DANA INC
10-Ks and 10-Qs
|
|
|
|
|
|
|
|
|
|
|
|
|
|
|
|
|
|
|
|
|
|
|
|
|
|
|
|
|
|
|
|
|
|
|
|
|
|
|
|
|
|
|
|
|
|
|
|
|
|
|
|
|
|
|
|
UNITED STATES
SECURITIES AND EXCHANGE COMMISSION
Washington, DC 20549
Form 10-K
Annual Report Pursuant to Section 13 or 15(d) of the Securities Exchange Act of 1934
For the Fiscal Year Ended:
December 31, 2017
Commission File Number: 1-1063
Dana Incorporated
(Exact name of registrant as specified in its charter)
|
Delaware
|
|
26-1531856
|
|
(State of incorporation)
|
|
(IRS Employer Identification Number)
|
|
3939 Technology Drive, Maumee, OH
|
|
43537
|
|
(Address of principal executive offices)
|
|
(Zip Code)
|
Registrant’s telephone number, including area code: (419) 887-3000
Securities registered pursuant to Section 12(b) of the Act:
|
Title of each class
|
|
Name of each exchange on which registered
|
|
Common Stock, par value $0.01 per share
|
|
New York Stock Exchange
|
Securities registered pursuant to Section 12(g) of the Act:
None.
Indicate by check mark if the registrant is a well-known seasoned issuer, as defined in Rule 405 of the Securities Act. Yes
þ
No
o
Indicate by check mark if the registrant is not required to file reports pursuant to Section 13 or 15(d) of the Act. Yes
o
No
þ
Indicate by check mark whether the registrant (1) has filed all reports required to be filed by Section 13 or 15(d) of the Securities Exchange Act of 1934 during the preceding 12 months (or for such shorter period that the registrant was required to file such reports), and (2) has been subject to such filing requirements for the past 90 days. Yes
þ
No
o
Indicate by check mark whether the registrant has submitted electronically and posted on its corporate web site, if any, every Interactive Data File required to be submitted and posted pursuant to Rule 405 of Regulation S-T (§232.405) during the preceding 12 months (or for such shorter period that the registrant was required to submit and post such files). Yes
þ
No
o
Indicate by check mark if disclosure of delinquent filers pursuant to Item 405 of Regulation S-K (§229.405 of this chapter) is not contained herein, and will not be contained, to the best of registrant's knowledge, in definitive proxy or information statements incorporated by reference in Part III of this Form 10-K or any amendment to this Form 10-K.
o
Indicate by check mark whether the registrant is a large accelerated filer, an accelerated filer, a non-accelerated filer, smaller reporting company or an emerging growth company. See the definitions of “large accelerated filer,” “accelerated filer,” “smaller reporting company,” and "emerging growth company" in Rule 12b-2 of the Exchange Act. (Check one):
|
Large accelerated filer
þ
|
Non-accelerated filer
o
|
Smaller reporting company
o
|
|
Accelerated filer
o
|
(Do not check if a smaller reporting company)
|
Emerging growth company
o
|
If an emerging growth company, indicate by check mark if the registrant has elected not to use the extended transition period for complying with any new or revised financial accounting standards provided pursuant to Section 13(a) of the Exchange Act.
o
Indicate by check mark whether the registrant is a shell company (as defined in Rule 12b-2 of the Act). Yes
o
No
þ
The aggregate market value of the common stock held by non-affiliates of the registrant computed by reference to the closing price of the common stock on June 30, 2017 was $3,218,263,263.
APPLICABLE ONLY TO CORPORATE ISSUERS:
There were 145,056,206 shares of the registrant's common stock outstanding at January 31, 2018.
DOCUMENTS INCORPORATED BY REFERENCE
Portions of the definitive Proxy Statement to be delivered to stockholders in connection with the Annual Meeting of Shareholders to be held on
April 26, 2018
are incorporated by reference into Part III.
DANA INCORPORATED
FORM 10-K
YEAR ENDED DECEMBER 31, 2017
Table of Contents
|
|
|
Pages
|
|
PART I
|
|
|
|
Item 1
|
Business
|
|
|
Item 1A
|
Risk Factors
|
|
|
Item 1B
|
Unresolved Staff Comments
|
|
|
Item 2
|
Properties
|
|
|
Item 3
|
Legal Proceedings
|
|
|
|
|
|
|
PART II
|
|
|
|
Item 5
|
Market for Registrant's Common Equity, Related Stockholder Matters and Issuer Purchases of Equity Securities
|
|
|
Item 6
|
Selected Financial Data
|
|
|
Item 7
|
Management's Discussion and Analysis of Financial Condition and Results of Operations
|
|
|
Item 7A
|
Quantitative and Qualitative Disclosures about Market Risk
|
|
|
Item 8
|
Financial Statements and Supplementary Data
|
|
|
Item 9
|
Changes in and Disagreements With Accountants on Accounting and Financial Disclosure
|
|
|
Item 9A
|
Controls and Procedures
|
|
|
Item 9B
|
Other Information
|
|
|
|
|
|
|
PART III
|
|
|
|
Item 10
|
Directors, Executive Officers and Corporate Governance
|
|
|
Item 11
|
Executive Compensation
|
|
|
Item 12
|
Security Ownership of Certain Beneficial Owners and Management and Related Stockholder Matters
|
|
|
Item 13
|
Certain Relationships and Related Transactions, and Director Independence
|
|
|
Item 14
|
Principal Accountant Fees and Services
|
|
|
|
|
|
|
PART IV
|
|
|
|
Item 15
|
Exhibits and Financial Statement Schedules
|
|
|
|
|
|
|
Signatures
|
|
|
i
Forward-Looking Information
Statements in this report (or otherwise made by us or on our behalf) that are not entirely historical constitute “forward-looking statements” within the meaning of the Private Securities Litigation Reform Act of 1995. Such forward-looking statements can often be identified by words such as “anticipates,” “expects,” “believes,” “intends,” “plans,” “predicts,” “seeks,” “estimates,” “projects,” “outlook,” “may," “will,” “should,” “would,” “could,” “potential,” “continue,” “ongoing” and similar expressions, variations or negatives of these words. These statements represent the present expectations of Dana Incorporated and its consolidated subsidiaries (Dana) based on our current information and assumptions. Forward-looking statements are inherently subject to risks and uncertainties. Our plans, actions and actual results could differ materially from our present expectations due to a number of factors, including those discussed below and elsewhere in this report and in our other filings with the Securities and Exchange Commission (SEC). All forward-looking statements speak only as of the date made and we undertake no obligation to publicly update or revise any forward-looking statement to reflect events or circumstances that may arise after the date of this report.
ii
(Dollars in millions, except per share amounts)
General
Dana Incorporated (Dana) is headquartered in Maumee, Ohio and was incorporated in Delaware in 2007. We are a global provider of high technology drive and motion products, sealing solutions, thermal-management technologies and fluid-power products and our customer base includes virtually every major vehicle and engine manufacturer in the global light vehicle, medium/heavy vehicle and off-highway markets. As of December 31, 2017 we employed approximately 30,100 people, operated in
33
countries and had
139
major facilities around the world.
The terms “Dana,” “we,” “our” and “us” are references to Dana. These references include the subsidiaries of Dana unless otherwise indicated or the context requires otherwise.
Overview of our Business
We have aligned our organization around four operating segments: Light Vehicle Driveline Technologies (Light Vehicle), Commercial Vehicle Driveline Technologies (Commercial Vehicle), Off-Highway Drive and Motion Technologies (Off-Highway) and Power Technologies. These operating segments have global responsibility and accountability for business commercial activities and financial performance.
External sales by operating segment for the years ended
December 31, 2017
,
2016
and
2015
are as follows:
|
2017
|
2016
|
2015
|
|||||||||||||||||||
|
Dollars
|
% of Total
|
Dollars
|
% of Total
|
Dollars
|
% of Total
|
||||||||||||||||
|
Light Vehicle
|
$
|
3,172
|
|
44.0
|
%
|
$
|
2,607
|
|
44.8
|
%
|
$
|
2,482
|
|
40.9
|
%
|
||||||
|
Commercial Vehicle
|
1,412
|
|
19.6
|
%
|
1,254
|
|
21.5
|
%
|
1,533
|
|
25.3
|
%
|
|||||||||
|
Off-Highway
|
1,521
|
|
21.1
|
%
|
909
|
|
15.6
|
%
|
1,040
|
|
17.2
|
%
|
|||||||||
|
Power Technologies
|
1,104
|
|
15.3
|
%
|
1,056
|
|
18.1
|
%
|
1,005
|
|
16.6
|
%
|
|||||||||
|
Total
|
$
|
7,209
|
|
$
|
5,826
|
|
$
|
6,060
|
|
||||||||||||
Refer to Segment Results of Operations in Item 7 and
Note 20
to our consolidated financial statements in Item 8 for further financial information about our operating segments.
1
Our business is diversified across end-markets, products and customers. The following table summarizes the markets, products and largest customers of each of our operating segments as of December 31, 2017.
|
Segment
|
Markets
|
Products
|
Largest
Customers |
|
Light Vehicle
|
Light vehicle market:
|
Front axles
|
Ford Motor Company
|
|
Light trucks (full frame)
|
Rear axles
|
Fiat Chrysler Automobiles*
|
|
|
Sport utility vehicles
|
Driveshafts/Propshafts
|
Renault-Nissan Alliance
|
|
|
Crossover utility vehicles
|
Differentials
|
General Motors Company
|
|
|
Vans
|
Torque couplings
|
Toyota Motor Company
|
|
|
Passenger cars
|
Modular assemblies
|
Tata Motors
|
|
|
Rear drive units
|
|||
|
Power transfer units
|
|||
|
Axle tube assemblies
|
|||
|
Axle shafts
|
|||
|
EV gearboxes
|
|||
|
Commercial Vehicle
|
Medium/heavy vehicle market:
|
Steer axles
|
PACCAR Inc
|
|
Medium duty trucks
|
Drive axles
|
Volkswagen AG**
|
|
|
Heavy duty trucks
|
Driveshafts
|
AB Volvo
|
|
|
Buses
|
Tire inflation systems
|
Daimler AG
|
|
|
Specialty vehicles
|
|
Ford Motor Company
|
|
|
Off-Highway
|
Off-Highway market:
|
Front axles
|
Deere & Company
|
|
Construction
|
Rear axles
|
AGCO Corporation
|
|
|
Earth moving
|
Driveshafts
|
Manitou Group
|
|
|
Agricultural
|
Transmissions
|
Oshkosh Corporation
|
|
|
Mining
|
Torque converters
|
Sandvik AB
|
|
|
Forestry
|
Wheel, track and winch
|
Linamar Corporation
|
|
|
Material handling
|
planetary drives
|
||
|
Industrial stationary
|
Industrial gear boxes
|
||
|
Tire inflation systems
|
|||
|
Electronic controls
|
|||
|
Hydraulic valves, pumps
|
|||
|
and motors
|
|||
|
Power Technologies
|
Light vehicle market
|
Gaskets
|
Ford Motor Company
|
|
Medium/heavy vehicle market
|
Cover modules
|
General Motors Company
|
|
|
Off-Highway market
|
Heat shields
|
Cummins Inc.
|
|
|
Engine sealing systems
|
Volkswagen AG
|
||
|
Cooling
|
Caterpillar Inc.
|
||
|
Heat transfer products
|
|||
* Via a directed supply relationship with Hyundai Mobis.
** Includes MAN AG, a majority-owned subsidiary of Volkswagen AG
2
Geographic Operations
We maintain administrative and operational organizations in North America, Europe, South America and Asia Pacific to support our operating segments, assist with the management of affiliate relations and facilitate financial and statutory reporting and tax compliance on a worldwide basis. Our operations are located in the following countries:
|
North America
|
Europe
|
South America
|
Asia Pacific
|
|
|
Canada
|
Belgium
|
Norway
|
Argentina
|
Australia
|
|
Mexico
|
Denmark
|
Russia
|
Brazil
|
China
|
|
United States
|
Finland
|
South Africa
|
Colombia
|
India
|
|
France
|
Spain
|
Ecuador
|
Japan
|
|
|
Germany
|
Sweden
|
New Zealand
|
||
|
Hungary
|
Switzerland
|
Singapore
|
||
|
Ireland
|
Turkey
|
South Korea
|
||
|
Italy
|
United Kingdom
|
Taiwan
|
||
|
Netherlands
|
Thailand
|
|||
Our non-U.S. subsidiaries and affiliates manufacture and sell products similar to those we produce in the United States. Operations outside the U.S. may be subject to a greater risk of changing political, economic and social environments, changing governmental laws and regulations, currency revaluations and market fluctuations than our domestic operations. See the discussion of risk factors in Item 1A.
Sales reported by our non-U.S. subsidiaries comprised
$4,000
of our
2017
consolidated sales of $
7,209
. A summary of sales and long-lived assets by geographic region can be found in
Note 20
to our consolidated financial statements in Item 8.
Customer Dependence
We are largely dependent on light vehicle, medium- and heavy-duty vehicle and off-highway original equipment manufacturer (OEM) customers. Ford Motor Company (Ford) was the only individual customer accounting for 10% or more of our consolidated sales in
2017
. As a percentage of total sales from operations, our sales to Ford were approximately
22%
in
2017
,
22%
in
2016
and
20%
in
2015
and our sales to Fiat Chrysler Automobiles (via a directed supply relationship with Hyundai Mobis), our second largest customer, were approximately 8% in
2017
, 9% in
2016
and 9% in
2015
. PACCAR Inc, Renault-Nissan Alliance and General Motors Company were our third, fourth and fifth largest customers in
2017
. Our 10 largest customers collectively accounted for approximately
58%
of our sales in
2017
.
Loss of all or a substantial portion of our sales to Ford or other large volume customers would have a significant adverse effect on our financial results until such lost sales volume could be replaced and there is no assurance that any such lost volume would be replaced.
Sources and Availability of Raw Materials
We use a variety of raw materials in the production of our products, including steel and products containing steel, stainless steel, forgings, castings and bearings. Other commodity purchases include aluminum, brass, copper and plastics. These materials are typically available from multiple qualified sources in quantities sufficient for our needs. However, some of our operations remain dependent on single sources for certain raw materials.
While our suppliers have generally been able to support our needs, our operations may experience shortages and delays in the supply of raw material from time to time due to strong demand, capacity limitations, short lead times, production schedule increases from our customers and other problems experienced by the suppliers. A significant or prolonged shortage of critical components from any of our suppliers could adversely impact our ability to meet our production schedules and to deliver our products to our customers in a timely manner.
Seasonality
Our businesses are generally not seasonal. However, in the light vehicle market, our sales are closely related to the production schedules of our OEM customers and those schedules have historically been weakest in the third quarter of the year due to a large number of model year change-overs that occur during this period. Additionally, third-quarter production
3
schedules in Europe are typically impacted by the summer vacation schedules and fourth-quarter production is affected globally by year-end holidays.
Backlog
A substantial amount of the new business we are awarded by OEMs is granted well in advance of a program launch. These awards typically extend through the life of the given program. This backlog of new business does not represent firm orders. We estimate future sales from new business using the projected volume under these programs.
Competition
Within each of our markets, we compete with a variety of independent suppliers and distributors, as well as with the in-house operations of certain OEMs. With a renewed focus on product innovation, we differentiate ourselves through efficiency and performance, reliability, materials and processes, sustainability and product extension.
The following table summarizes our principal competitors by operating segment as of December 31, 2017.
|
Segment
|
Principal Competitors
|
|
Light Vehicle
|
ZF Friedrichshafen AG
|
|
GKN plc
|
|
|
American Axle & Manufacturing Holdings, Inc.
|
|
|
Magna International Inc.
|
|
|
Wanxiang Group Corporation
|
|
|
Hitachi Automotive Systems, Ltd.
|
|
|
IFA ROTORION Holding GmbH
|
|
|
Tiryakiler Group
|
|
|
Vertically integrated OEM operations
|
|
|
Commercial Vehicle
|
Meritor, Inc.
|
|
American Axle & Manufacturing Holdings, Inc.
|
|
|
Hendrickson (a subsidiary of the Boler Company)
|
|
|
Klein Products Inc.
|
|
|
Tirsan Kardan
|
|
|
Vertically integrated OEM operations
|
|
|
Off-Highway
|
Carraro Group
|
|
ZF Friedrichshafen AG
|
|
|
Kessler + Co.
|
|
|
Comer Industries
|
|
|
Bonfiglioli
|
|
|
Oerlikon Fairfield
|
|
|
Reggiana Riduttori
|
|
|
Sew-Eurodrive
|
|
|
Siemens
|
|
|
Vertically integrated OEM operations
|
|
|
Power Technologies
|
ElringKlinger AG
|
|
Federal-Mogul Corporation
|
|
|
Freudenberg NOK Group
|
|
|
MAHLE GmbH
|
|
|
Modine Manufacturing Company
|
|
|
Valeo Group
|
|
|
YinLun Co., LTD
|
|
|
Denso Corporation
|
|
4
Intellectual Property
Our proprietary driveline and power technologies product lines have strong identities in the markets we serve. Throughout these product lines, we manufacture and sell our products under a number of patents that have been obtained over a period of years and expire at various times. We consider each of these patents to be of value and aggressively protect our rights throughout the world against infringement. We are involved with many product lines and the loss or expiration of any particular patent would not materially affect our sales and profits.
We own or have licensed numerous trademarks that are registered in many countries, enabling us to market our products worldwide. For example, our Spicer®, Victor Reinz® and Long® trademarks are widely recognized in their market segments.
Engineering and Research and Development
Since our introduction of the automotive universal joint in 1904, we have been focused on technological innovation. Our objective is to be an essential partner to our customers and we remain highly focused on offering superior product quality, technologically advanced products, world-class service and competitive prices. To enhance quality and reduce costs, we use statistical process control, cellular manufacturing, flexible regional production and assembly, global sourcing and extensive employee training.
We engage in ongoing engineering and research and development activities to improve the reliability, performance and cost-effectiveness of our existing products and to design and develop innovative products that meet customer requirements for new applications. We are integrating related operations to create a more innovative environment, speed product development, maximize efficiency and improve communication and information sharing among our research and development operations. At
December 31, 2017
, we had eight stand-alone technical and engineering centers and eight additional sites at which we conduct research and development activities. Our research and development costs were $102 in
2017
, $81 in
2016
and $75 in
2015
. Total engineering expenses including research and development were $220 in
2017
, $196 in
2016
and $183 in
2015
.
Our research and development activities continue to improve customer value. For all of our markets, this means drivelines with higher torque capacity, reduced weight and improved efficiency. End-use customers benefit by having vehicles with better fuel economy and reduced cost of ownership. We are also developing a number of power technologies products for vehicular and other applications that will assist fuel cell, battery and hybrid vehicle manufacturers in making their technologies commercially viable in mass production.
Employees
The following table summarizes our employees by operating segment as of December 31, 2017.
|
Segment
|
Employees
|
||
|
Light Vehicle
|
12,100
|
|
|
|
Commercial Vehicle
|
5,800
|
|
|
|
Off-Highway
|
5,500
|
|
|
|
Power Technologies
|
5,300
|
|
|
|
Technical and administrative
|
1,400
|
|
|
|
Total
|
30,100
|
|
|
Environmental Compliance
We make capital expenditures in the normal course of business as necessary to ensure that our facilities are in compliance with applicable environmental laws and regulations. The cost of environmental compliance has not been a material part of capital expenditures and did not have a material adverse effect on our earnings or competitive position in
2017
.
Available Information
Our annual reports on Form 10-K, quarterly reports on Form 10-Q, current reports on Form 8-K and amendments to those reports filed pursuant to Section 13 or 15(d) of the Securities Exchange Act of 1934 as amended (Exchange Act) are available, free of charge, on or through our Internet website at http://www.dana.com/investors as soon as reasonably practicable after we electronically file such materials with, or furnish them to, the SEC. Copies of any materials we file with the SEC can also be
5
obtained free of charge through the SEC’s website at http://www.sec.gov or by calling the SEC’s Office of Investor Education and Advocacy at 1-800-732-0330. We also post our
Corporate Governance Guidelines, Standards of Business Conduct for Members of the Board of Directors
, Board Committee membership lists and charters,
Standards of Business Conduct
and other corporate governance materials on our Internet website. Copies of these posted materials are also available in print, free of charge, to any stockholder upon request from: Dana Incorporated, Investor Relations, P.O. Box 1000, Maumee, Ohio 43537, or via telephone in the U.S. at 800-537-8823 or e-mail at InvestorRelations@dana.com. The inclusion of our website address in this report is an inactive textual reference only and is not intended to include or incorporate by reference the information on our website into this report.
We are impacted by events and conditions that affect the light vehicle, medium/heavy vehicle and off-highway markets that we serve, as well as by factors specific to Dana. Among the risks that could materially adversely affect our business, financial condition or results of operations are the following, many of which are interrelated.
Risk Factors Related to the Markets We Serve
Failure to sustain a continuing economic recovery in the United States and elsewhere could have a substantial adverse effect on our business.
Our business is tied to general economic and industry conditions as demand for vehicles depends largely on the strength of the economy, employment levels, consumer confidence levels, the availability and cost of credit and the cost of fuel. These factors have had and could continue to have a substantial impact on our business.
We expect global market conditions to result in overall comparable to slightly higher sales in 2018. We expect the North America economic climate will continue to be modestly strong to stable. The medium/heavy truck market in North America is expected to be stronger in 2018, with demand levels in the off-highway market being stable to slightly stronger. In the light vehicle market, light truck demand is expected to be comparable to slightly weaker than 2017. The economy in Europe is expected to improve modestly, with off-highway market demand continuing to improve and on-highway market demand being relatively comparable to this past year. Continued economic improvement in Brazil is expected to provide stable to improving production levels in our key South America market segments in 2018. We expect the rate of growth in Asia Pacific to be more modest in 2018, with the off-highway and light truck markets being comparable to up slightly compared to 2017, while the 2018 medium/heavy truck market is expected to be somewhat weaker. Adverse developments in the economic conditions of any of these markets could reduce demand for new vehicles, causing our customers to reduce their vehicle production and, as a result, demand for our products would be adversely affected.
Certain political developments occurring the past two years have provided increased economic uncertainty. The United Kingdom's decision in 2016 to exit the European Union has not had significant economic ramifications to date; however, transition details continue to develop and could have potential economic implications in the United Kingdom and elsewhere. Effects of the 2016 presidential election in the U.S., including recent tax reform legislation, easing of regulatory requirements and potential trade policy actions, are likely to impact economic conditions in the U.S. and various countries, the cost of importing into the U.S. and the competitive landscape of our customers, suppliers and competitors.
Adverse global economic conditions could also cause our customers and suppliers to experience severe economic constraints in the future, including bankruptcy, which could have a material adverse impact on our financial position and results of operations.
We could be adversely impacted by the loss of any of our significant customers, changes in their requirements for our products or changes in their financial condition.
We are reliant upon sales to several significant customers. Sales to our ten largest customers accounted for
58%
of our overall sales in
2017
. Changes in our business relationships with any of our large customers or in the timing, size and continuation of their various programs could have a material adverse impact on us.
The loss of any of these customers, the loss of business with respect to one or more of their vehicle models on which we have high component content, or a significant decline in the production levels of such vehicles would negatively impact our business, results of operations and financial condition. Pricing pressure from our customers also poses certain risks. Inability on our part to offset pricing concessions with cost reductions would adversely affect our profitability. We are continually bidding on new business with these customers, as well as seeking to diversify our customer base, but there is no assurance that our
6
efforts will be successful. Further, to the extent that the financial condition of our largest customers deteriorates, including possible bankruptcies, mergers or liquidations, or their sales otherwise decline, our financial position and results of operations could be adversely affected.
We may be adversely impacted by changes in international legislative and political conditions.
We operate in
33
countries around the world and we depend on significant foreign suppliers and customers. Further, we have several growth initiatives that are targeting emerging markets like China and India. Legislative and political activities within the countries where we conduct business, particularly in emerging markets and less developed countries, could adversely impact our ability to operate in those countries. The political situation in a number of countries in which we operate could create instability in our contractual relationships with no effective legal safeguards for resolution of these issues, or potentially result in the seizure of our assets. We operate in Argentina, where trade-related initiatives and other government restrictions limit our ability to optimize operating effectiveness. At December 31, 2017, our net asset exposure related to Argentina was approximately $19, including $9 of net fixed assets.
We may be adversely impacted by the strength of the U.S. dollar relative to the currencies in the other countries in which we do business.
Approximately
55%
of our sales in
2017
were from operations located in countries other than the U.S. Currency variations can have an impact on our results (expressed in U.S. dollars). Currency variations can also adversely affect margins on sales of our products in countries outside of the U.S. and margins on sales of products that include components obtained from affiliates or other suppliers located outside of the U.S. Strengthening of the U.S. dollar against the euro and currencies of other countries in which we have operations has had and could continue to have an adverse effect on our results reported in U.S. dollars. We use a combination of natural hedging techniques and financial derivatives to mitigate foreign currency exchange rate risks. Such hedging activities may be ineffective or may not offset more than a portion of the adverse financial impact resulting from currency variations.
We may be adversely impacted by new laws, regulations or policies of governmental organizations related to increased fuel economy standards and reduced greenhouse gas emissions, or changes in existing ones.
The markets and customers we serve are subject to substantial government regulation, which often differs by state, region and country. These regulations, and proposals for additional regulation, are advanced primarily out of concern for the environment (including concerns about global climate change and its impact) and energy independence. We anticipate that the number and extent of these regulations, and the costs to comply with them, will increase significantly in the future.
In the U.S., vehicle fuel economy and greenhouse gas emissions are regulated under a harmonized national program administered by the National Highway Traffic Safety Administration and the Environmental Protection Agency (EPA). Other governments in the markets we serve are also creating new policies to address these same issues, including the European Union, Brazil, China and India. These government regulatory requirements could significantly affect our customers by altering their global product development plans and substantially increasing their costs, which could result in limitations on the types of vehicles they sell and the geographical markets they serve. Any of these outcomes could adversely affect our financial position and results of operations.
Company-Specific Risk Factors
We have taken, and continue to take, cost-reduction actions. Although our process includes planning for potential negative consequences, the cost-reduction actions may expose us to additional production risk and could adversely affect our sales, profitability and ability to attract and retain employees.
We have been reducing costs in all of our businesses and have discontinued product lines, exited businesses, consolidated manufacturing operations and positioned operations in lower cost locations. The impact of these cost-reduction actions on our sales and profitability may be influenced by many factors including our ability to successfully complete these ongoing efforts, our ability to generate the level of cost savings we expect or that are necessary to enable us to effectively compete, delays in implementation of anticipated workforce reductions, decline in employee morale and the potential inability to meet operational targets due to our inability to retain or recruit key employees.
7
We depend on our subsidiaries for cash to satisfy the obligations of the company.
Our subsidiaries conduct all of our operations and own substantially all of our assets. Our cash flow and our ability to meet our obligations depend on the cash flow of our subsidiaries. In addition, the payment of funds in the form of dividends, intercompany payments, tax sharing payments and otherwise may be subject to restrictions under the laws of the countries of incorporation of our subsidiaries or the by-laws of the subsidiary.
Labor stoppages or work slowdowns at Dana, key suppliers or our customers could result in a disruption in our operations and have a material adverse effect on our businesses.
We and our customers rely on our respective suppliers to provide parts needed to maintain production levels. We all rely on workforces represented by labor unions. Workforce disputes that result in work stoppages or slowdowns could disrupt operations of all of these businesses, which in turn could have a material adverse effect on the supply of, or demand for, the products we supply our customers.
We could be adversely affected if we are unable to recover portions of commodity costs (including costs of steel, other raw materials and energy) from our customers.
We continue to work with our customers to recover a portion of our material cost increases. While we have been successful in the past recovering a significant portion of such cost increases, there is no assurance that increases in commodity costs, which can be impacted by a variety of factors, including changes in trade laws and tariffs, will not adversely impact our profitability in the future.
We could be adversely affected if we experience shortages of components from our suppliers or if disruptions in the supply chain lead to parts shortages for our customers.
A substantial portion of our annual cost of sales is driven by the purchase of goods and services. To manage and minimize these costs, we have been consolidating our supplier base. As a result, we are dependent on single sources of supply for some components of our products. We select our suppliers based on total value (including price, delivery and quality), taking into consideration their production capacities and financial condition, and we expect that they will be able to support our needs. However, there is no assurance that adverse financial conditions, including bankruptcies of our suppliers, reduced levels of production, natural disasters or other problems experienced by our suppliers will not result in shortages or delays in their supply of components to us or even in the financial collapse of one or more such suppliers. If we were to experience a significant or prolonged shortage of critical components from any of our suppliers, particularly those who are sole sources, and were unable to procure the components from other sources, we would be unable to meet our production schedules for some of our key products and to ship such products to our customers in a timely fashion, which would adversely affect our sales, profitability and customer relations.
Adverse economic conditions, natural disasters and other factors can similarly lead to financial distress or production problems for other suppliers to our customers which can create disruptions to our production levels. Any such supply-chain induced disruptions to our production are likely to create operating inefficiencies that will adversely affect our sales, profitability and customer relations.
Our profitability and results of operations may be adversely affected by program launch difficulties.
The launch of new business is a complex process, the success of which depends on a wide range of factors, including the production readiness of our manufacturing facilities and manufacturing processes and those of our suppliers, as well as factors related to tooling, equipment, employees, initial product quality and other factors. Our failure to successfully launch material new or takeover business could have an adverse effect on our profitability and results of operations.
We use important intellectual property in our business. If we are unable to protect our intellectual property or if a third party makes assertions against us or our customers relating to intellectual property rights, our business could be adversely affected.
We own important intellectual property, including patents, trademarks, copyrights and trade secrets, and are involved in numerous licensing arrangements. Our intellectual property plays an important role in maintaining our competitive position in a number of the markets that we serve. Our competitors may develop technologies that are similar or superior to our proprietary technologies or design around the patents we own or license. Further, as we expand our operations in jurisdictions where the protection of intellectual property rights is less robust, the risk of others duplicating our proprietary technologies increases,
8
despite efforts we undertake to protect them. Developments or assertions by or against us relating to intellectual property rights, and any inability to protect these rights, could have a material adverse impact on our business and our competitive position.
We could encounter unexpected difficulties integrating acquisitions and joint ventures.
We acquired businesses in 2017, and we expect to complete additional acquisitions and investments in the future that complement or expand our businesses. The success of this strategy will depend on our ability to successfully complete these transactions or arrangements, to integrate the businesses acquired in these transactions and to develop satisfactory working arrangements with our strategic partners in the joint ventures. We could encounter unexpected difficulties in completing these transactions and integrating the acquisitions with our existing operations. We also may not realize the degree or timing of benefits anticipated when we entered into a transaction.
Several of our joint ventures operate pursuant to established agreements and, as such, we do not unilaterally control the joint venture. There is a risk that the partners’ objectives for the joint venture may not be aligned with ours, leading to potential differences over management of the joint venture that could adversely impact its financial performance and consequent contribution to our earnings. Additionally, inability on the part of our partners to satisfy their contractual obligations under the agreements could adversely impact our results of operations and financial position.
We could be adversely impacted by the costs of environmental, health, safety and product liability compliance.
Our operations are subject to environmental laws and regulations in the U.S. and other countries that govern emissions to the air; discharges to water; the generation, handling, storage, transportation, treatment and disposal of waste materials; and the cleanup of contaminated properties. Historically, other than an EPA settlement as part of our bankruptcy proceedings, environmental costs related to our former and existing operations have not been material. However, there is no assurance that the costs of complying with current environmental laws and regulations, or those that may be adopted in the future, will not increase and adversely impact us.
There is also no assurance that the costs of complying with current laws and regulations, or those that may be adopted in the future, that relate to health, safety and product liability matters will not adversely impact us. There is also a risk of warranty and product liability claims, as well as product recalls, if our products fail to perform to specifications or cause property damage, injury or death. (See Notes 16 and
17
to our consolidated financial statements in Item 8 for additional information on product liabilities and warranties.)
A failure of our information technology infrastructure could adversely impact our business and operations.
We recognize the increasing volume of cyber attacks and employ commercially practical efforts to provide reasonable assurance that the risks of such attacks are appropriately mitigated. Each year, we evaluate the threat profile of our industry to stay abreast of trends and to provide reasonable assurance our existing countermeasures will address any new threats identified. Despite our implementation of security measures, our IT systems and those of our service providers are vulnerable to circumstances beyond our reasonable control including acts of terror, acts of government, natural disasters, civil unrest and denial of service attacks which may lead to the theft of our intellectual property, trade secrets or business disruption. To the extent that any disruption or security breach results in a loss or damage to our data or an inappropriate disclosure of confidential information, it could cause significant damage to our reputation, affect our relationships with our customers, suppliers and employees, lead to claims against the company and ultimately harm our business. Additionally, we may be required to incur significant costs to protect against damage caused by these disruptions or security breaches in the future.
We participate in certain multi-employer pension plans which are not fully funded.
We contribute to certain multi-employer defined benefit pension plans for our union-represented employees in the U.S. in accordance with our collective bargaining agreements. Contributions are based on hours worked except in cases of layoff or leave where we generally contribute based on 40 hours per week for a maximum of one year. The plans are not fully funded as of
December 31, 2017
. We could be held liable to the plans for our obligation, as well as those of other employers, due to our participation in the plans. Contribution rates could increase if the plans are required to adopt a funding improvement plan, if the performance of plan assets does not meet expectations or as a result of future collectively bargained wage and benefit agreements. (See
Note 12
to our consolidated financial statements in Item 8 for additional information on multi-employer pension plans.)
9
Changes in interest rates and asset returns could increase our pension funding obligations and reduce our profitability.
We have unfunded obligations under certain of our defined benefit pension and other postretirement benefit plans. The valuation of our future payment obligations under the plans and the related plan assets are subject to significant adverse changes if the credit and capital markets cause interest rates and projected rates of return to decline. Such declines could also require us to make significant additional contributions to our pension plans in the future. A material increase in the unfunded obligations of these plans could also result in a significant increase in our pension expense in the future.
We may incur additional tax expense or become subject to additional tax exposure.
Our provision for income taxes and the cash outlays required to satisfy our income tax obligations in the future could be adversely affected by numerous factors. These factors include changes in the level of earnings in the tax jurisdictions in which we operate, changes in the valuation of deferred tax assets, changes in our plans to repatriate the earnings of our non-U.S. operations to the U.S. and changes in tax laws and regulations. Enactment of the Tax Cuts and Jobs Act in the U.S. on December 22, 2017 introduced broad and complex tax reforms. With this legislation having only recently been enacted, we have had limited time to fully evaluate the impacts of these tax reforms on our business. Additionally, certain of the provisions lack clarity and will likely be subject to further interpretation by the Internal Revenue Service. As we further analyze the recent tax reform provisions and subsequent guidance, the provisional estimates of certain elements of the legislation recognized in 2017 could be impacted, and there are likely to be significant future impacts that these tax reforms will have on our future financial results and our business strategies.
Our income tax returns are subject to examination by federal, state and local tax authorities in the U.S. and tax authorities outside the U.S. The results of these examinations and the ongoing assessments of our tax exposures could also have an adverse effect on our provision for income taxes and the cash outlays required to satisfy our income tax obligations.
Our ability to utilize our net operating loss carryforwards may be limited.
Net operating loss carryforwards (NOLs) approximating $643 were available at
December 31, 2017
to reduce future U.S. income tax liabilities. Our ability to utilize these NOLs may be limited as a result of certain change of control provisions of the U.S. Internal Revenue Code of 1986, as amended (Code). Of this amount, NOLs of approximately $458 are treated as losses incurred before the change of control upon emergence from Chapter 11 and are limited to annual utilization of $84. The balance of our NOLs, treated as incurred subsequent to the change in control, is not subject to limitation as of
December 31, 2017
. However, there can be no assurance that trading in our shares will not effect another change in control under the Code, which would further limit our ability to utilize our available NOLs. Such limitations may cause us to pay income taxes earlier and in greater amounts than would be the case if the NOLs were not subject to limitation.
An inability to provide products with the technology required to satisfy customer requirements would adversely impact our ability to successfully compete in our markets.
The vehicular markets in which we operate are undergoing significant technological change, with increasing focus on electrified and autonomous vehicles. These and other technological advances could render certain of our products obsolete. Maintaining our competitive position is dependent on our ability to develop commercially-viable products and services that support the future technologies embraced by our customers.
Failure to appropriately anticipate and react to the cyclical and volatile nature of production rates and customer demands in our business can adversely impact our results of operations.
Our financial performance is directly related to production levels of our customers. In several of our markets, customer production levels are prone to significant cyclicality, influenced by general economic conditions, changing consumer preferences, regulatory changes, and other factors. Oftentimes the rapidity of the downcycles and upcycles can be severe. Successfully executing operationally during periods of extreme downward and upward demand pressures can be challenging. Our inability to recognize and react appropriately to the production cycles inherent in our markets can adversely impact our operating results.
Our continued success is dependent on being able to attract and retain requisite talent.
Sustaining and growing our business requires that we continue to attract, develop and retain people with the requisite skills. With the vehicles of the future expected to undergo significant technological change, having qualified people savvy in the right technologies will be a key factor in our ability to develop the products necessary to successfully compete in the future.
10
As a global organization, we are also dependent on our ability to attract and maintain a diverse work force that is fully engaged supporting our company’s objectives and initiatives.
Failure to maintain effective internal controls could adversely impact our business, financial condition and results of operations.
Regulatory provisions governing the financial reporting of U.S. public companies require that we maintain effective disclosure controls and internal controls over financial reporting across our operations in 33 countries. Effective internal controls are designed to provide reasonable assurance of compliance, and, as such, they can be susceptible to human error, circumvention or override, and fraud. Failure to maintain adequate, effective internal controls could result in potential financial misstatements or other forms of noncompliance that have an adverse impact on our results of operations, financial condition or organizational reputation. Our 2017 acquisitions were exempt from certain regulatory internal control compliance requirements this past year, but are required to be compliant in 2018.
Developments in the financial markets or downgrades to Dana's credit rating could restrict our access to capital and increase financing costs.
At December 31, 2017, Dana had consolidated debt obligations of $1,821, with cash and marketable securities of $643 and unused revolving credit capacity of $578. Our ability to grow the business and satisfy debt service obligations is dependent, in part, on our ability to gain access to capital at competitive costs. External factors beyond our control can adversely affect capital markets – either tightening availability of capital or increasing the cost of available capital. Failure on our part to maintain adequate financial performance and appropriate credit metrics can also affect our ability to access capital at competitive prices.
Risk Factors Related to our Securities
Provisions in our Restated Certificate of Incorporation and Bylaws may discourage a takeover attempt.
Certain provisions of our Restated Certificate of Incorporation and Bylaws, as well as the General Corporation Law of the State of Delaware, may have the effect of delaying, deferring or preventing a change in control of Dana. Such provisions, including those governing the nomination of directors, limiting who may call special stockholders’ meetings and eliminating stockholder action by written consent, may make it more difficult for other persons, without the approval of our board of directors, to make a tender offer or otherwise acquire substantial amounts of common stock or to launch other takeover attempts that a stockholder might consider to be in such stockholder’s best interest.
None.
11
|
Type of Facility
|
North
America |
Europe
|
South
America |
Asia
Pacific |
Total
|
|||||
|
Light Vehicle
|
||||||||||
|
Manufacturing/Distribution
|
12
|
4
|
4
|
10
|
30
|
|||||
|
Service/Assembly
|
2
|
1
|
1
|
4
|
||||||
|
Technical and Engineering Centers
|
1
|
1
|
||||||||
|
Commercial Vehicle
|
||||||||||
|
Manufacturing/Distribution
|
7
|
5
|
4
|
7
|
23
|
|||||
|
Service/Assembly
|
1
|
1
|
||||||||
|
Off-Highway
|
||||||||||
|
Manufacturing/Distribution
|
5
|
32
|
1
|
9
|
47
|
|||||
|
Service/Assembly
|
1
|
1
|
||||||||
|
Administrative Offices
|
2
|
2
|
||||||||
|
Technical and Engineering Centers
|
1
|
1
|
||||||||
|
Power Technologies
|
||||||||||
|
Manufacturing/Distribution
|
10
|
4
|
2
|
16
|
||||||
|
Technical and Engineering Centers
|
2
|
2
|
||||||||
|
Corporate and other
|
||||||||||
|
Administrative Offices
|
2
|
1
|
1
|
3
|
7
|
|||||
|
Technical and Engineering Centers - Multiple Segments
|
1
|
3
|
4
|
|||||||
|
43
|
48
|
11
|
37
|
139
|
||||||
As of
December 31, 2017
, we operated in
33
countries and had
139
major facilities housing manufacturing and distribution operations, service and assembly operations, technical and engineering centers and administrative offices. In addition to the eight stand-alone technical and engineering centers in the table above, we have fourteen technical and engineering centers housed within manufacturing sites. We lease 67 of these facilities and own the remainder. We believe that all of our property and equipment is properly maintained.
Our world headquarters is located in Maumee, Ohio. This facility and other facilities in the greater Detroit, Michigan and Maumee, Ohio areas house functions that have global or North American regional responsibility for finance and accounting, treasury, risk management, legal, human resources, procurement and supply chain management, communications and information technology.
We are a party to various pending judicial and administrative proceedings that arose in the ordinary course of business. After reviewing the currently pending lawsuits and proceedings (including the probable outcomes, reasonably anticipated costs and expenses and our established reserves for uninsured liabilities), we do not believe that any liabilities that may result from these proceedings are reasonably likely to have a material adverse effect on our liquidity, financial condition or results of operations. Legal proceedings are also discussed in Notes 3 and
16
to our consolidated financial statements in Item 8.
Market information
— Our common stock trades on the New York Stock Exchange (NYSE) under the symbol "DAN." The following table shows the high and low prices of our common stock as reported by the NYSE for each of our fiscal quarters during
2017
and
2016
.
12
|
|
2017
|
2016
|
|||||||||||||
|
|
High
|
Low
|
High
|
Low
|
|||||||||||
|
Fourth quarter
|
$
|
33.45
|
|
$
|
28.01
|
|
$
|
19.81
|
|
$
|
13.93
|
|
|||
|
Third quarter
|
28.25
|
|
22.27
|
|
15.70
|
|
9.80
|
|
|||||||
|
Second quarter
|
22.51
|
|
17.53
|
|
14.55
|
|
10.21
|
|
|||||||
|
First quarter
|
20.62
|
|
17.67
|
|
14.32
|
|
10.62
|
|
|||||||
Holders of common stock
— Based on reports by our transfer agent, there were approximately 3,151 registered holders of our common stock on January 31, 2018.
Reference is made to the Equity Compensation Plan Information section of Item 12 for certain information regarding our equity compensation plans.
Stockholder return
— The following graph shows the cumulative total shareholder return for our common stock since December 31, 2012. The graph compares our performance to that of the Standard & Poor’s 500 Stock Index (S&P 500) and the Dow Jones US Auto Parts Index. The comparison assumes $100 was invested at the closing price on December 31, 2012. Each of the returns shown assumes that all dividends paid were reinvested.
Performance chart
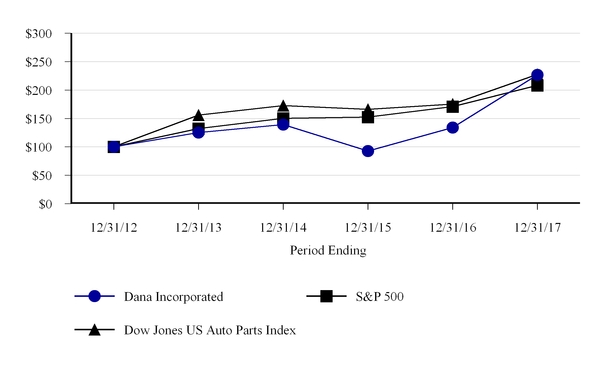
Index
|
|
12/31/2012
|
12/31/2013
|
12/31/2014
|
12/31/2015
|
12/31/2016
|
12/31/2017
|
|||||||||||||||||
|
Dana Incorporated
|
$
|
100.00
|
|
$
|
125.26
|
|
$
|
139.18
|
|
$
|
92.92
|
|
$
|
134.07
|
|
$
|
226.96
|
|
|||||
|
S&P 500
|
100.00
|
|
132.39
|
|
150.51
|
|
152.59
|
|
170.84
|
|
208.14
|
|
|||||||||||
|
Dow Jones US Auto Parts Index
|
100.00
|
|
156.05
|
|
172.65
|
|
166.24
|
|
175.24
|
|
227.44
|
|
|||||||||||
Dividends
— We declared and paid quarterly common stock dividends of six cents per share in 2017 and 2016.
Issuer's purchases of equity securities
— In December 2017, our Board of Directors approved a new $100 common stock share repurchase program, which expires on December 31, 2019. Our prior $1,700 common stock share repurchase program expired on December 31, 2017 with approximately $219 of the program remaining unused. No shares of our common stock were repurchased under the program during 2017.
Annual meeting
— We will hold an annual meeting of shareholders on
April 26, 2018
.
13
|
Year Ended December 31,
|
||||||||||||||||||||
|
2017
|
2016
|
2015
|
2014
|
2013
|
||||||||||||||||
|
Operating Results
|
||||||||||||||||||||
|
Net sales
|
$
|
7,209
|
|
$
|
5,826
|
|
$
|
6,060
|
|
$
|
6,617
|
|
$
|
6,769
|
|
|||||
|
Earnings from continuing operations before income taxes
|
380
|
|
215
|
|
292
|
|
260
|
|
368
|
|
||||||||||
|
Income from continuing operations
|
116
|
|
653
|
|
176
|
|
343
|
|
261
|
|
||||||||||
|
Income (loss) from discontinued operations
|
|
|
4
|
|
(15
|
)
|
(1
|
)
|
||||||||||||
|
Net income
|
116
|
|
653
|
|
180
|
|
328
|
|
260
|
|
||||||||||
|
Net income attributable to the parent company
|
$
|
111
|
|
$
|
640
|
|
$
|
159
|
|
$
|
319
|
|
$
|
244
|
|
|||||
|
Redeemable noncontrolling interests adjustment to redemption value
|
6
|
|
|
|
|
|
||||||||||||||
|
Preferred stock dividend requirements
|
—
|
|
—
|
|
—
|
|
7
|
|
25
|
|
||||||||||
|
Preferred stock redemption premium
|
—
|
|
—
|
|
—
|
|
—
|
|
232
|
|
||||||||||
|
Net income (loss) available to common stockholders
|
$
|
105
|
|
$
|
640
|
|
$
|
159
|
|
$
|
312
|
|
$
|
(13
|
)
|
|||||
|
Net income (loss) per share available to common stockholders
|
||||||||||||||||||||
|
Basic
|
||||||||||||||||||||
|
Income (loss) from continuing operations
|
$
|
0.72
|
|
$
|
4.38
|
|
$
|
0.98
|
|
$
|
2.07
|
|
$
|
(0.08
|
)
|
|||||
|
Income (loss) from discontinued operations
|
—
|
|
—
|
|
0.02
|
|
(0.10
|
)
|
(0.01
|
)
|
||||||||||
|
Net income (loss)
|
0.72
|
|
4.38
|
|
1.00
|
|
1.97
|
|
(0.09
|
)
|
||||||||||
|
Diluted
|
||||||||||||||||||||
|
Income (loss) from continuing operations
|
$
|
0.71
|
|
$
|
4.36
|
|
$
|
0.97
|
|
$
|
1.93
|
|
$
|
(0.08
|
)
|
|||||
|
Income (loss) from discontinued operations
|
—
|
|
—
|
|
0.02
|
|
(0.09
|
)
|
(0.01
|
)
|
||||||||||
|
Net income (loss)
|
0.71
|
|
4.36
|
|
0.99
|
|
1.84
|
|
(0.09
|
)
|
||||||||||
|
Depreciation and amortization of intangibles
|
$
|
233
|
|
$
|
182
|
|
$
|
174
|
|
$
|
213
|
|
$
|
262
|
|
|||||
|
Net cash provided by operating activities
|
554
|
|
384
|
|
406
|
|
510
|
|
577
|
|
||||||||||
|
Purchases of property, plant and equipment
|
393
|
|
322
|
|
260
|
|
234
|
|
209
|
|
||||||||||
|
Financial Position
|
||||||||||||||||||||
|
Cash and cash equivalents and marketable securities
|
$
|
643
|
|
$
|
737
|
|
$
|
953
|
|
$
|
1,290
|
|
$
|
1,366
|
|
|||||
|
Total assets
|
5,644
|
|
4,860
|
|
4,301
|
|
4,893
|
|
5,068
|
|
||||||||||
|
Long-term debt, less debt issuance costs
|
1,759
|
|
1,595
|
|
1,553
|
|
1,588
|
|
1,541
|
|
||||||||||
|
Total debt
|
1,799
|
|
1,664
|
|
1,575
|
|
1,653
|
|
1,598
|
|
||||||||||
|
Preferred stock
|
—
|
|
—
|
|
—
|
|
—
|
|
372
|
|
||||||||||
|
Common stock and additional paid-in capital
|
2,356
|
|
2,329
|
|
2,313
|
|
2,642
|
|
2,842
|
|
||||||||||
|
Treasury stock
|
(87
|
)
|
(83
|
)
|
(1
|
)
|
(33
|
)
|
(366
|
)
|
||||||||||
|
Total parent company stockholders' equity
|
1,013
|
|
1,157
|
|
728
|
|
1,080
|
|
1,309
|
|
||||||||||
|
Book value per share
|
$
|
6.98
|
|
$
|
7.92
|
|
$
|
4.58
|
|
$
|
6.83
|
|
$
|
8.94
|
|
|||||
|
Common Share Information
|
||||||||||||||||||||
|
Dividends declared per common share
|
$
|
0.24
|
|
$
|
0.24
|
|
$
|
0.23
|
|
$
|
0.20
|
|
$
|
0.20
|
|
|||||
|
Weighted-average common shares outstanding
|
||||||||||||||||||||
|
Basic
|
145.1
|
|
146.0
|
|
159.0
|
|
158.0
|
|
146.4
|
|
||||||||||
|
Diluted
|
146.9
|
|
146.8
|
|
160.0
|
|
173.5
|
|
146.4
|
|
||||||||||
|
Market prices
|
||||||||||||||||||||
|
High
|
$
|
33.45
|
|
$
|
19.81
|
|
$
|
23.48
|
|
$
|
24.82
|
|
$
|
23.46
|
|
|||||
|
Low
|
17.53
|
|
9.80
|
|
13.01
|
|
16.81
|
|
15.17
|
|
||||||||||
14
Management's discussion and analysis of financial condition and results of operations should be read in conjunction with the financial statements and accompanying notes in Item 8.
Management Overview
We are a global provider of high-technology products to virtually every major vehicle and engine manufacturer in the world. We also serve the stationary industrial market. Our technologies include drive and motion products (axles, driveshafts, planetary hub drives, power-transmission products, tire-management products and transmissions); sealing solutions (gaskets, seals, heat shields and fuel-cell plates); thermal-management technologies (transmission and engine oil cooling, battery and electronics cooling and exhaust-gas heat recovery); and fluid-power products (pumps, valves, motors and controls). We serve our global light vehicle, medium/heavy vehicle and off-highway markets through four business units – Light Vehicle Driveline Technologies (Light Vehicle), Commercial Vehicle Driveline Technologies (Commercial Vehicle), Off-Highway Drive and Motion Technologies (Off-Highway) and Power Technologies, which is the center of excellence for sealing and thermal-management technologies that span all customers in our on-highway and off-highway markets. We have a diverse customer base and geographic footprint which minimizes our exposure to individual market and segment declines. In
2017
,
51%
of our sales came from North American operations and
49%
from operations throughout the rest of the world. Our sales by operating segment were Light Vehicle –
44%
, Commercial Vehicle –
20%
, Off-Highway –
21%
and Power Technologies –
15%
.
Operational and Strategic Initiatives
Our enterprise strategy builds on our strong technology foundation and leverages our resources across the organization while maintaining a customer centric focus, expanding our global markets, and accelerating the commercialization of new technology as we evolve into the era of vehicle electrification.
Central to our strategy is
leveraging our core operations
by sharing our capabilities, technology, assets and knowledge across the enterprise, leading to improved execution and increased customer satisfaction. Through streamlining and rationalizing our manufacturing activities we have significantly improved our profitability and margins, and we believe additional opportunities remain to further optimize our manufacturing footprint and improve our cost performance. Leveraging investments across multiple end markets and making disciplined, value enhancing acquisitions will allow us to bring product to market faster, grow our top-line sales and enhance financial returns.
Strengthening customer centricity
and
expanding global markets
are key elements of our strategy that focus on market penetration. Foundational to growing the business is directing the entire organization to putting the customer at the center of our value system and shifting from transactional to relationship-based interactions. These relationships are built on a foundation of providing unparalleled technology with exceptional quality, delivery and value. With even stronger relationships we will be better positioned to support our customers’ most important global and flagship programs and capitalize on future growth opportunities.
We continue to enhance and expand our global footprint, optimizing it to capture growth across all of our end markets. Specifically, our manufacturing and technology center footprint positions us to support customers globally – an important factor as many of our customers are increasingly focused on common solutions for global platforms. Our acquisition of the Brevini operations in 2017 (see Acquisitions section below) provided us with operational presence in eight additional countries, while also providing us with additional opportunities to leverage our global footprint to support the needs across all our businesses. Shortly following the acquisition, we were able to consolidate certain Brevini activities in China, allowing us to utilize an acquired facility to support our Power Technologies business in China.
While growth opportunities are present in each region of the world, we have a primary focus on building our presence and local capability in the Asia Pacific region. Over the last few years, we have opened two new engineering facilities in the region, gear manufacturing facilities in India and Thailand, and are currently developing a new light vehicle assembly facility in China that is scheduled to commence operations in 2018.
In addition to Asia, we see further growth opportunity in Eastern Europe. A new gear manufacturing facility in Hungary is under construction and scheduled to commence operations in the first half of 2018. This will be our third facility in the country and will give us the capability to cost effectively manufacture gears, one of our core technologies, and efficiently service our customers within the region.
15
The final two elements of our enterprise strategy,
commercializing new technology
and
accelerating hybridization and electrification,
focus on opportunities for product expansion. Bringing new innovations to market as industry leading products will drive growth as our new products and technology provide our customers with cutting-edge solutions, address end user needs and capitalize on key market trends. An example is our industry leading electronically disconnecting all-wheel drive technology, which we believe is the most fuel efficient rapidly disconnecting system in the market, will be utilized on a Ford Motor Company global vehicle platform – opening up new commercial channels for us in the passenger car, crossover and sport utility vehicle markets. The above-referenced new assembly facility under construction in China will support this new program.
Initiatives to capitalize on evolving hybridization and electrification vehicle trends are a core ingredient of our current strategy. In addition to our current technologies in battery cooling and fuel cells, this element of our strategy is leveraging our electronics controls expertise across all our business units and applications such as advanced vehicle hybridization and electrification initiatives. We are working with customers to develop new solutions for those markets where electrification will be adopted first such as hybrids, buses and urban delivery vehicles. These new solutions, which include advanced electric propulsion systems with fully integrated motors and controls, are included in our recently launched Spicer Electrified portfolio of products. Working with our joint venture partner, our latest integrated e-axle is scheduled to launch in the first quarter of 2018 in a bus application in China.
The development and implementation of our enterprise strategy is positioning Dana to grow profitably due to increased customer focus as we leverage our core capabilities, expand into new markets, develop and commercialize new technologies including for hybrid and electric vehicles.
Capital Structure Initiatives
In addition to investing in our business, we plan to continue prioritizing the allocation of capital to reduce debt and maintain a strong financial position. In January 2018, we announced our intention to drive toward investment grade metrics as part of a balanced approach to our capital allocation priorities and our goal of further strengthening our balance sheet.
Shareholder return actions
— When evaluating capital structure initiatives, we balance our growth opportunities and shareholder value initiatives with maintaining a strong balance sheet and access to capital. Our strong financial position has enabled us to simplify our capital structure while providing returns to our shareholders in the form of cash dividends and a reduction in the number of shares outstanding. Over the past five years, we returned $1,481 of cash to shareholders by redeeming all of our preferred stock and repurchasing common shares. From program inception in 2012 through December 31, 2017, we repurchased approximately 74 million shares, inclusive of the common share equivalent reduction resulting from redemption of preferred shares. With the availability under the previous authorization having expired, our Board of Directors authorized a new $100 share repurchase program which was effective January 2018 and expires at the end of 2019. We declared and paid quarterly common stock dividends over the past five years, raising the dividend from five cents to six cents per share in the second quarter of 2015. In recognition of our strong financial performance and confidence in our financial outlook, our Board approved an additional four cents per share increase in the quarterly dividend to ten cents per share in 2018.
Financing actions
— We have taken advantage of the lower interest rate environment to complete refinancing transactions in each of the past four years that resulted in lower effective interest rates while extending maturities. In 2017, we completed a $400 2025 note offering and entered into a $275 floating rate term loan. The proceeds of these issuances were used to repay higher cost international debt and to repay $450 of 2021 notes. In connection with amending our credit agreement to effectuate the term loan, we also increased our revolving credit facility by $100, providing us with $600 of back-up liquidity through 2022. Additionally, in 2017 we commenced the process of terminating one of our U.S. pension plans. This action allows us to effectively eliminate pension obligations and the associated future funding risk associated with interest rate and other market developments. We expect the termination action to be completed in 2019.
Other Initiatives
Aftermarket opportunities
— We have a global group dedicated to identifying and developing aftermarket growth opportunities that leverage the capabilities within our existing businesses – targeting increased future aftermarket sales. In January 2016, we completed the acquisition of Magnum® Gaskets' (Magnum) aftermarket distribution business, providing us access to new customers for sealing products and an additional aftermarket channel for other products. Powered by recognized brands such as Dana®, Spicer®, Victor Reinz®, Glaser®, GWB®, Thompson®, Tru-Cool®, SVL®, and Transejes™, Dana delivers a broad range of aftermarket solutions – including genuine, all makes, and value lines – servicing passenger, commercial and off-highway vehicles across the globe.
16
Selective acquisitions
— Our acquisition focus is principally directed at “bolt-on” or adjacent acquisition opportunities that have a strategic fit with our existing core businesses, particularly opportunities that support our enterprise strategy and enhance the value proposition of our product offerings. Any potential acquisition will be evaluated in the same manner we currently consider customer program opportunities and other uses of capital – with a disciplined financial approach designed to ensure profitable growth and increased shareholder value.
Acquisitions
USM
–
Warren
— On March 1, 2017, we completed the purchase of Warren Manufacturing LLC (USM – Warren), which holds certain assets and liabilities of the former Warren, Michigan production unit of U.S. Manufacturing Corporation (USM). With this transaction, we acquired proprietary tube-manufacturing processes and light-weighting intellectual property for axle tubes and shafts. Significant content was previously purchased from USM. Vertically integrating this content strengthens the supply chain for several of our most strategic customers. The new product and process technologies for light-weighting will assist our customers in achieving their sustainability and fuel efficiency goals. The USM – Warren acquisition added $96 of sales and $12 of adjusted EBITDA in 2017. The results of operations of the USM – Warren business are reported within our Light Vehicle operating segment.
We paid $104 for this business at closing, including $25 to effectively settle trade payable obligations originating from product purchases Dana made from USM prior to the acquisition. No debt was assumed with this transaction which was funded using cash on hand. Post-closing purchase price adjustments for working capital and other items, which totaled less than $1, were received in this year's third quarter. Reference is made to Note 2 of the consolidated financial statements in Item 8 for the allocation of purchase consideration to assets acquired and liabilities assumed.
BFP and BPT
— On February 1, 2017, we acquired 80% ownership interests in Brevini Fluid Power S.p.A. (BFP) and Brevini Power Transmission S.p.A. (BPT) from Brevini Group S.p.A. (Brevini). The acquisition expands our Off-Highway operating segment product portfolio to include technologies for tracked vehicles, doubling our addressable market for off-highway driveline systems and establishing Dana as the only off-highway solutions provider that can manage the power to both move the equipment and perform its critical work functions. This acquisition also brings a platform of technologies that can be leveraged in our light and commercial vehicle end markets, helping to accelerate our hybridization and electrification initiatives. The BFP and BPT acquisitions added $401 of sales and $40 of adjusted EBITDA in 2017. The results of operations of these businesses are reported within our Off-Highway operating segment.
We paid $181 at closing using cash on hand and assumed debt of $181 as part of the transaction. In December 2017, a purchase price reduction of $9 was agreed under the sale and purchase agreement provisions for determination of the net indebtedness and net working capital levels of BFP and BPT as of the closing date. In connection with the acquisition of BFP and BPT, Dana agreed to purchase certain real estate currently being leased by BPT from a Brevini affiliate for €25 by November 1, 2017. Purchase at this date did not occur due to document transfer requirements not having been fully satisfied. Receipt of the purchase price adjustment will occur concurrent with the completion of the real estate purchase during the first quarter of 2018. Reference is made to Note 2 of the consolidated financial statements in Item 8 for the allocation of purchase consideration to assets acquired and liabilities assumed. The terms of the agreement provide Dana the right to call Brevini's noncontrolling interests in BFP and BPT, and Brevini the right to put its noncontrolling interests in BFP and BPT to Dana, assuming Dana does not exercise its call rights, at dates and prices defined in the agreement.
SIFCO
—
On December 23, 2016, we acquired strategic assets of the commercial vehicle steer axle systems and related forged components businesses of SIFCO. The acquisition enables us to enhance our vertically integrated supply chain, which will further improve our cost structure and customer satisfaction by leveraging SIFCO's extensive experience and knowledge of sophisticated forged components. In addition to strengthening our position as a central source for products that use forged and machined parts throughout the region, this acquisition enables us to better accommodate the local content requirements of our customers, which reduces their import and other region-specific costs.
As part of the acquisition, we added two manufacturing facilities and approximately 1,400 employees. The strategic assets were acquired by Dana free and clear of any liens, claims or encumbrances and without assumption of any legacy liabilities of SIFCO. We had sales of $86 in 2016 resulting from business conducted under the previous supply agreement with SIFCO. The additional business relationships obtained as a result of the acquisition generated incremental sales of $44 in 2017. The results of operations of the SIFCO related business are reported within our Commercial Vehicle operating segment.
The SIFCO purchase price was $70, with the payment of $10 of the purchase price deferred until December 2017 pending any claims under indemnification provisions of the purchase agreement. In December 2017, the parties to the SIFCO transaction entered into a settlement agreement. Under this agreement, $3 was paid to the seller with the remaining deferred
17
purchase price of $7 being retained by Dana to settle indemnification claims. After the settlement of all indemnification claims, any remaining deferred purchase price will be paid to the seller. Reference is made to Note 2 of the consolidated financial statements in Item 8 for the allocation of purchase consideration to assets acquired and liabilities assumed.
Magnum
— On January 29, 2016, we acquired the aftermarket distribution business of Magnum, a U.S.-based supplier of gaskets and sealing products for automotive and commercial vehicle applications, for a cash payment of $18. Assets acquired included trademarks and trade names, customer relationships and goodwill. The results of operations of Magnum are reported within our Power Technologies operating segment.
Divestitures
Brazil Suspension Components Operations
— In December 2017, we entered into an agreement to divest our Brazil suspension components business (the disposal group). This business is non-core to our enterprise strategy and under-performing financially. As such, we agreed to divest the business for no consideration and contribute $10 of additional cash to the business prior to closing. Completion of the sale is expected in the first quarter of 2018 upon receipt of Brazilian antitrust approval. The disposal group was classified as held for sale at December 31, 2017. We recognized a pre-tax loss of $27 in the fo
urth quarter of 2017 to adjust the carrying value of the net assets to fair value and to recognize the liability for the additional cash required to be contributed to the business prior to closing. Reference is made to Note 3 of our consolidated financial statements in Item 8 for additional information, including the carrying amounts of the major classes of assets and
liabilities of the disposal group held for sale at December 31, 2017. Sales of the business being divested approximated $23 in 2017. In conn
ection with the divestiture of this business, we entered into a supply agreement whereby Dana will purchase specified components to satisfy customer requirements from the purchaser of the divested business at market prices.
Nippon Reinz
— On November 30, 2016, we sold our
53.7%
interest in Nippon Reinz Co. Ltd. (Nippon Reinz) to Nichias Corporation. Dana received net cash proceeds of
$5
and recognized a pre-tax loss of
$3
on the divestiture of Nippon Reinz, inclusive of the derecognition of the related noncontrolling interest. Nippon Reinz had sales of
$42
in 2016 through the transaction date.
Dana Companies
—
On December 30, 2016, we completed the divestiture of Dana Companies, LLC (DCLLC), a consolidated wholly-owned limited liability company that was established as part of our reorganization in 2008 to hold and manage personal injury asbestos claims retained by the reorganized Dana Corporation, which was merged into DCLLC. The assets of DCLLC at time of sale included cash and marketable securities along with the rights to insurance coverage in place to satisfy a significant portion of its liabilities. We received net cash proceeds of $29 at closing on December 30, 2016, with $3 retained by the purchaser subject to the satisfaction of certain future conditions. We recognized a pre-tax loss of $77 in 2016 upon completion of the transaction. We received payment of the retained $3 in the second quarter of 2017 and recognized such amount as income. Following completion of the sale, Dana has no obligation with respect to current or future asbestos claims. The sale of this business also enhanced our available liquidity since the net proceeds from the sale are available for use in our core businesses.
Venezuela
Operations
— In December 2014, we entered into an agreement to divest our operations in Venezuela (the disposal group) to an unaffiliated company for no consideration. We completed the divestiture in January 2015. In connection with the divestiture, we entered into a supply and technology agreement whereby Dana will supply product and technology to the operations at competitive market prices. Dana has no obligations to otherwise provide support to the operations. The disposal group was classified as held for sale at December 31, 2014, and we recognized a net charge of $77 – an $80 loss to adjust the carrying value of the net assets to fair value less cost to sell, with a reduction of $3 for the noncontrolling interest share of the loss. These assets and liabilities were presented as held for sale on our December 31, 2014 balance sheet. Upon completion of the divestiture of the disposal group in January 2015, we recognized a gain of $5 on the derecognition of the noncontrolling interest in a former Venezuelan subsidiary in other income (expense), net. We also credited other comprehensive income (loss) (OCI) attributable to the parent for $10 and OCI attributable to noncontrolling interests for $1 to eliminate the unrecognized pension expense recorded in accumulated other comprehensive income (loss) (AOCI). See Note 3 to our consolidated financial statements in Item 8 for additional information. With the completion of the sale in January 2015, Dana has no remaining investment in Venezuela.
Structural Products Business
— In 2010, we completed the sale of substantially all of the assets of our Structural Products business to Metalsa S.A. de C.V. (Metalsa) and reached a final agreement with the buyer on disputed issues in May 2014. Prior to the third quarter of 2012, Structural Products was reported as an operating segment of continuing operations. With the cessation of the retained operations in the third quarter of 2012, we began reporting the activities relating to the Structural Products business as discontinued operations. Legal and other costs incurred in 2014 to settle a customer complaint and the
18
remaining disputes with Metalsa and insurance recoveries in 2015 related to previously outstanding claims have extended the reporting of discontinued operations.
Segments
We manage our operations globally through four operating segments. Our Light Vehicle and Power Technologies segments primarily support light vehicle original equipment manufacturers (OEMs) with products for light trucks, SUVs, CUVs, vans and passenger cars. The Commercial Vehicle segment supports the OEMs of on-highway commercial vehicles (primarily trucks and buses), while our Off-Highway segment supports OEMs of off-highway vehicles (primarily wheeled vehicles used in construction, mining and agricultural applications).
Trends in Our Markets
Global Vehicle Production
|
|
|
|
|
Actual
|
|||||||||
|
(Units in thousands)
|
Dana 2018 Outlook
|
2017
|
2016
|
2015
|
|||||||||
|
North America
|
|
|
|
|
|
|
|
|
|
|
|||
|
Light Truck (Full Frame)
|
4,000
|
|
to
|
4,300
|
4,331
|
|
4,220
|
|
3,937
|
|
|||
|
Light Vehicle Engines
|
14,800
|
|
to
|
15,100
|
14,828
|
|
15,913
|
|
15,474
|
|
|||
|
Medium Truck (Classes 5-7)
|
245
|
|
to
|
255
|
246
|
|
233
|
|
237
|
|
|||
|
Heavy Truck (Class 8)
|
290
|
|
to
|
310
|
255
|
|
228
|
|
323
|
|
|||
|
Agricultural Equipment
|
50
|
|
to
|
60
|
54
|
|
53
|
|
58
|
|
|||
|
Construction/Mining Equipment
|
160
|
|
to
|
170
|
157
|
|
150
|
|
158
|
|
|||
|
Europe (including Eastern Europe)
|
|
|
|
|
|
|
|
|
|
|
|||
|
Light Truck
|
10,600
|
|
to
|
10,900
|
10,276
|
|
9,306
|
|
8,546
|
|
|||
|
Light Vehicle Engines
|
24,700
|
|
to
|
25,200
|
24,096
|
|
23,287
|
|
22,570
|
|
|||
|
Medium/Heavy Truck
|
480
|
|
to
|
495
|
486
|
|
463
|
|
434
|
|
|||
|
Agricultural Equipment
|
200
|
|
to
|
215
|
202
|
|
193
|
|
202
|
|
|||
|
Construction/Mining Equipment
|
310
|
|
to
|
330
|
309
|
|
290
|
|
299
|
|
|||
|
South America
|
|
|
|
|
|
|
|
|
|
|
|||
|
Light Truck
|
1,300
|
|
to
|
1,500
|
1,235
|
|
980
|
|
940
|
|
|||
|
Light Vehicle Engines
|
2,650
|
|
to
|
2,750
|
2,412
|
|
2,112
|
|
2,439
|
|
|||
|
Medium/Heavy Truck
|
90
|
|
to
|
100
|
89
|
|
70
|
|
88
|
|
|||
|
Agricultural Equipment
|
30
|
|
to
|
35
|
33
|
|
29
|
|
32
|
|
|||
|
Construction/Mining Equipment
|
8
|
|
to
|
12
|
9
|
|
10
|
|
13
|
|
|||
|
Asia-Pacific
|
|
|
|
|
|
|
|
|
|
|
|||
|
Light Truck
|
29,800
|
|
to
|
31,000
|
29,495
|
|
27,465
|
|
24,160
|
|
|||
|
Light Vehicle Engines
|
52,500
|
|
to
|
53,500
|
52,543
|
|
50,533
|
|
47,209
|
|
|||
|
Medium/Heavy Truck
|
1,850
|
|
to
|
2,050
|
2,039
|
|
1,661
|
|
1,383
|
|
|||
|
Agricultural Equipment
|
650
|
|
to
|
680
|
653
|
|
648
|
|
676
|
|
|||
|
Construction/Mining Equipment
|
445
|
|
to
|
465
|
441
|
|
396
|
|
405
|
|
|||
North America
Light vehicle markets
— Improving economic conditions during the past few years have contributed to increased light vehicle sales and production levels in North America. Overall economic conditions in North America continue to be relatively favorable with improving employment levels and upward trending consumer confidence. After increasing by about 1% in 2016 from 2015, the North America light vehicle market begun to show signs of weakening demand levels this past year as strong sales levels the past few years have significantly reduced the built-up demand to replace older vehicles. As such, 2017 light vehicle sales declined about 2% from 2016. Within the light vehicle segment, passenger car sales declined around 5% in 2016, and another 9% in 2017. In part due to comparatively low fuel prices when compared with recent years, demand for light trucks and SUVs continued to be strong, increasing about 7% in 2016 and 4% in 2017. Many of our customer programs are focused in the full frame light truck segment. Sales in this segment increased 6% in 2016 and another 3% in 2017. Production levels were generally reflective of light vehicle sales. Production of 17.8 million light vehicles in 2016 was 2% higher than 2015, with 2017 light vehicle production coming in at approximately 17.1 million units – down 4% from 2016. Light vehicle engine production was impacted more by the developments in the passenger car segment, with production in 2017 declining about 7% versus
19
2016 after increasing 3% year-over-year in 2016. In the key full frame light truck segment, production levels in 2017 increased about 3% compared to 2016 following an increase of 7% in 2016 from the preceding year. Days’ supply of total light vehicles in the U.S. at the end of December the past three years has been around 61 to 62 days. In the full frame light truck segment, days supply in inventory at December 31, 2017 approximated 64 days, down slightly from 65 days at December 31, 2016 and up from 62 days at the end of December 2015.
Light truck markets are expected to remain relatively strong given the positive North America economic environment that is expected to drive continued growth in manufacturing and construction activities in 2018. Rising interest rates, less pent-up demand, higher levels of consumer debt and declining used car prices may constrict demand. We expect Dana sales will continue to benefit from strong market demand for key vehicles that we supply which launched within the past two years. Our current outlook for 2018 has full frame light truck production at 4.0 to 4.3 million vehicles, comparable to down 8% with 2017 production of about 4.3 million vehicles. We expect light vehicle engine production in 2018 to be 14.8 to 15.1 million units, comparable to up slightly compared to this past year.
Medium/heavy vehicle markets
— The commercial vehicle market is similarly impacted by many of the same macroeconomic developments impacting the light vehicle market. Strong production levels in the heavy truck segment in 2014 and first half of 2015 led to more trucks than required to meet freight demand. As a consequence, production levels in 2016 were scaled back. Class 8 heavy truck production in 2016 declined 29% from 2015, while Classes 5-7 medium truck build was relatively comparable. The North American economy gaining strength in 2017 has led to increased freight-hauling demand and a strengthening order book for new Class 8 trucks. During 2017, heavy duty Class 8 truck production was up approximately 12% while medium duty Classes 5-7 truck production was up 6% compared with 2016.
Class 8 order levels increased significantly during the second half of 2017, positioning 2018 to be a strong production year. With the strong Class 8 order book and an expectation that the North America economic environment will continue to be strong in 2018, our outlook for 2018 Class 8 production in North America is 290,000 to 310,000 trucks, a level which is up about 14 to 22% compared with the 2017 build level. In the medium duty segment, we expect full year 2018 production to be in the range of 245,000 to 255,000 vehicles, comparable to up 4% from 2017.
Markets Outside of North America
Light vehicle markets
— Signs of an improved overall European economy have been evident, albeit mixed at times, during the past few years. While improving modestly in 2015 and 2016, signs of a strengthening economic climate were evident in 2017. Reflective of an improved economic environment, light vehicle engine production was up about 3% in both 2016 and 2017 and light truck production was higher by 9 to 10% in each of the past two years. The United Kingdom's decision to withdraw from the European Union, along with political developments in other European countries, continues to cast an element of uncertainty around continued economic improvement in the region. At present, we expect overall stable to improving economic conditions across the entire region in 2018. Our full year 2018 outlook expects an increase in light truck and light vehicle engine production of around 3 to 6% from 2017. The economic climate in many South American markets the past few years has been weak, volatile and challenging. After significant production declines in 2014 and 2015, there were signs that demand levels had bottomed out in 2016. Production levels in 2017 were reflective of an improving market, with light vehicle engine production up 14% and light truck production up 26% compared to 2016. At present, we expect further economic recovery in the region in 2018. Our full year 2018 outlook has light truck production increasing 5 to 21% from 2017, with light vehicle engine production up 10 to 14% compared to this past year. The Asia Pacific markets have been relatively strong the past few years. Light truck production increased 8% in 2015 and was up another 14% in 2016, while light vehicle engine production increased 2% in 2015 and another 7% in 2016. Further production increases occurred this past year, with 2017 light truck production up 7% and light vehicle engine build up 4%. Our full year 2018 outlook for the Asia Pacific light vehicle markets is for continued strong production levels, with the light truck segment up 1 to 5% from 2017 and light engine production being comparable to up 2%.
Medium/heavy vehicle markets
— Some of the same factors referenced above that affected light vehicle markets outside of North America similarly affected the medium/heavy markets. A strengthening European market the past three years contributed to medium/heavy truck production increasing 9% in 2015, 7% in 2016 and another 5% in 2017. Our 2018 full year outlook anticipates continued strong production at levels relatively comparable with 2017. A weakening South America economic climate beginning in 2014 led to medium/heavy truck production declining 47% in 2015 and another 20% in 2016. As with the light vehicle markets, improving economic conditions in the region led to medium/heavy truck production in 2017 being up about 28% from the preceding year. We expect that continued economic recovery in 2018 will contribute to comparable to higher medium/truck production in 2018. As such, our 2018 outlook currently anticipates comparable to higher production of around 12% when compared to 2017. A stronger than expected China market and an improving India market contributed to increases in medium/heavy truck production in the Asia Pacific region of about 20% in 2016 and another 23% in 2017 when
20
compared with the preceding year. This past year's strong demand was driven in part by impending regulations in China that limit axle load and weight which accelerated buying during the second half of 2016 and into 2017 prior to the new regulations becoming effective. With some pre-buy in China in 2017 likely reducing 2018 purchases, our 2018 production outlook expects aggregate production in the region to be comparable to down 9% from 2017.
Off-Highway Markets
— Our off-highway business has a large presence outside of North America, with approximately 75% of its sales coming from Europe and 15% from South America and Asia Pacific combined. We serve several segments of the diverse off-highway market, including construction, agriculture, mining and material handling. Our largest markets are the construction/mining and agricultural equipment segments which have been relatively weak over the past few years. Global demand in the agriculture market was down about 11% in 2014, 7% in 2015 and 5% in 2016. The construction/mining segment weakened about 4% in 2014, 11% in 2015 and 3% in 2016. These markets began to rebound in 2017 along with general economic recovery in several global markets, and in particular the European markets where this segment has a significant presence. During 2017, global production levels in the construction/mining and agriculture segments increased by about 8% and 2%. Consistent with expectations for improving global economic conditions, we expect that off-highway market demand will increase in 2018. Our 2018 outlook has production in the construction/mining segment increasing about 1 to 7% and the agriculture segment being down 1% to up 5% from 2017.
Foreign Currency
With 55% of our sales coming from outside the U.S., international currency movements can have a significant effect on our sales and results of operations. The euro zone countries, Brazil, Thailand, Mexico and China accounted for approximately 44%, 8%, 8%, 7% and 7% of our non-U.S. sales in 2017. Although sales in Argentina and South Africa are each less than 5% of our non-U.S. sales, exchange rate movements of those countries have been volatile and significantly impacted sales from time to time. Translation of our international activities at average exchange rates in 2015 as compared to average rates in 2014 reduced sales by $516, with $268 attributable to a weaker euro and $91 to a weaker Brazilian real. In 2016, weaker international currencies reduced sales by another $173. A weaker Argentine peso, British pound, Mexican peso, South African rand and Brazilian real reduced sales by $70, $23, $19, $18 and $11, while the euro was relatively stable in 2016. International currencies strengthened against the U.S. dollar in 2017, increasing 2017 sales by $54. A stronger euro, Brazilian real, Thai baht and South African rand more than offset a weaker Argentine peso. Based on our current sales and exchange rate outlook for 2018, we expect overall stability in international currencies with a modest reduction to sales. At sales levels in our current outlook for 2018, a 5% movement on the euro would impact our annual sales by approximately $100. A 5% change on the Brazilian real, Thai baht, Mexican peso and Chinese yuan rates would impact our annual sales in each of those countries by approximately $10 to $20.
International Markets
The United Kingdom's decision to exit the European Union ("Brexit") has provided some uncertainty and potential volatility around European currencies, along with uncertain effects of future trade and other cross-border activities of the United Kingdom with the European Union and other countries. Similarly, with new government leadership in the U.S. assuming control in early 2017, there is added uncertainly around future economic and trade policy and its potential impact on the U.S. dollar relative to other currencies as well as its direct impact on trade with other countries.
The Brazil market is an important market for our Commercial Vehicle segment, representing about 19% of this segment's 2017 sales. Our medium/heavy truck sales in Brazil account for approximately 77% of our total sales in the country. Reduced market demand resulting from the weak economic environment in Brazil in 2015 led to production levels in the light vehicle and medium/heavy duty truck markets that were lower by about 22% and 44% from 2014. Continued weakness in 2016 resulted in further reductions in medium/heavy truck production of about 20% and a light vehicle production decline of around 10%. As a consequence, sales by our operations in Brazil for 2016 approximated $200, down from about $500 in 2014. In response to the challenging economic conditions in this country, we implemented restructuring and other cost reduction actions and reduced costs to the extent practicable. As discussed in Note 2 to our consolidated financial statements in Item 8, we completed a transaction in December 2016 that provided us with the underlying assets and personnel supporting our pre-existing business with a supplier along with some incremental business. With this transaction, we have enhanced our competitive position in the market and should benefit significantly in future years as the Brazilian markets rebound. The Brazilian economy has rebounded in 2017, leading to increased medium/heavy truck and light truck production of more than 25% from 2016. Further economic improvement and increased production is expected in 2018.
21
Commodity Costs
The cost of our products may be significantly impacted by changes in raw material commodity prices, the most important to us being those of various grades of steel, aluminum, copper and brass. The effects of changes in commodity prices are reflected directly in our purchases of commodities and indirectly through our purchases of products such as castings, forgings, bearings and component parts that include commodities. Most of our major customer agreements provide for the sharing of significant commodity price changes with those customers. Where such formal agreements are not present, we have historically been successful implementing price adjustments that largely compensate for the inflationary impact of material costs. Material cost changes will customarily have some impact on our financial results as customer pricing adjustments typically lag commodity price changes.
Our costs in 2017 and 2016 increased on a year-over-year basis by approximately $70 and $8 due to higher commodity costs, while lower commodity prices reduced year-over-year costs in 2015 by $10. During 2017, material recovery actions increased sales by $57 while other pricing actions reduced sales by $46, yielding a net year-over-year sales increase of $11. Material cost recovery and pricing actions increased sales by $10 in 2016 and $1 in 2015.
U.S. Tax Reform
In December 2017, the U.S. introduced broad ranging tax reform with the passage of the Tax Cuts and Jobs Act ("Act") legislation. Among the tax reforms was a reduction of the corporate tax rate from 35% to 21%. Historically, we've recognized deferred tax assets for items providing future reductions of taxable income. These deferred tax assets are valued based on the corporate tax rate expected to be available when the deductions are taken. With enactment of the lower corporate tax rate in 2017, we've taken a charge to tax expense in the fourth quarter of 2017 to reduce the value of these assets. The effect of the rate reduction on deferred tax assets in combination with other provisions of the Act resulted in a net non-cash increase in 2017 income tax expense of $186. Among the tax reform provisions was a transitional U.S. tax, or toll charge, assessed on undistributed earnings of foreign operations. We were able to utilize existing tax attributes to offset this transitional tax liability. As such, adoption of the Act's provisions did not give rise to any cash taxes.
Beyond 2017, the lower corporate tax rate will benefit our results of operations in the form of reduced tax expense. Although the reduced tax rate will benefit earnings, there is not likely to be a corresponding reduction of cash taxes. We have net operating loss carryforwards that are utilized to offset U.S. cash tax obligations, likely over the next several years. With implementation of a territorial tax system and exclusion of foreign subsidiary dividends from taxation in the U.S., we believe the Act will provide some greater flexibility to repatriate future earnings of our foreign operations.
Sales, Earnings and Cash Flow Outlook
|
2018
Outlook |
2017
|
2016
|
2015
|
||||||||||
|
Sales
|
$7,500 - $7,700
|
$
|
7,209
|
|
$
|
5,826
|
|
$
|
6,060
|
|
|||
|
Adjusted EBITDA
|
$910 - $960
|
$
|
835
|
|
$
|
660
|
|
$
|
652
|
|
|||
|
Net cash provided by operating activities
|
~7.5% of Sales
|
$
|
554
|
|
$
|
384
|
|
$
|
406
|
|
|||
|
Purchases of property, plant and equipment
|
~4.0% of Sales
|
$
|
393
|
|
$
|
322
|
|
$
|
260
|
|
|||
|
Free Cash Flow
|
~3.5% of Sales
|
$
|
161
|
|
$
|
62
|
|
$
|
146
|
|
|||
Adjusted EBITDA and Free Cash Flow are non-GAAP financial measures. See the Non-GAAP Financial Measures discussion below for definitions of our non-GAAP financial measures and reconciliations to the most directly comparable U.S. generally accepted accounting principles (GAAP) measures. We have not provided a reconciliation of our adjusted EBITDA outlook to the most comparable GAAP measure of net income. Providing net income guidance is potentially misleading and not practical given the difficulty of projecting event driven transactional and other non-core operating items that are included in net income, including restructuring actions, asset impairments and certain income tax adjustments. The accompanying reconciliations of these non-GAAP measures with the most comparable GAAP measures for the historical periods presented are indicative of the reconciliations that will be prepared upon completion of the periods covered by the non-GAAP guidance.
We experienced declines in total sales in 2015 and 2016 due to weaker international currencies relative to the U.S. dollar. For these two years combined, currency translation effects reduced sales by $689. Adjusted for currency and divestiture effects, sales in these years were relatively comparable, with new customer programs largely offsetting the impacts of overall weaker end user demand across our global businesses. We experienced uneven end user markets, with some being relatively strong and
22
others somewhat weak, and the conditions across the regions of the world differing quite dramatically. In 2017, international currencies were relatively stable, providing a $54 benefit to sales. The increase in 2017 sales of 24% was driven primarily by acquisitions and stronger market demand. Acquisitions, net of divestitures, added $500 of sales, while stronger market demand and contributions from new customer programs increased sales by $829 – an organic increase of 14%. Our 2018 sales outlook is $7,500 to $7,700,
with the sales growth coming principally from our new business backlog that is expected to contribute about
$300
to 2018 sales. A full year of sales from our 2017 acquisitions and net pick-up in overall market demand is expected to also contribute increased sales in 2018, while we expect currency effects to again be relatively stable with this past year.
Adjusted EBITDA margin as a percent of sales remained relatively constant at around 11% in 2016 and 2015 despite certain markets being weak and volatile. We continue to focus on margin improvement through right sizing and rationalizing our manufacturing operations, leveraging resources across the global organization, implementing other cost reduction initiatives and ensuring that customer programs are competitively priced. We achieved Adjusted EBITDA margin growth in 2017 as we benefited from the operating leverage attributable to increased sales volumes, while at the same time digesting and integrating several acquisitions. At our current sales outlook for 2018, we expect full year 2018 Adjusted EBITDA to approximate $910 to $960. Margin in 2018 is expected to exceed 12%, as we benefit from higher margin net new business, improve cost performance and realize synergies from the integration of our recent acquisitions, more than offsetting the increased investment we expect to make in 2018 to support our electrification strategy initiatives.
We have generated positive free cash flow in recent years while increasing capital spending to support organic business growth through launching new business with customers. Free cash flow in 2015 declined from the previous year due to lower earnings and increased capital spend to support new program launches, with lower cash taxes and restructuring payments providing a partial offset. Reduced free cash flow in 2016 was primarily attributable to our continued success in being awarded significant new customer programs. Although many of the recent program wins were not scheduled to begin production until 2018, certain of these programs required capital investment beginning in 2016. As such, cash used for capital investments in 2016 was $62 higher than in 2015. As planned, an elevated level of capital spending at around 5.5% of sales continued into 2017 to support new customer programs. Despite an increase in capital spending of $71 in 2017, free cash increased by $99, primarily from a stronger earnings performance which contributed to increased operating cash flows of $170. With the
required capital to support new programs beginning to
dissipate and return to more typical levels over the next couple years. We expect capital spend in 2018 will be around 4% of sales. Operating cash flows in 2018 are expected to again be around 7.5% of sales. A continued growth in earnings is expected to benefit 2018 operating cash flows along with a reduced amount of one-time transaction-related cash expenditures that were incurred in 2017 to facilitate acquisitions completed this past year. Partially offsetting the benefit from higher earnings and lower transaction expenditures is an expected higher level of cash taxes and working capital investment. With a comparable level of operating cash flows relative to sales in 2018, the reduction in capital spending is expected to provide free cash flow of about 3.5% of sales – an increase of about $100 from the 2.2% of sales generated in 2017.
Among our Operational and Strategic Initiatives are increased focus on and investment in product technology – delivering products and technology that are key to bringing solutions to issues of paramount importance to our customers. Our success on this front is measured, in part, by our sales backlog – net new business received that will be launching in the future and adding to our base annual sales. This backlog excludes replacement business and represents incremental sales associated with new programs for which we have received formal customer awards. At December 31, 2017, our sales backlog of net new business for the 2018 through 2020 period was $800, a 7% increase from the $750 three-year sales backlog that existed at the end of 2016. The increased three-year sales backlog at December 31, 2017 reflects continued new business wins, as the expected impact of revised market volumes and currency effects were minimal.
23
Consolidated Results of Operations
Summary Consolidated Results of Operations (
2017
versus
2016
)
|
2017
|
2016
|
||||||||||||||||
|
Dollars
|
% of
Net Sales |
Dollars
|
% of
Net Sales |
Increase/
(Decrease) |
|||||||||||||
|
Net sales
|
$
|
7,209
|
|
|
$
|
5,826
|
|
|
$
|
1,383
|
|
||||||
|
Cost of sales
|
6,147
|
|
85.3
|
%
|
4,982
|
|
85.5
|
%
|
1,165
|
|
|||||||
|
Gross margin
|
1,062
|
|
14.7
|
%
|
844
|
|
14.5
|
%
|
218
|
|
|||||||
|
Selling, general and administrative expenses
|
511
|
|
7.1
|
%
|
406
|
|
7.0
|
%
|
105
|
|
|||||||
|
Amortization of intangibles
|
11
|
|
8
|
|
3
|
|
|||||||||||
|
Restructuring charges, net
|
14
|
|
36
|
|
(22
|
)
|
|||||||||||
|
Loss on disposal group held for sale
|
(27
|
)
|
|
|
(27
|
)
|
|||||||||||
|
Loss on sale of subsidiaries
|
|
|
(80
|
)
|
80
|
|
|||||||||||
|
Other income (expense), net
|
(9
|
)
|
18
|
|
(27
|
)
|
|||||||||||
|
Earnings before interest and income taxes
|
490
|
|
332
|
|
158
|
|
|||||||||||
|
Loss on extinguishment of debt
|
(19
|
)
|
(17
|
)
|
(2
|
)
|
|||||||||||
|
Interest income
|
11
|
|
13
|
|
(2
|
)
|
|||||||||||
|
Interest expense
|
102
|
|
113
|
|
(11
|
)
|
|||||||||||
|
Earnings before income taxes
|
380
|
|
215
|
|
165
|
|
|||||||||||
|
Income tax expense (benefit)
|
283
|
|
(424
|
)
|
707
|
|
|||||||||||
|
Equity in earnings of affiliates
|
19
|
|
14
|
|
5
|
|
|||||||||||
|
Net income
|
116
|
|
653
|
|
(537
|
)
|
|||||||||||
|
Less: Noncontrolling interests net income
|
10
|
|
13
|
|
(3
|
)
|
|||||||||||
|
Less: Redeemable noncontrolling interests net loss
|
(5
|
)
|
|
(5
|
)
|
||||||||||||
|
Net income attributable to the parent company
|
$
|
111
|
|
$
|
640
|
|
$
|
(529
|
)
|
||||||||
Sales
— The following table shows changes in our sales by geographic region.
|
Amount of Change Due To
|
|||||||||||||||||||||||
|
2017
|
2016
|
Increase/
(Decrease) |
Currency
Effects |
Acquisitions
(Divestitures) |
Organic
Change |
||||||||||||||||||
|
North America
|
$
|
3,688
|
|
$
|
3,128
|
|
$
|
560
|
|
$
|
(1
|
)
|
$
|
127
|
|
$
|
434
|
|
|||||
|
Europe
|
2,154
|
|
1,616
|
|
538
|
|
35
|
|
294
|
|
209
|
|
|||||||||||
|
South America
|
500
|
|
338
|
|
162
|
|
3
|
|
54
|
|
105
|
|
|||||||||||
|
Asia Pacific
|
867
|
|
744
|
|
123
|
|
17
|
|
25
|
|
81
|
|
|||||||||||
|
Total
|
$
|
7,209
|
|
$
|
5,826
|
|
$
|
1,383
|
|
$
|
54
|
|
$
|
500
|
|
$
|
829
|
|
|||||
Sales in 2017 were $1,383 higher than in 2016. Stronger international currencies increased sales by $54. The acquisitions of BFP, BPT, SIFCO, USM – Warren and Magnum in 2016 and 2017 generated a year-over-year increase in sales of $542, with the divestiture of Nippon Reinz resulting in a reduction of $42. The organic sales increase of $829 resulted primarily from stronger light truck markets, strengthening global off-highway demand, stronger medium/heavy truck markets in Europe and South America, and contributions from new business.
The North America sales increase from acquisitions in 2017 relates primarily to the USM – Warren purchase, with a lesser amount being added by the BFP, BPT and Magnum transactions. The organic sales increase of 14% was driven principally by stronger production levels on certain of our key light truck programs, with stronger medium/heavy truck production and off-highway demand levels also providing some contribution.
Excluding currency effects and the increase in sales of $294 attributable to the BFP and BPT acquisitions, 2017 sales in Europe were 13% higher than in 2016. Stronger off-highway market demands were a primary driver of the organic sales increase, although each of our operating segments experienced increased organic sales, primarily from higher production/demand levels.
In South America, 2017 sales benefited from a stronger Brazil real, however, that was largely offset by a weaker Argentina peso. The acquisition-related sales increase resulted from the SIFCO and BPT acquisitions. Excluding these effects, sales were
24
up 31% from 2016. The organic sales increase in the region was driven largely by stronger 2017 production levels, with light truck and medium/heavy truck production each up more than 25% from the preceding year.
Asia Pacific sales in 2017 were 17% higher than 2016. Sales increased by $67 from the BPT and BFP acquisitions, more than offsetting the $42 reduction attributable to the Nippon-Reinz divestiture. Sales in this region also benefited from a stronger India rupee and Thailand baht. The organic sales increase of 11% in this region was due primarily to stronger light vehicle production levels and off-highway market demand, along with contributions from new customer programs.
Cost of sales and gross margin
— Cost of sales for 2017 increased $1,165, or 23%, when compared to 2016. Similar to the factors affecting sales, the increase was primarily due to higher overall sales volumes and the inclusion of acquired businesses. Cost of sales attributed to net acquisitions, which included $14 of incremental cost assigned to inventory as part of business combination accounting, amounted to $423, or 84.8% of the sales of those businesses. Excluding the effects of acquisitions and divestitures, cost of sales as a percent of sales declined from 85.5% of sales in 2016 to 85.3% of sales in 2017 – a reduction of 20 basis points. This reduction in cost of sales as a percent of sales was largely attributable to better fixed cost absorption on the higher production volume. Cost of sales also benefited from material cost savings of approximately $67 and a reduction in warranty expense of $8. The benefit from higher production levels and other items was partially offset by increased material commodity prices of $70, start-up/launch costs of $30 and engineering and development expense of $24.
Gross margin of $1,062 for 2017 increased $218 from 2016. Gross margin as a percent of sales was 14.7% in 2017, 20 basis points higher than in 2016. Acquisitions net of divestitures added $76 of gross margin. The margin improvement as a percent of sales was driven principally by the cost of sales factors referenced above.
Selling, general and administrative expenses (SG&A)
— SG&A expenses in 2017 were $511 (7.1% of sales) as compared to $406 (7.0% of sales) in 2016. SG&A attributed to net acquisitions was $73. Excluding the increase associated with acquisitions and divestitures, SG&A expenses as a percent of sales were 6.5% of sales, 50 basis points lower than the same period of 2016. The $32 year-over-year increase exclusive of net acquisitions was principally due to an increase in salary and benefits expenses of $41 primarily relating to increased compensation expense resulting from better performance in relation to incentive targets in 2017. Selling costs and other discretionary spending were $9 lower than in 2016.
Amortization of intangibles
— The increase of $3 in amortization expense was primarily attributable to amortization of the intangibles acquired in the acquisitions completed in late 2016 and the first quarter of 2017.
Restructuring charges, net
— During 2017, we approved additional plans to implement certain headcount reduction initiatives in our Off-Highway business as part of the BPT and BFP acquisition integration, resulting in the recognition of $14, primarily for severance and benefits costs, during 2017. Including costs associated with the newly approved actions during 2017 and costs associated with previously announced initiatives, net of the reversal described below, restructuring expense during 2017 was $14. During the fourth quarter of 2017, in response to better-than-expected market recovery in our Off-Highway business in Europe, management re-evaluated the economic conditions of our global Off-Highway business and determined that a portion of the previously approved 2016 restructuring program is no longer economically prudent. This change in facts and circumstances led to the decision to reverse $8 of previously accrued liabilities. Restructuring charges of $36 in 2016 included $14 of costs attributable to headcount reductions in our Off-Highway segment and $10 for headcount reductions in our Brazil Commercial Vehicle business that were taken in connection with our acquisition of the SIFCO business. The remaining amount was attributable to the planned closure of our Commercial Vehicle manufacturing facility in Glasgow, Kentucky, headcount reduction actions at our corporate facilities in the U.S. and employee separation and exit costs associated with previously announced actions.
Loss on disposal group held for sale
— Reference is made to Note 3 of the consolidated financial statements in Item 8 for a discussion of the pending divestiture of our Brazil suspension components business.
Loss on sale of subsidiaries
— Reference is made to Note 3 of the consolidated financial statements in Item 8 for a discussion of the 2016 divestitures of DCLLC and Nippon Reinz.
25
Other income (expense), net
— The following table shows the major components of other income (expense), net.
|
|
2017
|
2016
|
|||||
|
Government grants and incentives
|
$
|
7
|
|
$
|
8
|
|
|
|
Foreign exchange loss
|
(3
|
)
|
(3
|
)
|
|||
|
Strategic transaction expenses
|
(25
|
)
|
(13
|
)
|
|||
|
Insurance and other recoveries
|
|
|
10
|
|
|||
|
Gain on sale of marketable securities
|
|
|
7
|
|
|||
|
Amounts attributable to previously divested/closed operations
|
3
|
|
|
|
|||
|
Other, net
|
9
|
|
9
|
|
|||
|
Other income (expense), net
|
$
|
(9
|
)
|
$
|
18
|
|
|
The higher level of strategic transaction expenses in 2017 is primarily attributable to costs incurred in connection with acquiring and integrating the BFP, BPT and USM businesses beginning in the first quarter of 2017. Amounts attributable to previously divested/closed operations in 2017 includes the receipt of the remaining proceeds on our December 2016 divestiture of DCLLC. See Note 19 to our consolidated financial statements in Item 8 for additional information. In 2016, DCLLC received a recovery of $8 of costs previously incurred on behalf of other participants in a consortium that existed to administer certain legacy personal injury claims and realized gains of $7 from the sale of portfolio investments.
Loss on extinguishment of debt
—
As discussed in Note 14 to our consolidated financial statements in Item 8, we redeemed $100 of our September 2021 Notes, repaid indebtedness of our BPT and BFP subsidiaries and repaid certain bank debt in Brazil during the second quarter of 2017, and we redeemed the remaining $350 of our September 2021 Notes in this year's third quarter. We incurred redemption premiums of $15 in connection with these repayments and wrote off $4 of previously deferred financing costs associated with the debt that was extinguished. In the second quarter of 2016, we redeemed our February 2021 Notes, incurring a redemption premium of $12, and also restructured our domestic revolving credit facility. In connection with these transactions, we wrote off $5 of previously deferred financing costs.
Interest income and interest expense
— Interest income was $11 in 2017 and $13 in 2016. Interest expense was $102 in 2017 and $113 in 2016. A lower average interest rate on borrowings was partially offset by higher average debt levels in 2017. Average debt levels were higher in 2017 in part due to debt of $181 assumed in connection with the acquisition of BFP and BPT. As discussed in Note 14 to our consolidated financial statements in Item 8, we completed several financing transactions since May 2016 which in combination with cross-currency swaps effectively resulted in euro-denominated obligations at lower interest rates. Average effective interest rates, inclusive of amortization of debt issuance costs, approximated 5.5% and 6.5% in 2017 and 2016.
Income tax expense (benefit)
— Income taxes were an expense of $283 in 2017 and a benefit of $424 in 2016. With the enactment of the Tax Cuts and Jobs Act occurring in December 2017 in the U.S., provisions of this tax reform legislation were required to be recognized in 2017. The most significant 2017 impact of this legislation was the reduction of net deferred tax assets to reflect expected realization at the lower U.S. corporate tax rate of 21% rather than the previous rate of 35%. The net impact of recognizing the required elements of the new tax reform legislation was an increase in tax expense of $186. During 2017, continued improvement in our profit outlook enabled us to release $27 of valuation allowances on state deferred tax assets. In 2016, we determined that most of the valuation allowances against U.S. deferred taxes were no longer required. Release of these valuation allowances resulted in a $501 income tax benefit. Additionally, developments in Brazil led to our assessment that an allowance against certain deferred taxes in that country was appropriate, and we recognized tax expense of $25 to establish this valuation allowance. See Note 18 to our consolidated financial statements in Item 8 of Part II for further disclosures around these items.
Excluding the effects of the items referenced in the preceding paragraph, our effective tax rates were 33% in 2017 and 24% in 2016. These rates vary from the applicable U.S. federal statutory rate of 35% in these periods primarily due to valuation allowances in several countries and lower statutory tax rates outside the U.S. In 2016, a benefit of $58 for a reduction of accrued taxes on earnings of foreign operations resulting from legal entity restructuring and a revised determination as to permanent reinvestment contributed to a lower effective tax rate. These benefits were offset by tax expense of $17 on dividends and other income attributable to foreign operations, $30 of expense recognized to establish provisions associated with uncertain tax positions and $11 of amortization of a prepaid tax asset that was written off to retained earnings on January 1, 2017 in connection with the adoption of new guidance relating to intra-entity transfers. See Note 1 to our consolidated financial statements in Item 8 of Part II for further disclosure around the adoption of the new intra-entity transfer guidance.
In countries where our history of operating losses does not allow us to satisfy the “more likely than not” criterion for
26
recognition of deferred tax assets, we have generally recognized no income tax on the pre-tax income or losses as valuation allowance adjustments offset the associated tax effects. Following the release of valuation allowances on our U.S. deferred tax assets in the fourth quarter of 2016, tax effects relating to U.S. income in 2017 are no longer being offset by adjustments to the valuation allowance. We believe that it is reasonably possible that a valuation allowance of up to $8 related to a subsidiary in Argentina will be released in the next twelve months.
Equity in earnings of affiliates
— Net earnings from equity investments was $19 in 2017 compared with $14 in 2016. Equity in earnings from BSFB was $9 in 2017 and $7 in 2016. Equity in earnings from DDAC was $9 in 2017, inclusive of a $4 charge for asset transfer and conversion of certain assets, and $7 in 2016.
Noncontrolling interests net income
— The reduced level of earnings attributable to noncontrolling interests is generally attributable to reduced earnings of the consolidated operations that are less than wholly-owned. The reduction in 2017 was due, in part, to increased tax expense in 2017 associated with planned legal entity restructuring. The redeemable noncontrolling interest relates to the acquisition of BFP and BPT in the first quarter of 2017 on which we have call options as described more fully in Note 2 of the consolidated financial statements in Item 8.
Segment Results of Operations (
2017
versus
2016
)
Light Vehicle
|
Sales
|
Segment
EBITDA |
Segment
EBITDA Margin |
|||||||||
|
2016
|
$
|
2,607
|
|
$
|
279
|
|
10.7
|
%
|
|||
|
Volume and mix
|
452
|
|
92
|
|
|||||||
|
Acquisition
|
96
|
|
12
|
|
|||||||
|
Performance
|
14
|
|
(22
|
)
|
|||||||
|
Currency effects
|
3
|
|
(2
|
)
|
|||||||
|
2017
|
$
|
3,172
|
|
$
|
359
|
|
11.3
|
%
|
|||
Light Vehicle sales in 2017, exclusive of currency and the increased sales from the acquisition of USM – Warren on March 1 of this year, were 18% higher than 2016. The volume-related sales increase was driven primarily by stronger production levels, content increases and favorable model mix on certain of our significant full frame light truck programs in North America, resulting in sales growth that exceeded overall higher 2017 North America full frame light truck production of 3%. Sales in this segment also benefited from increased production levels in Europe, South America and Asia Pacific and new customer programs, including the transfer of a program previously supported by our Commercial Vehicle segment that moved to Light Vehicle in mid-2016 when the axle used to support the program was replaced with an axle produced by the Light Vehicle segment. This program increased Light Vehicle 2017 sales by approximately $50. Customer pricing and cost recovery impacts increased sales by $14.
Light Vehicle segment EBITDA increased by $80 in 2017. Higher sales volumes provided a benefit of $92, while the acquisition of USM – Warren contributed $12. The year-over-year performance-related earnings reduction in 2017 was driven by $37 of increased commodity costs and $30 of incremental new program start-up and launch-related costs. Partially offsetting these higher costs were pricing and material recovery actions that increased segment EBITDA by $14 and material cost initiatives that provided increased savings of $32. The remaining performance-related reduction of $1 was attributable to higher engineering investment and increased incentive compensation net of other earnings improvement actions.
Commercial Vehicle
|
Sales
|
Segment
EBITDA |
Segment
EBITDA Margin |
|||||||||
|
2016
|
$
|
1,254
|
|
$
|
96
|
|
7.7
|
%
|
|||
|
Volume and mix
|
81
|
|
20
|
|
|||||||
|
Acquisition
|
44
|
|
1
|
|
|||||||
|
Performance
|
12
|
|
6
|
|
|||||||
|
Currency effects
|
21
|
|
(7
|
)
|
|||||||
|
2017
|
$
|
1,412
|
|
$
|
116
|
|
8.2
|
%
|
|||
27
Currency effects which increased sales in 2017 were primarily due to a stronger euro and Brazilian real. The increased sales from acquisition in 2017 relate to the purchase of SIFCO business late in 2016, as described above. After adjusting for the effects of currency and acquisitions, sales in our Commercial Vehicle segment increased 7% in 2017. The volume-related increase was primarily attributable to higher production levels in North America, where Class 8 production was up 12% and Classes 5-7 production was up 6%. Also contributing to the higher sales volume were production increases of 28% in South America and 5% in Europe. Partially offsetting the increased production levels was the transfer of a program having sales of about $50 to the Light Vehicle segment which began supplying the axle for the program in mid-2016.
Commercial Vehicle segment EBITDA increased by $20 in 2017. Although sales benefited from currency translation, segment EBITDA was negatively impacted by currency transaction losses. Higher sales volumes increased 2017 earnings by $20. The performance-related improvement in segment EBITDA resulted primarily from pricing and material recovery actions which provided a benefit of $12, a reduction in warranty expense of $8 and material cost savings actions of $12, more than offsetting increases in material commodity costs of $14 and in incentive compensation and other costs of $12.
Off-Highway
|
Sales
|
Segment
EBITDA |
Segment
EBITDA Margin |
|||||||||
|
2016
|
$
|
909
|
|
$
|
129
|
|
14.2
|
%
|
|||
|
Volume and mix
|
202
|
|
41
|
|
|||||||
|
Acquisition
|
401
|
|
40
|
|
|||||||
|
Performance
|
(10
|
)
|
(1
|
)
|
|||||||
|
Currency effects
|
19
|
|
3
|
|
|||||||
|
2017
|
$
|
1,521
|
|
$
|
212
|
|
13.9
|
%
|
|||
The operations of the BFP and BPT businesses acquired on February 1, 2017 added $401 to this segment's sales in 2017. Currency effects provided higher sales of $19, principally due to a stronger euro compared to 2016. After adjusting for these two items, sales in 2017 were higher by 21%, reflecting significantly higher global end-market demand.
Off-Highway 2017 segment EBITDA increased by $83, with the BFP and BPT operations contributing $40 and higher sales volumes providing an increase of $41. Year-over-year performance-related earnings in 2017 were reduced by increased engineering and development expenses of $14, lower pricing, net of material recovery, of $10, and higher commodity costs of $6. Substantially offsetting these reductions to earnings were material cost savings of $13 and improved earnings from restructuring and other cost savings actions..
Power Technologies
|
Sales
|
Segment
EBITDA |
Segment
EBITDA Margin |
|||||||||
|
2016
|
$
|
1,056
|
|
$
|
158
|
|
15.0
|
%
|
|||
|
Volume and mix
|
83
|
|
26
|
|
|||||||
|
Divestiture
|
(41
|
)
|
(5
|
)
|
|||||||
|
Performance
|
(5
|
)
|
(12
|
)
|
|||||||
|
Currency effects
|
11
|
|
1
|
|
|||||||
|
2017
|
$
|
1,104
|
|
$
|
168
|
|
15.2
|
%
|
|||
Power Technologies primarily serves the light vehicle market but also sells product to the medium/heavy truck and off-highway markets. Net of currency effects and the reduction in sales resulting from the Nippon Reinz divestiture in the fourth quarter of 2016, sales in 2017 increased 7%, primarily due to overall stronger market demand and new customer programs.
Segment EBITDA increased by $10 in 2017, with higher sales volumes providing an earnings benefit of $26 and the divestiture of Nippon Reinz reducing earnings by $5. A reduction of $12 in year-over-year third performance-related earnings was driven by higher commodity costs of $13, customer pricing reductions of $5 and other net cost increases of $4. Partially offsetting these reductions to earnings was savings from material cost reduction initiatives of $10.
28
Summary Consolidated Results of Operations (
2016
versus
2015
)
|
2016
|
2015
|
||||||||||||||||
|
Dollars
|
% of
Net Sales |
Dollars
|
% of
Net Sales |
Increase/
(Decrease) |
|||||||||||||
|
Net sales
|
$
|
5,826
|
|
|
$
|
6,060
|
|
|
$
|
(234
|
)
|
||||||
|
Cost of sales
|
4,982
|
|
85.5
|
%
|
5,211
|
|
86.0
|
%
|
(229
|
)
|
|||||||
|
Gross margin
|
844
|
|
14.5
|
%
|
849
|
|
14.0
|
%
|
(5
|
)
|
|||||||
|
Selling, general and administrative expenses
|
406
|
|
7.0
|
%
|
391
|
|
6.5
|
%
|
15
|
|
|||||||
|
Amortization of intangibles
|
8
|
|
14
|
|
(6
|
)
|
|||||||||||
|
Restructuring charges, net
|
36
|
|
15
|
|
21
|
|
|||||||||||
|
Loss on sale of subsidiaries
|
(80
|
)
|
|
|
(80
|
)
|
|||||||||||
|
Impairment of long-lived assets
|
|
|
(36
|
)
|
36
|
|
|||||||||||
|
Other income, net
|
18
|
|
1
|
|
17
|
|
|||||||||||
|
Earnings before interest and income taxes
|
332
|
|
394
|
|
(62
|
)
|
|||||||||||
|
Loss on extinguishment of debt
|
(17
|
)
|
(2
|
)
|
(15
|
)
|
|||||||||||
|
Interest income
|
13
|
|
13
|
|
—
|
|
|||||||||||
|
Interest expense
|
113
|
|
113
|
|
—
|
|
|||||||||||
|
Earnings from continuing operations before
income taxes |
215
|
|
292
|
|
(77
|
)
|
|||||||||||
|
Income tax expense (benefit)
|
(424
|
)
|
82
|
|
(506
|
)
|
|||||||||||
|
Equity in earnings (losses) of affiliates
|
14
|
|
(34
|
)
|
48
|
|
|||||||||||
|
Income from continuing operations
|
653
|
|
176
|
|
477
|
|
|||||||||||
|
Income from discontinued operations
|
|
|
4
|
|
(4
|
)
|
|||||||||||
|
Net income
|
653
|
|
180
|
|
473
|
|
|||||||||||
|
Less: Noncontrolling interests net income
|
13
|
|
21
|
|
(8
|
)
|
|||||||||||
|
Net income attributable to the parent company
|
$
|
640
|
|
$
|
159
|
|
$
|
481
|
|
||||||||
Sales
— The following table shows changes in our sales by geographic region.
|
Amount of Change Due To
|
|||||||||||||||||||||||
|
2016
|
2015
|
Increase/
(Decrease) |
Currency
Effects |
Acquisitions
(Divestitures) |
Organic
Change |
||||||||||||||||||
|
North America
|
$
|
3,128
|
|
$
|
3,210
|
|
$
|
(82
|
)
|
$
|
(24
|
)
|
$
|
7
|
|
$
|
(65
|
)
|
|||||
|
Europe
|
1,616
|
|
1,723
|
|
(107
|
)
|
(44
|
)
|
|
(63
|
)
|
||||||||||||
|
South America
|
338
|
|
377
|
|
(39
|
)
|
(82
|
)
|
|
43
|
|
||||||||||||
|
Asia Pacific
|
744
|
|
750
|
|
(6
|
)
|
(23
|
)
|
(3
|
)
|
20
|
|
|||||||||||
|
Total
|
$
|
5,826
|
|
$
|
6,060
|
|
$
|
(234
|
)
|
$
|
(173
|
)
|
$
|
4
|
|
$
|
(65
|
)
|
|||||
Sales in 2016 were $234 lower than in 2015. Weaker international currencies decreased sales by $173. The acquisition of Magnum earlier this year added sales of $7, with the divestiture of Nippon Reinz at the end of November 2016 reducing sales by $3. A volume-related organic sales decrease of $75 resulted primarily from weaker global Off-Highway demand, lower commercial vehicle production in North America and Brazil and lower sales with a major North America commercial vehicle customer, partially offset by stronger overall light vehicle volume levels in North America, Europe and Asia Pacific and contributions from new customer programs. Cost recovery pricing actions increased sales by $10.
The North America organic sales reduction of 2% was driven principally by a decline in Class 8 production of about 30%, reduced sales levels with a major commercial vehicle customer and weaker Off-Highway demand. These effects were partially offset by growth in full frame light truck production of around 7%, an increase in light vehicle engine build of 4% and higher sales from new customer programs.
Excluding currency effects, principally from a weaker South African rand and British pound, our 2016 sales in Europe were 4% lower than in 2015. Weaker Off-Highway demand was the primary driver of this reduction in sales, with increased light vehicle engine and light truck production providing a partial offset.
29
South America sales in 2016 were impacted by weaker currencies in Argentina and Brazil. Excluding these effects, sales were up 11% from 2015. The organic sales increase in the region was driven largely by pricing actions, primarily recovery of inflationary cost increases in Argentina and contributions from new customer programs. These increases were partially offset by medium/heavy truck production levels being around 20% lower.
Asia Pacific sales in 2016 were relatively comparable to those in the preceding year. Weaker currencies in Thailand, India and China contributed to the currency-related sales reduction. The 3% organic sales increase resulted primarily from increased production levels in the region along with new customer programs.
Cost of sales and gross margin
— Cost of sales declined $229, or 4%, in 2016 when compared to 2015. Similar to the factors affecting sales, the reduction was primarily due to currency effects and lower overall sales volumes. Cost of sales as a percent of 2016 sales was 50 basis points lower than in the previous year. Underabsorption of costs as a result of lower sales volumes increased cost of sales as a percent of sales. Cost of sales in 2016 was also higher due to increases in engineering and product development costs of $13 and material commodity prices of $8 and incremental start-up/launch costs of $8. More than offsetting the margin impact of these increases were savings from lower material costs of $67 and avoidance of supplier transition costs in our Commercial Vehicle segment of $14 in 2015, and a decline in environmental remediation expense of $6.
Gross margin of $844 for 2016 decreased $5 from 2015. Gross margin as a percent of sales was 14.5% in 2016, 50 basis points higher than in 2015. Margin improvement was driven principally by the cost of sales factors referenced above.
Selling, general and administrative expenses (SG&A)
— SG&A expenses in 2016 were $406 (7.0% of sales) as compared to $391 (6.5% of sales) in 2015. Salary and benefits expenses in 2016 were $9 higher than in 2015, while selling and other discretionary spending increased $6, due in part to execution of certain strategic project initiatives.
Amortization of intangibles
— The reduction of $6 in amortization of intangibles was primarily attributable to certain customer related intangibles becoming fully amortized.
Restructuring charges, net
— Restructuring charges of $36 in 2016 included a fourth-quarter expense of $10 in conjunction with the SIFCO acquisition, as described above, to eliminate certain positions in our Brazil Commercial Vehicle business to align with expected market demand. Third-quarter 2016 expense included $14 for separation costs in connection with headcount reduction actions in our Off-Highway segment that were approved as a result of continuing weak demand levels in this business at that time. The remaining $12 of restructuring expense in 2016 relates to the closure of our Commercial Vehicle manufacturing facility in Glasgow, Kentucky, headcount reduction actions at our corporate facilities in the U.S., other headcount reductions in Brazil and employee separation and exit costs associated with previously announced headcount reduction and facility closure actions. Restructuring charges of $15 in 2015 were primarily attributable to headcount reductions in our Commercial Vehicle business in Brazil which were significantly impacted by lower demand levels, along with costs associated with previously announced restructuring actions.
Loss on sale of subsidiaries
— Reference is made to Note 3 of the consolidated financial statements in Item 8 for a discussion of the fourth-quarter 2016 divestitures of DCLLC and Nippon Reinz.
Impairment of long-lived assets
— Reference is made to
Note 3
of the consolidated financial statements in Item 8 for discussion of charges recognized in connection with an impairment of long-lived assets attributable to an exclusive supply relationship with a South American supplier.
Other income, net
— The following table shows the major components of other income, net.
|
2016
|
2015
|
||||||
|
Government grants and incentives
|
$
|
8
|
|
$
|
3
|
|
|
|
Foreign exchange loss
|
(3
|
)
|
(20
|
)
|
|||
|
Gain on derecognition of noncontrolling interest
|
|
|
5
|
|
|||
|
Strategic transaction expenses
|
(13
|
)
|
(4
|
)
|
|||
|
Insurance and other recoveries
|
10
|
|
4
|
|
|||
|
Gain on sale of marketable securities
|
7
|
|
1
|
|
|||
|
Amounts attributable to previously divested/closed operations
|
|
|
1
|
|
|||
|
Other, net
|
9
|
|
11
|
|
|||
|
Other income (expense), net
|
$
|
18
|
|
$
|
1
|
|
|
30
During 2015, foreign exchange losses were primarily driven by the impact the strengthening U.S. dollar had on our Mexican peso and euro forward contracts. Upon completion of the divestiture of our operations in Venezuela in January 2015, we recognized a $5 gain on the derecognition of the noncontrolling interest in one of our former Venezuelan subsidiaries. See Note 3 to our consolidated financial statements in Item 8 of Part II for additional information. The increase in strategic transaction expenses in 2016 is primarily attributable to an increased level of inorganic growth opportunities that were being pursued, including the SIFCO acquisition that closed in December 2016 and the BFP and BPT acquisitions that closed in February 2017. Additionally, we incurred transactional costs in connection with the divestitures of DCLLC and Nippon Reinz. See Notes 2 and 3 for additional information. During 2016, we received a recovery of $8 of costs previously incurred on behalf of other participants in a consortium that existed to administer certain legacy personal injury claims. During 2015, we reached a settlement with an insurance carrier for the recovery of previously incurred legal costs.
Loss on extinguishment of debt
—
During the second quarter of 2016, we redeemed our February 2021 Notes and incurred a redemption premium of $12. We also restructured our domestic revolving credit facility. In connection with these actions, we wrote off $5 of previously deferred financing costs. The prior year expense was attributable to the call premium and write-off of previously deferred financing costs associated with the redemption of $15 of our February 2019 Notes in the first quarter of 2015.
Interest income and interest expense
— Interest income was $13 in both 2016 and 2015. Interest expense was $113 in both 2016 and 2015. A lower average interest rate on borrowings was offset by higher average debt levels in 2016. As discussed in Note 14 to our consolidated financial statements in Item 8 of Part II, Dana Financing Luxembourg S.à r.l. issued $375 of its June 2026 Notes on May 27, 2016 and we redeemed $350 of our February 2021 Notes on June 23, 2016. In conjunction with the issuance of the June 2026 Notes, we entered into two 10-year fixed-to-fixed cross-currency swaps which have the effect of economically converting the June 2026 Notes to euro-denominated debt at a fixed rate of 5.140%. Average effective interest rates, inclusive of amortization of debt issuance costs, approximated 6.5% and 6.6% in 2016 and 2015.
Income tax expense (benefit)
— Income taxes were a benefit of $424 in 2016, whereas we had a tax expense of $82 in 2015. In the fourth quarter of 2016, we determined that most of the valuation allowances against U.S. deferred taxes were no longer required. Release of these valuation allowances resulted in a $501 income tax benefit. Additionally, developments in Brazil led to our determination that an allowance against certain deferred taxes in that country was appropriate, and we recognized tax expense of $25 to establish this valuation allowance. During 2015, we completed an intercompany transfer of an affiliate's stock and certain operating assets. In connection with this transaction, we released $66 of valuation allowance on U.S. deferred tax assets and recognized $23 of tax expense related to the stock sale and $2 of amortization of a prepaid tax asset created as part of the transaction. Amortization of the prepaid tax asset in 2016 was $11. In 2015, we also established a valuation allowance of $15 against the deferred tax assets of a subsidiary in Brazil. See Note 18 to our consolidated financial statements in Item 8 of Part II for further disclosures around these valuation allowance adjustments.
The effective income tax rates vary from the U.S. federal statutory rate of 35% primarily due to valuation allowances in several countries, nondeductible expenses, different statutory rates outside the U.S. and withholding taxes. Contributing to the lower effective rate in 2016 were benefits of $58 for a reduction of accrued taxes on earnings of foreign operations resulting from legal entity restructuring and a revised determination as to permanent reinvestment. Partially offsetting this benefit was tax expense of $17 on dividends and other income attributable to foreign operations, and $30 of expense recognized to establish provisions associated with uncertain tax positions. Excluding the effects of the items described above, the effective tax rate was 24% in 2016 and 37% in 2015. In 2016, jurisdictions with effective tax rates less than the U.S. tax rate of 35% decreased the overall effective rate. In 2015, jurisdictions with valuation allowances had lower pre-tax income, which increased the effective rate.
In the U.S. and certain other countries, where our history of operating losses did not allow us to satisfy the “more likely than not” criterion for recognition of deferred tax assets, we have generally recognized no income tax on the pre-tax income or losses in these jurisdictions as valuation allowance adjustments offset the associated tax effects. With the release of valuation allowances on our U.S. deferred tax assets in 2016, the future impact of valuation allowance adjustments will be less significant, resulting in tax expense that will be more reflective of a customary global effective tax rate.
Equity in earnings (losses) of affiliates
— Net earnings from equity investments was $14 in 2016 and a net loss of $34 in 2015. Equity in earnings from Bendix Spicer Foundation Brake, LLC (BSFB) were $7 in 2016 and $11 in 2015. Our share of Dongfeng Dana Axle Co., Ltd. (DDAC) operating results were $7 in 2016 and a loss of $7 in 2015. During the fourth quarter of 2015, we determined that we had an other-than-temporary decrease in the carrying value of our DDAC investment and recorded a $39 impairment charge. See Note 21 to our consolidated financial statements in Item 8.
31
Income from discontinued operations
— Income (loss) from discontinued operations activity relates to our Structural Products business. See
Note 3
to our consolidated financial statements in Item 8.
Noncontrolling interests net income
—
As more fully discussed in Note 1 to our consolidated financial statements in Item 8, the first quarter of 2015 included $9 for correction of previously reported noncontrolling interests net income.
Segment Results of Operations (
2016
versus
2015
)
Light Vehicle
|
Sales
|
Segment
EBITDA
|
Segment
EBITDA
Margin
|
||||||||
|
2015
|
$
|
2,482
|
|
$
|
262
|
|
10.6
|
%
|
||
|
Volume and mix
|
235
|
|
37
|
|
||||||
|
Performance
|
31
|
|
(4
|
)
|
||||||
|
Currency effects
|
(141
|
)
|
(16
|
)
|
||||||
|
2016
|
$
|
2,607
|
|
$
|
279
|
|
10.7
|
%
|
||
Light Vehicle sales in 2016 were reduced by currency translation effects, primarily as a result of a weaker Mexico peso, Argentina peso, Thailand baht, South Africa rand and British pound sterling. Sales, exclusive of currency effects, were 11% higher than in 2015. The volume-related increases were driven primarily by stronger production levels. North America full frame light truck production in 2016 was up 7%, while light truck production in Europe and Asia Pacific was stronger by 9% and 12% compared to 2015. Sales in this segment also benefited from new customer programs, including $45 relating to a program previously supported by our Commercial Vehicle segment that moved to Light Vehicle in 2016 when the axle used to support the program was replaced with an axle produced by the Light Vehicle segment. Cost recovery actions, including inflationary cost recovery in Argentina, were the primary drivers of the sales increase categorized as performance.
Light Vehicle segment EBITDA of $279 in 2016 was $17 higher than in the same period of 2015. Higher sales volumes from overall stronger production levels and new business provided a benefit of $37, while weaker international currencies reduced segment EBITDA by $16. The year-over-year performance-related earnings reduction was driven partly by an increase in material commodity costs of $16, higher warranty costs of $7, start-up and launch-related costs of $10, an increase in engineering and product development expense, net of customer recoveries, of $9 and inflationary and other cost increases of $17. Partially offsetting these factors which reduced segment EBITDA were cost recovery pricing actions of $31 and savings from material cost initiatives of $24.
Commercial Vehicle
|
Sales
|
Segment
EBITDA
|
Segment
EBITDA
Margin
|
||||||||
|
2015
|
$
|
1,533
|
|
$
|
100
|
|
6.5
|
%
|
||
|
Volume and mix
|
(265
|
)
|
(52
|
)
|
||||||
|
Performance
|
3
|
|
52
|
|
||||||
|
Currency effects
|
(17
|
)
|
(4
|
)
|
||||||
|
2016
|
$
|
1,254
|
|
$
|
96
|
|
7.7
|
%
|
||
Currency effects which reduced sales in 2016 were primarily due to a year-over-year weaker Brazil real and Mexico peso. After adjusting for the effects of currency, 2016 sales in our Commercial Vehicle segment decreased 17% compared to 2015. The volume-related reduction was primarily attributable to lower sales in North America where Class 8 production was down about 30%, a program having sales of $45 was transfered to the Light Vehicle segment who began supplying the axle for the program, and our share of sales with a major customer declined. Weaker end market demand in Brazil also contributed to lower sales volumes, with 2016 medium/heavy truck production being down about 20%.
Commercial Vehicle segment EBITDA of $96 was $4 lower than in 2015. Lower sales volumes reduced 2016 segment EBITDA by $52. Largely offsetting the effects of lower volume was improved year-over-year performance-related segment EBITDA of $52, resulting from material cost savings of $15, avoidance of supplier transition costs of $14 incurred in 2015, a decline in warranty expense of $8, pricing actions of $3 and other net cost reductions of $12.
32
Off-Highway
|
Sales
|
Segment
EBITDA
|
Segment
EBITDA
Margin
|
||||||||
|
2015
|
$
|
1,040
|
|
$
|
147
|
|
14.1
|
%
|
||
|
Volume and mix
|
(110
|
)
|
(31
|
)
|
||||||
|
Performance
|
(11
|
)
|
11
|
|
||||||
|
Currency effects
|
(10
|
)
|
2
|
|
||||||
|
2016
|
$
|
909
|
|
$
|
129
|
|
14.2
|
%
|
||
Currency-adjusted 2016 sales were down 12% compared to 2015, primarily from lower global end-market demand.
Off-Highway segment EBITDA of $129 in 2016 was down $18 from 2015. The impact of lower sales volumes on segment EBITDA was partially offset by performance-related earnings improvement, principally from year-over-year material cost savings of $17 and other net cost reductions of $5 which were partially offset by pricing actions of $11.
Power Technologies
|
Sales
|
Segment
EBITDA
|
Segment
EBITDA
Margin
|
||||||||
|
2015
|
$
|
1,005
|
|
$
|
149
|
|
14.8
|
%
|
||
|
Volume and mix
|
69
|
|
17
|
|
||||||
|
Performance
|
(13
|
)
|
(6
|
)
|
||||||
|
Currency effects
|
(5
|
)
|
(2
|
)
|
||||||
|
2016
|
$
|
1,056
|
|
$
|
158
|
|
15.0
|
%
|
||
Power Technologies primarily serves the light vehicle market but also sells product to the medium/heavy truck and off-highway markets. Net of currency effects, sales in 2016 increased about 5% due to stronger market demand. Light vehicle engine build in North America and Europe was up about 4% and 3% compared to 2015. Pricing actions during 2016 reduced year-over-year sales by $13.
Segment EBITDA of $158 in 2016 was $9 higher than in 2015, driven primarily by higher sales volumes. Although performance-related segment EBITDA in 2016 benefited by $17 from lower material commodity costs and other material cost savings, those benefits were more than offset by $13 of pricing actions, higher engineering and development expense of $4 and other net cost increases of $6.
Non-GAAP Financial Measures
Adjusted EBITDA
We have defined adjusted EBITDA as net income before interest, taxes, depreciation, amortization, equity grant expense, restructuring expense and other adjustments not related to our core operations (gain/loss on debt extinguishment, pension settlements, divestitures, impairment, etc.). Adjusted EBITDA is a measure of our ability to maintain and continue to invest in our operations and provide shareholder returns. We use adjusted EBITDA in assessing the effectiveness of our business strategies, evaluating and pricing potential acquisitions and as a factor in making incentive compensation decisions. In addition to its use by management, we also believe adjusted EBITDA is a measure widely used by securities analysts, investors and others to evaluate financial performance of our company relative to other Tier 1 automotive suppliers. Adjusted EBITDA should not be considered a substitute for earnings before income taxes, net income or other results reported in accordance with GAAP. Adjusted EBITDA may not be comparable to similarly titled measures reported by other companies.
The following table provides a reconciliation of net income to adjusted EBITDA.
33
|
2017
|
2016
|
2015
|
|||||||||
|
Net income
|
$
|
116
|
|
$
|
653
|
|
$
|
180
|
|
||
|
Income from discontinued operations
|
|
|
4
|
|
|||||||
|
Income from continuing operations
|
116
|
|
653
|
|
176
|
|
|||||
|
Equity in earnings (losses) of affiliates
|
19
|
|
14
|
|
(34
|
)
|
|||||
|
Income tax expense (benefit)
|
283
|
|
(424
|
)
|
82
|
|
|||||
|
Earnings from continuing operations before income taxes
|
380
|
|
215
|
|
292
|
|
|||||
|
Depreciation and amortization
|
233
|
|
182
|
|
174
|
|
|||||
|
Restructuring charges, net
|
14
|
|
36
|
|
15
|
|
|||||
|
Interest expense, net
|
91
|
|
100
|
|
100
|
|
|||||
|
Other*
|
117
|
|
127
|
|
71
|
|
|||||
|
Adjusted EBITDA
|
$
|
835
|
|
$
|
660
|
|
$
|
652
|
|
||
|
*
|
Other includes stock compensation expense, strategic transaction expenses, gain on derecognition of noncontrolling interest, distressed supplier costs, amounts attributable to previously divested/closed operations, acquisition related inventory adjustments, loss on extinguishment of debt, loss on sale of subsidiaries and other items. See
Note 20
to our consolidated financial statements in Item 8 for additional details.
|
Free Cash Flow
We have defined free cash flow as cash provided by operating activities less purchases of property, plant and equipment. We believe this measure is useful to investors in evaluating the operational cash flow of the company inclusive of the spending required to maintain the operations. Free cash flow is neither intended to represent nor be an alternative to the measure of net cash provided by operating activities reported under GAAP. Free cash flow may not be comparable to similarly titled measures reported by other companies.
The following table reconciles net cash flows provided by operating activities to free cash flow.
|
|
2017
|
2016
|
2015
|
||||||||
|
Net cash provided by operating activities
|
$
|
554
|
|
$
|
384
|
|
$
|
406
|
|
||
|
Purchases of property, plant and equipment
|
(393
|
)
|
(322
|
)
|
(260
|
)
|
|||||
|
Free cash flow
|
$
|
161
|
|
$
|
62
|
|
$
|
146
|
|
||
Liquidity
The following table provides a reconciliation of cash and cash equivalents to liquidity, a non-GAAP measure, at
December 31, 2017
:
|
Cash and cash equivalents
|
$
|
603
|
|
|
Less: Deposits supporting obligations
|
(7
|
)
|
|
|
Available cash
|
596
|
|
|
|
Additional cash availability from Revolving Facility
|
578
|
|
|
|
Marketable securities
|
40
|
|
|
|
Total liquidity
|
$
|
1,214
|
|
Cash deposits are maintained to provide credit enhancement for certain agreements and are reported as part of cash and cash equivalents. For most of these deposits, the cash may be withdrawn if a comparable security is provided in the form of letters of credit. Accordingly, these deposits are not considered to be restricted.
Marketable securities are included as a component of liquidity as these investments can be readily liquidated at our discretion.
34
The components of our
December 31, 2017
consolidated cash balance were as follows:
|
U.S.
|
Non-U.S.
|
Total
|
|||||||||
|
Cash and cash equivalents
|
$
|
85
|
|
$
|
323
|
|
$
|
408
|
|
||
|
Cash and cash equivalents held as deposits
|
|
7
|
|
7
|
|
||||||
|
Cash and cash equivalents held at less than wholly-owned subsidiaries
|
6
|
|
182
|
|
188
|
|
|||||
|
Consolidated cash balance
|
$
|
91
|
|
$
|
512
|
|
$
|
603
|
|
||
A portion of the non-U.S. cash and cash equivalents is utilized for working capital and other operating purposes. Several countries have local regulatory requirements that significantly restrict the ability of our operations to repatriate this cash. Beyond these restrictions, there are practical limitations on repatriation of cash from certain subsidiaries because of the resulting tax withholdings and subsidiary by-law restrictions which could limit our ability to access cash and other assets.
The principal sources of liquidity available for our future cash requirements are expected to be (i) cash flows from operations, (ii) cash and cash equivalents on hand and (iii) borrowings from our Revolving Facility. We believe that our overall liquidity and operating cash flow will be sufficient to meet our anticipated cash requirements for capital expenditures, working capital, debt obligations, common stock repurchases and other commitments during the next twelve months. While uncertainty surrounding the current economic environment could adversely impact our business, based on our current financial position, we believe it is unlikely that any such effects would preclude us from maintaining sufficient liquidity.
In April 2017, Dana Financing Luxembourg S.à r.l. completed the issuance of $400 of its April 2025 Notes. Net proceeds of the offering totaled $394. The proceeds from the offering were used to repay indebtedness of our BPT and BFP subsidiaries, repay indebtedness of a wholly-owned subsidiary in Brazil, redeem $100 of our September 2021 Notes and for general corporate purposes. The September 2021 Notes were redeemed on April 4, 2017 at a price equal to 104.031% plus accrued and unpaid interest.
On August 17, 2017, we entered into an amended credit and guaranty agreement comprised of a $275 term facility (the Term Facility) and a $600 revolving credit facility (the Revolving Facility) both of which mature on August 17, 2022. On September 14, 2017, we drew the entire amount available under the Term Facility. Net proceeds from the Term Facility draw totaled $274. The proceeds from the Term Facility, together with cash on hand, were used to redeem the remaining $350 of our September 2021 Notes at a price equal to 102.688% plus accrued and unpaid interest.
At December 31, 2017, we had no outstanding borrowings under the Revolving Facility but we had utilized $22 for letters of credit. We had availability at December 31, 2017 under the Revolving Facility of $578 after deducting the outstanding letters of credit.
At December 31, 2017, we were in compliance with the covenants of our financing agreements. Under the Revolving Facility and our senior notes, we are required to comply with certain incurrence-based covenants customary for facilities of these types. The incurrence-based covenants in the Revolving Facility permit us to, among other things, (i) issue foreign subsidiary indebtedness, (ii) incur general secured indebtedness subject to a pro forma first lien net leverage ratio not to exceed 1.50:1.00 in the case of first lien debt and a pro forma secured net leverage ratio of 2.50:1.00 in the case of other secured debt and (iii) incur additional unsecured debt subject to a pro forma total net leverage ratio not to exceed 3.50:1.00. We may also make dividend payments in respect of our common stock as well as certain investments and acquisitions subject to a pro forma total net leverage ratio of 2.75:1.00. In addition, the Revolving Facility is subject to a financial covenant requiring us to maintain a first lien net leverage ratio not to exceed 2.00:1.00. The indentures governing the senior notes include other incurrence-based covenants that may subject us to additional specified limitations.
In December 2017, our Board of Directors approved a new $100 common stock share repurchase program, which expires on December 31, 2019. We plan to repurchase shares utilizing available excess cash either in the open market or through privately negotiated transactions. The stock repurchases are subject to prevailing market conditions, available growth opportunities and other considerations.
From time to time, depending upon market, pricing and other conditions, as well as our cash balances and liquidity, we may seek to acquire our senior notes or other indebtedness or our common stock through open market purchases, privately negotiated transactions, tender offers, exchange offers or otherwise, upon such terms and at such prices as we may determine (or as may be provided for in the indentures governing the notes), for cash, securities or other consideration. There can be no assurance that we will pursue any such transactions in the future, as the pursuit of any alternative will depend upon numerous factors such as market conditions, our financial performance and the limitations applicable to such transactions under our
35
financing and governance documents.
Cash Flow
|
2017
|
2016
|
2015
|
|||||||||
|
Cash used for changes in working capital
|
$
|
(8
|
)
|
$
|
(51
|
)
|
$
|
(41
|
)
|
||
|
Other cash provided by operations
|
562
|
|
435
|
|
447
|
|
|||||
|
Net cash provided by operating activities
|
554
|
|
384
|
|
406
|
|
|||||
|
Net cash used in investing activities
|
(581
|
)
|
(365
|
)
|
(258
|
)
|
|||||
|
Net cash used in financing activities
|
(120
|
)
|
(88
|
)
|
(403
|
)
|
|||||
|
Net decrease in cash and cash equivalents
|
$
|
(147
|
)
|
$
|
(69
|
)
|
$
|
(255
|
)
|
||
The table above summarizes our consolidated statement of cash flows.
Operating activities
— Exclusive of working capital, other cash provided by operations was $562 during 2017 compared to $435 during 2016 and $447 during 2015. The increase in 2017 is principally due to an increased level of operating earnings in 2017. Partially offsetting the higher operating earnings was an increased cash use of $20 for acquisition-related costs, including costs incurred to complete the transactions and post-acquisition related integration costs. The decrease during 2016 was primarily attributable to a year-over-year increase in cash paid for interest of $15 and cash paid on the settlement of foreign currency forward contracts and swaps of $7, partially offset by higher operating earnings.
Working capital used cash of $8 in 2017, $51 in 2016 and $41 in 2015. Cash of $141 was used to finance increased receivables in 2017, with cash of $86 having been required in 2016 and receivables remaining unchanged in 2015. Higher inventories consumed cash of $146 in 2017, $13 in 2016 and $28 in 2015. Increases in accounts payable and other net liabilities provided cash of $279 in 2017 and $48 in 2016 while decreases in accounts payable and other net liabilities used cash of $13 in 2015. The higher level of cash used to finance increased receivables and inventory, and the partial offset resulting from higher levels of accounts payable and other liabilities, in 2017 is due primarily to the stronger volume levels experienced this past year. Exclusive of acquisitions, sales increased 15% in 2017, predominantly on the strength of stronger market demand and new customer programs. In addition to higher volume levels, the cash generated in 2017 from increased levels of accounts payable and other liabilities was also reflective of changes in payment practices and lengthening of payment terms with suppliers. The continued focus on receivable collections and inventory management combined with extending supplier terms and modifying payment practices, enabled us to use less cash overall for working capital in 2017 than 2016 despite the higher sales levels. The use of cash in 2016 for receivables reflected increased sales levels in November and December compared to 2015. Except for this increase in receivables in 2016, there were no significant uses or sources of cash from working capital components in 2016 and 2015 as organic sales levels were relatively comparable with the preceding years.
Investing activities
— Expenditures for property plant and equipment were $393, $322, and $260 in 2017, 2016 and 2015. The higher level of capital spending the past two years has resulted from our increased new business sales backlog, reflecting our success with being awarded new customer programs. Additionally, two of our largest customer programs requiring new investment launched within the past two years. During 2017, we paid $106, net of cash acquired, to purchase an 80% ownership interest in BFP and BPT, and we used cash of $78 to acquire the USM – Warren business. During 2016, we paid $18 to acquire the aftermarket distribution business of Magnum and $60 to acquire the strategic assets of SIFCO's commercial vehicle steer axle systems and related forged components businesses. In 2016, we received net proceeds of $5 and $29 related to the sale of our Nippon Reinz and DCLLC subsidiaries. During all three years, purchases of marketable securities were largely funded by proceeds from sales and maturities of marketable securities.
Financing activities
— During 2017, our European subsidiary, Dana Financing Luxembourg S.à r.l., completed the issuance of $400 of its April 2025 Notes and paid financing costs of $6 related to the notes. We paid financing costs of $3 related to our Term Facility and Revolving Facility and drew the entire $275 available under the Term Facility. We redeemed all $450 of our September 2021 Notes at a $14 premium, repaid indebtedness of a wholly-owned subsidiary in Brazil at a premium of $1 and repaid indebtedness of our BPT and BFP subsidiaries. In 2016, Dana Financing Luxembourg S.à r.l. completed the issuance of $375 of its June 2026 Notes and paid financing costs of $7 related to the notes. We paid financing costs of $3 to enter our Revolving Facility and a premium of $12 to redeem all of our February 2021 Notes. Also during 2016, we made scheduled repayments of $32 and took out $66 of additional long-term debt at international locations. During 2015, we redeemed $55 of our February 2019 Notes at a $2 premium. We used cash of $81 and $311 to repurchase common shares under our share repurchase program in 2016 and 2015. We used $35, $35 and $37 for dividend payments to common stockholders in 2017, 2016 and 2015. Distributions to noncontrolling interests totaled $12, $17 and $9 in 2017, 2016 and 2015.
36
Off-Balance Sheet Arrangements
In connection with the divestiture of our Structural Products business in 2010, leases covering three U.S. facilities were assigned to a U.S. affiliate of the new owner, Metalsa S.A. de C.V. (Metalsa). Under the terms of the sale agreement, we guarantee the affiliate’s performance under the leases, which run through June 2025, including approximately $6 of annual payments. In the event of a required payment by Dana as guarantor, we are entitled to pursue full recovery from Metalsa of the amounts paid under the guarantee and to take possession of the leased property.
Contractual Obligations
We are obligated to make future cash payments in fixed amounts under various agreements. The following table summarizes our significant contractual obligations as of
December 31, 2017
.
|
|
|
Payments Due by Period
|
||||||||||||||||||
|
Contractual Cash Obligations
|
Total
|
2018
|
2019 - 2020
|
2021 - 2022
|
After 2022
|
|||||||||||||||
|
Long-term debt
(1)
|
$
|
1,785
|
|
$
|
12
|
|
$
|
38
|
|
$
|
234
|
|
$
|
1,501
|
|
|||||
|
Interest payments
(2)
|
689
|
|
98
|
|
194
|
|
190
|
|
207
|
|
||||||||||
|
Leases
(3)
|
306
|
|
53
|
|
93
|
|
70
|
|
90
|
|
||||||||||
|
Unconditional purchase obligations
(4)
|
176
|
|
174
|
|
1
|
|
1
|
|
—
|
|
||||||||||
|
Pension contribution
(5)
|
16
|
|
16
|
|
|
|
|
|
|
|
||||||||||
|
Retiree health care benefits
(6)
|
99
|
|
5
|
|
10
|
|
10
|
|
74
|
|
||||||||||
|
Uncertain income tax positions
(7)
|
|
|
|
|
|
|
|
|
|
|
||||||||||
|
Total contractual cash obligations
|
$
|
3,071
|
|
$
|
358
|
|
$
|
336
|
|
$
|
505
|
|
$
|
1,872
|
|
|||||
______________________________________________________
Notes:
|
(1)
|
Principal payments on long-term debt and capital lease obligations in place at
December 31, 2017
.
|
|
(2)
|
Interest payments are based on long-term debt and capital leases in place at
December 31, 2017
and the interest rates applicable to such obligations.
|
|
(3)
|
Operating leases related to real estate, manufacturing and material handling equipment, vehicles and other assets.
|
|
(4)
|
Unconditional purchase obligations are comprised of commitments for the procurement of fixed assets, the purchase of raw materials and the fulfillment of other contractual obligations.
|
|
(5)
|
This amount represents estimated
2018
minimum required contributions to our global defined benefit pension plans. We have not estimated pension contributions beyond
2018
due to the significant impact that return on plan assets and changes in discount rates might have on such amounts.
|
|
(6)
|
This amount represents estimated payments under our non-U.S. retiree health care programs. Obligations under the non-U.S. retiree health care programs are not fixed commitments and will vary depending on various factors, including the level of participant utilization and inflation. Our estimates of the payments to be made in the future consider recent payment trends and certain of our actuarial assumptions.
|
|
(7)
|
We are not able to reasonably estimate the timing of payments related to uncertain tax positions because the timing of settlement is uncertain. The above table does not reflect unrecognized tax benefits at
December 31, 2017
of $117. See
Note 18
to our consolidated financial statements in Item 8 for additional discussion.
|
At
December 31, 2017
, we maintained cash balances of $
7
on deposit with financial institutions primarily to support property insurance policy deductibles, certain employee retirement obligations and specific government approved environmental remediation efforts.
Contingencies
For a summary of litigation and other contingencies, see
Note 16
to our consolidated financial statements in Item 8. Based on information available to us at the present time, we do not believe that any liabilities beyond the amounts already accrued that may result from these contingencies will have a material adverse effect on our liquidity, financial condition or results of operations.
Critical Accounting Estimates
The preparation of our consolidated financial statements in accordance with GAAP requires us to use estimates and make judgments and assumptions about future events that affect the reported amounts of assets, liabilities, revenue, expenses and the related disclosures. Considerable judgment is often involved in making these determinations. Critical estimates are those that
37
require the most difficult, subjective or complex judgments in the preparation of the financial statements and the accompanying notes. We evaluate these estimates and judgments on a regular basis. We believe our assumptions and estimates are reasonable and appropriate. However, the use of different assumptions could result in significantly different results and actual results could differ from those estimates. The following discussion of accounting estimates is intended to supplement the Summary of Significant Accounting Policies presented as
Note 1
to our consolidated financial statements in Item 8.
Income taxes
— Accounting for income taxes is complex, in part because we conduct business globally and therefore file income tax returns in numerous tax jurisdictions. Significant judgment is required in determining the income tax provision, uncertain tax positions, deferred tax assets and liabilities and the valuation allowances recorded against our net deferred tax assets. A valuation allowance is provided when, in our judgment based upon available information, it is more likely than not that a portion of such deferred tax assets will not be realized. To make this assessment, we consider the historical and projected future taxable income or loss by tax jurisdiction. We consider all components of comprehensive income and weight the positive and negative evidence, putting greater reliance on objectively verifiable historical evidence than on projections of future profitability that are dependent on actions that have not taken place as of the assessment date. We also consider changes to historical profitability of actions that occurred through the date of assessment and objectively verifiable effects of material forecasted events that would have a sustained effect on future profitability, as well as the effect on historical profits of nonrecurring events. We also incorporate the changes to historical and prospective income from tax planning strategies expected to be implemented.
Tax reform legislation in the U.S. was signed into law in December 2017 with enactment of the Tax Cuts and Jobs Act ("Act"). This legislation represents a fundamental and dramatic shift in U.S. taxation, with many provisions of the Act differing significantly from previous U.S. tax law. With enactment occurring late in 2017, companies with calendar reporting years have not had extensive time to analyze the impacts of the legislation. Applying the effects of a lower corporate tax rate to deferred tax assets and liabilities, evaluating the one-time transition tax on undistributed earnings of foreign operations, examining the implications of changes to net operating loss and other credit carryforwards and considering other provisions of the Act in a relatively compressed time frame necessitates significant estimation and judgment. Following the guidance of the U.S. Securities and Exchange Commission's Staff Accounting Bulletin No. 118, we have made reasonable estimates of the Act's provisions and have recorded a non-cash charge to fourth quarter tax expense of $186 to reflect these effects. This provisional estimate could be impacted based on further analysis of the Act's requirements. Given the Act's broad and complex changes, further clarification, interpretation and regulatory guidance could affect the assumptions we used in making our reasonable estimate. As we continue to assess the Act's provisions, any adjustments to our provisional estimate will be reported as a component of income tax expense in 2018 and disclosed in the period when any such adjustments have been determined.
Prior to 2016, we carried a valuation allowance against deferred tax assets in the U.S. While our U.S. operations have experienced improved profitability in recent years, our analysis of the income of the U.S. operations, as adjusted for changes in historical results due to developments through 2015, demonstrated historical losses as of December 31, 2015. Additionally, there were considerable uncertainties in the U.S. in certain of our end markets. Therefore, we had not achieved a level of sustained profitability that would, in our judgment, support a release of the valuation allowance prior to 2016. With our improved level of profitability and forecast, we determined in the fourth quarter of 2016 that a valuation allowance against U.S. deferred tax assets for federal tax purposes was no longer required, and we recognized a tax benefit of $501 for the release of valuation allowance. At December 31, 2016, we had retained a valuation allowance of $137 against deferred tax assets in the U.S. primarily related to state operating loss carryforwards and other credits which did not meet the more likely than not criterion for release of valuation allowance. Based on our 2017 financial performance and our financial outlook, we determined that a release of $27 in 2017 was appropriate.
In the ordinary course of business, there are many transactions and calculations where the ultimate tax determination is less than certain. We are regularly under audit by the various applicable tax authorities. Although the outcome of tax audits is always uncertain, we believe that we have appropriate support for the positions taken on our tax returns and that our annual tax provisions include amounts sufficient to pay assessments, if any, which may be proposed by the taxing authorities. Nonetheless, the amounts ultimately paid, if any, upon resolution of the issues raised by the taxing authorities may differ materially from the amounts accrued for each year. See additional discussion of our deferred tax assets and liabilities in Note 18 to our consolidated financial statements in Item 8.
Retiree benefits
— Accounting for pension benefits and other postretirement benefits (OPEB) involves estimating the cost of benefits to be provided well into the future and attributing that cost to the time period each employee works. These plan expenses and obligations are dependent on assumptions developed by us in consultation with our outside advisers such as actuaries and other consultants and are generally calculated independently of funding requirements. The assumptions used, including inflation, discount rates, investment returns, life expectancies, turnover rates, retirement rates, future compensation levels and health care cost trend rates, have a significant impact on plan expenses and obligations. These assumptions are
38
regularly reviewed and modified when appropriate based on historical experience, current trends and the future outlook. Changes in one or more of the underlying assumptions could result in a material impact to our consolidated financial statements in any given period. If actual experience differs from expectations, our financial position and results of operations in future periods could be affected.
Mortality rates are based in part on the company's plan experience and actuarial estimates. The inflation assumption is based on an evaluation of external market indicators, while retirement and turnover rates are based primarily on actual plan experience. Health care cost trend rates are developed based on our actual historical claims experience, the near-term outlook and an assessment of likely long-term trends. For our largest plans, discount rates are based upon the construction of a yield curve which is developed based on a subset of high-quality fixed-income investments (those with yields between the 40th and 90th percentiles). The projected cash flows are matched to this yield curve and a present value developed which is then calibrated to develop a single equivalent discount rate. Pension benefits are funded through deposits with trustees that satisfy, at a minimum, the applicable funding regulations. For our largest defined benefit pension plans, expected investment rates of return are based on input from the plans’ investment advisers and actuary regarding our expected investment portfolio mix, historical rates of return on those assets, projected future asset class returns, the impact of active management and long-term market conditions and inflation expectations. We believe that the long-term asset allocation on average will approximate the targeted allocation and we regularly review the actual asset allocation to periodically re-balance the investments to the targeted allocation when appropriate. OPEB and the majority of our non-U.S. pension benefits are funded as they become due.
Actuarial gains or losses may result from changes in assumptions or when actual experience is different from that which was expected. Under the applicable standards, those gains and losses are not required to be immediately recognized in our results of operations as income or expense, but instead are deferred as part of AOCI and amortized into our results of operations over future periods.
U.S. retirement plans
Our U.S. defined benefit pension plans comprise 82% of our consolidated defined benefit pension obligations at December 31, 2017. These plans are frozen and no service-related costs are being incurred. Changes in our net obligations are principally attributable to changing discount rates and the performance of plan assets. In part to reduce our exposure to fluctuations in unfunded pension obligations, our Board of Directors approved in October 2017 the termination of a U.S. defined benefit pension plan. At December 31, 2017, this plan had benefit obligations of $1,064 and assets of $900. The benefit obligations have been valued at the amount expected to be required to settle the obligations utilizing assumptions regarding the portion of obligations expected to be settled through participant acceptance of lump sum payments or annuities and the cost to purchase annuities. Increasing the plan's obligations to reflect the expected settlement value resulted in an actuarial loss of $69 that was charged to OCI in 2017. Ultimate plan termination is subject to regulatory approval and to prevailing market conditions and other considerations, including interest rates and annuity pricing. In the event that approvals are received and we proceed with effecting termination of the plan, settlement of the obligations is expected to occur in the first half of 2019. For our other pension plans, benefit obligations are valued using discount rates established annually in consultation with our outside actuarial advisers using the same yield curve approach described above. Rising discount rates decrease the present value of future pension obligations – a 25 basis point increase in the discount rate would decrease our U.S. pension liability by about $41. As indicated above, when establishing the expected long-term rate of return on our U.S. pension plan assets, we consider historical performance and forward looking return estimates reflective of our portfolio mix and investment strategy. Based on the most recent analysis of projected portfolio returns, we concluded that the use of a 6.0% expected return in 2018 is appropriate for our U.S. pension plans where termination is not anticipated. With the asset portfolio of the plan being terminated having a larger proportion of cash and fixed income investments, a rate of return of 4.1% through the expected settlement date in the first half of 2019 was considered appropriate. See
Note 12
to the consolidated financial statements in Item 8 for information about the investing and allocation objectives related to our U.S. pension plan assets.
The Society of Actuaries (SOA) issued new mortality improvement scales in the fourth quarter of 2017, marking the fourth consecutive year for revised guidance. In developing MP-2017, the SOA considered actual experience through 2014 and preliminary data for 2015. When it issued MP-2014, the SOA had projected improvement from the beginning of 2008 after analyzing historical data through 2007. In connection with selecting our assumptions in 2014, we had compared actual experience for years after 2007 to the improvement projected in MP-2014, along with other information, before concluding that a 0.75% long-term improvement rate (LTIR) for periods beginning with 2014 was appropriate and assuming that the LTIR would be attained by 2020, sooner than the period assumed in MP-2014. We reviewed the data in MP-2017 and concluded that the adjustments made in the past are also appropriate with respect to the latest guidance, resulting in the adoption of MP-2017 modified to reflect an LTIR of 0.75% being achieved by 2026. Adopting the modified MP-2017 scale did not have a material effect on our pension obligations.
39
In 2016, we began using a full yield curve approach to estimate the service (where applicable) and interest components of the annual cost of our pension and other postretirement benefit plans. The new method estimates interest and service expense using the specific spot rates, from the yield curve, that relate to projected cash flows. Prior to 2016, we had estimated interest and service expense using the discount rate underlying the calculation of the related projected benefit obligation at the end of the preceding year. That rate was a weighted-average rate derived from the corresponding yield curve. The full yield curve approach, which we believe is more precise, reduced interest expense for our pension plans in the U.S. by approximately $14 in 2016 and $11 in 2017. The determination of the projected benefit obligation at year end is unchanged, however, so the actuarial gain or loss is affected by the amount of the change in interest and service expense.
At December 31, 2017, we have $559 of unrecognized losses relating to our U.S. pension plans. Actuarial gains and losses, which are primarily the result of changes in the discount rate and other assumptions and differences between actual and expected asset returns, are deferred in AOCI and amortized to expense following the corridor approach. We use the average remaining service period of active participants unless almost all of the plan’s participants are inactive, in which case we use the average remaining life expectancy of inactive participants. The plan being terminated has deferred actuarial losses of $369 at December 31, 2017. The unrecognized actuarial losses of this plan that remain when the obligations are settled in 2019 will be recognized as expense at that time.
Actuarial gains and losses can also impact required cash contributions. Based on the current funded status of our U.S. plans, there are no minimum contribution requirements for 2018. For the U.S. plan being terminated, to effectuate the expected settlement in 2019, Dana will be required to fund any plan obligations in excess of assets. Based on the plan obligation settlement assumptions and asset values at December 31, 2017, the unfunded plan obligations are $164. The actual cash requirement at settlement will vary from this amount based on the actual cost of annuities and participant settlement elections relative to those assumed for year-end 2017 valuation and the actual return on assets compared to the 4.1% expected annual rate of return.
See
Note 12
to our consolidated financial statements in Item 8 for additional discussion of our pension and OPEB obligations.
Goodwill and other indefinite-lived intangible assets
— Our goodwill and other indefinite-lived intangible assets are tested for impairment annually as of October 31 for all of our reporting units, and more frequently if events or circumstances warrant such a review. We make significant assumptions and estimates about the extent and timing of future cash flows, growth rates and discount rates. The cash flows are estimated over a significant future period of time, which makes those estimates and assumptions subject to a high degree of uncertainty. We also utilize market valuation models which require us to make certain assumptions and estimates regarding the applicability of those models to our assets and businesses. We use our internal forecasts, which we update quarterly, to make our cash flow projections. These forecasts are based on our knowledge of our customers’ production forecasts, our assessment of market growth rates, net new business, material and labor cost estimates, cost recovery agreements with customers and our estimate of savings expected from our restructuring activities.
The most likely factors that would significantly impact our forecasts are changes in customer production levels and loss of significant portions of our business. We believe that the assumptions and estimates used in the assessment of the goodwill and other indefinite-lived intangible assets as of October 31, 2017 were reasonable. Aside from the goodwill recorded in connection with the Magnum and SJT Forjaria Ltda. acquisitions, we believe there is a significant excess of fair value over the carrying value of the related assets at December 31, 2017.
Long-lived assets with definite lives
— We perform impairment assessments on our property, plant and equipment and our definite-lived intangible assets whenever events and circumstances indicate that the carrying amounts of the assets may not be recoverable. When indications are present, we compare the estimated future undiscounted net cash flows of the operations to which the assets relate to the carrying amounts of such assets. We utilize the cash flow projections discussed above for property, plant and equipment and amortizable intangibles. We group the assets and liabilities at the lowest level for which identifiable cash flows are largely independent of the cash flows of other assets and liabilities and evaluate the asset group against the undiscounted future cash flows using the life of the primary assets. If the carrying amounts of the long-lived assets are not recoverable from future cash flows and exceed their fair value, an impairment loss is recognized to reduce the carrying amounts of the long-lived assets to their fair value. Fair value is determined based on discounted cash flows, third party appraisals or other methods that provide appropriate estimates of value. Determining whether a triggering event has occurred, performing the impairment analysis and estimating the fair value of the assets require numerous assumptions and a considerable amount of management judgment.
Investments in affiliates
— We had aggregate investments in affiliates of $163 at December 31, 2017 and $150 at December 31, 2016. We monitor our investments in affiliates for indicators of other-than-temporary declines in value on an ongoing basis
40
in accordance with GAAP. If we determine that an other-than temporary decline in value has occurred, we recognize an impairment loss, which is measured as the difference between the recorded carrying value and the fair value of the investment. Fair value is generally determined using the discounted cash flows (an income approach) or guideline public company (a market approach) methods. A deterioration in industry conditions and decline in the operating results of our non-consolidated affiliates could result in the impairment of our investments. During 2015, we recorded a $39 impairment charge related to our investment in DDAC. See
Note 21
to our consolidated financial statements in Item 8 for additional information.
Warranty
— Costs related to product warranty obligations are estimated and accrued at the time of sale with a charge against cost of sales. Warranty accruals are evaluated and adjusted as appropriate based on occurrences giving rise to potential warranty exposure and associated experience. Warranty accruals and adjustments require significant judgment, including a determination of our involvement in the matter giving rise to the potential warranty issue or claim, our contractual requirements, estimates of units requiring repair and estimates of repair costs. If actual experience differs from expectations, our financial position and results of operations in future periods could be affected.
Contingency reserves
— We have numerous other loss exposures, such as product liability and warranty claims and matters involving litigation. Establishing loss reserves for these matters requires the use of estimates and judgment regarding risk of exposure and ultimate liability. Product liability and warranty claims are generally estimated based on historical experience and the estimated costs associated with specific events giving rise to potential field campaigns or recalls. In the case of legal contingencies, estimates are made of the likely outcome of legal proceedings and potential exposure where reasonably determinable based on the information presently known to us. New information and other developments in these matters could materially affect our recorded liabilities.
We are exposed to fluctuations in foreign currency exchange rates, commodity prices for products we use in our manufacturing and interest rates. To reduce our exposure to these risks, we maintain risk management controls to monitor these risks and take appropriate actions to attempt to mitigate such forms of market risks.
Foreign currency exchange rate risk
— Our foreign currency exposures are primarily associated with intercompany and third party sales and purchase transactions, cross-currency intercompany loans and external debt. We use forward contracts to manage our foreign currency exchange rate risk associated with a portion of our forecasted foreign currency-denominated sales and purchase transactions and with certain foreign currency-denominated assets and liabilities. We also use currency swaps, including fixed-to-fixed cross-currency interest rate swaps, to manage foreign currency exchange rate risk associated with our intercompany loans and external debt. Foreign currency exposures are reviewed quarterly, at a minimum, and natural offsets are considered prior to entering into derivative instruments.
Changes in the fair value of derivative instruments treated as cash flow hedges are reported in other comprehensive income (loss) (OCI). Deferred gains and losses are reclassified to earnings in the same period in which the underlying transactions affect earnings. Specifically, with respect to the cross-currency interest rate swap, to the extent we recognize an exchange gain or loss on the underlying external debt, we reclassify an offsetting portion from OCI to earnings in the same period.
Changes in the fair value of derivative instruments not treated as cash flow hedges are recognized in earnings in the period in which those changes occur. Changes in the fair value of derivative instruments associated with product-related transactions are recorded in cost of sales, while those associated with non-product transactions are recorded in other income (expense), net. See
Note 15
to our consolidated financial statements in Item 8.
The following table summarizes the sensitivity of the fair value of our derivative instruments, including forward contracts and currency swaps, at
December 31, 2017
to a 10% change in foreign exchange rates.
|
10% Increase
in Rates
Gain (Loss)
|
10% Decrease
in Rates
Gain (Loss)
|
||||||
|
Foreign currency rate sensitivity:
|
|
|
|
|
|||
|
Currency swaps
|
$
|
140
|
|
$
|
(140
|
)
|
|
|
Forward contracts
|
$
|
(11
|
)
|
$
|
13
|
|
|
41
At December 31, 2017, of the $1,418 total notional amount of foreign currency derivatives, approximately 80% represents the aggregate of three fixed-to-fixed cross-currency interest rate swaps associated with recorded foreign currency-denominated external debt and certain foreign currency-denominated intercompany loans while the remaining 20% primarily represents forward contracts associated with our forecasted foreign currency-denominated sales and purchase transactions.
To manage our global liquidity objectives, we periodically execute intercompany loans, some of which are foreign currency-denominated. With respect to such intercompany loans, the total notional amount outstanding at December 31, 2017 is approximately $500. Depending on the specific objective of each intercompany loan arrangement, certain intercompany loans may be hedged while others remain unhedged for strategic reasons. The decision to hedge the loan, to designate the loan itself as a hedge or not to hedge the loan is dependent on management's underlying strategy. Of the approximately $500 of foreign currency-denominated intercompany loans outstanding at December 31, 2017, approximately two-thirds, or $337, has been hedged by one of our fixed-to-fixed cross-currency swaps whereby we have protected the income statement from exchange rate risk. Of the remaining one-third of such outstanding intercompany loans, none has been hedged. A significant portion of this remaining one-third is deemed to be permanent in nature while the remainder of this one-third portion has been designated as a net investment hedge to protect the USD-equivalent value of the corresponding amount of the underlying investment in our Mexican operations. The remeasurement of foreign currency-denominated intercompany loans that have been designated as net investment hedges or characterized as permanent in nature is recognized as an adjustment to the cumulative translation adjustment component of OCI.
To align our cash requirements with availability by currency, we also periodically issue external debt that is denominated in a currency other than the functional currency of the issuing entity. As of December 31, 2017, we had $775 of external U.S. dollar debt, issued by a euro-functional entity, all of which has been hedged by our fixed-to-fixed cross-currency interest rate swaps. Such swaps are treated as cash flow hedges whereby the changes in fair value are recorded in OCI to the extent the hedges remain effective.
At December 31, 2016, the total notional amount of our currency derivative portfolio was $714 and included a fixed-to-fixed cross-currency interest rate swap associated with $375 of external debt. The remaining $339 represents currency swaps and forward contracts associated with certain foreign currency-denominated intercompany loans and forecasted sales and purchase transactions.
Commodity price risk
— We do not utilize derivative contracts to manage commodity price risk. Our overall strategy is to pass through commodity risk to our customers in our pricing agreements. A substantial portion of our customer agreements include contractual provisions for the pass-through of commodity price movements. In instances where the risk is not covered contractually, we have generally been able to adjust customer pricing to recover commodity cost increases.
Interest rate risk
— Our long-term debt portfolio consists mostly of fixed-rate instruments. On occasion we enter into interest rate swaps to convert fixed-rate debt to floating-rate debt. As described in
Note 15
to our consolidated financial statements in Item 8, we entered into a fixed-to-floating interest rate swap during 2015 but terminated that swap prior to the end of 2015. At
December 31, 2017
, we do not hold any fixed-to-floating interest rate swaps. Our three fixed-to-fixed cross-currency interest rate swaps remain outstanding at
December 31, 2017
and act as hedges of the currency risk of certain external and intercompany debt instruments. See Note 15 to our consolidated financial statements in Item 8 for additional information.
42
Report of Independent Registered Public Accounting Firm
To the Board of Directors and Shareholders of Dana Incorporated
Opinions on the Financial Statements and Internal Control over Financial Reporting
We have audited the accompanying consolidated balance sheets of Dana Incorporated and its subsidiaries as of December 31, 2017 and December 31, 2016, and the related consolidated statements of operations, comprehensive income, cash flows, and stockholders’ equity for each of the three years in the period ended December 31, 2017, including the related notes and schedule of valuation and qualifying accounts and reserves for each of the three years in the period ended December 31, 2017 appearing under Item 15(a)(3) (collectively referred to as the “consolidated financial statements”). We also have audited the Company's internal control over financial reporting as of December 31, 2017, based on criteria established in
Internal Control - Integrated Framework
(2013) issued by the Committee of Sponsoring Organizations of the Treadway Commission (COSO).
In our opinion, the consolidated financial statements referred to above present fairly, in all material respects, the financial position of the Company as of December 31, 2017 and December 31, 2016
,
and the results of its operations and its cash flows for each of the three years in the period ended December 31, 2017 in conformity with accounting principles generally accepted in the United States of America. Also in our opinion, the Company maintained, in all material respects, effective internal control over financial reporting as of December 31, 2017, based on criteria established in
Internal Control - Integrated Framework
(2013) issued by the COSO.
Basis for Opinions
The Company's management is responsible for these consolidated financial statements, for maintaining effective internal control over financial reporting, and for its assessment of the effectiveness of internal control over financial reporting, included in Management’s Report on Internal Control over Financial Reporting appearing under Item 9A. Our responsibility is to express opinions on the Company’s consolidated financial statements and on the Company's internal control over financial reporting based on our audits. We are a public accounting firm registered with the Public Company Accounting Oversight Board (United States) ("PCAOB") and are required to be independent with respect to the Company in accordance with the U.S. federal securities laws and the applicable rules and regulations of the Securities and Exchange Commission and the PCAOB.
We conducted our audits in accordance with the standards of the PCAOB. Those standards require that we plan and perform the audits to obtain reasonable assurance about whether the consolidated financial statements are free of material misstatement, whether due to error or fraud, and whether effective internal control over financial reporting was maintained in all material respects.
Our audits of the consolidated financial statements included performing procedures to assess the risks of material misstatement of the consolidated financial statements, whether due to error or fraud, and performing procedures that respond to those risks. Such procedures included examining, on a test basis, evidence regarding the amounts and disclosures in the consolidated financial statements. Our audits also included evaluating the accounting principles used and significant estimates made by management, as well as evaluating the overall presentation of the consolidated financial statements. Our audit of internal control over financial reporting included obtaining an understanding of internal control over financial reporting, assessing the risk that a material weakness exists, and testing and evaluating the design and operating effectiveness of internal control based on the assessed risk. Our audits also included performing such other procedures as we considered necessary in the circumstances. We believe that our audits provide a reasonable basis for our opinions.
As described in Management’s Report on Internal Control over Financial Reporting, management has excluded Brevini Fluid Power S.pA. (BFP), Brevini Power Transmission S.p.A. (BPT), and Warren Manufacturing LLC (USM) from its assessment of internal control over financial reporting as of December 31, 2017 because they were acquired by the Company in purchase business combinations during 2017. We have also excluded BFP, BPT, and USM from our audit of internal control over financial reporting. BFP and BPT are majority-owned subsidiaries and USM is a wholly-owned subsidiary whose total assets and total revenues excluded from management’s assessment and our audit of internal control over financial reporting represent approximately 2.5%, 6.0% and 1.6% of total assets, respectively and approximately 1.5%, 4.1%, and 1.3% of total revenues, respectively, of the related consolidated financial statement amounts as of and for the year ended December 31, 2017.
43
Definition and Limitations of Internal Control over Financial Reporting
A company’s internal control over financial reporting is a process designed to provide reasonable assurance regarding the reliability of financial reporting and the preparation of financial statements for external purposes in accordance with generally accepted accounting principles. A company’s internal control over financial reporting includes those policies and procedures that (i) pertain to the maintenance of records that, in reasonable detail, accurately and fairly reflect the transactions and dispositions of the assets of the company; (ii) provide reasonable assurance that transactions are recorded as necessary to permit preparation of financial statements in accordance with generally accepted accounting principles, and that receipts and expenditures of the company are being made only in accordance with authorizations of management and directors of the company; and (iii) provide reasonable assurance regarding prevention or timely detection of unauthorized acquisition, use, or disposition of the company’s assets that could have a material effect on the financial statements.
Because of its inherent limitations, internal control over financial reporting may not prevent or detect misstatements. Also, projections of any evaluation of effectiveness to future periods are subject to the risk that controls may become inadequate because of changes in conditions, or that the degree of compliance with the policies or procedures may deteriorate.
|
/s/ PricewaterhouseCoopers LLP
|
|
|
Toledo, Ohio
|
|
|
February 14, 2018
|
|
We have served as the Company’s auditor since 1916.
44
Dana Incorporated
(In millions, except per share amounts)
|
|
2017
|
2016
|
2015
|
||||||||
|
Net sales
|
$
|
7,209
|
|
|
$
|
5,826
|
|
|
$
|
6,060
|
|
|
Costs and expenses
|
|
|
|
|
|
|
|||||
|
Cost of sales
|
6,147
|
|
4,982
|
|
5,211
|
|
|||||
|
Selling, general and administrative expenses
|
511
|
|
406
|
|
391
|
|
|||||
|
Amortization of intangibles
|
11
|
|
8
|
|
14
|
|
|||||
|
Restructuring charges, net
|
14
|
|
36
|
|
15
|
|
|||||
|
Loss on disposal group held for sale
|
(27
|
)
|
|||||||||
|
Loss on sale of subsidiaries
|
|
|
(80
|
)
|
|||||||
|
Impairment of long-lived assets
|
|
|
|
|
(36
|
)
|
|||||
|
Other income (expense), net
|
(9
|
)
|
18
|
|
1
|
|
|||||
|
Earnings before interest and income taxes
|
490
|
|
332
|
|
394
|
|
|||||
|
Loss on extinguishment of debt
|
(19
|
)
|
(17
|
)
|
(2
|
)
|
|||||
|
Interest income
|
11
|
|
13
|
|
13
|
|
|||||
|
Interest expense
|
102
|
|
113
|
|
113
|
|
|||||
|
Earnings from continuing operations before income taxes
|
380
|
|
215
|
|
292
|
|
|||||
|
Income tax expense (benefit)
|
283
|
|
(424
|
)
|
82
|
|
|||||
|
Equity in earnings (losses) of affiliates
|
19
|
|
14
|
|
(34
|
)
|
|||||
|
Income from continuing operations
|
116
|
|
653
|
|
176
|
|
|||||
|
Income from discontinued operations
|
|
|
|
|
4
|
|
|||||
|
Net income
|
116
|
|
653
|
|
180
|
|
|||||
|
Less: Noncontrolling interests net income
|
10
|
|
13
|
|
21
|
|
|||||
|
Less: Redeemable noncontrolling interests net loss
|
(5
|
)
|
|
|
|
|
|||||
|
Net income attributable to the parent company
|
$
|
111
|
|
$
|
640
|
|
$
|
159
|
|
||
|
Net income per share available to common stockholders:
|
|
|
|
|
|
|
|||||
|
Basic:
|
|
|
|
|
|
|
|||||
|
Income from continuing operations
|
$
|
0.72
|
|
$
|
4.38
|
|
$
|
0.98
|
|
||
|
Income from discontinued operations
|
$
|
—
|
|
$
|
—
|
|
$
|
0.02
|
|
||
|
Net income
|
$
|
0.72
|
|
$
|
4.38
|
|
$
|
1.00
|
|
||
|
Diluted:
|
|
|
|
|
|
|
|||||
|
Income from continuing operations
|
$
|
0.71
|
|
$
|
4.36
|
|
$
|
0.97
|
|
||
|
Income from discontinued operations
|
$
|
—
|
|
$
|
—
|
|
$
|
0.02
|
|
||
|
Net income
|
$
|
0.71
|
|
$
|
4.36
|
|
$
|
0.99
|
|
||
|
Weighted-average common shares outstanding
|
|
|
|
|
|
|
|||||
|
Basic
|
145.1
|
|
146.0
|
|
159.0
|
|
|||||
|
Diluted
|
146.9
|
|
146.8
|
|
160.0
|
|
|||||
|
Dividends declared per common share
|
$
|
0.24
|
|
$
|
0.24
|
|
$
|
0.23
|
|
||
The accompanying notes are an integral part of the consolidated financial statements.
45
Dana Incorporated
Consolidated Statement of Comprehensive Income
(In millions)
|
|
2017
|
2016
|
2015
|
||||||||
|
Net income
|
$
|
116
|
|
$
|
653
|
|
$
|
180
|
|
||
|
Other comprehensive income (loss), net of tax:
|
|
|
|
|
|
|
|||||
|
Currency translation adjustments
|
(14
|
)
|
(41
|
)
|
(186
|
)
|
|||||
|
Hedging gains and losses
|
(30
|
)
|
(30
|
)
|
5
|
|
|||||
|
Investment and other gains and losses
|
2
|
|
(2
|
)
|
(3
|
)
|
|||||
|
Defined benefit plans
|
(6
|
)
|
(39
|
)
|
3
|
|
|||||
|
Other comprehensive loss
|
(48
|
)
|
(112
|
)
|
(181
|
)
|
|||||
|
Total comprehensive income (loss)
|
68
|
|
541
|
|
(1
|
)
|
|||||
|
Less: Comprehensive income attributable to noncontrolling interests
|
(17
|
)
|
(11
|
)
|
(17
|
)
|
|||||
|
Less: Comprehensive loss attributable to redeemable noncontrolling interests
|
2
|
|
|
|
|
|
|||||
|
Comprehensive income (loss) attributable to the parent company
|
$
|
53
|
|
$
|
530
|
|
$
|
(18
|
)
|
||
The accompanying notes are an integral part of the consolidated financial statements.
46
Dana Incorporated
(In millions, except share and per share amounts)
|
|
2017
|
2016
|
|||||
|
Assets
|
|
|
|
|
|||
|
Current assets
|
|
|
|
|
|||
|
Cash and cash equivalents
|
$
|
603
|
|
$
|
707
|
|
|
|
Marketable securities
|
40
|
|
30
|
|
|||
|
Accounts receivable
|
|
|
|
|
|||
|
Trade, less allowance for doubtful accounts of $8 in 2017 and $6 in 2016
|
994
|
|
721
|
|
|||
|
Other
|
172
|
|
110
|
|
|||
|
Inventories
|
969
|
|
638
|
|
|||
|
Other current assets
|
97
|
|
78
|
|
|||
|
Current assets of disposal group held for sale
|
7
|
|
|||||
|
Total current assets
|
2,882
|
|
2,284
|
|
|||
|
Goodwill
|
127
|
|
90
|
|
|||
|
Intangibles
|
174
|
|
109
|
|
|||
|
Deferred tax assets
|
420
|
|
588
|
|
|||
|
Other noncurrent assets
|
71
|
|
226
|
|
|||
|
Investments in affiliates
|
163
|
|
150
|
|
|||
|
Property, plant and equipment, net
|
1,807
|
|
1,413
|
|
|||
|
Total assets
|
$
|
5,644
|
|
$
|
4,860
|
|
|
|
Liabilities and equity
|
|
|
|
|
|||
|
Current liabilities
|
|
|
|
|
|||
|
Notes payable, including current portion of long-term debt
|
$
|
40
|
|
$
|
69
|
|
|
|
Accounts payable
|
1,165
|
|
819
|
|
|||
|
Accrued payroll and employee benefits
|
219
|
|
149
|
|
|||
|
Taxes on income
|
53
|
|
15
|
|
|||
|
Other accrued liabilities
|
220
|
|
201
|
|
|||
|
Current liabilities of disposal group held for sale
|
5
|
|
|||||
|
Total current liabilities
|
1,702
|
|
1,253
|
|
|||
|
Long-term debt, less debt issuance costs of $22 in 2017 and $21 in 2016
|
1,759
|
|
1,595
|
|
|||
|
Pension and postretirement obligations
|
607
|
|
565
|
|
|||
|
Other noncurrent liabilities
|
413
|
|
205
|
|
|||
|
Noncurrent liabilities of disposal group held for sale
|
2
|
|
|||||
|
Total liabilities
|
4,483
|
|
3,618
|
|
|||
|
Commitments and contingencies (Note 16)
|
|
|
|
|
|||
|
Redeemable noncontrolling interests
|
47
|
|
|
|
|||
|
Parent company stockholders' equity
|
|
|
|
|
|||
|
Preferred stock, 50,000,000 shares authorized, $0.01 par value, no shares outstanding
|
—
|
|
—
|
|
|||
|
Common stock, 450,000,000 shares authorized, $0.01 par value, 144,984,050 and 143,938,280 shares outstanding
|
2
|
|
2
|
|
|||
|
Additional paid-in capital
|
2,354
|
|
2,327
|
|
|||
|
Retained earnings
|
86
|
|
195
|
|
|||
|
Treasury stock, at cost (7,001,017 and 6,812,784 shares)
|
(87
|
)
|
(83
|
)
|
|||
|
Accumulated other comprehensive loss
|
(1,342
|
)
|
(1,284
|
)
|
|||
|
Total parent company stockholders' equity
|
1,013
|
|
1,157
|
|
|||
|
Noncontrolling interests
|
101
|
|
85
|
|
|||
|
Total equity
|
1,114
|
|
1,242
|
|
|||
|
Total liabilities and equity
|
$
|
5,644
|
|
$
|
4,860
|
|
|
The accompanying notes are an integral part of the consolidated financial statements.
47
Dana Incorporated
(In millions)
|
|
2017
|
2016
|
2015
|
||||||||
|
Operating activities
|
|
|
|
|
|
|
|||||
|
Net income
|
$
|
116
|
|
$
|
653
|
|
$
|
180
|
|
||
|
Depreciation
|
220
|
|
173
|
|
158
|
|
|||||
|
Amortization of intangibles
|
13
|
|
9
|
|
16
|
|
|||||
|
Amortization of deferred financing charges
|
5
|
|
5
|
|
5
|
|
|||||
|
Call premium on debt
|
15
|
|
12
|
|
2
|
|
|||||
|
Write-off of deferred financing costs
|
4
|
|
5
|
|
1
|
|
|||||
|
Earnings of affiliates, net of dividends received
|
(3
|
)
|
(3
|
)
|
12
|
|
|||||
|
Stock compensation expense
|
23
|
|
17
|
|
14
|
|
|||||
|
Deferred income taxes
|
179
|
|
(480
|
)
|
(10
|
)
|
|||||
|
Pension contributions, net
|
(6
|
)
|
(16
|
)
|
(18
|
)
|
|||||
|
(Gain) loss on sale of subsidiaries
|
(3
|
)
|
80
|
|
|||||||
|
Loss on disposal group held for sale
|
27
|
|
|
|
|
|
|||||
|
Impairment of long-lived assets
|
|
|
|
|
36
|
|
|||||
|
Impairment of equity affiliate
|
|
|
|
|
39
|
|
|||||
|
Change in working capital
|
(8
|
)
|
(51
|
)
|
(41
|
)
|
|||||
|
Change in other noncurrent assets and liabilities
|
(9
|
)
|
(1
|
)
|
(7
|
)
|
|||||
|
Other, net
|
(19
|
)
|
(19
|
)
|
19
|
|
|||||
|
Net cash provided by operating activities
|
554
|
|
384
|
|
406
|
|
|||||
|
Investing activities
|
|
|
|
|
|
|
|||||
|
Purchases of property, plant and equipment
|
(393
|
)
|
(322
|
)
|
(260
|
)
|
|||||
|
Acquisition of businesses, net of cash acquired
|
(187
|
)
|
(78
|
)
|
|||||||
|
Purchases of marketable securities
|
(35
|
)
|
(93
|
)
|
(43
|
)
|
|||||
|
Proceeds from sales of marketable securities
|
1
|
|
47
|
|
17
|
|
|||||
|
Proceeds from maturities of marketable securities
|
27
|
|
47
|
|
30
|
|
|||||
|
Proceeds from sale of subsidiaries
|
3
|
|
34
|
|
|
|
|||||
|
Other
|
3
|
|
|
|
(2
|
)
|
|||||
|
Net cash used in investing activities
|
(581
|
)
|
(365
|
)
|
(258
|
)
|
|||||
|
Financing activities
|
|
|
|
|
|
|
|||||
|
Net change in short-term debt
|
(90
|
)
|
9
|
|
(5
|
)
|
|||||
|
Repayment of letters of credit
|
|
|
|
|
(4
|
)
|
|||||
|
Proceeds from long-term debt
|
676
|
|
441
|
|
18
|
|
|||||
|
Repayment of long-term debt
|
(640
|
)
|
(382
|
)
|
(60
|
)
|
|||||
|
Call premium on debt
|
(15
|
)
|
(12
|
)
|
(2
|
)
|
|||||
|
Deferred financing payments
|
(9
|
)
|
(11
|
)
|
|
|
|||||
|
Dividends paid to common stockholders
|
(35
|
)
|
(35
|
)
|
(37
|
)
|
|||||
|
Distributions to noncontrolling interests
|
(12
|
)
|
(17
|
)
|
(9
|
)
|
|||||
|
Repurchases of common stock
|
|
|
(81
|
)
|
(311
|
)
|
|||||
|
Other
|
5
|
|
|
|
7
|
|
|||||
|
Net cash used in financing activities
|
(120
|
)
|
(88
|
)
|
(403
|
)
|
|||||
|
Net decrease in cash and cash equivalents
|
(147
|
)
|
(69
|
)
|
(255
|
)
|
|||||
|
Cash and cash equivalents - beginning of period
|
707
|
|
791
|
|
1,121
|
|
|||||
|
Effect of exchange rate changes on cash balances
|
43
|
|
(15
|
)
|
(75
|
)
|
|||||
|
Cash and cash equivalents - end of period
|
$
|
603
|
|
$
|
707
|
|
$
|
791
|
|
||
The accompanying notes are an integral part of the consolidated financial statements.
48
Dana Incorporated
Consolidated Statement of Stockholders’ Equity
(In millions)
|
|
Parent Company Stockholders'
|
|
|
|
|||||||||||||||||||||||||||||||
|
Preferred
Stock
|
Common
Stock
|
Additional
Paid-In
Capital
|
Retained
Earnings
(Accumulated
Deficit)
|
Treasury
Stock
|
Accumulated
Other
Compre-
hensive
Loss
|
Parent
Company
Stockholders'
Equity
|
Non-
controlling
Interests
|
Total
Equity
|
|||||||||||||||||||||||||||
|
Balance, December 31, 2014
|
$
|
—
|
|
$
|
2
|
|
$
|
2,640
|
|
$
|
(532
|
)
|
$
|
(33
|
)
|
$
|
(997
|
)
|
$
|
1,080
|
|
$
|
100
|
|
$
|
1,180
|
|
||||||||
|
Net income
|
159
|
|
159
|
|
21
|
|
180
|
|
|||||||||||||||||||||||||||
|
Other comprehensive loss
|
(177
|
)
|
(177
|
)
|
(4
|
)
|
(181
|
)
|
|||||||||||||||||||||||||||
|
Common stock dividends ($0.23 per share)
|
(37
|
)
|
(37
|
)
|
(37
|
)
|
|||||||||||||||||||||||||||||
|
Distributions to noncontrolling interests
|
—
|
|
(9
|
)
|
(9
|
)
|
|||||||||||||||||||||||||||||
|
Derecognition of noncontrolling interest
|
—
|
|
(5
|
)
|
(5
|
)
|
|||||||||||||||||||||||||||||
|
Common stock share repurchases
|
(311
|
)
|
(311
|
)
|
(311
|
)
|
|||||||||||||||||||||||||||||
|
Retire treasury shares
|
(346
|
)
|
346
|
|
—
|
|
—
|
|
|||||||||||||||||||||||||||
|
Stock compensation
|
17
|
|
17
|
|
17
|
|
|||||||||||||||||||||||||||||
|
Stock withheld for employees taxes
|
(3
|
)
|
(3
|
)
|
(3
|
)
|
|||||||||||||||||||||||||||||
|
Balance, December 31, 2015
|
—
|
|
2
|
|
2,311
|
|
(410
|
)
|
(1
|
)
|
(1,174
|
)
|
728
|
|
103
|
|
831
|
|
|||||||||||||||||
|
Net income
|
640
|
|
640
|
|
13
|
|
653
|
|
|||||||||||||||||||||||||||
|
Other comprehensive loss
|
(110
|
)
|
(110
|
)
|
(2
|
)
|
(112
|
)
|
|||||||||||||||||||||||||||
|
Common stock dividends ($0.24 per share)
|
(35
|
)
|
(35
|
)
|
(35
|
)
|
|||||||||||||||||||||||||||||
|
Distributions to noncontrolling interests
|
—
|
|
(17
|
)
|
(17
|
)
|
|||||||||||||||||||||||||||||
|
Derecognition of noncontrolling interest
|
—
|
|
(12
|
)
|
(12
|
)
|
|||||||||||||||||||||||||||||
|
Common stock share repurchases
|
(81
|
)
|
(81
|
)
|
(81
|
)
|
|||||||||||||||||||||||||||||
|
Stock compensation
|
16
|
|
16
|
|
16
|
|
|||||||||||||||||||||||||||||
|
Stock withheld for employees taxes
|
(1
|
)
|
(1
|
)
|
(1
|
)
|
|||||||||||||||||||||||||||||
|
Balance, December 31, 2016
|
—
|
|
2
|
|
2,327
|
|
195
|
|
(83
|
)
|
(1,284
|
)
|
1,157
|
|
85
|
|
1,242
|
|
|||||||||||||||||
|
Adoption of ASU 2016-16 tax adjustment, January 1, 2017
|
(179
|
)
|
(179
|
)
|
(179
|
)
|
|||||||||||||||||||||||||||||
|
Net income
|
111
|
|
111
|
|
10
|
|
121
|
|
|||||||||||||||||||||||||||
|
Other comprehensive income (loss)
|
(58
|
)
|
(58
|
)
|
7
|
|
(51
|
)
|
|||||||||||||||||||||||||||
|
Common stock dividends ($0.24 per share)
|
(35
|
)
|
(35
|
)
|
(35
|
)
|
|||||||||||||||||||||||||||||
|
Distributions to noncontrolling interests
|
—
|
|
(12
|
)
|
(12
|
)
|
|||||||||||||||||||||||||||||
|
Increase from business combination
|
—
|
|
12
|
|
12
|
|
|||||||||||||||||||||||||||||
|
Redeemable noncontrolling interests adjustment to redemption value
|
(6
|
)
|
(6
|
)
|
(6
|
)
|
|||||||||||||||||||||||||||||
|
Purchase of noncontrolling interests
|
—
|
|
(1
|
)
|
(1
|
)
|
|||||||||||||||||||||||||||||
|
Stock compensation
|
27
|
|
27
|
|
27
|
|
|||||||||||||||||||||||||||||
|
Stock withheld for employees taxes
|
(4
|
)
|
(4
|
)
|
(4
|
)
|
|||||||||||||||||||||||||||||
|
Balance, December 31, 2017
|
$
|
—
|
|
$
|
2
|
|
$
|
2,354
|
|
$
|
86
|
|
$
|
(87
|
)
|
$
|
(1,342
|
)
|
$
|
1,013
|
|
$
|
101
|
|
$
|
1,114
|
|
||||||||
The accompanying notes are an integral part of the consolidated financial statements.
49
Dana Incorporated
Index to Notes to the Consolidated
Financial Statements
|
|
|
Page
|
|
1.
|
Organization and Summary of Significant Accounting Policies
|
|
|
|
|
|
|
2.
|
Acquisitions
|
|
|
3.
|
Disposal Groups, Divestitures and Impairment of Long-Lived Assets
|
|
|
|
|
|
|
4.
|
Goodwill and Other Intangible Assets
|
|
|
|
|
|
|
5.
|
Restructuring of Operations
|
|
|
|
|
|
|
6.
|
Inventories
|
|
|
|
|
|
|
7.
|
Supplemental Balance Sheet and Cash Flow Information
|
|
|
|
|
|
|
8.
|
Stockholders' Equity
|
|
|
|
|
|
|
9.
|
Redeemable Noncontrolling Interests
|
|
|
10.
|
Earnings per Share
|
|
|
|
|
|
|
11.
|
Stock Compensation
|
|
|
|
|
|
|
12.
|
Pension and Postretirement Benefit Plans
|
|
|
|
|
|
|
13.
|
Marketable Securities
|
|
|
|
|
|
|
14.
|
Financing Agreements
|
|
|
|
|
|
|
15.
|
Fair Value Measurements and Derivatives
|
|
|
|
|
|
|
16.
|
Commitments and Contingencies
|
|
|
|
|
|
|
17.
|
Warranty Obligations
|
|
|
|
|
|
|
18.
|
Income Taxes
|
|
|
|
|
|
|
19.
|
Other Income (Expense), Net
|
|
|
|
|
|
|
20.
|
Segments, Geographical Area and Major Customer Information
|
|
|
|
|
|
|
21.
|
Equity Affiliates
|
|
50
Notes to the Consolidated Financial Statements
(In millions, except share and per share amounts)
General
Dana Incorporated (Dana) is headquartered in Maumee, Ohio and was incorporated in Delaware in 2007. We are a global provider of high technology drive and motion products, sealing solutions, thermal-management technologies and fluid-power products and our customer base includes virtually every major vehicle and engine manufacturer in the global light vehicle, medium/heavy vehicle and off-highway markets.
The terms "Dana," "we," "our" and "us," when used in this report are references to Dana. These references include the subsidiaries of Dana unless otherwise indicated or the context requires otherwise.
Summary of significant accounting policies
Basis of presentation
— Our consolidated financial statements include the accounts of all subsidiaries where we hold a controlling financial interest. The ownership interests in subsidiaries held by third parties are presented in the consolidated balance sheet within equity, but separate from the parent’s equity, as noncontrolling interests. All significant intercompany balances and transactions have been eliminated in consolidation. Investments in
20
to
50%
-owned affiliates, which are not required to be consolidated, are generally accounted for under the equity method. Equity in earnings of these investments is presented separately in the consolidated statement of operations, net of tax. Investments in less-than-
20%
-owned companies are generally included in the financial statements at the cost of our investment. Dividends, royalties and fees from these cost basis affiliates are recorded in income when received.
In the fourth quarter of 2017, we identified an error in the classification of a third-party ownership interest in a subsidiary of Brevini Power Transmission S.p.A. Based on put and call provisions provided for in the agreement between the parties, the third-party ownership interest should have been classified as a redeemable noncontrolling interest. This balance sheet error was corrected in December 2017 by increasing redeemable noncontrolling interests and reducing noncontrolling interests by
$3
. The purchase consideration allocation presented in Note 2 and the initial fair value of redeemable noncontrolling interests of acquired businesses presented in Note 9 include this correction.
In the first quarter of 2015, we identified an error attributable to the calculation of noncontrolling interests net income of a subsidiary. The error resulted in an understatement of noncontrolling equity and noncontrolling interests net income and a corresponding overstatement of parent company stockholders' equity and net income attributable to the parent company in prior periods. Based on our assessments of qualitative and quantitative factors, the error and related impacts were not considered material to the financial statements of the prior periods to which they relate. The error was corrected in March 2015 by increasing noncontrolling interests net income by
$9
. The correction was not considered material to our 2015 net income attributable to the parent company.
Held for sale
— We classify long-lived assets or disposal groups as held for sale in the period: management commits to a plan to sell; the long-lived asset or disposal group is available for immediate sale in its present condition subject only to terms that are usual and customary for sales of such long-lived assets or disposal groups; an active program to locate a buyer and other actions required to complete the plan to sell have been initiated; the sale is probable within one year; the asset or disposal group is being actively marketed for sale at a price that is reasonable in relation to its current fair value; and it is unlikely that significant changes to the plan will be made or that the plan will be withdrawn. Long-lived assets and disposal groups classified as held for sale are measured at the lower of their carrying amount or fair value less costs to sell.
Discontinued operations
— Prior to January 1, 2015, we would classify a business component that had been disposed of or classified as held for sale as discontinued operations if the cash flows of the component were eliminated from our ongoing operations and we no longer had any significant continuing involvement in or with the component. The results of operations of our discontinued operations, including any gains or losses on disposition, were aggregated and presented on one line in the income statement. See
Recently adopted accounting pronouncements
in this note for a description of the current practice and
Note 3
for additional information regarding our discontinued operations.
Estimates
— Our consolidated financial statements are prepared in accordance with accounting principles generally accepted in the United States (GAAP), which require the use of estimates, judgments and assumptions that affect the amounts reported in the consolidated financial statements and accompanying disclosures. We believe our assumptions and estimates are reasonable
51
and appropriate. However, due to the inherent uncertainties in making estimates, actual results could differ from those estimates.
Fair value measurements
— A three-tier fair value hierarchy is used to prioritize the inputs to valuation techniques used to measure fair value. The three levels of inputs are as follows: Level 1 inputs (highest priority) include unadjusted quoted prices in active markets for identical instruments. Level 2 inputs include quoted prices for similar instruments that are observable either directly or indirectly. Level 3 inputs (lowest priority) include unobservable inputs in which there is little or no market data, which require management to develop its own assumptions. Classification within the hierarchy is determined based on the lowest level input that is significant to the fair value measurement.
The inputs we use in our valuation techniques include market data or assumptions that we believe market participants would use in pricing an asset or liability, including assumptions about risk when appropriate. Our valuation techniques include a combination of observable and unobservable inputs. When available, we use quoted market prices to determine the fair value (market approach). In the absence of active markets for the identical assets or liabilities, such measurements involve developing assumptions based on market observable data and, in the absence of such data, we consider the amount and timing of estimated future cash flows and assumed discount rates reflecting varying degrees of credit risk that is consistent with what market participants would use in a hypothetical transaction that occurs at the measurement date (income approach). Fair values may not represent actual values of the financial instruments that could be realized as of the balance sheet date or that will be realized in the future.
Cash and cash equivalents
— Cash and cash equivalents includes cash on hand, demand deposits and short-term cash investments that are highly liquid in nature and have maturities of three months or less when purchased.
Marketable securities
— Our investments in marketable securities reported in the accompanying balance sheet are classified as available for sale and carried at fair value. We recorded unrealized gains and losses in accumulated other comprehensive income (loss) (AOCI) through the end of 2017 but will record them in net income beginning in 2018 to comply with new accounting guidance. Realized gains and losses are recorded using the specific identification method.
Inventories
— Inventories are valued at the lower of cost or net realizable value. Cost is determined using the average or first-in, first-out (FIFO) cost method.
Property, plant and equipment
— As a result of our adoption of fresh start accounting on February 1, 2008, property, plant and equipment was stated at fair value with useful lives ranging from
two
to
thirty
years. Useful lives of newly acquired assets are generally
twenty
to
thirty
years for buildings and building improvements,
five
to
ten
years for machinery and equipment,
three
to
five
years for tooling and office equipment and
three
to
ten
years for furniture and fixtures. Depreciation is recognized over the estimated useful lives using primarily the straight-line method for financial reporting purposes and accelerated depreciation methods for federal income tax purposes. If assets are impaired, their value is reduced via an increase in accumulated depreciation.
Pre-production costs related to long-term supply arrangements
— The costs of tooling used to make products sold under long-term supply arrangements are capitalized as part of property, plant and equipment and amortized over their useful lives if we own the tooling or if we fund the purchase but our customer owns the tooling and grants us the irrevocable right to use the tooling over the contract period. If we have a contractual right to bill our customers, costs incurred in connection with the design and development of tooling are carried as a component of other accounts receivable until invoiced. Design and development costs related to customer products are deferred if we have an agreement to collect such costs from the customer; otherwise, they are expensed when incurred. At
December 31, 2017
, the machinery and equipment component of property, plant and equipment includes
$28
of our tooling related to long-term supply arrangements. The significant increase during 2017 reflects the start of production for our recently awarded customer contracts, including the new JL program at our Toledo, Ohio plant. Also at December 31, 2017, trade and other accounts receivable includes
$40
of costs related to tooling that we have a contractual right to collect from our customers.
Goodwill
— We test goodwill for impairment annually as of October 31 and more frequently if events occur or circumstances change that would warrant an interim review. Goodwill impairment testing is performed at the reporting unit level, which is the operating segment in the case of our Off-Highway goodwill. We estimate the fair value of the reporting unit in the first step using various valuation methodologies, including projected future cash flows and multiples of current earnings. If the estimated fair value of the reporting unit exceeds its carrying value, the goodwill is considered not impaired. If the carrying value of the reporting unit exceeds its estimated fair value, then the second step of the test would be required to determine the implied fair value of the goodwill and any resulting impairment. The vast majority of our goodwill is assigned to our Off-Highway
52
segment. The estimated fair value of our Off-Highway reporting unit was significantly greater than its carrying value at October 31, 2017.
No
impairment of goodwill occurred during the three years ended
December 31, 2017
.
Intangible assets
— Intangible assets include the value of core technology, trademarks and trade names, customer relationships and intangible assets used in research and development activities. Core technology and customer relationships have definite lives while intangible assets used in research and development activities and substantially all of our trademarks and trade names have indefinite lives. Definite-lived intangible assets are amortized over their useful life using the straight-line method of amortization and are periodically reviewed for impairment indicators. Amortization of core technology is charged to cost of sales. Amortization of trademarks and trade names and customer relationships is charged to amortization of intangibles. Intangible assets used in research and development activities have an indefinite life until completion of the associated research and development efforts. Upon completion of development, the assets are amortized over their useful life; if the project is abandoned, the assets are written off immediately. Indefinite-lived intangible assets are tested for impairment annually and more frequently if impairment indicators exist. See Notes 3 and
4
for more information about intangible assets.
Investments in affiliates
— Investments in affiliates include investments accounted for under the equity and cost methods. We monitor our investments in affiliates for indicators of other-than-temporary declines in value on an ongoing basis in accordance with GAAP. Indicators include, but are not limited to, current economic and market conditions, operating performance of the affiliate, including current earnings trends and undiscounted cash flows, and other affiliate-specific information. If we determine that an other-than-temporary decline in value has occurred, we recognize an impairment loss, which is measured as the excess of the investment's recorded carrying value over its fair value. The fair value determination, particularly for investments in privately-held companies, requires significant judgment to determine appropriate estimates and assumptions. Changes in these estimates and assumptions could affect the calculation of the fair value of the investments and determination of whether any identified impairment is other than temporary. See Note
21
for further information about our investment in affiliates.
Tangible asset impairments
— We review the carrying value of amortizable long-lived assets for impairment whenever events or changes in circumstances indicate that the carrying amount of an asset may not be recoverable. Recoverability of assets to be held and used is measured by a comparison of the carrying amount of the assets to the undiscounted future net cash flows expected to be generated by the assets. If such assets are considered to be impaired, the impairment to be recognized is measured by the amount by which the carrying amount of the assets exceeds their fair value. Assets to be disposed of are reported at the lower of their carrying amount or fair value less costs to sell and are no longer depreciated.
Other long-lived assets and liabilities
— We discount our workers’ compensation obligations by applying blended risk-free rates that are appropriate for the duration of the projected cash flows. The use of risk-free rates is considered appropriate given that other risks affecting the volume and timing of payments have been considered in developing the probability-weighted projected cash flows. The blended risk-free rates are revised annually to consider incremental cash flow projections.
Financial instruments
— The carrying values of cash and cash equivalents, trade receivables and short-term borrowings approximate fair value. Notes receivable are carried at fair value, which considers the contractual call or selling price, if applicable. Borrowings under our credit facilities are carried at historical cost and adjusted for principal payments and foreign currency fluctuations.
Derivative
s — Foreign currency forward contracts and currency swaps are carried at fair value. We enter into these contracts to manage our exposure to the impact of currency fluctuations on certain foreign currency-denominated assets and liabilities and on a portion of our forecasted purchase and sale transactions. On occasion, we also enter into net investment hedges to protect the translated U.S. dollar value of our investment in certain foreign subsidiaries. We also periodically enter into fixed-to-fixed cross-currency swaps on foreign currency-denominated external or intercompany debt instruments to reduce our exposure to foreign currency exchange rate risk. Such fixed-to-fixed cross-currency swaps are designated as cash flow hedges. We do not use derivatives for trading or speculative purposes and we do not hedge all of our exposures.
Changes in the fair value of currency-related contracts treated as cash flow hedges are deferred and included as a component of other comprehensive income (loss) (OCI) to the extent the contracts remain effective and the associated forecasted cash flows from our purchase and sale transactions and from our hedged external and intercompany debt instruments remain probable. For our forward contracts associated with forecasted purchase and sale transactions, effectiveness is measured by using regression analysis to determine the degree of correlation between the change in the fair value of the derivative instrument and the change in the associated foreign currency exchange rates. For our fixed-to-fixed cross-currency swaps, a review of critical terms is performed each period to establish that an assumption of effectiveness remains appropriate. Deferred gains and losses are reclassified to other income (expense), net in the same periods in which the underlying transactions affect earnings.
53
Changes in the fair value of contracts not treated as cash flow hedges or as net investment hedges are recognized in other income (expense), net in the period in which those changes occur. Changes in the fair value of contracts treated as net investment hedges are recorded in the cumulative translation adjustment (CTA) component of OCI. Amounts recorded in CTA are deferred until such time as the investment in the associated subsidiary is substantially liquidated.
We may also use fixed-to-floating interest rate swaps to manage exposure to fluctuations in interest rates and to adjust the mix of our fixed-rate and variable-rate debt. With our current portfolio of fixed-rate debt, the execution of a fixed-to-floating interest rate swap serves to convert our fixed-rate debt to variable-rate debt. As a fair value hedge of the underlying debt, changes in the fair values of the swap and the underlying debt are recorded in interest expense. No such fixed-to-floating swaps remain outstanding at December 31, 2017. See Note 15 for additional information.
In the consolidated statement of cash flows, the impact of hedging activities is recorded in the category that is consistent with the nature of the derivative instrument. This category is typically the same category as that of the underlying item being hedged.
Warranty
— Costs related to product warranty obligations are estimated and accrued at the time of sale with a charge against cost of sales. Warranty accruals are evaluated and adjusted as appropriate based on occurrences giving rise to potential warranty exposure and associated experience. Warranty accruals and adjustments require significant judgment, including a determination of our involvement in the matter giving rise to the potential warranty issue or claim, our contractual requirements, estimates of units requiring repair and estimates of repair costs.
Environmental compliance and remediation
— Environmental expenditures that relate to current operations are expensed or capitalized as appropriate. Expenditures that relate to existing conditions caused by past operations that do not contribute to our current or future revenue generation are expensed. Liabilities are recorded when environmental assessments and/or remedial efforts are probable and the costs can be reasonably estimated. We consider the most probable method of remediation, current laws and regulations and existing technology in determining our environmental liabilities.
Pension and other postretirement defined benefits
— Net pension and postretirement benefits expenses and the related liabilities are determined on an actuarial basis. These plan expenses and obligations are dependent on management’s assumptions developed in consultation with our actuaries. We review these actuarial assumptions at least annually and make modifications when appropriate. With the input of independent actuaries and other relevant sources, we believe that the assumptions used are reasonable; however, changes in these assumptions, or experience different from that assumed, could impact our financial position, results of operations or cash flows.
Postemployment benefits
— Costs to provide postemployment benefits to employees are accounted for on an accrual basis. Obligations that do not accumulate or vest are recorded when payment is probable and the amount can be reasonably estimated. For those obligations that accumulate or vest and the amount can be reasonably estimated, expense and the related liability are recorded as service is rendered.
Equity-based compensation
— We measure compensation cost arising from the grant of share-based awards to employees at fair value. We recognize such costs in income over the period during which the requisite service is provided, usually the vesting period. The grant date fair value is estimated using valuation techniques that require the input of management estimates and assumptions.
Revenue recognition
— Sales are recognized when products are shipped and risk of loss has transferred to the customer. We accrue for warranty costs, sales returns and other allowances based on experience and other relevant factors when sales are recognized. Adjustments are made as new information becomes available. Shipping and handling fees billed to customers are included in sales, while costs of shipping and handling are included in cost of sales. Taxes collected from customers are excluded from revenues and credited directly to obligations to the appropriate governmental agencies.
Foreign currency translation
— The financial statements of subsidiaries and equity affiliates outside the U.S. located in non-highly inflationary economies are measured using the currency of the primary economic environment in which they operate as the functional currency, which typically is the local currency. Transaction gains and losses resulting from translating assets and liabilities of these entities into the functional currency are included in other income (expense), net or in equity in earnings of affiliates. When translating into U.S. dollars, income and expense items are translated at average monthly rates of exchange, while assets and liabilities are translated at the rates of exchange at the balance sheet date. Translation adjustments resulting from translating the functional currency into U.S. dollars are deferred and included as a component of AOCI in stockholders’
54
equity. For operations whose functional currency is the U.S. dollar, nonmonetary assets are translated into U.S. dollars at historical exchange rates and monetary assets are translated at current exchange rates.
Income taxes
— In the ordinary course of business there is inherent uncertainty in quantifying our income tax positions. We assess our income tax positions and record tax assets or liabilities for all years subject to examination based upon management’s evaluation of the facts and circumstances and information available at the reporting dates. For those tax positions where it is more likely than not that a tax benefit will be sustained, we have recorded the largest amount of tax benefit with a greater than
50%
likelihood of being realized upon ultimate settlement with a taxing authority that has full knowledge of all relevant information. For those income tax positions where it is not more likely than not that a tax benefit will be sustained, no tax benefit has been recognized in the financial statements. Where applicable, the related interest cost has also been recognized as a component of the income tax provision.
Research and development
— Research and development costs include expenditures for research activities relating to product development and improvement. Salaries, fringes and occupancy costs, including building, utility and overhead costs, comprise the vast majority of these expenses and are expensed as incurred. Research and development expenses were
$102
,
$81
and
$75
in
2017
,
2016
and
2015
.
Recently adopted accounting pronouncements
In October 2016, the Financial Accounting Standards Board (FASB) issued
Accounting Standard Update (ASU) 2016-16, Income Taxes – Intra-Entity Transfers of Assets Other Than Inventory,
guidance that simplifies the accounting for the income tax consequences of intra-entity transfers of assets other than inventory. GAAP had prohibited the recognition in earnings of current and deferred income taxes for an intra-entity transfer until the asset was sold to an outside party or recovered through use. This amendment simplifies the accounting by requiring entities to recognize the income tax consequences of an intra-entity transfer of an asset other than inventory when the transfer occurs. The new guidance, which requires modified retrospective application, becomes effective January 1, 2018 with early adoption permitted in 2017 prior to the issuance of interim financial statements. We adopted this guidance effective January 1, 2017. The adoption of the new guidance resulted in a decrease in other current assets of
$10
, a decrease in other noncurrent assets of
$169
and a decrease in retained earnings at January 1, 2017 of
$179
.
We also adopted the following standards during 2017, none of which had a material impact on our financial statements or financial statement disclosures:
|
Standard
|
Effective Date
|
|||
|
2016-07
|
Investments – Equity Method and Joint Ventures – Simplifying the Transition to the Equity Method of Accounting
|
January 1, 2017
|
||
|
2016-06
|
Derivatives and Hedging – Contingent Put and Call Options in Debt Instruments
|
January 1, 2017
|
||
|
2016-05
|
Derivatives and Hedging – Effect of Derivative Contract Novations on Existing Hedge Accounting Relationships
|
January 1, 2017
|
||
|
2015-11
|
Inventory – Simplifying the Measurement of Inventory
|
January 1, 2017
|
||
Recently issued accounting pronouncements
In September 2017, the FASB issued
ASU 2017-13, Amendments to SEC Paragraphs Pursuant to the Staff Announcement at the July 20, 2017 EITF Meeting and Rescission of Prior SEC Staff Announcements and Observer Comments
, guidance that delays the mandatory adoption of ASC 606 and 842 for certain entities, revises the guidance related to performance-based incentive fees in ASC 605 and revises the guidance related to leases in ASC 840 and 842. The revisions to the lease guidance eliminate language specific to certain sale-leaseback arrangements, guarantees of lease residual assets and loans made by lessees to owner-lessors. Also included is an amendment to ASC 842 to retain the guidance in ASC 840 covering the impact of changes in tax rates on investments in leveraged leases. This guidance, which is effective immediately, generally relates to the adoption of ASC 606 and 842 and is not expected to impact our consolidated financial statements.
In August 2017, the FASB issued
ASU 2017-12, Derivatives and Hedging – Targeted Improvements to Accounting for Hedging Activities
, guidance that is intended to improve and simplify various aspects of accounting for hedging activities. The guidance addresses effectiveness testing requirements, income statement presentation and disclosure and hedge accounting qualification criteria. Adoption of this standard is expected to result in a prospective change to the presentation of certain hedging-related gains and losses in our consolidated statement of operations. We also expect adoption to simplify our ongoing
55
effectiveness testing and to reduce the complexity of hedge accounting requirements for new hedging contracts executed after adoption. The new standard is effective January 1, 2019 but early adoption is permitted. We intend to adopt this standard effective January 1, 2018, the impact of which is prospective, as described above. The impact of adoption, including the change in presentation within the consolidated statement of operations, is not expected to be material.
In July 2017, the FASB issued
ASU 2017-11, Earnings Per Share, Distinguishing Liabilities from Equity, Derivatives and Hedging – (Part I) Accounting for Certain Financial Instruments with Down Round Features, (Part II) Replacement of the Indefinite Deferral for Mandatorily Redeemable Financial Instruments of Certain Nonpublic Entities and Certain Mandatorily Redeemable Noncontrolling Interests with a Scope Exception
. This guidance is intended to reduce the complexity associated with accounting for certain financial instruments with characteristics of liabilities and equity. Specifically, a down round feature would no longer cause a freestanding equity-linked financial instrument (or an embedded conversion option) to be considered "not indexed to an entity's own stock" and therefore accounted for as a derivative liability at fair value with changes in fair value recognized in current earnings. Down round features are most often found in warrants and conversion options embedded in debt or preferred equity instruments. In addition, the guidance re-characterized the indefinite deferral of certain provisions on distinguishing liabilities from equity to a scope exception with no accounting effect. This guidance becomes effective January 1, 2019. Early adoption is permitted. We do not presently issue any equity-linked financial instruments and therefore this guidance has no impact on our consolidated financial statements.
In May 2017, the FASB issued
ASU 2017-09, Stock Compensation – Scope of Modification Accounting
, guidance that clarifies that all changes to share-based payment awards are not necessarily accounted for as a modification. Under the new guidance, modification accounting is required only if the fair value, the vesting conditions, or the classification of the award changes as a result of the change in terms or conditions. This guidance is effective prospectively beginning January 1, 2018. Early adoption is permitted. This guidance will apply to any future modifications. We do not expect this guidance to have a material impact on our consolidated financial statements.
In March 2017, the FASB issued
ASU 2017-07, Retirement Benefits – Improving the Presentation of Net Periodic Pension Cost and Net Periodic Postretirement Benefit Cost,
guidance that requires entities to present the service cost component of net periodic pension cost and net periodic postretirement benefit cost in the income statement line items where they report compensation cost. Entities will present all other components of net benefit cost outside operating income, if this subtotal is presented. The rules related to the timing of when costs are recognized or how they are measured have not changed. This amendment only impacts where those costs are reflected within the income statement. In addition, only the service cost component will be eligible for capitalization in inventory and other assets. This guidance becomes effective January 1, 2018. Early adoption is permitted. Upon adoption, we expect to classify the non-service cost components of net periodic pension expense in other income (expense), net.
In January 2017, the FASB issued
ASU 2017-04, Goodwill – Simplifying the Test for Goodwill Impairment,
guidance that simplifies how an entity is required to test goodwill for impairment by eliminating Step 2 of the goodwill impairment test. The new guidance quantifies goodwill impairment as the amount by which the carrying amount of a reporting unit, including goodwill, exceeds its fair value, with the impairment loss limited to the total amount of goodwill allocated to that reporting unit. This guidance becomes effective for us January 1, 2020 and will be applied on a prospective basis. Early adoption is permitted for impairment tests performed after January 1, 2017. We do not expect the adoption of this guidance to impact our consolidated financial statements.
In January 2017, the FASB issued
ASU 2017-01, Business Combinations – Clarifying the Definition of a Business,
guidance that revises the definition of a business. The definition of a business affects many areas of accounting, including acquisitions, disposals, goodwill impairment and consolidation. When substantially all of the fair value of gross assets acquired is concentrated in a single asset (or a group of similar assets), the asset acquired would not represent a business. To be considered a business, an acquisition would have to include an input and a substantive process that together significantly contribute to the ability to create outputs. The new guidance provides a framework to evaluate when an input and a substantive process are present. This guidance becomes effective January 1, 2018. Early adoption is permitted.
In November 2016, the FASB released
ASU 2016-18, Statement of Cash Flows – Restricted Cash,
guidance that addresses the diversity in practice in the classification and presentation of changes in restricted cash on the statement of cash flows. Amounts generally described as restricted cash and restricted cash equivalents should be included with cash and cash equivalents when reconciling the beginning-of-period and end-of-period total amounts shown on the statement of cash flows. This guidance becomes effective January 1, 2018 and must be applied on a retrospective basis. This guidance will result in a change in presentation of our consolidated statement of cash flows.
56
In August 2016, the FASB released
ASU 2016-15, Statement of Cash Flows – Classification of Certain Cash Receipts and Cash Payments,
guidance that is intended to reduce diversity in practice in how certain cash receipts and cash payments are classified in the statement of cash flows. This guidance becomes effective January 1, 2018 and must be applied on a retrospective basis. This guidance is not expected to have a material impact on our consolidated statement of cash flows.
In June 2016, the FASB issued
ASU 2016-13, Credit Losses – Measurement of Credit Losses on Financial Instruments,
new guidance for the accounting for credit losses on certain financial instruments. This guidance introduces a new approach to estimating credit losses on certain types of financial instruments and modifies the impairment model for available-for-sale debt securities. This guidance, which becomes effective January 1, 2020, is not expected to have a material impact on our consolidated financial statements.
In February 2016, the FASB issued
ASU 2016-02, Leases,
its new lease accounting standard. The primary focus of the standard is on the accounting by lessees. This standard requires lessees to recognize a right-of-use asset and a lease liability for virtually all leases (other than leases that meet the definition of a short-term lease) on the balance sheet. The recognition, measurement and presentation of expenses and cash flows arising from a lease by a lessee have not significantly changed from current GAAP. Operating leases will result in straight-line expense while finance leases will result in a front-loaded expense pattern in the income statement. Quantitative and qualitative disclosures are required to provide insight into the extent of revenue and expense recognized and expected to be recognized from leasing arrangements. Approximately three-fourths of our global lease portfolio represents leases of real estate, including manufacturing, assembly and office facilities, while the remainder represents leases of personal property, including manufacturing, material handling and IT equipment. Many factors will impact the ultimate measurement of the lease obligation to be recognized upon adoption, including our assessment of the likelihood of renewal of leases that provide such an option. We continue to evaluate the impact this guidance will have on our consolidated financial statements. This guidance becomes effective January 1, 2019 with early adoption permitted.
In January 2016, the FASB issued
ASU 2016-01, Financial Instruments – Recognition and Measurement of Financial Assets and Financial Liabilities,
an amendment that addresses the recognition, measurement, presentation and disclosure of certain financial instruments. Investments in equity securities currently classified as available-for-sale and carried at fair value, with changes in fair value reported in OCI, will be carried at fair value determined on an exit price notion and changes in fair value will be reported in net income. The new guidance also affects the assessment of deferred tax assets related to available-for-sale securities, the accounting for liabilities for which the fair value option is elected and the disclosures of financial assets and financial liabilities in the notes to the financial statements. This guidance, which becomes effective January 1, 2018, is not expected to have a material impact on our consolidated financial statements.
In May 2014, the FASB issued
ASU 2014-09, Revenue - Revenue from Contracts with Customers,
guidance that requires companies to recognize revenue in a manner that depicts the transfer of promised goods or services to customers in amounts that reflect the consideration a company expects to be entitled to in exchange for those goods or services. The new guidance will also require new disclosures about the nature, amount, timing and uncertainty of revenue and cash flows arising from contracts with customers. This guidance will be effective January 1, 2018 for Dana. We intend to adopt this standard using the modified retrospective method, recognizing the cumulative effect of initially applying the standard as an adjustment to opening retained earnings. We have assessed our products in combination with the provisions of our current customer contracts to evaluate whether any contractual provisions provide us with an enforceable right to payment that may require us to recognize revenue prior to the product being shipped to the customer. We have also assessed whether the pricing provisions contained in certain of our customer contracts may provide the customer with a material right. Based on our assessment, we do not expect the new guidance to have a material impact and believe the adoption date financial statement impact will be limited to balance sheet reclassifications required to establish the contract asset, contract liability and refund liability concepts provided for in the new guidance. While we are still assessing the enhanced disclosure requirements of the new guidance, we have determined that we will further disaggregate our revenue, presenting revenue by geographic region for each of our operating segments.
USM – Warren
— On March 1, 2017, we acquired certain assets and liabilities relating to the Warren, Michigan production unit of U.S. Manufacturing Corporation (USM). The production unit acquired is in the business of manufacturing axle housings, extruded tubular products and machined components for the automotive industry. The acquisition will increase Dana's revenue from light and commercial vehicle manufacturers and will vertically integrate a significant element of Dana's supply chain. It also provides Dana with new lightweight product and process technologies.
USM contributed certain assets and liabilities relating to its Warren, Michigan production unit to Warren Manufacturing LLC (USM – Warren), a newly created legal entity, and Dana acquired all of the company units of USM – Warren. The company units were acquired by Dana free and clear of any liens. We paid
$104
at closing, including
$25
to effectively settle
57
trade payable obligations originating from product purchases Dana made from USM prior to the acquisition, and received
$1
in the third quarter for purchase price adjustments determined under the terms of the agreement.
The acquisition has been accounted for as a business combination. The purchase consideration and the related allocation to the acquisition date fair values of the assets acquired and liabilities assumed are presented in the following table:
|
Total purchase consideration
|
$
|
78
|
|
|
|
Accounts receivable - Trade
|
17
|
|
||
|
Accounts receivable - Other
|
3
|
|
||
|
Inventories
|
9
|
|
||
|
Goodwill
|
3
|
|
||
|
Intangibles
|
33
|
|
||
|
Property, plant and equipment
|
50
|
|
||
|
Accounts payable
|
(34
|
)
|
||
|
Accrued payroll and employee benefits
|
(2
|
)
|
||
|
Other accrued liabilities
|
(1
|
)
|
||
|
Total purchase consideration allocation
|
$
|
78
|
|
|
Goodwill recognized in this transaction is primarily attributable to synergies expected to arise after the acquisition and the assembled workforce and is deductible for tax purposes. Intangibles includes
$30
allocated to customer relationships and
$3
allocated to developed technology. We used the relief from royalty method, an income approach, to value developed technology. We used the multi-period excess earnings method, an income approach, to value customer relationships. We used a replacement cost method to value fixed assets. The developed technology and customer relationship intangible assets are being amortized on a straight-line basis over
eighteen
and
eleven
years, respectively, and property, plant and equipment is being depreciated on a straight-line basis over useful lives ranging from
one
to
seventeen
years.
The results of operations of the business are reported in our Light Vehicle operating segment from the date of acquisition. We incurred transaction related expenses to complete the acquisition in 2017 totaling
$5
, which were charged to other income (expense), net. The pro forma effects of this acquisition would not materially impact our reported results for any period presented, and as a result no pro forma financial statements are presented. During 2017, the business contributed sales of
$96
.
BFP and BPT
—
On February 1, 2017, we acquired
80%
ownership interests in Brevini Fluid Power S.p.A. (BFP) and Brevini Power Transmission S.p.A. (BPT) from Brevini Group S.p.A. (Brevini). The acquisition expands our Off-Highway operating segment product portfolio to include technologies for tracked vehicles, doubling our addressable market for off-highway driveline systems and establishing Dana as the only off-highway solutions provider that can manage the power to both move the equipment and perform its critical work functions. This acquisition also brings a platform of technologies that can be leveraged in our light and commercial-vehicle end markets, helping to accelerate our hybridization and electrification initiatives.
We paid
$181
at closing, using cash on hand, and refinanced a significant portion of the debt assumed in the transaction during the first half of 2017. In December 2017, a purchase price reduction of
$9
was agreed under the sale and purchase agreement provisions for determination of the net indebtedness and net working capital levels of BFP and BPT as of the closing date. The terms of the agreement provide Dana the right to call half of Brevini’s noncontrolling interests in BFP and BPT, and Brevini the right to put half of its noncontrolling interests in BFP and BPT to Dana, assuming Dana does not exercise its call right, after the 2017 BFP and BPT financial statements have been approved by the board of directors. Further, Dana has the right to call Brevini’s remaining noncontrolling interests in BFP and BPT, and Brevini the right to put its remaining noncontrolling interests in BFP and BPT to Dana, assuming Dana does not exercise its call right, after the 2019 BFP and BPT financial statements have been approved by the board of directors. The call and put prices are based on the amount Dana paid to acquire its initial
80%
interest in BFP and BPT subject to adjustment based on the actual EBITDA and free cash flows, as defined in the agreement, of BFP and BPT. In connection with the acquisition of BFP and BPT, Dana agreed to purchase certain real estate currently being leased by BPT from a Brevini affiliate for
€25
by November 1, 2017. The real estate purchase did not occur by November 1, 2017 due to document transfer requirements not having been fully satisfied. Receipt of the purchase price adjustment will occur concurrent with the completion of the real estate purchase during the first quarter of 2018. The purchase consideration and the related allocation to the acquisition date fair values of the assets acquired and liabilities assumed are presented in the following table:
58
|
Total purchase consideration
|
$
|
172
|
|
|
|
Cash and cash equivalents
|
$
|
75
|
|
|
|
Accounts receivable - Trade
|
78
|
|
||
|
Accounts receivable - Other
|
18
|
|
||
|
Inventories
|
134
|
|
||
|
Other current assets
|
9
|
|
||
|
Goodwill
|
20
|
|
||
|
Intangibles
|
41
|
|
||
|
Deferred tax assets
|
3
|
|
||
|
Other noncurrent assets
|
4
|
|
||
|
Property, plant and equipment
|
145
|
|
||
|
Notes payable, including current portion of long-term debt
|
(130
|
)
|
||
|
Accounts payable
|
(51
|
)
|
||
|
Accrued payroll and employee benefits
|
(14
|
)
|
||
|
Taxes on income
|
(1
|
)
|
||
|
Other accrued liabilities
|
(19
|
)
|
||
|
Long-term debt
|
(51
|
)
|
||
|
Pension and postretirement obligations
|
(11
|
)
|
||
|
Other noncurrent liabilities
|
(22
|
)
|
||
|
Redeemable noncontrolling interests
|
(44
|
)
|
||
|
Noncontrolling interests
|
(12
|
)
|
||
|
Total purchase consideration allocation
|
$
|
172
|
|
|
The purchase consideration and fair value of the assets acquired and liabilities assumed are preliminary and could be revised as a result of adjustments made to the purchase price, additional information obtained regarding liabilities assumed and revisions of provisional estimates of fair values, including but not limited to, the completion of independent appraisals and valuations related to property, plant and equipment and intangibles.
Goodwill recognized in this transaction is primarily attributable to synergies expected to arise after the acquisition and the assembled workforce, is not deductible for tax purposes and will be assigned to and evaluated for impairment at the operating segment level. Intangibles includes
$29
allocated to customer relationships and
$12
allocated to trademarks and trade names. We used the multi-period excess earnings method, an income approach, to value the customer relationships. We used the relief from royalty method, an income approach, to value trademarks and trade names. We used a replacement cost method to value fixed assets. We used a discounted cash flow approach to value the redeemable noncontrolling interests, inclusive of the put and call provisions. We used both discounted cash flow and cost approaches to value the noncontrolling interests. The customer relationships and trademarks and trade names intangible assets are being amortized on a straight-line basis over
seventeen
years, and property, plant and equipment is being depreciated on a straight-line basis over useful lives ranging from
three
to
thirty
years.
The results of operations of the businesses are reported in our Off-Highway operating segment from the date of acquisition. Transaction related expenses in 2017 associated with completion of the acquisition totaling
$7
were charged to other income (expense), net. The pro forma effects of this acquisition would not materially impact our reported results for any period presented, and as a result no pro forma financial statements are presented. During 2017, the businesses contributed sales of
$401
. See Note 5 for more information.
SIFCO
—
On December 23, 2016, we acquired strategic assets of SIFCO S.A.'s (SIFCO) commercial vehicle steer axle systems and related forged components businesses. The acquisition enables us to enhance our vertically integrated supply chain, which will further improve our cost structure and customer satisfaction by leveraging SIFCO's extensive experience and knowledge of sophisticated forged components. In addition to strengthening our position as a central source for products that use forged and machined parts throughout the region, this acquisition enables us to better accommodate the local content requirements of our customers, which reduces their import and other region-specific costs. See Note 3 for additional information on Dana's prior relationship with SIFCO.
SIFCO contributed the strategic assets to SJT Forjaria Ltda., a newly created legal entity, and Dana acquired all of the issued and outstanding quotas of SJT Forjaria Ltda. The strategic assets were acquired by Dana free and clear of any liens,
59
claims or encumbrances. The acquisition was funded using cash on hand and has been accounted for as a business combination. Dana paid
$60
at closing and paid
$3
of previously deferred consideration during the fourth quarter of 2017. On December 19, 2017, Dana and SIFCO reached an agreement providing for Dana to retain the remaining
$7
of deferred consideration to satisfy indemnification claims as they arise. Once all indemnification claims have been satisfied, any remaining deferred consideration will be paid to SIFCO. The purchase consideration and the related allocation to the acquisition date fair values of the assets acquired are presented in the following table:
|
Total purchase consideration
|
$
|
70
|
|
|
|
Accounts receivable - Trade
|
$
|
1
|
|
|
|
Accounts receivable - Other
|
1
|
|
||
|
Inventories
|
10
|
|
||
|
Goodwill
|
7
|
|
||
|
Intangibles
|
3
|
|
||
|
Property, plant and equipment
|
59
|
|
||
|
Accounts payable
|
(2
|
)
|
||
|
Accrued payroll and employee benefits
|
(9
|
)
|
||
|
Total purchase consideration allocation
|
$
|
70
|
|
|
Goodwill recognized in this transaction is primarily attributable to synergies expected to arise after the acquisition and the assembled workforce, and is deductible for tax purposes. Intangibles includes
$2
allocated to developed technology and
$1
allocated to trade names. We used the relief from royalty method, an income approach, to value developed technology and trade names. We used a replacement cost method to value fixed assets. The developed technology and trade name intangible assets are being amortized on a straight-line basis over
seven
and
five
years, respectively, and property, plant and equipment is being depreciated on a straight-line basis over useful lives ranging from
three
to
ten
years.
The results of operations of the business are reported in our Commercial Vehicle operating segment from the date of acquisition. As a result of the acquisition, we incurred transaction related expenses totaling
$5
, which were charged to other income (expense), net. The pro forma effects of this acquisition would not materially impact our reported results for any period presented, and as a result no pro forma financial statements were presented.
Magnum
— On January 29, 2016, we acquired the aftermarket distribution business of Magnum
®
Gaskets (Magnum), a U.S.-based supplier of gaskets and sealing products for automotive and commercial-vehicle applications, for a cash payment of
$18
. Assets acquired included trademarks and trade names, customer relationships and goodwill. The results of operations of Magnum are reported within our Power Technologies operating segment. We acquired Magnum using cash on hand. The pro forma effects of this acquisition would not materially impact our reported results for any period presented, and as a result no pro forma financial statements were presented.
Disposal group held for sale
— In December 2017, we entered into an agreement to divest our Brazil suspension components business (the disposal group) for
no
consideration to an unaffiliated company. The results of operations of the Brazil suspension components business are reported within our Commercial Vehicle operating segment. To effectuate the sale, Dana is obligated to contribute
$10
of additional cash to the business prior to closing. Completion of the sale is expected in the first quarter of 2018 upon receipt of Brazilian antitrust approval. The disposal group was classified as held for sale at December 31, 2017. We recognized a
$27
loss to adjust the carrying value of the net assets to fair value and to recognize the liability for the additional cash required to be contributed to the business prior to closing. The assets and liabilities of our Brazil suspension components business are presented as held for sale on our balance sheet as of December 31, 2017. The carrying amounts of the major classes of assets and liabilities of our Brazil suspension components business are as follows:
60
|
December 31,
2017
|
|||
|
Accounts receivable - Trade
|
$
|
3
|
|
|
Inventories
|
4
|
|
|
|
Current assets classified as held for sale
|
$
|
7
|
|
|
Accounts payable
|
$
|
3
|
|
|
Accrued payroll and employee benefits
|
1
|
|
|
|
Other accrued liabilities
|
1
|
|
|
|
Current liabilities classified as held for sale
|
$
|
5
|
|
|
Other noncurrent liabilities
|
$
|
2
|
|
|
Noncurrent liabilities classified as held for sale
|
$
|
2
|
|
Divestiture of Dana Companies
—
On December 30, 2016, we completed the divestiture of Dana Companies, LLC (DCLLC), a consolidated wholly-owned limited liability company that was established as part of our reorganization in 2008 to hold and manage personal injury asbestos claims retained by the reorganized Dana Corporation which was merged into DCLLC. DCLLC had net assets of
$165
at the time of sale including cash and cash equivalents, marketable securities and rights to insurance coverage in place to satisfy a significant portion of its liabilities. We received cash proceeds of
$88
–
$29
net of cash divested – with
$3
retained by the purchaser subject to the satisfaction of certain future conditions. We recognized a pre-tax loss of
$77
in 2016 upon completion of the transaction. During the second quarter of 2017 the conditions associated with the retained purchase price were satisfied. Dana received the remaining proceeds and recognized
$3
of income in other income (expense), net. Following completion of the sale, Dana has
no
obligation with respect to current or future asbestos claims.
Divestiture of Nippon Reinz
— On November 30, 2016, we sold our
53.7%
interest in Nippon Reinz Co. Ltd. (Nippon Reinz) to Nichias Corporation. Dana received net cash proceeds of
$5
and recognized a pre-tax loss of
$3
on the divestiture of Nippon Reinz, inclusive of the
$12
gain on derecognition of the noncontrolling interest. Nippon Reinz had sales of
$42
in 2016 through the transaction date.
Disposal of operations in Venezuela
— In December 2014, we entered into an agreement to divest our Light Vehicle operations in Venezuela (the disposal group) to an unaffiliated company for
no
consideration. Upon classification of the disposal group as held for sale in December 2014, we recognized an
$80
loss to adjust the carrying value of the net assets of our operations in Venezuela to fair value less cost to sell. The assets and liabilities of our operations in Venezuela were presented as held for sale on our balance sheet as of December 31, 2014. Upon completion of the divestiture of the disposal group in January 2015, we recognized a gain of
$5
on the derecognition of the noncontrolling interest in a former Venezuelan subsidiary in other income (expense), net. We also credited OCI attributable to the parent for
$10
and OCI attributable to noncontrolling interests for
$1
to eliminate the unrecognized pension expense recorded in AOCI.
Discontinued operations of Structural Products business
— The sale of substantially all of the assets of our Structural Products business to Metalsa S.A. de C.V. (Metalsa) in 2010 excluded the facility in Longview, Texas and its employees and manufacturing assets related to a significant customer contract. The customer contract was satisfied and operations concluded in August 2012. As a result of the cessation of all operations, activities related to the former Structural Products business have been presented as discontinued operations in the accompanying financial statements. The income reported for 2015 includes insurance recoveries related to previously outstanding claims.
The results of the discontinued operations were as follows:
|
|
2015
|
||
|
Sales
|
$
|
—
|
|
|
Other income, net
|
5
|
|
|
|
Pre-tax income
|
5
|
|
|
|
Income tax expense
|
1
|
|
|
|
Income from discontinued operations
|
$
|
4
|
|
Impairment of long-lived assets
— On February 1, 2011, we entered into an agreement with SIFCO, a leading producer of steer axles and forged components in South America. In return for payment of
$150
to SIFCO, we acquired the distribution rights to SIFCO's commercial vehicle steer axle systems as well as an exclusive long-term supply agreement for key driveline
61
components. During 2014, our Commercial Vehicle operating segment had
$225
of sales attributable to SIFCO supplied axles and parts.
This agreement was accounted for as a business combination for financial reporting purposes. The aggregate fair value of the net assets acquired was allocated primarily to the exclusivity provisions of the supply agreement as a contract-based intangible asset and recorded within our Commercial Vehicle operating segment. Fair value was also allocated to fixed assets and an embedded lease obligation. The intangible asset was being amortized and the fixed assets were being depreciated on a straight-line basis over
ten
years. The embedded lease obligations were being amortized using the effective interest method over the
ten
-year useful lives of the related fixed assets.
On April 22, 2014, SIFCO and affiliated companies filed for judicial reorganization before Bankruptcy Court in São Paulo, Brazil and an ancillary Chapter 15 proceeding before the Bankruptcy Court of the Southern District of New York. The Brazilian bankruptcy case was subsequently moved to the 5th Lower Civil Court in the Judicial District of Jundiai, the location of SIFCO's principal operations. Until the third quarter of 2015, SIFCO complied with the terms of the supply agreement. In August 2015, SIFCO discontinued production of our orders and failed to comply with provisions of the supply agreement. We obtained a judicial injunction requiring that SIFCO release any finished product in their possession that was produced pursuant to the supply agreement, resume production and parts supply pursuant to the terms of the supply agreement and cease communications with our customers regarding direct sale of parts. SIFCO contested the injunction we obtained, without success, and refused to comply with the injunction. Through a judicial seizure order we were successful in obtaining the release of the finished product.
Based on SIFCO's refusal to comply with the terms of the supply agreement and the court injunctions as noted above, we believed that the carrying amount of the contract-based intangible asset was not recoverable and therefore tested the associated asset group for impairment as of September 30, 2015 under ASC 360-10. Based upon management's conclusion that there were no future economic benefits and related cash flows associated with the long-lived assets of this asset group, which is comprised predominantly of the intangible asset, management concluded that the fair value of the asset group was de minimis and accordingly recorded a full impairment charge of
$36
in the third quarter of 2015.
On October 27, 2015, we entered into an interim agreement with SIFCO under which they continued to supply product while pursuing various mutually satisfactory longer-term alternatives. During 2015, in addition to the above mentioned impairment charge, we incurred approximately
$8
of increased costs in connection with maintaining product supply from SIFCO. On December 23, 2016, we acquired strategic assets of SIFCO's commercial vehicle steer axle systems and related forged components businesses. See Note 2 for additional information.
Goodwill
—The change in the carrying amount of goodwill in 2017 is primarily due to the acquisitions of USM – Warren and
80%
interests in BFP and BPT and currency fluctuation. The change in the carrying amount of goodwill in 2016 is due to the acquisitions of SJT Forjaria Ltda. and the aftermarket distribution business of Magnum and currency fluctuation. See Note 2 for additional information. Based on our October 31, 2017 impairment assessment, the fair value of our Off-Highway segment is significantly higher than its carrying value, including goodwill. We do not believe that any significant component of our goodwill is at risk of being impaired.
Changes in the carrying amount of goodwill by segment
—
|
Light Vehicle
|
Commercial Vehicle
|
Off-Highway
|
Power Technologies
|
Total
|
|||||||||||||||
|
Balance, December 31, 2015
|
$
|
—
|
|
$
|
—
|
|
$
|
80
|
|
$
|
—
|
|
$
|
80
|
|
||||
|
Acquisitions
|
6
|
|
6
|
|
12
|
|
|||||||||||||
|
Currency impact
|
(2
|
)
|
(2
|
)
|
|||||||||||||||
|
Balance, December 31, 2016
|
—
|
|
6
|
|
78
|
|
6
|
|
90
|
|
|||||||||
|
Acquisitions
|
3
|
|
20
|
|
|
23
|
|
||||||||||||
|
Purchase accounting adjustments
|
|
1
|
|
|
|
1
|
|
||||||||||||
|
Currency impact
|
1
|
|
12
|
|
13
|
|
|||||||||||||
|
Balance, December 31, 2017
|
$
|
3
|
|
$
|
8
|
|
$
|
110
|
|
$
|
6
|
|
$
|
127
|
|
||||
Non-amortizable intangible assets
— Our non-amortizable intangible assets include trademarks, trade names and intangible assets used in research and development activities. Trademarks and trade names consist of the Dana® and Spicer® trademarks
62
and trade names utilized in our Commercial Vehicle and Off-Highway segments. We value trademarks and trade names using a relief from royalty method which is based on revenue streams.
No
impairment was recorded during the three years ended
December 31, 2017
in connection with the required annual assessment. Intangible assets used in research and development activities relate to our strategic alliance formed with Fallbrook Technologies Inc. in September 2012. We use the multi-period excess earnings method, an income approach, to value the intangible assets used in research and development activities.
No
impairment has been recorded during the three years ended
December 31, 2017
in connection with the required annual assessment.
Amortizable intangible assets
— Our amortizable intangible assets include core technology, customer relationships and a portion of our trademarks and trade names. Trademarks and trade names includes the Brevini® trademark and trade name utilized in our Off-Highway segment. Core technology includes the proprietary know-how and expertise that is inherent in our products and manufacturing processes. Customer relationships include the established relationships with our customers and the related ability of these customers to continue to generate future recurring revenue and income.
These assets are tested for impairment whenever events or changes in circumstances indicate that their carrying amounts may not be recoverable. We group the assets and liabilities at the lowest level for which identifiable cash flows are largely independent of the cash flows of other assets and liabilities and evaluate the asset group against the undiscounted future cash flows. We use our internal forecasts, which we update quarterly, to develop our cash flow projections. These forecasts are based on our knowledge of our customers’ production forecasts, our assessment of market growth rates, net new business, material and labor cost estimates, cost recovery agreements with customers and our estimate of savings expected from our restructuring activities. The most likely factors that would significantly impact our forecasts are changes in customer production levels and loss of significant portions of our business. Our valuation is applied over the life of the primary assets within the asset groups. If the undiscounted cash flows do not indicate that the carrying amount of the asset group is recoverable, an impairment charge is recorded if the carrying amount of the asset group exceeds its fair value based on discounted cash flow analyses or appraisals.
There were
no
impairments for the years ended December 31, 2017 and
December 31, 2016
. During the third quarter of 2015, we impaired the customer relationships intangible asset associated with our exclusive long-term supply agreement with SIFCO. See
Note 3
for additional information.
Components of other intangible assets
—
|
|
December 31, 2017
|
December 31, 2016
|
|||||||||||||||||||||||
|
Weighted
Average
Useful Life
(years)
|
Gross
Carrying
Amount
|
Accumulated
Impairment and
Amortization
|
Net
Carrying
Amount
|
Gross
Carrying
Amount
|
Accumulated
Impairment and
Amortization
|
Net
Carrying
Amount
|
|||||||||||||||||||
|
Amortizable intangible assets
|
|
|
|
|
|
|
|
|
|
|
|
|
|
||||||||||||
|
Core technology
|
7
|
$
|
95
|
|
$
|
(88
|
)
|
$
|
7
|
|
$
|
88
|
|
$
|
(83
|
)
|
$
|
5
|
|
||||||
|
Trademarks and trade names
|
16
|
17
|
|
(2
|
)
|
15
|
|
6
|
|
(2
|
)
|
4
|
|
||||||||||||
|
Customer relationships
|
8
|
470
|
|
(403
|
)
|
67
|
|
389
|
|
(374
|
)
|
15
|
|
||||||||||||
|
Non-amortizable intangible assets
|
|||||||||||||||||||||||||
|
Trademarks and trade names
|
65
|
|
65
|
|
65
|
|
65
|
|
|||||||||||||||||
|
Used in research and development activities
|
20
|
|
20
|
|
20
|
|
20
|
|
|||||||||||||||||
|
|
|
$
|
667
|
|
$
|
(493
|
)
|
$
|
174
|
|
$
|
568
|
|
$
|
(459
|
)
|
$
|
109
|
|
||||||
The net carrying amounts of intangible assets, other than goodwill, attributable to each of our operating segments at
December 31, 2017
were as follows: Light Vehicle Driveline (Light Vehicle) –
$52
, Commercial Vehicle –
$34
, Off-Highway –
$78
and Power Technologies –
$10
.
63
Amortization expense related to amortizable intangible assets
—
|
|
2017
|
2016
|
2015
|
||||||||
|
Charged to cost of sales
|
$
|
2
|
|
$
|
1
|
|
$
|
2
|
|
||
|
Charged to amortization of intangibles
|
11
|
|
8
|
|
14
|
|
|||||
|
Total amortization
|
$
|
13
|
|
$
|
9
|
|
$
|
16
|
|
||
The following table provides the estimated aggregate pre-tax amortization expense related to intangible assets for each of the next five years based on
December 31, 2017
exchange rates. Actual amounts may differ from these estimates due to such factors as currency translation, customer turnover, impairments, additional intangible asset acquisitions and other events.
|
|
2018
|
2019
|
2020
|
2021
|
2022
|
||||||||||||||
|
Amortization expense
|
$
|
9
|
|
$
|
8
|
|
$
|
7
|
|
$
|
7
|
|
$
|
7
|
|
||||
Our restructuring activities have historically included rationalizing our operating footprint by consolidating facilities, positioning operations in lower cost locations and reducing overhead costs. In recent years, however, in response to lower demand and other market conditions in certain businesses, our focus has primarily been headcount reduction initiatives to reduce operating costs. Restructuring expense includes costs associated with current and previously announced actions and is comprised of contractual and noncontractual separation costs and exit costs, including costs associated with lease continuation obligations and certain operating costs of facilities that we are in the process of closing.
During 2017, we approved additional plans to implement certain headcount reduction initiatives in our Off-Highway business as part of the BFP and BPT acquisition integration, resulting in the recognition of
$14
, primarily for severance and benefits costs, during 2017. Including costs associated with the newly approved actions during 2017 and costs associated with previously announced initiatives, net of the reversal described below, restructuring expense during 2017 was
$14
, including
$8
of severance and benefits costs and
$6
of exit costs. During the fourth quarter of 2017, in response to better-than-expected market recovery in our Off-Highway business in Europe, management re-evaluated the economic conditions of our global Off-Highway business and determined that a portion of the previously approved 2016 restructuring program is no longer economically prudent. This change in facts and circumstances led to the decision to reverse
$8
of previously accrued liabilities.
During 2016, we implemented various headcount reduction initiatives across our businesses, including the first-quarter 2016 announcement of the planned closure of our Commercial Vehicle manufacturing facility in Glasgow, Kentucky. During the second half of 2016, we also approved and began to implement other headcount reduction initiatives, the most significant of which were associated with our Off-Highway business in Europe and our Commercial Vehicle and Light Vehicle businesses in Brazil, in response to continued market weakness in those businesses at that time. Additionally, in conjunction with the SJT Forjaria Ltda. acquisition in December 2016, we approved plans to eliminate certain redundant positions as one of our initial steps toward the integration of the SJT Forjaria Ltda. operations into our Commercial Vehicle business in that region. Including costs associated with these actions and with other previously announced initiatives, total restructuring expense during 2016 was
$36
, including
$33
of severance and benefits costs and
$3
of exit costs.
During 2015, we implemented certain headcount reduction programs, primarily in our Commercial Vehicle business in Brazil in response to lower demand in that region. Including costs associated with these actions and with other previously announced initiatives, total restructuring expense in 2015 was
$15
and included
$12
of severance and benefits costs and
$3
of exit costs.
64
Accrued restructuring costs and activity, including noncurrent portion
—
|
Employee
Termination
Benefits
|
Exit
Costs
|
Total
|
|||||||||
|
Balance at December 31, 2014
|
$
|
12
|
|
$
|
9
|
|
$
|
21
|
|
||
|
Charges to restructuring
|
12
|
|
3
|
|
15
|
|
|||||
|
Cash payments
|
(12
|
)
|
(4
|
)
|
(16
|
)
|
|||||
|
Currency impact
|
(3
|
)
|
(3
|
)
|
|||||||
|
Balance at December 31, 2015
|
9
|
|
8
|
|
17
|
|
|||||
|
Charges to restructuring
|
35
|
|
3
|
|
38
|
|
|||||
|
Adjustments of accruals
|
(2
|
)
|
|
|
(2
|
)
|
|||||
|
Cash payments
|
(10
|
)
|
(5
|
)
|
(15
|
)
|
|||||
|
Balance at December 31, 2016
|
32
|
|
6
|
|
38
|
|
|||||
|
Charges to restructuring
|
16
|
|
6
|
|
22
|
|
|||||
|
Adjustments of accruals
|
(8
|
)
|
(8
|
)
|
|||||||
|
Cash payments
|
(21
|
)
|
(7
|
)
|
(28
|
)
|
|||||
|
Currency impact
|
2
|
|
|
|
2
|
|
|||||
|
Balance at December 31, 2017
|
$
|
21
|
|
$
|
5
|
|
$
|
26
|
|
||
At
December 31, 2017
, accrued employee termination benefits include costs to reduce approximately
300
employees over the next
two
years. The exit costs relate primarily to lease continuation obligations.
Cost to complete
— The following table provides project-to-date and estimated future restructuring expenses for completion of our approved restructuring initiatives for our business segments at
December 31, 2017
.
|
|
Expense Recognized
|
Future
Cost to
Complete
|
|||||||||||||
|
Prior to
2017
|
2017
|
Total
to Date
|
|||||||||||||
|
Light Vehicle
|
$
|
10
|
|
$
|
2
|
|
$
|
12
|
|
$
|
—
|
|
|||
|
Commercial Vehicle
|
41
|
|
4
|
|
45
|
|
12
|
|
|||||||
|
Off-Highway
|
6
|
|
7
|
|
13
|
|
|||||||||
|
Corporate
|
1
|
|
1
|
|
|||||||||||
|
Total
|
$
|
57
|
|
$
|
14
|
|
$
|
71
|
|
$
|
12
|
|
|||
The future cost to complete includes estimated separation costs, primarily those associated with one-time benefit programs, and exit costs through 2021, including lease continuation costs, equipment transfers and other costs which are required to be recognized as closures are finalized or as incurred during the closure.
Inventory components at December 31
—
|
|
2017
|
2016
|
|||||
|
Raw materials
|
$
|
442
|
|
$
|
321
|
|
|
|
Work in process and finished goods
|
580
|
|
368
|
|
|||
|
Inventory reserves
|
(53
|
)
|
(51
|
)
|
|||
|
Total
|
$
|
969
|
|
$
|
638
|
|
|
65
Supplemental balance sheet information at December 31
—
|
|
2017
|
2016
|
|||||
|
Other current assets:
|
|
|
|
|
|||
|
Prepaid expenses
|
$
|
83
|
|
$
|
67
|
|
|
|
Other
|
14
|
|
11
|
|
|||
|
Total
|
$
|
97
|
|
$
|
78
|
|
|
|
Other noncurrent assets:
|
|
|
|
|
|||
|
Prepaid income taxes
|
$
|
—
|
|
$
|
168
|
|
|
|
Prepaid expenses
|
17
|
|
11
|
|
|||
|
Deferred financing costs
|
5
|
|
5
|
|
|||
|
Pension assets, net of related obligations
|
3
|
|
2
|
|
|||
|
Other
|
46
|
|
40
|
|
|||
|
Total
|
$
|
71
|
|
$
|
226
|
|
|
|
Property, plant and equipment, net:
|
|
|
|
|
|||
|
Land and improvements to land
|
$
|
210
|
|
$
|
172
|
|
|
|
Buildings and building fixtures
|
518
|
|
435
|
|
|||
|
Machinery and equipment
|
2,635
|
|
2,108
|
|
|||
|
Total cost
|
3,363
|
|
2,715
|
|
|||
|
Less: accumulated depreciation
|
(1,556
|
)
|
(1,302
|
)
|
|||
|
Net
|
$
|
1,807
|
|
$
|
1,413
|
|
|
|
Other accrued liabilities (current):
|
|||||||
|
Non-income taxes payable
|
$
|
43
|
|
$
|
30
|
|
|
|
Accrued interest
|
14
|
|
17
|
|
|||
|
Warranty reserves
|
29
|
|
35
|
|
|||
|
Deferred income
|
12
|
|
6
|
|
|||
|
Work place injury costs
|
6
|
|
5
|
|
|||
|
Restructuring costs
|
22
|
|
29
|
|
|||
|
Payable under forward contracts
|
9
|
|
8
|
|
|||
|
Environmental
|
3
|
|
3
|
|
|||
|
Other expense accruals
|
82
|
|
68
|
|
|||
|
Total
|
$
|
220
|
|
$
|
201
|
|
|
|
Other noncurrent liabilities:
|
|||||||
|
Income tax liability
|
$
|
48
|
|
$
|
57
|
|
|
|
Interest rate swap market valuation
|
177
|
|
12
|
|
|||
|
Deferred income tax liability
|
59
|
|
37
|
|
|||
|
Work place injury costs
|
22
|
|
26
|
|
|||
|
Warranty reserves
|
47
|
|
31
|
|
|||
|
Restructuring costs
|
4
|
|
9
|
|
|||
|
Other noncurrent liabilities
|
56
|
|
33
|
|
|||
|
Total
|
$
|
413
|
|
$
|
205
|
|
|
66
Supplemental cash flow information
—
|
2017
|
2016
|
2015
|
|||||||||
|
Change in working capital:
|
|||||||||||
|
Change in accounts receivable
|
$
|
(141
|
)
|
$
|
(86
|
)
|
$
|
—
|
|
||
|
Change in inventories
|
(146
|
)
|
(13
|
)
|
(28
|
)
|
|||||
|
Change in accounts payable
|
234
|
|
70
|
|
(22
|
)
|
|||||
|
Change in accrued payroll and employee benefits
|
53
|
|
5
|
|
3
|
|
|||||
|
Change in accrued income taxes
|
26
|
|
(13
|
)
|
(1
|
)
|
|||||
|
Change in other current assets and liabilities
|
(34
|
)
|
(14
|
)
|
7
|
|
|||||
|
Net
|
$
|
(8
|
)
|
$
|
(51
|
)
|
$
|
(41
|
)
|
||
|
Cash paid during the period for:
|
|
|
|
|
|
|
|||||
|
Interest
|
$
|
104
|
|
$
|
111
|
|
$
|
96
|
|
||
|
Income taxes
|
87
|
|
89
|
|
90
|
|
|||||
|
Non-cash investing and financing activities:
|
|
|
|
|
|
|
|||||
|
Purchases of property, plant and equipment held in accounts payable
|
$
|
86
|
|
$
|
113
|
|
$
|
55
|
|
||
|
Stock compensation plans
|
17
|
|
14
|
|
15
|
|
|||||
Preferred Stock
We are authorized to issue
50,000,000
of Dana preferred stock, par value
$0.01
per share. There were
no
preferred shares outstanding at December 31, 2017 or 2016.
Common Stock
We are authorized to issue
450,000,000
shares of Dana common stock, par value
$0.01
per share. At
December 31, 2017
, there were
151,985,067
shares of our common stock issued and
144,984,050
shares outstanding, net of
7,001,017
in treasury shares. Treasury shares include those shares withheld at cost to satisfy tax obligations from stock awards issued under our stock compensation plan in addition to share repurchases noted below.
Our Board of Directors declared a quarterly cash dividend of six cents per share of common stock in each quarter of
2017
. Aggregate
2017
declared and paid dividends total
$35
. Dividends accrue on restricted stock units (RSUs) granted under our stock compensation program and will be paid in cash or additional units when the underlying units vest.
Treasury stock
— In December 2015, we retired
18,100,000
shares of treasury stock. The
$346
excess of the cost of the treasury stock over the common stock par value, based on the weighted-average pool price of our treasury shares at the date of retirement, was charged to additional paid-in capital.
Share repurchase program
— Our Board of Directors approved a common stock share repurchase program up to
$1,700
on January 11, 2016. The program expired on December 31, 2017. In December 2017, our Board of Directors approved a new common stock share repurchase program up to
$100
, expiring on December 31, 2019. The stock repurchases are subject to prevailing market conditions and other management considerations.
67
Changes in each component of AOCI of the parent
—
|
|
Parent Company Stockholders
|
||||||||||||||||||
|
Foreign
Currency
Translation
|
Hedging
|
Investments
|
Defined
Benefit
Plans
|
Accumulated
Other
Comprehensive
Loss
|
|||||||||||||||
|
Balance, December 31, 2014
|
$
|
(427
|
)
|
$
|
(9
|
)
|
$
|
5
|
|
$
|
(566
|
)
|
$
|
(997
|
)
|
||||
|
Other comprehensive income (loss):
|
|
|
|
|
|
|
|
|
|
|
|||||||||
|
Currency translation adjustments
|
(179
|
)
|
|
|
|
|
|
|
(179
|
)
|
|||||||||
|
Holding loss on net investment hedge
|
(2
|
)
|
(2
|
)
|
|||||||||||||||
|
Holding gains and losses
|
|
|
(14
|
)
|
(3
|
)
|
|
|
(17
|
)
|
|||||||||
|
Reclassification of amount to net income
(a)
|
20
|
|
|
|
20
|
|
|||||||||||||
|
Net actuarial losses
|
|
|
(28
|
)
|
(28
|
)
|
|||||||||||||
|
Reclassification adjustment for net actuarial losses included in net periodic benefit cost
(b)
|
|
|
25
|
|
25
|
|
|||||||||||||
|
Elimination of net prior service cost and actuarial losses of disposal group
|
10
|
|
10
|
|
|||||||||||||||
|
Tax expense
|
|
|
(1
|
)
|
|
|
(5
|
)
|
(6
|
)
|
|||||||||
|
Other comprehensive income (loss)
|
(181
|
)
|
5
|
|
(3
|
)
|
2
|
|
(177
|
)
|
|||||||||
|
Balance, December 31, 2015
|
(608
|
)
|
(4
|
)
|
2
|
|
(564
|
)
|
(1,174
|
)
|
|||||||||
|
Other comprehensive income (loss):
|
|
|
|
|
|
|
|
|
|||||||||||
|
Currency translation adjustments
|
(43
|
)
|
|
|
|
|
|
|
(43
|
)
|
|||||||||
|
Holding gains and losses
|
|
|
(16
|
)
|
3
|
|
|
|
(13
|
)
|
|||||||||
|
Reclassification of amount to net income
(a)
|
(14
|
)
|
(7
|
)
|
(21
|
)
|
|||||||||||||
|
Net actuarial losses
|
|
|
(88
|
)
|
(88
|
)
|
|||||||||||||
|
Reclassification adjustment for net actuarial losses included in net periodic benefit cost
(b)
|
|
|
26
|
|
26
|
|
|||||||||||||
|
Elimination due to sale of subsidiary
|
2
|
|
2
|
|
1
|
|
5
|
|
|||||||||||
|
Tax benefit
|
3
|
|
|
|
|
|
21
|
|
24
|
|
|||||||||
|
Other comprehensive loss
|
(38
|
)
|
(30
|
)
|
(2
|
)
|
(40
|
)
|
(110
|
)
|
|||||||||
|
Balance, December 31, 2016
|
(646
|
)
|
(34
|
)
|
—
|
|
(604
|
)
|
(1,284
|
)
|
|||||||||
|
Other comprehensive income (loss):
|
|
|
|
|
|
|
|
|
|
|
|||||||||
|
Currency translation adjustments
|
(22
|
)
|
|
|
|
|
|
|
(22
|
)
|
|||||||||
|
Holding loss on net investment hedge
|
(2
|
)
|
(2
|
)
|
|||||||||||||||
|
Holding gains and losses
|
|
|
(162
|
)
|
1
|
|
|
|
(161
|
)
|
|||||||||
|
Reclassification of amount to net income
(a)
|
|
|
128
|
|
|
|
|
|
128
|
|
|||||||||
|
Net actuarial losses
|
|
|
(28
|
)
|
(28
|
)
|
|||||||||||||
|
Curtailment gain
|
1
|
|
1
|
|
|||||||||||||||
|
Reclassification adjustment for net actuarial losses included in net periodic benefit cost
(b)
|
|
|
30
|
|
30
|
|
|||||||||||||
|
Tax (expense) benefit
|
|
|
4
|
|
1
|
|
(9
|
)
|
(4
|
)
|
|||||||||
|
Other comprehensive income (loss)
|
(24
|
)
|
(30
|
)
|
2
|
|
(6
|
)
|
(58
|
)
|
|||||||||
|
Balance, December 31, 2017
|
$
|
(670
|
)
|
$
|
(64
|
)
|
$
|
2
|
|
$
|
(610
|
)
|
$
|
(1,342
|
)
|
||||
___________________________________________________
Notes:
(a) Foreign currency contract and investment reclassifications are included in other income (expense), net.
(b) See
Note 12
for additional details.
In connection with the acquisition of a controlling interest in BFP and BPT from Brevini on February 1, 2017, we recognized
$44
for Brevini's
20%
redeemable noncontrolling interests. The terms of the agreement provide Dana the right to call Brevini's noncontrolling interests in BFP and BPT, and Brevini the right to put its noncontrolling interests in BFP and BPT to Dana, assuming Dana does not exercise its call rights, at dates and prices defined in the agreement. The call and put prices are based on the amount Dana paid to acquire its initial ownership interest in BFP and BPT subject to adjustment based on the actual EBITDA and free cash flows, as defined in the agreement, of BFP and BPT. See Note 2 for additional information.
68
Redeemable noncontrolling interests reflected as of the balance sheet date are the greater of the redeemable noncontrolling interest balances adjusted for comprehensive income items and distributions or the redemption values (i.e., the "floor"). Redeemable noncontrolling interest adjustments of redemption value to the floor are recorded in retained earnings and included as an adjustment to net income available to parent company stockholders in the calculation of earnings per share. During 2017 there was a
$6
adjustment to reflect a redemption value in excess of carrying value. See Note 10.
Reconciliation of changes in redeemable noncontrolling interests
—
|
December 31, 2017
|
Twelve Months Ended
|
|||
|
Balance, beginning of period
|
$
|
—
|
|
|
|
Initial fair value of redeemable noncontrolling interests of acquired businesses
|
44
|
|
||
|
Purchase of redeemable noncontrolling interest
|
(1
|
)
|
||
|
Comprehensive income (loss) adjustments:
|
|
|||
|
Net income (loss) attributable to redeemable noncontrolling interests
|
(5
|
)
|
||
|
Other comprehensive income (loss) attributable to redeemable noncontrolling interests
|
3
|
|
||
|
Retained earnings adjustments:
|
|
|||
|
Adjustment to redemption value
|
6
|
|
||
|
Balance, end of period
|
$
|
47
|
|
|
Reconciliation of the numerators and denominators of the earnings per share calculations
—
|
|
2017
|
2016
|
2015
|
||||||||
|
Income from continuing operations
|
$
|
116
|
|
$
|
653
|
|
$
|
176
|
|
||
|
Less: Noncontrolling interests net income
|
10
|
|
13
|
|
21
|
|
|||||
|
Less: Redeemable noncontrolling interests net loss
|
(5
|
)
|
|
|
|
|
|||||
|
Less: Redeemable noncontrolling interests adjustment to redemption value
|
(6
|
)
|
|
|
|
|
|||||
|
Income from continuing operations available to common stockholders - Numerator basic and diluted
|
$
|
105
|
|
$
|
640
|
|
$
|
155
|
|
||
|
Net income available to common stockholders - Numerator basic and diluted
|
$
|
105
|
|
$
|
640
|
|
$
|
159
|
|
||
|
Denominator:
|
|||||||||||
|
Weighted-average shares outstanding - Basic
|
145.1
|
|
146.0
|
|
159.0
|
|
|||||
|
Employee compensation-related shares, including stock options
|
1.8
|
|
0.8
|
|
1.0
|
|
|||||
|
Weighted-average shares outstanding - Diluted
|
146.9
|
|
146.8
|
|
160.0
|
|
|||||
The share count for diluted earnings per share is computed on the basis of the weighted-average number of common shares outstanding plus the effects of dilutive common stock equivalents (CSEs) outstanding during the period. We excluded
0.1 million
,
1.7 million
and
0.4 million
CSEs from the calculations of diluted earnings per share for the years 2017, 2016 and 2015 as the effect of including them would have been anti-dilutive.
2017 Omnibus Incentive Plan
On April 27, 2017, our stockholders approved the 2017 Omnibus Incentive Plan (the Plan), replacing the 2012 Omnibus Incentive Plan (the Prior Plan). The Plan authorizes the grant of stock options, stock appreciation rights (SARs), RSUs and performance share units (PSUs) through April 2027. The maximum aggregate number of shares of common stock that may be issued under the Plan is
3.7 million
shares of common stock plus the number of shares that remained available for new grants under the Prior Plan. Cash-settled awards do not count against the maximum aggregate number. At
December 31, 2017
, there were
6.3 million
shares available for future grants. Shares of common stock to be issued under the Plan are made available from authorized and unissued Dana common stock.
69
Award activity
— (shares in millions)
|
|
Options
|
SARs
|
RSUs
|
PSUs
|
||||||||||||||||||||||||
|
Shares
|
Exercise Price
per Share*
|
Shares
|
Exercise Price
per Share*
|
Shares
|
Grant-Date
Fair Value
per Share*
|
Shares
|
Grant-Date
Fair Value
per Share*
|
|||||||||||||||||||||
|
December 31, 2016
|
1.5
|
|
$
|
14.56
|
|
0.3
|
|
$
|
15.42
|
|
1.8
|
|
$
|
16.54
|
|
0.6
|
|
$
|
16.31
|
|
||||||||
|
Granted
|
|
|
|
|
|
|
|
|
0.8
|
|
19.92
|
|
0.3
|
|
18.63
|
|
||||||||||||
|
Exercised or vested
|
(0.7
|
)
|
14.54
|
|
(0.2
|
)
|
15.62
|
|
(0.6
|
)
|
18.48
|
|
(0.2
|
)
|
21.68
|
|
||||||||||||
|
Forfeited or expired
|
|
|
|
|
|
|
|
|
(0.2
|
)
|
17.09
|
|
(0.1
|
)
|
20.36
|
|
||||||||||||
|
December 31, 2017
|
0.8
|
|
14.58
|
|
0.1
|
|
14.83
|
|
1.8
|
|
17.38
|
|
0.6
|
|
15.70
|
|
||||||||||||
* Weighted-average
|
|
2017
|
2016
|
2015
|
||||||||
|
Total stock compensation expense
|
$
|
23
|
|
$
|
17
|
|
$
|
14
|
|
||
|
Total grant-date fair value of awards vested
|
17
|
|
11
|
|
21
|
|
|||||
|
Cash received from exercise of stock options
|
10
|
|
2
|
|
2
|
|
|||||
|
Cash paid to settle SARs and RSUs
|
4
|
|
1
|
|
2
|
|
|||||
|
Intrinsic value of stock options and SARs exercised
|
8
|
|
1
|
|
1
|
|
|||||
|
Intrinsic value of RSUs and PSUs vested
|
20
|
|
7
|
|
16
|
|
|||||
Compensation expense is generally measured based on the fair value at the date of grant and is recognized on a straight-line basis over the vesting period. For options and SARs, we use an option-pricing model to estimate fair value. For RSUs and PSUs, the fair value is based on the closing market price of our common stock at the date of grant. Awards that are settled in cash are subject to liability accounting. Accordingly, the fair value of such awards is remeasured at the end of each reporting period until settled or expired. We had accrued
$7
and
$5
for cash-settled awards at
December 31, 2017
and
2016
. We issued
0.6 million
shares of common stock in
2017
to settle vested RSUs. At
December 31, 2017
, the total unrecognized compensation cost related to the nonvested awards granted and expected to vest was
$22
. This cost is expected to be recognized over a weighted-average period of
1.7
years.
Stock options and stock appreciation rights
— The exercise price of each option or SAR equals the closing market price of our common stock on the date of grant. Options and SARs generally vest over
three
years and their maximum term is
ten
years. Shares issued upon the exercise of options are recorded as common stock and additional paid-in capital at the option price. SARs are settled in cash for the difference between the market price on the date of exercise and the exercise price. We have not granted stock options or SARs since 2013. All outstanding awards are fully vested and exercisable. At
December 31, 2017
, the outstanding awards have an aggregate intrinsic value of
$15
and a weighted-average remaining contractual life of
3.8
years.
Restricted stock units and performance shares units
— Each RSU or PSU granted represents the right to receive one share of Dana common stock or, at the election of Dana (for units awarded to board members) or for employees located outside the U.S. (for employee awarded units), cash equal to the market value per share. All RSUs contain dividend equivalent rights. RSUs granted to non-employee directors vest on the first anniversary date of the grant and those granted to employees generally cliff vest fully after
three
years. PSUs granted to employees vest if specified performance goals are achieved during the respective performance period, generally
three
years.
The number of PSUs that ultimately vest is contingent on achieving specified return on invested capital targets, specified total shareholder return targets relative to peer companies or specified margin targets. For the portion of the PSU award based on the return on invested capital performance or margin metric, we estimated the fair value at grant date based on the closing market price of our common stock at the date of grant adjusted for the value of assumed dividends over the period because the award is not dividend protected. The estimated grant date value is accrued over the performance period and adjusted as appropriate based on performance relative to the target. For the portion of the PSU award based on shareholder returns, we estimated the fair value at grant date using various assumptions as part of a Monte Carlo simulation. The expected term represents the period from the grant date to the end of the performance period. The risk-free interest rate was based on U.S. Treasury constant maturity rates at the grant date. The dividend yield was calculated by dividing the expected annual dividend by the average stock price over the prior year. The expected volatility was based on historical volatility using daily stock price observations.
70
|
PSUs
|
|||||
|
2016
|
2015
|
||||
|
Expected term (in years)
|
3.0
|
|
3.0
|
|
|
|
Risk-free interest rate
|
1.00
|
%
|
0.89
|
%
|
|
|
Dividend yield
|
1.40
|
%
|
0.98
|
%
|
|
|
Expected volatility
|
33.4
|
%
|
33.9
|
%
|
|
Cash incentive awards
— Our 2017 Omnibus Incentive Plan provides for cash incentive awards. We make awards annually to certain eligible employees designated by Dana, including certain executive officers. Awards under the plan are based on achieving certain financial performance goals. The performance goals of the plan are established annually by the Board of Directors.
Under the
2017
,
2016
and
2015
annual incentive programs, participants were eligible to receive cash awards based on achieving earnings, cash flow and working capital performance goals. Our 2017, 2016 and 2015 long-term incentive programs each have a
three
-year contractual period and include a performance-based cash component. For the 2017 and 2016 long-term incentive programs the vesting of the performance-based cash component is based on achieving the required return-on-invested-capital target, established at the grant date of the award, measured on an average basis over the
three
-year contractual period of the program. The 2017 award also has a component that is based on achieving a margin target that was established at the grant date. For the 2015 long-term incentive program the vesting of the performance-based cash component is based on achieving the required return-on-invested-capital target, established at the grant date of the award, in the third year of the
three
-year contractual period of the respective program. We accrued
$77
,
$41
and
$35
of expense in
2017
,
2016
and
2015
for the expected cash payments under these programs.
71
We sponsor various defined benefit, qualified and nonqualified, pension plans covering eligible employees. Other postretirement benefits (OPEB), including medical and life insurance, are provided for certain employees upon retirement.
We also sponsor various defined contribution plans that cover the majority of our employees. Under the terms of the qualified defined contribution retirement plans, employee and employer contributions may be directed into a number of diverse investments. None of these qualified defined contribution plans allow direct investment in our stock.
Components of net periodic benefit cost (credit) and other amounts recognized in OCI
—
|
|
Pension Benefits
|
||||||||||||||||||||||
|
|
2017
|
2016
|
2015
|
||||||||||||||||||||
|
|
U.S.
|
Non-U.S.
|
U.S.
|
Non-U.S.
|
U.S.
|
Non-U.S.
|
|||||||||||||||||
|
Interest cost
|
$
|
51
|
|
$
|
7
|
|
$
|
53
|
|
$
|
7
|
|
$
|
66
|
|
$
|
8
|
|
|||||
|
Expected return on plan assets
|
(82
|
)
|
(3
|
)
|
(92
|
)
|
(2
|
)
|
(108
|
)
|
(2
|
)
|
|||||||||||
|
Service cost
|
|
|
7
|
|
|
|
5
|
|
|
|
5
|
|
|||||||||||
|
Amortization of net actuarial loss
|
23
|
|
7
|
|
21
|
|
6
|
|
18
|
|
7
|
|
|||||||||||
|
Termination benefit
|
1
|
|
|||||||||||||||||||||
|
Other
|
|
|
|
|
|
|
1
|
|
|
|
|
|
|||||||||||
|
Net periodic benefit cost (credit)
|
(8
|
)
|
19
|
|
(18
|
)
|
17
|
|
(24
|
)
|
18
|
|
|||||||||||
|
Recognized in OCI:
|
|
|
|
|
|
|
|
|
|
|
|
|
|||||||||||
|
Amount due to net actuarial (gains) losses
|
22
|
|
4
|
|
68
|
|
16
|
|
40
|
|
(6
|
)
|
|||||||||||
|
Reclassification adjustment for net actuarial losses in net periodic benefit cost
|
(23
|
)
|
(7
|
)
|
(21
|
)
|
(6
|
)
|
(18
|
)
|
(7
|
)
|
|||||||||||
|
Curtailment
|
(1
|
)
|
|||||||||||||||||||||
|
Other
|
|
|
|
|
|
|
(1
|
)
|
|
|
(11
|
)
|
|||||||||||
|
Total recognized in OCI
|
(1
|
)
|
(4
|
)
|
47
|
|
9
|
|
22
|
|
(24
|
)
|
|||||||||||
|
Net recognized in benefit cost (credit) and OCI
|
$
|
(9
|
)
|
$
|
15
|
|
$
|
29
|
|
$
|
26
|
|
$
|
(2
|
)
|
$
|
(6
|
)
|
|||||
|
|
OPEB - Non-U.S.
|
||||||||||
|
|
2017
|
2016
|
2015
|
||||||||
|
Interest cost
|
$
|
3
|
|
$
|
3
|
|
$
|
3
|
|
||
|
Service cost
|
1
|
|
1
|
|
1
|
|
|||||
|
Amortization of net actuarial gain
|
|
|
(1
|
)
|
|
|
|||||
|
Net periodic benefit cost
|
4
|
|
3
|
|
4
|
|
|||||
|
Recognized in OCI:
|
|
|
|
|
|
|
|||||
|
Amount due to net actuarial (gains) losses
|
2
|
|
4
|
|
(6
|
)
|
|||||
|
Reclassification adjustment for net actuarial gain in net periodic benefit cost
|
|
|
1
|
|
|
|
|||||
|
Total recognized in OCI
|
2
|
|
5
|
|
(6
|
)
|
|||||
|
Net recognized in benefit cost and OCI
|
$
|
6
|
|
$
|
8
|
|
$
|
(2
|
)
|
||
Our U.S. defined benefit pension plans are frozen and no additional service cost is being accrued. The estimated net actuarial loss for the defined benefit pension plans that will be amortized from AOCI into benefit cost in
2018
is
$28
for our U.S. plans and
$6
for our non-U.S. plans. We use the corridor approach for purposes of systematically amortizing deferred gains or losses as a component of net periodic benefit cost into the income statement in future reporting periods. The amortization period used is generally the average remaining service period of active participants in the plan unless almost all of the plan’s participants are inactive, in which case we use the average remaining life expectancy of the inactive participants.
No
portion of the estimated net actuarial gain related to OPEB plans will be amortized from AOCI into benefit cost in
2018
.
72
In October 2017, upon authorization by the Dana Board of Directors, we commenced the process of terminating
one
of our U.S. defined benefit pension plans. Ultimate plan termination is subject to regulatory approval and to prevailing market conditions and other considerations, including interest rates and annuity pricing. In the event that approvals are received and we proceed with effecting termination, settlement of the plan obligations is expected to occur in the first half of 2019. At December 31, 2017, this plan had benefit obligations of
$1,064
and assets of
$900
. The benefit obligations have been valued at the amount expected to be required to settle the obligations, using assumptions regarding the portion of obligations expected to be settled through participant acceptance of lump sum payments or annuities and the cost to purchase those annuities. Increasing this plan's obligations to reflect the expected settlement value resulted in an actuarial loss of
$69
that was charged to OCI in 2017, bringing the unrecognized actuarial losses of the plan to
$369
at the end of 2017. If the settlement is effected as expected in 2019, the plan's deferred actuarial losses remaining in AOCI at that time will be recognized as expense.
As discussed in
Note 3
, upon the divestiture of our operations in Venezuela, we eliminated unrecognized pension expense of
$11
, of which
$1
was attributable to noncontrolling interests.
Funded status
— The following tables provide reconciliations of the changes in benefit obligations, plan assets and funded status.
|
|
Pension Benefits
|
|
|
||||||||||||||||||||
|
|
2017
|
2016
|
OPEB - Non-U.S.
|
||||||||||||||||||||
|
|
U.S.
|
Non-U.S.
|
U.S.
|
Non-U.S.
|
2017
|
2016
|
|||||||||||||||||
|
Reconciliation of benefit obligation:
|
|
|
|
|
|
|
|
|
|
|
|
|
|||||||||||
|
Obligation at beginning of period
|
$
|
1,682
|
|
$
|
309
|
|
$
|
1,692
|
|
$
|
288
|
|
$
|
91
|
|
$
|
86
|
|
|||||
|
Interest cost
|
51
|
|
7
|
|
53
|
|
7
|
|
3
|
|
3
|
|
|||||||||||
|
Service cost
|
|
|
7
|
|
|
|
5
|
|
1
|
|
1
|
|
|||||||||||
|
Actuarial (gain) loss
|
115
|
|
7
|
|
59
|
|
18
|
|
2
|
|
4
|
|
|||||||||||
|
Benefit payments
|
(118
|
)
|
(14
|
)
|
(122
|
)
|
(12
|
)
|
(5
|
)
|
(5
|
)
|
|||||||||||
|
Acquisitions
|
22
|
|
|||||||||||||||||||||
|
New plans
|
|
|
|
|
|
|
14
|
|
|
|
|
|
|||||||||||
|
Settlements
|
|
|
(1
|
)
|
|
|
(2
|
)
|
|
|
|
|
|||||||||||
|
Termination benefit
|
1
|
|
|||||||||||||||||||||
|
Curtailment
|
(1
|
)
|
|||||||||||||||||||||
|
Other
|
|
|
|
|
|
|
(5
|
)
|
|
|
|
|
|||||||||||
|
Translation adjustments
|
|
|
40
|
|
|
|
(4
|
)
|
7
|
|
2
|
|
|||||||||||
|
Obligation at end of period
|
$
|
1,730
|
|
$
|
377
|
|
$
|
1,682
|
|
$
|
309
|
|
$
|
99
|
|
$
|
91
|
|
|||||
The amount included on the New plans line in the preceding table includes obligations under a pension plan in Switzerland, gratuity plans in India and a termination benefit plan covering certain employees in Italy. We determined in 2016 that these obligations should be included within our defined benefit pension plan obligation and the related disclosures. The adjustments were primarily reclassifications from other noncurrent liabilities to pension and postretirement obligations and did not have a material impact on pension expense.
73
|
|
Pension Benefits
|
|
|
||||||||||||||||||||
|
|
2017
|
2016
|
OPEB - Non-U.S.
|
||||||||||||||||||||
|
|
U.S.
|
Non-U.S.
|
U.S.
|
Non-U.S.
|
2017
|
2016
|
|||||||||||||||||
|
Reconciliation of fair value of plan assets:
|
|
|
|
|
|
|
|
|
|
|
|
|
|||||||||||
|
Fair value at beginning of period
|
$
|
1,454
|
|
$
|
51
|
|
$
|
1,493
|
|
$
|
40
|
|
$
|
—
|
|
$
|
—
|
|
|||||
|
Actual return on plan assets
|
175
|
|
6
|
|
83
|
|
4
|
|
|
|
|
|
|||||||||||
|
Employer contributions
|
2
|
|
15
|
|
|
|
15
|
|
5
|
|
5
|
|
|||||||||||
|
Benefit payments
|
(118
|
)
|
(14
|
)
|
(122
|
)
|
(12
|
)
|
(5
|
)
|
(5
|
)
|
|||||||||||
|
Settlements
|
|
|
(1
|
)
|
|
|
(2
|
)
|
|
|
|
|
|||||||||||
|
New plans
|
|
|
4
|
|
|||||||||||||||||||
|
Acquisition
|
12
|
|
|
|
|||||||||||||||||||
|
Translation adjustments
|
|
|
2
|
|
|
|
2
|
|
|
|
|
|
|||||||||||
|
Fair value at end of period
|
$
|
1,513
|
|
$
|
71
|
|
$
|
1,454
|
|
$
|
51
|
|
$
|
—
|
|
$
|
—
|
|
|||||
|
Funded status at end of period
|
$
|
(217
|
)
|
$
|
(306
|
)
|
$
|
(228
|
)
|
$
|
(258
|
)
|
$
|
(99
|
)
|
$
|
(91
|
)
|
|||||
Amounts recognized in the balance sheet
—
|
|
Pension Benefits
|
|
|
||||||||||||||||||||
|
|
2017
|
2016
|
OPEB - Non-U.S.
|
||||||||||||||||||||
|
|
U.S.
|
Non-U.S.
|
U.S.
|
Non-U.S.
|
2017
|
2016
|
|||||||||||||||||
|
Amounts recognized in the consolidated balance sheet:
|
|
|
|
|
|
|
|
|
|
|
|||||||||||||
|
Noncurrent assets
|
$
|
—
|
|
$
|
3
|
|
$
|
—
|
|
$
|
2
|
|
$
|
—
|
|
$
|
—
|
|
|||||
|
Current liabilities
|
|
|
(13
|
)
|
|
|
(9
|
)
|
(5
|
)
|
(5
|
)
|
|||||||||||
|
Noncurrent liabilities
|
(217
|
)
|
(296
|
)
|
(228
|
)
|
(251
|
)
|
(94
|
)
|
(86
|
)
|
|||||||||||
|
Net amount recognized
|
$
|
(217
|
)
|
$
|
(306
|
)
|
$
|
(228
|
)
|
$
|
(258
|
)
|
$
|
(99
|
)
|
$
|
(91
|
)
|
|||||
Amounts recognized in AOCI
—
|
|
Pension Benefits
|
|
|
||||||||||||||||||||
|
|
2017
|
2016
|
OPEB - Non-U.S.
|
||||||||||||||||||||
|
|
U.S.
|
Non-U.S.
|
U.S.
|
Non-U.S.
|
2017
|
2016
|
|||||||||||||||||
|
Amounts recognized in AOCI:
|
|
|
|
|
|
|
|
|
|
|
|
|
|||||||||||
|
Net actuarial loss (gain)
|
$
|
559
|
|
$
|
88
|
|
$
|
560
|
|
$
|
92
|
|
$
|
(8
|
)
|
$
|
(10
|
)
|
|||||
|
AOCI before tax
|
559
|
|
88
|
|
560
|
|
92
|
|
(8
|
)
|
(10
|
)
|
|||||||||||
|
Deferred taxes
|
(10
|
)
|
(22
|
)
|
(17
|
)
|
(24
|
)
|
3
|
|
3
|
|
|||||||||||
|
Net
|
$
|
549
|
|
$
|
66
|
|
$
|
543
|
|
$
|
68
|
|
$
|
(5
|
)
|
$
|
(7
|
)
|
|||||
Excluding the actuarial loss of
$69
for remeasurement of the benefit obligations of the plan being terminated at expected settlement value, we recognized an actuarial gain of
$47
on the U.S. plans in 2017 as the return on assets exceeding the expected rate more than offset the effect of the lower discount rates used to value our December 31, 2017 pension obligations and the impact of using spot rates to determine pension service and interest expense, as discussed previously. In the fourth quarter of 2017, the Society of Actuaries continued its trend of frequent updates, issuing new U.S. mortality scales (MP-2017) based on historical data through 2014 and preliminary data for 2015. After studying the new data and consulting with our actuarial advisers, we concluded that adopting MP-2017, modified to reflect a long-term improvement rate of
0.75%
being attained in 2026, was appropriate. This change in assumption did not have a significant impact on the 2017 valuation.
The 2016 actuarial loss was largely the result of decreases in the discount rates used to value our December 31, 2016 pension obligations. Other elements of the actuarial loss include the impact of using spot rates in 2016 to determine pension service and interest expense. The spot rate approach reduces pension expense but the impact is effectively offset by an increase in the actuarial loss. In the fourth quarter of 2016, the Society of Actuaries issued new mortality scales (MP-2016) in the U.S. based on historical data through 2013 and preliminary data for 2014. After studying the new data and consulting with our actuarial advisers, we concluded that adopting MP-2016, modified to reflect a long-term improvement rate of
0.75%
being attained in 2026, was appropriate. This change in assumption did not have a significant impact on the 2016 valuation.
74
Aggregate funding levels
— The following table presents information regarding the aggregate funding levels of our defined benefit pension plans at December 31:
|
|
2017
|
2016
|
|||||||||||||
|
|
U.S.
|
Non-U.S.
|
U.S.
|
Non-U.S.
|
|||||||||||
|
Plans with fair value of plan assets in excess of obligations:
|
|
|
|
|
|
|
|
|
|||||||
|
Accumulated benefit obligation
|
$
|
16
|
|
$
|
15
|
|
$
|
—
|
|
$
|
15
|
|
|||
|
Projected benefit obligation
|
16
|
|
15
|
|
|
|
15
|
|
|||||||
|
Fair value of plan assets
|
16
|
|
18
|
|
|
|
17
|
|
|||||||
|
Plans with obligations in excess of fair value of plan assets:
|
|
|
|
|
|||||||||||
|
Accumulated benefit obligation
|
1,714
|
|
334
|
|
1,682
|
|
272
|
|
|||||||
|
Projected benefit obligation
|
1,714
|
|
362
|
|
1,682
|
|
294
|
|
|||||||
|
Fair value of plan assets
|
1,497
|
|
53
|
|
1,454
|
|
34
|
|
|||||||
Fair value of pension plan assets
—
|
|
|
Fair Value Measurements at December 31, 2017
|
||||||||||||||||||||||||||
|
|
|
U.S.
|
Non-U.S.
|
|||||||||||||||||||||||||
|
Asset Category
|
Total
|
Level 1
|
Level 2
|
NAV (a)
|
Level 1
|
Level 2
|
Level 3
|
|||||||||||||||||||||
|
Equity securities:
|
|
|
|
|
|
|
|
|
|
|
||||||||||||||||||
|
U.S. all cap (b)
|
$
|
62
|
|
$
|
62
|
|
$
|
—
|
|
$
|
—
|
|
$
|
—
|
|
$
|
—
|
|
$
|
—
|
|
|||||||
|
U.S. large cap
|
61
|
|
|
|
|
|
61
|
|
|
|
|
|
||||||||||||||||
|
U.S. small cap
|
7
|
|
7
|
|
||||||||||||||||||||||||
|
EAFE composite
|
65
|
|
|
|
|
|
65
|
|
|
|
|
|
||||||||||||||||
|
Emerging markets
|
52
|
|
|
|
|
|
52
|
|
|
|
|
|
|
|
||||||||||||||
|
Fixed income securities:
|
|
|
||||||||||||||||||||||||||
|
U.S. bonds (c)
|
61
|
|
|
|
61
|
|
|
|
|
|
|
|
||||||||||||||||
|
Corporate bonds
|
464
|
|
|
|
226
|
|
238
|
|
|
|
|
|
||||||||||||||||
|
U.S. Treasury strips
|
281
|
|
|
|
281
|
|
|
|
|
|
||||||||||||||||||
|
Non-U.S. government securities
|
26
|
|
|
|
|
|
26
|
|
|
|
||||||||||||||||||
|
Emerging market debt
|
82
|
|
|
|
|
|
82
|
|
|
|
|
|
||||||||||||||||
|
Alternative investments:
|
|
|
||||||||||||||||||||||||||
|
Insurance contracts (e)
|
33
|
|
|
|
|
|
|
|
33
|
|
||||||||||||||||||
|
Real estate
|
35
|
|
|
|
|
|
35
|
|
|
|
|
|
||||||||||||||||
|
Other (f)
|
1
|
|
|
|
(10
|
)
|
11
|
|
|
|
||||||||||||||||||
|
Cash and cash equivalents
|
354
|
|
|
|
353
|
|
|
|
1
|
|
|
|
||||||||||||||||
|
Total
|
$
|
1,584
|
|
$
|
69
|
|
$
|
911
|
|
$
|
533
|
|
$
|
—
|
|
$
|
38
|
|
$
|
33
|
|
|||||||
75
|
|
|
Fair Value Measurements at December 31, 2016
|
||||||||||||||||||||||||||
|
|
|
U.S.
|
Non-U.S.
|
|||||||||||||||||||||||||
|
Asset Category
|
Total
|
Level 1
|
Level 2
|
NAV (a)
|
Level 1
|
Level 2
|
Level 3
|
|||||||||||||||||||||
|
Equity securities:
|
|
|
|
|
|
|
|
|
|
|
||||||||||||||||||
|
U.S. all cap (b)
|
$
|
76
|
|
$
|
76
|
|
$
|
—
|
|
$
|
—
|
|
$
|
—
|
|
$
|
—
|
|
$
|
—
|
|
|||||||
|
U.S. large cap
|
102
|
|
|
|
|
|
102
|
|
|
|
|
|
||||||||||||||||
|
U.S. small cap
|
26
|
|
26
|
|
||||||||||||||||||||||||
|
EAFE composite
|
119
|
|
|
|
|
|
119
|
|
|
|
|
|
||||||||||||||||
|
Emerging markets
|
66
|
|
|
|
|
|
66
|
|
|
|
|
|
|
|
||||||||||||||
|
Fixed income securities:
|
|
|
||||||||||||||||||||||||||
|
U.S. bonds (c)
|
137
|
|
|
|
67
|
|
70
|
|
|
|
|
|
||||||||||||||||
|
Corporate bonds
|
419
|
|
|
|
198
|
|
221
|
|
|
|
|
|
||||||||||||||||
|
U.S. Treasury strips
|
269
|
|
|
|
269
|
|
|
|
|
|
||||||||||||||||||
|
Non-U.S. government securities
|
25
|
|
|
|
|
|
25
|
|
|
|
||||||||||||||||||
|
Emerging market debt
|
65
|
|
|
|
|
|
65
|
|
|
|
|
|
||||||||||||||||
|
Alternative investments:
|
|
|
||||||||||||||||||||||||||
|
Hedge fund of funds (d)
|
66
|
|
|
|
|
|
66
|
|
|
|
|
|
||||||||||||||||
|
Insurance contracts (e)
|
16
|
|
|
|
|
|
|
|
16
|
|
||||||||||||||||||
|
Real estate
|
36
|
|
|
|
|
|
36
|
|
|
|
|
|
||||||||||||||||
|
Other (f)
|
10
|
|
|
|
1
|
|
9
|
|
|
|
||||||||||||||||||
|
Cash and cash equivalents
|
73
|
|
|
|
72
|
|
1
|
|
|
|
||||||||||||||||||
|
Total
|
$
|
1,505
|
|
$
|
102
|
|
$
|
607
|
|
$
|
745
|
|
$
|
—
|
|
$
|
35
|
|
$
|
16
|
|
|||||||
________________________________
Notes:
|
(a)
|
Certain assets are measured at fair value using the net asset value (NAV) per share (or its equivalent) practical expedient and have not been classified in the fair value hierarchy.
|
|
(b)
|
This category comprises a combination of small-, mid- and large-cap equity stocks that are allocated at the investment manager's discretion. Investments include common and preferred securities as well as equity funds that invest in these instruments.
|
|
(c)
|
This category represents a combination of high-yield and investment grade corporate bonds, sovereign bonds, Yankee bonds, asset-backed securities and U.S. government bonds. Investments include fixed income funds that invest in these instruments.
|
|
(d)
|
This category includes fund managers that invest in a well-diversified group of hedge funds where strategies include, but are not limited to, event driven, relative value, long/short market neutral, multistrategy and global macro. Investments may be made directly or through pooled funds.
|
|
(e)
|
This category comprises contracts placed with insurance companies where the underlying assets are invested in fixed interest securities.
|
|
(f)
|
Other assets in the U.S. represent interest rate derivatives which had a market value of
$(10)
at December 31, 2017 and
$1
at December 31, 2016.
|
|
|
2017
|
2016
|
||||||
|
|
Non-U.S.
|
Non-U.S.
|
||||||
|
Reconciliation of Level 3 Assets
|
Insurance
Contracts
|
Insurance
Contracts
|
||||||
|
Fair value at beginning of period
|
$
|
16
|
|
$
|
12
|
|
||
|
Actual gains relating to assets still held at the reporting date
|
3
|
|
||||||
|
Purchases, sales and settlements
|
1
|
|
|
|
||||
|
Currency impact
|
3
|
|
|
|
||||
|
Transfers into (out of) Level 3
|
10
|
|
4
|
|
||||
|
Fair value at end of period
|
$
|
33
|
|
$
|
16
|
|
||
Valuation Methods
Equity securities
— The fair value of equity securities held directly by the trust is based on quoted market prices. When the equity securities are held in commingled funds that are not publicly traded, the fair value of our interest in the fund is its NAV as determined by quoted market prices for the underlying holdings.
Fixed income securities
— The fair value of fixed income securities held directly by the trust is based on a bid evaluation process with input from independent pricing sources. When the fixed income securities are held in commingled funds that are not publicly traded, the fair value of our interest in the fund is its NAV as determined by a similar valuation of the underlying holdings.
76
Hedge funds
— The fair value of hedge funds is provided by the managers of the underlying investments. Those managers develop a NAV based on market quotes for the most liquid assets and alternative methods for assets that do not have sufficient trading activity to derive prices.
Insurance contracts
— The values shown for insurance contracts are the amounts reported by the insurance company and approximate the fair values of the underlying investments.
Real estate
— The investments in real estate represent ownership interests in commingled funds and partnerships that invest in real estate. The investment managers determine the NAV of these ownership interests using the fair value of the underlying real estate which is obtained via independent third party appraisals prepared on a periodic basis. Assumptions used to value the properties are updated quarterly. For the component of the real estate portfolio under development, the investments are carried at cost until they are completed and valued by a third party appraiser.
Cash and cash equivalents
— The fair value of cash and cash equivalents is set equal to its amortized cost.
The methods described above may produce a fair value that may not be indicative of net realizable value or reflective of future fair values. Furthermore, while we believe the valuation methods are appropriate and consistent with other market participants, the use of different methodologies or assumptions to determine the fair value of certain financial instruments could result in a different fair value measurement at the reporting date.
Investment policy
— Target asset allocations of U.S. pension plans are established through an investment policy, which is updated periodically and reviewed by an Investment Committee, comprised of certain company officers and directors. The investment policy allows for a flexible asset allocation mix which is intended to provide appropriate diversification to lessen market volatility while assuming a reasonable level of economic risk.
Our policy recognizes that properly managing the relationship between pension assets and pension liabilities serves to mitigate the impact of market volatility on our funding levels. The investment policy permits plan assets to be invested in a number of diverse categories, including a Growth Portfolio, an Immunizing Portfolio and a Liquidity Portfolio. These sub-portfolios are intended to balance the generation of incremental returns with the management of overall risk.
The Growth Portfolio is invested in a diversified pool of assets in order to generate an incremental return with an acceptable level of risk. The Immunizing Portfolio is a hedging portfolio that may be comprised of fixed income securities and overlay positions. This portfolio is designed to offset changes in the value of the pension liability due to changes in interest rates. The Liquidity Portfolio is a cash portfolio designed to meet short-term liquidity needs and reduce the plans’ overall risk. As a result of our diversification strategies, there are no significant concentrations of risk within the portfolio of investments.
The allocations among portfolios are adjusted as needed to meet changing objectives and constraints and to manage the risk of adverse changes in the unfunded positions of our plans. Following approval of the plan of termination by our Board of Directors in October 2017, the Investment Committee established new targets for the assets of the subject plan. At
December 31, 2017
, the plan that we expect to terminate had targets of
10%
in the Growth Portfolio (U.S. and non-U.S. equities, high-yield fixed income, real estate, emerging market debt and cash),
88%
in the Immunizing Portfolio (long duration U.S. Treasury strips, corporate bonds and cash) and
2%
in the Liquidity Portfolio (cash and short-term securities) while the remaining U.S. plans had targets of
45%
for the Growth Portfolio,
53%
for the Immunizing Portfolio and
2%
for the Liquidity Portfolio. The assets held at December 31, 2017 by the plan we expect to terminate were invested
26%
in the Growth Portfolio,
73%
in the Immunizing Portfolio and
1%
in the Liquidity Portfolio while the assets held by the remaining U.S. plans were invested
39%
in the Growth Portfolio,
60%
in the Immunizing Portfolio and
1%
in the Liquidity Portfolio. The Investment Committee is in the process of implementing the adjustments to the asset allocation.
77
Significant assumptions
— The significant weighted-average assumptions used in the measurement of pension benefit obligations at December 31 of each year and the net periodic benefit cost for each year are as follows:
|
|
2017
|
2016
|
2015
|
||||||||||||||
|
|
U.S.
|
Non-U.S.
|
U.S.
|
Non-U.S.
|
U.S.
|
Non-U.S.
|
|||||||||||
|
Pension benefit obligations:
|
|
|
|
|
|
|
|
|
|
|
|
|
|||||
|
Discount rate
|
3.55
|
%
|
2.25
|
%
|
3.92
|
%
|
2.48
|
%
|
4.13
|
%
|
2.83
|
%
|
|||||
|
Net periodic benefit cost:
|
|
|
|
|
|
|
|
|
|||||||||
|
Discount rate
|
3.24
|
%
|
2.34
|
%
|
3.29
|
%
|
2.56
|
%
|
3.81
|
%
|
3.75
|
%
|
|||||
|
Rate of compensation increase
|
N/A
|
|
3.33
|
%
|
N/A
|
|
3.12
|
%
|
N/A
|
|
4.83
|
%
|
|||||
|
Expected return on plan assets
|
6.00
|
%
|
5.92
|
%
|
6.50
|
%
|
5.42
|
%
|
7.00
|
%
|
5.87
|
%
|
|||||
The pension plan discount rate assumptions are evaluated annually in consultation with our outside actuarial advisers. Long-term interest rates on high quality corporate debt instruments are used to determine the discount rate. For our largest plans, discount rates are developed using a discounted bond portfolio analysis, with appropriate consideration given to defined benefit payment terms and duration of the liabilities. As disclosed previously, the obligations of the U.S. plan being terminated have been remeasured at expected settlement value. Based on the timing and settlement payments, the U.S. plan being terminated has an implied discount rate of
2.79%
. In the above table, the discount rate used to determine U.S. pension obligations at the end of 2017 does not consider the plan we expect to terminate.
We had historically estimated the interest and service cost components of net periodic benefit cost for pension and other postretirement benefits using a single weighted-average discount rate derived from the yield curve used to measure the benefit obligation of the plan at the most recent remeasurement date. At December 31, 2015, we changed the method used to estimate those interest and service components for pension and other postretirement benefit plans that utilize a yield curve approach. The new method uses a full yield curve approach to estimate the interest and service components by applying the specific spot rates along the yield curve used in the most recent remeasurement of the benefit obligation to the relevant projected cash flows. We believe this method improves the correlation between the projected cash flows and the corresponding interest rates and provides a more precise measurement of interest and service costs. Since the remeasurement of total benefit obligations is not affected, the resulting reduction in periodic benefit cost is offset by an increase in the actuarial loss.
The expected rate of return on plan assets was selected on the basis of our long-term view of return and risk assumptions for major asset classes. We define long-term as forecasts that span at least the next
ten
years. Our long-term outlook is influenced by a combination of return expectations by individual asset class, actual historical experience and our diversified investment strategy. We consult with and consider the opinions of financial professionals in developing appropriate capital market assumptions. Return projections are also validated using a simulation model that incorporates yield curves, credit spreads and risk premiums to project long-term prospective returns. The appropriateness of the expected rate of return is assessed on an annual basis and revised if necessary. We have a high percentage of total assets in fixed income securities since the benefit accruals are frozen for all of our U.S. pension plans. Based on this assessment, we have selected a
6.00%
expected return on asset assumption for
2018
for our U.S. plans not being terminated. The asset portfolio of the U.S. plan expected to be terminated has a higher proportion of assets invested in fixed income investments. As such, we selected an expected rate of
4.10%
for this plan.
The significant weighted-average assumptions used in the measurement of OPEB obligations at December 31 of each year and the net periodic benefit cost for each year are as follows:
|
|
2017
|
2016
|
2015
|
|||||
|
|
Non-U.S.
|
Non-U.S.
|
Non-U.S.
|
|||||
|
OPEB benefit obligations:
|
|
|
|
|
|
|
||
|
Discount rate
|
3.41
|
%
|
3.69
|
%
|
3.96
|
%
|
||
|
Net periodic benefit cost:
|
|
|
|
|
||||
|
Discount rate
|
3.70
|
%
|
3.45
|
%
|
3.84
|
%
|
||
|
Initial health care cost trend rate
|
5.07
|
%
|
5.32
|
%
|
5.62
|
%
|
||
|
Ultimate health care cost trend rate
|
5.07
|
%
|
5.02
|
%
|
5.03
|
%
|
||
|
Year ultimate reached
|
2018
|
|
2018
|
|
2018
|
|
||
The discount rate selection process was similar to the process used for the pension plans. Assumed health care cost trend rates have a significant effect on the health care obligation. To determine the trend rates, consideration is given to the plan design, recent experience and health care economics.
78
A one-percentage-point change in assumed health care cost trend rates would have the following effects for
2017
:
|
1% Point
Increase
|
1% Point
Decrease
|
||||||
|
Effect on total of service and interest cost components
|
$
|
1
|
|
$
|
(1
|
)
|
|
|
Effect on OPEB obligations
|
10
|
|
(9
|
)
|
|||
Estimated future benefit payments and contributions
— Expected benefit payments by our pension and OPEB plans for each of the next five years and for the following five-year period are as follows:
|
|
Pension Benefits
|
OPEB
|
||||||||||
|
Year
|
U.S.
|
Non-U.S.
|
Non-U.S.
|
|||||||||
|
2018
|
$
|
135
|
|
$
|
17
|
|
$
|
5
|
|
|||
|
2019
|
1,072
|
|
26
|
|
5
|
|
||||||
|
2020
|
44
|
|
17
|
|
5
|
|
||||||
|
2021
|
43
|
|
17
|
|
5
|
|
||||||
|
2022
|
43
|
|
19
|
|
5
|
|
||||||
|
2023 to 2027
|
204
|
|
105
|
|
27
|
|
||||||
|
Total
|
$
|
1,541
|
|
$
|
201
|
|
$
|
52
|
|
|||
Pension benefits are funded through deposits with trustees that satisfy, at a minimum, the applicable funding regulations. OPEB benefits are funded as they become due. Projected contributions to be made during
2018
to the defined benefit pension plans are
$16
for our non-U.S. plans. Based on the current funded status of our U.S. plans, there are
no
minimum contributions required for
2018
.
Multi-employer pension plans
— We participate in the Steelworkers Pension Trust (SPT) multi-employer pension plan which provides pension benefits to all of our U.S. employees represented by the United Steelworkers and United Automobile Workers unions. Contributions are made in accordance with our collective bargaining agreements and rates are generally based on hours worked. The collective bargaining agreements expire August 18, 2021. The trustees of the SPT have provided us with the latest data available for the plan year ended
December 31, 2017
. As of that date, the plan is not fully funded. We could be held liable to the plan for our obligations as well as those of other employers as a result of our participation in the plan. Contribution rates could increase if the plan is required to adopt a funding improvement plan or a rehabilitation plan, if the performance of plan assets does not meet expectations or as a result of future collectively bargained wage and benefit agreements. If we choose to stop participating in the plan, we may be required to pay the plan an amount based on the underfunded status of the plan, referred to as a withdrawal liability.
The Pension Protection Act (PPA) defines a zone status for each plan. Plans in the green zone are at least
80%
funded, plans in the yellow zone are at least
65%
funded and plans in the red zone are generally less than
65%
funded. The SPT plan has utilized extended amortization provisions to amortize its losses from 2008. The plan recertified its zone status after using the extended amortization provisions as allowed by law. The SPT plan has not implemented a funding improvement or rehabilitation plan, nor are such plans pending. Our contributions to the SPT have not exceeded
5%
of the total contributions to the plan.
|
Employer
Identification
Number/
Plan Number
|
PPA
Zone Status
|
Funding Plan Pending/
Implemented
|
Contributions by Dana
|
Surcharge
Imposed
|
||||||||||||||||||
|
Pension
Fund
|
2017
|
2016
|
2017
|
2016
|
2015
|
|||||||||||||||||
|
SPT
|
23-6648508 / 499
|
Green
|
Green
|
No
|
$
|
11
|
|
$
|
10
|
|
$
|
10
|
|
No
|
||||||||
79
|
|
2017
|
2016
|
|||||||||||||||||||||
|
Cost
|
Unrealized
Gains (Losses)
|
Fair
Value
|
Cost
|
Unrealized
Gains (Losses)
|
Fair
Value
|
||||||||||||||||||
|
U.S. government securities
|
$
|
3
|
|
$
|
—
|
|
$
|
3
|
|
$
|
2
|
|
$
|
—
|
|
$
|
2
|
|
|||||
|
Corporate securities
|
5
|
|
|
|
5
|
|
2
|
|
|
|
2
|
|
|||||||||||
|
Certificates of deposit
|
27
|
|
|
|
27
|
|
22
|
|
22
|
|
|||||||||||||
|
Other
|
4
|
|
1
|
|
5
|
|
4
|
|
|
|
4
|
|
|||||||||||
|
Total marketable securities
|
$
|
39
|
|
$
|
1
|
|
$
|
40
|
|
$
|
30
|
|
$
|
—
|
|
$
|
30
|
|
|||||
U.S. government securities include bonds issued by government-sponsored agencies and Treasury notes. Corporate securities include primarily debt securities. Other consists of investments in mutual and index funds. U.S. government securities, corporate debt and certificates of deposit maturing in one year or less, after one year through five years and after five years through ten years total
$27
,
$5
and
$3
at
December 31, 2017
.
Long-term debt at December 31
—
|
|
2017
|
2016
|
||||||||||||||||
|
Interest
Rate |
Principal
|
Unamortized Debt Issue Costs
|
Principal
|
Unamortized Debt Issue Costs
|
||||||||||||||
|
Senior Notes due September 15, 2021
|
5.375%
|
$
|
—
|
|
$
|
—
|
|
$
|
450
|
|
$
|
(5
|
)
|
|||||
|
Senior Notes due September 15, 2023
|
6.000%
|
300
|
|
(4
|
)
|
300
|
|
(4
|
)
|
|||||||||
|
Senior Notes due December 15, 2024
|
5.500%
|
425
|
|
(5
|
)
|
425
|
|
(6
|
)
|
|||||||||
|
Senior Notes due April 15, 2025
|
5.750%
|
*
|
400
|
|
(6
|
)
|
|
|
|
|||||||||
|
Senior Notes due June 1, 2026
|
6.500%
|
*
|
375
|
|
(6
|
)
|
375
|
|
(6
|
)
|
||||||||
|
Term Facility
|
275
|
|
(1
|
)
|
|
|
|
|||||||||||
|
Other indebtedness
|
29
|
|
120
|
|
||||||||||||||
|
Total
|
$
|
1,804
|
|
$
|
(22
|
)
|
$
|
1,670
|
|
$
|
(21
|
)
|
||||||
|
*
|
In conjunction with the issuance of the April 2025 Notes we entered into 8-year fixed-to-fixed cross-currency swaps which have the effect of economically converting the April 2025 Notes to euro-denominated debt at a fixed rate of
3.850%
. See Note 15 for additional information. In conjunction with the issuance of the June 2026 Notes we entered into 10-year fixed-to-fixed cross-currency swaps which have the effect of economically converting the June 2026 Notes to euro denominated debt at a fixed rate of
5.140%
. See Note 15 for additional information.
|
Interest on the senior notes is payable semi-annually and interest on the Term Facility is payable quarterly. Other indebtedness includes borrowings from various financial institutions, capital lease obligations, the unamortized fair value adjustment related to a terminated interest rate swap and the financial liability related to build-to-suit leases. See
Note 15
for additional information on the terminated interest rate swap.
Scheduled principal payments on long-term debt at
December 31, 2017
—
|
|
2018
|
2019
|
2020
|
2021
|
2022
|
Thereafter
|
Total
|
||||||||||||||||||||
|
Debt maturities
|
$
|
12
|
|
$
|
19
|
|
$
|
19
|
|
$
|
18
|
|
$
|
216
|
|
$
|
1,501
|
|
$
|
1,785
|
|
||||||
Senior notes activity
— On September 18, 2017, we redeemed the remaining
$350
of our September 2021 Notes at a price equal to
102.688%
plus accrued and unpaid interest. The
$13
loss on extinguishment of debt includes the
$10
redemption premium and the
$3
write-off of previously deferred financing costs associated with the September 2021 Notes.
On April 4, 2017, Dana Financing Luxembourg S.à r.l., a wholly-owned subsidiary of Dana, issued
$400
in senior notes (April 2025 Notes) at
5.750%
, which are guaranteed by Dana. The April 2025 Notes were issued through a private placement and will not be registered under the U.S. Securities Act of 1933, as amended (the Securities Act). The April 2025 Notes were offered only to qualified institutional buyers in reliance on Rule 144A under the Securities Act and, outside the United States, only to non-U.S. investors in reliance on Regulation S under the Securities Act. The April 2025 Notes rank equally with Dana's other unsecured senior notes. Interest on the notes is payable on April 15 and October 15 of each year, beginning on October 15, 2017. The April 2025 Notes will mature on April 15, 2025. Net proceeds of the offering totaled
$394
. Financing costs of
$6
80
were recorded as deferred costs and are being amortized to interest expense over the life of the April 2025 Notes. The proceeds from the offering were used to repay indebtedness of our BPT and BFP subsidiaries, repay indebtedness of a wholly-owned subsidiary in Brazil, redeem
$100
of our September 2021 Notes and for general corporate purposes. The September 2021 Notes were redeemed on April 4, 2017 at a price equal to
104.031%
plus accrued and unpaid interest. The
$6
loss on extinguishment of debt includes the
$4
redemption premium and the
$1
write-off of previously deferred financing costs associated with the September 2021 Notes and the
$1
redemption premium associated with the repayment of indebtedness of a wholly-owned subsidiary in Brazil. In conjunction with the issuance of the April 2025 Notes, we entered into eight-year fixed-to-fixed cross-currency swaps which have the effect of economically converting the April 2025 Notes to euro-denominated debt at a fixed rate of
3.850%
. See Note 15 for additional information.
On June 23, 2016, we redeemed all of our February 2021 Notes at a price equal to
103.375%
plus accrued and unpaid interest. The
$16
loss on extinguishment of debt includes the
$12
redemption premium and the
$4
write-off of previously deferred financing costs associated with the February 2021 Notes.
On May 27, 2016, Dana Financing Luxembourg S.à r.l., a wholly-owned subsidiary of Dana, issued
$375
in senior notes (June 2026 Notes). The June 2026 Notes were issued through a private placement and will not be registered under the U.S. Securities Act of 1933, as amended (the Securities Act). The June 2026 Notes were offered only to qualified institutional buyers in reliance on Rule 144A under the Securities Act and, outside the United States, only to non-U.S. investors in reliance on Regulation S under the Securities Act. The June 2026 Notes rank equally with Dana's other unsecured senior notes. Interest on the notes is payable on June 15 and December 15 of each year, beginning on December 15, 2016. The June 2026 Notes will mature on June 1, 2026. Net proceeds of the offering totaled
$368
. Financing costs of
$7
were recorded as deferred costs and are being amortized to interest expense over the life of the notes. The proceeds from the offering were used to redeem our February 2021 Notes, to pay related fees and expenses and for general corporate purposes.
On March 16, 2015, we redeemed the remaining
$15
of our February 2019 Notes at a price equal to
103.250%
plus accrued and unpaid interest. The
$2
loss on extinguishment of debt includes the redemption premium and the write-off of previously deferred financing costs associated with the February 2019 Notes.
Senior notes redemption provisions
— We may redeem some or all of the senior notes at the following redemption prices (expressed as percentages of principal amount), plus accrued and unpaid interest to the redemption date, if redeemed during the 12-month period commencing on the anniversary date of the senior notes in the years set forth below:
|
Redemption Price
|
||||||||||||
|
September
|
December
|
April
|
June
|
|||||||||
|
Year
|
2023 Notes
|
2024 Notes
|
2025 Notes
|
2026 Notes
|
||||||||
|
2018
|
103.000
|
%
|
||||||||||
|
2019
|
102.000
|
%
|
102.750
|
%
|
||||||||
|
2020
|
101.000
|
%
|
101.833
|
%
|
104.313
|
%
|
||||||
|
2021
|
100.000
|
%
|
100.917
|
%
|
102.875
|
%
|
103.250
|
%
|
||||
|
2022
|
100.000
|
%
|
100.000
|
%
|
101.438
|
%
|
102.167
|
%
|
||||
|
2023
|
100.000
|
%
|
100.000
|
%
|
101.083
|
%
|
||||||
|
2024
|
100.000
|
%
|
100.000
|
%
|
||||||||
|
2025
|
100.000
|
%
|
||||||||||
Prior to September 15, 2018 for the September 2023 Notes, we may redeem some or all of such notes at a price equal to the principal amount thereof, plus accrued and unpaid interest, plus a “make-whole” premium. We have not separated the make-whole premium from the underlying debt instrument to account for it as a derivative instrument as the economic characteristics and the risks of this embedded derivative are clearly and closely related to the economic characteristics and risks of the underlying debt.
Prior to December 15, 2019, we may redeem some or all of the December 2024 Notes at a price equal to the principal amount thereof, plus accrued and unpaid interest, plus a “make-whole” premium. We have not separated the make-whole premium from the underlying debt instrument to account for it as a derivative instrument as the economic characteristics and the risks of this embedded derivative are clearly and closely related to the economic characteristics and risks of the underlying debt.
At any time prior to April 15, 2020, we may redeem up to
35%
of the aggregate principal amount of the April 2025 Notes in an amount not to exceed the amount of proceeds of one or more equity offerings, at a price equal to
105.750%
of the
81
principal amount thereof, plus accrued and unpaid interest, if any, to the redemption date, provided that at least
50%
of the original aggregate principal amount of the April 2025 Notes remains outstanding after the redemption.
Prior to April 15, 2020, we may redeem some or all of the April 2025 Notes at a redemption price of
100.000%
of the aggregate principal amount thereof, plus accrued and unpaid interest, if any, to the redemption date plus a “make-whole” premium. We have not separated the make-whole premium from the underlying debt instrument to account for it as a derivative instrument as the economic characteristics and the risks of this embedded derivative are clearly and closely related to the economic characteristics and risks of the underlying debt.
At any time prior to June 1, 2019, we may redeem up to
35%
of the aggregate principal amount of the June 2026 Notes in an amount not to exceed the amount of proceeds of one or more equity offerings, at a price equal to
106.500%
of the principal amount thereof, plus accrued and unpaid interest, if any, to the redemption date, provided that at least
50%
of the original aggregate principal amount of the June 2026 Notes remains outstanding after the redemption.
Prior to June 1, 2021, we may redeem some or all of the June 2026 Notes at a redemption price of
100.000%
of the aggregate principal amount thereof, plus accrued and unpaid interest, if any, to the redemption date plus a “make-whole” premium. We have not separated the make-whole premium from the underlying debt instrument to account for it as a derivative instrument as the economic characteristics and the risks of this embedded derivative are clearly and closely related to the economic characteristics and risks of the underlying debt.
Credit agreement
— On August 17, 2017, we entered into an amended credit and guaranty agreement comprised of a
$275
term facility (the Term Facility) and a
$600
revolving credit facility (the Revolving Facility) both of which mature on August 17, 2022. On September 14, 2017, we drew the entire amount available under the Term Facility. Net proceeds from the Term Facility draw totaled
$274
. Financing costs of
$1
were recorded as deferred cost and are being amortized to interest expense over the life of the Term Facility. We are required to make equal quarterly installments on the last day of each fiscal quarter of
1.5625%
of the initial aggregate principal amount of the Term Facility commencing on September 30, 2018. We may prepay some or all of Term Facility without penalty. Any prepayments made on the Term Facility would be applied against the required quarterly installments. The proceeds from the Term Facility were used to repay our September 2021 Notes and for general corporate purposes. The Revolving Facility amended our previous revolving credit facility. In connection with the Revolving Facility, we paid
$2
in deferred financing costs to be amortized to interest expense over the life of the facility. Deferred financing costs on our Revolving Facility are included in other noncurrent assets.
The Term Facility and the Revolving Facility are guaranteed by all of our wholly-owned domestic subsidiaries subject to certain exceptions (the guarantors) and grants a first-priority lien on substantially all of the assets of Dana and the guarantors, subject to certain exceptions.
Advances under the Term Facility and Revolving Facility bear interest at a floating rate based on, at our option, the base rate or Eurodollar rate (each as described in the revolving credit agreement) plus a margin as set forth below:
|
Margin
|
||||||
|
Total Net Leverage Ratio
|
Base Rate
|
Eurodollar Rate
|
||||
|
Less than or equal to 1.00:1.00
|
0.50
|
%
|
1.50
|
%
|
||
|
Greater than 1.00:1.00 but less than or equal to 2.00:1.00
|
0.75
|
%
|
1.75
|
%
|
||
|
Greater than 2.00:1.00
|
1.00
|
%
|
2.00
|
%
|
||
We have elected to pay interest on our advance under the Term Facility at the Eurodollar Rate. The interest rate on the Term Facility, inclusive of the applicable margin, was
3.28488%
as of December 31, 2017.
Commitment fees are applied based on the average daily unused portion of the available amounts under the Revolving Facility as set forth below:
|
Total Net Leverage Ratio
|
Commitment Fee
|
||
|
Less than or equal to 1.00:1.00
|
0.250
|
%
|
|
|
Greater than 1.00:1.00 but less than or equal to 2.00:1.00
|
0.375
|
%
|
|
|
Greater than 2.00:1.00
|
0.500
|
%
|
|
82
Up to
$275
of the Revolving Facility may be applied to letters of credit, which reduces availability. We pay a fee for issued and undrawn letters of credit in an amount per annum equal to the applicable margin for Eurodollar rate advances based on a quarterly average availability under issued and undrawn letters of credit under the Revolving Facility and a per annum fronting fee of
0.125%
, payable quarterly.
At
December 31, 2017
, we had
no
outstanding borrowings under the Revolving Facility but we had utilized
$22
for letters of credit. We had availability at
December 31, 2017
under the Revolving Facility of
$578
after deducting the outstanding letters of credit.
Debt covenants
— At
December 31, 2017
, we were in compliance with the covenants of our financing agreements. Under the Term Facility, Revolving Facility and the senior notes, we are required to comply with certain incurrence-based covenants customary for facilities of these types and, in the case of the Term Facility and Revolving Facility, a maintenance covenant requiring us to maintain a first lien net leverage ratio not to exceed 2.00 to 1.00.
In measuring the fair value of our assets and liabilities, we use market data or assumptions that we believe market participants would use in pricing an asset or liability including assumptions about risk when appropriate. Our valuation techniques include a combination of observable and unobservable inputs.
Fair value measurements on a recurring basis
— Assets and liabilities that are carried in our balance sheet at fair value are as follows:
|
|
Fair Value
|
|||||||||||
|
Category
|
Balance Sheet Location
|
Fair Value Level
|
December 31, 2017
|
December 31, 2016
|
||||||||
|
Available-for-sale securities
|
Marketable securities
|
1
|
$
|
5
|
|
$
|
4
|
|
||||
|
Available-for-sale securities
|
Marketable securities
|
2
|
35
|
|
26
|
|
||||||
|
Currency forward contracts
|
||||||||||||
|
Cash flow hedges
|
Accounts receivable - Other
|
2
|
1
|
|
2
|
|
||||||
|
Cash flow hedges
|
Other accrued liabilities
|
2
|
5
|
|
4
|
|
||||||
|
Undesignated
|
Accounts receivable - Other
|
2
|
1
|
|
1
|
|
||||||
|
Undesignated
|
Other accrued liabilities
|
2
|
3
|
|
1
|
|
||||||
|
Currency swaps
|
||||||||||||
|
Cash flow hedges
|
Other noncurrent liabilities
|
2
|
177
|
|
12
|
|
||||||
|
Undesignated
|
Other accrued liabilities
|
2
|
—
|
|
3
|
|
||||||
Fair Value Level 1 assets and liabilities reflect quoted prices in active markets. Fair Value Level 2 assets and liabilities reflect the use of significant other observable inputs.
Fair value of financial instruments
— The financial instruments that are not carried in our balance sheet at fair value are as follows:
|
|
2017
|
2016
|
|||||||||||||
|
Carrying
Value
|
Fair
Value
|
Carrying
Value
|
Fair
Value
|
||||||||||||
|
Senior notes
|
$
|
1,500
|
|
$
|
1,592
|
|
$
|
1,550
|
|
$
|
1,612
|
|
|||
|
Term Facility
|
275
|
|
275
|
|
—
|
|
—
|
|
|||||||
|
Other indebtedness*
|
29
|
|
22
|
|
120
|
|
101
|
|
|||||||
|
Total
|
$
|
1,804
|
|
$
|
1,889
|
|
$
|
1,670
|
|
$
|
1,713
|
|
|||
|
*
|
The carrying value includes the unamortized portion of a fair value adjustment related to a terminated interest rate swap at both dates. The carrying value and fair value also include a financial liability associated with certain build-to-suit lease arrangements at both dates.
|
The fair value of our senior notes and Term Facility are estimated based upon a market approach (Level 2) while the fair value of our other indebtedness is based upon an income approach (Level 2). The fair value of the Term Facility approximates its carrying value as it is a floating-rate facility. See
Note 14
for additional information about financing arrangements.
83
Fair value measurements on a nonrecurring basis
— Certain assets are measured at fair value on a nonrecurring basis. These are long-lived assets that are subject to fair value adjustments only in certain circumstances. These assets include intangible assets and property, plant and equipment which may be written down to fair value when they are held for sale or as a result of impairment.
Interest rate derivatives
— Our portfolio of derivative financial instruments periodically includes interest rate swaps designed to mitigate our interest rate risk. As of
December 31, 2017
,
no
fixed-to-floating interest rate swaps remain outstanding. However, a
$6
fair value adjustment to the carrying amount of our December 2024 Notes, associated with a fixed-to-floating interest rate swap that had been executed but was subsequently terminated during 2015, remains deferred at
December 31, 2017
. This amount is being amortized as a reduction of interest expense through the period ending December 2024, the scheduled maturity date of the December 2024 Notes. Approximately
$1
was amortized as a reduction of interest expense during 2017.
Foreign currency derivatives
— Our foreign currency derivatives include forward contracts associated with forecasted transactions, primarily involving the purchases and sales of inventory through the next
eighteen months
, as well as currency swaps associated with certain recorded external notes payable and intercompany loans receivable and payable. Periodically, our foreign currency derivatives also include net investment hedges of certain of our investments in foreign operations.
During the first quarter of 2017, in conjunction with the issuance of
€281
of euro-denominated intercompany notes payable, issued by certain of our Luxembourg subsidiaries (the "Luxembourg Intercompany Notes") and payable to USD-functional Dana, Inc., we executed fixed-to-fixed cross-currency swaps with the same critical terms as the Luxembourg Intercompany Notes. The risk management objective of these swaps is to eliminate the variability in the functional-currency-equivalent cash flows due to changes in the euro / U.S. dollar exchange rates associated with the forecasted principal and interest payments.
Additionally, during the first quarter of 2017, in conjunction with the issuance of an aggregate
$15
of U.S. dollar-denominated short-term notes payable by one of our Brazilian subsidiaries (the "Brazilian Notes"), we executed fixed-to-fixed cross-currency swaps with the same critical terms as the Brazilian Notes to eliminate the variability in the functional-currency-equivalent cash flows due to changes in the U.S. dollar / Brazilian real exchange rates. During September 2017, the Brazilian Notes and the associated swaps were settled.
During March 2017, in conjunction with the planned April 2017 issuance of the
$400
of U.S. dollar-denominated April 2025 Notes by euro-functional Dana Financing Luxembourg S.à r.l., we executed fixed-to-fixed cross-currency swaps with the same critical terms as the April 2025 Notes to eliminate the variability in the functional-currency-equivalent cash flows due to changes in the U.S. dollar / euro exchange rates associated with the forecasted principal and interest payments.
During May 2016, in conjunction with the issuance of the
$375
of U.S. dollar-denominated June 2026 Notes by euro-functional Dana Financing Luxembourg S.à r.l., we executed fixed-to-fixed cross-currency swaps with the same critical terms as the June 2026 Notes to eliminate the variability in the functional-currency-equivalent cash flows due to changes in the U.S. dollar / euro exchange rates associated with the forecasted principal and interest payments.
All of the underlying designated financial instruments, and any subsequent replacement debt, have been designated as the hedged items in each respective cash flow hedge relationship, as shown in the table below. Designated as cash flow hedges of the forecasted principal and interest payments of the underlying designated financial instruments, or subsequent replacement debt, all of the swaps economically convert the underlying designated financial instruments into the functional currency of each respective holder. The impact of the interest rate differential between the inflow and outflow rates on all fixed-to-fixed cross-currency swaps is recognized during each period as a component of interest expense.
The following fixed-to-fixed cross-currency swaps were outstanding at
December 31, 2017
:
|
Underlying Financial Instrument
|
Derivative Financial Instrument
|
||||||||||||||||||||||
|
Description
|
Type
|
Face Amount
|
Rate
|
Designated Notional Amount
|
Traded Amount
|
Inflow Rate
|
Outflow Rate
|
||||||||||||||||
|
June 2026 Notes
|
Payable
|
$
|
375
|
|
6.50
|
%
|
$
|
375
|
|
€
|
338
|
|
6.50
|
%
|
5.14
|
%
|
|||||||
|
April 2025 Notes
|
Payable
|
$
|
400
|
|
5.75
|
%
|
$
|
400
|
|
€
|
371
|
|
5.75
|
%
|
3.85
|
%
|
|||||||
|
Luxembourg Intercompany Notes
|
Receivable
|
€
|
281
|
|
3.91
|
%
|
€
|
281
|
|
$
|
300
|
|
6.00
|
%
|
3.91
|
%
|
|||||||
84
All of the swaps are expected to be highly effective in offsetting the corresponding currency-based changes in cash outflows related to the underlying designated financial instruments. Based on our qualitative assessment that the critical terms of all of the underlying designated financial instruments and all of the associated swaps match and that all other required criteria have been met, we do not expect to incur any ineffectiveness. As effective cash flow hedges, changes in the fair value of the swaps will be recorded in OCI during each period. Additionally, to the extent the swaps remain effective, the appropriate portion of AOCI will be reclassified to earnings each period as an offset to the foreign exchange gain or loss resulting from the remeasurement of the underlying designated financial instruments. See Note 14 for additional information about the June 2026 Notes and the April 2025 Notes.
In the event our ongoing assessment demonstrates that the critical terms of either the swaps or the underlying designated financial instruments have changed, or that there have been adverse developments regarding counterparty risk, we will use the long haul method to assess ineffectiveness of the hedging relationship. To the extent the swaps are no longer effective, changes in their fair values will be recorded in earnings. During 2017, deferred losses of
$32
associated with all of the fixed-to-fixed cross-currency swaps were recorded in OCI and reflect the net impact of a
$165
unfavorable change in the fair value of the swaps and a
$133
reclassification from AOCI to earnings. The reclassification from AOCI to earnings represents an offset to a foreign exchange remeasurement gain on all of the designated debt instruments outstanding during the year ended December 31, 2017.
The total notional amount of outstanding foreign currency forward contracts, involving the exchange of various currencies, was
$306
at
December 31, 2017
and
$143
at
December 31, 2016
. The total notional amount of outstanding foreign currency swaps, including the fixed-to-fixed cross-currency swaps, was
$1,112
at
December 31, 2017
and
$571
at
December 31, 2016
.
The following currency derivatives were outstanding at
December 31, 2017
:
|
|
|
Notional Amount (U.S. Dollar Equivalent)
|
||||||||||||||
|
Functional Currency
|
Traded Currency
|
Designated as
Cash Flow
Hedges
|
Undesignated
|
Total
|
Maturity
|
|||||||||||
|
U.S. dollar
|
Mexican peso
|
$
|
109
|
|
|
|
$
|
109
|
|
Dec-18
|
||||||
|
Euro
|
U.S. dollar, Canadian dollar, Hungarian forint, British pound, Swiss franc, Indian rupee, Russian ruble, Chinese renminbi
|
45
|
|
6
|
|
51
|
|
Mar-19
|
||||||||
|
British pound
|
U.S. dollar, Euro
|
1
|
|
|
|
1
|
|
Nov-18
|
||||||||
|
Swedish krona
|
Euro, U.S. dollar
|
29
|
|
|
|
29
|
|
Feb-19
|
||||||||
|
South African rand
|
U.S. dollar, Euro, Thai baht
|
|
|
9
|
|
9
|
|
Sep-18
|
||||||||
|
Canadian dollar
|
U.S. dollar
|
11
|
|
11
|
|
Mar-19
|
||||||||||
|
Thai baht
|
U.S. dollar, Australian dollar
|
31
|
|
31
|
|
Dec-18
|
||||||||||
|
Brazilian real
|
U.S. dollar, Euro
|
33
|
|
33
|
|
Dec-18
|
||||||||||
|
Indian rupee
|
U.S. dollar, British pound, Euro
|
|
|
32
|
|
32
|
|
Jun-19
|
||||||||
|
Total forward contracts
|
184
|
|
122
|
|
306
|
|
|
|||||||||
|
U.S. dollar
|
Euro
|
337
|
|
|
|
337
|
|
Sep-23
|
||||||||
|
Euro
|
U.S. dollar
|
775
|
|
|
|
775
|
|
Jun-26
|
||||||||
|
Total currency swaps
|
1,112
|
|
—
|
|
1,112
|
|
||||||||||
|
Total currency derivatives
|
$
|
1,296
|
|
$
|
122
|
|
$
|
1,418
|
|
|||||||
Cash flow hedges
— With respect to contracts designated as cash flow hedges, changes in fair value during the period in which the contracts remain outstanding are reported in OCI to the extent such contracts remain effective. Effectiveness is measured by using regression analysis to determine the degree of correlation between the change in the fair value of the derivative instrument and the change in the associated foreign currency exchange rates. Changes in fair value of contracts not designated as cash flow hedges or as net investment hedges are recognized in other income (expense), net in the period in which the changes occur. Realized gains and losses from currency-related forward contracts, including those that have been designated as cash flow hedges and those that have not been designated, are recognized in other income (expense), net.
85
Net investment hedges
— We periodically designate derivative contracts or underlying non-derivative financial instruments as net investment hedges. With respect to contracts designated as net investment hedges, we apply the forward method, but for non-derivative financial instruments designated as net investment hedges, we apply the spot method. Under both methods, we report changes in fair value in the cumulative translation adjustment (CTA) component of OCI during the period in which the contracts remain outstanding to the extent such contracts and non-derivative financial instruments remain effective.
During the first quarter of 2017, we designated the principal amount of an existing non-derivative Mexican peso-denominated intercompany note payable (the "MXN-denominated intercompany note") by Dana European Holdings Luxembourg S.à r.l. to Dana de Mexico Corporacion S. de R.L. de C.V., one of our Mexican subsidiaries, as a net investment hedge of the equivalent portion of the investment in the associated Mexican operations. At December 31, 2017, the principal amount of the MXN-denominated intercompany note is
1,465
Mexican pesos, or approximately
$74
.
During 2017, we recorded a deferred loss of
$2
in the CTA component of OCI associated with the MXN-denominated intercompany note. Amounts recorded in CTA remain deferred in AOCI until such time as the investments in the associated subsidiaries are substantially liquidated.
Amounts to be reclassified to earnings
— Deferred gains or losses associated with effective cash flow hedges of forecasted transactions are reported in AOCI and are reclassified to earnings in the same periods in which the underlying transactions affect earnings. Amounts expected to be reclassified to earnings assume no change in the current hedge relationships or to
December 31, 2017
exchange rates. Deferred losses of
$4
at
December 31, 2017
are expected to be reclassified to earnings during the next twelve months, compared to deferred losses of
$2
at
December 31, 2016
. Amounts reclassified from AOCI to earnings arising from the discontinuation of cash flow hedge accounting treatment were not material during 2017.
Other product liabilities
— We had accrued
$7
and
$5
for non-asbestos product liability costs at
December 31, 2017
and
2016
. We had also recognized
$9
and
$4
as expected amounts recoverable from third parties at the respective dates. The increases in the liability and recoverable amounts at
December 31, 2017
largely reflect the recognition of the estimated cost, net of payments made, and the expected recovery of an insured matter. Payments made to claimants have preceded the recovery of amounts from third parties, resulting in a recoverable amount in excess of the total liability at December 31, 2017. We estimate these liabilities based on current information and assumptions about the value and likelihood of the claims against us.
Environmental liabilities
— Accrued environmental liabilities were
$8
at
December 31, 2017
and 2016. We consider the most probable method of remediation, current laws and regulations and existing technology in estimating our environmental liabilities.
Guarantee of lease obligations
— In connection with the divestiture of our Structural Products business in 2010, leases covering
three
U.S. facilities were assigned to a U.S. affiliate of Metalsa. Under the terms of the sale agreement, we will guarantee the affiliate’s performance under the leases, which run through June 2025, including approximately
$6
of annual payments. In the event of a required payment by Dana as guarantor, we are entitled to pursue full recovery from Metalsa of the amounts paid under the guarantee and to take possession of the leased property.
Other legal matters
— We are subject to various pending or threatened legal proceedings arising out of the normal course of business or operations. In view of the inherent difficulty of predicting the outcome of such matters, we cannot state what the eventual outcome of these matters will be. However, based on current knowledge and after consultation with legal counsel, we believe that any liabilities that may result from these proceedings will not have a material adverse effect on our liquidity, financial condition or results of operations.
On September 25, 2015, the Brazilian antitrust authority (“CADE”) announced an investigation of an alleged cartel involving a former Dana business in Brazil and various competitors related to sales of shock absorbers between 2000 and 2014. We divested this business as a part of the sale of our aftermarket business in 2004. The investigation of Dana's involvement in this matter concluded in the second quarter of 2016 without a material impact on Dana.
Lease commitments —
Cash obligations under future minimum rental commitments under operating leases and net rental expense at December 31, 2017 are shown in the table below. Operating lease commitments are primarily related to facilities. The significant increase in lease commitments at December 31, 2017 reflects the impact of the acquisitions made during 2017. See also Note 2 for additional information about our acquisitions.
86
|
|
2018
|
2019
|
2020
|
2021
|
2022
|
Thereafter
|
Total
|
||||||||||||||||||||
|
Lease commitments
|
$
|
53
|
|
$
|
48
|
|
$
|
45
|
|
$
|
39
|
|
$
|
31
|
|
$
|
90
|
|
$
|
306
|
|
||||||
|
|
2017
|
2016
|
2015
|
||
|
Rent expense
|
$61
|
$50
|
$49
|
||
We record a liability for estimated warranty obligations at the dates our products are sold. We record the liability based on our estimate of costs to settle future claims. Adjustments to our estimated costs at time of sale are made as claim experience and other new information becomes available. Obligations for service campaigns and other occurrences are recognized as adjustments to prior estimates when the obligation is probable and can be reasonably estimated.
Changes in warranty liabilities —
|
|
2017
|
2016
|
2015
|
||||||||
|
Balance, beginning of period
|
$
|
66
|
|
$
|
56
|
|
$
|
47
|
|
||
|
Acquisitions
|
6
|
|
|
|
|
|
|||||
|
Amounts accrued for current period sales
|
32
|
|
25
|
|
26
|
|
|||||
|
Adjustments of prior estimates
|
11
|
|
26
|
|
22
|
|
|||||
|
Settlements of warranty claims
|
(42
|
)
|
(41
|
)
|
(36
|
)
|
|||||
|
Currency impact
|
3
|
|
|
|
(3
|
)
|
|||||
|
Balance, end of period
|
$
|
76
|
|
$
|
66
|
|
$
|
56
|
|
||
The Acquisitions line includes approximately
$4
related to the acquisition of BFP and BPT that is subject to recovery from the seller.
Income tax expense (benefit) attributable to continuing operations
—
|
|
2017
|
2016
|
2015
|
||||||||
|
Current
|
|
|
|
|
|
|
|||||
|
U.S. federal and state
|
$
|
6
|
|
$
|
(18
|
)
|
$
|
12
|
|
||
|
Non-U.S.
|
98
|
|
74
|
|
80
|
|
|||||
|
Total current
|
104
|
|
56
|
|
92
|
|
|||||
|
Deferred
|
|
|
|
|
|
|
|||||
|
U.S. federal and state
|
164
|
|
(497
|
)
|
(9
|
)
|
|||||
|
Non-U.S.
|
15
|
|
17
|
|
(1
|
)
|
|||||
|
Total deferred
|
179
|
|
(480
|
)
|
(10
|
)
|
|||||
|
Total expense (benefit)
|
$
|
283
|
|
$
|
(424
|
)
|
$
|
82
|
|
||
We record interest and penalties related to uncertain tax positions as a component of income tax expense or benefit. Net interest expense for the periods presented herein is not significant.
Income from continuing operations before income taxes
—
|
|
2017
|
2016
|
2015
|
||||||||
|
U.S. operations
|
$
|
60
|
|
$
|
(56
|
)
|
$
|
72
|
|
||
|
Non-U.S. operations
|
320
|
|
271
|
|
220
|
|
|||||
|
Earnings from continuing operations before income taxes
|
$
|
380
|
|
$
|
215
|
|
$
|
292
|
|
||
Income tax audits
— We conduct business globally and, as a result, file income tax returns in multiple jurisdictions that are subject to examination by taxing authorities throughout the world. With few exceptions, we are no longer subject to U.S.
87
federal, state and local or foreign income tax examinations for years before 2009. The U.S. federal income tax audits for 2011 and 2012 were settled during the first quarter of 2015, resulting in no incremental cash taxes.
We are currently under audit by U.S. and foreign authorities for certain taxation years. When the issues related to these periods are settled, the total amounts of unrecognized tax benefits for all open tax years may be modified. Audit outcomes and the timing of the audit settlements are subject to uncertainty and we cannot make an estimate of the impact on our financial position at this time.
U.S.tax reform legislation
— On December 22, 2017, the Tax Cuts and Jobs Act ("Act") was signed into law in the U.S. The Act includes a broad range of tax reforms, certain of which were required by GAAP to be recognized upon enactment. The U.S. Securities and Exchange Commission has issued Staff Accounting Bulletin 118 (SAB 118), which provides guidance on accounting for the tax effects of the Act. SAB 118 provides a measurement period that should not extend beyond one year from the enactment date for companies to complete the accounting under ASC 740. In accordance with SAB 118, a company must reflect the income tax effects of those aspects of the Act for which the accounting under ASC 740 is complete. To the extent that a company’s accounting for certain income tax effects of the Act is incomplete but it is able to determine a reasonable estimate, it must record a provisional estimate in the financial statements. If a company cannot determine a provisional estimate to be included in the financial statements, it should continue to apply ASC 740 on the basis of the provisions of the tax laws that were in effect immediately before the enactment of the Act.
Based on our historical financial performance in the U.S., at December 31, 2017, we have a significant net deferred tax asset position. As such, with the Act's reduction of the corporate tax rate from
35%
to
21%
, we remeasured our net deferred tax assets at the lower corporate rate of
21%
and recognized a tax expense to adjust net deferred tax assets to the reduced value. The Act introduced provisions that fundamentally change the U.S. approach to taxation of foreign earnings. Under the Act, qualified dividends of foreign subsidiaries are no longer subject to U.S. tax. Under the previously-existing tax rules, dividends from foreign operations were subjected to U.S. tax, and if not considered permanently reinvested, we had recognized expense and recorded a liability for the tax expected to be incurred upon receipt of the dividend of these foreign earnings. Although the Act excludes dividends of foreign subsidiaries from taxation, it includes provisions for a mandatory deemed dividend of undistributed foreign earnings at tax rates of
15.5%
or
8%
("transition tax") depending on the nature of the foreign operations' assets. Companies may utilize tax attributes (including net operating losses and tax credits) to offset the transition tax. The estimated net effect of applying the provisions of the Act on our 2017 results of operations was a non-cash charge to tax expense of
$186
. This provisional amount could be revised as additional guidance and interpretations are issued and as we continue to examine the details of the Act and the related tax attributes.
Beginning in 2018, the Act may also trigger a taxable deemed dividend to the extent that the annual earnings of our foreign subsidiaries exceed a specified threshold, based on the value of tangible foreign operating assets. The deemed dividend, if any, from this global intangible low-taxed income (GILTI) may be offset by the use of other tax attributes in that year. We intend to account for the tax effect of GILTI as a period cost and will include a provisional estimate for GILTI in our effective tax rate beginning in the first quarter of 2018. The SEC staff has indicated that a company should make and disclose a policy election as to whether it will recognize deferred taxes for basis differences expected to reverse as GILTI or account for the effect of GILTI as a period cost when incurred. We are currently applying the SAB 118 guidance to the selection of a GILTI accounting policy election and, therefore, as of December 31, 2017, our GILTI accounting policy has not been finalized. We intend to finalize our GILTI accounting policy in 2018 during the measurement period.
88
Effective tax rate reconciliation for continuing operations —
|
|
2017
|
2016
|
2015
|
|||||
|
U.S. federal income tax rate
|
35
|
%
|
35
|
%
|
35
|
%
|
||
|
Adjustments resulting from:
|
|
|
|
|
|
|
||
|
State and local income taxes, net of federal benefit
|
1
|
|
5
|
|
(1
|
)
|
||
|
Non-U.S. income (expense)
|
(11
|
)
|
(15
|
)
|
(11
|
)
|
||
|
Credits and tax incentives
|
(16
|
)
|
(5
|
)
|
(4
|
)
|
||
|
U.S. tax on non-U.S. earnings
|
12
|
|
(19
|
)
|
9
|
|
||
|
Intercompany sale of certain operating assets
|
(6
|
)
|
5
|
|
9
|
|
||
|
Settlement and return adjustments
|
(2
|
)
|
14
|
|
1
|
|
||
|
Enacted change in tax laws
|
49
|
|
4
|
|
||||
|
Miscellaneous items
|
1
|
|
2
|
|
5
|
|
||
|
Valuation allowance adjustments
|
11
|
|
(222
|
)
|
(15
|
)
|
||
|
Effective income tax rate for continuing operations
|
74
|
%
|
(196
|
)%
|
28
|
%
|
||
The net effect in 2017 of applying the U.S. tax reform provisions of the Act was tax expense of
$186
. This impact, which increased the effective rate for 2017 by
49%
, was principally attributable to the reduction of net deferred tax assets to reflect the reduced corporate tax rate. Foreign tax credits of
$49
which were generated in 2017 but not utilized to offset the transition tax are included as a benefit in the credits and incentives component of the effective rate reconciliation, with an offsetting expense of
$49
in the valuation allowance component to recognize that such credits are not likely to be realized.
In the fourth quarter of 2016, we determined that valuation allowances against certain U.S. deferred taxes were no longer required. Release of these valuation allowances resulted in
$501
of tax benefit. Valuation allowances against U.S. deferred tax assets primarily related to state operating loss carryforwards and other credits were retained. In the fourth quarter of 2017, based on our improved financial performance and outlook, we determined that release of an additional
$27
was appropriate and recognized a tax benefit of this amount. Developments in Brazil in 2016 led to our determination that an allowance against certain deferred taxes in that country was appropriate, and we recognized tax expense of
$25
in 2016 to establish this valuation allowance.
In 2014, income tax expense in the U.S. was reduced by
$179
for release of valuation allowances for income forecasted to be realized in 2015 in connection with a tax planning action that involved a sale of an affiliate’s stock and certain operating assets by a U.S. subsidiary of the company to a non-U.S. affiliate expected to be completed in 2015. During the fourth quarter of 2015, the tax planning action was completed. The final income generated by the transaction was higher than anticipated as a consequence of proposed Internal Revenue Service regulations issued in 2015 providing guidance on the tax treatment afforded a component of the tax planning action we undertook, as well as revised income estimates, which resulted in an additional
$66
release of valuation allowance. In conjunction with the completion of the intercompany sale of certain operating assets to a non-U.S. affiliate, a prepaid tax asset of
$190
was recorded. The prepaid tax asset represents the usage of tax attributes recognized in 2014 and 2015, through the release of valuation allowance on our deferred tax assets, and was being amortized into tax expense over the life of the assets transferred in the transaction until 2017. We recognized tax expense of
$11
and
$2
in 2016 and 2015 as a result of this amortization. In addition, we recognized tax expense of
$23
in 2015 related to the sale of the affiliate’s stock. As described in Note 1 of the consolidated financial statements, in 2017 we adopted new accounting guidance applicable to intra-entity transfers. Adoption of this guidance effective January 1, 2017 resulted in the unamortized value of the prepaid tax asset being written off to retained earnings.
Foreign income repatriation
— Prior to the U.S. tax reform provisions enacted with passage of the Act, we provided for U.S. federal income and non-U.S. withholding taxes on the earnings of our non-U.S. operations that are not considered to be permanently reinvested. As indicated above, with passage of the Act, dividends of earnings from non-U.S. operations are generally no longer subjected to U.S. income tax. Accordingly, in the fourth quarter of 2017, we reduced the previously recorded liability for U.S. income tax on expected repatriations of non-U.S. earnings. We continue to analyze and adjust the estimated impact of the non-U.S. income and withholding tax liabilities based on the amount and source of these earnings, as well as the expected means through which those earnings may be taxed. We recognized net expense of
$2
for 2017, a net benefit of
$58
for 2016 and expense of
$1
for 2015 related to future income taxes and non-U.S. withholding taxes on repatriations from operations that are not permanently reinvested. We also paid withholding taxes of
$7
,
$6
and
$7
during
2017
,
2016
and
2015
related to the actual transfer of funds to the U.S. The unrecognized tax liability associated with the operations in which we are permanently reinvested is
$5
at December 31, 2017.
89
The earnings of our certain non-U.S. subsidiaries may be repatriated to the U.S. in the form of repayments of intercompany borrowings. Certain of our international operations had intercompany loan obligations to the U.S. totaling
$1,119
at the end of
2017
. Included in this amount are intercompany loans and related interest accruals with an equivalent value of
$23
which are denominated in a foreign currency and considered to be permanently invested.
Valuation allowance adjustments
— We have recorded valuation allowances in several entities where the recent history of operating losses does not allow us to satisfy the “more likely than not” criterion for the recognition of deferred tax assets. Consequently, there is no income tax expense or benefit recognized on the pre-tax income or losses in these jurisdictions as valuation allowances are adjusted to offset the associated tax expense or benefit.
When evaluating the need for a valuation allowance we consider all components of comprehensive income, and we weigh the positive and negative evidence, putting greater reliance on objectively verifiable evidence than on projections of future profitability that are dependent on actions that have not occurred as of the assessment date. We also consider changes to the historical financial results due to activities that were either new to the business or not expected to recur in the future, in order to identify the core earnings of the business. A sustained period of profitability, after considering changes to the historical results due to implemented actions and nonrecurring events, along with positive expectations for future profitability are necessary to reach a determination that a valuation allowance should be released. We believe it is reasonably possible that a valuation allowance of up to
$8
related to a subsidiary in Argentina will be released in the next twelve months.
Prior to 2016, we carried a valuation allowance against deferred tax assets in the U.S. While our U.S. operations have experienced improved profitability in recent years, our analysis of the income of the U.S. operations, as adjusted for changes in historical results due to developments through 2015, demonstrated historical losses as of December 31, 2015. Additionally, there were considerable uncertainties in the U.S. in certain of our end markets. Therefore, we had not achieved a level of sustained profitability that would, in our judgment, support a release of the valuation allowance prior to 2016.
During the fourth quarter of 2016, following the completion of an enterprise wide strategy assessment and our annual
one
- and
five
-year financial plans, the Company assessed the weight of all available positive and negative evidence and determined it was more likely than not that future earnings would be sufficient to realize most of our deferred tax assets in the U.S. Accordingly, we released the U.S. valuation allowance at December 31, 2016, resulting in an income tax benefit of
$501
. In arriving at the conclusion that we had achieved sustained profitability in the U.S., we considered the following positive evidence: we were in a cumulative
three
-year historical income position in the U.S., we had income in seven of the eight previous quarters; we successfully launched a replacement business for one of our largest customer programs for Light Vehicle in the U.S. with actual volumes and margins which were consistent with our forecast in the fourth quarter; we stabilized our U.S. Commercial Vehicle business despite lower than expected volumes and we secured certain new programs with customers that increased our sales backlog in the U.S.
At December 31, 2016, we retained a valuation allowance of
$137
against deferred tax assets in the U.S. primarily related to state operating loss carryforwards and other credits which do not meet the more likely than not criterion for releasing the valuation allowance. During 2017, based on our financial performance and outlook, we determined that
$27
of this allowance met the more-likely-than not standard for release.
At December 31, 2016, our analysis of the operations of a subsidiary in Brazil, adjusted for changes in the historical results due to the effects of developments through the date of the analysis and planned future actions, reflected
three
years of historical cumulative losses and our annual
one
- and
five
-year financial plans forecasted continued near-term losses. Therefore, we determined it was not more likely than not that future earnings will be sufficient to realize the deferred tax assets. Accordingly, we recorded a valuation allowance as of December 31, 2016, resulting in income tax expense of
$25
.
90
Deferred tax assets and liabilities —
Temporary differences and carryforwards give rise to the following deferred tax assets and liabilities.
|
|
2017
|
2016
|
|||||
|
Net operating loss carryforwards
|
$
|
319
|
|
$
|
472
|
|
|
|
Postretirement benefits, including pensions
|
119
|
|
152
|
|
|||
|
Research and development costs
|
85
|
|
113
|
|
|||
|
Expense accruals
|
78
|
|
54
|
|
|||
|
Other tax credits recoverable
|
122
|
|
67
|
|
|||
|
Capital loss carryforwards
|
43
|
|
40
|
|
|||
|
Inventory reserves
|
16
|
|
18
|
|
|||
|
Postemployment and other benefits
|
5
|
|
8
|
|
|||
|
Other
|
|
|
20
|
|
|||
|
Total
|
787
|
|
944
|
|
|||
|
Valuation allowance
|
(301
|
)
|
(285
|
)
|
|||
|
Deferred tax assets
|
486
|
|
659
|
|
|||
|
Unremitted earnings
|
(30
|
)
|
(27
|
)
|
|||
|
Intangibles
|
(22
|
)
|
(29
|
)
|
|||
|
Depreciation
|
(60
|
)
|
(52
|
)
|
|||
|
Other
|
(13
|
)
|
|
|
|||
|
Deferred tax liabilities
|
(125
|
)
|
(108
|
)
|
|||
|
Net deferred tax assets
|
$
|
361
|
|
$
|
551
|
|
|
Carryforwards
—
Our deferred tax assets include benefits expected from the utilization of net operating loss (NOL), capital loss and credit carryforwards in the future. The following table identifies the net operating loss deferred tax asset components and the related allowances that existed at
December 31, 2017
. Due to time limitations on the ability to realize the benefit of the carryforwards, additional portions of these deferred tax assets may become unrealizable in the future.
|
Deferred
Tax
Asset
|
Valuation
Allowance
|
Carryforward
Period
|
Earliest
Year of
Expiration
|
||||||||
|
Net operating losses
|
|
|
|
|
|
|
|||||
|
U.S. federal
|
$
|
135
|
|
$
|
—
|
|
20
|
2029
|
|||
|
U.S. state
|
101
|
|
(81
|
)
|
Various
|
2018
|
|||||
|
Brazil
|
20
|
|
(20
|
)
|
Unlimited
|
|
|||||
|
France
|
9
|
|
|
|
Unlimited
|
|
|||||
|
Australia
|
35
|
|
(35
|
)
|
Unlimited
|
|
|||||
|
Italy
|
7
|
|
(7
|
)
|
Unlimited
|
||||||
|
Germany
|
5
|
|
(5
|
)
|
Unlimited
|
||||||
|
U.K.
|
3
|
|
(3
|
)
|
Unlimited
|
|
|||||
|
Argentina
|
3
|
|
(3
|
)
|
5
|
2018
|
|||||
|
China
|
1
|
|
(1
|
)
|
5
|
2019
|
|||||
|
Total
|
$
|
319
|
|
$
|
(155
|
)
|
|
|
|||
In addition to the NOL carryforwards listed in the table above, we have deferred tax assets related to capital loss carryforwards of
$43
which are fully offset with valuation allowances at
December 31, 2017
. We also have deferred tax assets of
$122
related to other credit carryforwards which are partially offset with
$76
of valuation allowances at
December 31, 2017
. The capital losses can be carried forward indefinitely while the other credits are generally available for
10
to
20
years. We elected to adopt the new guidance for share based payments in the third quarter of 2016, requiring us to reflect any adjustments as of January 1, 2016 in retained earnings. The primary impact of adopting the new guidance was an increase in deferred tax assets of
$32
related to the cumulative excess tax benefits resulting from share-based payments. Because we continued to carry a valuation allowance against certain of our deferred tax assets in the U.S., the increase in deferred tax assets was offset by an increase in our valuation allowance of
$32
, resulting in
no
impact to retained earnings as of January 1, 2016.
91
The use of a portion of our
$643
U.S. federal NOL as of
December 31, 2017
is subject to limitation due to the change in ownership of our stock upon emergence from bankruptcy. Generally, the application of the relevant Internal Revenue Code (IRC) provisions will release the limitation on
$84
of pre-change NOLs each year, allowing pre-change losses to offset post-change taxable income. Through further evaluation and audit adjustment, and after considering U.S. taxable income in 2017, we estimate that
$458
of our U.S. federal NOLs remains subject to limitation as of
December 31, 2017
. The remainder of our U.S. federal NOLs represents a combination of post-change NOLs and pre-change NOLs on which the limitation has been released. However, there can be no assurance that trading in our shares will not effect another change in ownership under the IRC which would further limit our ability to utilize our available NOLs.
Unrecognized tax benefits
— Unrecognized tax benefits are the difference between a tax position taken, or expected to be taken, in a tax return and the benefit recognized for accounting purposes. Interest income or expense, as well as penalties relating to income tax audit adjustments and settlements, are recognized as components of income tax expense or benefit. Interest of
$11
and
$7
was accrued on the uncertain tax positions at
December 31, 2017
and
2016
.
Reconciliation of gross unrecognized tax benefits
—
|
|
2017
|
2016
|
2015
|
||||||||
|
Balance, beginning of period
|
$
|
117
|
|
$
|
87
|
|
$
|
109
|
|
||
|
Decrease related to expiration of statute of limitations
|
(3
|
)
|
(5
|
)
|
(6
|
)
|
|||||
|
Decrease related to prior years tax positions
|
(25
|
)
|
(1
|
)
|
(9
|
)
|
|||||
|
Increase related to prior years tax positions
|
15
|
|
28
|
|
1
|
|
|||||
|
Increase related to current year tax positions
|
15
|
|
8
|
|
8
|
|
|||||
|
Decrease related to settlements
|
|
|
|
|
(16
|
)
|
|||||
|
Balance, end of period
|
$
|
119
|
|
$
|
117
|
|
$
|
87
|
|
||
The 2017 decrease related to prior years tax positions includes
$23
that resulted from the reduction of the U.S. income tax rate from
35%
to
21%
since these positions represent a reduction of U.S. net operating losses. We anticipate that our gross unrecognized tax benefits will decrease by
$17
in the next twelve months upon the expected completion of examinations in various jurisdictions. The settlement of these matters will not impact the effective tax rate. Gross unrecognized tax benefits of
$83
would impact the effective tax rate if recognized. If other open matters are settled with the IRS or other taxing jurisdictions, the total amounts of unrecognized tax benefits for open tax years may be modified.
|
|
2017
|
2016
|
2015
|
||||||||
|
Government grants and incentives
|
$
|
7
|
|
$
|
8
|
|
$
|
3
|
|
||
|
Foreign exchange loss
|
(3
|
)
|
(3
|
)
|
(20
|
)
|
|||||
|
Gain on derecognition of noncontrolling interest
|
|
|
|
|
5
|
|
|||||
|
Strategic transaction expenses
|
(25
|
)
|
(13
|
)
|
(4
|
)
|
|||||
|
Insurance and other recoveries
|
|
|
10
|
|
4
|
|
|||||
|
Gain on sale of marketable securities
|
|
|
7
|
|
1
|
|
|||||
|
Amounts attributable to previously divested/closed operations
|
3
|
|
|
|
1
|
|
|||||
|
Other, net
|
9
|
|
9
|
|
11
|
|
|||||
|
Other income (expense), net
|
$
|
(9
|
)
|
$
|
18
|
|
$
|
1
|
|
||
Foreign exchange gains and losses on cross-currency intercompany loan balances that are not of a long-term investment nature are included above. Foreign exchange gains and losses on intercompany loans that are permanently invested are reported in OCI. During 2015, foreign exchange losses were primarily driven by the impact the strengthening U.S. dollar had on our Mexican peso and euro forward contracts.
Upon completion of the divestiture of our operations in Venezuela in January 2015, we recognized a gain on the derecognition of the noncontrolling interest in a former Venezuelan subsidiary.
Strategic transaction expenses relate primarily to costs incurred in connection with acquisition and divestiture related activities, including costs to complete the transaction and post-closing integration costs. Strategic transaction expenses in 2017 are primarily attributable to our acquisitions of USM - Warren, BFP and BPT. Strategic transaction expenses in 2016 are
92
primarily attributable to our acquisition of SJT Forjaria Ltda. and our divestitures of DCLLC and Nippon Reinz. See Notes 2 and 3 for additional information.
Amounts attributable to previously divested/closed operations includes the receipt of the remaining proceeds on our December 2016 divestiture of DCLLC during the second quarter of 2017. See Note 3 for additional information. During 2016, DCLLC received
$8
as recovery of costs previously incurred on behalf of other participants in a consortium that existed to administer certain legacy personal injury claims, and they sold investments which generated
$7
of gain.
During 2015, we reached a settlement with an insurance carrier for the recovery of previously incurred legal costs.
We are a global provider of high-technology products to virtually every major vehicle and engine manufacturer in the world. We also serve the stationary industrial market. Our technologies include drive and motion products (axles, driveshafts, planetary hub drives, power-transmission products, tire-management products, and transmissions); sealing solutions (gaskets, seals, heat shields, and fuel-cell plates); thermal-management technologies (transmission and engine oil cooling, battery and electronics cooling, and exhaust-gas heat recovery); and fluid-power products (pumps, valves, motors, and controls). We serve our global light vehicle, medium/heavy vehicle and off-highway markets through
four
operating segments – Light Vehicle Driveline Technologies (Light Vehicle), Commercial Vehicle Driveline Technologies (Commercial Vehicle), Off-Highway Drive and Motion Technologies (Off-Highway) and Power Technologies, which is the center of excellence for sealing and thermal-management technologies that span all customers in our on-highway and off-highway markets. These operating segments have global responsibility and accountability for business commercial activities and financial performance.
Dana evaluates the performance of its operating segments based on external sales and segment EBITDA. Segment EBITDA is a primary driver of cash flows from operations and a measure of our ability to maintain and continue to invest in our operations and provide shareholder returns. Our segments are charged for corporate and other shared administrative costs. Segment EBITDA may not be comparable to similarly titled measures reported by other companies.
Segment information
—
|
2017
|
External
Sales
|
Inter-
Segment
Sales
|
Segment
EBITDA
|
Capital
Spend
|
Depreciation
|
Net
Assets
|
||||||||||||||||||
|
Light Vehicle
|
$
|
3,172
|
|
$
|
130
|
|
$
|
359
|
|
$
|
279
|
|
$
|
88
|
|
$
|
1,538
|
|
||||||
|
Commercial Vehicle
|
1,412
|
|
97
|
|
116
|
|
31
|
|
41
|
|
714
|
|
||||||||||||
|
Off-Highway
|
1,521
|
|
4
|
|
212
|
|
32
|
|
40
|
|
724
|
|
||||||||||||
|
Power Technologies
|
1,104
|
|
17
|
|
168
|
|
32
|
|
29
|
|
488
|
|
||||||||||||
|
Eliminations and other
|
|
|
(248
|
)
|
|
|
19
|
|
22
|
|
423
|
|
||||||||||||
|
Total
|
$
|
7,209
|
|
$
|
—
|
|
$
|
855
|
|
$
|
393
|
|
$
|
220
|
|
$
|
3,887
|
|
||||||
|
2016
|
|
|
|
|
|
|
|
|
|
|
|
|
||||||||||||
|
Light Vehicle
|
$
|
2,607
|
|
$
|
113
|
|
$
|
279
|
|
$
|
208
|
|
$
|
71
|
|
$
|
1,194
|
|
||||||
|
Commercial Vehicle
|
1,254
|
|
83
|
|
96
|
|
34
|
|
33
|
|
699
|
|
||||||||||||
|
Off-Highway
|
909
|
|
3
|
|
129
|
|
21
|
|
20
|
|
262
|
|
||||||||||||
|
Power Technologies
|
1,056
|
|
14
|
|
158
|
|
32
|
|
29
|
|
440
|
|
||||||||||||
|
Eliminations and other
|
|
|
(213
|
)
|
|
|
27
|
|
20
|
|
760
|
|
||||||||||||
|
Total
|
$
|
5,826
|
|
$
|
—
|
|
$
|
662
|
|
$
|
322
|
|
$
|
173
|
|
$
|
3,355
|
|
||||||
|
2015
|
|
|
|
|
|
|
|
|
|
|
|
|
||||||||||||
|
Light Vehicle
|
$
|
2,482
|
|
$
|
126
|
|
$
|
262
|
|
$
|
140
|
|
$
|
63
|
|
$
|
1,002
|
|
||||||
|
Commercial Vehicle
|
1,533
|
|
95
|
|
100
|
|
33
|
|
32
|
|
692
|
|
||||||||||||
|
Off-Highway
|
1,040
|
|
3
|
|
147
|
|
18
|
|
20
|
|
310
|
|
||||||||||||
|
Power Technologies
|
1,005
|
|
15
|
|
149
|
|
34
|
|
28
|
|
423
|
|
||||||||||||
|
Eliminations and other
|
|
|
(239
|
)
|
|
|
35
|
|
15
|
|
467
|
|
||||||||||||
|
Total
|
$
|
6,060
|
|
$
|
—
|
|
$
|
658
|
|
$
|
260
|
|
$
|
158
|
|
$
|
2,894
|
|
||||||
93
Prior to the third quarter of 2017, our Crossville, Tennessee distribution center rolled up within our Commercial Vehicle operating segment for purposes of inter-segment sales reporting. Beginning in the third quarter of 2017, the distribution center has been split between our Commercial Vehicle and Off-Highway operating segments. This change in management reporting has resulted in a decrease in the inter-segment sales reported by our Off-Highway operating segment. Prior period amounts have been recast to conform with the current presentation. This change in management reporting had no impact on segment reporting of external sales or segment EBITDA.
Net assets include certain cash balances, accounts receivable, inventories, other current assets, certain intangibles, investments in affiliates, other noncurrent assets, net property, plant and equipment, notes payable and short term debt, accounts payable and current accrued liabilities.
Reconciliation of segment EBITDA to consolidated net income
—
|
|
2017
|
2016
|
2015
|
||||||||
|
Segment EBITDA
|
$
|
855
|
|
$
|
662
|
|
$
|
658
|
|
||
|
Corporate expense and other items, net
|
(20
|
)
|
(2
|
)
|
(6
|
)
|
|||||
|
Depreciation
|
(220
|
)
|
(173
|
)
|
(158
|
)
|
|||||
|
Amortization of intangibles
|
(13
|
)
|
(9
|
)
|
(16
|
)
|
|||||
|
Restructuring charges, net
|
(14
|
)
|
(36
|
)
|
(15
|
)
|
|||||
|
Stock compensation expense
|
(23
|
)
|
(17
|
)
|
(14
|
)
|
|||||
|
Strategic transaction expenses
|
(25
|
)
|
(13
|
)
|
(4
|
)
|
|||||
|
Acquisition related inventory adjustments
|
(14
|
)
|
|
|
|
|
|||||
|
Other items
|
(11
|
)
|
(2
|
)
|
(6
|
)
|
|||||
|
Loss on disposal group held for sale
|
(27
|
)
|
|
|
|
|
|||||
|
Loss on sale of subsidiaries
|
|
|
(80
|
)
|
|
|
|||||
|
Impairment of long-lived assets
|
|
|
|
|
(36
|
)
|
|||||
|
Distressed supplier costs
|
|
(1
|
)
|
(8
|
)
|
||||||
|
Amounts attributable to previously divested/closed operations
|
2
|
|
3
|
|
(6
|
)
|
|||||
|
Gain on derecognition of noncontrolling interest
|
|
|
|
|
5
|
|
|||||
|
Earnings before interest and income taxes
|
490
|
|
332
|
|
394
|
|
|||||
|
Loss on extinguishment of debt
|
(19
|
)
|
(17
|
)
|
(2
|
)
|
|||||
|
Interest expense
|
102
|
|
113
|
|
113
|
|
|||||
|
Interest income
|
11
|
|
13
|
|
13
|
|
|||||
|
Earnings from continuing operations before income taxes
|
380
|
|
215
|
|
292
|
|
|||||
|
Income tax expense (benefit)
|
283
|
|
(424
|
)
|
82
|
|
|||||
|
Equity in earnings (losses) of affiliates
|
19
|
|
14
|
|
(34
|
)
|
|||||
|
Income from continuing operations
|
116
|
|
653
|
|
176
|
|
|||||
|
Income from discontinued operations
|
|
|
|
|
4
|
|
|||||
|
Net income
|
$
|
116
|
|
$
|
653
|
|
$
|
180
|
|
||
Reconciliation of segment net assets to consolidated total assets
—
|
|
2017
|
2016
|
|||||
|
Segment net assets
|
$
|
3,887
|
|
$
|
3,355
|
|
|
|
Accounts payable and other current liabilities
|
1,704
|
|
1,254
|
|
|||
|
Other current and long-term assets
|
53
|
|
251
|
|
|||
|
Consolidated total assets
|
$
|
5,644
|
|
$
|
4,860
|
|
|
94
Geographic information
— Of our
2017
consolidated net sales, the U.S., Italy and Germany account for
45%
,
11%
and
7%
, respectively. No other country accounted for more than
5%
of our consolidated net sales during 2017. Sales are attributed to the location of the product entity recording the sale. Long-lived assets represent property, plant and equipment.
|
|
Net Sales
|
Long-Lived Assets
|
|||||||||||||||||||||
|
|
2017
|
2016
|
2015
|
2017
|
2016
|
2015
|
|||||||||||||||||
|
North America
|
|
|
|
|
|
|
|
|
|
|
|
|
|||||||||||
|
United States
|
$
|
3,209
|
|
$
|
2,695
|
|
$
|
2,805
|
|
$
|
828
|
|
$
|
634
|
|
$
|
441
|
|
|||||
|
Other North America
|
479
|
|
433
|
|
405
|
|
82
|
|
80
|
|
90
|
|
|||||||||||
|
Total
|
3,688
|
|
3,128
|
|
3,210
|
|
910
|
|
714
|
|
531
|
|
|||||||||||
|
Europe
|
|
|
|
|
|
|
|
|
|
|
|
|
|||||||||||
|
Italy
|
762
|
|
499
|
|
570
|
|
122
|
|
58
|
|
58
|
|
|||||||||||
|
Germany
|
473
|
|
377
|
|
368
|
|
149
|
|
98
|
|
100
|
|
|||||||||||
|
Other Europe
|
919
|
|
740
|
|
785
|
|
211
|
|
157
|
|
153
|
|
|||||||||||
|
Total
|
2,154
|
|
1,616
|
|
1,723
|
|
482
|
|
313
|
|
311
|
|
|||||||||||
|
South America
|
500
|
|
338
|
|
377
|
|
153
|
|
172
|
|
99
|
|
|||||||||||
|
Asia Pacific
|
867
|
|
744
|
|
750
|
|
262
|
|
214
|
|
226
|
|
|||||||||||
|
Total
|
$
|
7,209
|
|
$
|
5,826
|
|
$
|
6,060
|
|
$
|
1,807
|
|
$
|
1,413
|
|
$
|
1,167
|
|
|||||
Sales to major customers
— Ford is the only individual customer to whom sales have exceeded
10%
of our consolidated sales in the past three years. Sales to Ford for the three most recent years were
$1,553
(
22%
) in
2017
,
$1,300
(
22%
) in
2016
and
$1,187
(
20%
) in
2015
.
We have a number of investments in entities that engage in the manufacture of vehicular parts – primarily axles, driveshafts and wheel-end braking systems – supplied to OEMs.
Dividends received from equity affiliates were
$16
,
$11
and
$16
in
2017
,
2016
and
2015
.
Equity method investments exceeding
$5
at
December 31, 2017
—
|
Ownership
Percentage |
Investment
|
||||
|
Dongfeng Dana Axle Co., Ltd. (DDAC)
|
50%
|
$
|
97
|
|
|
|
Bendix Spicer Foundation Brake, LLC
|
20%
|
44
|
|
||
|
Axles India Limited
|
48%
|
9
|
|
||
|
Taiway Ltd.
|
14%
|
5
|
|
||
|
All others as a group
|
5
|
|
|||
|
Investments in equity affiliates
|
|
160
|
|
||
|
Investment in affiliates carried at cost
|
3
|
|
|||
|
Investment in affiliates
|
|
$
|
163
|
|
|
Our equity method investments in DDAC, Bendix Spicer Foundation Brake, LLC and Axles India Limited are included in the net assets of our Commercial Vehicle operating segment. Our equity method investment in Taiway Ltd. is included in the net assets of our Light Vehicle segment.
The significant decline in China's commercial vehicle market during 2015 resulted in a series of monthly operating losses by DDAC. These factors when combined with updated long-range plan information received from DDAC in the fourth quarter of 2015, which incorporated China's projected "new normal" future growth rate, indicated that we may not be able to recover the carrying value of our investment in DDAC. During the fourth quarter of 2015, we calculated the fair value of our investment in DDAC to determine if we had an other-than-temporary decline in the carrying value of our investment. We used both the discounted cash flow (an income approach) and guideline public company (a market approach) methods, weighting each equally, to fair value our investment in DDAC. The discounted cash flow method used DDAC's updated long-range plan and focuses on estimating the expected after-tax cash flows attributable to the subject company over its life and converting these after-tax cash flows to present value through discounting. The discount rate of
16.0%
which was used in our assessment
95
accounts for both the time value of money and subject company risk factors. The guideline public company method focuses on comparing a subject company to reasonably similar (or "guideline") publicly-traded companies. Under this method, valuation multiples are: (i) derived from the operating data of selected guideline public companies; (ii) evaluated and adjusted based on the strengths and weaknesses of the subject company relative to the selected guideline companies; and (iii) applied to the operating data of the subject company to arrive at an indication of fair value. The carrying value of our investment in DDAC exceeded the calculated fair value by
$39
. The
$39
impairment charge has been included in equity in earnings of affiliates.
The carrying value of our equity method investments at
December 31, 2017
was
$26
more than our share of the affiliates’ book value, including
$19
attributable to goodwill. The difference between the investment carrying value and the amount of underlying equity in assets, excluding goodwill, is being amortized on a straight-line basis over the underlying assets’ estimated useful lives of
five
to
forty-five
years.
Summarized financial information for DDAC and other equity affiliates on a combined basis
—
|
|
DDAC
|
Other Equity Affiliates Combined
|
|||||||||||||||||||||
|
|
2017
|
2016
|
2015
|
2017
|
2016
|
2015
|
|||||||||||||||||
|
Sales
|
$
|
877
|
|
$
|
646
|
|
$
|
554
|
|
$
|
588
|
|
$
|
498
|
|
$
|
582
|
|
|||||
|
Gross profit
|
$
|
104
|
|
$
|
83
|
|
$
|
45
|
|
$
|
122
|
|
$
|
98
|
|
$
|
113
|
|
|||||
|
Income (loss) before income taxes
|
$
|
28
|
|
$
|
15
|
|
$
|
(14
|
)
|
$
|
41
|
|
$
|
26
|
|
$
|
42
|
|
|||||
|
Net income (loss)
|
$
|
22
|
|
$
|
18
|
|
$
|
(6
|
)
|
$
|
38
|
|
$
|
24
|
|
$
|
40
|
|
|||||
|
Dana's equity in earnings (loss) of affiliate
|
$
|
9
|
|
$
|
7
|
|
$
|
(45
|
)
|
$
|
10
|
|
$
|
7
|
|
$
|
11
|
|
|||||
|
|
DDAC
|
Other Equity
Affiliates Combined
|
|||||||||||||
|
|
2017
|
2016
|
2017
|
2016
|
|||||||||||
|
Current assets
|
$
|
786
|
|
$
|
547
|
|
$
|
186
|
|
$
|
169
|
|
|||
|
Noncurrent assets
|
185
|
|
191
|
|
76
|
|
74
|
|
|||||||
|
Total assets
|
$
|
971
|
|
$
|
738
|
|
$
|
262
|
|
$
|
243
|
|
|||
|
Current liabilities
|
$
|
711
|
|
$
|
512
|
|
$
|
117
|
|
$
|
96
|
|
|||
|
Noncurrent liabilities
|
86
|
|
87
|
|
11
|
|
13
|
|
|||||||
|
Total liabilities
|
$
|
797
|
|
$
|
599
|
|
$
|
128
|
|
$
|
109
|
|
|||
96
Dana Incorporated
Quarterly Results (Unaudited)
(In millions, except per share amounts)
|
2017
|
First
Quarter
|
Second
Quarter
|
Third
Quarter
|
Fourth
Quarter
|
||||||||||||
|
Net sales
|
$
|
1,701
|
|
$
|
1,840
|
|
$
|
1,831
|
|
$
|
1,837
|
|
||||
|
Gross margin
|
$
|
263
|
|
$
|
276
|
|
$
|
269
|
|
$
|
254
|
|
||||
|
Net income (loss)
|
$
|
80
|
|
$
|
73
|
|
$
|
73
|
|
$
|
(110
|
)
|
||||
|
Net income (loss) attributable to the parent company
|
$
|
75
|
|
$
|
71
|
|
$
|
69
|
|
$
|
(104
|
)
|
||||
|
Net income (loss) per share available to parent company common stockholders
|
|
|
|
|
|
|
|
|
||||||||
|
Basic
|
$
|
0.52
|
|
$
|
0.48
|
|
$
|
0.47
|
|
$
|
(0.74
|
)
|
||||
|
Diluted
|
$
|
0.51
|
|
$
|
0.47
|
|
$
|
0.46
|
|
$
|
(0.74
|
)
|
||||
|
2016
|
First
Quarter
|
Second
Quarter
|
Third
Quarter
|
Fourth
Quarter
|
||||||||||||
|
Net sales
|
$
|
1,449
|
|
$
|
1,546
|
|
$
|
1,384
|
|
$
|
1,447
|
|
||||
|
Gross margin
|
$
|
199
|
|
$
|
233
|
|
$
|
208
|
|
$
|
204
|
|
||||
|
Net income
|
$
|
48
|
|
$
|
55
|
|
$
|
61
|
|
$
|
489
|
|
||||
|
Net income attributable to the parent company
|
$
|
45
|
|
$
|
53
|
|
$
|
57
|
|
$
|
485
|
|
||||
|
Net income per share available to parent company common stockholders
|
|
|
|
|
|
|
|
|
||||||||
|
Basic
|
$
|
0.30
|
|
$
|
0.36
|
|
$
|
0.40
|
|
$
|
3.37
|
|
||||
|
Diluted
|
$
|
0.30
|
|
$
|
0.36
|
|
$
|
0.39
|
|
$
|
3.34
|
|
||||
_________________________________________________________
Note: Gross margin is net sales less cost of sales.
The net loss for the fourth quarter of 2017 includes a
$27
pre-tax charge to adjust carrying value of our Brazil suspension components business to fair value and to recognize the liability for the additional cash required to be contributed to the business prior to closing and a tax charge of
$186
to recognize the estimated effects of U.S. tax reform legislation enacted on December 22, 2017. Net income for the third and second quarters of 2017 includes a
$13
and
$6
pre-tax loss on extinguishment of debt. Net income for the fourth quarter of 2016 includes a combined loss of
$80
(
$52
after tax) on the divestiture of our Nippon Reinz Co. Ltd. and Dana Companies, LLC subsidiaries and a
$476
credit resulting from the release of valuation allowance on our U.S. deferred tax assets of
$501
net of an increase in valuation allowance of
$25
in Brazil. Net income for the second quarter of 2016 includes a
$17
pre-tax loss on extinguishment of debt.
97
Dana Incorporated
Schedule II
Valuation and Qualifying Accounts and Reserves
(In millions)
Amounts deducted from assets in the balance sheets
—
|
Balance at
beginning
of period
|
Amounts
charged
(credited)
to income
|
Allowance
utilized
|
Adjustments
arising
from change
in currency
exchange rates
and other items
|
Balance at
end of
period
|
|||||||||||||||
|
Accounts Receivable - Allowance for Doubtful Accounts
|
|||||||||||||||||||
|
2017
|
$
|
6
|
|
$
|
2
|
|
$
|
—
|
|
$
|
—
|
|
$
|
8
|
|
||||
|
2016
|
$
|
5
|
|
$
|
2
|
|
$
|
—
|
|
$
|
(1
|
)
|
$
|
6
|
|
||||
|
2015
|
$
|
6
|
|
$
|
1
|
|
$
|
(1
|
)
|
$
|
(1
|
)
|
$
|
5
|
|
||||
|
Inventory Reserves
|
|||||||||||||||||||
|
2017
|
$
|
51
|
|
$
|
10
|
|
$
|
(11
|
)
|
$
|
3
|
|
$
|
53
|
|
||||
|
2016
|
$
|
46
|
|
$
|
19
|
|
$
|
(13
|
)
|
$
|
(1
|
)
|
$
|
51
|
|
||||
|
2015
|
$
|
48
|
|
$
|
18
|
|
$
|
(16
|
)
|
$
|
(4
|
)
|
$
|
46
|
|
||||
|
Deferred Tax Assets - Valuation Allowance
|
|||||||||||||||||||
|
2017
|
$
|
285
|
|
$
|
29
|
|
$
|
—
|
|
$
|
(13
|
)
|
$
|
301
|
|
||||
|
2016
|
$
|
662
|
|
$
|
(483
|
)
|
$
|
—
|
|
$
|
106
|
|
$
|
285
|
|
||||
|
2015
|
$
|
728
|
|
$
|
(49
|
)
|
$
|
(1
|
)
|
$
|
(16
|
)
|
$
|
662
|
|
||||
98
None.
Item 9A.
Controls and Procedures
Disclosure controls and procedures —
Our management, with the participation of our Chief Executive Officer and Chief Financial Officer, has evaluated the effectiveness of our disclosure controls and procedures (as such term is defined in Rule 13a-15(e) under the Securities Exchange Act of 1934, as amended, (the Exchange Act)) as of the end of the period covered by this report. Based on such evaluations, our Chief Executive Officer and Chief Financial Officer have concluded that, as of the end of such period, our disclosure controls and procedures are effective.
Management's report on internal control over financial reporting —
Our management is responsible for establishing and maintaining adequate internal control over financial reporting, as such term is defined in Exchange Act Rule 13a-15(f). Management, with the participation of the Chief Executive Officer and Chief Financial Officer, has evaluated the effectiveness of our internal control over financial reporting based on the framework in Internal Control – Integrated Framework (2013) issued by the Committee of Sponsoring Organizations of the Treadway Commission. Considering Securities and Exchange Commission guidance, management excluded from its assessment of internal control over financial reporting Warren Manufacturing LLC (USM – Warren) acquired on March 1, 2017 and Brevini Fluid Power S.p.A. (BFP) and Brevini Power Transmission S.p.A. (BPT) acquired on February 1, 2017. BFP, BPT and USM - Warren's total assets and total revenues excluded from management’s assessment represent approximately 2.5%, 6.0% and 1.6% of total assets, respectively and approximately 1.5%, 4.1%, and 1.3% of total revenues, respectively, of the related consolidated financial statement amounts as of and for the year ended December 31, 2017. Based on this evaluation, management has concluded that, as of
December 31, 2017
, our internal control over financial reporting was effective.
Because of its inherent limitations, internal control over financial reporting may not prevent or detect misstatements. Also, projections of any evaluation of effectiveness to future periods are subject to risk that controls may become inadequate because of changes in conditions, or that the degree of compliance with the policies or procedures may deteriorate.
PricewaterhouseCoopers LLP, an independent registered public accounting firm, has audited the effectiveness of our internal control over financial reporting as of
December 31, 2017
, as stated in its report which is included herein.
Changes in internal control over financial reporting —
There has been no change in our internal control over financial reporting during the quarter ended
December 31, 2017
that has materially affected, or is reasonably likely to materially affect, our internal control over financial reporting.
None.
Dana has adopted Standards of Business Conduct that apply to all of its officers and employees worldwide. Dana also has adopted Standards of Business Conduct for the Board of Directors. Both documents are available on Dana’s Internet website at
http://www.dana.com/investors.
The remainder of the response to this item will be included under the sections captioned “Corporate Governance,” “Board Leadership Structure," "Succession Planning,” “Information About the Nominees,” “Risk Oversight,” “Committees and Meetings of Directors,” “Executive Officers” and “Section 16(a) Beneficial Ownership Reporting Compliance” of Dana’s definitive Proxy Statement relating to the Annual Meeting of Shareholders to be held on
April 26, 2018
, which sections are hereby incorporated herein by reference.
The response to this item will be included under the sections captioned “Compensation Committee Interlocks and Insider Participation,” “Compensation of Executive Officers,” “Compensation Discussion and Analysis,” “Compensation of Directors,” “Officer Stock Ownership Guidelines,” “Compensation Committee Report,” “Summary Compensation Table,”
99
“Grants of Plan-Based Awards at Fiscal Year-End,” “Outstanding Equity Awards at Fiscal Year-End,” “Option Exercises and Stock Vested During Fiscal Year,” “Pension Benefits,” “Nonqualified Deferred Compensation at Fiscal Year-End,” “Executive Agreements” and “Potential Payments and Benefits Upon Termination or Change in Control” of Dana’s definitive Proxy Statement relating to the Annual Meeting of Shareholders to be held on
April 26, 2018
, which sections are hereby incorporated herein by reference.
The response to this item will be included under the section captioned “Security Ownership of Certain Beneficial Owners and Management” of Dana’s definitive Proxy Statement relating to the Annual Meeting of Shareholders to be held on
April 26, 2018
, which section is hereby incorporated herein by reference.
Equity Compensation Plan Information
The following table contains information at
December 31, 2017
about shares of stock which may be issued under our equity compensation plans, all of which have been approved by our shareholders.
|
(Shares in millions)
Plan Category
|
Number of Securities to be Issued Upon Exercise of Outstanding Options,
Warrants and Rights
(1)
|
Weighted Average
Exercise Price of Number of Securities to be Issued Upon Exercise of Outstanding Options,
Warrants and Rights
(2)
|
Number of Securities
Remaining Available for Future Issuance
Under Equity Compensation Plans (Excluding Securities Reflected in Column (a))
|
|||||||
|
Equity compensation plans
approved by security holders
|
3.5
|
|
$
|
14.58
|
|
6.3
|
|
|||
|
Equity compensation plans not
approved by security holders
|
||||||||||
|
Total
|
3.5
|
|
$
|
14.58
|
|
6.3
|
|
|||
________________________________________
Notes:
|
(1)
|
In addition to stock options, restricted stock units and performance shares have been awarded under Dana's equity compensation plans and were outstanding at
December 31, 2017
.
|
|
(2)
|
Calculated without taking into account the 2.6 shares of common stock subject to outstanding restricted stock and performance share units that become issuable as those units vest since they have no exercise price and no cash consideration or other payment is required for such shares.
|
The response to this item will be included under the sections captioned “Director Independence and Transactions of Directors with Dana,” “Transactions of Executive Officers with Dana” and “Information about the Nominees” of Dana’s definitive Proxy Statement relating to the Annual Meeting of Shareholders to be held on
April 26, 2018
, which sections are hereby incorporated herein by reference.
The response to this item will be included under the section captioned "Independent Registered Public Accounting Firm" of Dana's definitive Proxy Statement relating to the Annual Meeting of Shareholders to be held on
April 26, 2018
, which section is hereby incorporated herein by reference.
100
Item 15.
Exhibits and Financial Statement Schedules
|
|
|
10-K
Pages
|
|
(a) List of documents filed as a part of this report:
|
|
|
|
1.
|
Consolidated Financial Statements:
|
|
|
|
Report of Independent Registered Public Accounting Firm
|
|
|
|
Consolidated Statement of Operations
|
|
|
|
Consolidated Statement of Comprehensive Income
|
|
|
|
Consolidated Balance Sheet
|
|
|
|
Consolidated Statement of Cash Flows
|
|
|
|
Consolidated Statement of Stockholders' Equity
|
|
|
|
Notes to the Consolidated Financial Statements
|
|
|
2.
|
Quarterly Results (Unaudited)
|
|
|
3.
|
Financial Statement Schedule:
|
|
|
|
Valuation and Qualifying Accounts and Reserves (Schedule II)
|
|
|
|
All other schedules are omitted because they are not applicable or the required information is shown in the financial statements or notes thereto.
|
|
|
4.
|
Exhibits
|
|
|
No.
|
Description
|
|||
|
3.1
|
||||
|
3.2
|
||||
|
3.3
|
||||
|
4.1
|
||||
|
4.2
|
||||
|
4.3
|
||||
|
4.4
|
||||
|
4.5
|
||||
|
4.6
|
||||
|
10.1**
|
||||
101
|
10.2**
|
||||
|
10.3**
|
||||
|
10.4**
|
||||
|
10.5**
|
||||
|
10.6**
|
||||
|
10.7**
|
||||
|
10.8**
|
||||
|
10.9**
|
||||
|
10.10**
|
||||
|
10.11**
|
||||
|
10.12
|
||||
|
10.13
|
||||
|
10.14
|
||||
|
12
|
||||
|
21
|
||||
|
23
|
||||
|
24
|
||||
|
31.1
|
||||
|
31.2
|
||||
|
32
|
||||
|
101
|
The following materials from Dana Incorporated’s Annual Report on Form 10-K for the year ended December 31, 2017, formatted in XBRL (Extensible Business Reporting Language): (i) the Consolidated Statement of Operations, (ii) the Consolidated Statement of Comprehensive Income, (iii) the Consolidated Balance Sheet, (iv) the Consolidated Statement of Cash Flows, (v) the Consolidated Statement of Shareholders’ Equity and (vi) Notes to the Consolidated Financial Statements. Filed with this Report.
|
|||
|
**
|
Management contract or compensatory plan or arrangement.
|
|||
102
SIGNATURES
Pursuant to the requirements of Section 13 or 15(d) of the Securities Exchange Act of 1934, the registrant has duly caused this report to be signed on its behalf by the undersigned, hereunto duly authorized.
|
|
DANA INCORPORATED
|
||
|
|
|
||
|
Date:
|
February 14, 2018
|
By:
|
/s/ James K. Kamsickas
|
|
|
|
James K. Kamsickas
|
|
|
|
|
President and Chief Executive Officer
|
|
Pursuant to the requirements of the Securities Exchange Act of 1934, this report has been signed below on this 14th day of February 2018 by the following persons on behalf of the registrant and in the capacities indicated, including a majority of the directors.
|
Signature
|
Title
|
|
|
|
|
|
|
/s/ James K. Kamsickas
|
President and Chief Executive Officer
|
|
|
James K. Kamsickas
|
(Principal Executive Officer)
|
|
|
/s/ Jonathan M. Collins
|
Executive Vice President and Chief Financial Officer
|
|
|
Jonathan M. Collins
|
(Principal Financial Officer)
|
|
|
/s/ Rodney R. Filcek
|
Senior Vice President and Chief Accounting Officer
|
|
|
Rodney R. Filcek
|
(Principal Accounting Officer)
|
|
|
/s/ Rachel A. Gonzalez*
|
Director
|
|
|
Rachel A. Gonzalez
|
||
|
/s/ Virginia A. Kamsky*
|
Director
|
|
|
Virginia A. Kamsky
|
|
|
|
/s/ Terrence J. Keating*
|
Director
|
|
|
Terrence J. Keating
|
|
|
|
/s/ Raymond E. Mabus, Jr.*
|
Director
|
|
|
Raymond E. Mabus, Jr.
|
||
|
/s/ R. Bruce McDonald*
|
Director
|
|
|
R. Bruce McDonald
|
||
|
/s/ Mark A. Schulz*
|
Director
|
|
|
Mark A. Schulz
|
|
|
|
/s/ Keith E. Wandell*
|
Non-Executive Chairman and Director
|
|
|
Keith E. Wandell
|
|
|
|
*By:
|
/s/ Douglas H. Liedberg
|
|
|
|
|
Douglas H. Liedberg, Attorney-in-Fact
|
|
|
103
TABLE OF CONTENTS
Part IItem 1. BusinessItem 1A. Risk FactorsItem 1B. Unresolved Staff CommentsItem 2. PropertiesItem 3. Legal ProceedingsPart IIItem 5. Market For Registrant S Common Equity, Related Stockholder Matters and Issuer Purchases Of Equity SecuritiesItem 6. Selected Financial DataItem 7. Management S Discussion and Analysis Of Financial Condition and Results Of Operations (dollars in Millions)Item 7A. Quantitative and Qualitative Disclosures About Market RiskItem 8. Financial Statements and Supplementary DataNote 1. Organization and Summary Of Significant Accounting PoliciesNote 2. AcquisitionsNote 3. Disposal Groups, Divestitures and Impairment Of Long-lived AssetsNote 4. Goodwill and Other Intangible AssetsNote 5. Restructuring Of OperationsNote 6. InventoriesNote 7. Supplemental Balance Sheet and Cash Flow InformationNote 8. Stockholders' EquityNote 9. Redeemable Noncontrolling InterestsNote 10. Earnings Per ShareNote 11. Stock CompensationNote 12. Pension and Postretirement Benefit PlansNote 13. Marketable SecuritiesNote 14. Financing AgreementsNote 15. Fair Value Measurements and DerivativesNote 16. Commitments and ContingenciesNote 17. Warranty ObligationsNote 18. Income TaxesNote 19. Other Income (expense), NetNote 20. Segments, Geographical Area and Major Customer InformationNote 21. Equity AffiliatesItem 9. Changes in and Disagreements with Accountants on Accounting and Financial DisclosureItem 9A. Controls and ProceduresItem 9B. Other InformationPart IIIItem 10. Directors, Executive Officers and Corporate GovernanceItem 11. Executive CompensationItem 12. Security Ownership Of Certain Beneficial Owners and Management and Related Stockholder MattersItem 13. Certain Relationships and Related Transactions and Director IndependenceItem 14. Principal Accountant Fees and ServicesPart IVItem 15. Exhibits and Financial Statement Schedules