DEUTSCHE BANK AKTIENGESELLSCHAFT
DB 20-F Report ended Dec. 31, 2021
|
|
Deutsche Bank
|
Item 3: Key Information
|
|
|
Annual Report 2021 on Form 20-F
|
|
|
|
|
|
As filed with the Securities and Exchange Commission on March 11, 2022
UNITED STATES
SECURITIES EXCHANGE COMMISSION
WASHINGTON, D.C. 20549
Form
20-F
☐
REGISTRATION STATEMENT PURSUANT TO SECTION 12(b) OR (g) OF THE SECURITIES
EXCHANGE ACT OF 1934
or
☒
ANNUAL REPORT PURSUANT TO SECTION 13 OR 15(d) OF THE SECURITIES EXCHANGE
ACT OF 1934 FOR THE FISCAL YEAR ENDED
DECEMBER 31, 2021
or
☐
TRANSITION REPORT PURSUANT TO SECTION 13 OR 15(d) OF THE SECURITIES
EXCHANGE ACT OF 1934
or
☐
SHELL COMPANY REPORT PURSUANT TO SECTION 13 OR 15(d) OF THE SECURITIES
EXCHANGE ACT OF 1934
Date of event requiring this shell company report……………………………….
Commission file number 1-15242
Deutsche Bank Aktiengesellschaft
(Exact name of Registrant as specified in its charter)
Deutsche Bank Corporation
(Translation of Registrant’s name into English)
Federal Republic of Germany
(Jurisdiction of incorporation or organization)
Taunusanlage 12, 60325 Frankfurt am Main, Germany
(Address of principal executive offices)
Brigitte Bomm, +49-69-910-33996, brigitte.bomm@db.com, Taunusanlage 12, 60325 Frankfurt am Main, Germany
(Name, Telephone, E-mail and/or Facsimile number and Address of Company Contact Person)
Securities registered or to be registered pursuant to Section 12(b) of the Act
See following page
Securities registered or to be registered pursuant to Section 12(g) of the Act.
NONE
(Title of Class)
Securities for which there is a reporting obligation pursuant to Section 15(d) of the Act.
NONE
(Title of Class)
Indicate the number of outstanding shares of each of the issuer’s classes of capital or common stock as of the close of the period covered by the annual report:
|
Ordinary Shares, no par value
|
|
(as of December 31, 2021)
|
1
|
|
|
Deutsche Bank
|
Item 3: Key Information
|
|
|
Annual Report 2021 on Form 20-F
|
|
|
|
|
|
Indicate by check mark if the registrant is a well-known seasoned issuer, as defined in Rule 405 of the Securities Act.
If this report is an annual or transition report, indicate by check mark if the registrant is not required to file reports pursuant to Section 13 or 15(d) of the Securities Exchange Act of 1934.
Yes
☐
No
☒
Indicate by check mark whether the registrant (1) has filed all reports required to be filed by Section 13 or 15(d) of the Securities Exchange Act of 1934 during the preceding 12
months (or for such shorter period that the registrant was required to file such reports), and (2) has been subject to such filing requirements for the past 90 days.
Yes
☒
No
☐
Indicate by check mark whether the registrant has submitted electronically every Interactive Data File required to be submitted pursuant to Rule 405 of Regulation S-T (§232.405 of this chapter) during the preceding 12 months (or for such shorter period that the registrant was required to submit such files).
Indicate by check mark whether the registrant is a large accelerated filer, an accelerated filer, a non-accelerated filer, or an emerging growth company. See definition of “large accelerated filer”, “accelerated filer”, and emerging growth company in Rule 12b-2 of the Exchange Act.
Non-accelerated filer
☐
Emerging growth company
☐
If an emerging growth company that prepares its financial statements in accordance with U.S. GAAP, indicate by check mark if the registrant has elected not to use the extended transition period for complying with any new or revised financial accounting standards* provided pursuant to Section 13(a) of the Exchange Act.
☐
*The term “new or revised financial accounting standard” refers to any update issued by the Financial Accounting Standards Board to its Accounting Standards Codification after April 5, 2012.
Indicate by check mark whether the registrant has filed a report on and attestation to its management’s assessment of the effectiveness of its internal control over financial reporting under Section 404(b) of the Sarbanes-Oxley Act (15 U.S.C. 7262(b)) by the registered public accounting firm that prepared or issued its audit report.
☒
Indicate by check mark which basis of accounting the registrant has used to prepare the financial statements included in this filing:
U.S. GAAP
☐
International Financial Reporting Standards
☒
Other
☐
as issued by the International Accounting Standards Board
If “Other” has been checked in response to the previous question, indicate by check mark which financial statement item the registrant has elected to follow
Item 17
☐
Item 18
☐
If this is an annual report, indicate by check mark whether the registrant is a shell company (as defined in Rule 12b-2 of the Exchange Act).
Yes
☐
No
☒
(APPLICABLE ONLY TO ISSUERS INVOLVED IN BANKRUPTCY PROCEEDINGS DURING THE PAST FIVE YEARS)
Indicate by check mark whether the registrant has filed all documents and reports required to be filed by Sections 12, 13 or 15(d) of the
Securities Exchange Act of 1934 subsequent to the distribution of securities under a plan confirmed by a court.
Yes
☐
No
☐
Securities registered or to be registered pursuant to Section 12(b) of the Act (as of February 28, 2022)
|
Title of each class
|
Trading Symbol(s)
|
Name of each exchange
on which registered
|
|
Ordinary shares, no par value
|
DB
|
New York Stock Exchange
|
|
Fixed to Fixed Reset Rate Subordinated Tier 2 Notes Due 2028
|
DB /28
|
New York Stock Exchange
|
|
4.50
% Fixed Rate Subordinated Tier 2 Notes Due 2025
|
DB 25
|
New York Stock Exchange
|
|
DB Gold Double Long Exchange Traded Notes due February 15, 2038
|
DGP
|
NYSE Arca
|
|
DB Gold Double Short Exchange Traded Notes due February 15, 2038
|
DZZ
|
NYSE Arca
|
|
DB Gold Short Exchange Traded Notes due February 15, 2038
|
DGZ
|
NYSE Arca
|
|
2
|
|
|
Deutsche Bank
|
Item 3: Key Information
|
|
|
Annual Report 2021 on Form 20-F
|
|
|
|
|
|
Table of Contents
Table of Contents – 3
PART I – 9
Item 1: Identity of Directors, Senior Management and Advisers – 9
Item 2: Offer Statistics and Expected Timetable – 9
Item 3: Key Information – 9
Dividends – 10
Capitalization and Indebtedness – 11
Reasons for the Offer and Use of Proceeds – 11
Risk Factors – 12
Item 4: Information on the Company – 56
History and Development of the Company – 56
Business Overview – 56
The Competitive Environment – 63
Regulation and Supervision – 71
Organizational Structure – 89
Property and Equipment – 89
Information required by subpart 1400 of SEC Regulation S-K – 89
Item 4A: Unresolved Staff Comments – 90
Item 5: Operating and Financial Review and Prospects – 90
Overview – 90
Significant Accounting Policies and Critical Accounting Estimates – 90
Recently Adopted Accounting Pronouncements and New Accounting Pronouncements – 91
Operating Results – 92
Results of Operations – 93
Financial Position – 93
Liquidity and Capital Resources – 93
Post-Employment Benefit Plans – 93
Off-Balance Sheet Arrangements – 94
Tabular Disclosure of Contractual Obligations – 94
Research and Development, Patents and Licenses – 94
Item 6: Directors, Senior Management and Employees – 95
Directors and Senior Management – 95
Board Practices of the Management Board – 97
Compensation – 98
Employees – 99
Share Ownership – 99
Item 7: Major Shareholders and Related Party Transactions – 100
Major Shareholders – 100
Related Party Transactions – 102
Interests of Experts and Counsel – 102
Item 8: Financial Information – 103
Consolidated Statements and Other Financial Information – 103
Significant Changes – 106
Item 9: The Offer and Listing – 107
Offer and Listing Details and Markets – 107
Plan of Distribution – 107
Selling Shareholders – 107
Dilution – 107
Expenses of the Issue – 107
Item 10: Additional Information – 108
Share Capital – 108
Memorandum and Articles of Association – 108
Notification Requirements – 111
|
3
|
|
|
Deutsche Bank
|
Item 3: Key Information
|
|
|
Annual Report 2021 on Form 20-F
|
|
|
|
|
|
Material Contracts – 115
Exchange Controls – 115
Taxation – 115
Dividends and Paying Agents – 118
Statement by Experts – 118
Documents on Display – 118
Subsidiary Information – 118
Item 11: Quantitative and Qualitative Disclosures about Credit, Market and Other Risk – 118
Item 12: Description of Securities other than Equity Securities – 119
PART II – 120
Item 13: Defaults, Dividend Arrearages and Delinquencies – 120
Item 14: Material Modifications to the Rights of Security Holders and Use of Proceeds – 120
Item 15: Controls and Procedures – 120
Disclosure Controls and Procedures – 120
Management’s Annual Report on Internal Control over Financial Reporting – 121
Report of Independent Registered Public Accounting Firm – 121
Change in Internal Control over Financial Reporting – 122
Item 16A: Audit Committee Financial Expert – 122
Item 16B: Code of Ethics – 122
Item 16C: Principal accountant fees and services – 122
Item 16D: Exemptions from the Listing Standards for Audit Committees – 123
Item 16E: Purchases of Equity Securities by the Issuer and Affiliated Purchasers – 124
Item 16F: Change in Registrant’s Certifying Accountant – 125
Item 16G: Corporate Governance – 125
Item 16H: Mine Safety Disclosure – 127
Item 16I: Disclosure Regarding Foreign Jurisdictions that Prevent Inspections – 127
Disclosures Under Iran Threat Reduction and Syria Human Rights Act of 2012 – 128
PART III – 130
Item 17: Financial Statements – 130
Item 18: Financial Statements – 130
Item 19: Exhibits – 130
Signatures – 131
Annual Report – 1
Supplemental Financial Information (Unaudited) – S-1
|
4
|
|
|
Deutsche Bank
|
Item 3: Key Information
|
|
|
Annual Report 2021 on Form 20-F
|
|
|
|
|
|
Deutsche Bank Aktiengesellschaft, which we also call Deutsche Bank AG, is a stock corporation organized under the laws of the Federal Republic of Germany. Unless otherwise specified or required by the context, in this document, references to “we”, “us”, “our”, “the Group”, “Deutsche Bank” and “Deutsche Bank Group” are to Deutsche Bank Aktiengesellschaft and its consolidated subsidiaries.
Due to rounding, numbers presented throughout this document may not add up precisely to the totals we provide and percentages may not precisely reflect the absolute figures.
Our registered address is Taunusanlage 12, 60325 Frankfurt am Main, Germany, and our telephone number is +49-69-910-00.
Inclusion of Our Annual Report
We have included as an integral part of this Annual Report on Form 20-F our Annual Report 2021, to which we refer to the responses to certain items hereof. Certain portions of the Annual Report 2021 have been omitted, as indicated therein. The included Annual Report 2021 contains our Consolidated Financial Statements, which we refer to in response to Items 8 and 18.
The Annual Report 2021 and Consolidated Financial Statements included herein differ from those we publish for other purposes (the “non-SEC” versions thereof) in that the financial information presented in the Annual Report 2021 and Consolidated Financial Statements included herein has been prepared in accordance with International Financial Reporting Standards (“IFRS”) as issued by the International Accounting Standards Board (“IASB”). The financial information presented in the non-SEC Annual Report 2021 and Consolidated Financial Statements included therein, by contrast, has been prepared in accordance with IFRS as issued by the IASB and endorsed by the European Union (EU), including, effective as of January 1, 2020, the application of fair value hedge accounting for portfolio hedges of interest rate risk (fair value macro hedges) in accordance with the EU carve-out version of IAS 39. For further information, see Note 1, “Significant accounting policies and critical accounting estimates – Basis of accounting – EU carve-out” to the Consolidated Financial Statements.
Such Consolidated Financial Statements differ from those contained in the Annual Report 2021 used for other purposes (the “non-SEC financial statements”) in that (i) Notes 42, 43 and 44 of the non-SEC financial statements, which address non-U.S. requirements, have been deleted, (ii) Notes 45 and 46 of the non-SEC financial statements are set forth as Notes 42 and 43, respectively, of the included financial statements and (iii) Note 44, which addresses U.S. requirements, has been added to the included financial statements.
The Consolidated Financial Statements as of and for the years ended December 31, 2021 and 2020 have been audited by Ernst Young GmbH Wirtschaftsprüfungsgesellschaft, as described in their “Report of Independent Registered Public Accounting Firm” included in the Annual Report 2021.
The Consolidated Financial Statements as of and for the year ended December 31, 2019 have been audited by KPMG AG Wirtschaftsprüfungsgesellschaft, as described in their “Report of Independent Registered Public Accounting Firm” included in the Annual Report 2021.
Such reports are included only in the version of the Annual Report 2021 included in this Annual Report on Form 20-F.
Cautionary Statement Regarding Forward-Looking Statements
We make certain forward-looking statements in this document with respect to our financial condition and results of operations. In this document, forward-looking statements include, among others, statements relating to:
- – the potential development and impact on us of economic and business conditions and the legal and regulatory environment to which we are subject, including as a result of the COVID-19 pandemic and the large-scale Russian military action against Ukraine;
- – the implementation of our strategic initiatives and other responses thereto;
- – the development of aspects of our results of operations;
- – our expectations of the impact of risks that affect our business, including the risks of losses on our trading processes and credit exposures; and
- – other statements relating to our future business development and economic performance.
In addition, we may from time to time make forward-looking statements in our periodic reports to the United States Securities and Exchange Commission on Form 6-K, annual and interim reports, invitations to Annual General Meetings and other information sent to shareholders, offering circulars and prospectuses, press releases and other written materials. Our Management Board, Supervisory Board, officers and employees may also make oral forward-looking statements to third parties, including financial analysts.
|
5
|
|
|
Deutsche Bank
|
Item 3: Key Information
|
|
|
Annual Report 2021 on Form 20-F
|
|
|
|
|
|
Forward-looking statements are statements that are not historical facts, including statements about our beliefs and expectations. We use words such as “believe”, “anticipate”, “expect”, “intend”, “seek”, “estimate”, “project”, “should”, “potential”, “reasonably possible”, “plan”, “aim” and similar expressions to identify forward-looking statements.
By their very nature, forward-looking statements involve risks and uncertainties, both general and specific. We base these statements on our current plans, estimates, projections and expectations. You should therefore not place too much reliance on them. Our forward-looking statements speak only as of the date we make them, and we undertake no obligation to update any of them in light of new information or future events.
We caution you that a number of important factors could cause our actual results to differ materially from those we describe in any forward-looking statement. These factors include, among others, the following:
- – the potential development and impact on us of economic and business conditions, including as a result of the COVID-19 pandemic and the large-scale Russian military action against Ukraine;
- – other changes in general economic and business conditions;
- – changes and volatility in currency exchange rates, interest rates and asset prices;
- – changes in governmental policy and regulation, including measures taken in response to economic, business, political and social conditions;
- – the potential development and impact on us of legal and regulatory proceedings to which we are or may become subject;
- – changes in our competitive environment;
- – the success of our acquisitions, divestitures, mergers and strategic alliances;
- – our success in implementing our strategic initiatives and other responses to economic and business conditions and the legal and regulatory environment and realizing the benefits anticipated therefrom; and
- – other factors, including those we refer to in “Item 3: Key Information – Risk Factors” and elsewhere in this document and others to which we do not refer.
|
6
|
|
|
Deutsche Bank
|
Item 3: Key Information
|
|
|
Annual Report 2021 on Form 20-F
|
|
|
|
|
|
Use of Non-GAAP Financial Measures
This document and other documents we have published or may publish contain non-GAAP financial measures. Non-GAAP financial measures are measures of our historical or future performance, financial position or cash flows that contain adjustments that exclude or include amounts that are included or excluded, as the case may be, from the most directly comparable measure calculated and presented in accordance with IFRS in our financial statements. Examples of our non-GAAP financial measures, and the most directly comparable IFRS financial measures, are as follows:
|
Non-GAAP Financial Measure
|
Most Directly Comparable IFRS Financial Measure
|
|
Adjusted profit (loss) before tax, Adjusted profit (loss) before tax ex BGH ruling on pricing agreements
|
Profit (loss) before tax
|
|
Profit (loss) attributable to Deutsche Bank shareholders for the segments, Profit (loss) attributable to Deutsche Bank shareholders after AT1 coupon for the segments, Adjusted profit (loss) attributable to Deutsche Bank shareholders, Adjusted profit (loss) ex BGH ruling on pricing agreements, Adjusted Profit (loss) attributable to Deutsche Bank shareholders ex BGH ruling on pricing agreements
|
Profit (loss)
|
|
Revenues excluding specific items, Revenues on a currency – adjusted basis, Revenues adjusted for forgone revenues due to BGH ruling
|
Net revenues
|
|
Adjusted costs, Adjusted costs excluding transformation charges, Adjusted costs excluding transformation charges and expenses eligible for reimbursement related to Prime Finance
|
Noninterest expenses
|
|
Net assets (adjusted)
|
Total assets
|
|
Tangible shareholders’ equity, Average tangible shareholders’ equity, Tangible book value, Average tangible book value
|
Total shareholders’ equity (book value)
|
|
Post-tax return on average tangible shareholders’ equity, Post-tax return on average shareholders’ equity (based on profit (loss) attributable to Deutsche bank shareholders after AT 1 coupon), adjusted post-tax return on equity measures
|
Post-tax return on total shareholders’ equity
|
|
Tangible book value per basic share outstanding, Book value per basic share outstanding
|
Book value per share outstanding
|
|
|
For descriptions of these non-GAAP financial measures and the adjustments made to the most directly comparable financial measures under IFRS, please refer to “Supplementary Information (Unaudited): Non-GAAP Financial Measures”, which is incorporated by reference herein.
When used with respect to future periods, our non-GAAP financial measures are also forward-looking statements. We cannot predict or quantify the levels of the most directly comparable financial measures under IFRS that would correspond to these measures for future periods. This is because neither the magnitude of such IFRS financial measures, nor the magnitude of the adjustments to be used to calculate the related non-GAAP financial measures from such IFRS financial measures, can be predicted. Such adjustments, if any, will relate to specific, currently unknown, events and in most cases can be positive or negative, so that it is not possible to predict whether, for a future period, the non-GAAP financial measure will be greater than or less than the related IFRS financial measure.
|
7
|
|
|
Deutsche Bank
|
Item 3: Key Information
|
|
|
Annual Report 2021 on Form 20-F
|
|
|
|
|
|
Regulatory fully loaded measures
Our regulatory assets, exposures, risk-weighted assets, capital and ratios thereof are calculated for regulatory purposes and set forth throughout this document under the regulation on prudential requirements for credit institutions and investment firms (“CRR”) and the Capital Requirements Directive (“CRD”), including recent amendments. Unless otherwise noted, our CRR/CRD solvency measures set forth in this document are calculated under the CRR/CRD as currently applicable. We present in this report certain figures based on the CRR definition of own fund instruments applicable for Additional Tier 1 (AT1) capital and Tier 2 (T2) capital and figures based thereon, including Tier 1, Total Capital and Leverage Ratio, on a “fully loaded” basis. We calculate such “fully loaded” figures excluding the transitional (or “phase-in”) arrangements for own fund instruments as provided in the currently applicable CRR/CRD. Our CET1 and RWA figures include the transitional impacts from the IFRS 9 add-back also in the “fully-loaded” figures given it is an immaterial difference. Measures calculated pursuant to our fully loaded methodology are non-GAAP financial measures.
We believe that these “fully loaded” calculations provide useful information to investors as they reflect our progress against known future regulatory capital standards. Many of our competitors have been describing calculations on a “fully loaded” basis, however, our competitors’ assumptions and estimates regarding “fully loaded” calculations may vary such that our “fully loaded” measures may not be comparable with similarly labelled measures used by our competitors.
For descriptions of these fully loaded CRR/CRD measures and the differences from the most directly comparable measures under the CRR/CRD transitional rules, please refer to the following sections of the Annual Report 2021, each of which is incorporated by reference herein: (i) “Management Report: Risk Report: Risk and Capital Performance: Capital, Leverage Ratio and MREL”, in particular the subsections thereof entitled “Development of Own Funds”, “Development of Risk-Weighted Assets” and “Leverage Ratio”, and (ii) “Supplementary Information (Unaudited): Non-GAAP Financial Measures: Regulatory fully loaded measures”.
When used with respect to future periods, our fully loaded CRR/CRD measures are also forward-looking statements. We cannot predict or quantify the levels of the most directly comparable transitional CRR/CRD measures that would correspond to these fully loaded CRR/CRD measures for future periods. We manage our business with the aim of achieving targets based on fully loaded CRR/CRD measures. Accordingly, the relation between the fully loaded and transitional measures may be variable and will depend upon, among other things, management action taken in light of future business, economic and other conditions.
Use of Internet Addresses
This document contains inactive textual addresses of Internet websites operated by us and third parties. Reference to such websites is made for informational purposes only, and information found at such websites is not incorporated by reference into this document.
|
8
|
|
|
Deutsche Bank
|
Item 3: Key Information
|
|
|
Annual Report 2021 on Form 20-F
|
|
|
|
|
|
PART I
Item 1: Identity of Directors, Senior Management and Advisers
Not required because this document is filed as an annual report.
Item 2: Offer Statistics and Expected Timetable
Not required because this document is filed as an annual report.
Item 3: Key Information
|
9
|
|
|
Deutsche Bank
|
Signatures
|
|
|
Annual Report 2021 on Form 20-F
|
Change in Internal Control over Financial Reporting
|
|
|
|
|
Dividends
The following table shows the dividend per share in euro and in U.S. dollars for the years ended December 31, 2021, 2020, 2019, 2018 and 2017. We declare our dividends at our Annual General Meeting following each year. For 2021, the Management Board proposes to the Annual General Meeting to pay a dividend of € 0.20 per share. Our dividends are based on the non-consolidated results of Deutsche Bank AG as prepared in accordance with German accounting principles. Because we declare our dividends in euro, the amount an investor actually receives in any other currency depends on the exchange rate between euro and that currency at the time the euros are converted into that currency.
In general, the German withholding tax applicable to dividends is 26.375 % (consisting of a 25 % withholding tax and an effective 1.375 % surcharge). Under the German Investment Tax Act, dividends received by a fund within the meaning of the German Investment Tax Act are subject to 15 % German withholding tax equal to the Treaty tax rate. For individual German tax residents, the withholding tax paid represents for private dividends, generally, the full and final income tax applicable to the dividends. Dividend recipients who are tax residents of countries that have entered into a convention for avoiding double taxation may be eligible to receive a refund from the German tax authorities for a portion of the amount withheld and in addition may be entitled to receive a tax credit for the German withholding tax not refunded in accordance with their local tax law.
Generally, U.S. residents will be entitled to receive a refund equal to 11.375 % of the dividends paid. For US federal income tax purposes, the dividends we pay are not eligible for the dividends received deduction generally allowed for dividends received by US corporations from other US corporations.
Dividends in the table below are presented before German withholding tax.
See “Item 10: Additional Information – Taxation” for more information on the tax treatment of our dividends.
|
|
|
|
|
|
|
Payout ratio
2,3
|
||
|
|
|
Dividends
per share
1
|
|
Dividends
per share
|
|
Basic earnings
per share
|
|
Diluted earnings
per share
|
|
2021 (proposed)
|
|
$ 0.23
|
|
€ 0.20
|
|
20%
|
|
21%
|
|
2020
|
|
$ 0.00
|
|
€ 0.00
|
|
0%
|
|
0%
|
|
2019
|
|
$ 0.00
|
|
€ 0.00
|
|
N/M
|
|
N/M
|
|
2018
|
|
$ 0.13
|
|
€ 0.11
|
|
N/M
|
|
N/M
|
|
2017
|
|
$ 0.13
|
|
€ 0.11
|
|
N/M
|
|
N/M
|
|
|
|
|
|
|
|
|
|
|
N/M – Not meaningful
1
For your convenience, we present dividends in U.S. dollars for each year by translating the euro amounts at the period end rate for the last business day of each year.
2
We define our payout ratio as the dividends we paid per share in respect of each year as a percentage of our basic and diluted earnings per share for that year.
3
The number of average basic and diluted shares outstanding has been adjusted in order to reflect the effect of the bonus element of the subscription rights issue in connection with the capital increase in April 2017. For 2019 and 2017, there was no dilutive effect as the Group reported a net loss attributable to shareholders and no dilutive effect for 2018 as net income was offset by AT1 coupons paid.
|
10
|
|
|
Deutsche Bank
|
Signatures
|
|
|
Annual Report 2021 on Form 20-F
|
Change in Internal Control over Financial Reporting
|
|
|
|
|
Capitalization and Indebtedness
Consolidated capitalization in accordance with IFRS as issued by the IASB as of December 31, 2021
|
|
|
in € m.
|
|
Debt:
1,2
|
|
|
|
Long-term debt
|
|
144,485
|
|
Trust preferred securities
|
|
528
|
|
Long-term debt at fair value through profit or loss
|
|
3,699
|
|
Total debt
|
|
148,712
|
|
|
|
|
|
Shareholders’ equity:
|
|
|
|
Common shares (no par value)
|
|
5,291
|
|
Additional paid-in capital
|
|
40,580
|
|
Retained earnings
|
|
12,680
|
|
Common shares in treasury, at cost
|
|
(6)
|
|
Accumulated other comprehensive income, net of tax
|
|
|
|
Unrealized net gains (losses) on financial assets at fair value through other comprehensive income, net of tax and other
|
|
(124)
|
|
Unrealized net gains (losses) on derivatives hedging variability of cash flows, net of tax
|
|
(33)
|
|
Unrealized net gains (losses) on assets classified as held for sale, net of tax
|
|
0
|
|
Unrealized net gains (losses) attributable to change in own credit risk of financial liabilities designated at fair value through profit and loss, net of tax
|
|
(3)
|
|
Foreign currency translation, net of tax
|
|
(282)
|
|
Unrealized net gains (losses) from equity method investments
|
|
(6)
|
|
Total shareholders’ equity
|
|
58,096
|
|
Equity component of financial instruments
|
|
8,305
|
|
Noncontrolling interests
|
|
1,698
|
|
Total equity
|
|
68,099
|
|
Total capitalization
|
|
216,810
|
|
|
|
|
1
€ 734 million (0.5 %) of our debt was guaranteed by the German government as of December 31, 2021 related to legacy positions assumed in the context of the Postbank takeover.
2
€ 63,928 million (43 %) of our debt was secured as of December 31, 2021.
Reasons for the Offer and Use of Proceeds
Not required because this document is filed as an annual report.
|
11
|
|
|
Deutsche Bank
|
Signatures
|
|
|
Annual Report 2021 on Form 20-F
|
Change in Internal Control over Financial Reporting
|
|
|
|
|
Risk Factors
An investment in our securities involves a number of risks. You should carefully consider the following information about the risks we face, together with other information in this document, when you make investment decisions involving our securities. If one or more of these risks were to materialize, it could have a material adverse effect on our financial condition, results of operations, cash flows or prices of our securities.
Summary of Risk Factors
Risks Relating to the Macroeconomic, Geopolitical and Market Environment
.
As a global corporate and investment bank with a large private client franchise, our businesses are materially affected by global macroeconomic and financial market conditions. Significant challenges may arise from economic growth prospects, the interest rate environment, inflationary pressure, supply chain disruptions and geopolitical risks as well as higher market volatility, potential deterioration of international trade relations, and weakness of global, regional and national economic conditions. Such risks exist in particular from the COVID-19 pandemic and its ongoing impacts and the large-scale Russian military action against Ukraine. Other risks exist with respect to China and from political and economic instability in key markets. These risks could negatively affect the business environment, leading to weaker economic activity and a broader correction in the financial markets. Materialization of these risks could negatively affect the results of operations in some of our businesses and our financial condition as well as our strategic plans. Our ability to protect ourselves against these risks is limited.
Risks Relating to Our Business and Strategy
.
Our results of operation and financial condition have in the past been negatively impacted by the market environment, uncertain macroeconomic and geopolitical conditions, lower levels of client activity, increased competition and regulation, and the immediate impact of our strategic decisions. If we are unable to improve our profitability, we may be unable to meet our strategic aspirations, and may have difficulty maintaining capital, liquidity and leverage at levels expected by market participants and our regulators. Adverse market conditions, asset price deteriorations, volatility and cautious investor sentiment have affected and may in the future materially and adversely affect our revenues and profits, particularly in our investment banking, brokerage and other commission- and fee-based businesses.
Intense competition, in our home market of Germany as well as in international markets, has and could continue to have a material adverse impact on our revenues and profitability.
Our liquidity, business activities and profitability may be adversely affected by an inability to access the debt capital markets or to sell assets during periods of market-wide or firm-specific liquidity constraints. Credit rating downgrades have contributed to increases in our funding costs in the past, and any future downgrade could materially adversely affect our funding costs, the willingness of counterparties to continue to do business with us and significant aspects of our business model.
If we are unable to implement our strategic plans successfully, we may be unable to achieve our financial objectives.
Risks Relating to environmental, social and governance (ESG)-related changes
.
The impacts of rising global temperatures, and the enhanced focus on climate change and the transition to a “net-zero” economy from society, our regulators and the banking sector, have given rise to the risk that climate change may impact our business activities, to reputational risk if we are not seen to support ESG objectives and to the risk that our portrayal of the ESG aspects of our activities does not adhere to evolving ESG standards.
Risks Relating to Regulation and Supervision
.
Regulatory reforms, together with increased regulatory scrutiny more generally, have had and continue to have a significant impact on us and may adversely affect our business and ability to execute our strategic plans. Competent regulators may prohibit us from making dividend payments or payments on our regulatory capital instruments, suspend certain activities or take other actions if we fail to comply with regulatory requirements.
Regulatory changes may impact how key entities are funded which could affect how businesses operate and negatively impact results. Regulatory actions may also require us to change our business model or result in some business activities becoming unviable. Regulatory and legislative changes require us to maintain increased capital and debt that can be bailed in in a resolution scenario and abide by tightened liquidity requirements. Any perceptions in the market that we may be unable to meet our capital or liquidity requirements could intensify the effect of these factors on our business and results. Other regulatory reforms adopted or proposed in the wake of the financial crisis – for example, extensive new regulations governing our derivatives activities, compensation, bank levies, deposit protection or data protection– may materially increase our operating costs and negatively impact our business model.
|
12
|
|
|
Deutsche Bank
|
Signatures
|
|
|
Annual Report 2021 on Form 20-F
|
Change in Internal Control over Financial Reporting
|
|
|
|
|
Risks Relating to Our Internal Control Environment.
We have identified the need to strengthen our internal control environment and infrastructure and have embarked on initiatives to do so. The German Federal Financial Supervisory Authority (
Bundesanstalt für Finanzdienstleistungsaufsicht
, “BaFin”) has ordered us in September 2018 to take appropriate internal safeguards and comply with general due diligence obligations in order to prevent money laundering and terrorist financing, in February 2019 to review our group-wide risk management processes in the area of correspondence banking and adjust them where necessary and in April 2021 to adopt further appropriate internal safeguards and comply with due diligence obligations, in particular with regard to regular reviews. This expansion also applies to correspondent relationships and transaction monitoring. The BaFin has appointed a special representative to monitor the implementation of the ordered measures as well as to assess and report on the progress of the implementation to the BaFin.
Risks Relating to Litigation, Regulatory Enforcement Matters and Investigations
.
We operate in a highly and increasingly regulated and litigious environment, potentially exposing us to liability and other costs, the amounts of which may be substantial and difficult to estimate, as well as to legal and regulatory sanctions and reputational harm. Among other matters:
- – We have been the subject of industry-wide investigations by regulatory and law enforcement authorities relating to interbank and dealer offered rates, as well as civil actions.
- – We are involved in civil proceedings in connection with our takeover offer for Postbank.
- – We have investigated the circumstances around equity trades entered into by certain clients in Moscow and London and have advised regulatory and law enforcement authorities in several jurisdictions about those trades.
- – We are the subject of industry-wide inquiries and investigations by regulatory and law enforcement authorities relating to transactions of clients in German shares around the dividend record dates for the purpose of obtaining German tax credits or refunds of withholding tax levied on dividend payments (so-called cum-ex transactions), as well as civil actions.
- – We have entered into a deferred prosecution agreement (DPA) with the U.S. Department of Justice concerning our historical engagements of finders and consultants and precious metals spoofing. If we violate the DPA, its term could be extended, or we could be subject to criminal prosecution or other actions.
- – We are under continuous examination by tax authorities in the jurisdictions in which we operate.
- – U.S. Congressional committees and other U.S. governmental entities have sought and may seek information from us concerning potential dealings between us and certain former members of the U.S. executive branch, former President Trump, his family and other close associates.
- – We have received requests for information from regulatory and law enforcement authorities concerning certain former correspondent banking relationships, including Danske Bank, and our anti-financial crime controls, including in the U.S.
- – Scrutiny of EU regulators and courts in respect of the protection of retail customers has increased in particular with a view on the validity and transparency of terms in standard form contracts and compensation for alleged damages.
Should any of the legal proceedings be resolved against us, or any investigations result in a finding that the Bank failed to comply with applicable law, the Bank could be exposed to material damages, fines, limitations on business, remedial undertakings, criminal prosecution or other material adverse effects on our financial condition, as well as risk to our reputation and potential loss of business as a result of extensive media attention. Guilty pleas by or convictions of us or our affiliates in criminal proceedings, or regulatory or enforcement orders, settlements or agreements to which we or our affiliates become subject, may have consequences that have adverse effects on certain of our businesses. Moreover, if these matters are resolved on terms that are more adverse to us than we expect, in terms of their costs or necessary changes to our businesses, or if related negative perceptions concerning our business and prospects and related business impacts increase, we may not be able to achieve our strategic objectives or we may be required to change them.
|
13
|
|
|
Deutsche Bank
|
Signatures
|
|
|
Annual Report 2021 on Form 20-F
|
Change in Internal Control over Financial Reporting
|
|
|
|
|
Other Risks.
We are also subject to other risks, including the following:
- – In addition to our traditional banking businesses of deposit-taking and lending, we also engage in nontraditional credit businesses in which credit is extended in transactions that include holding securities of third parties or in complex derivative transactions. These businesses materially increase our exposure to credit risk.
- – A substantial proportion of our assets and liabilities comprise financial instruments that we carry at fair value, with changes in fair value recognized in our income statement. We have incurred losses, and may incur further losses, from such changes.
- – Pursuant to accounting rules, we must periodically test the value of the goodwill of our businesses and the value of our other intangible assets for impairment. If such test determines that impairment exists, we must write down the value of such asset.
- – We must also review our deferred tax assets at the end of each reporting period. If it is no longer probable that sufficient taxable income will be available to allow all or a portion of our deferred tax assets to be utilized, we must reduce the carrying amounts. Impairments of goodwill and other intangible assets and reductions in deferred tax assets have had and may in the future have material adverse effects on our profitability, equity and financial condition.
- – We are also exposed to pension risks which can materially impact the measurement of our pension obligations, including interest rate, inflation and longevity risks that can materially impact our earnings.
- – Our risk management policies, procedures and methods leave us exposed to unidentified or unanticipated risks, which could lead to material losses.
- – Operational risks, which may arise from errors in the performance of our processes, the conduct of our employees, instability, malfunction or outage of our IT system and infrastructure, or loss of business continuity, or comparable issues with respect to our third-party service providers, may disrupt our businesses and lead to material losses.
- – We utilize a variety of third parties in support of our business and operations. Services provided by third parties pose risks to us comparable to those we bear when we perform the services ourselves, and we remain ultimately responsible for the services the third parties provide. If such a third party does not conduct business in accordance with applicable standards or our expectations, we could be exposed to material losses or regulatory action, litigation or reputational damage or fail to achieve the benefits we sought from the relationship.
- – Our operational systems are subject to an increasing risk of cyber-attacks and other internet crime, which could result in material losses of client or customer information, damage our reputation and lead to regulatory penalties and financial losses.
- – The size of our clearing operations exposes us to a heightened risk of material losses should they fail to function properly.
- – Ongoing global benchmark reform efforts, specifically the transition from interbank offered rates to alternative reference rates including “risk-free rates” that are under development, introduce a number of inherent risks to our business and the financial industry.
- – We are subject to laws and other requirements relating to financial and trade sanctions and embargoes. If we breach such laws and requirements, we can be subject, and have in the past been subject, to material regulatory enforcement actions and penalties. Transactions with counterparties in countries designated by the U.S. State Department as state sponsors of terrorism or persons targeted by U.S. economic sanctions may lead potential customers and investors to avoid doing business with us or investing in our securities, harm our reputation or result in regulatory or enforcement action.
Risks Relating to the Macroeconomic, Geopolitical and Market Environment
As a corporate and investment bank with a large private client franchise, our businesses are materially affected by global macroeconomic and financial market conditions. Significant challenges may arise from economic growth prospects, the interest rate environment, inflationary pressure, supply chain disruptions, geopolitical risks as well as higher market volatility, potential deterioration of international trade relations, and weakness of global, regional and national economic conditions. Such risks exist in particular from the COVID-19 pandemic and its ongoing impacts, and the large-scale Russian military action against Ukraine. Other risks exist with respect to China and from political and economic instability in key markets.
Deutsche Bank’s macroeconomic, business and operating environment improved over the course of 2021 as the global economy experienced a strong recovery from the pandemic recession. However, the near-term outlook has deteriorated, and downside risks have increased as inflationary pressure has intensified further, supply-side disruptions have become more entrenched, and the new, highly infectious Omicron variant of COVID-19 spread rapidly across the globe.
|
14
|
|
|
Deutsche Bank
|
Signatures
|
|
|
Annual Report 2021 on Form 20-F
|
Change in Internal Control over Financial Reporting
|
|
|
|
|
The COVID-19 pandemic continues to present tangible downside risk to our business. The global surge in COVID-19 cases related to the highly transmissible Omicron variant has negatively impacted economic activity due to increased restrictions imposed by governments across many countries, despite indications that it causes less severe disease than previous variants. Impacts are expected to subside as vaccination rates continue to increase globally and new antiviral drugs become available which should limit the number of severe illnesses and deaths, although vaccination rates in many emerging markets continue to lag behind and developed markets continue to face vaccine hesitancy in significant parts of their population. As a result, the timing and strength of economic recoveries will continue to vary from country to country. The emergence of new variants of concern may require further social distancing requirements or lockdowns and the effects of these are not fully predictable as they will vary depending on the nature of the variant, country-specific pandemic conditions and policy preferences. Countries which have pursued a zero COVID-19 policy, including China, might struggle to contain Omicron as successfully as other variants due to its more infectious nature. Although some incipient changes in policy have started to occur, strict lockdowns may be required which could impact China’s economy and global supply chains.
On February 24, 2022, Russia commenced large-scale military action against Ukraine. This followed weeks of tensions between Russia and Ukraine, as well as the West, and the recognition by Russia of two separatist-held areas in Eastern Ukraine as independent states. News of the Russian military action negatively impacted stock prices and caused many commodities to rally, with the Brent crude oil price exceeding U.S.$ 100 a barrel and natural gas prices also increasing sharply. The conflict could lead to a further rise in energy prices (particularly natural gas) if supplies are disrupted and presents a key downside risk for corporates and households in Europe and may further exacerbate supply chain risks of clients with higher sensitivities to rising energy costs. Ensuing turbulence in global financial markets could impact risky assets and countries. Taken together, the conflict and its ancillary effects could lead to a substantial slowdown in the global economy and diminish our ability to generate revenues and the profitability on specific portfolios as well as result in higher-than-expected loan losses. Depending on how this crisis develops further and its impact on financial markets and the economy generally it may also impact our ability to meet stated financial and non-financial targets.
Supply chain pressures in global production, trade and logistics resulting from the pandemic and subsequent strong pick-up in demand will likely persist through 2022, constraining output and fueling price inflation of manufactured and intermediate goods as well as energy and other commodities. Consumer price inflation rates have hit multi-decade highs in Europe and the US and soaring energy prices are driving cost pressures for corporates and households which may impact the quality of our portfolios in particular in directly impacted industries such as Utilities. As a result, we may observe higher than expected defaults in selected industries or regions, higher drawdowns of credit facilities and generally higher market volatility.
The inflation outlook remains uncertain. Consensus and market-implied projections point to continuously elevated inflationary pressure as supply bottlenecks and other temporary factors fade only slowly. Although major central banks are expected to gradually remove extraordinary monetary policy stimulus by phasing out emergency bond purchases and lifting key policy rates, there remains a risk that consumer and asset price inflation in major advanced economies will continue to accelerate faster than anticipated, requiring more aggressive monetary policy tightening. While this could create some upside potential for our business activity levels and net interest income, a disorderly sharp increase in bond yields could trigger a downward correction to equities and the widening of credit spreads, which could adversely impact trading results. In addition, we could see increased counterparty credit exposure on derivatives, increased credit risks on highly leveraged clients and emerging markets with external imbalances as well as risks to our pension fund assets. More broadly, this could impact the valuation of our assets and liabilities and drive changes in the composition of our balance sheet.
Despite elevated inflationary pressures, interest rates remain extremely low currently with the European Central Bank (“ECB”) deposit facility rate still set at -0.50 %, German nominal Bund yields, until recently, trading at / close to negative territory and real rates deeply negative. The low interest rate environment has supported elevated market valuations across risk assets, particularly in US equities including the technology sector. Most recently, macroeconomic and geopolitical concerns have sent US equities into correction territory, with significant price declines among technology companies, and the risk of a significant and sustained equity price decline may be heightened further if policy rates rise more rapidly and to a higher level than currently anticipated. Delayed tightening would likely further exacerbate stretched market valuations and drive renewed pressure on bank interest margins. More importantly, a further prolonged period of low interest rates in the Eurozone could materially affect our profitability and balance sheet deployment. While our revenues are particularly sensitive to interest rates, given the size of our loan and deposit books denominated in Euros, the low interest rate environment can also impact other balance sheet positions, which are accounted at fair value.
|
15
|
|
|
Deutsche Bank
|
Signatures
|
|
|
Annual Report 2021 on Form 20-F
|
Change in Internal Control over Financial Reporting
|
|
|
|
|
Compared to the low level of credit loss provisions observed in 2021, we expect the level to increase in 2022. This reflects our expectation of a slowdown of macroeconomic growth from the exceptionally strong levels in 2021 and the existence of various risk drivers such as lagging COVID-19 pandemic effects for certain asset classes like commercial real estate, persistent supply chain disruptions, inflation and geopolitical risks. Additionally, the possibility of new COVID-19 variants continues to pose the risk of triggering new, severe responses by governments as well as adverse market and client reactions. These could lead to increasing loan losses as well as potential client drawdowns of credit facilities (as observed in 2020) which in turn would lead to an increase in capital requirements and liquidity demands. Higher volatility in financial markets could lead to increased margin calls both inbound and outbound. Policy measures taken by central banks and governments such as debt moratoria have helped to mitigate some of the short-term impacts in 2020 and 2021. The withdrawal of support measures coupled with a significant increase in corporate and sovereign debt levels as a result of the pandemic (including second-round effects, e.g., on supply-chains) could also cause defaults and credit losses to increase. We regularly utilize collateralized loan obligations (CLO) and credit default swaps (CDS) to manage concentration risk. However, this may not be sufficient to fully offset potential credit losses.
China-related risks are elevated with ongoing concerns over the potential for a broad and persistent deterioration of China’s highly leveraged property sector and property developers. We have seen numerous rating actions by external agencies, noting that some of the names which have seen significant rating deterioration were up until recently investment-grade rated, and widespread liquidity shortages for the sector. Stabilizing the economy has become a key priority for the Chinese government in 2022, but risks of ongoing liquidity constraints and selected defaults in the property sector remain elevated. In a severe downside this may lead to broader contagion across weaker state- and privately owned enterprises which could drive increased losses, including higher credit provisions, in our portfolio.
If these risks materialize, or current negative conditions persist or worsen, our business, results of operations or strategic plans could be adversely affected.
In addition to its broader macroeconomic impacts, the large-scale Russian military action against Ukraine may adversely affect our business and operations.
In response to the large-scale Russian military action against Ukraine, Western countries and the EU have moved to impose broad-based sanctions (including asset-freeze / blocking sanctions) targeting Russia, including but not limited to major Russian banks, the Russian Central Bank, certain other companies, Russian parliament members and certain members of the Russian elite and their families as well as announced the disconnection of select Russian banks from SWIFT (Society for Worldwide Interbank Financial Telecommunication). The sanctions have also banned primary and/or secondary trading of sovereign debt and other select securities. It is possible that additional sanctions may be imposed, including additional or new asset-freezing / blocking sanctions of individuals (SDNs) or companies (including further systemically important corporates and banks), a prohibition on the conversion of RUB into USD, EUR or GBP, and the disconnection of additional Russian banks from the SWIFT financial transfers system. Sanctions are subject to rapid change and it is also possible that new direct or indirect secondary sanctions could be imposed by the United States or other jurisdictions without warning as a result of developments. Considering the sanctions announced in the wake of the Russian military action, we are facing an unprecedented amount of sanctions measures, not all of which are fully aligned across jurisdictions and therefore further increase operational complexity and risk of making errors in managing day-to-day business activities within the rapidly evolving sanctions environment.
Generally, enhanced Russia sanctions results in increased complexity of our control environment and, the more clients are impacted, the more challenging it could be to completely wind-down cases within the timeframe provided by licenses or authorizations. New sanctions as well as countermeasures by the Russian government could also result in differences between the local application and/or implementation of relevant requirements by DB Moscow and the DB Group (as DB Moscow would have to adhere to local law). Subsequently, this would create conflict of law situations and certain exemptions would have to be applied. Furthermore, Deutsche Bank is utilizing inhouse technology resources in Russia, which contribute to the development of a number of the Bank’s critical applications. We are subject to the risk that our ability to utilize these technology resources could be impaired or lost, for instance due to sanctions from the West, Russian state-initiated actions or management actions.
We are monitoring closely the developments relating to heightened sanctions, including Russian countermeasures, and utilizing dedicated governance structures including Global and Regional Crisis Management as and when required. We have also seen increased cyber-attacks, which may pose direct and indirect risks to us. The downside impact of the ongoing situation concerning Ukraine, from both a financial and non-financial risk perspective will depend on how the current crisis will unfold further. Russia’s large-scale military action against Ukraine and the West’s severe sanctions response against Russia may have significant negative economic consequences not only for the Russian economy but for Europe too. The crisis has the potential to worsen the already stressed energy price situation in Europe which could lead to an economic slowdown driving increased losses, including higher credit provisions, in our portfolio. The regulatory environment or other restrictions including sanctions imposed may result in our business activities related to Russia becoming unviable or that we lose control over our assets.
Despite the business continuity and crisis management policies currently in place, the conflict also poses challenges related to personnel as well as loss of business continuity, which may disrupt our business and lead to material losses.
|
16
|
|
|
Deutsche Bank
|
Signatures
|
|
|
Annual Report 2021 on Form 20-F
|
Change in Internal Control over Financial Reporting
|
|
|
|
|
In addition to its broader macroeconomic impacts, the COVID-19 pandemic has and may continue to adversely affect our business and operations in other ways, including with respect to our operating environment and personnel.
From an operational perspective, and despite the business continuity and crisis management policies currently in place, the COVID-19 pandemic, the emergence of new variants of the virus and resulting rapid changes in government responses may continue to have an adverse impact on our business activities and control environment. The continuing move across global industries to conduct business from home and away from primary office locations is driving a more accelerated evolution of business practices compared to historic trends. The demand on our technology infrastructure and the risk of cyber-attacks could lead to technology failures, security breaches, unauthorized access, loss or destruction of data or unavailability of services, as well as increase the likelihood of conduct breaches. Any of these events could potentially result in litigation, a financial loss, disruption of our business activities and liability to our customers, regulatory scrutiny, government intervention or damage to our reputation. At the same time the cost to us of managing these cyber, information security and other risks remains high. Delays in the implementation of regulatory requirements, including consumer protection measures and of our strategic projects, could also have a negative impact on our revenues and costs, while a return of higher market volatility has led, and could continue to lead, to increased demand on markets surveillance monitoring and processing. Our vendors and service providers are facing similar challenges with the risk that these counterparties could be unable to fulfil their contractual obligations, putting the benefits we seek to obtain from such contracts at risk.
The COVID-19 pandemic temporarily reduced the rate of regular employee attrition versus historical levels, creating a more challenging context to our cost targets and increasing the cost of involuntary severance arrangements. This also limited the opportunity to redeploy talented employees within the bank whose roles were made redundant. Requests from regulators to demonstrate moderation in the levels of compensation that we can offer may have put the Group at a disadvantage in attracting and retaining talented employees. However, in 2021, staff attrition levels have reverted to pre-pandemic levels and we are particularly focused on developments in the Asia-Pacific region. If the attrition rate increases versus historical levels, this may adversely affect our ability to attract and retain talented personnel, particularly in front-office positions that are key to revenue generation and in positions key to improving our control environment. Globally, we observe extremely competitive markets for employees, particularly in the United States and India.
If any of these risks materialize, they may adversely affect our results of operations, strategic plans and targets, and the prices of our securities.
We are subject to other macroeconomic and geopolitical risks, including with respect to China, which could negatively affect the business environment, leading to weaker economic activity and a broader correction in the financial markets.
Tensions between the U.S. and China remain elevated across a wide range of areas, including trade and technology-related issues, Hong Kong, Taiwan, human rights, and cybersecurity. The U.S. has imposed selected sanctions as well as export and investment restrictions on Chinese companies and officials, and China has imposed sanctions on certain U.S. companies and officials and introduced a framework for blocking regulations aimed at the extraterritorial application of sanctions against China. Likewise, the EU has imposed sanctions on China in relation to human rights issues, which were reciprocated by China. While we cannot predict the impacts of sanctions on our business or our financial targets, such measures raise potential regulatory compliance and conflicts of laws challenges and the impacts could be material and adverse.
Other geopolitical risks, which could negatively impact our business environment and our financial targets include the potential for escalation in the Middle East over Iran’s nuclear program, should the United States and Iran fail to reach agreement over a return to or implementation of a new JCPOA (Iran nuclear deal).
If any of these risks materialize, they may adversely affect our results of operations, strategic plans and targets, and the prices of our securities.
|
17
|
|
|
Deutsche Bank
|
Signatures
|
|
|
Annual Report 2021 on Form 20-F
|
Change in Internal Control over Financial Reporting
|
|
|
|
|
In the European Union, potential political shocks and uncertainties could have unpredictable consequences for the financial system and the wider economy, and could contribute to European de-integration
in certain areas, potentially leading to declines in business levels, write-downs of assets and losses across our businesses.
Our ability to protect ourselves against these risks is limited.
Since the global financial crisis and subsequent European sovereign debt crisis between 2009 and 2012, political uncertainty in Europe has been elevated. The withdrawal of the UK from the European Union (“Brexit”) in particular, but also, the increasing attractiveness to voters of populist political movements in other member states has raised concerns about a potential unwinding of aspects of European integration that have benefitted our businesses. While the European financial architecture and crisis response capabilities were strengthened substantially over the past decade, since 2020, the crisis caused by the pandemic has led to a massive deterioration of the fiscal situation for many EU and EMU countries again. To support the economic recovery and modernization, the EU has launched the unprecedented, multi-year Next Generation EU program, comprising grants and loans of more than € 800 billion (at current prices) and committing the member states to pursue ambitious national structural reform and investment plans to receive the funds. This has improved the prospects for growth-enhancing structural reforms and further integration among EU member states, both viewed as important tools to reduce the Eurozone’s vulnerabilities to future crises. However, given the political uncertainties, e.g. stemming from coming parliamentary and presidential elections in several countries, there remain downside risks to the future economic performance and political cohesion in Europe. If these risks materialize, they may ultimately result in material reductions in our business levels as our customers rein in activity levels in light of decreased economic output and increased uncertainty, which would materially adversely affect our operating results and financial condition. An escalation of political risks could have consequences for the financial system, public debt sustainability, the value of the euro and the greater economy as a whole, potentially leading to declines in business levels, write-downs of assets and losses across our businesses.
If
, in an extreme tail risk scenario, one or more members of the Eurozone
defaults on their debt obligations or decides to leave the common currency, this would result
in the reintroduction of one or more national currencies. Should a Eurozone country conclude it must exit the common currency, the resulting need to reintroduce a national currency and restate existing contractual obligations could have unpredictable financial, legal, political and social consequences, leading not only to significant losses on sovereign debt but also on private debt in that country. Given the highly interconnected nature of the financial system within the Eurozone, and the high levels of exposure we have to public and private counterparties around Europe, our ability to plan for such a contingency in a manner that would reduce our exposure to non-material levels is likely to be limited. If the overall economic climate deteriorates as a result of Brexit or further departures from the Eurozone, our
businesses
could be adversely affected, and, if overall business levels decline or we are forced to write down significant exposures among our various businesses, we could incur substantial losses.
The withdrawal of the United Kingdom from the European Union – Brexit – may have adverse effects on our business, results of operations or strategic plans.
The UK Government concluded a Trade Cooperation Agreement (TCA) with the European Union which came into effect on January 1, 2021. Uncertainty remains, however, as negotiations between the UK and the EU have continued through 2021, especially with regard to financial services not extensively covered by the existing deal. Discussions on the nature of this extension and the final outcome will continue in 2022.
Given
the ongoing uncertaint
y over the medium- and long-term effects of the UK’s withdrawal from the European Union, it is difficult to determine the exact impact on Deutsche Bank AG over the long term. However, the UK’s economy and those of the Eurozone countries are very tightly linked as a result of EU integration projects other than the Euro, and the scale of our businesses in the UK – especially those dependent on activity levels in the City of London, to which we are heavily exposed and which may deteriorate as a result of Brexit – means that even modest effects in percentage terms can have a very substantial adverse effect on our businesses. Brexit has, unfortunately, resulted in a disruption of the provision of cross-border financial services.
Also, if there is to be further delay or possibly a failure to reach agreement on matters determining mutual ‘equivalence’ under respective legislation, this will lead to greater costs to reorganize parts of our business and will restrict our ability to provide financial services to and from the UK in the seamless manner that was done previously. The currently unsettled future relationship between the EU and the UK is also likely to lead to further uncertainty in relation to the regulation of cross-border business activities. Recent announcements from the EU commission confirming an extension to the current temporary equivalence arrangements for UK CCPs (Central Clearing Counterparty) has removed the risk that access to UK clearing would be withheld from EU firms from June 2022 (when the previous extension expired). Without equivalence between EU and UK regimes for financial services we will be restricted in our ability to provide financial services to and from the UK.
We have applied for authorization from the Prudential Regulation Authority and the Financial Conduct Authority (FCA), our UK regulators, to continue to undertake regulated activity in the UK (previously undertaken pursuant to the European Passport provisions). Failure to gain authorization as a Third Country Branch could adversely affect our business, results of operations or strategic plans.
|
18
|
|
|
Deutsche Bank
|
Signatures
|
|
|
Annual Report 2021 on Form 20-F
|
Change in Internal Control over Financial Reporting
|
|
|
|
|
More broadly, some economic downside risks remain in case the UK were to invoke Article 16 of the Northern Ireland protocol which, in a worst-case outcome, could lead to the EU suspending the Brexit trade deal. In the absence of a negotiated solution, World Trade Organization (WTO) rules could eventually apply which could mean higher tariffs which would further negatively impact trade and economic activity.
Despite our extensive preparations, as a result of Brexit, our business and strategic plans could be adversely affected. It is difficult to assess any adverse consequences with any quantitative certainty at this time, particularly since they will depend on future political and market developments.
We may be required to take impairments on our exposures to the sovereign debt of European or other countries
if
the European sovereign debt crisis
reignites. The credit default swaps into which we have entered to manage sovereign credit risk may not be available to offset these losses.
A large portion of the sovereign debt of Eurozone countries is held by European financial institutions, including Deutsche Bank. Despite the apparent abatement of the European sovereign debt crisis
in recent years, it remains uncertain whether
, in light of the current political environment, Greece or other Eurozone sovereigns, such as Spain, Italy, Portugal and Cyprus, will be able to manage their debt levels in the future
and whether Greece will attempt to renegotiate its past international debt restructuring. The rise of anti-austerity parties and populist sentiment in many of these countries poses a threat to the medium- to long-term measures recommended for these countries to alleviate the tensions in the Eurozone caused by drastically differing economic situations among the Eurozone states. In the future, negotiations or exchanges similar to the Greek debt restructuring in 2012 could take place with respect to the sovereign debt of these or other affected countries. The outcome of any negotiations regarding changed terms (including reduced principal amounts or extended maturities) of sovereign debt may result in additional impairments of assets on our balance sheet. Any negotiations are highly likely to be subject to political and economic pressures that we cannot control, and we are unable to predict their effects on the financial markets, on the greater economy or on ourselves.
In addition, any restructuring of outstanding sovereign debt may result in potential losses for us and other market participants that are not covered by payouts on hedging instruments that we have entered into to protect against the risk of default. These instruments largely consist of credit default swaps, generally referred to as CDSs, pursuant to which one party agrees to make a payment to another party if a credit event (such as a default) occurs on the identified underlying debt obligation. A sovereign restructuring that avoids a credit event through voluntary write-downs of value may not trigger the provisions in CDSs we have entered into, meaning that our exposures in the event of a write-down could exceed the exposures we previously viewed as our net exposure after hedging. Additionally, even if the CDS provisions are triggered, the amounts ultimately paid under the CDSs may not correspond to the full amount of any loss we incur. We also face the risk that our hedging counterparties have not effectively hedged their own exposures and may be unable to provide the necessary liquidity if payments under the instruments they have written are triggered. This may result in systemic risk for the European banking sector as a whole and may negatively affect our business and financial position.
Risks Relating to Our Business and Strategy
Our results of operation and financial condition have in the past been negatively impacted by the challenging market environment, uncertain macroeconomic and geopolitical conditions, lower levels of client activity, increased competition and regulation, and the immediate impact of our strategic decisions. If we are unable to improve our profitability, we may be unable to meet our strategic aspirations, and may have difficulty maintaining capital, liquidity and leverage at levels expected by market participants and our regulators.
The Bank experienced an increase in net revenues in 2021 compared to 2020, which in turn was higher than 2019. The revenue increase was driven by benefits of underlying market activity, which offset the impact of interest rate headwinds, negative impacts from the COVID-19 pandemic and industry-wide margin compression.
The ability of our Investment Bank to continue its performance of 2021 is dependent on the continuation of high levels of market activity in investment banking as an industry. This will likely be impacted by the development of the COVID-19 pandemic, which continues to pose significant downside risks, and by geopolitical events and pressures such as the large-scale Russian military action against Ukraine and tensions with China. The COVID-19 pandemic also has intensified the “lower for longer” interest rate environment, which has impacted the results of several of our divisions. The low-rate environment has also supported elevated market valuations across risk assets as investors search for yield. These trends raise the risk of a significant and sustained asset price correction following from an increase in interest rates. Risks are amplified by high debt levels, a lack of liquidity in some areas of the market and an easing of global underwriting standards. Adverse market conditions, unfavorable prices and volatility including material movements in foreign exchange rates (and resulting translation effects) as well as cautious investor and client sentiment may in the future materially and adversely affect our revenues and profits as well as the timely and complete achievement of our strategic aspirations and targets.
|
19
|
|
|
Deutsche Bank
|
Signatures
|
|
|
Annual Report 2021 on Form 20-F
|
Change in Internal Control over Financial Reporting
|
|
|
|
|
Changes in our business mix towards lower-margin, lower-risk products can limit our opportunities to profit from volatility. Regulators have generally encouraged the banking sector to focus more on the facilitation of client flow and less on risk taking. This has been effected in part by increasing capital requirements for higher-risk activities. In addition, some of our regulators have encouraged or welcomed changes to our business perimeter, consistent with their emphasis on lower-risk activities for banks. In recent years, we have reduced our exposure to a number of businesses that focused on riskier but more capital-intensive products (but that in earlier periods also had the potential to be more highly profitable). Further pressure on our revenues and profitability has resulted from long-term structural trends driven by regulation (especially increased regulatory capital, leverage and liquidity requirements and increased compliance costs) and competition that have further compressed our margins in many of our businesses. Should a combination of these factors continue to lead to reduced margins and subdued activity levels in our trading and markets business over the longer term, this could impair out ability to reach our financial targets.
Although we have in current years made considerable progress resolving litigation, enforcement and similar matters broadly within our established reserves, this pattern may not continue. In particular, these costs could substantially exceed the level of provisions that we established for our litigation, enforcement and similar matters, which can contribute to negative market perceptions about our financial health, costing us business. This, combined with the actual costs of litigation, enforcement and other matters, could in turn adversely affect our ability to maintain capital, liquidity and leverage at levels expected by market participants and our regulators.
Adverse market conditions, asset price deteriorations, volatility and cautious investor sentiment have affected and may in the future materially and adversely affect our revenues and profits, particularly in our investment banking, brokerage and other commission- and fee-based businesses. As a result, we have in the past incurred and may in the future incur significant losses from our trading and investment activities.
As a global investment bank, we have significant exposure to the financial markets and are more at risk from adverse developments in the financial markets than are institutions engaged predominantly in traditional banking activities. Sustained market declines have in the past caused and can in the future cause our revenues to decline, and, if we are unable to reduce our expenses at the same pace, can cause our profitability to erode or cause us to show material losses. Volatility can also adversely affect us, by causing the value of financial assets we hold to decline or the expense of hedging our risks to rise. Reduced customer activity can also lead to lower revenues in our “flow” business.
Specifically, our investment banking revenues, in the form of financial advisory and underwriting fees, directly relate to the number and size of the transactions in which we participate and are susceptible to adverse effects from sustained market downturns. These fees and other income are generally linked to the value of the underlying transactions and therefore can decline with asset values. In addition, periods of market decline and uncertainty tend to dampen client appetite for market and credit risk, a critical driver of transaction volumes and investment banking revenues, especially transactions with higher margins. In recent and other times in the past, decreased client appetite for risk has led to lower levels of activity and lower levels of profitability in our Investment Bank corporate division. Our revenues and profitability could sustain material adverse effects from a significant reduction in the number or size of debt and equity offerings and merger and acquisition transactions.
Market downturns also have led and may in the future lead to declines in the volume of transactions that we execute for our clients and, therefore, to declines in our noninterest income. In addition, because the fees that we charge for managing our clients’ portfolios are in many cases based on the value or performance of those portfolios, a market downturn that reduces the value of our clients’ portfolios or increases the amount of withdrawals reduces the revenues we receive from our asset management and private banking businesses. Even in the absence of a market downturn, below-market or negative performance by our investment funds may result in increased withdrawals and reduced inflows, which would reduce the revenue we receive. While our clients would be responsible for losses we incur in taking positions for their accounts, we may be exposed to additional credit risk as a result of their need to cover the losses where we do not hold adequate collateral or cannot realize it. Our business may also suffer if our clients lose money and we lose the confidence of clients in our products and services.
In addition, the revenues and profits we derive from many of our trading and investment positions and our transactions in connection with them can be directly and negatively impacted by market prices. In each of the product and business lines in which we enter into these trading and investment positions, part of our business entails making assessments about the financial markets and trends in them. When we own assets, market price declines can expose us to losses. Many of the more sophisticated transactions of our Investment Bank corporate division are influenced by price movements and differences among prices. If prices move in a way we have not anticipated, we may experience losses. Also, when markets are volatile, the assessments we have made may prove to lead to lower revenues or profits, or may lead to losses, on the related transactions and positions. In addition, we commit capital and take market risk to facilitate certain capital markets transactions; doing so can result in losses as well as income volatility. Such losses may especially occur on assets we hold for which there are not very liquid markets to begin with. Assets that are not traded on stock exchanges or other public trading markets, such as derivatives contracts between banks, may have values that we calculate using models other than publicly quoted prices. Monitoring the deterioration of prices of assets like these is difficult and could lead to losses we did not anticipate.
|
20
|
|
|
Deutsche Bank
|
Signatures
|
|
|
Annual Report 2021 on Form 20-F
|
Change in Internal Control over Financial Reporting
|
|
|
|
|
We can also be adversely affected if general perceptions of risk cause uncertain investors to remain on the sidelines of the market, curtailing their activity and in turn reducing the levels of activity in those of our businesses dependent on transaction flow.
Additionally, the current market environment is characterized by very low interest rates, particularly in the Eurozone, including negative interest yields on German government bonds. A prolonged period of low interest rates in the Eurozone or elsewhere could materially impact our net interest margin, profitability and balance sheet deployment. While our revenues are particularly sensitive to interest rates, given the size of our loan and deposit books denominated in Euros, the low interest rates environment can also impact other balance sheet positions which are accounted at fair value. These conditions could result in a significant impact on revenues relative to our current expectations. Actions to offset this rate impact, such as pricing changes or the introduction of additional fees, may not be sufficient to offset this impact.
Conversely, there have been recently increases in market interest rates and there are expectations that monetary authorities will increase interest rates over the course of 2022. If such increases take place to a greater extent or rate than we or the market anticipate, this may have negative effects on the economy, markets and our businesses.
Our liquidity, business activities and profitability may be adversely affected by an inability to access the debt capital markets or to sell assets during periods of market-wide or firm-specific liquidity constraints. Credit rating downgrades have contributed to an increase in our funding costs in the past. Though we have recently seen upgrades of our credit ratings, any future downgrade could materially adversely affect our funding costs, the willingness of counterparties to continue to do business with us and significant aspects of our business model.
We have a continuous demand for liquidity to fund our business activities. Our liquidity may be impaired by an inability to access secured and/or unsecured debt markets, an inability to access funds from our subsidiaries or otherwise allocate liquidity optimally across our businesses, an inability to sell assets or redeem our investments, or unforeseen outflows of cash or collateral. This situation may arise due to circumstances unrelated to our businesses and outside our control, such as disruptions in the financial markets, or circumstances specific to us, such as reluctance of our counterparties or the market to finance our operations due to perceptions about potential outflows (including deposit outflows) resulting from litigation, regulatory and similar matters, actual or perceived weaknesses in our businesses, our business model or our strategy, as well as in our resilience to counter negative economic and market conditions. Reflecting these conditions, our internal estimates of our available liquidity over the duration of a stressed scenario could at times be negatively impacted.
In addition, negative developments concerning other financial institutions perceived to be comparable to us and negative views about the financial services industry in general can also affect us. These perceptions could affect the prices at which we could access the capital markets to obtain the necessary funding to support our business activities; should these perceptions exist, continue or worsen, our ability to obtain this financing on acceptable terms may be adversely affected. Among other things, an inability to refinance assets on our balance sheet or maintain appropriate levels of capital to protect against deteriorations in their value could force us to liquidate assets we hold at depressed prices or on unfavorable terms, and could also force us to curtail business, such as the extension of new credit. This could have an adverse effect on our business, financial condition and results of operations. Additionally, we need to ensure ongoing ability to refinance our business activities in the respective currencies.
In addition, we have benefited in recent years from a number of incremental measures by the ECB and other central banks to provide additional liquidity to financial institutions and the financial markets, particularly in the Eurozone. To the extent these actions are curtailed or halted, our funding costs could increase, or our funding supply could decrease, which could in turn result in a reduction in our business activities. In particular, any decision by the ECB to discontinue or reduce quantitative easing or steps by the Federal Reserve to tighten its monetary policy or actions by central banks more generally to tighten their monetary policy will likely cause long-term interest rates to increase and supply of central bank funding to be reduced which could impact the costs of our funding.
Our credit ratings have been upgraded in 2021 by all three leading rating agencies. Despite the recent upgrades, rating agencies regularly review our credit ratings, and such reviews could be negatively affected by a number of factors that can change over time, including the credit rating agency’s assessment of: our strategy and management’s capability; our financial condition including in respect of profitability, asset quality, capital, funding and liquidity; the level of political support for the industries in which we operate; the implementation of structural reform; the legal and regulatory frameworks applicable to our legal structure; business activities and the rights of our creditors; changes in rating methodologies; changes in the relative size of the loss-absorbing buffers protecting bondholders and depositors; the competitive environment, political and economic conditions in our key markets (including the impact of the COVID-19 pandemic and Brexit); and market uncertainty. In addition, credit ratings agencies are increasingly taking into account environmental, social and governance factors, including climate risk, as part of the credit ratings analysis, as are investors in their investment decisions.
|
21
|
|
|
Deutsche Bank
|
Signatures
|
|
|
Annual Report 2021 on Form 20-F
|
Change in Internal Control over Financial Reporting
|
|
|
|
|
Any reductions in our credit ratings, including, in particular, downgrades below investment grade, or a deterioration in the capital markets’ perception of our financial resilience could significantly affect our access to money markets, reduce the size of our deposit base and trigger additional collateral or other requirements in derivatives contracts and other secured funding arrangements or the need to amend such arrangements, which could adversely affect our cost of funding and our access to capital markets and could limit the range of counterparties willing to enter into transactions with us. This could in turn adversely impact our competitive position and threaten our prospects in the short to medium-term.
After the start of the global financial crisis, the major credit rating agencies have lowered our credit ratings or placed them on review or negative watch on multiple occasions. These credit rating downgrades have contributed to an increase in our funding costs. Despite the recent upgrades, our credit spread levels (meaning the difference between the yields on our securities as compared to benchmark government bonds) are sensitive to further adverse developments and severe future downgrades could bring our credit rating into the non-investment grade category. This could materially and adversely affect our funding costs and significant aspects of our business model. The effect would depend on a number of factors including whether a downgrade affects financial institutions across the industry or on a regional basis, or is intended to reflect circumstances specific to us, such as our potential settlement of regulatory, litigation and similar matters; any actions our senior management may take in advance of or in response to the downgrade; the willingness of counterparties to continue to do business with us; any impact of other market events and the state of the macroeconomic environment more generally.
Additionally, under many of the contracts governing derivative instruments to which we are a party, a downgrade could require us to post additional collateral, lead to terminations of contracts with accompanying payment obligations for us or give counterparties additional remedies. We take these effects into account in our liquidity stress testing analysis, as further described in “Management Report: Risk Report: Liquidity Risk: Stress Testing and Scenario Analysis” in the Annual Report 2021.
If we are unable to implement our strategic plans successfully, we may be unable to achieve our financial objectives, or we may incur losses, including further impairments and provisions, or low profitability, and our financial condition, results of operations and share price may be materially and adversely affected.
In July 2019, we announced a strategic transformation of the Bank, designed to significantly improve sustainable returns to shareholders by refocusing our Core Bank – which comprises our four core operating divisions, namely the Corporate Bank, the Investment Bank, the Private Bank, and Asset Management, together with the segment Corporate Other – around market leading businesses, which typically operate in growing markets with attractive return potential. We also created the Capital Release Unit (CRU), with the principal objective to liberate capital consumed by low return assets and businesses that earn insufficient returns or activities that are no longer core to our strategy. Since then, we have redrawn our business perimeter and selectively exited businesses in which we were not able to compete profitably. The next phase of our transformation will focus on seeking to ensure sustainable profitability by growing our businesses, while remaining disciplined on costs, risk and balance sheet management and control.
Our key financial targets for 2022 are:
- – Post-tax Return on Average Tangible Equity of 8 % for the Group
- – Post-tax Return on Average Tangible Equity of more than 9 % for the Core Bank
- – Cost income ratio of 70 %
- – Common Equity Tier 1 capital ratio of above 12.5 %
- – Leverage ratio (fully loaded) of ~4.5 %
We have now set additional key financial targets for 2025:
- – Post-tax Return on Average Tangible Equity of above 10 % for the Group
- – Compounded annual growth rate of revenues from 2021 to 2025 of 3.5 to 4.5 %
- – Cost income ratio of less than 62.5 %
We are committed to delivering sustainably growing cash dividends and returning excess capital to shareholders through share buybacks that is over and above what is required to support profitable growth and upcoming regulatory changes over time, subject to regulatory approval and shareholder authorization and meeting German corporate law requirements. To that end, subject to meeting our strategic targets, the Management Board intends to grow the cash dividend per share by 50 % p.a. in the next 3 years, starting from € 0.20 per share for the financial year 2021, which would translate into approximately € 3.3 billion of cumulative dividend payments by 2025 with respect to financial years 2021-2024. In relation to the financial year 2024 we intend to achieve a total payout ratio of 50 % from a combination of dividends paid and share buybacks executed in 2025; and we intend to maintain a 50 % total payout ratio in subsequent years. In addition to the already announced share buyback in 2022 of € 0.3 billion, meeting our current financial aspirations would therefore support the previously announced cumulative distributions to shareholders in the form of dividends paid or share buybacks executed in the total amount of € 5 billion in respect of financial years 2021-2024.
|
22
|
|
|
Deutsche Bank
|
Signatures
|
|
|
Annual Report 2021 on Form 20-F
|
Change in Internal Control over Financial Reporting
|
|
|
|
|
In addition, should we successfully execute our financial and strategic plans through 2025, total implied cumulative distributions of approximately € 8 billion in respect of financial years 2021-2025 would be achievable. Our ambition to return capital to shareholders is further underpinned by our aim to maintain a robust Common Equity Tier 1 (CET 1) capital ratio of approximately 13 %, i.e. a CET 1 ratio of no less than 200 basis points above our Maximum Distributable Amount (MDA) threshold we currently assume to prevail over time.
Our strategic goals are subject to various internal and external factors and to market, regulatory, economic and political uncertainties, and to limitations relating to our operating model. These could negatively impact the implementation of our strategic goals, the realization of their anticipated benefits, or our ability to achieve our financial targets for 2022 or our additional financial targets for 2025. In particular, our strategic objectives are subject to the following assumptions and risks:
- – Geopolitical developments, in particular with respect to the large-scale Russian military action against Ukraine, also may impact global and regional economies and markets other than in short-term ways and may result in adverse effects on our business, results of operations or strategic plans and targets, and the prices of our securities. Other geopolitical risks exist with respect to China and from political and economic instability in key markets.
- – The current COVID-19 pandemic and its potential impact on the global economy may affect our ability to meet our financial targets. A protracted downturn in local, regional or global economic conditions may result in adverse effects on our business, results of operations or strategic plans and targets, and the prices of our securities.
- – The base case scenario for our financial and capital plan includes revenue growth estimates which are dependent on positive macroeconomic developments. Stagnation or a downturn in the macroeconomic environment could significantly impact our ability to generate the revenue growth necessary to achieve these strategic financial and capital targets. This base case scenario also includes assumptions regarding our ability to reduce costs in future periods.
- – In addition, our base case scenario includes an expectation of low but rising interest rates, in accordance with our assessment of the forward interest rate curve. If interest rates do not rise as we have expected, our revenues may not develop as we expect.
- – Our strategic objectives are also based on assumptions regarding inflation levels, which have risen over the past year and the outlook for which remains uncertain. If inflation does not develop as we expect, or if our commercial leverage in relations with suppliers and third parties does not enable us to resist inflationary pressures, our businesses may be adversely impacted and our costs may increase.
- – Our plans are based upon January 31, 2022 foreign exchange rates, particularly with respect to the euro and U.S. dollar. In the event that exchange rates change from these levels, our ability to achieve our goals may be adversely affected.
- – Results for the Investment Bank in 2021 were supported by high levels of market activity in investment banking as an industry. The ability of the Investment Bank to continue its performance is dependent on the continuation of high levels of market activity.
- – For 2022, we expect provisions for credit losses of around 20 basis points as a percentage of average loans. Should higher levels of provisions for credit losses be required, our results of operations and our ability to meet our strategic financial and capital targets may be adversely affected.
- – We expect that we will be able to overcome significant challenges arising from our business model. We continue to rely on our trading and markets businesses as a significant source of profit. Depending on how economic and market conditions evolve, such businesses may be adversely impacted or be unable to achieve the profitability we seek from them.
- – Asset and client levels have been impacted by the negative market perceptions of Deutsche Bank from time to time. A continued or renewed negative market focus on Deutsche Bank could result in new client and asset outflows.
- – We expect that de-leveraging of CRU will continue, while reducing cost. In the event that the CRU is not able to de-leverage or reduce costs as planned, our objectives could be jeopardized.
- – In 2020, the COVID-19 pandemic temporarily reduced the rate of regular employee attrition versus historical levels, though in 2021 staff attrition levels reverted back closer to pre-pandemic trends. In the event that attrition levels again decrease, this can create a more challenging context to our cost targets. Conversely, if the attrition rate increases versus historical levels, this may adversely affect our ability to attract and retain talented personnel, particularly in front-office positions that are key to revenue generation and in positions key to improving our control environment.
- – Regulatory changes could also adversely impact our ability to achieve our strategic aims. In particular, regulators could demand changes to our business model or organization that could reduce our profitability, or we may be forced to make changes that reduce our profitability in an effort to remain compliant with laws and regulations.
- – We are involved in numerous litigation, arbitration and regulatory proceedings and investigations in Germany and in a number of jurisdictions outside of Germany, especially in the United States. Such matters are subject to many uncertainties. We expect the litigation environment to continue to be challenging. If litigation and regulatory matters occur at the same or higher rate and magnitude than they have in some recent years or if we are subject to sustained market speculation about our potential exposure to such matters, we may not be able to achieve our strategic aspirations.
- – We currently operate a highly complex infrastructure, which can compromise the quality of the overall control environment. Establishing a more efficient bank with a strong control environment depends on successfully streamlining and simplifying our IT landscape as well as cultural change.
|
23
|
|
|
Deutsche Bank
|
Signatures
|
|
|
Annual Report 2021 on Form 20-F
|
Change in Internal Control over Financial Reporting
|
|
|
|
|
- – A robust and effective internal control environment is necessary to ensure that we conduct our business in compliance with the laws and regulations applicable to us. We may be unable to complete our initiatives to enhance the efficacy of our internal control environment as quickly as we intend or as our regulators demand, and our efforts may be insufficient to prevent all future deficiencies in our control environment or to result in fewer litigations or regulatory and enforcement investigations and proceedings in the future. Furthermore, implementation of enhanced controls may result in higher-than- expected costs of regulatory compliance that could offset efficiency gains.
- – In particular, if some of the above risks were to materialize in the short-term such that our revenues would be negatively impacted or our cost base would significantly increase, we may not be able to achieve our cost-income ratio target of 70 % for 2022. For example, revenues could fall short of our expectations or expenses such as bank levies, litigation expenses, or staff costs may be higher than expected.
If we fail to implement our strategic initiatives in whole or in part or should the initiatives that are implemented fail to produce the anticipated benefits, or should the costs we incur to implement our initiatives exceed the amounts anticipated, or should we fail to achieve the publicly communicated targets we have set for implementation of these initiatives, we may fail to achieve our financial objectives, or incur losses or low profitability or erosions of our capital base, and our financial condition, results of operations and share price may be materially and adversely affected.
We may have difficulties selling companies, businesses or assets at favorable prices or at all and may experience material losses from these assets and other investments irrespective of market developments.
We seek to sell or otherwise reduce our exposure to assets that are not part of our core business or as part of our strategy to simplify and focus our business and to meet or exceed capital and leverage requirements, as well as to help us meet our return on tangible equity targets. We have already sold a substantial portion of our non-core assets, and our remaining non-core assets may be particularly difficult for us to sell as quickly as we have expected at prices we deem acceptable. Where we sell companies or businesses, we may remain exposed to certain of their losses or risks under the terms of the sale contracts, and the process of separating and selling such companies or businesses may give rise to operating risks or other losses. Unfavorable business or market conditions may make it difficult for us to sell companies, businesses or assets at favorable prices, or may preclude a sale altogether. If we cannot reduce our assets according to plan, we may not be able to achieve the capital targets set out under our strategy.
We may have difficulty in identifying and executing business combinations, and both engaging in combinations and avoiding them could materially harm our results of operations and our share price.
We consider business combinations from time to time. Were we to announce or complete a significant business combination transaction, our share price or the share price of the combined entity could decline significantly if investors viewed the transaction as too costly, dilutive to existing shareholders or unlikely to improve our competitive position. It is generally not feasible for our reviews of any business with which we might engage in a combination to be complete in all respects. As a result, a combination may not perform as well as expected. In addition, we may fail to integrate our operations successfully with any entity with which we participate in a business combination. Failure to complete announced business combinations or failure to achieve the expected benefits of any such combination could materially and adversely affect our profitability. Such failures could also affect investors’ perception of our business prospects and management, and thus cause our share price to fall. They could also lead to departures of key employees, or lead to increased costs and reduced profitability if we felt compelled to offer them financial incentives to remain.
If we avoid entering into business combination transactions or if announced or expected transactions fail to materialize, market participants may perceive us negatively. We may also be unable to expand our businesses, especially into new business areas, as quickly or successfully as our competitors if we do so through organic growth alone. These perceptions and limitations could cost us business and harm our reputation, which could have material adverse effects on our financial condition, results of operations and liquidity.
Intense competition, in our home market of Germany as well as in international markets, has and could continue to materially adversely impact our revenues and profitability.
Competition is intense in all of our primary business areas, in Germany as well as in international markets. If we are unable to respond to the competitive environment in these markets with attractive product and service offerings that are profitable for us, we may lose market share in important areas of our business or incur losses on some or all of our activities. In addition, downturns in the economies of these markets could add to the competitive pressure, for example, through increased price pressure and lower business volumes for us.
|
24
|
|
|
Deutsche Bank
|
Signatures
|
|
|
Annual Report 2021 on Form 20-F
|
Change in Internal Control over Financial Reporting
|
|
|
|
|
There has been substantial consolidation and convergence among financial services companies. This trend has significantly increased the capital base and geographic reach of some of our competitors and has hastened the globalization of the securities and other financial services markets. As a result, we must compete with financial institutions that may be larger and better capitalized than we are and that may have a stronger position in local markets.
In addition to our traditional competitors such as other universal banks and financial services firms, an emerging group of future competitors in the form of start-ups and technology firms, including those providing “fintech” services, are showing an increasing interest in banking services and products. These new competitors could increase competition in both core products, e.g., payments, basic accounts and loans and investment advisory, as well as in new products, e.g., peer to peer lending and equity crowd funding. Such firms are also potential competitors of ours in attracting and retaining talented personnel.
Risks Relating to environmental, social and governance (ESG)-related changes
The impacts of rising global temperatures, and the enhanced focus on climate change and the transition to a “net-zero” economy from society, our regulators and the banking sector, have led to the emergence of new and increasing sources of financial and non-financial risks. These include the physical risks arising from extreme weather events. which are growing in frequency and severity. transition risks as carbon-intensive sectors are faced with higher taxation, reduced demand and potentially restricted access to financing, and risks relating to the portrayal of ESG aspect of activities. These risks can impact Deutsche Bank across a broad range of financial and non-financial risk types.
Financial institutions are facing increased scrutiny on climate and broader environmental, social and governance (ESG)-related issues from governments, regulators, shareholders and other bodies, leading to reputational risks if we are not seen to support the transition to a lower carbon economy, and to protect biodiversity and human rights. We are also required to review and enhance our ESG risk management frameworks in alignment with emerging regulatory guidance and to ensure that we accurately portray the ESG aspects of our activities. There is a lack of consistent and comprehensive ESG data and methodologies available today which means that we are heavily reliant on proxy estimates and qualitative approaches when assessing the risks to our balance sheet, which introduces a high degree of uncertainty into our climate-related disclosures. In 2022, the ECB will conduct its first climate stress test, an exercise which contains a number of novel and complex elements which require the development of new methodologies and data sources.
Deutsche Bank is committed to managing our business activities and operations in a sustainable manner, including aligning our portfolios with net zero emissions by 2050. We are continuing to develop and implement our approach to environmental risk assessments and management in order to promote the integration of environmental-related factors across our business activities. This includes the ability to identify, monitor and manage risks and to conduct regular scenario analysis and stress testing. Both rapidly changing regulatory as well as stakeholder demands, combined with significant focus by stakeholders, may materially affect our businesses if we fail to adopt such demands or appropriately implement our strategic plans.
|
25
|
|
|
Deutsche Bank
|
Signatures
|
|
|
Annual Report 2021 on Form 20-F
|
Change in Internal Control over Financial Reporting
|
|
|
|
|
Risks Relating to Regulation and Supervision
Regulatory reforms enacted and proposed in response to weaknesses in the financial sector, together with increased regulatory scrutiny more generally, have had and continue to have a significant impact on us and may adversely affect our business and ability to execute our strategic plans. Competent regulators may prohibit us from making dividend payments or payments on our regulatory capital instruments or take other actions if we fail to comply with regulatory requirements.
In response to the global financial crisis and the European sovereign debt crisis, governments and regulatory authorities have worked to enhance the resilience of the financial services industry against future crises through changes to the regulatory framework. The pace of change of new proposals has slowed as the focus turns more to implementation of the various elements of the regulatory reform agenda outlined by the Basel Committee on Banking Supervision (“Basel Committee”) and other standard-setting bodies. As a result, there continues to be uncertainty for us and the financial industry in general, though the level of uncertainty is reduced from prior periods. The range of new (or revised) laws and regulations or current proposals includes, among other things:
- – provisions for more stringent regulatory capital, leverage and liquidity standards,
- – restrictions on compensation practices,
- – restrictions on proprietary trading and other investment services,
- – special bank levies,
- – recovery and resolution powers to intervene in a crisis including the “bail-in” of creditors,
- – tightened large exposure limits,
- – the creation of a single supervisory authority and a single resolution authority within the Eurozone and any other participating member states,
- – contributions to the Single Resolution Fund and prefunding of deposit guarantee schemes,
- – separation of certain businesses from deposit taking,
- – stress testing and capital planning regimes,
- – heightened reporting requirements, and
- – reforms of derivatives, other financial instruments, investment products and market infrastructures.
As a core element of the reform of the regulatory framework, the Basel Committee developed and continuously refined and supplemented a comprehensive set of rules of minimum capital adequacy and liquidity standards as well as other rules, known as Basel 3. The initial set of rules was implemented into European and national (in our case, German) law beginning in 2014, with the European legislative package also referred to as “CRR/CRD IV” and the Bank Recovery and Resolution Directive (or “BRRD”), which provides for a resolution framework for banks. The set of rules was further strengthened with a comprehensive package of reforms in 2019 also referred to as “CRR II/CRD V” and “BRRD II”. The reform package also implemented certain regulatory proposals of the Financial Stability Board (“FSB”) regarding a requirement for global systemically important institutions (“G-SIIs”), such as Deutsche Bank, to hold certain minimum levels of capital and other instruments which are capable of bearing losses in resolution (“Total Loss-Absorbing Capacity” or “TLAC”).
On October 27, 2021, the European Commission published a comprehensive package of reforms with respect to the European Union banking rules (referred to as the “Banking Package 2021”) to ensure that banks become more resilient to potential future economic shocks while contributing to the EU’s recovery from the COVID-19 pandemic and its transition to climate neutrality. The proposals aim to amend the Capital Requirements Regulation (“CRR”), the Capital Requirements Directive (“CRD”) and the Bank Recovery and Resolution Directive (“BRRD”). If adopted, the proposals to amendment the CRR and CRD (commonly referred to as “CRR III” and “CRD VI”) will, in particular, finalize the implementation of the Basel 3 framework in the European Union and also fully implement the market risk capital changes in the Fundamental Review of the Trading Book (“FRTB”). Another separate proposal entails combined amendments to the CRR and the BRRD with respect to the resolution regime.
CRR III and CRD VI include, inter alia, a gradually introduced output floor establishing minimum risk-weighted assets that will ultimately be set at 72.5 % of the risk-weighted assets calculated under the standardized approach, changes to standardized and internal ratings-based approaches for determining credit risk, changes to the credit valuation adjustment, a revision of the approaches for operational risks and reforms to the market risk framework as set out in the FRTB, adjustments to the Pillar 2 requirements (“P2R”) and the systemic risk buffer and a “fit-and-proper” set of rules for senior staff managing banks. Other proposed measures are aimed to address sustainability risks by requiring banks to identify, disclose and manage environmental, social and governance risks as part of their risk management which includes regular climate stress testing by the banks’ supervisors. The proposal does not entail any adjustments to the capital requirements for green or brown assets. However, the European Commission stated that it is exploring this idea and has asked the European Banking Authority (“EBA”) to assess possible adjustments.
It is expected that the EBA will provide its report in 2023.
|
26
|
|
|
Deutsche Bank
|
Signatures
|
|
|
Annual Report 2021 on Form 20-F
|
Change in Internal Control over Financial Reporting
|
|
|
|
|
The proposals regarding the resolution regime include clarifications with respect to some aspects of the TLAC / minimum requirement for own funds and eligible liabilities (“MREL”) regime in relation to single point of entry and multiple point of entry resolution strategies and, in particular, a deduction regime requiring intermediate parents to deduct from their own internal MREL capacity the amount of their holdings of internal MREL eligible instruments, including own funds, issued by their subsidiaries belonging to the same resolution group.
The Banking Package 2021 will now be negotiated with EU lawmakers, i.e. the European Parliament and Member States. It is expected that CRR III and CRD VI will start entering into force in 2023 at the earliest with the new rules implementing Basel 3 to apply from January 1, 2025. The European Commission expects that the final implementation of the Basel 3 framework will lead to an increase in the capital requirements of European banks of less than 3 % on average at the beginning of the transitional period in 2025 and of less than 9 % at the end of such period in 2030.
The implementation of the remaining outstanding proposals under Basel 3 as contained in the Banking Package 2021 has the potential to increase our risk-weighted assets and will likely affect our business by raising our regulatory capital and liquidity requirements and by leading to increased costs. Such requirements may be in addition to regulatory capital buffers that may also be increased or be in addition to those already imposed on us and could themselves materially increase our capital requirements.
In addition, regulatory scrutiny of compliance with existing laws and regulations has become more intense and supervisory expectations remain significant. The specific effects of a number of new (or revised) laws and regulations remain uncertain because the drafting and implementation of these laws and regulations are still on-going and supervisory expectations continue to develop.
Regulatory authorities have substantial discretion in how to regulate banks, and this discretion, and the means available to the regulators, have been steadily increasing during recent years. Regulation may be imposed on an ad hoc basis by governments and regulators in response to ongoing or future crises (such as the COVID-19 pandemic), and may especially affect financial institutions such as Deutsche Bank that are deemed to be systemically important.
In particular, the regulators with jurisdiction over us, including the ECB under the Single Supervisory Mechanism (also referred to as the “SSM”), may, in connection with the supervisory review and evaluation process (“SREP”), SSM-wide reviews of asset quality or internal risk models or otherwise, conduct stress tests. They have discretion to impose capital surcharges on financial institutions for risks, including for litigation, regulatory and similar matters, that are not otherwise recognized in risk-weighted assets or other surcharges depending on the individual situation of the bank. Such adjustments may, for example, reflect additional risks posed by deficiencies in our control environment, or come as a result of supervisory inspections concerning the treatment of specific products or transactions. One of these areas in focus of the ECB with regard to risk taking is leveraged lending, for which the ECB has announced its intent to clarify their expectations for all banks under the SSM and to consider quantitative measures in future SREP decisions for institutions which the ECB assesses as non-compliant with these expectations. The ECB may take or require other measures, such as restrictions on or changes to our business. In this context, the ECB may impose, and has imposed, on us individual capital requirements resulting from the SREP which are referred to as P2R. Institutions must meet their P2R with at least 75 % of Tier 1 capital and at least 56.25 % of Common Equity Tier 1 capital. P2R must be fulfilled in addition to the statutory minimum capital and buffer requirements and any non-compliance may have immediate legal consequences such as restrictions on dividend payments.
Also following the SREP, the ECB may communicate to individual banks, and has communicated to us, an expectation to hold a further Pillar 2 Common Equity Tier 1 capital add-on, the so-called Pillar 2 guidance (“P2G”). Although the P2G is not legally binding and failure to meet the P2G does not automatically trigger legal action, the ECB has stated that it generally expects banks to meet the P2G. In light of the COVID-19 pandemic, the ECB currently allows banks to operate temporarily below the level of capital defined by the P2G, but expects banks to operate above P2G again from January 1, 2023.
Further, effective as of February 1, 2022, the BaFin set the amount of the countercyclical capital buffer (“CCyB”) for banks in Germany at 0.75 % of their total risk exposure amount. Banks have to comply with the new CCyB requirement from February 1, 2023.
Also, more generally, competent regulators may, if we fail to comply with regulatory requirements, in particular with statutory minimum capital requirements or P2R, or if there are shortcomings in our governance and risk management processes, prohibit us from making dividend payments to shareholders or distributions to holders of our other regulatory capital instruments. This could occur, for example, if we fail to make sufficient profits due to declining revenues, or as a result of substantial outflows due to litigation, regulatory and similar matters. Generally, a failure to comply with the quantitative and qualitative regulatory requirements could have a material adverse effect on our business, financial condition and results of operations, including our ability to pay out dividends to shareholders or distributions on our other regulatory capital instruments or, in certain circumstances, conduct business which we currently conduct or plan to conduct in the future.
|
27
|
|
|
Deutsche Bank
|
Signatures
|
|
|
Annual Report 2021 on Form 20-F
|
Change in Internal Control over Financial Reporting
|
|
|
|
|
Regulatory and legislative changes require us to maintain increased capital and bail-inable debt (debt that can be bailed in in resolution) and abide by tightened liquidity requirements. These requirements may significantly affect our business model, financial condition and results of operations, as well as the competitive environment generally. Any perceptions in the market that we may be unable to meet our capital or liquidity requirements with an adequate buffer, or that we should maintain capital or liquidity in excess of these requirements, or any other failure to meet these requirements, could intensify the effect of these factors on our business and results.
The implementation of the CRR/CRD IV legislative package resulted, among other things, in increased capital and tightened liquidity requirements, including additional capital buffer requirements which were gradually phased in through January 1, 2019. Further revisions, such as stricter rules on the measurement of risks and the changes introduced by the CRR II/CRD V/BRRD II reform package increased risk-weighted assets and the corresponding capital demand for banks, as well as tightened liquidity requirements (such as the introduction of a binding Net Stable Funding Ratio (“NSFR”)). In addition, the introduction of a binding leverage ratio (including the leverage ratio buffer) affected our business model, financial conditions and results of operations.
Furthermore, under the SRM Regulation, the BRRD and the German Recovery and Resolution Act (
Sanierungs- und Abwicklungsgesetz
), we are required to meet at all times a robust MREL which is determined on a case-by-case basis by the competent resolution authority. In addition, the CRR II/CRD V/BRRD II reform package implemented the FSB’s TLAC standard for global systemically important banks (“G-SIBs”, such as us) by introducing a Pillar 1 MREL requirement for G-SIIs (the European equivalent term for G-SIBs). This requirement is based on both risk-based and non-risk-based denominators and will be set at the higher of 18 % of total risk exposure and 6.75 % of the leverage ratio exposure measure. It can be met with Tier 1 or Tier 2 capital instruments or debt that meets specific eligibility criteria. Deduction rules apply for holdings by G-SIIs of TLAC instruments of other G-SIIs. In addition, the competent authorities have the ability to impose on G-SIIs individual MREL requirements that exceed the statutory minimum requirements. As described above, the European Commission included clarifications with respect to the TLAC / MREL regime in its legislative proposals of October 27, 2021.
Both the TLAC (or Pillar 1 MREL) and MREL requirements are specifically designed to require banks to maintain a sufficient amount of instruments which are eligible to absorb losses in resolution with the aim of ensuring that failing banks can be resolved without recourse to taxpayers’ money. To that end, in order to facilitate the meeting of TLAC requirements by German banks, obligations of German banks under certain specifically defined senior unsecured debt instruments issued by them (such as bonds that are not structured debt instruments) rank, since 2017, junior to all other outstanding unsecured unsubordinated obligations of such bank (such as deposits, derivatives, money market instruments and certain structured debt instruments), but continue to rank in priority to contractually subordinated debt instruments (such as Tier 2 instruments).
As part of the harmonization of national rules on the priority of claims of banks’ creditors in the European Union, the BRRD allows banks to issue “senior non-preferred” debt instruments ranking according to their terms (and not only statutorily) junior to the bank’s other unsubordinated debt instruments (including bonds that are not treated as “senior non-preferred” debt instruments), but in priority to the bank’s contractually subordinated liabilities (such as Tier 2 instruments). Any such “senior non-preferred” debt instruments issued by Deutsche Bank AG under such rules rank on parity with its then outstanding “senior non-preferred” debt instruments under the prior rules. This BRRD amendment was finalized and implemented into German law as of July 21, 2018.
The need to comply with these requirements may affect our business, financial condition and results of operation and in particular may increase our financing costs.
We may not have sufficient capital or other loss-absorbing liabilities to meet these increasing regulatory requirements. This could occur due to regulatory changes and other factors, such as our inability to issue new securities which are recognized as regulatory capital or loss-absorbing liabilities under the new standards, due to an increase of risk-weighted assets based on more stringent rules for the measurement of risks or as a result of a future decline in the value of the euro as compared to other currencies, due to stricter requirements for the compliance with the non-risk based leverage ratio, due to any substantial losses we may incur, which would reduce our retained earnings, a component of Common Equity Tier 1 capital, or due to a combination of these or other factors.
|
28
|
|
|
Deutsche Bank
|
Signatures
|
|
|
Annual Report 2021 on Form 20-F
|
Change in Internal Control over Financial Reporting
|
|
|
|
|
If we are unable to maintain sufficient capital to meet the applicable minimum capital ratios, the buffer requirements, any specific Pillar 2 capital requirements, leverage ratio requirements, or TLAC or MREL requirements, we may become subject to enforcement actions and/or restrictions on the pay-out of dividends, share buybacks, payments on our other regulatory capital instruments, and discretionary compensation payments. In addition, any requirement to increase risk-based capital ratios or the leverage ratio could lead us to adopt a strategy focusing on capital preservation and creation over revenue generation and profit growth, including the reduction of higher margin risk-weighted assets. If we are unable to increase our capital ratios to the regulatory minimum in such a case or by raising new capital through the capital markets, through the reduction of risk-weighted assets or through other means, we may be required to activate our group recovery plan. If these actions or other private or supervisory actions do not restore capital ratios to the required levels, and we are deemed to be failing or likely to fail, competent authorities may apply resolution powers under the Single Resolution Mechanism (“SRM”) and applicable rules and regulations, which could lead to a significant dilution of our shareholders’ or even the total loss of our shareholders’ or creditors’ investment.
The CRR introduced a liquidity coverage requirement intended to ensure that banks have an adequate stock of unencumbered high quality liquid assets that can be easily and quickly converted into cash to meet their liquidity needs for a 30-calendar day liquidity stress scenario. The required liquidity coverage ratio (“LCR”) is calculated as the ratio of a bank’s liquidity buffer to its net liquidity outflows. Also, banks must regularly report the composition of the liquid assets in their liquidity buffer to their competent authorities. Due to the COVID-19 pandemic, the ECB temporarily allowed banks to operate below the minimum LCR. On December 17, 2021, the ECB announced that it expects banks to operate again with a LCR of above 100 % as from January 1, 2022.
In addition, the CRR II/CRD V/BRRD II reform package introduced the NSFR to reduce medium- to long-term funding risks by requiring banks to fund their activities with sufficiently stable sources of funding over a one-year period. The NSFR, which applies since June 28, 2021,
is defined as the ratio of a bank’s available stable funding relative to the amount of required stable funding over a one-year period. Banks must maintain an NSFR of at least 100 %. The ECB may impose on individual banks liquidity requirements which are more stringent than the general statutory requirements if the bank’s continuous liquidity would otherwise not be ensured. The NSFR applies to both the Group as a whole and to individual SSM regulated entities, including the parent entity Deutsche Bank AG.
If we fail to meet liquidity requirements, we may become subject to enforcement actions. In addition, any requirement to maintain or increase liquidity could lead us to reduce activities that pursue revenue generation and profit growth.
Due to the COVID-19 pandemic, the 2020 EU-wide stress test by the EBA and the ECB took place in 2021. This test was designed to provide supervisors, banks and other market participants with a common analytical framework to compare and assess, the resilience of EU banks over a three-year horizon under both a baseline and an adverse scenario, which is characterized by severe shocks taking into account the impact of the pandemic. The stress test was conducted on a sample of 50 EU banks, including Deutsche Bank and the results were published on July 30, 2021. By its standard procedures, the ECB considers our quantitative performance in the adverse scenario as an input when reconsidering the level of the Pillar 2 guidance in its 2021 SREP assessment and our qualitative performance as one aspect when holistically reviewing the P2R. Following the 2021 SREP, Deutsche Bank has been informed by the ECB that, from March 1, 2022 onwards, we are required, on a consolidated basis, to maintain an unchanged P2R of 2.50 %. The next EU-wide stress test will be carried out in 2023.
In some cases, we are required to hold and calculate capital and to comply with rules on liquidity and risk management separately for our local operations in different jurisdictions, in particular in the United States.
We are required to hold and calculate capital and to comply with rules on liquidity and risk management separately for our local operations in different jurisdictions. In February 2014, the Federal Reserve Board adopted rules that set forth how the U.S. operations of certain foreign banking organizations (“FBOs”), such as Deutsche Bank, are required to be structured in the United States, as well as the enhanced prudential standards that apply to our U.S. operations. Under these rules, a large FBO with U.S.$ 50 billion or more in U.S. non-branch assets, such as Deutsche Bank, was required to establish or designate a separately capitalized top-tier U.S. intermediate holding company (an “IHC”) that would hold substantially all of the FBO’s ownership interests in its U.S. subsidiaries. On July 1, 2016, we designated DB USA Corporation as our IHC. In March 2018, we completed the partial initial public offering of our Asset Management division, to form DWS
Group GmbH Co. KGaA (“DWS”), in which we retain approximately 80 % of the shares. In April 2018, DWS USA Corporation was formed as a subsidiary of DWS, and, following receipt of Federal Reserve Board approval, we designated it as our second IHC, through which our U.S. asset management subsidiaries are held. Each of these IHCs is subject, on a consolidated basis, to the risk-based and leverage capital requirements under the U.S. Basel 3 capital framework, capital planning and stress testing requirements, U.S. liquidity buffer requirements and other enhanced prudential standards comparable to those applicable to large U.S. banking organizations. They are also subject to supplementary leverage ratio (“SLR”) requirements. The Federal Reserve Board has the authority to examine an IHC, such as DB USA Corporation and DWS USA Corporation, and its subsidiaries, as well as U.S. branches and agencies of FBOs, such as our New York branch.
|
29
|
|
|
Deutsche Bank
|
Signatures
|
|
|
Annual Report 2021 on Form 20-F
|
Change in Internal Control over Financial Reporting
|
|
|
|
|
On October 10, 2019, the Federal Reserve Board finalized rules to categorize the U.S. operations of large FBOs based on size, complexity and risk for purposes of tailoring the application of the U.S. enhanced prudential standards (the “Tailoring Rules”). The Tailoring Rules do not significantly change the capital requirements that apply to DB USA Corporation or DWS USA Corporation although they provide the option to comply with certain simplifications to the capital requirements. However, the Tailoring Rules provide modest relief for our U.S. IHCs with respect to applicable liquidity requirements so long as our IHCs’ combined weighted short term wholesale funding remains below $75 billion
.
As a bank holding company with assets of U.S.$ 250 billion or more, Deutsche Bank AG is required under Title I of the Dodd-Frank Wall Street Reform and Consumer Protection Act of 2010, as amended (the “Dodd-Frank Act”), and the implementing regulations thereunder to prepare and submit to the Federal Reserve Board and the Federal Deposit Insurance Corporation (“FDIC”) either a full or targeted resolution plan (the “U.S. Resolution Plan”) on a timeline prescribed by such agencies. The U.S. Resolution Plan must demonstrate that Deutsche Bank AG has the ability to execute a strategy for the orderly resolution of its designated U.S. material entities and operations. For foreign-based companies subject to these resolution planning requirements such as Deutsche Bank AG, the U.S. Resolution Plan relates only to subsidiaries, branches, agencies and businesses that are domiciled in or whose activities are carried out in whole or in material part in the United States. Deutsche Bank’s U.S. Resolution Plan describes the single point of entry strategy for Deutsche Bank’s U.S. material entities and operations and prescribes that DB USA Corporation, our U.S. IHC, would provide liquidity and capital support to its U.S. material entity subsidiaries and ensure their solvent wind-down outside of applicable resolution proceedings.
On December 9, 2020, the Federal Reserve Board and FDIC finalized guidance for the resolution plans of certain large foreign banks, including Deutsche Bank AG. In that guidance, the agencies tailored their expectations around resolution capital and liquidity, derivatives and trading activity, as well as payment, clearing, and settlement activities. The agencies also provided information to large banks, including Deutsche Bank AG, regarding additional content to be included in the 2021 U.S. resolution plans, which were required to be filed by December 17, 2021. Deutsche Bank’s ‘targeted’ 2021 U.S. Resolution Plan, the firm’s first ‘targeted plan’, includes core elements of the U.S. resolution strategy — such as capital, liquidity, and recapitalization strategies — as well as how Deutsche Bank has integrated lessons learned from its response to the COVID-19 pandemic into its resolution planning process. Deutsche Bank AG submitted its targeted 2021 U.S. Resolution Plan on December 13, 2021. If the Federal Reserve Board and the FDIC were to jointly deem Deutsche Bank’s U.S. Resolution Plan not credible and Deutsche Bank failed to remediate any deficiencies in the required timeframe prescribed by the Federal Reserve Board and FDIC, these agencies could impose restrictions on Deutsche Bank or require the restructuring or reorganization of businesses, legal entities, operational systems and/or intra-company transactions which could negatively impact our operations and/or strategy. Additionally, the Federal Reserve Board and FDIC could also subject Deutsche Bank to more stringent capital, leverage or liquidity requirements, or require Deutsche Bank to divest certain assets or operations.
DB USA Corporation and DWS USA Corporation are each subject, on an annual basis, to the Federal Reserve Board’s supervisory stress testing and capital requirements. DB USA Corporation and DWS USA Corporation are also subject to the Federal Reserve’s Comprehensive Capital Analysis and Review (“CCAR”), which is an annual supervisory exercise that assesses the capital positions and planning practices of large bank holding companies and IHCs. On June 24, 2021, the Federal Reserve Board publicly released the results of its annual supervisory stress test, which showed that DB USA Corporation and DWS USA Corporation would continue to have capital levels above minimum requirements even under the stress test’s severely adverse scenario. DB USA Corporation and DWS USA Corporation submitted their annual capital plans in April 2021 and will make their next capital plan submissions to the Federal Reserve Board in April 2022. If the Federal Reserve Board were to object to these capital plans we could be required to increase capital or restructure businesses in ways that may negatively impact our operations and strategy or could be subject to restrictions on growth in the United States.
On March 4, 2020, the Federal Reserve Board issued a rule to amend its CCAR process to combine the CCAR quantitative assessment and the buffer requirements in the Federal Reserve Board’s capital rules to create an integrated capital buffer requirement. This final rule has eliminated the quantitative and qualitative ‘pass/fail’ assessments from CCAR and modified the static capital conservation buffer to incorporate an institution-specific stress capital buffer (SCB), which is floored at 2.5 %. The stress capital buffer equals (i) a bank holding company's projected peak-to-trough decline in common equity tier 1 capital under the annual CCAR supervisory severely adverse stress testing scenario prior to any planned capital actions, plus (ii) one year of planned common stock dividends. The stress capital buffer will be reset each year. On August 5, 2021, the Federal Reserve Board announced an SCB for each CCAR firm based on 2021 supervisory stress testing results, which for DB USA Corporation was 4.5 % and for DWS USA Corporation was 7.2 %. This SCB became effective October 1, 2021 and would generally remain in effect until September 30, 2022, at which point the size of the SCB for each of our IHCs will be recalibrated based on the results of the 2022 stress tests, which are expected to be released in June 2022. In response to the COVID-19 pandemic, during the first six months of 2021, the Federal Reserve Board imposed additional restrictions on certain capital distributions for CCAR firms, separate from the SCB. These additional capital restrictions were lifted on July 1, 2021.
|
30
|
|
|
Deutsche Bank
|
Signatures
|
|
|
Annual Report 2021 on Form 20-F
|
Change in Internal Control over Financial Reporting
|
|
|
|
|
The U.S. federal bank regulators in 2013 issued final rules implementing elements of the Basel 3 capital adequacy framework that are applicable to U.S. banking organizations.
In September 2014, the Federal Reserve Board and other U.S. regulators approved a final rule implementing liquidity coverage ratio (“LCR”) requirements for large U.S. bank holding companies and certain of their subsidiary depositary institutions that are generally consistent with the Basel Committee’s revised Basel 3 liquidity standards. DB USA Corporation, DWS USA Corporation and our principal U.S. bank subsidiary, Deutsche Bank Trust Company Americas (“DBTCA”), are subject to the LCR requirements. The Tailoring Rules reduced the LCR requirements applicable to these institutions from 100 to 85 percent coverage of net outflows over a projected 30-day period.
On October 20, 2020, the Federal Reserve Board and other U.S. regulators finalized rules implementing the second element of the Basel 3 liquidity framework, the net stable funding ratio (“NSFR”). Under the Tailoring Rules, DB USA Corporation, DWS USA Corporation and DBTCA would be subject to an 85 percent NSFR so long as our IHCs’ combined weighted short term wholesale funding remains below $75 billion. Effective July 1, 2021, these f
irms are required to calculate the NSFR and meet the minimum required ratios on a daily basis. Beginning in 2023, these firms will be required to publicly report NSFR information on a periodic basis.
On December 15, 2016, the Federal Reserve Board adopted final rules that implement the FSB’s TLAC standard in the United States. The final rules require, among other things, U.S. IHCs of non-U.S. G-SIBs, including our IHCs, DB USA Corporation and DWS USA Corporation, to maintain a minimum amount of TLAC, and separately require them to maintain a minimum amount of long-term debt meeting certain requirements.
U.S. rules and interpretations, including those described above, could cause us to reduce assets held in the United States, or to inject capital and/or liquidity into or otherwise change the structure of our U.S. operations, and could also restrict the ability of our U.S. subsidiaries to pay dividends to us or the amount of such dividends. To the extent that we are required to reduce operations in the United States or deploy capital or liquidity in the United States that could be deployed more profitably elsewhere, these requirements could have an adverse effect on our business, financial condition and results of operations.
Any increased capital or liquidity requirements, including those described above, could have adverse effects on our business, financial condition and results of operations, as well as on perceptions in the market of our stability, particularly if any such requirement and results in our having to raise capital at a time when we or the financial markets are distressed, or take other measures to increase liquidity in certain jurisdictions due to local requirements. The measures we might be required or find necessary to take in response to these shifting local requirements may be inconsistent with, and hinder the achievement of, our strategic goals. In addition, if these regulatory requirements must be implemented more quickly than currently foreseen, we may decide that the quickest and most reliable path to compliance is to reduce the level of assets on our balance sheet, dispose of assets or otherwise segregate certain activities or reduce or close down certain business lines.
The effects on our capital raising efforts in such a case could be amplified due to the expectation that our competitors, at least those subject to the same or similar capital requirements, would likely also be required to raise capital at the same time. Moreover, some of our competitors, particularly those outside the European Union, may not face the same or similar regulations, which could put us at a competitive disadvantage.
In addition to these regulatory initiatives, market sentiment may encourage financial institutions such as Deutsche Bank to maintain significantly more capital, liquidity and loss-absorbing capital instruments than the regulatory-mandated minima, which could exacerbate the effects on us described above or, if we do not increase our capital to the encouraged levels, could lead to the perception in the market that we are undercapitalized relative to our peers generally.
It is unclear whether the U.S. capital and other requirements described above, as well as similar developments in other jurisdictions, could lead to a fragmentation of supervision of global banks that could adversely affect our reliance on regulatory waivers allowing us to meet capital adequacy requirements, large exposure limits and certain organizational requirements on a consolidated basis only rather than on both a consolidated and non-consolidated basis. Should we no longer be entitled to rely on these waivers, we would have to adapt and take the steps necessary in order to meet regulatory capital requirements and other requirements on a consolidated as well as a non-consolidated basis, which could result also in significantly higher costs and potential adverse effects on our profitability and dividend paying ability.
|
31
|
|
|
Deutsche Bank
|
Signatures
|
|
|
Annual Report 2021 on Form 20-F
|
Change in Internal Control over Financial Reporting
|
|
|
|
|
Our regulatory capital and liquidity ratios and our funds available for distributions on our shares or regulatory capital instruments will be affected by our business decisions and, in making such decisions, our interests and those of the holders of such instruments may not be aligned, and we may make decisions in accordance with applicable law and the terms of the relevant instruments that result in no or lower payments being made on our shares or regulatory capital instruments.
Our regulatory capital and liquidity ratios are affected by a number of factors, including decisions we make relating to our businesses and operations as well as the management of our capital position, of our risk-weighted assets and of our balance sheet in general, and external factors, such as regulations regarding the risk weightings we are permitted to allocate to our assets, commercial and market risks or the costs of our legal or regulatory proceedings. While we and our management are required to take into account a broad range of considerations in our and their managerial decisions, including the interests of the Bank as a regulated institution and those of our shareholders and creditors, particularly in times of weak earnings and increasing capital requirements, the regulatory requirements to build capital and liquidity may become paramount. Accordingly, in making decisions in respect of our capital and liquidity management, we are not required to adhere to the interests of the holders of instruments we have issued that qualify for inclusion in our regulatory capital, such as our shares or Additional Tier 1 capital instruments. We may decide to refrain from taking certain actions, including increasing our capital at a time when it is feasible to do so (through securities issuances or otherwise), even if our failure to take such actions would result in a non-payment or a write-down or other recovery- or resolution-related measure in respect of any of our regulatory capital instruments. Our decisions could cause the holders of such regulatory capital instruments to lose all or part of the value of their investments in these instruments due to their effect on our regulatory capital ratios, and such holders will not have any claim against us relating to such decisions, even if they result in a non-payment or a write-down or other recovery- or resolution-related measure in respect of such instruments they hold.
In addition, our annual profit and distributable reserves form an important part of the funds available for us to pay dividends on our shares and make payments on our other regulatory capital instruments, as determined in the case of each such instrument by its terms or by operation of law, are calculated on an unconsolidated basis generally in accordance with German accounting rules set forth in the Commercial Code (
Handelsgesetzbuch
). Any adverse change in our financial prospects, financial position or profitability, or our distributable reserves, each as calculated on an unconsolidated basis, may have a material adverse effect on our ability to make dividend or other payments on these instruments. In addition, as part of the implementation of our strategy, we may record impairments that reduce the carrying value of subsidiaries on our unconsolidated balance sheet and reduce profits and distributable reserves. Future impairments or other events that reduce our profit or distributable reserves on an unconsolidated basis could lead us to be unable to make such payments in respect of future years in part or at all. In particular, the direct costs of our potential settlements of litigation, enforcement and similar matters, especially to the extent in excess of provisions we have established for them, and their related business impacts, if they occur, could impact such distributable amounts.
In addition, German law places limits on the extent to which annual profits and otherwise-distributable reserves, as calculated on an unconsolidated basis, may be distributed to our shareholders or the holders of our other regulatory capital instruments, such as our Additional Tier 1 capital instruments. Our management also has, subject to applicable law, broad discretion under the applicable accounting principles to influence all amounts relevant for calculating funds available for distribution. Such decisions may impact our ability to make dividend or other payments under the terms of our regulatory capital instruments.
|
32
|
|
|
Deutsche Bank
|
Signatures
|
|
|
Annual Report 2021 on Form 20-F
|
Change in Internal Control over Financial Reporting
|
|
|
|
|
European and German legislation regarding the recovery and resolution of banks and investment firms could, if steps were taken to ensure our resolvability or resolution measures were imposed on us, significantly affect our business operations, and lead to losses for our shareholders and creditors.
Germany participates in the SRM, which centralizes at a European level the key competences and resources for managing the failure of any bank in member states of the European Union participating in the banking union. The SRM is based on the SRM Regulation and the BRRD, which was implemented in Germany through the German Recovery and Resolution Act. In addition, the German Resolution Mechanism Act (
Abwicklungsmechanismusgesetz
) adapted German bank resolution laws to the SRM.
The SRM Regulation and the German Recovery and Resolution Act require the preparation of recovery and resolution plans for banks and grant broad powers to public authorities to intervene in a bank which is failing or likely to fail. For a bank directly supervised by the ECB, such as Deutsche Bank, the Single Resolution Board (referred to as the “SRB”) assesses its resolvability and may require legal and operational changes to the bank’s structure to ensure its resolvability. In the event that such bank is deemed by the ECB or the SRB as failing or likely to fail and certain other conditions are met, the SRB is responsible for adopting a resolution scheme for resolving the bank pursuant to the SRM Regulation. The European Commission and, to a lesser extent, the Council of the European Union, have a role in endorsing or objecting to the resolution scheme proposed by the SRB. The resolution scheme would be addressed to and implemented by the competent national resolution authorities (in Germany,
the BaFin) in line with the national laws implementing the BRRD. Resolution measures that could be imposed upon a bank in resolution may include the transfer of shares, assets or liabilities of the bank to another legal entity, the reduction, including to zero, of the nominal value of shares, the dilution of shareholders or the cancellation of shares outright, or the amendment, modification or variation of the terms of the bank’s outstanding debt instruments, for example by way of a deferral of payments or a reduction of the applicable interest rate.
Furthermore, certain eligible unsecured liabilities, in particular certain senior “non-preferred” debt instruments specified by the German Banking Act, may be written down, including to zero, or converted into equity (commonly referred to as “bail-in”) if the bank becomes subject to resolution.
The SRM is intended to eliminate, or reduce, the need for public support of troubled banks. Therefore, financial public support for such banks, if any, would be used only as a last resort after having assessed and exploited, to the maximum extent practicable, the resolution powers, including a bail-in. The taking of actions to ensure our resolvability or the exercise of resolution powers by the competent resolution authority could materially affect our business operations and lead to a significant dilution of our shareholders or even the total loss of our shareholders’ or creditors’ investment.
Other regulatory reforms adopted or proposed in the wake of the financial crisis – for example, extensive new regulations governing our derivatives activities, compensation, bank levies, deposit protection, or data protection – may materially increase our operating costs and negatively impact our business model.
Beyond capital requirements and the other requirements discussed above, we are affected, or expect to be affected, by various additional regulatory reforms, including, among other things, regulations governing our derivatives activities, compensation, bank levies, deposit protection, or data protection.
On August 16, 2012, the EU Regulation on over-the-counter (“OTC”) derivatives, central counterparties and trade repositories, referred to as European Market Infrastructure Regulation (“EMIR”), entered into force. EMIR introduced a number of requirements, including clearing obligations for certain classes of OTC derivatives and various reporting and disclosure obligations. EMIR implementation has led and may lead to changes that may negatively impact our profit margins. The revised Markets in Financial Instruments Directive (“MiFID”) and the corresponding Regulation (“MiFIR”) became applicable to us on January 3, 2018 and provide for, among other things, a trading obligation for those OTC derivatives which are subject to mandatory clearing and which are sufficiently standardized. On November 25, 2021, the European Commission published a proposal for a review of the MiFIR (referred to as the “MiFIR Review”) that entails amendments to the MiFIR and the MiFID. The proposals in the MiFIR Review, among other things, introduce an EU-wide consolidated tape for each asset class, enhanced transparency requirements for small trades in equities (such as shares) and for non-equities (such as derivatives and bonds), and adjust the scope of the EU share trading obligation and derivatives trading obligation.
In the United States, the Dodd-Frank Act has numerous provisions that affect or may affect our operations. Pursuant to regulations implementing provisions of the Dodd-Frank Act, we provisionally registered as a swap dealer with the U.S. Commodity Futures Trading Commission (“CFTC”) and became subject to the CFTC’s extensive oversight. Regulation of swap dealers by the CFTC imposes numerous corporate governance, business conduct, capital, margin, reporting, clearing, execution and other regulatory requirements on us. It also requires us to comply with certain U.S. rules in some circumstances with respect to transactions conducted outside of the United States or with non-U.S. persons. Although the coverage of EMIR and CFTC regulations implementing the Dodd-Frank Act is in many ways similar, certain swaps may be subject to both regulatory regimes to a significant extent.
|
33
|
|
|
Deutsche Bank
|
Signatures
|
|
|
Annual Report 2021 on Form 20-F
|
Change in Internal Control over Financial Reporting
|
|
|
|
|
Additionally, under the Dodd-Frank Act, security-based swaps are subject to a standalone regulatory regime under the jurisdiction of the U.S. Securities and Exchange Commission (“SEC”). The SEC has implemented rules regarding registration, capital, risk-mitigation techniques, reporting, business conduct standards, trade acknowledgement and verification requirements, and cross-border requirements for security-based swap dealers that are generally similar to the CFTC’s rules for swap dealers. These rules generally came into effect in November 2021, the first compliance date for registration of security-based swap dealers. Pursuant to these rules, we are conditionally registered as a security-based swap dealer and are now subject to further regulation of our derivatives business.
Pursuant to these CFTC and SEC regulations, there may be instances where we can comply with European and/or German requirements in lieu of complying with the U.S. regulatory requirements. These requirements under the Dodd-Frank Act may adversely affect our derivatives business and make us less competitive, especially as compared to competitors not subject to such regulation.
In addition, the CRR/CRD IV legislative package provided for executive compensation reforms including caps on bonuses that may be awarded to “material risk takers” and other employees as defined therein and in the German Banking Act and other applicable rules and regulations such as the Remuneration Regulation for Institutions (
Institutsvergütungsverordnung
). Such restrictions on compensation, including the amendments introduced by the CRR II/CRD V/BRRD II reform package and any guidelines issued by the EBA to further implement them, could put us at a disadvantage to our competitors in attracting and retaining talented employees, especially compared to those outside the European Union that are not subject to these caps and other constraints.
Following the financial crisis, bank levies have been introduced in some countries including, among others, Germany and the United Kingdom. We paid € 553 million for bank levies in 2021, € 633 million in 2020 and € 622 million in 2019. Also, we are required to contribute substantially to the Single Resolution Fund under the SRM (which is intended to reach by the end of 2023 a target level of 1 % of insured deposits of all banks in member states participating in the SRM) and the statutory deposit guarantee and investor compensation schemes under the recast European Union directive on deposit guarantee schemes (“DGS Directive”) and the European Union directive on investor compensation schemes. The DGS Directive defines a 0.8 % target level of prefunding by July 3, 2024 (similar to resolution funds), which has significantly increased the costs of the statutory deposit protection scheme. We also participate in the voluntary deposit protection provided by the private banks in Germany through the Deposit Protection Fund (
Einlagensicherungsfonds
) which is funded through contributions by its members. While the total impact of future levies cannot currently be quantified, they may have a material adverse effect on our business, financial condition and results of operations in future periods. Failure of banks, resolution measures and a decline of the value of the assets held by the SRM by the relevant DGS can cause an increase of contributions in order to replenish the shortfall.
We are subject to the General Data Protection Regulation (“GDPR”) which has increased our regulatory obligations in connection with the processing of personal data, including requiring compliance with the GDPR’s data protection principles, the increased number of data subject rights and strict data breach notification requirements. The GDPR grants broad enforcement powers to supervisory authorities, including the potential to levy significant fines for non-compliance and provides for a private right of action for individuals who are affected by a violation of the GDPR. Compliance with the GDPR requires investment in appropriate technical and organizational measures and we may be required to devote significant resources to data protection on an ongoing basis. In the event that we are found to have not met the standards required by the GDPR we may incur damage to our reputation, the imposition by data protection supervisory authorities of significant fines or restrictions on our ability to process personal data, and we may be required to defend claims for compensation brought by affected individuals, all of which could have a material adverse effect on us.
On November 27, 2019, the European Parliament and the Council adopted the Investment Firm Regulation and the Investment Firm Directive, which introduced substantive regulatory changes (including to the calculation of capital requirements) in respect of investment firms, such as our subsidiary DWS. The Investment Firm Regulation and the Investment Firm Directive (as implemented into German law) are in full force since June 26, 2021.
A number of jurisdictions where the bank is active are starting to discuss rules related to Environmental, Social and Governance (ESG) aspects of our business and exposure. It is currently difficult to estimate how these rules could impact us.
|
34
|
|
|
Deutsche Bank
|
Signatures
|
|
|
Annual Report 2021 on Form 20-F
|
Change in Internal Control over Financial Reporting
|
|
|
|
|
Scrutiny of regulators and courts in respect of the protection of retail customers has increased in particular with respect to the enforceability and transparency of standard business terms and compensation for alleged damages.
In the recent past, regulators and courts have put further emphasis on the protection of retail customers. Examples of this are (i) the BaFin’s general order of June 21, 2021, pursuant to which credit institutions must inform customers of certain invalid interest rate adjustment clauses in their standard business terms; (ii) the German Federal Court of Justice’s (BGH) decision of April 27, 2021, according to which typical clauses in the standard business terms of banks providing for deemed consent to proposed amendments if the customer does not object within a certain period are unenforceable; and (iii) the FX mortgages loan cases in Poland, which constitute an industry-wide and highly disputed and litigated issue, where courts have found that certain mortgage loan agreements in foreign currencies include unfair conditions and are therefore unenforceable. Customer restitution practices in respect of such matters have varied significantly across the industry, and it our practices differ from accepted norms, we may be subject to civil or regulatory claims. These matters may result in the imposition of additional costs to us or require us to reimburse or pay damages to clients.
Risks Relating to Our Internal Control Environment
A robust and effective internal control environment and adequate infrastructure (comprising people, policies and procedures, controls testing and IT systems) are necessary to ensure that we conduct our business in compliance with the laws, regulations and associated supervisory expectations applicable to us. We have identified the need to strengthen our internal control environment and infrastructure and have embarked on initiatives to accomplish this. If these initiatives are not successful or proceed too slowly, our reputation, regulatory position and financial condition may be materially adversely affected, and our ability to achieve our strategic ambitions may be impaired.
Our businesses are highly dependent on our ability to maintain a robust and effective internal control environment. This is needed for the Bank to process and monitor, on a daily basis, a wide variety of transactions, many of which are highly complex and occur at high speeds, volumes and frequencies, and across numerous and diverse markets and currencies. Such a robust and effective control environment is in turn dependent on the sufficiency of our infrastructure to support that environment. This infrastructure consists broadly of internal policies and procedures, testing protocols, and the IT systems and employees needed to enforce and enable them. An effective control environment is dependent on infrastructure systems and procedures that cover the processing and settling of transactions; the valuation of assets; the identification, monitoring, aggregation, measurement and reporting of risks and positions against various metrics; the evaluation of counterparties and customers for legal, regulatory and compliance purposes; the escalation of reviews; and the taking of mitigating and remedial actions where necessary. They are also critical for regulatory reporting and other data processing and compliance activities.
Both our internal control environment and the infrastructure that underlies it fall short in a number of areas of our standards for completeness and comprehensiveness and are not well integrated across the Bank. Our IT infrastructure, in particular, is fragmented, with numerous distinct platforms, many of which need significant upgrades, in operation across the Bank. Our business processes and the related control systems often require manual procedures and actions that increase the risks of human error and other operational problems that can lead to delays in reporting information to management and to the need for more adjustments and revisions than would be the case with more seamlessly integrated and automated systems and processes. As a result, it is often difficult and labor-intensive for us to obtain or provide information of a consistently high quality and on a timely basis to comply with regulatory reporting and other compliance requirements or to meet regulatory expectations on a consistent basis and, in certain cases, to manage our risk comprehensively. Furthermore, it often takes intensive efforts to identify, when possible, inappropriate behavior by our staff and attempts by third parties to misuse our services as a conduit for prohibited activities, including those relating to anti-financial crime laws and regulation.
In addition, we may not always have the personnel with the appropriate experience, seniority and skill levels to compensate for shortcomings in our processes and infrastructure, or to identify, manage or control risks, and it often has been difficult to attract and retain the requisite talent. This has impacted our ability to remediate existing weaknesses and manage the risks inherent in our activity. Additionally, despite the lower overall rate of attrition we have experienced during the COVID-19 pandemic, attrition in positions key to improving our control environment remains a risk.
Against this backdrop, our regulators, our Management Board and our Group Audit function have increasingly and more intensively focused on our internal controls and infrastructure through numerous formal reviews and audits of our operations. These reviews and audits have identified various areas for improvement relating to a number of elements of our control environment and infrastructure. These include the infrastructure relating to transaction capturing and recognition, classification of assets, asset valuation frameworks, models, data and process consistency, information security, software license management, payment services, risk identification, measurement and management and other processes required by laws, regulations, and supervisory expectations.
|
35
|
|
|
Deutsche Bank
|
Signatures
|
|
|
Annual Report 2021 on Form 20-F
|
Change in Internal Control over Financial Reporting
|
|
|
|
|
They also include regulatory reporting, anti-money laundering (“AML”), transaction monitoring, “know your customer” (“KYC”), sanctions and embargoes, market conduct and other internal processes that are aimed at preventing use of our products and services for the purpose of committing or concealing financial crime.
Our principal regulators, including the BaFin, the ECB and the Federal Reserve Board, have also conducted numerous reviews focused on our internal controls and the related infrastructure. These regulators have required us formally to commit to remediate our AML and other weaknesses, including the fragmented and manual nature of our infrastructure. For example, on September 21, 2018, the BaFin issued an order requiring us to implement measures on specified timelines over the coming months and years to improve our control and compliance infrastructure relating to AML and, in particular, the KYC processes in certain of our businesses. Local regulators in other countries in which we do business also review the sufficiency of our control environment and infrastructure with respect to their jurisdictions. While the overall goals of the various prudential regulators having authority over us in the many places in which we do business are broadly consistent, and the general themes of our deficiencies in internal controls and the supporting infrastructure are similar, the regulatory frameworks applicable to us in the area of internal controls are generally applicable at a national or EU-wide level and are not always consistent across the jurisdictions in which we operate around the world. This adds complexity and cost to our efforts to reduce fragmentation and put in place automated systems that communicate seamlessly and quickly with one another.
In order to improve in the areas discussed above, we are undertaking several major initiatives to enhance the efficacy of the transaction processing environment, strengthen our controls and infrastructure, manage non-financial risks and enhance the skill set of our personnel. We believe that these initiatives will better enable us to avoid the circumstances that have resulted in many of the litigations and regulatory and enforcement investigations and proceedings to which we have been subject, and will improve our ability to comply with laws and regulations and meet supervisory expectations. In particular, we are making efforts to reduce the complexity of our business and to integrate and automate processes and business and second-line controls. We have also exited certain businesses and high-risk countries, selectively off-boarded a number of clients, worked to strengthen our compliance culture and control functions. However, we may be unable to complete these initiatives as quickly as we intend or as our regulators demand, and our efforts may be insufficient to remediate existing deficiencies and prevent future deficiencies or to result in fewer litigations or regulatory and enforcement investigations, proceedings and criticism in the future. We may also, when faced with the considerable expense of these initiatives, fail to provide sufficient resources for them quickly enough or at all or underestimate the extent of resource requirements. The slow pace of our remediation efforts and progress on achieving significant and durable improvements in the areas discussed above, may result in regulatory action of the type that has been taken against other financial institutions whose progress regulators have deemed insufficient or too slow. If we are unable to significantly improve our infrastructure and control environment in a timely manner, we may be subject to fines or penalties, as well as to regulatory intervention in aspects of our businesses. For example, we might feel pressure or be required by our regulators to reduce our exposure to or terminate certain kinds of products or businesses, counterparties or regions, which could, depending on the extent of such requirement, significantly challenge our ability to operate profitably under our current business model.
Regulators can also impose capital surcharges, requiring capital buffers in addition to those directly required under the regulatory capital rules applicable to us, to reflect the additional risks posed by deficiencies in our control environment. In extreme cases, regulators can suspend our permission to operate in the businesses and regions within their jurisdictions or require extensive and costly remedial actions. Furthermore, implementation of enhanced infrastructure and controls may result in higher-than-expected costs of regulatory compliance that could offset or exceed efficiency gains or significantly affect our profitability. Any of these factors could affect our ability to implement our strategy in a timely manner or at all.
The BaFin has ordered us to improve our control and compliance infrastructure relating to our anti-money laundering and know-your-client processes, and appointed a special representative to monitor these measures’ implementation. Our results of operations, financial condition and reputation could be materially and adversely affected if we are unable to significantly improve our infrastructure and control environment by the set deadline.
On September 21, 2018, the BaFin issued an order requiring us to take appropriate internal safeguards and comply with general due diligence obligations in order to prevent money laundering and terrorist financing. The BaFin has appointed a special representative to monitor the implementation of the ordered measures, assessing and reporting the progress to the BaFin. In February 2019, the BaFin extended the order and the mandate of the special representative to review its group-wide risk management processes in the area of correspondence banking and adjust them where necessary. The BaFin further expanded the order and the mandate on April 29, 2021, ordering Deutsche Bank to adopt further appropriate internal safeguards and comply with due diligence obligations, in particular with regard to regular reviews. This expansion also applies to correspondent relationships and transaction monitoring. Our AML and KYC processes, as well as our other internal processes that are aimed at preventing use of our products and services for the purpose of committing or concealing financial crime and our personnel responsible for our efforts in these areas, continue to be the subject of regulatory scrutiny in a number of jurisdictions, including in the U.S., and other regulators could take actions against us similar to those of the BaFin.
|
36
|
|
|
Deutsche Bank
|
Signatures
|
|
|
Annual Report 2021 on Form 20-F
|
Change in Internal Control over Financial Reporting
|
|
|
|
|
If we are unable to significantly improve our infrastructure and control environment by the set deadlines, our results of operations, financial condition and reputation could be materially and adversely affected. Regulators can impose fines or require us to reduce our exposure to or terminate certain kinds of products or businesses or relationships with counterparties or regions. We may also face additional legal proceedings, investigations or regulatory actions in the future, including in other jurisdictions with material impact on the bank´s business and profitability. These could, depending on the extent of any resulting requirements, significantly challenge our reputation and our ability to operate profitably under our current business model.
Risks Relating to Litigation, Regulatory Enforcement Matters and Investigations
We operate in a highly and increasingly regulated and litigious environment, potentially exposing us to liability and other costs, the amounts of which may be substantial and difficult to estimate, as well as to legal and regulatory sanctions and reputational harm.
The financial services industry is among the most highly regulated industries. Our operations throughout the world are regulated and supervised by the central banks and regulatory authorities in the jurisdictions in which we operate. In recent years, regulation and supervision in a number of areas has increased, and regulators, law enforcement authorities, governmental bodies and others have sought to subject financial services providers to increasing oversight and scrutiny, which in turn has led to additional regulatory investigations or enforcement actions which are often followed by civil litigation. There has been a steep escalation in the severity of the terms which regulatory and law enforcement authorities have required to settle legal and regulatory proceedings against financial institutions, with settlements in recent years including unprecedented monetary penalties as well as criminal sanctions. As a result, we may continue to be subject to increasing levels of liability and regulatory sanctions, and may be required to make greater expenditures and devote additional resources to addressing these liabilities and sanctions. Regulatory sanctions may include status changes to local licenses or orders to discontinue certain business practices.
We and our subsidiaries are involved in various litigation proceedings, including civil class action lawsuits, arbitration proceedings and other disputes with third parties, as well as regulatory proceedings and investigations by both civil and criminal authorities in jurisdictions around the world. We expect that the costs to us arising from the resolution of litigation, enforcement and similar matters pending against us to continue to be significant in the near to medium term and to adversely affect our business, financial condition and results of operations. Litigation and regulatory matters are subject to many uncertainties, and the outcome of individual matters is not predictable with assurance. We may settle litigation or regulatory proceedings prior to a final judgment or determination of liability. We may do so for a number of reasons, including to avoid the cost, management efforts or negative business, regulatory or reputational consequences of continuing to contest liability, even when we believe we have valid defenses to liability. We may also do so when the potential consequences of failing to prevail would be disproportionate to the costs of settlement. Furthermore, we may, for similar reasons, reimburse counterparties for their losses even in situations where we do not believe that we are legally compelled to do so. The financial impact of legal risks might be considerable but may be difficult or impossible to estimate and to quantify, so that amounts eventually paid may exceed the amount of provisions made or contingent liabilities assessed for such risks.
Actions currently pending against us or our current or former employees may not only result in judgments, settlements, fines or penalties, but may also cause substantial reputational harm to us. The risk of damage to our reputation arising from such proceedings is also difficult or impossible to quantify.
Regulators have increasingly sought admissions of wrongdoing in connection with settlement of matters brought by them. This could lead to increased exposure in subsequent civil litigation or in consequences under so-called "bad actor" laws, in which persons or entities determined to have committed offenses under some laws can be subject to limitations on business activities under other laws, as well as adverse reputational consequences. In addition, the U.S. Department of Justice (“DOJ”) conditions the granting of cooperation credit in civil and criminal investigations of corporate wrongdoing on the company involved having provided to investigators all relevant facts relating to the individuals responsible for the alleged misconduct. This policy may result in increased fines and penalties if the DOJ determines that we have not provided sufficient information about applicable individuals in connection with an investigation. Other governmental authorities could adopt similar policies.
|
37
|
|
|
Deutsche Bank
|
Signatures
|
|
|
Annual Report 2021 on Form 20-F
|
Change in Internal Control over Financial Reporting
|
|
|
|
|
In addition, the financial impact of legal risks arising out of matters similar to some of those we face have been very large for a number of participants in the financial services industry, with fines and settlement payments greatly exceeding what market participants may have expected and, as noted above, escalating steeply in recent years to unprecedented levels. The experience of others, including settlement terms, in similar cases is among the factors we take into consideration in determining the level of provisions we maintain in respect of these legal risks. Developments in cases involving other financial institutions in recent years have led to greater uncertainty as to the predictability of outcomes and could lead us to add to our provisions. Moreover, the costs of our investigations and defenses relating to these matters are themselves substantial. Further uncertainty may arise as a result of a lack of coordination among regulators from different jurisdictions or among regulators with varying competencies in a single jurisdiction, which may make it difficult for us to reach concurrent settlements with each regulator. Should we be subject to financial impacts arising out of litigation and regulatory matters to which we are subject in excess of those we have calculated in accordance with our expectations and the relevant accounting rules, our provisions in respect of such risks may prove to be materially insufficient to cover these impacts. This could have a material adverse effect on our results of operations, financial condition or reputation as well as on our ability to maintain capital, leverage and liquidity ratios at levels expected by market participants and our regulators. In such an event, we could find it necessary to reduce our risk-weighted assets (including on terms disadvantageous to us) or substantially cut costs to improve these ratios, in an amount corresponding to the adverse effects of the provisioning shortfall.
We have previously been the subject of industry-wide investigations by regulatory and law enforcement authorities relating to interbank and dealer offered rates, and are currently the subject of civil actions in this area. Due to a n
u
mber of uncertainties, including those related to the high profile of the matters and other banks’ settlement negotiations, the eventual outcome of these matters is unpredictable, and may materially and adversely affect our results of operations, financial condition and reputation.
We have responded to requests for information from, and cooperated with, various regulatory and law enforcement authorities in connection with industry-wide investigations concerning the setting of the London Interbank Offered Rate (LIBOR), Euro Interbank Offered Rate (EURIBOR), Tokyo Interbank Offered Rate (TIBOR) and other interbank and dealer offered rates.
As previously reported, we paid € 725 million to the European Commission pursuant to a settlement agreement dated December 4, 2013 in relation to anticompetitive conduct in the trading of interest rate derivatives. Also as previously reported, on April 23, 2015, we reached settlements with the DOJ, the CFTC, FCA, and the New York State Department of Financial Services (“DFS”) to resolve investigations into misconduct concerning the setting of LIBOR, EURIBOR, and TIBOR. Under the terms of these agreements, we paid penalties of U.S.$ 2.175 billion to the DOJ, CFTC and DFS and GBP 226.8 million to the FCA. As part of the resolution with the DOJ, DB Group Services (UK) Limited (an indirectly held, wholly owned subsidiary of ours) pled guilty to one count of wire fraud in the U.S. District Court for the District of Connecticut and we entered into a Deferred Prosecution Agreement with a three-year term, which expired in 2018. On October 25, 2017, we entered into a settlement with a working group of U.S. state attorneys general resolving their interbank offered rate investigation. Among other conditions, we made a settlement payment of U.S.$ 220 million. The factual admissions we have made in connection with these settlements could make it difficult for us to defend against pending and future claims.
In addition, we are party to 27 U.S. civil actions concerning alleged manipulation relating to the setting of various interbank and/or dealer offered rates, as well as actions pending in each of the UK, Argentina and Spain. Most of the civil actions, including putative class actions, are pending in the U.S. District Court for the Southern District of New York (SDNY), against us and numerous other defendants. All but three of the U.S. civil actions were filed on behalf of parties who allege losses as a result of manipulation relating to the setting of U.S. dollar LIBOR. The three U.S. civil actions pending against us that do not relate to U.S. dollar LIBOR were also filed in the SDNY, and include one consolidated action concerning Pound Sterling (GBP) LIBOR, one action concerning Swiss franc (CHF) LIBOR, and one action concerning two Singapore Dollar (SGD) benchmark rates, the Singapore Interbank Offered Rate (SIBOR) and the Swap Offer Rate (SOR).
We cannot predict the effect on us of the interbank and dealer offered rates matters, which could include damages from private litigation for which we may be liable.
We are currently involved in civil proceedings in connection with our voluntary takeover offer for the acquisition of all shares of Postbank. The extent of our financial exposure to this matter could be material, and our reputation may be harmed.
On September 12, 2010, we announced a voluntary takeover offer for the acquisition of all shares in Deutsche Postbank AG (Postbank). On October 7, 2010, we published our official takeover offer and offered Postbank shareholders a consideration of € 25 for each Postbank share. This offer was accepted for a total of approximately 48.2 million Postbank shares.
In November 2010, a former shareholder of Postbank, Effecten-Spiegel AG, which had accepted the takeover offer, brought a claim against us alleging that the offer price was too low and was not determined in accordance with the applicable German law. The plaintiff alleges that we had been obliged to make a mandatory takeover offer for all shares in Postbank, at the latest, in 2009, as the voting rights of Deutsche Post AG in Postbank had to be attributed to us pursuant to Section 30 of the German Takeover Act. Based thereon, the plaintiff alleges that the consideration offered by us in the 2010 voluntary takeover offer needed to be raised to € 57.25 per share.
The Regional Court
(Landgericht)
Cologne dismissed the claim in 2011 and the Higher Regional Court (
Oberlandesgericht
) Cologne dismissed the appeal in 2012. The German Federal Court (
Bundesgerichtshof
) set this judgment aside and referred the case back to the Higher Regional Court Cologne to take evidence on certain allegations of the plaintiff.
|
38
|
|
|
Deutsche Bank
|
Signatures
|
|
|
Annual Report 2021 on Form 20-F
|
Change in Internal Control over Financial Reporting
|
|
|
|
|
Starting in 2014, additional former shareholders of Postbank, who accepted the 2010 tender offer, brought similar claims as Effecten-Spiegel AG. On October 20, 2017, the Regional Court Cologne handed down a decision granting the claims in a total of 14 cases which were combined in one proceeding. The Regional Court Cologne took the view that we were obliged to make a mandatory takeover offer already in 2008 so that the appropriate consideration to be offered in the takeover offer should have been € 57.25 per Postbank share (instead of € 25). The additional consideration per share owed to shareholders which have accepted the takeover offer would thus amount to € 32.25. We appealed this decision and the appeal was assigned to the 13
th
Senate of the Higher Regional Court of Cologne, which also heard the appeal of Effecten-Spiegel AG.
On December 16, 2020, the Higher Regional Court Cologne handed down a decision and fully dismissed the claims of Effecten-Spiegel AG. Further, in a second decision handed down on December 16, 2020, the Higher Regional Court Cologne allowed the appeal of Deutsche Bank against the decision of the Regional Court Cologne dated October 20, 2017 and dismissed all related claims of the relevant plaintiffs. The Higher Regional Court Cologne has granted leave to appeal to the German Federal Court (
Bundesgerichtshof
) as regards both and all relevant plaintiffs have lodged their respective appeals with the Federal Court end of January and beginning of February 2021, respectively. On October 15, 2021, the plaintiffs filed their reasonings of the appeal with the German Federal Court.
We have been served with a large number of additional lawsuits filed against us shortly before the end of 2017, almost all of which are now pending with the Regional Court Cologne. Some of the new plaintiffs allege that the consideration offered by us for the shares in Postbank in the 2010 voluntary takeover should be raised to € 64.25 per share.
The claims for payment against us in relation to these matters total almost € 700 million (excluding interest).
In September 2015, former shareholders of Postbank filed in the Regional Court Cologne shareholder actions against Postbank to set aside the squeeze-out resolution taken in the shareholders meeting of Postbank in August 2015. Among other things, the plaintiffs alleged that we were subject to a suspension of voting rights with respect to our shares in Postbank based on the allegation that we failed to make a mandatory takeover offer. The squeeze out is final and the proceeding itself has no reversal effect, but may result in damage payments. The claimants refer to legal arguments similar to those asserted in the Effecten-Spiegel proceeding described above. In a decision on October 20, 2017, the Regional Court Cologne declared the squeeze-out resolution to be void. The court, however, did not rely on a suspension of voting rights due to an alleged failure by us to make a mandatory takeover offer, but argued that Postbank violated information rights of Postbank shareholders in Postbank's shareholders meeting in August 2015. Postbank appealed this decision. On May 15, 2020 DB Privat- und Firmenkundenbank AG (legal successor of Postbank due to a merger in 2018) was merged into Deutsche Bank AG. On July 3, 2020 Deutsche Bank AG withdrew the appeal as regards the actions for voidance because efforts and costs to pursue this appeal became disproportionate to the minor remaining economic importance of the case considering that the 2015 squeeze-out cannot be reversed. As a consequence, the first instance judgement which found that Postbank violated the information rights of its shareholders in the shareholders’ meeting has become final.
The legal question of whether we had been obliged to make a mandatory takeover offer for all Postbank shares prior to our 2010 voluntary takeover may also impact two pending appraisal proceedings (
Spruchverfahren
). These proceedings were initiated by former Postbank shareholders with the aim to increase the cash compensation offered in connection with the squeeze-out of Postbank shareholders in 2015 and the cash compensation offered and annual compensation paid in connection with the execution of a domination and profit and loss transfer agreement (
Beherrschungs- und Gewinnabführungsvertrag
) between DB Finanz-Holding AG (now DB Beteiligungs-Holding GmbH) and Postbank in 2012.
The applicants in the appraisal proceedings claim that a potential obligation of ours to make a mandatory takeover offer for Postbank at an offer price of € 57.25 should be decisive when determining the adequate cash compensation in the appraisal proceedings. The Regional Court Cologne had originally followed this legal opinion of the applicants in two resolutions. In a decision dated June 2019, the Regional Court of Cologne expressly deviated from this legal resolution in the appraisal proceedings in connection with execution of a domination and profit and loss transfer agreement. According to this decision, the question whether we were obliged to make a mandatory offer for all Postbank shares prior to our voluntary takeover offer in 2010 shall not be relevant for determining the appropriate cash compensation. It is likely that the Regional Court Cologne will take the same legal position in the appraisal proceedings in connection with the squeeze-out. On October 1, 2020 the Regional Court Cologne handed down a decision in the appraisal proceeding concerning the domination and profit and loss transfer agreement (dated December 5, 2012) according to which the annual compensation pursuant to Section 304 of the German Stock Corporation Act (
jährliche Ausgleichszahlung
) shall be increased by € 0.12 to € 1.78 per Postbank share and the settlement amount pursuant to Section 305 of the German Stock Corporation Act (
Abfindungsbetrag
) shall be increased by € 4.56 to € 29.74 per Postbank share. The increase of the settlement amount is of relevance for approximately 492.000 former Postbank shares whereas the increase of the annual compensation is of relevance for approximately 7 million former Postbank shares. Deutsche Bank as well as the applicants have lodged an appeal against this decision.
The extent of our financial exposure to these matters could be material, and our reputation may be harmed.
|
39
|
|
|
Deutsche Bank
|
Signatures
|
|
|
Annual Report 2021 on Form 20-F
|
Change in Internal Control over Financial Reporting
|
|
|
|
|
We have investigated the circumstances around equity trades entered into by certain clients in Moscow and London and have advised regulatory and law enforcement authorit
i
es in several jurisdictions about those trades. In the event that violations of law or regulation are found to have occurred, any resulting penalties against us may materially and adversely affect our results of operations, financial condition and reputation.
We have investigated the circumstances around equity trades entered into by certain clients with us in Moscow and London. The total volume of transactions reviewed is significant. Our internal investigation of potential violations of law, regulation and policy and into the related internal control environment has concluded, and we have assessed the findings identified during the investigation; to date we have identified certain violations of our policies and deficiencies in our control environment. We have advised regulatory and law enforcement authorities in several jurisdictions (including Germany, Russia, the UK and the United States) of this investigation and have taken disciplinary measures with regard to certain individuals in this matter.
On January 30 and 31, 2017, the DFS and FCA announced settlements with the Bank related to their investigations into this matter. The settlements conclude the DFS and the FCA’s investigations into the Bank’s AML control function in its investment banking division, including in relation to the equity trading described above. Under the terms of the settlement agreement with the DFS, Deutsche Bank entered into a consent order, and agreed to pay civil monetary penalties of U.S.$ 425 million and to engage an independent monitor for a term of up to two years. Under the terms of the settlement agreement with the FCA, we agreed to pay civil monetary penalties of approximately GBP 163 million. On May 30, 2017, the Federal Reserve announced its settlement with us resolving this matter as well as additional AML issues identified by the Federal Reserve. We paid a penalty of U.S.$ 41 million. We also agreed to retain independent third parties to assess our Bank Secrecy Act/AML program and review certain foreign correspondent banking activity of DBTCA. We were also required to submit written remediation plans and programs.
We continue to cooperate with regulators and law enforcement authorities, including the DOJ which has its own ongoing investigation into these securities trades. In the event that violations of law or regulation are found to have occurred, legal and regulatory sanctions in respect thereof may materially and adversely affect our results of operations, financial condition and reputation.
We are currently the subject of industry-wide inquiries and investigations by regulatory and law enforcement authorities relating to transactions of clients in German shares around the dividend record dates for the purpose of obtaining German tax credits or refunds in relation to withholding tax levied on dividend payments (so-called cum-ex transactions). In addition, we are exposed to potential tax liabilities and to the assertion of potential civil law claims by third parties, e.g. former counterparties, custodian banks, investors and other market participants, including as a consequence of criminal judgements in criminal proceedings in which we are not directly involved. The eventual outcome of these matters is unpredictable, and may materially and adversely affect our results of operations, financial condition and reputation.
The Public Prosecutor in Cologne (
Staatsanwaltschaft Köln
, "CPP") has been conducting a criminal investigation since August 2017 concerning two former employees of Deutsche Bank in relation to cum-ex transactions of certain former clients of the Bank. At the end of May and beginning of June 2019, the CPP broadened the investigation proceedings against further current and former employees and former Management Board members of the Bank. In July 2020, in the course of inspecting the CPP’s investigation file, Deutsche Bank learned that the CPP had further extended its investigation in June 2019 to include further current and former Deutsche Bank personnel, including one former Management Board member and one current Management Board member. It is difficult to predict how the proceeding will further develop. Deutsche Bank is a potential secondary participant (
Nebenbeteiligte
) in these proceedings and the proceedings could result in a disgorgement of profits and fines.
In May 2021, Deutsche Bank learned through an information request received by Deutsche Oppenheim Family Office AG (“DOAG”) as legal successor of Sal. Oppenheim jr. Cie. AG Co. KGaA (“Sal. Oppenheim”) that the CPP in 2021 opened a criminal investigation proceeding in relation to cum-ex transactions against unknown former personnel of Sal. Oppenheim. DOAG provided the requested information on September 13 and October 15, 2021.
There is a risk that the proceedings lead to a formal indictment and criminal prosecution of accused individuals. Also, Deutsche Bank and or DOAG could be included in criminal court proceedings as a secondary participant or a party subject to criminal confiscation (
Einziehungsbeteiligte
). Increased media attention surrounding the cum-ex topic as well as any future criminal judgement that is unfavorable to the Bank can create reputational risks. The imposition of fines and the disgorgement of profits or criminal confiscations could have a material adverse effect on our financial condition or results of operations.
We are further exposed to the assertion of potential tax and civil law recourse and compensation claims by German tax authorities and third parties.
|
40
|
|
|
Deutsche Bank
|
Signatures
|
|
|
Annual Report 2021 on Form 20-F
|
Change in Internal Control over Financial Reporting
|
|
|
|
|
Deutsche Bank acted as participant in and filed withholding tax refund claims through the electronic refund procedure (
elektronisches Datenträgerverfahren
) on behalf of, inter alia, two former custody clients in connection with their cum-ex transactions. In February 2018, Deutsche Bank received from the German Federal Tax Office (
Bundeszentralamt für Steuern
, "FTO") a demand of approximately € 49 million for tax refunds paid to a former custody client. On December 20, 2019, Deutsche Bank received a liability notice from the FTO requesting payment of € 2.1 million by January 29, 2020 in connection with tax refund claims Deutsche Bank had submitted on behalf of another former custody client. In 2020, Deutsche Bank made the requested payment and filed an objection against the liability notice. On December 3, 2020, Deutsche Bank received another hearing letter from the FTO in relation to the € 2.1 million liability notice to which Deutsche Bank responded on April 16, 2021. On July 28, 2021, Deutsche Bank received a letter from the FTO stating that the revised tax assessment notice dated December 2019 was not a valid administrative act as it could not be served to Deutsche Bank’s client due to its liquidation already in 2016. On the same day, FTO issued another liability notice to Deutsche Bank arguing that it issued incorrect tax certificates. The € 2.1 million payment made by Deutsche Bank under the first liability notice was offset by FTO in the second liability notice. Thus, no further payments were made by Deutsche Bank. Deutsche Bank objected to the second liability notice on August 31, 2021 and filed the reasoning on October 14, 2021. On November 9, 2021, it submitted a further brief in this matter. In the event that the FTO issues the liability notice announced in February 2018 or further liability notices and to the extent Deutsche Bank is eventually liable under the liability notices, this would expose the Bank to potential financial losses and could have a material adverse effect on our results of operations.
As regards civil law claims, The Bank of New York Mellon SA/NV ("BNY") – as a parent of two companies acting as depot bank and fund administrator which Deutsche Bank acquired in 2010 and sold to BNY later in 2010 – has informed Deutsche Bank of its intention to assert indemnification claims under a contractual tax indemnity provision for potential cum-ex related tax liabilities incurred by these companies. BNY estimates the potential tax liability to amount to up to € 120 million. In November and December 2020, counsel to BNY informed Deutsche Bank that certain BNY entities (among others) have received notices from tax authorities regarding the estimated amount with respect to cum-ex related trades by certain investment funds in 2009 and 2010. BNY has filed objections against the notices.
On February 6, 2019, the Regional Court (
Landgericht
) Frankfurt am Main served Deutsche Bank with a claim by M.M.Warburg CO Gruppe GmbH and M.M.Warburg CO (AG Co.) KGaA (together “Warburg”) in connection with cum-ex transactions of Warburg with a custody client of Deutsche Bank during 2007 to 2011. Warburg claimed from Deutsche Bank indemnification against German taxes in relation to transactions conducted in the years 2007 to 2011. Further, Warburg claimed compensation of unspecified damages relating to these transactions. Based on the tax assessment notices received for 2007 to 2011, Warburg claimed a total of € 250 million (of which € 166 million is in relation to taxes and € 84 million is in relation to interest). On March 20, 2020, Warburg extended its claim against Deutsche Bank to indemnify Warburg in relation to the € 176 million (thereof € 166 million in relation to taxes and € 10 million in relation to interest) criminal confiscation order issued by the Regional Court Bonn in the criminal cum-ex trial on March 18, 2020 regarding the same transactions. On July 28, 2021 the German Federal Court of Justice (BGH) confirmed the criminal confiscation. On September 23, 2020 the Frankfurt Regional Court fully dismissed Warburg’s claim against Deutsche Bank on the grounds that Warburg as the tax debtor (
Steuerschuldner
) is primarily liable and cannot request payment from Deutsche Bank. The court further held that any claims are time-barred. On October 29, 2020, Warburg appealed the decision with the Higher Regional Court (
Oberlandesgericht
) Frankfurt am Main. Following appellate briefs by Warburg and Deutsche Bank the hearing of the appeal proceeding took place on November 3, 2021. On December 1, 2021, Warburg reduced its claim from the first instance proceeding. Warburg now claims € 86 million (thereof € 63 million in relation to taxes and € 23 million in relation to interest). Further, Warburg claims an amount of € 54 million in relation to the criminal confiscation. A further hearing took place on January 26, 2022. In a judgment dated March 2, 2022, the Higher Regional Court (
Oberlandesgericht
) Frankfurt am Main fully dismissed Warburg’s appeal. The court did not admit an appeal of its decision to the German Federal Court of Justice (BGH). Warburg may file an appeal against this non-admission (
Nichtzulassungsbeschwerde
).
On January 25, 2021, the Regional Court (
Landgericht
) Hamburg served Deutsche Bank with a claim by Warburg Invest Kapitalanlagegesellschaft mbH (“Warburg Invest”) in relation to transactions of two investment funds in 2009 and 2010, respectively. Warburg Invest was fund manager for both funds. Warburg Invest claims, from Deutsche Bank together with several other parties as joint and several debtors (
Gesamtschuldner
), indemnification against German taxes in relation to cum-ex transactions conducted by the two funds. Further, Warburg Invest claims compensation of unspecified damages relating to these transactions. In November 2020, Warburg Invest received a tax liability notice from tax authorities for one of the funds in the amount of € 61 million. Based on publicly available information Deutsche Bank estimates the tax amount for the second fund to be approximately € 49 million. Warburg Invest filed its claim against several parties including Deutsche Bank
inter alia
based on an allegation of intentional damage contrary to public policy (Section 826 German Civil Code) and the accusation that Deutsche Bank participated in a business model that was contrary to public policy (
sittenwidriges Geschäftsmodell
). On July 5, 2021, Deutsche Bank submitted its defense statement to the court. On December 31, 2021, two other defendants of the proceeding served a notice of dispute (
Streitverkündung
) to several parties including Deutsche Bank.
|
41
|
|
|
Deutsche Bank
|
Signatures
|
|
|
Annual Report 2021 on Form 20-F
|
Change in Internal Control over Financial Reporting
|
|
|
|
|
On February 26, 2021, the Regional Court (
Landgericht
) Frankfurt am Main served Deutsche Bank with a claim by Seriva Vermögensverwaltungs GmbH (“Seriva”). Seriva is requesting that Deutsche Bank reissue certain tax certificates (
Steuerbescheinigungen
) that Deutsche Bank withdrew in April 2017 in light of Seriva’s cum-ex transactions. Deutsche Bank responded to Seriva’s statement of claim on April 6, 2021. On July 5, 2021, Deutsche Bank received a reply brief from Seriva. Deutsche Bank responded on August 17, 2021. The hearing took place on February 7, 2022. In a judgment dated February 28, 2022, the court dismissed Seriva’s claim. Seriva may appeal the decision.
The risks arising from the cum-ex topic are difficult to quantify and the likelihood of these risks materializing is hard to predict. In the event that Deutsche Bank is eventually liable under the civil law claims already asserted or under claims that will potentially be asserted by third parties in the future, this may materially and adversely affect our financial condition or results of operations.
We have entered into a deferred prosecution agreement (DPA) with the DOJ concerning our historical engagements of finders and consultants and precious metals spoofing. If we violate the DPA, its term could be extended, or we could be subject to criminal prosecution or other actions, any of which could result in additional fines, penalties, settlements, payments or other materially adverse impacts to us.
On January 8, 2021, we entered into a deferred prosecution agreement (DPA) with the DOJ concerning our historical engagements of finders and consultants and, as part of our obligations in the DPA, agreed to pay approximately U.S.$ 80 million in connection with this conduct. The DPA with the DOJ also involved a resolution involving precious metals spoofing. As part of our obligations in the DPA relating to precious metals, we agreed to pay approximately U.S.$ 8 million, of which approximately U.S.$ 6 million would be credited by virtue of our 2018 resolution with the CFTC. On the same day, we also reached a settlement with the SEC to resolve its investigation into conduct regarding our compliance with the U.S. Foreign Corrupt Practices Act with respect to our engagement of finders and consultants. We agreed to pay approximately U.S.$ 43 million in this SEC settlement. If we violate the DPA, its term could be extended, or we could be subject to criminal prosecution or other actions, any of which could result in additional fines, penalties, settlements, payments or other materially adverse impacts to us. On February 28, 2022, following a finding by the DOJ that the Bank violated the 2021 DPA based on untimely reporting by the Bank of certain allegations relating to ESG-related information at the Bank’s subsidiary DWS, the Bank agreed with the DOJ to extend an existing monitorship and abide by the terms of a prior deferred prosecution agreement until February 2023 to allow the monitor to certify to the Bank’s implementation of the related internal controls. The DOJ has reserved all rights to take further action regarding the 2021 DPA if it deems necessary.
We are under continuous examination by tax authorities in the jurisdictions in which we operate. Tax laws are increasingly complex and are evolving. The cost to us arising from the resolution of routine tax examinations, tax litigation and other forms of tax proceedings or tax disputes may increase and may adversely affect our business, financial condition and results of operation.
We are under continuous examination by tax authorities in the jurisdictions in which we operate. Tax laws are increasingly complex. In the current political and regulatory environment, tax administrations' and courts' interpretation of tax laws and regulations and their application are evolving, and scrutiny by tax authorities has become increasingly intense. Wide ranging and continuous changes in the principles of international taxation emanating from the OECD's Base Erosion and Profit Shifting agenda are generating significant uncertainties for us and our subsidiaries and may result in an increase in instances of tax disputes or instances of double taxation going forward, as member states may take different approaches in transposing these requirements into national law or may choose to implement unilateral measures. Examples are the EU directive requiring disclosure of arrangements with specific tax features that took effect in 2020, or the recent draft EU directive to implement the OECD global minimum taxation rules (Pillar 2) that could take effect as early as 2023. Tax administrations have also been focusing on the eligibility of taxpayers for reduced withholding taxes on dividends in connection with certain cross-border lending or derivative transactions with the German Federal Ministry of Finance having issued additional administrative guidance in this area during 2021. In addition, while a significant amount of guidance has been issued since the enactment of the U.S. tax reform at the end of 2017 which included the Base Erosion Anti-Abuse Tax provisions, uncertainties remain and further interpretative guidance may be necessary over the coming years. As a result, the cost to us arising from the resolution of routine tax examinations, tax litigation and other forms of tax proceedings or tax disputes, as well as from rapidly changing and increasingly complex and uncertain tax laws and principles, may increase and may adversely affect our business, financial condition and results of operation.
|
42
|
|
|
Deutsche Bank
|
Signatures
|
|
|
Annual Report 2021 on Form 20-F
|
Change in Internal Control over Financial Reporting
|
|
|
|
|
U.S. Congressional committees and other U.S. governmental entities have sought and may seek information from us concerning, among other topics, potential dealings between us and certain former members of the U.S. executive branch, including former President Trump, his family and other close associates, exposing us in particular to risk to our reputation and potential loss of business as a result of extensive media attention.
A number of media entities have reported that U.S. Congressional committees and other U.S. governmental entities are seeking or may seek information from us concerning, among other topics, potential dealings between the Bank and certain former members of the executive branch of the U.S. government, including former President Trump, his family, and other close associates. Attention surrounding such actual or potential requests and inquiries and our responses can create reputational and other risks that could have a material adverse effect on us. Our policy is to cooperate with all authorized government inquiries.
We have received requests for information from regulatory and law enforcement authorities concerning certain former correspondent banking relationships, including Danske Bank, exposing us in particular to risk to our reputation and potential loss of business as a result of extensive media attention. In the event that violations of law or regulation are found to have occurred, legal and regulatory sanctions in respect thereof may materially and adversely affect our results of operations, financial condition and reputation.
We have received requests for information from regulatory and law enforcement authorities concerning certain former correspondent banking relationships, including Danske Bank. We are providing information to and otherwise cooperating with the investigating authorities. We have also completed an internal investigation focused on the Bank’s historical processing of correspondent banking transactions on behalf of customers of Danske Bank’s Estonia branch prior to cessation of the correspondent banking relationship with that branch in 2015, including of whether any violations of law, regulation or Bank policy occurred, and the effectiveness of the related internal control environment.
Additionally, on September 24 and 25, 2019, based on a search warrant issued by the Local Court (
Amtsgericht
) in Frankfurt, the Frankfurt Public Prosecutor’s (“FPP’s”) office conducted investigations into Deutsche Bank in connection with suspicious activity reports relating to potential money laundering at Danske Bank. On October 13, 2020, the FPP closed its criminal investigation because the FPP did not find sufficient evidence to substantiate the money laundering suspicion. However, the Bank agreed to pay an administrative fine of € 13.5 million to the FPP for failing to submit suspicious activity reports (SARs) in Germany in a timely fashion, which it paid in the fourth quarter of 2020.
On July 7, 2020, the DFS issued a Consent Order, finding that Deutsche Bank violated New York State banking laws in connection with its relationships with three former Deutsche Bank clients, Danske Bank’s Estonia branch, Jeffrey Epstein and FBME Bank, and imposing a US$ 150 million civil penalty in connection with these three former relationships, which Deutsche Bank paid in the third quarter of 2020.
On July 15, 2020, Deutsche Bank was named as a defendant in a securities class action filed in the U.S. District Court for the District of New Jersey, alleging that the Bank made material misrepresentations regarding the effectiveness of its AML controls and related remediation. The complaint cites allegations regarding control deficiencies raised in the DFS Consent Order related to the Bank’s relationships with Danske Bank’s Estonia branch, Jeffrey Epstein and FBME Bank. On September 30, 2020, the plaintiff filed an amended complaint that included additional allegations regarding the effectiveness of the Bank’s AML controls. On December 28, 2020, the court appointed lead plaintiff and lead counsel. The lead plaintiff filed a second amended complaint on March 1, 2021. On April 23, 2021, the Bank filed a motion to transfer the action, or in the alternative, to dismiss the second amended complaint. Briefing on these motions concluded on July 1, 2021.
Media and market attention surrounding these matters can create reputational risks in particular, even if our investigations and those of our regulators and the authorities do not result in evidence of wrongdoing. We could in particular suffer diminished volumes of business as a result, which could have a material adverse effect on our financial condition and results of operations.
We have received requests for information from regulatory and law enforcement authorities concerning our anti-financial crime controls, including in the United States. In the event that violations of law or regulation are found to have occurred, legal and regulatory sanctions in respect thereof may materially and adversely affect our results of operations, financial condition and reputation.
We have received requests for information from regulatory and law enforcement authorities concerning our anti-financial crime controls over the past several years, both generally and in connection with specific clients, counterparties or incidents, including in the United States. Among the areas within the scope of these inquiries are client onboarding and KYC processes, transaction monitoring systems and procedures, processes concerning the decision to file or not to file a suspicious activity report, escalation procedures, and other related processes and procedures. The Bank is cooperating in these investigations. In the event that violations of law or regulation are found to have occurred, legal and regulatory sanctions in respect thereof may materially and adversely affect our results of operations, financial condition and reputation.
|
43
|
|
|
Deutsche Bank
|
Signatures
|
|
|
Annual Report 2021 on Form 20-F
|
Change in Internal Control over Financial Reporting
|
|
|
|
|
Guilty pleas by or convictions of us or our affiliates in criminal proceedings, or regulatory or enforcement orders, settlements or agreements to which we or our affiliates become subject, may have consequences that have adverse effects on certain of our businesses.
We and our affiliates have been and are subjects of criminal and regulatory enforcement proceedings. In particular, as part of the resolution of the investigation of the DOJ into misconduct relating to London interbank offered rates, our subsidiary DB Group Services (UK) Limited entered into a plea agreement with the DOJ in 2015, pursuant to which the company pled guilty to one count of wire fraud, and, subsequently, a judgment of conviction was issued against the company. Also, in connection with the KOSPI Index unwind matters, our subsidiary Deutsche Securities Korea Co. was convicted of vicarious corporate criminal liability in respect of spot/futures linked market manipulation by one of its employees; though the criminal trial verdict has been overturned on appeal, the Korean prosecutor’s office has appealed the decision. We and our subsidiaries are also the subjects of other criminal or regulatory enforcement proceedings or investigations.
Guilty pleas or convictions against us or our affiliates, or regulatory or enforcement orders, settlements or agreements to which we or our affiliates become subject, could lead to our ineligibility to conduct certain business activities. In particular, such guilty pleas or convictions could cause our asset management affiliates to no longer qualify as “qualified professional asset managers” (“QPAMs”) under the QPAM Prohibited Transaction Exemption under ERISA, which exemption is relied on to provide asset management services to certain pension plans in connection with certain asset management strategies. While there are a number of statutory exemptions and numerous other administrative exemptions that our asset management affiliates may use to trade on behalf of ERISA plans, and in many instances they may do so in lieu of relying on the QPAM exemption, loss of QPAM status could cause customers who rely on such status (whether because they are legally required to do so or because we have agreed contractually with them to maintain such status) to cease to do business or refrain from doing business with us and could negatively impact our reputation more generally. For example, clients may mistakenly see the loss as a signal that our asset management affiliates are somehow no longer approved as asset managers generally by the U.S. Department of Labor (“DOL”), the agency responsible for ERISA, and cease to do business or refrain from doing business with us for that reason. This could have a material adverse effect on our results of operations, particularly those of our asset management business in the United States. On December 29, 2017, the DOL published a three-year individual exemption permitting certain of our affiliates to retain their QPAM status despite both the conviction of DB Group Services (UK) Limited and the conviction of Deutsche Securities Korea Co. (the latter conviction has been subsequently overturned and is now the subject of an appeal). This exemption was subsequently extended by the DOL for an additional three-year period and is scheduled to expire on April 17, 2024, but may terminate earlier if, among other things, we or our affiliates are convicted of crimes in other matters. The disqualification period arising from these convictions extends until April 17, 2027, so we will need to obtain a further exemption by April 18, 2024 to avoid a loss of QPAM status at that time.
Other Risks
In addition to our traditional banking businesses of deposit-taking and lending, we also engage in nontraditional credit businesses in which credit is extended in transactions that include, for example, our holding of securities of third parties or our engaging in complex derivative transactions. These nontraditional credit businesses materially increase our exposure to credit risk.
As a bank and provider of financial services, we are exposed to the risk that third parties who owe us money, securities or other assets will not perform their obligations. Many of the businesses we engage in beyond the traditional banking businesses of deposit-taking and lending also expose us to credit risk.
In particular, much of the business we conduct through our Investment Bank corporate division entails credit transactions, frequently ancillary to other transactions. Nontraditional sources of credit risk can arise, for example, from holding securities of third parties; entering into swap or other derivative contracts under which counterparties have obligations to make payments to us; executing securities, futures, currency or commodity trades that fail to settle at the required time due to nondelivery by the counterparty or systems failure by clearing agents, exchanges, clearing houses or other financial intermediaries; and extending credit through other arrangements. Parties to these transactions, such as trading counterparties, may default on their obligations to us due to bankruptcy, political and economic events, lack of liquidity, operational failure or other reasons.
|
44
|
|
|
Deutsche Bank
|
Signatures
|
|
|
Annual Report 2021 on Form 20-F
|
Change in Internal Control over Financial Reporting
|
|
|
|
|
Many of our derivative transactions are individually negotiated and non-standardized, which can make exiting, transferring or settling the position difficult. Certain credit derivatives require that we deliver to the counterparty the underlying security, loan or other obligation in order to receive payment. In a number of cases, we do not hold, and may not be able to obtain, the underlying security, loan or other obligation. This could cause us to forfeit the payments otherwise due to us or result in settlement delays, which could damage our reputation and ability to transact future business, as well as impose increased costs on us. Legislation in the European Union (EMIR) and the United States (the Dodd-Frank Act) has introduced requirements for the standardization, margining, central clearing and transaction reporting of certain over-the-counter derivatives. While such requirements are aimed at reducing the risk posed to counterparties and the financial system by such derivatives, they may reduce the volume and profitability of the transactions in which we engage, and compliance with such provisions may impose substantial costs on us.
The exceptionally difficult market conditions experienced during the global financial crisis severely adversely affected certain areas in which we do business that entail nontraditional credit risks, including the leveraged finance and structured credit markets, and similar market conditions, should they occur, may do so in the future.
A substantial proportion of our assets and liabilities comprise financial instruments that we carry at fair value, with changes in fair value recognized in our income statement. As a result of such changes, we have incurred losses in the past, and may incur further losses in the future.
A substantial proportion of the assets and liabilities on our balance sheet comprise financial instruments that we carry at fair value, with changes in fair value recognized in the income statement. Fair value is defined as the price at which an asset or liability could be exchanged in an arm’s length transaction between knowledgeable, willing parties, other than in a forced or liquidation sale. If the value of an asset carried at fair value declines (or the value of a liability carried at fair value increases) a corresponding unfavorable change in fair value is recognized in the income statement. These changes have been and could in the future be significant.
Observable prices or inputs are not available for certain classes of financial instruments. Fair value is determined in these cases using valuation techniques we believe to be appropriate for the particular instrument. The application of valuation techniques to determine fair value involves estimation and management judgment, the extent of which will vary with the degree of complexity of the instrument and liquidity in the market. Management judgment is required in the selection and application of the appropriate parameters, assumptions and modeling techniques. If any of the assumptions change due to negative market conditions or for other reasons, subsequent valuations may result in significant changes in the fair values of our financial instruments, requiring us to record losses.
Our exposure and related changes in fair value are reported net of any fair value gains we may record in connection with hedging transactions related to the underlying assets. However, we may never realize these gains, and the fair value of the hedges may change in future periods for a number of reasons, including as a result of deterioration in the credit of our hedging counterparties. Such declines may be independent of the fair values of the underlying hedged assets or liabilities and may result in future losses.
Pursuant to accounting rules, we must periodically test the value of the goodwill of our businesses and the value of our other intangible assets for impairment. In the event such test determines that criteria for impairment exists, we are required under accounting rules to write down the value of such asset. Impairments of goodwill and other intangible assets have had and may have a material adverse effect on our profitability results of operations.
Goodwill arises on the acquisition of subsidiaries and associates and represents the excess of the aggregate of the cost of an acquisition and any noncontrolling interests in the acquiree over the fair value of the identifiable net assets acquired at the date of the acquisition. As of December 31, 2021 and December 31, 2020, we recognized goodwill in the amount of € 2.8 billion and € 2.7 billion, respectively. Goodwill on the acquisition of subsidiaries is capitalized and reviewed for impairment annually or more frequently if there are indications that impairment may have occurred. Intangible assets are recognized separately from goodwill when they are separable or arise from contractual or other legal rights and their fair value can be measured reliably. These assets are tested for impairment and their useful lives reaffirmed at least annually. The determination of the recoverable amount in the impairment assessment of non-financial assets requires estimates based on quoted market prices, prices of comparable businesses, present value or other valuation techniques, or a combination thereof, necessitating management to make subjective judgments and assumptions. These estimates and assumptions could result in significant differences to the amounts reported if underlying circumstances were to change.
Impairments of goodwill and other intangible assets have had and may have a material adverse effect on our profitability and results of operations. Since 2019, we have recorded impairments of goodwill of € 1.0 billion in connection with our strategic transformation.
|
45
|
|
|
Deutsche Bank
|
Signatures
|
|
|
Annual Report 2021 on Form 20-F
|
Change in Internal Control over Financial Reporting
|
|
|
|
|
Pursuant to accounting rules, we must review our deferred tax assets at the end of each reporting period. To the extent that it is no longer probable that sufficient taxable income will be available to allow all or a portion of our deferred tax assets to be utilized, we have to reduce the carrying amounts. These reductions have had and may in the future have material adverse effects on our profitability, equity and financial condition.
We recognize deferred tax assets for future tax consequences attributable to temporary differences between the financial statement carrying amounts of existing assets and liabilities and their respective tax bases, unused tax losses and unused tax credits. Deferred tax assets are recognized only to the extent that it is probable that sufficient taxable profit will be available against which those unused tax losses, unused tax credits and deductible temporary differences can be utilized. As of December 31, 2021 and December 31, 2020, we recognized deferred tax assets of € 6.2 billion and € 6.1 billion, respectively.
In determining the amount of deferred tax assets, we use historical tax capacity and profitability information and, if relevant, forecasted operating results based upon approved business plans, including a review of the eligible carry-forward periods, available tax planning opportunities and other relevant considerations. The analysis of historical tax capacity includes the determination as to whether a history of recent losses exists at the reporting date, and is generally based on the pre-tax results adjusted for permanent differences for the current and the two preceding financial years.
Each quarter, we re-evaluate our estimate related to deferred tax assets, including our assumptions about future profitability. The accounting estimate related to the deferred tax assets depends upon underlying assumptions about the historical tax capacity and profitability information, as well as forecasted operating results based upon approved business plans, which can change from period to period and requires significant management judgment. For example, tax law changes or variances in future projected operating performance could result in an adjustment to the deferred tax assets that would be charged to income tax expense or directly to equity in the period such determination was made.
These adjustments have had and may in the future have material adverse effects on our profitability or equity. In connection with the transformation, the Group adjusted the estimate related to deferred tax assets in affected jurisdictions, such as the UK and the United States, and recognized € 2.8 billion of valuation adjustments since 2019.
We are exposed to pension risks which can materially impact the measurement of our pension obligations, including interest rate, inflation and longevity risks that can materially impact our earnings.
We sponsor a number of post-employment benefit plans on behalf of our employees, including defined benefit plans. Our plans are accounted for based on the nature and substance of the plan. Generally, for defined benefit plans the value of a participant’s accrued benefit is based on each employee’s remuneration and length of service. We maintain various external pension trusts to fund the majority of our defined benefit plan obligations. Our funding principle is to maintain funding of the defined benefit obligation by plan assets within a range of 90 % to 100 % of the obligation, subject to meeting any local statutory requirements. We have also determined that certain plans should remain unfunded, although their funding approach is subject to periodic review, e.g. when local regulations or practices change. Obligations for our unfunded plans are accrued on the balance sheet. For most of the externally funded defined benefit plans there are local minimum funding requirements. We can decide on any additional plan contributions, with reference to our funding principle. There are some locations, e.g. the United Kingdom, where the trustees and the Bank jointly agree contribution levels. We also sponsor retirement and termination indemnity plans in several countries, as well as some post-employment medical plans for a number of current and retired employees, mainly in the United States. The post-employment medical plans typically pay fixed percentages of medical expenses of eligible retirees after a set deductible has been met.
We develop and maintain guidelines for governance and risk management, including funding, asset allocation and actuarial assumption setting. In this regard, risk management means the management and control of risks for us related to market developments (e.g., interest rate, credit spread, price inflation), asset investment, regulatory or legislative requirements, as well as monitoring demographic changes (e.g., longevity). To the extent that pension plans are funded, the assets held mitigate some of the liability risks, but introduce investment risk. In our key pension countries, our largest post-employment benefit plan risk exposures relate to potential changes in credit spreads, interest rates, price inflation and longevity, although these have been partially mitigated through the investment strategy adopted. Overall, we seek to minimize the impact of pensions on our financial position from market movements, subject to balancing the trade-offs involved in financing post-employment benefits, regulatory capital and constraints from local funding or accounting requirements.
All plans are valued annually by independent qualified actuaries using the projected unit credit method, with inputs including the discount rate, inflation rate, rate of increase in future compensation and for pensions in payment and longevity expectations. For the Group’s most significant pension plans in the key countries, the discount rate used at each measurement date is set based on a high-quality corporate bond yield curve, which is derived using a bond universe sourced from reputable third-party index data providers and rating agencies, and reflects the timing, amount and currency of the future expected benefit payments for the respective plan.
|
46
|
|
|
Deutsche Bank
|
Signatures
|
|
|
Annual Report 2021 on Form 20-F
|
Change in Internal Control over Financial Reporting
|
|
|
|
|
Our investment objective in funding the plans and our obligations in respect of them is to protect ourselves from adverse impacts of our defined benefit pension plans on key financial metrics. We seek to allocate plan assets closely to the market risk factor exposures of the pension liability to interest rates, credit spreads and inflation and, thereby, plan assets broadly reflect the underlying risk profile and currency of the pension obligations.
To the extent that the factors that drive our pension liabilities move in a manner adverse to us, or that our assumptions regarding key variables prove incorrect, or that our funding of our pension liabilities does not sufficiently hedge those liabilities, we could be required to make additional contributions or be exposed to actuarial or accounting losses in respect of our pension plans. More detailed information regarding our employee benefit plans is provided in Note 33, “Employee Benefits” of the consolidated financial statements.
Our risk management policies, procedures and methods leave us exposed to unidentified or unanticipated risks, which could lead to material losses.
We have devoted significant resources to developing our risk management policies, procedures and assessment methods and intend to continue to do so in the future. Nonetheless, the risk management techniques and strategies have not been and may in the future not be fully effective in mitigating our risk exposure in all economic market environments or against all types of risk, including risks that we fail to identify or anticipate. Some of our quantitative tools and metrics for managing risk are based upon our use of observed historical market behavior. We apply statistical and other tools to these observations to arrive at quantifications of our risk exposures. During the financial crisis, the financial markets experienced unprecedented levels of volatility (rapid changes in price direction) and the breakdown of historically observed correlations (the extent to which prices move in tandem) across asset classes, compounded by extremely limited liquidity. In this volatile market environment, our risk management tools and metrics failed to predict some of the losses we have experienced, and they may in the future fail to predict important risk exposures. In addition, our quantitative modeling does not take all risks into account and makes numerous assumptions regarding the overall environment, which may not be borne out by events. As a result, risk exposures have arisen and could continue to arise from factors we did not anticipate or correctly evaluate in our statistical models. This has limited and could continue to limit our ability to manage our risks especially in light of geopolitical developments, many of the outcomes of which are currently unforeseeable. Our losses thus have been and may in the future be significantly greater than the historical measures indicate.
In addition, our more qualitative approach to managing those risks not taken into account by our quantitative methods could also prove insufficient, exposing us to material unanticipated losses. Also, if existing or potential customers or counterparties believe our risk management is inadequate, they could take their business elsewhere or seek to limit their transactions with us. This could harm our reputation as well as our revenues and profits. See “Management Report: Risk Report” in the Annual Report 2021 for a more detailed discussion of the policies, procedures and methods we use to identify, monitor and manage our risks.
Operational risks, which may arise from errors in the performance of our processes, the conduct of our employees, instability, malfunction or outage of our IT system and infrastructure, or loss of business continuity, or comparable issues with respect to our vendors, may disrupt our businesses and lead to material losses.
We face operational risk arising from errors, inadvertent or intentional, made in the execution, confirmation or settlement of transactions or from transactions not being properly recorded, evaluated or accounted for. An example of this risk concerns our derivative contracts, which are not always confirmed with the counterparties on a timely basis. For so long as the transaction remains unconfirmed, we are subject to heightened credit and operational risk and in the event of a default may find it more difficult to enforce the contract.
In addition, our businesses are highly dependent on our ability to process manually or through our systems a large number of transactions on a daily basis, across numerous and diverse markets in many currencies. Some of the transactions have become increasingly complex. Moreover, management relies heavily on its financial, accounting and other data processing systems that include manual processing components. If any of these processes or systems do not operate properly, or are disabled, or subject to intentional or inadvertent human error, we could suffer financial loss, a disruption of our businesses, liability to clients, regulatory intervention or reputational damage.
|
47
|
|
|
Deutsche Bank
|
Signatures
|
|
|
Annual Report 2021 on Form 20-F
|
Change in Internal Control over Financial Reporting
|
|
|
|
|
We are also dependent on our employees to conduct our business in accordance with applicable laws, regulations and generally accepted business standards. If our employees do not conduct our business in this manner, we may be exposed to material losses. Furthermore, if an employee’s misconduct reflects fraudulent intent, we could also be exposed to reputational damage. We categorize these risks as conduct risk, a term used to describe the risks associated with behavior by employees and agents, including third parties, that could harm clients, customers or the integrity of the markets, such as selling products that are not suitable for a particular customer, fraud, unauthorized trading and failure to comply with applicable regulations, laws and internal policies. U.S. regulators in particular have been increasingly focused on conduct risk, and such heightened regulatory scrutiny and expectations could lead to investigations and other inquiries, as well as remediation requirements, more regulatory or other enforcement proceedings, civil litigation and higher compliance and other risks and costs.
We in particular face the risk of loss events due to the instability, malfunction or outage of our IT system and IT infrastructure, as well as breaches in IT system and infrastructure (including cyber-attacks). Such losses could materially affect our ability to perform business processes and may, for example, arise from the erroneous or delayed execution of processes as a result of system outages, degraded services in systems and IT applications or the inaccessibility of our IT systems. A delay in processing a transaction, for example, could result in an operational loss if market conditions worsen during the period after the error. IT-related errors may also result in the mishandling of confidential information, damage to our computer systems, financial losses, additional costs for repairing systems, reputational damage, customer dissatisfaction or potential regulatory or litigation exposure (including under data protection laws such as the GDPR).
The move across global industries to conduct business from home and away from primary office locations in response to the COVID-19 pandemic continues to put pressure on business practices, and the demand on our technology infrastructure. Additionally, the current situation also exposes us to a greater risk of cyber-attacks, which could lead to technology failures, security breaches, unauthorized access, loss or destruction of data or unavailability of services, as well as increase the likelihood of conduct breaches.
Business continuity risk is the risk of incurring losses resulting from the interruption of normal business activities. We operate in many geographic locations and are frequently subject to the occurrence of events outside of our control. Despite the contingency plans we have in place, our ability to conduct business in any of these locations may be adversely impacted by a disruption to the infrastructure that supports our business, whether as a result of, for example, events that affect our third party vendors or the community or public infrastructure in which we operate. Any number of events could cause such a disruption including deliberate acts such as sabotage, terrorist activities, bomb threats, strikes, riots and assaults on the bank’s staff; natural calamities such as hurricanes, snow storms, floods, disease pandemics (such as the current COVID-19 pandemic) and earthquakes; or other unforeseen incidents such as accidents, fires, explosions, utility outages and political unrest. Any such disruption could have a material adverse effect on our business and financial position.
As a global bank, Deutsche Bank is often the subject of news reports. Deutsche Bank conducts its media dialogue through official teams. However, members of the media sometimes approach Deutsche Bank staff outside of these channels and Deutsche Bank-internal information, including confidential matters, have been subject to external news media coverage, which may result in publication of confidential information. Leaks to the media can have severe consequences for Deutsche Bank, particularly when they involve inaccurate statements, rumors, speculation or unsanctioned opinions. This can result in financial consequences such as the loss of confidence or business with clients and may impact the bank’s share price or our capital instruments by undermining investor confidence. Our ability to protect ourselves against these risks is limited.
We utilize a variety of third parties in support of our business and operations. Services provided by third parties pose risks to us comparable to those we bear when we perform the services ourselves, and we remain ultimately responsible for the services our third parties provide. Furthermore, if a third party does not conduct business in accordance with applicable standards or our expectations, we could be exposed to material losses or regulatory action or litigation or fail to achieve the benefits we sought from the relationship.
We utilize a variety of third parties in support of our business and operations. We do so in order to focus on our core competencies and to seek improvements in costs, efficiency and effectiveness in our operations, for instance in connection with our IT modernization efforts. The nature of what we use third parties for has evolved and now includes more fundamental aspects of services and infrastructure such as Cloud computing. This represents different risks and requires more robust risk assessments, appropriate contracting and ongoing oversight commensurate with relevant risks. It has also led to an increase in regulation and regulatory scrutiny over how we manage third parties on a day-to-day basis and also assessments of the levels of resiliency needed in relation to the importance of the business services supported by the third party.
|
48
|
|
|
Deutsche Bank
|
Signatures
|
|
|
Annual Report 2021 on Form 20-F
|
Change in Internal Control over Financial Reporting
|
|
|
|
|
Services provided by third parties pose risks to us comparable to those we bear when we perform the services ourselves, and we remain ultimately responsible for the services the third parties provide. We depend on such third parties to conduct their delivery of services in compliance with applicable laws, regulations and generally accepted business standards and in accordance with the contractual terms and service levels they have agreed with us. If the third parties do not conduct business in accordance with these standards, we may be exposed to material losses and could be subject to regulatory action or litigation as well as be exposed to reputational damage. More generally, if a third-party relationship does not meet our expectations, we could be exposed to financial risks, such as the costs and expenses associated with migration of the services to another third party and business and operational risks related to the transition, and we could fail to achieve the benefits we sought from the relationship.
Our operational systems are subject to an increasing risk of cyber-attacks and other internet crime, which could result in material losses of client or customer information, damage our reputation and lead to regulatory penalties and financial losses.
Among the operational risks we face is the risk of breaches of the security of our or our vendors’ computer systems due to unauthorized access to networks or resources, the introduction of computer viruses or malware, or other forms of cybersecurity attacks or incidents. Such breaches could threaten the confidentiality of our or our clients’ data and the integrity of our systems. We continue to invest toward the protection of our computer systems against such breaches and toward ensuring that our vendors employ appropriate cybersecurity safeguards. To address the evolving cyber threat risk, we continue to modify and enhance our protective measures and to investigate and remediate information security vulnerabilities. These measures, however, may not be effective against the many security threats we face.
The increasing frequency and sophistication of recent cyber-attacks has resulted in an elevated risk profile for many organizations around the world including Deutsche Bank, and significant attention by our management has been paid to the overall level of preparedness against such attacks. Cybersecurity is growing in importance due to factors such as the continued and increasing reliance on our technology environment. We and other financial institutions have experienced attacks on computer systems, including attacks aimed at obtaining unauthorized access to confidential company or customer information or damaging or interfering with company data, resources or business activities, or otherwise exploiting vulnerabilities in our infrastructure. We expect to continue to be the target of such attacks in the future. Although we have to date not experienced any material business impact from these attacks, we may not be able to effectively anticipate and prevent more material attacks from occurring in the future. The move across global industries to conduct business from home and away from primary office locations in response to the COVID-19 pandemic also exposes us to a greater risk of cyber-attacks, which could lead to technology failures, security breaches, unauthorized access, loss or destruction of data or unavailability of services. A successful attack could have a significant negative impact on us, including as a result of disclosure or misappropriation of client or proprietary information, damage to computer systems, an inability to access information technology (IT) systems, financial losses, remediation costs (such as for investigation and re-establishing services), increased cybersecurity costs (such as for additional personnel, technology, or third-party vendors), personal data breach notification obligations, reputational damage, customer dissatisfaction and potential regulatory or litigation exposure.
The size of our clearing operations exposes us to a heightened risk of material losses should these operations fail to function properly.
We have large clearing and settlement businesses and an increasingly complex and interconnected information technology (IT) landscape. These give rise to the risk that we, our customers or other third parties could lose substantial sums if our systems fail to operate properly for even short periods. This will be the case even where the reason for the interruption is external to us. In such a case, we might suffer harm to our reputation even if no material amounts of money are lost. This could cause customers to take their business elsewhere, which could materially harm our revenues and profits.
Ongoing global benchmark reform efforts, specifically the transition from interbank offered rates to alternative reference rates, including “risk-free-rates”, introduce a number of inherent risks to our business and the financial industry. These risks, should they materialize, may have adverse effects on our business, results of operations and profitability.
Regulators and central banks have set the goal of improving the robustness of financial benchmarks, especially interest rate benchmarks. As a result of this initiative, as of the end of 2021, CHF LIBOR, EUR LIBOR, EONIA and certain other LIBOR currency tenors have ceased to be published. GBP LIBOR and JPY LIBOR have ceased to be available in representative form. Certain tenors of GBP and JPY LIBOR remain available in synthetic form for a limited time period, only to enable so called ‘tough legacy’ transactions to transition to suitable Risk-Free Rate (“RFR”) alternatives. A reduced number of USD LIBOR tenors is expected to be published until the end of June 2023, however the new use of USD LIBOR is subject to significant limitations. The transition away from the LIBORs and EONIA (together “IBORs”) to RFRs may cause portfolios to perform differently than in the past, or have other consequences, which cannot be fully anticipated. Regulators such as the FCA and FRB have strongly urged market participants to transition to alternative RFRs.
|
49
|
|
|
Deutsche Bank
|
Signatures
|
|
|
Annual Report 2021 on Form 20-F
|
Change in Internal Control over Financial Reporting
|
|
|
|
|
A material portion of our assets and liabilities, including financial instruments we trade and other transactions and services we are involved in, have interest rates that are linked to IBORs and other financial benchmarks that have already ceased or that may be subject to potential unavailability or future discontinuation. Transition of legacy transactions will depend, in some cases on client engagement and agreement to spread adjustments, which may not be forthcoming. In some cases, transition of legacy products may be hampered by structural factors, such as technical inability to contact numerous bondholders. To help address risks with tough legacy products, legislation has been passed in UK and New York, and implementing powers have been used by the European Commission. None of those legislative steps has provided a panacea to transition of “tough legacy” products, however, and therefore risks remain in respect of our products and holdings which reference IBORs. Uncertainties around the timing and method of transition to RFRs continues to present a number of risks for us, our customers and the financial services industry more widely. The unavailability and discontinuation of IBORs and other financial benchmarks continues to pose a variety of risks to us. Those risks include the following:
- – Legal and compliance risk (including conduct risk) may arise due to possible disputes regarding either the terms of financial contracts with counterparties, or the manner of transition to replacement rates. Many financial instruments linked to financial benchmarks contain provisions, known as fallbacks, for the use of a successor interest rate in the event of the discontinuation of the benchmark, while others do not. The quality of fallbacks in contracts has improved in respect of a number of products in very recent times, but risks remain that some fallbacks may not perform well. In connection with discontinuation and transition, the counterparty to the financial instrument may challenge the rate determined by a fallback for such an instrument, particularly if we are involved in the determination or setting of the successor rate. Such disputes could result in litigation or regulatory action founded in claims of breach of contract, anti-trust violations, market abuse, and/or other mistreatment of customers.
- – Legal and compliance risk may derive from any failure to comply with regulators’ expectations, that new use of financial benchmarks will cease.
- – Liquidity risk may arise due to slow acceptance, take-up, and development of liquidity in RFR-related products, particularly SOFR, leading to market dislocation or fragmentation. Additionally, bid/offer spreads may widen impacting funding and collateral postings. Similar risks may apply to exposures toward the date of discontinuation, or in relation to tough-legacy products which use synthetic LIBOR, which may perform differently than historic LIBOR.
- – Also, the replacement of financial benchmarks, or use of synthetic LIBOR, could adversely impact the value of and return on existing instruments and contracts and the market for securities and other instruments whose returns are linked to such benchmarks.
- – Market risk may arise due to interest rate “basis” risks – the risks posed by different interest rate provisions applying to assets than to liabilities – across tenors and currencies, driven by differing fallback methodologies and timings. Different timings of adoption of fallback protocols will create new basis and potentially make hedging more costly or less effective, and losses may result from value transfer in the fallback methodology adopted. Due to the unavailability and discontinuation of financial benchmarks that have already happened, and that are yet to come, we may incur losses in respect of our assets and liabilities if the successor interest rate is not economically equivalent to the discontinued benchmarks.
- – Introduction of new RFRs has required us to develop new pricing and risk models related to new RFR-linked products. Regulatory risk and capital models developed to support RFR-linked products have been submitted for approval by competent authorities, with further model changes expected to be submitted in 2022. The scale of model changes still to be implemented presents continued project and operational risk and continues to be a key focus of senior management.
- – Finance and tax risk may arise due to the discontinuation of financial benchmarks and transition to RFRs, which could cause hedge accounting items to be derecognized, adversely impacting our profitability or causing us to incur losses. Discontinuation and transition could also pose difficulties for the independent price verification of financial instruments, where market data is unavailable for the new or modified financial instrument. Tax uncertainties could arise, for example, if a discontinuation or transition is viewed as a significant modification of a financial instrument that results in a profit or loss recognition event for tax purposes.
- – Technology and operational risk may arise as a result of the complexity of transition processes, which will require collaboration with our regulators and central banks as well as a wide range of market participants. Also, significant change efforts – relating to RFR product development, re-documentation of client contracts and infrastructure change, including to systems, processes and models across the business and our Finance, Risk and Treasury functions –, has been required. There is a risk that not all systems and process dependencies on financial benchmark availability have been identified and remediated. Successful transition processes are, to some extent, dependent on achieving industry and client consensus on standards and conventions, timing and sequencing of transition steps, creation of forward-looking term versions of the RFRs and the timely re-documenting of client contracts.
|
50
|
|
|
Deutsche Bank
|
Signatures
|
|
|
Annual Report 2021 on Form 20-F
|
Change in Internal Control over Financial Reporting
|
|
|
|
|
It is currently difficult to determine to what extent the transition to alternative reference rates will adversely affect us, or the costs of implementing any relevant remedial action. Uncertainty as to the nature and extent to such potential changes, alternative reference rates or other reforms including the potential continuation beyond the initial first year of the publication of synthetic GBP LIBOR may adversely affect financial instruments using financial benchmarks. The implementation of any alternative RFRs may be impossible or impracticable under the existing terms of such financial instruments and could have an adverse effect on the value of certain financial instruments and on our profitability. There is also the risk of an adverse effect to reported performance arising from the transition rules established by accounting bodies.
More broadly, initiatives to reform existing benchmarks and our participation in them, including as benchmark submitter, could potentially expose us to legal, reputational or other risks. In particular, legal and compliance risk (including conduct risk) may arise due to the operational risks of participating in benchmark submissions, either as part of a panel with the requirement to use models and potentially exercise expert judgement or as provider of transactions data to a benchmark administrator.
The continued reduction in availability and ultimate discontinuation of further financial benchmarks including USD LIBOR, and transition to RFRs could have adverse effects on our business, results of operations, and profitability.
We are subject to laws and other requirements relating to financial and trade sanctions and embargoes. If we breach such laws and requirements, we can be subject, and have in the past been subject, to material regulatory enforcement actions and penalties.
We are required to monitor, evaluate, and observe laws and other requirements relating to financial and trade sanctions and embargoes set by the EU, the Deutsche Bundesbank, Germany’s Federal Office for Economic Affairs and Export Control, and other authorities, such as the U.S. Treasury Department’s Office of Foreign Assets Control (OFAC) and the UK Treasury Department’s Office of Financial Sanctions Implementation (OFSI). Sanctions are subject to rapid change and it is also possible that new direct or indirect secondary sanctions could be imposed by the United States or other jurisdictions without warning as a result of geopolitical developments. New and far-reaching sanctions against Russian entities and individuals have been imposed by the United States, the EU, the United Kingdom and other individual countries very rapidly following the commencement by Russia of hostilities against the Ukraine, and many of these sanctions require very rapid implementation. Should we fail to comply timely and in all respects with these new sanctions, we could be exposed to legal penalties and our reputation could suffer. New sanctions may also be imposed on other entities and individuals beyond the Ukrainian conflict at any time. If we breach any such new or preexisting laws and requirements, we can be subject, and have in the past been subject, to material regulatory enforcement actions and penalties.
Transactions with counterparties in countries designated by the U.S. State Department as state sponsors of terrorism or persons targeted by U.S. economic sanctions may lead potential customers and investors to avoid doing business with us or investing in our securities, harm our reputation or result in regulatory or enforcement action which could materially and adversely affect our business.
We engage or have engaged in a limited amount of business with counterparties, including government-owned or -controlled counterparties, in certain countries or territories that are subject to comprehensive U.S. sanctions, including Iran and Cuba (referred to as “Sanctioned Countries”), or with persons targeted by U.S. economic sanctions (referred to as “Sanctioned Persons”). U.S. law generally prohibits U.S. persons or any other persons acting within U.S. jurisdiction (which includes business with a U.S. nexus) from dealings with or relating to Sanctioned Countries or Sanctioned Persons. Additionally, U.S. indirect or “secondary” sanctions threaten the imposition of sanctions against non-U.S. persons entirely outside of U.S. jurisdiction for engaging in certain activities, including categories of transactions with certain entities and countries. Thus, U.S. sanctions may implicate activities in other geographic areas and by non-U.S. persons depending on the circumstances. Our U.S. subsidiaries, branch offices, and employees are, and, in some cases, our non-U.S. subsidiaries, branch offices, and employees are or become, subject to such prohibitions and other regulations.
We are a German bank and our activities with respect to Sanctioned Countries and Sanctioned Persons have been subject to policies and procedures designed to avoid the involvement of U.S. jurisdiction, including U.S. persons acting in any managerial or operational role and to ensure compliance with United Nations, European Union and German sanctions and embargoes; in reflection of legal developments in recent years, we have further developed our policies and procedures with the aim of promoting – to the extent legally permitted – compliance with regulatory requirements extending to other geographic areas regardless of jurisdiction. However, should our policies prove to be, or have been, ineffective, we may be subject to regulatory or enforcement action that could materially and adversely affect our reputation, financial condition, or business. We have also taken other action to reduce the risk of compliance violations. In 2007, our Management Board decided that we will not engage in new business with counterparties in countries such as Iran, Syria, Sudan and North Korea and to exit existing business to the extent legally possible. In 2014, we added the Crimea Region, and in 2021 Afghanistan to this list of countries, whilst de-listing Sudan. We also decided to limit our business with counterparties in Cuba. Iran, North Korea, Syria and Cuba are currently designated as state sponsors of terrorism by the U.S. State Department.
|
51
|
|
|
Deutsche Bank
|
Signatures
|
|
|
Annual Report 2021 on Form 20-F
|
Change in Internal Control over Financial Reporting
|
|
|
|
|
We had a representative office in Tehran, Iran, which we discontinued on December 31, 2007. Our remaining business with Iranian counterparties consisted mostly of participations as lender and/or agent in a few large trade finance facilities arranged before 2007 to finance the export contracts of exporters in Europe and Asia. As of December 31, 2018, those loans were fully paid back, subsequently the majority of the remaining Iranian business consists of legacy contractual obligations related to guarantees. We do not believe our business activities with Iranian counterparties are or had been material to our overall business, with the aforementioned guarantees having notional amounts of substantially less than 0.01 % of our total assets over recent years. As of December 31, 2021, the revenues from such activities represented substantially less than 0.01 % of our total revenues for the year ended December 31, 2021.
As required by Section 219 of the Iran Threat Reduction and Syria Human Rights Act of 2012 (Section 13(r) of the Securities Exchange Act of 1934, as amended) we have disclosed certain information regarding our activities or transactions with persons subject to U.S. sanctions against Iran and other persons subject to such provision. Such disclosure is set forth in the section of this document entitled “Disclosures Under Iran Threat Reduction and Syria Human Rights Act of 2012”, which follows “Item 16I: Disclosure Regarding Foreign Jurisdictions that Prevent Inspections”.
We are also engaged in a limited amount of business with counterparties domiciled in Cuba, which is not subject to any United Nations, European Union or German embargoes. The business consists of a limited number of letters of credit and of cash payments, each without a U.S. nexus, and it represented substantially less than 0.01 % of our assets as of December 31, 2021. The letters of credit served to finance commercial products such as machinery as well as medical products.
We have set up processes and procedures aimed at complying with other substantial changes in U.S. economic sanctions that have occurred since 2017. In August 2017, the United States enacted the “Countering America’s Adversaries Through Sanctions Act” (referred to as “CAATSA”), which codifies existing U.S. sanctions against Russia (including designation of Russian entities under U.S. sanctions), expands U.S. secondary sanctions against Russia, tightens existing sectoral sanctions (targeting specific sectors of the Russian economy), and permits the imposition of sectoral sanctions against additional sectors of the Russian economy. In particular, expanded U.S. secondary sanctions under CAATSA allow for the imposition of U.S. sanctions on, among others, non-U.S. entities who engage in, among other activities, “significant” transactions with persons targeted under Russia-related sanctions or specific entities in the Russian defense and intelligence sectors, as well as certain energy projects relating to Russia. We do not believe we have engaged or are currently engaged in any transactions with Russian entities that violate, or are sanctionable under, U.S. sanctions. However, given the broad discretion U.S. authorities have in interpreting and enforcing U.S. sanctions, there can be no assurances that U.S. authorities will not bring enforcement actions against us, or impose secondary sanctions on us for our ongoing activities. Any such actions could have a material impact on our business and harm our reputation. Further, as noted earlier in these Risk Factors, in response to the recent large-scale Russian military action against Ukraine, the United States, as well as other nations and the EU, have expanded sanctions on Russia and Russian entities; such sanctions could have a material impact on our business activities.
Additionally, since 2017, the U.S. Administration has imposed a number of sanctions against the Government of Venezuela and Venezuelan officials. These sanctions prohibit (beginning on August 5, 2019) virtually all unlicensed transactions involving the Government of Venezuela, including state-owned or state-controlled companies, and also threaten to impose sanctions on (non-U.S.) persons having materially assisted such transactions or dealings. We have taken steps and established processes and procedures aimed at complying with these U.S. sanctions against the Government of Venezuela. In response to these U.S. sanctions, we have wound down several client relationships. With respect to entities of the Government of Venezuela, we are currently only engaged in legacy transactions. We do not believe that any of our remaining activities related to the Government of Venezuela violate U.S. sanctions. However, given the broad discretion U.S. authorities have in interpreting and enforcing U.S. sanctions, there can be no assurances that U.S. authorities will not allege that our ongoing activities violate U.S. sanctions.
Political and trade tensions between the United States and China led to a series of sanctions and countermeasures in 2020 and 2021, some of which were particularly relevant to financial institutions. In June 2021, the United States adopted Executive Order 14032, which amended an existing restriction and restricts purchases and sales by U.S. persons of certain publicly traded securities linked to companies the United States determines are affiliated with the Chinese military-industrial complex, as well as publicly traded securities that are derivative of or designed to provide investment exposure to such securities. Executive Order 14032 amended and clarified similar restrictions that had been imposed under a previous executive order. While we have implemented changes in our control processes to promote compliance with these requirements, such measures raise potential regulatory compliance and conflicts of laws challenges and the impacts of such measures could be material and adverse.
|
52
|
|
|
Deutsche Bank
|
Signatures
|
|
|
Annual Report 2021 on Form 20-F
|
Change in Internal Control over Financial Reporting
|
|
|
|
|
We are aware, through press reports and other means, of initiatives by governmental and non-governmental entities in the United States and elsewhere to adopt laws, regulations or policies prohibiting transactions with or investment in, or requiring divestment from, entities doing business with Sanctioned Countries, particularly China, Iran and Russia. Such initiatives may result in our being unable to gain or retain entities subject to such prohibitions as customers or as investors in our securities. In addition, our reputation may suffer due to our association with such countries. Such a result could have significant adverse effects on our business or the price of our securities.
Sanctions are subject to rapid change and it is also possible that new direct or indirect secondary sanctions could be imposed by the United States or other jurisdictions without warning as a result of geopolitical developments.
|
53
|
|
|
Deutsche Bank
|
Signatures
|
|
|
Annual Report 2021 on Form 20-F
|
Change in Internal Control over Financial Reporting
|
|
|
|
|
Item 4: Information on the Company
History and Development of the Company
The legal and commercial name of our company is Deutsche Bank Aktiengesellschaft. It is a stock corporation organized under the laws of Germany.
Deutsche Bank Aktiengesellschaft originated from the reunification of Norddeutsche Bank Aktiengesellschaft, Hamburg, Rheinisch-Westfälische Bank Aktiengesellschaft, Düsseldorf, and Süddeutsche Bank Aktiengesellschaft, Munich. Pursuant to the Law on the Regional Scope of Credit Institutions, these were disincorporated in 1952 from Deutsche Bank, which had been founded in 1870. The merger and the name were entered in the Commercial Register of the District Court Frankfurt am Main on May 2, 1957.
We are registered under registration number HRB 30 000. Our registered address is Taunusanlage 12, 60325 Frankfurt am Main, Germany, and our telephone number is +49-69-910-00. Our agent in the United States is: DB USA Corporation, c/o Office of the Secretary, 1 Columbus Circle, Mail Stop NYC01-1950, New York, New York 10019-8735.
For information on significant capital expenditures and divestitures, please see “Management Report: Operating and Financial Review: Deutsche Bank Group: Significant Capital Expenditures and Divestitures” in the Annual Report 2021.
The Securities and Exchange Commission (“SEC”) maintains an Internet site that contains reports, proxy and information statements, and other information regarding issuers that file electronically with the SEC, such as Deutsche Bank Aktiengesellschaft, with the address http://www.sec.gov. Our filings are available on the SEC’s Internet site under File Number 001-15242. Our Internet address is http://www.db.com.
Business Overview
Our Organization
Please see “Management Report: Operating and Financial Review: Deutsche Bank Group: Our Organization” in the Annual Report 2021. For information on net revenues by geographic area and by corporate division please see Note 4 “Business Segments and Related Information: Entity-Wide Disclosures” to the consolidated financial statements and “Management Report: Operating and Financial Review: Results of Operations: Segment Results of Operations” in the Annual Report 2021.
Management Structure
Please see “Management Report: Operating and Financial Review: Deutsche Bank Group: Management Structure” in the Annual Report 2021.
Our Business Strategy
In July 2019, we embarked on a fundamental transformation of Deutsche Bank. Since then we made substantial progress on our key commitments. We have redrawn our business perimeter and selectively exited businesses in which we were not able to compete profitably. The focused execution of our strategic agenda is helping us to deliver against our financial targets and milestones. We have achieved revenue and volume growth across all four core businesses, with business momentum, market share gains and investments supporting performance heading into 2022. Throughout the uncertainty of the COVID-19 pandemic we have increased our client interactions and supported them in navigating their challenges. As we ended the year 2021 we absorbed 97 % of our anticipated transformation related costs. This progress has been recognized externally by our stakeholders. Notably in 2021, Deutsche Bank received rating upgrades from Moody’s, SP and Fitch.
|
54
|
|
|
Deutsche Bank
|
Signatures
|
|
|
Annual Report 2021 on Form 20-F
|
Change in Internal Control over Financial Reporting
|
|
|
|
|
Our competitive position is built on our business capabilities in lending, investing, payments, risk management and capital markets intermediation with a global reach and on the stability of the German home market. Strength and stability are expected to become important as the next decade could see unprecedented market changes in the banking industry. Significant shifts in the macro environment, the transition of economies to net zero
emissions and advances in technology will define our operating environment. In this volatile world, client demands are expected to grow in particular for advisory services, for ESG related transaction support and for risk management.
Our ambition is for Deutsche Bank to become the first point of call for all our clients, addressing the full range of their financial needs, as their Global Hausbank. Our global network, our more than 20,000 account managers worldwide, our market expertise, our comprehensive product range and our outstanding risk management should place us to be a leading Global Hausbank based in Europe. Positive client momentum and profitable growth are validating our direction. We help our clients navigate a complex environment by hedging their risks, financing their transformation, and facilitating investments that allow them to offset the negative impact of inflation and protect their assets. Looking ahead this sets us up for the next phase of our evolution which aims to focus on becoming sustainably profitable by further growing our businesses while increasing efficiencies and maintaining capital discipline.
Our future growth aspirations are centered around stable and sustainable businesses. Targeted growth initiatives have been identified in the Corporate Bank, the Private Bank, primarily in the International Private Bank, and in Asset Management. For the Investment Bank our focus will remain a consistent and disciplined execution of our strategy.
These growth ambitions will be combined with a continued focus on costs. To reshape and improve our long-term competitive position, we will remain disciplined and create further capacity for future investments. We plan to reinvest cost savings into targeted growth initiatives and further efficiency measures.
Both our growth targets and our focus on efficiency are intended to allow us to return capital to our shareholders. We remain committed to employing the same discipline we used in the last phase of the transformation to balance investment into business growth and return capital. To enhance the return on the tangible equity profile of the Group, we aim to re-allocate capital to higher yielding and higher growth businesses within our portfolio.
We are committed to delivering sustainably growing cash dividends and returning excess capital to shareholders through share buybacks that is over and above what is required to support profitable growth and upcoming regulatory changes over time, subject to regulatory approval and shareholder authorization and meeting German corporate law requirements. To that end, subject to meeting our strategic targets, the Management Board intends to grow the cash dividend per share by 50 % p.a. in the next 3 years, starting from € 0.20 per share for the financial year 2021, which would translate into approximately € 3.3 billion of cumulative dividend payments by 2025 with respect to financial years 2021-2024. In relation to the financial year 2024 we intend to achieve a total payout ratio of 50% from a combination of dividends paid and share buybacks executed in 2025; and we intend to maintain a 50% total payout ratio in subsequent years. In addition to the already announced share buyback in 2022 of € 0.3 billion, meeting our current financial aspirations would therefore support the previously announced cumulative distributions to shareholders in the form of dividends paid or share buybacks executed in the total amount of € 5 billion in respect of financial years 2021-2024. In addition, should we successfully execute our financial and strategic plans through 2025, total implied cumulative distributions of approximately € 8 billion in respect of financial years 2021-2025 would be achievable. Our ambition to return capital to shareholders is further underpinned by our aim to maintain a robust Common Equity Tier 1 (CET 1) capital ratio of approximately 13 %, i.e. a CET 1 ratio of no less than 200 basis points above our Maximum Distributable Amount (MDA) threshold we currently assume to prevail over time.
In our aspiration of supporting our client franchise we continue to emphasize strong controls and transform the way we work. To achieve this we will balance growth ambitions with a robust control mindset, we plan to continue to strengthen systems and processes and we will invest in deploying modern technology. Likewise, we will continue our transition to become more agile.
Our financial results in 2021
Sustaining revenue growth in our Core Bank
Our strategic transformation was designed to refocus our Core Bank around market leading businesses, which operate in growing markets with attractive return potential. Our Core Bank comprises our four core operating divisions, namely the Corporate Bank, the Investment Bank, the Private Bank, and Asset Management, together with the segment Corporate Other. Revenues in our Core Bank were € 25.4 billion in 2021, with € 25.5 billion on Group level, a year-on-year increase of 5 % and 6 %, respectively.
|
55
|
|
|
Deutsche Bank
|
Signatures
|
|
|
Annual Report 2021 on Form 20-F
|
Change in Internal Control over Financial Reporting
|
|
|
|
|
Continuing to deliver on cost reduction targets
We remained highly focused on cost reductions in 2021. Noninterest expenses were € 21.5 billion in 2021, a slight year-over-year increase of € 0.3 billion or 1.4 %. As the transformation advances, our cost/ income ratio has substantially improved since 2019, down 24 percentage points. Adjusted costs excluding transformation charges and expenses eligible for reimbursement related to Prime Finance were € 19.3 billion, a year-over-year reduction of € 0.3 billion or 1.3 %, with lower compensation and benefits reflecting reductions in the workforce and offsetting performance driven adjustments to variable compensation and slight increase in IT costs mainly driven by investment spending and execution of our IT and platform strategies.
Continued portfolio and cost reduction and completion of Prime Finance transfer in the Capital Release Unit
The Capital Release Unit delivered another year of significant portfolio reduction while further reducing costs in 2021. The transfer of clients, technology and key staff from Deutsche Bank’s Global Prime Finance and Electronic Equities businesses to BNP Paribas was successfully completed by the end of 2021, meeting the targeted timeline.
At year-end 2021, risk weighted assets (RWAs) were reduced to € 28 billion, down from € 34 billion at the end of 2020 and ahead of Deutsche Bank’s year end 2022 target of € 32 billion. As at December 31, 2021, the Unit’s RWAs included Operational Risk RWAs of € 20 billion. Leverage exposure was € 39 billion at the end of 2021, down 46 % from € 72 billion at the end of 2020, already ahead of our target of € 51 billion for 2022.
Since its inception in mid-2019, the Capital Release Unit has reduced RWAs by 57 %, or € 37 billion, and leverage exposure by 84 %, or € 210 billion.
The Capital Release Unit reported a substantial improvement
in its financial results in 2021. The loss before tax was € 1.4 billion, down 38 % from a loss before tax of € 2.2 billion in 2020. This improvement was primarily driven by a 26 % reduction in noninterest expenses, reflecting a 35 % reduction in adjusted costs ex-transformation charges during the year.
Conservative balance sheet management
We remain committed to managing our balance sheet conservatively as we execute on our strategic transformation and navigate through the COVID-19 pandemic and the situation related to the Russian military action against the Ukraine. At the end of 2021, our CET1 ratio was 13.2 %, 42 basis points lower compared to year-end 2020 and 280 basis points above the regulatory CET1 requirements. For 2022, we remain committed to maintaining our CET1 ratio above 12.5 %.
Leverage ratio (fully loaded) was 4.9 % at the end of the 2021, positively impacted by the CRR amendments which took effect on June 28, 2021 and the ECB’s Decision 2021/1074. In aggregate, these effects allow banks to temporarily exclude certain eligible central bank exposures until March 2022 hence continuing the exclusion which was temporarily introduced by the CRR Quick Fix in the third quarter of 2020. Including these balances, our Leverage ratio (fully loaded) was 4.5 %.
Value-at-Risk (VaR) amounted to € 34 million at the end of 2021 confirming our conservative risk levels.
Provisions for credit losses were € 515 million for the full year 2021, significantly lower compared to 2020. For the full year 2022, we expect provisions for credit losses to be around 20 basis points as a percentage of our anticipated average loans. This reflects the expectations of a slowdown of macro-economic growth in 2022 from the exceptionally strong levels in 2021. We remain committed to our stringent underwriting standards and our tight risk management framework. Further detail on the calculation of Expected Credit Losses (ECLs) is provided in the section ‘Risk Report’ in this report.
Our Sustainability strategy
Since 2019, sustainability has been a central component of our “Compete to win” strategy. In 2021, we made progress in implementing our sustainability strategy, focusing on the following four dimensions:
- – Sustainable Finance. It is our objective to be a reliable financial partner for our clients and to support them in their transition.
- – Policies and commitments: To ensure that the business we do is ESG-compliant and avoids negative impacts.
- – People and Operations: To be the partner of choice, we also have to lead by example. It means ensuring that we ourselves operate in a sustainable way and that we foster a culture of diversity and inclusion.
- – Thought Leadership and Stakeholder Engagement. We need to engage with lawmakers, regulators, investors, and society as a whole in order to agree on the right standards and frameworks to maximize our positive impact.
|
56
|
|
|
Deutsche Bank
|
Signatures
|
|
|
Annual Report 2021 on Form 20-F
|
Change in Internal Control over Financial Reporting
|
|
|
|
|
One of the main drivers for this progress is the bank’s governance to manage, measure and control its sustainability activities. This governance includes two executive-level forums devoted entirely to sustainability. The most senior forum is the Group Sustainability Committee. Chaired by our Chief Executive Officer, the committee’s role is to accelerate decision-making and ensure senior management alignment across the Group. To reinforce the bank’s sustainability ambition, the Management Board’s, and other top-executives’ variable compensation has been tied to additional non-financial sustainability objectives from 2021, such as volumes for sustainable financing and investments, a reduction of electricity consumption in the bank’s buildings and a sustainability rating index comprising the following rating agencies: CDP, ISS ESG, MSCI ESG Ratings, SP Global, and Sustainalytics.
Given the progress we have been making in sustainable finance, we first announced to bring forward our € 200 billion target for sustainable financing and investments by two years to year-end of 2023 and now expect to achieve it by year-end 2022. We exceeded our 2021 target of € 100 billion after nine months and ended the year with € 157 billion in sustainable financing and investments.
We also continued to work on the implementation of further focus areas of our sustainability strategy. In 2021, we continued to develop and implement a comprehensive Climate Risk Framework, in line with the recommendations of the Task Force for Climate-Related Financial Disclosures. We became a founding member of the Net Zero Banking Alliance, committing to align our operational and attributable emissions from our loan portfolio with pathways to net zero by 2050. This supplements the bank’s signing of the Collective Commitment to Climate Action of the German financial sector and our commitment to publish the carbon footprint of our loan portfolio by the end of 2022. Next to our engagement in the Net-Zero Banking Alliance we started transition dialogues to support our clients in accelerating their sustainability transition and develop credible transition plans.
In line with our ambition to put sustainability at the center of our operations, we remained carbon neutral for our own operations and business travel, as we have been since 2012 and further implemented our commitment to source 100 % renewable electricity by 2025, with an interim target of 85 % for 2022.
To demonstrate thought leadership and actively engage in dialogue, we laid our strategy at our first Sustainability Deep Dive in May 2021. Furthermore, a Deutsche Bank delegation engaged with clients and other stakeholders on sustainability issues at COP 26, which was held in Glasgow, Scotland. We also established an ESG Centre of Excellence in cooperation with the Monetary Authority of Singapore and funded a chair for Sustainable Finance in the newly created Sustainable Business Transformation Initiative at the European School of Management and Technology Berlin.
With our holistic sustainability approach, we aim to maximize our contribution to the Paris Climate Agreement and the United Nations' Sustainable Development Goals. Several ESG rating agencies have recognized our sustainability progress: CDP has raised the bank’s climate change score from C to B; credit ratings agency SP Global scored Deutsche Bank 60 points (SP Global CSA assessment), putting it back in the Dow Jones Sustainability Europe Index, and our Sustainalytics score improved from 30.0 (high risk) to 27.4 (medium risk).
Our financial targets
Our key financial targets are:
Financial Targets for 2022
- – Post-tax Return on Average Tangible Equity of 8 % for the Group
- – Post-tax Return on Average Tangible Equity of more than 9 % for the Core Bank
- – Cost income ratio of 70 %
- – Common Equity Tier 1 capital ratio of above 12.5 %
- – Leverage ratio (fully loaded) of ~4.5 %
Financial Targets for 2025
- – Post-tax Return on Average Tangible Equity of above 10 % for the Group
- – Compounded annual growth rate of revenues from 2021 to 2025 of 3.5 to 4.5 %
- – Cost income ratio of less than 62.5 %
Our financial and regulatory targets are based on our financial results prepared in accordance with the International Financial Reporting Standards (“IFRS”) as issued by the International Accounting Standards Board (“IASB”) and endorsed by the European Union (“EU”). For further details, please refer to the section ‘Basis of preparation/impact of changes in accounting principles’ in this report.
|
57
|
|
|
Deutsche Bank
|
Signatures
|
|
|
Annual Report 2021 on Form 20-F
|
Change in Internal Control over Financial Reporting
|
|
|
|
|
The COVID-19 pandemic and its remaining impact on the global economy as well as the Russian military action against the Ukraine may affect our ability to meet our financial targets, as its ultimate impact remains impossible to predict.
Until the first quarter of 2021, the Group had included an additional target for adjusted costs excluding transformation charges in 2022 of € 16.7 billion. Since we adopted our transformation program in 2019, significant progress has been made by the Group, and consequently our goal of achieving sustainable profitability is closer. Given the variability of revenue growth as macroeconomic forces accelerate or slow our progress, in the third quarter 2021 we announced that we believe it is more appropriate to focus on a relative measure of costs in targeting a strong and sustainable margin. Therefore as of the second quarter of 2021, management measures the Group’s cost efficiency using the cost/income ratio (CIR). The primary cost target for the Group is the CIR and a quantitative absolute cost target will no longer be published.
Adjusted costs, adjusted costs excluding transformation charges, Post-tax Return on Average Tangible Equity as well as Leverage ratio (fully loaded) are non-GAAP financial measures. Please refer to “Supplementary Information (Unaudited): Non-GAAP Financial Measures” of this report for the definitions of such measures and reconciliations to the IFRS measures on which they are based.
Our Businesses
This section should be read in conjunction with the section Deutsche Bank: Our Organization in the Operating and Financial Review in the Annual Report 2021.
Corporate Bank
Corporate banking is an integral part of our business. Firstly, our capabilities in Cash Management, Trade Finance and Lending, as well as Foreign Exchange, the latter delivered in close collaboration with the Investment Bank, enable us to serve core needs of our corporate clients. As a leading bank serving multinational and German corporates domestically and abroad, we help clients in optimizing their working capital and liquidity, securing global supply chains and distribution channels and managing their risks. Secondly, we act as a specialized provider of services to Financial Institutions, offering Correspondent Banking, Trust and Agency and Securities Services. Finally, we provide business banking services to approximately 800,000 clients in Germany, covering small corporates and entrepreneur clients and offering a largely standardized product suite.
We have defined a number of specific initiatives to capitalize on our core competencies across these different areas and grow our revenues to achieve our targets.
In 2021, the Corporate Bank continued to make progress on its strategic objectives. By the end of the year we generated € 364 million of revenues from deposit re-pricing, bringing the total amount of deposits under charging agreements to € 101 billion. We continued growing our business with platforms, FinTechs and eCommerce payment providers with new mandates and clients. We launched our first Merchant Solutions products and started collaborating on our joint venture with Fiserv, a leading global provider of payments and financial services technology, announced in the second quarter of 2021. In the third quarter of 2021, we acquired Better Payment Germany GmbH, a payment service provider based in Berlin to expand our product range and increase market share in payment processing and acceptance. Finally, we have focused on continuously scaling-up the ESG-related transition dialogue with our clients and our engagements with external ESG stakeholders in various industry initiatives.
We continue working towards our strategic ambitions. Firstly, we intend to re-price further deposits, both in our Cash Management franchise and with domestic German corporate clients, in order to offset the impact of negative interest rates in Europe. Implementation of deposit charging agreements is materially within our control and relies on our disciplined execution as evidenced by our progress to date. We also aim to offer a full suite of advisory and financing solutions for corporate treasurers. We intend to continue to expand our lending proposition with corporate clients across all regions. Building on 2021 achievements, our initiatives also include further growth of our business with platforms, FinTechs and eCommerce payment providers. Parts of corporate banking, especially payments, are experiencing a high degree of innovation and disruption driven by high-paced technology developments and the emergence of new competitors. In 2022, we expect to benefit from our targeted investments in new growth areas, including Merchant Solutions and Asset as a Service, and where we see market opportunity and believe to have a competitive advantage. As we grow our business with clients globally, we commit to applying sound risk management principles in order to maintain the high quality of our loan portfolio and strict lending standards.
|
58
|
|
|
Deutsche Bank
|
Signatures
|
|
|
Annual Report 2021 on Form 20-F
|
Change in Internal Control over Financial Reporting
|
|
|
|
|
We also aim to further advance our provision of sustainable financing solutions for our clients. In 2021, we expanded our sustainable finance product offering via inclusion of sustainability factors in cash management and supply chain finance products, established ongoing knowledge-sharing formats and continued to address ESG topics in client dialogue. Furthermore, we also began developing scalable ESG solutions for our Business Banking clients that we expect to introduce in 2022.
Looking ahead, we expect the Corporate Bank to act as an integral part of our Global Hausbank. We see growth opportunities across all of our core client groups (Corporate, Institutional, Business Banking) from existing CB strengths and new products. Equally we see further potential to reduce our cost base from technology and front-to-back process optimization, as well as automation and location strategy.
Initiatives will target revenue growth with corporate clients across cash management and payments, growing our fee-based business with institutional clients and expand lending. Our ambition is to become a leader in ESG and drive the transition to a sustainable economy by supporting our corporate clients globally. Additionally we expect that our investments into new products enabling new business models of the real economy, like merchant solutions and Assets-as-a-Service, will contribute to future sustainable growth.
Investment Bank
The Investment Bank (IB) remains core to our business. Across Origination and Advisory (OA) and Fixed Income and Sales and Trading (FIC), corporate and institutional clients are able to access a comprehensive range of services, encompassing advisory, debt and equity issuance, financing, market making / liquidity provision and risk management solutions. The division regionally encompasses EMEA, Americas and APAC, with a strategy that is focused upon operating in areas of competitive strength.
In 2021, the Investment Bank (IB) continued with the implementation of the strategy outlined in our Investor presentations in 2019 and 2020. The key priorities of delivering sustainable revenue growth; client franchise improvements; and reduction of the cost base are unchanged. In each of these areas the IB successfully delivered tangible results.
Eight quarters of year-on-year revenue growth in OA, continued strength across our financing business and the targeted transformation of our FIC Flow platform resulted in 4 % revenue growth versus a strong 2020.
This reflected the strength of the client franchise;
in OA we grew our market share with our priority clients by 110 basis points (Source: Dealogic), whilst in FIC our institutional client group saw a 17 % increase in client revenue credits versus 2019. Our new client coverage model in EMEA, combined with investment into our flow business also contributed to gains in market share in our electronic franchise across Rates products, Credit bonds and FX businesses. Clients recognize the strength of our offering and turn to us for a full range of risk management services, increasingly encompassing ESG related activity
The successful execution of the IB’s strategy since 2019 has created a well-positioned business. Our unique platform focuses on areas of competitive strength and we are able to demonstrate the benefit of businesses that operate across the value chain. The Investment Bank aims to remain consistent and disciplined in its strategy execution. This will allow us to defend and consolidate our strong market position. We expect to maintain the level of client intensity along with focused investments into growth of specific areas of the business. Within our Fixed Income franchise, further enhancements will be made to our flow businesses, expansion of our financing capability and the development of technology-led innovative client solutions as part of our risk management offering. Within OA, targeted investment will be made through pursuing growth opportunities via investment into the coverage of key targeted sectors with a focus upon building our Mergers Acquisitions business.
Finally, ESG remains a priority across all our business lines. We are top 5 ranked origination house for debt related ESG products (Source: Dealogic) and have developed a number of market-first funding and investment solutions for clients. In 2021, we partnered with several global clients to support their issuance of Sustainability Linked Bonds, helping them raise well over € 150 billion of funding in sustainable bond instruments. Deutsche Bank acted as joint bookrunner on the inaugural € 12 billion green bond transaction issued under the EU’s Next Generation program.
Private Bank
Private Bank (PB), operating through the two distinct business units of Private Bank Germany (PB GY) and the International Private Bank (IPB), covers private, wealth and commercial clients across more than 60 countries.
PB GY is Germany’s leading retail bank with two complementary brands, Deutsche Bank and Postbank. We target clients seeking advisory solutions with Deutsche Bank offerings and those looking for convenience through the Postbank offerings. In cooperation with Deutsche Post DHL AG, we also offer postal and parcel services in the Postbank branches. Within PB GY, the transformation is well on track. In 2021, we successfully continued our strategic initiatives and grew our operating business, specifically in investment and lending products. Going forward, PB GY plans to conclude the consolidation of Deutsche Bank and Postbank IT infrastructure and to realize efficiencies in operations.
|
59
|
|
|
Deutsche Bank
|
Signatures
|
|
|
Annual Report 2021 on Form 20-F
|
Change in Internal Control over Financial Reporting
|
|
|
|
|
We also aim to further optimize our distribution network by reducing the branch network and self-service infrastructure. We intend to invest into data-enabled sales channels and B2B2C growth strategies while strengthening our consumer finance business. At the same time we aim to build on our market-leading advisory proposition to drive growth in Insurance and Investment products. To meet the changing advisory-demands of our clients, PB GY is implementing new branch formats and remote banking facilities. In order to support the growing demand for ESG compliant products and respective advisory, a dedicated sustainability-focused branch format will be rolled out further.
The IPB has a diversified business mix. Our core scalable business is in continental Europe but we also have a fast growing presence in Asia and the Middle East and we operate a specialized ultra-high-net-worth (U/HNW) franchise in the United States. Under IPB’s Personal Banking segment, we serve around three million clients, primarily in Italy and Spain. IPB’s vision is to be the house of choice for family entrepreneurs globally. Our approach to holistically cover these clients’ private and commercial needs with a one stop solution is a competitive differentiator. We have launched the dedicated “Bank for Entrepreneurs” proposition in 2021 in Italy and Spain and look to extend it to further markets in the future. An important element of this strategy is for IPB to be a preferred investment partner for sophisticated U/HNW families globally. In 2021, we have significantly invested to strengthen our relationship coverage and product capabilities to capture the attractive growth opportunities in this segment. Adding to this strategy is our plan to become a Premium Bank for Affluent clients. We are transforming our Personal Banking franchise towards a model that is tailored towards the needs of the affluent segment. In a first step, we signed an agreement to sell Deutsche Bank Financial Advisors network and continued to optimize our branch network in 2021. We will continue to invest in our product capabilities, key markets, digitization and completing the transformation of our Personal Banking franchise through optimizing our network and channel capabilities.
In 2021, the Private Bank continued to build on the sustainability foundations laid in the previous year, through the development of a framework for classification of investment products (complementing the Group-level Sustainable Finance Framework published in 2020). At the first Sustainability Deep Dive in May 2021, the division committed to provide their private, wealth and commercial clients with suitable ESG-compliant financial products and solutions.
Asset Management
We are a leading asset manager with € 928 billion in assets under management as of December 31, 2021. With approximately 4,200 employees operating globally, we provide a range of traditional and alternative investment capabilities to clients worldwide. Our investment offerings span all major asset classes including equity, fixed income, cash and multi asset as well as alternative and passive investments. Our product offerings are distributed through our global distribution network, while also leveraging third party distribution channels. We serve a diverse base of retail and institutional investors worldwide, with a strong presence in our home market in Germany. Our clients include government institutions, corporations and foundations as well as millions of individual investors.
The asset management industry is evolving, with intensified competition, continued margin pressure, and technological disruption amid heightened geopolitical tensions and increased market volatility. However, we believe our diverse range of high-quality products and investment solutions provides us with a strong basis for growing assets and profitability - regardless of the market in which we operate. Since our initial public offering (IPO) in March 2018, we have focused on a strategic and organizational refinement, improving net flows and increased efficiency. We prioritized the adjusted cost-income ratio target within the first phase of our corporate journey to ensure that we are able to generate maximum shareholder value regardless of the environment in which we operate. Entering the second phase of our corporate journey, we intend to focus on our ambitions to transform, grow and lead in order to become a leading European asset manager with global reach.
Firstly, as part of our transformation ambition, we aim to adapt the way we work to meet the industry challenges of the decade ahead of us. We want to achieve this by recalibrating our core platform and policy framework so that these are tailored to DWS’s fiduciary business and clients. We are also investing in new technology and, following the launch of our Functional Role Framework, we are further strengthening the culture of our organization. Secondly, our ambition to grow concentrates on delivering focused product strategies in targeted growth markets, expanding our range of sustainable investment solutions and leveraging existing partnerships to capture new client opportunities, especially in Asia Pacific where we see strong growth. In addition, we will seek to play an active role in mergers and acquisitions (MA). We will monitor the market for selective bolt-on opportunities to grow in priority areas as well as transformational opportunities in order to participate in the continued consolidation we expect in the asset management industry. Thirdly, it is our ambition to achieve differentiated leadership across ESG, passive and high margin investments and solutions. By delivering on these ambitions, we can reach our overall goal of becoming a leading European asset manager with global reach.
At the start of 2021, DWS refined the medium-term financial targets for 2024 as part of a broader review of priorities and initiatives. These targets are a sustainable, adjusted cost-income ratio of 60 % and a net flow rate of greater than 4 % of the beginning of the period assets under management on average over the medium term.
|
60
|
|
|
Deutsche Bank
|
Signatures
|
|
|
Annual Report 2021 on Form 20-F
|
Change in Internal Control over Financial Reporting
|
|
|
|
|
In 2021, we continued to increase our focus on the targeted asset classes of Passive, Active Multi-Asset and Alternatives. As part of our regional strategy, we aim to focus on developing and nurturing strategic partnerships which have been a driver of our strong market position in Germany and in Europe. In Asia, we are continuing to deepen the relationships with our partners Nippon Life and Harvest Fund Management and we are exploring new business opportunities in the region. We entered a long-term strategic partnership with BlackFin Capital Partners in the second half of 2021 to jointly evolve the digital investment platform into a platform ecosystem. Our aspiration is to deliver a best-in-class client experience and service. Our growth commitment into technology is further underlined by the acquisition of a minority stake in UK-based retirement technology company Smart Pension Limited.
Increasingly, governments and businesses around the globe have set ambitious targets in contributing towards a global net zero economy by 2050. DWS aims to become climate-neutral in its actions, in line with the Paris Agreement, by 2050 or sooner. Building on this long-term ambition and our signatory to the Net Zero Asset Managers Initiative (NZAM), climate action is a focus theme within our global sustainability strategy.
As we look to extend our view towards 2025 we intend to further grow our Asset Management franchise by building on platform scale with organic and inorganic opportunities - acquiring complementary strengths, distribution access and enlarging our geographical footprint. The strong underlying trend of assets shifting to Passive and to Alternatives provides areas for growth in several parts of our business. Delivery of our ESG capabilities to clients and further embedding ESG into the corporate DNA of DWS will be key to support our growth.
The Competitive Environment
The COVID-19 pandemic continued to set the scene for the global economy in 2021, with vaccine availability being the main difference from the previous year. As the initial pandemic wave receded, the affected economies recovered strongly in the course of 2021.
Nevertheless, global GDP growth in 2021 slightly weakened more than expected at the beginning of the year, largely due to a longer than anticipated drag from COVID-19 variants and supply chain disruptions. A partly disappointing performance in vaccine uptake and distribution somewhat dampened growth prospects while increasing inflation risk. At 6 %, global GDP growth in 2021 was still the highest since the global financial crisis more than a decade ago even though various economies experienced remarkable fluctuations in recovery momentum. In 2020 global GDP plunged by 3.1 %. Global inflation climbed to 4.1 % in 2021. In the developed countries, GDP grew by 5.1 % and consumer prices rose by 3.2 % in 2021, while GDP of emerging market economies increased by 6.6 % and inflation reached 4.6 % in 2021.
The Eurozone economies performed well especially after the wave of COVID-19 infections resulting from the Delta variant. However, conditions deteriorated in the second half of 2021 as supply constraints became headwinds and the Eurozone almost stagnated in the last quarter of 2021. Annual GDP expanded by 5.2 % and inflation accelerated to 2.6 % in 2021 from 0.3 % in 2020. The European Central Bank continued its support and its fiscal policy remained expansive. The German economy recovered during 2021 as GDP grew by 2.8 % after the easing of COVID-19 related restrictions and private consumption gained significant momentum. The industry benefited from strong global demand, but was unable to realize its recovery potential due to supply bottlenecks. Combined with temporary factors, the supply chain constraints and higher energy prices led to a significant increase in inflation. These factors contributed to a GDP contraction in the final quarter.
The U.S. economy recovered strongly in 2021 as GDP grew by 5.7 %. Massive fiscal stimulus, the introduction of vaccines and a strong labor market improvement supported domestic demand. However, persistent supply bottlenecks and the impact of COVID-19 constrained the recovery somewhat. Inflation picked up strongly during the year to an annual rate of 4.7 % from 1.2 % in 2020. The Federal Reserve’s monetary policy remained expansionary.
The recovery of the Japanese economy in 2021 was slower in comparison to other developed countries and was weaker than expected at the beginning of 2021. This development was due to the prolonged COVID-19 impact, the government's stringent response to the pandemic and increasing supply shortages of semiconductors and other products. The GDP grew by only 1.7 % in 2021. Inflation decelerated to -0.2 %, after stagnating in 2020. The Bank of Japan continued to maintain its accommodative stance.
Asia's economic recovery gained a strong 7.1 % growth in 2021, but was affected by weaker than expected GDP growth in certain economies in Asia and a more severe and prolonged COVID-19 impact. Over the course of 2021, growth performance became increasingly divergent, with the more advanced economies in Asia largely staying on their recovery path, while others faltered significantly. Inflation decelerated to 2.1 % in 2021 from 2.9 % in 2020.
|
61
|
|
|
Deutsche Bank
|
Signatures
|
|
|
Annual Report 2021 on Form 20-F
|
Change in Internal Control over Financial Reporting
|
|
|
|
|
China's economy experienced a dynamic start to 2021, with export demand being the main growth driver. As the year progressed, domestic demand was impacted by COVID-19 outbreaks and related measures, as well as strict enforcement of credit and regulatory discipline. The pressured real estate sector and energy shortages constrained the recovery. Nevertheless, Chinese economy expanded by 8.1 % in 2021. Inflation decelerated to 0.9 % in 2021 from 2.5 % in 2020.
2022 Outlook
The global economy entered 2022 with positive momentum, which is expected to continue moderately over the year ahead. Growth throughout 2022 will be supported by a combination of ongoing recovery from COVID-19 pandemic and fiscal stimulus programs. Global inflation is expected to increase noticeably in 2022. Central banks are expected to tighten monetary policy. Global GDP is expected to grow by 4.2 % in 2022. The global inflation rate is expected to pick up to 5.7 % from 4.1 % in 2021. For developed countries, GDP is expected to grow by 3.6 % and consumer prices to increase by 4.7 % in 2022 from 3.2 % in 2021. Economic growth in emerging markets is projected to reach 4.6 % in 2022, while inflation is expected to accelerate to 6.4 % from 4.6 % in 2021.
The Eurozone economy experienced a sluggish start to 2022 due to supply bottlenecks and surging energy prices. However, a significant growth rebound is expected from spring onwards, supported by a normalization of the pandemic situation due to high vaccination rates, pent-up demand, robust labor markets and impulses from the EU Recovery Fund. These factors are likely to prevent a stronger decline in inflation. The European Central Bank is expected to end net purchases under the Pandemic Emergency Purchase Program by the end of March 2022 and start to raise policy rates in the third quarter of 2022. GDP in 2022 is expected to grow by 3.8 %. Eurozone inflation is expected to increase to 4.7 %, from 2.6 % in 2021. The German economy is expected to see balanced growth of 4.0 % in 2022, driven by acceleration in the domestic and more externally driven sectors of the economy. After a weak start due to a renewed increase in COVID-19 infections, GDP growth is expected to pick up strongly during 2022. Robust labor market, pent-up demand and mitigating supply constraints should support growth momentum. In Germany, inflation is expected to remain elevated due to higher energy prices and likely recede only gradually in course of 2022. The government aims to increase public investment for digitization and the transition to carbon neutrality.
For the U.S. economy, consumer spending will continue to be the important driver of growth momentum in 2022. The economy is expected to expand by 3.6 %, supported by improved household finances due to excess savings, continued normalization of services spending and a recovery in car sales. The Government will provide further fiscal stimulus. With the labor market at full employment and inflation elevated, the Federal Reserve is expected to tighten its monetary policy stance and raise interest rates six times in 2022. U.S. inflation is expected to stay at 5.9 % in 2022, from 4.7 % in 2021. Recent geopolitical development could lead to significantly higher energy and commodity prices.
The Japanese economy is expected to accelerate by 2.3 % in 2022, supported by widespread vaccination, easing of supply chain constraints and the decline of the pandemic in Southeast Asia. The government and the Bank of Japan have become more aligned in coordinating policy. Inflation is expected to be at 1 % in 2022, after -0.2 % in 2021. The Bank of Japan is expected to maintain its accommodative stance while being mindful of policy spill overs.
The economic recovery in emerging markets is likely to slow down slightly in 2022, although the economies will continue to benefit from robust export demand and a recovery of the Chinese economy in particular. Emerging markets are expected to face several challenges in 2022 including the large gap in vaccination compared to developed economies, stickier inflation profiles, weaker growth and high foreign currency denominated debt.
Emerging market GDP is expected to expand by 4.6 % in 2022. Asian economies are expected to be supported by robust export growth and a recovery in domestic demand, GDP should grow by 5.5 %. Inflation in emerging markets is expected to accelerate to 6.4 % in 2022, from 4.6 % in 2021.
The Chinese economy is expected to regain momentum and a GDP growth of 5.1 % during the year as fiscal and monetary policy has become supportive again and the impact of COVID-19 is likely to ease in 2022. A recovery in growth is also expected depending on policy-supported green investment, a rebound in property sales and easing supply constraints. Inflation is expected to pick up, especially in the second half of the year. The inflation rate is forecasted to accelerate to 2.3 % in 2022 from 0.9 % in 2021. The People's Bank of China is likely to actively promote lending for green investment projects and ensure sufficient lending to the real estate sector.
|
62
|
|
|
Deutsche Bank
|
Signatures
|
|
|
Annual Report 2021 on Form 20-F
|
Change in Internal Control over Financial Reporting
|
|
|
|
|
There are a number of risks to our global economic outlook. Ongoing challenges from COVID-19 due to more severe variants or less effective vaccines could considerably dampen economic momentum. Growing government debt burdens could also impact the broader Eurozone economy. If inflation fails to recede, it will lead central banks to a more aggressive tightening stance, causing a sharply negative reaction in financial markets and most likely a significant economic recession. Trade tensions could negatively impact the global economic outlook. Additionally, rising geopolitical tensions could create further uncertainty. On February 24, 2022, Russia commenced large-scale military action against Ukraine. In response to the Russian military action against Ukraine, the West has moved to impose broad-based sanctions targeting Russia, including but not limited to major Russian banks, certain other companies, Russian parliament members and certain members of the Russian elite and their families but also banning primary / secondary trading of sovereign debt and other select securities. The heightened risk of sanctions, including potential Russian countermeasures, has been considered in our portfolio strategy. We are monitoring the developments closely and utilizing dedicated governance structures including Global and Regional Crisis Management as and when required.
Competitor Landscape
Against this backdrop, Deutsche Bank competes in the financial services sector with a spectrum of competitors, who include other universal banks, commercial banks, savings banks and other public sector banks, broker dealers, investment banking firms, asset management firms, private banks, investment advisors, payments services providers, financial technology firms and insurance companies. Some of the competitors are global like Deutsche Bank, while others have a regional, product or niche client footprint. Deutsche Bank competes on a number of factors, including the quality of client relationships, transaction execution, products and services, innovation, reputation and price.
The profitability of the European banking industry rebounded significantly in 2021 and may have reached the highest level since the financial crisis. Loan loss provisions fell to near their lowest level in a decade and a half, and healthy growth in fee and commission income as well as trading income more than outweighed the continuing moderate contraction in net interest income. Administrative expenses rose slightly. In the Euro area, trends in corporate lending and private-sector deposit-taking normalized, with them expanding at about pre-crisis rates. Household loans, on the other hand, picked up further momentum, driven by mortgages. Liquidity holdings at central banks have reached staggering heights. In corporate finance, European banks on aggregate lost further market share to the U.S. competitors.
The performance of the global banking industry could improve further in 2022, subject to the COVID-19 pandemic subsiding and supply shortages in many industries receding. In Europe, revenues should benefit from the European Central Bank’s (ECB) gradual exit from its crisis tools, particularly the trimming of asset purchases in the context of Quantitative Easing and potential signals of looming higher interest rates. Likewise, stronger private consumption as well as sustained robust government spending and corporate investment may have a positive impact on bank revenues. On the flip side, the most favorable funding conditions under the ECB’s TLTRO III program will expire. In the U.S., net interest income could receive a boost from several rate hikes by the Federal Reserve, similar to the beginning of the last cycle in 2015/16. At least initially, the prospect of higher rates could also stimulate credit demand, both with respect to loans and corporate bonds. In most of Asia, banks could also benefit from rising interest rates and therefore margins as well as from a recovery in domestic consumption. In China, the picture is probably going to be more mixed, with a drag from a moderate easing of monetary policy, but tailwinds from fiscal expansion and a pickup in overall economic growth.
In our home market, Germany, the retail banking market remains fragmented and our competitive environment is influenced by the three pillar system of private banks, public banks and cooperative banks. Competitive intensity has increased in recent years following some consolidation activity, particularly among public regional banks (Landesbanken) and private banks, and increased activity levels from foreign players.
Looking at the wider banking ecosystem, the evolution of financial technology firms remains as much an opportunity as a challenge for banks. While we see the risk of banking disruption primarily through big technology companies and in select product areas, particularly the unregulated segments, some banks have also taken the opportunity to selectively partner with financial technology firms and leverage their solutions to become more efficient and/or develop differentiated delivery channels for end clients.
Regulatory Environment
The flow of new legislative proposals under the post-crisis global regulatory reform agenda gained new traction, with a drive to implement and review previous reforms, while there are fewer regulatory measures to support banks and the economy during COVID-19,
as recovery started.
|
63
|
|
|
Deutsche Bank
|
Signatures
|
|
|
Annual Report 2021 on Form 20-F
|
Change in Internal Control over Financial Reporting
|
|
|
|
|
In particular, during 2021, a number of international developments in the area of banking regulation and supervision have been implemented and will continue to be further refined, in particular with a view to strengthening international standards to create financially resilient institutions and ensuring the resolvability of banks. At the same time, authorities wound down or announced the expiry of temporary measures to provide regulatory relief from COVID-19 effects. In addition to “traditional” banking regulation and supervision, environmental, social and governance matters have become a new legislative focus that will also affects banks as these rules are being implemented and further developed.
Capital, liquidity and leverage requirements – In 2021 and early 2022, measures to provide temporary relief to banks and the economy, including on capital requirements, liquidity and reporting, as well as exemptions from leverage exposure requirements, were either wound down or their expiry was announced. In particular, on February 10, 2022, the European Central Bank (“ECB”, our principal regulator) confirmed that the temporary relief from the leverage ratio requirement would expire in March 2022 and that it expects banks to resume operating with capital levels above the ECB’s Pillar 2 guidance from January 1, 2023. Also, on December 17, 2021, the ECB announced that it expects banks to operate again with a liquidity coverage ratio of above 100 % as from January 1, 2022. Further, effective as of February 1, 2022, the German Federal Financial Supervisory Authority (
Bundesanstalt für Finanzdienstleistungsaufsicht
(“BaFin“)) set the amount of the countercyclical capital buffer (“CCyB”) for banks in Germany at 0.75 % of their total risk exposure amount. Banks have to comply with the new CCyB requirement from February 1, 2023.
On October 27, 2021, the European Commission published a comprehensive package of reforms with respect to the European Union banking rules (referred to as the “Banking Package 2021”) to ensure that banks become more resilient to potential future economic shocks while contributing to the EU’s recovery from the COVID-19 pandemic and its transition to climate neutrality. The proposals aim to amend the Capital Requirements Regulation (“CRR”), the Capital Requirements Directive (“CRD”) and the Bank Recovery and Resolution Directive (“BRRD”). If adopted, the proposals to amendment the CRR and CRD (commonly referred to as “CRR III” and “CRD VI”) will, in particular, finalize the implementation of the Basel 3 framework in the European Union and also fully implement the market risk capital changes in the Fundamental Review of the Trading Book (“FRTB”). Another separate proposal entails combined amendments to the CRR and the BRRD with respect to the resolution regime.
CRR III and CRD VI include, inter alia, a gradually introduced output floor establishing minimum risk weight assets that will ultimately be set at 72.5 % of the risk weight assets calculated under the standardized approach, changes to standardized and internal ratings-based approaches for determining credit risk, changes to the credit valuation adjustment, a revision of the approaches for operational risks and reforms to the market risk framework as set out in the FRTB, adjustments to the Pillar 2 requirements (“P2R”) and the systemic risk buffer and a “fit-and-proper” set of rules for senior staff managing banks. Other proposed measures are aimed to address sustainability risks by requiring banks to identify, disclose and manage environmental, social and governance risks as part of their risk management which includes regular climate stress testing by the banks’ supervisors. The proposal does not entail any adjustments to the capital requirements for green or brown assets. However, the European Commission stated that it is exploring this idea and has asked the European Banking Authority (“EBA”) to assess possible adjustments. It is expected that the EBA will provide its report in 2023.
The proposals regarding the resolution regime include clarifications with respect to some aspects of the total loss absorbing capacity (“TLAC”) / minimum requirement for own funds and eligible liabilities (“MREL”) regime in relation to single point of entry and multiple point of entry resolution strategies and, in particular, a deduction regime requiring intermediate parents to deduct from their own internal MREL capacity the amount of their holdings of internal MREL eligible instruments, including own funds, issued by their subsidiaries belonging to the same resolution group.
The Banking Package 2021 will now be negotiated with EU law-makers, i.e. the European Parliament and Member States. It is expected that CRR III and CRD VI will start entering into force in 2023 at the earliest with the new rules implementing Basel 3 to apply from January 1, 2025. The European Commission expects that the final implementation of the Basel 3 framework will lead to an increase in the capital requirements of European banks of less than 3 % on average at the beginning of the transitional period in 2025 and of less than 9 % at the end of such period in 2030.
The implementation of the remaining outstanding proposals under Basel 3 as contained in the Banking Package
2021 has the potential to increase our risk weight assets and will likely affect our business by raising our regulatory capital and liquidity requirements and by leading to increased costs.
The US and UK were planning to release proposals to implement such reforms as well, expected to be published in 2022.
|
64
|
|
|
Deutsche Bank
|
Signatures
|
|
|
Annual Report 2021 on Form 20-F
|
Change in Internal Control over Financial Reporting
|
|
|
|
|
Capital planning and stress testing – Due to the COVID-19 pandemic, the 2020 EU-wide stress test by the European Banking Authority (“EBA”) and the ECB took place in 2021. This test was designed to provide supervisors, banks and other market participants with a common analytical framework to compare and assess, the resilience of EU banks over a three-year horizon under both a baseline and an adverse scenario, which is characterized by severe shocks taking into account the impact of the pandemic. The results were published on July 30, 2021.
The stress test was conducted on a sample of 50 EU banks, including Deutsche Bank. In line with the previous exercises, this exercise did not include a pass-fail threshold as the results of the exercise are designed to serve as an input to the supervisory review and evaluation process (or “SREP”) discussed in greater detail under “Regulation and Supervision – Supervisory Review and Evaluation Process” below. The next EU-wide stress test will be carried out in 2023.
DB USA Corporation and DWS USA Corporation are each subject, on an annual basis, to the Federal Reserve Board’s supervisory stress testing and capital requirements. DB USA Corporation and DWS USA Corporation are also subject to the Federal Reserve’s Comprehensive Capital Analysis and Review (“CCAR”), which is an annual supervisory exercise that assesses the capital positions and planning practices of large bank holding companies and IHCs. On June 24, 2021, the Federal Reserve Board publicly released the results of its annual supervisory stress test, which showed that DB USA Corporation and DWS USA Corporation would continue to have capital levels above minimum requirements even under the stress test’s severely adverse scenario. DB USA Corporation and DWS USA Corporation submitted their annual capital plans in April 2021 and will make their next capital plan submissions to the Federal Reserve Board in April 2022. On August 5, 2021, the Federal Reserve Board announced a stress capital buffer (an “SCB”) for each CCAR firm based on 2021 supervisory stress testing results, which for DB USA Corporation was 4.5 % and for DWS USA Corporation was 7.2 %. This SCB became effective October 1, 2021 and would generally remain in effect until September 30, 2022, at which point the size of the SCB for each of our IHCs will be recalibrated based on the results of the 2022 stress tests, which are expected to be released in June 2022.
Recovery and resolution – The major jurisdictions where we have significant group operations have now finalized the implementation of the FSB’s Key Attributes for Effective Resolution Regimes. Under the European Union’s Single Resolution Mechanism (“SRM”), to which we are subject, competent authorities have far-reaching powers to impose resolution measures upon banks that are deemed to be failing or likely to fail. Resolution measures, in particular, include the power to reduce, including to zero, the nominal value of shares, or to cancel shares outright, and to write down certain eligible subordinated and unsubordinated unsecured liabilities, including to zero, or convert them into equity (commonly referred to as “bail in”). To ensure sufficient availability of liabilities with loss-absorbing capacity that could be bailed in, banks in the European Union must meet, or will have to meet, certain minimum requirements such as TLAC or MREL.
For a bank directly supervised by the ECB, such as Deutsche Bank, the Single Resolution Board (“SRB”) draws up the resolution plan, assesses the bank’s resolvability and may require legal and operational changes to the bank’s structure to ensure its resolvability.
In the United States, Deutsche Bank AG is required under Title I of the Dodd-Frank Wall Street Reform and Consumer Protection Act (the “Dodd-Frank Act”), as amended, to prepare and submit to the Federal Reserve Board and the Federal Deposit Insurance Corporation (“FDIC”) either a full or targeted resolution plan (the “U.S. Resolution Plan”) on a timeline prescribed by such agencies. The U.S. Resolution Plan must demonstrate that Deutsche Bank AG has the ability to execute and implement a strategy for the orderly resolution of its designated material U.S. entities and operations. For foreign-based companies subject to these resolution planning requirements such as Deutsche Bank AG, the U.S. Resolution Plan relates only to subsidiaries, branches, agencies and businesses that are domiciled in or whose activities are carried out in whole or in material part in the United States.
Deutsche Bank AG filed its most recent U.S. Resolution Plan in December 2021 and is currently awaiting written regulatory feedback. This targeted resolution plan submission provides detailed information on our U.S. Resolution Strategy, our resolution capabilities in the U.S., material changes made to our U.S. Resolution Plan since the last full submission in 2018, as well as certain additional information. Deutsche Bank’s next full U.S. Resolution Plan is due in 2024.
|
65
|
|
|
Deutsche Bank
|
Signatures
|
|
|
Annual Report 2021 on Form 20-F
|
Change in Internal Control over Financial Reporting
|
|
|
|
|
Loss-absorbing capacity – Following the FSB’s final term sheet on TLAC in November 2015, several jurisdictions have started to implement the TLAC standard in their regulatory frameworks. The TLAC standard is designed to ensure that global systemically important banks (“G-SIBs”), such as Deutsche Bank, maintain enough capital and long-term debt instruments that can be effectively bailed-in to absorb losses and recapitalize the bank. The EU has already implemented the FSB’s TLAC standard for G-SIBs by introducing a “Pillar 1” MREL for global systemically important institutions (“G-SIIs”, the European equivalent term for G-SIBs). This requirement is based on both risk-based and non-risk-based denominators and is set at the higher of 18 % of total risk exposure and 6.75 % of the leverage ratio exposure measure. It can be met with Tier 1 or Tier 2 capital or debt that meets specific eligibility criteria. In addition, the competent authorities will have the ability to impose a TLAC add-on requirement on G-SIIs. The European Commission’s legislative proposals of October 27, 2021 include clarifications with respect to some aspects of the TLAC / MREL regime in relation to single point of entry and multiple point of entry resolution strategies and, in particular, a deduction regime requiring intermediate parents to deduct from their own internal MREL capacity the amount of their holdings of internal MREL eligible instruments, including own funds, issued by their subsidiaries belonging to the same resolution group. We also are subject to TLAC requirements in other jurisdictions. For example, the Federal Reserve Board’s rules implementing the TLAC standard in the United States are effective as of January 2019, with TLAC requirements that apply to U.S. intermediate holding companies (such as ours) of non-U.S. G-SIBs. These rules include a minimum TLAC requirement and TLAC buffer, a minimum long-term debt requirement and clean holding company requirements.
Central Counterparties – On February 8, 2022, the European Commission published the extension of their temporary equivalence decision for UK Central Counterparties to June 30, 2025. During the next three years until the expiry of the temporary equivalence decision, the European Commission will continue to focus on measures to channel clearing services in EUR-denominated products to EU Central Counterparties by making them more competitive and cost efficient and by strengthening EU-level supervision. Furthermore, the existing transition period for third-country CCPs which allows them to be classified as qualifying CCPs for capital allocation purposes without a formal equivalence decision by the European Commission and recognition by the European Securities and Markets Authority, the European securities regulator, will expire on June 28, 2022 and is not expected to be extended. Depending on the status of these decisions and potential mitigating actions, these changes can have a negative impact on Deutsche Bank’s regulatory capital and increase operating costs.
Capital Markets Union - On November 25, 2021 the European Commission published four legislative proposals to further the aims of the Capital Markets Union (“CMU”) as set out in the 2020 CMU Action Plan, including proposals on the Markets in Financial Instruments Regulation and Directive (MiFIR and MiFID). The other proposals include amendments to the Alternative Investment Fund Managers Directive (AIFMD), the European Long-Term Investment Fund (ELTIF) Regulation, and a regulation to set up the so-called European Single Access Point (“ESAP”). Key elements of the proposals focus on supporting the market making abilities of European banks, in particular, by granting them access to UK derivatives trading venues, enhancing the framework for a Consolidated Tape (CT) for aggregated trade information across all execution venues in the EU, and developing an ESAP so that investors can access financial and sustainability-related information in one place. The impact of the proposals will depend on their final calibration, as the package will now be negotiated by EU Member States and European Parliament. Further proposals in connection with the CMU are expected for the second half of 2022, including a legislative proposal to improve the framework for public listings of companies in the EU.
Benchmarks – Ahead of the cessation of LIBOR for certain currencies in end-2021, regulators have concentrated efforts on speeding up the transition from interbank offered rates (IBORs) to risk free rates (RFRs), developing “tough legacy” solutions, and finalizing proposals and authorities’ powers to implement replacement rates in their respective jurisdictions. In the EU, amendments to the Benchmarks Regulation included the creation of new powers for the European Commission to designate statutory replacement rates, as well as an extension of the transition period for the third country benchmarks regime until the end of 2023. The European Commission has since exercised its new powers in October 2021, designating SARON compounded in arrears and ESTR plus 8.5 basis points as the statutory replacement rates for CHF LIBOR and EONIA, respectively. The statutory replacement rates entered into force on January 3, 2022. The European Commission is expected to designate statutory replacement rates for GBP and JPY LIBOR and the UK intends to publish synthetic rates for such rates in the first quarter of 2022.
The UK Financial Conduct Authority (FCA) received new powers to mandate the publication of synthetic versions of LIBOR under the Critical Benchmarks (References and Administrators’ Liability) Act which was finalized in December 2021. The Act is intended to ensure that the FCA can provide continuity for certain LIBOR rates, ensuring that parties to contracts which could not be transitioned to an RFR before the end of 2021 are able to continue to apply LIBOR to their contracts.
In the U.S., the Adjustable Interest Rate (LIBOR) Act proposed at the federal level is intended to ensure a smooth transition for contracts which do not have adequate fallback rates. This legislation has been passed by the House of Representatives and is before the Senate Banking Committee.
|
66
|
|
|
Deutsche Bank
|
Signatures
|
|
|
Annual Report 2021 on Form 20-F
|
Change in Internal Control over Financial Reporting
|
|
|
|
|
Digital Transformation – Several jurisdictions progressed initiatives in 2021 to both address risks and capitalize on the benefits associated with the digitalization of financial services. The Basel Committee on Banking Supervision also consulted on this area. Work in this area is expected to continue in 2022 with a focus on data protection, e-privacy, cybersecurity, operational resilience and capital treatment of crypto-assets.
On September 24, 2020, the European Commission published its Digital Finance Strategy, which outlined regulatory priorities and policy actions through 2024. The strategy was published alongside legislative proposals to strengthen and harmonize financial sector operational resilience requirements (proposal for a Digital Operational Resilience Act (“DORA”) and a complementing amending directive) and to establish a regulatory framework for crypto-assets (proposals for regulations on markets in crypto-assets (MiCA) and on a pilot regime for market infrastructures based on distributed ledger technology (“DLT Regulation”)). The Digital Services Act (“DSA”) and Digital Markets Act (“DMA”) proposals followed on December 15, 2020. The DSA and the DMA focus on protecting fundamental rights of all users of digital services and establishing a level playing field for businesses and consumers with regards to online platforms. On December 16, 2020, the EU published a new Cybersecurity Strategy which was accompanied by a new draft directive on the resilience of critical entities (CER Directive) and a proposal for a revised directive on measures for high common level of cybersecurity across the Union (NIS 2). The proposals aim at adapting online and offline security requirements in response to growing interconnectedness and digitalization.
The legislative process on the DLT Regulation, DORA and its complementing directive, the DSA and the DMA made considerable progress during 2021 and their final texts may be adopted in 2022.
Work by UK and U.S. authorities focused primarily on putting in place a stronger regulatory framework to promote operational resilience of firms and financial market infrastructures. In the UK, the Bank of England, the Prudential Regulatory Authority, and the FCA progressed its December 2019 policy proposals which update requirements for the financial sector and introduce operational resilience into the UK prudential framework. The final UK policy was published on March 29, 2021. In the U.S., the Federal Reserve Board, the FDIC, and the Office of the Comptroller of the Currency released a paper on October 30, 2020 applicable to certain large U.S. domestic banks, which provides guidance on sound practices designed to help banks increase operational resilience for their critical operations and core business lines. At the international level, the Basel Committee for Banking Supervision (BCBS) published on August 6, 2020 two linked principles documents related to operational resilience and the management of operational risk to help banks enhance their ability to withstand, adapt and recover from operational risk-related events in order to mitigate potential severe adverse impact.
Anti-Money Laundering and Other Financial Crime – On June 20, 2021, the European Commission published a new anti-money laundering (“AML”) and countering the financing of terrorism legislative package (referred to as the “AML/CFT Package”). The key element of the AML/CFT Package is the establishment of an integrated European AML supervisory system closely involving national supervisors and the newly to be established EU AML Authority (“AMLA”) as well as the creation of a unified AML/CFT regulatory framework which includes directly applicable AML/CFT rules and requirements throughout the EU (so called single EU rulebook). Once the package is implemented, AMLA will directly supervise a small number of cross-border financial sector entities in the highest risk category, facilitate cooperation among financial intelligence units and coordinate national authorities. The single rulebook expands the list of obliged entities and includes harmonized, more detailed and granular rules, inter alia, in the area of customer due diligence, beneficial ownership, and AML/CFT risk management. According to the European Commission’s plans, AMLA will be established in 2023 and start most of its activities in 2024. The direct supervision of certain financial entities is expected to commence in 2026. The full rulebook including new technical standards to be prepared by AMLA is expected to be in place and apply by the end of 2025.
Environmental, Social, and Governance – In April 2021, the European Commission published a proposal for a Corporate Sustainability Reporting Directive (“CSRD”) which would amend the existing reporting requirements under the Non-Financial Reporting Directive (“NFRD”). The proposal extends the scope of companies which have to report non-financial information, introduces more detailed reporting requirements following mandatory sustainability reporting standards and requires the reported information to be audited. The CSRD proposal is currently in the legislative process and might apply to financial years starting from January 1, 2023. Also, the Sustainable Finance Disclosure Regulation (“SFDR”) that introduced sustainability disclosure obligations for manufacturers of financial products and financial advisers towards end-investors is now in full force. The regulation’s disclosure obligations also apply with regard to adverse impacts on sustainability matters at the entity and the financial products levels. The European Commission is expected to adopt a delegated act on regulatory technical standards under the SFDR in 2022 that will apply from January 1, 2023.
Further, on July 6, 2021, the European Commission published its renewed sustainable finance strategy that builds on its 2018 action plan on financing sustainable growth. The new strategy aims to support the financing of the transition to a sustainable economy by proposing action in four areas: transition finance, inclusiveness, resilience and contribution of the financial system, and global ambition. In this context, the Commission also published a draft for a regulation on a European Green Bond Standard (“EuGBS”) that goes back to the 2018 action plan and the European Green Deal. The proposed EuGBS will create a high-quality voluntary standard for bonds financing EU taxonomy-aligned sustainable investments. The EuGBS is currently in the legislative process and expected to enter into force in 2023.
|
67
|
|
|
Deutsche Bank
|
Signatures
|
|
|
Annual Report 2021 on Form 20-F
|
Change in Internal Control over Financial Reporting
|
|
|
|
|
In December 2021, the Commission’s delegated regulation supplementing Article 8 of the Taxonomy Regulation (“Article 8 Disclosures Delegated Act”) entered into force. The Article 8 Disclosures Delegated Act specifies the content, methodology and presentation of disclosure required in accordance with Article 8 of the Taxonomy Regulation with respect to (non-)financial undertakings in the scope of the NFRD (and, once in force, the CSRD). The act generally requires financial institutions to disclose the share of environmentally sustainable economic activities in the total assets they finance or invest in.
The Article 8 Disclosures Delegated Act started to apply from January 1, 2022 on a phased basis. Until December 31, 2023, a limited disclosure regime applies to financial institutions requiring them to disclose qualitative information and information on the proportion of taxonomy-eligible activities in relation to total activities. More detailed reporting requirements will apply from January 1, 2024. The Article 8 Disclosures Delegated Act interrelates with the EU Taxonomy Climate Delegated Act which provides technical screening criteria to classify assets or activities as “green” and that entered into force on January 1, 2022. On February 2, 2022, the European Commission presented a not yet adopted Taxonomy Complementary Climate Delegated Act that is expected to apply from January 1, 2023. The act will amend the EU Taxonomy Climate Delegated Act and introduce conditions subject to which certain nuclear and gas activities can qualify as activities that qualify as contributing substantially to climate change mitigation (i.e., as a transitional activity) within the meaning of the EU taxonomy. In addition, the Taxonomy Complementary Climate Delegated Act will amend the Article 8 Disclosures Delegated Act by introducing specific disclosure requirements associated with natural gas and nuclear energy activities. The EU taxonomy remains under further development.
In Germany, the Act on Corporate Due Diligence in Supply Chains (Lieferkettensorgfaltspflichtengesetz) was adopted in 2021. It integrates human rights and environmental aspects into the supply chains of corporates and will enter into force on January 1,2023. Under the act, credit institutions that grant loans, engage in collateral transactions or invest customer funds will generally be subject to due diligence requirements only with respect to the borrower, the collateral taker or the investment. However, a credit institution granting large loans or engaging in other transactions that typically result in significant control and information rights of the institution may be subject to enhanced due diligence requirements also with respect to end customers, or, more generally, the use of the funds. This may require banks to take additional aspects into account when assessing credit risk and entering into financial transactions.
Climate change, environmental and social issues
The Sustainable Development Goals (SDGs) set ambitious goals for achieving a better and more sustainable future. They address the most pressing economic, social and environmental (ESG) challenges of our time, including those closely related to climate change. In 2021, the COVID-19 pandemic continued to put even greater emphasis on sustainable development.
Economies and societies around the world are undergoing a profound transformation. To facilitate this transition significant investment levels are required. I
nvestors
are increasingly integrating ESG factors in their investment strategies, however, with little uniformity around the benchmarks to which they measure ESG investments. The growing focus on ESG is also reflected in our client base’s rising demand for sustainable financing and investment solutions - a market environment that is not only shaping our but also our peers’ product and advisory offering.
Finally, the broader public is expecting t
he financial sector to play an important role in making the transition happen by mobilizing private capital to close existing investment gaps. In many jurisdictions, sustainability is at the very top of the political and regulatory agenda, and supervisory bodies increasingly express clear expectations for banks to manage sustainability risks with a focus on climate-related risks. Over the last years, the European Commission has taken significant steps to increase its ambition level on sustainable finance and demonstrate leadership in setting international standards. In 2021, further initiatives were adopted, including its renewed Sustainable Finance Strategy, the European Green Bond Standard proposal and a Taxonomy Regulation Delegated Act on the information to be disclosed by companies. These measures are meant to support
re-orientation of investments towards more sustainable technologies and businesses, and in doing so support the European Union’s goal of achieving climate neutrality by 2050.
The European Central Bank (ECB) also set out supervisory expectations for banks with regards to addressing climate-related and environmental risks in their business strategy as well as governance and risk management frameworks. ECB will complete its first climate risk stress test by mid-2022. Furthermore, the European Bank Authority’s (EBA) took guidelines into effect, that require financial institutions to analyze a borrower’s exposure to climate risk.
Similar activity took place amongst regulators around the world. Authorities across Asia-Pacific continued to promulgate and design initiatives intended to further promote the development of sustainable finance. They also played an active role in international fora, including the Network for Greening the Financial System (NGFS) and the International Platform for Sustainable Finance, which is working on the Common Ground Taxonomy. In the wake of the new administration, in 2021 U.S. regulators increased their activity regarding climate-related initiatives and policies. In March 2021, for example, the Federal Reserve Board created a Supervision Climate Committee which will develop a supervisory program to oversee how supervised firms are addressing climate-related financial risks; this move was foreshadowed in late 2020, when the Federal Reserve joined the NGSF. In addition, the Securities and Exchange Commission (SEC) is developing a proposed rule on how publicly held firms should provide investors with climate-related disclosures.
|
68
|
|
|
Deutsche Bank
|
Signatures
|
|
|
Annual Report 2021 on Form 20-F
|
Change in Internal Control over Financial Reporting
|
|
|
|
|
Regulation and Supervision
Our operations throughout the world are regulated and supervised by the relevant authorities in each of the jurisdictions where we conduct business. Such regulation relates to licensing, capital adequacy, liquidity, risk concentration, conduct of business as well as organizational and reporting requirements. It affects the type and scope of the business we conduct in a country and how we structure specific operations. In reaction to the 2008 financial crisis, the regulatory environment has undergone and is still undergoing significant changes.
Highlights
On October 27, 2021, the European Commission published a comprehensive package of reforms with respect to the European Union banking rules (referred to as the “Banking Package 2021”) to ensure that banks become more resilient to potential future economic shocks while contributing to the EU’s recovery from the COVID-19 pandemic and its transition to climate neutrality. The proposals aim to amend the Capital Requirements Regulation (“CRR”), the Capital Requirements Directive (“CRD”) and the Bank Recovery and Resolution Directive (“BRRD”). If adopted, the proposals to amendment the CRR and CRD (commonly referred to as “CRR III” and “CRD VI”) will, in particular, finalize the implementation of the Basel 3 framework in the European Union and also fully implement the market risk capital changes in the Fundamental Review of the Trading Book (“FRTB”). Another separate proposal entails combined amendments to the CRR and the BRRD with respect to the resolution regime.
CRR III and CRD VI include, inter alia, a gradually introduced output floor establishing minimum risk-weighted assets that will ultimately be set at 72.5 % of the risk-weighted assets calculated under the standardized approach, changes to standardized and internal ratings-based approaches for determining credit risk, changes to the credit valuation adjustment, a revision of the approaches for operational risks and reforms to the market risk framework as set out in the FRTB, adjustments to the Pillar 2 requirements (“P2R”) and the systemic risk buffer (“SyRB”) and a “fit-and-proper” set of rules for senior staff managing banks. Other proposed measures are aimed to address sustainability risks by requiring banks to identify, disclose and manage environmental, social and governance risks as part of their risk management which includes regular climate stress testing by the banks’ supervisors. The proposal does not entail any adjustments to the capital requirements for green or brown assets. However, the European Commission stated that it is exploring this idea and has asked the European Banking Authority (“EBA”) to assess possible adjustments. It is expected that the EBA will provide its report in 2023.
The proposals regarding the resolution regime include clarifications with respect to some aspects of the total loss absorbing capacity (“TLAC”) / minimum requirement for own funds and eligible liabilities (“MREL”) regime in relation to single point of entry and multiple point of entry resolution strategies and, in particular, a deduction regime requiring intermediate parents to deduct from their own internal MREL capacity the amount of their holdings of internal MREL eligible instruments, including own funds, issued by their subsidiaries belonging to the same resolution group.
The Banking Package 2021 will now be negotiated with EU lawmakers, i.e. the European Parliament and Member States. It is expected that CRR III and CRD VI will start entering into force in 2023 at the earliest with the new rules implementing Basel 3 to apply from January 1, 2025. The European Commission expects that the final implementation of the Basel 3 framework will lead to an increase in the capital requirements of European banks of less than 3 % on average at the beginning of the transitional period in 2025 and of less than 9 % at the end of such period in 2030.
The implementation of the remaining outstanding proposals under Basel 3 as contained in the Banking Package 2021 has the potential to increase our risk-weighted assets and will likely affect our business by raising our regulatory capital and liquidity requirements and by leading to increased costs. The implementation date of Basel 3 has been deferred to January 1, 2023 due to the economic impact of COVID-19.
Also, the United Kingdom (UK) ceased to be a Member State of the European Union as from 11 pm on January 31, 2020, and entered into a ‘Transition Period’ pursuant to the UK/EU Withdrawal Act 2020 during which EU law continued to be applicable in the UK. On December 31, 2020, the Transition Period terminated, and EU law was no longer applicable within the UK. For the UK, this meant that all extensions of EU Member State ‘privileges’ were no longer available including any reliance upon the European Passport and automatic rights of access to EU market infrastructure.
|
69
|
|
|
Deutsche Bank
|
Signatures
|
|
|
Annual Report 2021 on Form 20-F
|
Change in Internal Control over Financial Reporting
|
|
|
|
|
As from the end of the Transition Period, new UK requirements must be complied with when conducting regulated activity in the UK, both as regards cross border business as well as Deutsche Bank AG London Branch activity. Deutsche Bank AG is planning to continue to provide banking and other financial services in the UK both from its London Branch and also on a cross-border basis. Deutsche Bank AG is now subject to additional regulatory requirements in the United Kingdom, and its activities in the United Kingdom will be supervised and monitored by both the Prudential Regulatory Authority (“PRA”) and the Financial Conduct Authority (“FCA”). Deutsche Bank AG is already in the process of applying for authorization to provide banking and other financial services in the United Kingdom. The date by which Deutsche Bank AG can expect to receive UK authorization is currently unknown, and in the meantime, it has the benefit of ‘deemed permission’ pursuant to the UK’s Temporary Permissions Regime (TPR). The TPR also provides Deutsche Bank AG with some temporary relief as to needing to comply with a number of UK rules by allowing ‘substituted compliance’ with similar EU rules. However, certain UK rules have already come into effect and some of these conflict with the similar European rules, and this has already posed challenges for both Deutsche Bank AG and the financial services industry generally (e.g., Derivatives Trading Obligation and Share Trading Obligation under MiFID).
On November 27, 2019, the European Parliament and the Council adopted the Investment Firm Regulation and the Investment Firm Directive, which introduced substantive regulatory changes (including to the calculation of capital requirements) in respect of investment firms, such as our subsidiary DWS. The Investment Firm Regulation and the Investment Firm Directive (as implemented into German law) are in full force since June 26, 2021.
The following sections present a description of the regulation and supervision of our business in our home market Germany under the European Union framework of regulation and in the United States.
Regulation in Germany under the Regulatory Framework of the European Union
We are subject to comprehensive regulation under German law and regulations promulgated by the European Union which are directly applicable law in Germany.
The German Banking Act (
Kreditwesengesetz
) and the CRR are important sources of regulation for German banks with respect to prudential regulation, licensing requirements, and the business activities of financial institutions. In particular, the German Banking Act requires that an enterprise which engages in one or more of the activities categorized in the German Banking Act as “banking business” or “financial services” in Germany must be licensed as a credit institution (
Kreditinstitut
) or financial services institution (
Finanzdienstleistungsinstitut
), as the case may be. Deutsche Bank AG is licensed as a credit institution and is authorized to conduct banking business and to provide financial services.
Significant parts of the regulatory framework for banks in the European Union are governed by the CRR. The CRR includes requirements relating to regulatory capital, risk-based capital adequacy, monitoring and control of large exposures, consolidated supervision, leverage, liquidity and public disclosure, including Basel 3 standards.
Certain other requirements that apply to us, including those with respect to capital buffers, organizational and risk management requirements, are set forth in the German Banking Act and other German laws, partly implementing European Union directives such as the CRD.
Deutsche Bank AG, headquartered in Frankfurt am Main, Germany, is the parent institution of Deutsche Bank Group. Under the CRR, Deutsche Bank AG, as credit institution and parent company, is responsible for regulatory consolidation of all subsidiary credit institutions, financial institutions, asset management companies and ancillary service undertakings. Generally, the bank regulatory requirements under the CRR and the German Banking Act apply both on a stand-alone and a consolidated basis. However, banks forming part of a consolidated group may receive a waiver with respect to the application of specific regulatory requirements on an unconsolidated basis if certain conditions are met. As of December 31, 2020, Deutsche Bank AG benefited from such a waiver, according to which Deutsche Bank AG needs to apply the requirements relating to own funds, large exposures, exposures to transferred credit risks, leverage and disclosure by institutions, as well as certain risk management requirements, only on a consolidated basis.
Capital Adequacy Requirements
Minimum Capital Adequacy Requirements (Pillar 1)
The minimum capital adequacy requirements for banks are primarily set forth in the CRR. The CRR requires German banks to maintain an adequate level of regulatory capital in relation to the total of their risk positions, referred to as total exposure amount. Risk positions include credit risk positions, market risk positions and operational risk positions (including, among other things, risks related to certain external factors, as well as to technical errors and errors of employees). The most important type of capital for compliance with the capital requirements under the CRR is Common Equity Tier 1 capital. Common Equity Tier 1 capital primarily consists of share capital, retained earnings and other reserves, subject to certain regulatory adjustments. Another component of regulatory capital is Additional Tier 1 capital, which includes, for example, certain unsecured subordinated perpetual capital instruments and related share premium accounts. An important feature of Additional Tier 1 capital is that the principal amount of the instruments will be written down, or converted into Common Equity Tier 1 capital, when the Common Equity Tier 1 capital ratio of the financial institution falls below a minimum of 5.125 % (or such higher level as the issuing bank may determine). Common Equity Tier 1 capital and Additional Tier 1 capital together constitute Tier 1 capital. An additional type of regulatory capital is Tier 2 capital which generally consists of long-term subordinated debt instruments. Tier 1 capital and Tier 2 capital together constitute own funds.
|
70
|
|
|
Deutsche Bank
|
Signatures
|
|
|
Annual Report 2021 on Form 20-F
|
Change in Internal Control over Financial Reporting
|
|
|
|
|
Under the CRR, banks are required to maintain a minimum ratio of Tier 1 capital to total risk exposure amount of 6 % and a minimum ratio of Common Equity Tier 1 capital to total risk exposure of 4.5 %. The minimum total capital ratio of own funds to total risk exposure is 8 %.
Capital Buffers
The German Banking Act also requires banks to build up a mandatory capital conservation buffer (Common Equity Tier 1 capital amounting to 2.5 % of total risk exposure), and authorizes the BaFin to set a domestic countercyclical capital buffer (“CCyB”) for Germany (Common Equity Tier 1 capital of generally 0 % to 2.5 % of total risk exposure, or more in particular circumstances) during periods of high credit growth. Due to the impact of the current pandemic, BaFin had temporarily lowered the CCyB to 0 %. Effective as of February 1, 2022, BaFin set the CCyB at 0.75 %. Banks have to comply with this new CCyB requirement starting from February 1, 2023. In order to comply with the CCyB requirement, banks must calculate their institution-specific CCyB as the weighted average of the CCyBs that apply to them in the jurisdictions where their relevant credit exposures are located. Accordingly, the total CCyB requirement, if any, with which we need to comply also depends on the corresponding buffer requirements in other jurisdictions. In addition, BaFin may require banks to build up a SyRB (Common Equity Tier 1 capital of a minimum of 0.5 % of the total risk exposure amount for all exposures to prevent and mitigate long term non-cyclical systemic or macro-prudential risks not otherwise covered by CRR/CRD). Any SyRB determined by BaFin in excess of 5 % would require prior authorization of the European Commission. Deutsche Bank’s current SyRB is 0 %. On January 12, 2022, BaFin has announced its intention to set a SyRB of 2 % with regard to residential real estate financing with effect as of April 1, 2022 applicable from February 1, 2023. Global systemically important institutions (“G-SIIs”) are subject to an additional capital buffer (Common Equity Tier 1 capital of between 1 % and 3.5 % of risk-weighted assets), which the BaFin determines for German banks based on a scoring system measuring the bank’s global systemic importance. Deutsche Bank’s current G-SII capital risk buffer is 1.5 %. BaFin can also determine a capital buffer of Common Equity Tier 1 capital of up to 3 % of risk-weighted assets for other systemically important banks (so-called O-SIIs) in Germany, based on criteria measuring, among others, the bank’s importance for the economy in Germany and the European Economic Area. Deutsche Bank is subject to treatment both as a G-SII, as well as an O-SII (on a consolidated basis). Any risk buffer for O-SIIs that exceeds the threshold of 3 % requires prior authorization by the European Commission. Deutsche Bank’s current O-SII capital buffer is 2 %. The buffers for G-SIIs and the buffer for O-SIIs are not cumulative; only the higher of these buffers applies. However, such higher buffer and the SyRB are cumulative. If the total buffer is higher than 5 %, BaFin needs to seek approval by the European Commission. If a bank fails to build up the required capital buffers, it will be subject to restrictions on the pay-out of dividends, share buybacks and discretionary compensation payments. Also, within the single supervisory mechanism
(“SSM”),
the European Central Bank (“ECB”) may require banks to maintain higher capital buffers than those required by the BaFin.
Leverage Ratio
The CRR also provides for a Tier 1 capital-based binding minimum leverage ratio requirement of 3 %. The minimum leverage ratio requirement is calculated on a non-risk basis and complements the other risk-based capital requirements. Before June 28, 2021 banks were only required to report and publish their leverage ratios and became required to comply with the minimum leverage ratio from June 28, 2021. Competent authorities have discretion to allow banks to exclude certain central bank exposures from the calculation of the leverage ratio. The ECB and the BaFin first declared the existence of exceptional circumstances in September 2020 and subsequently extended the allowed exclusion until March 31, 2022. On February 10, 2022, the ECB confirmed that it sees no need to extend this measure further.
In addition to the minimum leverage ratio requirement, the CRR provides for a leverage ratio buffer requirement for G-SIIs (such as Deutsche Bank), which must be met with Tier 1 capital and is set at 50 % of the G-SII's risk-weighted capital buffer rate. The application of the leverage ratio buffer is deferred to January 1, 2023. Certain aspects relating to the leverage ratio buffer requirement as contained in the CRD (such as restrictions on the pay out of dividends etc. if the requirements are not met) must be implemented in the laws of the individual member jurisdictions.
Pillar 2 Capital Requirements and Guidance
Furthermore, the ECB may impose capital requirements on individual significant credit institutions
which are more stringent than the statutory minimum requirements set forth in the CRR, the German Banking Act or the related regulations. Upon completion of the supervisory review and evaluation process (“SREP”) discussed in greater detail below, the competent supervisory authority makes an SREP decision in relation to each relevant bank, which may include specific capital and liquidity requirements for each affected bank. Any such additional bank-specific capital requirements
resulting from the SREP are referred to as P2R in addition to the statutory minimum capital and buffer requirements. Institutions must meet their P2R with at least 75 % of Tier 1 capital and at least 56.25 % of Common Equity Tier 1 capital.
|
71
|
|
|
Deutsche Bank
|
Signatures
|
|
|
Annual Report 2021 on Form 20-F
|
Change in Internal Control over Financial Reporting
|
|
|
|
|
In addition, the ECB may decide following the SREP to communicate to individual banks an expectation to hold a further Pillar 2 Common Equity Tier 1 capital add-on, the so-called Pillar 2 guidance (“P2G”). The ECB has stated that it generally expects banks to meet the P2G although it is not legally binding and failure to meet the P2G does not automatically have legal consequences. The competent supervisory authority may take a range of other measures based on the SREP outcome to address shortcomings in a bank’s governance and risk management processes or its capital or liquidity position, such as prohibiting dividend payments to shareholders or distributions to holders of regulatory capital instruments. In light of the COVID-19 pandemic, the ECB currently allows banks to operate temporarily below the level of capital defined by the P2G, but expects banks to operate above P2G again from January 1, 2023.
For details of Deutsche Bank’s regulatory capital, see “Management Report: Risk Report: Risk and Capital Performance” in our Annual Report 2021.
MREL Requirements
As discussed below under “Recovery and Resolution”, to ensure that European banks have a sufficient amount of liabilities with loss-absorbing capacity, they are required to meet MREL determined for each institution individually on a case-by-case basis. The European Union implemented the Financial Stability Board’s (“FSB”) TLAC standard for global systemically important banks (“G-SIBs”, such as us) by introducing a Pillar 1 MREL requirement for G-SIIs (the European equivalent term for G-SIBs). This requirement is based on both risk-based and non-risk-based denominators and will be set at the higher of 18 % of total risk exposure and 6.75 % of the leverage ratio exposure measure. It can be met with Tier 1 or Tier 2 capital or debt that meets specific eligibility criteria. Deduction rules apply for holdings by G-SIIs of TLAC instruments of other G-SIIs. In addition, the competent authorities have the ability to impose on G-SIIs individual MREL requirements that exceed the statutory minimum requirements. See “Highlights” above for further information on clarifications with respect to the TLAC / MREL regime that are included in the European Commission’s legislative proposals of October 27, 2021.
Limitations on Large Exposures
The CRR also contains the primary restrictions on large exposures, which limit a bank’s concentration of credit risks. The German Banking Act and the Large Exposure Regulation (
Großkredit- und Millionenkreditverordnung
) supplement the CRR. Under the CRR, our exposure to a customer and any customers affiliated with such customer is deemed to be a “large exposure” when the value of such exposure is equal to or exceeds 10 % of our Tier 1 capital. All exposures to a single customer and any customers affiliated with such customer are aggregated for these purposes. In general, no large exposure may exceed 25 % of our Tier 1 capital, or, in case the customer is a bank designated as G-SII, 15 % of our Tier 1 capital. Competent authorities may set a lower limit than € 150 million. For exposures in the trading book, the large exposure regime may give greater latitude, subject to an additional own funds requirement.
Liquidity Requirements
The CRR introduced a liquidity coverage requirement intended to ensure that banks have an adequate stock of unencumbered high quality liquid assets that can be easily and quickly converted into cash to meet their liquidity needs for a 30-calendar day liquidity stress scenario. The required liquidity coverage ratio (“LCR”) is calculated as the ratio of a bank’s liquidity buffer to its net liquidity outflows. Also, banks must regularly report the composition of the liquid assets in their liquidity buffer to their competent authorities. Due to the COVID-19 pandemic, the ECB temporarily allowed banks to operate below the minimum LCR. On December 17, 2021, the ECB announced that it expects banks to operate again with a LCR of above 100 % as from January 1, 2022.
In addition, the CRR provides for a net stable funding ratio (“NSFR”) to reduce medium- to long-term funding risks by requiring banks to fund their activities with sufficiently stable sources of funding over a one-year period. The NSFR, which applies since June 28, 2021, is defined as the ratio of a bank’s available stable funding relative to the amount of required stable funding over a one-year period. Banks must maintain an NSFR of at least 100 %. The NSFR will apply to both the Group as a whole and to individual SSM regulated entities, including the parent entity Deutsche Bank AG.
The ECB may impose on individual banks liquidity requirements which are more stringent than the general statutory requirements if the bank’s continuous liquidity would otherwise not be ensured.
Separation of Proprietary Trading Activities by Universal Banks
|
72
|
|
|
Deutsche Bank
|
Signatures
|
|
|
Annual Report 2021 on Form 20-F
|
Change in Internal Control over Financial Reporting
|
|
|
|
|
The German Separation Act provides that deposit-taking banks and their affiliates are prohibited from engaging in proprietary trading that does not constitute a service for others, high-frequency trading, and credit or guarantee transactions with hedge funds and comparable enterprises that are substantially leveraged, unless such activities are exempt or excluded, or in the case no such exemption or exclusion is available, is transferred to a separate legal entity, referred to as a financial trading institution (
Finanzhandelsinstitut
). The separation requirement applies if certain thresholds are exceeded, which is the case for us. In addition, the German Separation Act authorizes the BaFin to prohibit the deposit-taking bank and its affiliates, on a case-by-case basis, from engaging in market-making and other activities that are comparable to the activities prohibited by law, if these activities may put the solvency of the deposit-taking bank or any of its affiliates at risk. In the event that the BaFin orders such a prohibition, the respective activities must be discontinued or transferred to a separate financial trading institution. The financial trading institution may be established in the form of an investment firm or a bank and may be part of the same group as the deposit-taking bank. However, it must be economically and organizationally independent from the deposit-taking bank and its other affiliates, and it has to comply with enhanced risk management requirements. We have established a compliance and control framework to ensure that no prohibited activities are conducted. Deutsche Bank has not established a financial trading institution.
Anti-Financial Crime, Sanctions, Fraud, Bribery and Corruption
Financial sector participants are required to take steps to prevent the abuse of the financial system through money laundering and other financial crime. The European Union has continually sought to strengthen its framework for anti-money laundering and combating the financing of terrorism, in line with international standards set by the Financial Action Task Force. Recent developments include, in addition to the European Commission’s new AML/CFT Package, the implementation into German law of the European Union’s Fifth Anti-Money Laundering Directive as of January 2020 and the Sixth Anti-Money Laundering Directive as of March 2021. If adopted, the proposals in the new AML/CFT Package will establish an overhauled integrated European AML supervisory system with the single rulebook expanding the list of obliged entities and including harmonized, more detailed and granular rules on, among other things, customer due diligence, beneficial ownership, and AML/CFT risk management. Generally, the requirements (such as know-your-customer requirements) currently set out in the German AML Act (
Geldwäschegesetz
) and the German Banking Act apply to all business lines and infrastructure units as well as all subsidiaries and affiliates that undertake AML-relevant business and in which Deutsche Bank AG has a dominating influence.
We are required to comply with international sanctions, which are measures to protect national security interests or international law by countries, multilateral or regional organizations against certain countries, organizations or individuals restricting economic activity. In 2021, various sanctions laws and regulations were issued or changed requiring us to update policies and processes such as name list screening and transaction filtering.
We are subject to fraud, bribery and corruption laws and regulations under the German Criminal Code and in the other countries in which we conduct business. The UK Bribery Act 2010 has extraterritorial impact and requires us to design and develop appropriate measures to mitigate bribery and corruption risk and to administer controls and safeguards to mitigate such risks.
Data Protection and Cyber Risk
We have to comply with all applicable data protection laws in the countries in which we operate. The regulation on the protection of natural persons with regard to the processing of personal data and on the free movement of such data, also referred to as the General Data Protection Regulation (“GDPR”), became applicable in the European Union on May 25, 2018. It relates to data protection and privacy rights of individuals within the European Union and addresses the export of personal data to other jurisdictions. The GDPR primarily aims at giving individuals control over their personal data and to unifying the regulatory environment for cross-border business. Superseding the 1995 Data Protection Directive, the GDPR contains provisions and requirements pertaining to the processing of personal data of individuals and also applies to businesses inside the European Union that are processing personal data. The regulation furthermore applies to businesses outside of the European Union if goods or services are offered to data subjects in the European Union, or if the behavior of data subjects in the European Union is being monitored. The GDPR imposes compliance obligations and grants broad enforcement powers to supervisory authorities, including the potential to levy significant fines for non-compliance.
Under the German Banking Act and the BaFin’s Minimum Requirements for Risk Management for Banks (
Mindestan-
forderungen an das Risikomanagement
) together with the BaFin’s Supervisory Requirements for IT in Financial Institutions (
Bankaufsichtlichen Anforderungen an die IT
), information security needs to be an integral part of a financial institution’s IT strategy and risk management. The BaFin requires that financial institutions establish a comprehensive information and cyber security program, define standards, implement controls and adhere to their resulting security policies and standards in accordance with evolving business requirements, regulatory guidance, and an emerging threat landscape. Information security risk management is part of vendor risk management for any procurement if information technology or outsourcing activity include the use of new technologies like cloud services. Information security risk (also referred to as cyber risk) is a component of operational risk assessed in the context of the SREP under Guidelines on Information and Communication Technology Risk Assessment issued by the European Banking Authority, which expects financial institutions to protect the confidentiality, integrity, and availability of customer data and information assets. Such guidelines are complemented by the European Banking Authority’s Guidelines on ICT and Security Risk Management. Further, at the European Union level, the expected adoption of the Digital Operational Resilience Act and the complementing amending directive will introduce a comprehensive framework setting out rules on the digital operational resilience for all regulated financial institutions throughout the European Union.
|
73
|
|
|
Deutsche Bank
|
Signatures
|
|
|
Annual Report 2021 on Form 20-F
|
Change in Internal Control over Financial Reporting
|
|
|
|
|
Remuneration Rules
Under the German Banking Act and the German Credit Institution Remuneration Regulation (
Institutsvergütungsverordnung
), we are subject to certain restrictions on the remuneration we pay our management board members and employees. These remuneration rules implement requirements of the CRD and impose a cap on bonuses. Pursuant to this cap, the variable remuneration for management board members and employees must not exceed the fixed remuneration. The variable remuneration may be increased to twice the management board member's or employee’s fixed remuneration if expressly approved by the shareholders’ meeting with the required majority. In addition, we are obliged to identify individuals who have a material impact on our risk profile (“material risk takers”). Such material risk takers are subject to additional rules, such as the requirement that at least 40 % or, as the case may be, at least 60 % of the variable remuneration granted to them must be on a deferred basis. The minimum deferral period is four years and may increase to five years depending on certain factors. For certain material risk takers the minimum deferral period is set to five years. Also at least 50 % of the variable remuneration for material risk takers must be paid in shares of the bank or instruments linked to shares of the bank. Variable compensation of material risk takers has to be subject to an ex post risk adjustment mechanism and to a claw back provision in case of personal wrongdoing. These deferral and claw back provisions do not apply to a material risk taker whose variable remuneration does not exceed € 50,000 gross and 1/3 of the total annual remuneration. Finally, we are required to comply with certain disclosure requirements relating to the remuneration we pay to, and our remuneration principles in respect of, our material risk takers and other affected employees.
For details of Deutsche Bank’s remuneration system, see “3 - Compensation Report” in our Annual
Report 2021.
Deposit Protection and Investor Compensation in Germany
The Deposit Protection Act and the Investor Compensation Act
The German Deposit Protection Act (
Einlagensicherungsgesetz
) and the German Investor Compensation Act (
Anlegerentschädigungsgesetz
) provide for a mandatory deposit protection and investor compensation system in Germany, based on a European Union directive on deposit guarantee schemes (“DGS Directive”) and a European Union directive on investor compensation schemes.
The German Deposit Protection Act requires that each German bank participates in one of the statutory government-controlled deposit protection schemes (
Entschädigungseinrichtungen
). Since October 2021, the Entschädigungseinrichtung deutscher Banken GmbH (“EdB”) is the sole German deposit protection scheme for all German banks. The EdB collects and administers the contributions of the member banks, and settles any compensation claims of depositors in accordance with the German Deposit Protection Act.
Under the German Deposit Protection Act, deposit protection schemes are generally liable for obligations resulting from deposits denominated in any currency in an amount of up to € 100,000 per depositor and bank. Certain depositors, such as banks, insurance companies, investment funds and governmental bodies, are excluded from coverage.
Deposit protection schemes are financed by annual contributions of the participating banks proportionate to their potential liabilities, depending on the amount of its covered deposits and the degree of risk the bank is exposed to. A target level of 0.8 % of the total covered deposits of the participating banks is supposed to be reached by July 3, 2024. Deposit protection schemes may also levy special contributions if required to settle compensation claims.
Deposit protection schemes will be required to contribute to bank resolution costs where resolution tools are used. The contribution made by the deposit protection scheme is limited to the compensation it would have to pay if the affected bank had become subject to insolvency proceedings. Furthermore, deposit protection schemes may provide funding to its participating banks to avoid their failure under certain circumstances.
Under the German Investor Compensation Act, in the event that the BaFin ascertains a compensation case, Entschädigungseinrichtung deutscher Banken GmbH as Deutsche Bank AG’s deposit protection scheme is also required to compensate 90 % of the aggregate claims of each covered creditor arising from securities transactions denominated in euro or in a currency of any other European Union Member State up to an amount of the equivalent of € 20,000. Many financial sector participants such as banks, insurance companies, investment funds, governmental bodies or medium-sized and large corporations do not benefit from this coverage.
|
74
|
|
|
Deutsche Bank
|
Signatures
|
|
|
Annual Report 2021 on Form 20-F
|
Change in Internal Control over Financial Reporting
|
|
|
|
|
Voluntary Deposit Protection System
Liabilities to creditors that are not covered by a statutory compensation scheme may be covered by the Deposit Protection Fund (
Einlagensicherungsfonds
) set up by the Association of German Banks (Bundesverband deutscher Banken e.V.) of which Deutsche Bank AG is a member. The Deposit Protection Fund protects deposits, i.e., generally credit balances credited to an account or resulting from interim positions which the bank is required to repay, subject to certain exclusions, up to an amount equal to 15 % of the bank’s own funds (
Eigenmittel
) as further specified in the Deposit Protection Fund’s by-laws. This limit will be reduced to 8.75 % from January 1, 2025 onwards.
The financial resources of the Deposit Protection Fund are funded by contributions of the participating banks. If the resources of the Fund are insufficient, banks may be required to make special contributions, in particular if the resources of the Deposit Protection Fund become stretched due to bank insolvencies or otherwise.
The Association of German Banks launched on December 8, 2021 a far-reaching reform project for its Deposit Protection Fund. It is scheduled to be finalized in April 2022 and to start phasing in from 2023 onwards. Key elements are the exclusion of deposits of insurance and re-insurance undertakings, UCITS and pension funds as well as governmental agencies. Also, absolute cover limit amounts will apply to all depositors. These amounts are € 5 million per depositor from January 1, 2025 and € 1 million on January 1, 2030. For corporates the limits will be ten times higher but limited to deposits with a maturity of up to 12 months.
Market Conduct, Investor Protection and Infrastructure Regulation
Under the German Securities Trading Act (
Wertpapierhandelsgesetz
), the BaFin regulates and supervises securities trading, including the provision of investment services, in Germany. The German Securities Trading Act contains, among other things, disclosure and transparency rules for issuers of securities that are listed on a German exchange and organizational requirements as well as rules of conduct which apply to all businesses that provide investment services. Investment services include, in particular, the purchase and sale of securities or derivatives for others and the intermediation of transactions in securities or derivatives as well as investment advice. The BaFin has broad powers to investigate businesses providing investment services to monitor their compliance with the organizational requirements, rules of conduct and reporting requirements. In addition, the German Securities Trading Act requires an independent auditor to perform an annual audit of the investment services provider’s compliance with its obligations under the German Securities Trading Act.
A related area is the Market Abuse Regulation (“MAR”) which establishes a common European Union framework for, inter alia, insider dealing, the public disclosure of inside information, market manipulation, and managers’ transactions. The German Securities Trading Act, which had contained rules on market abuse prior to the entering into force of the MAR, continues to supplement the MAR in this respect, for example by providing for sanctions in case of violations of the MAR.
In addition, the Markets in Financial Instruments Directive (“MiFID”), implemented primarily by the German Securities Trading Act, and the Markets in Financial Instruments Regulation (“MiFIR”) provide for a greater regulation and oversight of financial firms providing investment services or activities in the European Union by covering additional markets and instruments, the extension of pre- and post-trade transparency rules from equities to all financial instruments, greater restrictions on operating trading platforms, and greater sanctioning powers. The trading venues under supervision include organized trading facilities. In addition, MiFID/MiFIR, also provide for a trading obligation for OTC derivatives subject to mandatory clearing and which are sufficiently standardized, and investor protection rules that significantly impact the way investment firms distribute products. On November 25, 2021, the European Commission published a proposal for a review of the MiFIR (referred to as the “MiFIR Review”) that entails amendments to the MiFIR and the MiFID. The proposals in the MiFIR Review, among other things, introduce an EU-wide consolidated tape for each asset class, enhanced transparency requirements for small trades in equities (such as shares) and for non-equities (such as derivatives and bonds), and adjust the scope of the EU share trading obligation and derivatives trading obligation.
The Regulation on Key Information Documents or Packaged Retail and Insurance-based Investment Products (PRIIPs) applies since January 1, 2018. It focuses on disclosure and transparency requirements when advising on or selling retail structured products and other complex and packaged investment products and aims at increasing investor protection.
|
75
|
|
|
Deutsche Bank
|
Signatures
|
|
|
Annual Report 2021 on Form 20-F
|
Change in Internal Control over Financial Reporting
|
|
|
|
|
Beyond the infrastructure-related provisions of MiFID and MiFIR, market infrastructure has been the focus of other regulatory initiatives of the European Union that are relevant for Deutsche Bank. The Regulation on Transparency of Securities Financing Transaction aims at increasing transparency and reducing risks associated with such transactions. The regulation requires that repos, securities lending transactions and transactions with equivalent effect and margin lending transactions be reported to trade repositories and requires risk disclosures and consent before assets are reused or re-hypothecated. For the OTC derivatives markets, the European Regulation on OTC Derivatives, Central Counterparties and Trade Repositories, also referred to as European Market Infrastructure Regulation (“EMIR”), pursues the goals of reducing system, counterparty and operational risk and increase transparency in the OTC derivatives markets. The regulation introduced requirements for standardized over-the-counter derivatives, such as central clearing, margining, portfolio reconciliation or reporting to trade repositories.
In addition, the European Union’s Regulation on Financial Benchmarks seeks to ensure the integrity and accuracy of indices used as benchmarks for financial instruments and contracts, and prevent their manipulation. European Union-regulated banks, investment firms, fund managers and certain other supervised entities are only permitted to use benchmarks provided in accordance with the regulation. Benchmark administrators in the European Union are required to obtain authorization or registration, and are subject to rules and oversight regarding their organization, governance and conduct. Benchmarks provided by non-EU administrators are permissible under certain conditions.
Legal Requirements relating to Financial Statements and Audits
As required by the German Commercial Code (
Handelsgesetzbuch
), Deutsche Bank AG prepares its non-consolidated financial statements in accordance with German GAAP. Deutsche Bank Group’s consolidated financial statements are prepared in accordance with International Financial Reporting Standards (“IFRS”), and our compliance with capital adequacy requirements and large exposure limits is determined solely based upon such consolidated financial statements.
Under German law, Deutsche Bank AG is required to be audited annually by a certified public accountant (
Wirtschaftsprüfer
). Deutsche Bank AG’s auditor is appointed each year at the annual shareholders’ meeting. However, the supervisory board mandates the auditor and supervises the audit. The BaFin and the Deutsche Bundesbank (“Bundesbank”), the German central bank, must be informed of the appointment and the BaFin may reject the auditor’s appointment. The German Banking Act requires that a bank’s auditor inform the BaFin and the Bundesbank of any facts that come to the auditor’s attention which would lead it to refuse to certify or to limit its certification of the bank’s annual financial statements or which would adversely affect the bank’s financial position. The auditor is also required to notify the BaFin and the Bundesbank in the event of a material breach by management of the articles of association or of any other applicable law. The auditor is required to prepare a detailed and comprehensive annual audit report (
Prüfungsbericht
) for submission to the bank’s supervisory board, the BaFin and the Bundesbank. The BaFin and the Bundesbank share their information with the ECB. In addition to the statutory audit directive and its amendment that has been implemented into national law, Deutsche Bank is also subject to the European Union’s Regulation on Specific Requirements regarding Statutory Audit of Public-Interest Entities which includes requirements for mandatory audit firm rotation and restrictions on non-audit services.
Banking Supervision under the Single Supervisory Mechanism
Under the European Union’s system of financial supervision referred to as the single supervisory mechanism (“SSM”), the ECB is the primary supervisor of all systemically important or significant credit institutions (such as Deutsche Bank AG) and their banking affiliates in the relevant Member States. The competent national authorities supervise the remaining, less significant banks under the oversight of the ECB. As a result, Deutsche Bank AG is supervised by the ECB, the BaFin and the Bundesbank.
With respect to us and other significant credit institutions, the ECB is the primary supervisor and is responsible for most tasks of prudential supervision, such as compliance with regulatory requirements concerning own funds, large exposure limits, leverage, liquidity, securitizations, corporate governance, business organization and risk management requirements. The ECB carries out its day-to-day supervisory functions through a joint supervisory team (“JST”) established for Deutsche Bank Group. The JST is led by the ECB and comprises staff from the ECB and national supervisory authorities, including the BaFin and the Bundesbank. In addition, and regardless of whether an institution is significant or not, the ECB is responsible for issuing new licenses to credit institutions and for assessing the acquisition and increase of significant participations (also referred to as qualifying holdings) in credit institutions established in those Member States of the European Union that participate in the SSM and where notification of such changes must be filed.
|
76
|
|
|
Deutsche Bank
|
Signatures
|
|
|
Annual Report 2021 on Form 20-F
|
Change in Internal Control over Financial Reporting
|
|
|
|
|
The BaFin is our principal supervisor for regulatory matters with respect to which we are not supervised by the ECB. These include business conduct in the securities markets, in particular when providing investment services to clients, payment services and implementing measures against money laundering and terrorist financing, and they also include certain special areas of bank regulation, such as those related to the issuance of covered bonds (Pfandbriefe) and the supervision of German home loan banks (
Bausparkassen
) with regard to certain regulatory requirements specifically applicable to such home loan banks. Generally, the BaFin also supervises us with respect to those requirements under the German Banking Act that are not based upon European law. The Bundesbank supports the BaFin and the ECB and closely cooperates with them. The cooperation includes the ongoing review and evaluation of reports submitted by us and of our audit reports as well as assessments of the adequacy of our capital base and risk management systems. The ECB, the BaFin and the Bundesbank receive comprehensive information from us in order to monitor our compliance with applicable legal requirements and to obtain information on our financial condition.
Supervisory Review and Evaluation Process
For significant institutions such as Deutsche Bank, the JST conducts the SREP for an ongoing assessment of risks, governance arrangements and the capital and liquidity situation. The SREP requires that the JSTs review the arrangements, strategies, processes and mechanisms of supervised banks on a regular basis, in order to evaluate risks to which these banks are or might be exposed, risks they could pose to the financial system, and risks revealed by stress testing.
The SREP framework consists of a business model analysis, an assessment of internal governance and institution-wide control arrangements, an assessment of risks to capital and adequacy of capital to cover these risks; and an assessment of risks to liquidity and adequacy of liquidity resources to cover these risks. The SREP can result in Pillar 2 capital and liquidity requirements or guidance for the relevant institution (see above “Pillar 2 Capital Requirements and Guidance”).
Audits, Investigations and Enforcement
Investigations and Supervisory Audits
The ECB and the BaFin may conduct audits of banks on a discretionary basis, as well as for cause. In particular, the ECB may audit our compliance with requirements with respect to which it supervises us, such as those set forth in the CRR/CRD. The BaFin may also decide to audit our compliance with requirements with respect to which it supervises us, such as those relating to business conduct in the securities markets and the regulation of anti-money laundering, to counter terrorist financing and payment services, as well as certain special areas of bank regulation, such as those related to the issuance of covered bonds and the supervision of German home loan banks.
The ECB as well as the BaFin may require a bank to furnish information and documents in order to ensure that the bank is complying with applicable bank supervisory laws. The ECB and the BaFin may conduct investigations without having to state a reason therefor. Such investigations may also take place at a foreign entity that is part of a bank’s group for regulatory purposes. Investigations of foreign entities are limited to the extent that the law of the jurisdiction where the entity is located restricts such investigations.
The ECB and the BaFin may attend meetings of a bank’s supervisory board and shareholders meetings. They also have the authority to require that such meetings be convened.
Supervisory and Enforcement Powers
The ECB has a wide range of enforcement powers in the event it discovers any irregularities concerning adherence to requirements with respect to which it supervises us.
It may, for example,
- – impose additional own funds or liquidity requirements in excess of statutory minimum requirements;
- – restrict or limit a bank’s business;
- – require the cessation of activities to reduce risk;
- – require a bank to use net profits to strengthen its own funds;
- – restrict or prohibit dividend payments to shareholders or distributions to holders of Additional Tier 1 instruments; or
- – remove the members of the bank’s management or supervisory board members from office.
|
77
|
|
|
Deutsche Bank
|
Signatures
|
|
|
Annual Report 2021 on Form 20-F
|
Change in Internal Control over Financial Reporting
|
|
|
|
|
To the extent necessary to carry out the tasks granted to it, the ECB may also require national supervisory authorities to make use of their powers under national law. If these measures are inadequate, the ECB may revoke the bank’s license. Furthermore, the ECB has the power to impose administrative penalties in case of breaches of directly applicable European Union laws, such as the CRR, or of applicable ECB regulations and decisions. Penalties imposed by the ECB may amount to up to twice the amount of profits gained or losses avoided because of the violation, or up to 10 % of the total annual turnover of the relevant entity in the preceding business year or such other amounts as may be provided for in relevant European Union law. In addition, where necessary to carry out the tasks granted to it, the ECB may also require that the BaFin initiate proceedings to ensure that appropriate penalties are imposed on the affected bank.
The BaFin also retains a wide range of enforcement powers. As discussed above, it may take action if instructed by the ECB in connection with supervisory tasks granted to the ECB. With respect to supervisory tasks remaining with the BaFin, the BaFin may take action upon its own initiative. In particular, if a bank is in danger of defaulting on its obligations to creditors, the BaFin may take emergency measures to avert default. These emergency measures may include:
- – issuing instructions relating to the management of the bank;
- – prohibiting the acceptance of deposits and the extension of credit;
- – prohibiting or restricting the bank’s managers from carrying on their functions;
- – prohibiting payments and disposals of assets;
- – closing the bank’s customer services; and
- – prohibiting the bank from accepting any payments other than payments of debts owed to the bank.
The BaFin may also impose administrative pecuniary penalties under the German Banking Act and other German laws. Penalties under the German Banking Act may amount to generally up to € 5 million or, in certain cases, € 20 million, depending of the type of offense. If the economic benefit derived from the offense is higher, the BaFin may impose penalties of up to 10 % of the net turnover of the preceding business year or twice the amount of the economic benefit derived from the violation.
Finally, violations of the German Banking Act may result in criminal penalties against the members of the Management Board or senior management.
Recovery and Resolution
Germany participates in the European Union’s single resolution mechanism (“SRM”), which centralizes at a European level the key competences and resources for managing the failure of banks in Member States of the European Union participating in the banking union. The SRM is based on the SRM Regulation and the BRRD, which in Germany are mainly implemented through the German Recovery and Resolution Act (
Sanierungs- und Abwicklungsgesetz
).
Under the SRM, broad resolution powers with respect to banks domiciled in the participating Member States are granted to the Single Resolution Board (“SRB”) as the central European resolution authority and to the competent national resolution authorities. Resolution powers in particular include the power to reduce, including to zero, the nominal value of shares, or to cancel shares outright, and to write down certain eligible subordinated and unsubordinated unsecured liabilities, including to zero, or convert them into equity (commonly referred to as “bail-in”).
For a bank directly supervised by the ECB, such as Deutsche Bank, the SRB draws up the resolution plan, assesses the bank’s resolvability and may require legal and operational changes to the bank’s structure to ensure its resolvability. In the event that a bank is failing or likely to fail and certain other conditions are met, in particular where there is no reasonable prospect that any alternative private sector measures would prevent the failure and resolution measures are necessary in the public interest, the SRB is responsible for adopting a resolution scheme for resolving the bank pursuant to the SRM Regulation. The European Commission and, to a lesser extent, the Council of the European Union, have a role in endorsing or objecting to the resolution scheme proposed by the SRB. The resolution scheme would be addressed to and implemented by the competent national resolution authorities (the BaFin in Germany).
Resolution measures that could be imposed upon a failing bank may include a range of measures including the transfer of shares, assets or liabilities of the bank to another legal entity, the reduction, including to zero, of the nominal value of shares, the dilution of shareholders of a failing bank or the cancellation of shares outright, or the amendment, modification or variation of the terms of the bank’s outstanding debt instruments, for example by way of deferral of payments or a reduction of the applicable interest rate. Furthermore, by way of a “bail-in”, certain liabilities may be written down, including to zero, or converted into equity after the bank’s regulatory capital has been exhausted.
|
78
|
|
|
Deutsche Bank
|
Signatures
|
|
|
Annual Report 2021 on Form 20-F
|
Change in Internal Control over Financial Reporting
|
|
|
|
|
To ensure that resolution measures can be effectively taken, contractual obligations governed by the laws of a non-EU country or that are subject to jurisdiction outside the European Union are required to include contractual provisions that ensure that the relevant obligation can be bailed in. In the case of financial contracts governed by the laws of a non-EU country or that are subject to jurisdiction outside the European Union, stay acceptance clauses need to be included.
To ensure sufficient availability of liabilities with loss-absorbing capacity that could be bailed in, the SRM Regulation and the German Recovery and Resolution Act introduced a requirement for banks to meet MREL. The required level of MREL is determined by the competent resolution authorities for each supervised bank individually on a case-by-case basis, depending on the preferred resolution strategy. In the case of Deutsche Bank AG, MREL is determined by the SRB.
In addition, G-SIIs are subject to a special Pillar 1 MREL requirement that implements the FSB’s TLAC standard for G-SIBs (see “MREL Requirements” above).
G-SIIs will need to predominantly rely on capital instruments or eligible subordinated debt for this purpose. Effective January 1, 2017, the German Banking Act provided for a new class of statutorily subordinated debt securities that rank as senior non-preferred below the bank’s other senior liabilities (but in priority to the bank’s contractually subordinated liabilities, such as those qualifying as Tier 2 instruments). Following a harmonization effort by the European Union implemented in Germany effective July 21, 2018, banks are permitted to decide if a specific issuance of eligible senior debt will rank as senior non-preferred debt or as senior preferred debt.
The SRB is charged with administering the Single Resolution Fund, a pool of money which is financed by bank levies raised at national level and intended to reach a target level of 1 % of insured deposits of all banks in Member States participating in the SRM by the end of 2023. It will be used for resolving failing banks after other options, such as the bail-in tool, have been exhausted. In line with the German Recovery and Resolution Act, public financial support for a failing bank should only be used as a last resort, after having assessed and exploited, to the maximum extent possible, resolution measures set forth in the SRM Regulation and the German Recovery and Resolution Act, including the bail-in tool.
Regulation in the European Economic Area and Brexit
The European Union pursues common standards of laws and regulations to create consistency across the internal market and reduce compliance and regulatory burdens for businesses operating on a cross-border basis. The Agreement on the European Economic Area (EEA) extends this objective to Iceland, Liechtenstein and Norway. Members of the EEA have agreed to enact legislation similar to that passed in the European Union in many areas. Within the EEA, Deutsche Bank AG generally operates under the so-called “European Passport”. Deutsche Bank AG is subject to regulation and supervision primarily by the ECB and the BaFin. Deutsche Bank AG provides services in the European Economic Area under the “European Passport” both through local branches established in many of the Member States, but also on a cross border basis from its headquarters in Frankfurt. To the extent that activities are carried out within a Member State’s jurisdiction, the authorities of that host Member State supervise the conduct of such activities. This includes, for example, rules on treating clients fairly and rules governing a bank’s conduct in the securities market.
The United Kingdom (UK) ceased to be a Member State of the European Union as from 11 pm on January 31, 2020, and entered into a ‘Transition Period’ pursuant to UK/EU Withdrawal Act 2020 during which EU law continued to be applicable in the UK. On December 31, 2020, the Transition Period terminated, and EU law was no longer applicable within the UK. For the UK, this meant that all extensions of EU Member State ‘privileges’ were no longer available including any reliance upon the European Passport and automatic rights of access to EU market infrastructure.
As from the end of the Transition Period, new UK requirements must be complied with when conducting regulated activity in the UK, both as regards cross border business as well as Deutsche Bank AG London Branch activity. Deutsche Bank AG is planning to continue to provide banking and other financial services in the UK both from its London Branch and also on a cross-border basis. Deutsche Bank AG is now subject to additional regulatory requirements in the United Kingdom, and its activities in the United Kingdom will be supervised and monitored by both the Prudential Regulatory Authority (“PRA”) and the Financial Conduct Authority (“FCA”). Deutsche Bank AG is already in the process of applying for authorization to provide banking and other financial services in the United Kingdom. The date by which Deutsche Bank AG can expect to receive UK authorization is currently unknown, and in the meantime, it has the benefit of ‘deemed permission’ pursuant to the UK’s Temporary Permissions Regime (TPR). The TPR also provides Deutsche Bank AG with some temporary relief as to needing to comply with a number of UK rules by allowing ‘substituted compliance’ with similar EU rules. However, certain UK rules have already come into effect and some of these conflict with the similar European rules. This has already posed challenges for both Deutsche Bank AG and the financial services industry generally (e.g., Derivatives Trading Obligation and Share Trading Obligation under MiFID).
|
79
|
|
|
Deutsche Bank
|
Signatures
|
|
|
Annual Report 2021 on Form 20-F
|
Change in Internal Control over Financial Reporting
|
|
|
|
|
Subsidiaries of the Deutsche Bank Group established in the EEA which were previously benefitting from the European Passport will also need to seek authorization in the UK if any plan to continue to service UK clients or conduct UK regulated activity in the UK. Certain other Deutsche Bank Group subsidiaries have had to assess whether they conduct regulated activity in the UK (e.g., by providing UK regulated services to UK based clients), and where necessary, make plans to run off that activity within the UK’s Financial Services Contracts Regime (FSCR) or otherwise ensure such activity can be conducted pursuant to a UK licensing exemption (i.e., an overseas persons exclusion). Deutsche Bank subsidiaries expected to conduct contractual run-off operations within the FSCR include BHM (FFT), Norisbank (FFT), DB Spa (Milan), DB SAE (Madrid), DB Polska (Warsaw), DB Luxembourg (Brussels) and all with respect to retail client activity only (largely as a result of clients
having moved to the UK since first availing of the services).
Regulation and Supervision in the United States
Our operations are subject to extensive federal and state banking, securities and derivatives regulation and supervision in the United States. We engage in U.S. banking activities directly through our New York branch. We also control U.S. bank subsidiaries, such as Deutsche Bank Trust Company Americas (“DBTCA”), and U.S. broker-dealers, such as Deutsche Bank Securities Inc., U.S. non-depository trust companies and other subsidiaries. We hold our U.S. subsidiaries through two intermediate holding companies, DB USA Corporation, through which our U.S. banking subsidiaries and the large majority of our other U.S. subsidiaries are held, and DWS USA Corporation, through which our U.S. asset management subsidiaries are held.
In 2010, the United States enacted the Dodd-Frank Wall Street Reform and Consumer Protection Act (the “Dodd-Frank Act”), which provides a broad framework for significant regulatory changes that extend to almost every area of U.S. financial regulation. While rulemaking in respect of most of the provisions of the Dodd-Frank Act has already taken place, full implementation of the Dodd-Frank Act will require further detailed rulemaking and uncertainty remains about the final details, timing and impact of some rules. Some existing regulations implementing the Dodd-Frank Act underwent or are undergoing tailoring as a result of amendments to the Dodd-Frank Act enacted in 2018. In addition, the substance and impact of the Dodd-Frank Act may be affected further by subsequent legislation and changes in the U.S. political landscape.
The Dodd-Frank Act provisions known as the “Volcker Rule” limit the ability of banking entities and their affiliates to engage as principal in certain types of proprietary trading and to sponsor or invest in private equity or hedge funds or similar funds (“covered funds”), subject to certain exclusions and exemptions. In the case of non-U.S. banking entities such as Deutsche Bank AG, these exemptions permit certain activities conducted outside the United States, provided that certain criteria are satisfied. The Volcker Rule also limits the ability of banking entities and their affiliates to enter into certain transactions with covered funds with which they or their affiliates have certain relationships. The Volcker Rule also requires banking entities to establish comprehensive compliance programs designed to help ensure and monitor compliance with restrictions under the Volcker Rule.
The Dodd-Frank Act also provides regulators with tools to provide greater capital, leverage and liquidity requirements and other prudential standards, particularly for financial institutions that pose significant systemic risk. U.S. regulators are also able to restrict the size and growth of systemically significant non-bank financial companies and large interconnected bank holding companies. U.S. regulators are also required to impose bright-line debt-to-equity ratio limits on financial companies that the Financial Stability Oversight Council determines pose a grave threat to financial stability if it determines that the imposition of such limits is necessary to minimize the risk.
With respect to prudential standards, in February 2014, the Federal Reserve Board adopted rules that set forth how the U.S. operations of certain foreign banking organizations (“FBOs”), such as Deutsche Bank, are required to be structured, as well as the enhanced prudential standards that apply to our U.S. operations. Under these rules, as of July 1, 2016, a large FBO with U.S.$ 50 billion or more in U.S. non-branch assets, such as Deutsche Bank, was required to establish or designate a separately capitalized top-tier U.S. intermediate holding company (an “IHC”) that would hold substantially all of the FBO’s ownership interests in its U.S. subsidiaries. The Federal Reserve Board may permit an FBO subject to the U.S. IHC requirement to establish or designate multiple U.S. IHCs upon written request. On July 1, 2016, we designated DB USA Corporation as our IHC. In March 2018, we completed the partial initial public offering of our Asset Management division, consolidating these activities in DWS Group GmbH Co. KGaA, in which we retain approximately 80 % of the shares. In April 2018, DWS USA Corporation was formed as a subsidiary of DWS Group GmbH Co. KGaA, and, following receipt of Federal Reserve Board approval, we designated it as our second IHC, through which our U.S. asset management subsidiaries are held. As of the date of their designation or formation, they each became subject, on a consolidated basis, to the risk-based and leverage capital requirements under the U.S. Basel 3 capital framework, capital planning and stress testing requirements (on a phased-in basis), U.S. liquidity buffer requirements and other enhanced prudential standards comparable to those applicable to large U.S. banking organizations. Supplementary leverage ratio requirements applicable to DB USA Corporation took effect beginning in January 2018 and were applicable to DWS USA Corporation upon its formation.
|
80
|
|
|
Deutsche Bank
|
Signatures
|
|
|
Annual Report 2021 on Form 20-F
|
Change in Internal Control over Financial Reporting
|
|
|
|
|
On October 10, 2019, the Federal Reserve Board finalized rules to categorize the U.S. operations of large FBOs based on size, complexity and risk for purposes of tailoring the application of the U.S. enhanced prudential standards (the “Tailoring Rules”). The Tailoring Rules do not significantly change the capital requirements that apply to DB USA Corporation or DWS USA Corporation, although they provide the option to comply with certain simplifications to the capital requirements. However, the Tailoring Rules provide modest relief for our U.S. IHCs with respect to applicable liquidity requirements so long as the IHCs’ combined weighted short term wholesale funding remains below $75 billion.
The Federal Reserve Board has the authority to examine an IHC, such as DB USA Corporation and DWS USA Corporation, and its subsidiaries, as well as U.S. branches and agencies of FBOs, such as our New York branch. An FBO’s U.S. branches and agencies are not held beneath an IHC; however, the U.S. branches and agencies of the FBO are subject to certain liquidity requirements, as well as other enhanced prudential standards applicable to the combined U.S. operations, such as risk management and oversight and, under certain circumstances, asset maintenance requirements. Additionally, the Tailoring Rules also placed requirements on the FBO itself related to the adequacy and reporting of the FBO’s home country capital and stress testing regime.
In June 2018 and October 2019, the Federal Reserve Board finalized rules relating to single counterparty credit limits that apply to the combined U.S. operations and IHCs of certain large FBOs, including Deutsche Bank. Under these rules, our IHCs are prohibited from having net credit exposure to a single unaffiliated counterparty in excess of 25 percent of each IHC’s tier 1 capital. Our combined U.S. operations (including our IHCs and our New York branch) would have become separately subject to similar restrictions beginning July 1, 2021 unless Deutsche Bank AG certified compliance with a home country large exposure regime that is consistent with the Basel large exposure framework. Deutsche Bank AG has availed itself of substituted compliance through certification for its combined U.S. operations, as the European Union’s framework became effective on June 28, 2021.
In addition, the Federal Reserve Board proposed but has not adopted an “early remediation” framework under which it would implement prescribed restrictions and penalties against the FBO and its U.S. operations, such as restrictions on the ability of the FBO and its U.S. operations to make discretionary compensation payments to certain of its officers and directors, if the FBO and/or its U.S. operations do not meet certain risk-based capital, leverage, liquidity, stress testing or other risk management requirements, and would authorize the termination of U.S. operations under certain circumstances.
As a bank holding company with assets of U.S.$ 250 billion or more, Deutsche Bank AG is required under Title I of the Dodd-Frank Act to prepare and submit to the Federal Reserve Board and the Federal Deposit Insurance Corporation (“FDIC”) either a full or targeted resolution plan (the “U.S. Resolution Plan”) on a timeline prescribed by such agencies. The U.S. Resolution Plan must demonstrate that Deutsche Bank AG has the ability to execute a strategy for the orderly resolution of its designated U.S. material entities and operations. For foreign-based companies subject to these resolution planning requirements such as Deutsche Bank AG, the U.S. Resolution Plan relates only to subsidiaries, branches, agencies and businesses that are domiciled in or whose activities are carried out in whole or in material part in the United States. Deutsche Bank’s U.S. Resolution Plan describes the single point of entry strategy for Deutsche Bank’s U.S. material entities and operations and prescribes that DB USA Corporation would provide liquidity and capital support to its U.S. material entity subsidiaries and ensure their solvent wind-down outside of applicable resolution proceedings. On December 9, 2020, the Federal Reserve Board and FDIC finalized guidance for the resolution plans of certain large foreign banks, including Deutsche Bank AG. In that guidance, the agencies tailored their expectations around resolution capital and liquidity, derivatives and trading activity, as well as payment, clearing, and settlement activities. The agencies also provided information to large banks, including Deutsche Bank AG, regarding additional content to be included in the 2021 U.S. resolution plans, which were required to be filed by December 17, 2021. Deutsche Bank’s ‘targeted’ 2021 U.S. Resolution Plan, the firm’s first ‘targeted plan’, includes core elements of the U.S. resolution strategy — such as capital, liquidity, and recapitalization strategies — as well as how Deutsche Bank has integrated lessons learned from its response to the COVID-19 pandemic into its resolution planning process. Deutsche Bank AG submitted its targeted 2021 U.S. Resolution Plan on December 13, 2021.
DB USA Corporation and DWS USA Corporation are each subject, on an annual basis, to the Federal Reserve Board’s supervisory stress testing and capital requirements. DB USA Corporation and DWS USA Corporation are also subject to the Federal Reserve’s Comprehensive Capital Analysis and Review (“CCAR”), which is an annual supervisory exercise that assesses the capital positions and planning practices of large bank holding companies and IHCs. On June 24, 2021, the Federal Reserve Board publicly released the results of its annual supervisory stress test, which showed that DB USA Corporation and DWS USA Corporation would continue to have capital levels above minimum requirements even under the stress test’s severely adverse scenario. DB USA Corporation and DWS USA Corporation submitted their annual capital plans in April 2021 and will make their next capital plan submissions to the Federal Reserve Board in April 2022. On March 4, 2020, the Federal Reserve Board issued a rule to amend its CCAR process to combine the CCAR quantitative assessment and the buffer requirements in the Federal Reserve Board’s capital rules to create an integrated capital buffer requirement. This final rule has eliminated the quantitative and qualitative ‘pass/fail’ assessments from CCAR and modified the static capital conservation buffer to incorporate an institution-specific stress capital buffer (SCB), which is floored at 2.5 %.
|
81
|
|
|
Deutsche Bank
|
Signatures
|
|
|
Annual Report 2021 on Form 20-F
|
Change in Internal Control over Financial Reporting
|
|
|
|
|
The stress capital buffer equals (i) a bank holding company's projected peak-to-trough decline in common equity tier 1 capital under the annual CCAR supervisory severely adverse stress testing scenario prior to any planned capital actions, plus (ii) one year of planned common stock dividends. The stress capital buffer will be reset each year. On August 5, 2021, the Federal Reserve Board announced an SCB for each CCAR firm based on 2021 supervisory stress testing results, which for DB USA Corporation was 4.5 % and for DWS USA Corporation was 7.2 %. This SCB became effective October 1, 2021 and would generally remain in effect until September 30, 2022, at which point the size of the SCB for each of our IHCs will be recalibrated based on the results of the 2022 stress tests, which are expected to be released in June 2022.
The U.S. federal bank regulators in 2013 issued final rules implementing elements of the Basel 3 capital adequacy framework that are applicable to U.S. banking organizations.
In September 2014, the Federal Reserve Board and other U.S. regulators approved a final rule implementing liquidity coverage ratio (“LCR”) requirements for large U.S. bank holding companies and certain of their subsidiary depositary institutions that are generally consistent with the Basel Committee’s revised Basel 3 liquidity standards. These LCR requirements are applicable to DB USA Corporation, DWS USA Corporation and DBTCA. The Tailoring Rules reduced the LCR requirements applicable to these institutions from 100 to 85 percent coverage of net outflows over a projected 30-day period.
On October 20, 2020, the Federal Reserve Board and other U.S. regulators finalized rules implementing the second element of the Basel 3 liquidity framework, the net stable funding ratio (“NSFR”). Under the Tailoring Rules, DB USA Corporation, DWS USA Corporation and DBTCA are subject to an 85 percent NSFR so long as our IHCs’ combined weighted short term wholesale funding remains below $75 billion. Effective July 1, 2021, these f
irms are required to calculate the NSFR on a daily basis. Beginning in 2023, these firms will be required to publicly report NSFR information on a periodic basis.
On December 15, 2016, the Federal Reserve Board adopted final rules that implement a U.S. version of the FSB’s TLAC standard in the United States. The final rules require, among other things, the U.S. IHCs of non-U.S. G-SIBs, including DB USA Corporation and DWS USA Corporation, to maintain a minimum TLAC amount, and separately require them to maintain a minimum amount of eligible long-term debt. Under the final rules, the required TLAC amount and the ability or inability of the IHC to count long-term debt issued externally towards the requirements varies depending on the G-SIB’s planned resolution strategy. DB USA Corporation and DWS USA Corporation are each considered a “non-resolution covered IHC”, which means that they are intended, under the planned resolution strategy of their G-SIB parent (Deutsche Bank AG), to continue to operate outside of resolution proceedings while the G-SIB parent is subject to a bail-in under the applicable European resolution regime. The final rules require a “non-resolution covered IHC” to maintain (i) internal minimum TLAC of at least 16 % of its risk-weighted assets, 6 % of its Basel 3 leverage ratio denominator and 8 % of its average total consolidated assets, and (ii) internal eligible long-term debt of at least 6 % of its risk-weighted assets, 2.5 % of its Basel 3 leverage ratio denominator and 3.5 % of its average total consolidated assets. Eligible long-term debt instruments for non-resolution covered IHCs are required to meet certain criteria, including issuance to a foreign company that controls directly or indirectly the covered IHC or a foreign affiliate (a non-U.S. entity that is wholly owned, directly or indirectly, by the non-U.S. G-SIB) and the inclusion of a contractual trigger allowing for, in limited circumstances, the immediate conversion or exchange of some or all of the instrument into Common Equity Tier 1 instruments upon an order by the Federal Reserve Board. Internal TLAC requirements may be satisfied with a combination of eligible long-term debt instruments and Tier 1 capital. Each of DB USA Corporation and DWS USA Corporation would also face restrictions on its discretionary bonus payments and capital distributions if it fails to maintain a TLAC buffer consisting of Common Equity Tier 1 capital above the minimum TLAC requirement equal to 2.5 % of risk-weighted assets. The final rules also prohibit or limit the ability of DB USA Corporation and DWS USA Corporation to engage in certain types of financial transactions.
In October 2020, the Federal Reserve Board finalized a proposal to align the calculation of TLAC buffer for U.S. IHCs of non-U.S. G-SIBs with the calculation methodology used by U.S. G-SIBs which took effect on April 1, 2021.
Furthermore, the Dodd-Frank Act provides for an extensive framework for the regulation of over-the-counter (“OTC”) derivatives, including mandatory clearing, exchange trading and transaction reporting of certain OTC derivatives, as well as rules regarding registration, capital, margin, business conduct standards, recordkeeping and other requirements for swap dealers, security-based swap dealers, major swap participants and major security-based swap participants. The Commodity Futures Trading Commission (“CFTC”) has adopted rules implementing the most significant provisions of the Dodd-Frank Act. More recently, in October 2020, also pursuant to the Dodd-Frank Act, the CFTC finalized regulations to impose position limits on certain commodities and economically equivalent swaps, futures and options. In July 2020, the CFTC adopted final rules on the cross-border application of U.S. swap rules, building on the CFTC’s cross-border guidance from 2013 and related no-action relief letters. The Securities and Exchange Commission (“SEC”) has also finalized rules regarding registration, capital, margin, risk-mitigation techniques, trade reporting, business conduct standards, trade acknowledgement and verification requirements, recordkeeping and financial reporting, and cross-border requirements for security-based swap dealers. These rules generally came into effect in November 2021, the first compliance date for registration of security-based swap dealers and major security-based swap participants.
|
82
|
|
|
Deutsche Bank
|
Signatures
|
|
|
Annual Report 2021 on Form 20-F
|
Change in Internal Control over Financial Reporting
|
|
|
|
|
Finally, the U.S. prudential regulators (the Federal Reserve Board, the FDIC, the Office of the Comptroller of the Currency, the Farm Credit Administration and the Federal Housing Finance Agency) have adopted final rules establishing margin requirements for non-cleared swaps and security-based swaps that are applicable to swap dealers and security-based swap dealers that are subject to U.S. prudential regulations in lieu of the CFTC’s and SEC’s margin rules. The final margin rules follow a phased implementation schedule, with certain initial margin and variation margin requirements in effect as of September 2016, additional variation margin requirements in effect as of March 2017, and additional initial margin requirements phased in from September 2017 through September 2022, with the relevant compliance dates depending in each case on the transactional volume of the parties and their affiliates.
The Dodd-Frank Act, as amended, also established a regulatory framework and enhanced regulation for several other areas, including but not limited to the following. The Dodd-Frank Act established a new regime for the orderly liquidation of failing financial companies through the appointment of the FDIC as receiver that is available only if the U.S. Secretary of the Treasury determines in consultation with the U.S. President that certain criteria are met, including that the failure of the company and its resolution under otherwise applicable federal or state law would have serious adverse effects on U.S. financial stability. In addition, the Dodd-Frank Act requires U.S. regulatory agencies to prescribe regulations with respect to incentive-based compensation at financial institutions in order to prevent inappropriate behavior that could lead to a material financial loss. Other provisions require issuers with securities listed on U.S. stock exchanges, which may include foreign private issuers such as Deutsche Bank, to establish a “claw back” policy to recoup previously awarded executive compensation in the event of an accounting restatement; in May 2016, the SEC re-proposed rules to implement this provision of the Dodd-Frank Act that would cover foreign private issuers, and in October 2021, the SEC reopened the proposed rules for public comment, but such rules have not yet been adopted. The Dodd-Frank Act also grants the SEC discretionary rule-making authority to impose a new fiduciary standard on brokers, dealers and investment advisers; pursuant to this authority, on June 5, 2019, the SEC adopted rules and interpretations applicable to the relationships between such entities and their retail customers, and full compliance was required on June 30, 2020. The Dodd-Frank Act also expands the extraterritorial jurisdiction of U.S. courts over actions brought by the SEC or the United States with respect to violations of the antifraud provisions of the Securities Act of 1933, the Securities Exchange Act of 1934 and the Investment Advisers Act of 1940.
Implementation of the Dodd-Frank Act and related final regulations will result in additional costs and could limit or restrict the way we conduct our business.
Regulatory Authorities
We, as well as our wholly owned subsidiary DB USA Corporation are bank holding companies under the U.S. Bank Holding Company Act of 1956, as amended (the “Bank Holding Company Act“), by virtue of, among other things, our and its ownership of DBTCA. We and DB USA Corporation have elected to be financial holding companies pursuant to the provisions of the Gramm-Leach-Bliley Act (the “GLB Act”) and, accordingly, may affiliate with securities firms and engage in other activities that are financial in nature or incidental or complementary to activities that are financial in nature. As a bank holding company and financial holding company, Deutsche Bank’s U.S. operations are subject to regulation, supervision and examination by the Federal Reserve Board as our U.S. “umbrella supervisor”.
DBTCA is a New York state-chartered bank whose deposits are insured by the FDIC to the extent permitted by law. DBTCA is subject to regulation, supervision and examination by the Federal Reserve and the New York State Department of Financial Services and to applicable FDIC rules. In addition, DBTCA is also subject to regulation by the Consumer Financial Protection Bureau in relation to retail products and services offered to its customers. Deutsche Bank Trust Company Delaware is a Delaware state-chartered bank which is subject to regulation, supervision and examination by the FDIC and the Office of the State Bank Commissioner of Delaware. Deutsche Bank AG’s New York branch is supervised by the Federal Reserve and the New York State Department of Financial Services. Deutsche Bank’s federally chartered non-depository trust companies are subject to regulation, supervision and examination by the Office of the Comptroller of the Currency. We and our subsidiaries are also subject to regulation, supervision and examination by state banking regulators of certain states in which we and they conduct banking operations.
|
83
|
|
|
Deutsche Bank
|
Signatures
|
|
|
Annual Report 2021 on Form 20-F
|
Change in Internal Control over Financial Reporting
|
|
|
|
|
Restrictions on Activities
As described below, federal and state banking laws and regulations restrict our ability to engage, directly or indirectly through subsidiaries, in activities in the United States. Among others, we are required to obtain the prior approval of the Federal Reserve Board before directly or indirectly acquiring the ownership or control of more than 5 % of any class of voting shares of U.S. banks, certain other depository institutions, and bank or depository institution holding companies. Under applicable U.S. federal banking law, our U.S. banking operations are also restricted from engaging in certain “tying” arrangements involving products and services.
Our two U.S. FDIC-insured bank subsidiaries, as well as our New York branch, are subject to requirements and restrictions under federal and state law, including requirements to maintain reserves against deposits, restrictions on the types and amounts of loans that may be made and the interest that may be charged thereon, and limitations on the types of investments that may be made and the types of services that may be offered.
In addition to the business of banking, and managing or controlling banks, so long as we are a financial holding company under U.S. law, we may also engage in nonbanking activities in the United States that are financial in nature, or incidental or complementary to such financial activity, including certain securities, merchant banking, insurance and other financial activities, subject to certain limitations on the conduct of such activities and to notice or prior regulatory approval in some cases. As a non-U.S. bank, Deutsche Bank AG and our non-U.S. subsidiaries are generally authorized under U.S. law and regulations to acquire a non-U.S. company engaged in nonfinancial activities as long as that company’s U.S. operations do not exceed certain thresholds and certain other conditions are met.
In November 2018, the Federal Reserve Board adopted a revised supervisory rating system for bank holding companies with U.S.$ 100 billion or more in total consolidated assets and for IHCs with U.S.$ 50 billion or more in total consolidated assets, such as DB USA Corporation. The revised system also generally applies to DWS USA Corporation. Under the revised system, covered companies receive separate ratings from the Federal Reserve for (i) capital planning and positions, (ii) liquidity risk management and positions and (iii) governance and controls. Each of these component areas will receive one of the following four ratings: (i) Broadly Meets Expectations, (ii) Conditionally Meets Expectations, (iii) Deficient-1, and (iv) Deficient-2. A covered company must maintain a rating of Broadly Meets Expectations or Conditionally Meets Expectations for each of the three components to be considered “well managed.”
In February 2021, the Federal Reserve Board issued guidance, initially proposed in August 2017, intended to enhance the effectiveness of boards of directors and refocus the Federal Reserve Board’s supervisory expectations for boards of directors on their core responsibilities, and also to delineate between roles and responsibilities for boards of directors and for senior management. Although the proposed guidance does not directly apply to DB USA Corporation or DWS USA Corporation, the Federal Reserve Board indicated that it expects to issue a separate proposal on governance specific to IHCs.
Our status as a financial holding company, and our resulting ability to engage in a broader range of nonbanking activities, are dependent on Deutsche Bank AG, DB USA Corporation and our two insured U.S. depository institutions qualifying as “well capitalized” and “well managed” under applicable regulations and upon our insured U.S. depository institutions meeting certain requirements under the Community Reinvestment Act. The Federal Reserve Board’s and other U.S. regulators’ “well capitalized” standards are generally based on specified quantitative thresholds set at levels above the minimum requirements to be considered “adequately capitalized.” For our two insured depository institution subsidiaries, DBTCA and Deutsche Bank Trust Company Delaware, the well-capitalized thresholds under the U.S. Basel 3 framework are a Common Equity Tier 1 capital ratio of 6.5 %, a Tier 1 capital ratio of 8 %, a Total capital ratio of 10 %, and a U.S. leverage ratio of 5 %. For bank holding companies, including Deutsche Bank AG and DB USA Corporation, the well-capitalized thresholds are a Tier 1 capital ratio of 6 % and a Total capital ratio of 10 %, both of which in the case of Deutsche Bank AG are calculated for Deutsche Bank AG under its home country standards.
State-chartered banks (such as DBTCA) and state-licensed branches and agencies of foreign banks (such as our New York branch) may not, with certain exceptions that require prior regulatory approval, engage as a principal in any type of activity not permissible for their federally chartered or licensed counterparts. In addition, DBTCA and Deutsche Bank Trust Company Delaware are subject to their respective state banking laws pertaining to legal lending limits and permissible investments and activities. Likewise, the United States federal banking laws also subject state-licensed branches and agencies to the single-borrower lending limits that apply to federally licensed branches or agencies, which are substantially similar to the lending limits applicable to national banks. The single-borrower lending limits applicable to branches and agencies are calculated based on the dollar equivalent of the capital of the foreign bank (i.e., Deutsche Bank AG in the case of the New York branch).
|
84
|
|
|
Deutsche Bank
|
Signatures
|
|
|
Annual Report 2021 on Form 20-F
|
Change in Internal Control over Financial Reporting
|
|
|
|
|
The Federal Reserve Board may terminate the activities of any U.S. office of a foreign bank if it determines that the foreign bank is not subject to comprehensive supervision on a consolidated basis in its home country or that there is reasonable cause to believe that such foreign bank or its affiliate has violated the law or engaged in an unsafe or unsound banking practice in the United States or, for a foreign bank that presents a risk to the stability of the United States financial system, the home country of the foreign bank has not adopted, or made demonstrable progress toward adopting, an appropriate system of financial regulation to mitigate such risk.
Also, under the so-called swaps “push-out” provisions of the Dodd-Frank Act, certain structured finance derivatives activities of FDIC-insured banks and U.S. branch offices of foreign banks (including our New York branch) are restricted.
There are various qualitative and quantitative restrictions on the extent to which we and our nonbank subsidiaries can borrow or otherwise obtain credit from our U.S. banking subsidiaries or engage in certain other transactions involving those subsidiaries, including derivative transactions and securities borrowing or lending transactions. In general, these transactions must be on terms that would ordinarily be offered to unaffiliated entities, must be secured by designated amounts of specified collateral and are subject to volume limitations. These restrictions also apply to certain transactions of our New York branch with our U.S. broker-dealers and certain of our other U.S. affiliates.
A major focus of U.S. governmental policy relating to financial institutions is aimed at preventing money laundering and terrorist financing and compliance with economic sanctions in respect of designated countries or activities. Failure of an institution to have policies and procedures and controls in place to prevent, detect and report money laundering and terrorist financing could in some cases have serious legal, financial and reputational consequences for the institution.
New York Branch
The New York branch of Deutsche Bank AG is licensed by the Superintendent of the New York State Department of Financial Services to conduct a commercial banking business and is required to maintain and pledge eligible high-quality assets with banks in the State of New York. The Superintendent of Financial Services may also impose asset maintenance requirements on foreign banks with branch offices in New York. In addition, the Federal Reserve Board is authorized to impose institution-specific asset maintenance requirements under certain conditions, pursuant to the Tailoring Rules.
The New York State Banking Law authorizes the Superintendent of Financial Services to take possession of the business and property of a New York branch of a foreign bank under certain circumstances, generally involving violation of law, conduct of business in an unsafe manner, impairment of capital, suspension of payment of obligations, or initiation of liquidation proceedings against the foreign bank at its domicile or elsewhere. In liquidating or dealing with a branch’s business after taking possession of a branch, only the claims of depositors and other creditors which arose out of transactions with a branch are to be accepted by the Superintendent of Financial Services for payment out of the business and property of the foreign bank in the State of New York or in the U.S. and reflected on the books of the New York branch, without prejudice to the rights of the holders of such claims to be satisfied out of other assets of the foreign bank. After such claims are paid, the Superintendent of Financial Services will turn over the remaining assets, if any, first to the liquidators of other offices of the foreign bank that are being liquidated in the United States and then, if any assets remain, to the foreign bank or its duly appointed liquidator or receiver.
The New York branch’s deposits and other note obligations are not permitted to be, and are not, insured by the FDIC. In general, under the International Banking Act and FDIC regulations, the New York branch is not permitted to engage in domestic retail deposit activity (accepting an initial deposit of less than US$250,000). The New York branch may not engage as principal in any type of activity that is not permissible for a federally licensed branch of a foreign bank unless the Federal Reserve Board has determined that such activity is consistent with sound banking practice. The New York branch must also comply with the same single borrower (or issuer) lending and investment limits applicable to federally licensed branches, which are substantially similar to the lending limits applicable to national banks. The lending limits applicable to the New York branch take into account credit exposures from derivative transactions. These limits are based on the foreign bank’s worldwide capital. In addition, regulations that the U.S. Financial Stability Oversight Council or other regulators may adopt could affect the nature of the activities which the New York branch may conduct, and may impose restrictions and limitations on the conduct of such activities.
|
85
|
|
|
Deutsche Bank
|
Signatures
|
|
|
Annual Report 2021 on Form 20-F
|
Change in Internal Control over Financial Reporting
|
|
|
|
|
Deutsche Bank Trust Company Americas
The Federal Deposit Insurance Corporation Improvement Act of 1991 (“FDICIA”) provides for extensive regulation of depository institutions (such as DBTCA and its direct and indirect parent companies), including requiring federal banking regulators to take “prompt corrective action” with respect to FDIC-insured banks that do not meet minimum capital requirements. As an insured bank’s capital level declines and the bank falls into lower categories (or if it is placed in a lower category by the discretionary action of its supervisor), greater limits are placed on its activities and federal banking regulators are authorized (and, in many cases, required) to take increasingly more stringent supervisory actions, which could ultimately include the appointment of a conservator or receiver for the bank (even if it is solvent). In addition, FDICIA generally prohibits an FDIC-insured bank from making any capital distribution (including payment of a dividend) or payment of a management fee to its holding company if the bank would thereafter be undercapitalized. If an insured bank becomes “undercapitalized”, it is required to submit to federal regulators a capital restoration plan guaranteed by the bank’s holding company. Since the enactment of FDICIA, both of our U.S. insured banks have maintained capital above the “well capitalized” standards, the highest capital category under applicable regulations.
DBTCA, like other FDIC-insured banks, is required to pay assessments to the FDIC for deposit insurance under the FDIC’s Deposit Insurance Fund (calculated using the FDIC’s risk-based assessment system). The minimum reserve ratio for the Deposit Insurance Fund was increased under the Dodd-Frank Act from 1.15 % to 1.35 %, which was reached as of September 30, 2018 following the imposition from July 1, 2016 through that date of a surcharge on the quarterly assessments of large insured depository institutions, including DBTCA. In addition, the FDIC has set the designated reserve ratio at 2 % as a long-term goal. The FDIC’s standard maximum deposit insurance amount per depositor at an insured depository institution is U.S.$ 250,000.
Other
In the United States, our U.S.-registered broker-dealers are regulated by the SEC. Broker-dealers are subject to regulations that cover all aspects of the securities business, including sales methods, trade practices among broker-dealers, use and safekeeping of customers’ funds and securities, capital structure, recordkeeping, the financing of customers’ purchases and the conduct of directors, officers and employees.
Our principal U.S. SEC-registered broker-dealer subsidiary, Deutsche Bank Securities Inc., is a member of the New York Stock Exchange (and other securities exchanges) and is regulated by the Financial Industry Regulatory Authority, Inc. (“FINRA”) and the individual state securities authorities in the states in which it operates. The U.S. government agencies and self-regulatory organizations, as well as state securities authorities in the United States having jurisdiction over our U.S. broker-dealer affiliates, are empowered to conduct administrative proceedings that can result in censure, fine, the issuance of cease-and-desist orders or the suspension or expulsion of a broker-dealer or its directors, officers or employees. Deutsche Bank Securities Inc. is also registered with and regulated by the SEC as an investment adviser, and by the CFTC and the National Futures Association as a futures commission merchant and commodity pool operator.
Under the Dodd-Frank Act, with certain exceptions, entities that are swap dealers, security-based swap dealers, major swap participants or major security-based swap participants are required to register with the SEC or CFTC, or both. Currently, Deutsche Bank AG is provisionally registered as a swap dealer with the CFTC and is conditionally registered as a security-based swap dealer with the SEC. Registration, including provisional and conditional registration, as a swap dealer, security-based swap dealer, major swap participant or major security-based swap participant subjects the registrant to requirements as to capital, margin, business conduct and recordkeeping, among other requirements.
|
86
|
|
|
Deutsche Bank
|
Signatures
|
|
|
Annual Report 2021 on Form 20-F
|
Change in Internal Control over Financial Reporting
|
|
|
|
|
Organizational Structure
We operate our business along the structure of our four corporate divisions and the Capital Release Unit. Deutsche Bank AG is the direct or indirect holding company for our subsidiaries. The following table sets forth the significant subsidiaries we own, directly or indirectly, as of December 31, 2021. We used the three-part test set out in Section 1-02 (w) of Regulation S-X under the U.S. Securities Exchange Act of 1934 to determine significance. We do not have any other subsidiaries we believe are material based on other, less quantifiable, factors.
We own 100 % of the equity and voting interests in these subsidiaries except for DWS Group GmbH Co. KGaA, of which we own 79.49 % of equity and voting interests. These subsidiaries are included in our consolidated financial statements and prepare standalone financial statements as of December 31, 2021. Their principal countries of operation are the same as their countries of incorporation.
|
Subsidiary
|
|
Place of Incorporation
|
|
DB USA Corporation
1
|
|
Delaware, United States
|
|
Deutsche Bank Americas Holding Corporation
2
|
|
Delaware, United States
|
|
DB U.S. Financial Markets Holding Corporation
3
|
|
Delaware, United States
|
|
Deutsche Bank Securities Inc.
4
|
|
Delaware, United States
|
|
Deutsche Bank Trust Corporation
5
|
|
New York, United States
|
|
Deutsche Bank Trust Company Americas
6
|
|
New York, United States
|
|
Deutsche Bank Luxembourg S.A.
7
|
|
Luxembourg
|
|
DB Beteiligungs-Holding GmbH
8
|
|
Frankfurt am Main, Germany
|
|
DWS Group GmbH Co. KGaA
9
|
|
Frankfurt am Main, Germany
|
|
|
|
|
1
DB USA Corporation is the top-level holding company for our subsidiaries in the United States.
2
Deutsche Bank Americas Holding Corporation is a second tier holding company for subsidiaries in the United States.
3
DB U.S. Financial Markets Holding Corporation is a second tier holding company for subsidiaries in the United States.
4
Deutsche Bank Securities Inc. is a U.S. company registered as a broker dealer and investment advisor with the Securities and Exchange Commission and as a futures commission merchant with the Commodities Futures Trading Commission.
5
Deutsche Bank Trust Corporation is a bank holding company under Federal Reserve Board regulations.
6
Deutsche Bank Trust Company Americas is a New York State-chartered bank and member of the Federal Reserve System. It originates loans and other forms of credit, accepts deposits, arranges financings and provides numerous other commercial banking and financial services.
7
The company's primary business model comprises loan business with international clients (Corporate Bank Investment Bank), where the bank acts globally as lending office and as risk transfer hub for the Strategic Corporate Lending of Deutsche Bank, as well as structured finance activities covering long-term infrastructure projects and high quality investment goods. Furthermore, the bank offers tailor-made solutions with a wide range of products and services to their ultra-high-net-worth (UHNW) clients.
8
The company holds the majority stake in DWS Group GmbH Co. KGaA.
9
The company is a partnership limited by shares (Kommanditgesellschaft auf Aktien) with a German limited liability company (Gesellschaft mit beschränkter Haftung) as a general partner. The business purpose of the company is the holding of participations in as well as the management and support of a group of financial services providers. Following the public listing on March 23, 2018 on the Frankfurt Stock Exchange Deutsche Bank Group owns 79.49 % of equity and voting interests in the entity.
Property and Equipment
As of December 31, 2021, we operated in 58 countries out of 1,709 branches around the world, of which 67 % were in Germany. We lease a majority of our offices and branches under long-term agreements.
We continue to review our property requirements worldwide taking into account cost containment measures as well as growth initiatives in selected businesses. Please see Note 21 “Property and Equipment” and Note 42 “Impact of Deutsche Bank´s transformation” to the consolidated financial statements for further information.
Information required by subpart 1400 of SEC Regulation S-K
Please see pages S-1 through S-10 of the Supplemental Financial Information (Unaudited), which pages are incorporated by reference herein, for information required by subpart 1400 of SEC Regulation S-K.
|
87
|
|
|
Deutsche Bank
|
Signatures
|
|
|
Annual Report 2021 on Form 20-F
|
Change in Internal Control over Financial Reporting
|
|
|
|
|
Item 4A: Unresolved Staff Comments
We have not received written comments from the Securities and Exchange Commission regarding our periodic reports under the Exchange Act, as of any day 180 days or more before the end of the fiscal year to which this annual report relates, which remain unresolved.
Item 5: Operating and Financial Review and Prospects
Overview
The following discussion and analysis should be read in conjunction with the consolidated financial statements and the related notes to them included in “Item 18: Financial Statements” of this document, on which we have based this discussion and
analysis.
We have prepared our consolidated financial statements in accordance with IFRS as issued by the International Accounting Standards Board (“IASB”).
Significant Accounting Policies and Critical Accounting Estimates
Our significant accounting policies are essential to understanding our reported results of operations and financial condition. Certain of these accounting policies require critical accounting estimates that involve complex and subjective judgments and the use of assumptions, some of which may be for matters that are inherently uncertain and susceptible to change. Such critical accounting estimates could change from period to period and have a material impact on our financial condition, changes in financial condition or results of operations. Critical accounting estimates could also involve estimates where management could have reasonably used another estimate in the current accounting period. Actual results may differ from these estimates if conditions or underlying circumstances were to change. See Note 1 “Significant Accounting Policies and Critical Accounting Estimates” to the consolidated financial statements for a discussion on our significant accounting policies and critical accounting estimates.
We have identified the following significant accounting policies that involve critical accounting estimates:
- – the impairment of associates
- – the impairment of financial assets at fair value through other comprehensive income
- – the determination of fair value
- – the recognition of trade date profit
- – the impairment of loans and provisions for off-balance sheet positions
- – the impairment of goodwill and other intangibles
- – the recognition and measurement of deferred tax assets
- – the accounting for legal and regulatory contingencies and uncertain tax positions
|
88
|
|
|
Deutsche Bank
|
Signatures
|
|
|
Annual Report 2021 on Form 20-F
|
Change in Internal Control over Financial Reporting
|
|
|
|
|
Recently Adopted Accounting Pronouncements and New Accounting Pronouncements
See Note 2 “Recently Adopted and New Accounting Pronouncements” to the consolidated financial statements for a discussion on our recently adopted and new accounting pronouncements.
|
89
|
|
|
Deutsche Bank
|
Signatures
|
|
|
Annual Report 2021 on Form 20-F
|
Change in Internal Control over Financial Reporting
|
|
|
|
|
Operating Results
You should read the following discussion and analysis in conjunction with our consolidated financial statements.
Executive Summary
Please see “Management Report: Operating and Financial Review: Executive Summary” in the Annual Report 2021.
Trends and Uncertainties
For insight into the trends impacting our performance please see the “Management Report: Operating and Financial Review” section of the Annual Report 2021. Key risks and uncertainties for the Bank are discussed in “Item 3: Key Information – Risk Factors”.
The Bank’s future performance and the implementation of our strategic goals could be influenced by a number of uncertainties. Challenges may arise from economic growth prospects, the interest rate environment, inflationary pressure and supply chain disruption, geopolitical risks and competition in the financial services industry as well as higher market volatility, in particular in light of the COVID-19 pandemic and its ongoing impacts as well as political and economic instability in key markets.
On February 24, 2022, Russia commenced large-scale military action against Ukraine. In response to the Russian military action against Ukraine, the West has moved to impose broad-based sanctions targeting Russia, including but not limited to major Russian banks, certain other companies, Russian parliament members and certain members of the Russian elite and their families but also banning primary / secondary trading of sovereign debt and other select securities. Secondary effects of these developments, for example the cost and sufficiency of energy supplies in Western Europe and the economic impact of various scenarios, are hard to predict and could be severe. Where possible and to the extent of our current knowledge, these impacts, including potential Russian countermeasures, have been considered in our portfolio strategy. We are monitoring the developments closely and utilizing dedicated governance structures including Global and Regional Crisis Management as and when required.
In addition, regulatory, tax and supervisory requirements continue to evolve. Although regulatory reforms have been selectively delayed in order to support banks’ efforts to more easily manage the impacts from COVID-19 and provide financing to the real economy, the regulatory reforms (e.g. imposing capital surcharges and implementation of Final Basel III reforms), enacted and proposed in response to weaknesses identified during the last financial crisis together with the increased regulatory scrutiny and discretion will impose material costs on us, create significant uncertainty and may adversely affect our business plans as well as our ability to execute our strategic plans in the medium-term. Those changes that require us to maintain increased capital may significantly affect our business model, financial condition and results of operation as well as the competitive environment generally. In addition, we are involved in litigation, tax examinations, arbitration and regulatory proceedings and investigations. Such matters are subject to many uncertainties.
While we seek to achieve efficiencies in our operations, the realization of planned savings will be dependent on the successful and timely implementation of our updated strategy measures. The benefits, costs and timeframe of the implementation of our strategy could be adversely affected by unforeseen difficulties in the implementation process as well as factors beyond our control, such as negative market developments.
Risks to our Corporate Bank (CB) outlook include potential impacts on our business model from macroeconomic and global geopolitical uncertainty, including uncertainties around the duration of and recovery from the COVID-19 pandemic and associated with the Russian military action against the Ukraine. In addition, uncertainty around central bank policies (e.g., the interest rate environment), ongoing regulatory developments (e.g., the finalization of the Basel III framework), geopolitical event risks and levels of client activity may also have an adverse impact.
There are several risks to our Investment Bank (IB) outlook in 2022. The ongoing COVID-19 pandemic has the potential to create further disruption to the economic recovery. The relative success of the vaccination roll outs to the developing world and any potential new variants could well have positive or adverse impacts. The impact of the current Russian military action against the Ukraine on financial markets is highly uncertain. Central bank policies, specifically around tapering and interest rates create risks, as does the potential for a period of higher inflation along with ongoing regulatory developments. More broadly, geopolitical event risks may also have an adverse impact.
|
90
|
|
|
Deutsche Bank
|
Signatures
|
|
|
Annual Report 2021 on Form 20-F
|
Change in Internal Control over Financial Reporting
|
|
|
|
|
Risks to our Private Bank (PB) outlook include potential impacts on our business model from macroeconomic uncertainties, including uncertainties around the duration of and recovery from COVID-19 pandemic and associated with the Russian military action against the Ukraine, uncertainty on interest rates in the Eurozone, slower economic growth in our major operating countries and lower client activity. Client activity could be impacted by market uncertainties including higher than expected volatility in equity and credit markets. The implementation of regulatory requirements including consumer protection measures and delays in the implementation of our strategic projects could also have a negative impact on our revenues, capital consumption and costs.
In our Asset Management (AM) outlook, the recent military action Russia commenced against Ukraine has increased the political and economic uncertainty, which may have an impact on our forward-looking assumptions and impact on our growth forecast.
Risks to our Capital Release Unit (CRU) outlook include the legal and regulatory environment, which we continue to carefully monitor, particularly regarding the foreign currency denominated mortgage portfolio in Poland. Adverse judicial or regulatory developments could have a negative impact on the portfolio.
In 2022, we expect Corporate Other (CO) to generate a pre-tax loss; however this loss is expected to be lower compared to the previous year. Results will continue to be impacted by valuation and timing differences on positions that are economically hedged but do not meet the accounting requirements for hedge accounting. There will be certain transitional costs held centrally relating to changes in our internal funds transfer pricing (‘FTP’) framework, as well as costs linked to legacy activities relating to the merger of the DB Privat- und Firmenkundenbank AG into Deutsche Bank AG. We expect to retain around € 300 million in total related to these funding costs in CO in 2022. Expenses associated with shareholder activities as defined in the OECD Transfer Pricing guidelines not allocated to the business divisions are expected to be around € 400 million, lower compared to the previous year. CO is also expected to be impacted by higher group-wide incremental investments, mainly in our IT and Anti-Financial Crime areas.
The effective tax rate in future periods may be influenced by changes in tax laws or interpretative guidance, the occurrence of non-tax deductible litigation and other charges, changes in the measurement of deferred tax assets, or the resolution of tax examinations and investigations.
Results of Operations
Please see “Management Report: Operating and Financial Review: Results of Operations” in the Annual Report 2021 and our discussion of Non-GAAP financial measures in the “Supplementary Financial Information”.
Financial Position
Please see “Management Report: Operating and Financial Review: Financial Position” in the Annual Report 2021.
Liquidity and Capital Resources
For a detailed discussion of our liquidity risk management, see “Management Report: Risk Report: Liquidity Risk” in the Annual Report 2021.
For a detailed discussion of our capital management, see “Management Report: Risk Report: Capital Management” in the Annual Report 2021.
Post-Employment Benefit Plans
Please see “Management Report: Employees: Post-Employment Benefit Plans” in the Annual Report 2021.
|
91
|
|
|
Deutsche Bank
|
Signatures
|
|
|
Annual Report 2021 on Form 20-F
|
Change in Internal Control over Financial Reporting
|
|
|
|
|
Off-Balance Sheet Arrangements
For information on the nature, purpose and extent of our off-balance sheet arrangements, please see Note 38 “Structured Entities” to the consolidated financial statements. For further information on off-balance sheet arrangements, including allowances for off-balance sheet positions, please refer to “Management Report: Risk Report: Asset Quality: Allowance for Credit Losses” in the Annual Report 2021 and Note 19 “Allowance for Credit Losses” to the consolidated financial statements. For information on irrevocable lending commitments and contingent liabilities with respect to third parties, please see Note 28 “Credit related Commitments” to the consolidated financial statements.
Tabular Disclosure of Contractual Obligations
Please see “Management Report: Operating and Financial Review: Tabular Disclosure of Contractual Obligations” in the Annual Report 2021.
Research and Development, Patents and Licenses
Not applicable.
|
92
|
|
|
Deutsche Bank
|
Signatures
|
|
|
Annual Report 2021 on Form 20-F
|
Change in Internal Control over Financial Reporting
|
|
|
|
|
Item 6: Directors, Senior Management and Employees
Directors and Senior Management
In accordance with the German Stock Corporation Act (Aktiengesetz), we have a Management Board (Vorstand) and a Supervisory Board (Aufsichtsrat). The German Stock Corporation Act prohibits simultaneous membership on both the Management Board and the Supervisory Board. The members of the Management Board are the executive officers of our company. The Management Board is responsible for managing our company and representing us in dealings with third parties. The Supervisory Board oversees the Management Board, appoints and removes its members and determines their remuneration and other compensation components, including pension benefits. According to German law, our Supervisory Board represents us in dealings with members of the Management Board. Therefore, no members of the Management Board may enter into any agreement with us without the prior consent of our Supervisory Board.
Age limits for members of the Management Board are defined contractually. Accordingly, the appointment as member of the Management Board shall end in principle with the close of the ordinary general meeting in the year, in which the Management Board Member reaches the retirement age according to the rules of the German statutory pension insurance scheme applicable in Germany for the long-time insured to claim an early retirement pension (“Renteneineintrittsalter zur vorzeitigen Inanspruchnahme der Altersrente für langjährig Versicherte”), which is currently 63 years of age. Age limits also exist for the members of the Supervisory Board according to the Terms of Reference (Geschäftsordnung) for our Supervisory Board. There is a maximum age limit of 70 years for members of the Supervisory Board. In exceptional cases, a Supervisory Board member can be elected or appointed for a period that extends no longer than until the end of the fourth Ordinary General Meeting that takes place after he/she has reached the age of 70.
The Supervisory Board may not make management decisions. However, German law and our Articles of Association (Satzung) require the Management Board to obtain the approval of the Supervisory Board for certain actions. The most important of these actions are:
- – granting of general powers of attorney (Generalvollmachten). A general power of attorney authorizes its holder to represent the company in substantially all legal matters without limitation to the affairs of a specific office;
- – acquisitions and disposals (including transactions carried out by a dependent company) of real estate in so far as the object involves more than € 500,000,000;
- – granting of credits, including the acquisition of participations in other companies, where the German Banking Act (Kreditwesengesetz) requires approval by the Supervisory Board. In particular, pursuant to the German Banking Act, it requires of the Supervisory Board inter alia the approval if we grant a loan (to the extent legally permissible) to a member of the Management Board or the Supervisory Board or one of our employees who holds a procuration (Prokura) or general power of attorney; and
- – acquisitions and disposals (including transactions carried out by a dependent company) of other participations, insofar as the object involves more than € 1 billion. The Supervisory Board must be informed without delay of any acquisition or disposal of such participations involving more than € 500,000,000.
The Management Board must submit regular reports or ad-hoc reports, as the case may be, to the Supervisory Board on our current operations and future business planning as well as on our risk situation. The Supervisory Board may also request special reports from the Management Board at any time.
With respect to voting powers, a member of the Supervisory Board or the Management Board may not vote on resolutions open to a vote at a board meeting if the proposed resolution concerns:
- – a legal transaction between us and the respective member; or
- – commencement, settlement or completion of legal proceedings between us and the respective member.
A member of the Supervisory Board or the Management Board may not directly or indirectly exercise voting rights on resolutions open to a vote at a shareholders’ meeting (Hauptversammlung, which we refer to as the General Meeting) if the proposed resolution concerns:
- – ratification of the member’s acts;
- – a discharge of liability of the member; or
- – enforcement of a claim against the member by us.
|
93
|
|
|
Deutsche Bank
|
Signatures
|
|
|
Annual Report 2021 on Form 20-F
|
Change in Internal Control over Financial Reporting
|
|
|
|
|
Supervisory Board and Management Board
In carrying out their duties, members of both the Management Board and Supervisory Board must exercise the standard of care of a prudent and diligent business person, and they are liable to us for damages if they fail to do so.
The liability of the members of the Management Board or the Supervisory Board under the German Stock Corporation Act for breach of their fiduciary duties is to the company rather than individual shareholders. However, individual shareholders that hold at least 1 % or € 100,000 of the subscribed capital and are granted standing by the court may also invoke such liability to the company. The underlying concept is that all shareholders should benefit equally from amounts received under this liability by adding such amounts to the company’s assets rather than disbursing them to plaintiff shareholders. We may waive the right to claim damages or settle these claims if at least three years have passed since the alleged breach and if the shareholders approve the waiver or settlement at the General Meeting with a simple majority of the votes cast, and provided that opposing shareholders do not hold, in the aggregate, one tenth or more of our share capital and do not have their opposition formally noted in the minutes maintained by a German notary.
Supervisory Board
The German Co-Determination Act of 1976 (Mitbestimmungsgesetz) requires our Supervisory Board to have twenty members, which is also reflected in the Articles of Association. In the event that the number of members of our Supervisory Board falls below twenty, upon application to a competent court, the court must appoint replacement members to serve on the board until official appointments are made by the general meeting of shareholders (with respect to shareholder representatives) or the employees and their representatives (with respect to employee representatives).
The German Co-Determination Act of 1976 (Mitbestimmungsgesetz) requires that the shareholders elect half of the members of the supervisory board of large German companies, such as Deutsche Bank, and that employees in Germany elect the other half. None of the current members of either of our boards were selected pursuant to any arrangement or understandings with major shareholders, customers or others.
Each member of the Supervisory Board generally serves for a fixed term of approximately five years. For the election of shareholder representatives, the General Meeting may establish that the terms of office of individual members may begin or end on differing dates. Pursuant to German law, the term expires at the latest at the end of the Annual General Meeting that approves and ratifies such member’s actions in the fourth fiscal year after the year in which the Supervisory Board member was elected. Supervisory Board members may also be re-elected. The shareholders may, by a majority of the votes cast in a General Meeting, remove any member of the Supervisory Board they have elected in a General Meeting. The employees may remove any member they have elected by a vote of three-quarters of the employee votes cast.
The members of the Supervisory Board elect the chairperson and the deputy chairperson of the Supervisory Board. Traditionally, the chairperson is a representative of the shareholders, and the deputy chairperson is a representative of the employees. At least half of the members of the Supervisory Board must be present at a meeting or must have submitted their vote in writing to constitute a quorum. In general, approval by a simple majority of the members of the Supervisory Board present and voting is required to pass a resolution. In the case of a deadlock, the resolution is put to a second vote. In the case of a second deadlock, the chairperson has the deciding vote.
For additional information on our Supervisory Board, including a table providing the names of and biographical information for the current members, see “Corporate Governance Statement: Management Board and Supervisory Board: Supervisory Board” in the Annual Report 2021.
Committees of the Supervisory Board
For information on the committees of our Supervisory Board, please see “Corporate Governance Statement: Management Board and Supervisory Board: Committees of the Supervisory Board” in the Annual Report 2021.
The business address of the members of the Supervisory Board is the same as our business address, Taunusanlage 12, 60325 Frankfurt am Main, Germany.
|
94
|
|
|
Deutsche Bank
|
Signatures
|
|
|
Annual Report 2021 on Form 20-F
|
Change in Internal Control over Financial Reporting
|
|
|
|
|
Management Board
Our Articles of Association require the Management Board to have at least three members. Our Management Board currently has ten members. The Supervisory Board has also appointed a Chairman (CEO) and one Deputy Chairman (President) of the Management Board.
The Supervisory Board appoints the members of the Management Board for a maximum term of five years and oversees them. They may be re-appointed or have their term extended for one or more terms of up to a maximum of five years each. The Supervisory Board may remove a member of the Management Board prior to the expiration of his or her term for good cause.
Pursuant to our Articles of Association, two members of the Management Board, or one member of the Management Board together with a holder of procuration, may represent us for legal purposes. A holder of procuration is an attorney-in-fact who holds a legally defined power under German law, which cannot be restricted with respect to third parties. However, pursuant to German law, the Management Board itself must resolve on certain matters as a whole and may not delegate the decision to one or more individual members. In particular, it may not delegate the determination of our business and risk strategies, and the coordinating or controlling responsibilities. The Management Board is required to ensure that shareholders are treated on an equal basis and receive equal information. The Management Board is also responsible for ensuring our proper business organization, which includes appropriate and effective risk management as well as compliance with legal requirements and internal guidelines, and for taking the necessary measures to ensure that adequate internal guidelines are developed and implemented.
Other selected responsibilities of the Management Board in accordance with the Terms of Reference for the Management Board and/or German law are:
- – appointing key personnel at the level directly below the Management Board, in particular, appointing the Global Key Function Holders employed by us;
- – making decisions regarding significant credit exposures or other risks which have not been delegated to individual risk management units;
- – acquisition and disposal of equity investments, including capital measures in all cases in which (i) the law or our Articles of Association require approval by the Supervisory Board, or (ii) the equivalent of € 100 million is exceeded;
- – acquisition and disposal of real estate – directly or by separate legal entities – in all cases in which: (i) the law or our Articles of Association require approval by the Supervisory Board, or (ii) the real estate’s equivalent exceeds € 100 million;
- – individual vendor or intra Group-outsourcings (or material changes to those outsourcings) in all cases in which the equivalent of € 100 million is exceeded on an annual basis or include the delegation of core organizational duties of the Management Board;
- – calling shareholders’ meetings;
- – filing petitions to set aside shareholders’ resolutions;
- – preparing and executing shareholders’ resolutions; and
- – reporting to the Supervisory Board.
For additional information on our Management Board, including the names of and biographical information for the current members, see “Corporate Governance Statement: Management Board and Supervisory Board: Management Board” in the Annual Report 2021. The Terms of Reference of the Management Board are published on our website www.db.com/ir/en/documents.htm.
Board Practices of the Management Board
The Terms of Reference for the Management Board are in accordance with the Supervisory Board resolution of October 29, 2021. These Terms of Reference provide that the members of the Management Board have the collective responsibility for managing Deutsche Bank. Notwithstanding this principle, the allocation of functional responsibilities to the individual members of the Management Board and their substitution (in case of temporary absence) are set out in the Business Allocation Plan for the Management Board in accordance with the Supervisory Board resolution of October 29, 2021. The allocation of functional responsibilities does not exempt any member of the Management Board from collective responsibility for the management of the business. The members of the Management Board are responsible for the proper performance and/or delegation of their duties and the clear allocation of accountabilities and responsibilities within the area of own functional responsibility (so-called “
Ressort
”) in accordance with the Business Allocation Plan.
|
95
|
|
|
Deutsche Bank
|
Signatures
|
|
|
Annual Report 2021 on Form 20-F
|
Change in Internal Control over Financial Reporting
|
|
|
|
|
Members of the Management Board are bound to the corporate interest of Deutsche Bank. No member of the Management Board may pursue personal interests in his/her decisions or use business opportunities intended for the company for himself/herself. To the extent permitted by German law, individual members of the Management Board may assume Deutsche Bank Group-external mandates, honorary offices or special assignments. In order to effectively prevent any conflicts of interest, the members of the Management Board may accept such positions only upon the approval of the other members of the Management Board and the Chairman’s Committee of the Supervisory Board. Management Board members generally do not accept the role of chair of supervisory boards of Group-external companies.
Section 161 of the German Stock Corporation Act requires that the management board and supervisory board of any German stock exchange-listed company declare annually that the company complies with the recommendations of the German Corporate Governance Code or, if not, which recommendations the company does not comply with and why it does not comply with these recommendations (so-called “comply or explain”-principle). On some points, these recommendations go beyond the requirements of the German Stock Corporation Act. The Management Board and Supervisory Board issued a new Declaration of Conformity in accordance with Section 161 of the German Stock Corporation Act in October 2021, which is available on our internet website at www.db.com/ir/en/documents.htm under the heading “Declaration of Conformity pursuant to Section 161 German Stock Corporation Act (AktG), Oct 2021”.
For information on the Management Board’s terms of office, please see “Corporate Governance Statement: Management Board and Supervisory Board: Management Board” in the Annual Report 2021. For details of the Management Board’s service contracts providing benefits upon termination, please see “Compensation Report: Benefits as of the end of the mandate” and “Compensation Report: Benefits upon Early Termination” in the Management Report of the Annual Report 2021.
The allocation of functional responsibilities to the individual members of the Management Board is described in the Business Allocation Plan for the Management Board, which sets the framework for the delegation of responsibilities to senior management below the Management Board. The Management Board endorses individual accountability of senior position holders as opposed to joint decision-taking in committees. At the same time, the Management Board recognizes the importance of having comprehensive and robust information across all businesses in order to take well informed decisions and established, in addition to Infrastructure Committees, Business Executive Committees and Regional Committees, the “Group Management Committee” which aims to improve the information flow across the Corporate Divisions and between the Corporate Divisions and the Management Board. The Group Management Committee as a senior platform, which is not required by the German Stock Corporation Act, is composed of all Management Board members as well as most senior business representatives to exchange information and discuss business, growth and profitability.
Compensation
For information on the compensation of the members of our Management Board, see Compensation Report: Management Board Compensation Report” in the Annual Report 2021.
For information on the compensation of the members of our Employees, see Compensation Report: Employee Compensation Report” in the Annual Report 2021.
For information on the compensation of the members of our Supervisory Board, see Compensation Report: Compensation System for Supervisory Board Members” in the Annual Report 2021.
|
96
|
|
|
Deutsche Bank
|
Signatures
|
|
|
Annual Report 2021 on Form 20-F
|
Change in Internal Control over Financial Reporting
|
|
|
|
|
Employees
Labor Relations
In Germany, labor unions and employers’ associations generally negotiate collective bargaining agreements on salaries and benefits for employees below the management level. Many companies in Germany, including ourselves and our material German subsidiaries, are members of the employers’ association and are bound by collective bargaining agreements.
Accordingly, our employers’ association, the “Arbeitgeberverband des privaten Bankgewerbes e.V.”, regularly renegotiates the collective bargaining agreements that cover many of our employees. The last agreement was reached in July 2019. As part of the final package, salaries were increased in two stages by a total of 4.0 %: 2.0 % from September 2019 and a further 2.0 % from November 2020. In addition to salary increases, the final result also included mutual negotiation obligations regarding new collective bargaining agreements on qualification, working hours, training and prevention as well as the start of a further modernization of the collective bargaining agreements. This collective wage agreement lasted until end of June 2021, negotiations between Arbeitgeberverband des privaten Bankgewerbes e.V. and the unions on a renewal are ongoing.
Our employers’ association negotiates with the following unions:
- – ver.di (Vereinigte Dienstleistungsgewerkschaft);
- – Deutscher Bankangestellten Verband (DBV – Gewerkschaft der Finanzdienstleister);
- – Deutscher Handels- und Industrieangestellten Verband (DHV – Die Berufsgewerkschaft; however, this applies until the middle of 2021 only, because DHV union was then declared by the Federal Labor Court to be incapable of concluding collective agreements)
As German law prohibits us from asking our employees whether they are members of labor unions, there is no record of how many of the bank’s employees are union members.
On the basis of the agreement on cross-border information and consultation of Deutsche Bank employees in the EU concluded on September 10, 1996, all employees in the EU are represented by the European Works Council. This adds up to around 53% of the Group's total workforce.
For further information on our employees, see “Management Report: Employees” in the Annual Report 2021.
Share Ownership
For the share ownership of the Management Board, see “Management Report: Compensation Report: Management Board Share Ownership” in the Annual Report 2021.
For the share ownership of the members of the Supervisory Board, see “Corporate Governance Statement/Corporate Governance Report: Reporting and Transparency: Directors’ Share Ownership” in the Annual Report 2021.
For a description of our employee share programs, please see Note 33 “Employee Benefits” to the consolidated financial statements.
|
97
|
|
|
Deutsche Bank
|
Signatures
|
|
|
Annual Report 2021 on Form 20-F
|
Change in Internal Control over Financial Reporting
|
|
|
|
|
Item 7: Major Shareholders and Related Party Transactions
Major Shareholders
On December 31, 2021, our issued share capital amounted to € 5,290,939,215.36 divided into 2,066,773,131 no par value ordinary registered shares.
On December 31, 2021, we had 574,644 registered shareholders. 893,547,039 of our shares were registered in the names of 564,220 shareholders resident in Germany, representing 43.23 % of our share capital. 273,502,796 of our shares were registered in the names of 538 shareholders resident in the United States, representing 13.23 % of our share capital.
The German Securities Trading Act (Wertpapierhandelsgesetz) requires investors in publicly-traded corporations whose investments reach certain thresholds to notify both the corporation and the BaFin of such change within four trading days. The minimum disclosure threshold is 3 % of the corporation’s issued voting share capital.
BlackRock, Inc., Wilmington, DE, has notified us that as of December 31, 2020 it held 5.23 % of our shares. We have received no further notification by BlackRock, Inc., Wilmington, DE, through February 18, 2022.
The Capital Group Companies, Inc., Los Angeles, California, has notified us that as of November 23, 2021 it held 5.20 % of our shares. We have received no further notification by The Capital Group Companies, Inc., Los Angeles, California, through February 18, 2022.
Douglas L. Braunstein
(
Hudson Executive Capital LP
), has notified us that as of November 20, 2020 he held 3.18 % of our shares. We have received no further notification by
Douglas L. Braunstein
(
Hudson Executive Capital LP
), through
February 18, 2022.
Paramount Services Holdings Ltd., British Virgin Islands, has notified us that as of August 20, 2015 it held 3.05 % of our shares. We have received no further notification by Paramount Services Holdings Ltd., British Virgin Islands, through February 18, 2022.
Supreme Universal Holdings Ltd., Cayman Islands, has notified us that as of August 20, 2015 it held 3.05 % of our shares. We have received no further notification by Supreme Universal Holdings Ltd., Cayman Islands, through February 18, 2022.
Over the last three years, we have been notified of the following changes with regards to the minimum disclosure threshold. BlackRock, Inc. had notified us that on May 17, 2019 it held 5.003 % of our shares. BlackRock, Inc. had notified us that on May 20, 2019 it held 4.99 % of our shares. BlackRock, Inc. had notified us that on May 21, 2019 it held 5.05 % of our shares. BlackRock, Inc. had notified us that on June 10, 2019 it held 4.81 % of our shares. BlackRock, Inc. had notified us that on June 20, 2019 it held 5.01 % of our shares. BlackRock, Inc. had notified us that on June 28, 2019 it held 4.97 % of our shares. BlackRock, Inc. had notified us that on July 4, 2019 it held 5.04 % of our shares. BlackRock, Inc. had notified us that on July 5, 2019 it held 4.98 % of our shares. BlackRock, Inc. had notified us that on December 2, 2020 it held 5.03 % of our shares BlackRock, Inc. had notified us that on December 3, 2020 it held 4.99 % of our shares. BlackRock, Inc. had notified us that on December 5, 2020 it held 5.03 % of our shares. BlackRock, Inc. had notified us that on December 16, 2020 it held 4.98 % of our shares. BlackRock, Inc. had notified us that on December 31, 2020 it held 5.23 % of our shares.
The Capital Group Companies, Inc. had notified us that on January 31, 2020 it held 3.10 % of our shares. The Capital Group Companies, Inc. had notified us that on March 23, 2020 it held 2.77 % of our shares. The Capital Group Companies, Inc. had notified us that on March 31, 2020 it held 3.74 % of our shares. The Capital Group Companies, Inc. had notified us that on November 23, 2020 it held 5.20 % of our shares.
Douglas L. Braunstein
(
Hudson Executive Capital LP
), has notified us that on November 20, 2020 he held 3.18 % of our shares.
Stephen A. Feinberg (Cerberus), had notified us that on January 10, 2022 he held 1.99 % of our shares from previously 3.001 % of our shares as of November 14, 2017.
|
98
|
|
|
Deutsche Bank
|
Signatures
|
|
|
Annual Report 2021 on Form 20-F
|
Change in Internal Control over Financial Reporting
|
|
|
|
|
UBS Group AG had notified us that on January 3, 2019 it held 3.35 % of our shares. UBS Group AG had notified us that on January 7, 2019 it held 2.96 % of our shares. UBS Group AG had notified us that on January 10, 2019 it held 3.04 % of our shares. UBS Group AG had notified us that on January 15, 2019 it held 2.99 % of our shares. UBS Group AG had notified us that on January 16, 2019 it held 3.03 % of our shares. UBS Group AG had notified us that on January 28, 2019 it held 2.97 % of our shares. UBS Group AG had notified us that on January 29, 2019 it held 2.92 % of our shares.
We are neither directly nor indirectly owned nor controlled by any other corporation, by any government or by any other natural or legal person severally or jointly.
Pursuant to German law and our Articles of Association, to the extent that we may have major shareholders at any time, we may not give them different voting rights from any of our other shareholders.
We are aware of no arrangements which may at a subsequent date result in a change in control of our company.
|
99
|
|
|
Deutsche Bank
|
Signatures
|
|
|
Annual Report 2021 on Form 20-F
|
Change in Internal Control over Financial Reporting
|
|
|
|
|
Related Party Transactions
We have business relationships with a number of the companies in which we own significant equity interests. We also have business relationships with a number of companies where members of our Management Board also hold positions on boards of directors. Our business relationships with these companies cover many of the financial services we provide to our clients generally. For more detailed information, refer to Note 36 “Related Party Transactions” to the consolidated financial statements.
We conduct our business with these companies on terms equivalent to those that would prevail if we did not have equity holdings in them or management members in common, and we have conducted business with these companies on that basis in 2021 and prior years. None of these transactions is or was material to us.
Among our business with related party companies in 2021, there have been and currently are loans, guarantees and commitments, which totaled € 151 million (including loans amounting to € 123 million) as of December 31, 2021, compared to € 212 million (including loans amounting to € 169 million) as of December 31, 2020.
All these credit exposures
- – were made in the ordinary course of business,
- – were made on substantially the same terms, including interest rates and collateral, as those prevailing at the time for comparable transactions with other persons, and
- – did not involve more than the normal risk of collectability or present other unfavorable features compared to loans to nonrelated parties at their initiation.
Related Party Impaired Loans
The Group did not have any
impaired loans to related parties
in 2021 and 2020.
Interests of Experts and Counsel
Not required because this document is filed as an annual report.
|
100
|
|
|
Deutsche Bank
|
Signatures
|
|
|
Annual Report 2021 on Form 20-F
|
Change in Internal Control over Financial Reporting
|
|
|
|
|
Item 8: Financial Information
Consolidated Statements and Other Financial Information
Consolidated Financial Statements
The Financial Statements of this Annual Report on Form 20-F consist of the Consolidated Financial Statements including Notes 1 to 44 thereto, which are set forth as Part 2 of the Annual Report 2021, and, as described in Note 1 “Significant Accounting Policies and Critical Accounting Estimates” thereto under “Basis of accounting – IFRS 7 disclosures”, certain parts of the Management Report set forth as Part 1 of the Annual Report 2021.
The Consolidated Financial Statements as of and for the years ended December 31, 2021 and 2020 have been audited by Ernst Young GmbH Wirtschaftsprüfungsgesellschaft, as described in their “Report of Independent Registered Public Accounting Firm” included in the Annual Report 2021.
The Consolidated Financial Statements as of and for the year ended December 31, 2019 have been audited by KPMG AG Wirtschaftsprüfungsgesellschaft, as described in their “Report of Independent Registered Public Accounting Firm” included in the Annual Report 2021.
Legal Proceedings
General.
We and our subsidiaries operate in a legal and regulatory environment that exposes us to significant litigation risks. As a result, we are involved in litigation, arbitration and regulatory proceedings and investigations in Germany and in a number of jurisdictions outside Germany, including the United States. Please refer to Note 27 “Provisions” to the Consolidated Financial Statements for descriptions of certain significant legal proceedings. Additional legal proceedings that may have, or have had in the recent past, significant effects on our financial position or profitability are described below.
Australian Antitrust Proceedings.
In June 2018, the Australian Commonwealth Director of Public Prosecutions (CDPP) filed charges against Deutsche Bank for alleged criminal cartel offenses following a referral by the Australian Competition and Consumer Commission. CDPP alleges that the cartel conduct took place in connection with an institutional share placement by Australia and New Zealand Banking Group Limited in August 2015, on which Deutsche Bank acted as joint underwriter with other banks. CDPP has also charged other banks and individuals, including two former Deutsche Bank employees. Deutsche Bank AG and its former employees have been charged with two offences of making, and giving effect to, anti-competitive arrangements. On February 11, 2022, the CDPP withdrew the charges against Deutsche Bank AG and its former employees.
Bank Bill Swap Rate Claims.
On August 16, 2016, a putative class action was filed in the U.S. District Court for the Southern District of New York against Deutsche Bank and other defendants, bringing claims based on alleged collusion and manipulation in connection with the Australian Bank Bill Swap Rate (“BBSW”) on behalf of persons and entities that engaged in U.S.-based transactions in BBSW-linked financial instruments from 2003 through the date on which the effects of the alleged unlawful conduct ceased. The complaint alleged that the defendants, among other things, engaged in money market transactions intended to influence the BBSW fixing, made false BBSW submissions, and used their control over BBSW rules to further the alleged misconduct. An amended complaint was filed on December 16, 2016. On November 26, 2018, the court partially granted defendants’ motions to dismiss the amended complaint, dismissing all claims against Deutsche Bank. On April 3, 2019, the plaintiffs filed a second amended complaint, which the defendants moved to dismiss. On February 13, 2020, the court partially granted the motion to dismiss the second amended complaint, with certain claims against Deutsche Bank remaining. On June 16, 2020, Deutsche Bank served an answer denying all allegations of misconduct. Discovery is ongoing.
|
101
|
|
|
Deutsche Bank
|
Signatures
|
|
|
Annual Report 2021 on Form 20-F
|
Change in Internal Control over Financial Reporting
|
|
|
|
|
FX derivatives products investigations and litigation.
Deutsche Bank has received requests for information from certain regulators in connection with its internal investigation into the historical sales of certain FX derivatives products with a limited number of clients. Deutsche Bank is providing information to and otherwise cooperating with its regulators. Separately, on September 30, 2021, Deutsche Bank was served with a claim that was filed in the High Courts of England and Wales by four companies within the Palladium Hotels Group (“PHG”). PHG are claiming restitution or damages for losses estimated at € 500 million in respect of FX derivatives trades entered into with Deutsche Bank between 2014 and 2019. They allege that Deutsche Bank made negligent misrepresentations, misstatements and/or breached a duty of care to PHG in relation to the trades. It is also alleged that one of the four PHG claimants lacked legal capacity to enter into some of the trades. On December 17, 2021, Deutsche Bank filed a defense disputing the claim on the following grounds: that PHG is a sophisticated investor with extensive experience of using derivatives, Deutsche Bank did not act as either an advisor or fiduciary to PHG, the trades reflected PHG’s own trading strategy and commercial objectives and were carried out with PHG’s full authorization, there were no misrepresentations, the relevant PHG claimant had capacity to enter into these trades, and that PHG well understood both the potential benefits and risks involved.
KOSPI Index Unwind Matters.
Following the decline of the Korea Composite Stock Price Index 200 (the “KOSPI 200”) in the closing auction on November 11, 2010 by approximately 2.7 %, the Korean Financial Supervisory Service (“FSS”) commenced an investigation and expressed concerns that the fall in the KOSPI 200 was attributable to a sale by Deutsche Bank of a basket of stocks, worth approximately € 1.6 billion, that was held as part of an index arbitrage position on the KOSPI 200. On February 23, 2011, the Korean Financial Services Commission, which oversees the work of the FSS, reviewed the FSS’ findings and recommendations and resolved to take the following actions: (i) to file a criminal complaint to the Korean Prosecutor’s Office for alleged market manipulation against five employees of Deutsche Bank group and Deutsche Bank’s subsidiary Deutsche Securities Korea Co. (DSK) for vicarious corporate criminal liability; and (ii) to impose a suspension of six months, commencing April 1, 2011 and ending September 30, 2011, of DSK’s business for proprietary trading of cash equities and listed derivatives and DMA (direct market access) cash equities trading, and the requirement that DSK suspend the employment of one named employee for six months. On August 19, 2011, the Korean Prosecutor’s Office announced its decision to indict DSK and four employees of Deutsche Bank group on charges of spot/futures-linked market manipulation. The criminal trial commenced in January 2012. On January 25, 2016, the Seoul Central District Court rendered guilty verdicts against a DSK trader and DSK. A criminal fine of KRW 1.5 billion (less than € 2.0 million) was imposed on DSK. The Court also ordered forfeiture of the profits generated on the underlying trading activity. The Group disgorged the profits on the underlying trading activity in 2011. The criminal trial verdicts against both the DSK trader and against DSK were overturned on appeal in a decision rendered by the Seoul High Court on December 12, 2018. The Korean Prosecutor’s Office has appealed the Seoul High Court decision.
In addition, a number of civil actions have been filed in Korean courts against Deutsche Bank and DSK by certain parties who allege they incurred losses as a consequence of the fall in the KOSPI 200 on November 11, 2010. First instance court decisions were rendered against the Bank and DSK in some of these cases starting in the fourth quarter of 2015. The outstanding claims known to Deutsche Bank have an aggregate claim amount of less than € 60 million (at present exchange rates).
Monte Dei Paschi.
In March 2013, Banca Monte dei Paschi di Siena (“MPS”) initiated civil proceedings in Italy against Deutsche Bank alleging that Deutsche Bank assisted former MPS senior management in an accounting fraud on MPS, by undertaking repo transactions with MPS and “Santorini”, a wholly owned special-purpose vehicle of MPS, which helped MPS defer losses on a previous transaction undertaken with Deutsche Bank. Subsequently, in July 2013, the Fondazione Monte dei Paschi di Siena (“FMPS”), MPS’ largest shareholder, also commenced civil proceedings in Italy for damages based on substantially the same facts. In December 2013, Deutsche Bank reached an agreement with MPS to settle the civil proceedings and the transactions were unwound. The civil proceedings initiated by FMPS, in which damages of between € 220 million and € 381 million were claimed, were also settled in December 2018 upon payment by Deutsche Bank of € 17.5 million. FMPS’s separate claim filed in July 2014 against FMPS’s former administrators and a syndicate of 12 banks including Deutsche Bank S.p.A. for € 286 million continues to be pending before the first instance Florence courts.
A criminal investigation was launched by the Siena Public Prosecutor into the transactions entered into by MPS with Deutsche Bank and certain unrelated transactions entered into by MPS with other parties. Such investigation was moved in summer 2014 from Siena to the Milan Public Prosecutors as a result of a change in the alleged charges being investigated. On February 16, 2016, the Milan Public Prosecutors issued a request of committal to trial against Deutsche Bank and six current and former employees. The committal process concluded with a hearing on October 1, 2016, during which the Milan court committed all defendants in the criminal proceedings to trial. Deutsche Bank’s potential exposure was for administrative liability under Italian Legislative Decree n. 231/2001 and for civil vicarious liability as an employer of current and former Deutsche Bank employees who are being criminally prosecuted.
|
102
|
|
|
Deutsche Bank
|
Signatures
|
|
|
Annual Report 2021 on Form 20-F
|
Change in Internal Control over Financial Reporting
|
|
|
|
|
On November 8, 2019, the Milan court issued its verdicts, finding five former employees and one current employee of Deutsche Bank guilty and sentencing them to either 3 years and 6 months or 4 years and 8 months. Deutsche Bank was found liable under Italian Legislative Decree n. 231/2001 and the court ordered the seizure of alleged profits of € 64.9 million and a fine of € 3 million. The Court also found Deutsche Bank has civil vicarious liability for damages (to be quantified by the civil court) as an employer of the current and former employees who were convicted. The sentences and fines are not due until the conclusion of any appeal process. The final judgment was issued by the Court on May 13, 2020. Deutsche Bank and the six former or current employees filed an appeal to the Milan Court of Appeal on September 22, 2020. The Milan Court of Appeal commenced hearing the appeal on December 2, 2021 and is scheduled to conclude the hearings on March 31, 2022.
On May 22, 2018, CONSOB, the authority responsible for regulating the Italian financial markets, issued fines of € 100,000 each against the six current and former employees of Deutsche Bank who are defendants in the criminal proceedings. The six individuals were also banned from performing management functions in Italy and for Italian based institutions for three to six months each. No separate fine or sanction was imposed on Deutsche Bank, but it is jointly and severally liable for the six current/former Deutsche Bank employees’ fines. On June 14, 2018, Deutsche Bank and the six individuals filed an appeal in the Milan Court of Appeal challenging CONSOB’s decision and one of the individuals sought a stay of enforcement of the fine against that individual. On December 17, 2020, the Milan Court of Appeal allowed the appeals filed by Deutsche Bank and the six current and former employees and annulled the resolution sanctioning them. CONSOB filed an appeal to the Supreme Court against the decision on June 17, 2021. Deutsche Bank and the six individuals have opposed the appeal.
Pension Plan Assets.
We sponsor a number of post-employment benefit plans on behalf of our employees. In Germany, the pension assets that fund the obligations under these pension plans are held by Benefit Trust GmbH. The German tax authorities challenged the tax treatment of certain income received by Benefit Trust GmbH in the years 2010 to 2013 with respect to its pension plan assets. For the year 2010 Benefit Trust GmbH had entered into litigation to seek a refund of amounts paid. In March 2021, the German supreme fiscal court (Bundesfinanzhof) ruled in favor of Benefit Trust GmbH, and the matter was closed for tax year 2010. For tax years 2011 to 2013 the matter was stayed pending the outcome of the 2010 litigation. The amount of tax and interest under dispute for years 2011 to 2013, which has been paid to the tax authorities, amounts to € 456 million. On February 24, 2022, the German tax authorities issued final tax assessments for the years 2011 to 2013 consistent with the court’s favorable decision for the year 2010, concluding the matter. The amount of tax and interest formerly in dispute that we had paid to the tax authorities has been returned to us.
Precious Metals Investigations and Litigations.
Deutsche Bank received inquiries from certain regulatory and law enforcement authorities, including requests for information and documents, pertaining to investigations of precious metals trading and related conduct. Deutsche Bank has cooperated with these investigations. On January 29, 2018, Deutsche Bank entered into a U.S.$ 30 million settlement with the U.S. Commodity Futures Trading Commission (“CFTC”) concerning spoofing, and manipulation and attempted manipulation in precious metals futures and of stop loss orders. On January 8, 2021, Deutsche Bank entered into a deferred prosecution agreement with the U.S. Department of Justice concerning spoofing and the Foreign Corrupt Practices Act conduct as mentioned in the Note 27 “Provisions” to the Consolidated Financial Statements. As part of its obligations in the deferred prosecution agreement, Deutsche Bank agreed to pay approximately U.S.$ 8 million, of which approximately U.S.$ 6 million would be credited by virtue of the aforementioned CFTC resolution.
Deutsche Bank is a defendant in two consolidated class action lawsuits pending in the U.S. District Court for the Southern District of New York. The suits allege violations of U.S. antitrust law, the U.S. Commodity Exchange Act and related state law arising out of the alleged manipulation of gold and silver prices through participation in the Gold and Silver Fixes. Deutsche Bank has reached agreements to settle the Gold action for U.S.$ 60 million and the Silver action for U.S.$ 38 million. The court granted final approval to the settlement in the silver action on June 15, 2021, and has scheduled a fairness hearing on the settlement in the gold action for August 5, 2022.
Pre-Release ADRs.
Deutsche Bank and certain affiliates have received inquiries from certain European regulatory, tax and law enforcement authorities, including requests for documents and information, with respect to American Depositary Receipts (ADRs), including ADRs that have been issued on a "pre-release" basis (“pre-release ADRs”). Deutsche Bank is cooperating with these inquiries.
Transfer of Lease Assets.
In December 2017, a claim for damages was filed with the Regional Court Frankfurt am Main against Deutsche Bank AG in the amount of approximately € 155 million (excluding interest). In 2006, Deutsche Bank AG (indirectly, through a special-purpose vehicle) entered into transactions according to which the plaintiff transferred certain lease assets to the special-purpose vehicle against, among other things, receipt of a preference dividend. The plaintiff alleges that Deutsche Bank had entered into an agreement with it under which Deutsche Bank provided flawed contractual documentation as a result of which the German tax authorities have disallowed the plaintiff’s expected tax savings. The Regional Court Frankfurt am Main fully dismissed the claim on July 26, 2019. The plaintiff has appealed this decision to the Higher Regional Court Frankfurt am Main. After its hearing on July 15, 2021, the Higher Regional Court Frankfurt am Main decided to reject the plaintiff‘s appeal in full. Leave to a further appeal has not been granted, however, the plaintiff has filed a non-admission complaint with the German Federal Court which is still pending.
|
103
|
|
|
Deutsche Bank
|
Signatures
|
|
|
Annual Report 2021 on Form 20-F
|
Change in Internal Control over Financial Reporting
|
|
|
|
|
Dividend Policy
For 2021, the Management Board intends to propose to the General Meeting a dividend of € 0.20 per share, after having paid no dividend for 2020 or 2019. Subject to regulatory approval and shareholder authorization and meeting German Corporate law requirements, the Management Board is committed to delivering sustainably growing cash dividends and returning excess capital to shareholders through share buybacks that is over and above what is required to support profitable growth and upcoming regulatory changes over time. To that end, subject to meeting our strategic targets, the Management Board intends to grow the cash dividend per share by 50 % p.a. in the next 3 years, starting from € 0.20 per share for the financial year 2021. In relation to the financial year 2024 the Management Board intends to achieve a total payout ratio of 50 % from a combination of dividends paid and share buybacks executed in 2025; and it intends to maintain a 50 % total payout ratio in subsequent years. However, we cannot assure investors that we will pay dividends as we did in previous years, nor at any other level, or at all, in any future period. If the company is not profitable, we may not pay dividends at all. Furthermore, if Deutsche Bank AG fails to meet the regulatory capital adequacy requirements under CRR/CRD (including individually imposed capital requirements (so-called “Pillar 2” requirements) and the combined buffer requirement), it may be prohibited from making, and the ECB or the BaFin may suspend or limit, the payment of dividends. In addition, the ECB expects banks to meet “Pillar 2” guidance. If Deutsche Bank AG operates or expects to operate below “Pillar 2” guidance, the ECB will review the reasons why the Bank’s capital level has fallen or is expected to fall and may take appropriate and proportionate measures in connection with such shortfall. Any such measures might have an impact on Deutsche Bank AG’s willingness or ability to pay dividends. For further information on regulatory capital adequacy requirements and the powers of Deutsche Bank AG’s regulators to suspend dividend payments, see “Item 4: Information on the Company – Regulation and Supervision – Capital Adequacy Requirements” and “– Investigative and Enforcement Powers.”
Under German law, Deutsche Bank AG’s dividends are based on the unconsolidated results of Deutsche Bank AG as prepared in accordance with the German Commercial Code (HGB). Deutsche Bank AG’s Management Board, which prepares the annual financial statements of Deutsche Bank AG on an unconsolidated basis, and its Supervisory Board, which reviews them, first allocate part of Deutsche Bank AG’s annual surplus (if any) to Deutsche Bank AG’s statutory reserves and to any losses carried forward, in accordance with applicable legal requirements. They then allocate the remainder of any surplus to other revenue reserves (or retained earnings) and balance sheet profit. They may allocate up to one-half of this remainder to other revenue reserves, and must allocate at least one-half to balance sheet profit. A profit distribution from the balance sheet profit is only permitted to the extent that the balance sheet profit plus distributable earnings exceed potential dividend blocking items, which consist primarily of deferred tax assets, self-developed software and unrealized gains on plan assets, all net of respective deferred tax liabilities.
Deutsche Bank AG may then distribute a portion of or all of the amount of the balance sheet profit not subject to dividend blocking of Deutsche Bank AG if the annual General Meeting so resolves. The annual General Meeting may resolve a non-cash distribution instead of, or in addition to, a cash dividend. However, Deutsche Bank AG is not legally required to distribute its balance sheet profit to its shareholders to the extent that it has issued participatory rights (
Genussrechte
) or granted a silent participation (
stille Beteiligung
) that accord their holders the right to a portion of Deutsche Bank AG’s distributable profit.
Deutsche Bank AG declares dividends by resolution of the annual General Meeting and pays them (if any) once a year. Dividends approved at a General Meeting are payable on the third business day after that meeting, unless a later date has been determined at that meeting or by the Articles of Association. In accordance with the German Stock Corporation Act, the record date for determining which holders of Deutsche Bank AG’s ordinary shares are entitled to the payment of dividends, if any, or other distributions whether cash, stock or property, is the date of the General Meeting at which such dividends or other distributions are declared.
Significant Changes
Except as otherwise stated in this document, there have been no significant changes subsequent to December 31, 2021.
|
104
|
|
|
Deutsche Bank
|
Signatures
|
|
|
Annual Report 2021 on Form 20-F
|
Change in Internal Control over Financial Reporting
|
|
|
|
|
Item 9: The Offer and Listing
Offer and Listing Details and Markets
Our share capital consists of ordinary shares issued in registered form without par value. Under German law, shares without par value are deemed to have a “nominal” value equal to the total amount of share capital divided by the number of shares. Our shares have a nominal value in this sense of € 2.56 per share.
The principal trading market for our shares is the Frankfurt Stock Exchange, where it trades under the symbol DBK. Our shares are also traded on the six other German stock exchanges (Berlin, Duesseldorf, Hamburg, Hanover, Munich and Stuttgart, where on each exchange it also trades under the symbol DBK), on the Eurex and the New York Stock Exchange, where it trades under the symbol DB.
We maintain a share register in Frankfurt am Main and, for the purposes of trading our shares on the New York Stock Exchange, a share register in New York.
All shares on German stock exchanges trade in euros, and all shares on the New York Stock Exchange trade in U.S. dollars.
You should not rely on our past share performance as a guide to our future share performance.
Plan of Distribution
Not required because this document is filed as an annual report.
Selling Shareholders
Not required because this document is filed as an annual report.
Dilution
Not required because this document is filed as an annual report.
Expenses of the Issue
Not required because this document is filed as an annual report.
|
105
|
|
|
Deutsche Bank
|
Signatures
|
|
|
Annual Report 2021 on Form 20-F
|
Change in Internal Control over Financial Reporting
|
|
|
|
|
Item 10: Additional Information
Share Capital
Not required because this document is filed as an annual report.
Memorandum and Articles of Association
The following is a summary of certain information relating to certain provisions of our Articles of Association, our share capital and German law. This summary is not complete and is qualified by reference to our Articles of Association and German law in effect at the date of this filing. Copies of our Articles of Association are publicly available at the Commercial Register (
Handelsregister
) in Frankfurt am Main, and an English translation is filed as Exhibit 1.1 to this Annual Report.
Our Business Objectives
Section 2 of our Articles of Association sets out the objectives of our business:
- – to transact all aspects of banking business;
- – to provide financial and other services; and
- – to promote international economic relations.
Our Articles of Association permit us to pursue these objectives directly or through subsidiaries and affiliated companies.
Our Articles of Association also provide that, to the extent permitted by law, we may transact all business and take all steps that appear likely to promote our business objectives. In particular, we may:
- – acquire and dispose of real estate;
- – establish branches in Germany and abroad;
- – acquire, administer and dispose of participations in other enterprises; and
- – conclude intercompany agreements ( Unternehmensverträge ).
Supervisory Board and Management Board
For more information on our Supervisory Board and Management Board, see “Item 6: Directors, Senior Management and
Employees.”
Voting Rights and Shareholders' Meetings
Each of our shares entitles its registered holder to one vote at our General Meeting. Our Annual General Meeting takes place within the first eight months of our fiscal year. Pursuant to our Articles of Association, we may hold the meeting in Frankfurt am Main, Düsseldorf or any other German city with over 250,000 inhabitants. Unless a shorter period is permitted by law, we must give the notice convening the General Meeting at least 30 days before the last day on which shareholders can register their attendance of the General Meeting (which is the sixth day immediately preceding that General Meeting). Shorter periods apply if the General Meeting is called to adopt a resolution on a capital increase in the context of early intervention measures pursuant to the Act on the Recovery and Resolution of Institutions and Financial Groups (Gesetz zur Sanierung und Abwicklung von Instituten und Finanzgruppen). We are required to include details regarding the shareholder attendance registration process and the issuance of admission cards in our invitation to the General Meeting.
The Management Board or the Supervisory Board may also call an extraordinary General Meeting. Shareholders holding in the aggregate at least 5 % of the nominal value of our share capital may also request that such a meeting be called.
|
106
|
|
|
Deutsche Bank
|
Signatures
|
|
|
Annual Report 2021 on Form 20-F
|
Change in Internal Control over Financial Reporting
|
|
|
|
|
According to our Articles of Association our shares are issued in the form of registered shares. For purposes of registration in the share register, all shareholders are required to notify us of the number of shares they hold and, in the case of natural persons, of their name, address and date of birth and, in the case of legal persons, of their registered name, business address and registered domicile, and in both cases should add an electronic address. Both being registered in our share register and the timely registration for attendance of the General Meeting constitute prerequisite conditions for any shareholder’s attendance and exercise of voting rights at the General Meeting. Shareholders may register their attendance of a General Meeting with the Management Board (or as otherwise designated in the invitation) by written notice or electronically, no later than the sixth day immediately preceding the date of that General Meeting. Any shareholders who have failed to comply with certain notification requirements summarized under “Notification Requirements” below are precluded from exercising any rights attached to their shares, including voting rights.
Under German law, upon our request a registered shareholder must inform us whether that shareholder owns the shares registered in its name or whether that shareholder holds the shares for any other person as a nominee shareholder. Both the nominee shareholder and the person for whom the shares are held have an obligation to provide the same personal data as required for registration in the share register with respect to the person for whom the shares are held.
Shareholders may appoint proxies to represent them at General Meetings. As a matter of German law, a proxy relating to voting rights granted by shares may be revoked at any time.
As a foreign private issuer, we are not required to file a proxy statement under U.S. securities law. The proxy voting process for our shareholders in the United States is substantially similar to the process for publicly held companies incorporated in the United States.
The Annual General Meeting normally adopts resolutions on the following matters:
- – appropriation of distributable balance sheet profits ( Bilanzgewinn ) from the preceding fiscal year;
- – formal ratification of the acts ( Entlastung ) of the members of the Management Board and the members of the Supervisory Board in the preceding fiscal year; and
- – appointment of independent auditors for the current fiscal year.
A simple majority of votes cast is generally sufficient to approve a measure, except in cases where a greater majority is otherwise required by our Articles of Association or by law. Under the German Stock Corporation Act and the German Transformation Act (
Umwandlungsgesetz
), certain resolutions of fundamental importance require a majority of at least 75 % of the share capital represented at the General Meeting adopting the resolution, in addition to a majority of the votes cast. Such resolutions include the following matters, among others:
- – amendments to our Articles of Association changing our business objectives;
- – capital increases that exclude subscription rights;
- – capital reductions;
- – creation of authorized or conditional capital;
- – our dissolution;
- – “transformations” under the German Transformation Act such as mergers, spin-offs and changes in our legal form;
- – transfer of all our assets;
- – integration of another company; and
- – intercompany agreements (in particular, domination and profit-transfer agreements).
Under certain circumstances, such as when a resolution violates our Articles of Association or the German Stock Corporation Act, shareholders may file a shareholder action with the appropriate Regional Court (
Landgericht
) in Germany to set aside resolutions adopted at the General Meeting.
Under German law, the rights of shareholders as a group can be changed by amendment of the company's articles of association. Any amendment of our Articles of Association requires a resolution of the General Meeting. The authority to amend our Articles of Association, insofar as such amendments merely relate to the wording, such as changes of the share capital as a result of the issuance of shares from authorized capital, has been assigned to our Supervisory Board by our Articles of Association. Pursuant to our Articles of Association, the resolutions of the General Meeting are taken by a simple majority of votes and, insofar as a majority of capital stock is required, by a simple majority of capital stock, except where law or our Articles of Association determine otherwise. The rights of individual shareholders can only be changed with their consent. Amendments to the Articles of Association become effective upon their registration in the Commercial Register.
|
107
|
|
|
Deutsche Bank
|
Signatures
|
|
|
Annual Report 2021 on Form 20-F
|
Change in Internal Control over Financial Reporting
|
|
|
|
|
Share Register
We maintain a share register with Link Market Services GmbH and our New York transfer agent, pursuant to an agency agreement between us and Link Market Services GmbH and a sub-agency agreement between Link Market Services GmbH and the New York transfer agent.
Our share register will be open for inspection by shareholders during normal business hours at our offices at Taunusanlage 12, 60325 Frankfurt am Main, Germany. The share register generally contains each shareholder's surname, first name, date of birth, address, as the case may be, electronic address and the number or the quantity of our shares held. Shareholders may prevent their personal information from appearing in the share register by holding their securities through a bank or custodian. Although the shareholder would remain the beneficial owner of the securities, only the bank's or custodian's name would appear in the share register.
Dividend Rights
For a summary of our dividend policy and legal basis for dividends under German law, see “Item 8: Financial Information – Dividend Policy.”
Increases in Share Capital
German law and our Articles of Association permit us to increase our share capital in any of three ways:
- – Resolution by our General Meeting authorizing the issuance of new shares.
- – Resolution by our General Meeting authorizing the Management Board, subject to the approval of the Supervisory Board, to issue new shares up to a specified amount (no more than 50 % of existing share capital) within a specified period, which may not exceed five years. This is referred to as authorized capital ( genehmigtes Kapital ).
- – Resolution by our General Meeting authorizing the issuance of new shares up to a specified amount (no more than 50 % of existing share capital) for specific purposes, such as for employee stock options, for use as consideration in a merger or to issue to holders of convertible bonds or other convertible securities. This is referred to as conditional capital ( bedingtes Kapital ).
The issuance of new ordinary shares by resolution of the General Meeting requires the simple majority of the votes cast and of the share capital represented at the General Meeting. Should the resolution of the General Meeting provide for the exclusion of shareholders’ preemptive rights in full or in part, the simple majority of the votes cast and a majority of at least 75 % of the share capital represented at the General Meeting are required. Similarly, resolutions of the General Meeting concerning the creation of authorized or conditional capital require the simple majority of the votes cast and a majority of at least 75 % of the share capital represented at the General Meeting.
Liquidation Rights
The German Stock Corporation Act requires that if we are liquidated, any liquidation proceeds remaining after the payment of all our liabilities will be distributed to our shareholders in proportion to their shareholdings.
Preemptive Rights
In principle, holders of our shares have preemptive rights allowing them to subscribe any shares, bonds convertible into, or attached warrants to subscribe for, our shares or participatory certificates we issue. Such preemptive rights exist in proportion to the number of shares currently held by the shareholder. Preemptive rights of shareholders may be excluded with respect to any capital increase, however, as part of the resolution by the General Meeting on such capital increase. Such a resolution by the General Meeting on a capital increase that excludes the shareholders’ preemptive rights with respect thereto requires both a majority of the votes cast and a majority of at least 75 % of the share capital represented at the General Meeting.
A resolution to exclude preemptive rights requires that the proposed exclusion is expressly disclosed in the agenda to the General Meeting and that the Management Board presents the reasons for the exclusion to the shareholders in a written report. Under the German Stock Corporation Act, preemptive rights may in particular be excluded with respect to capital increases not exceeding 10 % of the existing share capital with an issue price payable in cash not significantly below the stock exchange price at the time of issuance. In addition, shareholders may, in a resolution by the General Meeting on authorized capital, authorize the Management Board to exclude the preemptive rights with respect to newly issued shares from authorized capital in specific circumstances set forth in the resolution.
Shareholders are generally permitted to transfer their preemptive rights. Preemptive rights may be traded on one or more German stock exchanges for a limited number of days prior to the final day the preemptive rights can be exercised.
|
108
|
|
|
Deutsche Bank
|
Signatures
|
|
|
Annual Report 2021 on Form 20-F
|
Change in Internal Control over Financial Reporting
|
|
|
|
|
Notices and Reports
We publish notices pertaining to our shares and the General Meeting in the electronic German Federal Gazette (Bundes-
anzeiger) and, when so required, in at least one national newspaper designated for exchange notices.
We send our New York transfer agent, through publication or otherwise, a copy of each of our notices pertaining to any General Meeting, any adjourned General Meeting or our actions with respect to any cash or other distributions or the offering of any rights. We provide such notices in the form given or to be given to our shareholders. Our New York transfer agent is requested to arrange for the mailing of such notices to all shareholders registered in the New York registry.
We will make all notices we send to shareholders available at our principal office for inspection by shareholders.
Charges of Transfer Agents
We pay Link Market Services GmbH and our New York transfer agent customary fees for their services as transfer agents and registrars. Our shareholders will not be required to pay Link Market Services GmbH or our New York transfer agent any fees or charges in connection with their transfers of shares in the share register. Our shareholders will also not be required to pay any fees in connection with the conversion of dividends from euros to U.S. dollars.
Liability of Transfer Agents
Neither Link Market Services GmbH nor our New York transfer agent will be liable to shareholders if prevented or delayed by law, or any circumstances beyond their control, from performing their obligations as transfer agents and registrars.
Notification Requirements
Disclosure of Interests in a Listed Stock Corporation
Disclosure Obligations under the German Securities Trading Act
Deutsche Bank AG, as a listed company, and its shareholders are subject to the shareholding disclosure obligations under the German Securities Trading Act (
Wertpapierhandelsgesetz
). Pursuant to the German Securities Trading Act, any shareholder whose voting interest in a listed company like Deutsche Bank AG, through acquisition, sale or by other means, reaches, exceeds or falls below a 3 %, 5 %, 10 %, 15 %, 20 %, 25 %, 30 %, 50 % or 75 % threshold must notify us and the BaFin of its current aggregate voting interest in writing and without undue delay, but at the latest within four trading days. In connection with this requirement, the German Securities Trading Act contains various provisions regarding the attribution of voting rights to the person who actually controls the voting rights attached to the shares.
Furthermore, the voting rights attached to a third party’s shares are attributed to a shareholder if the shareholder coordinates its conduct concerning the listed company with the third party (so-called “acting in concert”) either through an agreement or other means. Acting in concert is deemed to exist if the parties coordinate their voting at the listed company’s general meeting or, outside the general meeting, coordinate their actions with the goal of significantly and permanently modifying the listed company’s corporate strategy. Each party’s voting rights are attributed to each of the other parties acting in concert.
|
109
|
|
|
Deutsche Bank
|
Signatures
|
|
|
Annual Report 2021 on Form 20-F
|
Change in Internal Control over Financial Reporting
|
|
|
|
|
Shareholders failing to comply with their notification obligations are prevented from exercising any rights attached to their shares (including voting rights and the right to receive dividends) until they have complied with the notification requirements. If the failure to comply with the notification obligations specifically relates to the size of the voting interest in the Deutsche Bank AG and is the result of willful or grossly negligent conduct, the suspension of shareholder rights is – subject to certain exceptions in case of an incorrect notification deviating no more than 10 % from the actual percentage of voting rights – extended by a six-month period commencing upon the submission of the required notification.
Except for the 3 % threshold, similar notification obligations exist for reaching, exceeding or falling below the thresholds described above when a person holds, directly or indirectly, certain instruments other than shares. This applies to instruments which grant upon maturity an unconditional right to acquire existing voting shares of Deutsche Bank AG, a discretionary right to acquire such shares, as well as to instruments that refer to such shares and have an economic effect similar to that of the aforementioned instruments, irrespective of whether such instruments are physically or cash-settled. These instruments include, for example, transferable securities, options, futures contracts and swaps. Voting rights to be attributed to a person based on any such instrument will generally be aggregated with the person’s other voting rights deriving from shares or other instruments.
Notice must be given without undue delay, but within four trading days at the latest. The notice period commences as soon as the person obliged to notify knows, or, under the circumstances should know, that his or her voting rights reach, exceed or fall below any of the abovementioned relevant thresholds, but in any event no later than two trading days after reaching, exceeding or falling below the threshold. Only in case that the voting rights reach, exceed or fall below any of the thresholds as a result of an event affecting all voting rights, the notice period might commence at a later stage. Deutsche Bank AG must publish the foregoing notifications without undue delay, but no later than within three trading days after their receipt, and report such publication to the BaFin. Furthermore, the Deutsche Bank AG must publish a notification in case of any increase or decrease of the total number of voting rights without undue delay, but within two trading days at the latest, and such notification must be reported to the BaFin and forwarded to the German Company Register (
Unternehmensregister
). An exception applies where the increase of the total number of voting rights is due to the issue of new shares from conditional capital. In this case, Deutsche Bank AG must publish the increase at the end of the month in which it occurred. However, such increase must also be notified without undue delay, but within two trading days at the latest, where any other increase or decrease of the total number of voting rights triggers the aforementioned notification requirement.
Non-compliance with the disclosure requirements regarding shareholdings and holdings of other instruments may result in a significant fine imposed by the BaFin. In addition, the BaFin publishes, on its website, sanctions imposed and measures taken indicating the person or entity responsible and the nature of the breach (so-called “naming and shaming”).
Shareholders whose voting rights reach or exceed thresholds of 10 % of the voting rights in a listed company, or higher thresholds, are obliged to inform the company within 20 trading days of the purpose of their investment and the origin of the funds used for such investment, unless the articles of association of the listed company provide otherwise. Our Articles of Association do not contain such a provision.
Disclosure Obligations under the German Securities Acquisition and Takeover Act
Pursuant to the German Securities Acquisition and Takeover Act (
Wertpapiererwerbs- und Übernahmegesetz
), any person whose voting interest reaches or exceeds 30 % of the voting shares of a listed stock corporation must, within seven calendar days, publish this fact (including the percentage of its voting rights) on the Internet and by means of an electronically operated financial information dissemination system. In addition, the person must subsequently make a mandatory public tender offer within four weeks to all shareholders of the listed company unless an exemption has been granted. The German Securities Acquisition and Takeover Act contains a number of provisions intended to ensure that shareholdings are attributed to those persons who actually control the voting rights attached to the shares. The provisions regarding coordinated conduct as part of the German Securities Acquisition and Takeover Act (so-called “acting in concert”) and the rules on the attribution of voting rights attached to shares of third parties are the same as the statutory securities trading provisions described above under “Disclosure Obligations under the German Securities Trading Act” except with respect to voting rights of shares underlying instruments whose holders are vested with the right to unilaterally acquire existing voting shares of the listed company or voting rights which may be acquired on the basis of instruments with similar economic effect. If a shareholder fails to provide notice on reaching or exceeding the 30 % threshold, or fails to make a public tender offer, the shareholder will be precluded from exercising any rights associated with its shares (including voting and dividend rights) until it has complied with the requirements under the German Securities Acquisition and Takeover Act. In addition, non-compliance with the disclosure requirement may result in a fine.
|
110
|
|
|
Deutsche Bank
|
Signatures
|
|
|
Annual Report 2021 on Form 20-F
|
Change in Internal Control over Financial Reporting
|
|
|
|
|
Disclosure of Participations in a Credit Institution
The German Banking Act (
Kreditwesengesetz
) requires any person intending to acquire, alone or acting in concert with another person, directly or indirectly, a qualifying holding (
bedeutende Beteiligung
) in a credit or financial services institution to notify the BaFin and the Bundesbank without undue delay and in writing of the intended acquisition. A qualifying holding is a direct or indirect holding in an undertaking which represents 10 % or more of the capital or voting rights or which makes it possible to exercise a significant influence over the management of such undertaking. The required notice must contain information demonstrating, among other things, the reliability of the person or, in the case of a corporation or other legal entity, the reliability of its directors and officers.
A person holding a qualifying holding shall also notify the BaFin and the Bundesbank without undue delay and in writing if he intends to increase the amount of the qualifying holding up to or beyond the thresholds of 20 %, 30 % or 50 % of the voting rights or capital or in such way that the institution comes under such person’s control or if such person intends to reduce the participation below 10 % or below one of the other thresholds described above.
The BaFin will have to confirm the receipt of a complete notification within two working days in writing to the proposed acquirer. Within a period of 60 working days from the BaFin’s written confirmation that a complete notification has been received (assessment period), the BaFin will review and, in accordance with Council Regulation (EU) No 1024/2013 of October 15, 2013 conferring specific tasks on the European Central Bank concerning policies relating to the prudential supervision of credit institutions, forward the notification and a proposal for a decision whether or not to object to the acquisition to the ECB. The ECB will decide whether or not to object to the acquisition on the basis of the applicable assessment criteria. Within the assessment period the ECB may prohibit the intended acquisition in particular if there appears to be reason to assume that the acquirer or its directors and officers are not reliable or that the acquirer is not financially sound, that the participation would impair the effective supervision of the relevant credit institution, that a prospective managing director (
Geschäftsleiter
) is not reliable or not qualified, that money laundering or financing of terrorism has occurred or been attempted in connection with the intended acquisition, or that there would be an increased risk of such illegal acts as a result of the intended acquisition. During the assessment period the BaFin may request further information necessary for its or the ECB’s assessment. Generally, such a request delays the expiration of the assessment period by up to 30 business days. If the information submitted is incomplete or incorrect the ECB may prohibit the intended acquisition.
If a person acquires a qualifying holding despite such prohibition or without making the required notification, the competent authority may prohibit the person from exercising the voting rights attached to the shares. In addition, non-compliance with the disclosure requirement may result in the imposition of a fine in accordance with statutory provisions. Moreover, the competent authority may order that any disposition of the shares requires its approval and may ultimately appoint a trustee to exercise the voting rights attached to the shares or to sell the shares to the extent they constitute a qualifying holding.
Review of Acquisition of 10 % of voting rights or more by the German Federal Ministry of Economic Affairs and Climate Action
Pursuant to the German Foreign Trade Act (
Außenwirtschaftsgesetz
) and the German Foreign Trade Regulation (
Außenwirtschaftsverordnung
), acquisitions may be reviewed by the German Federal Ministry of Economic Affairs and Climate Action (the “Ministry”) where the initial direct or indirect acquisition of voting rights in a German company by investors from outside the European Union (EU) and the European Free Trade Association (Iceland, Lichtenstein, Norway and Switzerland) exceed 10 %, 20 % or 25 %, or where voting rights in a German company by investors outside the EU or European Free Trade Association exceed 20 %, 25 %, 40 %, 50 % or 75 % through direct or indirect subsequent acquisitions. Both the thresholds for the applicable initial voting rights (10 %, 20 % or 25 %) and whether a filing obligation exists or not, depend on the industry sector the target company is active in. The Ministry must be notified in writing regarding the conclusion of a contract where the direct or indirect acquisition by an investor from outside the European Union and the European Free Trade Association is 10 % or 20 % (or where the direct or indirect subsequent acquisitions exceeding 20 %, 25 %, 40 %, 50 % or 75 % of the voting rights) of the voting rights in a German company which operates certain critical infrastructure (including inter alia certain services in the financial sector) or operates in other certain sensitive sectors (including inter alia certain technologies, IT, telecommunication, healthcare or the media). The Ministry must also be notified in writing regarding the conclusion of a contract where there is a direct or indirect acquisition by an investor from outside Germany of 10 % or more of the voting rights in a German company operating in the defense or cryptology sectors (or where the direct or indirect subsequent acquisitions exceeds 20 %, 25 %, 40 %, 50 % or 75 % of the voting rights). If Deutsche Bank is considered to be a company which operates in any such critical infrastructure or sensitive sector, the Ministry would need to be notified of an acquisition of voting rights in Deutsche Bank that meets the abovementioned thresholds. Pending clearance by the Ministry, an acquisition subject to this notification requirement must not be consummated without clearance and its implementation would be legally void.
|
111
|
|
|
Deutsche Bank
|
Signatures
|
|
|
Annual Report 2021 on Form 20-F
|
Change in Internal Control over Financial Reporting
|
|
|
|
|
Consummating such an acquisition without clearance may also result in monetary fines of up to € 500,000 or up to five years imprisonment. The acquirer may seek voluntary pre-clearance of a proposed acquisition from the Ministry that is not subject to a mandatory filing. The Ministry may impose conditions on the acquisition, prohibit the acquisition, or require that it is unwound, if the Ministry determines that the acquisition will likely affect the public order or public security of Germany or another EU member state, or in relation to certain projects or programs of interest for the European Union pursuant to the "EU-Screening regulation, or likely affects the essential security interests of Germany. The Ministry’s decision to review an acquisition must be made within two months following the Ministry’s knowledge of the conclusion of the acquisition contract, of the publication of the decision to launch a take-over bid or of the publication of the acquisition of control. The review must be completed within four months following receipt of the complete set of acquisition documents and any additional information requested by the Ministry. The Ministry can extend its review period up to an additional four months. A review is precluded if more than five years have passed since the acquisition.
EU Short Selling Regulation (ban on naked short selling)
Regulation (EU) No 236/2012 of the European Parliament and of the Council of March 14, 2012 on short selling and certain aspects of credit default swaps (the “EU Short Selling Regulation”) came into force on November 1, 2012. The EU Short Selling Regulation, the regulations adopted by the EU Commission implementing it, and the German act implementing the EU Short Selling Regulation replace the previously applicable German federal provisions governing the ban on naked short selling of shares and certain debt securities. (Short sales are sales of securities that the seller does not own, with the intention of buying back an identical security at a later point in time in order to be able to deliver the security. A short sale is “naked” when the seller has not borrowed the securities at the time of the short sale, or ensured they can be borrowed or obtained under a similar arrangement.) Under the EU Short Selling Regulation, except for certain exemptions, naked short sales of listed shares are not permitted. Short sales of listed shares that are covered by borrowing or similar arrangements are subject to the following transparency requirements. Significant net short positions in shares must be reported to the BaFin and, if a certain threshold is exceeded, they must also be publicly disclosed. Net short positions are calculated by netting the long and short positions held by a natural or legal person in the issued capital of the company concerned. The details are set forth in the EU Short Selling Regulation and the regulations adopted by the EU Commission implementing it. In certain situations described in greater detail in the EU Short Selling Regulation, the BaFin is permitted to limit short selling and comparable transactions.
Disclosure of Transactions of Managers
Art. 19 of Regulation (EU) No 596/2014 of the European Parliament and of the Council of April 16, 2014 on market abuse (the “EU Market Abuse Regulation”) requires persons with management responsibilities (“Managers”) in a listed company like Deutsche Bank AG to notify the company and the BaFin of their own transactions in shares or debt instruments of the company or financial instruments based thereon, in particular derivatives. Such notifications must be made promptly and no later than three business days after the date of the transaction. The notification obligation also applies to persons who are closely associated with a Manager. The obligation does not apply if the aggregate annual transactions by a Manager or persons with whom he or she is closely associated do not, individually, exceed a certain threshold amount through the end of a calendar year. The BaFin has made use of its authority to increase the threshold of € 5,000 set forth in the EU Marked Abuse Regulation to the maximum possible amount of € 20,000.
Deutsche Bank AG is required to promptly publish any notification received but in any case no later than two business days after receipt of such notification. The publication must be made in a manner which enables fast access to this information on a non-discriminatory basis in accordance with the implementing standards published by the European Securities and Markets Authority. Furthermore, Deutsche Bank AG must without undue delay notify the BaFin and forward the notification to the Company Register (Unternehmensregister). For the purposes of the EU Market Abuse Regulation, the following persons are deemed to be a Manager: members of management, administrative or supervisory bodies of Deutsche Bank AG as well as senior executives who are not such members but who have regular access to inside information relating directly or indirectly to the Company and who have power to take managerial decisions affecting the future developments and business prospects of the Company. The following persons are deemed to be closely associated with a Manager: spouses, registered civil partners (
eingetragene Lebenspartner
), dependent children and other relatives who at the time of the transaction requiring notification have lived in the same household with the Manager for at least one year. Legal entities for which the aforementioned persons have management responsibilities are also subject to the notification requirement. The aforementioned provisions also apply to legal entities, companies and institutions directly or indirectly controlled by a Manager or by a person closely associated with a Manager, which have been founded to the benefit of such a person, or whose economic interests correspond to a considerable extent to those of such a person. Non-compliance with the notification requirements may result in a fine.
|
112
|
|
|
Deutsche Bank
|
Signatures
|
|
|
Annual Report 2021 on Form 20-F
|
Change in Internal Control over Financial Reporting
|
|
|
|
|
Material Contracts
In the usual course of our business, we enter into numerous contracts with various other entities. We have not, however, entered into any material contracts outside the ordinary course of our business within the past two years.
Exchange Controls
As in other member states of the European Union, regulations issued by the competent European Union authorities to comply with United Nations resolutions have caused freeze orders on assets of certain legal and natural persons designated in such regulations. In addition, the European Union maintained a wide range of autonomous economic and financial sanctions on Iran. While all nuclear-related economic and financial EU sanctions against Iran were repealed on January 16, 2016, some restrictions remain in force.
Moreover, in response to Russia’s large-scale military action against Ukraine the European Union, the United States, the United Kingdom and others imposed broad-based sanctions against Russia.
With some exceptions, corporations or individuals residing in Germany are required to report to the Bundesbank any payment received from, or made to or for the account of, a nonresident corporation or individual that exceeds € 12,500 (or the equivalent in a foreign currency). This reporting requirement is for statistical purposes.
Subject to the above-mentioned exceptions, there are currently no German laws, decrees or regulations that would prevent the transfer of capital or remittance of dividends or other payments to our shareholders who are not residents or citizens of Germany.
There are also no restrictions under German law or our Articles of Association concerning the right of nonresident or foreign shareholders to hold our shares or to exercise any applicable voting rights. Where the investment reaches or exceeds certain thresholds, however, certain reporting obligations apply and the investment may become subject to review by the BaFin, the European Central Bank and other competent authorities. For more information see “Item 10: Additional Information – Notification Requirements”.
Taxation
The following is a general summary of material German and United States federal income tax consequences of the ownership and disposition of shares for a resident of the United States for purposes of the income tax convention between the United States and Germany (the “Treaty”) who is fully eligible for benefits under the Treaty. A U.S. resident will generally be entitled to Treaty benefits if it is:
- – the beneficial owner of shares (and of the dividends paid with respect to the shares);
- – an individual resident of the United States, a U.S. corporation, or a partnership, estate or trust to the extent its income is subject to taxation in the United States in its hands or in the hands of its partners or beneficiaries;
- – not also a resident of Germany for German tax purposes; and
- – not subject to “anti-treaty shopping” articles under German domestic law or the Treaty that apply in limited circumstances.
The Treaty benefits discussed below generally are not available to shareholders who hold shares in connection with the conduct of business through a permanent establishment in Germany. The summary does not discuss the treatment of those
shareholders.
The summary does not purport to be a comprehensive description of all of the tax considerations that may be relevant to any particular shareholder, including tax considerations that arise from rules of general application or that are generally assumed to be known by shareholders. In particular, the summary deals only with shareholders that will hold shares as capital assets and does not address the tax treatment of shareholders that are subject to special rules, such as fiduciaries of pension (e.g. U.S. pension funds), profit-sharing or other employee benefit plans, banks, insurance companies, dealers in securities or currencies, persons that hold shares as a position in a straddle, conversion transaction, synthetic security or other integrated financial transaction, persons that elect mark-to-market treatment, persons that own, directly or indirectly, 10 % or more of our stock, measured by vote or value, persons that hold shares through a partnership or hybrid entity and persons whose “functional currency” is not the U.S. dollar. The summary is based on German and U.S. laws, treaties and regulatory interpretations, including in the United States current and proposed U.S. Treasury regulations as of the date hereof, all of which are subject to change (possibly with retroactive effect).
|
113
|
|
|
Deutsche Bank
|
Signatures
|
|
|
Annual Report 2021 on Form 20-F
|
Change in Internal Control over Financial Reporting
|
|
|
|
|
Shareholders should consult their own advisors regarding the tax consequences of the ownership and disposition of shares in light of their particular circumstances, as well as the effect of any state, local or other national laws.
Taxation of Dividends
In general, dividends that we pay are subject to German withholding tax at an aggregate rate of 26.375 % (consisting of a 25 % withholding tax and a 1.375 % surcharge). Under the Treaty, a U.S. resident will be entitled to receive a refund from the German tax authorities of 11.375 in respect of a declared dividend of 100. For example, for a declared dividend of 100, a U.S. resident initially will receive 73.625 and may claim a refund from the German tax authorities of 11.375 and, therefore, receive a total cash payment of 85 (i.e., 85 % of the declared dividend). According to the German Investment Tax Act dividends received by a fund within the meaning of the German Investment Tax Act are generally subject to 15 % German withholding tax equal to the Treaty tax rate. U.S. residents who are entitled to a refund of more than 11.375 % (e.g. U.S. pension funds) have to fulfil further requirements according to para. 50j German Income Tax Act, in particular certain holding requirements.
For U.S. tax purposes, a U.S. resident will be deemed to have received total dividends of 100. The gross amount of dividends that a U.S. resident receives (which includes amounts withheld in respect of German withholding tax) generally will be subject to U.S. federal income taxation as foreign source dividend income, and will not be eligible for the dividends received deduction generally allowed to U.S. corporations. German withholding tax at the 15 % rate provided under the Treaty will be treated as a foreign income tax that, subject to generally applicable limitations under U.S. tax law, is eligible for credit against a U.S. resident’s U.S. federal income tax liability or, at its election, may be deducted in computing taxable income. Thus, for a declared dividend of 100, a U.S. resident will be deemed to have paid German taxes of 15. A U.S. resident cannot claim credits for German taxes that would have been refunded to it if it had filed a claim for refund. Foreign tax credits will not be allowed for withholding taxes imposed in respect of certain short-term or hedged positions. The creditability of foreign withholding taxes may be limited in certain situations, including where the burden of foreign taxes is separated inappropriately from the related foreign income.
Subject to certain exceptions for short-term and hedged positions, “qualified dividends” received by certain non-corporate U.S. shareholders will generally be subject to taxation in the United States at a lower rate than other ordinary income. Dividends received will be qualified dividends if we (i) are eligible for the benefits of a comprehensive income tax treaty with the United States that the U.S. Internal Revenue Service (“IRS”) has approved for purposes of the qualified dividend rules and (ii) were not, in the year prior to the year in which the dividend was paid, and are not, in the year in which the dividend is paid, a passive foreign investment company (“PFIC”). The Treaty has been approved for purposes of the qualified dividend rules, and we believe we qualify for benefits under the Treaty. The determination of whether we are a PFIC must be made annually and is dependent on the particular facts and circumstances at the time. It requires an analysis of our income and valuation of our assets, including goodwill and other intangible assets.
Based on our audited financial statements and relevant market and shareholder data, we believe that we were not a PFIC for U.S. federal income tax purposes with respect to our taxable years ended December 31, 2020 or December 31, 2021. In addition, based on our current expectations regarding the value and nature of our assets, the sources and nature of our income, and relevant market and shareholder data, we do not currently anticipate becoming a PFIC for our taxable year ending December 31, 2022, or for the foreseeable future. However, the PFIC rules are complex and their application to financial services companies is unclear. Each U.S. shareholder should consult its own tax advisor regarding the potential applicability of the PFIC regime to us and its implications for their particular circumstances.
If a U.S. resident receives a dividend paid in euros, it will recognize income in a U.S. dollar amount calculated by reference to the exchange rate in effect on the date of receipt, regardless of whether the payment is in fact converted into U.S. dollars. If dividends are converted into U.S. dollars on the date of receipt, a U.S. resident generally should not be required to recognize foreign currency gain or loss in respect of the dividend income but may be required to recognize foreign currency gain or loss on the receipt of a refund in respect of German withholding tax to the extent the U.S. dollar value of the refund differs from the U.S. dollar equivalent of that amount on the date of receipt of the underlying dividend.
Refund Procedures
To claim a refund, a U.S. resident must submit, within four years from the end of the calendar year in which the dividend is received, a claim for refund to the German tax authorities. The claim for refund must be accompanied by a withholding tax certificate (Kapitalertragsteuerbescheinigung) on an officially prescribed form and issued by the institution that withheld the tax.
|
114
|
|
|
Deutsche Bank
|
Signatures
|
|
|
Annual Report 2021 on Form 20-F
|
Change in Internal Control over Financial Reporting
|
|
|
|
|
Claims for refunds are made on a German claim for refund form, which must be filed with the German tax authorities: Bundeszentralamt für Steuern, An der Küppe 1, D-53225 Bonn, Germany. The German claim for refund forms can be downloaded from the homepage of the Bundeszentralamt für Steuern (www.bzst.de). A special form is available in cases para. 50j German Income Tax Act is applicable. A U.S. resident must also submit to the German tax authorities a certification (on IRS Form 6166) with respect to its last filed U.S. federal income tax return. Requests for IRS Form 6166 are made on IRS Form 8802, which requires payment of a user fee. IRS Form 8802 and its instructions can be obtained from the IRS website at www.irs.gov. Instead of the individual refund procedure described above, a U.S. resident may use an IT-supported quick-refund procedure (“Datenträgerverfahren – DTV”/“Data Medium Procedure – DMP”). If the U.S. resident’s bank or broker elects to participate in the DMP, it will perform administrative functions necessary to claim the Treaty refund for the beneficiaries. The refund beneficiaries must provide specified information to the DMP participant and confirm to the DMP participant that they meet the conditions of the Treaty provisions and that they authorize the DMP participant to file applications and receive notices and payments on their behalf.
The refund beneficiaries also must provide a “Certification of U.S. Tax Residency” on IRS Form 6166 with the DMP participant. In addition, if the individual refund procedure requires a withholding tax certificate (see above), such certificate is generally also necessary under the DMP.
The German tax authorities reserve the right to audit the entitlement to tax refunds for several years following their payment pursuant to the Treaty in individual cases. The DMP participant must assist with the audit by providing the necessary details or by forwarding the queries to the respective refund beneficiaries/shareholders. Presently the DMP cannot be used if the Treaty tax rate is below 15 % or if a holder of Depository Receipts claims a refund.
The German tax authorities will issue refunds denominated in euros. In the case of shares held through banks or brokers participating in the Depository Trust Company, the refunds will be issued to the Depository Trust Company, which will convert the refunds to U.S. dollars. The resulting amounts will be paid to banks or brokers for the account of holders.
If a U.S. resident holds its shares through a bank or broker who elects to participate in the DMP, it could take at least three weeks for it to receive a refund after a combined claim for refund has been filed with the German tax authorities. If a U.S. resident files a claim for refund directly with the German tax authorities, it could take at least eight months for it to receive a refund. The length of time between filing a claim for refund and receipt of that refund is uncertain and we can give no assurances as to when any refund will be received.
From 2023 onwards, a new refund procedure is applicable, and a U.S. resident holder generally will have to file a refund claim electronically. For dividends received by a U.S. holder after 2024 withholding tax certificates will be replaced by electronic submission of data directly to the tax authorities by the institution that withheld the tax.
Taxation of Capital Gains
Under the Treaty, a U.S. resident will generally not be subject to German capital gains tax in respect of a sale or other disposition of shares. For U.S. federal income tax purposes, a U.S. holder will generally recognize capital gain or loss on the sale or other disposition of shares in an amount equal to the difference between such holder’s tax basis in the shares and the U.S. dollar value of the amount realized from their sale or other disposition. Such gain or loss will be long-term capital gain or loss if the shares were held for more than one year. The net amount of long-term capital gain realized by an individual generally is subject to taxation at a lower rate than ordinary income. Any such gain generally would be treated as income arising from sources within the United States; any such loss would generally be allocated against U.S. source income. The ability to offset capital losses against ordinary income is subject to limitations.
Shareholders whose shares are held in an account with a German bank or financial services institution (including a German branch of a non-German bank or financial services institution) are urged to consult their own advisors. This summary does not discuss their particular tax situation.
United States Information Reporting and Backup Withholding
Dividends and payments of the proceeds on a sale of shares, paid within the United States or through certain U.S.-related financial intermediaries are subject to information reporting and may be subject to backup withholding unless the U.S. resident (i) is a corporation (other than an S corporation) or other exempt recipient or (ii) provides a taxpayer identification number and certifies (on IRS Form W-9) that no loss of exemption from backup withholding has occurred. Shareholders that are not U.S. persons generally are not subject to information reporting or backup withholding.
However, a non-U.S. person may be required to provide a certification (generally on IRS Form W-8BEN or W-8BEN-E) of its non-U.S. status in connection with payments received in the United States or through a U.S.-related financial intermediary.
Backup withholding tax is not an additional tax, and any amounts withheld under the backup withholding rules will be allowed as a refund or a credit against a holder’s U.S. federal income tax liability, provided the required information is furnished to the IRS.
|
115
|
|
|
Deutsche Bank
|
Signatures
|
|
|
Annual Report 2021 on Form 20-F
|
Change in Internal Control over Financial Reporting
|
|
|
|
|
Shareholders may be subject to other U.S. information reporting requirements. Shareholders should consult their own advisors regarding the application of U.S. information reporting rules in light of their particular circumstances.
German Gift and Inheritance Taxes
Under the current estate, inheritance and gift tax treaty between the United States and Germany (the “Estate Tax Treaty”), a transfer of shares generally will not be subject to German gift or inheritance tax so long as the donor or decedent, and the heir, donee or other beneficiary, were not domiciled in Germany for purposes of the Estate Tax Treaty at the time the gift was made, or at the time of the decedent’s death, and the shares were not held in connection with a permanent establishment or fixed base in Germany.
The Estate Tax Treaty provides a credit against U.S. federal estate and gift tax liability for the amount of inheritance and gift tax paid in Germany, subject to certain limitations, where shares are subject to German inheritance or gift tax and United States federal estate or gift tax.
Other German Taxes
There are currently no German net wealth, transfer, stamp or other similar taxes that would apply to a U.S. resident as a result of the receipt, purchase, ownership or sale of shares.
Dividends and Paying Agents
Not required because this document is filed as an annual report.
Statement by Experts
Not required because this document is filed as an annual report.
Documents on Display
We are subject to the informational requirements of the Securities Exchange Act of 1934, as amended. In accordance with these requirements, we file reports and other information with the Securities and Exchange Commission. Our Securities and Exchange Commission filings are available at the Securities and Exchange Commission’s website at www.sec.gov under File Number 001-15242.
Subsidiary Information
Not applicable.
Item 11: Quantitative and Qualitative Disclosures about Credit, Market and Other Risk
For Quantitative and Qualitative Disclosures about Credit, Market and Other Risk, please see “Management Report: Risk Report” in the Annual Report 2021.
Please see pages S-1 through S-10 of the Supplemental Financial Information (Unaudited), which pages are incorporated by reference herein, for information required by Subpart 1400 of SEC Regulation S-K.
|
116
|
|
|
Deutsche Bank
|
Signatures
|
|
|
Annual Report 2021 on Form 20-F
|
Change in Internal Control over Financial Reporting
|
|
|
|
|
Item 12: Description of Securities other than Equity Securities
Our ordinary shares are not represented by American Depositary Receipts and accordingly no information is required to be provided pursuant to Item 12.D.3 and Item 12.D.4. The remainder of the information required by this Item 12 and by Instruction 2(d) under the Instructions as to Exhibits of Form 20-F is provided as Exhibit 2.2 to this Annual Report on Form 20-F.
|
117
|
|
|
Deutsche Bank
|
Signatures
|
|
|
Annual Report 2021 on Form 20-F
|
Change in Internal Control over Financial Reporting
|
|
|
|
|
PART II
Item 13: Defaults, Dividend Arrearages and Delinquencies
Not applicable.
Item 14: Material Modifications to the Rights of Security Holders and Use of Proceeds
According to the German Banking Act (
Kreditwesengesetz
) and the German Recovery and Resolution Act (
Sanierungs- und Abwicklungsgesetz
), additional restrictions on distributions may apply or will apply, as the case may be, when we are in breach of capital requirements. In particular, a credit institution, such as us, will be considered as failing to meet the combined buffer requirement where it does not have sufficient own funds in an amount and of the quality needed to meet at the same time (i) its minimum capital requirements under the CRR, (ii) certain “Pillar 2” capital requirements, and (iii) the sum of the capital buffers applicable to the relevant credit institution. In calculating the respective amounts that may be distributed (so-called “Maximum Distributable Amount” or “MDA”), we will have to take certain “Pillar 2” capital requirements into account. Since January 2022, we are also subject to MDA restrictions in instances of non-compliance with our leverage ratio buffer introduced in the CRR (so-called “L-MDA”). In addition, we are subject to additional restrictions on distributions (so-called “M-MDA”) if we breach the harmonized minimum TLAC requirement under the CRR and our institution-specific minimum requirement for own funds and eligible liabilities set by the Single Resolution Board.
Item 15: Controls and Procedures
Disclosure Controls and Procedures
An evaluation was carried out under the supervision and with the participation of our management, including our Chief Executive Officer and Chief Financial Officer, of the effectiveness of the design and operation of our disclosure controls and procedures (as defined in Rule 13a-15(e) under the Securities Exchange Act of 1934) as of December 31, 2021. There are, as described below, inherent limitations to the effectiveness of any control system, including disclosure controls and procedures. Accordingly, even effective disclosure controls and procedures can provide only reasonable assurance of achieving their control objectives. Based upon such evaluation, our Chief Executive Officer and Chief Financial Officer concluded that the design and operation of our disclosure controls and procedures were effective as of December 31, 2021.
|
118
|
|
|
Deutsche Bank
|
Signatures
|
|
|
Annual Report 2021 on Form 20-F
|
Change in Internal Control over Financial Reporting
|
|
|
|
|
Management’s Annual Report on Internal Control over Financial Reporting
Management of Deutsche Bank Aktiengesellschaft, together with its consolidated subsidiaries, is responsible for establishing and maintaining adequate internal control over financial reporting. Our internal control over financial reporting is a process designed under the supervision of our Chief Executive Officer and our Chief Financial Officer to provide reasonable assurance regarding the reliability of financial reporting and the preparation of the firm’s financial statements for external reporting purposes in accordance with International Financial Reporting Standards (IFRS) as issued by the International Accounting Standards Board (IASB) and endorsed by the European Union (EU). As of December 31, 2021, management conducted an assessment of the effectiveness of our internal control over financial reporting based on the framework established in Internal Control – Integrated Framework (2013) issued by the Committee of Sponsoring Organizations of the Treadway Commission (COSO). Based on the assessment performed, management has determined that our internal control over financial reporting as of December 31, 2021 was effective based on the COSO framework (2013).
Ernst Young GmbH Wirtschaftsprüfungsgesellschaft, the registered public accounting firm that audited the financial statements included in this document, has issued a report on our internal control over financial reporting, which is set forth below.
Report of Independent Registered Public Accounting Firm
To the Shareholders and the Supervisory Board of Deutsche Bank Aktiengesellschaft:
Opinion on Internal Control Over Financial Reporting
We have audited Deutsche Bank Aktiengesellschaft’s internal control over financial reporting as of December 31, 2021, based on criteria established in Internal Control – Integrated Framework issued by the Committee of Sponsoring Organizations of the Treadway Commission (2013 framework) (the COSO criteria). In our opinion, Deutsche Bank Aktiengesellschaft (the Company) maintained, in all material respects, effective internal control over financial reporting as of December 31, 2021, based on the COSO criteria.
We also have audited, in accordance with the standards of the Public Company Accounting Oversight Board (United States) (PCAOB), the consolidated balance sheets of the Company as of December 31, 2021 and 2020, the related consolidated statements of income, comprehensive income, changes in equity and cash flows for each of the two years in the period ended December 31, 2021, the related notes and the specific disclosures described in Note 1 to the consolidated financial statements as being part of the financial statements, and our report dated March 7, 2022 expressed an unqualified opinion thereon.
Basis for Opinion
The Company’s management is responsible for maintaining effective internal control over financial reporting and for its assessment of the effectiveness of internal control over financial reporting included in the accompanying Management’s Annual Report on Internal Control over Financial Reporting. Our responsibility is to express an opinion on the Company’s internal control over financial reporting based on our audit. We are a public accounting firm registered with the PCAOB and are required to be independent with respect to the Company in accordance with the U.S. federal securities laws and the applicable rules and regulations of the Securities and Exchange Commission and the PCAOB.
We conducted our audit in accordance with the standards of the PCAOB. Those standards require that we plan and perform the audit to obtain reasonable assurance about whether effective internal control over financial reporting was maintained in all material respects.
Our audit included obtaining an understanding of internal control over financial reporting, assessing the risk that a material weakness exists, testing and evaluating the design and operating effectiveness of internal control based on the assessed risk, and performing such other procedures as we considered necessary in the circumstances. We believe that our audit provides a reasonable basis for our opinion.
Definition and Limitations of Internal Control Over Financial Reporting
|
119
|
|
|
Deutsche Bank
|
Signatures
|
|
|
Annual Report 2021 on Form 20-F
|
Change in Internal Control over Financial Reporting
|
|
|
|
|
A company’s internal control over financial reporting is a process designed to provide reasonable assurance regarding the reliability of financial reporting and the preparation of financial statements for external purposes in accordance with generally accepted accounting principles. A company’s internal control over financial reporting includes those policies and procedures that (1) pertain to the maintenance of records that, in reasonable detail, accurately and fairly reflect the transactions and dispositions of the assets of the company; (2) provide reasonable assurance that transactions are recorded as necessary to permit preparation of financial statements in accordance with generally accepted accounting principles, and that receipts and expenditures of the company are being made only in accordance with authorizations of management and directors of the company; and (3) provide reasonable assurance regarding prevention or timely detection of unauthorized acquisition, use, or disposition of the company’s assets that could have a material effect on the financial statements.
Because of its inherent limitations, internal control over financial reporting may not prevent or detect misstatements. Also, projections of any evaluation of effectiveness to future periods are subject to the risk that controls may become inadequate because of changes in conditions, or that the degree of compliance with the policies or procedures may deteriorate.
/s/ Ernst Young GmbH Wirtschaftsprüfungsgesellschaft
March 7, 2022
Change in Internal Control over Financial Reporting
There was no change in our internal control over financial reporting identified in connection with the evaluation referred to above that occurred during the year ended December 31, 2021 that has materially affected, or is reasonably likely to materially affect, our internal control over financial reporting.
A control system, no matter how well conceived and operated, can provide only reasonable, not absolute, assurance that the objectives of the control system are met. As such, disclosure controls and procedures or systems for internal control over financial reporting may not prevent all error and all fraud. Further, the design of a control system must reflect the fact that there are resource constraints, and the benefits of controls must be considered relative to their costs. Because of the inherent limitations in all control systems, no evaluation of controls can provide absolute assurance that all control issues and instances of fraud, if any, within the company have been detected. These inherent limitations include the realities that judgments in decision-making can be faulty, and that breakdowns can occur because of simple error or mistake. Additionally, controls can be circumvented by the individual acts of some persons, by collusion of two or more people, or by management override of the control. The design of any system of controls also is based in part upon certain assumptions about the likelihood of future events, and any design may not succeed in achieving its stated goals under all potential future conditions; over time, controls may become inadequate because of changes in conditions, or the degree of compliance with the policies or procedures may deteriorate. Because of the inherent limitations in a cost-effective control system, misstatements due to error or fraud may occur and not be detected.
Item 16A: Audit Committee Financial Expert
Please see “Corporate Governance Statement according to Sections 289f and 315d of the German Commercial Code: Auditing and Controlling: Audit Committee Financial Expert” in the Annual Report 2021.
Item 16B: Code of Ethics
Please see “Corporate Governance Statement according to Sections 289f and 315d of the German Commercial Code: Values and Leadership Principles of Deutsche Bank AG and Deutsche Bank Group: Deutsche Bank Group Code of Conduct and Code of Ethics for Senior Financial Officers” in the Annual Report 2021.
Item 16C: Principal accountant fees and services
Please see “Management Report: Corporate Governance Statement/Corporate Governance Report: Auditing and Controlling: Principal Accountant Fees and Services” in the Annual Report 2021.
|
120
|
|
|
Deutsche Bank
|
Signatures
|
|
|
Annual Report 2021 on Form 20-F
|
Change in Internal Control over Financial Reporting
|
|
|
|
|
Item 16D: Exemptions from the Listing Standards for Audit Committees
Our common shares are listed on the New York Stock Exchange, the corporate governance rules of which require a foreign private issuer such as us to have an audit committee that satisfies the requirements of Rule 10A-3 under the U.S. Securities Exchange Act of 1934. These requirements include a requirement that the audit committee be composed of members that are “independent” of the issuer, as defined in the Rule, subject to certain exemptions, including an exemption for employees who are not executive officers of the issuer if the employees are elected or named to the board of directors or audit committee pursuant to the issuer’s governing law or documents, an employee collective bargaining or similar agreement or other home country legal or listing requirements. The German Co-Determination Act of 1976 (
Mitbestimmungsgesetz
) requires that the shareholders elect half of the members of the supervisory board of large German companies, such as us, and that employees in Germany elect the other half. Employee-elected members are typically themselves employees or representatives of labor unions representing employees. Pursuant to law and practice, committees of the Supervisory Board are typically composed of both shareholder- and employee-elected members. Of the current members of our Audit Committee, five – Henriette Mark, Gabriele Platscher, Detlef Polaschek, Bernd Rose and Stefan Viertel – are current employees of Deutsche Bank who have been elected as Supervisory Board members by the employees. None of them is an executive officer. Accordingly, their service on the Audit Committee is permissible pursuant to the exemption from the independence requirements provided for by paragraph (b)(1)(iv)(C) of the Rule. We do not believe the reliance on such exemption would materially adversely affect the ability of the Audit Committee to act independently and to satisfy the other requirements of the Rule.
|
121
|
|
|
Deutsche Bank
|
Signatures
|
|
|
Annual Report 2021 on Form 20-F
|
Change in Internal Control over Financial Reporting
|
|
|
|
|
Item 16E: Purchases of Equity Securities by the Issuer and Affiliated Purchasers
In 2021, we repurchased a total of 32,700,000 shares, for group purposes pursuant to share buybacks authorized by the General Meeting. None were via derivatives. During the period from January 1, 2021 until the 2021 Annual General Meeting on May 27, 2021 we repurchased 28,700,000 shares, of which none were via derivatives, of our ordinary shares pursuant to the authorization granted by the Annual General Meeting on May 20, 2020, at an average price of € 9.35 and for a total consideration of € 268.5 million. This authorization was replaced by a new authorization to buy back shares approved by the Annual General Meeting on May 27, 2021. Under the new authorization, up to 206,677,313 shares may be repurchased through April 30, 2026. Of these, 103,338,656 shares may be purchased by using derivatives. During the period from the 2021 Annual General Meeting until December 31, 2021, 4,000,000 shares were brought back. At December 31, 2021, the number of shares held in Treasury from buybacks totaled 649,149. This figure stems from 1.3 million shares at the beginning of the year, plus 32.7 million shares from buybacks in 2021, less 33.4 million shares which were used to fulfill delivery obligations in the course of share-based compensation of employees. We did not cancel any shares in 2021.
In addition to these share buybacks for group purposes, pursuant to a shareholder authorization approved at our 2021 Annual General Meeting, we are authorized to buy and sell, for the purpose of securities trading, our ordinary shares through April 30, 2026, provided that number of shares held for this purpose may not at any time exceed 10 % of the company’s share capital. The shares may be bought through the stock exchange or by means of a public purchase offer to all shareholders. The gross volume of these securities trading transactions is often large, and even the net amount of such repurchases or sales may, in a given month, be large, though over longer periods of time such transactions tend to offset and are in any event constrained by the 10 % of share capital limit. These securities trading transactions consist predominantly of transactions on major non-US securities exchanges. We also enter into derivative contracts with respect to our shares and limited to shares in a maximum volume of 5 % of the actual share capital.
The following table sets forth, for each month in 2021 and for the year as a whole, the total gross number of our shares repurchased by us and our affiliated purchasers (pursuant to both activities described above), the total gross number of shares sold, the net number of shares purchased or sold, the average price paid per share (based on the gross shares repurchased), the number of shares that were purchased for group purposes mentioned above and the maximum number of shares that at that date remained eligible for purchase under such programs.
Issuer Purchases of Equity Securities in 2021
|
Month
|
|
Total number of
shares purchased
|
|
Total number of
shares sold
|
|
Net number of
shares purchased
or (sold)
|
|
Average price paid
per share (in €)
|
|
Number of
shares purchased
for group purposes
|
|
Maximum number of
shares that may yet
be purchased under
plans or programs
|
|
January
|
|
364,674
|
|
365,074
|
|
(400)
|
|
8.71
|
|
0
|
|
206,677,313
|
|
February
|
|
29,424,253
|
|
2,144,274
|
|
27,279,979
|
|
9.36
|
|
28,700,000
|
|
177,977,313
|
|
March
|
|
398,166
|
|
25,322,158
|
|
(24,923,992)
|
|
10.67
|
|
0
|
|
177,977,313
|
|
April
|
|
235,583
|
|
252,389
|
|
(16,806)
|
|
10.36
|
|
0
|
|
177,977,313
|
|
May
|
|
134,984
|
|
261,779
|
|
(126,795)
|
|
11.70
|
|
0
|
|
206,677,313
|
|
June
|
|
167,700
|
|
686,024
|
|
(518,324)
|
|
11.16
|
|
0
|
|
206,677,313
|
|
July
|
|
176,681
|
|
177,242
|
|
(561)
|
|
10.46
|
|
0
|
|
206,677,313
|
|
August
|
|
4,367,179
|
|
1,615,398
|
|
2,751,781
|
|
10.88
|
|
4,000,000
|
|
202,677,313
|
|
September
|
|
331,638
|
|
4,467,142
|
|
(4,135,504)
|
|
10.90
|
|
0
|
|
202,677,313
|
|
October
|
|
104,746
|
|
101,117
|
|
3,629
|
|
11.27
|
|
0
|
|
202,677,313
|
|
November
|
|
274,280
|
|
480,838
|
|
(206,558)
|
|
11.30
|
|
0
|
|
202,677,313
|
|
December
|
|
0
|
|
773,667
|
|
(773,667)
|
|
0.00
|
|
0
|
|
202,677,313
|
|
Total 2021
|
|
35,979,884
|
|
36,647,102
|
|
(667,218)
|
|
9.62
|
|
32,700,000
|
|
202,677,313
|
|
|
|
|
|
|
|
|
|
|
|
|
|
|
At December 31, 2021, the number of shares held by us in treasury totaled 678,948. This figure stems from 1,346,166 shares at the beginning of the year, plus 667,218 net shares sold in 2021. At December 31, 2021, our issued share capital consisted of 2,066,773,131 ordinary shares, of which 2,066,094,183 were outstanding.
|
122
|
|
|
Deutsche Bank
|
Signatures
|
|
|
Annual Report 2021 on Form 20-F
|
Change in Internal Control over Financial Reporting
|
|
|
|
|
Item 16F: Change in Registrant’s Certifying Accountant
Not applicable.
Item 16G: Corporate Governance
Our common shares are listed on the New York Stock Exchange, as well as on all seven German stock exchanges. Set forth below is a description of the significant ways in which our corporate governance practices differ from those applicable to U.S. domestic companies under the New York Stock Exchange’s listing standards as set forth in its Listed Company Manual (the “NYSE Manual”).
The Legal Framework.
Corporate governance principles for German stock corporations (
Aktiengesellschaften
) are set forth in the German Stock Corporation Act (
Aktiengesetz
), the German Co-Determination Act of 1976 (
Mitbestimmungsgesetz
) and the German Corporate Governance Code (
Deutscher Corporate Governance Kodex
, referred to as the Code).
The Two-Tier Board System of a German Stock Corporation.
The German Stock Corporation Act provides for a clear separation of management and oversight functions. It therefore requires German stock corporations to have both a supervisory board (
Aufsichtsrat
) and a management board (
Vorstand
). These boards are separate; no individual may be a member of both. Both the members of the management board and the members of the supervisory board must exercise the standard of care of a diligent business person to the company. In complying with this standard of care they are required to take into account a broad range of considerations, including the interests of the company and those of its shareholders, employees and creditors.
The management board is responsible for managing the company and representing the company in its dealings with third parties. The management board is also required to ensure appropriate risk management within the corporation and to establish an internal monitoring system. The members of the management board, including its chairperson or speaker, are regarded as peers and share a collective responsibility for all management decisions.
The supervisory board appoints and removes the members of the management board. It also may appoint a chairman (CEO) and one or more deputy chairmen of the management board. Although it is not permitted to make management decisions, the supervisory board has comprehensive monitoring functions with respect to the activities of the management board, including advising the management board and participating in decisions of fundamental importance to the company. To ensure that these monitoring functions are carried out properly, the management board must, among other things, regularly report to the supervisory board with regard to current business operations and business planning, including any deviation of actual developments from concrete and material targets previously presented to the supervisory board. The supervisory board may also request special reports from the management board at any time. Transactions of fundamental importance to the company, such as major strategic decisions or other actions that may have a fundamental impact on the company’s assets and liabilities, financial condition or results of operations, may be subject to the consent of the supervisory board. Pursuant to our Articles of Association (
Satzung
), such transactions include the granting of general powers of attorney granting of credits, including the acquisition of participations in other companies for which the German Banking Act (
Kreditwesengesetz
) requires approval by the Supervisory Board, as well as major acquisitions or disposals of real estate or other participations.
Pursuant to the German Co-Determination Act, our Supervisory Board consists of representatives elected by the shareholders and representatives elected by the employees in Germany. Based on the total number of Deutsche Bank employees in Germany these employees have the right to elect one-half of the total of twenty Supervisory Board members. The chairperson of the Supervisory Board of Deutsche Bank is a shareholder representative who has the deciding vote in the event of a tie.
This two-tier board system contrasts with the unitary board of directors envisaged by the relevant laws of all U.S. states and the New York Stock Exchange listing standards for U.S. companies.
German companies which have their shares listed on a stock exchange must each year issue a statement on the company’s corporate governance and either include such statement in their annual management report or publish it separately on their website.
The Recommendations of the Code.
The Code was issued in 2002 by a commission composed of German corporate governance experts appointed by the German Federal Ministry of Justice in 2001. The Code was last amended in December 2019 with effect as of March 20, 2020. It describes and summarizes the basic mandatory statutory corporate governance principles found in the provisions of German law. In addition, it contains supplemental recommendations and suggestions for standards on responsible corporate governance intended to reflect generally accepted best practice.
|
123
|
|
|
Deutsche Bank
|
Signatures
|
|
|
Annual Report 2021 on Form 20-F
|
Change in Internal Control over Financial Reporting
|
|
|
|
|
The Code is structured from a task perspective and addresses seven core areas of corporate governance. These are the tasks of (a) management and supervision, (b) appointment of candidates to the management board, (c) composition of the supervisory board, (d) supervisory board procedures, (e) conflicts of interest, (f) transparency and external reporting as well as (g) the remuneration of the members of the management board and the supervisory board. The Code contains three types of provisions. First, the Code contains principles which reflect material legal requirements for responsible governance, and are used in the Code to inform investors and other stakeholders. The second type of provisions is recommendations. While these are not legally binding, Section 161 of the German Stock Corporation Act requires that any German exchange-listed company declare annually that the company complies with the recommendations of the Code or, if not, which recommendations the company does not comply with and the reasons for the non-compliance (“comply or explain”). The third type of Code provisions comprises suggestions which companies may choose not to comply with without disclosure. The Code contains a significant number of such suggestions, covering almost all of the core areas of corporate governance it addresses.
In their last Declaration of Conformity of October 29, 2021, the Management Board and the Supervisory Board of Deutsche Bank stated that, since the last Declaration of Conformity issued on October 30, 2020, they have acted and will act in the future in conformity with the recommendations of the Code, with certain specified exceptions. The Declaration of Conformity is available on Deutsche Bank’s internet website at www.db.com/ir/en/documents.htm.
Supervisory Board Committees.
The supervisory board may form committees. Pursuant to the German Stock Corporation Act, any supervisory board committee must regularly report to the supervisory board.
The German Co-Determination Act requires that the supervisory board form a mediation committee to propose candidates for the management board in the event that the two-thirds majority of the members of the supervisory board needed to appoint members of the management board is not met.
The German Stock Corporation Act specifically mentions the possibility to establish an “audit committee” to deal with the supervision of accounting processes, the efficiency of the internal control system the risk management system and the internal audit system as well as with the annual auditing, in particular with the selection and the independence of the external auditor and the additional services rendered by the external auditor. The Code recommends establishing such an “audit committee”. The Code also recommends establishing a “nomination committee” comprised only of shareholder-elected supervisory board members to prepare the supervisory board’s proposals for the election or appointment of new shareholder representatives to the supervisory board. In general the Code recommends that the supervisory board shall form – depending on the specific circumstances of the enterprise and the number of supervisory board members – committees of members with relevant specialist expertise which can handle subjects, such as corporate strategy, compensation of the members of the management board, investments and financing.
Sections 25d (7) to (12) of the German Banking Act require, depending on the size and complexity of the respective credit institution, the establishment of supervisory board committees with specific tasks to be performed as follows: risk committee, audit committee, nomination committee (with tasks and composition requirements different from those set out in the Code) and compensation control committee. The Code’s recommendation that the nomination committee shall only comprise shareholder representatives is not complied with by Deutsche Bank AG because of mandatory special rules set forth in the German Banking Act, which assign further tasks to the nomination committee in addition to the preparation of proposals for the appointment of new shareholder representatives to the supervisory board. These further tasks do not justify the exclusion of employee representatives from the nomination committee. Based on the previous version of the Code, which was applicable until March 20, 2020, this non-compliance had to be disclosed and justified in the annual Declaration of Conformity. The current version of the Code provides that credit institutions and insurance companies are exempt from recommendations of the Code which conflict with special rules or regulations applicable to them. However, the Code recommends that in the case of such conflicts, companies indicate in their annual corporate governance statement what recommendations of the Code were not applicable to them.
The Supervisory Board of Deutsche Bank has established a Chairman’s Committee (
Präsidialausschuss
) which is inter alia responsible for conclusion, amendment and termination of employment and pension contracts with members of the Management Board, taking into account the responsibility of the Supervisory Board as a whole for the remuneration of the members of the Management Board, a Nomination Committee (
Nominierungsausschuss
), an Audit Committee (
Prüfungsausschuss
), a Risk Committee (
Risikoausschuss
), an Integrity Committee (
Integritätsausschuss
), a Compensation Control Committee (
Vergütungskontrollausschuss
), a Strategy Committee (
Strategieausschuss
), a Technology, Data and Innovation Committee (
Technologie-, Daten- und Innovationsausschuss
) and a Mediation Committee (
Vermittlungsausschuss
). The functions of a nominating/corporate governance committee and of a compensation committee required by the NYSE Manual for U.S. companies listed on the NYSE are therefore performed by the Supervisory Board or one of its committees, in particular the Chairman’s Committee, the Compensation Control Committee and the Mediation Committee.
|
124
|
|
|
Deutsche Bank
|
Signatures
|
|
|
Annual Report 2021 on Form 20-F
|
Change in Internal Control over Financial Reporting
|
|
|
|
|
Independent Board Members.
The NYSE Manual requires that a majority of the members of the board of directors of a NYSE listed U.S. company and each member of its nominating/corporate governance, compensation and audit committees be “independent” according to strict criteria and that the board of directors determines that such member has no material direct or indirect relationship with the company.
As a foreign private issuer, Deutsche Bank is not subject to these requirements. However, its audit committee must meet the more lenient independence requirement of Rule 10A-3 under the Securities Exchange Act of 1934. German corporate law does not require an affirmative independence determination, meaning that the Supervisory Board need not make affirmative findings that audit committee members are independent. However, the German Stock Corporation Act and the Code, as the case may, be contain several rules, recommendations and suggestions to ensure the supervisory board’s independent advice to, and supervision of, the management board. As noted above, no member of the management board may serve on the supervisory board (and vice versa). Supervisory board members will not be bound by directions or instructions from third parties. Any advisory, service or similar contract between a member of the supervisory board and the company is subject to the supervisory board’s approval. A similar requirement applies to loans granted by the company to a supervisory board member or other persons, such as certain members of a supervisory board member’s family. In addition, the German Stock Corporation Act prohibits a person who within the last two years was a member of the management board from becoming a member of the supervisory board of the same company unless he or she is elected upon the proposal of shareholders holding more than 25 % of the voting rights of the company.
The Code also recommends that each member of the supervisory board inform the supervisory board of any conflicts of interest. In the case of material conflicts of interest or ongoing conflicts, the Code recommends that the mandate of the Supervisory Board member shall end either as a result of such supervisory board member’s withdrawal or, failing which, based on his or her removal from office by the shareholders’ meeting. The Code further recommends that any conflicts of interest that have occurred be reported by the supervisory board at the annual general meeting, together with the action taken, and that potential conflicts of interest also be taken into account in the nomination process for the election of supervisory board members.
Audit Committee Procedures.
Pursuant to the NYSE Manual the audit committee of a U.S. company listed on the NYSE must have a written charter addressing its purpose, an annual performance evaluation, and the review of an auditor’s report describing internal quality control issues and procedures and all relationships between the auditor and the company. The Audit Committee of Deutsche Bank operates under written terms of reference and reviews the efficiency of its activities regularly.
Disclosure of Corporate Governance Guidelines.
Deutsche Bank discloses its Articles of Association, the Terms of Reference of its Management Board, its Supervisory Board, the Chairman’s Committee, the Audit Committee, the Risk Committee, the Integrity Committee, the Compensation Control Committee, the Nomination Committee, the Strategy Committee and the Technology, Data and Innovation Committee, its Declaration of Conformity under the Code pursuant to Section 161 of the German Stock Corporation Act and other documents pertaining to its corporate governance on its internet website at www.db.com/ir/en/documents.htm.
Item 16H: Mine Safety Disclosure
Not applicable.
Item 16I: Disclosure Regarding Foreign Jurisdictions that Prevent Inspections
Not applicable.
|
125
|
|
|
Deutsche Bank
|
Signatures
|
|
|
Annual Report 2021 on Form 20-F
|
Change in Internal Control over Financial Reporting
|
|
|
|
|
Disclosures Under Iran Threat Reduction and Syria Human Rights Act of 2012
Under Section 219 of the Iran Threat Reduction and Syria Human Rights Act of 2012, which added Section 13(r) of the U.S. Securities Exchange Act of 1934, as amended, an issuer of securities registered under the Securities Exchange Act of 1934 is required to disclose in its periodic reports filed under the Securities Exchange Act of 1934 certain of its activities and those of its affiliates relating to Iran and to other persons sanctioned by the U.S. under programs relating to terrorism and proliferation of weapons of mass destruction that occurred during the period covered by the report. We describe below a number of potentially disclosable activities of Deutsche Bank AG and its affiliates. Disclosure is generally required regardless of whether the activities, transactions or dealings were conducted in compliance with applicable law. Deutsche Bank also reports transactions in which
other Iranian persons or entities listed
on OFAC
sanctions lists were involved, whether or not they are directly or indirectly owned or controlled by the Iranian government.
Legacy Contractual Obligations Related to Guarantees and Letters of Credit
. Prior to 2007, we provided guarantees to a number of Iranian entities. In almost all of these cases, we issued counter-indemnities in support of guarantees issued by Iranian banks because the Iranian beneficiaries of the guarantees required that they be backed directly by Iranian banks. In 2007, we made a decision to discontinue issuing new guarantees to Iranian or Iran-related beneficiaries. Although the pre-existing guarantees stipulate that they must be either extended or honored if we receive such a demand and we are legally not able to terminate these guarantees, we decided to reject any “extend or pay” demands under such guarantees. Even though we had exited, where possible, many of these guarantees, guarantees with an aggregate face amount of approximately € 7.0 million are still outstanding as of year-end 2021. The gross revenues from this business in 2021 which we received from non-Iranian parties were approximately € 33,000 and the net profit we derived from these activities was less than this amount.
We also have outstanding legacy guarantees in relation to a Syrian bank sanctioned by the United States under its non-proliferation program. The aggregate face amount of these legacy guarantees was approximately € 9.1 million as of December 31, 2021, the gross revenues received from non-Syrian parties for these guarantees were approximately € 58,000 in 2021 and the net profit we derived from these activities was less than this amount. We intend to exit these guarantee arrangements.
Payments Executed.
Deutsche Bank continues to severely restrict its policy on Iran and consequently the execution of payments relating to Iran.
In
coming Payments.
In 2021, we received one payment from an Iranian government party of approximately € 3,000 in favor of a non-Iranian client
. Revenue for this incoming payment was less than € 10. This figure relates to a transaction for an Iranian Embassy-related office not included in the section on Iranian Consulates and Embassies below.
Outgoing Payments.
In 2021, no outgoing payments were executed in favor of Iranian parties outside of Germany; with regards to the Iranian Embassy in Germany, see below.
Operations of Iranian Bank Branches and Subsidiaries in Germany.
Several Iranian banks, including Bank Melli Iran, Bank Saderat, Bank Sepah, and Europäisch-Iranische Handelsbank, have branches or offices in Germany, even though their funds and other economic resources had been frozen earlier under European law. As part of the payment clearing system in Germany and other European countries, when these branches or offices needed to make payments in Germany or Europe to cover their day-to-day operations such as rent, taxes, insurance premiums and salaries for their remaining staff, or for any other kind of banking-related operations, fund transfers from these Iranian banks had been accepted through Target2.
In 2021, we executed approximately € 2.7 million in (almost only in-coming) transfers through Target2 across approximately 1,000 transactions and credited the relevant amounts to our non-Iranian clients. The gross revenues derived from these payments were approximately € 4,900.
We do not consider the execution of such transactions to be significant and we expect that we will continue to execute such transactions in the future.
Maintaining of Accounts for Iranian Consulates and Embassies.
In 2021, Iranian embassies and consulates in Germany held accounts with us. The purpose of these accounts is the funding of day-to-day operational costs of the embassies and consulates, such as salaries, rent and electricity. In 2021, the total volume of outgoing payments from these accounts was approximately € 5.4 million which have been funded through € 6.8 million of incoming payments. From these activities, we derived gross revenues of approximately € 3700 and net profits which were less than this amount. The German government has requested that we provide these services to enable the government of Iran to conduct its diplomatic relations and we intend to continue such maintenance.
|
126
|
|
|
Deutsche Bank
|
Signatures
|
|
|
Annual Report 2021 on Form 20-F
|
Change in Internal Control over Financial Reporting
|
|
|
|
|
Activities of Entities in Which We Have Interests.
Section 13(r) requires us to provide the specified disclosure with respect to ourselves and our “affiliates,” as defined in Exchange Act Rule 12b-2. Although we have minority equity interests in certain entities that could arguably result in these entities being deemed “affiliates,” we do not have the authority or the legal ability to acquire in every instance the information from these entities that would be necessary to determine whether they are engaged in any disclosable activities under Section 13(r). In some cases, legally independent entities are not permitted to disclose the details of their activities to us because of German privacy and data protection laws or the applicable banking laws and regulations. In such cases, voluntary disclosure of such details could violate such legal and/or regulatory requirements and subject the relevant entities to criminal prosecution or regulatory investigations.
|
127
|
|
|
Deutsche Bank
|
Signatures
|
|
|
Annual Report 2021 on Form 20-F
|
Change in Internal Control over Financial Reporting
|
|
|
|
|
PART III
Item 17: Financial Statements
Not applicable.
Item 18: Financial Statements
The Financial Statements of this Annual Report on Form 20-F consist of the Consolidated Financial Statements including Notes 1 to 44 thereto, which are set forth as Part 2 of the Annual Report 2021, and, as described in Note 1 “Significant Accounting Policies and Critical Accounting Estimates” thereto under “Basis of accounting – IFRS 7 disclosures”, certain parts of the Management Report set forth as Part 1 of the Annual Report 2021.
The Consolidated Financial Statements as of and for the years ended December 31, 2021 and 2020 have been audited by
Ernst Young GmbH Wirtschaftsprüfungsgesellschaft
(Firm ID:
1251
), as described in their “Report of Independent Registered Public Accounting Firm” included in the Annual Report 2021.
The Consolidated Financial Statements as of and for the year ended December 31, 2019 have been audited by KPMG AG Wirtschaftsprüfungsgesellschaft, (Firm ID: 1021) as described in their “Report of Independent Registered Public Accounting Firm” included in the Annual Report 2021.
Item 19: Exhibits
We have filed the following documents as exhibits to this document.
|
Exhibit number
|
|
Description of Exhibit
|
|
1.1
|
|
|
|
2.1
|
|
The total amount of long-term debt securities of us or our subsidiaries authorized under any instrument does not exceed 10 percent of the total assets of our Group on a consolidated basis. We hereby agree to furnish to the Commission, upon its request, a copy of any instrument defining the rights of holders of long-term debt of us or of our subsidiaries for which consolidated or unconsolidated financial statements are required to be filed.
|
|
2.2
|
|
|
|
4.1
|
|
|
|
4.2
|
|
|
|
4.3
|
|
|
|
4.4
|
|
|
|
4.5
|
|
|
|
4.6
|
|
|
|
4.7
|
|
|
|
4.8
|
|
|
|
4.9
|
|
|
|
8.1
|
|
|
|
12.1
|
|
|
|
12.2
|
|
|
|
13.1
|
|
|
|
13.2
|
|
|
|
15.1
|
|
|
|
15.2
|
|
|
|
101.1
|
|
Interactive Data File.
|
|
|
|
|
|
128
|
|
|
Deutsche Bank
|
Signatures
|
|
|
Annual Report 2021 on Form 20-F
|
Change in Internal Control over Financial Reporting
|
|
|
|
|
Signatures
The registrant hereby certifies that it meets all of the requirements for filing on Form 20-F and has duly caused and authorized the undersigned to sign this annual report on its behalf.
Date: March 11, 2022
Deutsche Bank Aktiengesellschaft
|
/s/
|
CHRISTIAN SEWING
|
Christian Sewing
Chairman of the Management Board
Chief Executive Officer
|
/s/
|
JAMES VON MOLTKE
|
James von Moltke
Member of the Management Board
Chief Financial Officer
|
129
|
|
|
Deutsche Bank
|
Operating and Financial Review
|
|
|
Annual Report 2021
|
Deutsche Bank Group
|
|
|
|
|
1
|
|
Deutsche Bank
|
Operating and Financial Review
|
|
|
Annual Report 2021
|
Deutsche Bank Group
|
|
|
|
|
[Page intentionally left blank for SEC filing purposes]
1
|
|
Deutsche Bank
|
Operating and Financial Review
|
|
|
Annual Report 2021
|
Deutsche Bank Group
|
|
|
|
|
Content
|
1 –
|
|
|
||||
|
Management Report
|
|
|||||
|
2
|
Operating and Financial Review
|
|
||||
|
34
|
Outlook
|
|
||||
|
41
|
Risks and Opportunities
|
|
||||
|
54
|
Risk Report
|
|
||||
|
171
|
Sustainability
|
|
||||
|
173
|
Employees
|
|
||||
|
174
|
Internal Control over Financial Reporting
|
|
||||
|
175
|
Information pursuant to Section 315a (1) of the German Commercial Code and Explanatory Report
|
|
||||
|
176
|
Corporate Governance Statement to 289f and 315d of the German Commercial Code
|
|
||||
|
176
|
Standalone parent company information (HGB)
|
|
||||
|
2 –
|
|
|
||||
|
Consolidated Financial Statements
|
|
|||||
|
178
|
Consolidated Statement of Income
|
|
||||
|
179
|
Consolidated Statement of Comprehensive Income
|
|
||||
|
180
|
Consolidated Balance Sheet
|
|
||||
|
181
|
Consolidated Statement of Changes in Equity
|
|
||||
|
183
|
Consolidated Statement of Cash Flows
|
|
||||
|
185
|
Notes to the consolidated financial statements
|
|
||||
|
219
|
Notes to the consolidated income statement
|
|
||||
|
226
|
Notes to the consolidated balance sheet
|
|
||||
|
277
|
Additional Notes
|
|
||||
|
320
|
Report of Independent Registered Public Accounting Firm
|
|
||||
|
3 –
|
|
|
||||
|
Compensation Report
|
|
|
||||
|
328
|
Compensation of the Management Board
|
|
||||
|
359
|
Compensation of members of the Supervisory Board
|
|
||||
|
362
|
Comparative presentation of compensation and earnings trends
|
|
||||
|
365
|
Compensation of the employees (unaudited)
|
|
||||
|
4 –
|
|
|
||||
|
Corporate Governance Statement/ Corporate Governance Report
|
|
|||||
|
379
|
Management Board and Supervisory Board
|
|
||||
|
394
|
Reporting and Transparency
|
|
||||
|
394
|
Related Party Transactions
|
|||||
|
395
|
Auditing and Controlling
|
|||||
|
398
|
Compliance with the German Corporate Governance Code
|
|
||||
|
5 –
|
|
|
||||
|
Supplementary Information
|
|
|||||
|
403
|
Non-GAAP Financial Measures
|
|
||||
|
414
|
Declaration of Backing
|
|
||||
|
415
|
Group Five-Year Record
|
|
||||
|
416
|
Imprint / Publications
|
|
||||
|
|
|
|
||||
2
|
|
Deutsche Bank
|
Operating and Financial Review
|
|
|
Annual Report 2021
|
Deutsche Bank Group
|
|
|
|
|
[Pages I to XXIII intentionally left blank for SEC filing purposes]
3
|
|
Deutsche Bank
|
Operating and Financial Review
|
|
|
Annual Report 2021
|
Deutsche Bank Group
|
|
|
|
|
1-
Combined Management Report
|
2
|
Operating and Financial Review
|
|
|
|
2
|
Executive Summary
|
|
|
|
5
|
Deutsche Bank Group
|
|
|
|
10
|
Results of Operations
|
|
|
|
29
|
Financial Position
|
|
|
|
31
|
Liquidity and Capital Resources
|
|
|
|
34
|
Outlook
|
|
|
|
41
|
Risks and Opportunities
|
|
|
|
54
|
Risk Report
|
|
|
|
56
|
Risk and capital overview
|
|
|
|
59
|
Risk and capital framework
|
|
|
|
68
|
Risk and Capital Management
|
|
|
|
118
|
Risk and capital performance
|
|
|
|
171
|
Sustainability
|
|
|
|
173
|
Employees
|
|
|
|
174
|
Internal Control over Financial Reporting
|
|
|
|
175
|
Information pursuant to Section 315a (1) of the German Commercial Code and Explanatory Report
|
|
|
|
176
|
Corporate Governance Statement to 289f and 315d of the German Commercial Code
|
|
|
|
176
|
Standalone parent company information (HGB)
|
|
|
|
|
|
|
|
4
|
|
Deutsche Bank
|
Operating and Financial Review
|
|
|
Annual Report 2021
|
Deutsche Bank Group
|
|
|
|
|
Operating and Financial Review
The following discussion and analysis should be read in conjunction with the consolidated financial statements and the related notes to them. Our Operating and Financial Review includes qualitative and quantitative disclosures on Segmental Results of Operations and Entity Wide disclosures on Net Revenue Components as required by International Financial Reporting Standard (IFRS) 8, “Operating Segments”. For additional Business Segment disclosure under IFRS 8 please refer to Note 4 “Business Segments and Related Information” of the Consolidated Financial Statements. Forward-looking statements are disclosed in the Outlook section.
Executive Summary
The Global Economy
|
Economic growth (in %)¹
|
|
2021²
|
|
2020³
|
|
Main driver
|
|
Global Economy
|
|
6.0
|
|
(3.1)
|
|
Global GDP growth in 2021 weakened slightly more than expected at the beginning of the year, largely due to a longer than anticipated drag from COVID-19 variants and supply chain disruptions. A partly disappointing performance in vaccine uptake and distribution somewhat dampened growth prospects while increasing inflation risk. Global GDP growth in 2021 is still the highest since the global financial crisis more than a decade ago even though various economies experienced remarkable fluctuations in recovery momentum.
|
|
Of which:
|
|
|
|
|
|
|
|
Developed countries
|
|
5.1
|
|
(4.8)
|
|
Developed countries benefited from the early availability of COVID-19 vaccines in 2021. Fiscal policies continued supporting domestic demand, while industry sectors benefited from the global recovery. Central banks also maintained their expansive stance and complemented fiscal policy measures. Nevertheless, the recovery of developed countries was slowed down by global supply chain constraints.
|
|
Emerging markets
|
|
6.6
|
|
(1.8)
|
|
The economic recovery in emerging markets was hampered by stop-go restrictions and vaccination pace. During the second half of 2021 inflation was driven by supply bottlenecks and higher energy prices.
|
|
Eurozone Economy
|
|
5.2
|
|
(6.5)
|
|
The Eurozone economies performed well especially after the wave of COVID-19 infections resulting from the Delta variant. However, conditions deteriorated in the second half of 2021 as supply constraints became headwinds and the Eurozone almost stagnated in the last quarter of 2021. The European Central Bank continued its support and its fiscal policy remained expansive.
|
|
Of which: German economy
|
|
2.8
|
|
(4.6)
|
|
The German economy recovered during 2021 after the easing of COVID-19 related restrictions and private consumption gained significant momentum. The industry benefited from strong global trade but was unable to realize its recovery potential due to supply bottlenecks. Combined with temporary factors, the supply chain constraints and higher energy prices led to a significant increase in inflation. These factors contributed to a GDP contraction in the final quarter of 2021.
|
|
U.S. Economy
|
|
5.7
|
|
(3.4)
|
|
The U.S. economy recovered strongly in 2021. Massive fiscal stimulus, the introduction of vaccines and a strong labor market improvement supported domestic demand. However, persistent supply bottlenecks and the impact of COVID-19 constrained the recovery somewhat. Inflation picked up strongly during the year. The Federal Reserve's monetary policy remained expansionary.
|
|
Japanese Economy
|
|
1.7
|
|
(4.5)
|
|
The recovery of the Japanese economy in 2021 was slower in comparison to other developed countries and was weaker than expected at the beginning of 2021. This development was due to the prolonged COVID-19 impact, the government's stringent response to the pandemic and increasing supply shortages of semiconductors and other products. The Bank of Japan continued to maintain its accommodative stance.
|
|
Asian Economy
4
|
|
7.1
|
|
(0.8)
|
|
Asia's economic recovery in 2021 was affected by weaker-than-expected GDP growth in a number of Asian economies and a more severe and prolonged COVID-19 impact. Over the course of 2021, growth performance became increasingly divergent, with the more advanced economies in Asia largely staying on their recovery path, while others faltered significantly.
|
|
Of which: Chinese Economy
|
|
8.1
|
|
2.2
|
|
China's economy experienced a dynamic start to 2021, with export demand being the main growth driver. As the year progressed, domestic demand was impacted by COVID-19 outbreaks and related measures, as well as strict enforcement of credit and regulatory discipline. The pressured real estate sector and energy shortages constrained the recovery.
|
|
|
|
|
|
|
|
|
1
Annual Real GDP Growth (% YoY). Sources: National Authorities unless stated otherwise.
2
Sources: Deutsche Bank Research.
3
Some economic data for 2020 was revised by public statistics authorities due to the economic effects of the pandemic. As a result, this data may differ from that previously published.
4
Includes China, Hong Kong, India, Indonesia, Malaysia, Philippines, Singapore, Sri Lanka, South Korea, Taiwan, Thailand and Vietnam; excludes Japan.
5
|
|
Deutsche Bank
|
Operating and Financial Review
|
|
|
Annual Report 2021
|
Deutsche Bank Group
|
|
|
|
|
The Banking Industry
|
|
|
Dec 31, 2021
|
||||||||
|
Growth year-over-year (in %)
|
|
Corporate
Lending
|
|
Retail
Lending
|
|
Corporate
Deposits
|
|
Retail
Deposits
|
|
Main driver
|
|
Eurozone
|
|
3.1
|
|
4.0
|
|
8.1
|
|
5.0
|
|
Corporate loan growth has rebounded significantly in recent months also contributing to higher corporate deposits growth. Household deposits expanded at about pre-COVID-19 rate. Retail lending has accelerated further, driven by mortgages, and is now essentially the strongest of the past decade.
|
|
Of which: Germany
|
|
5.0
|
|
5.2
|
|
6.4
|
|
3.3
|
|
Corporate loan growth initially slowed in 2021, but advanced again substantially in recent months and is now close to the pre-crisis level. Retail lending growth already at the highest level on record a year ago, has picked up even further momentum, especially in mortgages until lately when it levelled off. Consumer loans continue to stagnate. Household deposits are expanding at the slowest pace since 2016. Corporate deposit growth has slowed down somewhat but remains elevated.
|
|
US
|
|
0.9
|
|
3.8
|
|
11.3
1
|
|
11.3
1
|
|
Corporate loans were down year-on-year, but they have stabilized in the last months. Household lending has recovered from contraction and is now back at solid pre-crisis growth dynamics. Although down from extraordinary highs, total deposit growth has been still vigorous, with double-digit rates.
|
|
China
|
|
10.5
|
|
12.5
|
|
6.1
|
|
10.6
|
|
Both corporate and retail lending have slowed moderately, yet growth rates remain in double digits. Deposit funding has also lost momentum, particularly on the corporate side where volumes are essentially rising the least since the beginning of the pandemic, even though percentage changes have been stable recently.
|
|
|
|
|
|
|
|
|
|
|
|
|
1
Total US deposits as segment breakdown is not available.
2021 was an exceptional year for global Origination and Advisory (OA). Total fees set a new record, far exceeding the previous record from just a year ago, with an increase of 39 %. OA earnings have almost doubled in the past decade on a U.S. Dollar basis. In 2021, the fee pool reached new all-time highs across the major categories – Equity Origination, Debt Origination and largest increase observed in Advisory. The Americas accounted for 60 % of the total fee pool, EMEA for 23 % and APAC for 17 %. Volumes for Advisory (announced deals) as well as Equity Origination (record IPOs and follow-on transactions) climbed to their highest level ever, while Debt Origination decreased from its 2020 record driven by normalization of investment-grade corporate debt and government debt, though high-yield corporate bond issuance was the strongest ever. Overall FIC revenue pools declined by approximately 16 %, with G10 FX and Rates retreating by over 20 %, Emerging Markets declining by 10-15 % and Commodities (not part of DB product portfolio) was broadly flat year-on-year – all versus very strong 2020 performance. Financing products have outperformed, driven by a strong second half of 2021. Equities fee pool (again not a material part of DB product portfolio) has estimated to have grown 25 % year on year, with derivative and structured products the key drivers.
Deutsche Bank Performance
Deutsche Bank reported a profit before tax of € 3.5 billion and a net profit of € 2.6 billion for the full year 2021. Net profit increased fourfold relative to 2020 and the best result in ten years was delivered. The businesses gained momentum and market share during the year leading to revenue and profit growth across all four pillars of the Core Bank. The bank recognized 97% of the total anticipated transformation-related effects as well as reduced loan loss provisions supported by strong balance sheet and disciplined risk management. The transformation progress and financial performance in 2021 provides a strong step-off point to complete the transformation journey and deliver on the bank’s financial objectives in 2022. Reduction of legacy assets progressed faster than expected and the bank will resume capital distributions to shareholders. The bank announced actions which would provide total capital distributions to shareholders of approximately € 700 million in 2022. The Management Board has decided to initiate a share repurchase program of € 300 million, to be completed in the first half of 2022, and intends to propose to the Annual General Meeting a cash dividend of € 0.20 per share for the financial year 2021.
Pre-tax profit was € 3.5 billion in 2021 after absorbing transformation charges of € 1.0 billion and restructuring and severance expenses of € 470 million. The Core Bank, which excludes the Capital Release Unit, reported a pre-tax profit of € 4.9 billion in 2021 versus € 3.2 billion in 2020. Adjusting for transformation charges of € 945 million, restructuring and severance expenses of € 464 million and specific revenue items of negative € 74 million, pre-tax profit in the Core Bank would have been € 6.2 billion, up 49 % versus 2020 on a comparable basis.
6
|
|
Deutsche Bank
|
Operating and Financial Review
|
|
|
Annual Report 2021
|
Deutsche Bank Group
|
|
|
|
|
Revenues excluding specific items, Adjusted costs, Adjusted costs excluding transformation charges, Adjusted costs excluding transformation charges and expenses eligible for reimbursement related to Prime Finance, Adjusted profit (loss) before tax, Post-tax return on average tangible shareholders’ equity and Net Assets (adjusted) are non-GAAP financial measures. Please refer to “Supplementary Information (Unaudited): Non-GAAP Financial Measures” of this annual report for the definitions of such measures and reconciliations to the IFRS measures on which they are based.
Group Key Performance Indicators
|
Near-term operating performance
|
|
Status end of 2021
|
|
Status end of 2020
|
|
Group Post-tax return on average tangible shareholders’ equity¹
|
|
4.0 %
|
|
0.2 %
|
|
Core Bank Post-tax return on average tangible shareholders’ equity
2
|
|
6.6 %
|
|
4.0 %
|
|
Cost income ratio
3
|
|
84.2 %
|
|
88.4 %
|
|
|
|
|
|
|
|
Capital performance
|
|
|
|
|
|
Common Equity Tier 1 capital ratio
4
|
|
13.2 %
|
|
13.6 %
|
|
Leverage ratio (fully loaded)
4
|
|
4.9 %
|
|
4.7 %
|
|
|
|
|
|
|
1
Based on Net Income attributable to Deutsche Bank shareholders. For further information, please refer to “Supplementary Information (Unaudited): Non-GAAP Financial Measures” of this report
.
2
Based on Core Bank Net Income attributable to Deutsche Bank shareholders. For further information, please refer to “Supplementary Information (Unaudited): Non-GAAP Financial Measures” of this report.
3
Noninterest expenses as a percentage of total net revenues, which are defined as net interest income before provision for credit losses plus noninterest income.
4
Further detail on the calculation of this ratio is provided in the Risk Report.
Net revenues for the Group were € 25.5 billion in 2021, an increase of € 1.5 billion, or 6 % compared to 2020. Net revenues in the Core Bank increased by 5 % to € 25.5 billion. Net revenues in the Corporate Bank (CB) of € 5.2 billion remained flat year-on-year as business volume growth and deposit repricing offset interest rate headwinds. Net revenues in the Investment Bank (IB) increased by 4 % to € 9.6 billion in 2021, driven by significant increase in Origination Advisory reflecting favorable market conditions and record volume growth during the year while Fixed Income Currencies (FIC) sales trading remained essentially flat. Full-year net revenues in the Private Bank (PB) were € 8.2 billion, up 1 % year-on-year reflecting revenue growth in both Private Bank Germany and International Private Bank businesses as well as higher benefits from TLTRO that more than offset the adverse impact of interest rate headwinds and of forgone revenues resulting from the German Federal Court of Justice (BGH) ruling on customer consent for pricing changes on current accounts. Net revenues in Asset Management (AM) of € 2.7 billion increased by 21 % compared to the prior year reflecting growth in management fees due to improvements in equity market levels and seven consecutive quarters of net inflows as well as higher performance and transaction fees including favorable effects from a multi-asset performance fee in 2021. Net revenues in the Capital Release Unit (CRU) were € 26 million in 2021, versus negative € 225 million in the prior year, as revenues from Prime Finance cost recovery and the loan portfolio were only partly offset by funding, risk management and de-risking impacts. Revenues in Corporate and Other (CO) were negative € 211 million compared to negative € 552 million in the prior year reflecting favorable impact from valuation and timing differences driven by the positive mark-to-market impact from interest rate hedging activities in connection with the bank’s funding arrangements.
Provision for credit losses was € 515 million in 2021, down 71 % versus 2020, reflecting a supportive credit environment, high quality loan book and continued strict risk discipline against a backdrop of economic recovery due to the easing of COVID-19 restrictions during 2021. Provision for credit losses was 12 basis points of average loans, down from 41 basis points in 2020.
Noninterest expenses were € 21.5 billion in 2021, an increase of € 289 million or 1 %, from 2020. This includes transformation charges of € 1.0 billion, up from € 490 million in 2020. By the end of 2021, 97% of total transformation-related effects anticipated through the end of 2022 were already recognized. Litigation expenses increased by € 308 million, partly offset by a decline in restructuring and severance expenses by € 217 million. Adjusted costs excluding transformation charges and expenses eligible for reimbursement related to Prime Finance were € 19.3 billion, down 1 % compared to the prior year. The year-on-year decrease includes lower compensation costs reflecting the effects from workforce reductions of 1,690 full-time equivalents in 2021, partially offset by an increase in variable compensation costs. Excluding the aforementioned transformation charges and litigation, most expense categories within general and administrative expenses were lower or flat compared to last year, reflecting ongoing disciplined cost management.
Income tax expense was € 923 million in 2021, compared to € 391 million in the prior year. The effective tax rate in 2021 was 26 %.
The Bank reported a net profit of € 2.6 billion in 2021, compared to € 612 million in 2020. The improvement was driven by the aforementioned strong revenue performance across core businesses and reduced levels of provision for credit losses partly offset by a slight increase in non-interest expenses as described above.
The Common Equity Tier 1 (CET 1) capital ratio was 13.2 % at the end of 2021, a decrease of 40 bps compared to 2020. The leverage ratio improved from 4.7 % in 2020 to 4.9% at the end of 2021 on a fully loaded basis. The leverage ratio on a phase-in basis improved from 4.8 % in 2020 to 4.9 % in 2021.
7
|
|
Deutsche Bank
|
Operating and Financial Review
|
|
|
Annual Report 2021
|
Deutsche Bank Group
|
|
|
|
|
Deutsche Bank Group
Deutsche Bank: Our Organization
Headquartered in Frankfurt am Main, Germany, Deutsche Bank is the largest bank in Germany and one of the largest financial institutions in the world, as measured by total assets of € 1,325 billion as of December 31, 2021. As of that date, the bank had 82,969 full-time equivalent internal employees and operated in 58 countries with 1,709 branches, of which 67 % were located in Germany. The bank offers a wide variety of investment, financial and related products and services to private individuals, corporate entities and institutional clients around the world.
As of December 31, 2021, the bank was organized into the following segments:
- – Corporate Bank (CB)
- – Investment Bank (IB)
- – Private Bank (PB)
- – Asset Management (AM)
- – Capital Release Unit (CRU)
- – Corporate Other (CO)
We refer to CB, IB, PB, AM and CO as the Core Bank.
In addition, Deutsche Bank has a country and regional organizational layer to facilitate a consistent implementation of global strategies.
The bank has operations or dealings with existing and potential customers in most countries in the world. These operations and dealings include working through:
- – subsidiaries and branches;
- – representative offices; and
- – one or more representatives assigned to serve customers.
Capital expenditures or divestitures related to the divisions are included in the respective Corporate Division Overview.
Management Structure
The Management Board has structured the Group as a matrix organization, comprising Corporate Divisions and Infrastructure Functions operating in legal entities and branches across geographic locations.
The Management Board is responsible for the management of the company in accordance with the law, the Articles of Association and the Terms of Reference for the Management Board with the objective of creating sustainable value in the interests of the company. It considers the interests of shareholders, employees and other company-related stakeholders. The Management Board manages Deutsche Bank Group in accordance with uniform guidelines; it exercises general control over all Group companies.
The Management Board decides on all matters prescribed by law and the Articles of Association and ensures compliance with the legal requirements and internal guidelines (compliance). It also takes the necessary measures to ensure that adequate internal guidelines are developed and implemented. The Management Board's responsibilities include, in particular, the bank’s strategic management and direction, the allocation of resources, financial accounting and reporting, control and risk management, as well as corporate control and a properly functioning business organization. The members of the Management Board are collectively responsible for managing the bank’s business.
The allocation of functional responsibilities to the individual members of the Management Board is described in the Business Allocation Plan for the Management Board, which sets the framework for the delegation of responsibilities to senior management below the Management Board. The Management Board endorses individual accountability of senior position holders as opposed to joint decision-taking in committees. At the same time, the Management Board recognizes the importance of having comprehensive and robust information across all businesses in order to take well informed decisions and established, the “Group Management Committee” which aims to improve the information flow across the corporate divisions and between the corporate divisions and the Management Board along with the Infrastructure Committees, Business Executive Committees and Regional Committees. The Group Management Committee is a senior platform, which is not required by the German Stock Corporation Act, and is composed of all Management Board members, the most senior business representatives to exchange information and discuss business, growth and profitability.
8
|
|
Deutsche Bank
|
Operating and Financial Review
|
|
|
Annual Report 2021
|
Deutsche Bank Group
|
|
|
|
|
Corporate Bank
Corporate Division Overview
The Corporate Bank (CB) is primarily focused on serving corporate clients, including the German “Mittelstand”, larger and smaller sized commercial and business banking clients in Germany as well as multinational companies. It is also a partner to financial institutions with regards to certain Transaction Banking services.
Commencing from the first quarter of 2021, the Corporate Bank reports revenues based on three client categories: Institutional Client Services, Corporate Treasury Services and Business Banking. Institutional Client Services comprises of Cash Management for Institutional clients, Trust and Agency Services, as well as Securities Services. Corporate Treasury Services provides the full suite of Trade Finance and Lending, as well as Corporate Cash Management for multinational and German large and mid-sized corporate clients. Business Banking covers small corporates and entrepreneur clients in Germany and offers a holistic, largely standardized product suite.
There have been no significant capital expenditures or divestitures since January 1, 2019.
Products and Services
The Corporate Bank is a global provider of risk management solutions, cash management, lending, trade finance, trust and agency services as well as securities services. Focusing on the finance departments of corporate and commercial clients and financial institutions in Germany and across the globe, our holistic expertise and global network allows us to offer integrated solutions.
In addition to the Corporate Bank product suite, our Coverage teams provide clients with access to the expertise of the Investment Bank.
Distribution Channels and Marketing
The global Coverage function of the Corporate Bank focuses on international large corporate clients and is organized into two units: Coverage and Risk Management Solutions. Coverage includes multi-product generalists covering headquarter level and subsidiaries via global, regional and local coverage teams. Risk Management Solutions includes Foreign Exchange, Emerging Markets and Rates product specialists. This unit is managed regionally in APAC, Americas and EMEA to ensure close connectivity to our clients.
Corporate clients in Germany are served out of two units: Corporate Treasury Services and Business Banking. Corporate Treasury Services covers mid and large corporate clients across two brands, Deutsche Bank and Postbank, and offers the whole range of solutions across cash, trade financing, lending and risk management for the corporate treasurer. Business Banking covers small corporates and entrepreneur clients and offers a largely standardized product suite and selected contextual-banking partner offerings (e.g. accounting solutions).
Investment Bank
Corporate Division Overview
The Investment Bank (IB) combines Deutsche Bank’s Fixed Income, Currency (FIC) Sales Trading and, Origination Advisory, as well as Deutsche Bank Research. It focuses on its traditional strengths in financing, advisory, fixed income and currencies, bringing together wholesale banking expertise across coverage, risk management, sales and trading, Investment Banking and infrastructure. This enables IB to align resourcing and capital across our client and product perimeter to effectively serve the Bank’s clients.
In IB we made one significant capital divestiture since January 1, 2019:
In April 2019, Tradeweb closed its initial public offering (IPO). Tradeweb is a financial services company that builds and operates over-the-counter (OTC) marketplaces for trading fixed income products and derivatives. Deutsche Bank Group had an economic interest in Tradeweb from 2007 and participated in the initial public offering and several subsequent secondary offerings, alongside other large bank shareholders by selling a portion of its holdings.
There have been no significant capital expenditures since January 1, 2019.
9
|
|
Deutsche Bank
|
Operating and Financial Review
|
|
|
Annual Report 2021
|
Deutsche Bank Group
|
|
|
|
|
Products and Services
FIC Sales Trading brings together an institutional sales force, research, trading and structuring expertise across Foreign Exchange, Rates, Emerging markets, Credit trading and Financing. The FIC Sales Trading business operates globally and provides both corporate and institutional clients liquidity and market making services and a range of specialized risk management solutions across products, complemented by a comprehensive financing offering. The application of technology and continued innovation of transaction lifecycle processes is enabling Deutsche Bank to respond to all client requirements, increasing automation / electronification and regulatory requirements.
Origination and Advisory is responsible for our debt origination business, mergers and acquisitions (MA), and a focused equity advisory and origination platform. It is comprised of regional and industry-focused coverage teams, co-led from the bank’s hubs in Europe, the U.S. and Asia Pacific, that facilitates the delivery of a range of financial products and services to the bank’s corporate clients.
Distribution Channels and Marketing
Coverage of the IB’s clients is provided principally by three groups working in conjunction with each other: The Institutional Client Group, which houses our debt sales team. Risk Management Solutions in the Corporate Bank, which covers capital markets and Treasury solutions and Investment Banking Coverage within Origination Advisory. The close cooperation between these groups help to create enhanced synergies leading to increased cross selling of products/solutions to our clients.
Private Bank
Corporate Division Overview
Private Bank (PB) serves personal and private clients, wealthy individuals, entrepreneurs and families. The international businesses also focus on commercial clients. PB is organized along two business divisions: Private Bank Germany and International Private Bank.
PB was involved in the following significant capital divestitures since January 1, 2019:
In November 2020, Deutsche Bank AG signed an agreement to sell its share in Postbank Systems AG to Tata Consultancy Services (TCS). The transaction was closed after regulatory and governmental approvals on December 31, 2020.
In August 2021, Deutsche Bank SpA signed an agreement to sell its financial advisors network in Italy (Deutsche Bank Financial Advisors) to Zurich Italy. The transaction is subject to regulatory approval and is expected to close in 2022.
There have been no significant capital expenditures since January 1, 2019.
Products and Services
PB’s product range includes payment and account services, credit and deposit products as well as investment advice including a range of Environmental, Social and Governance (ESG) products, which enable their clients to invest in line with their values and according to specified ESG strategies, scores and exclusionary criteria.
Private Bank Germany pursues a differentiated, customer-focused approach with two strong and complementary main brands: Deutsche Bank and Postbank. With the Deutsche Bank brand, the division focuses on providing their private customers with banking and financial products and services that include sophisticated and individual advisory solutions. The focus of Postbank brand remains on providing their retail customers with standard products and daily retail banking services supported by direct banking capabilities. In cooperation with Deutsche Post DHL AG, Private Bank Germany also offers postal and parcel services in the Postbank brand branches.
International Private Bank also has a differentiated, customer-focused approach with two client segments. The IPB Personal Banking client segment covers the retail and affluent customers as well as small businesses in Italy, Spain, Belgium and India, providing them with banking and other financial services. The client segment Private Banking and Wealth Management covers high-net-worth and ultra-high-net-worth clients globally as well as small and medium-sized corporate clients and private banking clients in Italy, Spain, Belgium and India. The International Private Bank supports clients in planning, managing and investing their wealth, financing their personal and business interests and servicing their institutional and corporate needs. They also provide institutional-type services for sophisticated clients and complement their offerings by closely collaborating with the Investment Bank, the Corporate Bank and Asset Management.
10
|
|
Deutsche Bank
|
Operating and Financial Review
|
|
|
Annual Report 2021
|
Deutsche Bank Group
|
|
|
|
|
Distribution Channels and Marketing
Private Bank pursues an omni-channel approach and customers can flexibly choose between different possibilities to access services and products.
The distribution channels include branch networks in Private Bank Germany and International Private Bank, supported by customer call centers and self-service terminals. Advisory centers of the Deutsche Bank brand in Germany, Italy and Spain supplement the branch network and digital offerings including online and mobile banking. PB also has collaborations with self-employed financial advisors and other sales and cooperation partners, including various cooperations with Business-to-Business-to-Consumer (B2B2C) partners in Germany. For the private banking and wealth management client segment, the International Private Bank has a distinct client coverage team approach with Relationship and Investment Managers supported by Client Service Executives assisting clients with wealth management services and open-architecture products. In addition, in Germany, Deutsche Oppenheim Family Offices AG provides family office services, discretionary funds and advisory solutions.
The expansion of digital capabilities remains a strong focus across the businesses as Private Bank observes a significant change in client behavior towards digital channels. They will continue to optimize their omni-channel mix in the future in order to provide customers with the most convenient access to products and services.
Asset Management
Corporate Division Overview
With € 928 billion of assets under management as of December 31, 2021, the Asset Management division, which operates under the brand DWS, is one of the world’s leading asset management organizations. DWS serves a diverse client base of retail and institutional investors worldwide, with a strong presence in our home market in Germany. The client base includes government institutions, corporations and foundations as well as individual investors. As a regulated asset manager, DWS acts as a fiduciary for clients and we are conscious of our impact on society. Responsible Investing has been a key part of our heritage for more than twenty years.
Deutsche Bank retains 79.49% ownership interest in DWS and asset management remains a core business for the group. The shares of DWS are listed on the Frankfurt stock exchange.
There have been no significant capital expenditures or divestitures since January 1, 2019.
Products and Services
DWS’s investment offerings span all major asset classes including equity, fixed income, cash and multi asset as well as alternative investments. The alternative investments include real estate, infrastructure, private equity, liquid real assets and sustainable investments. There are also a range of passive investments. In addition, DWS’s solution strategies are targeted to client needs that cannot be addressed by traditional asset classes alone. Such services include insurance and pension solutions, asset-liability management, portfolio management solutions and asset allocation advisory. Our deep environmental, social and governance focus complement each other when creating targeted solutions for our clients.
Distribution Channels and Marketing
DWS’s product offerings are distributed across EMEA (Europe, Middle East and Africa), the Americas and Asia Pacific through a single global distribution network. DWS also leverages third-party distribution channels, including other members of Deutsche Bank Group.
Capital Release Unit
The Capital Release Unit (CRU) was created in July 2019. The CRU’s principal objective is to liberate capital consumed by low return assets and businesses that earn insufficient returns or that are no longer core to our strategy, by winding those down in an opportunistic manner. In addition, CRU is focused on reducing costs.
In addition, the CRU division recorded the following significant capital divestitures since January 1, 2019:
In March 2018, Deutsche Bank Group entered into an agreement to sell the retail banking business in Portugal to ABANCA Corporación Bancaria S.A. The parties closed the transaction in the first half of 2019.
In the fourth quarter of 2021, we concluded the transition of Deutsche Bank’s Prime Finance and Electronic Equities platform to BNP Paribas resulting in the transfer of technology, clients and staff. This achievement marks the end of a two-year transition period, which formally commenced in the fourth quarter of 2019.
11
|
|
Deutsche Bank
|
Operating and Financial Review
|
|
|
Annual Report 2021
|
Deutsche Bank Group
|
|
|
|
|
Infrastructure
The Infrastructure functions perform control and service activities for the businesses, including tasks relating to Group-wide, cross-divisional resource-planning, steering and control, as well as tasks relating to risk, liquidity and capital management.
The Infrastructure functions are organized into the following areas of responsibility of our senior management:
- – Finance
- – Risk
- – Chief Administration Office which includes Legal, Compliance and Anti Financial Crime
- – Technology, Data and Innovation
- – Transformation and Global Procurement
Infrastructure also includes Communications Corporate Social Responsibility, Human Resources, Global Real Estate and Group Audit which report to the Chief Executive Officer.
Costs originating in the Infrastructure functions are currently allocated to the corporate divisions based on the planned allocations, except for technology development costs which were charged to Divisions based on actual expenditures during 2021. During the financial year 2021, the prior cost allocation methodology has been replaced with a driver-based cost management (DBCM) framework for finance and risk functions and consumption based cost allocation of Technology Infrastructure products. This new framework links the services provided by the Infrastructure functions to the businesses which consume them thereby creating enhanced transparency regarding the drivers for the costs which are being charged and facilitate the identification of cost reduction opportunities.
Significant Capital Expenditures and Divestitures
Information on each Corporate Division’s significant capital expenditures and divestitures for the last three financial years has been included in the above descriptions of the Corporate Divisions.
Since January 1, 2021, there have been no public takeover offers by third parties with respect to our shares and we have not made any public takeover offers for our own account in respect of any other company’s shares.
12
|
|
Deutsche Bank
|
Operating and Financial Review
|
|
|
Annual Report 2021
|
Deutsche Bank Group
|
|
|
|
|
Results of Operations
Consolidated Results of Operations
You should read the following discussion and analysis in conjunction with the consolidated financial statements.
Condensed Consolidated Statement of Income
|
in € m.
|
|
|
|
|
|
|
|
2021 increase (decrease)
from 2020
|
|
2020 increase (decrease)
from 2019
|
||||
|
(unless stated otherwise)
|
|
2021
|
|
2020
|
|
2019
|
|
in € m.
|
|
in %
|
|
in € m.
|
|
in %
|
|
Net interest income
|
|
11,117
|
|
11,548
|
|
13,749
|
|
(431)
|
|
(4)
|
|
(2,201)
|
|
(16)
|
|
Provision for credit losses
|
|
515
|
|
1,792
|
|
723
|
|
(1,276)
|
|
(71)
|
|
1,068
|
|
148
|
|
Net interest income after provision for credit losses
|
|
10,602
|
|
9,756
|
|
13,026
|
|
846
|
|
9
|
|
(3,269)
|
|
(25)
|
|
Commissions and fee income¹
|
|
10,934
|
|
9,424
|
|
9,520
|
|
1,510
|
|
16
|
|
(96)
|
|
(1)
|
|
Net gains (losses) on financial assets/liabilities at fair value through profit or loss¹
|
|
3,139
|
|
2,332
|
|
193
|
|
807
|
|
35
|
|
2,139
|
|
N/M
|
|
Net gains (losses) on financial assets at fair value through other comprehensive income
|
|
237
|
|
323
|
|
260
|
|
(86)
|
|
(27)
|
|
63
|
|
24
|
|
Net gains (losses) on financial assets at amortized cost
|
|
1
|
|
311
|
|
3
|
|
(311)
|
|
(100)
|
|
308
|
|
N/M
|
|
Net income (loss) from equity method investments
|
|
98
|
|
120
|
|
110
|
|
(23)
|
|
(19)
|
|
10
|
|
9
|
|
Other income (loss)
|
|
13
|
|
(48)
|
|
(671)
|
|
62
|
|
N/M
|
|
623
|
|
(93)
|
|
Total noninterest income
|
|
14,421
|
|
12,463
|
|
9,416
|
|
1,958
|
|
16
|
|
3,047
|
|
32
|
|
Total net revenues²
|
|
25,023
|
|
22,219
|
|
22,441
|
|
2,804
|
|
13
|
|
(222)
|
|
(1)
|
|
Compensation and benefits
|
|
10,418
|
|
10,471
|
|
11,142
|
|
(53)
|
|
(1)
|
|
(671)
|
|
(6)
|
|
General and administrative expenses
|
|
10,821
|
|
10,259
|
|
12,253
|
|
561
|
|
5
|
|
(1,993)
|
|
(16)
|
|
Impairment of goodwill and other intangible assets
|
|
5
|
|
0
|
|
1,037
|
|
4
|
|
N/M
|
|
(1,037)
|
|
(100)
|
|
Restructuring activities
|
|
261
|
|
485
|
|
644
|
|
(224)
|
|
(46)
|
|
(159)
|
|
(25)
|
|
Total noninterest expenses
|
|
21,505
|
|
21,216
|
|
25,076
|
|
289
|
|
1
|
|
(3,860)
|
|
(15)
|
|
Profit (loss) before tax
|
|
3,518
|
|
1,003
|
|
(2,634)
|
|
2,515
|
|
N/M
|
|
3,637
|
|
N/M
|
|
Income tax expense (benefit)
|
|
923
|
|
391
|
|
2,630
|
|
532
|
|
136
|
|
(2,239)
|
|
(85)
|
|
Profit (loss)
|
|
2,595
|
|
612
|
|
(5,265)
|
|
1,983
|
|
N/M
|
|
5,876
|
|
N/M
|
|
Profit (loss) attributable to noncontrolling interests
|
|
144
|
|
129
|
|
125
|
|
15
|
|
12
|
|
4
|
|
3
|
|
Profit (loss) attributable to Deutsche Bank shareholders and additional equity components
|
|
2,451
|
|
483
|
|
(5,390)
|
|
1,968
|
|
N/M
|
|
5,873
|
|
N/M
|
|
Profit (loss) attributable to additional equity components
|
|
426
|
|
382
|
|
328
|
|
44
|
|
12
|
|
53
|
|
16
|
|
Profit (loss) attributable to Deutsche Bank shareholders
|
|
2,025
|
|
101
|
|
(5,718)
|
|
1,923
|
|
N/M
|
|
5,820
|
|
N/M
|
|
|
|
|
|
|
|
|
|
|
|
|
|
|
|
|
N/M – Not meaningful
1
For further detail please refer to Note 1 “Significant Accounting Policies and Critical Accounting Estimates” of this annual report.
2
After provision for credit losses.
Net Interest Income
|
in € m.
|
|
|
|
|
|
|
|
2021 increase (decrease)
from 2020
|
|
2020 increase (decrease)
from 2019
|
||||
|
(unless stated otherwise)
|
|
2021
|
|
2020
|
|
2019
|
|
in € m.
|
|
in %
|
|
in € m.
|
|
in %
|
|
Total interest and similar income
|
|
16,773
|
|
17,954
|
|
25,208
|
|
(1,181)
|
|
(7)
|
|
(7,254)
|
|
(29)
|
|
Total interest expenses
|
|
5,655
|
|
6,405
|
|
11,458
|
|
(750)
|
|
(12)
|
|
(5,053)
|
|
(44)
|
|
Net interest income
|
|
11,117
|
|
11,548
|
|
13,749
|
|
(431)
|
|
(4)
|
|
(2,201)
|
|
(16)
|
|
Average interest-earning assets
1
|
|
938,269
|
|
920,259
|
|
956,362
|
|
18,011
|
|
2
|
|
(36,104)
|
|
(4)
|
|
Average interest-bearing liabilities
1
|
|
690,742
|
|
685,772
|
|
714,716
|
|
4,970
|
|
1
|
|
(28,944)
|
|
(4)
|
|
Gross interest yield
2
|
|
1.57 %
|
|
1.83 %
|
|
2.53 %
|
|
(0.26) ppt
|
|
(14)
|
|
(0.70) ppt
|
|
(28)
|
|
Gross interest rate paid
3
|
|
0.53 %
|
|
0.78 %
|
|
1.47 %
|
|
(0.25) ppt
|
|
(32)
|
|
(0.69) ppt
|
|
(47)
|
|
Net interest spread
4
|
|
1.05 %
|
|
1.06 %
|
|
1.07 %
|
|
(0.01) ppt
|
|
(1)
|
|
(0.01) ppt
|
|
(1)
|
|
Net interest margin
5
|
|
1.18 %
|
|
1.25 %
|
|
1.44 %
|
|
(0.07) ppt
|
|
(6)
|
|
(0.18) ppt
|
|
(13)
|
|
|
|
|
|
|
|
|
|
|
|
|
|
|
|
|
ppt – Percentage points
1
Average balances for each year are calculated in general based upon month-end balances.
2
Gross interest yield is the average interest rate earned on average interest-earning assets.
3
Gross interest rate paid is the average interest rate paid on average interest-bearing liabilities.
4
Net interest spread is the difference between the average interest rate earned on average interest-earning assets and the average interest rate paid on average interest-bearing liabilities.
5
Net interest margin is net interest income expressed as a percentage of average interest-earning assets.
13
|
|
Deutsche Bank
|
Operating and Financial Review
|
|
|
Annual Report 2021
|
Deutsche Bank Group
|
|
|
|
|
2021
Net interest income was € 11.1 billion in 2021 compared to € 11.5 billion in 2020, a decrease of € 431 million, or 4 %, as the negative effects from interest rate headwinds were in part offset by increased interest income from business growth as well as higher benefits from deposit repricing and the Targeted Longer-Term Refinancing Operations III (TLTRO III) program. Interest income included € 494 million related to EU government grants under the TLTRO III program in 2021, whereas 2020 included € 86 million under this program and € 43 million related to EU government grants under the Targeted Longer-Term Refinancing Operations II (TLTRO II) program. Overall, the Bank’s net interest margin was 1.18 % in 2021, a decline of 7 basis points compared to the prior year.
2020
Net interest income was € 11.5 billion in 2020 compared to € 13.7 billion in 2019, a decrease of € 2.2 billion, or 16 %. The decrease was primarily driven by lower interest rates and unfavorable movements in foreign exchange rates. These negative effects were partly offset by improved volumes and client flows in Investment Bank as well as positive effects from deposit repricing in the Corporate Bank. Interest income included € 43 million related to EU government grants under the Targeted Longer-Term Refinancing Operations II (TLTRO II) program in 2020, whereas 2019 included € 93 million under this program. In addition, interest income for the year 2020 included € 86 million, which were related to EU government grants under the Targeted Longer-Term Refinancing Operations III (TLTRO III) program. Overall, the bank’s net interest margin declined by 18 basis points compared to the prior year to 1.25 % in 2020.
Net Gains (Losses) on Financial Assets/Liabilities at Fair Value through Profit or Loss
|
in € m.
|
|
|
|
|
|
|
|
2021 increase (decrease)
from 2020
|
|
2020 increase (decrease)
from 2019
|
||||
|
(unless stated otherwise)
|
|
2021
|
|
2020
|
|
2019
|
|
in € m.
|
|
in %
|
|
in € m.
|
|
in %
|
|
Trading income
|
|
1,954
|
|
2,097
|
|
197
|
|
(143)
|
|
(7)
|
|
1,900
|
|
N/M
|
|
Net gains (losses) on non-trading
financial assets mandatory at fair value
through profit or loss
|
|
1,106
|
|
276
|
|
377
|
|
831
|
|
N/M
|
|
(102)
|
|
(27)
|
|
Net gains (losses) on financial
assets/liabilities designated at fair value
through profit or loss
|
|
79
|
|
(40)
|
|
(381)
|
|
119
|
|
N/M
|
|
341
|
|
(89)
|
|
Total net gains (losses) on financial
assets/liabilities at fair value through
profit or loss
|
|
3,139
|
|
2,332
|
|
193
|
|
807
|
|
35
|
|
2,139
|
|
N/M
|
|
|
|
|
|
|
|
|
|
|
|
|
|
|
|
|
N/M – Not meaningful
2021
Net gains on financial assets/liabilities at fair value through profit or loss were € 3.1 billion in 2021, compared to € 2.3 billion in 2020. The increase of € 807 million or 35 % was driven by a positive impact from interest rate hedges in CO as well as favorable change in fair value of guarantees and an increase in mark-to-market valuation for illiquid products in AM.
The overall increase was partly offset by negative mark-to-market impacts on derivatives in IB reflecting more challenging market conditions compared to a very favorable trading environment in 2020.
2020
Net gains on financial assets/liabilities at fair value through profit or loss were € 2.3 billion in 2020, compared to € 193 million in 2019. The increase of € 2.1 billion was primarily driven by mark-to-market impacts on derivatives as well as positive impacts from overall strategic repositioning in IB resulting in strong client flows and benefits from increased market volatility. The development further benefited from positive effects from interest rate hedges in CO, which did not fully compensate the negative effects of the lower interest rates in Net Interest Income. This overall increase was partly offset by a negative impact from de-risking in the Capital Release Unit (CRU).
Net Interest Income and Net Gains (Losses) on Financial Assets/Liabilities at Fair Value through Profit or Loss
The bank’s trading and risk management activities include interest rate instruments and related derivatives. Under IFRS, interest and similar income earned from trading instruments and financial instruments designated at fair value through profit or loss (i.e., coupon and dividend income) and the costs of funding net trading positions are part of net interest income. The bank’s trading activities can periodically shift income between net interest income and net gains (losses) on financial assets/liabilities at fair value through profit or loss depending on a variety of factors, including risk management strategies.
In order to provide a more business-focused discussion, the following table presents net interest income and net gains (losses) on financial assets/liabilities at fair value through profit or loss by corporate division.
14
|
|
Deutsche Bank
|
Operating and Financial Review
|
|
|
Annual Report 2021
|
Deutsche Bank Group
|
|
|
|
|
|
in € m.
|
|
|
|
|
|
|
|
2021 increase (decrease)
from 2020
|
|
2020 increase (decrease)
from 2019
|
||||
|
(unless stated otherwise)
|
|
2021
|
|
2020
|
|
2019
|
|
in € m.
|
|
in %
|
|
in € m.
|
|
in %
|
|
Net interest income
|
|
11,117
|
|
11,548
|
|
13,749
|
|
(431)
|
|
(4)
|
|
(2,201)
|
|
(16)
|
|
Total net gains (losses) on financial assets/liabilities
at fair value through profit or loss
|
|
3,139
|
|
2,332
|
|
193
|
|
807
|
|
35
|
|
2,139
|
|
N/M
|
|
Total net interest income and net gains (losses) on
financial assets/liabilities at fair value through profit or loss
|
|
14,256
|
|
13,880
|
|
13,942
|
|
376
|
|
3
|
|
(62)
|
|
(0)
|
|
|
|
|
|
|
|
|
|
|
|
|
|
|
|
|
|
Breakdown by Corporate Division:
1
|
|
|
|
|
|
|
|
|
|
|
|
|
|
|
|
Corporate Bank
|
|
2,666
|
|
2,939
|
|
2,718
|
|
(273)
|
|
(9)
|
|
221
|
|
8
|
|
Investment Bank
|
|
6,891
|
|
7,193
|
|
5,442
|
|
(302)
|
|
(4)
|
|
1,750
|
|
32
|
|
Private Bank
|
|
4,847
|
|
4,648
|
|
4,991
|
|
198
|
|
4
|
|
(343)
|
|
(7)
|
|
Asset Management
|
|
246
|
|
(98)
|
|
87
|
|
345
|
|
N/M
|
|
(185)
|
|
N/M
|
|
Capital Release Unit
|
|
(18)
|
|
(33)
|
|
155
|
|
15
|
|
(45)
|
|
(188)
|
|
N/M
|
|
Corporate Other
|
|
(375)
|
|
(768)
|
|
549
|
|
393
|
|
(51)
|
|
(1,317)
|
|
N/M
|
|
Total net interest income and net gains (losses) on
financial assets/liabilities at fair value through profit or loss
|
|
14,256
|
|
13,880
|
|
13,942
|
|
376
|
|
3
|
|
(62)
|
|
(0)
|
|
|
|
|
|
|
|
|
|
|
|
|
|
|
|
|
N/M – Not meaningful
Prior year segmental information presented in the current structure.
1
This breakdown reflects net interest income and net gains (losses) on financial assets/liabilities at fair value through profit or loss only. For a discussion of the corporate divisions’ total revenues by product please refer to Note 4 “Business Segments and Related Information”.
2021
Total net interest income and net gains (losses) on financial assets/liabilities at fair value through profit or loss were € 14.3 billion in 2021, compared to € 13.9 billion in 2020, an increase of € 376 million. This was primarily due to a favorable change in fair value of guarantees, an increase in mark-to-market valuation for illiquid products and a favorable impact from the valuation of consolidated guaranteed mutual funds which has a corresponding offset in Other Income in AM. The development further benefited from a positive impact from interest rate hedges in CO. In Private Bank, net interest income increased including positive effects from business growth and higher benefits from TLTRO, partly offset by negative effects from interest rate headwinds.
These overall positive effects were partially offset by negative mark-to-market impacts on derivatives in IB reflecting more challenging market conditions compared to a very favorable trading environment in 2020. Revenues in CB also declined primarily as negative effects from interest rate headwinds more than offset the benefits from TLTRO, deposit re-pricing and business growth.
2020
Total net interest income and net gains (losses) on financial assets/liabilities at fair value through profit or loss were € 13.9 billion in 2020, which remained stable compared to 2019. This was primarily due to mark-to-market impacts on derivatives as well as positive impacts from overall strategic repositioning in IB resulting in strong client flows and benefits from increased market volatility, deposit repricing measures in CB and PB and growth in loan volumes in PB. In CO, mark-to-market impacts from interest rate hedging activities did not fully compensate the negative effects of the lower interest rates. This was further offset by continued negative impact of the low interest rate environment on deposit margins in PB and de-risking costs in CRU. Net interest income and net gains (losses) on financial assets/liabilities at fair value through profit or loss in AM also decreased compared to the prior year reflecting an unfavorable impact from the valuation of consolidated guaranteed mutual funds which has a corresponding offset in Other Income.
Provision for Credit Losses
2021
Provision for credit losses was € 515 million in 2021, a decrease of € 1.3 billion, or 71 % versus 2020, reflecting a supportive credit environment and a strong economic recovery due to the easing of COVID-19 related restrictions. The management overlay to reduce the weight of short-term forecasts in the standard model and base forward looking information on longer term averages during the height of the COVID-19 crisis was no longer applied in 2021. The lower level of provision for credit losses also included a positive effect from the release of a management overlay to account for uncertainties in the macro-economic outlook at the end of 2020 as the expected uncertainties did not materialize. This was partially offset by a new management overlay to address macro-economic variables outside the calibrated range of the IFRS 9 model. Provision for credit losses was 12 basis points of loans supported by strong balance sheet and disciplined risk management. Please refer to the sections “Segment Results of Operations” and “Risk Report” for further details on provision for credit losses.
2020
Provision for credit losses was € 1.8 billion in 2020, an increase of € 1.1 billion, or 148 % compared to 2019. This increase was primarily driven by negative impacts from COVID-19 related impairments. The net increase of provisions for credit losses on performing assets includes a management overlay to reduce the weight of short-term forecasts in the standard model and base forward looking information on longer term averages during the height of the COVID-19 crisis and an additional management overlay to account for remaining uncertainties in the macro-economic outlook. Provision for credit losses was 41 basis points of loans reflecting the high quality of the bank’s loan book. Please refer to the sections “Segment Results of Operations” and “Risk Report” for further details on provision for credit losses.
15
|
|
Deutsche Bank
|
Operating and Financial Review
|
|
|
Annual Report 2021
|
Deutsche Bank Group
|
|
|
|
|
Remaining Noninterest Income
|
in € m.
|
|
|
|
|
|
|
|
2021 increase (decrease)
from 2020
|
|
2020 increase (decrease)
from 2019
|
||||
|
(unless stated otherwise)
|
|
2021
|
|
2020
|
|
2019
|
|
in € m.
|
|
in %
|
|
in € m.
|
|
in %
|
|
Commissions and fee income
1
|
|
10,934
|
|
9,424
|
|
9,520
|
|
1,510
|
|
16
|
|
(96)
|
|
(1)
|
|
Net gains (losses) on financial assets at fair value
through other comprehensive income
|
|
237
|
|
323
|
|
260
|
|
(86)
|
|
(27)
|
|
63
|
|
24
|
|
Net gains (losses) on financial assets at amortized
cost
|
|
1
|
|
311
|
|
3
|
|
(311)
|
|
(100)
|
|
308
|
|
N/M
|
|
Net income (loss) from equity method investments
|
|
98
|
|
120
|
|
110
|
|
(23)
|
|
(19)
|
|
10
|
|
9
|
|
Other income (loss)
|
|
13
|
|
(48)
|
|
(671)
|
|
62
|
|
N/M
|
|
623
|
|
(93)
|
|
Total remaining noninterest income
|
|
11,282
|
|
10,130
|
|
9,222
|
|
1,151
|
|
11
|
|
908
|
|
10
|
|
|
|
|
|
|
|
|
|
|
|
|
|
|
|
|
|
1
includes:
|
|
|
|
|
|
|
|
|
|
|
|
|
|
|
|
Commissions and fees from fiduciary activities:
|
|
|
|
|
|
|
|
|
|
|
|
|
|
|
|
Commissions for administration
|
|
357
|
|
347
|
|
327
|
|
10
|
|
3
|
|
19
|
|
6
|
|
Commissions for assets under management
|
|
3,734
|
|
3,208
|
|
3,298
|
|
526
|
|
16
|
|
(90)
|
|
(3)
|
|
Commissions for other securities business
|
|
398
|
|
341
|
|
317
|
|
57
|
|
17
|
|
24
|
|
7
|
|
Total
|
|
4,489
|
|
3,896
|
|
3,943
|
|
594
|
|
15
|
|
(47)
|
|
(1)
|
|
Commissions, broker’s fees, mark-ups on securities
underwriting and other securities activities:
|
|
|
|
|
|
|
|
|
|
|
|
|
|
|
|
Underwriting and advisory fees
|
|
2,162
|
|
1,625
|
|
1,501
|
|
537
|
|
33
|
|
125
|
|
8
|
|
Brokerage fees
|
|
752
|
|
637
|
|
637
|
|
115
|
|
18
|
|
0
|
|
0
|
|
Total
|
|
2,914
|
|
2,262
|
|
2,137
|
|
652
|
|
29
|
|
125
|
|
6
|
|
Fees for other customer services
|
|
3,530
|
|
3,266
|
|
3,440
|
|
264
|
|
8
|
|
(174)
|
|
(5)
|
|
Total commissions and fee income
|
|
10,934
|
|
9,424
|
|
9,520
|
|
1,510
|
|
16
|
|
(96)
|
|
(1)
|
|
|
|
|
|
|
|
|
|
|
|
|
|
|
|
|
N/M – Not meaningful
Prior years' comparatives aligned to presentation in the current year.
Commissions and fee income
2021
Commissions and fee income was € 10.9 billion in 2021, an increase of € 1.5 billion, or 16 %, compared to 2020. The increase was driven by € 537 million higher underwriting and advisory fees due to strong growth in equity origination revenues from record Special Purpose Acquisition Company (SPAC) activity, significant growth in mergers acquisition activity and higher volumes during the year. Commissions for assets under management increased by € 526 million due to higher management fees from favorable markets and net inflows combined with favorable effects from a Multi Asset performance fee as well as increased real estate performance and transaction fees in AM. Fees for other customer services improved by € 264 million driven by strong performance in Leveraged Debt Capital Markets partly offset by a negative impact of € 154 million on revenues in PB subsequent to the BGH ruling. Brokerage fees increased by € 115 million mainly driven by a significant increase in revenues from investment products in PB.
2020
Commissions and fee income was € 9.4 billion in 2020, a decrease of € 96 million, or 1 %, compared to 2019. The decrease included € 174 million lower fees for other customer services in the Corporate Bank mainly driven by reduced economic activities. Commissions for assets under management decreased by € 90 million in AM mainly due to absence of performance fees from Multi Asset and Alternatives recognized in 2019. Underwriting and advisory fees increased by € 125 million mainly driven by increased activity and market share gains in debt market as well as an increase in global fee pool and issuances in equities. Brokerage fees have remained flat year-over-year mainly as the negative impact from discontinued business activities in CRU following the execution of the bank’s transformation strategy announced in July 2019 was fully compensated by higher commission and fee income in PB from investment and insurance products including benefits from re-pricing measures.
Net gains (losses) on financial assets at fair value through other comprehensive income
2021
Net gains on financial assets at fair value through other comprehensive income were € 237 million in 2021, a decrease of € 86 million, or 27 % compared to 2020 driven by lower gains from the sale of bonds and securities from strategic liquidity reserve.
2020
Net gains on financial assets at fair value through other comprehensive income were € 323 million in 2020, an increase of € 63 million, or 24 % compared to 2019 driven mainly by higher gains from the sale of bonds and securities from strategic liquidity reserve.
16
|
|
Deutsche Bank
|
Operating and Financial Review
|
|
|
Annual Report 2021
|
Deutsche Bank Group
|
|
|
|
|
Net gains (losses) on financial assets at amortized cost
2021
Net gains (losses) on financial assets at amortized cost were € 1 million in 2021 compared to € 311 million in 2020, driven by the absence of a 2020 gain from sale of assets out of the Hold-to-collect portfolio.
2020
Net gains (losses) on financial assets at amortized cost were € 311 million in 2020 and € 3 million in 2019, driven by a sale of assets out of the Hold-to-collect portfolio in 2020 as part of the bank’s strategy for managing the interest rate risk in the banking book.
Net income (loss) from equity method investments
2021
Net income from equity method investments was € 98 million in 2021 compared to € 120 million in 2020, a decrease of € 23 million, or 19 %.
2020
Net income from equity method investments was € 120 million in 2020 compared to € 110 million in 2019, an increase of € 10 million, or 9 %.
Other income (loss)
2021
Other income (loss) was € 13 million in 2021 compared to € (48) million in 2020. The improvement was driven by positive impacts associated with hedge ineffectiveness along with fair value hedge accounting adjustments. Further, favorable year-on-year movements in CRU were driven by lower de-risking impacts. This was partly offset by a negative impact from valuation adjustments on liabilities of guaranteed mutual funds in AM that offsets the aforementioned positive impact in net gains (losses) on financial assets/liabilities at fair value through profit or loss.
2020
Other income (loss) was € (48) million in 2020 compared to € (671) million in 2019. The improvement was driven by positive impacts associated with hedge ineffectiveness along with fair value hedge accounting adjustments. Furthermore, other income includes a positive impact from a valuation adjustment on liabilities of guaranteed mutual funds in AM that offsets a negative impact in net gains (losses) on financial assets/liabilities at fair value through profit or loss.
Noninterest Expenses
|
in € m.
|
|
|
|
|
|
|
|
2021 increase (decrease)
from 2020
|
|
2020 increase (decrease)
from 2019
|
||||
|
(unless stated otherwise)
|
|
2021
|
|
2020
|
|
2019
|
|
in € m.
|
|
in %
|
|
in € m.
|
|
in %
|
|
Compensation and benefits
|
|
10,418
|
|
10,471
|
|
11,142
|
|
(53)
|
|
(1)
|
|
(671)
|
|
(6)
|
|
General and administrative expenses¹
|
|
10,821
|
|
10,259
|
|
12,253
|
|
561
|
|
5
|
|
(1,993)
|
|
(16)
|
|
Impairment of goodwill and other intangible
assets
|
|
5
|
|
0
|
|
1,037
|
|
4
|
|
N/M
|
|
(1,037)
|
|
(100)
|
|
Restructuring activities
|
|
261
|
|
485
|
|
644
|
|
(224)
|
|
(46)
|
|
(159)
|
|
(25)
|
|
Total noninterest expenses
|
|
21,505
|
|
21,216
|
|
25,076
|
|
289
|
|
1
|
|
(3,860)
|
|
(15)
|
|
N/M – Not meaningful
|
|
|
|
|
|
|
|
|
|
|
|
|
|
|
|
|
|
|
|
|
|
|
|
|
|
|
|
|
|
|
|
1
includes:
|
|
|
|
|
|
|
|
|
|
|
|
|
|
|
|
Information Technology
|
|
4,321
|
|
3,862
|
|
5,011
|
|
459
|
|
12
|
|
(1,149)
|
|
(23)
|
|
Occupancy, furniture and equipment
expenses
|
|
1,727
|
|
1,724
|
|
1,693
|
|
3
|
|
0
|
|
31
|
|
2
|
|
Regulatory, tax insurance
2
|
|
1,395
|
|
1,407
|
|
1,440
|
|
(12)
|
|
(1)
|
|
(33)
|
|
(2)
|
|
Professional services
3
|
|
924
|
|
977
|
|
1,142
|
|
(53)
|
|
(5)
|
|
(165)
|
|
(14)
|
|
Banking Services and outsourced operations
3
|
|
946
|
|
967
|
|
969
|
|
(21)
|
|
(2)
|
|
(2)
|
|
(0)
|
|
Market Data and Research services
|
|
347
|
|
376
|
|
421
|
|
(28)
|
|
(8)
|
|
(46)
|
|
(11)
|
|
Travel expenses
|
|
46
|
|
76
|
|
256
|
|
(31)
|
|
(40)
|
|
(180)
|
|
(70)
|
|
Marketing expenses
|
|
178
|
|
174
|
|
251
|
|
3
|
|
2
|
|
(77)
|
|
(31)
|
|
Other expenses
4
|
|
938
|
|
697
|
|
1,070
|
|
241
|
|
35
|
|
(373)
|
|
(35)
|
|
Total general and administrative expenses
|
|
10,821
|
|
10,259
|
|
12,253
|
|
561
|
|
5
|
|
(1,993)
|
|
(16)
|
|
|
|
|
|
|
|
|
|
|
|
|
|
|
|
|
2
Includes bank levy of € 553 million in 2021, € 633 million in 2020 and € 622 million in 2019.
3
Prior years' comparatives aligned to presentation in the current year.
4
Includes litigation related expenses of € 466 million in 2021, € 158 million in 2020 and € 473 million in 2019. See Note 27 “Provisions”, for more detail on litigation.
17
|
|
Deutsche Bank
|
Operating and Financial Review
|
|
|
Annual Report 2021
|
Deutsche Bank Group
|
|
|
|
|
Compensation and benefits
2021
Compensation and benefits decreased by € 53 million, or 1 % to € 10.4 billion in 2021 compared to € 10.5 billion in 2020. The decrease was primarily driven by lower fixed compensation expenses resulting from workforce reductions offset by an increase in variable compensation costs.
2020
Compensation and benefits decreased by € 671 million, or 6 %, to € 10.5 billion in 2020 compared to € 11.1 billion in 2019. The decrease was primarily driven by lower fixed compensation expenses resulting from workforce reductions.
General and administrative expenses
2021
General and administrative expenses increased by € 561 million, or 5 %, to € 10.8 billion in 2021 compared to € 10.3 billion in 2020. The increase was driven by € 513 million higher transformation charges, which included increased information technology costs partly related to a contract settlement and software impairments, partly triggered by the bank’s migration to the cloud technology. By the end of 2021, 97 % of total transformation-related effects anticipated through the end of 2022 were already recognized. Litigation expenses increased by € 308 million, partly related to the BGH ruling on pricing arrangements. Apart from these, general and administrative expenses decreased compared to the prior year with reductions across major cost categories including professional service fees as well as travel and market data and research expenses.
2020
General and administrative expenses decreased by € 2.0 billion, or 16 %, to € 10.3 billion in 2020 compared to € 12.3 billion in 2019. The decrease was driven by € 655 million lower transformation charges as 2019 included higher software impairments and higher litigation expenses. Apart from these, general and administrative expenses further decreased compared to the prior year following a disciplined cost management with reductions across all major cost categories including IT expenses due to lower software amortization and a reduction of IT service expenses, professional service fees as well as travel and marketing expenses.
Impairment of goodwill and other intangible assets
2021
Impairment of goodwill and other intangible assets was € 5 million in the CB in 2021. No impairment charges were reported for 2020.
2020
No impairment charges were reported for 2020. Impairment of goodwill and other intangible assets of € 1.0 billion was reported in 2019. The announcement of the strategic transformation in July 2019 triggered the impairment review of Deutsche Bank’s goodwill. A worsening macro-economic outlook, including interest rate curves, industry-specific market growth corrections, as well as the impact related to the implementation of the transformation strategy resulted in the full impairment of the Wealth Management goodwill of € 545 million in PB and the GTB CF goodwill of € 492 million in CB in the second quarter 2019.
Restructuring
2021
Expenses for restructuring activities were € 261 million in 2021 compared to € 485 million in 2020. The decrease was primarily due to lower restructuring costs in PB.
2020
Expenses for restructuring activities were € 485 million in 2020 compared to € 644 million in 2019. The decrease was primarily due to higher costs related to the execution of the bank’s transformation strategy in 2019.
Income Tax Expense
2021
Income tax expense in 2021 was € 923 million compared to € 391 million in 2020. The effective tax rate in 2021 of 26 % benefited from a positive DTA valuation adjustment of € 274 million related to our strong US performance in 2021.
2020
Income tax expense in 2020 was € 391 million compared to € 2.6 billion in 2019. The effective tax rate in 2020 was 39 %.
18
|
|
Deutsche Bank
|
Operating and Financial Review
|
|
|
Annual Report 2021
|
Deutsche Bank Group
|
|
|
|
|
Net profit (loss)
2021
Net profit in 2021 was € 2.6 billion, compared to € 612 million in the prior year. The increase in net profit was primarily driven by higher revenues across core businesses and reduced levels of provision for credit losses largely due to favorable credit environment and high-quality loan book. This was partly offset by a slight increase in non-interest expenses.
2020
Net profit in 2020 was € 612 million, compared to a net loss of € 5.3 billion in the prior year. The increase in net profit was primarily driven by strong revenue performance in Investment Bank, absence of 2019 deferred tax valuation adjustments and transformation-related goodwill impairments as well as decreases in transformation charges, litigation expenses, restructuring and severance expenses and in adjusted costs excluding transformation charges reflecting workforce reductions, disciplined expense management and positive impact of currency translation effects. These positive effects were partly offset by increased levels of provision for credit losses.
Segment Results of Operations
The following is a discussion of the results of the business segments. See Note 4 “Business Segments and Related Information” to the consolidated financial statements for information regarding:
- – changes in the format of the bank’s segment disclosure and
- – the framework of the bank’s management reporting systems.
The Group’s segment reporting follows the organizational structure as reflected in its internal management reporting systems, which are the basis for assessing the financial performance of the business segments and for allocating resources to the business segments. The criterion for segmentation into divisions is the bank’s organizational structure as it existed at December 31, 2021. Prior year segmental information is presented in the current structure.
|
|
|
2021
|
||||||||||||
|
in € m.
(unless stated otherwise)
|
|
Corporate
Bank
|
|
Investment
Bank
|
|
Private
Bank
|
|
Asset Management
|
|
Capital
Release Unit
|
|
Corporate
Other
|
|
Total
Consolidated
|
|
Net revenues
1
|
|
|
|
|
|
|
|
|
|
|
|
(
|
|
|
|
Provision for credit losses
|
|
(
|
|
|
|
|
|
|
|
(
|
|
|
|
|
|
Noninterest expenses
|
|
|
|
|
|
|
|
|
|
|
|
|
|
|
|
Compensation and benefits
|
|
|
|
|
|
|
|
|
|
|
|
|
|
|
|
General and administrative expenses
|
|
|
|
|
|
|
|
|
|
|
|
(
|
|
|
|
Impairment of goodwill and other intangible assets
|
|
|
|
|
|
|
|
|
|
|
|
|
|
|
|
Restructuring activities
|
|
|
|
|
|
|
|
|
|
(
|
|
(
|
|
|
|
Total noninterest expenses
|
|
|
|
|
|
|
|
|
|
|
|
|
|
|
|
Noncontrolling interests
|
|
|
|
(
|
|
|
|
|
|
|
|
(
|
|
|
|
Profit (loss) before tax
|
|
|
|
|
|
|
|
|
|
(
|
|
(
|
|
|
|
Cost/income ratio
|
|
|
|
|
|
|
|
|
|
N/M
|
|
N/M
|
|
|
|
Assets
2
|
|
|
|
|
|
|
|
|
|
|
|
|
|
|
|
Additions to non-current assets
|
|
|
|
|
|
|
|
|
|
|
|
|
|
|
|
Risk-weighted assets
|
|
|
|
|
|
|
|
|
|
|
|
|
|
|
|
Leverage exposure (fully loaded)
3
|
|
|
|
|
|
|
|
|
|
|
|
|
|
|
|
Average allocated shareholders' equity
|
|
|
|
|
|
|
|
|
|
|
|
|
|
|
|
Post-tax return on average shareholders’ equity
4
|
|
|
|
|
|
|
|
|
|
(
|
|
N/M
|
|
|
|
Post-tax return on average tangible shareholders’ equity
4
|
|
|
|
|
|
|
|
|
|
(
|
|
N/M
|
|
|
|
|
|
|
|
|
|
|
|
|
|
|
|
|
|
|
|
1
includes:
|
|
|
|
|
|
|
|
|
|
|
|
|
|
|
|
Net interest income
|
|
|
|
|
|
|
|
(
|
|
|
|
|
|
|
|
Net income (loss) from equity method investments
|
|
|
|
(
|
|
|
|
|
|
|
|
|
|
|
|
2
includes:
|
|
|
|
|
|
|
|
|
|
|
|
|
|
|
|
Equity method investments
|
|
|
|
|
|
|
|
|
|
|
|
|
|
|
|
|
|
|
|
|
|
|
|
|
|
|
|
|
|
|
N/M – Not meaningful
3
The Group leverage exposure is presented excluding certain Euro-based exposures facing Eurosystem central banks based on the ECB-decision (EU) 2020/1306 and after having obtained permission from the ECB. The segmental leverage exposures are presented without that deduction.
4
The post-tax return on average tangible shareholders’ equity and average shareholders’ equity at the Group level reflects the reported effective tax rate for the Group, which was 26 % for the year ended December 31, 2021. For the post-tax return on average tangible shareholders’ equity and average shareholders’ equity of the segments, the Group effective tax rate was adjusted to exclude the impact of permanent differences not attributed to the segments, so that the segment tax rates were 28 % for the year ended December 31, 2021. For further information, please refer to “Supplementary Information (Unaudited): Non-GAAP Financial Measures” of this annual report.
19
|
|
Deutsche Bank
|
Operating and Financial Review
|
|
|
Annual Report 2021
|
Deutsche Bank Group
|
|
|
|
|
|
|
|
2020
|
||||||||||||
|
in € m.
(unless stated otherwise)
|
|
Corporate
Bank
|
|
Investment
Bank
|
|
Private
Bank
|
|
Asset Management
|
|
Capital
Release Unit
|
|
Corporate
Other
|
|
Total
Consolidated
|
|
Net revenues
1
|
|
|
|
|
|
|
|
|
|
(
|
|
(
|
|
|
|
Provision for credit losses
|
|
|
|
|
|
|
|
|
|
|
|
(
|
|
|
|
Noninterest expenses
|
|
|
|
|
|
|
|
|
|
|
|
|
|
|
|
Compensation and benefits
|
|
|
|
|
|
|
|
|
|
|
|
|
|
|
|
General and administrative expenses
|
|
|
|
|
|
|
|
|
|
|
|
(
|
|
|
|
Impairment of goodwill and other intangible assets
|
|
|
|
|
|
|
|
|
|
|
|
|
|
|
|
Restructuring activities
|
|
|
|
|
|
|
|
|
|
|
|
|
|
|
|
Total noninterest expenses
|
|
|
|
|
|
|
|
|
|
|
|
|
|
|
|
Noncontrolling interests
|
|
|
|
|
|
|
|
|
|
(
|
|
(
|
|
|
|
Profit (loss) before tax
|
|
|
|
|
|
(
|
|
|
|
(
|
|
(
|
|
|
|
Cost/income ratio
|
|
|
|
|
|
|
|
|
|
N/M
|
|
N/M
|
|
|
|
Assets
2
|
|
|
|
|
|
|
|
|
|
|
|
|
|
|
|
Additions to non-current assets
|
|
|
|
|
|
|
|
|
|
|
|
|
|
|
|
Risk-weighted assets
|
|
|
|
|
|
|
|
|
|
|
|
|
|
|
|
Leverage exposure (fully loaded)
3
|
|
|
|
|
|
|
|
|
|
|
|
|
|
|
|
Average allocated shareholders' equity
|
|
|
|
|
|
|
|
|
|
|
|
(
|
|
|
|
Post-tax return on average shareholders’ equity
4
|
|
|
|
|
|
(
|
|
|
|
(
|
|
N/M
|
|
|
|
Post-tax return on average tangible shareholders’ equity
4
|
|
|
|
|
|
(
|
|
|
|
(
|
|
N/M
|
|
|
|
|
|
|
|
|
|
|
|
|
|
|
|
|
|
|
|
1
includes:
|
|
|
|
|
|
|
|
|
|
|
|
|
|
|
|
Net interest income
|
|
|
|
|
|
|
|
|
|
|
|
|
|
|
|
Net income (loss) from equity method investments
|
|
|
|
|
|
|
|
|
|
|
|
|
|
|
|
2
includes:
|
|
|
|
|
|
|
|
|
|
|
|
|
|
|
|
Equity method investments
|
|
|
|
|
|
|
|
|
|
|
|
|
|
|
|
|
|
|
|
|
|
|
|
|
|
|
|
|
|
|
N/M – Not meaningful
Prior year segmental information presented in the current structure
3
The Group leverage exposure is presented excluding certain Euro-based exposures facing Eurosystem central banks based on the ECB-decision (EU) 2020/1306 and after having obtained permission from the ECB. The segmental leverage exposures are presented without that deduction.
4
The post-tax return on average tangible shareholders’ equity and average shareholders’ equity at the Group level reflects the reported effective tax rate for the Group, which was 39 % for the year ended December 31, 2020. For the post-tax return on average tangible shareholders’ equity and average shareholders’ equity of the segments, the Group effective tax rate was adjusted to exclude the impact of permanent differences not attributed to the segments, so that the segment tax rates were 28 % for the year ended December 31, 2020. For further information, please refer to “Supplementary Information (Unaudited): Non-GAAP Financial Measures” of this annual report.
20
|
|
Deutsche Bank
|
Operating and Financial Review
|
|
|
Annual Report 2021
|
Deutsche Bank Group
|
|
|
|
|
|
|
|
2019
|
||||||||||||
|
in € m.
(unless stated otherwise)
|
|
Corporate
Bank
|
|
Investment
Bank
|
|
Private
Bank
|
|
Asset Management
|
|
Capital
Release Unit
|
|
Corporate
Other
|
|
Total
Consolidated
|
|
Net revenues
1
|
|
|
|
|
|
|
|
|
|
|
|
|
|
|
|
Provision for credit losses
|
|
|
|
|
|
|
|
|
|
(
|
|
(
|
|
|
|
Noninterest expenses
|
|
|
|
|
|
|
|
|
|
|
|
|
|
|
|
Compensation and benefits
|
|
|
|
|
|
|
|
|
|
|
|
|
|
|
|
General and administrative expenses
|
|
|
|
|
|
|
|
|
|
|
|
(
|
|
|
|
Impairment of goodwill and other intangible assets
|
|
|
|
|
|
|
|
|
|
|
|
|
|
|
|
Restructuring activities
|
|
|
|
|
|
|
|
|
|
|
|
|
|
|
|
Total noninterest expenses
|
|
|
|
|
|
|
|
|
|
|
|
|
|
|
|
Noncontrolling interests
|
|
|
|
|
|
(
|
|
|
|
|
|
(
|
|
|
|
Profit (loss) before tax
|
|
|
|
|
|
(
|
|
|
|
(
|
|
(
|
|
(
|
|
Cost/income ratio
|
|
|
|
|
|
|
|
|
|
N/M
|
|
N/M
|
|
|
|
Assets
2
|
|
|
|
|
|
|
|
|
|
|
|
|
|
|
|
Additions to non-current assets
|
|
|
|
|
|
|
|
|
|
|
|
|
|
|
|
Risk-weighted assets
|
|
|
|
|
|
|
|
|
|
|
|
|
|
|
|
Leverage exposure (fully loaded)
|
|
|
|
|
|
|
|
|
|
|
|
|
|
|
|
Average allocated shareholders' equity
|
|
|
|
|
|
|
|
|
|
|
|
|
|
|
|
Post-tax return on average shareholders’ equity
3
|
|
(
|
|
|
|
(
|
|
|
|
(
|
|
N/M
|
|
(
|
|
Post-tax return on average tangible shareholders’ equity
3
|
|
(
|
|
|
|
(
|
|
|
|
(
|
|
N/M
|
|
(
|
|
|
|
|
|
|
|
|
|
|
|
|
|
|
|
|
|
1
includes:
|
|
|
|
|
|
|
|
|
|
|
|
|
|
|
|
Net interest income
|
|
|
|
|
|
|
|
(
|
|
|
|
|
|
|
|
Net income (loss) from equity method investments
|
|
|
|
|
|
|
|
|
|
|
|
|
|
|
|
2
includes:
|
|
|
|
|
|
|
|
|
|
|
|
|
|
|
|
Equity method investments
|
|
|
|
|
|
|
|
|
|
|
|
|
|
|
|
|
|
|
|
|
|
|
|
|
|
|
|
|
|
|
N/M – Not meaningful
Prior year segmental information presented in the current structure
3
The post-tax return on average tangible shareholders’ equity and average shareholders’ equity at the Group level reflects the reported effective tax rate for the Group, which was
(
100
) %
for the year ended December 31, 2019. For the post-tax return on average tangible shareholders’ equity and average shareholders’ equity of the segments, the Group effective tax rate was adjusted to exclude the impact of permanent differences not attributed to the segments, so that the segment tax rates were
28
%
for the year ended December 31, 2019. For further information, please refer to “Supplementary Information (Unaudited): Non-GAAP Financial Measures” of this annual report.
Corporate Bank
|
|
|
|
|
|
|
|
|
2021 increase (decrease)
from 2020
|
|
2020 increase (decrease)
from 2019
|
||||
|
in € m.
(unless stated otherwise)
|
|
2021
|
|
2020
|
|
2019
|
|
in € m.
|
|
in %
|
|
in € m.
|
|
in %
|
|
Net revenues
|
|
|
|
|
|
|
|
|
|
|
|
|
|
|
|
Corporate Treasury Services
|
|
|
|
|
|
|
|
5
|
|
0
|
|
48
|
|
2
|
|
Institutional Client Services
|
|
|
|
|
|
|
|
20
|
|
2
|
|
(131)
|
|
(9)
|
|
Business Banking
|
|
|
|
|
|
|
|
(21)
|
|
(3)
|
|
(18)
|
|
(2)
|
|
Total net revenues
|
|
|
|
|
|
|
|
4
|
|
0
|
|
(101)
|
|
(2)
|
|
Of which:
|
|
|
|
|
|
|
|
|
|
|
|
|
|
|
|
Net interest income
|
|
|
|
|
|
|
|
(278)
|
|
(10)
|
|
248
|
|
9
|
|
Commissions and fee income
|
|
|
|
|
|
|
|
125
|
|
6
|
|
(114)
|
|
(5)
|
|
Remaining income
|
|
|
|
|
|
|
|
158
|
|
85
|
|
(235)
|
|
(56)
|
|
Provision for credit losses
|
|
(
|
|
|
|
|
|
(367)
|
|
N/M
|
|
80
|
|
28
|
|
Noninterest expenses
|
|
|
|
|
|
|
|
|
|
|
|
|
|
|
|
Compensation and benefits
|
|
|
|
|
|
|
|
46
|
|
3
|
|
(17)
|
|
(1)
|
|
General and administrative expenses
|
|
|
|
|
|
|
|
(154)
|
|
(5)
|
|
(16)
|
|
(1)
|
|
Impairment of goodwill and other intangible assets
|
|
|
|
|
|
|
|
5
|
|
N/M
|
|
(492)
|
|
N/M
|
|
Restructuring activities
|
|
|
|
|
|
|
|
13
|
|
47
|
|
(108)
|
|
(79)
|
|
Total noninterest expenses
|
|
|
|
|
|
|
|
(90)
|
|
(2)
|
|
(634)
|
|
(13)
|
|
Noncontrolling interests
|
|
|
|
|
|
|
|
0
|
|
N/M
|
|
0
|
|
N/M
|
|
Profit (loss) before tax
|
|
|
|
|
|
|
|
461
|
|
86
|
|
453
|
|
N/M
|
|
Total assets (in € bn)
1
|
|
|
|
|
|
|
|
8
|
|
3
|
|
9
|
|
4
|
|
Loans (gross of allowance for loan losses, in € bn)
|
|
|
|
|
|
|
|
8
|
|
7
|
|
(5)
|
|
(4)
|
|
Employees (full-time equivalent)
|
|
|
|
|
|
|
|
(55)
|
|
(0)
|
|
(151)
|
|
(1)
|
|
|
|
|
|
|
|
|
|
|
|
|
|
|
|
|
N/M – Not meaningful
Prior year segmental information presented in the current structure.
1
Segment assets represent consolidated view, i.e., the amounts do not include intersegment balances.
21
|
|
Deutsche Bank
|
Operating and Financial Review
|
|
|
Annual Report 2021
|
Deutsche Bank Group
|
|
|
|
|
2021
Profit before tax of the Corporate Bank was € 1.0 billion for the full year 2021, up from € 539 million in 2020, driven by a decrease in credit loss provisions as well as lower noninterest expenses. Adjusted for transformation charges, restructuring and severance expenses, impairments of goodwill and other intangible assets and specific revenue items, profit before tax was € 1.2 billion, 70 % above the prior year. This increase was primarily driven by lower credit loss provisions, lower litigation charges as well as lower adjusted costs, partly offset by higher severance and restructuring.
Full year net revenues were € 5.2 billion, flat versus 2020, as business volume growth and deposit repricing offset interest rate headwinds.
Corporate Treasury Services revenues of € 3.1 billion were essentially unchanged compared to prior year, as the benefits of the deposit repricing, ECB’s TLTRO III program and other business initiatives offset interest rate headwinds. Institutional Client Services net revenues of € 1.3 billion were € 20 million or 2 % higher than prior year driven by underlying business performance. Business Banking net revenues of € 0.7 billion decreased by 3 %, as interest rate headwinds more than offset business growth and progress on repricing agreements.
Provision for credit losses was a net release of € 3 million, compared to provisions of € 364 million in 2020, reflecting low levels of impairments and releases of Stage 1 and 2 provisions compared to the prior year.
Noninterest expenses were € 4.2 billion, down 2 % year on year, partly reflecting a non-recurrence of litigation expenses in the prior year. Adjusted costs ex-transformation charges were € 4.0 billion, down 1 %, driven by headcount reduction and other initiatives. Severance and restructuring expenses rose 42 % year on year, reflecting headcount reductions in support of the bank’s transformation programme.
2020
Profit before tax of the Corporate Bank was € 539 million for the full year 2020, compared to € 86 million in the prior year. The year-on-year increase was largely driven by an impairment of goodwill of € 492 million in 2019 as well as lower restructuring costs in 2020. Adjusted for transformation charges, restructuring and severance expenses, impairments of goodwill and other intangible assets and specific revenue items, profit before tax was € 692 million in 2020.
Net revenues for the full year 2020 were € 5.1 billion, or € 5.2 billion excluding a loss on sale of Postbank systems, 2 % lower compared to 2019.
Corporate Treasury Services revenues of € 3.1 billion increased by € 48 million or 2 % compared to the prior year as the negative impact from a lower interest rate environment was largely compensated by deposit repricing, balance sheet management initiatives and ECB tiering as well as portfolio rebalancing actions. Institutional Client Services reported net revenues € 1.3 billion in 2020, a decrease of € 131 million, or 9 %, compared to € 1.4 billion in the prior year. The decline was impacted by significantly lower revenues in Securities Services and Trust and Agency Services, mainly due to interest rate reductions in the U.S. and in Asia. Revenues in Business Banking were € 0.7 billion and decreased by € 18 million or 2 % driven by the lower interest rate environment, partially offset by positive effects from deposit repricing agreements.
Provision for credit losses was € 364 million, an increase from € 284 million in 2019, affected by the COVID-19 pandemic.
Noninterest expenses in 2020 were € 4.2 billion, a decrease of € 634 million or 13 % compared to € 4.9 billion in the prior year which was impacted by the execution of the transformation strategy, which triggered an impairment of goodwill, higher restructuring costs and transformation charges mainly related to IT impairments. Furthermore, costs in 2019 were negatively impacted by changes in internal cost allocations following the resegmentation in 2019.
Adjusted costs excluding transformation charges were € 4.0 billion, down 2 % year on year. The decrease reflects a workforce reduction and business initiatives.
22
|
|
Deutsche Bank
|
Operating and Financial Review
|
|
|
Annual Report 2021
|
Deutsche Bank Group
|
|
|
|
|
Investment Bank
|
|
|
|
|
|
|
|
|
2021 increase (decrease)
from 2020
|
|
2020 increase (decrease)
from 2019
|
||||
|
in € m.
(unless stated otherwise)
|
|
2021
|
|
2020
|
|
2019
|
|
in € m.
|
|
in %
|
|
in € m.
|
|
in %
|
|
Net revenues
|
|
|
|
|
|
|
|
|
|
|
|
|
|
|
|
Fixed Income, Currency (FIC) Sales Trading
|
|
|
|
|
|
|
|
(11)
|
|
(0)
|
|
1,550
|
|
28
|
|
Debt Origination
|
|
|
|
|
|
|
|
73
|
|
5
|
|
383
|
|
34
|
|
Equity Origination
|
|
|
|
|
|
|
|
174
|
|
47
|
|
221
|
|
149
|
|
Advisory
|
|
|
|
|
|
|
|
247
|
|
101
|
|
(126)
|
|
(34)
|
|
Origination Advisory
|
|
|
|
|
|
|
|
494
|
|
23
|
|
479
|
|
29
|
|
Other
|
|
(
|
|
|
|
(
|
|
(139)
|
|
N/M
|
|
235
|
|
N/M
|
|
Total net revenues
|
|
|
|
|
|
|
|
345
|
|
4
|
|
2,263
|
|
32
|
|
Provision for credit losses
|
|
|
|
|
|
|
|
(587)
|
|
(85)
|
|
581
|
|
N/M
|
|
Noninterest expenses
|
|
|
|
|
|
|
|
|
|
|
|
|
|
|
|
Compensation and benefits
|
|
|
|
|
|
|
|
118
|
|
6
|
|
(75)
|
|
(3)
|
|
General and administrative expenses
|
|
|
|
|
|
|
|
260
|
|
8
|
|
(750)
|
|
(18)
|
|
Impairment of goodwill and other intangible assets
|
|
|
|
|
|
|
|
0
|
|
N/M
|
|
0
|
|
N/M
|
|
Restructuring activities
|
|
|
|
|
|
|
|
33
|
|
N/M
|
|
(155)
|
|
(92)
|
|
Total noninterest expenses
|
|
|
|
|
|
|
|
411
|
|
8
|
|
(979)
|
|
(15)
|
|
Noncontrolling interests
|
|
(
|
|
|
|
|
|
(29)
|
|
N/M
|
|
(8)
|
|
(41)
|
|
Profit (loss) before tax
|
|
|
|
|
|
|
|
549
|
|
17
|
|
2,670
|
|
N/M
|
|
Total assets (in € bn)
1
|
|
|
|
|
|
|
|
42
|
|
7
|
|
72
|
|
14
|
|
Loans (gross of allowance for loan losses, in € bn)
|
|
|
|
|
|
|
|
24
|
|
34
|
|
(6)
|
|
(8)
|
|
Employees (full-time equivalent)
|
|
|
|
|
|
|
|
(382)
|
|
(5)
|
|
90
|
|
1
|
|
|
|
|
|
|
|
|
|
|
|
|
|
|
|
|
N/M – Not meaningful
Prior year segmental information presented in the current structure.
1
Segment assets represent consolidated view, i.e., the amounts do not include intersegment balances.
2021
Profit before tax was € 3.7 billion in 2021, an increase of € 549 million compared to the prior year. The increase was mainly driven by slightly higher revenues, as well as significantly lower provision for credit losses, partly offset by higher non-interest expenses.
Net revenues were € 9.6 billion in 2021, an increase of € 345 million or 4 % compared to 2020.
Revenues in FIC Sales Trading were € 7.1 billion, essentially flat versus the prior year. Financing revenues were significantly higher, driven by increased net interest income as a result of increased lending activity, with solid performance across all businesses. Revenues in Credit Trading were significantly higher due to strength in the distressed business. Rates and Foreign Exchange revenues were significantly lower, reflecting more challenging market conditions compared to a favorable trading environment in 2020. Revenues in Emerging Markets were lower due to a decline in Asia, which did not benefit from the heightened levels of activity seen in 2020. This was partially offset by growth in the Central and Eastern Europe, Middle East and Africa region, with Latin America broadly flat.
Origination and Advisory net revenues were € 2.6 billion, a € 494 million or 23 % increase compared to the prior year. Debt Origination revenues were € 1.6 billion, higher than the prior year driven principally by strong performance in Leveraged Debt Capital Markets, which more than offset normalized Investment Grade debt issuances versus the prior year. Equity Origination revenues of € 544 million were significantly higher, reflecting record Special Purpose Acquisition Company (SPAC) activity in the first quarter and subsequent SPAC merger (de-SPAC) revenues through the year. Advisory revenues of € 491 million were significantly higher reflecting the growth in MA activity and record volumes during the year.
Other revenues were negative € 40 million, compared to positive € 99 million in 2020. The year–on-year decrease was materially driven by a reversal of previously recorded Collateralized Loan Obligation (CLO) hedge gains, resulting from the release of underlying provisions for credit losses, with an overall net neutral impact to profit before tax.
Provision for credit losses was € 104 million or 14 basis points of average loans, a decrease of € 587 million primarily driven by the non-recurrence of COVID-19 related impairments in the prior year.
Noninterest expenses in 2021 were € 5.8 billion, an increase of € 411 million or 8 % compared to the prior year, reflecting higher compensation costs, increased bank levy and infrastructure service cost allocations.
23
|
|
Deutsche Bank
|
Operating and Financial Review
|
|
|
Annual Report 2021
|
Deutsche Bank Group
|
|
|
|
|
2020
Profit before tax was € 3.2 billion in 2020, an increase of € 2.7 billion compared to the prior year. The increase was mainly driven by significantly higher revenues, as well as lower general and administrative expenses and restructuring, partly offset by significantly higher provisions for credit losses.
Net revenues were € 9.3 billion in 2020, an increase of € 2.3 billion or 32 % compared to 2019.
Revenues in FIC Sales Trading were € 7.1 billion, an increase of € 1.6 billion or 28 %. Rates revenues were significantly higher, with the business benefitting from the impact of strategic repositioning, in addition to strong client flows and market conditions. Foreign Exchange revenues were significantly higher, driven by the increased market volatility, specifically in the first half of the year and strength in derivatives. Revenues from Credit Trading were lower driven by the adverse credit market conditions in the first quarter, though the business recovered well in the second half of the year. Revenues in Emerging Markets were significantly higher, with all three regions up versus the prior year. Revenues in Financing were lower, with the business also affected by the adverse credit market in the first quarter, in addition to lower revenues from sectors impacted by the COVID-19 pandemic.
Origination and Advisory net revenues were € 2.1 billion, a € 479 million or 29 % increase compared to the prior year. Debt Origination revenues were € 1.5 billion, significantly higher than the prior year driven principally by increased activity and market share gains in Investment Grade Debt. Equity Origination revenues of € 369 million were also significantly higher, reflecting a record industry fee pool and DB’s strength in the Special Purpose Acquisition Company market. Advisory revenues of € 244 million were significantly lower in a reduced fee pool environment which was impacted by the COVID-19 pandemic.
Other revenues were € 99 million, compared to negative € 136 million in 2019. The year–on-year increase was materially driven by two items: A small gain of € 6 million relating to the impact of DVA on certain derivative liabilities versus a loss of € 140 million in 2019. Additionally, 2020 saw material Collateralized Loan Obligation (CLO) hedge gains on underlying provisions for credit losses driven by the COIVD-19 pandemic, with an overall net neutral impact on profit before tax.
Provision for credit losses was € 690 million or 90 basis points of average loans, an increase of € 581 million or 75 basis points primarily driven by COVID-19 related impairments.
Noninterest expenses in 2020 were € 5.4 billion, a decrease of € 979 million or 15 % compared to the prior year, reflecting lower adjusted costs, reduced restructuring and severance and lower litigation. Adjusted costs excluding transformation charges decreased by 9 % driven by disciplined expense management and lower service cost allocations.
24
|
|
Deutsche Bank
|
Operating and Financial Review
|
|
|
Annual Report 2021
|
Deutsche Bank Group
|
|
|
|
|
Private Bank
|
|
|
|
|
|
|
|
|
2021 increase (decrease)
from 2020
|
|
2020 increase (decrease)
from 2019
|
||||
|
in € m.
(unless stated otherwise)
|
|
2021
|
|
2020
|
|
2019
|
|
in € m.
|
|
in %
|
|
in € m.
|
|
in %
|
|
Net revenues:
|
|
|
|
|
|
|
|
|
|
|
|
|
|
|
|
Private Bank Germany
|
|
|
|
|
|
|
|
19
|
|
0
|
|
(120)
|
|
(2)
|
|
International Private Bank
|
|
|
|
|
|
|
|
90
|
|
3
|
|
7
|
|
0
|
|
IPB Personal Banking
1
|
|
|
|
|
|
|
|
38
|
|
4
|
|
(34)
|
|
(4)
|
|
IPB Private Banking
2
and Wealth Management
|
|
|
|
|
|
|
|
52
|
|
2
|
|
41
|
|
2
|
|
Total net revenues
|
|
|
|
|
|
|
|
109
|
|
1
|
|
(113)
|
|
(1)
|
|
Of which:
|
|
|
|
|
|
|
|
|
|
|
|
|
|
|
|
Net interest income
|
|
|
|
|
|
|
|
102
|
|
2
|
|
(339)
|
|
(7)
|
|
Commissions and fee income
|
|
|
|
|
|
|
|
155
|
|
5
|
|
187
|
|
7
|
|
Remaining income
|
|
|
|
|
|
|
|
(148)
|
|
(26)
|
|
40
|
|
7
|
|
Provision for credit losses
|
|
|
|
|
|
|
|
(265)
|
|
(37)
|
|
367
|
|
107
|
|
Noninterest expenses:
|
|
|
|
|
|
|
|
|
|
|
|
|
|
|
|
Compensation and benefits
|
|
|
|
|
|
|
|
(53)
|
|
(2)
|
|
(108)
|
|
(4)
|
|
General and administrative expenses
|
|
|
|
|
|
|
|
202
|
|
5
|
|
(280)
|
|
(6)
|
|
Impairment of goodwill and other intangible assets
|
|
|
|
|
|
|
|
0
|
|
N/M
|
|
(545)
|
|
N/M
|
|
Restructuring activities
|
|
|
|
|
|
|
|
(240)
|
|
(58)
|
|
287
|
|
N/M
|
|
Total noninterest expenses
|
|
|
|
|
|
|
|
(91)
|
|
(1)
|
|
(645)
|
|
(8)
|
|
Noncontrolling interests
|
|
|
|
|
|
(
|
|
(0)
|
|
(87)
|
|
1
|
|
N/M
|
|
Profit (loss) before tax
|
|
|
|
(
|
|
(
|
|
465
|
|
N/M
|
|
164
|
|
(62)
|
|
Total assets (in € bn)
3
|
|
|
|
|
|
|
|
14
|
|
5
|
|
26
|
|
10
|
|
Loans (gross of allowance for loan losses, in € bn)
|
|
|
|
|
|
|
|
17
|
|
7
|
|
10
|
|
5
|
|
Assets under Management (in € bn)
4
|
|
|
|
|
|
|
|
59
|
|
12
|
|
11
|
|
2
|
|
Net flows (in € bn)
|
|
|
|
|
|
|
|
14
|
|
88
|
|
12
|
|
N/M
|
|
Employees (full-time equivalent)
|
|
|
|
|
|
|
|
(1,665)
|
|
(6)
|
|
(1,657)
|
|
(5)
|
|
|
|
|
|
|
|
|
|
|
|
|
|
|
|
|
N/M – Not meaningful
Prior year segmental information presented in the current structure.
1
Including small businesses in Italy, Spain and India.
2
Including small mid caps in Italy, Spain and India.
3
Segment assets represent consolidated view, i.e., the amounts do not include intersegment balances.
4
We define assets under management as (a) assets we hold on behalf of customers for investment purposes and/or (b) client assets that are managed by us. We manage assets under management on a discretionary or advisory basis, or these assets are deposited with us. Deposits are considered assets under management if they serve investment purposes. In the Private Bank Germany, IPB Personal Banking and IPB Private Banking, this includes term deposits and savings deposits. In IPB Wealth Management, it is assumed that all customer deposits are held with us primarily for investment purposes.
2021
In 2021, the Private Bank made significant progress in the execution of its transformation strategy and in its priority to grow business volumes. Net new business volumes were € 45 billion across assets under management and loans. Profit before tax of € 366 million in 2021 was impacted by transformation-related effects of € 458 million including € 237 million restructuring and severance expenses as well as € 221 million transformation charges. This compares to a loss before tax of € 99 million in 2020, which included a € 88 million negative impact from the sale of Postbank Systems AG and transformation-related effects of € 642 million. Adjusted for transformation-related effects and for specific revenue items, profit before tax was € 721 million in 2021 despite negative impacts of € 284 million from the BGH ruling. This compares to an adjusted profit before tax of € 518 million in 2020. The year over year improvement mainly reflected lower provision for credit losses and revenue growth.
Net revenues of € 8.2 billion in 2021 increased by € 109 million, or 1 %, compared to 2020. Revenues were up 2 % year-on-year if adjusted for the aforementioned loss of € 88 million in the prior year from the sale of Postbank Systems AG and a negative revenue impact of € 154 million in 2021 related to the BGH ruling. Business growth in investment products and loans in a normalizing market environment more than offset significant interest rate headwinds. Revenues also benefited from the ECB’s TLTRO III program.
In the Private Bank Germany, net revenues were € 5.0 billion and remained stable year-on-year. Excluding the impact of the BGH ruling and the aforementioned negative impact from the sale of Postbank Systems AG in prior year, revenues were up 2 %. Continued strong business growth in investment and mortgage products mitigated significant deposit margin compression impacts. Revenue growth also benefited from the ECB’s TLTRO III program.
Net revenues in the International Private Bank (IPB) of € 3.2 billion increased by 3 % year-on-year reflecting business growth in a normalizing environment. Revenues also benefited from the ECB’s TLTRO III program. IPB’s client segment Private Banking and Wealth Management achieved net revenues of € 2.3 billion in 2021, up 2 % year-on-year, or 3 % excluding specific revenue items, as the contribution from Sal. Oppenheim was slightly higher in 2020. Headwinds from lower interest rates and negative impacts from foreign currency translation were more than offset by sustained business growth in investment products and lending supported by continued hiring of relationship managers. Net revenues in the Personal Banking client segment increased by € 38 million, or 4 %, to € 908 million in 2021. Sustained business growth in investment products and lower funding costs more than offset continued headwinds from lower interest rates.
25
|
|
Deutsche Bank
|
Operating and Financial Review
|
|
|
Annual Report 2021
|
Deutsche Bank Group
|
|
|
|
|
Provision for credit losses amounted to € 446 million in 2021 compared to € 711 million in 2020. The year-on-year decrease of 37 % reflected a more benign macroeconomic environment, tight risk discipline and a high-quality loan book.
Non-interest expenses were € 7.4 billion, down € 91 million, or 1 % year-on-year, reflecting lower transformation-related effects partly offset by higher litigation charges, which included a € 128 million negative impact related to the BGH ruling.
Adjusted costs excluding transformation charges of € 6.8 billion increased by € 42 million, or 1 % year-on-year. Incremental savings from transformation initiatives were offset by higher spend for technology and internal services, higher costs for deposit protection schemes and higher variable compensation driven by improved business performance. The increase also reflected the non-recurrence of a one-time benefit in the prior year associated with pension obligations.
Assets under Management of € 553 billion increased by € 59 billion compared to December 31, 2020. The increase was mainly attributable to € 30 billion net inflows as well as € 23 billion market appreciation and € 8 billion positive impact from foreign exchange rate movements. Net inflows of € 30 billion during 2021 were mainly in investment products.
2020
In 2020, the Private Bank continued the implementation of its strategic agenda. Results were impacted by transformation-related effects of € 642 million including € 520 million restructuring and severance expenses as well as € 122 million transformation charges, which were the main reasons for a reported pre-tax loss of € 99 million in 2020. Adjusted for these transformation-related effects and for specific revenue items, profit before tax was € 518 million in 2020 compared to adjusted profit before tax of € 522 million in 2019. Higher provision for credit losses and higher litigation charges were offset by cost reductions.
Net revenues of € 8.1 billion in 2020 declined by € 113 million, or 1 %, compared to 2019, mainly reflecting lower positive contributions from specific revenue items which included in 2020 a negative impact of € 88 million related to the sale of Postbank Systems AG. Excluding specific revenue items, revenues remained at prior year level as growth in volumes and higher commission and fee income compensated headwinds from the low interest rate environment and the COVID-19 pandemic.
In the Private Bank Germany, net revenues of € 5.0 billion declined by € 120 million, or 2 %, year-on-year. Revenues excluding the impact related to Postbank Systems AG were largely stable compared to 2019. Ongoing headwinds from lower interest rates and COVID-19 were offset by growth in loan revenues and higher commission and fee income from investment products, insurance products and from repricing measures.
Net revenues in the International Private Bank (IPB) of € 3.1 billion remained essentially flat compared to 2019. IPB’s client segment Private Banking and Wealth Management achieved net revenues of € 2.3 billion in 2020, an increase of € 41 million, or 2 %, compared to 2019. Headwinds from lower interest rates and COVID-19 and negative impacts from foreign currency translation were more than offset by business growth in investment products and lending reflecting benefits from previous hiring. Net revenues in the Personal Banking client segment declined by € 34 million, or 4 %, to € 870 million in 2020. The decline was mainly due to negative impacts from deposit margin compression and COVID-19.
Provision for credit losses amounted to € 711 million in 2020 compared to € 344 million in 2019. The increase was mainly due to negative impacts from the COVID-19 pandemic as well as higher benefits in 2019 from portfolio sales and model refinements. The increase was also related to the growth in the loan business.
Non-interest expenses of € 7.5 billion declined by € 645 million, or 8 %, compared to 2019. The positive year-on-year impact from the non-recurrence of a goodwill impairment of € 545 million in 2019 was largely offset by € 297 million higher transformation-related effects driven by higher restructuring and severance expenses reflecting initiatives related to the execution of the strategic agenda as well as € 104 million higher litigation charges.
Adjusted costs excluding transformation charges of € 6.8 billion reduced by € 501 million, or 7 %, compared to 2019. The decline was mainly attributable to cost reduction initiatives and synergies from efficiency measures including workforce reductions. PB’s internal workforce declined to below 30,000 at year end 2020.
Assets under Management of € 493 billion increased by € 11 billion compared to December 31, 2019. The increase was mainly attributable to € 16 billion net inflows and € 6 billion market appreciation, in part offset by a € 9 billion negative impact from foreign exchange rate movements. Net inflows of € 16 billion during 2020 were almost entirely in investment products.
26
|
|
Deutsche Bank
|
Operating and Financial Review
|
|
|
Annual Report 2021
|
Deutsche Bank Group
|
|
|
|
|
Asset Management
|
|
|
|
|
|
|
|
|
2021 increase (decrease)
from 2020
|
|
2020 increase (decrease)
from 2019
|
||||
|
in € m.
(unless stated otherwise)
|
|
2021
|
|
2020
|
|
2019
|
|
in € m.
|
|
in %
|
|
in € m.
|
|
in %
|
|
Net revenues
|
|
|
|
|
|
|
|
|
|
|
|
|
|
|
|
Management Fees
|
|
|
|
|
|
|
|
233
|
|
11
|
|
(5)
|
|
(0)
|
|
Performance and transaction fees
|
|
|
|
|
|
|
|
122
|
|
135
|
|
(111)
|
|
(55)
|
|
Other
|
|
|
|
|
|
(
|
|
123
|
|
N/M
|
|
13
|
|
N/M
|
|
Total net revenues
|
|
|
|
|
|
|
|
478
|
|
21
|
|
(103)
|
|
(4)
|
|
Provision for credit losses
|
|
|
|
|
|
|
|
3
|
|
148
|
|
1
|
|
59
|
|
Noninterest expenses
|
|
|
|
|
|
|
|
|
|
|
|
|
|
|
|
Compensation and benefits
|
|
|
|
|
|
|
|
82
|
|
11
|
|
(92)
|
|
(11)
|
|
General and administrative expenses
|
|
|
|
|
|
|
|
77
|
|
10
|
|
(88)
|
|
(10)
|
|
Impairment of goodwill and other intangible assets
|
|
|
|
|
|
|
|
(0)
|
|
N/M
|
|
0
|
|
N/M
|
|
Restructuring activities
|
|
|
|
|
|
|
|
(20)
|
|
(92)
|
|
(6)
|
|
(22)
|
|
Total noninterest expenses
|
|
|
|
|
|
|
|
138
|
|
9
|
|
(185)
|
|
(11)
|
|
Noncontrolling interests
|
|
|
|
|
|
|
|
66
|
|
42
|
|
5
|
|
4
|
|
Profit (loss) before tax
|
|
|
|
|
|
|
|
272
|
|
50
|
|
76
|
|
16
|
|
Total assets (in € bn)
1
|
|
|
|
|
|
|
|
1
|
|
10
|
|
(0)
|
|
(5)
|
|
Assets under Management (in € bn)
|
|
|
|
|
|
|
|
135
|
|
17
|
|
25
|
|
3
|
|
Net flows (in € bn)
|
|
|
|
|
|
|
|
17
|
|
N/M
|
|
5
|
|
N/M
|
|
Employees (full-time equivalent)
|
|
|
|
|
|
|
|
146
|
|
4
|
|
1
|
|
0
|
|
|
|
|
|
|
|
|
|
|
|
|
|
|
|
|
N/M – Not meaningful
Prior year segmental information presented in the current structure.
1
Segment assets represent consolidated view, i.e., the amounts do not include intersegment balances.
2021
In 2021, despite the continuation of the global COVID-19 pandemic, all major equity indices traded at significantly higher levels, with the U.S. dollar appreciating against the Euro. Overall growth in Assets under Management was driven by higher net flows as well as favorable market conditions, resulting in higher revenues compared to 2020.
In 2021, AM reported a significantly higher profit before tax of € 816 million, an increase of € 272 million, or 50 %, compared to € 544 million in the prior year, primarily driven by significantly higher revenues. Adjusted for transformation charges as well as restructuring and severance expenses, profit before tax was € 840 million in 2021 compared to € 586 million in 2020.
Net revenues were € 2.7 billion, an increase of € 478 million, or 21 %, compared to the prior year.
Management fees were € 2.4 billion in 2021, higher by € 233 million, or 11 %, compared to the prior year mainly from higher average assets under management throughout the year.
Performance and transaction fees of € 212 million in 2021 were significantly higher by € 122 million, or 135 %, compared to the full year 2020, driven by an exceptional Multi Asset performance fee as well as increased real estate performance and transaction fees.
Other revenues were € 126 million, an increase of € 123 million compared to 2020, primarily driven by the favorable change in fair value of guaranteed products, an increase in investment income for illiquid products and higher contribution from the investment in Harvest Fund Management Co. Limited.
Noninterest expenses were € 1.7 billion, an increase of € 138 million, or 9 %, compared to the prior year, driven by higher compensation and benefits, increased professional services and IT costs driven by the core platform transformation combined with higher service costs as a result of increasing assets under management.
Adjusted costs excluding transformation charges were € 1.6 billion in 2021, an increase of € 154 million, or 10 %, compared to € 1.5 billion in 2020.
Assets under Management were € 928 billion, an increase of € 135 billion, or 17 %, versus December 31, 2020. The increase was driven by a positive market performance of € 60 billion, favorable net flows development of € 48 billion and a positive foreign exchange impact of € 26 billion. The net inflows were primarily driven by strong inflows into targeted growth areas of Passive and Alternatives, as well as Active Cash, Active Fixed Income, Active Multi Asset and Active Systematic Quantitative Investments (SQI). Environmental, Social and Governance (ESG) dedicated funds continued to attract strong net inflows, representing 40 % of total net inflows.
27
|
|
Deutsche Bank
|
Operating and Financial Review
|
|
|
Annual Report 2021
|
Deutsche Bank Group
|
|
|
|
|
The following table provides the development of Assets under Management during 2021, broken down by product type as well as the respective management fee margins:
|
in € bn.
|
|
Active
Equity
|
|
Active
Fixed
Income
|
|
Active
Multi
Asset
|
|
Active
SQI
|
|
Active
Cash
|
|
Passive
|
|
Alternatives
|
|
Assets under
Management
|
|
Balance as of December 31, 2020
|
|
97
|
|
220
|
|
59
|
|
69
|
|
75
|
|
179
|
|
93
|
|
793
|
|
Inflows
|
|
16
|
|
47
|
|
13
|
|
14
|
|
510
|
|
95
|
|
14
|
|
708
|
|
Outflows
|
|
(16)
|
|
(43)
|
|
(9)
|
|
(11)
|
|
(504)
|
|
(69)
|
|
(9)
|
|
(660)
|
|
Net Flows
|
|
(1)
|
|
5
|
|
4
|
|
2
|
|
6
|
|
26
|
|
6
|
|
48
|
|
FX impact
|
|
2
|
|
8
|
|
0
|
|
0
|
|
4
|
|
8
|
|
3
|
|
26
|
|
Performance
|
|
18
|
|
(4)
|
|
6
|
|
5
|
|
(0)
|
|
25
|
|
11
|
|
60
|
|
Other
|
|
(0)
|
|
(0)
|
|
1
|
|
0
|
|
(0)
|
|
(1)
|
|
1
|
|
1
|
|
Balance as of December 31, 2021
|
|
116
|
|
227
|
|
70
|
|
77
|
|
84
|
|
238
|
|
115
|
|
928
|
|
Management fee margin (in bps)
|
|
72
|
|
13
|
|
33
|
|
28
|
|
3
|
|
18
|
|
49
|
|
28
|
|
|
|
|
|
|
|
|
|
|
|
|
|
|
|
|
|
|
2020
In 2020, the market conditions were impacted by the global COVID-19 pandemic. All major equity indices traded at significantly lower levels in the second quarter, with a recovery in most markets by year end, and with the U.S. dollar depreciating against the Euro. Overall net flows were positive combined with a growth in Assets under Management.
In 2020, AM reported a profit before tax of € 544 million, an increase of € 76 million, or 16 %, compared to € 468 million in the prior year, primarily driven by lower expenses. Adjusted for transformation charges as well as restructuring and severance expenses, profit before tax was € 586 million in 2020 compared to € 540 million in 2019.
Net revenues were € 2.2 billion, a decrease of € 103 million, or 4 %, compared to the prior year.
Management fees were € 2.1 billion in 2020, essentially flat compared to the prior year as effects from the positive market performance and growth in Passive were partly offset by declining management fee margins.
Performance and transaction fees of € 90 million in 2020 were significantly lower by € 111 million, or 55 %, compared to the full year 2019, predominantly due a non-recurring Alternatives and a Multi Asset performance fee recognized in 2019.
Other revenues were € 3 million compared to negative € 10 million in 2019 with both years negatively impacted by the fair value of guaranteed products, combined with lower investment income, higher contribution from investment in Harvest Fund Management Co. Limited and lower treasury funding charges in 2020.
Noninterest expenses were € 1.5 billion, a decrease of € 185 million, or 11 %, compared to the prior year, driven by a decline in variable compensation, and efficiency initiatives combined with pandemic related savings such as travel and entertainment and marketing costs. Noninterest expenses were also lower as the prior year included transformation charges relating to a real estate impairment.
Adjusted costs excluding transformation charges were € 1.5 billion in 2020, a decrease of € 159 million, or 10 % compared to € 1.6 billion in 2019 as lower compensation expenses were supported by lower non-compensation costs.
Assets under Management were € 793 billion, an increase of € 25 billion, or 3 %, versus December 31, 2019. The increase was driven by € 30 billion net inflows and € 24 billion related to favorable market development, mainly coming from the second half of 2020, partly offset by negative € 26 billion foreign exchange effects. The net inflows were primarily driven by Passive and Cash, and further supported by Alternatives. ESG dedicated funds continued to attract strong net inflows.
The following table provides the development of Assets under Management during 2020, broken down by product type as well as the respective management fee margins:
|
in € bn.
|
|
Active
Equity
|
|
Active
Fixed
Income
|
|
Active
Multi
Asset
|
|
Active
SQI
|
|
Active
Cash
|
|
Passive
|
|
Alternatives
|
|
Assets under
Management
|
|
Balance as of December 31, 2019
|
|
96
|
|
234
|
|
58
|
|
71
|
|
57
|
|
156
|
|
96
|
|
768
|
|
Inflows
|
|
21
|
|
47
|
|
16
|
|
19
|
|
503
|
|
85
|
|
12
|
|
703
|
|
Outflows
|
|
(19)
|
|
(54)
|
|
(18)
|
|
(22)
|
|
(483)
|
|
(68)
|
|
(8)
|
|
(673)
|
|
Net Flows
|
|
2
|
|
(7)
|
|
(2)
|
|
(3)
|
|
20
|
|
17
|
|
4
|
|
30
|
|
FX impact
|
|
(2)
|
|
(9)
|
|
(0)
|
|
(0)
|
|
(4)
|
|
(7)
|
|
(3)
|
|
(26)
|
|
Performance
|
|
3
|
|
7
|
|
1
|
|
1
|
|
0
|
|
13
|
|
(2)
|
|
24
|
|
Other
|
|
(1)
|
|
(6)
|
|
1
|
|
1
|
|
2
|
|
0
|
|
(1)
|
|
(3)
|
|
Balance as of December 31, 2020
|
|
97
|
|
220
|
|
59
|
|
69
|
|
75
|
|
179
|
|
93
|
|
793
|
|
Management fee margin (in bps)
|
|
72
|
|
13
|
|
34
|
|
28
|
|
4
|
|
19
|
|
50
|
|
28
|
|
|
|
|
|
|
|
|
|
|
|
|
|
|
|
|
|
|
28
|
|
Deutsche Bank
|
Operating and Financial Review
|
|
|
Annual Report 2021
|
Deutsche Bank Group
|
|
|
|
|
Capital Release Unit
|
|
|
|
|
|
|
|
|
2021 increase (decrease)
from 2020
|
|
2020 increase (decrease)
from 2019
|
||||
|
in € m.
(unless stated otherwise)
|
|
2021
|
|
2020
|
|
2019
|
|
in € m.
|
|
in %
|
|
in € m.
|
|
in %
|
|
Net revenues
|
|
|
|
(
|
|
|
|
251
|
|
N/M
|
|
(442)
|
|
N/M
|
|
Provision for credit losses
|
|
(
|
|
|
|
(
|
|
(70)
|
|
N/M
|
|
43
|
|
N/M
|
|
Noninterest expenses
|
|
|
|
|
|
|
|
|
|
|
|
|
|
|
|
Compensation and benefits
|
|
|
|
|
|
|
|
(40)
|
|
(24)
|
|
(191)
|
|
(53)
|
|
General and administrative expenses
|
|
|
|
|
|
|
|
(468)
|
|
(26)
|
|
(1,124)
|
|
(39)
|
|
Impairment of goodwill and other intangible assets
|
|
|
|
|
|
|
|
0
|
|
N/M
|
|
0
|
|
N/M
|
|
Restructuring activities
|
|
(
|
|
|
|
|
|
(7)
|
|
N/M
|
|
(139)
|
|
(97)
|
|
Total noninterest expenses
|
|
|
|
|
|
|
|
(515)
|
|
(26)
|
|
(1,453)
|
|
(43)
|
|
Noncontrolling interests
|
|
|
|
(
|
|
|
|
0
|
|
N/M
|
|
(1)
|
|
N/M
|
|
Profit (loss) before tax
|
|
(
|
|
(
|
|
(
|
|
836
|
|
(38)
|
|
970
|
|
(31)
|
|
Total assets (in € bn)
1
|
|
|
|
|
|
|
|
(66)
|
|
(33)
|
|
(62)
|
|
(24)
|
|
Employees (full-time equivalent)
|
|
|
|
|
|
|
|
(211)
|
|
(44)
|
|
(136)
|
|
(22)
|
|
|
|
|
|
|
|
|
|
|
|
|
|
|
|
|
N/M – Not meaningful
Prior year segmental information presented in the current structure.
1
Segment assets represent consolidated view, i.e., the amounts do not include intersegment balances.
2021
The Capital Release Unit reported a loss before tax of € 1.4 billion in 2021, a reduction of 38 % versus a loss of € 2.2 billion in 2020, primarily reflecting year on year cost reductions.
Net revenues were € 26 million in 2021, versus negative € 225 million in the prior year, as revenues from Prime Finance cost recovery and the loan portfolio were only partly offset by funding, risk management and de-risking impacts.
Provision for credit losses were a net release of € 42 million, compared to a provision of € 29 million in 2020. The net release was driven by the legacy real estate and shipping portfolios.
Noninterest expenses were € 1.4 billion, down 26 % year on year. This development was primarily driven by a 35 % reduction in adjusted costs, reflecting lower internal service charges and bank levy allocations as well as lower direct expenses.
Leverage exposure was € 39 billion at year end 2021, down from € 72 billion at the end of 2020, and ahead of the division's latest year-end 2022 target of € 51 billion. This progress partly reflected the transfer of Deutsche Bank’s Global Prime Finance and Electronic Equities businesses to BNP Paribas, which was successfully completed by the end of 2021, in line with the target timeline.
Risk weighted assets were € 28 billion at the end of 2021, down from € 34 billion at the end of 2020 and ahead of the bank’s year-end 2022 target of € 32 billion.
Since its inception after the second quarter of 2019, CRU has reduced leverage exposure by 84 % and RWAs by 57 %, while the loss before tax has been reduced by 57 % since 2019.
29
|
|
Deutsche Bank
|
Operating and Financial Review
|
|
|
Annual Report 2021
|
Deutsche Bank Group
|
|
|
|
|
2020
CRU incurred a loss before tax of € 2.2 billion in 2020, compared to a loss before tax of € 3.2 billion in 2019. This improvement versus the prior year was mainly driven by lower general and administrative expenses, lower compensation and benefits and lower restructuring costs that more than offset the loss of revenues from the exit of the equities trading business.
Net revenues were negative € 225 million, a decrease of € 442 million compared to 2019. Negative revenues in 2020 represent a full year of executing the strategy and were driven by de-risking, funding and hedging costs, partly offset by Prime Finance cost recovery. The prior year included six months of operating revenue before the CRU formation.
Provision for credit losses were € 29 million, compared to a release of € 14 million in 2019. While the net release in 2019 was dominated by a small number of specific events across several portfolios, 2020 saw additional provisions driven by the legacy shipping portfolio.
Noninterest expenses were € 1.9 billion, a reduction of € 1.5 billion or 43 % compared to the prior year. Consistent with the bank’s strategy, 2020 saw significantly lower restructuring costs of € 5 million compared to € 143 million incurred in the prior year. Similarly, CRU incurred significantly lower transformation costs, with € 162 million incurred in 2020, compared to transformation charges of € 510 million in 2019, mainly related to impairments of software.
Adjusted costs excluding transformation charges were € 1.7 billion, a decrease of € 862 million, or 33 % compared to 2019 following lower compensation and benefits costs across both fixed and variable compensation and reduced non-compensation costs mainly driven by lower professional fees as well as communication and data services.
Leverage exposure was € 72 billion, € 8 billion ahead of the euro year-end target of € 80 billion. This represents a full-year reduction of 43 % versus € 127 billion at the end of 2019.
Risk weighted assets (RWAs) were € 34 billion at the end of 2020, € 4 billion below the year-end target of € 38 billion. This represents a full year reduction of € 11 billion, of which € 10 billion from Credit and Market Risk or a 48 % reduction from the prior year period.
30
|
|
Deutsche Bank
|
Operating and Financial Review
|
|
|
Annual Report 2021
|
Deutsche Bank Group
|
|
|
|
|
Corporate Other (CO)
|
|
|
|
|
|
|
|
|
2021 increase (decrease)
from 2020
|
|
2020 increase (decrease)
from 2019
|
||||
|
in € m.
(unless stated otherwise)
|
|
2021
|
|
2020
|
|
2019
|
|
in € m.
|
|
in %
|
|
in € m.
|
|
in %
|
|
Net revenues
|
|
(
|
|
(
|
|
|
|
340
|
|
(62)
|
|
(659)
|
|
N/M
|
|
Provision for credit losses
|
|
|
|
(
|
|
(
|
|
9
|
|
N/M
|
|
(3)
|
|
N/M
|
|
Noninterest expenses
|
|
|
|
|
|
|
|
|
|
|
|
|
|
|
|
Compensation and benefits
|
|
|
|
|
|
|
|
(206)
|
|
(6)
|
|
(188)
|
|
(6)
|
|
General and administrative expenses
|
|
(
|
|
(
|
|
(
|
|
644
|
|
(24)
|
|
263
|
|
(9)
|
|
Impairment of goodwill and other intangible assets
|
|
|
|
|
|
|
|
0
|
|
N/M
|
|
0
|
|
N/M
|
|
Restructuring activities
|
|
(
|
|
|
|
|
|
(3)
|
|
N/M
|
|
(38)
|
|
(93)
|
|
Total noninterest expenses
|
|
|
|
|
|
|
|
436
|
|
77
|
|
37
|
|
7
|
|
Noncontrolling interests
|
|
(
|
|
(
|
|
(
|
|
(37)
|
|
22
|
|
3
|
|
(2)
|
|
Profit (loss) before tax
|
|
(
|
|
(
|
|
(
|
|
(68)
|
|
7
|
|
(696)
|
|
N/M
|
|
Employees (full-time equivalent)
|
|
|
|
|
|
|
|
477
|
|
2
|
|
(1,085)
|
|
(4)
|
|
|
|
|
|
|
|
|
|
|
|
|
|
|
|
|
N/M – Not meaningful
Prior year segmental information presented in the current structure.
2021
CO reported a loss before tax of € 1.0 billion in 2021 compared to a loss before tax of € 947 million in 2020, primarily reflecting higher noninterest expenses.
Net revenues were negative € 211 million in 2021, compared to negative € 552 million in 2020. Revenues related to valuation and timing differences were € 286 million in 2021, compared to negative € 103 million in 2020. This improvement was driven by the positive mark-to-market impact from interest rate hedging activities in connection with the bank’s funding arrangements where hedge accounting cannot be applied. Net revenues relating to funding and liquidity were negative € 242 million in 2021, versus negative € 235 million in 2020.
Noninterest expenses were € 1.0 billion in 2021, an increase of € 436 million, or 77 %, compared to 2020. 2021 noninterest expenses included € 603 million of transformation related expenses booked in CO, partly related to a contract settlement and software impairments, partly triggered by the bank’s migration to the cloud technology. Expenses associated with shareholder activities as defined in the OECD Transfer Pricing guidelines not allocated to the business divisions were € 460 million in 2021, versus € 403 million in 2020.
Noncontrolling interests are deducted from the profit before tax of the divisions and reversed in CO. These amounted to € 206 million in 2021, compared to € 169 million in 2020, mainly related to DWS.
2020
CO reported a loss before tax of € 947 million in 2020 compared to a loss before tax of € 251 million in 2019.
Net revenues were negative € 552 million in 2020, compared to € 107 million in 2019. Revenues related to valuation and timing differences were negative € 103 million in 2020, compared to € 573 million in 2019. This was driven by the negative mark-to-market impact of hedging activities in connection with the bank’s funding arrangements, against the backdrop of tightening spreads on Deutsche Bank funding issuances leading to lower funding costs. Net revenues relating to funding and liquidity were negative € 235 million in 2020, versus negative € 208 million in 2019.
Noninterest expenses were € 568 million in 2020, an increase of € 37 million, or 7 %, compared to 2019. 2020 noninterest expenses included € 168 million higher than planned infrastructure expenses which are retained in CO, compared to € 65 million lower than planned infrastructure expenses in 2019 as well as transformation charges primarily reflecting the bank’s accelerated rationalization of its real estate footprint. Litigation expenses amounted to a credit of € 67 million in 2020, reflecting a net provision release, compared to expenses of € 238 million in 2019. Expenses associated with shareholder activities as defined in the OECD Transfer Pricing guidelines not allocated to the business divisions were € 403 million in 2020, down 15 % compared to 2019. In 2019 positive effects were recognized from the release of legacy balances.
Noncontrolling interests are deducted from the profit before tax of the divisions and reversed in CO. These amounted to € 169 million in 2020, compared to € 173 million in 2019, mainly related to DWS.
31
|
|
Deutsche Bank
|
Operating and Financial Review
|
|
|
Annual Report 2021
|
Deutsche Bank Group
|
|
|
|
|
Financial Position
Assets
|
in € m.
(unless stated otherwise)
|
|
Dec 31, 2021
|
|
Dec 31, 2020
|
|
Absolute
Change
|
|
Change
in %
|
|
Cash, central bank and interbank balances
|
|
199,363
|
|
175,339
|
|
24,024
|
|
14
|
|
Central bank funds sold, securities purchased under resale agreements and securities borrowed
|
|
8,432
|
|
8,533
|
|
(101)
|
|
(1)
|
|
Financial assets at fair value through profit or loss
|
|
491,233
|
|
527,980
|
|
(36,747)
|
|
(7)
|
|
Of which: Trading assets
|
|
102,396
|
|
107,929
|
|
(5,532)
|
|
(5)
|
|
Of which: Positive market values from derivative financial instruments
|
|
299,732
|
|
343,493
|
|
(43,761)
|
|
(13)
|
|
Of which: Non-trading financial assets mandatory at fair value through profit and loss
|
|
88,965
|
|
76,121
|
|
12,844
|
|
17
|
|
Financial assets at fair value through other comprehensive income
|
|
28,979
|
|
55,834
|
|
(26,856)
|
|
(48)
|
|
Loans at amortized cost
|
|
472,069
|
|
426,691
|
|
45,378
|
|
11
|
|
Remaining assets
|
|
124,630
|
|
130,584
|
|
(5,954)
|
|
(5)
|
|
Of which: Brokerage and securities related receivables
|
|
71,495
|
|
74,564
|
|
(3,070)
|
|
(4)
|
|
Total assets
|
|
1,324,705
|
|
1,324,961
|
|
(256)
|
|
(0)
|
|
|
|
|
|
|
|
|
|
|
Liabilities and Equity
|
in € m.
(unless stated otherwise)
|
|
Dec 31, 2021
|
|
Dec 31, 2020
|
|
Absolute
Change
|
|
Change
in %
|
|
Deposits
|
|
604,396
|
|
567,745
|
|
36,651
|
|
6
|
|
Central bank funds purchased, securities sold under repurchase
agreements and securities loaned
|
|
772
|
|
4,023
|
|
(3,251)
|
|
(81)
|
|
Financial liabilities at fair value through profit or loss
|
|
400,857
|
|
419,199
|
|
(18,342)
|
|
(4)
|
|
Of which: Trading liabilities
|
|
54,718
|
|
44,316
|
|
10,403
|
|
23
|
|
Of which: Negative market values from derivative financial instruments
|
|
287,109
|
|
327,775
|
|
(40,666)
|
|
(12)
|
|
Of which: Financial liabilities designated at fair value through profit or loss
|
|
58,468
|
|
46,582
|
|
11,886
|
|
26
|
|
Other short-term borrowings
|
|
4,034
|
|
3,553
|
|
481
|
|
14
|
|
Long-term debt
|
|
144,485
|
|
149,163
|
|
(4,679)
|
|
(3)
|
|
Remaining liabilities
|
|
102,063
|
|
119,094
|
|
(17,031)
|
|
(14)
|
|
Of which: Brokerage and securities related payables
|
|
70,165
|
|
79,810
|
|
(9,645)
|
|
(12)
|
|
Total liabilities
|
|
1,256,606
|
|
1,262,777
|
|
(6,170)
|
|
(0)
|
|
Total equity
|
|
68,099
|
|
62,184
|
|
5,914
|
|
10
|
|
Total liabilities and equity
|
|
1,324,705
|
|
1,324,961
|
|
(256)
|
|
(0)
|
|
|
|
|
|
|
|
|
|
|
Movements in Assets and Liabilities
As of December 31, 2021, the total balance sheet of € 1.3 trillion slightly decreased by € 0.3 billion compared to year-end 2020.
Cash, central bank and interbank balances increased by
€ 24.0 billion
, primarily driven by proceeds from selected sales of financial assets at fair value through other comprehensive income of € 26.9 billion, as a result of rebalancing of our strategic liquidity reserve in light of market conditions.
Central bank funds sold, securities purchased under resale agreements and securities borrowed measured at amortized cost and under non-trading financial assets mandatory at fair value through profit and loss increased by € 14.8 billion, driven by higher client activity under current market conditions in our Investment Bank. Corresponding liabilities increased by € 7.4 billion.
Trading assets decreased by
€ 5.5 billion
, primarily due to unwinding of equity securities long positions as a result of the sale of our Prime Finance franchise to BNP Paribas. Trading liabilities increased by
€ 10.4 billion
, mainly attributable to increased client demand and market opportunities.
Positive and negative market values of derivative financial instruments decreased by
€ 43.8 billion
and € 40.7 billion, respectively, mainly due to de-risking in our Capital Release Unit and interest rate products as changes in interest rate curves were inversely correlated to changes in mark-to-market values. These decreases were partly offset by increases in foreign exchange rate products in the Fixed Income Currencies business in our Investment Bank due to higher trading volumes.
32
|
|
Deutsche Bank
|
Operating and Financial Review
|
|
|
Annual Report 2021
|
Deutsche Bank Group
|
|
|
|
|
Loans at amortized cost increased by
€ 45.4 billion
, primarily driven by strong underlying growth, and a large episodic financing that is expected to reverse in the first quarter 2022 in our Investment Bank, strong growth in mortgage and collateralized lending in our Private Bank as well as solid lending demand in Corporate Treasury Services in our Corporate Bank. Deposits increased by
€ 36.7 billion
, mainly from targeted growth in our Corporate Bank, organic growth in the Private Bank as well as short term wholesale funding supporting financing needs towards year-end.
Long-term debt decreased by € 4.7 billion, primarily driven by maturities and buy-backs of debt issuances, partly offset by drawings under the third TLTRO refinancing program of the ECB.
Remaining assets decreased by € 5.9 billion, primarily due to a decrease in assets held for sale due to the transfer of our Prime Finance franchise to BNP Paribas. Remaining liabilities decreased by € 17.0 billion primarily driven by lower brokerage payables in line with lower derivatives positions and a decrease in liabilities held for sale due to the aforementioned transfer.
The overall movement of the balance sheet included an increase of € 35.6 billion due to foreign exchange rate movements, mainly driven by a strengthening of the U.S. Dollar against the Euro. The effects from foreign exchange rate movements are embedded in the movement of the balance sheet line items discussed in this section.
Liquidity
Total High Quality Liquid Assets (HQLA) as defined by the Commission Delegated Regulation (EU) 2015/61 and amended by Regulation (EU) 2018/1620 were € 207 billion as of December 31, 2021, a € 6 billion decrease from € 213 billion as of December 31, 2020. The Group maintains additional highly liquid central bank eligible assets, not qualifying as HQLA or subject to transfer restrictions under the HQLA definition. These additional liquid assets were € 34 billion as at the end of December 31, 2021, such that the Group’s total Liquidity Reserves were € 241 billion. The decrease is primarily driven by increased lending activity and matured capital market issuances partially offset by additional participation in the ECB’s TLTRO and higher deposits. The Liquidity Coverage Ratio was 133 % at the end fourth quarter of 2021, a surplus to regulatory requirements of € 52 billion as compared to 145 % as at the end of fourth quarter of 2020, a surplus to regulatory requirements of € 66 billion.
Equity
Total equity as of December 31, 2021 increased by € 5.9 billion compared to December 31, 2020. This change was driven by a number of factors including the issuance of additional equity components (Additional Tier 1 securities, treated as equity in accordance with IFRS) of € 2.5 billion (€ 1.25 billion each on May 9, 2021 and November 16, 2021).
Further contributing to the increase were the profit reported for the period of € 2.6 billion, a positive impact from foreign currency translation of € 1.1 billion, net of tax, mainly resulting from the strengthening of the U.S. dollar against the Euro, as well as remeasurement gains related to defined benefit plans of € 592 million, net of tax. This was partly offset by unrealized net losses of financial assets at fair value through other comprehensive income of € 403 million, net of tax and coupons paid on additional equity components of € 363 million.
Own Funds
Our CRR/CRD Common Equity Tier 1 (CET 1) capital as of December 31, 2021 increased by € 1.6 billion to € 46.5 billion, compared to € 44.9 billion as of December 31, 2020. The CRR/CRD Risk-weighted assets (RWA) increased by € 22.7 billion to € 351.6 billion as of December 31, 2021, compared to € 329.0 billion as of December 31, 2020. Due to this increase in CRR/CRD RWA, the CRR/CRD CET 1 capital ratio as of December 31, 2021 decreased to 13.2 % compared to 13.6 % in December 31, 2020.
Our CRR/CRD Tier 1 capital as of December 31, 2021 amounted to € 55.4 billion, consisting of a CRR/CRD CET 1 capital of € 46.5 billion and CRR/CRD Additional Tier 1 (AT1) capital of € 8.9 billion. The CRR/CRD Tier 1 capital was € 3.6 billion higher than at the end of December 31, 2020, driven by an increase in CRR/CRD CET 1 capital of € 1.6 billion and an increase in CRR/CRD AT1 capital of € 2.0 billion since year end 2020. The CRR/CRD Tier 1 capital ratio as of December 31, 2021 remains unchanged at 15.7 % compared to December 31, 2020.
Our CRR/CRD Total Regulatory capital as of December 31, 2021 amounted to € 62.7 billion compared to € 58.7 billion at the end of December 31, 2020. The CRR/CRD Total capital increase was driven by an increase in CRR/CRD Tier 1 capital of € 3.6 billion and an increase in CRR/CRD Tier 2 capital of € 0.4 billion since year end 2020. The CRR/CRD Total capital ratio as of December 31, 2021 remains unchanged at 17.8 % compared to December 31, 2020.
33
|
|
Deutsche Bank
|
Operating and Financial Review
|
|
|
Annual Report 2021
|
Deutsche Bank Group
|
|
|
|
|
Liquidity and Capital Resources
Credit Ratings
[Page intentionally left blank for SEC filing purposes]
34
|
|
Deutsche Bank
|
Operating and Financial Review
|
|
|
Annual Report 2021
|
Deutsche Bank Group
|
|
|
|
|
[Page intentionally left blank for SEC filing purposes]
35
|
|
Deutsche Bank
|
Operating and Financial Review
|
|
|
Annual Report 2021
|
Deutsche Bank Group
|
|
|
|
|
Tabular Disclosure of Contractual Obligations
Cash payment requirements outstanding as of December 31, 2021.
|
Contractual obligations
|
|
|
|
|
|
|
|
|
|
Payment due
by period
|
|
in € m.
|
|
Total
|
|
Less than 1 year
|
|
1–3 years
|
|
3–5 years
|
|
More than 5 years
|
|
Long-term debt obligations¹
|
|
154,068
|
|
51,378
|
|
40,028
|
|
31,278
|
|
31,383
|
|
Trust preferred securities
1,2
|
|
529
|
|
529
|
|
0
|
|
0
|
|
0
|
|
Long-term financial liabilities designated at fair value through profit or loss
3
|
|
3,809
|
|
1,225
|
|
574
|
|
1,288
|
|
722
|
|
Future cash outflows not reflected in the measurement of Lease liabilities
4
|
|
6,433
|
|
10
|
|
163
|
|
376
|
|
5,884
|
|
Lease liabilities
1
|
|
4,515
|
|
682
|
|
875
|
|
875
|
|
2,082
|
|
Purchase obligations
|
|
4,045
|
|
547
|
|
1,649
|
|
1,678
|
|
171
|
|
Long-term deposits¹
|
|
22,188
|
|
0
|
|
7,733
|
|
4,462
|
|
9,994
|
|
Other long-term liabilities
|
|
1,467
|
|
1,101
|
|
284
|
|
2
|
|
79
|
|
Total
|
|
197,054
|
|
55,474
|
|
51,306
|
|
39,959
|
|
50,315
|
|
|
|
|
|
|
|
|
|
|
|
|
1
Includes interest payments.
2
Contractual payment date or first call date.
3
Long-term debt and long-term deposits designated at fair value through profit or loss.
4
For further detail please refer to Note 22 “Leases”.
Purchase obligations for goods and services include future payments for, among other things, information technology services and facility management. Some figures above for purchase obligations represent minimum contractual payments and actual future payments may be higher. Long-term deposits exclude contracts with a remaining maturity of less than one year. Under certain conditions future payments for some long-term financial liabilities designated at fair value through profit or loss may occur earlier. See the following notes to the consolidated financial statements for further information: Note 5 “Net Interest Income and Net Gains (Losses) on Financial Assets/Liabilities at Fair Value through Profit or Loss”, Note 22 “Leases”, Note 26 “Deposits” and Note 30 “Long-Term Debt and Trust Preferred Securities”.
36
|
|
Deutsche Bank
|
Operating and Financial Review
|
|
|
Annual Report 2021
|
Deutsche Bank Group
|
|
|
|
|
Outlook
[Page intentionally left blank for SEC filing purposes]
37
|
|
Deutsche Bank
|
Operating and Financial Review
|
|
|
Annual Report 2021
|
Deutsche Bank Group
|
|
|
|
|
[Page intentionally left blank for SEC filing purposes]
38
|
|
Deutsche Bank
|
Operating and Financial Review
|
|
|
Annual Report 2021
|
Deutsche Bank Group
|
|
|
|
|
[Page intentionally left blank for SEC filing purposes]
39
|
|
Deutsche Bank
|
Operating and Financial Review
|
|
|
Annual Report 2021
|
Deutsche Bank Group
|
|
|
|
|
[Page intentionally left blank for SEC filing purposes]
40
|
|
Deutsche Bank
|
Operating and Financial Review
|
|
|
Annual Report 2021
|
Deutsche Bank Group
|
|
|
|
|
[Page intentionally left blank for SEC filing purposes]
41
|
|
Deutsche Bank
|
Operating and Financial Review
|
|
|
Annual Report 2021
|
Deutsche Bank Group
|
|
|
|
|
[Page intentionally left blank for SEC filing purposes]
42
|
|
Deutsche Bank
|
Operating and Financial Review
|
|
|
Annual Report 2021
|
Deutsche Bank Group
|
|
|
|
|
[Page intentionally left blank for SEC filing purposes]
43
|
|
Deutsche Bank
|
Operating and Financial Review
|
|
|
Annual Report 2021
|
Deutsche Bank Group
|
|
|
|
|
Risks and Opportunities
[Page intentionally left blank for SEC filing purposes]
44
|
|
Deutsche Bank
|
Operating and Financial Review
|
|
|
Annual Report 2021
|
Deutsche Bank Group
|
|
|
|
|
[Page intentionally left blank for SEC filing purposes]
45
|
|
Deutsche Bank
|
Operating and Financial Review
|
|
|
Annual Report 2021
|
Deutsche Bank Group
|
|
|
|
|
[Page intentionally left blank for SEC filing purposes]
46
|
|
Deutsche Bank
|
Operating and Financial Review
|
|
|
Annual Report 2021
|
Deutsche Bank Group
|
|
|
|
|
[Page intentionally left blank for SEC filing purposes]
47
|
|
Deutsche Bank
|
Operating and Financial Review
|
|
|
Annual Report 2021
|
Deutsche Bank Group
|
|
|
|
|
[Page intentionally left blank for SEC filing purposes]
48
|
|
Deutsche Bank
|
Operating and Financial Review
|
|
|
Annual Report 2021
|
Deutsche Bank Group
|
|
|
|
|
[Page intentionally left blank for SEC filing purposes]
49
|
|
Deutsche Bank
|
Operating and Financial Review
|
|
|
Annual Report 2021
|
Deutsche Bank Group
|
|
|
|
|
[Page intentionally left blank for SEC filing purposes]
50
|
|
Deutsche Bank
|
Operating and Financial Review
|
|
|
Annual Report 2021
|
Deutsche Bank Group
|
|
|
|
|
[Page intentionally left blank for SEC filing purposes]
51
|
|
Deutsche Bank
|
Operating and Financial Review
|
|
|
Annual Report 2021
|
Deutsche Bank Group
|
|
|
|
|
[Page intentionally left blank for SEC filing purposes]
52
|
|
Deutsche Bank
|
Operating and Financial Review
|
|
|
Annual Report 2021
|
Deutsche Bank Group
|
|
|
|
|
[Page intentionally left blank for SEC filing purposes]
53
|
|
Deutsche Bank
|
Operating and Financial Review
|
|
|
Annual Report 2021
|
Deutsche Bank Group
|
|
|
|
|
[Page intentionally left blank for SEC filing purposes]
54
|
|
Deutsche Bank
|
Operating and Financial Review
|
|
|
Annual Report 2021
|
Deutsche Bank Group
|
|
|
|
|
[Page intentionally left blank for SEC filing purposes]
55
|
|
Deutsche Bank
|
Operating and Financial Review
|
|
|
Annual Report 2021
|
Deutsche Bank Group
|
|
|
|
|
[Page intentionally left blank for SEC filing purposes]
56
|
|
Deutsche Bank
|
Operating and Financial Review
|
|
|
Annual Report 2021
|
Deutsche Bank Group
|
|
|
|
|
Risk Report
|
|
Introduction – 55
|
|
|
|
|
56
|
Risk and capital overview
|
|
|
|
|
|
Key risk metrics – 56
|
|
|
|
|
|
Risk profile – 57
|
|
|
|
|
59
|
Risk and capital framework
|
|
|
|
|
|
Risk management principles – 59
|
|
|
|
|
|
Risk governance – 60
|
|
|
|
|
|
Risk appetite and capacity – 62
|
|
|
|
|
|
Risk and capital plan – 63
|
|
|
|
|
|
Stress testing – 65
|
|
|
|
|
|
Risk measurement and reporting systems – 66
|
|||
|
|
Recovery and resolution planning – 67
|
|||
|
68
|
Risk and Capital Management
|
|
||
|
|
Capital management – 68
|
|||
|
|
Resource limit setting – 68
|
|||
|
|
Risk identification and assessment – 69
|
|||
|
|
Credit Risk Management and Asset
Quality
– 69
|
|
|
|
|
|
Market Risk Management – 98
|
|||
|
|
Operational risk management – 104
|
|
||
|
|
Liquidity Risk Management – 109
|
|||
|
|
Enterprise risk management – 114
|
|||
|
|
Model Risk Management – 116
|
|
||
|
|
Reputational Risk Management – 117
|
|
|
|
|
118
|
Risk and capital performance
|
|
|
|
|
|
Capital, Leverage Ratio, TLAC and MREL – 118
|
|
|
|
|
|
Credit Risk Exposure – 134
|
|
|
|
|
|
Trading Market Risk Exposures – 154
|
|
|
|
|
|
Nontrading Market Risk Exposures – 157
|
|
|
|
|
|
Operational risk exposure – 159
|
|
|
|
|
|
Liquidity Risk Exposure – 160
|
|
|
|
|
|
|
|
|
|
|
|
|
|
|
|
|
|
|
|
|
|
57
|
|
Deutsche Bank
|
Operating and Financial Review
|
|
|
Annual Report 2021
|
Deutsche Bank Group
|
|
|
|
|
Introduction
Disclosures in line with IFRS 7
The following Risk Report provides qualitative and quantitative disclosures about credit, market and other risks in line with the requirements of International Financial Reporting Standard 7 (IFRS 7) Financial Instruments: Disclosures. It also considers the underlying classification and measurement and impairment requirements in IFRS 9 with further details to be found in the “Credit Risk Management and Model” section, in the “Asset quality” section, in the “Credit risk mitigation” section and in Note 1 “Significant accounting policies and critical accounting estimates” to the consolidated financial statements. Information which forms part of and is incorporated by reference into the financial statements of this report is marked by a light blue shading throughout this Risk Report.
European Regulation (EU) 2019/876 and Directive (EU) 2019/878 introduced amendments to the CRR/CRD with various changes to the regulatory framework that became applicable for June 30, 2021: A new standardized approach for counterparty credit risk (SA-CCR) was introduced that replaces the mark-to-market method to determine the exposure value for derivatives that are not in scope of the internal model method. In addition, a new framework to determine the risk weight for banking book investments in collective investment undertakings and default fund contributions to central counterparties was introduced. Moreover, a minimum regulatory leverage ratio of 3 % is determined as the ratio of Tier 1 capital and the regulatory leverage exposure. In addition, a minimum Net Stable Funding Ratio (NSFR) of 100 % was introduced that requires banks to maintain a stable funding profile in relation to their on and off balance sheet exposures.
In the third quarter of 2021, the Group introduced the new definition of default, which consists of two EBA guidelines. One guideline comprises an EBA technical standard regarding the materiality threshold for credit obligations past due (implemented with ECB regulation (EU) 2018/1845) and the second guideline covers the application of the definition of default. Both of these new requirements are jointly referred to below as the new Definition of Default, after the ECB’s approval was received in August 2021. The new Definition of Default replaced the default definition under Basel II and is applied to all key risk metrics throughout the Annual Report including as a trigger to Stage 3 under IFRS 9.
Since June 30, 2020, the Group applies the transitional arrangements in relation to IFRS 9 as provided in the current CRR/CRD for all CET1 measures.
Disclosures according to Pillar 3 of the Basel 3 Capital Framework
Our disclosures according to Pillar 3 of the Basel 3 Capital Framework, which are implemented in the European Union by the Regulation (EU) No 575/2013 on prudential requirements for credit institutions and investment firms (Capital Requirements Regulation or CRR), including recent amendments; and supported by the EBA guideline „Final draft implementing technical standards on public disclosures by institutions of the information referred to in Titles II and III of Part Eight of Regulation (EU) No 575/2013“ and related guidelines applicable to Pillar 3 disclosures, are published in our additional Pillar 3 Report, which can be found on our website.
Disclosures according to principles and recommendations of the Enhanced Disclosure Task Force (EDTF)
In 2012 the Enhanced Disclosure Task Force (“EDTF”) was established as a private sector initiative under the auspices of the Financial Stability Board (“FSB”), with the primary objective to develop fundamental principles for enhanced risk disclosures and to recommend improvements to existing risk disclosures. As a member of the EDTF we adhere to the disclosure recommendations in this Risk Report and also in our additional Pillar 3 report.
58
|
|
Deutsche Bank
|
Operating and Financial Review
|
|
|
Annual Report 2021
|
Deutsche Bank Group
|
|
|
|
|
Risk and capital overview
Key risk metrics
As mentioned in the section Risk factors above, the bank is exposed to a variety of financial and non-financial risk factors. Although the macroeconomic, business and operating environment has improved over the course of 2021 as the global economy experienced a strong recovery from the pandemic recession, downside risks to economic activity and financial markets remain elevated as new COVID-19 variants are discovered, supply chain challenges and rising energy prices grow more acute and geopolitical risks, including from China and Russia, increase.
The following selected key risk ratios and corresponding metrics form part of our holistic risk management across individual risk types. The Common Equity Tier 1 ratio (CET 1), Economic Capital Adequacy (ECA) Ratio, Leverage ratio (LR), Total Loss Absorbing Capacity (TLAC), Minimum Requirement for Own Funds and Eligible Liabilities (MREL), Liquidity Coverage Ratio (LCR), Net Stable Funding Ratio (NSFR) and Stressed Net Liquidity Position (sNLP) serve as high-level metrics and are fully integrated across strategic planning, risk appetite framework, and recovery and resolution planning practices, which are reviewed and approved by our Management Board at least annually.
|
Common Equity Tier 1 Ratio
|
|
|
|
31.12.2021
|
|
13.2 %
|
|
31.12.2020
|
|
13.6 %
|
|
|
|
|
|
Economic Capital Adequacy Ratio
|
|
|
|
31.12.2021
|
|
206 %
|
|
31.12.2020
|
|
179 %
|
|
|
|
|
|
Leverage Ratio (fully-loaded)
|
|
|
|
31.12.2021
|
|
4.9 %
|
|
31.12.2020
|
|
4.7 %
|
|
|
|
|
|
Total loss absorbing capacity (TLAC)
|
|
|
|
31.12.2021 (Risk Weighted Asset based)
|
|
31.0 %
|
|
31.12.2021 (Leverage Exposure based)
|
|
9.7 %
|
|
31.12.2020 (Risk Weighted Asset based)
|
|
32.0 %
|
|
31.12.2020 (Leverage Exposure based)
|
|
9.8 %
|
|
|
|
|
|
Liquidity Coverage Ratio
|
|
|
|
31.12.2021
|
|
133 %
|
|
31.12.2020
|
|
145 %
|
|
|
|
|
|
Total Risk-Weighted Assets
|
|
|
|
31.12.2021
|
|
€ 351.6 bn
|
|
31.12.2020
|
|
€ 329.0 bn
|
|
|
|
|
|
Total Economic Capital
|
|
|
|
31.12.2021
|
|
€ 23.5 bn
|
|
31.12.2020
|
|
€ 28.6 bn
|
|
|
|
|
|
Leverage Exposure
|
|
|
|
31.12.2021
|
|
€ 1,125 bn
|
|
31.12.2020
|
|
€ 1,078 bn
|
|
|
|
|
|
Minimum requirement for own funds and eligible liabilities (MREL)
|
||
|
31.12.2021 ¹
|
|
32.7%
|
|
31.12.2020 ¹
|
|
10.7 %
|
|
|
|
|
|
|
|
|
|
|
|
|
|
Stressed Net Liquidity Position (sNLP)
|
|
|
|
31.12.2021
|
|
€ 47.6 bn
|
|
31.12.2020
|
|
€ 43.0 bn
|
|
|
|
|
|
Net Stable Funding Ratio (NSFR)²
|
|
|
|
31.12.2021
|
|
121 %
|
|
|
|
|
|
|
|
|
1
For Dec 31, 2021 as percentage of RWA (requirement including the combined buffer requirement) and for Dec 31, 2020 as percentage of TLOF.
2
The NSFR has been newly introduced as a minimum ratio by the CRR amendments effective June 28, 2021; therefore, no comparative is shown.
Moreover, we regularly assess the potential impacts of risks on our balance sheet and profitability through portfolio reviews and stress tests. Stress tests are also used to test the resilience of Deutsche Bank’s strategic plans. The results of these tests indicate that the currently available capital and liquidity reserves, in combination with available mitigation measures, are sufficient to withstand periods of potential stress.
We conclude that the risks, as described above or in the following sections, to which Deutsche Bank is exposed to, including potential impacts on our business strategy, provide a true and fair picture of our risk profile.
For further details please refer to sections “Risk profile”, “Risk appetite and capacity”, “Risk and capital plan”, “Stress testing”, “Recovery and resolution planning”, “Risk and capital management”, “Capital, leverage ratio, TLAC and MREL” (for phase-in and fully loaded figures), “Liquidity coverage ratio”, and “Stress testing and scenario analysis”.
59
|
|
Deutsche Bank
|
Operating and Financial Review
|
|
|
Annual Report 2021
|
Deutsche Bank Group
|
|
|
|
|
Risk profile
The table below shows our overall risk position as measured by the economic capital demand calculated for credit, market, operational and strategic risk for the dates specified. To determine our overall economic risk position, we generally consider diversification benefits across risk types.
Overall risk position as measured by economic capital demand by risk type
|
|
|
|
|
|
|
2021 increase (decrease)
from 2020
|
||
|
in € m.
(unless stated otherwise)
|
|
Dec 31, 2021
|
|
Dec 31, 2020
|
|
in € m.
|
|
in %
|
|
Credit risk
|
|
11,725
|
|
11,636
|
|
90
|
|
1
|
|
Market risk
|
|
7,920
|
|
10,894
|
|
(2,974)
|
|
(27)
|
|
Trading market risk
|
|
2,292
|
|
2,198
|
|
94
|
|
4
|
|
Nontrading market risk
|
|
5,628
|
|
8,696
|
|
(3,068)
|
|
(35)
|
|
Operational risk
|
|
4,937
|
|
5,512
|
|
(574)
|
|
(10)
|
|
Strategic risk¹
|
|
3,173
|
|
5,949
|
|
(2,776)
|
|
(47)
|
|
Diversification benefit²
|
|
(4,213)
|
|
(5,429)
|
|
1,216
|
|
(22)
|
|
Total economic capital demand
|
|
23,542
|
|
28,560
|
|
(5,018)
|
|
(18)
|
|
|
|
|
|
|
|
|
|
|
1
Formerly reported as business risk. This category includes the model output for strategic risk and tax risk, as well as capital charges for risk related to software assets and IFRS deferred tax assets on temporary differences.
2
Diversification benefit across credit, market, operational and strategic risk.
As of December 31, 2021, our economic capital demand amounted to € 23.5 billion, which was € 5.0 billion or 18 % lower than € 28.6 billion economic capital demand as of December 31, 2020.
The credit risk economic capital usage totaled € 11.7 billion as of December 31, 2021, which was € 0.1 billion or 1 % higher compared to year-end 2020. The increase was primarily driven by the qualified adoption of the results of the ECB’s Targeted Review of Internal Models (TRIM), which was partially offset by lower transfer and settlement risk.
The economic capital demand for market risk totaled € 7.9 billion as of December 31, 2021, which was € 3.0 billion or 27 % lower compared to year-end 2020. The decrease was driven by nontrading market risk mainly due to reductions in the interest rates exposure in the strategic liquidity reserve bond portfolio, as well as by changes in the calculation methodology for the equity investment portfolio.
The operational risk economic capital usage totaled € 4.9 billion as of December 31, 2021, which was € 0.6 billion or 10 % lower than the € 5.5 billion economic capital usage as of December 31, 2020. In line with the development of our RWA for operational risk, the decrease was largely driven by a lighter internal loss profile, in particular lower loss frequency feeding into our capital model. For a detailed description see the section “Operational risk management”.
The strategic risk category captures the economic capital arising from the strategic risk model (which also implicitly includes elements of nonstandard risks such as reputational risk), the tax risk model, and capital charges for the risk related to software assets and IFRS deferred tax assets on temporary differences. The economic capital for strategic risk decreased to € 3.2 billion as of December 31, 2021 which was € 2.8 billion or 47 % lower compared to € 5.9 billion as of December 31, 2020, which primarily reflects the improvement in the earnings outlook supported by the execution of Deutsche Bank’s transformation.
The inter-risk diversification benefit of the economic capital demand across credit, market, operational and strategic risk totaled € 4.2 billion as of December 31, 2021, which was € 1.2 billion or 22% lower compared to year-end 2020. This decrease mainly reflects changes in the underlying risk type profile.
Our mix of business activities results in diverse risk taking by our business divisions. We also measure the key risks inherent in their respective business models through the total economic capital metric, which mirrors each business division’s risk profile and takes into account cross-risk effects at group level.
60
|
|
Deutsche Bank
|
Operating and Financial Review
|
|
|
Annual Report 2021
|
Deutsche Bank Group
|
|
|
|
|
Risk profile of our business divisions as measured by economic capital
|
|
|
Dec 31, 2021
|
||||||||||||||
|
in € m. (unless
stated otherwise)
|
|
Corporate Bank
|
|
Investment Bank
|
|
Private Bank
|
|
Asset Management
|
|
Capital Release Unit
|
|
Corporate Other
|
|
Total
|
|
Total
(in %)
|
|
Credit risk
|
|
2,984
|
|
4,869
|
|
2,519
|
|
60
|
|
376
|
|
917
|
|
11,725
|
|
50
|
|
Market risk
|
|
306
|
|
2,094
|
|
570
|
|
83
|
|
140
|
|
4,728
|
|
7,920
|
|
34
|
|
Operational risk
|
|
446
|
|
2,002
|
|
602
|
|
269
|
|
1,619
|
|
0
|
|
4,937
|
|
21
|
|
Strategic risk¹
|
|
242
|
|
10
|
|
32
|
|
0
|
|
1
|
|
2,888
|
|
3,173
|
|
13
|
|
Diversification benefit²
|
|
(478)
|
|
(1,533)
|
|
(540)
|
|
(145)
|
|
(826)
|
|
(693)
|
|
(4,213)
|
|
(18)
|
|
Total EC
|
|
3,500
|
|
7,442
|
|
3,183
|
|
267
|
|
1,309
|
|
7,840
|
|
23,542
|
|
100
|
|
Total EC in %
|
|
15
|
|
32
|
|
14
|
|
1
|
|
6
|
|
33
|
|
100
|
|
N/M
|
|
|
|
|
|
|
|
|
|
|
|
|
|
|
|
|
|
|
N/M – Not meaningful
1
Formerly reported as business risk. This category includes the model output for strategic risk and tax risk, as well as capital charges for risk related to software assets and IFRS deferred tax assets on temporary differences.
2
Diversification benefit across credit, market, operational and strategic risk.
|
|
|
Dec 31, 2020³
|
||||||||||||||
|
in € m. (unless
stated otherwise)
|
|
Corporate Bank
|
|
Investment Bank
|
|
Private Bank
|
|
Asset Management
|
|
Capital Release Unit
|
|
Corporate Other
|
|
Total
|
|
Total
(in %)
|
|
Credit risk
|
|
2,593
|
|
4,669
|
|
2,404
|
|
60
|
|
648
|
|
1,262
|
|
11,636
|
|
41
|
|
Market risk
|
|
836
|
|
2,355
|
|
1,170
|
|
420
|
|
235
|
|
5,877
|
|
10,894
|
|
38
|
|
Operational risk
|
|
482
|
|
2,169
|
|
646
|
|
284
|
|
1,930
|
|
0
|
|
5,512
|
|
19
|
|
Strategic risk¹
|
|
193
|
|
2,767
|
|
80
|
|
0
|
|
0
|
|
2,909
|
|
5,949
|
|
21
|
|
Diversification benefit²
|
|
(471)
|
|
(2,455)
|
|
(534)
|
|
(180)
|
|
(982)
|
|
(808)
|
|
(5,429)
|
|
(19)
|
|
Total EC
|
|
3,634
|
|
9,506
|
|
3,766
|
|
584
|
|
1,831
|
|
9,239
|
|
28,560
|
|
100
|
|
Total EC in %
|
|
13
|
|
33
|
|
13
|
|
2
|
|
6
|
|
32
|
|
100
|
|
N/M
|
|
|
|
|
|
|
|
|
|
|
|
|
|
|
|
|
|
|
N/M – Not meaningful
1
Formerly reported as business risk. This category includes the model output for strategic risk and tax risk, as well as capital charges for risk related to software assets and IFRS deferred tax assets on temporary differences.
2
Diversification benefit across credit, market, operational and strategic risk.
3
Risk amounts allocated to the business segments have been restated to reflect comparatives according to the structure as of December 31, 2021.
The Corporate Bank’s risk profile is dominated by its Trade Finance, Commercial Banking and Cash Management products and services offered. Economic capital demand largely arises from credit risk and is predominantly driven by the Trade Finance and Commercial Clients businesses. The economic capital demand for the Corporate Bank decreased by € 0.1 billion in comparison to year-end 2020 mainly as a result of lower market risk, partly offset by higher credit risk. The economic capital demand for market risk decreased by € 0.5 billion over the year mainly due to impact on the allocations to all businesses from the changes in the calculation methodology for the equity investment portfolio. The economic capital demand for credit risk as of December 31, 2021 was € 0.4 billion higher compared to year-end 2020 mainly driven by growth in Trade Finance and Strategic Corporate Lending. The economic capital demand for operational and strategic risk in the Corporate Bank remained fairly stable compared to year-end 2020.
The Investment Bank’s risk profile is dominated by its trading activities to support origination, structuring and market making activities, which give rise to all major risk types. Credit risk in Investment Bank is broadly distributed across business units but most prominent in Global Credit Trading, Rates and Leveraged Debt Capital Markets. Market risk arises mainly from trading and market making activities. The remainder of Investment Bank’s risk profile is largely derived from strategic risk reflecting earnings volatility risk. The economic capital demand for the Investment Bank decreased by € 2.1 billion in comparison to year-end 2020 as a result of lower strategic risk, market risk, and operational risk. Economic capital demand for strategic risk decreased by € 2.8 billion year-on-year driven by the improvement in the earnings outlook supported by the execution of Deutsche Bank’s transformation. The economic capital demand for market risk decreased by € 0.3 billion over the year mainly due to impact on the allocations to all businesses from the changes in the calculation methodology for the equity investment portfolio. The economic capital demand for operational risk decreased by € 0.2 billion mainly driven be a lighter internal loss profile, in particular a lower loss frequency. These reductions were partially offset by € 0.2 billion higher economic capital demand for credit risk mainly driven by Global Credit Trading and reduced inter-risk diversification benefit of € 0.9 billion compared to year-end 2020.
The Private Bank’s risk profile comprises business with German retail, international retail and business clients as well as wealth management clients generating credit risks as well as non-trading market risks from investment risk, modelling of client deposits and credit spread risk. The economic capital demand for the Private Bank decreased by € 0.6 billion in comparison to year-end 2020. The decrease was mainly driven by a reduction in market risk of € 0.6 billion due to the transfer of the liquidity reserve portfolio to Group Treasury within the Corporate Other division at the beginning of 2021. The economic capital for operational and strategic risks shows minor reductions over the year due to higher diversification effects with other divisions. These decreases were partially offset by an increase in credit risk as a result of portfolio growth and methodology changes related to new definition of default regulation.
61
|
|
Deutsche Bank
|
Operating and Financial Review
|
|
|
Annual Report 2021
|
Deutsche Bank Group
|
|
|
|
|
Asset Management, as a fiduciary asset manager, invests money on behalf of clients. As such, the main risk drivers are non-financial. The economic capital demand for market risk is mainly driven by non-trading market risks, which arise from guarantee products and co-investments in the funds. The economic capital demand for Asset Management decreased by € 0.3 billion compared to previous year mainly driven by methodological enhancements in market risk models that have impacted the allocations to the businesses and by a slight reduction in operational risk. This was partially offset by a reduction in the diversification benefit.
The Capital Release Unit continued to exit and run down non-strategic assets over 2021. The de-risking across risk types achieved throughout the year led to a reduction in economic capital demand of € 0.5 billion compared to year-end 2020. The aforementioned decrease was partly offset by a reduced diversification benefit as a result of portfolio reduction in size and complexity.
Corporate Other’s risk profile mainly comprises non-trading market risks from structural foreign exchange risk, pension risk and equity compensation risk, as well as strategic risk from the tax risk model and capital charges related to software assets and IFRS deferred tax assets on temporary differences. The economic capital demand for Corporate Other decreased by € 1.4 billion in comparison to year-end 2020 mainly due the rebalancing of our strategic liquidity reserve in response to market conditions.
Risk and capital framework
Risk management principles
Our business model inherently involves taking risks. Risks can be financial and non-financial and include on and off-balance sheet risks. Our objective is to create sustainable value in the interests of the company taking into consideration shareholders, employees and other company related stakeholders. The risk management framework contributes to this by aligning our planned and actual risk taking with our risk appetite as expressed by the Management Board, while being in line with our available capital and liquidity.
Our risk management framework consists of various components. Principles and standards are set for each component:
- – Organizational structures must follow the Three Lines of Defense (“3LoD”) model with a clear definition of roles and responsibilities for all risk types.
- – The 1st Line of Defense (“1st LoD”) refers to those roles in the Bank whose activities generate risks, whether financial or non-financial, and who own and are accountable for these risks. The 1st LoD manages these risks within the defined risk appetite, establishes an appropriate risk governance and risk culture, and adheres to the risk type frameworks defined by the 2nd Line of Defense (“2nd LoD”).
- – The 2nd LoD refers to the roles in the Bank who define the risk management framework for a specific risk type. The 2nd LoD independently assesses and challenges the implementation of the risk type framework and adherence to the risk appetite, and acts as an advisor to the 1st LoD on how to identify, assess and manage risks.
- – The 3rd Line of Defense (“3rd LoD”) is Group Audit, which is accountable for providing independent and objective assurance on the adequacy of the design, operating effectiveness and efficiency of the risk management system and systems of internal control.
- – Every employee must act as a risk manager consistent with our risk appetite, risk management standards and values.
- – The Management Board approved risk appetite must be cascaded and adhered to across all dimensions of the Group, with appropriate consequences in the event of a breach.
- – Risks must be identified and assessed.
- – Risks must be actively managed including appropriate risk mitigation and effective internal control systems.
- – Risks must be measured and reported using accurate, complete and timely data using approved models.
- – Regular stress tests must be performed against adverse scenarios and appropriate crisis response planning must be established.
We promote a strong risk culture where every employee must fully understand and take a holistic view of the risks which could result from their actions, understand the consequences and manage them appropriately against our risk appetite. We expect employees to exhibit behaviors that support a strong risk culture in line with our Code of Conduct. To promote this, our policies require that risks taken (including against risk appetite) must be taken into account during our performance assessment and compensation processes. This expectation continues to be reinforced through communications campaigns and mandatory training courses for all Deutsche Bank employees. In addition, our Management Board members and senior management frequently communicate the importance of a strong risk culture to support a consistent tone from the top.
62
|
|
Deutsche Bank
|
Operating and Financial Review
|
|
|
Annual Report 2021
|
Deutsche Bank Group
|
|
|
|
|
Risk governance
Our operations throughout the world are regulated and supervised by relevant authorities in each of the jurisdictions in which we conduct business. Such regulation focuses on licensing, capital adequacy, liquidity, risk concentration, conduct of business as well as organizational and reporting requirements. The European Central Bank (the “ECB”) in connection with the competent authorities of EU countries which joined the Single Supervisory Mechanism via the Joint Supervisory Team act in cooperation as our primary supervisors to monitor our compliance with the German Banking Act and other applicable laws and regulations.
Several layers of management provide cohesive risk governance:
-
–
The Supervisory Board is informed regularly on our risk situation, risk management and risk controlling, including reputational risk related items as well as material litigation cases. It has formed various committees to handle specific topics (for a detailed description of these committees, please see the “Corporate Governance Report” under “Management Board and Supervisory Board”, “Standing Committees”).
- – At the meetings of the Risk Committee, the Management Board reports on current and forward-looking risk exposures, portfolios, on risk appetite and strategy and on matters deemed relevant for the assessment and oversight of the risk situation of Deutsche Bank AG. It also reports on loans requiring a Supervisory Board resolution pursuant to law or the Articles of Association. The Risk Committee advises on issues related to the overall risk appetite, aggregate risk position and the risk strategy and keeps the Supervisory Board informed of its activities.
- – The Integrity Committee, among other responsibilities, advises and monitors the Management Board with regard to the management’s commitment to an economically sound, sustainable development of the company, monitors the Management Board’s measures that promote the company’s compliance with legal requirements, authorities’ regulations and the company’s own policies, including risk policies. It also reviews the Bank’s codes of conduct and ethics, and, upon request, supports the Risk Committee in monitoring and analyzing the Bank’s legal and reputational risks.
- – The Audit Committee, among other matters, monitors the effectiveness of the risk management system, particularly the internal control system and the internal audit system.
- – The Management Board is responsible for managing Deutsche Bank Group in accordance with the law, the Articles of Association and its Terms of Reference with the objective of creating sustainable value in the interest of the company, thus taking into consideration the interests of the shareholders, employees and other company related stakeholders. The Management Board is responsible for ensuring a proper business organization, encompassing appropriate and effective risk management, as well as compliance with legal requirements and internal guidelines. The Management Board established the Group Risk Committee (“GRC”) as the central forum for review and decision on material risk and capital-related topics. The GRC generally meets once a week. It has delegated some of its duties to individuals and sub-committees. The GRC and its sub-committees are described in more detail below.
63
|
|
Deutsche Bank
|
Operating and Financial Review
|
|
|
Annual Report 2021
|
Deutsche Bank Group
|
|
|
|
|
Risk management governance structure of the Deutsche Bank Group
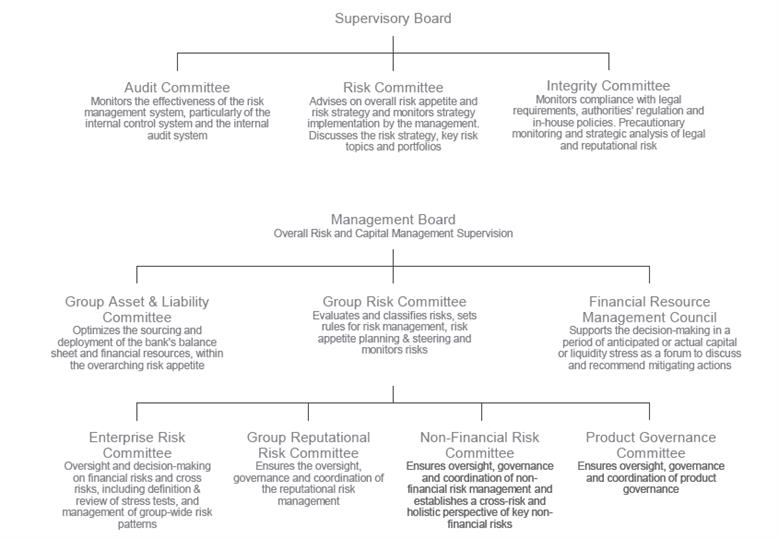
The following functional committees are central to the management of risk at Deutsche Bank:
64
|
|
Deutsche Bank
|
Operating and Financial Review
|
|
|
Annual Report 2021
|
Deutsche Bank Group
|
|
|
|
|
-
–
The Group Risk Committee (GRC) has various duties and dedicated authority, including approval of new or materially changed risk and capital models and review of the inventory of risks, high-level risk portfolios, risk exposure developments, and internal and regulatory Group-wide stress testing results. In addition, the GRC reviews and recommends items for Management Board approval, such as key risk management principles, the Group Risk Appetite Statement, the Group Recovery Plan and the Contingency Funding Plan, over-arching risk appetite parameters, and recovery and escalation indicators. The GRC also supports the Management Board during Group-wide risk and capital planning processes.
- – The Non-Financial Risk Committee (NFRC) oversees, governs and coordinates the management of non-financial risks in Deutsche Bank Group and establishes a cross-risk and holistic perspective of the key non-financial risks of the Group, including conduct and financial crime risk. It is tasked to define the non-financial risk appetite tolerance framework, to monitor and control the effectiveness of the non-financial risk operating model (including interdependencies between business divisions and control functions), and to monitor the development of emerging non-financial risks relevant for the Group.
- – The Group Reputational Risk Committee (GRRC) is responsible for the oversight, governance and coordination of reputational risk management and provides for a look-back and a lessons learnt process. It reviews and decides all reputational risk issues escalated by the Regional Reputational Risk Committees (RRRCs) and RRRC decisions which have been appealed by the business divisions, infrastructure functions or regional management. It provides guidance on Group-wide reputational risk matters, including communication of sensitive topics, to the appropriate levels of Deutsche Bank Group. The RRRCs which are sub-committees of the GRRC, are responsible for the oversight, governance and coordination of the management of reputational risk in the respective regions on behalf of the Management Board.
- – The Enterprise Risk Committee (ERC) has been established with a mandate to focus on enterprise-wide risk trends, events and cross-risk portfolios, bringing together risk experts from various risk disciplines. As part of its mandate, the ERC approves the group risk inventory, certain country and industry threshold increases, and scenario design outlines for more severe group-wide stress tests as well as reverse stress tests. It reviews group-wide stress test results in accordance with risk appetite, reviews the risk outlook, emerging risks and topics with enterprise-wide risk implications.
- – The Product Governance Committee has the mandate to ensure that there is appropriate oversight, governance and coordination of Product Governance in the Group by establishing a cross-risk and holistic perspective of key financial and non-financial risks associated with products and transactions throughout the lifecycle.
- – The Financial Resource Management Council (FRMC) is an ad-hoc governance body, chaired by the Chief Financial Officer and the Chief Risk Officer with delegated authority from the Management Board, to oversee financial crisis management at the bank. The FRMC provides a single forum to oversee execution of both the Contingency Funding Plan and the Group Recovery Plan. The council recommends upon mitigating actions to be taken in a time of anticipated or actual capital or liquidity stress. Specifically, the FRMC is tasked with analyzing the bank’s capital and liquidity position, in anticipation of a stress scenario recommending proposals for capital and liquidity related matters, and oversee execution of decisions.
- – The Group Asset Liability Committee has been established by the Management Board. Its mandate is to optimize the sourcing and deployment of the bank’s balance sheet and financial resources within the overarching risk appetite set by the Management Board.
Our Chief Risk Officer (CRO), who is a member of the Management Board, has Group-wide, supra-divisional responsibility for establishing a risk management framework with appropriate identification, measurement, monitoring, mitigation and reporting of liquidity, credit, market, enterprise, model and non-financial risks (including operational and reputational). However, frameworks for certain risks are established by other functions as per the business allocation plan.
The CRO has direct management responsibility for the CRO function. Risk management control duties in the CRO function are generally assigned to specialized risk management units focusing on the management of
- – Specific risk types
- – Risks within a specific business
- – Risks in a specific region.
These specialized risk management units generally handle the following core tasks:
- – Foster consistency with the risk appetite set by the Management Board and applied to Business Divisions and their Business Units;
- – Determine and implement risk and capital management policies, procedures and methodologies that are appropriate to the businesses within each division;
- – Establish and approve risk limits;
- – Conduct periodic portfolio reviews to keep the portfolio of risks within acceptable parameters; and
- – Develop and implement risk and capital management infrastructures and systems that are appropriate for each division.
Chief Risk Officers for each business division, having a holistic view of the respective business, challenge and influence the divisions’ strategies, risk awareness and ownership as well as their adherence to risk appetite.
Responsibility for Compliance and Anti-Financial Crime has transferred from the Chief Risk Officer to the Chief Administrative Officer in the first half of 2021.
While operating independently from each other and the business divisions, our Finance and Risk functions have the joint responsibility to quantify and verify the risk that we assume.
Risk appetite and capacity
Risk appetite expresses the aggregate level and types of risk that we are willing to assume to achieve our strategic objectives, as defined by a set of quantitative metrics and qualitative statements. Risk capacity is defined as the maximum level of risk we can assume given our capital and liquidity base, risk management and control capabilities, and our regulatory constraints.
Risk appetite is an integral element in our business planning processes via our risk strategy and plan, to promote the appropriate alignment of risk, capital and performance targets, while at the same time considering risk capacity and appetite constraints from both financial and non-financial risks. Compliance of the plan with our risk appetite and capacity is also tested under stressed market conditions. Top-down risk appetite serves as the limit for risk-taking for the bottom-up planning from the business functions.
The Management Board reviews and approves our risk appetite and capacity on an annual basis, or more frequently in the event of unexpected changes to the risk environment, with the aim of ensuring that they are consistent with our Group’s strategy, business and regulatory environment and stakeholders’ requirements.
65
|
|
Deutsche Bank
|
Operating and Financial Review
|
|
|
Annual Report 2021
|
Deutsche Bank Group
|
|
|
|
|
In order to determine our risk appetite and capacity, we set different group level triggers and thresholds on a forward-looking basis and define the escalation requirements for further action. We assign risk metrics that are sensitive to the material risks to which we are exposed and which function as indicators of financial health. In addition to that, we link our risk and recovery management governance framework with the risk appetite framework.
Reports relating to our risk profile as compared to our risk appetite and strategy and our monitoring thereof are presented regularly up to the Management Board. In the event that our desired risk appetite is breached, a predefined escalation governance matrix is applied so these breaches are highlighted to the appropriate governance bodies.
Risk and capital plan
Strategic and capital plan
We conduct annually an integrated strategic planning process which lays out the development of our future strategic direction for us as a Group and for our business areas. The strategic plan aims to create a holistic perspective on capital, funding and risk under risk-return considerations. This process translates our long-term strategic targets into measurable short- to medium-term financial targets and enables intra-year performance monitoring and management. Thereby we aim to identify growth options by considering the risks involved and the allocation of available capital resources to drive sustainable performance. Risk-specific portfolio strategies complement this framework and allow for an in-depth implementation of the risk strategy on portfolio level, addressing risk specifics including risk concentrations.
The strategic planning process consists of two phases: a top-down target setting and a bottom-up substantiation.
In a first phase – the top-down target setting – our key targets for profit and loss (including revenues and costs), capital supply, capital demand as well as leverage, funding and liquidity are discussed for the group and the key business areas. In this process, the targets for the next five years are based on our global macro-economic outlook and the expected regulatory framework. Subsequently, the targets are approved by the Management Board.
In a second phase, the top-down objectives are substantiated bottom-up by detailed business unit plans, which consist of a month by month operative plan; years two and three are planned per quarter and years four and five are annual plans. The proposed bottom-up plans are reviewed and challenged by Finance and Risk and are discussed individually with the business heads. Thereby, the specifics of the business are considered and concrete targets decided in line with our strategic direction. The bottom-up plans include targets for key legal entities to review local risk and capitalization levels. Stress tests complement the strategic plan to also consider stressed market conditions.
The resulting Strategic and Capital Plan is presented to the Management Board for discussion and approval. The final plan is presented to the Supervisory Board.
The Strategic and Capital Plan is designed to support our vision of being a leading German bank with strong European roots and a global network and aims to ensure:
- – Balanced risk adjusted performance across business areas and units;
- – High risk management standards with focus on risk concentrations;
- – Compliance with regulatory requirements;
- – Strong capital and liquidity position; and
- – Stable funding and liquidity strategy allowing for business planning within the liquidity risk appetite and regulatory requirements.
The Strategic and Capital Planning process allows us to:
- – Set earnings and key risk and capital adequacy targets considering the bank’s strategic focus and business plans;
- – Assess our capital adequacy with regard to internal and external requirements (i.e., economic capital and regulatory capital); and
- – Apply appropriate stress test analyses’ to assess the impact on capital demand, capital supply and liquidity.
All externally communicated financial targets are monitored on an ongoing basis in appropriate management committees. Any projected shortfall versus targets is discussed together with potential mitigating strategies with the aim to ensure that we remain on track to achieve our targets. Amendments to the strategic and capital plan must be approved by the Management Board. Achieving our externally communicated solvency targets ensures that we also comply with the solvency ratio-related Group Supervisory Review and Evaluation Process (SREP) requirements as articulated by our home supervisor.
66
|
|
Deutsche Bank
|
Operating and Financial Review
|
|
|
Annual Report 2021
|
Deutsche Bank Group
|
|
|
|
|
On December 9, 2019, Deutsche Bank was informed by the ECB of its decision regarding prudential minimum capital requirements for 2020 that applied from January 1, 2020 onwards, following the results of the 2019 SREP. The decision set ECB’s Pillar 2 Requirement (P2R) to 2.50% of RWA, effective as of January 1, 2020. As of December 31, 2021, Deutsche Bank needs to maintain on a consolidated basis a CET 1 ratio of at least 10.43 %, a Tier 1 ratio of at least 12.40 % and a Total Capital ratio of at least 15.03 %. The CET 1 requirement comprises the Pillar 1 minimum capital requirement of 4.50 %, the Pillar 2 requirement (SREP add-on) of 1.41 %, the capital conservation buffer of 2.50 %, the countercyclical buffer (subject to changes throughout the year) of 0.03 % and the higher of our G-SII/O-SII buffer of 2.00 %. Correspondingly, the Tier 1 capital requirement includes additionally a Tier 1 minimum capital requirement of 1.50 % plus a Pillar 2 requirement of 0.47 %, and the Total Capital requirement includes further a Tier 2 minimum capital requirement of 2.00 % and a Pillar 2 requirement of 0.63 %. Also, the ECB communicated to Deutsche Bank that its individual expectation to hold a further Pillar 2 CET 1 capital add-on, commonly referred to as ‘Pillar 2 guidance’ will be seen as guidance only and – until at least year-end 2022 – a breach of this guidance will not trigger the need to provide a capital restoration plan or a need to execute measures to re-build CET 1 capital.
In February 2022, the ECB informed us of its decision effective March 1, 2022 that our Pillar 2 Requirement remains unchanged. In 2021, Deutsche Bank has participated in the EBA Stress Test 2021 which was postponed from 2020 due to the COVID-19 pandemic. By its standard procedures, the ECB has considered our quantitative performance in the adverse scenario as an input when reconsidering the level of the Pillar 2 Guidance in its 2021 SREP assessment and our qualitative performance as one aspect when holistically reviewing the Pillar 2 Requirement.
In January 2022, the BaFin announced a countercyclical buffer of 0.75 % for Germany effective February 1, 2023, which translates into approximately 30 bps CET1 capital requirement for Deutsche Bank Group given our current share of German credit exposures. Additionally, the BaFin is considering a sectoral systemic risk buffer of 2 % for German residential real estate exposures effective February 1, 2023. If implemented as considered, this sectoral buffer could increase the CET 1 capital requirement for Deutsche Bank Group by approximately 20 bps, considering our current German residential real estate exposure.
It should be noted that the Financial Stability Board announced in 2019 that our G-SII buffer was reduced to 1.5 % effective from January 1, 2021. This however does not change the Banks’ capital requirements as the O-SII buffer remains at 2.0 %.
Internal capital adequacy assessment process
Deutsche Bank’s internal capital adequacy assessment process (ICAAP) consists of several well-established components which ensure that Deutsche Bank maintains sufficient capital to cover the risks to which the bank is exposed on an ongoing basis:
- – Risk identification and assessment: The risk identification process forms the basis of the ICAAP and results in an inventory of risks for the Group. All risks identified are assessed for their materiality. Further details can be found in section “Risk identification and assessment”.
- – Capital demand/risk measurement: Risk measurement methodologies and models are applied to quantify the regulatory and economic capital demand which is required to cover all material risks except for those which cannot be adequately limited by capital e.g. liquidity risk. Further details can be found in sections “Risk profile” and “Capital, Leverage Ratio, TLAC and MREL”.
- – Capital supply: Capital supply quantification refers to the definition of available capital resources to absorb unexpected losses. Further details can be found in sections “Capital, Leverage Ratio, TLAC and MREL” and “Economic Capital Adequacy”.
- – Risk appetite: Deutsche Bank has established a set of qualitative statements, quantitative metrics and thresholds which express the level of risk that we are willing to assume to achieve our strategic objectives. Threshold breaches are subject to a dedicated governance framework triggering management actions aimed to safeguard capital adequacy. Further details can be found in sections “Risk appetite and capacity” and “Key risk metrics”.
- – Capital planning: The risk appetite thresholds for capital adequacy metrics constitute boundaries which have to be met in the capital plan to safeguard capital adequacy on a forward-looking basis. Further details can be found in section “Strategic and capital plan”.
- – Stress testing: Capital plan figures are also considered under various stress test scenarios to prove resilience and overall viability of the bank. Regulatory and economic capital adequacy metrics are also subject to regular stress tests throughout the year to constantly evaluate Deutsche Bank’s capital position in hypothetical stress scenarios and to detect vulnerabilities under stress. Further details can be found in section “Stress testing”.
- – Capital adequacy assessment: Although capital adequacy is constantly monitored throughout the year, the ICAAP concludes with a dedicated annual capital adequacy statement (CAS). The assessment consists of a Management Board statement about Deutsche Bank’s capital adequacy, which is linked to specific conclusions and management actions to be taken to safeguard capital adequacy on a forward-looking basis.
67
|
|
Deutsche Bank
|
Operating and Financial Review
|
|
|
Annual Report 2021
|
Deutsche Bank Group
|
|
|
|
|
As part of its ICAAP, Deutsche Bank distinguishes between a normative and economic internal perspective. The normative internal perspective refers to a multi-year assessment of the ability to fulfil all capital-related legal requirements and supervisory demands on an ongoing basis under a baseline and adverse scenario. The economic internal perspective refers to an internal process using internal economic capital demand models and an internal economic capital supply definition. Both perspectives focus on maintaining the continuity of Deutsche Bank on an ongoing basis.
Stress testing
Deutsche Bank has implemented a stress test framework to satisfy internal as well as external stress test requirements. The internal stress tests are based on in-house developed methods and inform a variety of risk management use cases (risk type specific as well as cross risk). Internal stress tests form an integral part of our risk management framework complementing traditional risk measures. The cross-risk stress test framework, the Group Wide Stress Test Framework (GWST), serves a variety of bank management processes, in particular the strategic planning process, the ICAAP, the risk appetite framework and capital allocation. Capital plan stress testing is performed to assess the viability of our capital plan in adverse circumstances and to demonstrate a clear link between risk appetite, business strategy, capital plan and stress testing. The regulatory stress tests, e.g. the EBA stress test and the US-based CCAR (Comprehensive Capital Analysis and Review) stress tests, are strictly following the processes and methodologies as prescribed by the regulatory authorities.
Our internal stress tests are performed on a regular basis in order to assess the impact of a severe economic downturn as well as adverse bank-specific events on our risk profile and financial position. Our stress testing framework comprises regular sensitivity-based and scenario-based approaches addressing different severities and regional hotspots. We include all material risk types into our stress testing activities. These activities are complemented by portfolio- and country-specific downside analysis as well as further regulatory requirements, such as annual reverse stress tests and additional stress tests requested by our regulators on group or legal entity level. Our methodologies undergo regular scrutiny from Deutsche Bank’s internal validation team (Model Risk Management) whether they correctly capture the impact of a given stress scenario.
The initial phase of our cross-risk stress test consists of defining a macroeconomic downturn scenario by ERM Risk Research in cooperation with business specialists through a formal governance forum Scenario Design Council. ERM Risk Research monitors the political and economic development around the world and maintains a macro-economic heat map that identifies potentially harmful scenarios. Based on quantitative models and expert judgments, economic parameters such as foreign exchange rates, interest rates, GDP growth or unemployment rates are set accordingly to reflect the impact on our business. The scenario parameters are translated into specific risk drivers by subject matter experts in the risk units. Based on our internal models’ framework for stress testing, the following major metrics are calculated under stress: risk-weighted assets, impacts on profit and loss and economic capital by risk type. These results are aggregated at the Group level, and key metrics such as the CET 1 ratio, ECA ratio, MREL ratio and Leverage Ratio under stress are derived. Stress impacts on the Liquidity Coverage Ratio (LCR) and the Liquidity Reserve are also considered. The time-horizon of internal stress tests is between one and five years, depending on the use case and scenario assumptions. The Enterprise Risk Committee (ERC) reviews the final stress results. After comparing these results against our defined risk appetite, the ERC also discusses specific mitigation actions to remediate the stress impact in alignment with the overall strategic and capital plan if certain limits are breached. The results also feed into the recovery planning which is crucial for the recoverability of the Bank in times of crisis. The outcome is presented to senior management up to the Management Board to raise awareness on the highest level as it provides key insights into specific business vulnerabilities and contributes to the overall risk profile assessment of the bank.
The group wide stress tests performed in 2021 indicated that the bank’s capitalization together with available mitigation measures as defined in the Group Recovery Plan allow it to reach the internally set stress exit level.
The cross-risk reverse stress test leverages the GWST framework and is typically performed annually in order to challenge our business model by determining scenarios which would cause us to become unviable. Such a reverse stress test is based on a hypothetical macroeconomic scenario enriched by idiosyncratic events based on the top risks monitored by each risk type. Comparing such a hypothetical scenario resulting in the Bank’s non-viability to the current economic environment, we consider the probability of occurrence of such a hypothetical stress scenario as extremely low. Given this, we do not believe that our business continuity is at risk.
Starting end of 2020, we have further strengthened our framework by increasing the frequency of our Risk Appetite scenario to monthly thereby enabling a more rigorous risk appetite monitoring.
In addition to the GWST that includes all material risk types and major revenue streams, we have individual stress test programs in place for all relevant risk metrics in line with regulatory requirements. For the relevant stress test programs, we refer to the sections describing the individual risk management methods.
Deutsche Bank also took part in two major regulatory stress tests performed in 2021 i.e. the bi-annual European EBA stress test as well as the US-based CCAR stress test, as implemented pursuant to the US Dodd-Frank Act.
68
|
|
Deutsche Bank
|
Operating and Financial Review
|
|
|
Annual Report 2021
|
Deutsche Bank Group
|
|
|
|
|
GWST framework of Deutsche Bank Group
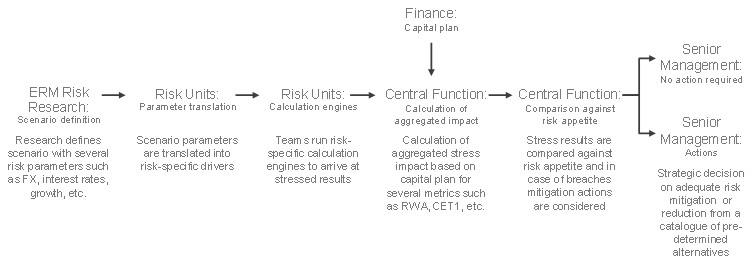
Risk measurement and reporting systems
Our risk measurement systems support regulatory reporting and external disclosures, as well as internal management reporting across credit, market, liquidity, operational, reputational, enterprise and model risks. The risk infrastructure incorporates the relevant legal entities and business divisions and provides the basis for reporting on risk positions, capital adequacy and limit, threshold or target utilization to the relevant functions on a regular and ad-hoc basis. Established units within the CFO and CRO-Function assume responsibility for measurement, analysis and reporting of risk while promoting sufficient quality and integrity of risk-related data. Our risk management systems are reviewed by Group Audit following a risk-based audit approach.
Deutsche Bank’s reporting is an integral part of Deutsche Bank’s risk management approach and as such aligns with the organizational setup by delivering consistent information on Group level and for material legal entities as well as breakdowns by risk types, business division and material business units.
The following principles guide Deutsche Bank’s “risk measurement and reporting” practices:
- – Deutsche Bank monitors risks taken against risk appetite and risk-reward considerations on various levels across the Group, e.g. Group, business divisions, material business units, material legal entities, risk types, portfolio and counterparty levels.
- – Risk reporting is required to be accurate, clear, useful and complete and must convey reconciled and validated risk data to communicate information in a concise manner to ensure, across material Financial and Non-Financial Risks, the bank’s risk profile is clearly understood.
- – Senior risk committees, such as the Enterprise Risk Committee (ERC) and the Group Risk Committee (GRC), as well as the Management Board who are responsible for risk and capital management receive regular reporting (as well as ad-hoc reporting as required).
- – Dedicated teams within Deutsche Bank proactively manage material Financial and Non-Financial Risks and must ensure that required management information is in place to enable proactive identification and management of risks and avoid undue concentrations within a specific Risk Type and across risks (Cross-Risk view).
In applying the previously mentioned principles, Deutsche Bank maintains a common basis for all risk reports and aims to minimize segregated reporting efforts to allow Deutsche Bank to provide consistent information, which only differs by granularity and audience focus.
The Bank identifies a large number of metrics within its risk measurement systems which support regulatory reporting and external disclosures, as well as internal management reporting across risks and for material risk types. Deutsche Bank designates a subset of those as “Key Risk Metrics” that represent the most critical ones for which the Bank places an appetite, limit, threshold or target at Group level and / or are reported routinely to senior management for discussion or decision making. The identified Key Risk Metrics include Capital Adequacy and Liquidity metrics; further details can be found in the section “Key risk metrics”
.
69
|
|
Deutsche Bank
|
Operating and Financial Review
|
|
|
Annual Report 2021
|
Deutsche Bank Group
|
|
|
|
|
While a large number of reports are used across the Bank, Deutsche Bank designates a subset of these as “Key Risk Reports” that are critical to support Deutsche Bank’s Risk Management Framework through the provision of risk information to senior management and therefore enable the relevant governing bodies to monitor, steer and control the Bank’s risk taking activities effectively. To ensure that Key Risk Reports meet recipients’ requirements, report producing functions regularly check whether the Key Risk Reports are clear and useful.
The main reports on risk and capital management that are used to provide Deutsche Bank’s central governance bodies with information relating to the Group risk profile are the following:
- – The monthly Risk and Capital Profile (RCP) report is a Cross-Risk report, provides a comprehensive view of Deutsche Bank’s risk profile and is used to inform the ERC, the GRC as well as the Management Board and subsequently the Risk Committee of the Supervisory Board. The RCP includes Risk Type specific and Business-Aligned overviews and Enterprise-wide risk topics. It also includes updates on Key Group Risk Appetite Metrics and other Key Portfolio Risk Type Control Metrics as well as updates on Key Risk Developments, highlighting areas of particular interest with updates on corresponding risk management strategies.
- – The Weekly Risk Report (WRR) is a weekly briefing covering high-level topical issues across key risk areas and is submitted every Friday to the Members of the ERC, the GRC and the Management Board and subsequently to the Members of the Risk Committee of the Supervisory Board. The WRR is characterized by the ad-hoc nature of its commentary as well as coverage of themes and focuses on more volatile risk metrics.
- – Deutsche Bank runs several Group-wide macroeconomic stress tests. A monthly Risk Appetite scenario serves the purpose to set and regularly monitor our stress loss appetite. In addition, there are topical scenarios (typically once per quarter) which are reported to and discussed in the ERC and escalated to the GRC if deemed necessary. The stressed key performance indicators are benchmarked against the Group Risk Appetite thresholds.
While the above reports are used at a Group level to monitor and review the risk profile of Deutsche Bank holistically, there are other, supplementing standard and ad-hoc management reports, including for Risk Types or Focus Portfolios, which are used to monitor and control the risk profile.
Recovery and resolution planning
In the EU, the Single Resolution Mechanism Regulation (“SRM Regulation”) and the Bank Recovery and Resolution Directive (“BRRD”) aim at reducing the likelihood of another financial crisis, enhance the resilience of institutions under stress, and eventually support the long-term stability of the financial systems without exposing taxpayers’ money to losses.
In line with the provisions of the SRM Regulation and the BRRD (which were mainly implemented in Germany by the German Recovery and Resolution Act (Sanierungs- und Abwicklungsgesetz – “SAG”)), we maintain our recovery and resolution planning framework designed to identify and manage the impact of adverse events in a timely and coordinated manner.
We maintain a Group recovery plan which is approved by the Management Board. The latest submission in 2021 includes, inter alia:
- – Updated overall recovery capacity which has been assessed against two severe stress scenarios and is deemed sufficient to withstand severe capital and liquidity stress; and
- – All Recovery metrics levels have been aligned to the new Group risk appetite and new recovery / early warning metrics have been added.
The Group resolution plan on the other hand is prepared by the resolution authorities, rather than by the bank itself. We work closely with the Single Resolution Board (SRB) and the Bundesanstalt für Finanzdienstleistungsaufsicht (“BaFin”) who establish the Group resolution plan for Deutsche Bank, which is currently based on a single point of entry (SPE) bail-in as the preferred resolution strategy. Under the SPE bail-in strategy, the parent entity Deutsche Bank AG would be recapitalized through a write-down and/or conversion to equity of capital instruments (Common Equity Tier 1, Additional Tier 1, Tier 2) and other eligible liabilities in order to stabilize the Group. Within one month after the application of the bail-in tool to recapitalize an institution, the BRRD (as implemented in the SAG) requires such institution to prepare a business reorganization plan, addressing the causes of failure and aiming to restore the institution's long-term viability. To further support and improve operational continuity of the bank for resolution planning purposes, DB has largely completed additional preparations, such as adding termination stay clauses into client financial agreements governed by non-EU law and including continuity provisions into key service agreements. Financial contracts and service agreements governed by EU law are already covered by statutory laws which prevent termination solely due to any resolution measure.
70
|
|
Deutsche Bank
|
Operating and Financial Review
|
|
|
Annual Report 2021
|
Deutsche Bank Group
|
|
|
|
|
The BRRD requires banks in EU member states to maintain minimum requirements for own funds and eligible liabilities (“MREL”) to make resolution credible by establishing sufficient loss absorption and recapitalization capacity. Apart from MREL-requirements, Deutsche Bank, as a global systemically important bank, is subject to global minimum standards for Total Loss-Absorbing Capacity (“TLAC”), which set out strict requirements for the amount and eligibility of instruments to be maintained for bail-in purposes. In particular, TLAC instruments must be subordinated (including so-called senior “non-preferred” debt, but also in the form of regulatory capital instruments) to other senior liabilities. This ensures that a bail-in would be applied first to equity and TLAC instruments, which must be exhausted before a bail-in may affect other senior (“preferred”) liabilities such as senior preferred plain vanilla bonds, debt instruments that are “structured”, deposits and derivatives.
In the United States, Deutsche Bank AG is required under Title I of the Dodd-Frank Wall Street Reform and Consumer Protection Act (the “Dodd-Frank Act”), as amended, to prepare and submit to the Federal Reserve Board and the Federal Deposit Insurance Corporation (“FDIC”) either a full or targeted resolution plan (the “U.S. Resolution Plan”) on a timeline prescribed by such agencies. The U.S. Resolution Plan must demonstrate that Deutsche Bank AG has the ability to execute and implement a strategy for the orderly resolution of its designated material U.S. entities and operations. For foreign-based companies subject to these resolution planning requirements such as Deutsche Bank AG, the U.S. Resolution Plan relates only to subsidiaries, branches, agencies and businesses that are domiciled in or whose activities are carried out in whole or in material part in the United States.
Deutsche Bank AG filed its most recent U.S. Resolution Plan in December 2021 and is currently awaiting written regulatory feedback. This targeted resolution plan submission provides detailed information on our U.S. Resolution Strategy, our resolution capabilities in the U.S., material changes made to our U.S. Resolution Plan since the last full submission in 2018, as well as certain additional information. Deutsche Bank’s next full U.S. Resolution Plan is due in 2024.
Risk and Capital Management
Capital management
Our Treasury function manages solvency, capital adequacy, leverage and bail-in capacity ratios at Group level and locally in each region, as applicable. Treasury implements our capital strategy, which itself is developed by the Group Risk Committee and approved by the Management Board. Treasury, directly or through the Group Asset and Liability Committee, manages, among other things, issuance and repurchase of shares and capital instruments, hedging of capital ratios against foreign exchange swings, setting capacities for key financial resources, the design of shareholders’ equity allocation, and regional capital planning. We are fully committed to maintaining our sound capitalization both from an economic and regulatory perspective. We continuously monitor and adjust our overall capital demand and supply in an effort to achieve an appropriate balance of the economic and regulatory considerations at all times and from all perspectives. These perspectives include book equity based on IFRS accounting standards, regulatory and economic capital as well as specific capital requirements from rating agencies.
Treasury manages the issuance and repurchase of capital instruments, namely Common Equity Tier 1, Additional Tier 1 and Tier 2 capital instruments as well as TLAC/MREL eligible debt instruments. Treasury constantly monitors the market for liability management trades. Such trades represent a countercyclical opportunity to create Common Equity Tier 1 capital by buying back our issuances below par.
Treasury manages the sensitivity of our CET 1 ratio and capital towards swings in foreign currency exchange rates against the euro. For this purpose, Treasury proposes and the Management Board determines which currencies are to be hedged. On this basis and within the constraints of a Management Board approved Risk Appetite for CET 1 ratio sensitivity and absolute capital loss risk, Treasury develops and executes suitable hedging strategies. The capital invested into our foreign subsidiaries and branches is either not hedged, partially hedged or fully hedged, balancing the effects from capital, capital deduction items and risk weighted assets in foreign currency.
Resource limit setting
Usage of key financial resources is influenced through the following governance processes and incentives.
Target resource capacities are reviewed in our annual strategic plan in line with our CET 1 and Leverage Ratio ambitions. As a part of our quarterly process, the Group Asset and Liability Committee approves divisional resource limits for total capital demand (defined as the sum of Risk Weighted Assets (RWA) and certain RWA equivalents of Capital Deduction Items) and leverage exposure that are based on the strategic plan but adjusted for market conditions and the short-term outlook. Limits are enforced through a close monitoring process and an excess charging mechanism.
71
|
|
Deutsche Bank
|
Operating and Financial Review
|
|
|
Annual Report 2021
|
Deutsche Bank Group
|
|
|
|
|
Overall regulatory capital requirements are principally driven by either our CET 1 ratio (solvency) or leverage ratio (leverage) requirements, whichever is the more binding constraint. For the internal capital allocation, the combined contribution of each segment to the Group’s Common Equity Tier 1 ratio, the Group’s Leverage ratio and the Group’s Capital Loss under Stress are weighted to reflect their relative importance and level of constraint to the Group. Contributions to the Common Equity Tier 1 ratio and the Leverage ratio are measured through RWA and Leverage Ratio Exposure (LRE). The Group’s Capital Loss under Stress is a measure of the Group’s overall economic risk exposure under a defined stress scenario. Goodwill, other intangible assets and business related regulatory capital deduction items included in total capital demand are directly allocated to the respective segments, supporting the calculation of the allocated tangible shareholders equity and the respective rate of return.
Most of our subsidiaries and a number of our branches are subject to legal and regulatory capital requirements. In developing, implementing and testing our capital and liquidity position, we fully take such legal and regulatory requirements into account. Any material capital requests of our branches and subsidiaries across the globe are presented to and approved by the Group Investment Committee prior to execution.
Further, Treasury is a member of our Pensions Committee and represented on the Investment Committee of the largest Deutsche Bank pension fund which sets the investment guidelines for this fund. This representation is intended to ensure that pension assets are aligned with pension liabilities, thus protecting our capital base.
Risk identification and assessment
We regularly identify risks to our business’ and infrastructure’s operations, including under stressed conditions. This assessment incorporates input from both 1
st
LoD and 2
nd
LoD, with the identified risks assessed for materiality based on their severity and likelihood of materialization. The assessment of risks is complemented by a view on emerging risks applying a forward-looking perspective. This risk identification and assessment process results in our risk inventory which captures the material risks for the Group, and where relevant, across businesses, entities and branches.
Regular updates to the risk inventory are reported to senior management for review and challenge, and subsequently inform key risk management processes. These include the development of stress scenarios tailored to Deutsche Bank’s risk profile, and informing risk appetite setting and monitoring. Risks in the inventory are also mapped to risks in
the risk type taxonomy.
Credit Risk Management and Asset Quality
Credit Risk framework
Credit Risk arises from all transactions where actual, contingent or potential claims against any counterparty, borrower, obligor or issuer (which we refer to collectively as “counterparties”) exist, including those claims that we plan to distribute. These transactions are typically part of our non-trading lending activities (such as loans and contingent liabilities) as well as our direct trading activity with clients (such as OTC derivatives). These also include traded bonds and debt securities. Carrying values of equity investments are also disclosed in our Credit Risk section. We manage the respective positions within our market risk and credit risk frameworks.
Based on the Risk Type Taxonomy, Credit Risk is grouped into four material categories, namely default / migration risk, transaction / settlement risk (exposure risk), mitigation risk and credit concentration risk. This is complemented by a regular risk identification and materiality assessment.
- – Default / migration risk as the main element of credit risk, is the risk that a counterparty defaults on its payment obligations or experiences material credit quality deterioration increasing the likelihood of a default.
- – Transaction / settlement risk (exposure risk) is the risk that arises from any existing, contingent or potential future positive exposure.
- – Mitigation risk is the risk of higher losses due to risk mitigation measures not performing as anticipated.
- – Credit concentration risk is the risk of an adverse development in a specific single counterparty, country, industry or product / asset class leading to a disproportionate deterioration in the risk profile of Deutsche Bank’s credit exposures to that counterparty, country, industry or product / asset class.
We manage our credit risk using the following philosophy and principles:
72
|
|
Deutsche Bank
|
Operating and Financial Review
|
|
|
Annual Report 2021
|
Deutsche Bank Group
|
|
|
|
|
- – Credit Risk Management(CRM) forms part of the 2nd Line of Defense (2nd LoD) within DB Group’s Three Lines of Defense model. Business as primary risk taker and owner forms the 1st Line of Defense (1st LoD) and Group Audit the 3rd Line of Defense (3rd LoD)
- – Compliance is reporting to a different Management Board Member and hence the credit risk function is independent from the compliance function up to Management Board level.
- – In each of our divisions, credit decision standards, processes and principles are consistently applied.
- – A key principle of credit risk management is client credit due diligence. Our client selection is achieved in collaboration with our business division counterparts who stand as a first line of defense.
- – We aim to prevent undue concentration and tail-risks (large unexpected losses) by maintaining a diversified credit portfolio. Client, industry, country and product-specific concentrations are assessed and managed against our risk appetite.
- – We maintain underwriting standards aiming to avoid large undue credit risk on a counterparty and portfolio level. In this regard we extend unsecured cash positions and actively use hedging for risk mitigation purposes. Additionally, we strive to secure our derivative portfolio through collateral agreements and may additionally hedge concentration risks to further mitigate credit risks from underlying market movements.
- – Every new credit facility and every extension (such as exposure limit increase) to any counterparty requires credit approval at the appropriate authority level in line with the minimum required credit authority calculation. We assign credit approval authorities to individuals according to their qualifications, experience and training, and we review these periodically.
- – We manage all our credit exposures to each obligor across our consolidated Group on the basis of the “one obligor principle” (as required under CRR Article 4(1)(39)), under which all facilities to a group of borrowers which are linked to each other (for example by one entity holding a majority of the voting rights or capital of another) are consolidated under one group.
- – We have established within CRM – where appropriate – specialized teams for deriving internal client ratings, analyzing and approving transactions, monitoring the portfolio or covering workout clients. For transaction approval purposes, structured credit risk management teams are aligned to the respective lending business areas.
- – Where required, we have established processes to manage credit exposures at a legal entity level.
- – To meet the requirements of CRR Article 190, DB Group has allocated the various control requirements for the credit processes to 2nd LoD units that are best suited to perform such controls.
Measuring Credit Risk
Credit Risk is measured by credit rating, regulatory and internal capital demand and key credit metrics mentioned below.
The credit rating is an essential part of the Bank’s underwriting and credit process and builds the basis for risk appetite determination on a counterparty and portfolio level, credit decision and transaction pricing as well the determination of regulatory capital demand for credit risk. Each counterparty must be rated and each rating has to be reviewed at least annually. Ongoing monitoring of counterparties helps keep ratings up-to-date. There must be no credit limit without a credit rating. For each credit rating the appropriate rating approach has to be applied and the derived credit rating has to be established in the relevant systems. Different rating approaches have been established to best reflect the specific characteristics of exposure classes, including central governments and central banks, institutions, corporates and retail.
Counterparties in our non-homogenous portfolios are rated by our independent Credit Risk Management function. Country risk related ratings are provided by ERM Risk Research.
Our rating analysis is based on a combination of qualitative and quantitative factors. When rating a counterparty we apply in-house assessment methodologies, scorecards and our 21-grade rating scale for evaluating the credit-worthiness of our counterparties.
Changes to existing credit models and introduction of new models are approved by the Regulatory Credit Risk Model Committee (RCRMC) chaired by the Head of CRM before the models are used for credit decisions and capital calculation for the first time or before they are significantly changed. Separately, for all material and partially for new models an approval by the Head of Model Risk Management is required. Where appropriate, less significant changes can be approved by a delegate of either function under a delegated authority. Proposals with high impact are recommended for approval to the Group Risk Committee. Regulatory approval may also be required. The model validation is performed independently of model development by Model Risk Management. The results of the regular validation processes as stipulated by internal policies are brought to the attention of the Regulatory Credit Risk Model Forum (RCRMF) and the RCRMC, even if the validation results do not lead to a change.
We measure risk-weighted assets to determine the regulatory capital demand for credit risk using “advanced”, “foundation” and “standard” approaches of which advanced and foundation are approved by our regulator.
73
|
|
Deutsche Bank
|
Operating and Financial Review
|
|
|
Annual Report 2021
|
Deutsche Bank Group
|
|
|
|
|
The advanced Internal Ratings Based Approach (IRBA) is the most sophisticated approach available under the regulatory framework for credit risk and allows us to make use of our internal credit rating methodologies as well as internal estimates of specific further risk parameters. These methods and parameters represent long-used key components of the internal risk measurement and management process supporting the credit approval process, the economic capital and expected loss calculation and the internal monitoring and reporting of credit risk. The relevant parameters include the probability of default (PD), the loss given default (LGD) and the maturity (M) driving the regulatory risk-weight and the credit conversion factor (CCF) as part of the regulatory exposure at default (EAD) estimation. For the majority of derivative counterparty exposures as well as securities financing transactions (SFT), we make use of the internal model method (IMM) in accordance with CRR and SolvV to calculate EAD. For most of our internal rating systems more than seven years of historical information is available to assess these parameters. Our internal rating methodologies aim at point-in-time rather than a through-the-cycle rating, but in line with regulatory solvency requirements, they are calibrated based on long-term averages of observed default rates.
The foundation IRBA is an approach available under the regulatory framework for credit risk allowing institutions to make use of their internal rating methodologies while using pre-defined regulatory values for all other risk parameters. Parameters subject to internal estimates include the PD while the LGD and the CCF are defined in the regulatory framework. Foundation IRBA remains in place for some exposures stemming from ex-Postbank.
We apply the standardized approach to a subset of our credit risk exposures. The standardized approach measures credit risk either pursuant to fixed risk weights, which are predefined by the regulator, or through the application of external ratings. We assign certain credit exposures permanently to the standardized approach in accordance with Article 150 CRR. These are predominantly exposures to the Federal Republic of Germany and other German public sector entities as well as exposures to central governments of other European Member States that meet the required conditions. These exposures make up the majority of the exposures carried in the standardized approach and receive predominantly a risk weight of zero percent. For internal purposes, however, these exposures are subject to an internal credit assessment and fully integrated in the risk management and economic capital processes.
In addition to the above described regulatory capital demand, we determine the internal capital demand for credit risk via an economic capital model.
We calculate economic capital for the default risk, country risk and settlement risk as elements of credit risk. In line with our economic capital framework, economic capital for credit risk is set at a level to absorb with a probability of 99.9 % very severe aggregate unexpected losses within one year. Our economic capital for credit risk is derived from the loss distribution of a portfolio via Monte Carlo Simulation of correlated rating migrations. The loss distribution is modeled in two steps. First, individual credit exposures are specified based on parameters for the probability of default, exposure at default and loss given default. In a second step, the probability of joint defaults is modeled through the introduction of economic factors, which correspond to geographic regions and industries. The simulation of portfolio losses is then performed by an internally developed model, which takes rating migration and maturity effects into account. Effects due to wrong-way derivatives risk (i.e., the credit exposure of a derivative in the default case is higher than in non-default scenarios) are modeled by applying our own alpha factor when deriving the exposure at default for derivatives and securities financing transactions under the CRR. We allocate expected losses and economic capital derived from loss distributions down to transaction level to enable management on transaction, customer and business level.
Besides the credit rating, which is a key component we apply for managing our credit portfolio, including transaction approval and the setting of risk appetite, we establish credit limits for all credit exposures. Credit limits set forth maximum credit exposures we are willing to assume over specified periods. In determining the credit limit for a counterparty, we consider the counterparty’s credit quality by reference to our internal credit rating. Credit limits and credit exposures are both measured on a gross and net basis where net is derived by deducting hedges and certain collateral from respective gross figures. For derivatives, we look at current market values and the potential future exposure over the relevant time horizon which is based upon our legal agreements with the counterparty. We also take into consideration the risk-return characteristics of individual transactions and portfolios. Risk-Return metrics explain the development of client revenues as well as capital consumption.
IFRS 9 Impairment
Description of IFRS 9 Model and Methodology
In the following section, the Group provides an overview of the IFRS 9 impairment framework which includes descriptions of key decisions taken in relation to critical accounting estimates and judgements, along with methodologies and definitions applied in the IFRS 9 impairment model.
The impairment requirements of IFRS 9 apply to all credit exposures that are measured at amortized cost or fair value through other comprehensive income and to off balance sheet lending commitments, such as loan commitments and financial guarantees. For purposes of our impairment approach, we refer to these instruments as financial assets.
74
|
|
Deutsche Bank
|
Operating and Financial Review
|
|
|
Annual Report 2021
|
Deutsche Bank Group
|
|
|
|
|
The Group determines its allowance for credit losses in accordance with IFRS 9 as follows:
- – Stage 1 reflects financial assets where it is assumed that credit risk has not increased significantly after initial recognition.
- – Stage 2 contains all financial assets, that are not defaulted, but have experienced a significant increase in credit risk since initial recognition.
- – Stage 3 consists of financial assets of clients which are defaulted in accordance with DB’s policies on regulatory default, which are based on the Capital Requirements Regulation (CRR) under Art. 178. The Group defines these financial assets as impaired, non-performing and defaulted.
- – Significant increase in credit risk is determined using quantitative and qualitative information based on the Group’s historical experience, credit risk assessment and forward-looking information.
- – Purchased or Originated Credit Impaired (POCI) financial assets are assets where at the time of initial recognition there is objective evidence of impairment.
The IFRS 9 impairment approach is an integral part of the Group’s Credit Risk Management procedures. The estimation of Expected Credit Losses (ECL’s) is either performed via the automated, parameter based ECL calculation using the Group’s ECL model or determined by Credit Officers. In both cases, the calculation takes place for each financial asset individually. Similarly, the determination of the need to transfer between stages is made on an individual asset basis. The Group’s ECL model is used to calculate the allowance for credit losses for all financial assets in Stage 1 and Stage 2, as well as for Stage 3 in the homogeneous portfolio (i.e. retail and small business loans with similar credit risk characteristics). For financial assets in our non-homogeneous portfolio in Stage 3 and for POCI assets, the allowance for credit losses is determined by Credit Officers.
The Group uses three main components to measure ECL. These are Probability of Default (PD), Loss Given Default (LGD) and Exposure at Default (EAD). The Group leverages existing parameters used for determination of capital demand under the Basel Internal Ratings Based Approach and internal risk management practices as much as possible to calculate ECL. These parameters are adjusted where necessary to comply with IFRS 9 requirements (e.g. use of point in time ratings and removal of downturn add-ons in the regulatory parameters). Incorporating forecasts of future economic conditions into the measurement of expected credit losses influences the allowance for credit losses in Stage 1 and 2. In order to calculate lifetime expected credit losses, the Group’s calculation derives the corresponding lifetime PDs from migration matrices that reflect economic forecasts.
Stage Determination and Significant Increase in Credit Risk
At initial recognition, financial assets are reflected in Stage 1, unless the financial assets are POCI. If there is a significant increase in credit risk, the financial asset is transferred to Stage 2. A significant increase in credit risk is determined by using rating-related and process-related indicators. The assignment of financial assets to Stage 3 is based on the status of the borrower being in default. If a borrower is in default, then all financial assets of the borrower are transferred to Stage 3.
Rating-related Stage 2 indicators: The Group compares a borrower’s lifetime PD at the reporting date with lifetime PD expectations at the date of initial recognition to determine if there was a significant change in the borrower’s PDs and all of its transactions in the scope of IFRS 9 impairment. Based on historically observed migration behavior and a sampling of different economic scenarios, a lifetime PD distribution is obtained. A quantile of this distribution, which is defined for each counterparty class, is chosen as the lifetime PD threshold. If the remaining lifetime PD of a transaction according to current expectations exceeds this threshold, the financial asset has incurred a significant increase in credit risk and is transferred to Stage 2. The quantiles used to define Stage 2 thresholds are determined using expert judgment, are validated annually and have not changed as a result of COVID
‑
19. The thresholds applied vary depending on the original credit quality of the borrower, elapsed lifetime, remaining lifetime and counterparty class. Management believes that the defined approach and quantiles represent a meaningful indicator that a financial asset has incurred a significant increase in credit risk.
Process-related Stage 2 Indicators: Process-related indicators are derived via the use of existing risk management indicators, which in Management’s view represent situations where the credit risk of financial assets has significantly increased. These include borrowers being added to a credit watchlist, being transferred to workout status, payments being 30 days or more past due or in forbearance (except for certain COVID-19 related forbearance measures as described further below).
As long as the conditions for one or more of the process-related or rating-related indicators is fulfilled and the borrower of the financial asset has not met the definition of default, the asset will remain in Stage 2. If the Stage 2 indicators are no longer fulfilled and the financial asset is not defaulted, the financial asset transfers back to Stage 1. In case of performing forborne financial assets, the probation period in line with regulatory guidance amounts to 2 years before the financial asset is reclassified to Stage 1.
75
|
|
Deutsche Bank
|
Operating and Financial Review
|
|
|
Annual Report 2021
|
Deutsche Bank Group
|
|
|
|
|
In the second quarter of 2021, the Group refined one of the process-related Stage 2 triggers. Financial assets added to the watchlist for discretionary reasons are now transferred to Stage 2, whereas prior to this change only assets added to the watchlist for mandatory reasons were transferred to Stage 2. This methodology change, which represents a change in estimate, resulted in an increase of the Group’s allowance for credit losses of
€
60
million
, which is reflected in the Group’s financial results as of December 31, 2021.
If the borrower defaults, all transactions of the borrower are allocated to Stage 3. If at a later date the borrower is no longer in default, the curing criteria according to regulatory guidance is applied (including probation periods), which are at least 3 months or 1 year in case of distressed restructurings. Once the regulatory cure period or criteria has been met, the borrower will cease to be classified as defaulted and its assets will be transferred back to Stage 2 or Stage 1.
In the third quarter of 2021, the Group obtained ECB approval and completed the rollout of the latest regulatory guidance on the definition of default, which consists of two EBA guidelines. One guideline comprises an EBA technical standard regarding the materiality threshold for credit obligations past due (implemented with ECB regulation (EU) 2018/1845) and the second guideline covers the application of the definition of default. Both new requirements are jointly referred to as EBA Guidelines on definition of default. These EBA Guidelines replaced the definition of default under Basel II and mainly impacted ECL for specific portfolios within the Private Bank. The impact of the change in estimate was not material.
The expected credit loss calculation for Stage 3 distinguishes between transactions in homogeneous and non-homogenous portfolios, and POCI financial assets. For transactions that are in Stage 3 and in a homogeneous portfolio, the Group uses a parameter based automated approach to determine the credit loss allowance per transaction. For these transactions, the LGD parameters are partially modelled to be time dependent, i.e. consider the declining recovery expectation as time elapses after default. The allowance for credit losses for financial assets in our non-homogeneous portfolios in Stage 3, as well as for POCI assets are determined by Credit Officers. This allows Credit Officers to consider currently available information and recovery expectations specific to the borrowers and the financial assets at the reporting date.
The Group has not changed its existing stage trigger mechanics and rules due to the COVID-19 pandemic except for EBA compliant moratoria and concessions granted to clients primarily affected by COVID-19. This exceptional treatment has become less relevant in 2021 as it applied to a limited number of client relationships in Italy, Germany and Spain, as most of the moratoria granted in Germany expired by end of 2020 and in other countries by the end of 2021.
Estimation Techniques for Key Input Factors
The first key input factor in the Group ECL calculation is the one-year PD for borrowers which is derived from our internal rating systems. The Group assigns a PD to each borrower credit exposure based on a 21-grade master rating scale for all of our exposure.
The borrower ratings assigned are derived based on internally developed rating models which specify consistent and distinct customer-relevant criteria and assign a rating grade based on a specific set of criteria as given for a certain customer. The set of criteria is generated from information sets relevant for the respective customer segments including general customer behavior, financial and external data. The methods in use range from statistical scoring models to expert-based models taking into account the relevant available quantitative and qualitative information. Expert-based models are usually applied for borrowers in the exposure classes “Central governments and central banks”, “Institutions” and “Corporates” with the exception of those “Corporates” segments for which a sufficient data basis is available for statistical scoring models. For the latter as well as for the retail segment statistical scoring or hybrid models combining both approaches are commonly used. Quantitative rating methodologies are developed based on applicable statistical modelling techniques, such as logistic regression.
One-year PDs are extended to multi-year PD curves using through-the-cycle (TTC) matrices and macroeconomic forecasts. Based on economic scenarios centered around the macroeconomic baseline forecast, TTC matrices are first transformed into point-in-time (PIT) rating migration matrices, typically for a two-year period. The calculation of the PIT matrices leverages a link between macroeconomic variables and the default and rating behavior of borrowers, which is derived from historical macroeconomic variables (MEV) and rating time series through regression techniques. In a final step, multi-year PD curves are derived from PIT rating migration matrices for periods where reasonable and supportable forecasts are available and extrapolated based on TTC rating migration matrices beyond those periods.
76
|
|
Deutsche Bank
|
Operating and Financial Review
|
|
|
Annual Report 2021
|
Deutsche Bank Group
|
|
|
|
|
The second key input into the ECL calculation is the LGD parameter, which is defined as the likely loss intensity in case of a borrower’s default. It provides an estimation of the exposure that cannot be recovered in a default event and therefore captures the severity of a loss. Conceptually, LGD estimates are independent of a borrower’s probability of default. The LGD models applied in stages 1 and 2, which are based on regulatory LGD models but adjusted for IFRS 9 requirements (removal of downturn-add-on and removal of indirect costs of workout), ensure that the main drivers for losses (i.e. different levels and quality of collateralization and customer or product types or seniority of facility) are reflected as risk drivers in LGD estimates. In our LGD models we assign collateral type specific LGD parameters to the collateralized exposure (collateral value after application of haircuts). The LGD setting for defaulted homogeneous portfolios are partially dependent on time after default and are either calibrated based on the Group’s multi-decade loss and recovery experience using statistical methods or for less significant portfolios certain LGD model input parameters (e.g. cure rates) are determined by expert judgement.
The third key input is the Exposure at Default (EAD) over the lifetime of a financial asset which is modelled taking into account expected repayment profiles (e.g. linear amortization, annuities, bullet loan structures). Prepayment options are not modelled for all portfolios as they are not deemed material. We apply specific Credit Conversion Factors (CCFs) in order to calculate an EAD value. Conceptually, the EAD is defined as the expected amount of the credit exposure to a borrower at the time of its default. In instances where a transaction involves an unused limit, a percentage share of this unused limit is added to the outstanding amount in order to appropriately reflect the expected outstanding amount in case of a borrower’s default. This reflects the assumption that for commitments, the utilization at the time of default might be higher than the current outstanding balance. In case a transaction involves an additional contingent component (i.e., guarantees) a further percentage share is applied as part of the CCF model in order to estimate the amount of guarantees drawn in case of default. The calibrations of such parameters are based on internal historical data and are either based on empirical analysis or supported by expert judgement and consider borrower and product type specifics. Where supervisory CCF values need to be applied for regulatory purposes, internal estimates are used for IFRS 9.
Expected Lifetime
IFRS 9 requires the determination of lifetime expected credit losses for which the expected lifetime of a financial asset is a key input factor. Lifetime expected credit losses represent default events over the expected life of a financial asset. The Group measures expected credit losses considering the risk of default over the maximum contractual period (including any borrower’s extension options) over which the Group is exposed to credit risk.
Retail overdrafts, credit card facilities and certain corporate revolving facilities typically include both a loan and an undrawn commitment component. The expected lifetime of such on-demand facilities exceeds their contractual life as they are typically cancelled only when the Group becomes aware of an increase in credit risk. The expected lifetime is estimated by taking into consideration historical information and the Group’s Credit Risk Management actions such as credit limit reductions and facility cancellation. Where such facilities are subject to an individual review by Credit Risk Management, the lifetime for calculating expected credit losses is 12 months. For facilities not subject to individual review by Credit Risk Management, we apply a lifetime for calculating expected credit losses of 24 months.
Interest Rate used in the IFRS 9 model
In the context of the ECL calculation, the Group applies in line with IFRS 9 an approximation of the effective interest rate (EIR), which is usually the contractual interest rate (CIR). The CIR is deemed to be an appropriate approximation, as the interest rate is consistently used in the ECL model, interest recognition and for discounting of the ECL and does not materially differ from the EIR.
Consideration of Collateralization in IFRS 9 Expected Credit Loss Calculation
The ECL model projects the level of collateralization for each point in time in the life of a financial asset. At the reporting date, the model uses the existing collateral distribution process applied in DB’s Economic Capital model. In this model, the liquidation value of each eligible collateral is allocated to relevant financial assets to distinguish between collateralized and uncollateralized parts of each financial asset. In the ECL calculation, the Group subsequently applies the aforementioned LGDs for secured and unsecured exposures to derive the ECL for the secured and unsecured part of the exposure separately.
For personal collateral (e.g. guarantees), the ECL model assumes that the relative level of collateralization remains stable over time. In the case of an amortizing loan, the outstanding exposure and collateral values decrease together over time. For physical collateral (e.g. real estate property), the ECL shall assume that the absolute collateral value remains constant. In case of an amortizing loan, the collateralized part of the exposure increases over time and the loan-to-value decreases accordingly.
Certain financial guarantee contracts are integral to the financial assets guaranteed. In such cases, the financial guarantee is considered as collateral for the financial asset and the benefit of the guarantee is used to mitigate the ECL of the guaranteed financial asset.
Forward Looking Information
Under IFRS 9, the allowance for credit losses is based on reasonable and supportable forward-looking information available without undue cost or effort, which takes into consideration past events, current conditions and forecasts of future economic conditions.
77
|
|
Deutsche Bank
|
Operating and Financial Review
|
|
|
Annual Report 2021
|
Deutsche Bank Group
|
|
|
|
|
To incorporate forward looking information into the Group’s allowance for credit losses, we use two key elements:
- – As its base scenario, the Group uses external survey-based macroeconomic forecasts (e.g. consensus views on GDP and unemployment rates). In addition, our scenario expansion model, which has been initially developed for stress testing, is used for forecasting macroeconomic variables that are not covered by external consensus data. All forecasts are assumed to reflect the most likely development of the respective variables and are updated at least once per quarter.
- – Statistical techniques are then applied to transform the base scenario into a scenario analysis covering an infinite number of scenarios, defined by probability distributions of the macroeconomic variables. These scenarios specify deviations from the baseline forecasts. The scenario distribution is then used for deriving multi-year PD curves for different rating and counterparty classes, which are applied in the ECL calculation and in the identification of significant deterioration in credit quality of financial assets as described above in the rating-related stage 2 indicators.
The general use of forward-looking information, including macro-economic factors, as well as adjustments taking into account extraordinary factors (e.g. COVID-19), are monitored by the Group's Risk and Finance Credit Loss Provision Forum. At a minimum, the Group updates its forecasts for macro-economic factors on a quarterly basis and reviews aspects of potential model imprecision (e.g. MEV parameters outside the historic range used for model calibration, if not already included in the model) as part of an MEV monitoring framework to assess the necessity of corrective measures in the form of overlays.
The Group’s overlay methodology introduced in 2021 focusses on individual extreme MEV movements in the context of specific methodological assumptions and limitations. A quantitative test procedure involves the calculation of ratios between (a) scenario projections from the consensus forecast and (b) historical maximum MEV movements to identify single MEVs are outside of historical ranges.
As described earlier, the Group’s approach to reflect macroeconomic variables in the calculation of the ECL estimate is to incorporate forecasts for the next two years, using eight discrete quarterly observations. After the period of eight quarters, the Group constructs forecasts based on macro-economic variables and their historic trends.
In the second quarter of 2021: Deutsche Bank implemented a refinement of its forward-looking information model which introduced a more granular approach to its portfolio segmentation to better reflect the key risk drivers in material portfolios. This change in estimate resulted in an increase of the Group’s allowance for credit losses of
€
31
million
firstly reflected in the second quarter of 2021 results.
The table below contains the MEVs which incorporate forward-looking information in our ECL model as of December 31, 2021, which includes the more granular approach implemented in second quarter 2021.
Forward-looking information applied
|
|
|
December 31, 2021¹ ²
|
|
||
|
|
|
Year 1
(4 quarter avg)
|
|
Year 2
(4 quarter avg)
|
|
|
Commodity - Gold
|
|
|
|
|
|
|
Commodity - WTI
|
|
|
|
|
|
|
Credit - CDX Emerging Markets
|
|
|
|
|
|
|
Credit - CDX High Yield
|
|
|
|
|
|
|
Credit - CDX IG
|
|
|
|
|
|
|
Credit - High Yield Index
|
|
|
|
|
|
|
Credit - ITX Europe 125
|
|
|
|
|
|
|
Equity - MSCI Asia
|
|
|
|
|
|
|
Equity - Nikkei
|
|
|
|
|
|
|
Equity - SP500
|
|
|
|
|
|
|
GDP - Developing Asia
|
|
|
|
|
|
|
GDP - Emerging Markets
|
|
|
|
|
|
|
GDP - Eurozone
|
|
|
|
|
|
|
GDP - Germany
|
|
|
|
|
|
|
GDP - Italy
|
|
|
|
|
|
|
GDP - USA
|
|
|
|
|
|
|
Real Estate Prices - US CRE Index
|
|
|
|
|
|
|
Unemployment - Eurozone
|
|
|
|
|
|
|
Unemployment - Germany
|
|
|
|
|
|
|
Unemployment - Italy
|
|
|
|
|
|
|
Unemployment - Japan
|
|
|
|
|
|
|
Unemployment - Spain
|
|
|
|
|
|
|
Unemployment - USA
|
|
|
|
|
|
|
|
|
|
|
|
|
1
MEV as of 31 December 2021; MEV outside the calibrated range were adjusted either in the model or via a management overlay as discussed further below.
2
Year 1 equals fourth quarter of 2021 to third quarter of 2022, Year 2 equals fourth quarter of 2022 to third quarter of 2023.
78
|
|
Deutsche Bank
|
Operating and Financial Review
|
|
|
Annual Report 2021
|
Deutsche Bank Group
|
|
|
|
|
During the height of the COVID-19 pandemic in 2020, it was management’s opinion that the most representative approach for estimating ECL was to reduce the weight of short-term forecasts and derive adjusted model inputs based on longer term averages. For this reason, the Group applied an overlay to its standard IFRS 9 model in 2020. The overlay, which reduced the provision by
€
104
million
as of December 31, 2020, was based on averaging forecasts for GDP and unemployment rates over the next three years. This overlay was no longer applied as of January 2021 as the MEV had gained their relevance with any remaining imprecisions being addressed via the model imprecision monitoring process discussed above.
|
|
|
December 31. 2020¹ ²
|
||||
|
|
|
Year 1
(4 quarter avg)
|
|
Year 2
(4 quarter avg)
|
|
Year 3
(4 quarter avg)
|
|
Credit - ITX Europe 125
|
|
|
|
−
|
|
−
|
|
FX - EUR/USD
|
|
|
|
−
|
|
−
|
|
GDP Eurozone
|
|
|
|
|
|
|
|
GDP Germany
|
|
|
|
|
|
|
|
GDP Italy
|
|
|
|
|
|
|
|
GDP USA
|
|
|
|
|
|
|
|
Rate - US Treasury 2y
|
|
|
|
–
|
|
−
|
|
Unemployment - Eurozone
|
|
|
|
|
|
|
|
Unemployment - Germany
|
|
|
|
|
|
|
|
Unemployment - Italy
|
|
|
|
|
|
|
|
Unemployment - Spain
|
|
|
|
|
|
|
|
Unemployment - USA
|
|
|
|
|
|
|
|
|
|
|
|
|
|
|
1
Rates, FX and credit spreads as per December 7 release; GDP, unemployment forecasts updated per December 16.
2
Year 1 equals fourth quarter of 2020 to third quarter of 2021, Year 2 equals fourth quarter of 2021 to third quarter of 2022.
Management overlays
Management regularly reviews key inputs into the ECL calculation and discusses aspects of potential model imprecision to assess the necessity of corrective measures in the form of overlays. In the following section, the Group provides details on its management overlays recorded as of December 31, 2020 and developments until December 31, 2021.
Development of overlays from December 31, 2020 to December 31, 2021
|
in € m. (unless stated otherwise)
|
|
|
|
Overlays as of December 31, 2020
|
|
Discontinued overlays
|
|
New Overlays
|
|
Overlays as of December 31, 2021
|
|
Overlay description
|
|
Impact on
|
|
|
|
|
|
|
|
|
|
3y averaging of specific MEVs
|
|
All financial assets in Stage 1 and 2
|
|
(
|
|
|
|
|
|
|
|
COVID-19 related downside risks
|
|
All financial assets in Stage 1 and 2
|
|
|
|
(
|
|
|
|
|
|
Construction Risk following increased prices for building materials
|
|
Mortgage portfolios in Private Bank in Stage 1 and 2
|
|
|
|
|
|
|
|
|
|
Model calibration (MEV outside calibrated range of the FLI model)
|
|
All financial assets in Stage 1 and 2
|
|
|
|
|
|
|
|
|
|
Recalibrations required due to the new Definition of Default
|
|
Financial assets primarily in Private Bank in Stage 3
|
|
|
|
|
|
(
|
|
(
|
|
Total
|
|
|
|
|
|
(
|
|
|
|
|
|
|
|
|
|
|
|
|
|
|
|
|
The Group applied the following overlays to its IFRS 9 model output as of December 31, 2021 and December 31, 2020.
- – FLI model overlay: As described above in the MEV section, the Group applied an overlay to its standard IFRS 9 model as a result of the COVID-19 pandemic, which resulted in a decrease of the Group’s allowance for credit losses. The overlay was based on averaging forecasts for GDP and unemployment rates over the next three years in its ECL estimation. The Group did not apply the above overlay post year end 2020 and returned to its standard IFRS 9 approach in 2021.
-
–
COVID-19 uncertainties: As of December 31, 2020 the Group booked an additional overlay of
€
-
–
Construction Risk following sharp increase of building material prices in 2021: the Group decided to record a
€
79
|
|
Deutsche Bank
|
Operating and Financial Review
|
|
|
Annual Report 2021
|
Deutsche Bank Group
|
|
|
|
|
-
–
Model calibration: The Group applies a management overlay to address significant year-on-year movements in certain macroeconomic variables, in particular GDP, which were identified as being outside the calibrated range of the FLI model. Since the model was not calibrated to deal with such extreme year-on-year movements of certain MEV, it is management’s view that the model is underestimating the amount of expected credit losses required at the reporting date. The quantification of the overlay amount was supported by an ECL impact calculation with forecasts outside of the historical range replaced by maximum MEV moves observed during the time window considered for model calibration purposes. As of year-end 2021, this overlay was
€
-
–
Recalibrations required due to the new Definition of Default introduced: In the third quarter of 2021, Deutsche Bank implemented the new Definition of Default which is the trigger for Stage 3 in Deutsche Bank’s IFRS 9 framework. The implementation of the new Definition of Default mainly affected the Private Bank, where the Stage 3 population in the homogeneous portfolios increased. As an adjustment in the Definition of Default is not expected to materially change the loss expectation related to this portfolio, Management is of the view that this change resulted in an overstatement of provisions in Stage 3 not reflecting the loss expectations for the impacted portfolios at the reporting date as the new Definition of Default will also require a recalibration of the Loss Given Default (LGD) parameter in the model that has not yet taken place. The LGD settings are reviewed on an annual basis with independent validation performed by the Model Risk Management function. The recalibration is only expected in 2022 once empirical data is available for a statistical recalibration, and consequently an overlay was recorded to address the expected LGD recalibration effects amounting to
€
Model Sensitivity
Macroeconomic Variables
The sensitivity of our model with respect to potential changes in projections for key MEVs is shown in the below table, which provides ECL impacts for Stages 1 and 2 from downward and upward shifts applied separately to each group of MEVs. Each of these groups consists of MEVs from the same category:
- – GDP growth rates: includes USA, Eurozone, Germany, Italy, Developing Asia, Emerging Markets
- – Unemployment rates: includes USA, Eurozone, Germany, Italy, Japan, Spain
- – Equities: SP500, Nikkei, MSCI Asia
- – Credit spreads: ITX Europe 125, High Yield Index, CDX IG, CDX High Yield, CDX Emerging Markets
- – Real Estate: Commercial Real Estate Price Index
- – Commodities: WTI oil price, Gold price
The tables below present the impact of upward and downward shifts to each of the MEV groups and impact on the ECL provision as of December 31, 2021. Note the sensitivity analysis only includes the impact of the aggregated MEV group (i.e. potential correlation between different MEV groups or the impact of management overlays is not taken into consideration).
As the Group refined its forward-looking information model in 2021 to include a more granular approach to its portfolio segmentation, the prior year information is not directly comparable as 2020 is based on a less granular approach.
ECL for Stage 3 is not affected and not reflected in the following tables as its modelling is independent of the macroeconomic scenarios
IFRS 9 – Sensitivities of Forward-Looking Information – Group Level
|
|
|
December 31, 2021
|
||||||
|
|
|
Upward sensitivity
|
|
Downward sensitivity
|
||||
|
|
|
Upward shift
|
|
ECL impact
in € m.
|
|
Downward shift
|
|
ECL impact
in € m.
|
|
GDP growth rates
|
|
|
|
(
|
|
(
|
|
|
|
Unemployment rates
|
|
(
|
|
(
|
|
|
|
|
|
Real estate prices
|
|
|
|
(
|
|
(
|
|
|
|
Equities
|
|
|
|
(
|
|
(
|
|
|
|
Credit spreads
|
|
(
|
|
(
|
|
|
|
|
|
Commodities¹
|
|
|
|
(
|
|
(
|
|
|
|
|
|
|
|
|
|
|
|
|
1
Here the sign of the shift applies to oil prices changes. Gold price changes have the opposite sign. 1pp (percentage point), e.g. GDP shifts from 3 % to 4 % // 1 % (percentage change), e.g. Real estate price shifts from 100 to 101.
|
|
|
December 31, 2020
|
||||||
|
|
|
Upward sensitivity
|
|
Downward sensitivity
|
||||
|
|
|
Upward shift
|
|
ECL impact
in € m.
|
|
Downward shift
|
|
ECL impact
in € m.
|
|
GDP growth rates
|
|
|
|
(
|
|
(
|
|
|
|
Unemployment rates
|
|
(
|
|
(
|
|
|
|
|
|
|
|
|
|
|
|
|
|
|
80
|
|
Deutsche Bank
|
Operating and Financial Review
|
|
|
Annual Report 2021
|
Deutsche Bank Group
|
|
|
|
|
At Group level, ECL sensitivity is primarily driven by changes in GDP growth rates, unemployment and credit spreads. Moderate sensitivities are also observed with respect to changes of commodities, equities and real estate prices. Compared to 2020, the total sensitivity impact slightly decreased in 2021 due to the lower ECL provision.
At divisional level, the analysis was only performed for the period ended December 31, 2021 and revealed GDP growth rates, credit spreads and commodities prices to be the dominant factors for the Investment Bank, whereas the model sensitivity for the Corporate Bank and Private Bank is mainly associated with changes in GDP growth rates and unemployment rates. The model sensitivity table for the Private Bank shows GDP growth rates and unemployment rates only, as the key MEVs relevant to the underlying portfolios.
IFRS 9 – Sensitivities of Forward-Looking Information applied on Stage 1 and Stage 2 - Corporate Bank
|
|
|
December 31, 2021
|
|
||||||
|
|
|
Upward sensitivity
|
|
Downward sensitivity
|
|
||||
|
|
|
Upward shift
|
|
ECL impact
in € m.
|
|
Downward shift
|
|
ECL impact
in € m.
|
|
|
GDP growth rates
|
|
|
|
(
|
|
(
|
|
|
|
|
Unemployment rates
|
|
(
|
|
(
|
|
|
|
|
|
|
Real estate prices
|
|
|
|
(
|
|
(
|
|
|
|
|
Credit spreads
|
|
(
|
|
(
|
|
|
|
|
|
|
Commodities¹
|
|
|
|
(
|
|
(
|
|
|
|
|
|
|
|
|
|
|
|
|
|
|
¹
Here the sign of the shift applies to oil prices changes. Gold price changes have the opposite sign.
IFRS 9 – Sensitivities of Forward-Looking Information applied on Stage 1 and Stage 2 - Investment Bank
|
|
|
December 31, 2021
|
||||||
|
|
|
Upward sensitivity
|
|
Downward sensitivity
|
||||
|
|
|
Upward shift
|
|
ECL impact
in € m.
|
|
Downward shift
|
|
ECL impact
in € m.
|
|
GDP growth rates
|
|
|
|
(
|
|
(
|
|
|
|
Unemployment rates
|
|
(
|
|
(
|
|
|
|
|
|
Real estate prices
|
|
|
|
(
|
|
(
|
|
|
|
Equities
|
|
|
|
(
|
|
(
|
|
|
|
Credit spreads
|
|
(
|
|
(
|
|
|
|
|
|
Commodities¹
|
|
|
|
(
|
|
(
|
|
|
|
|
|
|
|
|
|
|
|
|
¹
Here the sign of the shift applies to oil prices changes. Gold price changes have the opposite sign.
IFRS 9 – Sensitivities of Forward-Looking Information applied on Stage 1 and Stage 2 - Private Bank
|
|
|
December 31, 2021
|
||||||
|
|
|
Upward sensitivity
|
|
Downward sensitivity
|
||||
|
|
|
Upward shift
|
|
ECL impact
in € m.
|
|
Downward shift
|
|
ECL impact
in € m.
|
|
GDP growth rates
|
|
|
|
(
|
|
(
|
|
|
|
Unemployment rates
|
|
(
|
|
(
|
|
|
|
|
|
|
|
|
|
|
|
|
|
|
Impact of Lifetime Expected Credit Losses for Stage 1 borrowers
As described earlier, the Group uses a mixture of quantitative and qualitative criteria to determine Significant Increase in Credit Risk which require, for affected borrowers, a move to lifetime ECL (Stage 2). If for all Stage 1 borrowers Deutsche Bank were to record lifetime expected credit losses, the Group’s allowance for credit losses amounting to
€
5.4
billion
as of December 31, 2021 and as of December 31, 2020 would increase by approximately
44
%
as of year-end 2021 and
41
%
as of year-end 2020.
Stage 3 LGD setting
The Group’s allowance for credit losses in Stage 3 for the homogeneous portfolios amounts to
€
2.2
billion
as of December 31, 2021 and
€
1.9
billion
as of December 31, 2020. The key driver in determining the ECL provision is the Loss Given Default estimate, which differs by individual portfolios. Loss Given Default is influenced by recovery rates, proceeds from the sale of collateral, as well as cure rates. Some of the drivers for different portfolios include elements of expert judgment. If the LGD for all homogeneous portfolios were to increase by
1
%
, then Stage 3 ECL would increase by approximately
€
20
million
as of December 31, 2021 and December 31, 2020.
81
|
|
Deutsche Bank
|
Operating and Financial Review
|
|
|
Annual Report 2021
|
Deutsche Bank Group
|
|
|
|
|
IFRS 9 Model results
Based on the above described IFRS 9 model and overlays applied, the Group reported a provision for credit losses of
€
515
million
for the year ended 2021, which is a significant reduction to
€ 1.8 billion
for the year ended 2020. This provision for credit losses in 2021 and the significant reduction versus the year ended 2020 was driven by a benign credit environment, strong recovery of main economies after easing of COVID-19 related restrictions and a positive outlook based on improved macro-economic parameters.
As discussed above, the Group has applied various management overlays both in 2021 and 2020 to address the downside risks related to COVID-19, but also to address potential model imprecisions driven by a high volatility in MEV’s.
In regards to the Business Divisions, the Corporate Bank recorded a release of provision for credit losses of
€
3
million
in 2021 compared to provision for credit losses of
€
364
million
in 2020. The year-over-year reduction was driven by low impairments (Stage 3) and releases in Stage 1 and 2. The Investment Bank recorded an increase of provisions for credit losses of
€
104
million
compared to provision for credit losses of
€ 690 million
in 2020. The year-over-year reduction was driven by significantly lower level of COVID
‑
19 related impairments (Stage 3) in 2021. The Private Bank recorded a provision for credit losses of
€
446
million
in 2021 compared to
€
711
million
in 2020, benefiting from an overall benign macroeconomic environment.
The Group has assessed credit risks and its concentrations related to climate-related risks and how those risks affect the amounts recognized in the Allowance for Credit Losses which are deemed to be immaterial at the end of December 31, 2021.
For details on the Group’s accounting policy related to IFRS 9 Impairment, please refer to Note 1 - Significant Accounting Policies and Critical Accounting Estimates of the Consolidated Financial Statements.
Focus Industries in light of COVID-19 Pandemic
The recovery of the global economy has accelerated along with progress of COVID-19-vaccination in 2021 in key economies, which is expected to continue supporting corporate earnings. However, there continues to be a significant dispersion in the recovery between sectors with certain industries seeing more persistent impacts from the COVID-19 pandemic and the surge of infections due to the global spread of the Omicron variant.
As oil and gas prices have increased above pre-COVID-19 levels in the 2
nd
half of 2021, this sector is no longer considered a focus industry.
Key focus sectors accounted for approximately
8
%
of the loan book and approximately
27
%
of
Stage 3 credit loss provisions of the Group as of the year ended 2021. The information below is based on an internal risk view that is not fully congruent with the NACE (Nomenclature des Activities Economiques dans la Communate Europeenne, which is the statistical classification of economic activities in the European Union) applied elsewhere in this report, e.g. in the Asset Quality section.
-
–
Commercial real estate (CRE) (
€
-
–
Retail (excluding food/staples) (
€
-
–
Aviation (
€
-
–
Leisure (
€
82
|
|
Deutsche Bank
|
Operating and Financial Review
|
|
|
Annual Report 2021
|
Deutsche Bank Group
|
|
|
|
|
IFRS 9 - Application of EBA guidance regarding Default, Forbearance and IFRS 9 in light of COVID-19 measures
EBA’s “Statement on the application of the prudential framework regarding Default, Forbearance and IFRS 9 in light of COVID
‑
19 measures” published on March 25, 2020 states that institutions are expected to use a degree of judgement and distinguish between borrowers whose credit standing would not be significantly affected by the current situation in the long term, and those who would be unlikely to restore their creditworthiness. The Bank performed portfolio reviews and applied this regulatory guidance to a number of clients mainly in the Investment Bank and Corporate Bank.
EBA is further of the view that the public and private moratoria, as a response to COVID-19 pandemic, do not have to be automatically classified as forbearance if the moratoria are not borrower specific, based on the applicable national law or on an industry or sector-wide private initiative agreed and applied broadly by relevant credit institutions. Deutsche Bank has introduced this guidance into its internal risk management processes.
Legislative and non-legislative moratoria and public guarantee schemes in light of COVID-19 pandemic
In 2020, the European Banking Association (EBA) issued a “Statement on the application of the prudential framework regarding Default, Forbearance and IFRS 9 in light of COVID-19 measures”, along with guidance on legislative and non-legislative moratoria.
The following table provides an overview of active and expired loans and advances subject to EBA-compliant moratoria, loans and advances subject to COVID-19 related forbearance measures and newly originated loans and advances subject to a public guarantee scheme in the context of the COVID-19 pandemic as of December 31, 2021 and December 31, 2020.
Overview of active and expired moratoria, forbearance measures and guarantee schemes in light of COVID-19 pandemic
|
|
|
Dec 31, 2021
|
|
Dec 31, 2020
|
|
||||||||
|
in € m.
|
|
Loans and advances subject to EBA-compliant moratoria
|
|
Loans and advances subject to COVID-19-related forbearance measures
|
|
Newly originated loans and advances subject to public guarantee schemes in the context of the COVID-19 crisis
1
|
|
Loans and advances subject to EBA-compliant moratoria
|
|
Other loans and advances subject to COVID-19-related forbearance measures
|
|
Newly originated loans and advances subject to public guarantee schemes in the context of the COVID-19 crisis
|
|
|
Corporate Bank
|
|
|
|
|
|
|
|
|
|
|
|
|
|
|
Investment Bank
|
|
|
|
|
|
|
|
|
|
|
|
|
|
|
Private Bank
|
|
|
|
|
|
|
|
|
|
|
|
|
|
|
Capital Release Unit
|
|
|
|
|
|
|
|
|
|
|
|
|
|
|
Total
|
|
|
|
|
|
|
|
|
|
|
|
|
|
|
|
|
|
|
|
|
|
|
|
|
|
|
|
|
1
Excluding
€
0.3
billion
as of December 31, 2021 and
€
0.3
billion
as of December 31, 2020 which qualify for derecognition as these loans meet the pass-through criteria for financial instruments under IFRS 9
.
Breakdown of COVID-19 related measures by stages
|
|
|
Dec 31, 2021
|
||||||||||
|
|
|
Legislative and non-legislative Moratoria
|
|
COVID-19 related forbearance measures
|
|
Public guarantee schemes
|
||||||
|
in € m.
|
|
Gross Carrying Amount
|
|
Expected Credit Losses
|
|
Gross Carrying Amount
|
|
Expected Credit Losses
|
|
Gross Carrying Amount
|
|
Expected Credit Losses
|
|
Stage 1
|
|
|
|
(
|
|
|
|
(
|
|
|
|
(
|
|
Stage 2
|
|
|
|
(
|
|
|
|
(
|
|
|
|
(
|
|
Stage 3
|
|
|
|
(
|
|
|
|
(
|
|
|
|
(
|
|
Total
|
|
|
|
(
|
|
|
|
(
|
|
|
|
(
|
|
|
|
|
|
|
|
|
|
|
|
|
|
|
|
|
|
Dec 31, 2020
|
||||||||||
|
|
|
Legislative and non-legislative Moratoria
|
|
COVID-19 related forbearance measures
|
|
Public guarantee schemes
|
||||||
|
in € m.
|
|
Gross Carrying Amount
|
|
Expected Credit Losses
|
|
Gross Carrying Amount
|
|
Expected Credit Losses
|
|
Gross Carrying Amount
|
|
Expected Credit Losses
|
|
Stage 1
|
|
|
|
(
|
|
|
|
(
|
|
|
|
(
|
|
Stage 2
|
|
|
|
(
|
|
|
|
(
|
|
|
|
(
|
|
Stage 3
|
|
|
|
(
|
|
|
|
(
|
|
|
|
(
|
|
Total
|
|
|
|
(
|
|
|
|
(
|
|
|
|
(
|
|
|
|
|
|
|
|
|
|
|
|
|
|
|
83
|
|
Deutsche Bank
|
Operating and Financial Review
|
|
|
Annual Report 2021
|
Deutsche Bank Group
|
|
|
|
|
COVID-19 related forbearance measures: As of December 31, 2021, COVID-19 forbearance measures have been granted to
€
6.9
billion
outstanding loans and advances; reflecting a broad range of relief from modifications of contract conditions including covenants in the respective loan contract, extension of grace periods to payment deferrals. As of December 31, 2021, over
84
%
of clients are still performing and the Bank continues to remain at a stable ECL level. Over half of the forbearance measures consisted of contract modifications unrelated to payment deferrals. All forborne loans and advances are required to be classified as forborne until a 24-months’ probation period has been reached.
EBA-compliant moratoria can be divided into legislative moratoria, which are instituted by the Government and non-legislative moratoria granted by a group of financial institutions. EBA-compliant moratoria: The moratorium for SMEs and Corporates in Italy was originally scheduled to end on September 30, 2020, but has been further extended until December 2021. Also, the Spanish government extended the legislative Spanish moratoria for SMEs and Corporates until the end of 2021. Non-legislative moratoria: The non-legislative moratoria launched in Italy to support consumer finance clients from January 2021 until the end of March 2021 have all expired.
During 2021, the number of clients and volumes under moratoria have significantly reduced due to repayments, from peak levels in the second quarter 2020. As of December 31, 2021, nearly all moratoria have expired, those that are still active are well below
€
30
million
. More than
95
%
of these clients who took advantage of moratoria have now resumed payments. The transition was actively managed whereby we contacted each private client in order to ensure the clients were aware and able to resume payments before leaving moratoria.
Newly originated loans and advances subject to a public guarantee scheme: The Group has originated approximately
€
4.2
billion
of loans under the public guarantee scheme as of December 31, 2021 and in most cases the terms of the new originated loans and advances are between two and five years. Approximately
€
2.1
billion
of loans were granted in Germany via programs sponsored by KfW, of which,
€
0.3
billion
were derecognized as the terms of the loan and guarantee met the criteria for derecognition under IFRS 9, and
€
1.6
billion
were originated in Spain and
€
0.5
billion
in Luxembourg. As of December 31, 2021,
99
%
of the loans that were granted public guarantees continue to make regular repayments.
Asset Quality
The Asset Quality section under IFRS 9 describes the quality of debt instruments subject to impairment, which under IFRS 9 consist of debt instruments measured at amortized cost, financial instruments at fair value through other comprehensive income (FVOCI) as well as off balance sheet lending commitments such as loan commitments and financial guarantees (hereafter collectively referred to as “Financial Assets”).
Overview of financial assets subject to impairment
The following tables provide an overview of the exposure amount and allowance for credit losses by financial asset class broken down into stages as per IFRS 9 requirements.
Overview of financial assets subject to impairment
|
|
|
Dec 31, 2021
|
|
Dec 31, 2020
|
||||||||||||||||
|
in € m.
|
|
Stage 1
|
|
Stage 2
|
|
Stage 3
|
|
Stage 3
POCI
|
|
Total
|
|
Stage 1
|
|
Stage 2
|
|
Stage 3
|
|
Stage 3
POCI
|
|
Total
|
|
Amortized cost¹
|
|
|
|
|
|
|
|
|
|
|
|
|
|
|
|
|
|
|
|
|
|
Gross carrying amount
|
|
|
|
|
|
|
|
|
|
|
|
|
|
|
|
|
|
|
|
|
|
Allowance for credit losses²
|
|
|
|
|
|
|
|
|
|
|
|
|
|
|
|
|
|
|
|
|
|
of which Loans
|
|
|
|
|
|
|
|
|
|
|
|
|
|
|
|
|
|
|
|
|
|
Gross carrying amount
|
|
|
|
|
|
|
|
|
|
|
|
|
|
|
|
|
|
|
|
|
|
Allowance for credit losses²
|
|
|
|
|
|
|
|
|
|
|
|
|
|
|
|
|
|
|
|
|
|
|
|
|
|
|
|
|
|
|
|
|
|
|
|
|
|
|
|
|
|
|
|
Fair value through OCI
|
|
|
|
|
|
|
|
|
|
|
|
|
|
|
|
|
|
|
|
|
|
Fair value
|
|
|
|
|
|
|
|
|
|
|
|
|
|
|
|
|
|
|
|
|
|
Allowance for credit losses
|
|
|
|
|
|
|
|
|
|
|
|
|
|
|
|
|
|
|
|
|
|
|
|
|
|
|
|
|
|
|
|
|
|
|
|
|
|
|
|
|
|
|
|
Off-balance sheet
|
|
|
|
|
|
|
|
|
|
|
|
|
|
|
|
|
|
|
|
|
|
Notional amount
|
|
|
|
|
|
|
|
|
|
|
|
|
|
|
|
|
|
|
|
|
|
Allowance for credit losses³
|
|
|
|
|
|
|
|
|
|
|
|
|
|
|
|
|
|
|
|
|
|
|
|
|
|
|
|
|
|
|
|
|
|
|
|
|
|
|
|
|
|
|
1
Financial Assets at Amortized Cost consist of: Loans at Amortized Cost, Cash and central bank balances, Interbank balances (w/o central banks), Central bank funds sold and securities purchased under resale agreements, Securities borrowed and certain subcategories of Other assets
.
2
Allowance for credit losses do not include allowance for country risk amounting to
€
4
million
as of December 31, 2021 and
€
5
million
as of December 31, 2020
.
3
Allowance for credit losses do not include allowance for country risk amounting to
€
6
million
as of December 31, 2021 and
€
4
million
as of December 31, 2020
.
84
|
|
Deutsche Bank
|
Operating and Financial Review
|
|
|
Annual Report 2021
|
Deutsche Bank Group
|
|
|
|
|
Financial assets at amortized cost
The following tables provide an overview of development of financial assets at amortized cost and related allowance for credit losses in each of the relevant reporting periods broken down into stages as per IFRS 9 requirements.
Development of exposures in the current reporting period
|
|
|
Dec 31, 2021
|
||||||||
|
|
|
Gross carrying amount
|
||||||||
|
in € m.
|
|
Stage 1
|
|
Stage 2
|
|
Stage 3
|
|
Stage 3 POCI
|
|
Total
|
|
Balance, beginning of year
|
|
|
|
|
|
|
|
|
|
|
|
Movements in financial assets including new business and credit extensions
|
|
|
|
|
|
|
|
(
|
|
|
|
Transfers due to changes in creditworthiness
|
|
(
|
|
(
|
|
|
|
0
|
|
|
|
Changes due to modifications that did not result in
derecognition
|
|
(
|
|
(
|
|
(
|
|
|
|
(
|
|
Changes in models
|
|
|
|
|
|
|
|
|
|
|
|
Financial assets that have been derecognized during the period
|
|
(
|
|
(
|
|
(
|
|
(
|
|
(
|
|
Recovery of written off amounts
|
|
|
|
|
|
|
|
|
|
|
|
Foreign exchange and other changes
|
|
|
|
|
|
|
|
|
|
|
|
Balance, end of reporting period
|
|
|
|
|
|
|
|
|
|
|
|
|
|
|
|
|
|
|
|
|
|
|
Financial assets at amortized cost subject to impairment remained increased by
€
64
billion
or
9
%
in 2021, which was largely driven by Stage 1:
Stage 1 exposures increased by
€
58
billion
or
9
%
primarily due to the increase in loans at amortized cost in Investment Bank and Private Bank as well as the increase in central bank balances.
Stage 2 exposures increased by
€
5
billion
or
15
%
largely driven by the Investment Bank due to enhancements in the process related Stage 2 triggers, discussed above in the IFRS 9 impairment section
.
Stage 3 exposures slightly increased by
€
240
million
or
2
%
in 2021, which was driven by the increase in the Private Bank due to the new EBA definition of default as well as new defaults in the Investment Bank. This was partly offset by the reductions in our POCI loan portfolio as well as Corporate Bank and Capital Release Unit.
Development of exposures in the previous reporting period
|
|
|
Dec 31, 2020
|
||||||||
|
|
|
Gross carrying amount
|
||||||||
|
in € m.
|
|
Stage 1
|
|
Stage 2
|
|
Stage 3
|
|
Stage 3 POCI
|
|
Total
|
|
Balance, beginning of year
|
|
|
|
|
|
|
|
|
|
|
|
Movements in financial assets including new business and credit extensions
|
|
|
|
|
|
|
|
(
|
|
|
|
Transfers due to changes in creditworthiness
|
|
(
|
|
|
|
|
|
|
|
|
|
Changes due to modifications that did not result in
derecognition
|
|
(
|
|
(
|
|
(
|
|
|
|
(
|
|
Changes in models
|
|
|
|
|
|
|
|
|
|
|
|
Financial assets that have been derecognized during the period
|
|
(
|
|
(
|
|
(
|
|
(
|
|
(
|
|
Recovery of written off amounts
|
|
|
|
|
|
|
|
|
|
|
|
Foreign exchange and other changes
|
|
(
|
|
(
|
|
(
|
|
|
|
(
|
|
Balance, end of reporting period
|
|
|
|
|
|
|
|
|
|
|
|
|
|
|
|
|
|
|
|
|
|
|
Financial assets at amortized cost subject to impairment increased by
€
19
billion
or
3
%
in 2020, which was primarily driven by stage 2:
Stage 1 exposures slightly increased by
€
6
billion
or
1
%
.
Stage 2 exposures increased by
€
11
billion
or
43
%
driven by loans at amortized cost in Private Bank and Corporate Bank due to the update of the macroeconomic outlook.
Stage 3 exposures increased by
€
2,703
million
or
28
%
in 2020 driven by new defaults across business divisions, partly offset by a reduction in the POCI loan portfolio.
85
|
|
Deutsche Bank
|
Operating and Financial Review
|
|
|
Annual Report 2021
|
Deutsche Bank Group
|
|
|
|
|
Development of allowance for credit losses in the current reporting period
|
|
|
Dec 31, 2021
|
||||||||
|
|
|
Allowance for Credit Losses
³
|
||||||||
|
in € m.
|
|
Stage 1
|
|
Stage 2
|
|
Stage 3
|
|
Stage 3 POCI⁴
|
|
Total
|
|
Balance, beginning of year
|
|
|
|
|
|
|
|
|
|
|
|
Movements in financial assets including new business and credit extensions
|
|
(
|
|
|
|
|
|
|
|
|
|
Transfers due to changes in creditworthiness
|
|
|
|
(
|
|
|
|
N/M
|
|
|
|
Changes due to modifications that did not result in
derecognition
|
|
|
|
|
|
|
|
|
|
|
|
Changes in models
|
|
|
|
|
|
|
|
|
|
|
|
Financial assets that have been derecognized during the period²
|
|
|
|
|
|
(
|
|
(
|
|
(
|
|
Recovery of written off amounts
|
|
|
|
|
|
|
|
|
|
|
|
Foreign exchange and other changes
|
|
|
|
(
|
|
(
|
|
(
|
|
(
|
|
Balance, end of reporting period
|
|
|
|
|
|
|
|
|
|
|
|
Provision for Credit Losses excluding country risk
¹
|
|
(
|
|
(
|
|
|
|
|
|
|
|
|
|
|
|
|
|
|
|
|
|
|
1
Movements in financial assets including new business, transfers due to changes in creditworthiness and changes in models add up to Provision for Credit Losses excluding country risk.
2
This position includes charge offs of allowance for credit losses.
3
Allowance for credit losses does not include allowance for country risk amounting to
€
4
million
as of December 31, 2021
.
4
The total amount of undiscounted expected credit losses at initial recognition on financial assets that are purchased or originated credit-impaired initially recognized during the reporting period was
€
0
million
in 2021 and
€
50
million
in 2020
.
Allowance for credit losses against financial assets at amortized cost subject to impairment slightly decreased by
€
51
million
or
1
%
in 2021 mainly driven by Stages 1 and 2:
Stage 1 allowances decreased by
€
104
million
or
19
%
due to the update of macroeconomic outlook, as explained earlier.
Stage 2 allowances decreased by
€
117
million
or
18
%
driven by the update of macroeconomic outlook, as explained earlier.
Stage 3 allowances increased by
€
169
million
or
5
%
driven by new defaults in Private Bank and Investment Bank as well as the increase in allowance against the existing POCI loan portfolio, which were partly offset by the reductions in Corporate Bank and Capital Release Unit.
Our Stage 3 coverage ratio (defined as Allowance for credit losses in Stage 3 (excluding POCI) divided by Financial assets at amortized cost in Stage 3 (excluding POCI)) amounted to
33
%
in the current fiscal year, compared to
34
%
in the prior year.
Due to the positive macroeconomic outlook, transfers from stage 1 and transfers into stage 2 due to changes in creditworthiness declined in 2021 on a year-over-year basis. Accordingly, the improved macroeconomic parameters resulted in higher net allowance charges in stage 1 as well as higher net releases of allowance in stage 2, due to changes in creditworthiness in the full year 2021.
In 2021, transfers into stage 3 went down compared to 2020 and resulted mostly from transfers from stage 2. This reduction was driven by the diminished impact from COVID-19, which was partly offset by the introduction of the new definition of default by EBA in 2021. There has been a moderate increase in net allowance charges in stage 3 due to changes in creditworthiness in 2021.
Development of allowance for credit losses in the previous reporting period
|
|
|
Dec 31, 2020
|
||||||||
|
|
|
Allowance for Credit Losses³
|
||||||||
|
in € m.
|
|
Stage 1
|
|
Stage 2
|
|
Stage 3
|
|
Stage 3 POCI⁴
|
|
Total
|
|
Balance, beginning of year
|
|
|
|
|
|
|
|
|
|
|
|
Movements in financial assets including new business and credit extensions
|
|
(
|
|
|
|
|
|
|
|
|
|
Transfers due to changes in creditworthiness
|
|
|
|
(
|
|
|
|
N/M
|
|
|
|
Changes due to modifications that did not result in
derecognition
|
|
N/M
|
|
N/M
|
|
N/M
|
|
N/M
|
|
N/M
|
|
Changes in models
|
|
|
|
|
|
|
|
|
|
|
|
Financial assets that have been derecognized during the period²
|
|
|
|
|
|
(
|
|
|
|
(
|
|
Recovery of written off amounts
|
|
|
|
|
|
|
|
|
|
|
|
Foreign exchange and other changes
|
|
(
|
|
(
|
|
(
|
|
|
|
(
|
|
Balance, end of reporting period
|
|
|
|
|
|
|
|
|
|
|
|
Provision for Credit Losses excluding country risk¹
|
|
|
|
|
|
|
|
|
|
|
|
|
|
|
|
|
|
|
|
|
|
|
1
Movements in financial assets including new business, transfers due to changes in creditworthiness and changes in models add up to Provision for Credit Losses excluding country risk.
2
This position includes charge offs of allowance for credit losses.
3
Allowance for credit losses does not include allowance for country risk amounting to
€
5
million
as of December 31, 2020
.
4
The total amount of undiscounted expected credit losses at initial recognition on financial assets that are purchased or originated credit-impaired initially recognized during the reporting period was
€
50
million
in 2020 and
€ 0 million
in 2019
.
86
|
|
Deutsche Bank
|
Operating and Financial Review
|
|
|
Annual Report 2021
|
Deutsche Bank Group
|
|
|
|
|
Allowance for credit losses against financial assets at amortized cost subject to impairment
increased by
€
853
million
or
21
%
in 2020 mainly driven by Stage 3:
Stage 1 allowances
remained roughly stable with a slight decrease of
€
5
million
or
1
%
.
Stage 2 allowances
increased by
€
156
million
or
32
%
due to the update of the macroeconomic outlook.
Stage 3 allowances
increased by
€
702
million
or
23
%
driven by new defaults across business divisions and the increase against the existing POCI loan portfolio.
Financial assets at amortized cost by business division
|
|
|
Dec 31, 2021
|
||||||||||||||||||
|
|
|
Gross Carrying Amount¹
|
|
Allowance for Credit Losses
|
||||||||||||||||
|
in € m.
|
|
Stage 1
|
|
Stage 2
|
|
Stage 3
|
|
Stage 3
POCI
|
|
Total
|
|
Stage 1
|
|
Stage 2
|
|
Stage 3
|
|
Stage 3
POCI
|
|
Total
|
|
Corporate Bank
|
|
|
|
|
|
|
|
|
|
|
|
|
|
|
|
|
|
|
|
|
|
Investment Bank
|
|
|
|
|
|
|
|
|
|
|
|
|
|
|
|
|
|
|
|
|
|
Private Bank
|
|
|
|
|
|
|
|
|
|
|
|
|
|
|
|
|
|
|
|
|
|
Asset Management
|
|
|
|
|
|
|
|
|
|
|
|
|
|
|
|
|
|
|
|
|
|
Capital Release Unit
|
|
|
|
|
|
|
|
|
|
|
|
|
|
|
|
|
|
|
|
|
|
Corporate Other
|
|
|
|
|
|
|
|
|
|
|
|
|
|
|
|
|
|
|
|
|
|
Total
|
|
|
|
|
|
|
|
|
|
|
|
|
|
|
|
|
|
|
|
|
|
|
|
|
|
|
|
|
|
|
|
|
|
|
|
|
|
|
|
|
|
|
1
Gross Carrying Amount numbers per business division are reported after a reallocation of cash balances from business divisions to Corporate Other.
|
|
|
Dec 31, 2020
|
||||||||||||||||||
|
|
|
Gross Carrying Amount
|
|
Allowance for Credit Losses
|
||||||||||||||||
|
in € m.
|
|
Stage 1
|
|
Stage 2
|
|
Stage 3
|
|
Stage 3
POCI
|
|
Total
|
|
Stage 1
|
|
Stage 2
|
|
Stage 3
|
|
Stage 3
POCI
|
|
Total
|
|
Corporate Bank
|
|
|
|
|
|
|
|
|
|
|
|
|
|
|
|
|
|
|
|
|
|
Investment Bank
|
|
|
|
|
|
|
|
|
|
|
|
|
|
|
|
|
|
|
|
|
|
Private Bank
|
|
|
|
|
|
|
|
|
|
|
|
|
|
|
|
|
|
|
|
|
|
Asset Management
|
|
|
|
|
|
|
|
|
|
|
|
|
|
|
|
|
|
|
|
|
|
Capital Release Unit
|
|
|
|
|
|
|
|
|
|
|
|
|
|
|
|
|
|
|
|
|
|
Corporate Other
|
|
|
|
|
|
|
|
|
|
|
|
|
|
(
|
|
|
|
|
|
|
|
Total
|
|
|
|
|
|
|
|
|
|
|
|
|
|
|
|
|
|
|
|
|
|
|
|
|
|
|
|
|
|
|
|
|
|
|
|
|
|
|
|
|
|
|
87
|
|
Deutsche Bank
|
Operating and Financial Review
|
|
|
Annual Report 2021
|
Deutsche Bank Group
|
|
|
|
|
Financial assets at amortized cost by industry sector
The below table gives an overview of our asset quality by industry and is based on the NACE code of the counterparty. NACE (Nomenclature des Activités Économiques dans la Communauté Européenne) is a standard European industry classification system. The information below is not fully congruent to the internal risk view applied in the section “Focus industries in light of COVID-19 pandemic”.
|
|
|
Dec 31, 2021
|
||||||||||||||||||
|
|
|
Gross Carrying Amount
|
|
Allowance for Credit Losses
|
||||||||||||||||
|
in € m.
|
|
Stage 1
|
|
Stage 2
|
|
Stage 3
|
|
Stage 3
POCI
|
|
Total
|
|
Stage 1
|
|
Stage 2
|
|
Stage 3
|
|
Stage 3
POCI
|
|
Total
|
|
Agriculture, forestry and fishing
|
|
|
|
|
|
|
|
|
|
|
|
|
|
|
|
|
|
|
|
|
|
Mining and quarrying
|
|
|
|
|
|
|
|
|
|
|
|
|
|
|
|
|
|
|
|
|
|
Manufacturing
|
|
|
|
|
|
|
|
|
|
|
|
|
|
|
|
|
|
|
|
|
|
Electricity, gas, steam and air conditioning supply
|
|
|
|
|
|
|
|
|
|
|
|
|
|
|
|
|
|
|
|
|
|
Water supply, sewerage, waste management and remediation activities
|
|
|
|
|
|
|
|
|
|
|
|
|
|
|
|
|
|
|
|
|
|
Construction
|
|
|
|
|
|
|
|
|
|
|
|
|
|
|
|
|
|
(
|
|
|
|
Wholesale and retail trade, repair of motor vehicles and motorcycles
|
|
|
|
|
|
|
|
|
|
|
|
|
|
|
|
|
|
|
|
|
|
Transport and storage
|
|
|
|
|
|
|
|
|
|
|
|
|
|
|
|
|
|
(
|
|
|
|
Accommodation and food service activities
|
|
|
|
|
|
|
|
|
|
|
|
|
|
|
|
|
|
(
|
|
|
|
Information and communication
|
|
|
|
|
|
|
|
|
|
|
|
|
|
|
|
|
|
|
|
|
|
Financial and insurance activities
|
|
|
|
|
|
|
|
|
|
|
|
|
|
|
|
|
|
|
|
|
|
Real estate activities
|
|
|
|
|
|
|
|
|
|
|
|
|
|
|
|
|
|
|
|
|
|
Professional, scientific and technical activities
|
|
|
|
|
|
|
|
|
|
|
|
|
|
|
|
|
|
|
|
|
|
Administrative and support service activities
|
|
|
|
|
|
|
|
|
|
|
|
|
|
|
|
|
|
|
|
|
|
Public administration and defense, compulsory social security
|
|
|
|
|
|
|
|
|
|
|
|
|
|
|
|
|
|
|
|
|
|
Education
|
|
|
|
|
|
|
|
|
|
|
|
|
|
|
|
|
|
|
|
|
|
Human health services and social work activities
|
|
|
|
|
|
|
|
|
|
|
|
|
|
|
|
|
|
|
|
|
|
Arts, entertainment and recreation
|
|
|
|
|
|
|
|
|
|
|
|
|
|
|
|
|
|
|
|
|
|
Other service activities
|
|
|
|
|
|
|
|
|
|
|
|
|
|
|
|
|
|
|
|
|
|
Activities of households as employers, undifferentiated goods- and services-producing activities of households for own use
|
|
|
|
|
|
|
|
|
|
|
|
|
|
|
|
|
|
|
|
|
|
Activities of extraterritorial organizations and bodies
|
|
|
|
|
|
|
|
|
|
|
|
|
|
|
|
|
|
|
|
|
|
Total
|
|
|
|
|
|
|
|
|
|
|
|
|
|
|
|
|
|
|
|
|
|
|
|
|
|
|
|
|
|
|
|
|
|
|
|
|
|
|
|
|
|
|
|
|
|
Dec 31, 2020
|
||||||||||||||||||
|
|
|
Gross Carrying Amount
|
|
Allowance for Credit Losses
|
||||||||||||||||
|
in € m.
|
|
Stage 1
|
|
Stage 2
|
|
Stage 3
|
|
Stage 3
POCI
|
|
Total
|
|
Stage 1
|
|
Stage 2
|
|
Stage 3
|
|
Stage 3
POCI
|
|
Total
|
|
Agriculture, forestry and fishing
|
|
|
|
|
|
|
|
|
|
|
|
|
|
|
|
|
|
|
|
|
|
Mining and quarrying
|
|
|
|
|
|
|
|
|
|
|
|
|
|
|
|
|
|
|
|
|
|
Manufacturing
|
|
|
|
|
|
|
|
|
|
|
|
|
|
|
|
|
|
|
|
|
|
Electricity, gas, steam and air conditioning supply
|
|
|
|
|
|
|
|
|
|
|
|
|
|
|
|
|
|
|
|
|
|
Water supply, sewerage, waste management and remediation activities
|
|
|
|
|
|
|
|
|
|
|
|
|
|
|
|
|
|
|
|
|
|
Construction
|
|
|
|
|
|
|
|
|
|
|
|
|
|
|
|
|
|
|
|
|
|
Wholesale and retail trade, repair of motor vehicles and motorcycles
|
|
|
|
|
|
|
|
|
|
|
|
|
|
|
|
|
|
|
|
|
|
Transport and storage
|
|
|
|
|
|
|
|
|
|
|
|
|
|
|
|
|
|
|
|
|
|
Accommodation and food service activities
|
|
|
|
|
|
|
|
|
|
|
|
|
|
|
|
|
|
|
|
|
|
Information and communication
|
|
|
|
|
|
|
|
|
|
|
|
|
|
|
|
|
|
|
|
|
|
Financial and insurance activities
|
|
|
|
|
|
|
|
|
|
|
|
|
|
|
|
|
|
|
|
|
|
Real estate activities
|
|
|
|
|
|
|
|
|
|
|
|
|
|
|
|
|
|
|
|
|
|
Professional, scientific and technical activities
|
|
|
|
|
|
|
|
|
|
|
|
|
|
|
|
|
|
|
|
|
|
Administrative and support service activities
|
|
|
|
|
|
|
|
|
|
|
|
|
|
|
|
|
|
|
|
|
|
Public administration and defense, compulsory social security
|
|
|
|
|
|
|
|
|
|
|
|
|
|
|
|
|
|
|
|
|
|
Education
|
|
|
|
|
|
|
|
|
|
|
|
|
|
|
|
|
|
|
|
|
|
Human health services and social work activities
|
|
|
|
|
|
|
|
|
|
|
|
|
|
|
|
|
|
|
|
|
|
Arts, entertainment and recreation
|
|
|
|
|
|
|
|
|
|
|
|
|
|
|
|
|
|
|
|
|
|
Other service activities
|
|
|
|
|
|
|
|
|
|
|
|
|
|
|
|
|
|
|
|
|
|
Activities of households as employers, undifferentiated goods- and services- producing activities of households for own use
|
|
|
|
|
|
|
|
|
|
|
|
|
|
|
|
|
|
|
|
|
|
Activities of extraterritorial organizations and bodies
|
|
|
|
|
|
|
|
|
|
|
|
|
|
|
|
|
|
|
|
|
|
Total
|
|
|
|
|
|
|
|
|
|
|
|
|
|
|
|
|
|
|
|
|
|
|
|
|
|
|
|
|
|
|
|
|
|
|
|
|
|
|
|
|
|
|
88
|
|
Deutsche Bank
|
Operating and Financial Review
|
|
|
Annual Report 2021
|
Deutsche Bank Group
|
|
|
|
|
Financial assets at amortized cost by region
|
|
|
Dec 31, 2021
|
||||||||||||||||||
|
|
|
Gross Carrying Amount
|
|
Allowance for Credit Losses
|
||||||||||||||||
|
in € m.
|
|
Stage 1
|
|
Stage 2
|
|
Stage 3
|
|
Stage 3
POCI
|
|
Total
|
|
Stage 1
|
|
Stage 2
|
|
Stage 3
|
|
Stage 3
POCI
|
|
Total
|
|
Germany
|
|
|
|
|
|
|
|
|
|
|
|
|
|
|
|
|
|
|
|
|
|
Western Europe
(excluding Germany)
|
|
|
|
|
|
|
|
|
|
|
|
|
|
|
|
|
|
|
|
|
|
Eastern Europe
|
|
|
|
|
|
|
|
|
|
|
|
|
|
|
|
|
|
|
|
|
|
North America
|
|
|
|
|
|
|
|
|
|
|
|
|
|
|
|
|
|
|
|
|
|
Central and South America
|
|
|
|
|
|
|
|
|
|
|
|
|
|
|
|
|
|
|
|
|
|
Asia/Pacific
|
|
|
|
|
|
|
|
|
|
|
|
|
|
|
|
|
|
|
|
|
|
Africa
|
|
|
|
|
|
|
|
|
|
|
|
|
|
|
|
|
|
|
|
|
|
Other
|
|
|
|
|
|
|
|
|
|
|
|
|
|
|
|
|
|
(
|
|
|
|
Total
|
|
|
|
|
|
|
|
|
|
|
|
|
|
|
|
|
|
|
|
|
|
|
|
|
|
|
|
|
|
|
|
|
|
|
|
|
|
|
|
|
|
|
|
|
|
Dec 31, 2020
|
||||||||||||||||||
|
|
|
Gross Carrying Amount
|
|
Allowance for Credit Losses
|
||||||||||||||||
|
in € m.
|
|
Stage 1
|
|
Stage 2
|
|
Stage 3
|
|
Stage 3
POCI
|
|
Total
|
|
Stage 1
|
|
Stage 2
|
|
Stage 3
|
|
Stage 3
POCI
|
|
Total
|
|
Germany
|
|
|
|
|
|
|
|
|
|
|
|
|
|
|
|
|
|
|
|
|
|
Western Europe
(excluding Germany)
|
|
|
|
|
|
|
|
|
|
|
|
|
|
|
|
|
|
|
|
|
|
Eastern Europe
|
|
|
|
|
|
|
|
|
|
|
|
|
|
|
|
|
|
|
|
|
|
North America
|
|
|
|
|
|
|
|
|
|
|
|
|
|
|
|
|
|
|
|
|
|
Central and South America
|
|
|
|
|
|
|
|
|
|
|
|
|
|
|
|
|
|
|
|
|
|
Asia/Pacific
|
|
|
|
|
|
|
|
|
|
|
|
|
|
|
|
|
|
|
|
|
|
Africa
|
|
|
|
|
|
|
|
|
|
|
|
|
|
|
|
|
|
|
|
|
|
Other
|
|
|
|
|
|
|
|
|
|
|
|
|
|
|
|
|
|
(
|
|
|
|
Total
|
|
|
|
|
|
|
|
|
|
|
|
|
|
|
|
|
|
|
|
|
|
|
|
|
|
|
|
|
|
|
|
|
|
|
|
|
|
|
|
|
|
|
Financial assets at amortized cost by rating class
|
|
|
Dec 31, 2021
|
||||||||||||||||||
|
|
|
Gross Carrying Amount
|
|
Allowance for Credit Losses
|
||||||||||||||||
|
in € m.
|
|
Stage 1
|
|
Stage 2
|
|
Stage 3
|
|
Stage 3
POCI
|
|
Total
|
|
Stage 1
|
|
Stage 2
|
|
Stage 3
|
|
Stage 3
POCI
|
|
Total
|
|
iAAA–iAA
|
|
|
|
|
|
|
|
|
|
|
|
|
|
|
|
|
|
|
|
|
|
iA
|
|
|
|
|
|
|
|
|
|
|
|
|
|
|
|
|
|
|
|
|
|
iBBB
|
|
|
|
|
|
|
|
|
|
|
|
|
|
|
|
|
|
|
|
|
|
iBB
|
|
|
|
|
|
|
|
|
|
|
|
|
|
|
|
|
|
|
|
|
|
iB
|
|
|
|
|
|
|
|
|
|
|
|
|
|
|
|
|
|
|
|
|
|
iCCC and below
|
|
|
|
|
|
|
|
|
|
|
|
|
|
|
|
|
|
|
|
|
|
Total
|
|
|
|
|
|
|
|
|
|
|
|
|
|
|
|
|
|
|
|
|
|
|
|
|
|
|
|
|
|
|
|
|
|
|
|
|
|
|
|
|
|
|
|
|
|
Dec 31, 2020
|
||||||||||||||||||
|
|
|
Gross Carrying Amount
|
|
Allowance for Credit Losses
|
||||||||||||||||
|
in € m.
|
|
Stage 1
|
|
Stage 2
|
|
Stage 3
|
|
Stage 3
POCI
|
|
Total
|
|
Stage 1
|
|
Stage 2
|
|
Stage 3
|
|
Stage 3
POCI
|
|
Total
|
|
iAAA–iAA
|
|
|
|
|
|
|
|
|
|
|
|
|
|
|
|
|
|
|
|
|
|
iA
|
|
|
|
|
|
|
|
|
|
|
|
|
|
|
|
|
|
|
|
|
|
iBBB
|
|
|
|
|
|
|
|
|
|
|
|
|
|
|
|
|
|
|
|
|
|
iBB
|
|
|
|
|
|
|
|
|
|
|
|
|
|
|
|
|
|
|
|
|
|
iB
|
|
|
|
|
|
|
|
|
|
|
|
|
|
|
|
|
|
|
|
|
|
iCCC and below
|
|
|
|
|
|
|
|
|
|
|
|
|
|
|
|
|
|
|
|
|
|
Total
|
|
|
|
|
|
|
|
|
|
|
|
|
|
|
|
|
|
|
|
|
|
|
|
|
|
|
|
|
|
|
|
|
|
|
|
|
|
|
|
|
|
|
Our existing commitments to lend additional funds to debtors with Stage 3 financial assets at amortized cost amounted to
€
384
million
as of December 31, 2021 and
€
446
million
as of December 31, 2020.
Collateral held against financial assets at amortized cost in stage 3
|
|
|
Dec 31, 2021
|
|
Dec 31, 2020
|
||||||||
|
in € m.
|
|
Gross Carrying
Amount
|
|
Collateral
|
|
Guarantees
|
|
Gross Carrying
Amount
|
|
Collateral
|
|
Guarantees
|
|
Financial Assets at Amortized Cost (Stage 3)
|
|
|
|
|
|
|
|
|
|
|
|
|
|
|
|
|
|
|
|
|
|
|
|
|
|
|
1
Stage 3 consists here only of non-POCI assets.
In 2021, collateral and guarantees held against financial assets at amortized cost in stage 3 increased by
€
325
million
, or
8
%
mainly driven by Investment Bank and Private Bank.
Due to full collateralization we did not recognize an allowance for credit losses against Financial assets at amortized cost in Stage 3 for
€
1,130
million
in 2021 and
€
625
million
in 2020.
89
|
|
Deutsche Bank
|
Operating and Financial Review
|
|
|
Annual Report 2021
|
Deutsche Bank Group
|
|
|
|
|
Modified Assets at Amortized Cost
A financial asset is considered modified when its contractual cash flows are renegotiated or otherwise modified. Renegotiation or modification may or may not lead to derecognition of the old and recognition of the new financial instrument. This section covers modified financial assets that have not been derecognized.
Under IFRS 9, when the terms of a Financial Asset are renegotiated or modified and the modification does not result in derecognition, a gain or loss is recognized in the income statement as the difference between the original contractual cash flows and the modified cash flows discounted at the original effective interest rate (EIR). For modified financial assets the determination of whether the asset’s credit risk has increased significantly reflects the comparison of:
- – The remaining lifetime probability of default (PD) at the reporting date based on the modified terms; with
- – The remaining lifetime PD estimated based on data at initial recognition and based on the original contractual terms.
The following table provides the overview of modified financial assets at amortized cost in the reporting periods broken down into IFRS 9 stages.
Modified Assets at Amortized Cost
|
|
|
Dec 31, 2021
|
|
Dec 31, 2020
|
||||||||||||||||
|
in € m.
|
|
Stage 1
|
|
Stage 2
|
|
Stage 3
|
|
Stage 3
POCI
|
|
Total
|
|
Stage 1
|
|
Stage 2
|
|
Stage 3
|
|
Stage 3
POCI
|
|
Total
|
|
Amortized cost carrying amount prior to modification
|
|
|
|
|
|
|
|
|
|
|
|
|
|
|
|
|
|
|
|
|
|
Net modification gain/losses recognized
|
|
(
|
|
|
|
(
|
|
|
|
(
|
|
|
|
|
|
(
|
|
|
|
(
|
|
|
|
|
|
|
|
|
|
|
|
|
|
|
|
|
|
|
|
|
|
|
In 2021, we have observed the decrease of
€
113
million
or
74
%
in modified assets at amortized cost due to the non-recurring large client related modifications, which were granted in 2020. We did not include any COVID-19 driven modifications into the above table. For further details related to COVID-19 driven modifications, please refer to “Legislative and non-legislative moratoria and public guarantee schemes in light of COVID-19 pandemic”
In 2021, we have not observed any amounts of modified assets that have been upgraded to stage 1. We have not observed any subsequent re-deterioration of those assets into stages 2 and 3.
In 2020, we have observed immaterial amounts of modified assets that have been upgraded to stage 1. We have not observed any subsequent re-deterioration of those assets into stages 2 and 3.
Financial Assets at Fair value through Other Comprehensive Income
The fair value of financial assets at Fair value through Other Comprehensive Income (FVOCI) subject to impairment was
€
29
billion
at December 31, 2021, compared to
€
56
billion
at December 31, 2020. Allowance for credit losses against these assets remained at very low levels (
€
41
million
as of December 31, 2021 and
€
20
million
as of December 31, 2020). Due to immateriality no further breakdown is provided for financial assets at FVOCI.
Off-balance sheet lending commitments and guarantee business
The following tables provide an overview of the nominal amount and credit loss allowance for our off-balance sheet financial asset class broken down into stages as per IFRS 9 requirements
.
90
|
|
Deutsche Bank
|
Operating and Financial Review
|
|
|
Annual Report 2021
|
Deutsche Bank Group
|
|
|
|
|
Development of nominal amount in the current reporting period
|
|
|
Dec 31, 2021
|
||||||||
|
|
|
Nominal Amount
|
||||||||
|
in € m.
|
|
Stage 1
|
|
Stage 2
|
|
Stage 3
|
|
Stage 3 POCI
|
|
Total
|
|
Balance, beginning of year
|
|
|
|
|
|
|
|
|
|
|
|
Movements including new business
|
|
|
|
|
|
(
|
|
|
|
|
|
Transfers due to changes in creditworthiness
|
|
(
|
|
|
|
|
|
0
|
|
|
|
Changes in models
|
|
|
|
|
|
|
|
0
|
|
|
|
Foreign exchange and other changes
|
|
|
|
|
|
|
|
0
|
|
|
|
Balance, end of reporting period
|
|
|
|
|
|
|
|
|
|
|
|
of which: Financial guarantees
|
|
|
|
|
|
|
|
0
|
|
|
|
|
|
|
|
|
|
|
|
|
|
|
Development of nominal amount in the previous reporting period
|
|
|
Dec 31, 2020
|
||||||||
|
|
|
Nominal Amount
|
||||||||
|
in € m.
|
|
Stage 1
|
|
Stage 2
|
|
Stage 3
|
|
Stage 3 POCI
|
|
Total
|
|
Balance, beginning of year
|
|
|
|
|
|
|
|
|
|
|
|
Movements including new business
|
|
|
|
(
|
|
|
|
|
|
|
|
Transfers due to changes in creditworthiness
|
|
(
|
|
|
|
|
|
|
|
|
|
Changes in models
|
|
|
|
|
|
|
|
|
|
|
|
Foreign exchange and other changes
|
|
(
|
|
(
|
|
(
|
|
|
|
(
|
|
Balance, end of reporting period
|
|
|
|
|
|
|
|
|
|
|
|
of which: Financial guarantees
|
|
|
|
|
|
|
|
|
|
|
|
|
|
|
|
|
|
|
|
|
|
|
Development of allowance for credit losses in the current reporting period
|
|
|
Dec 31, 2021
|
||||||||
|
|
|
Allowance for Credit Losses
2
|
||||||||
|
in € m.
|
|
Stage 1
|
|
Stage 2
|
|
Stage 3
|
|
Stage 3 POCI
|
|
Total
|
|
Balance, beginning of year
|
|
|
|
|
|
|
|
0
|
|
|
|
Movements including new business
|
|
(
|
|
|
|
|
|
0
|
|
|
|
Transfers due to changes in creditworthiness
|
|
|
|
(
|
|
|
|
0
|
|
|
|
Changes in models
|
|
|
|
|
|
|
|
|
|
|
|
Foreign exchange and other changes
|
|
|
|
|
|
|
|
0
|
|
|
|
Balance, end of reporting period
|
|
|
|
|
|
|
|
0
|
|
|
|
of which: Financial guarantees
|
|
|
|
|
|
|
|
0
|
|
|
|
Provision for Credit Losses excluding country risk
1
|
|
(
|
|
|
|
|
|
0
|
|
|
|
|
|
|
|
|
|
|
|
|
|
|
1
The above table breaks down the impact on provision for credit losses from movements in financial assets including new business, transfers due to changes in creditworthiness and changes in models
.
2
Allowance for credit losses does not include allowance for country risk amounting to
€
6
million
as of December 31, 2021.
Development of allowance for credit losses in the previous reporting period
|
|
|
Dec 31, 2020
|
||||||||
|
|
|
Allowance for Credit Losses
2
|
||||||||
|
in € m.
|
|
Stage 1
|
|
Stage 2
|
|
Stage 3
|
|
Stage 3 POCI
|
|
Total
|
|
Balance, beginning of year
|
|
|
|
|
|
|
|
|
|
|
|
Movements including new business
|
|
|
|
|
|
|
|
|
|
|
|
Transfers due to changes in creditworthiness
|
|
|
|
|
|
(
|
|
|
|
|
|
Changes in models
|
|
|
|
|
|
|
|
|
|
|
|
Foreign exchange and other changes
|
|
|
|
|
|
(
|
|
|
|
|
|
Balance, end of reporting period
|
|
|
|
|
|
|
|
|
|
|
|
of which: Financial guarantees
|
|
|
|
|
|
|
|
|
|
|
|
Provision for Credit Losses excluding country risk
1
|
|
|
|
|
|
|
|
|
|
|
|
|
|
|
|
|
|
|
|
|
|
|
1
The above table breaks down the impact on provision for credit losses from movements in financial assets including new business, transfers due to changes in creditworthiness and changes in models.
2
Allowance for credit losses does not include allowance for country risk amounting to
€
4
million
as of December 31, 2020
.
Legal Claims
Assets subject to enforcement activity consist of assets, which have been fully or partially written off and the Group still continues to pursue recovery of the asset. Such enforcement activity comprises for example cases where the bank continues to devote resources (e.g. our Legal Department/CRM workout unit) towards recovery, either via legal channels or third party recovery agents. Enforcement activity also applies to cases where the Bank maintains outstanding and unsettled legal claims. This is irrespective of whether amounts are expected to be recovered and the recovery timeframe. It may be common practice in certain jurisdictions for recovery cases to span several years.
Amounts outstanding on financial assets that were written off during the reporting period and are still subject to enforcement activity amounted to
€
234
million
in fiscal year 2021, mainly in Corporate Bank, Investment Bank and Private Bank. In 2020, legal claims amounted to
€
295
million
, mainly in Corporate Bank, Investment Bank and Private Bank.
91
|
|
Deutsche Bank
|
Operating and Financial Review
|
|
|
Annual Report 2021
|
Deutsche Bank Group
|
|
|
|
|
Renegotiated and forborne assets at amortized costs
For economic or legal reasons we might enter into a forbearance agreement with a borrower who faces or will face financial difficulties in order to ease the contractual obligation for a limited period of time. A case-by-case approach is applied for our corporate clients considering each transaction and client-specific facts and circumstances. For consumer loans we offer forbearances for a limited period of time, in which the total or partial outstanding or future instalments are deferred to a later point of time. However, the amount not paid including accrued interest during this period must be re-compensated at a later point of time. Repayment options include distribution over residual tenor, a one-off payment or a tenor extension. Forbearances are restricted and depending on the economic situation of the client, our risk management strategies and the local legislation. In case a forbearance agreement is entered into, an impairment measurement is conducted as described below, an impairment charge is taken if necessary and the loan is subsequently recorded as impaired.
In our management and reporting of forborne assets at amortized costs, we are following the EBA definition for forbearances and non-performing loans (Implementing Technical Standards (ITS) on Supervisory reporting on forbearance and non-performing exposures under article 99(4) of Regulation (EU) No 575/2013). Once the conditions mentioned in the ITS are met, we report the loan as being forborne; we remove the asset from our forbearance reporting, once the discontinuance criteria in the ITS are met (i.e., the contract is considered as performing, a minimum two year probation period has passed, regular payments of more than an insignificant aggregate amount of principal or interest have been made during at least half of the probation period, and none of the exposures to the debtor is more than 30 days past-due at the end of the probation period).
In 2020, forbearance measures granted as a consequence of the COVID-19 pandemic have been added to the above regulations and are included in the following table, even if these measures, in accordance with EBA guidance, do in general not trigger a stage transition. COVID-19 related moratoria in contrast are not relevant for the below table. For further details please refer to the section “Legislative and non-legislative moratoria and public guarantee schemes in light of COVID-19 pandemic”.
Forborne financial assets at amortized cost
|
|
|
Dec 31, 2021
|
|
|
|
Dec 31, 2020
|
||||||||||||||||||
|
|
|
Performing
|
|
Non-performing
|
|
Total
forborne
loans at
amortized
cost
|
|
Performing
|
|
Non-performing
|
|
Total
forborne
loans at
amortized
cost
|
||||||||||||
|
in € m.
|
|
Stage 1
|
|
Stage 2
|
|
Stage 1
|
|
Stage 2
|
|
Stage 3
|
|
|
|
Stage 1
|
|
Stage 2
|
|
Stage 1
|
|
Stage 2
|
|
Stage 3
|
|
|
|
German
|
|
690
|
|
1,903
|
|
0
|
|
17
|
|
1,056
|
|
3,665
|
|
1,014
|
|
1,404
|
|
2
|
|
18
|
|
1,297
|
|
3,735
|
|
Non-German
|
|
2,478
|
|
3,489
|
|
135
|
|
25
|
|
3,949
|
|
10,076
|
|
4,515
|
|
2,388
|
|
10
|
|
35
|
|
2,775
|
|
9,723
|
|
Total
|
|
3,168
|
|
5,391
|
|
135
|
|
42
|
|
5,004
|
|
13,741
|
|
5,529
|
|
3,792
|
|
12
|
|
53
|
|
4,072
|
|
13,459
|
|
|
|
|
|
|
|
|
|
|
|
|
|
|
|
|
|
|
|
|
|
|
|
|
|
|
Development of forborne financial assets at amortized cost
|
in € m.
|
|
Dec 31, 2021
|
|
Dec 31, 2020
|
|
Balance beginning of period
|
|
13,459
|
|
4,796
|
|
Classified as forborne during the year
|
|
4,945
|
|
10,141
|
|
Transferred to non-forborne during the year (including repayments)
|
|
(4,934)
|
|
(1,371)
|
|
Charge-offs
|
|
(43)
|
|
(35)
|
|
Exchange rate and other movements
|
|
313
|
|
(72)
|
|
Balance end of period
|
|
13,741
|
|
13,459
|
|
|
|
|
|
|
Forborne assets at amortized cost slightly increased by € 282 million, or 2 % in 2021.
Forborne assets at amortized cost increased by € 8.7 billion in 2020, predominantly due to the inclusion of Forbearance measures granted as a consequence of the COVID-19 pandemic.
Forborne assets at amortized cost slightly decreased by € 45 million, or 1 % in 2019.
92
|
|
Deutsche Bank
|
Operating and Financial Review
|
|
|
Annual Report 2021
|
Deutsche Bank Group
|
|
|
|
|
Collateral Obtained
We obtain collateral on the balance sheet only in certain cases by either taking possession of collateral held as security or by calling upon other credit enhancements. Collateral obtained is made available for sale in an orderly fashion or through public auctions, with the proceeds used to repay or reduce outstanding indebtedness. Generally we do not occupy obtained properties for our business use. The residential real estate collateral obtained in 2020 refers predominantly to our exposures in Spain.
Collateral Obtained during the reporting period
|
in € m.
|
|
2021
|
|
2020²
|
|
Commercial real estate
|
|
|
|
|
|
Residential real estate
1
|
|
|
|
|
|
Other
|
|
|
|
|
|
Total collateral obtained during the reporting period
|
|
|
|
|
|
|
|
|
|
|
1
Carrying amount of foreclosed residential real estate properties amounted to
€
67
million
as of December 31, 2021 and
€
89
million
as of December 31,2020. (Numbers have been restated compared to prior year disclosure).
2
Numbers have been restated compared to prior year disclosure
.
The collateral obtained, as shown in the table above, excludes collateral recorded as a result of consolidating securitization trusts under IFRS 10. In 2021 the Group obtained
€
46
million
collateral related to these trusts, compared to
€
54
million
in 2020.
Derivatives – Credit Valuation Adjustment
We establish counterparty Credit Valuation Adjustment (CVA) for OTC derivative transactions to cover expected credit losses. The adjustment amount is determined by assessing the potential credit exposure to a given counterparty and taking into account any collateral held, the effect of any relevant netting arrangements, expected loss given default and the credit risk, based on available market information, including CDS spreads.
Treatment of default situations under derivatives
Unlike standard loan assets, we generally have more options to manage the credit risk in our derivatives transactions when movement in the current replacement costs or the behavior of our counterparty indicate that there is the risk that upcoming payment obligations under the transactions might not be honored. In these situations, we are frequently able under the relevant derivatives agreements to obtain additional collateral or to terminate and close-out the derivative transactions at short notice.
The master agreements and associated collateralization agreements for OTC derivative transactions executed with our clients typically result in the majority of our credit exposure being secured by collateral. It also provides for a broad set of standard or bespoke termination rights, which allow us to respond swiftly to a counterparty’s default or to other circumstances which indicate a high probability of failure.
Our contractual termination rights are supported by internal policies and procedures with defined roles and responsibilities which ensure that potential counterparty defaults are identified and addressed in a timely fashion. These procedures include necessary settlement and trading restrictions. When our decision to terminate derivative transactions results in a residual net obligation owed by the counterparty, we restructure the obligation into a non-derivative claim and manage it through our regular work-out process. As a consequence, for accounting purposes we typically do not show any nonperforming derivatives.
Wrong-way risk occurs when exposure to a counterparty is adversely correlated with the credit quality of that counterparty. In compliance with Article 291(2) and (4) CRR we have a monthly process to monitor several layers of wrong-way risk (specific wrong-way risk, general explicit wrong-way risk at country/industry/region levels and general implicit wrong-way risk, whereby relevant exposures arising from transactions subject to wrong-way risk are automatically selected and presented for comment to the responsible credit officer). A wrong-way risk report is then sent to Credit Risk senior management on a monthly basis. In addition, we utilized our established process for calibrating our own alpha factor (as defined in Article 284 (9) CRR) to estimate the overall wrong-way risk in our derivatives and securities financing transactions portfolio. The Private Bank Germany’s derivative counterparty risk is immaterial to the Group and collateral held is typically in the form of cash.
93
|
|
Deutsche Bank
|
Operating and Financial Review
|
|
|
Annual Report 2021
|
Deutsche Bank Group
|
|
|
|
|
Managing and mitigation of Credit Risk
Managing Credit Risk on counterparty level
Credit-related counterparties are principally allocated to credit officers within credit teams which are organized by types of counterparty (such as financial institutions, corporates or private individuals) or economic area (e.g., emerging markets) and supported by dedicated rating analyst teams where deemed necessary. The individual credit officers have the relevant expertise and experience to manage the credit risks associated with these counterparties and their associated credit related transactions. For retail clients, credit decision making and credit monitoring is highly automated for efficiency reasons. Credit Risk Management has full oversight of the respective processes and tools used in these highly automated retail credit processes. It is the responsibility of each credit officer to undertake ongoing credit monitoring for their allocated portfolio of counterparties. We also have procedures in place intended to identify at an early stage credit exposures for which there may be an increased risk of loss.
In instances where we have identified counterparties where there is a concern that the credit quality has deteriorated or appears likely to deteriorate to the point where they present a heightened risk of loss in default, the respective exposure is generally placed on a “watchlist”. We aim to identify counterparties that, on the basis of the application of our risk management tools, demonstrate the likelihood of problems well in advance in order to effectively manage the credit exposure and minimize potential losses. The objective of this early warning system is to address potential problems while adequate options for action are still available. This early risk detection is a tenet of our credit culture and is intended to ensure that greater attention is paid to such exposures.
Credit limits are established by the Credit Risk Management function via the execution of assigned credit authorities. This also applies to settlement risk that must fall within limits pre-approved by Credit Risk Management considering risk appetite and in a manner that reflects expected settlement patterns for the subject counterparty. Credit approvals are documented by the signing of the credit report by the respective credit authority holders and retained for future reference.
Credit authority is generally assigned to individuals as personal credit authority according to the individual’s professional qualification, experience and training. All assigned credit authorities are reviewed on a periodic basis to help ensure that they are commensurate with the individual performance of the authority holder.
Where an individual’s personal authority is insufficient to establish required credit limits, the transaction is referred to a higher credit authority holder or where necessary to an appropriate credit committee. Where personal and committee authorities are insufficient to establish appropriate limits, the case is referred to the Management Board for approval.
Mitigation of Credit Risk on counterparty level
In addition to determining counterparty credit quality and our risk appetite, we also use various credit risk mitigation techniques to optimize credit exposure and reduce potential credit losses. Credit risk mitigants are applied in the following forms:
- – Comprehensive and enforceable credit documentation with adequate terms and conditions.
- – Collateral in its various forms to reduce losses by increasing the recovery of obligations. Key principles for collateral management include legal effectiveness and enforceability, prudent and realistic collateral valuations, risk and regulatory capital reduction, as well as cost efficiency.
- – Risk transfers, which shift the risk of default of an obligor to a third party including hedging executed by our Strategic Corporate Lending (SCL). Other de-risking tools such as securitizations etc. may also be employed
- – Netting and collateral arrangements which reduce the credit exposure from derivatives and securities financing transactions (e.g. repo transactions).
- – Hedging of derivatives counterparty risk including CVA, using primarily CDS contracts via our Counterparty Portfolio Management desk
Collateral
We regularly agree on collateral to be received from customers that are subject to credit risk or to be provided by third parties agreed by legally effective and enforceable contracts, documented by a written and reasoned legal opinion. Collateral is credit protection in the form of (funded) assigned or pledged assets or (unfunded) third-party obligations that serves to mitigate the inherent risk of credit loss in an exposure, by either substituting the counterparty default risk or improving recoveries in the event of a default. We generally take all types of valuable and eligible collateral for our respective businesses but may limit accepted collateral types for specific businesses or regions as customary in the respective market or driven by purpose of efficiency. While collateral can be an alternative source of repayment, it does not replace the necessity of high quality underwriting standards and a thorough assessment of the debt service ability of the counterparty in line with CRR Article 194 (9).
94
|
|
Deutsche Bank
|
Operating and Financial Review
|
|
|
Annual Report 2021
|
Deutsche Bank Group
|
|
|
|
|
We segregate collateral received into the following two types:
- – Financial and other collateral, which enables us to recover all or part of the outstanding exposure by liquidating the collateral asset provided, in cases where the counterparty is unable or unwilling to fulfill its primary obligations. Cash collateral, securities (equity, bonds), collateral pledges or assignments of other claims or inventory, movable assets (i.e., plant, machinery, ships and aircraft) and real estate typically fall into this category. All financial collateral is regularly, mostly daily, revalued and measured against the respective credit exposure. The value of other collateral, including real estate, is monitored based upon established processes that includes regular reviews or revaluations by internal and/or external experts.
- – Guarantee collateral, which complements the counterparty’s ability to fulfill its obligation under the legal contract and as such is provided by uncorrelated third parties. Letters of credit, insurance contracts, export credit insurance, guarantees, credit derivatives and risk participations typically fall into this category. Guarantees and strong letters of comfort provided by correlated group members of customers (generally the parent company) are also accepted and used for risk transfer in approved rating scorecards. Guarantee collateral with a non-investment grade rating of the guarantor is limited.
Our processes seek to ensure that the collateral we accept for risk mitigation purposes is of high quality. This includes processes to generally ensure legally effective and enforceable documentation for realizable and measurable collateral assets which are evaluated within the on-boarding process by dedicated internal appraisers or teams with the respective qualification, skills and experience or adequate external valuers mandated in regulated processes. The applied valuations follow generally accepted valuation methods or models. Ongoing correctness of values is monitored by collateral type specific appropriate frequent and event-driven reviews considering relevant risk parameters. Revaluations are applied in cases of identified probable material deterioration and future monitoring may be adjusted respectively. The assessment of the suitability of collateral for a specific transaction is part of the credit decision and must be undertaken in a conservative way, including collateral haircuts that are applied. We have collateral type specific haircuts in place which are regularly reviewed and approved. In this regard, we strive to avoid “wrong-way” risk characteristics where the counterparty’s risk is positively correlated with the risk of deterioration in the collateral value. For guarantee collateral, the process for the analysis of the guarantor’s creditworthiness is aligned to the credit assessment process for counterparties.
The valuation of collateral is considered under a liquidation scenario. Liquidation value is equal to the expected proceeds of collateral monetization/realization in a base case scenario, wherein a fair price is achieved through careful preparation and orderly liquidation of the collateral. Collateral can either move in value over time (dynamic value) or not (static value). The dynamic liquidation value generally includes a safety margin or haircut over realizable value to address liquidity and marketability aspects.
The Group assigns a liquidation value to eligible collateral, based on, among other things:
- – the market value and / or lending value, notional amount or face value of a collateral as a starting point;
- – the type of collateral; the currency mismatch, if any, between the secured exposure and the collateral; and a maturity mismatch, if any;
- – the applicable legal environment or jurisdiction (onshore versus offshore collateral);
- – the market liquidity and volatility in relation to agreed termination clauses;
- – the correlation between the performance of the borrower and the value of the collateral, e.g., in the case of the pledge of a borrower’s own shares or securities (in this case generally full correlation leads to no liquidation value);
- – the quality of physical collateral and potential for litigation or environmental risks; and
- – a determined collateral type specific haircut (0 – 100 %) reflecting collection risks (i.e. price risks over the average liquidation period and processing/utilization/sales costs) as specified in the respective policies.
Collateral haircut settings are typically based on available historic internal and/or external recovery data (expert opinions may also be used, where appropriate). They also incorporate a forward-looking component in the form of collection and valuation forecast provided by experts within Risk Management. Considering the expected proceeds from the liquidation of the different collateral types, respective value fluctuations, market specific liquidation costs and time applied haircuts vary between 0 to 100 %. When data is not sufficiently available or inconclusive, more conservative haircuts than otherwise used must be applied. Haircut settings are reviewed at least annually.
Risk transfers
Risk transfers to third parties form a key part of our overall risk management process and are executed in various forms, including outright sales, single name and portfolio hedging, and securitizations. Risk transfers are conducted by the respective business units and by Strategic Corporate Lending (“SCL”), in accordance with specifically approved mandates.
SCL manages the residual credit risk of loans and lending-related commitments of the institutional and corporate credit portfolio, the leveraged portfolio and the medium-sized German companies’ portfolio across our CB and IB divisions.
95
|
|
Deutsche Bank
|
Operating and Financial Review
|
|
|
Annual Report 2021
|
Deutsche Bank Group
|
|
|
|
|
Acting as a central pricing reference, SCL provides the businesses with an observed or derived capital market rate for loan applications; however, the decision of whether or not the business can enter into the credit risk remains exclusively with Credit Risk Management.
SCL concentrates on two primary objectives within the credit risk framework to enhance risk management discipline, improve returns and use capital more efficiently:
- – to reduce single-name credit risk concentrations within the credit portfolio and
- – to manage credit exposures by utilizing techniques including loan sales, securitization via collateralized loan obligations, sub-participations and single-name and portfolio credit default swaps.
Netting and collateral arrangements for derivatives and Securities Financing Transactions
Netting is applicable to both exchange traded derivatives and OTC derivatives. Netting is also applied to securities financing transactions (e.g. repurchase, securities lending and margin lending transactions) as far as documentation, structure and nature of the risk mitigation allow netting with the underlying credit risk in accordance with applicable law and the Bank’s Financial Contracts Netting and Collateral Policies and Procedures – Legal (collectively, “Netting Policies”)..
All exchange traded derivatives are cleared through central counterparties (CCPs), which interpose themselves between the trading entities by becoming the counterparty to each of the entities. Where legally required or where available and to the extent agreed with our counterparties, we also use CCP clearing for our OTC derivative transactions.
The Dodd-Frank Act and related Commodity Futures Trading Commission (CFTC) rules require CCP clearing in the United States for certain standardized OTC derivative transactions, including certain interest rate swaps and index credit default swaps, subject to limited exceptions when facing certain counterparties. The European Regulation (EU) No 648/2012 on OTC Derivatives, Central Counterparties and Trade Repositories (EMIR) and the Commission Delegated Regulations (EU) 2015/2205, (EU) 2015/592 and (EU) 2016/1178 based thereupon introduced mandatory CCP clearing in the EU for certain standardized OTC derivatives transactions. Mandatory CCP clearing in the EU began for certain interest rate derivatives on June 21, 2016 and for certain iTraxx-based credit derivatives and additional interest rate derivatives on February 9, 2017. Article 4 (2) of EMIR authorizes competent authorities to exempt intragroup transactions from mandatory CCP clearing, provided certain requirements, such as full consolidation of the intragroup transactions and the application of an appropriate centralized risk evaluation, measurement and control procedure are met. The Bank successfully applied for the clearing exemption for a number of its regulatory-consolidated subsidiaries with intragroup derivatives, including e.g., Deutsche Bank Securities Inc. and Deutsche Bank Luxembourg S.A. As of December 31, 2021, the Bank is allowed to make use of intragroup exemptions from the EMIR clearing obligation for 57 bilateral intragroup relationships. The extent of the exemptions differs as not all entities enter into relevant transaction types subject to the clearing obligation. Of the 57 intragroup relationships, 14 are relationships where both entities are established in the Union (EU) for which a full exemption has been granted, and 43 are relationships where one is established in a third country (“Third Country Relationship”). Third Country Relationships required repeat applications for each new asset class being subject to the clearing obligation; the process took place in the course of 2017. Such repeat applications, at the time, were filed for 39 of the Third Country Relationships, with a number of those entities having been liquidated in the meantime. Due to “Brexit”, the status of some group entities has changed from an EU entity to a third country entity. There are two affected UK group entities, but we have not applied for any EMIR clearing exemption for those entities.
The rules and regulations of CCPs typically provide for the bilateral set off of all amounts payable on the same day and in the same currency (“payment netting”) thereby reducing our settlement risk. Depending on the business model applied by the CCP, this payment netting applies either to all of our derivatives cleared by the CCP or at least to those that form part of the same class of derivatives. Many CCPs’ rules and regulations also provide for the termination, close-out and netting of all cleared transactions upon the CCP’s default (“close-out netting”), which reduces our credit risk. In our risk measurement and risk assessment processes we apply close-out netting only to the extent we believe that the relevant CCP’s close-out netting provisions are legally valid and enforceable and have been approved in accordance with the Bank’s Netting Policies.
In order to reduce the credit risk resulting from OTC derivative transactions, where CCP clearing is not available, we regularly seek the execution of standard master agreements (such as master agreements for derivatives published by the International Swaps and Derivatives Association, Inc. (ISDA) or the German Master Agreement for Financial Derivative Transactions) with our counterparties. A master agreement allows for the close-out netting of rights and obligations arising under derivative transactions that have been entered into under such a master agreement upon the counterparty’s default, resulting in a single net claim owed by or to the counterparty. Payment netting may be agreed from time to time with our counterparties for multiple transactions having the same payment dates (e.g., foreign exchange transactions) pursuant to the terms of master agreements which can, reduce our settlement risk. In our risk measurement and risk assessment processes we apply close-out netting only to the extent we have concluded that the master agreement is legally valid and enforceable in all relevant jurisdictions and the recognition of close-out netting has been approved in accordance with the Bank’s Netting Policies.
96
|
|
Deutsche Bank
|
Operating and Financial Review
|
|
|
Annual Report 2021
|
Deutsche Bank Group
|
|
|
|
|
We also enter into credit support annexes (CSAs) to master agreements in order to further reduce our derivatives-related credit risk. These annexes generally provide risk mitigation through periodic, usually daily, margining of the covered exposure. The CSAs also provide for the right to terminate the related derivative transactions upon the counterparty’s failure to honor a margin call. As with netting, when we believe the annex is enforceable, we reflect this in our exposure measurement.
Certain CSAs to master agreements provide for rating-dependent triggers, where additional collateral must be pledged if a party’s rating is downgraded. We also enter into master agreements that provide for an additional termination event upon a party’s rating downgrade. These downgrade provisions in CSAs and master agreements usually apply to both parties but in some agreements may apply to us only. We analyze and monitor our potential contingent payment obligations resulting from a rating downgrade in our stress testing and liquidity coverage ratio approach for liquidity risk on an ongoing basis. For an assessment of the quantitative impact of a downgrading of our credit rating please refer to table “Stress Testing Results” in the section “Liquidity Risk”.
The Dodd-Frank Act and CFTC rules thereunder, including CFTC rule § 23.504, as well as EMIR and Commission Delegated Regulation based thereon, namely Commission Delegated Regulation (EU) 2016/2251, introduced the mandatory use of master agreements and related CSAs, which must be executed prior to or contemporaneously with entering into an uncleared OTC derivative transaction. Certain documentation is also required by the U.S. margin rules adopted by U.S. prudential regulators. Under the U.S. prudential regulators’ margin rules, we are required to post and collect initial margin for our derivatives exposures with other derivatives dealers, as well as with our counterparties that (a) are “financial end users,” as that term is defined in the U.S. margin rules, and (b) have an average daily aggregate notional amount of uncleared swaps, uncleared security-based swaps, foreign exchange forwards and foreign exchange swaps exceeding U.S.$ 8 billion in June, July and August of the previous calendar year. The U.S. margin rules additionally require us to post and collect variation margin for our derivatives with other derivatives dealers and certain financial end user counterparties. These margin requirements are subject to a U.S.$ 50 million threshold for initial margin, but no threshold for variation margin, with a combined U.S.$ 500,000 minimum transfer amount. The U.S. margin requirements have been in effect for large banks since September 2016, with additional variation margin requirements having come into effect March 1, 2017 and additional initial margin requirements are being phased in from September 2017 through September 2022.
Under Commission Delegated Regulation (EU) 2016/2251, which implements the EMIR margin requirements, the CSA must provide for daily valuation and daily variation margining based on a zero threshold and a minimum transfer amount of not more than € 500,000. For large derivative exposures exceeding € 8 billion, initial margin has to be posted as well. The variation margin requirements under EMIR apply as of March 1, 2017; the initial margin requirements originally were subject to a staged phase-in until September 1, 2021. However, legislative changes have been published on February 17, 2021 that, among others, will extend deadlines into 2022. Under Article 31 of Commission Delegated Regulation (EU) 2016/2251, an EU party may decide to not exchange margin with counterparties in certain non-netting jurisdictions provided certain requirements are met. Pursuant to Article 11 (5) to (10) of EMIR, competent authorities are authorized to exempt intragroup transactions from the margining obligation, provided certain requirements are met. While some of those requirements are the same as for the EMIR clearing exemptions (see above), there are additional requirements such as the absence of any current or foreseen practical or legal impediment to the prompt transfer of funds or repayment of liabilities between intragroup counterparties. The Bank is making use of this exemption. The Bank has successfully applied for the collateral exemption for some of its regulatory-consolidated subsidiaries with intragroup derivatives, including, e.g., Deutsche Bank Securities Inc. and Deutsche Bank Luxembourg S.A. As of December 31, 2021, the Bank is allowed to use intragroup exemptions from the EMIR collateral obligation for a number of bilateral intragroup relationships which are published under db.com/legal-resources/european-market-infrastructure-regulation/intra-group-exemptions-margining. For third country subsidiaries, the intragroup exemption is currently limited until the earlier of June 30, 2022 and four months after the publication of an equivalence decision by the EU Commission under Article 13(2) EMIR, unless, in the case of an equivalence decision being applicable, a follow-up exemption application is made and granted. We have prepared for intragroup margining and will implement collateral exchange as and when the intragroup exemptions are formally withdrawn by the competent authority For some bilateral intragroup relationships, the EMIR margining exemption may be used based on Article 11 (5) of EMIR, i.e. without the need for any application, because both entities are established in the same EU Member State.
Concentrations within Credit Risk mitigation
Concentrations within credit risk mitigations taken may occur if a number of guarantors and credit derivative providers with similar economic characteristics are engaged in comparable activities with changes in economic or industry conditions affecting their ability to meet contractual obligations. Concentration risk may also occur in collateral portfolios (e.g. multiple claims and receivables against third parties) which are considered conservatively within the valuation process and/or on-site inspections where applicable. We use a range of tools and metrics to monitor our credit risk mitigating activities and associated concentrations.
For more qualitative and quantitative details in relation to the application of credit risk mitigation and potential concentration effects please refer to the section “Maximum Exposure to Credit Risk”.
97
|
|
Deutsche Bank
|
Operating and Financial Review
|
|
|
Annual Report 2021
|
Deutsche Bank Group
|
|
|
|
|
Managing Credit Risk on portfolio level
Enterprise Risk Credit Risk Portfolio Management (ER CR PM) sets the framework for the management of concentration risks at a portfolio level. This includes strategically setting, monitoring and reviewing credit risk appetites across various dimensions such as Group, Division, Business Unit, Legal Entity, Branch, Asset Class, Country, and Industry level that need to be considered in the context of credit approvals. In addition, ER CR PM also provides a comprehensive and holistic view of the Bank’s risk profile across risk types.
On a portfolio level, significant concentrations of credit risk could result from having material exposures to a number of counterparties with similar economic characteristics, or who are engaged in comparable activities, where these similarities may cause their ability to meet contractual obligations to be affected in the same manner by changes in economic or industry conditions.
Our portfolio management framework supports a comprehensive assessment of concentrations within our credit risk portfolio in order to keep concentrations within acceptable levels.
Industry risk management
To manage industry risk, we have grouped our corporate and financial institutions counterparties into various industry sub-portfolios. Portfolios are regularly reviewed with the frequency of review dependent on portfolio size and risk profile as well as risk developments. Larger / riskier portfolios are reviewed at least on an annual basis. Reviews highlight industry developments and risks to our credit portfolio, review cross-risk concentration risks, analyze the risk/reward profile of the portfolio and incorporate the results of an economic downside stress test. Finally, this analysis is used to define the credit strategies for the portfolio in question.
In our Industry Limit framework, thresholds are established for aggregate credit limits to counterparties within each industry sub-portfolio. For risk management purposes, the aggregation of limits across industry sectors follows an internal risk view that does not have to be congruent with NACE (Nomenclature des Activities Economiques dans la Communate Europeenne) code-based view applied elsewhere in this report. Regular overviews are prepared for the Enterprise Risk Committee to discuss recent developments and to agree on actions where necessary.
Beyond credit risk, our Industry Risk Framework comprises of thresholds for Traded Credit Positions while key non-financial risks are closely monitored.
Country risk management
Avoiding undue concentrations from a regional perspective is also an integral part of our credit risk management framework. In order to achieve this, country risk thresholds are applied to Emerging Markets as well as selected Developed Markets countries (based on internal country risk ratings). Emerging Markets are divided into regions. Similar to industry risk, country portfolios are regularly reviewed with the frequency of review dependent on portfolio size and risk profile as well as risk developments. Larger / riskier portfolios are reviewed at least on an annual basis. These reviews assess key macroeconomic developments and outlook, review portfolio composition and quality, cross-risk concentration risks and analyze the risk/reward profile of the portfolio. Based on this, country risk appetite and strategies are set.
In our Country Risk Framework, thresholds are established for counterparty credit risk exposures in each country to manage the aggregated credit risk subject to country-specific economic and political events. These thresholds cover exposures to entities incorporated locally and subsidiaries of foreign multinational corporations as well as companies with significant economic or operational dependence on a specific country even though they are incorporated externally. In addition, gap risk thresholds are set to control the risk of loss due to intra-country wrong-way risk exposure. As such, for risk management purposes, the aggregation of exposures across countries follows an internal risk view that may differ from the geographical exposure view applied elsewhere in this report. Beyond credit risk, our Country Risk Framework comprises thresholds for trading positions in Emerging Markets and selective Developed Markets that measure the aggregate market value of traded credit risk positions. For Emerging Markets, thresholds are also set to measure the Profit and Loss impact under specific country stress scenarios on trading positions across the Bank’s portfolio. Furthermore, thresholds are set for capital and intra-group funding exposure of Deutsche Bank entities in above countries given the transfer risk inherent in these cross-border positions. Key non-financial risks are closely monitored. Our country risk ratings represent a key tool in our management of country risk. They include:
- – Sovereign rating (set and managed by ERM): A measure of the probability of the sovereign defaulting on its foreign or local currency obligations.
- – Transfer risk rating (set and managed by ERM): A measure of the probability of a “transfer risk event”, i.e., the risk that an otherwise solvent debtor is unable to meet its obligations due to inability to obtain foreign currency or to transfer assets as a result of direct sovereign intervention.
All sovereign and transfer risk ratings are reviewed, at least on an annual basis.
98
|
|
Deutsche Bank
|
Operating and Financial Review
|
|
|
Annual Report 2021
|
Deutsche Bank Group
|
|
|
|
|
Product/Asset class specific risk management
Complementary to our counterparty, industry and country risk approach, we focus on product/asset class specific risk concentrations and set limits or thresholds where required for risk management purposes. Specific risk limits are set in particular if a concentration of transactions of a specific type might lead to significant losses under certain conditions. In this respect, correlated losses might result from disruptions of the functioning of financial markets, significant moves in market parameters to which the respective product is sensitive, macroeconomic default scenarios or other factors. Specific focus is put on transactions with underwriting risks where we underwrite commitments with the intention to sell down or distribute part of the risk to third parties. These commitments include the undertaking to provide bank loans for syndication into the debt capital market and bridge loans for the issuance of notes. The inherent risks of being unsuccessful in the distribution of the facilities or the placement of the notes, comprise of a delayed distribution, funding of the underlying loans as well as a pricing risk as some underwriting commitments are additionally exposed to market risk in the form of widening credit spreads. Where applicable, we dynamically hedge this credit spread risk to be within the approved market risk limit framework.
A major asset class, in which Deutsche Bank is active in underwriting, is leverage lending, which we mainly execute through our Leveraged Debt Capital Markets (LDCM) business unit. The business model is a fee-based‚ originate to distribute approach focused on the distribution of largely unfunded underwriting commitments into the capital market. The aforementioned risks regarding distribution and credit spread movement apply to this business unit, however, are managed under a range of specific notional as well as market risk limits. The latter require the business to also hedge its underwriting pipeline against market dislocations. The fee-based model of our LDCM business unit includes a restrictive approach to single-name risk concentrations retained on Deutsche Bank‘s balance sheet, which results in a diversified overall portfolio without any material concentrations. The resulting longer-term on-balance sheet portfolio is also subject to a comprehensive credit limit and hedging framework.
Deutsche Bank also assumes underwriting risk with respect to Commercial Real Estate (CRE) loans, primarily in the CRE business unit in the Investment Bank where loans may be originated with the intent to securitize in the capital markets or syndicate to other lenders. The aforementioned inherent underwriting risks such as delayed distribution and pricing risk are managed through notional caps, market risk limits and hedging against the risk of market dislocations.
In addition to underwriting risk, we also focus on concentration of transactions with specific risk dynamics (including risk to commercial real estate and risk from securitization positions).
In addition, our Private Bank and certain Corporate Bank businesses are managed via product-specific strategies setting our risk appetite for portfolios with similar credit risk characteristics, such as the retail portfolios of mortgages and consumer finance products as well as products for business clients. Here risk analyses are performed on portfolio level including further breakdown into Business Units as well as Countries / Regions. Analysis for individual clients is of secondary importance. In Wealth Management, target levels are set for global concentrations along products as well as based on type and liquidity of collateral.
99
|
|
Deutsche Bank
|
Operating and Financial Review
|
|
|
Annual Report 2021
|
Deutsche Bank Group
|
|
|
|
|
Market Risk Management
Market Risk framework
The vast majority of our businesses are subject to market risk, defined as the potential for change in the market value of our trading and invested positions. Risk can arise from changes in interest rates, credit spreads, foreign exchange rates, equity prices, commodity prices and other relevant parameters, such as market volatility and market implied default probabilities. The market risk can affect accounting, economic and regulatory views of our exposure.
Market Risk Management is part of our independent Risk function and sits within the Market and Valuations Risk Management group. One of the primary objectives of Market Risk Management is to ensure that our business units’ risk exposure is within the approved risk appetite commensurate with its defined strategy. To achieve this objective, Market Risk Management works closely together with risk takers (“the business units”) and other control and support groups.
We distinguish between three substantially different types of market risk:
- – Trading market risk arises primarily through the market-making and client facilitation activities of the Investment Bank and Corporate Bank divisions. This involves taking positions in debt, equity, foreign exchange, other securities and commodities as well as in equivalent derivatives.
- – Traded default risk arising from defaults and rating migrations relating to trading instruments.
- – Nontrading market risk arises from market movements, primarily outside the activities of our trading units, in our banking book and from off-balance sheet items. This includes interest rate risk, credit spread risk, investment risk and foreign exchange risk as well as market risk arising from our pension schemes, guaranteed funds and equity compensation. Nontrading market risk also includes risk from the modeling of client deposits as well as savings and loan products.
Market Risk Management governance is designed and established to promote oversight of all market risks, effective decision-making and timely escalation to senior management.
Market Risk Management defines and implements a framework to systematically identify, assess, monitor and report our market risk. Market risk managers identify market risks through active portfolio analysis and engagement with the business units.
Market Risk measurement
We aim to accurately measure all types of market risks by a comprehensive set of risk metrics embedding accounting, economic and regulatory considerations.
We measure market risks by several internally developed key risk metrics and regulatory defined market risk approaches.
Trading Market Risk
Our primary mechanism to manage trading market risk is the application of our risk appetite framework of which the limit framework is a key component. Our Management Board, supported by Market Risk Management, sets group-wide value-at-risk, economic capital and portfolio stress testing limits for market risk in the trading book. Market Risk Management allocates this overall appetite to our Corporate Divisions and their individual business units based on established and agreed business plans. We also have business aligned heads within Market Risk Management who establish business unit limits, by allocating the limit down to individual portfolios, geographical regions and types of market risks.
Value-at-risk, economic capital and portfolio stress testing limits are used for managing all types of market risk at an overall portfolio level. As an additional and important complementary tool for managing certain portfolios or risk types, Market Risk Management performs risk analysis and business specific stress testing. Limits are also set on sensitivity and concentration/liquidity, exposure, business-level stress testing and event risk scenarios, taking into consideration business plans and the risk vs return assessment.
Business units are responsible for adhering to the limits against which exposures are monitored and reported. The market risk limits set by Market Risk Management are monitored on a daily, weekly and monthly basis, dependent on the risk management tool being used.
100
|
|
Deutsche Bank
|
Operating and Financial Review
|
|
|
Annual Report 2021
|
Deutsche Bank Group
|
|
|
|
|
Internally developed Market Risk Models
Value-at-Risk (VaR)
VaR is a quantitative measure of the potential loss (in value) of Fair Value positions due to market movements that should not be exceeded in a defined period of time and with a defined confidence level.
Our value-at-risk for the trading businesses is based on our own internal model. In October 1998, the German Banking Supervisory Authority (now the BaFin) approved our internal model for calculating the regulatory market risk capital for our general and specific market risks based on a sensitivity based Monte Carlo approach. In October 2020, the ECB approved a significant change to our VaR model, now a Historical Simulation approach predominantly utilizing full revaluation, although some portfolios remain on a sensitivity based approach. The new approach is used for both Risk Management and capital requirements.
The new approach provides more accurate modelling of our risks, enhances our analysis capabilities and provides a more effective tool for risk management. Aside from enabling a more accurate view of market risk, the implementation of Historical Simulation VaR has brought about an even closer alignment of our market risk systems and models to our end of day pricing.
Risk management VaR is calibrated to a 99 % confidence level and a one day holding period. This means we estimate there is a 1 in 100 chance that a mark-to-market loss from our trading positions will be at least as large as the reported VaR. For regulatory capital purposes, our VaR model is calibrated to a 99 % confidence interval and a ten day holding period.
The calculation employs a Historical Simulation technique that uses one year of historical market data as input and observed correlations between the risk factors during this one year period.
Our VaR model is designed to take into account a comprehensive set of risk factors across all asset classes. Key risk factors are swap/government curves, index and issuer-specific credit curves, single equity and index prices, foreign exchange rates, commodity prices as well as their implied volatilities. To help ensure completeness in the risk coverage, second order risk factors, e.g. money market basis, implied dividends, option-adjusted spreads and precious metals lease rates are also considered in the VaR calculation. The list of risk factors include in the VaR model is reviewed regularly and enhanced as part of ongoing model performance reviews.
The model incorporates both linear and, especially for derivatives, nonlinear impacts predominantly through a full revaluation approach but it also utilizes a sensitivity-based approach for certain portfolios. The full revaluation approach uses the historical changes to risk factors as input to pricing functions. Whilst this approach is computationally expensive, it does yield a more accurate view of market risk for nonlinear positions, especially under stressed scenarios. The sensitivity based approach uses sensitivities to underlying risk factors in combination with historical changes to those risk factors.
For each business unit a separate VaR is calculated for each risk type, e.g. interest rate risk, credit spread risk, equity risk, foreign exchange risk and commodity risk. “Diversification effect” reflects the fact that the total VaR on a given day will be lower than the sum of the VaR relating to the individual risk types. Simply adding the VaR figures of the individual risk types to arrive at an aggregate VaR would imply the assumption that the losses in all risk types occur simultaneously.
The VaR enables us to apply a consistent measure across our fair value exposures. It allows a comparison of risk in different businesses, and also provides a means of aggregating and netting positions within a portfolio to reflect correlations and offsets between different asset classes. Furthermore, it facilitates comparisons of our market risk both over time and against our daily trading results.
When using VaR results a number of considerations should be taken into account. These include:
- – The use of historical market data may not be a good indicator of potential future events, particularly those that are extreme in nature. This “backward-looking” limitation can cause VaR to understate future potential losses (as in 2008), but can also cause it to be overstated immediately following a period of significant stress (as in COVID-19 pandemic).
- – The one day holding period does not fully capture the market risk arising during periods of illiquidity, when positions cannot be closed out or hedged within one day.
- – VaR does not indicate the potential loss beyond the 99 th quantile.
- – Intra-day risk is not reflected in the end of day VaR calculation.
- – There may be risks in the trading or banking book that are not fully captured in the VaR model (either partially captured or missing entirely).
101
|
|
Deutsche Bank
|
Operating and Financial Review
|
|
|
Annual Report 2021
|
Deutsche Bank Group
|
|
|
|
|
Our process of systematically capturing and evaluating risks currently not captured in our VaR model has been further developed and improved. An assessment is made to determine the level of materiality of these risks and material risks are prioritized for inclusion in our internal model. Risks not in VaR are monitored and assessed on a regular basis through our Risk Not In VaR (RNIV) framework. This framework has also undergone a significant overhaul in 2020. This includes aligning the methodologies with the Historical Simulation approach which in turn yields a more accurate estimate of the contribution of these missing items and their potential capitalization.
We are committed to the ongoing development of our internal risk models, and we allocate substantial resources to reviewing, validating and improving them.
Stressed Value-at-Risk
Stressed Value-at-Risk (SVaR) calculates a stressed value-at-risk measure based on a one year period of significant market stress. We calculate a stressed value-at-risk measure using a 99 % confidence level. Stressed VaR is calculated with a holding period of ten days. Our SVaR calculation utilizes the same systems, trade information and processes as those used for the calculation of value-at-risk. The only difference is that historical market data and observed correlations from a period of significant financial stress (i.e., characterized by high volatilities) is used as an input for the Historical Simulation
.
The stress period selection process for the stressed value-at-risk calculation is based on the comparison of VaR calculated using historical time windows compared to the current SVaR. If a historical window produces a VaR which is higher than the current SVaR, it is further investigated and the SVaR window can then subsequently be updated accordingly. This process runs on a quarterly basis.
During 2021, the stress period selection process for DB Group was conducted as outlined above. As a result, the SVaR window used at various periods in 2021 included the Financial credit crisis of 2008/09, the European sovereign crisis of 2011/12 and the more recent COVID-19 stress period of 2020.
Incremental Risk Charge
Incremental Risk Charge captures default and credit rating migration risks for credit-sensitive positions in the trading book. We use a Monte Carlo Simulation for calculating incremental risk charge as the 99.9 % quantile of the portfolio loss distribution over a one-year capital horizon under a constant position approach and for allocating contributory incremental risk charge to individual positions.
The model captures the default and migration risk in an accurate and consistent quantitative approach for all portfolios. Important parameters for the incremental risk charge calculation are exposures, recovery rates, maturities, ratings with corresponding default and migration probabilities and parameters specifying issuer correlations.
Market Risk Standardized Approach
The Market Risk Standardized Approach (“MRSA”) is used to determine the regulatory capital charge for the specific market risk of trading book securitizations, for certain types of investment funds and for longevity risk as set out in CRR/CRD regulations.
Longevity risk is the risk of adverse changes in life expectancies resulting in a loss in value on longevity linked policies and transactions. For risk management purposes, stress testing and economic capital allocations are also used to monitor and manage longevity risk.
Market Risk Stress Testing
Stress testing is a key risk management technique, which evaluates the potential effects of extreme market events and movements in individual risk factors. It is one of the core quantitative tools used to assess the market risk of Deutsche Bank’s positions and complements VaR and Economic Capital. Market Risk Management performs several types of stress testing to capture the variety of risks (Portfolio Stress Testing, individual specific stress tests and Event Risk Scenarios) and also contributes to Group-wide stress testing. These stress tests cover a wide range of severities designed to test the earnings stability and capital adequacy of the bank.
102
|
|
Deutsche Bank
|
Operating and Financial Review
|
|
|
Annual Report 2021
|
Deutsche Bank Group
|
|
|
|
|
Trading Market Risk Economic Capital (TMR EC)
Our trading market risk economic capital model-scaled Stressed VaR based EC (SVaR based EC) - comprises two core components, the “common risk” component covering risk drivers across all businesses and the “business-specific risk” component, which enriches the Common Risk via a suite of Business Specific Stress Tests (BSSTs). Both components are calibrated to historically observed severe market shocks. Common risk is calculated using a scaled version of the SVaR framework while BSSTs are designed to capture more product/business-related bespoke risks (e.g. complex basis risks) as well as higher order risks not captured in the common risk component. The SVaR based EC uses the Monte Carlo SVaR framework.
Traded Default Risk Economic Capital (TDR EC)
TDR EC captures the relevant credit exposures across our trading and fair value banking books. Trading book exposures are monitored by MRM via single name concentration and portfolio thresholds which are set based upon rating, size and liquidity. Single name concentration risk thresholds are set for two key metrics: Default Exposure, i.e., the PL impact of an instantaneous default at the current recovery rate (RR), and bond equivalent Market Value (MV), i.e. default exposure at 0 % recovery. In order to capture diversification and concentration effects we perform a joint calculation for traded default risk economic capital and credit risk economic capital. Important parameters for the calculation of traded default risk are exposures, recovery rates and default probabilities as well as maturities. The probability of joint rating downgrades and defaults is determined by the default and rating correlations of the portfolio model. These correlations are specified through systematic factors that represent countries, geographical regions and industries.
Trading Market Risk Reporting
Market Risk Management reporting creates transparency on the risk profile and facilitates the understanding of core market risk drivers to all levels of the organization. The Management Board and Senior Governance Committees receive regular reporting, as well as ad hoc reporting as required, on market risk, regulatory capital and stress testing. Senior Risk Committees receive risk information at a number of frequencies, including weekly or monthly.
Additionally, Market Risk Management produces daily and weekly Market Risk specific reports and daily limit utilization reports for each business owner.
Regulatory prudent valuation of assets carried at fair value
Pursuant to Article 34 CRR, institutions shall apply the prudent valuation requirements of Article 105 CRR to all assets measured at fair value and shall deduct from CET 1 capital the amount of any additional value adjustments necessary.
We determined the amount of the additional value adjustments based on the methodology defined in the Commission Delegated Regulation (EU) 2016/101.
As of December 31, 2021 the amount of the additional value adjustments was € 1.8 billion. The December 31, 2020 amount was € 1.4 billion. The increase was predominantly due to the diversification benefit factor reverting back to normal levels after the amendment via Commission Delegated Regulation (EU) 2020/866 that provided temporary relief to account for the extreme market volatility due to the COVID-19 pandemic.
As of December 31, 2021 the reduction of the expected loss from subtracting the additional value adjustments was € 117 million, which partly mitigated the negative impact of the additional value adjustments on our CET 1 capital.
103
|
|
Deutsche Bank
|
Operating and Financial Review
|
|
|
Annual Report 2021
|
Deutsche Bank Group
|
|
|
|
|
Nontrading Market Risk
Nontrading market risk arises primarily from activities outside of our trading units, in our banking book, and from certain off-balance sheet items, embedding considerations of different accounting treatments of transactions. Significant market risk factors the Group is exposed to and are overseen by risk management groups in that area are:
- – Interest rate risk (including risk from embedded optionality and changes in behavioral patterns for certain product types), credit spread risk, foreign exchange risk, equity risk (including investments in public and private equity as well as real estate, infrastructure and fund assets).
- – Market risks from off-balance sheet items, such as pension schemes and guarantees, as well as structural foreign exchange risk and equity compensation risk.
As for trading market risks our risk appetite and limit framework is also applied to manage our exposure to nontrading market risk. On group level those are captured by the management board set limits for market risk economic capital capturing exposures to all market risks across asset classes as well as earnings and economic value based limits for interest rate risk in the banking books. Those limits are cascaded down by market risk management to the divisional or portfolio level. The limit framework for nontrading market risk exposure is further complemented by a set of business specific stress tests, value-at-risk sensitivity limits monitored on a daily or monthly basis dependent on the risk measure being used.
Interest Rate Risk in the Banking Book
Interest rate risk in the banking book (IRRBB) is the current or prospective risk, to both the Group's capital and earnings, arising from movements in interest rates, which affect the Group's banking book exposures. This includes gap risk, which arises from the term structure of banking book instruments, basis risk, which describes the impact of relative changes in interest rates for financial instruments that are priced using different interest rate curves, as well as option risk, which arises from option derivative positions or from optional elements embedded in financial instruments.
The Group manages its IRRBB exposures using economic value as well as earnings based measures. Our Group Treasury function is mandated to manage the interest rate risk centrally, with Market Risk Management acting as 2nd Line of Defense (“2nd LoD”) independently assessing and challenging the implementation of the framework and adherence to the risk appetite. Group Audit in its role as the 3rd Line of Defense (“3rd LoD”) is accountable for providing independent and objective assurance on the adequacy of the design, operating effectiveness and efficiency of the risk management system and systems of internal control. The Group Asset Liability Committee (“ALCo”) oversees and steers the Group’s structural interest risk position with particular focus on banking book risks and the management of the net interest income. The ALCo monitors the sensitivity of financial resources and associated metrics to key market parameters such as interest rate curves and oversees adherence to divisional/business financial resource limits.
Economic value based measures look at the change in economic value of banking book assets, liabilities and off-balance sheet exposures resulting from interest rate movements, independent of the accounting treatment. Thereby the Group measures the change in Economic Value of Equity (∆EVE) as the maximum decrease of the banking book economic value under the six standard scenarios defined by the European Banking Authority (EBA) in addition to internal stress scenarios for risk steering purposes. For the reporting of internal stress scenarios and risk appetite the Group applies a few different modelling assumptions as used in this disclosure. When aggregating ∆EVE across different currencies DB adds up negative and positive changes to EVE without applying weight factors for positive changes. Furthermore, the Group is using behavioral model assumptions about the interest rate duration of own equity capital as well as non-maturity deposits from financial institutions.
Earnings-based measures look at the expected change in Net Interest Income (NII) resulting from interest rate movements over a defined time horizon, compared to a defined benchmark scenario. Thereby the Group measures ∆NII as the maximum reduction in NII under the six standard scenarios defined by the European Banking Authority (EBA) in addition to internal stress scenarios for risk steering purposes, compared to a market implied curve scenario, over a period of 12 months.
The Group employs mitigation techniques to hedge the interest rate risk arising from nontrading positions within given limits. The interest rate risk arising from nontrading asset and liability positions is managed through Treasury Markets Investments. The residual interest rate risk positions are hedged with Deutsche Bank’s trading books within the IB division.
Thereby the Group uses derivatives and applies different hedge accounting techniques such as fair value hedge accounting or cash flow hedge accounting. For fair value hedges, the Group uses interest rate swaps and options contracts to manage the fair value movements of fixed rate financial instruments due to changes in benchmark interest. For hedges in the context of the Cash Flow Hedge accounting , we do use interest rate swaps to manage the exposure to cash flow variability of our variable rate instruments as a result of changes in benchmark interest rates.
104
|
|
Deutsche Bank
|
Operating and Financial Review
|
|
|
Annual Report 2021
|
Deutsche Bank Group
|
|
|
|
|
The Group assesses and measures hedge effectiveness of a hedging relationship based on the change in the fair value or cash flows of the derivative hedging instrument relative to the change in the fair value or cash flows of the hedged item attributable to the hedged risk.
The “Model Risk Management” function performs independent validation of models used for IRRBB measurement, as per all market risk models, in line with Deutsche Bank’s group-wide risk governance framework.
The calculation of VaR and sensitivities of interest rate risk is performed daily, whereas the measurement and reporting of economic value interest rate and earnings risk is performed on a monthly basis. The Group generally uses the same metrics in its internal management systems as it applies for the disclosure in this report.
Deutsche Bank’s key modelling assumptions are applied to the positions in our PB and CB divisions. Those positions are subject to risk of changes in our client’s behavior with regard to their deposits as well as loan products.
The Group manages the interest rate risk exposure of its Non-Maturity Deposits (NMDs) through a replicating portfolio approach to determine the average repricing maturity of the portfolio. For the purpose of constructing the replicating portfolio, the portfolio of NMDs is clustered by dimensions such as business unit, currency, product and geographical location. The main dimensions influencing the repricing maturity are elasticity of deposit rates to market interest rates, volatility of deposit balances and observable client behavior. For the reporting period the average repricing maturity assigned across all such replicating portfolios is 2.17 years and Deutsche Bank uses 15 years as the longest repricing maturity.
In the loan and some of the term deposit products Deutsche Bank considers early prepayment/withdrawal behavior of its customers. The parameters are based on historical observations, statistical analyses and expert assessments.
Furthermore, the Group generally calculates IRRBB related metrics in contractual currencies and aggregates the resulting metrics for reporting purposes. When calculating economic value based metrics the commercial margin is excluded for material parts of the balance sheet.
Credit Spread Risk in the Banking Book
Deutsche Bank is exposed to credit spread risk of bonds held in the banking book, mainly as part of the Treasury Liquidity Reserves portfolio. The credit spread risk in the banking book is managed by the businesses, with Market Risk Management acting as an independent oversight function ensuring that the exposure is within the approved risk appetite. This risk category is closely associated with interest rate risk in the banking book as changes in the perceived credit quality of individual instruments may result in fluctuations in spreads relative to underlying interest rates. The calculation of credit spread sensitivities and value-at-risk for credit spread exposure is in general performed on a daily basis, the measurement and reporting of economic capital and stress tests are performed on a monthly basis.
Foreign exchange risk
Foreign exchange risk arises from our nontrading asset and liability positions that are denominated in currencies other than the functional currency of the respective entity. The majority of this foreign exchange risk is transferred through internal hedges to trading books within the Investment Bank and is therefore reflected and managed via the value-at-risk figures in the trading books. The remaining foreign exchange risks that have not been transferred are mitigated through match funding the investment in the same currency, so that only residual risk remains in the portfolios. Small exceptions to above approach follow the general Market Risk Management monitoring and reporting process, as outlined for the trading portfolio.
The bulk of nontrading open foreign exchange risk arises from the foreign exchange translation of local capital into the reporting currency of DB Group and related capital hedge positions. Thereby structural open long positions
are taken for a selected number of relevant currencies to immunize the sensitivity of the capital ratio of the Group against changes in the exchange rates.
Equity and investment risk
Nontrading equity risk is arising predominantly from our non-consolidated investment holdings in the banking book and from our equity compensation plans.
Our non-consolidated equity investment holdings in the banking book are categorized into strategic and alternative investment assets. Strategic investments typically relate to acquisitions made to support our business franchise and are undertaken with a medium to long-term investment horizon. Alternative assets are comprised of principal investments and other non-strategic investment assets. Principal investments are direct investments in private equity, real estate, venture capital, hedge or mutual funds whereas assets recovered in the workout of distressed positions or other legacy investment assets in private equity and real estate are of a non-strategic nature.
105
|
|
Deutsche Bank
|
Operating and Financial Review
|
|
|
Annual Report 2021
|
Deutsche Bank Group
|
|
|
|
|
Investment proposals for strategic investments as well as monitoring of progress and performance against committed targets are evaluated by the Group Investment Committee. Depending on size, strategic investments may require approval from the Group Investment Committee, the Management Board or the Supervisory Board.
CRM Principal Investments is responsible for the risk-related governance and monitoring of our alternative asset activities. The review of new or increased principal investment commitments is the task of the Principal Investment Commitment Approval Group (PICAG), established by the Enterprise Risk Committee (ERC) as a risk management forum for alternative asset investments. The PICAG approves investments under its authority or recommends decisions above its authority to the Management Board for approval. The Management Board also sets investment limits for business divisions and various portfolios of risk upon recommendation by the ERC.
The equity investment holdings are included in regular group wide stress tests and the monthly market risk economic capital calculations.
Pension risk
The Group is exposed to market risks from defined benefit pension schemes for past and current employees. Market risks in pension plans materialize due to a potential decline in the market value of plan assets or an increase in the present value of the pension liability of each of the pension plans. Market Risk Management is responsible for a regular measurement, monitoring, reporting and control of market risks of the asset and liability side of the defined benefit pension plans. Thereby, market risks in pension plans include but are not restricted to interest rate risk, inflation risk, credit spread risk, equity risk, and longevity risk. For further details on the Group’s defined benefit pension obligations and their management, we refer to Note 33 “Employee Benefits” in the “Notes to the Consolidated Financial Statements” section.
Other risks in the Banking Book
Market risks in our Asset Management business primarily result from principal guaranteed funds or accounts, but also from co-investments in our funds.
Nontrading Market Risk Economic Capital
Nontrading market risk economic capital is calculated either by applying the standard traded market risk EC methodology or through the use of non-traded market risk models that are specific to each risk class and which consider, among other factors, historically observed market moves, the liquidity of each asset class, and changes in client’s behavior in relation to products with behavioral optionalities
.
Operational risk management
Operational risk management framework
Deutsche Bank applies the European Banking Authority’s Single Rulebook definition of operational risk: “Operational risk means the risk of losses stemming from inadequate or failed internal processes, people and systems or from external events. Operational risk includes legal risks but excludes business and reputational risk and is embedded in all banking products and activities.” Operational risk forms a subset of the bank’s non-financial risks (NFR).
Deutsche Bank’s operational risk appetite sets out the amount of operational risk we are willing to accept as a consequence of doing business. We take on operational risks consciously, both strategically as well as in day-to-day business. While the bank may have no appetite for certain types of operational risk events (such as violations of laws or regulations and misconduct), in other cases a certain amount of operational risk must be accepted if the bank is to achieve its business objectives. In case a residual risk is assessed to be outside our risk appetite, risk reducing actions must be undertaken, including remediating the risks, insuring risks or ceasing business.
The Operational risk management framework (ORMF) is a set of interrelated tools and processes that are used to identify, assess, measure, monitor and mitigate the bank’s operational risks. Its components have been designed to operate together to provide a comprehensive, risk-based approach to managing the bank’s most material operational risks. ORMF components include the Group’s approach to setting and adhering to operational risk appetite, the operational risk type and control taxonomies, the minimum standards for operational risk management processes including the respective tools, and the bank’s operational risk capital model.
106
|
|
Deutsche Bank
|
Operating and Financial Review
|
|
|
Annual Report 2021
|
Deutsche Bank Group
|
|
|
|
|
Organizational governance structure
While the day-to-day management of operational risk is the primary responsibility of our business divisions and infrastructure functions, where these risks are generated, Non-Financial Risk Management (NFRM) oversees the Group-wide management of operational risks, identifies and reports risk concentrations, and promotes a consistent application of the ORMF across the bank. NFRM is part of the Group risk function, the Chief Risk Office, which is headed by the Chief Risk Officer.
The Chief Risk Officer appoints the Head of NFRM, who is accountable for the design, oversight and maintenance of an effective, efficient and regulatory compliant ORMF, including the operational risk capital model. The Head of NFRM monitors and challenges the ORMF’s Group wide implementation and monitors overall risk levels against the bank’s operational risk appetite.
The Non-Financial Risk Committee (NFRC), which is chaired by the Chief Risk Officer, is responsible for the oversight, governance and coordination of the management of operational risk in the Group on behalf of the Management Board, by establishing a cross-risk perspective of the key operational risks of the Group. Its decision-making authorities include the review, advice and management of all operational risk issues that may impact the risk profile of our business divisions and infrastructure functions. Several sub-fora with attendees from both the 1st and 2nd LoDs support the NFRC to effectively fulfil its mandate. In addition to the Group level NFRC, business divisions have established 1st LoD NFR fora for the oversight and management of operational risks on various levels of the organization.
The governance of our operational risks follows the bank’s Three Lines of Defence (3LoD) approach to managing all of its financial and non-financial risks. The ORMF establishes the operational risk governance standards including the core 1st and 2nd LoD roles and their responsibilities, to ensure effective risk management and appropriate independent challenge.
Operational risk requirements for the first line of defence (1st LoD): Risk owners as the 1st LoD have full accountability for their operational risks and manage these against a defined risk specific appetite.
Operational risk owners are those roles in the bank whose activities generate - or who are exposed to - operational risks. As heads of business divisions and infrastructure functions, they must determine the appropriate organizational structure to identify their operational risk profile, actively manage these risks within their organization, take business decisions on the mitigation or acceptance of operational risks to ensure they remain within risk appetite, and establish and maintain 1st LoD controls.
Operational risk requirements for the second line of defence (2nd LoD): Risk Type Controllers (RTCs) act as the 2nd LoD control functions for all sub-risk types under the overarching risk type “operational risk”.
RTCs establish the framework and define Group level risk appetite statements for the specific operational risk type they oversee. RTCs define the minimum risk management and control standards and independently monitor and challenge risk owners’ implementation of these standards in their day-to-day processes, as well as their risk-taking and risk management activities. RTCs provide independent operational risk oversight and prepare aggregated risk type profile reporting. RTCs monitor the risk type’s profile against risk appetite and have a right to veto risk decisions leading to foreseeable risk appetite breaches. As risk type experts, RTCs define the risk type and its taxonomy and support and facilitate the implementation of the risk type framework in the 1st LoD. To maintain their independence, RTC roles are located only in infrastructure functions.
Operational risk requirements for NFRM as the RTC for the overarching risk type operational risk: As the RTC / risk control function for operational risk, NFRM establishes and maintains the overarching ORMF and determines the appropriate level of capital to underpin the Group’s operational risk.
- – As the 2nd LoD risk control function, NFRM defines the bank’s approach to operational risk appetite and monitors its adherence, breaches and consequences. NFRM is the independent reviewer and challenger of the 1st LoD’s risk and control assessments and risk management activities relating to the holistic operational risk profile of a unit (while RTCs monitor and challenge activities related to their specific risk types). NFRM provides the oversight of risk and control mitigation plans to return the bank’s operational risk to its risk appetite, where required. It also establishes and regularly reports the bank’s operational risk profile and operational top risks, i.e. the bank’s material operational risks which are outside of risk appetite.
- – As the subject matter expert for operational risk, NFRM provides independent risk views to facilitate forward-looking management of operational risks, actively engages with risk owners (1st LoD) and facilitates the implementation of risk management and control standards across the bank.
- – NFRM is accountable for the design, implementation and maintenance of the approach to determine the adequate level of capital required for operational risk, for recommendation to the Management Board. This includes the calculation and allocation of operational risk capital demand and expected loss under the Advanced Measurement Approach (AMA).
107
|
|
Deutsche Bank
|
Operating and Financial Review
|
|
|
Annual Report 2021
|
Deutsche Bank Group
|
|
|
|
|
Managing our operational risk
In order to manage the broad range of sub-risk types underlying operational risk, the ORMF provides a set of tools and processes that apply to all operational risk types across the bank. These enable us to determine our operational risk profile in relation to our risk appetite for operational risk, to systematically identify operational risk themes and concentrations, and to define risk mitigating measures and priorities.
In 2021, we continued to mature the management of operational risks by further integrating and simplifying our risk management processes, by enhancing the bank’s central controls inventory, and by strengthening our control activities conducted by both 1st LoD and 2nd LoD functions at various levels across the bank.
Loss data collection: We collect, categorize and analyze data on internal and relevant external operational risk events (with a PL impact ≥ €10,000) in a timely manner. Material operational risk events trigger clearly defined lessons learned and read-across analyses, which are performed in the 1st LoD in close collaboration between business partners, risk control and other infrastructure functions. Lessons learned reviews analyze the reasons for significant operational risk events, identify their root causes, and document appropriate remediation actions to reduce the likelihood of their reoccurrence. Read across reviews take the conclusions of the lessons learned process and seek to analyze whether similar risks and control weaknesses identified in a lessons learned review exist in other areas of the bank, even if they have not yet resulted in problems. This allows preventative actions to be undertaken. In 2021, we continued work on the multiyear initiative to implement a performant and modular event management platform. During phase 1 we continue to work on optimizing the user experience and convenience of the platform.
Scenario analysis. We complement existing risk insights through the use of exploratory scenario analysis. The source of our scenario storylines and trigger for their completion builds on internal losses, Emerging Risk reviews, Top Risk concentrations, and the review of external peer OR Loss Events. We thereby systematically utilize information from actual and potential future loss events to identify thematic susceptibilities and actively seek to reduce the likelihood of similar incidents, for example through deep dive analyses or risk profile reviews and Control Assurance planning. In 2021, we enhanced our approach, tightened roles and responsibilities, and through integrating the process more directly into day-to-day risk management activities. Scenario analysis continues to play an important role in assessing longer term potential impacts of COVID-19, Conduct, and ESG risk themes.
Risk Control Assessment: The Risk Control Assessment process (RCA) comprises of a series of bottom-up assessments of the risks generated by business divisions and infrastructure functions (1st LoDs), the effectiveness of the controls in place to manage them, and the remediation actions required to bring the risks outside of risk appetite back into risk appetite. This enables both the 1st and 2nd LoDs to have a clear view of the bank’s material operational risks. In 2021, we focused on embedding the dynamic, trigger based approach to the RCA to review our risk profile on a real time basis through NFR governance meetings. We continued to mature in the area of controls by refining the bank’s central control inventory and increasing control assurance activities conducted across both 1st LoD and 2nd LoD functions at various levels of the bank. The outcome provided greater transparency to Risk Owners on the control environment the bank relies upon to mitigate its operational risks.
Top Risks: We regularly report and perform analyses on our top risks to establish that they are appropriately mitigated. As all risks, top risks are rated in terms of both the likelihood that they could occur and the impact on the bank should they do so, and through this assessment they are identified to be particularly material for the bank. The reporting provides a forward-looking perspective on the impact of planned remediation and control enhancements. It also contains emerging risks and themes that have the potential to evolve as top risks in the future. Top risk reduction programs comprise the most significant risk reduction activities that are key to bringing our operational top risk themes back within risk appetite. In 2021, we fostered greater connectivity between Top Risks and the more granular RCA outputs through enhanced tooling and by improving aggregation logic to better identify Top risks from the bottom-up RCA process.
Transformation Risk Assessment: To appropriately identify and manage risks from material change initiatives within the bank, a Transformation Risk Assessment (TRA) process is in place to assess the impact of transformations on the bank’s risk profile and control environment. This process considers impacts to both financial and non-financial risk types and is applicable to initiatives including regulatory initiatives, technology migrations, risk remediation projects, strategy changes, organizational changes, and real estate moves within the bank. In 2021, the Operational Resilience dimension was formalized by mandating that Operational Resilience impacts due to potential changes to process, control or underlying resource base from the initiative are taken into account during the transformation risk assessment.
108
|
|
Deutsche Bank
|
Operating and Financial Review
|
|
|
Annual Report 2021
|
Deutsche Bank Group
|
|
|
|
|
NFR appetite metrics: NFR appetite is the amount of non-financial risk the bank is willing to accept as a consequence of doing business. The NFR appetite framework provides a common approach to measure and monitor the level of risk appetite across the firm. NFR appetite metrics are used to monitor the operational risk profile against the bank’s defined risk appetite, and to alert the organization to impending problems in a timely fashion. In 2021, to further inform the quality of risk appetite metrics used to assess NFR appetite and capital processes, a metric quality assessment has been introduced.
Findings and issue management: The findings and issue management process allows the bank to mitigate the risks associated with known control weaknesses and deficiencies, and enables management to make risk-based decisions over the need for further remediation or risk acceptance. Outputs from the findings management process must be able to demonstrate to internal and external stakeholders that the bank is actively identifying its control weaknesses, and taking steps to manage associated risks within acceptable levels of risk appetite. In 2021, we enhanced our ability to identify deficiency and gap control themes. The criteria for Risk Acceptance have been tightened along with those for other lifecycle events. These measures will continue to focus attention on sustainable remediation across the organization and improved control environment outcomes.
Operational risk type frameworks
The ORMF provides the overarching set of standards, tools and processes that apply to the management of all operational sub-risk types. It is complemented by the operational risk type frameworks, risk management and control standards and tools set up by the respective RTCs for the operational sub-risk types they control. These operational sub-risk types are controlled by various infrastructure functions and include the following:
- – The Compliance department performs an independent 2nd level control function that protects the bank’s license to operate by promoting and enforcing compliance with the law and driving a culture of compliance and ethical conduct in the bank. The Compliance department assists the business divisions and works with other infrastructure functions and regulators to establish and maintain a risk-based approach to the management of the bank’s compliance risks in accordance with the bank’s risk appetite and to help the bank detect, mitigate and prevent breaches of laws and regulations. The Compliance department performs the following principal activities: the identification, assessment, mitigation, monitoring and reporting on compliance risk; performs second level controls and testing; assists Regulatory Affairs with regulatory engagement and management and acts as a trusted advisor. The results of these assessments and controls are regularly reported to the Management Board and Supervisory Board.
- – Financial crime risks are managed by our Anti-Financial Crime (AFC) function via maintenance and development of a dedicated program. The AFC program is based on regulatory and supervisory requirements. AFC has defined roles and responsibilities and established dedicated functions for the identification and management of financial crime risks resulting from money laundering, terrorism financing, non-compliance with sanctions and embargoes, the facilitation of tax evasion as well as other criminal activities including fraud, bribery and corruption and other crimes. AFC updates its strategy for financial crime prevention via regular development of internal policies processes and controls, institution-specific risk assessment and staff training.
-
–
The Legal Department (including Group Governance and Group Data Privacy) is an independent infrastructure function mandated to provide legal advice to the Management Board, the Supervisory Board (to the extent it does not give rise to conflict of interest), business divisions and infrastructure functions, and to support the Management Board in setting up and guarding the Group’s governance and control frameworks in respect of the bank’s legal, internal corporate governance and data privacy risks. This includes in particular, but is not limited to:
- – Advising the Management Board and Supervisory Board on legal aspects of their activities
- – Providing legal advice to all Deutsche Bank units to facilitate adherence to legal and regulatory requirements in relation to their activities respectively, including to support their interactions with regulatory authorities
- – Engaging and managing external lawyers used by Deutsche Bank Group
- – Managing Deutsche Bank Group’s litigation and contentious regulatory matters, (including contentious HR matters), and managing Deutsche Bank Group’s response to external regulatory enforcement investigations
- – Advising on legal aspects of internal investigations
- – Setting the global governance framework for Deutsche Bank Group, facilitating its cross-unit application and assessing its implementation
- – Developing and safeguarding efficient corporate governance structures suitable to support efficient decision-making, to align risk and accountability based on clear and consistent roles and responsibilities
- – Maintaining Deutsche Bank Group’s framework for policies, procedures and framework documents and acting as guardian for Group policies and procedures as well as framework documents
- – Advising on data privacy laws, rules and regulation and maintaining DB Group´s data privacy risk and control framework
- – Ensuring appropriate quality assurance in relation to all of the above
109
|
|
Deutsche Bank
|
Operating and Financial Review
|
|
|
Annual Report 2021
|
Deutsche Bank Group
|
|
|
|
|
- – NFRM Product Governance oversees the New Product Approval (NPA) and Systematic Product Review (SPR) cross-risk processes forming a control framework designed to manage the risks associated with the implementation of new products and services, changes in products and services during their lifecycles and, the process by which they are systematically reviewed. Applicable bank-wide, the cross-risk processes cover different stages of the product lifecycle with NPA focusing on pre-implementation and SPR on post-implementation. Pre-implementation, the primary objective of the NPA process is to ensure proper assessment of all risks, both financial and non-financial, in NPA relevant products and services, as well as related processes and infrastructure. Post-implementation, the SPR process focuses on the periodic review of all products to determine if they are to remain live or need to be modified or withdrawn.
- – NFRM is the RTC for a number of operational resilience risks. Its mandate includes second line oversight of controls over transaction processing activities, as well as infrastructure risks to prevent technology or process disruption, maintain the confidentiality, integrity and availability of data, records and information security, and ensure business divisions and infrastructure functions have robust plans in place to recover critical business processes and functions in the event of disruption including technical or building outage, or the effects of cyber-attack or natural disaster as well as any physical security or safety risk. NFRM RTC also manages the risks arising from the bank’s internal and external vendor engagements via the provision of a comprehensive third party risk management framework
Measuring our operational risks
We calculate and measure the regulatory and economic capital requirements for operational risk using the Advanced Measurement Approach (AMA) methodology. Our AMA capital calculation is based upon the loss distribution approach. Gross losses from historical internal and external loss data (Operational Riskdata eXchange Association consortium data) and external scenarios from a public database (IBM OpData) complemented by internal scenario data are used to estimate the risk profile (i.e., a loss frequency and a loss severity distribution). Our loss distribution approach model includes conservatism by recognizing losses on events that arise over multiple years as single events in our historical loss profile.
Within the loss distribution approach model, the frequency and severity distributions are combined in a Monte Carlo simulation to generate potential losses over a one year time horizon. Finally, the risk mitigating benefits of insurance are applied to each loss generated in the Monte Carlo simulation. Correlation and diversification benefits are applied to the net losses in a manner compatible with regulatory requirements to arrive at a net loss distribution at Group level, covering expected and unexpected losses. Capital is then allocated to each of the business divisions after considering qualitative adjustments and expected loss.
The regulatory and economic capital requirements for operational risk are derived from the 99.9 % percentile; see the section “Internal Capital Adequacy” for details. Both regulatory and economic capital requirements are calculated for a time horizon of one year.
The regulatory and economic capital demand calculations are performed on a quarterly basis. NFRM establishes and maintains the approach for capital demand quantification and ensures that appropriate development, validation and change governance processes are in place, whereby the validation is performed by an independent validation function and in line with the Group’s model risk management process.
Drivers for operational risk capital development
In 2021, our total operational risk losses increased by € 172 million (43 %) year-on-year, predominantly driven
by losses and provisions arising from civil litigation and regulatory enforcement. Such losses still make up 89 % of operational risk losses, accounting for the majority of operational risk regulatory and economic capital demand and are more heavily reliant on our long-term loss history. Refer to section “Current Individual Proceedings”, Note 27 “Provisions”, for a description of our current legal and regulatory proceedings and a summary of the consolidated financial statements. The operational risk losses from civil litigation and regulatory enforcement increased by € 225 million (44 %) while our non-legal operational risk losses decreased by € 53 million (46 %) compared to 2020 primarily as a result of COVID-19 related expenses not having been repeated in 2021.
In view of the relevance of legal risks within our operational risk profile, we dedicate specific attention to the management and measurement of our open civil litigation and regulatory enforcement matters where the Bank relies both on information from internal as well as external data sources to consider developments in legal matters that affect the Bank specifically but also the banking industry as a whole. Reflecting the multi-year nature of legal proceedings the measurement of these risks furthermore takes into account changing levels of certainty by capturing the risks at various stages throughout the lifecycle of a legal matter.
Conceptually, the Bank measures operational risk including legal risk by determining the maximum loss that will not be exceeded with a given probability. This maximum loss amount includes a component that due to the IFRS criteria is reflected in our financial statements and a component that is expressed as regulatory or economic capital demand beyond the amount reflected as provisions within our financial statements.
110
|
|
Deutsche Bank
|
Operating and Financial Review
|
|
|
Annual Report 2021
|
Deutsche Bank Group
|
|
|
|
|
The legal losses which the Bank expects with a likelihood of more than 50 % are already reflected in our IFRS group financial statements. These losses include net changes in provisions for existing and new cases in a specific period where the loss is deemed probable and is reliably measurable in accordance with IAS 37. The development of our legal provisions for civil litigations and regulatory enforcement is outlined in detail in Note 27 “Provisions” to the consolidated financial statements.
Uncertain legal losses which are not reflected in our financial statements as provisions because they do not meet the recognition criteria under IAS 37 are expressed as “regulatory or economic capital demand”.
To quantify the litigation losses in the AMA model, the bank takes into account historical losses, provisions, contingent liabilities and legal forecasts. Legal forecasts are generally comprised of ranges of potential losses from legal matters that are not deemed probable but are reasonably possible. Reasonably possible losses may result from ongoing and new legal matters which are reviewed at least quarterly by the attorneys handling the legal matters.
We include the legal forecasts in the “relevant loss data” used in our AMA model. The projection range of the legal forecasts is not restricted to the one year capital time horizon but goes beyond and conservatively assumes early settlement of the underlying losses in the reporting period - thus considering the multi-year nature of legal matters.
Liquidity Risk Management
Liquidity risk arises from our potential inability to meet payment obligations when they come due or without incurring excessive costs. The group liquidity risk management framework should ensure that the guidance and controls are established within DB Group to fulfil its payment obligations at all times (including intraday) and can manage its liquidity and funding risks within the MB approved Risk Appetite, when executing the Bank’s strategy. The framework considers relevant and significant drivers of liquidity risk, whether on-balance sheet or off-balance sheet.
Liquidity Risk Management framework
The bank’s liquidity risk management principles are documented in the globally applicable “Liquidity Risk Management Policy” (LRMP) and adheres to the 8 key risk management practices (Risk governance, Risk Organization (3 LoD), Risk Culture, Risk Appetite and strategy, Risk Identification and assessment, Mitigation and controls, Risk measurement and reporting, Stress planning and execution). All additional policies and procedures (both global and local) issued by the liquidity risk management functions further define the requirements specific to liquidity risk practices. They are subordinate to this policy and subject to the standards it sets forth. The liquidity managing functions are organized in alignment with the three lines of defense structure set forth in the “Risk Management Policy – Deutsche Bank Group”. Lines of Business and Treasury comprise the first line of defense (“1LoD”) –responsible for executing the steps needed to manage the Bank’s liquidity position. Risk comprises the second line of defense (“2LoD”) – responsible for providing independent risk oversight, challenge, and validation of activities conducted by the 1LoD including establishing the Risk Appetite and Group level control standards. Group Audit comprises the third line of defense (“3LoD”) - responsible for overseeing the activities of both the 1LoD and 2LoD.The individual roles and responsibilities within the Liquidity Risk Management Framework have been laid out and documented in the Global Responsibility Matrix which was designed to provide clarity and transparency across all involved stakeholders.
In accordance with the ECB’s SREP (and revised ILAAP requirement issued in November 2018), Deutsche Bank has implemented an Internal Liquidity Adequacy Assessment Process (ILAAP), which is reviewed at least annually and approved by the Management Board. Liquidity Risk Management (LRM) undertakes ongoing oversight on activities conducted within the mandate of Treasury Liquidity Management (TSY-LM) to most effectively manage the liquidity of the group and steer business activities, while ensuring the bank’s Risk Appetite is adhered to. The ILAAP provides comprehensive documentation and assessment of the Bank’s Liquidity Risk Management framework, which includes: identifying the key liquidity and funding risks to which the Group is exposed; describing how these risks are identified, monitored and measured; and describing the techniques and resources used to manage and mitigate these risks.
The Management Board defines the liquidity and funding risk strategy for the Bank as well as the risk appetite, based on recommendations made by the Group Asset and Liability Committee (ALCO) and Group Risk Committee (GRC). The Management Board reviews and approves the risk appetite at least annually. The risk appetite is applied to the Group and Key Liquidity Entities (KLE) e.g. DB AG to monitor and control liquidity risk as well as the Bank’s long-term funding and issuance plan.
The Bank’s Liquidity Risk Appetite, which is defined through qualitative principles and supporting quantitative metrics, is laid out in the “Risk Appetite Statement – DB Group” and is subject to the standards set in the “Risk Appetite Policy – DB Group”. This Risk Appetite Statement is further underpinned by the Liquidity Risk Controls Framework consisting of Risk Appetite Limits, as well as a suite of Non-Risk Appetite Limits, Thresholds and Early Warning Indicators (EWI) defined in the Liquidity Risk Controls Policy.
111
|
|
Deutsche Bank
|
Operating and Financial Review
|
|
|
Annual Report 2021
|
Deutsche Bank Group
|
|
|
|
|
Deutsche Bank has a dedicated Stress Testing and Risk Appetite Framework set by LRM, which ensures the Bank’s liquidity position is balanced across the Group, its KLEs and across currencies.
Treasury manages liquidity and funding, in accordance with the Management Board-approved risk appetite across a range of relevant metrics and implements a number of tools including business level limits, to ensure compliance. As such, Treasury works closely with LRM and business divisions to identify, analyze and monitor underlying liquidity risk characteristics within business portfolios. These parties are engaged in regular dialogue regarding changes in the Bank’s liquidity position arising from business activities and market circumstances.
Furthermore, the Bank ensures at the level of each liquidity relevant entity that all local liquidity metrics are managed in compliance with the defined risk appetite. Local liquidity surpluses are pooled in DB AG hubs and local liquidity shortfalls can be met through support from DB AG hubs. Transfers of liquidity capacity between entities are subject to the approval framework outlined in the “Intercompany Funding Policy” involving the Group’s liquidity steering function as well as the local liquidity managers considering the LCR, NSFR (Pillar 1) and sNLP (Pillar 2), available surplus that resides in entities with restriction to transfer liquidity to other group entities, for example due to regulatory lending requirements, is considered to be trapped and as such not counted in the calculation of the consolidated group liquidity surplus.
The Management Board is informed about the Bank’s performance against the key liquidity metrics, including the Risk Appetite and internal and market indicators, via a weekly Liquidity Dashboard. Liquidity Treasury Reporting Analysis (LTRA) has overall accountability for the accurate and timely production of both external regulatory liquidity reporting and the internal management reporting of liquidity risk for DB Group. In addition, LTRA is responsible for the development of management information systems (MIS) and related analysis necessary for supporting the liquidity risk framework and its governance for Treasury and LRM.
As part of the annual strategic planning process, Treasury projects the development of the key liquidity and funding metrics including the USD currency exposure based on anticipated business activity to ensure that the strategic plan remains aligned with the Bank’s Risk Appetite.
Deutsche Bank has a wide range of funding sources, including retail and institutional deposits, unsecured and secured wholesale funding and debt issuance in the capital markets. Group ALCo is the Bank’s decisive governing body mandated by the Management Board to optimize the sourcing and deployment of the Bank’s balance sheet and financial resources in line with the Management Board risk appetite and strategy. As such, it has the overarching responsibility to define, approve and optimize the Bank`s funding strategy.
Deutsche Bank’s Group Contingency Funding Plan (CFP) outlines how the bank would respond to an actual or anticipated liquidity stress event. It includes a decisive set of actions that can be taken to raise cash and recover the bank’s key liquidity metrics in times of liquidity stress. The CFP includes a clear governance structure and well-defined liquidity risk indicators to ensure timely and effective decision-making, communication, and coordination during a liquidity stress event. Deutsche Bank has established the Financial Resource Management Council (FRMC) which is responsible for oversight of capital and liquidity across contingency, recovery, and resolution scenarios in a crisis situation.
Short-term liquidity and wholesale funding
Deutsche Bank tracks all contractual cash flows from wholesale funding sources on a daily basis, over a 12-month horizon. For this purpose, the Bank considers wholesale funding to include unsecured liabilities largely raised by Treasury Markets Pool, as well as secured liabilities primarily raised by the Investment Bank Division. Wholesale funding counterparties typically include corporates, banks and other financial institutions, governments and sovereigns.
The Group has implemented a set of limits to restrict the Bank’s exposure to wholesale counterparties, which have historically demonstrated the most susceptibility to market stress. The wholesale funding limits are monitored daily and apply to the total combined currency amount of all wholesale funding currently outstanding, both secured and unsecured with specific tenor limits. Liquidity Reserves constitute the primary mitigants against potential stress in the short-term.
The tables in the section “Liquidity Risk Exposure: Funding Diversification” show the contractual maturity of the Bank’s short-term wholesale funding and capital markets issuance.
112
|
|
Deutsche Bank
|
Operating and Financial Review
|
|
|
Annual Report 2021
|
Deutsche Bank Group
|
|
|
|
|
Liquidity stress testing and scenario analysis
Global internal liquidity stress testing and scenario analysis is used for measuring liquidity risk and evaluating the Group’s short-term liquidity position within the liquidity framework. This complements the daily operational cash management process. The long-term liquidity strategy based on contractual and behavioral modelled cash flow information is represented by a long-term metric known as the Funding Matrix (refer to Funding Risk Management below).
The global liquidity stress testing process is managed by Treasury in accordance with the Management Board approved risk appetite. Treasury is responsible for the design of the overall methodology, the choice of liquidity risk drivers and the determination of appropriate assumptions (parameters) to translate input data into stress testing output. LRM is responsible for the definition of the stress scenarios. Under the principles laid out by Model Risk Management, LRM performs the independent validation of liquidity risk models and non-model estimates. LTRA is responsible for implementing these methodologies and performing the stress test calculation in conjunction with Treasury, LRM and IT.
Stress testing and scenario analysis are used to evaluate the impact of sudden and severe stress events on the Group’s liquidity position. Deutsche Bank has selected four scenarios to calculate the Group’s stressed Net Liquidity Position (“sNLP”). These scenarios are designed to capture potential outcomes which may be experienced by Deutsche Bank during periods of idiosyncratic and/or market-wide stress and are designed to be both plausible and sufficiently severe as to materially impact the Group’s liquidity position. The most severe scenario assesses the potential consequences of a combined market-wide and idiosyncratic stress event, including downgrades of our credit rating. Under each of the scenarios the impact of a liquidity stress event over different time horizons and across multiple liquidity risk drivers, covering all business lines, product areas and balance sheet is considered. The output from scenario analysis feeds the Group Wide Stress Test, which considers the impact of scenarios on all risk stripes.
In addition, potential funding requirements from contingent liquidity risks which might arise under stress, including drawdowns on credit facilities, increased collateral requirements under derivative agreements, and outflows from deposits with a contractual rating linked trigger are included in the analysis. Subsequently Countermeasures, which are the actions the Group would take to counterbalance the outflows incurred during a stress event, are taken into consideration. Those countermeasures include utilizing the Bank’s Liquidity Reserve and generating liquidity from other unencumbered, marketable assets without causing any material impact on the Bank’s business model.
Stress testing is conducted at a global level and for defined Key Liquidity Entities covering an eight-week stress horizon which is considered the most critical time span during a liquidity crisis and, where, on a Group level, liquidity is actively steered and assessed. In addition to the consolidated currency stress test, stress tests for material currencies (EUR, USD and GBP) are performed. On a global level and in the U.S. liquidity stress tests cover a 12 months period. Additionally we also monitor the stress test results over a 12 month period with specific risk limits if required by local regulators. Ad-hoc analysis may be conducted to reflect the impact of potential downside events that could affect the Bank such as the COVID-19 pandemic. Relevant stress assumptions are applied to reflect liquidity flows from risk drivers and on-balance sheet and off-balance sheet products. The suite of stress testing scenarios and assumptions are reviewed on a regular basis and are updated when enhancements are made to stress testing methodologies.
Complementing daily liquidity stress testing, the Bank also conducts regular Group Wide Stress Testing (GWST) run by Enterprise Risk Management (ERM) analyzing liquidity risks in conjunction with the other defined risk types and evaluating their impact and interplay to both capital and liquidity positions as described in Risk and Capital Framework Stress testing.
The tables in the section “Liquidity Risk Exposure: Stress Testing and Scenario Analysis” show the results of the internal global liquidity stress test under the various scenarios.
Liquidity Coverage Ratio
In addition to the internal stress test results, the Group has a Management Board-approved risk appetite for the Liquidity Coverage Ratio (LCR). The LCR is intended to promote the short-term resilience of a Bank’s liquidity risk profile over a 30-day stress scenario. The ratio is defined as the amount of High-Quality Liquid Assets (HQLA) that could be used to raise liquidity in a stressed scenario, measured against the total volume of net cash outflows, arising from both contractual and modelled exposures over a 30-day time horizon.
The LCR complements the internal stress testing framework. By maintaining a ratio in excess of the minimum regulatory requirements, the LCR seeks to ensure that the Group holds adequate liquidity resources to mitigate a short-term liquidity stress.
113
|
|
Deutsche Bank
|
Operating and Financial Review
|
|
|
Annual Report 2021
|
Deutsche Bank Group
|
|
|
|
|
Key differences between the internal liquidity stress test and LCR include the time horizon (eight weeks versus 30 days), the classification and haircut differences between Liquidity Reserves and the LCR HQLA, outflow rates for various categories of funding, and inflow assumption for various assets (for example, loan repayments). The Group’s internal liquidity stress test also includes outflows related to intraday liquidity assumptions, which are not explicitly reflected in the LCR.
Funding Risk Management
Deutsche Bank’s primary internal tool for monitoring and managing longer term funding risk is the Funding Matrix. The Funding Matrix assesses the Group’s structural funding profile over a time horizon beyond one year. To produce the Funding Matrix, all funding-relevant assets and liabilities are mapped into time buckets corresponding to their contractual or modeled maturities. This allows the Group to identify expected excesses and shortfalls in term liabilities over assets in each time bucket, facilitating the management of potential liquidity exposures.
The liquidity profile is based on contractual cash flow information. If the contractual maturity profile of a product does not adequately reflect the liquidity profile, it is replaced by modeling assumptions. Short-term balance sheet items (1yr) or matched funded structures (asset and liabilities directly matched with no liquidity risk) are excluded from the term analysis.
The bottom-up assessment by individual business line is combined with a top-down reconciliation against the Group’s IFRS balance sheet. From the cumulative term profile of assets and liabilities beyond 1 year, long-funded surpluses or short-funded gaps in the Group’s maturity structure can be identified. The cumulative profile is thereby built up starting from the greater than 10-year bucket down to the greater than 1-year bucket.
The strategic liquidity planning process, which incorporates the development of funding supply and demand across business units, together with the Bank’s targeted key liquidity and funding metrics, provides the key input parameter for our annual capital markets issuance plan. Upon approval by the Management Board the capital markets issuance plan establishes issuance targets for securities by tenor, volume, currency and instrument.
Net Stable Funding Ratio
The Net Stable Funding Ratio (NSFR) is a regulatory metric for assessing a Bank’s structural funding profile. The NSFR is intended to reduce medium to long-term funding risks by requiring banks to maintain a stable funding profile in relation to their on- and off-balance sheet activities. The ratio is defined as the amount of Available Stable Funding (the portion of capital and liabilities expected to be a stable source of funding), relative to the amount of Required Stable Funding (a function of the liquidity characteristics of various assets held).
NFSR limits have been set for Group as well as for the entity Deutsche Bank AG to ensure compliance with this regulatory requirement. As the NSFR has come into effect as of June 28, 2021, the Bank must now maintain the prescribed minimum 100 % ratio. NSFR risk appetite levels were treated as thresholds up to June 28, 2021 after which they became hard limits to reflect the regulatory requirement.
Capital Markets Issuance
Debt issuance, encompassing senior unsecured bonds, covered bonds, and capital securities, is a key source of term funding for the Bank and is managed directly by Treasury. At least once a year, following endorsement by ALCO, Treasury submits an annual long-term Funding Plan to the GRC for recommendation and then to the Management Board for approval. This plan is driven by global and local funding and liquidity requirements based on expected business development. The Group’s capital markets issuance portfolio is dynamically managed through annual issuance plans to avoid excessive maturity concentrations.
Funding Diversification
Diversification of the Group’s funding profile in terms of investor types, regions and products is an important element of the liquidity risk management framework. The Bank has minimum risk appetite levels for most stable funding sources stemming from capital markets issuances and equity, as well as from retail, and transaction banking clients. Other customer deposits, secured funding and short positions are additional sources of funding. Unsecured wholesale funding represents unsecured wholesale liabilities sourced primarily by the Treasury Pool Management team. Given the relatively short-term nature of these liabilities, they are predominantly used to fund liquid trading assets.
114
|
|
Deutsche Bank
|
Operating and Financial Review
|
|
|
Annual Report 2021
|
Deutsche Bank Group
|
|
|
|
|
For diversifying our refinancing activities, Deutsche Bank holds a license to issue mortgage Pfandbriefe and maintains a program to issue structured covered bonds. Additionally, the Group continues to run a program for the purpose of issuing covered bonds under Spanish law (Cedulas). DB Group has also participated in ECB’s TLTRO III program. Under the Green Financing Framework Deutsche Bank has issued its first
Green Bond Senior Preferred issuance (
U.S.$
800
million
) and first
green Formosa bonds (
U.S.$
400
million
in total) to Taiwanese investors by a major global bank. Furthermore, multiple green structured notes, first green deposits and first green repurchase agreements (repos) were executed.
The chart “Liquidity Risk Exposure: Funding Diversification” shows the composition of external funding sources that contribute to the liquidity risk position, both in EUR billion and as a percentage of our total external funding sources.
Funds Transfer Pricing
The funds transfer pricing framework applies to all businesses/regions and promotes pricing of (i) assets in accordance with their underlying liquidity risk, (ii) liabilities in accordance with their liquidity value and (iii) contingent liquidity exposures in accordance with the cost of providing for appropriate liquidity reserves.
Within this framework funding and liquidity risk costs and benefits are allocated to the firm’s business units based on rates which reflect the economic costs of liquidity for Deutsche Bank. Treasury might set further financial incentives in line with the Bank’s liquidity risk guidelines. While the framework promotes a diligent group-wide allocation of the Bank's funding costs to the liquidity users, it also provides an incentive-based framework for businesses generating stable long-term and stress compliant funding.
Throughout 2021, the Bank continued to deliver against improvements of the changes to the internal FTP framework started in 2019 aimed at enhancing its effectiveness as a management tool, as well as better supporting funding cost optimization. Additional details are included in Note 4 „Business segments and related information“ of the consolidated financial statements.
Liquidity Reserves
Liquidity Reserves comprise available cash and cash equivalents, unencumbered highly liquid securities (including government and agency bonds and government guarantees) and other unencumbered central bank eligible assets. Certain intraday requirements and Mandatory Minimum Reserves are directly deducted in the calculation of the Liquidity Reserves while other intraday outflows are represented in the Group’s internal liquidity model.
The vast majority of the Group’s liquidity reserves are held centrally across major currencies at the central bank accounts of the parent entity and foreign branches in the key locations in which we are active and in a dedicated Treasury-owned Strategic Liquidity Reserve (SLR), set up exclusively to serve as a mitigant during periods of stress. To ensure a prudent composition of liquidity reserves across asset classes, minimum cash thresholds for the material currencies are maintained. In-line with our communication to the market, going forward the Bank aims at focusing on its amount of High-quality Liquid Assets, replacing the Liquidity Reserve measure, as it provides greater comparability across the industry.
Asset Encumbrance
Encumbered assets primarily comprise those on- and off-balance sheet assets that are pledged as collateral against secured funding, collateral swaps, and other collateralized obligations. Generally, loans are encumbered to support long-term capital markets secured issuance such as covered bonds or other self-securitization structures, while financing debt and equity inventory on a secured basis is a regular activity for the Investment Bank business. Additionally, in line with the EBA technical standards on regulatory asset encumbrance reporting, assets pledged with settlement systems are considered encumbered assets, including default funds and initial margins, as well as other assets pledged which cannot be freely withdrawn such as mandatory minimum reserves at central banks. Derivative margin receivable assets as encumbered under these EBA guidelines are also included.
115
|
|
Deutsche Bank
|
Operating and Financial Review
|
|
|
Annual Report 2021
|
Deutsche Bank Group
|
|
|
|
|
Enterprise risk management
Enterprise Risk Management (ERM) is a cross-risk function responsible for the bank’s overarching risk management framework and portfolio management. ERM sets, allocates and monitors risk appetite and provides analytics and recommendations to steer the strategy of the bank. ERM has the mandate to:
- – Set the bank’s risk management framework seeking to ensure that all risks are identified, owned and assessed.
- – Manage enterprise risk appetite, including the framework and methodology as to how appetite is applied across risk types, divisions, businesses and legal entities.
- – Integrate and aggregate risks to provide greater enterprise risk transparency to support decision making.
- – Commission forward-looking stress tests and manage group recovery plans.
Additionally, ERM acts as 2
nd
LoD function for enterprise risks, which relate to the potential losses or adverse consequences from strategic risk, insufficient capital, portfolio concentrations, environmental, social and governance risks. This includes inter alia the establishment of an appropriate risk governance, setting of a risk appetite, risk measurement and reporting. The management of these risks is also closely integrated with the bank’s overall strategy and processes on internal capital and liquidity adequacy.
Strategic risk
Strategic risk is the risk of a shortfall in earnings (excluding other material risks) due to incorrect business plans (owing to flawed assumptions), ineffective plan execution or a lack of responsiveness to material plan deviations. Strategic risk arises from the exposure of the bank to the macroeconomic environment, changes in the competitive landscape, and regulatory and technological developments. Additionally, it could occur due to errors in strategic positioning, the bank’s failure to execute its planned strategy and/or a failure to effectively address under-performance versus plan targets.
The strategic plan is developed annually and presented to the Management Board for discussion and approval. The final plan is presented to the Supervisory Board. The plan is challenged in an iterative process with respect to its assumptions, credibility and integrity. During the year, execution of business strategies is regularly monitored to assess the performance against targets. A more comprehensive description of this process is detailed in the section ‘Strategic and Capital Plan’.
Strategic risk is measured through a dedicated risk model that quantifies potential losses caused by unexpected pre-tax earnings shortfalls that cannot be offset by cost reductions under extreme but plausible market conditions over a 12-month period.
The 2
nd
LoD function for strategic risk is ERM. Finance, together with the divisions, are the 1
st
LoD and act as key risk managers of the associated risk.
Capital risk
Capital risk is defined as the risk that Deutsche Bank has an insufficient level or composition of capital supply to support its current and planned business activities and associated risks during normal and stressed conditions.
The bank’s capital risk framework consists of several elements which aim to ensure that Deutsche Bank maintains on an ongoing basis an adequate capitalization to cover the risks to which is exposed. The framework is strongly integrated with the bank-wide strategic planning process and closely linked to Deutsche Bank’s internal capital adequacy assessment process (see section “Internal Capital Adequacy Assessment Process” for further details). Treasury together with the divisions are the key risk managers of the associated risks and represent the 1
st
LoD. ERM acts as the 2
nd
LoD for capital risk.
Our Treasury function manages capital risk at group level and locally in each region, as applicable. This includes managing issuances and repurchases of capital instruments (see section on “Capital management” for details). Additionally, divisional limits for our key capital resources are approved by the Group Asset and Liability Committee to ensure alignment with our capital risk appetite (see section on “Resource limit setting” for details).
ERM sets the capital risk framework, assesses the capital risk profile and provides independent challenge. This includes setting of risk appetite thresholds for key capital ratios. Threshold breaches are subject to a dedicated governance framework triggering management actions up to the execution of Deutsche Bank’s recovery plan. Thresholds also provide boundaries to the capital plan and are fully integrated into the regular assessment of capital risk under stress scenarios.
116
|
|
Deutsche Bank
|
Operating and Financial Review
|
|
|
Annual Report 2021
|
Deutsche Bank Group
|
|
|
|
|
Portfolio concentration risk
Risk concentrations refer to clusters of the same or similar risk drivers within specific risk types (intra-risk concentrations in credit, market, operational and strategic risks) as well as across different risk types (inter-risk concentrations). They occur within and across counterparties, businesses, regions/countries, industries and products. The management and monitoring of risk concentrations is achieved through a quantitative and qualitative approach, as follows:
- – Intra-risk concentrations are assessed, monitored and mitigated by the individual risk functions (credit, market, operational, liquidity and strategic risk management). This is supported by limit setting on different levels and/or management according to each risk type.
- – Inter-risk concentrations are managed through quantitative top-down stress-testing and qualitative bottom-up reviews, identifying and assessing risk themes independent of any risk type and providing a holistic view across the bank. The diversification effects between credit, market, operational and strategic risk are measured through a dedicated risk model that quantifies the diversification benefit caused by non-perfect correlations between these risk types. The calculation of the risk type diversification benefit is intended to ensure that the standalone economic capital figures for the individual risk types are aggregated in an economically meaningful way.
The most senior governance body for the oversight of risk concentrations throughout 2021 was the Group Risk Committee (GRC).
Environmental, social and governance risk
The impacts of rising global temperatures, and the enhanced focus on climate change and the transition to a net-zero economy from society, our regulators and the banking sector have led to the emergence of new and increasing sources of financial and non-financial risks. These include the physical risks arising from extreme weather events, which are growing in frequency and severity, as well as transition risks as carbon intensive sectors are faced with higher taxation, reduced demand and potentially restricted access to financing. These risks can impact Deutsche Bank across a broad range of financial and non-financial risk types.
Financial institutions are facing increased scrutiny on climate and broader ESG-related issues from governments, regulators, shareholders and other bodies, leading to reputational risks if we are not seen to support the transition to a lower carbon economy, to protect biodiversity and human rights. We are also required to review and enhance our ESG risk management frameworks in alignment with emerging regulatory guidance and to ensure that we prevent Greenwashing. There is a lack of consistent and comprehensive ESG data and methodologies available today which means that we are heavily reliant on proxy estimates and qualitative approaches when assessing the risks to our balance sheet and introduce a high degree of uncertainty into our climate-related disclosures. In 2022, the ECB will conduct its first climate stress test, an exercise which will be extremely valuable as a learning exercise but contains a number of novel and complex elements which require the development of new methodologies and data sources.
Deutsche Bank is committed to managing our business activities and operations in a sustainable manner, including aligning our portfolios with net zero emissions by 2050. Deutsche Bank’s Group Sustainability Committee of the Management Board, which is chaired by the Chief Executive Officer, decides on all important sustainability initiatives. The Committee is advised by the Sustainability Council, composed of executives from business divisions and infrastructure functions. The Group Risk Committee (GRC), chaired by the Chief Risk Officer, is established by the Management Board to serve as the central forum for review and decision making on matters related to risk, capital, and liquidity. This includes the responsibility for developing the Bank’s Climate and broader ESG Risk Frameworks. A dedicated ESG Risk Forum oversees the integration ESG risks into the bank’s existing financial and non-financial risk management frameworks.
Climate and other ESG risks are incorporated into our risk taxonomy as discrete risk types. Our business activities are governed by a dedicated Climate and Environmental Risk Policy outlining roles, responsibilities as well as qualitative risk appetite principles and quantitative risk-appetite metrics. In addition, our Environmental and Social policy outlines specific restrictions for certain sectors. We use a number of complementary tools to identify and assess risks including our group risk identification process, an internal climate risk taxonomy and regular internal reporting of portfolio financed emissions and intensities. In addition, our risk-led annual reviews of our industry and country portfolio strategy include an assessment of climate risk vulnerability.
117
|
|
Deutsche Bank
|
Operating and Financial Review
|
|
|
Annual Report 2021
|
Deutsche Bank Group
|
|
|
|
|
Model Risk Management
Introduction
Model risk is the potential for adverse consequences from decisions based on incorrect or misused model outputs. Model risk can lead to: financial loss, poor business or strategic decision making, or damage to our reputation. DB recognizes the use of models can affect other risk-types, and that model risk is a distinct risk that can increase or decrease aggregate risk across other risk-types.
Deutsche Bank uses models for a broad range of decision-making activities, such as: underwriting credits; valuing exposures, instruments, and positions; measuring risk; managing and safeguarding client assets and determining capital and reserve adequacy. The term ‘model’ refers to a quantitative method, system, or approach that applies statistical, economic, financial, or mathematical theories, techniques, and assumptions to process input data into quantitative estimates. Models are simplified representations of real-world relationships and are based on assumptions and judgment. Accordingly, the bank is exposed to model risk, which must be identified, measured, and controlled appropriately.
Model risk management oversight is provided by all levels of management, including the Management Board. Management of model risk is underpinned by a framework designed and monitored by 2nd Line of Defence, including components across the lifecycle of a model.
Model Risk Management Framework and Governance
Model risk is one of the bank’s Level 1 risks, and is overseen by the Chief Risk Officer through the setting of a quantitative and qualitative risk appetite statement, and managed through:
- – Model risk policies and procedures, and supporting Key Operating Documents (KODs) aligned to risk appetite, regulatory requirements, and industry best practice, with clear roles and responsibilities for stakeholders;
- – Inventorization of all models, supporting ongoing model risk framework components including risk assessments and attestations;
- – Key controls for all models from development through to decommissioning, including validation, approval, deployment and monitoring:
- – Independent Validations, and subsequent 2LoD approvals, verify that models have been appropriately designed and implemented for their intended scope and purpose, and that respective controls are in place to assure that they continue to perform as expected during their use;
- – The controls identify models’ limitations and weaknesses, resulting in findings and compensating controls, these may be conditions for use, such as adjustments or overlays;
- – Model risk governance, including senior forums for monitoring and escalation of model risk related topics, as well as monthly updates to the Management Board on the model risk appetite metrics, and periodic model risk updates to the Supervisory Board.
Developments during the reporting period:
Model risk has been elevated to a Level 1 in the bank’s Group Risk Type Taxonomy reflecting the scope and importance of model risk to the firm. This was previously covered as a Level 3 risk under operational risk (“model misuse risk”). In addition, consequences for non-compliance with the model risk policy have been enhanced.
At the start of 2021, a strategic initiative was underway to refresh all aspects of the model risk framework bringing alignment of practices across the bank including identification, measurement, monitoring, reporting, controls, and mitigation of model risks. This new framework is supported by the development of an enhanced Model Inventory system. Phase one of implementation is focused on our US operations, with bank-wide implementation planned for 2022.
118
|
|
Deutsche Bank
|
Operating and Financial Review
|
|
|
Annual Report 2021
|
Deutsche Bank Group
|
|
|
|
|
Reputational Risk Management
Within our risk management process, reputational risk is defined as the risk of possible damage to Deutsche Bank’s brand and reputation, and the associated risk to earnings, capital or liquidity arising from any association, action or inaction which could be perceived by stakeholders to be inappropriate, unethical or inconsistent with the DB’s values and beliefs.
Deutsche Bank seeks to ensure that reputational risk is as low as reasonably practicable. Reputational risk cannot be precluded as it can be driven by unforeseeable changes in perception of our practices by our various stakeholders (e.g. public, clients, shareholders and regulators). Deutsche Bank strives to promote sustainable standards that will enhance profitability and minimize reputational risk.
The Reputational Risk Framework (the Framework) is in place to manage the process through which active decisions are taken on matters which may pose a reputational risk, before the event, and in doing so to prevent damage to Deutsche Bank’s reputation wherever possible. The Framework provides consistent standards for the identification, assessment and management of reputational risk issues. Reputational impacts which may arise as a consequence of a failure from another risk type, control or process are addressed separately via the associated risk type framework and are therefore not addressed in this section. The reputational risk could arise from multiple sources including, but not limited to, potential issues with the profile of the counterparty, the business purpose / economic substance of the transaction or product, high risk industries, environmental and social considerations, and the nature of the transaction or product or its structure and terms.
The modelling and quantitative measurement of reputational risk internal capital is implicitly covered in our economic capital framework primarily within strategic risk.
Governance and Organizational Structure
The Framework is applicable across all Business Divisions and Regions. DWS-specific matters are reviewed by a DWS-dedicated reputational risk committee and escalated to the DWS Executive Board where required.
Whilst every employee has a responsibility to protect our reputation, the primary responsibility for the identification, assessment, management, monitoring and, if necessary, referring or reporting of reputational risk matters lies with Deutsche Bank’s Business Divisions as the primary risk owners. Each Business Division has an established process through which matters, which are deemed to be a moderate or greater reputational risk are assessed, the Unit Reputational Risk Assessment Process (Unit RRAP).
The Unit RRAP is required to refer any material reputational risk matters to the respective Regional Reputational Risk Committee (RRRC). The Framework also sets out a number of matters which are considered inherently higher risk from a reputational risk perspective and are therefore mandatory referrals to the RRRCs. The RRRCs, which are 2nd LoD Committees, are responsible for ensuring the oversight, governance and coordination of the management of reputational risk in the respective region of Deutsche Bank. The RRRCs meet, as a minimum, on a quarterly basis with ad hoc meetings as required. The Group Reputational Risk Committee (GRRC) is responsible for ensuring the oversight, governance and coordination of the management of reputational risk at Deutsche Bank on behalf of the Group Risk Committee and the Management Board. Additionally, the GRRC reviews cases with a Group wide impact and in exceptional circumstances, those that could not be resolved at a regional level.
119
|
|
Deutsche Bank
|
Operating and Financial Review
|
|
|
Annual Report 2021
|
Deutsche Bank Group
|
|
|
|
|
Risk and capital performance
Capital, Leverage Ratio, TLAC and MREL
Own Funds
The calculation of our own funds incorporates the capital requirements following the “Regulation (EU) No 575/2013 on prudential requirements for credit institutions and investment firms” (Capital Requirements Regulation or “CRR”) and the “Directive 2013/36/EU on access to the activity of credit institutions and the prudential supervision of credit institutions and investment firms” (Capital Requirements Directive or “CRD”) which have been further amended with subsequent Regulations and Directives. The CRD has been implemented into German law. The information in this section as well as in the section “Development of risk-weighted Assets” is based on the regulatory principles of consolidation.
This section refers to the capital adequacy of the group of entities consolidated for banking regulatory purposes pursuant to the CRR and the German Banking Act (“Kreditwesengesetz” or “KWG”). Therein not included are insurance companies or companies outside the finance sector.
The total own funds pursuant to the effective regulations as of year-end 2021 comprises Tier 1 and Tier 2 (T2) capital. Tier 1 capital is subdivided into Common Equity Tier 1 (CET 1) capital and Additional Tier 1 (AT1) capital.
Common Equity Tier 1 (CET 1) capital consists primarily of common share capital (reduced by own holdings) including related share premium accounts, retained earnings (including losses for the financial year, if any) and accumulated other comprehensive income, subject to regulatory adjustments (i.e. prudential filters and deductions), as well as minority interests qualifying for inclusion in consolidated CET 1 capital. Prudential filters for CET 1 capital, according to Articles 32 to 35 CRR, include (i) securitization gains on sale, (ii) cash flow hedges and changes in the value of own liabilities, and (iii) additional value adjustments. CET 1 capital deductions for instance includes (i) intangible assets (exceeding their prudential value), (ii) deferred tax assets that rely on future profitability, (iii) negative amounts resulting from the calculation of expected loss amounts, (iv) net defined benefit pension fund assets, (v) reciprocal cross holdings in the capital of financial sector entities and, (vi) significant and non-significant investments in the capital (CET 1, AT1, T2) of financial sector entities above certain thresholds. All items not deducted (i.e., amounts below the threshold) are subject to risk-weighting.
Additional Tier 1 (AT1) capital consists of AT1 capital instruments and related share premium accounts as well as noncontrolling interests qualifying for inclusion in consolidated AT1 capital. To qualify as AT1 capital under CRR/CRD, instruments must have principal loss absorption through a conversion to common shares or a write-down mechanism allocating losses at a trigger point and must also meet further requirements (perpetual with no incentive to redeem; institution must have full dividend/coupon discretion at all times, etc.).
Tier 2 (T2) capital comprises eligible capital instruments, the related share premium accounts and subordinated long-term debt, certain loan loss provisions and noncontrolling interests that qualify for inclusion in consolidated T2 capital. To qualify as T2 capital, capital instruments or subordinated debt must have an original maturity of at least five years. Moreover, eligible capital instruments may inter alia not contain an incentive to redeem, a right of investors to accelerate repayment, or a credit sensitive dividend feature
We present in this report certain figures based on the CRR definition of own fund instruments applicable for Additional Tier 1
(AT1) capital and Tier 2 (T2) capital and figures based thereon, (including Tier 1, Total Capital and Leverage Ratio) on a “fully loaded” basis. We calculate such “fully loaded” figures excluding the transitional arrangements for own fund instruments as provided in the currently applicable CRR/CRD.
Our CET 1 and RWA figures include the transitional impacts from the IFRS 9 add-back also in the “fully-loaded” figures given it is an immaterial difference.
Transitional arrangements are applicable for AT1 and T2 instruments. Capital instruments issued on or prior to December 31, 2011, that no longer qualify as AT1 or T2 capital under the fully loaded CRR/CRD as currently applicable are subject to grandfathering rules during the transitional period and are being phased out from 2013 to 2022 with their recognition capped at 20 % in 2020 and 10 % in 2021 (in relation to the portfolio eligible for grandfathering which was still in issue on December 31, 2012) with grandfathering phasing out completely from January 1, 2022.
120
|
|
Deutsche Bank
|
Operating and Financial Review
|
|
|
Annual Report 2021
|
Deutsche Bank Group
|
|
|
|
|
The current CRR as applicable since June 27, 2019 provides further grandfathering rules for AT1 and T2 instruments issued prior to June 27, 2019. Thereunder, AT1 and T2 instruments issued through special purpose entities are grandfathered until December 31, 2021. Beyond 2021, transitional arrangements only exist for AT1 and T2 instruments which continue to qualify until June 26, 2025 even if they do not meet certain new requirements that apply since June 27, 2019. We had immaterial amounts of such instruments
outstanding at year end 2021, which practically removes the difference between “fully loaded” and “transitional” AT1 and T2 instruments starting from January 1, 2022.
We believe that these “fully loaded” calculations provide useful information to investors as they reflect our progress against known future regulatory capital standards. Many of our competitors have been describing calculations on a “fully loaded” basis, however, our competitors’ assumptions and estimates regarding “fully loaded” calculations may vary such that, our “fully loaded” measures may not be comparable with similarly labelled measures used by our competitors.
Capital instruments
Our Management Board received approval from the 2020 Annual General Meeting to buy back up to 206.7 million shares before the end of April 2025. Thereof 103.3 million shares can be purchased by using derivatives, this includes 41.3 million derivatives with a maturity exceeding 18 months. During the period from the 2020 Annual General Meeting until the 2021 Annual General Meeting (May 27, 2021), 28.7 million shares were purchased. The shares purchased were used for equity compensation purposes in the same period or are to be used in the upcoming period so that the number of shares held in Treasury from buybacks was 3.7 million as of the 2021 Annual General Meeting.
The 2021 Annual General Meeting granted our Management Board the approval to buy back up to 206.7 million shares before the end of April 2026. Thereof 103.3 million shares can be purchased by using derivatives, this includes 41.3 million derivatives with a maturity exceeding 18 months. These authorizations substitute the authorizations of the previous year. During the period from the 2021 Annual General Meeting until December 31, 2021, 4.0 million shares and 24.0 million call options were purchased. The shares in inventory are to be used in this period or upcoming periods for equity compensation purposes; the number of shares held in Treasury from buybacks was 0.7 million as of December 31, 2021. The call options are to be used also for equity compensation purposes in the upcoming periods.
Since the 2017 Annual General Meeting, renewed at the 2021 Annual General Meeting, and as of December 31, 2021, authorized capital available to the Management Board is € 2,560 million (1,000 million shares). As of December 31, 2021, the conditional capital against cash stands at € 512 million (200 million shares). The Management Board has decided that it will not make use of this conditional capital. Additional conditional capital for equity compensation amounts to € 51.2 million (20 million shares). Further, the 2018 Annual General Meeting authorized the issuance of participatory notes and other Hybrid Debt Securities that fulfill the regulatory requirements to qualify as Additional Tier 1 capital with an equivalent value of € 8.0 billion.
Our legacy Hybrid Tier 1 capital instruments (substantially all noncumulative trust preferred securities) are not recognized under fully loaded CRR/CRD rules as Additional Tier 1 capital, mainly because they have no write-down or equity conversion feature. During the transitional phase-out period the maximum recognizable amount of Additional Tier 1 instruments from Basel 2.5 compliant issuances as of December 31, 2012 will be reduced at the beginning of each financial year by 10 % or € 1.3 billion, through 2022. For December 31, 2021, this resulted in eligible Additional Tier 1 instruments of € 8.9 billion (i.e. € 8.3 billion AT1 Notes recognized under fully loaded CRR/CRD rules as well as € 0.6 billion of legacy Hybrid Tier 1 instruments recognizable during the transition period; the latter are recognized as regulatory capital as of December 2021 for the last time). In 2021, the bank issued AT1 notes amounting to € 2.5 billion. Furthermore, the bank redeemed legacy Hybrid Tier 1 instruments with a notional of € 0.5 billion.
The total of our Tier 2 capital instruments as of December 31, 2021 recognized during the transition period under CRR/CRD was € 7.4 billion (nominal value of € 8.8 billion). Tier 2 instruments recognized under fully loaded CRR/CRD rules amounted to € 7.3 billion (nominal value of € 8.7 billion). In 2021, the bank issued Tier 2 capital instruments with a nominal value of U.S. $ 1.25 billion (equivalent amount of € 1.1 billion). Furthermore, Tier 2 capital instruments with a notional of € 0.3 billion were redeemed.
Minimum capital requirements and additional capital buffers
The Pillar 1 CET 1 minimum capital requirement applicable to the Group is 4.50 % of risk-weighted assets (RWA). The Pillar 1 total capital requirement of 8.00 % demands further resources that may be met with up to 1.50 % Additional Tier 1 capital and up to 2.00 % Tier 2 capital.
Failure to meet minimum capital requirements can result in supervisory measures such as restrictions of profit distributions or limitations on certain businesses such as lending. We complied with the minimum regulatory capital adequacy requirements in 2021.
121
|
|
Deutsche Bank
|
Operating and Financial Review
|
|
|
Annual Report 2021
|
Deutsche Bank Group
|
|
|
|
|
In addition to these minimum capital requirements, the following combined capital buffer requirements were fully effective beginning 2021 onwards. These buffer requirements must be met in addition to the Pillar 1 minimum capital requirements, but can be drawn down in times of economic stress.
The capital conservation buffer is implemented in Section 10c German Banking Act, based on Article 129 CRD and equals a requirement of 2.50 % CET 1 capital of RWA in 2021 and onwards.
The countercyclical capital buffer is deployed in a jurisdiction when excess credit growth is associated with an increase in system-wide risk. It may vary between 0 % and 2.50 % CET 1 capital of RWA by 2022. In exceptional cases, it could also be higher than 2.50 %. The institution-specific countercyclical buffer that applies to Deutsche Bank is the weighted average of the countercyclical capital buffers that apply in the jurisdictions where our relevant credit exposures are located. As per December 31, 2021, the institution-specific countercyclical capital buffer was at 0.03 %.
In addition to the aforementioned buffers, national authorities, such as the BaFin, may require a systemic risk buffer to prevent and mitigate long-term non-cyclical systemic or macro-prudential risks that are not covered by the CRR. They can require an additional buffer of up to 5.00 % CET 1 capital of RWA. As of the year-end 2021, no systemic risk buffer applied to Deutsche Bank.
Deutsche Bank continues to be designated as a global systemically important institution (G-SII) by the German Federal Financial Supervisory Authority (BaFin) in agreement with the Deutsche Bundesbank, resulting in a G-SII buffer requirement of 1.50 % CET 1 capital of RWA in 2021 based on the indicators as published in 2019. This assessment has been confirmed by the FSB in 2020 and 2021. We will continue to publish our indicators on our website.
Additionally, Deutsche Bank AG has been classified by BaFin in agreement with the Deutsche Bundesbank as an “other systemically important institution” (O-SII) with an additional capital buffer requirement of 2.00 % in 2021 that has to be met on a consolidated level. Hence, for Deutsche Bank, the O-SII buffer amounts to 2.00 % in 2021. The higher of the buffers for systemically important institutions (G-SII buffer or O-SII buffer) must be applied.
In addition, pursuant to the Pillar 2 Supervisory Review and Evaluation Process (SREP), the European Central Bank (ECB) may impose capital requirements on individual banks which are more stringent than statutory requirements (so-called Pillar 2 requirement).
On December 9, 2019, Deutsche Bank was informed by the ECB of its decision regarding prudential minimum capital requirements for 2020 that applied from January 1, 2020 onwards, following the results of the 2019 SREP. The decision set ECB’s Pillar 2 Requirement (P2R) to 2.50% of RWA, effective as of January 1, 2020. As of December 31, 2021, Deutsche Bank needs to maintain on a consolidated basis a CET 1 ratio of at least 10.43 %, a Tier 1 ratio of at least 12.40 % and a Total Capital ratio of at least 15.03 %. The CET 1 requirement comprises the Pillar 1 minimum capital requirement of 4.50 %, the Pillar 2 requirement (SREP add-on) of 1.41 %, the capital conservation buffer of 2.50 %, the countercyclical buffer (subject to changes throughout the year) of 0.03 % and the higher of our G-SII/O-SII buffer of 2.00 %. Correspondingly, the Tier 1 capital requirement includes additionally a Tier 1 minimum capital requirement of 1.50 % plus a Pillar 2 requirement of 0.47 %, and the Total Capital requirement includes further a Tier 2 minimum capital requirement of 2.00 % and a Pillar 2 requirement of 0.63 %.
Also, the ECB communicated to Deutsche Bank that its individual expectation to hold a further Pillar 2 CET 1 capital add-on, commonly referred to as ‘Pillar 2 guidance’ will be seen as guidance only and – until at least year-end 2022 – a breach of this guidance will not trigger the need to provide a capital restoration plan or a need to execute measures to re-build CET 1 capital.
In February 2022, the ECB informed us of its decision effective 1 March 2022 that our Pillar 2 Requirement remains unchanged. In 2021, Deutsche Bank has participated in the EBA Stress Test 2021 which was postponed from 2020 due to the COVID-19 pandemic. By its standard procedures, the ECB has considered our quantitative performance in the adverse scenario as an input when reconsidering the level of the Pillar 2 Guidance in its 2021 SREP assessment and our qualitative performance as one aspect when holistically reviewing the Pillar 2 Requirement.
In January 2022, the BaFin announced a countercyclical buffer of 0.75% for Germany effective February 1, 2023, which translates into approximately 30 bps CET 1 capital requirement for Deutsche Bank Group given our current share of German credit exposures. Additionally, the BaFin is considering a sectoral systemic risk buffer of 2% for German residential real estate exposures effective February 1, 2023. If implemented as considered, this sectoral buffer could increase the CET 1 capital requirement for Deutsche Bank Group by approximately 20 bps, considering our current German residential real estate exposure.
122
|
|
Deutsche Bank
|
Operating and Financial Review
|
|
|
Annual Report 2021
|
Deutsche Bank Group
|
|
|
|
|
The following table gives an overview of the different Pillar 1 and Pillar 2 minimum capital requirements (but excluding the Pillar 2 guidance) as well as capital buffer requirements applicable to Deutsche Bank for years 2021 and 2022.
Overview total capital requirements and capital buffers
|
|
|
2021
|
|
2022
|
|
Pillar 1
|
|
|
|
|
|
Minimum CET 1 requirement
|
|
4.50 %
|
|
4.50 %
|
|
Combined buffer requirement
|
|
4.53 %
|
|
4.53 %
|
|
Capital Conservation Buffer
|
|
2.50 %
|
|
2.50 %
|
|
Countercyclical Buffer
|
|
0.03 %
|
|
0.03 %
¹
|
|
Systemic Risk Buffer
|
|
0.00 %
|
|
0.00 %
²
|
|
Maximum of:
|
|
2.00 %
|
|
2.00 %
|
|
G-SII Buffer
|
|
1.50 %
|
|
1.50 %
|
|
O-SII Buffer
|
|
2.00 %
|
|
2.00 %
|
|
Pillar 2
|
|
|
|
|
|
Pillar 2 SREP Add-on of CET 1 capital (excluding the "Pillar 2" guidance)
|
|
2.50 %
|
|
2.50 %
|
|
of which covered by CET 1 capital
|
|
1.41 %
|
|
1.41 %
|
|
of which covered by Tier 1 capital
|
|
1.88 %
|
|
1.88 %
|
|
of which covered by Tier 2 capital
|
|
0.63 %
|
|
0.63 %
|
|
Total CET 1 requirement from Pillar 1 and 2³
|
|
10.43 %
|
|
10.43 %
|
|
Total Tier 1 requirement from Pillar 1 and 2
|
|
12.40 %
|
|
12.40 %
|
|
Total capital requirement from Pillar 1 and 2
|
|
15.03 %
|
|
15.03 %
|
|
|
|
|
|
|
1
Deutsche Bank’s countercyclical buffer requirement is subject to country-specific buffer rates decreed by EBA and the Basel Committee of Banking Supervision (BCBS) as well as Deutsche Bank’s relevant credit exposures as per respective reporting date. The countercyclical buffer rate for 2022 has been assumed to be 0.03 % as per beginning of the year 2022. The countercyclical buffer is subject to changes throughout the year depending on its constituents.
2
The systemic risk buffer has been assumed to remain at 0 % for the projected year 2022, subject to changes based on further directives.
3
The total Pillar 1 and Pillar 2 CET 1 requirement (excluding the “Pillar 2” guidance) is calculated as the sum of the SREP requirement, the systemic risk buffer requirement, the capital conservation buffer requirement and countercyclical buffer requirement as well as the higher of the G-SII, O-SII.
Development of Own Funds
Our Total Regulatory capital as of December 31, 2021 amounted to € 62.7 billion compared to € 58.7 billion at the end of December 31, 2020. Our Tier 1 capital as of December 31, 2021 amounted to € 55.4 billion, consisting of a Common Equity Tier 1 (CET 1) capital of € 46.5 billion and Additional Tier 1 (AT1) capital of € 8.9 billion. The Tier 1 capital was € 3.6 billion higher than at the end of December 31, 2020, driven by an increase in CET 1 capital of € 1.6 billion and an increase in AT1 capital of € 2.0 billion since year end 2020.
The CET 1 capital increase of € 1.6 billion was largely the result of our positive net profit of € 2.4 billion as of December 31, 2021 which was partially offset by regulatory deductions for future common share dividend and AT1 coupon payments of, in aggregate of € 1.0 billion, in line with the ECB Decision (EU) (2015/656) on the recognition of interim or year-end profits in CET 1 capital in accordance with the Article 26(2) of Regulation (EU) No 575/2013 (ECB/2015/4). Additional increases include the result of positive effects from Currency Translation Adjustments of € 1.1 billion net of foreign exchange counter-effects of capital deduction items. Furthermore our CET 1 capital increased by € 0.7 billion mainly driven by a release of regulatory capital deductions following improvements in our valuation control framework in fourth quarter of 2021.
These positive impacts were partly offset by negative effects from increased regulatory adjustments from prudential filters of € 0.4 billion (additional value adjustments) due to re-introduction of pre-crisis methodology and model change related to Pruval rule book change, increased capital deduction from negative amounts resulting from the calculation of expected loss amounts of € 0.5 billion, unrealized loss from financial instruments at fair value through other comprehensive income of € 0.4 billion driven mainly by gains realized in PL, rising interest rates and widening credit spreads and € 0.2 billion caused by regular contribution through irrevocable payment commitments related to the Deposit Guarantee Scheme and the Single Resolution Fund.
The € 2.0 billion increase in AT1 capital resulted from the new issuance of two AT1 capital instruments with a cumulative notional amount of € 2.5 billion during the second and the fourth quarter of 2021, partially offset by call and redemption of one legacy hybrid Tier 1 instrument, recognizable as AT1 capital during the transition period, with a notional amount of € 0.5 billion in the fourth quarter of 2021.
Our fully loaded Total Regulatory capital as of December 31, 2021 was € 62.1 billion compared to € 57.3 billion at the end of December 31, 2020. Our fully loaded Tier 1 capital as of December 31, 2021 was € 54.8 billion, compared to € 50.6 billion at the end of December 31, 2020. Our fully loaded AT1 capital amounted to € 8.3 billion as of December 31, 2021 which increased compared to € 5.7 billion at the end of December 31, 2020 due to the above-mentioned € 2.5 billion issuances. Our CET 1 capital amounted to € 46.5 billion as of December 31, 2021 compared to € 44.9 billion at the end of December 31, 2020.
123
|
|
Deutsche Bank
|
Operating and Financial Review
|
|
|
Annual Report 2021
|
Deutsche Bank Group
|
|
|
|
|
Own Funds Template (including RWA and capital ratios)
|
|
|
Dec 31, 2021
|
|
Dec 31, 2020 ³
|
||||
|
in € m.
|
|
CRR/CRD
fully-loaded
|
|
CRR/CRD
|
|
CRR/CRD
fully loaded
|
|
CRR/CRD
|
|
Common Equity Tier 1 (CET 1) capital: instruments and reserves
|
|
|
|
|
|
|
|
|
|
Capital instruments, related share premium accounts and other reserves
|
|
45,864
|
|
|
|
45,890
|
|
|
|
Retained earnings
|
|
10,506
|
|
|
|
9,784
|
|
|
|
Accumulated other comprehensive income (loss), net of tax
|
|
(444)
|
|
(
|
|
(1,118)
|
|
(
|
|
Independently reviewed interim profits net of any foreseeable charge or dividend
1
|
|
1,379
|
|
|
|
253
|
|
|
|
Other
|
|
910
|
|
|
|
805
|
|
|
|
Common Equity Tier 1 (CET 1) capital before regulatory adjustments
|
|
58,215
|
|
|
|
55,613
|
|
|
|
|
|
|
|
|
|
|
|
|
|
Common Equity Tier 1 (CET 1) capital: regulatory adjustments
|
|
|
|
|
|
|
|
|
|
Additional value adjustments (negative amount)
|
|
(1,812)
|
|
(
|
|
(1,430)
|
|
(
|
|
Other prudential filters (other than additional value adjustments)
|
|
(14)
|
|
(
|
|
(112)
|
|
(
|
|
Goodwill and other intangible assets (net of related tax liabilities) (negative amount)
|
|
(4,897)
|
|
(
|
|
(4,635)
|
|
(
|
|
Deferred tax assets that rely on future profitability excluding those arising from
temporary differences (net of related tax liabilities where the conditions in Art. 38 (3)
CRR are met) (negative amount)
|
|
(1,466)
|
|
(
|
|
(1,353)
|
|
(
|
|
Negative amounts resulting from the calculation of expected loss amounts
|
|
(573)
|
|
(
|
|
(99)
|
|
(
|
|
Defined benefit pension fund assets (net of related tax liabilities) (negative amount)
|
|
(991)
|
|
(
|
|
(772)
|
|
(
|
|
Direct, indirect and synthetic holdings by an institution of own CET 1 instruments (negative amount)
|
|
0
|
|
|
|
0
|
|
|
|
Direct, indirect and synthetic holdings by the institution of the CET 1 instruments of financial sector entities where the institution has a significant investment in those entities (amount above the 10 % / 15 % thresholds and net of eligible short positions) (negative amount)
|
|
0
|
|
|
|
0
|
|
|
|
Deferred tax assets arising from temporary differences (net of related tax liabilities where the conditions in Art. 38 (3) CRR are met) (amount above the 10 % / 15 % thresholds) (negative amount)
|
|
(151)
|
|
(
|
|
(75)
|
|
(
|
|
Other regulatory adjustments
2
|
|
(1,805)
|
|
(
|
|
(2,252)
|
|
(
|
|
Total regulatory adjustments to Common Equity Tier 1 (CET 1) capital
|
|
(11,709)
|
|
(
|
|
(10,728)
|
|
(
|
|
Common Equity Tier 1 (CET 1) capital
|
|
46,506
|
|
|
|
44,885
|
|
|
|
|
|
|
|
|
|
|
|
|
|
Additional Tier 1 (AT1) capital: instruments
|
|
|
|
|
|
|
|
|
|
Capital instruments and the related share premium accounts
|
|
8,328
|
|
|
|
5,828
|
|
|
|
Amount of qualifying items referred to in Art. 484 (4) CRR and the related share
premium accounts subject to phase out from AT1
|
|
N/M
|
|
|
|
N/M
|
|
|
|
Additional Tier 1 (AT1) capital before regulatory adjustments
|
|
8,328
|
|
|
|
5,828
|
|
|
|
|
|
|
|
|
|
|
|
|
|
Additional Tier 1 (AT1) capital: regulatory adjustments
|
|
|
|
|
|
|
|
|
|
Direct, indirect and synthetic holdings by an institution of own AT1 instruments
(negative amount)
|
|
(60)
|
|
(
|
|
(80)
|
|
(
|
|
Residual amounts deducted from AT1 capital with regard to deduction from CET 1 capital during the transitional period pursuant to Art. 472 CRR
|
|
|
|
|
|
N/M
|
|
N/M
|
|
Other regulatory adjustments
|
|
0
|
|
|
|
0
|
|
|
|
Total regulatory adjustments to Additional Tier 1 (AT1) capital
|
|
(60)
|
|
(
|
|
(80)
|
|
(
|
|
Additional Tier 1 (AT1) capital
|
|
8,268
|
|
|
|
5,748
|
|
|
|
Tier 1 capital (T1 = CET 1 + AT1)
|
|
54,775
|
|
|
|
50,634
|
|
|
|
|
|
|
|
|
|
|
|
|
|
Tier 2 (T2) capital
|
|
7,328
|
|
|
|
6,623
|
|
|
|
Total capital (TC = T1 + T2)
|
|
62,102
|
|
|
|
57,257
|
|
|
|
Total risk-weighted assets
|
|
351,629
|
|
|
|
328,951
|
|
|
|
Capital ratios
|
|
|
|
|
|
|
|
|
|
Common Equity Tier 1 capital ratio (as a percentage of risk-weighted assets)
|
|
13.2
|
|
|
|
13.6
|
|
|
|
Tier 1 capital ratio (as a percentage of risk-weighted assets)
|
|
15.6
|
|
|
|
15.4
|
|
|
|
Total capital ratio (as a percentage of risk-weighted assets)
|
|
17.7
|
|
|
|
17.4
|
|
|
|
|
|
|
|
|
|
|
|
|
N/M – Not meaningful
1
Full year profit is recognized as per ECB Decision (EU) 2015/656 in accordance with the Article 26(2) of Regulation (EU) No 575/2013 (ECB/2015/4).
2
Includes capital deductions of 1.1 billion (December 2020: € 0.9 billion) based on ECB guidance on irrevocable payment commitments related to the Single Resolution Fund and the Deposit Guarantee Scheme, € 0.7 billion (December 2020: € 0.7 billion) based on ECB’s supervisory recommendation for a prudential provisioning of non-performing exposures, € 17 million resulting from minimum value commitments as per Article 36 (1)(n) of the CRR which became effective June 30, 2021 and CET 1 increase of € 39 million (December 2020: € 54 million) from IFRS 9 transitional provision as per Article 473a of the CRR. Capital deductions of € 0.7 billion, based on regular ECB review, included at December 2020, have been released as of December 31, 2021.
3
The Common Equity Tier 1 capital for December 31, 2020 has been updated to reflect a dividend payment of zero for the financial year 2020.
124
|
|
Deutsche Bank
|
Operating and Financial Review
|
|
|
Annual Report 2021
|
Deutsche Bank Group
|
|
|
|
|
Reconciliation of shareholders’ equity to Own Funds
|
|
|
CRR/CRD
|
||
|
in € m.
|
|
Dec 31, 2021
|
|
Dec 31, 2020 ³
|
|
Total shareholders’ equity per accounting balance sheet (IASB IFRS)
|
|
|
|
|
|
Difference between equity per IASB IFRS / EU IFRS
4
|
|
(
|
|
|
|
Total shareholders’ equity per accounting balance sheet (EU IFRS)
|
|
|
|
|
|
Deconsolidation/Consolidation of entities
|
|
|
|
|
|
Of which:
|
|
|
|
|
|
Additional paid-in capital
|
|
|
|
|
|
Retained earnings
|
|
|
|
|
|
Accumulated other comprehensive income (loss), net of tax
|
|
|
|
|
|
Total shareholders' equity per regulatory balance sheet
|
|
|
|
|
|
Minority Interests (amount allowed in consolidated CET 1)
|
|
|
|
|
|
AT1 coupon and shareholder dividend deduction
1
|
|
(
|
|
(
|
|
Common Equity Tier 1 (CET 1) capital before regulatory adjustments
|
|
|
|
|
|
Additional value adjustments
|
|
(
|
|
(
|
|
Other prudential filters (other than additional value adjustments)
|
|
(
|
|
(
|
|
Goodwill and other intangible assets (net of related tax liabilities) (negative amount)
|
|
(
|
|
(
|
|
Deferred tax assets that rely on future profitability
|
|
(
|
|
(
|
|
Defined benefit pension fund assets (net of related tax liabilities) (negative amount)
|
|
(
|
|
(
|
|
Direct, indirect and synthetic holdings by the institution of the CET 1 instruments of financial sector entities
where the institution has a significant investment in those entities
|
|
|
|
|
|
Other regulatory adjustments
2
|
|
(
|
|
(
|
|
Common Equity Tier 1 capital
|
|
|
|
|
|
|
|
|
|
|
1
Full year profit is recognized as per ECB Decision (EU) 2015/656 in accordance with the Article 26(2) of Regulation (EU) No 575/2013 (ECB/2015/4).
2
Includes capital deductions of 1.1 billion (December 2020: € 0.9 billion) based on ECB guidance on irrevocable payment commitments related to the Single Resolution Fund and the Deposit Guarantee Scheme, € 0.7 billion (December 2020: € 0.7 billion) based on ECB’s supervisory recommendation for a prudential provisioning of non-performing exposures, € 0.6 billion (December 2020: € 0.1 billion) negative amounts resulting from the calculation of expected loss amounts, € 17 million resulting from minimum value commitments as per Article 36 (1)(n) of the CRR which became effective June 30, 2021 and CET 1 increase of € 39 million (December 2020: € 54 million) from IFRS 9 transitional provision as per Article 473a of the CRR. Capital deductions of € 0.7 billion, based on regular ECB review, included at December 2020, have been released as of December 31, 2021.
3
The Common Equity Tier 1 capital for December 31, 2020 has been updated to reflect a dividend payment of zero
for the financial year 2020.
4
Differences in “equity per balance sheet” result entirely from deviations in profit (loss) after taxes due to the application of EU carve-out rules as set forth in the chapter "Basis of preparation/impact of changes in accounting principles". These rules were initially applied in the first quarter 2020.
Development of Own Funds
|
|
|
CRR/CRD
|
||
|
in € m.
|
|
twelve months
ended
Dec 31, 2021
|
|
twelve months
ended
Dec 31, 2020 ²
|
|
Common Equity Tier 1 (CET 1) capital - opening amount
|
|
44,885
|
|
44,148
|
|
Common shares, net effect
|
|
0
|
|
0
|
|
Additional paid-in capital
|
|
(26)
|
|
113
|
|
Retained earnings
|
|
2,834
|
|
854
|
|
Common shares in treasury, net effect/(+) sales (–) purchase
|
|
1
|
|
(3)
|
|
Movements in accumulated other comprehensive income
|
|
675
|
|
(1,655)
|
|
AT1 coupon and shareholder dividend deduction ¹
|
|
(987)
|
|
(242)
|
|
Additional value adjustments
|
|
(381)
|
|
308
|
|
Goodwill and other intangible assets (net of related tax liabilities) (negative amount)
|
|
(262)
|
|
1,880
|
|
Deferred tax assets that rely on future profitability (excluding those arising from temporary differences)
|
|
(113)
|
|
(227)
|
|
Negative amounts resulting from the calculation of expected loss amounts
|
|
(474)
|
|
160
|
|
Defined benefit pension fund assets (net of related tax liabilities) (negative amount)
|
|
(219)
|
|
119
|
|
Direct, indirect and synthetic holdings by the institution of the CET 1 instruments of financial sector entities
where the institution has a significant investment in those entities
|
|
0
|
|
0
|
|
Deferred tax assets arising from temporary differences (amount above 10 % and 15 % threshold,
net of related tax liabilities where the conditions in Art. 38 (3) CRR are met)
|
|
(77)
|
|
244
|
|
Other, including regulatory adjustments
|
|
650
|
|
(814)
|
|
Common Equity Tier 1 (CET 1) capital - closing amount
|
|
46,506
|
|
44,885
|
|
Additional Tier 1 (AT1) Capital – opening amount
|
|
6,848
|
|
6,397
|
|
New Additional Tier 1 eligible capital issues
|
|
2,487
|
|
1,134
|
|
Matured and called instruments
|
|
(500)
|
|
(713)
|
|
Other, including regulatory adjustments
|
|
33
|
|
30
|
|
Additional Tier 1 (AT1) Capital – closing amount
|
|
8,868
|
|
6,848
|
|
Tier 1 capital
|
|
55,375
|
|
51,734
|
|
Tier 2 (T2) capital – closing amount
|
|
7,358
|
|
6,944
|
|
Total regulatory capital
|
|
62,732
|
|
58,677
|
|
|
|
|
|
|
1
Full year profit is recognized as per ECB Decision (EU) 2015/656 in accordance with the Article 26(2) of Regulation (EU) No 575/2013 (ECB/2015/4).
2
The Common Equity Tier 1 capital for December 31, 2020 has been updated to reflect a dividend payment of zero for the financial year 2020.
125
|
|
Deutsche Bank
|
Operating and Financial Review
|
|
|
Annual Report 2021
|
Deutsche Bank Group
|
|
|
|
|
Minimum loss coverage for Non Performing Exposure (NPE)
In April 2019, the EU published requirements Regulation (EU) 2019/630 amending the CRR (Regulation (EU) No 575/2013) for a prudential backstop reserve for non-performing exposure (NPE). This regulation results in a Pillar 1 deduction from CET 1 capital when a minimum loss coverage requirement is not met. It is applied to exposures originated and defaulted after April 25, 2019.
In addition, in March 2018, the ECB published its “Addendum to the ECB Guidance to banks on non-performing loans: supervisory expectations for prudential provisioning of non-performing exposures” and in August 2019, its “Communication on supervisory coverage expectations for NPEs”.
The ECB guidance issued is applicable to all newly defaulted loans after April 1, 2018 (ECB-NPE-Flow) and, similar to the EU rules, it requires banks to take measures in case a minimum impairment coverage requirement is not met. Within the annual SREP discussions ECB may impose Pillar 2 measures on banks in case ECB is not confident with measure taken by the individual bank.
For the year end 2020, we introduced a framework to determine the prudential provisioning of non-performing exposure as a Pillar 2 measure as requested in the before mentioned ECB’s guidance and SREP recommendation.
For the minimum loss coverage expectation for NPE´s arising from clients defaulted before April 1, 2018 (ECB – NPE Stock) a phase-in path to 100 % coverage expectation was envisigated with an annual increase of 10 %. In a first step, banks were allocated to three comparable groups on the basis of the bank’s net NPL ratios as of end-2017 and in a second step an assessment of capacity regarding the potential impact was carried out for each individual bank with a horizon of end-2026. Deutsche Bank has been assigned to Group 1 which requires a full applicability of 100 % minimum loss coverage by year end 2024 for secured loans respectively by year end 2023 for unsecured loans.
The shortfall between the minimum loss coverage requirements for non-performing exposure and the risk reserves recorded in line with the IFRS 9 for defaulted (Stage 3) assets amounted to € 748 million as of December 31, 2021 and was deducted from CET 1. This additional CET 1 charge can be considered as additional loss reserve and leads to a € 384 million RWA relief.
Non-performing exposure loss coverage
|
|
|
Dec 31, 2021
|
||||||
|
in € m. (unless
stated otherwise)
|
|
Exposure value
|
|
Total minimum coverage requirement
|
|
Available coverage
|
|
Applicable amount of insufficient coverage
|
|
Corporate Bank
|
|
3,746
|
|
626
|
|
1,109
|
|
119
|
|
Investment Bank
|
|
14,671
|
|
7,823
|
|
10,155
|
|
273
|
|
Private Bank
|
|
7,119
|
|
1,263
|
|
2,449
|
|
311
|
|
Asset Management
|
|
0
|
|
0
|
|
0
|
|
0
|
|
Capital Release Unit
|
|
253
|
|
120
|
|
102
|
|
42
|
|
Corporate Other
|
|
22
|
|
3
|
|
0
|
|
3
|
|
Total
|
|
25,811
|
|
9,835
|
|
13,816
|
|
748
|
|
|
|
|
|
|
|
|
|
|
|
|
|
Dec 31, 2020
|
||||||
|
in € m. (unless
stated otherwise)
|
|
Exposure value
|
|
Total minimum coverage requirement
|
|
Available coverage
|
|
Applicable amount of insufficient coverage
|
|
Corporate Bank
|
|
2,852
|
|
377
|
|
1,058
|
|
63
|
|
Investment Bank
|
|
13,510
|
|
7,816
|
|
10,574
|
|
255
|
|
Private Bank
|
|
6,123
|
|
1,269
|
|
2,011
|
|
361
|
|
Asset Management
|
|
0
|
|
0
|
|
0
|
|
0
|
|
Capital Release Unit
|
|
422
|
|
183
|
|
182
|
|
60
|
|
Corporate Other
|
|
1
|
|
1
|
|
0
|
|
1
|
|
Total
|
|
22,907
|
|
9,646
|
|
13,825
|
|
740
|
|
|
|
|
|
|
|
|
|
|
126
|
|
Deutsche Bank
|
Operating and Financial Review
|
|
|
Annual Report 2021
|
Deutsche Bank Group
|
|
|
|
|
Development of risk-weighted assets
The table below provides an overview of RWA broken down by risk type and business division. It includes the aggregated effects of the segmental reallocation of infrastructure related positions, if applicable, as well as reallocations between the segments.
Risk-weighted assets by risk type and business division
|
|
|
Dec 31, 2021
|
||||||||||||
|
in € m.
|
|
Corporate
Bank
|
|
Investment
Bank
|
|
Private
Bank
|
|
Asset
Management
|
|
Capital
Release Unit
|
|
Corporate
Other
|
|
Total
|
|
Credit Risk
|
|
59,588
|
|
93,125
|
|
77,632
|
|
11,017
|
|
5,426
|
|
16,964
|
|
263,752
|
|
Settlement Risk
|
|
0
|
|
1
|
|
0
|
|
0
|
|
10
|
|
49
|
|
60
|
|
Credit Valuation Adjustment (CVA)
|
|
120
|
|
4,879
|
|
167
|
|
9
|
|
1,098
|
|
55
|
|
6,327
|
|
Market Risk
|
|
128
|
|
17,565
|
|
40
|
|
33
|
|
1,293
|
|
715
|
|
19,773
|
|
Operational Risk
|
|
5,571
|
|
25,031
|
|
7,527
|
|
3,357
|
|
20,232
|
|
0
|
|
61,718
|
|
Total
|
|
65,406
|
|
140,600
|
|
85,366
|
|
14,415
|
|
28,059
|
|
17,783
|
|
351,629
|
|
|
|
|
|
|
|
|
|
|
|
|
|
|
|
|
|
|
|
Dec 31, 2020 ¹
|
||||||||||||
|
in € m.
|
|
Corporate
Bank
|
|
Investment
Bank
|
|
Private
Bank
|
|
Asset
Management
|
|
Capital
Release Unit
|
|
Corporate
Other
|
|
Total
|
|
Credit Risk
|
|
50,995
|
|
70,550
|
|
68,353
|
|
6,224
|
|
7,214
|
|
19,371
|
|
222,708
|
|
Settlement Risk
|
|
0
|
|
0
|
|
0
|
|
0
|
|
1
|
|
54
|
|
56
|
|
Credit Valuation Adjustment (CVA)
|
|
75
|
|
6,302
|
|
92
|
|
198
|
|
1,599
|
|
125
|
|
8,392
|
|
Market Risk
|
|
385
|
|
24,323
|
|
548
|
|
31
|
|
1,470
|
|
2,139
|
|
28,897
|
|
Operational Risk
|
|
6,029
|
|
27,115
|
|
8,081
|
|
3,544
|
|
24,130
|
|
0
|
|
68,899
|
|
Total
|
|
57,483
|
|
128,292
|
|
77,074
|
|
9,997
|
|
34,415
|
|
21,690
|
|
328,951
|
|
|
|
|
|
|
|
|
|
|
|
|
|
|
|
|
1
The divisional split for December 31, 2020 has been updated from the previous disclosures to reflect the current divisional structure.
Our RWA were € 351.6 billion as of December 31, 2021, compared to € 329.0 billion at the end of 2020. The increase of € 22.7 billion was primarily driven by credit risk RWA, which was partially offset by RWA for market risk, credit valuation adjustment (CVA) risk and operational risk. The increase in credit risk RWA by € 41.0 billion was primarily driven by RWA inflation from the European Central Bank’s Targeted Review of Internal Models (TRIM) which led to model refinements for large corporates, banks/financial institutions and leveraged lending, amounting to € 15.5 billion, the CRR amendments applicable as of June 28, 2021 amounting to € 6.3 billion and the introduction of the EBA Guideline on the new definition of default amounting to € 8.1 billion as well as business growth within our core businesses. Additionally, our credit risk RWA increased by € 6.4 billion due to foreign-exchange movements. This was partially offset by RWA decreases within our Capital Release Unit due to the successful transfer of our Global Prime Finance and Electronic Equities platform to BNP Paribas and Corporate Other as well as impacts from Rating Migration.
Market risk RWA decreased by € 9.1 billion and was primarily driven by the VaR component due to the phase-out of the COVID-19 volatility and an update of the VaR/SVaR model. Additionally, the decrease in RWA for the incremental risk charge displays the reduction in European sovereign bond exposures. These decreases were partially offset by an increase in SVaR driven by the COVID-19 scenario and an increase in the market risk standardized approach (covering securitizations, longevity and certain collective investment undertakings (CIUs)). The phase-out of the COVID-19 volatility also brought a benefit to our CVA RWA which reduced by € 2.1 billion over the last year. The operational risk RWA reduction of € 7.2 billion was mainly driven by a more favorable development of our internal loss profile feeding into our capital model, partially offset by model related updates.
The tables below provide an analysis of key drivers for risk-weighted asset movements observed for credit risk, credit valuation adjustments as well as market and operational risk in the reporting period. They also show the corresponding movements in capital requirements, derived from the RWA by an 8 % capital ratio.
Development of risk-weighted assets for Credit Risk including Counterparty Credit Risk
|
|
|
Dec 31, 2021
|
|
Dec 31, 2020
|
||||
|
in € m.
|
|
Credit risk RWA
|
|
Capital
requirements
|
|
Credit risk RWA
|
|
Capital
requirements
|
|
Credit risk RWA balance, beginning of year
|
|
222,708
|
|
17,817
|
|
221,060
|
|
17,685
|
|
Book size
|
|
4,719
|
|
378
|
|
4,659
|
|
373
|
|
Book quality
|
|
(899)
|
|
(72)
|
|
1,160
|
|
93
|
|
Model updates
|
|
(97)
|
|
(8)
|
|
(2,072)
|
|
(166)
|
|
Methodology and policy
|
|
30,172
|
|
2,414
|
|
6,542
|
|
523
|
|
Acquisition and disposals
|
|
131
|
|
10
|
|
(1,672)
|
|
(134)
|
|
Foreign exchange movements
|
|
6,431
|
|
514
|
|
(7,237)
|
|
(579)
|
|
Other
|
|
587
|
|
47
|
|
268
|
|
21
|
|
Credit risk RWA balance, end of year
|
|
263,752
|
|
21,100
|
|
222,708
|
|
17,817
|
|
|
|
|
|
|
|
|
|
|
127
|
|
Deutsche Bank
|
Operating and Financial Review
|
|
|
Annual Report 2021
|
Deutsche Bank Group
|
|
|
|
|
Of which: Development of risk-weighted assets for Counterparty Credit Risk
|
|
|
Dec 31, 2021
|
|
Dec 31, 2020
|
||||
|
in € m.
|
|
Counterparty
credit risk RWA
|
|
Capital
requirements
|
|
Counterparty
credit risk RWA
|
|
Capital
requirements
|
|
Counterparty credit risk RWA balance, beginning of year
|
|
23,814
|
|
1,905
|
|
23,698
|
|
1,896
|
|
Book size
|
|
(4,527)
|
|
(362)
|
|
1,784
|
|
143
|
|
Book quality
|
|
(422)
|
|
(34)
|
|
(594)
|
|
(48)
|
|
Model updates
|
|
125
|
|
10
|
|
(643)
|
|
(51)
|
|
Methodology and policy
|
|
4,805
|
|
384
|
|
669
|
|
54
|
|
Acquisition and disposals
|
|
0
|
|
0
|
|
0
|
|
0
|
|
Foreign exchange movements
|
|
986
|
|
79
|
|
(1,100)
|
|
(88)
|
|
Other
|
|
0
|
|
0
|
|
0
|
|
0
|
|
Counterparty credit risk RWA balance, end of year
|
|
24,780
|
|
1,982
|
|
23,814
|
|
1,905
|
|
|
|
|
|
|
|
|
|
|
The classifications of key drivers for the RWA credit risk development table are fully aligned with the recommendations of the Enhanced Disclosure Task Force (EDTF). Organic changes in our portfolio size and composition are considered in the category “book size”. The category “book quality” mainly represents the effects from portfolio rating migrations, loss given default, model parameter recalibrations as well as collateral and netting coverage activities. “Model updates” include model refinements and advanced model roll out. RWA movements resulting from externally, regulatory-driven changes, e.g. applying new regulations, are considered in the “methodology and policy” section. “Acquisition and disposals” is reserved to show significant exposure movements which can be clearly assigned to new businesses or disposal-related activities. Changes that cannot be attributed to the above categories are reflected in the category “other”.
The increase in RWA for credit risk by 18.4% or € 41.0 billion since December 31, 2020 is mainly driven by the categories “methodology and policy”, “book size” as well as FX related movements along with marginal increase in the categories “other” and “acquisition and disposals”. This is partially offset by changes shown in the categories “book quality” and “model updates”. The category “methodology and policy” mainly reflects impacts driven by “Targeted Review of Internal Models TRIM” resulting from regular ECB reviews of € 15.5 billion and updates from the introduction of the EBA Guideline on definition of default amounting to € 8.1 billion as well as the CRR amendments applicable as of June 28, 2021 amounting to € 6.3 billion. The increase in the category “book size” reflects business growth in our core business segments partly offset by reduction initiatives in our Capital Release Unit. The decrease in category “book quality” includes reductions resulting from improved counterparty ratings as well as favorable parameter developments and data enhancements.
The increase in counterparty credit risk is mainly driven by the increase in category “methodology and policy” resulting from regular ECB reviews by way of TRIM addons as well as FX related movements. Further, an increase in category “model updates” reflects enhancements of our internal models. This was offset by changes to category “book size” reflecting the current market volatility as well as category “book quality” particularly stemming from rating change impacts.
Based on the CRR/CRD regulatory framework, we are required to calculate RWA using the CVA which takes into account the credit quality of our counterparties. RWA for CVA covers the risk of mark-to-market losses on the expected counterparty risk in connection with OTC derivative exposures. We calculate the majority of the CVA based on our own internal model as approved by the BaFin.
Development of risk-weighted assets for Credit Valuation Adjustment
|
|
|
Dec 31, 2021
|
|
Dec 31, 2020
|
||||
|
in € m.
|
|
CVA RWA
|
|
Capital
requirements
|
|
CVA RWA
|
|
Capital
requirements
|
|
CVA RWA balance, beginning of year
|
|
8,392
|
|
671
|
|
4,683
|
|
374
|
|
Movement in risk levels
|
|
(449)
|
|
(36)
|
|
(3,338)
|
|
(267)
|
|
Market data changes and recalibrations
|
|
(1,581)
|
|
(126)
|
|
0
|
|
0
|
|
Model updates
|
|
0
|
|
0
|
|
5,787
|
|
463
|
|
Methodology and policy
|
|
0
|
|
0
|
|
1,260
|
|
101
|
|
Acquisitions and disposals
|
|
(33)
|
|
(3)
|
|
0
|
|
0
|
|
Foreign exchange movements
|
|
0
|
|
0
|
|
0
|
|
0
|
|
CVA RWA balance, end of year
|
|
6,329
|
|
506
|
|
8,392
|
|
671
|
|
|
|
|
|
|
|
|
|
|
The development of CVA RWA is broken down into a number of categories: “Movement in risk levels”, which includes changes to the portfolio size and composition; “Market data changes and calibrations”, which includes changes in market data levels and volatilities as well as recalibrations; “Model updates” refers to changes to either the IMM credit exposure models or the value-at-risk models that are used for CVA RWA; “Methodology and policy” relates to changes to the regulation. Any significant business acquisitions or disposals would be presented in the category with that name.
128
|
|
Deutsche Bank
|
Operating and Financial Review
|
|
|
Annual Report 2021
|
Deutsche Bank Group
|
|
|
|
|
As of December 31, 2021, the RWA for CVA amounted to € 6.3 billion, representing a decrease of € 2.1 billion or (25 %) compared to December 31, 2020. The overall decrease was primarily driven by market data changes as a result of a change in the VaR window in Q2, where volatility from March and April 2020 rolled out of CVA RWA calculations; market data changes also incorporates the improved hedging strategy implemented to incorporate the shift in the VaR period. Additional decreases also materialized through enhancements in risk representation resulting in improved calculation inputs.
Development of risk-weighted assets for Market Risk
|
|
|
Dec 31, 2021
|
||||||||||
|
in € m.
|
|
VaR
|
|
SVaR
|
|
IRC
|
|
Other
|
|
Total RWA
|
|
Total capital
requirements
|
|
Market risk RWA balance, beginning of year
|
|
12,109
|
|
6,983
|
|
7,005
|
|
2,799
|
|
28,897
|
|
2,312
|
|
Movement in risk levels
|
|
(1,067)
|
|
537
|
|
(3,349)
|
|
28
|
|
(3,850)
|
|
(308)
|
|
Market data changes and recalibrations
|
|
(4,943)
|
|
0
|
|
0
|
|
334
|
|
(4,609)
|
|
(369)
|
|
Model updates/changes
|
|
(2,196)
|
|
2,675
|
|
0
|
|
0
|
|
479
|
|
38
|
|
Methodology and policy
|
|
(366)
|
|
(835)
|
|
0
|
|
0
|
|
(1,201)
|
|
(96)
|
|
Acquisitions and disposals
|
|
0
|
|
0
|
|
0
|
|
0
|
|
0
|
|
0
|
|
Foreign exchange movements
|
|
0
|
|
0
|
|
0
|
|
57
|
|
57
|
|
5
|
|
Other
|
|
0
|
|
0
|
|
0
|
|
0
|
|
0
|
|
0
|
|
Market risk RWA balance, end of year
|
|
3,538
|
|
9,360
|
|
3,657
|
|
3,219
|
|
19,773
|
|
1,582
|
|
|
|
|
|
|
|
|
|
|
|
|
|
|
|
|
|
Dec 31, 2020
|
||||||||||
|
in € m.
|
|
VaR
|
|
SVaR
|
|
IRC
|
|
Other
|
|
Total RWA
|
|
Total capital
requirements
|
|
Market risk RWA balance, beginning of year
|
|
4,273
|
|
13,734
|
|
4,868
|
|
2,493
|
|
25,368
|
|
2,029
|
|
Movement in risk levels
|
|
(4,775)
|
|
(2,397)
|
|
2,698
|
|
570
|
|
(3,902)
|
|
(311)
|
|
Market data changes and recalibrations
|
|
4,237
|
|
0
|
|
0
|
|
(131)
|
|
4,105
|
|
328
|
|
Model updates/changes
|
|
(107)
|
|
547
|
|
(561)
|
|
0
|
|
(121)
|
|
(10)
|
|
Methodology and policy
|
|
8,481
|
|
(4,901)
|
|
0
|
|
(15)
|
|
3,565
|
|
285
|
|
Acquisitions and disposals
|
|
0
|
|
0
|
|
0
|
|
0
|
|
0
|
|
0
|
|
Foreign exchange movements
|
|
0
|
|
0
|
|
0
|
|
(118)
|
|
(118)
|
|
(9)
|
|
Other
|
|
0
|
|
0
|
|
0
|
|
0
|
|
0
|
|
0
|
|
Market risk RWA balance, end of year
|
|
12,109
|
|
6,983
|
|
7,005
|
|
2,799
|
|
28,897
|
|
2,312
|
|
|
|
|
|
|
|
|
|
|
|
|
|
|
The analysis for market risk covers movements in our internal models for value-at-risk (VaR), stressed value-at-risk (SVaR), incremental risk charge (IRC) as well as results from the market risk standardized approach (MRSA), which is captured in the table under the category “Other”. MRSA is used to determine the regulatory capital charge for the specific market risk of trading book securitizations, for certain types of investment funds and for longevity risk as set out in CRR/CRD regulations.
The market risk RWA movements due to changes in market data levels, volatilities, correlations, liquidity and ratings are included under the “Market data changes and recalibrations” category. Changes to our market risk RWA internal models, such as methodology enhancements or risk scope extensions, are included in the category of “Model updates”. In the “Methodology and policy” category we reflect regulatory driven changes to our market risk RWA models and calculations. Significant new businesses and disposals would be assigned to the line item “Acquisition and disposals”. The impacts of “Foreign exchange movements” are only calculated for the CRM and Standardized approach methods.
As of December 31, 2021 the RWA for market risk was € 19.8 billion which has decreased by € 9.1 billion (-31 %) since December 31, 2020. The decrease was driven by the “Market data changes and recalibrations” category across value-at-risk driven by the COVID-19 related market volatility rolling out of the value-at-risk window and by the “Methodology and policy” category driven by the reduction in capital multiplier from 4.5 to 4, based on closure of audit findings from Joint Supervisory Team (JST) on Historical Simulation value-at-risk. The decrease in incremental risk charge was driven by reduction in European sovereign bond exposures.
Development of risk-weighted assets for operational risk
|
|
|
Dec 31, 2021
|
|
Dec 31, 2020
|
||||
|
in € m.
|
|
Operational risk
RWA
|
|
Capital
requirements
|
|
Operational risk
RWA
|
|
Capital
requirements
|
|
Operational risk RWA balance, beginning of year
|
|
68,899
|
|
5,512
|
|
72,662
|
|
5,813
|
|
Loss profile changes (internal and external)
|
|
(8,000)
|
|
(640)
|
|
(4,677)
|
|
(374)
|
|
Expected loss development
|
|
(113)
|
|
(9)
|
|
1,164
|
|
93
|
|
Forward looking risk component
|
|
(278)
|
|
(22)
|
|
533
|
|
43
|
|
Model updates
|
|
1,210
|
|
97
|
|
(784)
|
|
(63)
|
|
Methodology and policy
|
|
0
|
|
0
|
|
0
|
|
0
|
|
Acquisitions and disposals
|
|
0
|
|
0
|
|
0
|
|
0
|
|
Operational risk RWA balance, end of year
|
|
61,718
|
|
4,937
|
|
68,899
|
|
5,512
|
|
|
|
|
|
|
|
|
|
|
129
|
|
Deutsche Bank
|
Operating and Financial Review
|
|
|
Annual Report 2021
|
Deutsche Bank Group
|
|
|
|
|
Changes in internal and external loss events are reflected in the category “Loss profile changes”. The category “Expected loss development” is based on divisional business plans as well as historical losses and is deducted from the AMA capital figure within certain constraints. The category “Forward looking risk component” reflects qualitative adjustments and, as such, the effectiveness and performance of the day-to-day operational risk management activities via NFR appetite metrics and RCA scores, focusing on the business environment and internal control factors. The category “Model updates” covers model refinements, such as the implementation of model changes. The category “Methodology and policy” represents externally driven changes such as regulatory add-ons. The category “Acquisition and disposals” represents significant exposure movements which can be clearly assigned to new or disposed businesses.
The overall RWA decrease of € 7.2 billion was mainly driven by a lighter internal loss profile, in particular lower loss frequencies feeding into our capital model. These loss profile changes reduced our RWA for Operational Risk by € 8.0 billion.
A minor loss deductible increase lead to an RWA decrease of € 0.1 billion while the forward looking component was impacted by slightly stronger NFR appetite metrics and RCA scores, resulting in an RWA decrease of € 0.3 billion.
The RWA increase of € 1.2 billion from model updates was driven by two changes. First, the wider use of NFR appetite metrics as key risk indicators lead to a higher precision of the forward looking risk component. A second model enhancement was made to make the model more robust in the treatment of risk event types with scarce internal losses.
Economic Capital
Economic capital adequacy
Our internal capital adequacy assessment process (ICAAP) aims at maintaining the continuity of Deutsche Bank on an ongoing basis. We assess our internal capital adequacy from an economic perspective as the ratio of our economic capital supply divided by our internal economic capital demand as shown in the table below.
Total economic capital supply and demand
|
in € m.
(unless stated otherwise)
|
|
Dec 31, 2021
|
|
Dec 31, 2020
|
|
Components of economic capital supply
|
|
|
|
|
|
Shareholders' equity
|
|
58,027
|
|
54,786
|
|
Noncontrolling interests¹
|
|
858
|
|
880
|
|
AT1 coupons deduction
|
|
(298)
|
|
(242)
|
|
Gain on sale of securitizations, cash flow hedges
|
|
42
|
|
(11)
|
|
Fair value gains on own debt and debt valuation adjustments, subject to own credit risk
|
|
(56)
|
|
(100)
|
|
Additional valuation adjustments
|
|
(1,812)
|
|
(1,430)
|
|
Intangible assets
|
|
(3,583)
|
|
(3,463)
|
|
IFRS deferred tax assets excl. temporary differences
|
|
(1,653)
|
|
(1,503)
|
|
Expected loss shortfall
|
|
(573)
|
|
(99)
|
|
Defined benefit pension fund assets
|
|
(991)
|
|
(772)
|
|
Other adjustments
²
|
|
(1,492)
|
|
(1,566)
|
|
Additional tier 1 equity instruments
³
|
|
0
|
|
4,659
|
|
Economic capital supply
|
|
48,470
|
|
51,138
|
|
|
|
|
|
|
|
Components of economic capital demand
|
|
|
|
|
|
Credit risk
|
|
11,725
|
|
11,636
|
|
Market risk
|
|
7,920
|
|
10,894
|
|
Operational risk
|
|
4,937
|
|
5,512
|
|
Strategic risk
4
|
|
3,173
|
|
5,949
|
|
Diversification benefit
|
|
(4,213)
|
|
(5,429)
|
|
Total economic capital demand
|
|
23,542
|
|
28,560
|
|
|
|
|
|
|
|
Economic capital adequacy ratio
|
|
206 %
|
|
179 %
|
|
|
|
|
|
|
1
Includes noncontrolling interest up to the economic capital requirement for each subsidiary.
2
Includes € 1.1 billion capital deduction based on ECB guidance on irrevocable payment commitments related to the Single Resolution Fund and the Deposit Guarantee Scheme. Capital deductions of € 0.7 billion, based on regular ECB review have been released from December 2021 due to remediation.
3
Additional Tier 1 equity instruments were completely de-recognized from economic capital supply from December 2021 onwards.
4
Formerly reported as business risk. This category includes the model output for strategic risk and tax risk, as well as capital charges for risk related to IFRS deferred tax assets on temporary differences and software assets.
The economic capital adequacy ratio was 206 % as of December 31, 2021, compared with 179 % as of December 31, 2020. The change in the ratio was mainly due to a decrease in capital demand, which was partially offset by lower capital supply. The economic capital supply decreased by € 2.7 billion and was primarily driven by the decision to completely de-recognize € 4.7 billion of additional tier 1 equity instruments from economic capital supply and the increase in capital deductions mainly from higher expected loss shortfall of € 0.5 billion, prudential filters (additional value adjustment) of € 0.4 billion and irrevocable payment commitments related to the Single Resolution Fund and the Deposit Guarantee Scheme of € 0.2 billion. These decreases were partly offset by our positive net income of € 2.4 billion, release of regulatory capital deductions of € 0.7 billion and other offsetting items. The decrease in capital demand was driven by lower economic capital demand as explained in the section “Risk Profile”.
130
|
|
Deutsche Bank
|
Operating and Financial Review
|
|
|
Annual Report 2021
|
Deutsche Bank Group
|
|
|
|
|
Leverage Ratio
We manage our balance sheet on a Group level and, where applicable, locally in each region. In the allocation of financial resources, we favor business portfolios with the highest positive impact on our profitability and shareholder value. We monitor and analyze balance sheet developments and track certain market-observed balance sheet ratios. Based on this we trigger discussion and management action by the Group Risk Committee (GRC).
Leverage Ratio according to CRR/CRD framework
The non-risk-based leverage ratio is intended to act as a supplementary measure to the risk-based capital requirements. Its objectives are to constrain the build-up of leverage in the banking sector, helping avoid destabilizing deleveraging processes which can damage the broader financial system and the economy, and to reinforce the risk-based requirements with a simple, non-risk based “backstop” measure.
A minimum leverage ratio requirement of 3 % was introduced effective starting with June 28, 2021. From January 1, 2023 an additional leverage ratio buffer requirement of 50 % of the applicable G-SII buffer rate will apply. It is currently expected that this additional requirement will equal 0.75 % for Deutsche Bank.
We calculate our leverage ratio exposure in accordance with Articles 429 to 429g of the CRR.
Our total leverage ratio exposure includes derivatives, securities financing transactions (SFTs), off-balance sheet exposure and other on-balance sheet exposure (excluding derivatives and SFTs).
The leverage exposure for derivatives is calculated by using a modified version of the standardized approach for counterparty credit risk (SA-CCR), comprising the current replacement cost plus a regulatory defined add-on for the potential future exposure. The effective notional amount of written credit derivatives, i.e., the notional reduced by any negative fair value changes that have been incorporated in Tier 1 capital is included in the leverage ratio exposure measure; the resulting exposure measure is further reduced by the effective notional amount of purchased credit derivative protection on the same reference name provided certain conditions are met.
The securities financing transaction (SFT) component includes the gross receivables for SFTs, which are netted with SFT payables if specific conditions are met. In addition to the gross exposure a regulatory add-on for the counterparty credit risk is included.
The off-balance sheet exposure component follows the credit risk conversion factors (CCF) of the standardized approach for credit risk (0 %, 20 %, 50 %, or 100 %), which depend on the risk category subject to a floor of 10 %.
The on-balance sheet exposures (excluding derivatives and SFTs) component reflects the accounting values of the assets (excluding derivatives, SFTs and regular-way purchases and sales awaiting settlement) as well as regulatory adjustments for asset amounts deducted in determining Tier 1 capital. The exposure value of regular-way purchases and sales awaiting settlement is determined as offset between those cash receivables and cash payables where the related regular-way sales and purchases are both settlement on a delivery-versus payment basis.
Certain Euro-based exposures facing Eurosystem central banks may be excluded from the leverage exposure subject to having obtained permission from the European Central Bank. Based on Decision (EU) 2020/1306 of the European Central Bank, the Group was allowed for the first time in the September 30, 2020 reporting to exclude these exposures from the leverage exposure. This exclusion did apply until June 27, 2021. Decision (EU) 2021/1074 of the European Central Bank extends the exemption of certain Euro-based exposures facing Eurosystem central banks until March 31, 2022.
131
|
|
Deutsche Bank
|
Operating and Financial Review
|
|
|
Annual Report 2021
|
Deutsche Bank Group
|
|
|
|
|
The following tables show the leverage ratio exposure and the leverage ratio. The Leverage ratio common disclosure table provides the leverage ratio on a fully loaded and phase-in basis with the fully loaded and phase-in Tier 1 Capital, respectively, in the numerator. For further details on Tier 1 capital please also refer to the section “Development of Own Funds”.
Summary reconciliation of accounting assets and leverage ratio exposures
|
in € bn.
|
|
Dec 31, 2021
|
|
Dec 31, 2020
|
|
Total assets as per published financial statements
|
|
1,324
|
|
1,325
|
|
Adjustment for entities which are consolidated for accounting purposes but are outside the scope of
regulatory consolidation
|
|
1
|
|
1
|
|
Adjustments for derivative financial instruments
|
|
(163)
|
|
(206)
|
|
Adjustment for securities financing transactions (SFTs)
|
|
2
|
|
10
|
|
Adjustment for off-balance sheet items (i.e. conversion to credit equivalent amounts of off-balance
sheet exposures)
|
|
115
|
|
101
|
|
Other adjustments
|
|
(154)
|
|
(153)
|
|
Leverage ratio total exposure measure
|
|
1,125
|
|
1,078
|
|
|
|
|
|
|
Leverage ratio common disclosure
|
in € bn.
(unless stated otherwise)
|
|
Dec 31, 2021 ²
|
|
Dec 31, 2020 ¹ ²
|
|
Total derivative exposures
|
|
138
|
|
141
|
|
Total securities financing transaction exposures
|
|
91
|
|
83
|
|
Total off-balance sheet exposures
|
|
115
|
|
101
|
|
Other Assets
|
|
791
|
|
761
|
|
Asset amounts deducted in determining Tier 1 capital
|
|
(9)
|
|
(8)
|
|
|
|
|
|
|
|
Tier 1 capital (fully loaded)
|
|
54.8
|
|
50.6
|
|
Leverage ratio total exposure measure
|
|
1,125
|
|
1,078
|
|
Leverage ratio (fully loaded, in %)
|
|
4.9
|
|
4.7
|
|
|
|
|
|
|
|
Tier 1 capital (phase-in)
|
|
55.4
|
|
51.7
|
|
Leverage ratio total exposure measure
|
|
1,125
|
|
1,078
|
|
Leverage ratio (phase-in, in %)
|
|
4.9
|
|
4.8
|
|
|
|
|
|
|
1
The Tier 1 capital and related ratios for December 31, 2020 have been updated to reflect a dividend payment of zero.
2
Following additional EBA guidance, deductions of receivables assets for cash variation margin provided in derivatives transactions were moved to “Other Assets” from “Total derivative exposures”.
Description of the factors that had an impact on the leverage ratio in 2021
As of December 31, 2021, our fully loaded leverage ratio was 4.9 % compared to 4.7 % as of December 31, 2020. This takes, into account a fully loaded Tier 1 capital of € 54.8 billion over an applicable exposure measure of € 1,125 billion as of December 31, 2021 (€ 50.6 billion and € 1,078 billion as of December 31, 2020, respectively).
Over the year 2021, our leverage exposure increased by € 46 billion to € 1,125 billion, largely driven by the leverage exposure for the remaining asset items which increased by € 30 billion. This reflects the development of our balance sheet (for additional information please refer to section “Movements in assets and liabilities” in this report) and certain impacts from the CRR amendments effective June 28, 2021: the loan growth on the balance sheet as well as impacts from the CRR amendments resulted in an increase by € 52 billion and cash and central bank/interbank balances increased by € 11 billion. Pending settlements increased by € 2 billion on a net basis - despite being € 6 billion higher on a gross basis. These increases were partly offset by Financial assets at fair value through OCI which decreased by € 27 billion and non-derivative trading assets which decreased by € 6 billion. Off-balance sheet leverage exposures increased by € 13 billion corresponding to higher notional amounts for irrevocable lending commitments and the impact of the CRR amendments. Furthermore, SFT-related items (securities purchased under resale agreements, securities borrowed and receivables from prime brokerage) increased by € 8 billion, in line with the development on the balance sheet. In addition, the leverage exposure related to derivatives decreased by € 3 billion.
The increase in leverage exposure in 2021 included a positive foreign exchange impact of € 35 billion mainly due to the strengthening of the U.S. Dollar versus the Euro. The effects from foreign exchange rate movements are embedded in the movement of the leverage exposure items discussed in this section.
As of December 31, 2021, our leverage ratio according to transitional provisions was 4.9 % (4.8 % as of December 31, 2020), calculated as Tier 1 capital according to transitional rules of € 55.4 billion over an applicable exposure measure of € 1,125 billion (€ 51.7 billion and € 1,078 billion as of December 31, 2020, respectively).
132
|
|
Deutsche Bank
|
Operating and Financial Review
|
|
|
Annual Report 2021
|
Deutsche Bank Group
|
|
|
|
|
We exclude certain central bank exposures in the amount of € 99 billion as of December 31, 2021, based on Article 429a (1) (n) CRR and the ECB Decision 2021/1074. As we make use of this exemption, Article 429a (7) CRR specifies that the applicable minimum leverage ratio must be increased to 3.2%. Note that until the first quarter of 2021 a similar exemption applied based on Article 500b CRR. Not applying the temporary exclusion of certain central bank exposures our leverage exposure was € 1,223 billion as of December 31, 2021, corresponding to a leverage ratio of 4.5 % on a fully loaded basis and on a phase-in basis.
For main drivers of the Tier 1 capital development please refer to section “Development of Own Funds”.
Minimum Requirement of Own Funds and Eligible Liabilities (“MREL”) and Total Loss Absorbing Capacity (“TLAC”)
MREL Requirements
The minimum requirement for own funds and eligible liabilities (“MREL”) requirement was introduced by the European Union’s Regulation establishing uniform rules and a uniform procedure for the resolution of credit institutions (Single Resolution Mechanism Regulation or “SRMR”) and the European Union’s Directive establishing a framework for the recovery and resolution of credit institutions (Bank Recovery and Resolution Directive or “BRRD”) as implemented into German law by the German Recovery and Resolution Act.
The currently required level of MREL is determined by the competent resolution authorities for each supervised bank individually on a case-by-case basis, depending on the respective preferred resolution strategy. In the case of Deutsche Bank AG, MREL is determined by the Single Resolution Board (“SRB”). While there is no statutory minimum level of MREL, the SRMR, BRRD and a delegated regulation set out criteria which the resolution authority must consider when determining the relevant required level of MREL. Guidance is provided through an MREL policy published annually by the SRB. Any binding MREL ratio determined by the SRB is communicated to Deutsche Bank via the German Federal Financial Supervisory Authority (BaFin).
In the last quarter of 2019, Deutsche Bank AG’s binding MREL ratio requirement on a consolidated basis has been set at 8.58 % of Total Liabilities and Own Funds (“TLOF”) applicable immediately of which 6.11 % of TLOF have to be meet with own funds and subordinated instruments as an additional requirement. TLOF principally consists of total liabilities after derivatives netting, plus own funds, i.e., regulatory capital.
As a result of its regular annual review, the SRB has revised Deutsche Bank AG’s binding MREL ratio requirement in the last quarter of 2021 applicable immediately. These new requirements for the first time reflect the legal changes of the banking reform package via amendments to the SRMR and the BRRD provided in June 2019 with the publication of Regulation (EU) 2019/877 and Directive (EU) 2019/879. As a result, the MREL and subordinated MREL requirement will no longer be expressed as a percentage of TLOF but as a percentage of Risk Weighted Assets (“RWA”) and Leverage Ratio Exposure (“LRE”). The MREL ratio requirement on a consolidated basis is now 24.05 % of RWA and 6.88% of LRE of which 20.27 % of RWA and 6.88 % of LRE must be met with own funds and subordinated instruments. The combined buffer requirements of 4.53 % as of December 31, 2021 must be met in addition to the RWA based MREL and subordinated MREL requirements.
TLAC Requirements
Since June 27, 2019, Deutsche Bank, as a global systemically important bank, has also become subject to global minimum standards for its Total Loss-Absorbing Capacity (“TLAC”). The TLAC requirement was implemented via amendments to the Capital Requirements Regulation and the Capital Requirements Directive provided in June 2019 with the publication of Regulation (EU) 2019/876 and Directive (EU) 2019/878.
This TLAC requirement is based on both risk-based and non-risk-based denominators and set at the higher-of 16 % of RWA plus the combined buffer requirements and 6.00 % of LRE for a transition period until December 31, 2021. Since January 1, 2022, the requirement is set at the higher-of 18 % of RWA plus the combined buffer requirements and 6.75% of LRE.
133
|
|
Deutsche Bank
|
Operating and Financial Review
|
|
|
Annual Report 2021
|
Deutsche Bank Group
|
|
|
|
|
MREL ratio development
As of December 31, 2021, available MREL were € 114.9 billion, corresponding to a ratio of 32.66 % of RWA. This means that Deutsche Bank has a comfortable MREL surplus of € 14.4 billion above our MREL requirement of € 100.5 billion (i.e. 28.58 % of RWA including combined buffer requirement). € 109.1 billion of our available MREL were own funds and subordinated liabilities, corresponding to a MREL subordination ratio of 31.03 % of RWA, a buffer of € 21.9 billion over our subordination requirement of € 87.2 billion (i.e. 24.79 % of RWA including combined buffer requirements). Compared to December 31, 2020 the surpluses above both our MREL requirement and our subordinated MREL requirement have been reduced mainly through the change in the MREL requirement setting legislation and methodology described above. This was partially offset by an increase in our MREL capacity from new issuances of own funds and eligible liabilities which more than offset roll-offs and methodology changes in the measurement basis. These developments also impacted our TLAC ratio.
TLAC ratio development
As of December 31, 2021, TLAC was € 109.1 billion and the corresponding TLAC ratios were 31.03 % of RWA and 9.70 % of LRE. This means that Deutsche Bank has a comfortable TLAC surplus of € 36.9 billion over its TLAC requirement of € 72.2 billion (20.53 % of RWA including combined buffer requirements).
MREL and TLAC disclosure
|
in € m.
(unless stated otherwise)
|
|
Dec 31, 2021
|
|
Dec 31, 2020
|
|
Regulatory capital elements of TLAC/MREL
|
|
|
|
|
|
Common Equity Tier 1 capital (CET 1)
|
|
46,506
|
|
44,885
|
|
Additional Tier 1 (AT1) capital instruments eligible under TLAC/MREL
|
|
8,868
|
|
6,848
|
|
Tier 2 (T2) capital instruments eligible under TLAC/MREL
|
|
|
|
|
|
Tier 2 (T2) capital instruments before TLAC/MREL adjustments
|
|
7,358
|
|
6,944
|
|
Tier 2 (T2) capital instruments adjustments for TLAC/MREL
|
|
1,208
|
|
518
|
|
Tier 2 (T2) capital instruments eligible under TLAC/MREL
|
|
8,566
|
|
7,462
|
|
Total regulatory capital elements of TLAC/MREL
|
|
63,941
|
|
59,195
|
|
|
|
|
|
|
|
Other elements of TLAC/MREL
|
|
|
|
|
|
Senior non-preferred plain vanilla
|
|
45,153
|
|
46,048
|
|
Holdings of eligible liabilities instruments of other G-SIIs (TLAC only)
|
|
0
|
|
0
|
|
Total Loss Absorbing Capacity (TLAC)
|
|
109,094
|
|
105,243
|
|
Add back of holdings of eligible liabilities instruments of other G-SIIs (TLAC only)
|
|
0
|
|
0
|
|
Available Own Funds and subordinated Eligible Liabilities (subordinated MREL)
|
|
109,094
|
|
105,243
|
|
Senior preferred plain vanilla
|
|
5,759
|
|
3,658
|
|
Available Minimum Own Funds and Eligible Liabilities (MREL)
|
|
114,853
|
|
108,901
|
|
|
|
|
|
|
|
Risk Weighted Assets (RWA)
|
|
351,629
|
|
328,951
|
|
Leverage Ratio Exposure (LRE)
|
|
1,124,667
|
|
1,078,277
|
|
Total liabilities and own funds after prudential netting (TLOF)
|
|
-
|
|
1,018,744
|
|
|
|
|
|
|
|
TLAC ratio
|
|
|
|
|
|
TLAC ratio (as percentage of RWA)
|
|
31.03
|
|
31.99
|
|
TLAC requirement (as percentage of RWA)
|
|
20.53
|
|
20.52
|
|
TLAC ratio (as percentage of Leverage Exposure)
|
|
9.70
|
|
9.76
|
|
TLAC requirement (as percentage of Leverage Exposure)
|
|
6.00
|
|
6.00
|
|
TLAC surplus over RWA requirement
|
|
36,919
|
|
37,747
|
|
TLAC surplus over LRE requirement
|
|
41,614
|
|
40,547
|
|
|
|
|
|
|
|
MREL subordination
|
|
|
|
|
|
MREL subordination ratio (%)¹
|
|
31.03
|
|
10.33
|
|
MREL subordination requirement (%)¹
|
|
24.79
|
|
6.11
|
|
Surplus over MREL subordination requirement
|
|
21,909
|
|
42,998
|
|
|
|
|
|
|
|
MREL ratio
|
|
|
|
|
|
MREL ratio (%)¹
|
|
32.66
|
|
10.69
|
|
MREL requirement (%)¹
|
|
28.58
|
|
8.58
|
|
MREL surplus over requirement
|
|
14,372
|
|
21,493
|
|
|
|
|
|
|
1
For Dec 31, 2021 as percentage of RWA (requirement including the combined buffer requirement) and for Dec 31, 2020 as percentage of TLOF.
134
|
|
Deutsche Bank
|
Operating and Financial Review
|
|
|
Annual Report 2021
|
Deutsche Bank Group
|
|
|
|
|
Own Funds and Eligible Liabilities
To meet the MREL and TLAC requirement, Deutsche Bank needs to ensure that a sufficient amount of eligible liabilities instruments is maintained. Instruments eligible for MREL and TLAC are regulatory capital instruments (“own funds”) and liabilities that meet certain criteria, which are referred to as eligible liabilities.
Own funds used for MREL and TLAC include the full amount of Tier 2 capital instruments with a remaining maturity of greater than 1 year and less than 5 years which are reflected in regulatory capital on a pro-rata basis only.
Eligible liabilities are liabilities issued out of the resolution entity Deutsche Bank AG that meet eligibility criteria which are supposed to ensure that they are structurally suited as loss-absorbing capital. As a result, eligible liabilities exclude deposits which are covered by an insurance deposit protection scheme or which are preferred under German insolvency law (e.g., deposits from private individuals as well as small and medium-sized enterprises). Among other things, secured liabilities and derivatives liabilities are generally excluded as well. Debt instruments with embedded derivative features can be included under certain conditions (e.g. a known and fixed or increasing principal). In addition, eligible liabilities must have a remaining time to maturity of at least one year and must either be issued under the law of a Member State of the European Union or must include a bail-in clause in their contractual terms to make write-down or conversion effective. The SRB has granted a transitional period for liabilities issued under UK law on or before November 15, 2018, which do not include an enforceable and effective bail-in clause but can still be included in eligible liabilities after Brexit until June 28, 2025.
In addition, eligible liabilities need to be subordinated to be counted against the TLAC and MREL subordination requirements. Effective January 1, 2017, the German Banking Act provided for a new class of statutorily subordinated debt securities that rank as “senior non-preferred” below the bank’s other senior liabilities (but in priority to the bank’s contractually subordinated liabilities, such as those qualifying as Tier 2 instruments). Following a harmonization effort by the European Union implemented in Germany effective July 21, 2018, banks are permitted to now decide if a specific issuance of eligible senior debt will be in the non-preferred or in the preferred category. Any such “senior non-preferred” debt instruments issued by Deutsche Bank AG under such rules rank on parity with its outstanding debt instruments that were classified as “senior non-preferred” under the prior rules. All of these “senior non-preferred” issuances meet the TLAC and MREL subordination criteria.
135
|
|
Deutsche Bank
|
Operating and Financial Review
|
|
|
Annual Report 2021
|
Deutsche Bank Group
|
|
|
|
|
Credit Risk Exposure
We define our credit exposure by taking into account all transactions where losses might occur due to the fact that counterparties may not fulfill their contractual payment obligations as defined under ‘Credit Risk Framework’.
Maximum Exposure to Credit Risk
The maximum exposure to credit risk table shows the direct exposure before consideration of associated collateral held and other credit enhancements (netting and hedges) that do not qualify for offset in our financial statements for the periods specified. The netting credit enhancement component includes the effects of legally enforceable netting agreements as well as the offset of negative mark-to-markets from derivatives against pledged cash collateral. The collateral credit enhancement component mainly includes real estate, collateral in the form of cash as well as securities-related collateral. In relation to collateral we apply internally determined haircuts and additionally cap all collateral values at the level of the respective collateralized exposure.
136
|
|
Deutsche Bank
|
Operating and Financial Review
|
|
|
Annual Report 2021
|
Deutsche Bank Group
|
|
|
|
|
Maximum Exposure to Credit Risk
|
|
|
Dec 31, 2021
|
||||||||||
|
|
|
|
|
|
|
Credit Enhancements
|
||||||
|
in € m.
|
|
Maximum
exposure
to credit risk
1
|
|
Subject to
impairment
|
|
Netting
|
|
Collateral
|
|
Guarantees
and Credit
derivatives
2
|
|
Total credit
enhancements
|
|
Financial assets at amortized cost
3
|
|
|
|
|
|
|
|
|
|
|
|
|
|
Cash and central bank balances
|
|
|
|
|
|
−
|
|
|
|
−
|
|
|
|
Interbank balances (w/o central banks)
|
|
|
|
|
|
−
|
|
|
|
|
|
|
|
Central bank funds sold and securities purchased under resale agreements
|
|
|
|
|
|
−
|
|
|
|
−
|
|
|
|
Securities borrowed
|
|
|
|
|
|
−
|
|
|
|
−
|
|
|
|
Loans
|
|
|
|
|
|
−
|
|
|
|
|
|
|
|
Other assets subject to credit risk
4,5
|
|
|
|
|
|
|
|
|
|
|
|
|
|
Total financial assets at amortized cost
3
|
|
|
|
|
|
|
|
|
|
|
|
|
|
Financial assets at fair value through profit or loss
6
|
|
|
|
|
|
|
|
|
|
|
|
|
|
Trading assets
|
|
|
|
−
|
|
−
|
|
|
|
|
|
|
|
Positive market values from derivative financial instruments
|
|
|
|
−
|
|
|
|
|
|
|
|
|
|
Non-trading financial assets mandatory at fair value through profit or loss
|
|
|
|
−
|
|
|
|
|
|
|
|
|
|
Of which:
|
|
|
|
|
|
|
|
|
|
|
|
|
|
Securities purchased under resale agreement
|
|
|
|
−
|
|
|
|
|
|
|
|
|
|
Securities borrowed
|
|
|
|
−
|
|
−
|
|
|
|
|
|
|
|
Loans
|
|
|
|
−
|
|
−
|
|
|
|
|
|
|
|
Financial assets designated at fair value through profit or loss
|
|
|
|
−
|
|
−
|
|
|
|
|
|
|
|
Total financial assets at fair value through profit or loss
|
|
|
|
−
|
|
|
|
|
|
|
|
|
|
Financial assets at fair value through OCI
|
|
|
|
|
|
0
|
|
|
|
|
|
|
|
Of which:
|
|
|
|
|
|
|
|
|
|
|
|
|
|
Securities purchased under resale agreement
|
|
|
|
|
|
−
|
|
|
|
|
|
|
|
Securities borrowed
|
|
|
|
|
|
−
|
|
|
|
|
|
|
|
Loans
|
|
|
|
|
|
−
|
|
|
|
|
|
|
|
Total financial assets at fair value through OCI
|
|
|
|
|
|
−
|
|
|
|
|
|
|
|
Financial guarantees and other credit related contingent liabilities
7
|
|
|
|
|
|
−
|
|
|
|
|
|
|
|
Revocable and irrevocable lending commitments and other credit related commitments
7
|
|
|
|
|
|
−
|
|
|
|
|
|
|
|
Total off-balance sheet
|
|
|
|
|
|
−
|
|
|
|
|
|
|
|
|
|
|
|
|
|
|
|
|
|
|
|
|
|
Maximum exposure to credit risk
|
|
|
|
|
|
|
|
|
|
|
|
|
|
|
|
|
|
|
|
|
|
|
|
|
|
|
1
Does not include credit derivative notional sold (
€
491,407
million
) and credit derivative notional bought protection.
2
Bought Credit protection is reflected with the notional of the underlying
.
3
All amounts at gross value before deductions of allowance for credit losses.
4
All amounts at amortized cost (gross) except for qualifying hedge derivatives, which are reflected at Fair value through PL
.
5
Includes Asset Held for Sale regardless of accounting classification.
6
Excludes equities, other equity interests and commodities.
7
Figures are reflected at notional amounts.
|
|
|
Dec 31, 2020
|
||||||||||
|
|
|
|
|
|
|
Credit Enhancements
|
||||||
|
in € m.
|
|
Maximum
exposure
to credit risk
1
|
|
Subject to
impairment
|
|
Netting
|
|
Collateral
|
|
Guarantees
and Credit
derivatives
2
|
|
Total credit
enhancements
|
|
Financial assets at amortized cost
3
|
|
|
|
|
|
|
|
|
|
|
|
|
|
Cash and central bank balances
|
|
|
|
|
|
−
|
|
|
|
−
|
|
|
|
Interbank balances (w/o central banks)
|
|
|
|
|
|
−
|
|
|
|
|
|
|
|
Central bank funds sold and securities purchased under resale agreements
|
|
|
|
|
|
−
|
|
|
|
−
|
|
|
|
Securities borrowed
|
|
|
|
|
|
−
|
|
|
|
−
|
|
|
|
Loans
|
|
|
|
|
|
−
|
|
|
|
|
|
|
|
Other assets subject to credit risk
4,5
|
|
|
|
|
|
|
|
|
|
|
|
|
|
Total financial assets at amortized cost
3
|
|
|
|
|
|
|
|
|
|
|
|
|
|
Financial assets at fair value through profit or loss
6
|
|
|
|
|
|
|
|
|
|
|
|
|
|
Trading assets
|
|
|
|
−
|
|
−
|
|
|
|
|
|
|
|
Positive market values from derivative financial instruments
|
|
|
|
−
|
|
|
|
|
|
|
|
|
|
Non-trading financial assets mandatory at fair value through profit or loss
|
|
|
|
−
|
|
|
|
|
|
|
|
|
|
Of which:
|
|
|
|
|
|
|
|
|
|
|
|
|
|
Securities purchased under resale agreement
|
|
|
|
−
|
|
|
|
|
|
|
|
|
|
Securities borrowed
|
|
|
|
−
|
|
−
|
|
|
|
|
|
|
|
Loans
|
|
|
|
−
|
|
−
|
|
|
|
|
|
|
|
Financial assets designated at fair value through profit or loss
|
|
|
|
−
|
|
−
|
|
|
|
|
|
|
|
Total financial assets at fair value through profit or loss
|
|
|
|
−
|
|
|
|
|
|
|
|
|
|
Financial assets at fair value through OCI
|
|
|
|
|
|
|
|
|
|
|
|
|
|
Of which:
|
|
|
|
|
|
|
|
|
|
|
|
|
|
Securities purchased under resale agreement
|
|
|
|
|
|
−
|
|
|
|
|
|
|
|
Securities borrowed
|
|
|
|
|
|
−
|
|
|
|
|
|
|
|
Loans
|
|
|
|
|
|
−
|
|
|
|
|
|
|
|
Total financial assets at fair value through OCI
|
|
|
|
|
|
−
|
|
|
|
|
|
|
|
Financial guarantees and other credit related contingent liabilities
7
|
|
|
|
|
|
−
|
|
|
|
|
|
|
|
Revocable and irrevocable lending commitments and other credit related commitments
7
|
|
|
|
|
|
−
|
|
|
|
|
|
|
|
Total off-balance sheet
|
|
|
|
|
|
−
|
|
|
|
|
|
|
|
|
|
|
|
|
|
|
|
|
|
|
|
|
|
Maximum exposure to credit risk
|
|
|
|
|
|
|
|
|
|
|
|
|
|
|
|
|
|
|
|
|
|
|
|
|
|
|
1
Does not include credit derivative notional sold (
€
395,636
million
) and credit derivative notional bought protection.
2
Bought Credit protection is reflected with the notional of the underlying.
3
All amounts at gross value before deductions of allowance for credit losses.
4
All amounts at amortized cost (gross) except for qualifying hedge derivatives, which are reflected at Fair value through PL.
5
Includes Asset Held for Sale regardless of accounting classification.
6
Excludes equities, other equity interests and commodities.
7
Figures are reflected at notional amounts.
The overall increase in maximum exposure to credit risk for December 31, 2021 was € 23.0 billion mainly driven by an increase of € 45.3 billion in loans at amortized cost, € 24.0 billion in cash and central bank and interbank balances, € 14.8 billion in central bank funds sold, securities purchased under resale agreements and securities borrowed across all applicable measurement categories and € 22.7 billion in irrevocable commitments and financial guarantees. These increases were offset by reductions in positive market values from derivatives by € 43.8 billion, financial assets at fair value through other comprehensive income by € 26.9 billion mainly in debt securities and other assets subject to credit risk by € 13.0 billion.
Included in the category of trading assets as of December 31, 2021, were traded bonds of
€
85.5
billion
(
€
83.5
billion
as of December 31, 2020) of which over
83
%
were investment-grade (over
84
%
as of December 31, 2020).
Credit Enhancements are split into three categories: netting, collateral and guarantees / credit derivatives. Haircuts, parameter setting for regular margin calls as well as expert judgments for collateral valuation are employed to prevent market developments from leading to a build-up of uncollateralized exposures. All categories are monitored and reviewed regularly. Overall credit enhancements received are diversified and of adequate quality being largely cash, highly rated government bonds and third-party guarantees mostly from well rated banks and insurance companies. These financial institutions are domiciled mainly in European countries and the United States. Furthermore, we have collateral pools of highly liquid assets and mortgages (principally consisting of residential properties mainly in Germany) for the homogeneous retail portfolio.
137
|
|
Deutsche Bank
|
Operating and Financial Review
|
|
|
Annual Report 2021
|
Deutsche Bank Group
|
|
|
|
|
Main Credit Exposure Categories
The tables in this section show details about several of our main credit exposure categories, namely Loans, Revocable and Irrevocable Lending Commitments, Contingent Liabilities Over-The-Counter (“OTC”) Derivatives, Debt Securities and Repo and repo-style transactions:
- – “Loans” are gross loans as reported on our balance sheet at amortized cost, loans at fair value through profit and loss and loans at fair value through other comprehensive income before deduction of allowance for credit losses. This includes “Traded loans” that are bought and held for the purpose of selling them in the near term, or the material risks of which have all been hedged or sold. From a regulatory perspective the latter category principally covers trading book positions.
- – “Revocable and irrevocable lending commitments” consist of the undrawn portion of revocable and irrevocable lending-related commitments.
- – “Contingent liabilities” consist of financial and performance guarantees, standby letters of credit and other similar arrangements (mainly indemnity agreements).
- – “OTC derivatives” are our credit exposures from over-the-counter derivative transactions that we have entered into, after netting and cash collateral received. On our balance sheet, these are included in financial assets at fair value through profit or loss or, for derivatives qualifying for hedge accounting, in other assets, in either case only applying cash collateral received and netting eligible under IFRS.
- – “Debt securities” include debentures, bonds, deposits, notes or commercial paper, which are issued for a fixed term and redeemable by the issuer, as reported on our balance sheet within accounting categories at amortized cost and at fair value through other comprehensive income before deduction of allowance for credit losses, it also includes category at fair value through profit and loss. This includes “Traded bonds”, which are bonds, deposits, notes or commercial paper that are bought and held for the purpose of selling them in the near term. From a regulatory perspective the latter category principally covers trading book positions.
- – “Repo and repo-style transactions” consist of reverse repurchase transactions, as well as securities or commodities borrowing transactions, only applying collateral received and netting eligible under IFRS.
Although considered in the monitoring of maximum credit exposures, the following are not included in the details of our main credit exposure: brokerage and securities related receivables, cash and central bank balances, interbank balances (without central banks), assets held for sale, accrued interest receivables, traditional securitization positions.
Main Credit Exposure Categories by Business Divisions
|
|
|
Dec 31, 2021
|
||||||||||||
|
|
|
Loans
|
|
Off-balance sheet
|
|
OTC derivatives
|
||||||||
|
in € m.
|
|
at amortized cost
1
|
|
trading -
at fair value
through PL
|
|
Designated /
mandatory at
fair value
through PL
|
|
at fair value
through OCI
2
|
|
Revocable and
irrevocable
lending
commitments
3
|
|
Contingent
liabilities
|
|
at fair value
through PL
4
|
|
Corporate Bank
|
|
122,310
|
|
255
|
|
311
|
|
4,169
|
|
135,944
|
|
55,560
|
|
190
|
|
Investment Bank
|
|
92,966
|
|
8,590
|
|
702
|
|
202
|
|
50,768
|
|
1,764
|
|
17,416
|
|
Private Bank
|
|
254,439
|
|
0
|
|
7
|
|
0
|
|
39,660
|
|
1,883
|
|
524
|
|
Asset Management
|
|
23
|
|
0
|
|
1
|
|
0
|
|
110
|
|
9
|
|
0
|
|
Capital Release Unit
|
|
2,222
|
|
344
|
|
15
|
|
0
|
|
41
|
|
31
|
|
5,813
|
|
Corporate Other
|
|
4,867
|
|
0
|
|
0
|
|
0
|
|
608
|
|
146
|
|
203
|
|
Total
|
|
476,827
|
|
9,189
|
|
1,035
|
|
4,370
|
|
227,132
|
|
59,394
|
|
24,146
|
|
|
|
|
|
|
|
|
|
|
|
|
|
|
|
|
…
|
|
|
Dec 31, 2021
|
||||||||||||
|
|
|
Debt Securities
|
|
Repo and repo-style transactions
7
|
|
Total
|
||||||||
|
in € m.
|
|
at amortized cost
5
|
|
at fair value
through PL
|
|
at fair value
through OCI
6
|
|
at amortized cost
|
|
at fair value
through PL
|
|
at fair value
through OCI
|
|
|
|
Corporate Bank
|
|
839
|
|
15
|
|
0
|
|
862
|
|
0
|
|
0
|
|
320,454
|
|
Investment Bank
|
|
3,332
|
|
88,692
|
|
1,045
|
|
6,692
|
|
74,441
|
|
0
|
|
346,609
|
|
Private Bank
|
|
525
|
|
1
|
|
2
|
|
0
|
|
0
|
|
0
|
|
297,041
|
|
Asset Management
|
|
0
|
|
3,582
|
|
154
|
|
0
|
|
0
|
|
0
|
|
3,879
|
|
Capital Release Unit
|
|
0
|
|
625
|
|
0
|
|
0
|
|
3,397
|
|
0
|
|
12,489
|
|
Corporate Other
|
|
10,154
|
|
2,452
|
|
22,177
|
|
879
|
|
448
|
|
1,231
|
|
43,165
|
|
Total
|
|
14,849
|
|
95,367
|
|
23,377
|
|
8,433
|
|
78,286
|
|
1,231
|
|
1,023,637
|
|
|
|
|
|
|
|
|
|
|
|
|
|
|
|
|
1
Includes stage 3 and stage 3 POCI loans at amortized cost amounting to
€
12.4
billion
as of December 31, 2021.
2
Includes stage 3 and stage 3 POCI loans at fair value through OCI amounting to
€
28.1
million
as of December 31, 2021
3
Includes stage 3 and stage 3 POCI off-balance sheet exposure amounting to
€
2.6
billion
as of December 31, 2021.
4
Includes the effect of netting agreements and cash collateral received where applicable. Excludes derivatives qualifying for hedge accounting.
5
Includes stage 3 and stage 3 POCI debt securities at amortized cost amounting to
€
368.2
million
as of December 31, 2021.
6
Includes stage 3 and stage 3 POCI debt securities at fair value through OCI amounting to
€
15.8
million
as of December 31, 2021.
7
Before reflection of collateral and limited to securities purchased under resale agreements and securities borrowed.
138
|
|
Deutsche Bank
|
Operating and Financial Review
|
|
|
Annual Report 2021
|
Deutsche Bank Group
|
|
|
|
|
|
|
|
Dec 31, 2020
|
||||||||||||
|
|
|
Loans
|
|
Off-balance sheet
|
|
OTC derivatives
|
||||||||
|
in € m.
|
|
at amortized cost
1
|
|
trading -
at fair value
through PL
|
|
Designated /
mandatory at
fair value
through PL
|
|
at fair value
through OCI
2
|
|
Revocable and
irrevocable
lending
commitments
3
|
|
Contingent
liabilities
|
|
at fair value
through PL
4
|
|
Corporate Bank
|
|
114,491
|
|
621
|
|
784
|
|
4,393
|
|
130,690
|
|
44,293
|
|
299
|
|
Investment Bank
|
|
69,309
|
|
6,366
|
|
1,618
|
|
220
|
|
45,053
|
|
1,889
|
|
22,533
|
|
Private Bank
|
|
237,194
|
|
0
|
|
7
|
|
0
|
|
37,315
|
|
1,625
|
|
440
|
|
Asset Management
|
|
20
|
|
0
|
|
0
|
|
0
|
|
121
|
|
9
|
|
0
|
|
Capital Release Unit
|
|
2,807
|
|
1,352
|
|
220
|
|
22
|
|
1,592
|
|
38
|
|
9,388
|
|
Corporate Other
|
|
7,682
|
|
0
|
|
0
|
|
0
|
|
1,106
|
|
123
|
|
268
|
|
Total
|
|
431,503
|
|
8,339
|
|
2,629
|
|
4,635
|
|
215,877
|
|
47,978
|
|
32,928
|
|
|
|
|
|
|
|
|
|
|
|
|
|
|
|
|
…
|
|
|
Dec 31, 2020
|
||||||||||||
|
|
|
Debt Securities
|
|
Repo and repo-style transactions
7
|
|
Total
|
||||||||
|
in € m.
|
|
at amortized cost
5
|
|
at fair value
through PL
|
|
at fair value
through OCI
6
|
|
at amortized cost
|
|
at fair value
through PL
|
|
at fair value
through OCI
|
|
|
|
Corporate Bank
|
|
733
|
|
68
|
|
0
|
|
345
|
|
0
|
|
0
|
|
296,717
|
|
Investment Bank
|
|
2,078
|
|
86,579
|
|
980
|
|
7,356
|
|
59,974
|
|
0
|
|
303,956
|
|
Private Bank
|
|
521
|
|
2
|
|
1
|
|
10
|
|
0
|
|
0
|
|
277,115
|
|
Asset Management
|
|
0
|
|
2,850
|
|
198
|
|
0
|
|
0
|
|
0
|
|
3,198
|
|
Capital Release Unit
|
|
0
|
|
1,404
|
|
0
|
|
1
|
|
3,091
|
|
0
|
|
19,915
|
|
Corporate Other
|
|
9,294
|
|
4,443
|
|
48,476
|
|
824
|
|
0
|
|
1,543
|
|
73,760
|
|
Total
|
|
12,625
|
|
95,347
|
|
49,656
|
|
8,535
|
|
63,066
|
|
1,543
|
|
974,661
|
|
|
|
|
|
|
|
|
|
|
|
|
|
|
|
|
1
Includes stage 3 and stage 3 POCI loans at amortized cost amounting to
€
11.9
billion
as of December 31, 2020.
2
Includes stage 3 and stage 3 POCI loans at fair value through OCI amounting to
€
90.3
million
as of December 31, 2020
3
Includes stage 3 and stage 3 POCI off-balance sheet exposure amounting to
€
2.6
billion
as of December 31, 2020.
4
Includes the effect of netting agreements and cash collateral received where applicable. Excludes derivatives qualifying for hedge accounting.
5
Includes stage 3 and stage 3 POCI debt securities at amortized cost amounting to
€
360.4
million
as of December 31, 2020.
6
Includes stage 3 and stage 3 POCI debt securities at fair value through OCI amounting to
€
15.1
million
as of December 31, 2020.
7
Before reflection of collateral and limited to securities purchased under resale agreements and securities borrowed.
Our total credit exposure increased by € 48.9 billion year-on-year.
- ― In terms of business divisions, total main credit exposure increased by € 42.7 billion in the Investment Bank including a large episodic financing in the loan book which is expected to reverse in first quarter 2022, € 23.7 billion in the Corporate Bank, € 19.9 billion in the Private Bank and € 0.7 billion in Asset Management, partially offset by decreases in Corporate Other by € 30.6 billion and € 7.4 billion in the Capital Release Unit. The business division Corporate Other primarily contains exposures in Treasury.
- ― From a product perspective, exposure increases have been observed for loans, off-balance sheet positions and repo and repo-style transactions, while decreases were observed in debt securities and OTC derivatives.
139
|
|
Deutsche Bank
|
Operating and Financial Review
|
|
|
Annual Report 2021
|
Deutsche Bank Group
|
|
|
|
|
Main Credit Exposure Categories by Industry Sectors
The below tables give an overview of our credit exposure by industry based on the NACE code of the counterparty. NACE (Nomenclature des Activités Économiques dans la Communauté Européenne) is a standard European industry classification system and does not have to be congruent with an internal risk based view applied elsewhere in this report.
140
|
|
Deutsche Bank
|
Operating and Financial Review
|
|
|
Annual Report 2021
|
Deutsche Bank Group
|
|
|
|
|
|
|
|
Dec 31, 2021
|
||||||||||||
|
|
|
Loans
|
|
Off-balance sheet
|
|
OTC derivatives
|
||||||||
|
in € m.
|
|
at amortized
cost
1
|
|
trading -
at fair value
through PL
|
|
Designated /
mandatory at
fair value
through PL
|
|
at fair value
through OCI
2
|
|
Revocable and
irrevocable
lending
commitments
3
|
|
Contingent
liabilities
|
|
at fair value
through PL
4
|
|
Agriculture, forestry and fishing
|
|
|
|
|
|
|
|
|
|
|
|
|
|
|
|
Mining and quarrying
|
|
|
|
|
|
|
|
|
|
|
|
|
|
|
|
Manufacturing
|
|
|
|
|
|
|
|
|
|
|
|
|
|
|
|
Electricity, gas, steam and air conditioning supply
|
|
|
|
|
|
|
|
|
|
|
|
|
|
|
|
Water supply, sewerage, waste management and remediation activities
|
|
|
|
|
|
|
|
|
|
|
|
|
|
|
|
Construction
|
|
|
|
|
|
|
|
|
|
|
|
|
|
|
|
Wholesale and retail trade, repair of motor vehicles and motorcycles
|
|
|
|
|
|
|
|
|
|
|
|
|
|
|
|
Transport and storage
|
|
|
|
|
|
|
|
|
|
|
|
|
|
|
|
Accommodation and food service activities
|
|
|
|
|
|
|
|
|
|
|
|
|
|
|
|
Information and communication
|
|
|
|
|
|
|
|
|
|
|
|
|
|
|
|
Financial and insurance activities
|
|
|
|
|
|
|
|
|
|
|
|
|
|
|
|
Real estate activities
|
|
|
|
|
|
|
|
|
|
|
|
|
|
|
|
Professional, scientific and technical activities
|
|
|
|
|
|
|
|
|
|
|
|
|
|
|
|
Administrative and support service activities
|
|
|
|
|
|
|
|
|
|
|
|
|
|
|
|
Public administration and defense, compulsory social security
|
|
|
|
|
|
|
|
|
|
|
|
|
|
|
|
Education
|
|
|
|
|
|
|
|
|
|
|
|
|
|
|
|
Human health services and social work activities
|
|
|
|
|
|
|
|
|
|
|
|
|
|
|
|
Arts, entertainment and recreation
|
|
|
|
|
|
|
|
|
|
|
|
|
|
|
|
Other service activities
|
|
|
|
|
|
|
|
|
|
|
|
|
|
|
|
Activities of households as employers, undifferentiated goods- and services-producing activities of households for own use
|
|
|
|
|
|
|
|
|
|
|
|
|
|
|
|
Activities of extraterritorial organizations and bodies
|
|
|
|
|
|
|
|
|
|
|
|
|
|
|
|
Total
|
|
|
|
|
|
|
|
|
|
|
|
|
|
|
|
|
|
|
|
|
|
|
|
|
|
|
|
|
|
|
|
|
|
Dec 31, 2021
|
||||||||||||
|
|
|
Debt Securities
|
|
Repo and repo-style transactions
7
|
|
Total
|
||||||||
|
in € m.
|
|
at amortized cost
5
|
|
at fair value
through PL
|
|
at fair value
through OCI
6
|
|
at amortized cost
|
|
at fair value
through PL
|
|
at fair value
through OCI
|
|
|
|
Agriculture, forestry and fishing
|
|
|
|
|
|
|
|
|
|
|
|
|
|
|
|
Mining and quarrying
|
|
|
|
|
|
|
|
|
|
|
|
|
|
|
|
Manufacturing
|
|
|
|
|
|
|
|
|
|
|
|
|
|
|
|
Electricity, gas, steam and air conditioning supply
|
|
|
|
|
|
|
|
|
|
|
|
|
|
|
|
Water supply, sewerage, waste management and remediation activities
|
|
|
|
|
|
|
|
|
|
|
|
|
|
|
|
Construction
|
|
|
|
|
|
|
|
|
|
|
|
|
|
|
|
Wholesale and retail trade, repair of motor vehicles and motorcycles
|
|
|
|
|
|
|
|
|
|
|
|
|
|
|
|
Transport and storage
|
|
|
|
|
|
|
|
|
|
|
|
|
|
|
|
Accommodation and food service activities
|
|
|
|
|
|
|
|
|
|
|
|
|
|
|
|
Information and communication
|
|
|
|
|
|
|
|
|
|
|
|
|
|
|
|
Financial and insurance activities
|
|
|
|
|
|
|
|
|
|
|
|
|
|
|
|
Real estate activities
|
|
|
|
|
|
|
|
|
|
|
|
|
|
|
|
Professional, scientific and technical activities
|
|
|
|
|
|
|
|
|
|
|
|
|
|
|
|
Administrative and support service activities
|
|
|
|
|
|
|
|
|
|
|
|
|
|
|
|
Public administration and defense, compulsory social security
|
|
|
|
|
|
|
|
|
|
|
|
|
|
|
|
Education
|
|
|
|
|
|
|
|
|
|
|
|
|
|
|
|
Human health services and social work activities
|
|
|
|
|
|
|
|
|
|
|
|
|
|
|
|
Arts, entertainment and recreation
|
|
|
|
|
|
|
|
|
|
|
|
|
|
|
|
Other service activities
|
|
|
|
|
|
|
|
|
|
|
|
|
|
|
|
Activities of households as employers, undifferentiated goods- and services-producing activities of households for own use
|
|
|
|
|
|
|
|
|
|
|
|
|
|
|
|
Activities of extraterritorial organizations and bodies
|
|
|
|
|
|
|
|
|
|
|
|
|
|
|
|
Total
|
|
|
|
|
|
|
|
|
|
|
|
|
|
|
|
|
|
|
|
|
|
|
|
|
|
|
|
|
|
|
1
Includes stage 3 and stage 3 POCI loans at amortized cost amounting to
€ 12.4 billion
as of December 31, 2021.
2
Includes stage 3 and stage 3 POCI loans at fair value through OCI amounting to
€
28.1
million
as of December 31, 2021
3
Includes stage 3 and stage 3 POCI off-balance sheet exposure amounting to
€
2.6
billion
as of December 31, 2021
.
4
Includes the effect of netting agreements and cash collateral received where applicable. Excludes derivatives qualifying for hedge accounting.
5
Includes stage 3 and stage 3 POCI debt securities at amortized cost amounting to
€
368.2
million
as of December 31, 2021.
6
Includes stage 3 and stage 3 POCI debt securities at fair value through OCI amounting to
€
15.8
million
as of December 31, 2021
.
7
Before reflection of collateral and limited to securities purchased under resale agreements and securities borrowed.
|
|
|
Dec 31, 2020
|
||||||||||||
|
|
|
Loans
|
|
Off-balance sheet
|
|
OTC derivatives
|
||||||||
|
in € m.
|
|
at amortized cost
1
|
|
trading -
at fair value
through PL
|
|
Designated /
mandatory at
fair value
through PL
|
|
at fair value
through OCI
2
|
|
Revocable and
irrevocable
lending
commitments
3
|
|
Contingent
liabilities
|
|
at fair value
through PL
4
|
|
Agriculture, forestry and fishing
|
|
|
|
|
|
|
|
|
|
|
|
|
|
|
|
Mining and quarrying
|
|
|
|
|
|
|
|
|
|
|
|
|
|
|
|
Manufacturing
|
|
|
|
|
|
|
|
|
|
|
|
|
|
|
|
Electricity, gas, steam and air conditioning supply
|
|
|
|
|
|
|
|
|
|
|
|
|
|
|
|
Water supply, sewerage, waste management and remediation activities
|
|
|
|
|
|
|
|
|
|
|
|
|
|
|
|
Construction
|
|
|
|
|
|
|
|
|
|
|
|
|
|
|
|
Wholesale and retail trade, repair of motor vehicles and motorcycles
|
|
|
|
|
|
|
|
|
|
|
|
|
|
|
|
Transport and storage
|
|
|
|
|
|
|
|
|
|
|
|
|
|
|
|
Accommodation and food service activities
|
|
|
|
|
|
|
|
|
|
|
|
|
|
|
|
Information and communication
|
|
|
|
|
|
|
|
|
|
|
|
|
|
|
|
Financial and insurance activities
|
|
|
|
|
|
|
|
|
|
|
|
|
|
|
|
Real estate activities
|
|
|
|
|
|
|
|
|
|
|
|
|
|
|
|
Professional, scientific and technical activities
|
|
|
|
|
|
|
|
|
|
|
|
|
|
|
|
Administrative and support service activities
|
|
|
|
|
|
|
|
|
|
|
|
|
|
|
|
Public administration and defense, compulsory social security
|
|
|
|
|
|
|
|
|
|
|
|
|
|
|
|
Education
|
|
|
|
|
|
|
|
|
|
|
|
|
|
|
|
Human health services and social work activities
|
|
|
|
|
|
|
|
|
|
|
|
|
|
|
|
Arts, entertainment and recreation
|
|
|
|
|
|
|
|
|
|
|
|
|
|
|
|
Other service activities
|
|
|
|
|
|
|
|
|
|
|
|
|
|
|
|
Activities of households as employers, undifferentiated goods- and services-producing activities of households for own use
|
|
|
|
|
|
|
|
|
|
|
|
|
|
|
|
Activities of extraterritorial organizations and bodies
|
|
|
|
|
|
|
|
|
|
|
|
|
|
|
|
Total
|
|
|
|
|
|
|
|
|
|
|
|
|
|
|
|
|
|
|
|
|
|
|
|
|
|
|
|
|
|
|
|
|
|
Dec 31, 2020
|
||||||||||||
|
|
|
Debt Securities
|
|
Repo and repo-style transactions
7
|
|
Total
|
||||||||
|
in € m.
|
|
at amortized cost
5
|
|
at fair value
through PL
|
|
at fair value
through OCI
6
|
|
at amortized cost
|
|
at fair value
through PL
|
|
at fair value
through OCI
|
|
|
|
Agriculture, forestry and fishing
|
|
|
|
|
|
|
|
|
|
|
|
|
|
|
|
Mining and quarrying
|
|
|
|
|
|
|
|
|
|
|
|
|
|
|
|
Manufacturing
|
|
|
|
|
|
|
|
|
|
|
|
|
|
|
|
Electricity, gas, steam and air conditioning supply
|
|
|
|
|
|
|
|
|
|
|
|
|
|
|
|
Water supply, sewerage, waste management and remediation activities
|
|
|
|
|
|
|
|
|
|
|
|
|
|
|
|
Construction
|
|
|
|
|
|
|
|
|
|
|
|
|
|
|
|
Wholesale and retail trade, repair of motor vehicles and motorcycles
|
|
|
|
|
|
|
|
|
|
|
|
|
|
|
|
Transport and storage
|
|
|
|
|
|
|
|
|
|
|
|
|
|
|
|
Accommodation and food service activities
|
|
|
|
|
|
|
|
|
|
|
|
|
|
|
|
Information and communication
|
|
|
|
|
|
|
|
|
|
|
|
|
|
|
|
Financial and insurance activities
|
|
|
|
|
|
|
|
|
|
|
|
|
|
|
|
Real estate activities
|
|
|
|
|
|
|
|
|
|
|
|
|
|
|
|
Professional, scientific and technical activities
|
|
|
|
|
|
|
|
|
|
|
|
|
|
|
|
Administrative and support service activities
|
|
|
|
|
|
|
|
|
|
|
|
|
|
|
|
Public administration and defense, compulsory social security
|
|
|
|
|
|
|
|
|
|
|
|
|
|
|
|
Education
|
|
|
|
|
|
|
|
|
|
|
|
|
|
|
|
Human health services and social work activities
|
|
|
|
|
|
|
|
|
|
|
|
|
|
|
|
Arts, entertainment and recreation
|
|
|
|
|
|
|
|
|
|
|
|
|
|
|
|
Other service activities
|
|
|
|
|
|
|
|
|
|
|
|
|
|
|
|
Activities of households as employers, undifferentiated goods- and services-producing activities of households for own use
|
|
|
|
|
|
|
|
|
|
|
|
|
|
|
|
Activities of extraterritorial organizations and bodies
|
|
|
|
|
|
|
|
|
|
|
|
|
|
|
|
Total
|
|
|
|
|
|
|
|
|
|
|
|
|
|
|
|
|
|
|
|
|
|
|
|
|
|
|
|
|
|
|
1
Includes stage 3 and stage 3 POCI loans at amortized cost amounting to
€
11.9
billion
as of December 31, 2020.
2
Includes stage 3 and stage 3 POCI loans at fair value through OCI amounting to
€
90.3
million
as of December 31, 2020
3
Includes stage 3 and stage 3 POCI off-balance sheet exposure amounting to
€
2.6
billion
as of December 31, 2020.
4
Includes the effect of netting agreements and cash collateral received where applicable. Excludes derivatives qualifying for hedge accounting.
5
Includes stage 3 and stage 3 POCI debt securities at amortized cost amounting to
€
360.4
million
as of December 31, 2020.
6
Includes stage 3 and stage 3 POCI debt securities at fair value through OCI amounting to
€
15.1
million
as of December 31, 2020.
7
Before reflection of collateral and limited to securities purchased under resale agreements and securities borrowed.
141
|
|
Deutsche Bank
|
Operating and Financial Review
|
|
|
Annual Report 2021
|
Deutsche Bank Group
|
|
|
|
|
The portfolio is subject to the same credit underwriting requirements stipulated in our “Principles for Managing Credit Risk”, including various controls according to single name, country, industry and product/asset class-specific concentration.
Material transactions, such as loans underwritten with the intention to sell down or distribute part of the risk to third parties, are subject to review and approval by senior credit risk management professionals and (depending upon size) an underwriting committee and/or the Management Board. High emphasis is placed on structuring and pricing such transactions so that de-risking can be achieved in a timely manner and – where DB takes market price risk – to mitigate such market risk.
Our amortized cost loan exposure within above categories is mostly to good quality borrowers. Moreover, with the focus on the Corporate Bank and Investment Bank, loan exposure is subject to further risk mitigation through our Strategic Corporate Lending unit (“SCL”).
Our household loan exposure is principally associated with our Private Bank portfolios.
Our amortized cost loan exposure of € 40.6 billion to Real Estate activities above is based on NACE code classification. We also provide an understanding of our Commercial Real Estate exposures across the Commercial Real Estate Group, APAC CRE exposures in the Investment Bank and non-recourse CRE business in the Corporate Bank. Please refer to the chapter “Focus Industries in light of COVID-19 Pandemic” for further information on Commercial Real Estate exposures.
Our commercial real estate loans, primarily originated in the U.S. and Europe, are generally secured by first mortgages on the underlying real estate property. Deutsche Bank originates fixed and floating rate loans and selectively acquires (generally at substantial discount) sub- /non-performing loans sold by financial institutions. The underwriting process is stringent and the exposure is managed under separate portfolio limits. Credit underwriting policy guidelines provide that LTV ratios of generally less than 75 % are maintained. Additionally, given the significance of the underlying collateral, independent external appraisals are commissioned for all secured loans by a valuation team (part of the independent Credit Risk Management function) which is also responsible for reviewing and challenging the reported real estate values regularly. Deutsche Bank originates loans for distribution in the banking market or via securitization. In this context Deutsche Bank frequently retains a portion of the syndicated loans while securitized positions may be entirely sold (except where regulation requires retention of economic risk). Mezzanine or other junior tranches of debt are retained only in exceptional cases. The bank also participates in conservatively underwritten unsecured lines of credit to well-capitalized real estate investment trusts and other real estate operating companies.
Commercial real estate property valuations and rental incomes can be significantly impacted by macro-economic conditions and idiosyncratic events affecting the underlying properties. Accordingly, the portfolio is categorized as higher risk and hence subject to the aforementioned tight restrictions on concentration.
Our credit exposure to our ten largest counterparties accounted for 8 % of our aggregated total credit exposure in these categories as of December 31, 2021 compared with 9 % as of December 31, 2020. Our top ten counterparty exposures were well-rated counterparties or otherwise related to structured trades which show high levels of risk mitigation.
Overall credit exposure to the industry sector Financial and Insurance Activities was predominantly comprised of investment-grade exposures. Total loans across all applicable measurement categories amounted to € 111.2 billion, total repo and repo style transactions across all applicable measurement categories amounted to € 86.0 billion and off-balance sheet activities amounted to € 89.5 billion as of December 31, 2021, and were principally associated with Investment Bank and Corporate Bank portfolios, which were majorly held in North America and Europe.
142
|
|
Deutsche Bank
|
Operating and Financial Review
|
|
|
Annual Report 2021
|
Deutsche Bank Group
|
|
|
|
|
Main credit exposure categories by geographical region
|
|
|
Dec 31, 2021
|
||||||||||||
|
|
|
Loans
|
|
Off-balance sheet
|
|
OTC derivatives
|
||||||||
|
in € m.
|
|
at amortized cost
1
|
|
trading -
at fair value
through PL
|
|
Designated /
mandatory at
fair value
through PL
|
|
at fair value
through OCI
2
|
|
Revocable
and irrevo-
cable lending
commitments
3
|
|
Contingent
liabilities
|
|
at fair value
through PL
4
|
|
Europe
|
|
|
|
|
|
|
|
|
|
|
|
|
|
|
|
Of which:
|
|
|
|
|
|
|
|
|
|
|
|
|
|
|
|
Germany
|
|
|
|
|
|
|
|
|
|
|
|
|
|
|
|
United Kingdom
|
|
|
|
|
|
|
|
|
|
|
|
|
|
|
|
France
|
|
|
|
|
|
|
|
|
|
|
|
|
|
|
|
Luxembourg
|
|
|
|
|
|
|
|
|
|
|
|
|
|
|
|
Italy
|
|
|
|
|
|
|
|
|
|
|
|
|
|
|
|
Netherlands
|
|
|
|
|
|
|
|
|
|
|
|
|
|
|
|
Spain
|
|
|
|
|
|
|
|
|
|
|
|
|
|
|
|
Ireland
|
|
|
|
|
|
|
|
|
|
|
|
|
|
|
|
Switzerland
|
|
|
|
|
|
|
|
|
|
|
|
|
|
|
|
Poland
|
|
|
|
|
|
|
|
|
|
|
|
|
|
|
|
Belgium
|
|
|
|
|
|
|
|
|
|
|
|
|
|
|
|
Russian Federation⁸
|
|
|
|
|
|
|
|
|
|
|
|
|
|
|
|
Ukraine⁸
|
|
|
|
|
|
|
|
|
|
|
|
|
|
|
|
Other Europe⁸
,
¹⁰
|
|
|
|
|
|
|
|
|
|
|
|
|
|
|
|
North America
|
|
|
|
|
|
|
|
|
|
|
|
|
|
|
|
Of which:
|
|
|
|
|
|
|
|
|
|
|
|
|
|
|
|
U.S.
|
|
|
|
|
|
|
|
|
|
|
|
|
|
|
|
Cayman Islands
|
|
|
|
|
|
|
|
|
|
|
|
|
|
|
|
Canada
|
|
|
|
|
|
|
|
|
|
|
|
|
|
|
|
Other North America
|
|
|
|
|
|
|
|
|
|
|
|
|
|
|
|
Asia/Pacific
|
|
|
|
|
|
|
|
|
|
|
|
|
|
|
|
Of which:
|
|
|
|
|
|
|
|
|
|
|
|
|
|
|
|
Japan
|
|
|
|
|
|
|
|
|
|
|
|
|
|
|
|
Australia
|
|
|
|
|
|
|
|
|
|
|
|
|
|
|
|
India
|
|
|
|
|
|
|
|
|
|
|
|
|
|
|
|
China
|
|
|
|
|
|
|
|
|
|
|
|
|
|
|
|
Singapore
|
|
|
|
|
|
|
|
|
|
|
|
|
|
|
|
Hong Kong
|
|
|
|
|
|
|
|
|
|
|
|
|
|
|
|
Other Asia/Pacific
|
|
|
|
|
|
|
|
|
|
|
|
|
|
|
|
Other geographical areas
|
|
|
|
|
|
|
|
|
|
|
|
|
|
|
|
Total
|
|
|
|
|
|
|
|
|
|
|
|
|
|
|
|
|
|
|
|
|
|
|
|
|
|
|
|
|
|
|
|
|
|
Dec 31, 2021
|
||||||||||||
|
|
|
Debt Securities
|
|
Repo and repo-style transactions
7
|
|
Total
|
||||||||
|
in € m.
|
|
at amortized cost
5
|
|
at fair value
through PL
|
|
at fair value
through OCI
6
|
|
at amortized cost
|
|
at fair value
through PL
|
|
at fair value
through OCI
|
|
|
|
Europe
|
|
|
|
|
|
|
|
|
|
|
|
|
|
|
|
Of which:
|
|
|
|
|
|
|
|
|
|
|
|
|
|
|
|
Germany
|
|
|
|
|
|
|
|
|
|
|
|
|
|
|
|
United Kingdom
|
|
|
|
|
|
|
|
|
|
|
|
|
|
|
|
France
|
|
|
|
|
|
|
|
|
|
|
|
|
|
|
|
Luxembourg
|
|
|
|
|
|
|
|
|
|
|
|
|
|
|
|
Italy
|
|
|
|
|
|
|
|
|
|
|
|
|
|
|
|
Netherlands
|
|
|
|
|
|
|
|
|
|
|
|
|
|
|
|
Spain
|
|
|
|
|
|
|
|
|
|
|
|
|
|
|
|
Ireland
|
|
|
|
|
|
|
|
|
|
|
|
|
|
|
|
Switzerland
|
|
|
|
|
|
|
|
|
|
|
|
|
|
|
|
Poland
|
|
|
|
|
|
|
|
|
|
|
|
|
|
|
|
Belgium
|
|
|
|
|
|
|
|
|
|
|
|
|
|
|
|
Russian Federation⁸
|
|
|
|
|
|
|
|
|
|
|
|
|
|
|
|
Ukraine⁸
|
|
|
|
|
|
|
|
|
|
|
|
|
|
|
|
Other Europe⁸
,
¹⁰
|
|
|
|
|
|
|
|
|
|
|
|
|
|
|
|
North America
|
|
|
|
|
|
|
|
|
|
|
|
|
|
|
|
Of which:
|
|
|
|
|
|
|
|
|
|
|
|
|
|
|
|
U.S.
|
|
|
|
|
|
|
|
|
|
|
|
|
|
|
|
Cayman Islands
|
|
|
|
|
|
|
|
|
|
|
|
|
|
|
|
Canada
|
|
|
|
|
|
|
|
|
|
|
|
|
|
|
|
Other North America
|
|
|
|
|
|
|
|
|
|
|
|
|
|
|
|
Asia/Pacific
|
|
|
|
|
|
|
|
|
|
|
|
|
|
|
|
Of which:
|
|
|
|
|
|
|
|
|
|
|
|
|
|
|
|
Japan
|
|
|
|
|
|
|
|
|
|
|
|
|
|
|
|
Australia
|
|
|
|
|
|
|
|
|
|
|
|
|
|
|
|
India
|
|
|
|
|
|
|
|
|
|
|
|
|
|
|
|
China
|
|
|
|
|
|
|
|
|
|
|
|
|
|
|
|
Singapore
|
|
|
|
|
|
|
|
|
|
|
|
|
|
|
|
Hong Kong
|
|
|
|
|
|
|
|
|
|
|
|
|
|
|
|
Other Asia/Pacific
|
|
|
|
|
|
|
|
|
|
|
|
|
|
|
|
Other geographical areas
|
|
|
|
|
|
|
|
|
|
|
|
|
|
|
|
Total
|
|
|
|
|
|
|
|
|
|
|
|
|
|
|
|
|
|
|
|
|
|
|
|
|
|
|
|
|
|
|
1
Includes stage 3 and stage 3 POCI loans at amortized cost amounting to
€
12.4
billion
as of December 31, 2021.
2
Includes stage 3 and stage 3 POCI loans at fair value through OCI amounting to
€
28.1
million
as of December 31, 2021
3
Includes stage 3 and stage 3 POCI off-balance sheet exposure amounting to
€
2.6
billion
as of December 31, 2021
.
4
Includes the effect of netting agreements and cash collateral received where applicable. Excludes derivatives qualifying for hedge accounting.
5
Includes stage 3 and stage 3 POCI debt securities at amortized cost amounting to
€
368.2
million
as of December 31, 2021.
6
Includes stage 3 and stage 3 POCI debt securities at fair value through OCI amounting to
€
15.8
million
as of December 31, 2021.
7
Before reflection of collateral and limited to securities purchased under resale agreements and securities borrowed.
8
Thematic addition on back of the ongoing border conflict between the Russian Federation and Ukraine.
9
Ukraine trading loan exposure driven by financing, materially guaranteed by supranational development bank. Net exposure considering broader risk mitigation structure is deminimis
10
Other Europe includes Belarus with a total exposure of less than
€
2
million
.
|
|
|
Dec 31, 2020
|
||||||||||||
|
|
|
Loans
|
|
Off-balance sheet
|
|
OTC derivatives
|
||||||||
|
in € m.
|
|
at amortized cost
1
|
|
trading -
at fair value
through PL
|
|
Designated /
mandatory at
fair value
through PL
|
|
at fair value
through OCI
2
|
|
Revocable
and irrevo-
cable lending
commitments
3
|
|
Contingent
liabilities
|
|
at fair value
through PL
4
|
|
Europe
|
|
|
|
|
|
|
|
|
|
|
|
|
|
|
|
Of which:
|
|
|
|
|
|
|
|
|
|
|
|
|
|
|
|
Germany
|
|
|
|
|
|
|
|
|
|
|
|
|
|
|
|
United Kingdom
|
|
|
|
|
|
|
|
|
|
|
|
|
|
|
|
France
|
|
|
|
|
|
|
|
|
|
|
|
|
|
|
|
Luxembourg
|
|
|
|
|
|
|
|
|
|
|
|
|
|
|
|
Italy
|
|
|
|
|
|
|
|
|
|
|
|
|
|
|
|
Netherlands
|
|
|
|
|
|
|
|
|
|
|
|
|
|
|
|
Spain
|
|
|
|
|
|
|
|
|
|
|
|
|
|
|
|
Ireland
|
|
|
|
|
|
|
|
|
|
|
|
|
|
|
|
Switzerland
|
|
|
|
|
|
|
|
|
|
|
|
|
|
|
|
Poland
|
|
|
|
|
|
|
|
|
|
|
|
|
|
|
|
Belgium
|
|
|
|
|
|
|
|
|
|
|
|
|
|
|
|
Russian Federation⁸
|
|
|
|
|
|
|
|
|
|
|
|
|
|
|
|
Ukraine⁸
|
|
|
|
|
|
|
|
|
|
|
|
|
|
|
|
Other Europe⁸
|
|
|
|
|
|
|
|
|
|
|
|
|
|
|
|
North America
|
|
|
|
|
|
|
|
|
|
|
|
|
|
|
|
Of which:
|
|
|
|
|
|
|
|
|
|
|
|
|
|
|
|
U.S.
|
|
|
|
|
|
|
|
|
|
|
|
|
|
|
|
Cayman Islands
|
|
|
|
|
|
|
|
|
|
|
|
|
|
|
|
Canada
|
|
|
|
|
|
|
|
|
|
|
|
|
|
|
|
Other North America
|
|
|
|
|
|
|
|
|
|
|
|
|
|
|
|
Asia/Pacific
|
|
|
|
|
|
|
|
|
|
|
|
|
|
|
|
Of which:
|
|
|
|
|
|
|
|
|
|
|
|
|
|
|
|
Japan
|
|
|
|
|
|
|
|
|
|
|
|
|
|
|
|
Australia
|
|
|
|
|
|
|
|
|
|
|
|
|
|
|
|
India
|
|
|
|
|
|
|
|
|
|
|
|
|
|
|
|
China
|
|
|
|
|
|
|
|
|
|
|
|
|
|
|
|
Singapore
|
|
|
|
|
|
|
|
|
|
|
|
|
|
|
|
Hong Kong
|
|
|
|
|
|
|
|
|
|
|
|
|
|
|
|
Other Asia/Pacific
|
|
|
|
|
|
|
|
|
|
|
|
|
|
|
|
Other geographical areas
|
|
|
|
|
|
|
|
|
|
|
|
|
|
|
|
Total
|
|
|
|
|
|
|
|
|
|
|
|
|
|
|
|
|
|
|
|
|
|
|
|
|
|
|
|
|
|
|
|
|
|
Dec 31, 2020
|
||||||||||||
|
|
|
Debt Securities
|
|
Repo and repo-style transactions
7
|
|
Total
|
||||||||
|
in € m.
|
|
at amortized cost
5
|
|
at fair value
through PL
|
|
at fair value
through OCI
6
|
|
at amortized cost
|
|
at fair value
through PL
|
|
at fair value
through OCI
|
|
|
|
Europe
|
|
|
|
|
|
|
|
|
|
|
|
|
|
|
|
Of which:
|
|
|
|
|
|
|
|
|
|
|
|
|
|
|
|
Germany
|
|
|
|
|
|
|
|
|
|
|
|
|
|
|
|
United Kingdom
|
|
|
|
|
|
|
|
|
|
|
|
|
|
|
|
France
|
|
|
|
|
|
|
|
|
|
|
|
|
|
|
|
Luxembourg
|
|
|
|
|
|
|
|
|
|
|
|
|
|
|
|
Italy
|
|
|
|
|
|
|
|
|
|
|
|
|
|
|
|
Netherlands
|
|
|
|
|
|
|
|
|
|
|
|
|
|
|
|
Spain
|
|
|
|
|
|
|
|
|
|
|
|
|
|
|
|
Ireland
|
|
|
|
|
|
|
|
|
|
|
|
|
|
|
|
Switzerland
|
|
|
|
|
|
|
|
|
|
|
|
|
|
|
|
Poland
|
|
|
|
|
|
|
|
|
|
|
|
|
|
|
|
Belgium
|
|
|
|
|
|
|
|
|
|
|
|
|
|
|
|
Russian Federation⁸
|
|
|
|
|
|
|
|
|
|
|
|
|
|
|
|
Ukraine⁸
|
|
|
|
|
|
|
|
|
|
|
|
|
|
|
|
Other Europe⁸
|
|
|
|
|
|
|
|
|
|
|
|
|
|
|
|
North America
|
|
|
|
|
|
|
|
|
|
|
|
|
|
|
|
Of which:
|
|
|
|
|
|
|
|
|
|
|
|
|
|
|
|
U.S.
|
|
|
|
|
|
|
|
|
|
|
|
|
|
|
|
Cayman Islands
|
|
|
|
|
|
|
|
|
|
|
|
|
|
|
|
Canada
|
|
|
|
|
|
|
|
|
|
|
|
|
|
|
|
Other North America
|
|
|
|
|
|
|
|
|
|
|
|
|
|
|
|
Asia/Pacific
|
|
|
|
|
|
|
|
|
|
|
|
|
|
|
|
Of which:
|
|
|
|
|
|
|
|
|
|
|
|
|
|
|
|
Japan
|
|
|
|
|
|
|
|
|
|
|
|
|
|
|
|
Australia
|
|
|
|
|
|
|
|
|
|
|
|
|
|
|
|
India
|
|
|
|
|
|
|
|
|
|
|
|
|
|
|
|
China
|
|
|
|
|
|
|
|
|
|
|
|
|
|
|
|
Singapore
|
|
|
|
|
|
|
|
|
|
|
|
|
|
|
|
Hong Kong
|
|
|
|
|
|
|
|
|
|
|
|
|
|
|
|
Other Asia/Pacific
|
|
|
|
|
|
|
|
|
|
|
|
|
|
|
|
Other geographical areas
|
|
|
|
|
|
|
|
|
|
|
|
|
|
|
|
Total
|
|
|
|
|
|
|
|
|
|
|
|
|
|
|
|
|
|
|
|
|
|
|
|
|
|
|
|
|
|
|
1
Includes stage 3 and stage 3 POCI loans at amortized cost amounting to
€
11.9
billion
as of December 31, 2020.
2
Includes stage 3 and stage 3 POCI loans at fair value through OCI amounting to
€
90.3
million
as of December 31, 2020
3
Includes stage 3 and stage 3 POCI off-balance sheet exposure amounting to
€
2.6
billion
as of December 31, 2020.
4
Includes the effect of netting agreements and cash collateral received where applicable. Excludes derivatives qualifying for hedge accounting.
5
Includes stage 3 and stage 3 POCI debt securities at amortized cost amounting to
€
360.4
million
as of December 31, 2020.
6
Includes stage 3 and stage 3 POCI debt securities at fair value through OCI amounting to
€
15.1
million
as of December 31, 2020.
7
Before reflection of collateral and limited to securities purchased under resale agreements and securities borrowed.
8
Thematic addition on back of the ongoing border conflict between the Russian Federation and Ukraine
The tables above give an overview of our credit exposure by geographical region, allocated based on the counterparty’s country of domicile. Aforementioned domicile view does not have to be congruent with an internal risk based view applied elsewhere in this report.
Our largest concentration of credit risk within loans from a regional perspective is in our home market Germany, with a significant share in households, which includes the majority of our mortgage lending and home loan business.
Within OTC derivatives, tradable assets as well as repo and repo-style transactions, our largest concentrations from a regional perspective were in Europe and North America
.
Credit Exposure Classification
We also classify our credit exposure along our business divisions, which is in line with the divisionally aligned chief risk officer mandates.
In the section below, we show the credit exposure of the Corporate Bank and the Investment Bank together. In the subsequent section, we provide the credit exposure for the Private Bank.
143
|
|
Deutsche Bank
|
Operating and Financial Review
|
|
|
Annual Report 2021
|
Deutsche Bank Group
|
|
|
|
|
Corporate Bank and Investment Bank credit exposure
The tables below show our main Corporate Bank and Investment Bank Credit Exposure by product types and internal rating bands. Please refer to section "Measuring Credit Risk" for more details about our internal ratings.
Main Corporate Bank and Investment Bank credit exposure categories according to our internal creditworthiness categories of our counterparties – gross
|
|
|
|
|
Dec 31, 2021
|
||||||||||||
|
in € m.
(unless stated otherwise)
|
|
Loans
|
|
Off-balance sheet
|
|
OTC derivatives
|
||||||||||
|
Ratingband
|
|
Probability
of default in %
1
|
|
at amortized cost
|
|
trading -
at fair value
through PL
|
|
Designated /
mandatory at
fair value
through PL
|
|
at fair value
through OCI
|
|
Revocable
and irrevo-
cable lending
commitments
|
|
Contingent
liabilities
|
|
at fair value
through PL
2
|
|
iAAA–iAA
|
|
0.00 ≤ 0.04
|
|
23,066
|
|
130
|
|
13
|
|
159
|
|
26,153
|
|
3,545
|
|
4,008
|
|
iA
|
|
0.04 ≤ 0.11
|
|
41,041
|
|
138
|
|
202
|
|
1,151
|
|
53,557
|
|
27,267
|
|
4,503
|
|
iBBB
|
|
0.11 ≤ 0.5
|
|
61,562
|
|
789
|
|
192
|
|
1,967
|
|
54,600
|
|
14,362
|
|
2,710
|
|
iBB
|
|
0.5 ≤ 2.27
|
|
51,617
|
|
4,058
|
|
296
|
|
857
|
|
26,794
|
|
6,799
|
|
5,923
|
|
iB
|
|
2.27 ≤ 10.22
|
|
29,606
|
|
2,333
|
|
111
|
|
207
|
|
22,360
|
|
3,479
|
|
373
|
|
iCCC and below
|
|
10.22 ≤ 100
|
|
8,385
|
|
1,397
|
|
198
|
|
29
|
|
3,247
|
|
1,872
|
|
90
|
|
Total
|
|
|
|
215,276
|
|
8,845
|
|
1,013
|
|
4,370
|
|
186,711
|
|
57,324
|
|
17,606
|
|
|
|
|
|
|
|
|
|
|
|
|
|
|
|
|
|
|
|
|
|
|
|
Dec 31, 2021
|
||||||||||||
|
in € m.
(unless stated otherwise)
|
|
Debt Securities
|
|
Repo and repo-style transactions
|
|
|
||||||||||
|
Ratingband
|
|
Probability
of default in %
1
|
|
at amortized cost
|
|
at fair value
through PL
|
|
at fair value
through OCI
|
|
at amortized cost
|
|
at fair value
through PL
|
|
at fair value
through OCI
|
|
Total
|
|
iAAA–iAA
|
|
0.00 ≤ 0.04
|
|
1,253
|
|
49,214
|
|
0
|
|
473
|
|
35,615
|
|
−
|
|
143,629
|
|
iA
|
|
0.04 ≤ 0.11
|
|
1,433
|
|
11,698
|
|
108
|
|
1,127
|
|
17,831
|
|
−
|
|
160,056
|
|
iBBB
|
|
0.11 ≤ 0.5
|
|
439
|
|
11,786
|
|
90
|
|
2,035
|
|
9,144
|
|
−
|
|
159,678
|
|
iBB
|
|
0.5 ≤ 2.27
|
|
265
|
|
13,621
|
|
225
|
|
1,844
|
|
11,363
|
|
−
|
|
123,659
|
|
iB
|
|
2.27 ≤ 10.22
|
|
357
|
|
1,745
|
|
590
|
|
1,475
|
|
361
|
|
−
|
|
62,995
|
|
iCCC and below
|
|
10.22 ≤ 100
|
|
423
|
|
643
|
|
32
|
|
600
|
|
128
|
|
−
|
|
17,045
|
|
Total
|
|
|
|
4,171
|
|
88,707
|
|
1,045
|
|
7,554
|
|
74,441
|
|
−
|
|
667,062
|
|
|
|
|
|
|
|
|
|
|
|
|
|
|
|
|
|
|
1
Reflects the probability of default for a one year time horizon.
2
Includes the effect of netting agreements and cash collateral received where applicable.
Main Corporate Bank and Investment Bank credit exposure categories according to our internal creditworthiness categories of our counterparties – net
|
|
|
|
|
Dec 31, 2021¹
|
||||||||||||
|
in € m.
(unless stated otherwise)
|
|
Loans
|
|
Off-balance sheet
|
|
OTC derivatives
|
||||||||||
|
Ratingband
|
|
Probability
of default in %
2
|
|
at amortized cost
|
|
trading -
at fair value
through PL
|
|
Designated /
mandatory at
fair value
through PL
|
|
at fair value
through OCI
|
|
Revocable
and irrevo-
cable lending
commitments
|
|
Contingent
liabilities
|
|
at fair value
through PL
|
|
iAAA–iAA
|
|
0.00 ≤ 0.04
|
|
16,959
|
|
130
|
|
13
|
|
45
|
|
24,962
|
|
2,664
|
|
2,518
|
|
iA
|
|
0.04 ≤ 0.11
|
|
31,570
|
|
53
|
|
202
|
|
998
|
|
51,421
|
|
24,751
|
|
3,087
|
|
iBBB
|
|
0.11 ≤ 0.5
|
|
32,646
|
|
633
|
|
89
|
|
1,752
|
|
51,426
|
|
12,207
|
|
2,287
|
|
iBB
|
|
0.5 ≤ 2.27
|
|
26,315
|
|
2,451
|
|
208
|
|
435
|
|
24,316
|
|
5,343
|
|
5,843
|
|
iB
|
|
2.27 ≤ 10.22
|
|
10,221
|
|
1,551
|
|
45
|
|
167
|
|
21,138
|
|
2,236
|
|
370
|
|
iCCC and below
|
|
10.22 ≤ 100
|
|
4,336
|
|
961
|
|
67
|
|
29
|
|
3,079
|
|
1,095
|
|
90
|
|
Total
|
|
|
|
122,047
|
|
5,779
|
|
624
|
|
3,427
|
|
176,342
|
|
48,295
|
|
14,195
|
|
|
|
|
|
|
|
|
|
|
|
|
|
|
|
|
|
|
|
|
|
|
|
Dec 31, 2021¹
|
||||||||||||
|
in € m.
(unless stated otherwise)
|
|
Debt Securities
|
|
Repo and repo-style transactions
|
|
|
||||||||||
|
Ratingband
|
|
Probability
of default in %
2
|
|
at amortized cost
|
|
at fair value
through PL
|
|
at fair value
through OCI
|
|
at amortized cost
|
|
at fair value
through PL
|
|
at fair value
through OCI
|
|
Total
|
|
iAAA–iAA
|
|
0.00 ≤ 0.04
|
|
1,253
|
|
49,214
|
|
0
|
|
16
|
|
0
|
|
−
|
|
97,775
|
|
iA
|
|
0.04 ≤ 0.11
|
|
1,433
|
|
11,698
|
|
108
|
|
0
|
|
22
|
|
−
|
|
125,344
|
|
iBBB
|
|
0.11 ≤ 0.5
|
|
439
|
|
11,773
|
|
90
|
|
67
|
|
22
|
|
−
|
|
113,430
|
|
iBB
|
|
0.5 ≤ 2.27
|
|
260
|
|
13,583
|
|
225
|
|
14
|
|
259
|
|
−
|
|
79,252
|
|
iB
|
|
2.27 ≤ 10.22
|
|
334
|
|
1,745
|
|
590
|
|
0
|
|
0
|
|
−
|
|
38,397
|
|
iCCC and below
|
|
10.22 ≤ 100
|
|
361
|
|
621
|
|
32
|
|
0
|
|
0
|
|
−
|
|
10,672
|
|
Total
|
|
|
|
4,080
|
|
88,635
|
|
1,045
|
|
97
|
|
304
|
|
−
|
|
464,869
|
|
|
|
|
|
|
|
|
|
|
|
|
|
|
|
|
|
|
1
Net of eligible collateral, guarantees and hedges based on
IFRS
requirements.
2
Reflects the probability of default for a one year time horizon.
144
|
|
Deutsche Bank
|
Operating and Financial Review
|
|
|
Annual Report 2021
|
Deutsche Bank Group
|
|
|
|
|
The tables below show our main Corporate Bank and Investment Bank credit exposure for 2020 by product types and internal rating bands.
Main Corporate Bank and Investment Bank credit exposure categories according to our internal creditworthiness categories of our counterparties – gross
|
|
|
|
|
Dec 31, 2020
|
||||||||||||
|
in € m.
(unless stated otherwise)
|
|
Loans
|
|
Off-balance sheet
|
|
OTC derivatives
|
||||||||||
|
Ratingband
|
|
Probability
of default in %
1
|
|
at amortized cost
|
|
trading -
at fair value
through PL
|
|
Designated /
mandatory at
fair value
through PL
|
|
at fair value
through OCI
|
|
Revocable
and irrevo-
cable lending
commitments
|
|
Contingent
liabilities
|
|
at fair value
through PL
2
|
|
iAAA–iAA
|
|
0.00 ≤ 0.04
|
|
13,679
|
|
44
|
|
446
|
|
114
|
|
20,168
|
|
1,911
|
|
4,230
|
|
iA
|
|
0.04 ≤ 0.11
|
|
29,365
|
|
436
|
|
347
|
|
641
|
|
47,835
|
|
11,794
|
|
6,414
|
|
iBBB
|
|
0.11 ≤ 0.5
|
|
55,845
|
|
1,047
|
|
672
|
|
2,149
|
|
57,941
|
|
22,069
|
|
4,395
|
|
iBB
|
|
0.5 ≤ 2.27
|
|
48,063
|
|
2,470
|
|
500
|
|
1,458
|
|
26,476
|
|
5,566
|
|
3,202
|
|
iB
|
|
2.27 ≤ 10.22
|
|
26,885
|
|
1,813
|
|
76
|
|
160
|
|
18,789
|
|
2,864
|
|
4,477
|
|
iCCC and below
|
|
10.22 ≤ 100
|
|
9,962
|
|
1,177
|
|
361
|
|
92
|
|
4,535
|
|
1,978
|
|
113
|
|
Total
|
|
|
|
183,800
|
|
6,987
|
|
2,401
|
|
4,614
|
|
175,743
|
|
46,182
|
|
22,832
|
|
|
|
|
|
|
|
|
|
|
|
|
|
|
|
|
|
|
|
|
|
|
|
Dec 31, 2020
|
||||||||||||
|
in € m.
(unless stated otherwise)
|
|
Debt Securities
|
|
Repo and repo-style transactions
|
|
|
||||||||||
|
Ratingband
|
|
Probability
of default in %
1
|
|
at amortized cost
|
|
at fair value
through PL
|
|
at fair value
through OCI
|
|
at amortized cost
|
|
at fair value
through PL
|
|
at fair value
through OCI
|
|
Total
|
|
iAAA–iAA
|
|
0.00 ≤ 0.04
|
|
1,183
|
|
50,886
|
|
103
|
|
298
|
|
27,745
|
|
−
|
|
120,806
|
|
iA
|
|
0.04 ≤ 0.11
|
|
527
|
|
7,762
|
|
82
|
|
827
|
|
8,504
|
|
−
|
|
114,533
|
|
iBBB
|
|
0.11 ≤ 0.5
|
|
307
|
|
12,569
|
|
87
|
|
1,425
|
|
8,346
|
|
−
|
|
166,851
|
|
iBB
|
|
0.5 ≤ 2.27
|
|
174
|
|
13,062
|
|
400
|
|
2,239
|
|
15,004
|
|
−
|
|
118,616
|
|
iB
|
|
2.27 ≤ 10.22
|
|
239
|
|
1,607
|
|
293
|
|
2,311
|
|
375
|
|
−
|
|
59,889
|
|
iCCC and below
|
|
10.22 ≤ 100
|
|
382
|
|
762
|
|
15
|
|
600
|
|
0
|
|
−
|
|
19,978
|
|
Total
|
|
|
|
2,811
|
|
86,647
|
|
980
|
|
7,700
|
|
59,974
|
|
−
|
|
600,672
|
|
|
|
|
|
|
|
|
|
|
|
|
|
|
|
|
|
|
1
Reflects the probability of default for a one year time horizon.
2
Includes the effect of netting agreements and cash collateral received where applicable.
Main Corporate Bank and Investment Bank credit exposure categories according to our internal creditworthiness categories of our counterparties – net
|
|
|
|
|
Dec 31, 2020¹
|
||||||||||||
|
in € m.
(unless stated otherwise)
|
|
Loans
|
|
Off-balance sheet
|
|
OTC derivatives
|
||||||||||
|
Ratingband
|
|
Probability
of default in %
2
|
|
at amortized cost
|
|
trading -
at fair value
through PL
|
|
Designated /
mandatory at
fair value
through PL
|
|
at fair value
through OCI
|
|
Revocable
and irrevo-
cable lending
commitments
|
|
Contingent
liabilities
|
|
at fair value
through PL
|
|
iAAA–iAA
|
|
0.00 ≤ 0.04
|
|
8,684
|
|
44
|
|
446
|
|
0
|
|
19,088
|
|
1,618
|
|
3,381
|
|
iA
|
|
0.04 ≤ 0.11
|
|
22,618
|
|
131
|
|
347
|
|
621
|
|
46,384
|
|
9,837
|
|
4,957
|
|
iBBB
|
|
0.11 ≤ 0.5
|
|
31,266
|
|
889
|
|
625
|
|
1,602
|
|
54,626
|
|
19,365
|
|
4,190
|
|
iBB
|
|
0.5 ≤ 2.27
|
|
22,984
|
|
1,887
|
|
407
|
|
955
|
|
23,947
|
|
3,995
|
|
3,100
|
|
iB
|
|
2.27 ≤ 10.22
|
|
8,853
|
|
824
|
|
6
|
|
140
|
|
17,614
|
|
2,244
|
|
4,432
|
|
iCCC and below
|
|
10.22 ≤ 100
|
|
4,823
|
|
759
|
|
207
|
|
92
|
|
4,263
|
|
1,269
|
|
113
|
|
Total
|
|
|
|
99,228
|
|
4,534
|
|
2,038
|
|
3,410
|
|
165,922
|
|
38,330
|
|
20,175
|
|
|
|
|
|
|
|
|
|
|
|
|
|
|
|
|
|
|
|
|
|
|
|
Dec 31, 2020¹
|
||||||||||||
|
in € m.
(unless stated otherwise)
|
|
Debt Securities
|
|
Repo and repo-style transactions
|
|
|
||||||||||
|
Ratingband
|
|
Probability
of default in %
2
|
|
at amortized cost
|
|
at fair value
through PL
|
|
at fair value
through OCI
|
|
at amortized cost
|
|
at fair value
through PL
|
|
at fair value
through OCI
|
|
Total
|
|
iAAA–iAA
|
|
0.00 ≤ 0.04
|
|
1,183
|
|
50,886
|
|
103
|
|
0
|
|
27
|
|
−
|
|
85,460
|
|
iA
|
|
0.04 ≤ 0.11
|
|
527
|
|
7,762
|
|
82
|
|
0
|
|
1
|
|
−
|
|
93,268
|
|
iBBB
|
|
0.11 ≤ 0.5
|
|
307
|
|
12,569
|
|
87
|
|
23
|
|
3
|
|
−
|
|
125,551
|
|
iBB
|
|
0.5 ≤ 2.27
|
|
171
|
|
13,017
|
|
400
|
|
71
|
|
3
|
|
−
|
|
70,939
|
|
iB
|
|
2.27 ≤ 10.22
|
|
239
|
|
1,607
|
|
293
|
|
0
|
|
0
|
|
−
|
|
36,253
|
|
iCCC and below
|
|
10.22 ≤ 100
|
|
311
|
|
727
|
|
15
|
|
0
|
|
0
|
|
−
|
|
12,579
|
|
Total
|
|
|
|
2,737
|
|
86,567
|
|
980
|
|
95
|
|
34
|
|
−
|
|
424,049
|
|
|
|
|
|
|
|
|
|
|
|
|
|
|
|
|
|
|
1
Net of eligible collateral, guarantees and hedges based on
IFRS
requirements.
2
Reflects the probability of default for a one year time horizon.
145
|
|
Deutsche Bank
|
Operating and Financial Review
|
|
|
Annual Report 2021
|
Deutsche Bank Group
|
|
|
|
|
The above tables show an overall increase in our Corporate Bank and Investment Bank gross exposure in 2021 of € 66.4 billion or 11 %. Loans at amortized cost increased by € 31.5 billion mainly driven by growth across businesses as well as a large episodic financing that is expected to reverse in Q1’22. Off-balance sheet positions increased by € 22.1 billion mainly driven by new commitments and guarantees issued during the period. Repo and repo-style transactions increased by € 14.3 billion in the Investment Bank mainly driven by higher client activity, debt securities increased by € 3.5 billion. From a regional perspective, the increase was primarily attributable to counterparties domiciled in the United States, Germany, Switzerland, Cayman Islands, and France. These increases were partly offset by a decrease in OTC derivatives of € 5.2 billion mainly driven by interest rate products.
We use risk mitigation techniques as described above to optimize our Corporate Bank and Investment Bank credit exposures and reduce potential credit losses. The tables for “net” exposure discloses the development of our Corporate Bank and Investment Bank credit exposure’s net of collateral, guarantees and hedges.
SCL Risk Mitigation for Credit Exposure
Our Strategic Corporate Lending (“SCL”) unit helps mitigate the risk of our corporate credit exposures. The notional amount of SCL’s risk reduction activities decreased from € 34.0 billion as of December 31, 2020, to € 31.7 billion as of December 31, 2021.
As of year-end 2021, SCL mitigated the credit risk of € 27.0 billion of loans and lending-related commitments, through synthetic collateralized loan obligations supported predominantly by financial guarantees. This position totaled € 30.9 billion as of December 31, 2020.
SCL also held credit derivatives with an underlying notional amount of € 4.7 billion as of December 31, 2021. The position totaled € 3.1 billion as of December 31, 2020. The credit derivatives used for our portfolio management activities are accounted for at fair value.
Private Bank credit exposure
Private Bank credit exposure, credit exposure stage 3 and net credit costs
|
|
|
Total exposure
in € m.
|
|
of which loan book
in € m.
|
|
Credit exposure stage 3
in € m.
|
|
Net credit costs
as a % of total exposure
¹
|
||||||||
|
|
|
Dec 31, 2021
|
|
Dec 31, 2020
|
|
Dec 31, 2021
|
|
Dec 31, 2020
|
|
Dec 31, 2021
|
|
Dec 31, 2020
|
|
Dec 31, 2021
|
|
Dec 31, 2020
|
|
PB Germany
|
|
194,486
|
|
185,959
|
|
169,639
|
|
160,683
|
|
2,668
|
|
2,798
|
|
0.12%
|
|
0.17%
|
|
Consumer Finance
|
|
29,638
|
|
29,352
|
|
15,360
|
|
15,240
|
|
1,446
|
|
1,277
|
|
0.77%
|
|
0.77%
|
|
Mortgage
|
|
159,825
|
|
153,165
|
|
150,082
|
|
143,368
|
|
1,187
|
|
1,481
|
|
0.00%
|
|
0.06%
|
|
Business Finance
|
|
1,310
|
|
1,246
|
|
905
|
|
870
|
|
7
|
|
6
|
|
0.07%
|
|
0.15%
|
|
Other
|
|
3,713
|
|
2,196
|
|
3,291
|
|
1,206
|
|
27
|
|
35
|
|
0.01%
|
|
0.05%
|
|
International Private Bank
|
|
102,556
|
|
91,156
|
|
84,800
|
|
76,511
|
|
4,037
|
|
3,484
|
|
0.21%
|
|
0.43%
|
|
Consumer Finance
|
|
11,007
|
|
11,162
|
|
8,940
|
|
8,937
|
|
435
|
|
350
|
|
0.71%
|
|
1.50%
|
|
Mortgage
|
|
12,950
|
|
13,611
|
|
12,889
|
|
13,520
|
|
701
|
|
668
|
|
0.21%
|
|
(0.08%)
|
|
Business Finance
|
|
13,226
|
|
12,151
|
|
11,320
|
|
9,914
|
|
968
|
|
728
|
|
0.83%
|
|
1.16%
|
|
Wealth Management
|
|
64,553
|
|
53,928
|
|
51,570
|
|
44,072
|
|
1,933
|
|
1,739
|
|
0.00%
|
|
0.17%
|
|
Other
|
|
819
|
|
303
|
|
81
|
|
68
|
|
0
|
|
0
|
|
(0.01%)
|
|
1.41%
|
|
Total
|
|
297,041
|
|
277,115
|
|
254,439
|
|
237,194
|
|
6,705
|
|
6,282
|
|
0.15%
|
|
0.26%
|
|
|
|
|
|
|
|
|
|
|
|
|
|
|
|
|
|
|
1
Net credit costs for the twelve months period ended at the respective balance sheet date divided by the total exposure at that balance sheet date.
2
Net credit costs as a % of total exposures in line Other for International Private Bank for 2020 have been updated.
Consumer Finance is divided into personal instalment loans, credit lines and credit cards. Consumer Finance business is uncollateralized, loan risk depends on client quality. Various lending requirements are stipulated, including (but not limited to) client rating, maximum loan amounts and maximum tenors, and are adapted to regional conditions and/or circumstances of the borrower (i.e., for consumer loans a maximum loan amount taking into account customer net income). Given the largely homogeneous nature of this portfolio, counterparty credit-worthiness and ratings are predominately derived by utilizing an automated decision engine.
146
|
|
Deutsche Bank
|
Operating and Financial Review
|
|
|
Annual Report 2021
|
Deutsche Bank Group
|
|
|
|
|
Mortgage business is the financing of residential properties (primarily owner-occupied) sold by various business channels in Europe, primarily in Germany but also in Spain and Italy. The level of credit risk of the mortgage loan portfolio is determined by assessing the quality of the client and the underlying collateral. The loan amounts are generally larger than Consumer Finance loans and they are extended for longer time horizons. Based on our underwriting criteria and processes and the diversified portfolio (customers/properties) with respective collateralization, the mortgage portfolio is categorized as lower risk, while consumer finance is categorized as high risk.
Business Finance represents credit products for small businesses, SME up to large corporates. Products range from current accounts and credit lines to investment loans or revolving facilities, factoring, leasing and derivatives. Smaller clients below a turnover of € 2.5 million are limited to current accounts and loans. Clients are located primarily in Italy and Spain, but credit can also be extended to subsidiaries abroad, mostly in Europe.
Wealth Management offers customized wealth management solutions and private banking services including discretionary portfolio management and traditional and alternative investment solutions, complemented by structured risk management, wealth planning, lending and family office services for wealth, high-net-worth (HNW) and ultra-high-net-worth (UHNW) individuals and family offices. Wealth Management’s total exposure is divided into Lombard Lending (against readily marketable liquid collateral / securities) and Structured Lending (against less liquid collateral). While the level of credit risk for the Lombard portfolio is determined by assessing the quality of the underlying collateral, the level of credit risk for the structured portfolio is determined by assessing both the quality of the client and the collateral. Products range from secured Lombard and mortgage loans to current accounts (Europe only), credit lines and other loans; to a lesser extent derivatives and contingencies. Clients are located globally.
PB mortgage loan-to-value
1
|
|
|
Dec 31, 2021
|
|
Dec 31, 2020
|
|
≤ 50 %
|
|
64 %
|
|
65 %
|
|
50 ≤ 70 %
|
|
17 %
|
|
16 %
|
|
70 ≤ 90 %
|
|
10 %
|
|
10 %
|
|
90 ≤ 100 %
|
|
3 %
|
|
3 %
|
|
100 ≤ 110 %
|
|
2 %
|
|
2 %
|
|
110 ≤ 130 %
|
|
2 %
|
|
2 %
|
|
130 %
|
|
2 %
|
|
1 %
|
|
|
|
|
|
|
1
When assigning the exposure to the corresponding LTV buckets, the exposure amounts are distributed according to their relative share of the underlying assessed real estate value.
The LTV expresses the amount of exposure as a percentage of the underlying real estate value.
Our LTV ratios are calculated using the total exposure divided by the current determined value of the respective properties. These values are monitored and updated if necessary on a regular basis. The exposure of transactions that are additionally backed by liquid collateral is reduced by the respective collateral values, whereas any prior charges increase the corresponding total exposure. The LTV calculation includes exposure which is secured by real estate collateral. Any mortgage lending exposure that is collateralized exclusively by any other type of collateral is not included in the LTV calculation.
The creditor’s creditworthiness, the LTV and the quality of collateral is an integral part of our risk management when originating loans and when monitoring and steering our credit risks. In general, we are willing to accept higher LTV’s, the better the creditor’s creditworthiness is. Nevertheless, restrictions of LTV apply e.g. for countries with negative economic outlook or expected declines of real estate values.
As of December 31, 2021, 64 % of our exposure related to the mortgage lending portfolio had a LTV ratio below or equal to 50 %, slightly lower compared to the prior year.
147
|
|
Deutsche Bank
|
Operating and Financial Review
|
|
|
Annual Report 2021
|
Deutsche Bank Group
|
|
|
|
|
Credit Exposure from Derivatives
All exchange traded derivatives are cleared through central counterparties (“CCPs”), the rules and regulations of which provide for daily margining of all current and future credit risk positions emerging out of such transactions. To the extent possible, we also use CCP services for OTC derivative transactions (“OTC clearing”); we thereby benefit from the credit risk mitigation achieved through the CCP’s settlement system.
The Dodd-Frank Act provides for an extensive framework for the regulation of OTC derivatives, including mandatory clearing, platform trading and transaction reporting of certain OTC derivatives, as well as rules regarding registration , capital, margin, business conduct standards, recordkeeping and other requirements for swap dealers, security-based swap dealers, major swap participants and major security-based swap participants. The Dodd-Frank Act and related CFTC rules require OTC clearing in the United States for certain standardized OTC derivative transactions, including certain interest rate swaps and index credit default swaps. Margin requirements for non-cleared derivative transactions in the US started in September 2016. The European Regulation (EU) No 648/2012 on OTC Derivatives, Central Counterparties and Trade Repositories (“EMIR”) introduced a number of risk mitigation techniques for non-centrally cleared OTC derivatives in 2013 and the reporting of OTC and exchange traded derivatives in 2014. Mandatory clearing of certain standardized OTC derivatives transactions in the EU began in June 2016, and margin requirements for un-cleared OTC derivative transactions in the EU started in February 2017. Deutsche Bank implemented the exchange of both initial and variation margin in the EU from February 2017 for the first category of counterparties subject to the EMIR margin for un-cleared derivatives requirements.
The CFTC has adopted rules implementing the most significant provisions of the Dodd-Frank Act. More recently, in September 2020, the CFTC issued a final rule on the cross-border application of U.S. swap rules, which builds on, and in some cases supersedes the CFTC’s cross-border guidance from 2013 and related no-action relief letters. In October 2020, also pursuant to the Dodd-Frank Act, the CFTC finalized regulations to impose position limits on certain commodities and economically equivalent swaps, futures and options.
The SEC has also finalized rules regarding registration, trade reporting, capital, margin, risk mitigation techniques, business conduct standards, trade acknowledgement and verification, recordkeeping and financial reporting, and cross-border requirements for security-based swap dealers and major security-based swap participants. Compliance with these requirements was generally required as of November 2021.
Finally, U.S. prudential regulators (the Federal Reserve, the FDIC, the Office of the Comptroller of the Currency, the Farm Credit Administration and the Federal Housing Finance Agency) have adopted final rules establishing margin requirements for non-cleared swaps and security-based swaps that are applicable to swap dealers and security-based swap dealers that are subject to U.S. prudential regulations (such as Deutsche Bank) in lieu of the CFTC’s and the SEC’s margin rules. Deutsche Bank implemented the exchange of both initial and variation margin for uncleared derivatives in the U.S. from September 2016, for the first category of counterparties subject to the U.S. prudential regulators’ margin requirements. Additional initial margin requirements for smaller counterparties are in the process of being phased in from September 2017 through September 2022, with the relevant compliance dates depending in each case on the transactional volume of the parties and their affiliates. The U.S. prudential regulators delayed the initial margin compliance date from September 2020 until September 2021 or September 2022 for swaps with certain counterparties with lower levels of transactional volume as a result of the impact of COVID-19.
148
|
|
Deutsche Bank
|
Operating and Financial Review
|
|
|
Annual Report 2021
|
Deutsche Bank Group
|
|
|
|
|
The following table shows a breakdown of notional amounts and gross market values for assets and liabilities of exchange traded and OTC derivative transactions on the basis of clearing channel.
Notional amounts of derivatives on basis of clearing channel and type of derivative
|
|
|
Dec 31, 2021
|
||||||||||||
|
|
|
Notional amount maturity distribution
|
|
|
|
|
|
|
||||||
|
in € m.
|
|
Within 1 year
|
|
1 and
≤ 5 years
|
|
After 5 years
|
|
Total
|
|
Positive
market
value
|
|
Negative
market
value
|
|
Net
market
value
|
|
Interest rate related:
|
|
|
|
|
|
|
|
|
|
|
|
|
|
|
|
OTC
|
|
13,625,153
|
|
10,672,998
|
|
6,717,198
|
|
31,015,349
|
|
167,037
|
|
154,392
|
|
12,645
|
|
Bilateral (Amt)
|
|
1,541,797
|
|
1,976,392
|
|
1,542,479
|
|
5,060,668
|
|
156,247
|
|
143,526
|
|
12,721
|
|
CCP (Amt)
|
|
12,083,356
|
|
8,696,606
|
|
5,174,718
|
|
25,954,681
|
|
10,790
|
|
10,865
|
|
(76)
|
|
Exchange-traded
|
|
730,798
|
|
286,032
|
|
514
|
|
1,017,344
|
|
174
|
|
131
|
|
43
|
|
Total Interest rate related
|
|
14,355,951
|
|
10,959,030
|
|
6,717,712
|
|
32,032,693
|
|
167,211
|
|
154,523
|
|
12,688
|
|
Currency related:
|
|
|
|
|
|
|
|
|
|
|
|
|
|
|
|
OTC
|
|
5,323,845
|
|
847,188
|
|
420,701
|
|
6,591,734
|
|
108,030
|
|
108,282
|
|
(252)
|
|
Bilateral (Amt)
|
|
5,220,578
|
|
843,099
|
|
420,511
|
|
6,484,189
|
|
107,244
|
|
107,347
|
|
(103)
|
|
CCP (Amt)
|
|
103,267
|
|
4,088
|
|
190
|
|
107,545
|
|
786
|
|
934
|
|
(148)
|
|
Exchange-traded
|
|
20,765
|
|
0
|
|
0
|
|
20,765
|
|
2
|
|
8
|
|
(6)
|
|
Total Currency related
|
|
5,344,610
|
|
847,188
|
|
420,701
|
|
6,612,499
|
|
108,032
|
|
108,289
|
|
(258)
|
|
Equity/index related:
|
|
|
|
|
|
|
|
|
|
|
|
|
|
|
|
OTC
|
|
25,341
|
|
9,272
|
|
2,881
|
|
37,493
|
|
5,595
|
|
3,666
|
|
1,929
|
|
Bilateral (Amt)
|
|
25,341
|
|
9,272
|
|
2,881
|
|
37,493
|
|
5,595
|
|
3,666
|
|
1,929
|
|
CCP (Amt)
|
|
0
|
|
0
|
|
0
|
|
0
|
|
0
|
|
0
|
|
0
|
|
Exchange-traded
|
|
184,194
|
|
44,141
|
|
2,286
|
|
230,621
|
|
3,455
|
|
4,723
|
|
(1,267)
|
|
Total Equity/index related
|
|
209,535
|
|
53,413
|
|
5,167
|
|
268,115
|
|
9,050
|
|
8,388
|
|
661
|
|
Credit derivatives related
|
|
|
|
|
|
|
|
|
|
|
|
|
|
|
|
OTC
|
|
129,185
|
|
823,005
|
|
85,102
|
|
1,037,292
|
|
15,611
|
|
16,359
|
|
(748)
|
|
Bilateral (Amt)
|
|
78,553
|
|
71,414
|
|
34,561
|
|
184,529
|
|
2,102
|
|
2,466
|
|
(364)
|
|
CCP (Amt)
|
|
50,632
|
|
751,591
|
|
50,540
|
|
852,763
|
|
13,509
|
|
13,892
|
|
(384)
|
|
Exchange-traded
|
|
0
|
|
0
|
|
0
|
|
0
|
|
0
|
|
0
|
|
0
|
|
Total Credit derivatives related
|
|
129,185
|
|
823,005
|
|
85,102
|
|
1,037,292
|
|
15,611
|
|
16,359
|
|
(748)
|
|
Commodity related:
|
|
|
|
|
|
|
|
|
|
|
|
|
|
|
|
OTC
|
|
2,764
|
|
3,419
|
|
1,421
|
|
7,605
|
|
105
|
|
107
|
|
(2)
|
|
Bilateral (Amt)
|
|
2,764
|
|
3,419
|
|
1,421
|
|
7,605
|
|
105
|
|
107
|
|
(2)
|
|
CCP (Amt)
|
|
0
|
|
0
|
|
0
|
|
0
|
|
0
|
|
0
|
|
0
|
|
Exchange-traded
|
|
27,241
|
|
1,356
|
|
0
|
|
28,598
|
|
218
|
|
225
|
|
(6)
|
|
Total Commodity related
|
|
30,006
|
|
4,776
|
|
1,421
|
|
36,203
|
|
323
|
|
332
|
|
(8)
|
|
Other:
|
|
|
|
|
|
|
|
|
|
|
|
|
|
|
|
OTC
|
|
40,047
|
|
3,565
|
|
157
|
|
43,769
|
|
606
|
|
675
|
|
(69)
|
|
Bilateral (Amt)
|
|
40,047
|
|
3,565
|
|
157
|
|
43,769
|
|
606
|
|
675
|
|
(69)
|
|
CCP (Amt)
|
|
0
|
|
0
|
|
0
|
|
0
|
|
0
|
|
0
|
|
0
|
|
Exchange-traded
|
|
8,786
|
|
186
|
|
0
|
|
8,971
|
|
5
|
|
9
|
|
(5)
|
|
Total Other
|
|
48,832
|
|
3,751
|
|
157
|
|
52,741
|
|
610
|
|
684
|
|
(74)
|
|
Total OTC business
|
|
19,146,335
|
|
12,359,447
|
|
7,227,460
|
|
38,733,243
|
|
296,983
|
|
283,480
|
|
13,503
|
|
Total bilateral business
|
|
6,909,080
|
|
2,907,161
|
|
2,002,011
|
|
11,818,253
|
|
271,899
|
|
257,787
|
|
14,111
|
|
Total CCP business
|
|
12,237,255
|
|
9,452,286
|
|
5,225,448
|
|
26,914,990
|
|
25,084
|
|
25,692
|
|
(608)
|
|
Total exchange-traded business
|
|
971,784
|
|
331,716
|
|
2,800
|
|
1,306,300
|
|
3,854
|
|
5,095
|
|
(1,241)
|
|
Total
|
|
20,118,119
|
|
12,691,163
|
|
7,230,260
|
|
40,039,542
|
|
300,837
|
|
288,575
|
|
12,262
|
|
Positive market values after netting
and cash collateral received
|
|
−
|
|
−
|
|
−
|
|
−
|
|
25,518
|
|
−
|
|
−
|
|
|
|
|
|
|
|
|
|
|
|
|
|
|
|
|
149
|
|
Deutsche Bank
|
Operating and Financial Review
|
|
|
Annual Report 2021
|
Deutsche Bank Group
|
|
|
|
|
|
|
|
Dec 31, 2020
|
||||||||||||
|
|
|
Notional amount maturity distribution
|
|
|
|
|
|
|
||||||
|
in € m.
|
|
Within 1 year
|
|
1 and
≤ 5 years
|
|
After 5 years
|
|
Total
|
|
Positive
market
value
|
|
Negative
market
value
|
|
Net
market
value
|
|
Interest rate related:
|
|
|
|
|
|
|
|
|
|
|
|
|
|
|
|
OTC
|
|
11,299,988
|
|
8,076,426
|
|
5,241,008
|
|
24,617,422
|
|
230,512
|
|
215,795
|
|
14,717
|
|
Bilateral (Amt)
|
|
1,476,276
|
|
1,977,542
|
|
1,598,819
|
|
5,052,637
|
|
220,704
|
|
206,192
|
|
14,512
|
|
CCP (Amt)
|
|
9,823,712
|
|
6,098,884
|
|
3,642,189
|
|
19,564,785
|
|
9,808
|
|
9,602
|
|
206
|
|
Exchange-traded
|
|
605,924
|
|
215,611
|
|
66
|
|
821,601
|
|
347
|
|
154
|
|
193
|
|
Total Interest rate related
|
|
11,905,912
|
|
8,292,037
|
|
5,241,074
|
|
25,439,023
|
|
230,859
|
|
215,948
|
|
14,911
|
|
Currency related:
|
|
|
|
|
|
|
|
|
|
|
|
|
|
|
|
OTC
|
|
4,351,809
|
|
791,671
|
|
401,111
|
|
5,544,590
|
|
91,241
|
|
87,177
|
|
4,063
|
|
Bilateral (Amt)
|
|
4,255,560
|
|
788,132
|
|
401,012
|
|
5,444,704
|
|
90,297
|
|
85,830
|
|
4,466
|
|
CCP (Amt)
|
|
96,249
|
|
3,539
|
|
98
|
|
99,886
|
|
944
|
|
1,347
|
|
(403)
|
|
Exchange-traded
|
|
43,601
|
|
8
|
|
0
|
|
43,608
|
|
5
|
|
24
|
|
(19)
|
|
Total Currency related
|
|
4,395,409
|
|
791,679
|
|
401,111
|
|
5,588,199
|
|
91,246
|
|
87,202
|
|
4,044
|
|
Equity/index related:
|
|
|
|
|
|
|
|
|
|
|
|
|
|
|
|
OTC
|
|
28,938
|
|
32,164
|
|
7,186
|
|
68,288
|
|
5,700
|
|
5,692
|
|
8
|
|
Bilateral (Amt)
|
|
28,938
|
|
32,164
|
|
7,186
|
|
68,288
|
|
5,700
|
|
5,692
|
|
8
|
|
CCP (Amt)
|
|
0
|
|
0
|
|
0
|
|
0
|
|
0
|
|
0
|
|
0
|
|
Exchange-traded
|
|
126,825
|
|
36,818
|
|
1,634
|
|
165,277
|
|
3,772
|
|
4,902
|
|
(1,130)
|
|
Total Equity/index related
|
|
155,763
|
|
68,982
|
|
8,821
|
|
233,565
|
|
9,473
|
|
10,594
|
|
(1,122)
|
|
Credit derivatives related
|
|
|
|
|
|
|
|
|
|
|
|
|
|
|
|
OTC
|
|
61,552
|
|
689,031
|
|
86,593
|
|
837,176
|
|
13,557
|
|
13,272
|
|
285
|
|
Bilateral (Amt)
|
|
23,672
|
|
124,373
|
|
32,647
|
|
180,692
|
|
3,043
|
|
2,628
|
|
415
|
|
CCP (Amt)
|
|
37,880
|
|
564,658
|
|
53,947
|
|
656,484
|
|
10,515
|
|
10,645
|
|
(130)
|
|
Exchange-traded
|
|
0
|
|
0
|
|
0
|
|
0
|
|
0
|
|
0
|
|
0
|
|
Total Credit derivatives related
|
|
61,552
|
|
689,031
|
|
86,593
|
|
837,176
|
|
13,557
|
|
13,272
|
|
285
|
|
Commodity related:
|
|
|
|
|
|
|
|
|
|
|
|
|
|
|
|
OTC
|
|
3,716
|
|
2,857
|
|
1,341
|
|
7,913
|
|
142
|
|
993
|
|
(851)
|
|
Bilateral (Amt)
|
|
3,716
|
|
2,857
|
|
1,341
|
|
7,913
|
|
138
|
|
661
|
|
(522)
|
|
CCP (Amt)
|
|
0
|
|
0
|
|
0
|
|
0
|
|
4
|
|
332
|
|
(328)
|
|
Exchange-traded
|
|
15,446
|
|
744
|
|
0
|
|
16,190
|
|
409
|
|
55
|
|
353
|
|
Total Commodity related
|
|
19,162
|
|
3,600
|
|
1,341
|
|
24,103
|
|
551
|
|
1,048
|
|
(497)
|
|
Other:
|
|
|
|
|
|
|
|
|
|
|
|
|
|
|
|
OTC
|
|
376,256
|
|
3,438
|
|
154
|
|
379,848
|
|
1,043
|
|
936
|
|
108
|
|
Bilateral (Amt)
|
|
376,256
|
|
3,438
|
|
154
|
|
379,848
|
|
1,043
|
|
936
|
|
108
|
|
CCP (Amt)
|
|
0
|
|
0
|
|
0
|
|
0
|
|
0
|
|
0
|
|
0
|
|
Exchange-traded
|
|
9,411
|
|
0
|
|
0
|
|
9,411
|
|
29
|
|
53
|
|
(24)
|
|
Total Other
|
|
385,667
|
|
3,438
|
|
154
|
|
389,259
|
|
1,072
|
|
989
|
|
84
|
|
Total OTC business
|
|
16,122,259
|
|
9,595,586
|
|
5,737,393
|
|
31,455,237
|
|
342,196
|
|
323,866
|
|
18,331
|
|
Total bilateral business
|
|
6,164,418
|
|
2,928,505
|
|
2,041,159
|
|
11,134,082
|
|
320,925
|
|
301,939
|
|
18,986
|
|
Total CCP business
|
|
9,957,840
|
|
6,667,081
|
|
3,696,234
|
|
20,321,155
|
|
21,271
|
|
21,926
|
|
(656)
|
|
Total exchange-traded business
|
|
801,207
|
|
253,181
|
|
1,701
|
|
1,056,088
|
|
4,562
|
|
5,188
|
|
(626)
|
|
Total
|
|
16,923,465
|
|
9,848,767
|
|
5,739,094
|
|
32,511,325
|
|
346,758
|
|
329,054
|
|
17,704
|
|
Positive market values after netting
and cash collateral received
|
|
−
|
|
−
|
|
−
|
|
−
|
|
35,161
|
|
−
|
|
−
|
|
|
|
|
|
|
|
|
|
|
|
|
|
|
|
|
Equity Exposure
The table below presents the carrying values of our equity investments according to IFRS definition split by trading and nontrading for the respective reporting dates. We manage our respective positions within our market risk and other appropriate risk frameworks.
Composition of our Equity Exposure
|
in € m.
|
|
Dec 31, 2021
|
|
Dec 31, 2020
|
|
Trading Equities
|
|
5,094
|
|
11,769
|
|
Nontrading Equities¹
|
|
2,644
|
|
2,375
|
|
Total Equity Exposure
|
|
7,739
|
|
14,145
|
|
|
|
|
|
|
1
Includes equity investment funds amounting to € 87 million as of December 31, 2021 and € 291 million as of December 31, 2020.
As of December 31, 2021, our trading equities exposure was mainly composed of € 4.3 billion from Investment Bank and € 0.5 billion from Capital Release Unit activities. Overall trading equities decreased by € 6.7 billion year on year driven mainly by unwinding of trades in the Equities business.
150
|
|
Deutsche Bank
|
Operating and Financial Review
|
|
|
Annual Report 2021
|
Deutsche Bank Group
|
|
|
|
|
Trading Market Risk Exposures
Value-at-Risk Metrics of Trading Units of Deutsche Bank Group
The tables and graph below present the Historic Simulation value-at-risk metrics calculated with a 99 % confidence level and a one-day holding period for our trading units.
Value-at-Risk of our Trading Units by Risk Type¹
|
|
|
Total
|
|
Diversification
effect
|
|
Interest rate
risk
|
|
Credit spread
risk
|
|
Equity price
risk
|
|
Foreign exchange
risk²
|
|
Commodity price
risk
|
||||||||||||||
|
in € m.
|
|
2021
|
|
2020
|
|
2021
|
|
2020
|
|
2021
|
|
2020
|
|
2021
|
|
2020
|
|
2021
|
|
2020
|
|
2021
|
|
2020
|
|
2021
|
|
2020
|
|
Average
|
|
37.5
|
|
58.9
|
|
(37.2)
|
|
(44.0)
|
|
23.1
|
|
17.9
|
|
27.9
|
|
53.6
|
|
13.0
|
|
15.5
|
|
9.5
|
|
13.3
|
|
1.1
|
|
2.7
|
|
Maximum
|
|
69.0
|
|
133.3
|
|
(21.0)
|
|
(10.2)
|
|
38.5
|
|
36.3
|
|
60.3
|
|
117.1
|
|
20.1
|
|
30.8
|
|
25.2
|
|
32.3
|
|
7.9
|
|
8.8
|
|
Minimum
|
|
27.7
|
|
25.6
|
|
(76.9)
|
|
(84.4)
|
|
11.3
|
|
8.1
|
|
17.5
|
|
17.9
|
|
6.8
|
|
5.3
|
|
4.4
|
|
4.5
|
|
0.3
|
|
0.4
|
|
Period-end
|
|
|
|
|
|
(
|
|
(
|
|
|
|
|
|
|
|
|
|
|
|
|
|
|
|
|
|
|
|
|
|
|
|
|
|
|
|
|
|
|
|
|
|
|
|
|
|
|
|
|
|
|
|
|
|
|
|
|
|
|
1
Figures for 2021 as of December 31, 2021. Figures for 2020 as of December 31, 2020.
2
Includes value-at-risk from gold and other precious metal positions.
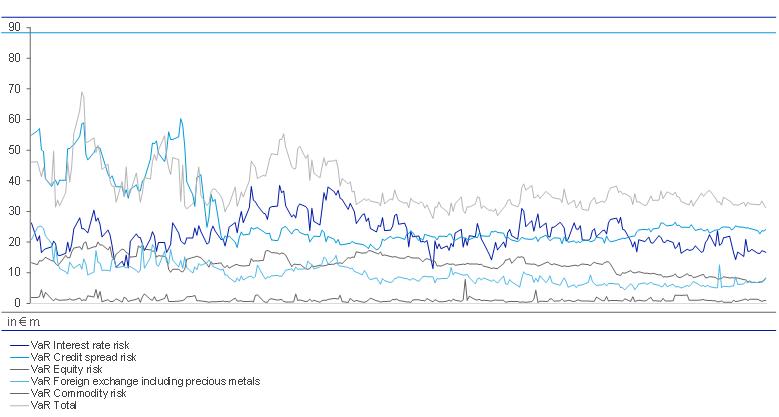
Development of historic simulation value-at-risk by risk types in 2021
The average value-at-risk over 2021 was € 37.5 million, which decreased € 21 million (-36 %) compared to the average for 2020, driven by decreases across risk classes from COVID-19 related market volatility impacts rolling out of the value-at-risk window.
For regulatory reporting purposes, the incremental risk charge for the respective reporting dates represents the higher of the spot value at the reporting dates, and their preceding 12-week average calculation
.
151
|
|
Deutsche Bank
|
Operating and Financial Review
|
|
|
Annual Report 2021
|
Deutsche Bank Group
|
|
|
|
|
Average, Maximum and Minimum Incremental Risk Charge of Trading Units (with a 99.9 % confidence level and one-year capital horizon)
1,2,3,
|
|
|
Total
|
|
Credit Trading
|
|
Core Rates
|
|
Emerging Markets
|
|
Other
4
|
|
||||||||||
|
in € m.
|
|
2021
|
|
2020
|
|
2021
|
|
2020
|
|
2021
|
|
2020
|
|
2021
|
|
2020
|
|
2021
|
|
2020
|
|
|
Average
|
|
436.6
|
|
591.4
|
|
118.1
|
|
100.2
|
|
211.4
|
|
347.4
|
|
188.3
|
|
242.6
|
|
(81.2)
|
|
(98.7)
|
|
|
Maximum
|
|
604.1
|
|
688.8
|
|
154.6
|
|
147.4
|
|
574.5
|
|
631.6
|
|
267.9
|
|
324.9
|
|
59.1
|
|
(70.0)
|
|
|
Minimum
|
|
292.5
|
|
537.3
|
|
62.5
|
|
50.0
|
|
60.1
|
|
263.1
|
|
84.4
|
|
62.8
|
|
(224.9)
|
|
(147.6)
|
|
|
Period-end
|
|
|
|
|
|
|
|
|
|
|
|
|
|
|
|
|
|
(
|
|
(
|
|
|
|
|
|
|
|
|
|
|
|
|
|
|
|
|
|
|
|
|
|
|
|
|
1
Amounts show the bands within which the values fluctuated during the 12-weeks preceding December 31, 2021 and December 31, 2020, respectively
.
2
Business line breakdowns have been updated for 2021 reporting to better reflect the current business structure.
3
All liquidity horizons are set to 12 months.
4
Other includes Capital Release Unit.
The incremental risk charge as at the end of 2021 was € 293 million, a decrease of € 268 million (-48 %) compared with year end 2020. The average of the incremental risk charge as at the end of 2021 was € 437 million and thus € 155 million (-26 %) lower compared with the average for the period ended December 31, 2020. The decrease in incremental risk charge for 2021 was driven by reduction in European sovereign bond exposures when compared to 2020.
Results of Regulatory Backtesting of Trading Market Risk
In 2021 we observed 1 global outlier under the Historical Simulation model, where our loss on a buy-and-hold basis exceeded the value-at-risk of our Trading Books, compared with seven outliers in 2020. The outlier was driven by the significant market stress experienced on China real estate exposures. Also, there were two Actual Backtesting outliers during 2021, which compares the VaR to Total Income less Fees Commissions. One of the Actual Backtesting outliers was driven by market stress on China real estate exposures while the second outlier was due to loss in Investment Bank from an event risk which is outside the scope of value-at-risk.
Based on the backtesting results, our analysis of the underlying reasons for outliers and enhancements included in our value-at-risk methodology we continue to believe that our value-at-risk model will remain an appropriate measure for our trading market risk under normal market conditions. The following graph shows the trading units daily buy-and-hold income in comparison to the value-at-risk as of the close of the previous business day for the trading days of the reporting period. The value-at-risk is presented in negative amounts to visually compare the estimated potential loss of our trading positions with the buy and hold income. Figures are shown in millions of euro. The chart shows that our trading units achieved a positive buy and hold income for 48 % of the trading days in 2021 (versus 60 % in 2020), as well as displaying the global outliers experienced in 2021.
The capital requirements for the value-at-risk model, for which the backtesting results are shown here, accounts for 5.6 % of the total capital requirement for the Group.
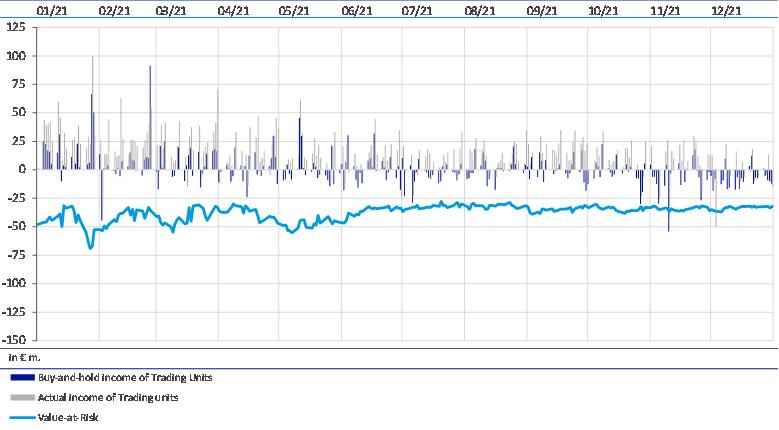
EU MR4 – Comparison of VAR estimates with gains/losses
152
|
|
Deutsche Bank
|
Operating and Financial Review
|
|
|
Annual Report 2021
|
Deutsche Bank Group
|
|
|
|
|
Daily Income of our Trading Units
The following histogram shows the distribution of daily income of our trading units. Daily income is defined as total income which consists of new trades, fees commissions, buy hold income, reserves, carry and other income. It displays the number of trading days on which we reached each level of trading income shown on the horizontal axis in millions of euro.
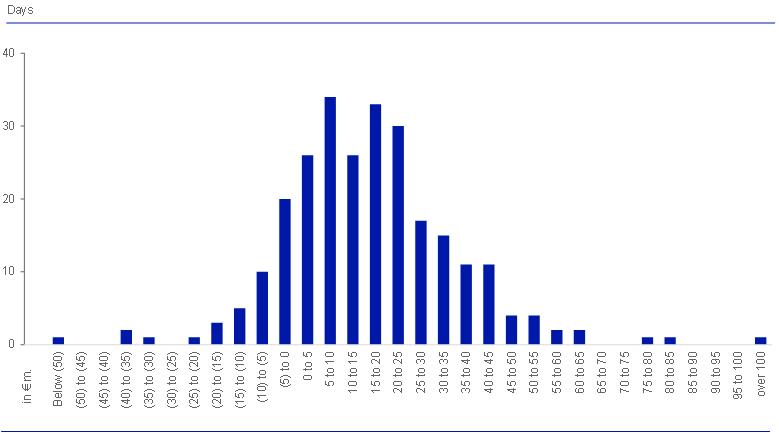
Distribution of daily income of our trading units in 2021
Our trading units achieved a positive revenue for 84 % of the trading days in 2021 compared with 90 % in the full year 2020.
153
|
|
Deutsche Bank
|
Operating and Financial Review
|
|
|
Annual Report 2021
|
Deutsche Bank Group
|
|
|
|
|
Nontrading Market Risk Exposures
Economic Capital Usage for Nontrading Market Risk
The following table shows the Nontrading Market Risk economic capital usage by risk type
:
Economic Capital Usage by risk type.
|
|
|
Economic capital usage
|
||
|
in € m.
|
|
Dec 31, 2021
|
|
Dec 31, 2020
|
|
Interest rate risk
|
|
|
|
|
|
Credit spread risk
|
|
|
|
|
|
Equity and Investment risk
|
|
|
|
|
|
Foreign exchange risk
|
|
|
|
|
|
Pension risk
|
|
|
|
|
|
Guaranteed funds risk
|
|
|
|
|
|
Total nontrading market risk portfolios
|
|
|
|
|
|
|
|
|
|
|
The economic capital figures do take into account diversification benefits between the different risk types.
Economic Capital Usage for Nontrading Market Risk totaled
€
5.6
billion
as of December 31, 2021, which is
€
3.1
billion
below our economic capital usage at year-end 2020.
-
–
Interest rate risk. Economic capital charge for interest rate risk in the banking book, including gap risk, basis risk and option risk, such as the risk of a change in client behavior embedded in modelled non-maturity deposits or prepayment risk. In total the economic capital usage for December 31, 2021 was
€
-
–
Credit spread risk. Economic capital charge for portfolios in the banking book subject to credit spread risk. Economic capital usage was
€
-
–
Equity and Investment risk. Economic capital charge for equity risk from our non-consolidated investment holdings, such as our strategic investments and alternative assets, and from a structural short position in our own share price arising from our equity compensation plans. The economic capital usage was
€
-
–
Foreign exchange risk. Foreign exchange risk predominantly arises from our structural position taken to immunize the sensitivity of our capital ratio against changes in the exchange rates. Our economic capital usage was
€
-
–
Pension risk. This risk arises from our defined benefit obligations, including interest rate risk and inflation risk, credit spread risk, equity risk and longevity risk. The economic capital usage was
€
-
–
Guaranteed funds risk. Economic capital usage was
€
154
|
|
Deutsche Bank
|
Operating and Financial Review
|
|
|
Annual Report 2021
|
Deutsche Bank Group
|
|
|
|
|
Interest Rate Risk in the Banking Book
The following table shows the impact on the Group’s net interest income in the banking book as well as the change of the economic value for the banking book positions from interest rate changes under the six standard scenarios defined by the European Banking Authority (EBA) :
Economic value net interest income interest rate risk in the banking book by EBA scenario
|
|
|
Delta EVE
|
|
Delta NII¹
|
||||
|
in € bn.
|
|
Dec 31, 2021
|
|
Dec 31, 2020
|
|
Dec 31, 2021
|
|
Dec 31, 2020
|
|
Parallel up
|
|
(3.5)
|
|
(5.2)
|
|
1.4
|
|
2.3
|
|
Parallel down
|
|
0.1
|
|
0.5
|
|
(0.9)
|
|
(1.1)
|
|
Steepener
|
|
(0.0)
|
|
(0.6)
|
|
(0.7)
|
|
(0.9)
|
|
Flattener
|
|
(1.3)
|
|
(0.6)
|
|
1.1
|
|
2.1
|
|
Short rate up
|
|
(1.7)
|
|
(1.7)
|
|
1.7
|
|
2.7
|
|
Short rate down
|
|
0.4
|
|
0.4
|
|
(0.9)
|
|
(1.1)
|
|
Maximum
|
|
(3.5)
|
|
(5.2)
|
|
(0.9)
|
|
(1.1)
|
|
|
|
|
|
|
|
|
|
|
|
in € bn.
|
|
Dec 31, 2021
|
|
Dec 31, 2020
|
|
|
|
|
|
Tier 1 Capital
|
|
55.4
|
|
51.7
|
|
|
|
|
|
|
|
|
|
|
|
|
|
|
1
Delta Net Interest Income (NII) reflects the difference between projected NII in the respective scenario with shifted rates vs. market implied rates. Sensitivities are based on a static balance sheet at constant exchange rates, excluding trading positions and DWS. Figures do not include Mark to Market (MtM) / Other Comprehensive Income (OCI) effects on centrally managed positions not eligible for hedge accounting.
The maximum Economic Value of Equity (EVE) loss was € (3.5) billion as of December 2021, compared to € (5.2) billion as of December 2020. As per December 2021 the maximum EVE loss represents 6.3 % of Tier 1 Capital.
The maximum Economic Value of Equity (EVE) loss due to a +200 basis points parallel shift of the yield curve across all currencies as defined by the BaFin was € (3.4) billion as of December 2021, representing 5.4 % of Total Capital.
The decrease in the maximum Economic Value of Equity loss for the ‘Parallel up’ interest rate scenario was partially driven by improvements in our risk measurement. In particular we extended our modelling assumptions for Non Maturity Deposits and the TLTRO to better align to the behavior expected in a negative interest rate environment. Such changes are governed by Deutsche Bank’s Risk and model validation functions and allow for better risk reflection and management.
Additionally changes in risk positions in Deutsche Bank’s pension fund as well the ‘strategic liquidity reserve’ were reducing the maximum Economic Value of Equity (EVE) loss for that scenario. Those risks are part of the IRRBB framework but are managed via separate, defined risk management strategies.
The maximum one-year loss in net interest income (NII) was € (0.9) billion as of December 2021, compared to € (1.1) billion as of December 2020.
The maximum loss for the 12M net interest income sensitivity for the interest rate down scenario was reduced by circa € 0.2 billion.
Deutsche Bank manages NII sensitivity with a goal to stabilize and enhance earnings. Additional measures implemented in 2021 by business divisions to reprice our deposit base as well as active risk management strategies have helped to enhance earnings and reduce NII risk, while at same time allowing to keep upside potential.
The following table shows the variation of the economic value for Deutsche Bank’s banking book positions resulting from downward and upward interest rate shocks by currency:
Economic value interest rate risk in the banking book by currency
|
|
|
Dec 31, 2021
|
||
|
in € bn.
|
|
Parallel up
|
|
Parallel down
|
|
EUR
|
|
(2.4)
|
|
(0.2)
|
|
USD
|
|
(1.0)
|
|
0.4
|
|
Other
|
|
(0.1)
|
|
(0.1)
|
|
Total
|
|
(3.5)
|
|
0.1
|
|
|
|
|
|
|
155
|
|
Deutsche Bank
|
Operating and Financial Review
|
|
|
Annual Report 2021
|
Deutsche Bank Group
|
|
|
|
|
Operational risk exposure
Operational risk – risk profile
Operational risk losses by event type (profit and loss view)
|
in € m.
|
|
2021
|
|
2020¹
|
|
Clients, Products and Business Practices
|
|
402
|
|
232
|
|
Internal Fraud
|
|
72
|
|
44
|
|
Execution, Delivery and Process Management
|
|
52
|
|
55
|
|
Others
|
|
28
|
|
8
|
|
External Fraud
|
|
12
|
|
16
|
|
Natural Disasters and Public Safety
|
|
7
|
|
47
|
|
Group
|
|
573
|
|
401
|
|
|
|
|
|
|
1
2020 loss figures revised from prior year presentation due to subsequent capture of losses and reclassification.
As of December 31, 2021, operational losses increased by € 172 million (43 %) year on year, predominantly driven by increases in “Clients, Products and Business Practices”. Whilst the main contributors were provisions arising from civil litigation and regulatory enforcement, a key driver stems from court decisions in relation to applicability of specific terms in standard contracts for customers, which also has a wider impact on the industry. Losses related to "Internal Fraud" also increased by € 28 million (64 %) year on year. COVID-19 related expenses were not repeated in 2021, which explains the decrease in expenses for "Natural Disasters and Public Safety". Losses in the remaining event types remained stable year-on-year.
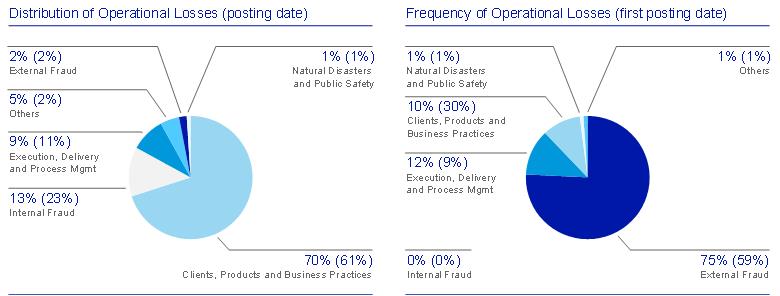
Operational losses by event type occurred in the period 2021 (2016 - 2020)
1
1
Percentages in brackets correspond to loss frequency respectively to loss amount for losses occurred in 2016-2020 period. Frequency and amounts can change subsequently.
“Distribution of Operational Losses” (above left) summarizes the proportion of operational risk loss postings by event type using the PL value in 2021, against the average for the comparative five-year period 2016-2020 (in brackets). The event type “Clients, Products and Business Practices” dominates operational losses with a share of 70 % and is comprised mainly of outflows related to litigation, investigations and enforcement actions (as mentioned above).
“Frequency of Operational Losses” (above right) summarizes the proportion of operational risk events by event type (based on a count of events where losses were first recognized in 2021), against the average for the comparative five-year period 2016-2020 (in brackets). The highest event type frequency, “External Fraud”, made up 75 % of all observed loss events. Although this event type contributed significantly to the frequency distribution of event losses in 2021, it made a negligible contribution to financial value of total loss events in 2021.
Whilst we seek to ensure the comprehensive capture of all operational risk loss events with a PL impact of € 10,000 or greater, the totals shown in this section may be underestimated due to delayed detection and recording of loss events.
156
|
|
Deutsche Bank
|
Operating and Financial Review
|
|
|
Annual Report 2021
|
Deutsche Bank Group
|
|
|
|
|
Liquidity Risk Exposure
Funding Markets and Capital Markets Issuance
In 2021, the COVID-19 pandemic remained in focus and markets kept reacting sensitive to pandemic-related news. Despite this macroeconomic uncertainty, the Bank continued the idiosyncratic tightening and successfully executed the 2021 Issuance Plan of € 15-20 billion, comprising debt issuance with an original maturity in excess of one year.
Looking at the Bank’s credit performance, Senior Non-Preferred cash bonds outperformed peers significantly throughout 2021. Supported by rating upgrades from Moody’s, Fitch and SP, the Bank’s credit rallied and continuously narrowed the delta to our European peers. At year end, the SNP delta to peers trades tighter than at any time in 2021.
The Group concluded 2021 having raised
€
19.7
billion
in term funding. This funding was broadly spread across the funding sources as follows: AT1 issuance (
€
2.5
billion
), Tier 2 issuance (
€
1.1
billion
), Senior non-preferred plain-vanilla issuance (
€
9.6
billion
), senior preferred plain-vanilla issuance (
€
4.0
billion
) and other senior preferred structured issuance (
€
2.5
billion
). The
€
19.7
billion
total is divided into
Euro (
€
6.8
billion
), USD (
€
11.3
billion
), GBP (
€
0.7
billion
) and other currencies aggregated (
€
0.9
billion
).
The Group’s investor base for 2021 issuances comprised of asset managers and pension funds (
60
%
), retail customers (
5
%
), banks (
7
%
), governments and agencies (
0 %
), insurance companies (
6
%
) and other institutional investors (
21
%
). The geographical distribution was split between Germany (
12
%
), rest of Europe (
33
%
), U.S. (
36
%
), Asia/Pacific (
16
%
) and Other (
3
%
). The average spread of issuance over 3-months-Euribor / Libor / Risk Free Rates was
161
basis points for the full year. The average tenor was
5.7
years. Despite an increased issuance activity in Q4, total issuances were higher in the first half of the year than in the second. The Group issued the following volumes over each quarter: Q1:
€
7.0
billion
, Q2:
€
5.0
billion
, Q3:
€
1.3
billion
and Q4:
€
6.3
billion
, respectively.
In 2022, our issuance plan is € 15-20 billion and comprises capital instruments, senior non-preferred, senior preferred and covered bonds. We also plan to raise a portion of this funding in U.S. dollar and may enter into cross currency swaps to manage any residual requirements. We have total capital markets maturities, excluding legally exercisable calls, of approximately € 12 billion in 2022.
Funding Diversification
In 2021, total external funding increased by
€ 52.2 billion
from
€
886.2
billion
at December 31, 2020 to
€
938.4
billion
at December 31, 2021. The increase was primarily driven by inflows in the Corporate Bank, where deposits increased by
€
17.8
billion
. DB’s most stable deposits in the Private Bank increased by
€
12.7
billion
predominately within the International Private Bank. In addition, secured funding and shorts increased by
€
25.0
billion
due to increased client demand and market opportunities as well as DB’s participation in ECB’s TLTRO III programme. Furthermore, targeted deposit inflows of
€
5.9
billion
led to higher unsecured wholesale funding. The
€
9.8
billion
decrease of Capital Markets and Equity outstandings relate to lower long-term debt mainly due to maturities exceeding new issuances partially offset by higher equity and additional AT1 issuance.
With the disclosure of the regulatory Net Stable Funding Ratio starting in the second quarter of 2021, DB has discontinued the disclosure of the internal Most Stable Funding Ratio (MSFR).
157
|
|
Deutsche Bank
|
Operating and Financial Review
|
|
|
Annual Report 2021
|
Deutsche Bank Group
|
|
|
|
|
Composition of External Funding Sources
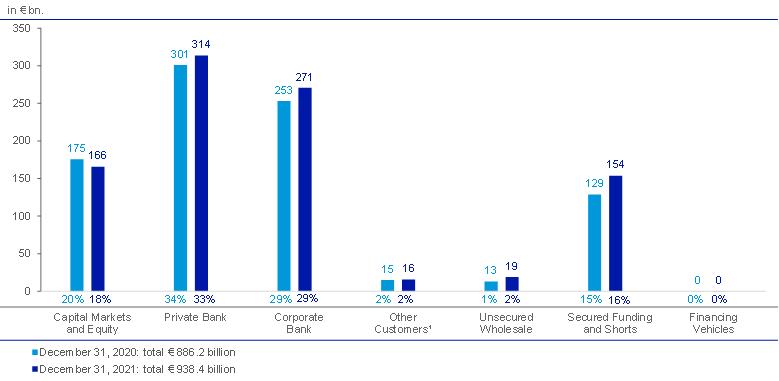
1
Other Customers includes fiduciary deposits, X-markets notes and margin/Prime Brokerage cash balances (shown on a net basis).
Reference: Reconciliation to total balance sheet of
€
1,324.7
billion
(
€
1,325.3
billion
): Derivatives settlement balances
€
306.8
billion
(
€
348.2
billion
), add-back for netting effect for margin/Prime Brokerage cash balances (shown on a net basis)
€
49.0
billion
(
€
63.4
billion
), other non-funding liabilities
€
30.5
billion
(
€
27.4
billion
) for December 31, 2021 and December 31, 2020, respectively.
Maturity of unsecured wholesale funding, ABCP and capital markets issuance
1
|
|
|
Dec 31, 2021
|
||||||||||||||
|
in € m.
|
|
Not more
than
1 month
|
|
Over
1 month
but not
more than
3 months
|
|
Over
3 months
but not
more than
6 months
|
|
Over
6 months
but not
more than
1 year
|
|
Sub-total
less than
1 year
|
|
Over
1 year
but not
more than
2 years
|
|
Over
2 years
|
|
Total
|
|
Deposits from banks
|
|
1,556
|
|
572
|
|
447
|
|
490
|
|
3,065
|
|
63
|
|
52
|
|
3,180
|
|
Deposits from other
wholesale customers
|
|
4,577
|
|
3,944
|
|
1,178
|
|
2,276
|
|
11,975
|
|
617
|
|
957
|
|
13,549
|
|
CDs and CP
|
|
242
|
|
288
|
|
1,009
|
|
1,014
|
|
2,553
|
|
0
|
|
0
|
|
2,553
|
|
ABCP
|
|
0
|
|
0
|
|
0
|
|
0
|
|
0
|
|
0
|
|
0
|
|
0
|
|
Senior non-preferred
plain vanilla
|
|
1,375
|
|
2,932
|
|
1,836
|
|
2,590
|
|
8,733
|
|
6,259
|
|
37,858
|
|
52,850
|
|
Senior preferred
plain vanilla
|
|
3
|
|
39
|
|
38
|
|
9
|
|
89
|
|
3,394
|
|
2,520
|
|
6,003
|
|
Senior structured
|
|
105
|
|
487
|
|
546
|
|
1,471
|
|
2,610
|
|
2,325
|
|
10,162
|
|
15,096
|
|
Covered bonds/ABS
|
|
110
|
|
151
|
|
723
|
|
361
|
|
1,345
|
|
1,509
|
|
11,356
|
|
14,210
|
|
Subordinated liabilities
|
|
0
|
|
0
|
|
2,016
|
|
280
|
|
2,296
|
|
1,336
|
|
13,949
|
|
17,581
|
|
Other
|
|
213
|
|
0
|
|
0
|
|
0
|
|
213
|
|
0
|
|
0
|
|
213
|
|
Total
|
|
8,180
|
|
8,413
|
|
7,794
|
|
8,491
|
|
32,878
|
|
15,503
|
|
76,854
|
|
125,234
|
|
Of which:
|
|
|
|
|
|
|
|
|
|
|
|
|
|
|
|
|
|
Secured
|
|
110
|
|
151
|
|
723
|
|
361
|
|
1,345
|
|
1,509
|
|
11,356
|
|
14,210
|
|
Unsecured
|
|
8,070
|
|
8,262
|
|
7,070
|
|
8,130
|
|
31,533
|
|
13,994
|
|
65,497
|
|
111,024
|
|
|
|
|
|
|
|
|
|
|
|
|
|
|
|
|
|
|
1
Includes additional Tier 1 notes reported as additional equity components in the financial statements. Liabilities with call features are shown at earliest legally exercisable call date. No assumption is made as to whether such calls would be exercised.
2
Secured funding volume reported post own debt elimination
The total volume of unsecured wholesale liabilities, ABCP and capital markets issuance maturing within one year amount to € 31 billion as of December 31, 2021, and should be viewed in the context of our total Liquidity Reserves of € 241 billion.
158
|
|
Deutsche Bank
|
Operating and Financial Review
|
|
|
Annual Report 2021
|
Deutsche Bank Group
|
|
|
|
|
|
|
|
Dec 31, 2020
|
||||||||||||||
|
in € m.
|
|
Not more
than
1 month
|
|
Over
1 month
but not
more than
3 months
|
|
Over
3 months
but not
more than
6 months
|
|
Over
6 months
but not
more than
1 year
|
|
Sub-total
less than
1 year
|
|
Over
1 year
but not
more than
2 years
|
|
Over
2 years
|
|
Total
|
|
Deposits from banks
|
|
964
|
|
1,063
|
|
779
|
|
547
|
|
3,354
|
|
162
|
|
78
|
|
3,594
|
|
Deposits from other
wholesale customers
|
|
1,626
|
|
1,326
|
|
407
|
|
986
|
|
4,344
|
|
409
|
|
1,162
|
|
5,914
|
|
CDs and CP
|
|
693
|
|
466
|
|
887
|
|
753
|
|
2,800
|
|
0
|
|
21
|
|
2,821
|
|
ABCP
|
|
0
|
|
0
|
|
0
|
|
0
|
|
0
|
|
0
|
|
0
|
|
0
|
|
Senior non-preferred
plain vanilla
|
|
3,689
|
|
3,970
|
|
2,349
|
|
8,291
|
|
18,298
|
|
8,235
|
|
34,106
|
|
60,639
|
|
Senior preferred
plain vanilla
|
|
15
|
|
0
|
|
5
|
|
1,698
|
|
1,718
|
|
85
|
|
1,955
|
|
3,759
|
|
Senior structured
|
|
544
|
|
416
|
|
917
|
|
1,465
|
|
3,343
|
|
2,310
|
|
12,021
|
|
17,674
|
|
Covered bonds/ABS
|
|
70
|
|
1,179
|
|
786
|
|
1,966
|
|
4,001
|
|
1,337
|
|
17,303
|
|
22,641
|
|
Subordinated liabilities
|
|
0
|
|
0
|
|
538
|
|
531
|
|
1,069
|
|
1,765
|
|
11,437
|
|
14,271
|
|
Other
|
|
137
|
|
0
|
|
0
|
|
0
|
|
137
|
|
0
|
|
695
|
|
832
|
|
Total
|
|
7,738
|
|
8,420
|
|
6,668
|
|
16,237
|
|
39,063
|
|
14,303
|
|
78,779
|
|
132,145
|
|
Of which:
|
|
|
|
|
|
|
|
|
|
|
|
|
|
|
|
|
|
Secured
|
|
70
|
|
1,179
|
|
786
|
|
1,966
|
|
4,001
|
|
1,337
|
|
17,303
|
|
22,641
|
|
Unsecured
|
|
7,668
|
|
7,241
|
|
5,882
|
|
14,271
|
|
35,063
|
|
12,966
|
|
61,476
|
|
109,505
|
|
|
|
|
|
|
|
|
|
|
|
|
|
|
|
|
|
|
The following table shows the currency breakdown of our short-term unsecured wholesale funding, of our ABCP funding and of our capital markets issuance.
Unsecured wholesale funding, ABCP and capital markets issuance (currency breakdown)
|
|
|
Dec 31,2021
|
|
Dec 31,2020
|
||||||||||||||||
|
in € m.
|
|
in EUR
|
|
in USD
|
|
in GBP
|
|
in other
CCYs
|
|
Total
|
|
in EUR
|
|
in USD
|
|
in GBP
|
|
in other
CCYs
|
|
Total
|
|
Deposits from
banks
|
|
986
|
|
797
|
|
414
|
|
984
|
|
3,180
|
|
963
|
|
2,222
|
|
149
|
|
261
|
|
3,594
|
|
Deposits from
other whole-
sale customers
|
|
3,346
|
|
7,946
|
|
201
|
|
2,055
|
|
13,549
|
|
4,474
|
|
989
|
|
90
|
|
361
|
|
5,914
|
|
CDs and CP
|
|
1,370
|
|
837
|
|
0
|
|
345
|
|
2,553
|
|
1,082
|
|
715
|
|
365
|
|
658
|
|
2,821
|
|
ABCP
|
|
0
|
|
0
|
|
0
|
|
0
|
|
0
|
|
0
|
|
0
|
|
0
|
|
0
|
|
0
|
|
Senior non-preferred
plain vanilla
|
|
25,583
|
|
21,244
|
|
2,297
|
|
3,726
|
|
52,850
|
|
29,700
|
|
25,122
|
|
1,833
|
|
3,984
|
|
60,639
|
|
Senior preferred
plain vanilla
|
|
1,989
|
|
3,838
|
|
0
|
|
176
|
|
6,003
|
|
1,894
|
|
1,635
|
|
0
|
|
230
|
|
3,759
|
|
Senior structured
|
|
6,720
|
|
6,395
|
|
12
|
|
1,970
|
|
15,096
|
|
7,725
|
|
7,972
|
|
14
|
|
1,963
|
|
17,674
|
|
Covered bonds/
ABS
|
|
14,210
|
|
0
|
|
0
|
|
0
|
|
14,210
|
|
22,641
|
|
0
|
|
0
|
|
0
|
|
22,641
|
|
Subordinated
liabilities
|
|
8,396
|
|
8,216
|
|
774
|
|
195
|
|
17,581
|
|
4,693
|
|
3,577
|
|
0
|
|
6,001
|
|
14,271
|
|
Other
|
|
213
|
|
0
|
|
0
|
|
0
|
|
213
|
|
832
|
|
0
|
|
0
|
|
0
|
|
832
|
|
Total
|
|
62,813
|
|
49,272
|
|
3,698
|
|
9,451
|
|
125,234
|
|
74,004
|
|
42,232
|
|
2,451
|
|
13,458
|
|
132,145
|
|
Of which:
|
|
|
|
|
|
|
|
|
|
|
|
|
|
|
|
|
|
|
|
|
|
Secured
|
|
14,210
|
|
0
|
|
0
|
|
0
|
|
14,210
|
|
22,641
|
|
0
|
|
0
|
|
0
|
|
22,641
|
|
Unsecured
|
|
48,603
|
|
49,272
|
|
3,698
|
|
9,451
|
|
111,024
|
|
51,363
|
|
42,232
|
|
2,451
|
|
13,458
|
|
109,505
|
|
|
|
|
|
|
|
|
|
|
|
|
|
|
|
|
|
|
|
|
|
|
159
|
|
Deutsche Bank
|
Operating and Financial Review
|
|
|
Annual Report 2021
|
Deutsche Bank Group
|
|
|
|
|
Liquidity Reserves
Composition of our liquidity reserves by parent company (including branches) and subsidiaries
|
|
|
Dec 31, 2021
|
|
Dec 31, 2020
|
||||
|
in € bn.
|
|
Carrying Value
|
|
Liquidity Value
|
|
Carrying Value
|
|
Liquidity Value
|
|
Available cash and cash equivalents (held primarily at central banks)
|
|
181
|
|
181
|
|
155
|
|
155
|
|
Parent (incl. foreign branches)
|
|
144
|
|
144
|
|
130
|
|
130
|
|
Subsidiaries
|
|
37
|
|
37
|
|
25
|
|
25
|
|
Highly liquid securities (includes government, government
guaranteed and agency securities)
|
|
40
|
|
40
|
|
62
|
|
62
|
|
Parent (incl. foreign branches)
|
|
20
|
|
20
|
|
42
|
|
41
|
|
Subsidiaries
|
|
20
|
|
20
|
|
20
|
|
20
|
|
Other unencumbered central bank eligible securities
|
|
20
|
|
18
|
|
26
|
|
24
|
|
Parent (incl. foreign branches)
|
|
15
|
|
13
|
|
21
|
|
19
|
|
Subsidiaries
|
|
5
|
|
5
|
|
5
|
|
5
|
|
Total liquidity reserves
|
|
241
|
|
239
|
|
243
|
|
241
|
|
Parent (incl. foreign branches)
|
|
179
|
|
177
|
|
192
|
|
191
|
|
Subsidiaries
|
|
62
|
|
62
|
|
51
|
|
50
|
|
|
|
|
|
|
|
|
|
|
As of December 31, 2021, our liquidity reserves amounted to € 241 billion compared with € 243 billion as of December 31, 2020. The decrease of € 2 billion comprised approximately a € 26 billion increase in cash and cash equivalents, offset by a decrease of € 22 billion in highly liquid securities and € 6 billion increase in other unencumbered securities. The development was primarily driven by increased lending activity partially and matured capital market issuances offset by additional participation in the ECB’s TLTRO and higher deposits. The quarterly average of our Liquidity Reserves for this year is € 247 billion compared with € 233 billion during 2020. In the table above the carrying value represents the market value of our Liquidity Reserves while the liquidity value reflects our assumption of the value that could be obtained, primarily through secured funding, taking into account the experience observed in secured funding markets at times of stress.
Liquidity Coverage Ratio
The year-end LCR as of December 31, 2021 stands at 133.1 % compared to 144.8 % as of December 31, 2020.
Our twelve month weighted average LCR continues to be 142%. This has been calculated in accordance with the Commission Delegated Regulation (EU) 2015/61 and the EBA Guidelines on LCR disclosure to complement the disclosure of liquidity risk management under Article 435 CRR.
LCR components
|
|
|
Dec 31, 2021
|
|
Dec 31, 2020
|
|
in € bn. (unless stated otherwise)
|
|
Total adjusted
weighted value
(average)
|
|
Total adjusted
weighted value
(average)
|
|
Number of data points used in the calculation of averages
|
|
12
|
|
12
|
|
High Quality Liquid Assets
|
|
220
|
|
207
|
|
Total net cash outflows
|
|
155
|
|
146
|
|
Liquidity Coverage Ratio (LCR) in %
|
|
142 %
|
|
142 %
|
|
|
|
|
|
|
Funding Risk Management
Structural Funding
All funding matrices (the aggregate currency, the USD and the GBP funding matrix) were in line with the respective risk appetite as of year ends 2020 and 2019.
Stress Testing and Scenario Analysis
At the end of 2021 our stressed Net Liquidity Position stood at € 48 billion compared to €43 billion at the end of 2020. The predominant driver of the increase was a change in presentation of available excess liquidity maintained at branches and subsidiaries within the Group where limited liquidity transfer restrictions exist. Previous, excess balances were not shown in the Group’s sNLP metric, but are now being reflected. The impact of this presentational change was €16 billion and was partly offset by methodology changes and business activities. Without the presentational change the SNLP at the end of 2021 would have been €32 bn.
160
|
|
Deutsche Bank
|
Operating and Financial Review
|
|
|
Annual Report 2021
|
Deutsche Bank Group
|
|
|
|
|
Global All Currency Daily Stress Testing Results
|
|
|
Dec 31, 2021
|
|
Dec 31, 2020
|
||||||||
|
in € bn.
|
|
Funding
Gap¹
|
|
Gap
Closure²
|
|
Net Liquidity
Position
|
|
Funding
Gap¹
|
|
Gap
Closure²
|
|
Net Liquidity
Position
|
|
Systemic market risk
|
|
100
|
|
220
|
|
119
|
|
82
|
|
189
|
|
107
|
|
1 notch downgrade (DB specific)
|
|
78
|
|
220
|
|
141
|
|
17
|
|
145
|
|
128
|
|
Severe downgrade (DB specific)
|
|
152
|
|
240
|
|
88
|
|
157
|
|
216
|
|
59
|
|
Combined
3
|
|
|
|
|
|
|
|
|
|
|
|
|
|
|
|
|
|
|
|
|
|
|
|
|
|
|
1
Funding gap caused by impaired rollover of liabilities and other projected outflows.
2
Based on liquidity generation through Liquidity Reserves and other business mitigants.
3
Combined impact of systemic market risk and severe downgrade
.
Global EUR Daily Stress Testing Results
|
|
|
Dec 31, 2021
|
|
Dec 31, 2020
|
||||||||
|
in € m.
|
|
Funding
Gap¹
|
|
Gap
Closure²
|
|
Net Liquidity
Position
|
|
Funding
Gap¹
|
|
Gap
Closure²
|
|
Net Liquidity
Position
|
|
Combined³
|
|
91
|
|
112
|
|
21
|
|
86
|
|
104
|
|
18
|
|
|
|
|
|
|
|
|
|
|
|
|
|
|
1
Funding gap caused by impaired rollover of liabilities and other projected outflows.
2
Based on liquidity generation through Liquidity Reserves and other business mitigants.
3
Combined impact of systemic market risk and severe downgrade.
Global USD Daily Stress Testing Results
|
|
|
Dec 31, 2021
|
|
Dec 31, 2020
|
||||||||
|
in € bn.
|
|
Funding
Gap¹
|
|
Gap
Closure²
|
|
Net Liquidity
Position
|
|
Funding
Gap¹
|
|
Gap
Closure²
|
|
Net Liquidity
Position
|
|
Combined³
|
|
78
|
|
88
|
|
10
|
|
60
|
|
64
|
|
4
|
|
|
|
|
|
|
|
|
|
|
|
|
|
|
1
Funding gap caused by impaired rollover of liabilities and other projected outflows.
2
Based on liquidity generation through Liquidity Reserves and other business mitigants.
3
Combined impact of systemic market risk and severe downgrade.
Global GBP Daily Stress Testing Results
|
|
|
Dec 31, 2021
|
|
Dec 31, 2020
|
||||||||
|
in € bn.
|
|
Funding Gap¹
|
|
Gap Closure²
|
|
Net Liquidity Position
|
|
Funding
Gap
|
|
Gap
Closure
|
|
Net Liquidity Position
|
|
Combined³
|
|
4
|
|
8
|
|
4
|
|
4
|
|
10
|
|
6
|
|
|
|
|
|
|
|
|
|
|
|
|
|
|
1
Funding gap caused by impaired rollover of liabilities and other projected outflows.
2
Based on liquidity generation through Liquidity Reserves and other business mitigants.
3
Combined impact of systemic market risk and severe downgrade.
The following table presents the amount needed to meet collateral requirements from contractual obligations in the event of a one- or two-notch downgrade by rating agencies for all currencies.
Contractual Obligations
|
|
|
Dec 31, 2021
|
|
Dec 31, 2020
|
||||
|
in € m.
|
|
One-notch
downgrade
|
|
Two-notch
downgrade
|
|
One-notch
downgrade
|
|
Two-notch
downgrade
|
|
Contractual derivatives funding or margin requirements
|
|
205
|
|
294
|
|
354
|
|
439
|
|
Other contractual funding or margin requirements
|
|
0
|
|
0
|
|
0
|
|
0
|
|
|
|
|
|
|
|
|
|
|
Net stable funding ratio
The NSFR requires banks to maintain a stable funding profile in relation to their on- and off-balance sheet activities. The ratio is defined as the amount of Available Stable Funding (the portion of capital and liabilities expected to be a stable source of funding), relative to the amount of Required Stable Funding (a function of the liquidity characteristics of various assets held).
The Capital Requirements Regulation II (“CRR2”), the regulation which defines and implements the NSFR for the EU, was finalized in June 2019 and is effective from June 28, 2021.
The NSFR as of December 31, 2021 calculated in accordance with the CRR2 stands at 121 %, or € 105 billion of excess over regulatory minimum of 100 %.
Net stable funding ratio
|
|
|
Dec 31, 2021
|
|
in € bn. (unless stated otherwise)
|
|
Total adjusted
weighted value
|
|
Available stable funding (ASF)
|
|
602
|
|
Required stable funding (RSF)
|
|
498
|
|
Net Stable Funding Ratio (NSFR) in %
|
|
121 %
|
|
|
|
|
161
|
|
Deutsche Bank
|
Operating and Financial Review
|
|
|
Annual Report 2021
|
Deutsche Bank Group
|
|
|
|
|
Asset Encumbrance
This section refers to asset encumbrance in the group of institutions consolidated for banking regulatory purposes pursuant to the German Banking Act. Therefore this excludes insurance companies or companies outside the finance sector. Assets pledged by our insurance subsidiaries are included in Note 20 “Assets Pledged and Received as Collateral” of the consolidated financial statements, and restricted assets held to satisfy obligations to insurance companies’ policy holders are included within Note 37 “Information on Subsidiaries” of the consolidated financial statements.
Encumbered assets primarily comprise those on- and off-balance sheet assets that are pledged as collateral against secured funding, collateral swaps, and other collateralized obligations. Additionally, in line with EBA technical standards on regulatory asset encumbrance reporting, assets placed with settlement systems, including default funds and initial margins, as well as other assets pledged which cannot be freely withdrawn such as mandatory minimum reserves at central banks, are considered encumbered. We also include derivative margin receivable assets as encumbered under these EBA guidelines.
Readily available assets are those on- and off-balance sheet assets that are not otherwise encumbered, and which are in freely transferrable form. Unencumbered financial assets at fair value, other than securities borrowed or purchased under resale agreements and positive market value from derivatives, and available for sale investments are all assumed to be readily available.
The readily available value represents the on- and off-balance sheet carrying amount or fair value rather than any form of stressed liquidity value (see the “Liquidity Reserves” for an analysis of unencumbered liquid assets available under a liquidity stress scenario). Other unencumbered on- and off-balance sheet assets are those assets that have not been pledged as collateral against secured funding or other collateralized obligations, or are otherwise not considered to be readily available. Included in this category are securities borrowed or purchased under resale agreements and positive market value from derivatives. Similarly, for loans and other advances to customers, these would only be viewed as readily available to the extent they are already in a pre-packaged transferrable format, and have not already been used to generate funding. This represents the most conservative view given that an element of such loans currently shown in Other assets could be packaged into a format that would be suitable for use to generate funding.
Encumbered and unencumbered assets
|
|
|
Dec 31, 2021
|
||||||
|
|
|
Carrying value
|
||||||
|
|
|
|
|
|
|
Unencumbered assets
|
||
|
in € bn.
(unless stated otherwise)
|
|
Assets
|
|
Encumbered
assets
|
|
Readily
available
|
|
Other
|
|
Debt securities
|
|
131
|
|
66
|
|
65
|
|
0
|
|
Equity instruments
|
|
6
|
|
1
|
|
5
|
|
0
|
|
Other assets:
|
|
|
|
|
|
|
|
|
|
Cash and due from banks Interest earning deposits with Banks
|
|
199
|
|
14
|
|
186
|
|
0
|
|
Securities borrowed or purchased under resale agreements¹
|
|
8
|
|
0
|
|
0
|
|
8
|
|
Financial assets at fair value through profit and loss²
|
|
|
|
|
|
|
|
|
|
Trading assets
|
|
10
|
|
0
|
|
10
|
|
0
|
|
Positive market value from derivative financial instruments
|
|
300
|
|
0
|
|
0
|
|
300
|
|
Securities borrowed or purchased under resale agreements¹
|
|
78
|
|
0
|
|
0
|
|
78
|
|
Other financial assets at fair value through profit or loss
|
|
1
|
|
0
|
|
1
|
|
0
|
|
Financial assets at fair value through other comprehensive income²
|
|
6
|
|
0
|
|
4
|
|
1
|
|
Loans
|
|
513
|
|
86
|
|
6
|
|
420
|
|
Other assets
|
|
73
|
|
45
|
|
0
|
|
28
|
|
Total
|
|
1,325
|
|
212
|
|
277
|
|
836
|
|
|
|
|
|
|
|
|
|
|
1
Securities borrowed and securities purchased under resale agreements are all shown as other unencumbered. The use of the underlying collateral is separately captured in the off-balance sheet table below.
2
Excludes Debt securities and Equity instruments (separately disclosed above).
|
|
|
Dec 31, 2021
|
||||||
|
|
|
Fair value of collateral received
|
||||||
|
|
|
|
|
|
|
Unencumbered assets
|
||
|
in € bn.
(unless stated otherwise)
|
|
Assets
|
|
Encumbered
assets
|
|
Readily
available
|
|
Other
|
|
Collateral received:
|
|
260
|
|
223
|
|
35
|
|
2
|
|
Debt securities
|
|
254
|
|
219
|
|
35
|
|
0
|
|
Equity instruments
|
|
4
|
|
4
|
|
0
|
|
0
|
|
Other collateral received
|
|
2
|
|
0
|
|
0
|
|
2
|
|
|
|
|
|
|
|
|
|
|
162
|
|
Deutsche Bank
|
Operating and Financial Review
|
|
|
Annual Report 2021
|
Deutsche Bank Group
|
|
|
|
|
|
|
|
Dec 31, 2020
|
||||||
|
|
|
Carrying value
|
||||||
|
|
|
|
|
|
|
Unencumbered assets
|
||
|
in € bn.
(unless stated otherwise)
|
|
Assets
|
|
Encumbered
assets
|
|
Readily
available
|
|
Other
|
|
Debt securities
|
|
156
|
|
61
|
|
95
|
|
0
|
|
Equity instruments
|
|
13
|
|
6
|
|
7
|
|
0
|
|
Other assets:
|
|
|
|
|
|
|
|
|
|
Cash and due from banks Interest earning deposits with Banks
|
|
175
|
|
13
|
|
162
|
|
0
|
|
Securities borrowed or purchased under resale agreements¹
|
|
0
|
|
0
|
|
0
|
|
0
|
|
Financial assets at fair value through profit and loss²
|
|
|
|
|
|
|
|
|
|
Trading assets
|
|
9
|
|
0
|
|
9
|
|
0
|
|
Positive market value from derivative financial instruments
|
|
344
|
|
0
|
|
0
|
|
344
|
|
Securities borrowed or purchased under resale agreements¹
|
|
0
|
|
0
|
|
0
|
|
0
|
|
Other financial assets at fair value through profit or loss
|
|
3
|
|
0
|
|
3
|
|
0
|
|
Financial assets at fair value through other comprehensive income²
|
|
6
|
|
0
|
|
5
|
|
2
|
|
Loans
|
|
459
|
|
83
|
|
3
|
|
373
|
|
Other assets
|
|
90
|
|
55
|
|
0
|
|
35
|
|
Total
|
|
1,326
|
|
218
|
|
282
|
|
825
|
|
|
|
|
|
|
|
|
|
|
1
Securities borrowed and securities purchased under resale agreements are all shown as other unencumbered. The use of the underlying collateral is separately captured in the off-balance sheet table below.
2
Excludes Debt securities and Equity instruments (separately disclosed above).
|
|
|
Dec 31, 2020
|
||||||
|
|
|
Fair value of collateral received
|
||||||
|
|
|
|
|
|
|
Unencumbered assets
|
||
|
in € bn.
(unless stated otherwise)
|
|
Assets
|
|
Encumbered
assets
|
|
Readily
available
|
|
Other
|
|
Collateral received:
|
|
237
|
|
199
|
|
36
|
|
2
|
|
Debt securities
|
|
193
|
|
159
|
|
34
|
|
0
|
|
Equity instruments
|
|
42
|
|
40
|
|
2
|
|
0
|
|
Other collateral received
|
|
2
|
|
0
|
|
0
|
|
2
|
|
|
|
|
|
|
|
|
|
|
Maturity Analysis of Assets and Financial Liabilities
Treasury manages the maturity analysis of assets and liabilities. Modeling of assets and liabilities is necessary in cases where the contractual maturity does not adequately reflect the liquidity risk position. The most significant example in this context would be immediately repayable deposits from retail and transaction banking customers which have consistently displayed high stability throughout even the most severe financial crises.
The modeling profiles are part of the overall liquidity risk management framework (see section “Liquidity Stress Testing and Scenario Analysis” for short-term liquidity positions ≤ 1 year and section “Structural Funding” for long-term liquidity positions 1 year) which is defined and approved by the Management Board.
163
|
|
Deutsche Bank
|
Operating and Financial Review
|
|
|
Annual Report 2021
|
Deutsche Bank Group
|
|
|
|
|
The following tables present a maturity analysis of our total assets based on carrying value and upon earliest legally exercisable maturity as of December 31, 2021 and 2020, respectively.
Analysis of the earliest contractual maturity of assets
|
|
|
Dec 31, 2021
|
||||||||||||||||||
|
in € m.
|
|
On
demand
(incl.
Overnight
and
one day
notice)
|
|
Up to
one
month
|
|
Over
1 month
to no
more
than
3 months
|
|
Over
3 months
but no
more
than
6 months
|
|
Over
6 months
but no
more
than
9 months
|
|
Over
9 months
but no
more
than
1 year
|
|
Over
1 year
but no
more
than
2 years
|
|
Over
2 years
but no
more
than
5 years
|
|
Over
5 years
|
|
Total
|
|
Cash and central bank
balances¹
|
|
186,020
|
|
5,513
|
|
488
|
|
0
|
|
0
|
|
0
|
|
0
|
|
0
|
|
0
|
|
192,021
|
|
Interbank balances
(w/o central banks)¹
|
|
6,153
|
|
641
|
|
191
|
|
120
|
|
119
|
|
114
|
|
0
|
|
0
|
|
4
|
|
7,342
|
|
Central bank funds sold
|
|
0
|
|
0
|
|
0
|
|
0
|
|
0
|
|
0
|
|
0
|
|
0
|
|
0
|
|
0
|
|
Securities purchased under
resale agreements
|
|
178
|
|
1,979
|
|
2,042
|
|
569
|
|
992
|
|
144
|
|
831
|
|
1,633
|
|
0
|
|
8,368
|
|
With banks
|
|
168
|
|
1,375
|
|
740
|
|
303
|
|
277
|
|
8
|
|
629
|
|
1,611
|
|
0
|
|
5,111
|
|
With customers
|
|
10
|
|
604
|
|
1,302
|
|
266
|
|
715
|
|
136
|
|
202
|
|
23
|
|
0
|
|
3,257
|
|
Securities borrowed
|
|
0
|
|
63
|
|
0
|
|
0
|
|
0
|
|
0
|
|
0
|
|
0
|
|
0
|
|
63
|
|
With banks
|
|
0
|
|
0
|
|
0
|
|
0
|
|
0
|
|
0
|
|
0
|
|
0
|
|
0
|
|
0
|
|
With customers
|
|
0
|
|
63
|
|
0
|
|
0
|
|
0
|
|
0
|
|
0
|
|
0
|
|
0
|
|
63
|
|
Financial assets at fair value
through profit or loss
|
|
420,972
|
|
47,776
|
|
7,155
|
|
2,514
|
|
1,190
|
|
3,577
|
|
747
|
|
1,966
|
|
5,336
|
|
491,233
|
|
Trading assets
|
|
100,079
|
|
0
|
|
76
|
|
0
|
|
0
|
|
1,815
|
|
0
|
|
4
|
|
423
|
|
102,396
|
|
Fixed-income securities
and loans
|
|
94,607
|
|
0
|
|
0
|
|
0
|
|
0
|
|
0
|
|
0
|
|
0
|
|
130
|
|
94,737
|
|
Equities and other variable-
income securities
|
|
4,801
|
|
0
|
|
76
|
|
0
|
|
0
|
|
1,815
|
|
0
|
|
4
|
|
293
|
|
6,989
|
|
Other trading assets
|
|
671
|
|
0
|
|
0
|
|
0
|
|
0
|
|
0
|
|
0
|
|
0
|
|
0
|
|
671
|
|
Positive market values from
derivative financial instruments
|
|
299,732
|
|
0
|
|
0
|
|
0
|
|
0
|
|
0
|
|
0
|
|
0
|
|
0
|
|
299,732
|
|
Non-trading financial assets mandatory at fair value through profit or loss
|
|
21,155
|
|
47,776
|
|
7,079
|
|
2,514
|
|
1,142
|
|
1,762
|
|
663
|
|
1,962
|
|
4,912
|
|
88,965
|
|
Securities purchased under
resale agreements
|
|
6,373
|
|
44,027
|
|
5,850
|
|
1,934
|
|
895
|
|
202
|
|
56
|
|
594
|
|
0
|
|
59,931
|
|
Securities borrowed
|
|
14,777
|
|
2,829
|
|
663
|
|
86
|
|
0
|
|
0
|
|
0
|
|
0
|
|
0
|
|
18,355
|
|
Fixed-income securities
and loans
|
|
5
|
|
198
|
|
374
|
|
415
|
|
242
|
|
726
|
|
437
|
|
1,228
|
|
4,125
|
|
7,750
|
|
Other non-trading financial assets mandatory at fair value through profit or loss
|
|
0
|
|
722
|
|
193
|
|
79
|
|
4
|
|
834
|
|
170
|
|
140
|
|
787
|
|
2,929
|
|
Financial assets designated at fair value through profit or loss
|
|
6
|
|
0
|
|
0
|
|
0
|
|
48
|
|
0
|
|
84
|
|
1
|
|
1
|
|
140
|
|
Positive market values from
derivative financial instruments
qualifying for hedge accounting
|
|
0
|
|
124
|
|
57
|
|
103
|
|
11
|
|
92
|
|
25
|
|
223
|
|
469
|
|
1,105
|
|
Financial assets at fair value
through other comprehensive income
|
|
0
|
|
2,188
|
|
1,897
|
|
1,281
|
|
890
|
|
738
|
|
2,236
|
|
5,970
|
|
13,778
|
|
28,979
|
|
Securities purchased under resale agreements
|
|
0
|
|
1,231
|
|
0
|
|
0
|
|
0
|
|
0
|
|
0
|
|
0
|
|
0
|
|
1,231
|
|
Securities borrowed
|
|
0
|
|
0
|
|
0
|
|
0
|
|
0
|
|
0
|
|
0
|
|
0
|
|
0
|
|
0
|
|
Debt securities
|
|
0
|
|
502
|
|
950
|
|
689
|
|
532
|
|
626
|
|
1,772
|
|
4,560
|
|
13,746
|
|
23,377
|
|
Loans
|
|
0
|
|
455
|
|
947
|
|
593
|
|
358
|
|
112
|
|
464
|
|
1,410
|
|
32
|
|
4,370
|
|
Other
|
|
0
|
|
0
|
|
0
|
|
0
|
|
0
|
|
0
|
|
0
|
|
0
|
|
0
|
|
0
|
|
Loans
|
|
16,962
|
|
40,041
|
|
27,994
|
|
23,938
|
|
11,882
|
|
12,448
|
|
29,518
|
|
89,736
|
|
219,550
|
|
472,069
|
|
To banks
|
|
282
|
|
885
|
|
899
|
|
503
|
|
274
|
|
183
|
|
441
|
|
3,387
|
|
753
|
|
7,607
|
|
To customers
|
|
16,680
|
|
39,156
|
|
27,095
|
|
23,435
|
|
11,608
|
|
12,265
|
|
29,077
|
|
86,349
|
|
218,797
|
|
464,462
|
|
Retail
|
|
2,782
|
|
5,893
|
|
4,262
|
|
2,092
|
|
1,071
|
|
2,209
|
|
4,337
|
|
16,256
|
|
171,602
|
|
210,504
|
|
Corporates and other
customers
|
|
13,898
|
|
33,263
|
|
22,833
|
|
21,343
|
|
10,537
|
|
10,056
|
|
24,740
|
|
70,093
|
|
47,195
|
|
253,958
|
|
Other financial assets
|
|
65,378
|
|
7,742
|
|
1,223
|
|
1,206
|
|
1,322
|
|
3,306
|
|
4,879
|
|
3,968
|
|
8,022
|
|
97,046
|
|
Total financial assets
|
|
695,662
|
|
106,067
|
|
41,048
|
|
29,731
|
|
16,406
|
|
20,419
|
|
38,237
|
|
103,497
|
|
247,159
|
|
1,298,227
|
|
Other assets
|
|
8,407
|
|
1,258
|
|
1
|
|
2,118
|
|
31
|
|
2,576
|
|
130
|
|
1,372
|
|
10,585
|
|
26,479
|
|
Total assets
|
|
704,069
|
|
107,325
|
|
41,049
|
|
31,850
|
|
16,437
|
|
22,995
|
|
38,367
|
|
104,869
|
|
257,744
|
|
1,324,705
|
|
|
|
|
|
|
|
|
|
|
|
|
|
|
|
|
|
|
|
|
|
|
1
The positions “Cash and central bank balances” and “Interbank balances (w/o central banks)” include € 526 million cash held with Russian Banks, predominantly with the Central Bank of Russia.
164
|
|
Deutsche Bank
|
Operating and Financial Review
|
|
|
Annual Report 2021
|
Deutsche Bank Group
|
|
|
|
|
|
|
|
Dec 31, 2020
|
||||||||||||||||||
|
in € m.
|
|
On
demand
(incl.
Overnight
and
one day
notice)
|
|
Up to
one
month
|
|
Over
1 month
to no
more
than
3 months
|
|
Over
3 months
but no
more
than
6 months
|
|
Over
6 months
but no
more
than
9 months
|
|
Over
9 months
but no
more
than
1 year
|
|
Over
1 year
but no
more
than
2 years
|
|
Over
2 years
but no
more
than
5 years
|
|
Over
5 years
|
|
Total
|
|
Cash and central bank
balances
|
|
163,953
|
|
2,165
|
|
32
|
|
39
|
|
13
|
|
6
|
|
0
|
|
0
|
|
0
|
|
166,208
|
|
Interbank balances
(w/o central banks)
|
|
7,106
|
|
1,239
|
|
470
|
|
138
|
|
95
|
|
71
|
|
0
|
|
0
|
|
11
|
|
9,130
|
|
Central bank funds sold
|
|
0
|
|
0
|
|
0
|
|
0
|
|
0
|
|
0
|
|
0
|
|
0
|
|
0
|
|
0
|
|
Securities purchased under
resale agreements
|
|
151
|
|
2,111
|
|
1,378
|
|
765
|
|
84
|
|
237
|
|
2,212
|
|
1,593
|
|
0
|
|
8,533
|
|
With banks
|
|
137
|
|
1,578
|
|
206
|
|
508
|
|
64
|
|
0
|
|
1,529
|
|
1,505
|
|
0
|
|
5,527
|
|
With customers
|
|
14
|
|
533
|
|
1,172
|
|
257
|
|
20
|
|
237
|
|
683
|
|
88
|
|
0
|
|
3,005
|
|
Securities borrowed
|
|
0
|
|
0
|
|
0
|
|
0
|
|
0
|
|
0
|
|
0
|
|
0
|
|
0
|
|
0
|
|
With banks
|
|
0
|
|
0
|
|
0
|
|
0
|
|
0
|
|
0
|
|
0
|
|
0
|
|
0
|
|
0
|
|
With customers
|
|
0
|
|
0
|
|
0
|
|
0
|
|
0
|
|
0
|
|
0
|
|
0
|
|
0
|
|
0
|
|
Financial assets at fair value
through profit or loss
|
|
462,674
|
|
39,834
|
|
6,189
|
|
2,971
|
|
593
|
|
3,391
|
|
1,898
|
|
4,063
|
|
6,366
|
|
527,980
|
|
Trading assets
|
|
448,260
|
|
291
|
|
0
|
|
0
|
|
0
|
|
2,480
|
|
83
|
|
0
|
|
309
|
|
451,422
|
|
Fixed-income securities
and loans¹
|
|
91,353
|
|
291
|
|
0
|
|
0
|
|
0
|
|
2,480
|
|
83
|
|
0
|
|
119
|
|
94,326
|
|
Equities and other variable-
income securities¹
|
|
11,579
|
|
0
|
|
0
|
|
0
|
|
0
|
|
0
|
|
0
|
|
0
|
|
190
|
|
11,769
|
|
Other trading assets
|
|
1,833
|
|
0
|
|
0
|
|
0
|
|
0
|
|
0
|
|
0
|
|
0
|
|
0
|
|
1,833
|
|
Positive market values from
derivative financial instruments
|
|
343,493
|
|
0
|
|
0
|
|
0
|
|
0
|
|
0
|
|
0
|
|
0
|
|
0
|
|
343,493
|
|
Non-trading financial assets mandatory at fair value through profit or loss
|
|
14,415
|
|
39,543
|
|
6,189
|
|
2,971
|
|
593
|
|
912
|
|
1,461
|
|
3,980
|
|
6,057
|
|
76,121
|
|
Securities purchased under
resale agreements
|
|
3,649
|
|
32,309
|
|
5,052
|
|
2,848
|
|
560
|
|
97
|
|
373
|
|
1,169
|
|
0
|
|
46,057
|
|
Securities borrowed
|
|
10,532
|
|
5,752
|
|
721
|
|
0
|
|
0
|
|
0
|
|
4
|
|
0
|
|
0
|
|
17,009
|
|
Fixed-income securities
and loans¹
|
|
198
|
|
1,188
|
|
399
|
|
117
|
|
6
|
|
278
|
|
997
|
|
2,691
|
|
5,678
|
|
11,553
|
|
Other non-trading financial assets mandatory at fair value through profit or loss¹
|
|
36
|
|
294
|
|
16
|
|
6
|
|
27
|
|
536
|
|
88
|
|
121
|
|
378
|
|
1,503
|
|
Financial assets designated at fair value through profit or loss
|
|
0
|
|
0
|
|
0
|
|
0
|
|
0
|
|
0
|
|
353
|
|
83
|
|
1
|
|
437
|
|
Positive market values from
derivative financial instruments
qualifying for hedge accounting
|
|
0
|
|
528
|
|
622
|
|
350
|
|
131
|
|
71
|
|
215
|
|
221
|
|
1,126
|
|
3,265
|
|
Financial assets at fair value
through other comprehensive income
|
|
5
|
|
3,013
|
|
3,182
|
|
3,059
|
|
3,304
|
|
1,831
|
|
8,436
|
|
11,271
|
|
21,735
|
|
55,834
|
|
Securities purchased under resale agreements
|
|
0
|
|
1,543
|
|
0
|
|
0
|
|
0
|
|
0
|
|
0
|
|
0
|
|
0
|
|
1,543
|
|
Securities borrowed
|
|
0
|
|
0
|
|
0
|
|
0
|
|
0
|
|
0
|
|
0
|
|
0
|
|
0
|
|
0
|
|
Debt securities
|
|
0
|
|
1,167
|
|
2,621
|
|
2,684
|
|
2,963
|
|
1,653
|
|
7,633
|
|
9,252
|
|
21,683
|
|
49,656
|
|
Loans
|
|
5
|
|
303
|
|
561
|
|
374
|
|
341
|
|
179
|
|
803
|
|
2,019
|
|
52
|
|
4,635
|
|
Other
|
|
0
|
|
0
|
|
0
|
|
0
|
|
0
|
|
0
|
|
0
|
|
0
|
|
0
|
|
0
|
|
Loans
|
|
13,792
|
|
41,600
|
|
19,375
|
|
15,763
|
|
9,482
|
|
11,575
|
|
28,140
|
|
75,957
|
|
211,005
|
|
426,691
|
|
To banks
|
|
270
|
|
693
|
|
744
|
|
577
|
|
235
|
|
384
|
|
258
|
|
1,602
|
|
751
|
|
5,514
|
|
To customers
|
|
13,522
|
|
40,907
|
|
18,632
|
|
15,186
|
|
9,247
|
|
11,191
|
|
27,882
|
|
74,355
|
|
210,255
|
|
421,177
|
|
Retail
|
|
2,288
|
|
7,919
|
|
3,226
|
|
1,817
|
|
1,100
|
|
1,262
|
|
4,955
|
|
16,034
|
|
164,343
|
|
202,943
|
|
Corporates and other
customers
|
|
11,234
|
|
32,988
|
|
15,406
|
|
13,369
|
|
8,148
|
|
9,929
|
|
22,927
|
|
58,321
|
|
45,912
|
|
218,234
|
|
Other financial assets
|
|
73,415
|
|
7,766
|
|
1,362
|
|
1,112
|
|
430
|
|
2,207
|
|
2,073
|
|
6,867
|
|
1,560
|
|
96,791
|
|
Total financial assets
|
|
721,096
|
|
98,256
|
|
32,611
|
|
24,197
|
|
14,133
|
|
19,390
|
|
42,975
|
|
99,972
|
|
241,803
|
|
1,294,433
|
|
Other assets
|
|
13,898
|
|
1,599
|
|
1
|
|
1,672
|
|
9
|
|
1,983
|
|
211
|
|
1,406
|
|
9,749
|
|
30,529
|
|
Total assets
|
|
734,994
|
|
99,856
|
|
32,612
|
|
25,869
|
|
14,142
|
|
21,373
|
|
43,186
|
|
101,378
|
|
251,552
|
|
1,324,961
|
|
|
|
|
|
|
|
|
|
|
|
|
|
|
|
|
|
|
|
|
|
|
1
Numbers have been restated reflecting a reclassification of certain investment certificates from “fixed-income securities and loans” to “equities and other variable-income securities” as part of trading assets, and from “fixed-income securities and loans” to “other non-trading financial assets mandatory at fair value through profit or loss” as part of non-trading financial assets mandatory at fair value through profit or loss, to the tune of € 2.5 billion and € 1.2 billion, respectively.
165
|
|
Deutsche Bank
|
Operating and Financial Review
|
|
|
Annual Report 2021
|
Deutsche Bank Group
|
|
|
|
|
The following tables present a maturity analysis of our total liabilities based on carrying value and upon earliest legally exercisable maturity as of December 31, 2021 and 2020, respectively.
Analysis of the earliest contractual maturity of liabilities
|
|
|
Dec 31, 2021
|
||||||||||||||||||
|
in € m.
|
|
On
demand
(incl. Over-
night and
one day
notice)
|
|
Up to
one
month
|
|
Over
1 month
to no
more
than
3 months
|
|
Over
3 months
but no
more
than
6 months
|
|
Over
6 months
but no
more
than
9 months
|
|
Over
9 months
but no
more
than
1 year
|
|
Over
1 year
but no
more
than
2 years
|
|
Over
2 years
but no
more
than
5 years
|
|
Over
5 years
|
|
Total
|
|
Deposits
|
|
393,897
|
|
23,033
|
|
95,474
|
|
49,687
|
|
10,775
|
|
10,057
|
|
4,726
|
|
7,095
|
|
9,652
|
|
604,396
|
|
Due to banks
|
|
42,195
|
|
2,312
|
|
8,091
|
|
9,328
|
|
5,619
|
|
1,637
|
|
2,374
|
|
5,105
|
|
7,652
|
|
84,315
|
|
Due to customers
|
|
351,702
|
|
20,721
|
|
87,383
|
|
40,359
|
|
5,156
|
|
8,420
|
|
2,352
|
|
1,989
|
|
1,999
|
|
520,081
|
|
Retail
|
|
158,038
|
|
3,040
|
|
59,964
|
|
28,293
|
|
889
|
|
745
|
|
416
|
|
495
|
|
127
|
|
252,006
|
|
Corporates and other
customers
|
|
193,664
|
|
17,681
|
|
27,419
|
|
12,066
|
|
4,267
|
|
7,675
|
|
1,936
|
|
1,494
|
|
1,873
|
|
268,075
|
|
Trading liabilities
|
|
341,827
|
|
0
|
|
0
|
|
0
|
|
0
|
|
0
|
|
0
|
|
0
|
|
0
|
|
341,827
|
|
Trading securities
|
|
54,235
|
|
0
|
|
0
|
|
0
|
|
0
|
|
0
|
|
0
|
|
0
|
|
0
|
|
54,235
|
|
Other trading liabilities
|
|
483
|
|
0
|
|
0
|
|
0
|
|
0
|
|
0
|
|
0
|
|
0
|
|
0
|
|
483
|
|
Negative market values from
derivative financial
instruments
|
|
287,109
|
|
0
|
|
0
|
|
0
|
|
0
|
|
0
|
|
0
|
|
0
|
|
0
|
|
287,109
|
|
Financial liabilities designed at fair value through profit or loss
|
|
12,038
|
|
22,809
|
|
4,219
|
|
648
|
|
13,987
|
|
2,114
|
|
376
|
|
1,497
|
|
780
|
|
58,468
|
|
Securities sold under repurchase agreements
|
|
10,802
|
|
22,069
|
|
4,077
|
|
548
|
|
13,855
|
|
1,950
|
|
1
|
|
3
|
|
58
|
|
53,364
|
|
Long-term debt
|
|
1,008
|
|
0
|
|
35
|
|
36
|
|
87
|
|
59
|
|
368
|
|
1,439
|
|
667
|
|
3,699
|
|
Other financial liabilities
designated at fair value
through profit or loss
|
|
228
|
|
740
|
|
106
|
|
64
|
|
44
|
|
105
|
|
7
|
|
54
|
|
56
|
|
1,404
|
|
Investment contract liabilities
|
|
0
|
|
0
|
|
0
|
|
0
|
|
0
|
|
562
|
|
0
|
|
0
|
|
0
|
|
562
|
|
Negative market values from
derivative financial instruments
qualifying for hedge accounting
|
|
0
|
|
317
|
|
362
|
|
187
|
|
188
|
|
48
|
|
34
|
|
252
|
|
79
|
|
1,466
|
|
Central bank funds purchased
|
|
0
|
|
0
|
|
0
|
|
0
|
|
0
|
|
0
|
|
0
|
|
0
|
|
0
|
|
0
|
|
Securities sold under repurchase agreements
|
|
226
|
|
2
|
|
30
|
|
39
|
|
1
|
|
0
|
|
440
|
|
2
|
|
8
|
|
747
|
|
Due to banks
|
|
218
|
|
1
|
|
28
|
|
37
|
|
1
|
|
0
|
|
440
|
|
0
|
|
3
|
|
727
|
|
Due to customers
|
|
8
|
|
2
|
|
2
|
|
2
|
|
0
|
|
0
|
|
0
|
|
2
|
|
5
|
|
21
|
|
Securities loaned
|
|
24
|
|
0
|
|
0
|
|
0
|
|
0
|
|
0
|
|
0
|
|
0
|
|
0
|
|
24
|
|
Due to banks
|
|
6
|
|
0
|
|
0
|
|
0
|
|
0
|
|
0
|
|
0
|
|
0
|
|
0
|
|
6
|
|
Due to customers
|
|
18
|
|
0
|
|
0
|
|
0
|
|
0
|
|
0
|
|
0
|
|
0
|
|
0
|
|
18
|
|
Other short term borrowings
|
|
2,676
|
|
639
|
|
114
|
|
536
|
|
2
|
|
67
|
|
0
|
|
0
|
|
0
|
|
4,034
|
|
Long-term debt
|
|
0
|
|
1,838
|
|
31,616
|
|
10,889
|
|
1,452
|
|
3,637
|
|
17,832
|
|
48,166
|
|
29,054
|
|
144,485
|
|
Debt securities - senior
|
|
0
|
|
1,772
|
|
3,287
|
|
2,934
|
|
1,344
|
|
2,849
|
|
12,901
|
|
34,760
|
|
21,780
|
|
81,629
|
|
Debt securities - subordi-
nated
|
|
0
|
|
0
|
|
14
|
|
0
|
|
0
|
|
0
|
|
1,231
|
|
4,879
|
|
2,479
|
|
8,603
|
|
Other long-term debt - senior
|
|
0
|
|
66
|
|
28,315
|
|
7,955
|
|
93
|
|
788
|
|
3,597
|
|
8,397
|
|
4,749
|
|
53,960
|
|
Other long-term debt -
subordinated
|
|
0
|
|
0
|
|
0
|
|
0
|
|
15
|
|
0
|
|
103
|
|
130
|
|
46
|
|
293
|
|
Trust Preferred Securities
|
|
0
|
|
0
|
|
0
|
|
264
|
|
0
|
|
264
|
|
0
|
|
0
|
|
0
|
|
528
|
|
Other financial liabilities
|
|
78,320
|
|
1,358
|
|
1,988
|
|
329
|
|
171
|
|
284
|
|
762
|
|
1,235
|
|
1,828
|
|
86,274
|
|
Total financial liabilities
|
|
829,009
|
|
49,996
|
|
133,803
|
|
62,580
|
|
26,576
|
|
17,033
|
|
24,169
|
|
58,245
|
|
41,401
|
|
1,242,811
|
|
Other liabilities
|
|
13,795
|
|
0
|
|
0
|
|
0
|
|
0
|
|
0
|
|
0
|
|
0
|
|
0
|
|
13,795
|
|
Total equity
|
|
0
|
|
0
|
|
0
|
|
0
|
|
0
|
|
0
|
|
0
|
|
0
|
|
68,099
|
|
68,099
|
|
Total liabilities and equity
|
|
842,804
|
|
49,996
|
|
133,803
|
|
62,580
|
|
26,576
|
|
17,033
|
|
24,169
|
|
58,245
|
|
109,499
|
|
1,324,705
|
|
Off-balance sheet commitments
given
|
|
42,737
|
|
11,379
|
|
13,969
|
|
15,500
|
|
8,712
|
|
24,010
|
|
32,770
|
|
99,808
|
|
37,641
|
|
286,525
|
|
Banks
|
|
1,243
|
|
1,538
|
|
2,018
|
|
1,765
|
|
1,502
|
|
2,555
|
|
2,180
|
|
3,167
|
|
4,592
|
|
20,560
|
|
Retail
|
|
16,057
|
|
783
|
|
683
|
|
163
|
|
165
|
|
2,058
|
|
257
|
|
822
|
|
10,258
|
|
31,244
|
|
Corporates and other
customers
|
|
25,437
|
|
9,058
|
|
11,267
|
|
13,573
|
|
7,045
|
|
19,397
|
|
30,334
|
|
95,819
|
|
22,790
|
|
234,720
|
|
|
|
|
|
|
|
|
|
|
|
|
|
|
|
|
|
|
|
|
|
|
166
|
|
Deutsche Bank
|
Operating and Financial Review
|
|
|
Annual Report 2021
|
Deutsche Bank Group
|
|
|
|
|
|
|
|
Dec 31, 2020
|
||||||||||||||||||
|
in € m.
|
|
On
demand
(incl. Over-
night and
one day
notice)
|
|
Up to
one
month
|
|
Over
1 month
to no
more
than
3 months
|
|
Over
3 months
but no
more
than
6 months
|
|
Over
6 months
but no
more
than
9 months
|
|
Over
9 months
but no
more
than
1 year
|
|
Over
1 year
but no
more
than
2 years
|
|
Over
2 years
but no
more
than
5 years
|
|
Over
5 years
|
|
Total
|
|
Deposits
|
|
375,205
|
|
20,323
|
|
85,104
|
|
47,290
|
|
10,005
|
|
6,455
|
|
5,362
|
|
8,053
|
|
9,948
|
|
567,745
|
|
Due to banks
|
|
34,818
|
|
1,364
|
|
7,860
|
|
7,969
|
|
5,353
|
|
1,354
|
|
2,961
|
|
5,853
|
|
7,901
|
|
75,432
|
|
Due to customers
|
|
340,387
|
|
18,959
|
|
77,244
|
|
39,322
|
|
4,653
|
|
5,101
|
|
2,401
|
|
2,199
|
|
2,047
|
|
492,313
|
|
Retail
|
|
151,438
|
|
3,660
|
|
57,516
|
|
28,093
|
|
992
|
|
714
|
|
605
|
|
490
|
|
150
|
|
243,656
|
|
Corporates and other
customers
|
|
188,949
|
|
15,300
|
|
19,728
|
|
11,229
|
|
3,661
|
|
4,387
|
|
1,796
|
|
1,709
|
|
1,898
|
|
248,657
|
|
Trading liabilities
|
|
372,090
|
|
0
|
|
0
|
|
0
|
|
0
|
|
0
|
|
0
|
|
0
|
|
0
|
|
372,090
|
|
Trading securities
|
|
43,882
|
|
0
|
|
0
|
|
0
|
|
0
|
|
0
|
|
0
|
|
0
|
|
0
|
|
43,882
|
|
Other trading liabilities
|
|
434
|
|
0
|
|
0
|
|
0
|
|
0
|
|
0
|
|
0
|
|
0
|
|
0
|
|
434
|
|
Negative market values from
derivative financial
instruments
|
|
327,775
|
|
0
|
|
0
|
|
0
|
|
0
|
|
0
|
|
0
|
|
0
|
|
0
|
|
327,775
|
|
Financial liabilities designed at fair value through profit or loss
|
|
12,658
|
|
18,594
|
|
9,961
|
|
2,101
|
|
86
|
|
26
|
|
347
|
|
1,494
|
|
1,316
|
|
46,582
|
|
Securities sold under repurchase agreements
|
|
11,258
|
|
18,511
|
|
9,780
|
|
2,065
|
|
0
|
|
1
|
|
11
|
|
10
|
|
0
|
|
41,636
|
|
Long-term debt
|
|
84
|
|
36
|
|
164
|
|
34
|
|
24
|
|
25
|
|
317
|
|
1,450
|
|
1,240
|
|
3,374
|
|
Other financial liabilities
designated at fair value
through profit or loss
|
|
1,316
|
|
47
|
|
17
|
|
1
|
|
62
|
|
0
|
|
18
|
|
34
|
|
77
|
|
1,572
|
|
Investment contract liabilities
|
|
0
|
|
0
|
|
0
|
|
0
|
|
0
|
|
526
|
|
0
|
|
0
|
|
0
|
|
526
|
|
Negative market values from
derivative financial instruments
qualifying for hedge accounting
|
|
0
|
|
108
|
|
245
|
|
46
|
|
11
|
|
9
|
|
65
|
|
254
|
|
541
|
|
1,279
|
|
Central bank funds purchased
|
|
0
|
|
0
|
|
0
|
|
0
|
|
0
|
|
0
|
|
0
|
|
0
|
|
0
|
|
0
|
|
Securities sold under repurchase agreements
|
|
1,815
|
|
14
|
|
1
|
|
0
|
|
0
|
|
0
|
|
9
|
|
485
|
|
1
|
|
2,325
|
|
Due to banks
|
|
1,814
|
|
13
|
|
0
|
|
0
|
|
0
|
|
0
|
|
9
|
|
409
|
|
0
|
|
2,246
|
|
Due to customers
|
|
1
|
|
0
|
|
1
|
|
0
|
|
0
|
|
0
|
|
0
|
|
76
|
|
1
|
|
79
|
|
Securities loaned
|
|
1,697
|
|
0
|
|
0
|
|
0
|
|
0
|
|
0
|
|
0
|
|
0
|
|
0
|
|
1,698
|
|
Due to banks
|
|
426
|
|
0
|
|
0
|
|
0
|
|
0
|
|
0
|
|
0
|
|
0
|
|
0
|
|
427
|
|
Due to customers
|
|
1,271
|
|
0
|
|
0
|
|
0
|
|
0
|
|
0
|
|
0
|
|
0
|
|
0
|
|
1,271
|
|
Other short term borrowings
|
|
1,385
|
|
282
|
|
366
|
|
647
|
|
400
|
|
474
|
|
0
|
|
0
|
|
0
|
|
3,553
|
|
Long-term debt
|
|
0
|
|
4,307
|
|
5,579
|
|
13,873
|
|
25,273
|
|
10,595
|
|
13,751
|
|
47,489
|
|
28,297
|
|
149,163
|
|
Debt securities - senior
|
|
0
|
|
4,143
|
|
5,229
|
|
3,643
|
|
5,093
|
|
7,356
|
|
12,462
|
|
35,199
|
|
20,266
|
|
93,391
|
|
Debt securities - subordi-
nated
|
|
0
|
|
0
|
|
14
|
|
4
|
|
0
|
|
0
|
|
0
|
|
3,948
|
|
3,386
|
|
7,352
|
|
Other long-term debt - senior
|
|
0
|
|
164
|
|
335
|
|
10,202
|
|
20,180
|
|
3,239
|
|
1,274
|
|
8,156
|
|
4,552
|
|
48,103
|
|
Other long-term debt -
subordinated
|
|
0
|
|
0
|
|
0
|
|
24
|
|
0
|
|
0
|
|
15
|
|
185
|
|
93
|
|
316
|
|
Trust Preferred Securities
|
|
0
|
|
0
|
|
0
|
|
524
|
|
269
|
|
528
|
|
0
|
|
0
|
|
0
|
|
1,321
|
|
Other financial liabilities
|
|
86,658
|
|
942
|
|
1,735
|
|
272
|
|
188
|
|
230
|
|
875
|
|
1,211
|
|
1,784
|
|
93,894
|
|
Total financial liabilities
|
|
851,507
|
|
44,569
|
|
102,991
|
|
64,753
|
|
36,232
|
|
18,843
|
|
20,410
|
|
58,985
|
|
41,888
|
|
1,240,178
|
|
Other liabilities
|
|
22,599
|
|
0
|
|
0
|
|
0
|
|
0
|
|
0
|
|
0
|
|
0
|
|
0
|
|
22,599
|
|
Total equity
|
|
0
|
|
0
|
|
0
|
|
0
|
|
0
|
|
0
|
|
0
|
|
0
|
|
62,184
|
|
62,184
|
|
Total liabilities and equity
|
|
874,107
|
|
44,569
|
|
102,991
|
|
64,753
|
|
36,232
|
|
18,843
|
|
20,410
|
|
58,985
|
|
104,072
|
|
1,324,961
|
|
Off-balance sheet commitments
given
|
|
41,744
|
|
8,996
|
|
11,000
|
|
18,109
|
|
8,285
|
|
21,379
|
|
36,149
|
|
84,924
|
|
33,269
|
|
263,854
|
|
Banks
|
|
576
|
|
1,356
|
|
1,268
|
|
2,137
|
|
1,453
|
|
1,532
|
|
2,008
|
|
2,401
|
|
2,704
|
|
15,437
|
|
Retail
|
|
16,654
|
|
802
|
|
950
|
|
333
|
|
225
|
|
1,529
|
|
349
|
|
468
|
|
10,262
|
|
31,570
|
|
Corporates and other
customers
|
|
24,514
|
|
6,838
|
|
8,783
|
|
15,639
|
|
6,607
|
|
18,318
|
|
33,792
|
|
82,054
|
|
20,303
|
|
216,847
|
|
|
|
|
|
|
|
|
|
|
|
|
|
|
|
|
|
|
|
|
|
|
167
|
|
Deutsche Bank
|
Operating and Financial Review
|
|
|
Annual Report 2021
|
Deutsche Bank Group
|
|
|
|
|
Sustainability
[Page intentionally left blank for SEC filing purposes]
168
|
|
Deutsche Bank
|
Operating and Financial Review
|
|
|
Annual Report 2021
|
Deutsche Bank Group
|
|
|
|
|
[Page intentionally left blank for SEC filing purposes]
169
|
|
Deutsche Bank
|
Operating and Financial Review
|
|
|
Annual Report 2021
|
Deutsche Bank Group
|
|
|
|
|
Employees
Group Headcount
As of December 31, 2021, we employed a total of 82,969 staff members compared to 84,659 as of December 31, 2020.
We calculate our employee figures on a full-time equivalent basis, meaning we include proportionate numbers of part-time employees.
The following table shows our numbers of full-time equivalent employees as of December 31, 2021, 2020 and 2019.
|
Employees
1
|
|
Dec 31, 2021
|
|
Dec 31, 2020
|
|
Dec 31, 2019
|
|
Germany
|
|
35,741
|
|
37,315
|
|
40,491
|
|
Europe (outside Germany), Middle East and Africa
|
|
19,311
|
|
19,617
|
|
19,672
|
|
Asia/Pacific
|
|
20,215
|
|
19,430
|
|
18,874
|
|
North America
2
|
|
7,556
|
|
8,149
|
|
8,399
|
|
Latin America
|
|
145
|
|
148
|
|
162
|
|
Total employees
|
|
82,969
|
|
84,659
|
|
87,597
|
|
|
|
|
|
|
|
|
1
Full-time equivalent employees, numbers may not add up due to rounding.
2
Primarily the United States.
The number of our employees decreased in 2021 by 1,690 or 2.0 % driven by execution of transformation initiatives announced in July 2019.
- – Germany (-1,574; -4.2 %) driven by the implementation of restructuring measures, primarily in Private Bank and infrastructure functions;
- – North America (-592; -7.3 %) driven by reductions in all divisions and related infrastructure functions;
- – Latin America (-3; -2.0 %) due to reductions primarily in Brazil as a result of the implementation of our footprint strategy;
- – EMEA ex Germany (-306; -1.6 %) mainly driven by reductions in the Private Bank and in the Corporate Bank partly offset by increases in Technology Data Innovation;
- – Asia/Pacific (+785; +4.0 %) primarily driven by increases in Technology Data Innovation.
The following table shows the distribution of full-time equivalent employees by division as of December 31, 2021, 2020 and 2019.
|
Employees
|
|
Dec 31, 2021
|
|
Dec 31, 2020
|
|
Dec 31, 2019
|
|
|
Corporate Bank (CB)
|
|
16.0 %
|
|
15.7 %
|
|
15.4 %
|
|
|
Investment Bank (IB)
|
|
8.7 %
|
|
9.0 %
|
|
8.5 %
|
|
|
Private Bank (PB)
|
|
33.9 %
|
|
35.2 %
|
|
35.9 %
|
|
|
Asset Management (AM)
|
|
4.9 %
|
|
4.6 %
|
|
4.5 %
|
|
|
Capital Release Unit (CRU)
|
|
0.3 %
|
|
0.6 %
|
|
0.7 %
|
|
|
Infrastructure
|
|
36.2 %
|
|
34.9 %
|
|
35.0 %
|
|
|
|
|
|
|
|
|
|
|
- – Corporate Bank (CB, -55; -0.4 %) mainly driven by reductions the Americas and UK, partly offset by increases mainly in APAC;
- – Investment Bank (IB, -382; -5.0 %) mainly reductions in operations functions;
- – Private Bank (PB, -1,665; -5.6 %) mainly driven by the reductions in Germany and in EMEA ex Germany;
- – Asset Management (AM, +146; +3.7 %) primarily driven by increases in Germany, UK and in Asia/Pacific;
- – Capital Release Unit (CRU, -211; -44.2 %) mainly driven by reductions related to the sale of Global Prime Finance and Electronic Equities platform;
- – Infrastructure functions (+477; +1.6 %) primarily driven by increases in Technology Data Innovation (+1,040) mainly driven by insourcing of business critical external roles, partly offset by reductions in all other infrastructure functions.
170
|
|
Deutsche Bank
|
Operating and Financial Review
|
|
|
Annual Report 2021
|
Deutsche Bank Group
|
|
|
|
|
Post-Employment Benefit Plans
We sponsor a number of post-employment benefit plans on behalf of our employees, both defined contribution plans and defined benefit plans.
In our globally coordinated accounting process covering defined benefit plans with a defined benefit obligation exceeding € 2 million our global actuary reviews the valuations provided by locally appointed actuaries in each country.
By applying our global principles for determining the financial and demographic assumptions we ensure that the assumptions are best-estimate, unbiased and mutually compatible, and that they are globally consistent.
For a further discussion on our employee benefit plans see Note 33 “Employee Benefits” to our consolidated financial statements.
171
|
|
Deutsche Bank
|
Operating and Financial Review
|
|
|
Annual Report 2021
|
Deutsche Bank Group
|
|
|
|
|
Information pursuant to Section 315a (1) of the German Commercial Code and Explanatory Report
[Page intentionally left blank for SEC filing purposes]
172
|
|
Deutsche Bank
|
Operating and Financial Review
|
|
|
Annual Report 2021
|
Deutsche Bank Group
|
|
|
|
|
Standalone parent company information (HGB)
[Page intentionally left blank for SEC filing purposes]
173
|
|
Deutsche Bank
|
Operating and Financial Review
|
|
|
Annual Report 2021
|
Deutsche Bank Group
|
|
|
|
|
2-
|
178
|
Consolidated Statement of Income
|
|
|
23 –
|
Goodwill and Other Intangible Assets – 254
|
||||||||||||||||||||
|
179
|
Consolidated Statement of Comprehensive Income
|
|
|
24 –
|
Non-Current Assets and Disposal Groups Held for Sale – 259
|
||||||||||||||||||||
|
180
|
Consolidated Balance Sheet
|
|
|
25 –
|
Other Assets and Other Liabilities – 260
|
||||||||||||||||||||
|
181
|
Consolidated Statement of Changes in Equity
|
|
|
26 –
|
Deposits – 260
|
||||||||||||||||||||
|
183
|
Consolidated Statement of Cash Flows
|
|
|
27 –
|
Provisions – 261
|
||||||||||||||||||||
|
185
|
Notes to the consolidated financial statements
|
|
|
28 –
|
Credit related Commitments and Contingent Liabilities – 274
|
||||||||||||||||||||
|
|
1 –
|
Significant accounting policies and critical accounting estimates – 185
|
|
|
29 –
|
Other Short-Term Borrowings – 275
|
|||||||||||||||||||
|
|
2 –
|
Recently adopted and new accounting pronouncements – 208
|
|
|
30 –
|
Long-Term Debt and Trust Preferred Securities – 275
|
|||||||||||||||||||
|
|
3 –
|
Acquisitions and dispositions – 210
|
|
|
31 –
|
Maturity Analysis of the earliest contractual undiscounted cash flows of Financial Liabilities – 276
|
|||||||||||||||||||
|
|
4 –
|
Business segments and related information – 211
|
|
|
32 –
|
Common Shares – 277
|
|||||||||||||||||||
|
219
|
Notes to the consolidated income statement
|
|
|
33 –
|
Employee Benefits – 278
|
||||||||||||||||||||
|
|
5 –
|
Net interest income and net gains (losses) on financial assets/liabilities at fair value through profit or loss – 219
|
|
277
|
Additional Notes
|
||||||||||||||||||||
|
|
6 –
|
Commissions and fee income – 221
|
|
|
34 –
|
Income Taxes – 291
|
|||||||||||||||||||
|
|
7 –
|
Net gains (losses) from derecognition of financial assets measured at amortized cost – 223
|
|
|
35 –
|
Derivatives – 293
|
|||||||||||||||||||
|
|
8 –
|
Other income (loss) – 223
|
|
|
36 –
|
Related Party Transactions – 296
|
|||||||||||||||||||
|
|
9 –
|
General and administrative expenses – 223
|
|
|
37 –
|
Information on Subsidiaries – 298
|
|||||||||||||||||||
|
|
10 –
|
Restructuring – 224
|
|
|
38 –
|
Structured entities – 299
|
|||||||||||||||||||
|
|
11 –
|
Earnings per share – 225
|
|
|
39 –
|
Current and non-current assets and liabilities – 304
|
|||||||||||||||||||
|
226
|
Notes to the consolidated balance sheet
|
|
|
40 –
|
Events after the reporting period – 305
|
||||||||||||||||||||
|
|
12 –
|
Financial assets/liabilities at fair value through profit or loss – 226
|
|
|
41 –
|
Regulatory capital information – 307
|
|||||||||||||||||||
|
|
13 –
|
Financial Instruments carried at Fair Value – 227
|
|
|
42 –
|
Impact of Deutsche Bank’s transformation – 311
|
|||||||||||||||||||
|
|
14 –
|
Fair Value of Financial Instruments not carried at Fair Value – 241
|
|
|
43 –
|
IBOR Reform – 312
|
|||||||||||||||||||
|
|
15 –
|
Financial assets at fair value through other comprehensive income – 243
|
|
|
44 –
|
Condensed Deutsche Bank AG (parent company only) financial information – 314
|
|||||||||||||||||||
|
|
16 –
|
Equity Method Investments – 230
|
|
|
|
|
|||||||||||||||||||
|
|
17 –
|
Offsetting Financial Assets and Financial Liabilities – 231
|
|
|
|
|
|||||||||||||||||||
|
|
18 –
|
Loans – 247
|
|
320
|
Report of Independent Registered Public Accounting Firm
|
||||||||||||||||||||
|
|
19 –
|
Allowance for Credit Losses – 248
|
|
|
|
||||||||||||||||||||
|
|
20 –
|
Transfer of Financial Assets, Assets Pledged and Received as Collateral – 250
|
|
|
|
|
|||||||||||||||||||
|
|
21 –
|
Property and Equipment – 252
|
|
|
|
||||||||||||||||||||
|
|
22 –
|
Leases – 253
|
|
|
|
||||||||||||||||||||
Consolidated Financial Statements
174
|
|
Deutsche Bank
|
Operating and Financial Review
|
|
|
Annual Report 2021
|
Deutsche Bank Group
|
|
|
|
|
Consolidated Statement of Income
|
in € m.
|
|
Notes
|
|
2021
|
|
2020
|
|
2019
|
|
Interest and similar income
1
|
|
5
|
|
|
|
|
|
|
|
Interest expense
|
|
5
|
|
|
|
|
|
|
|
Net interest income
|
|
5
|
|
|
|
|
|
|
|
Provision for credit losses
|
|
19
|
|
|
|
|
|
|
|
Net interest income after provision for credit losses
|
|
|
|
|
|
|
|
|
|
Commissions and fee income
|
|
6
|
|
|
|
|
|
|
|
Net gains (losses) on financial assets/liabilities at fair value through
profit or loss
|
|
5
|
|
|
|
|
|
|
|
Net gains (losses) from derecognition of financial assets measured at amortized cost
|
|
7
|
|
|
|
|
|
|
|
Net gains (losses) on financial assets at fair value through other
comprehensive income
|
|
|
|
|
|
|
|
|
|
Net income (loss) from equity method investments
|
|
16
|
|
|
|
|
|
|
|
Other income (loss)
|
|
8
|
|
|
|
(
|
|
(
|
|
Total noninterest income
|
|
|
|
|
|
|
|
|
|
Compensation and benefits
|
|
33
|
|
|
|
|
|
|
|
General and administrative expenses
|
|
9
|
|
|
|
|
|
|
|
Impairment of goodwill and other intangible assets
|
|
23
|
|
|
|
|
|
|
|
Restructuring activities
|
|
10
|
|
|
|
|
|
|
|
Total noninterest expenses
|
|
|
|
|
|
|
|
|
|
Profit (loss) before income taxes
|
|
|
|
|
|
|
|
(
|
|
Income tax expense (benefit)
|
|
34
|
|
|
|
|
|
|
|
Profit (loss)
|
|
|
|
|
|
|
|
(
|
|
Profit (loss) attributable to noncontrolling interests
|
|
|
|
|
|
|
|
|
|
Profit (loss) attributable to Deutsche Bank shareholders and additional
equity components
|
|
|
|
|
|
|
|
(
|
|
|
|
|
|
|
|
|
|
|
1
Interest and similar income included
€
13.4
billion
,
€
14.1
billion
and
€
18.0
billion
for the year ended December 31, 2021, 2020 and 2019, respectively, calculated based on effective interest method.
Earnings per Share
|
in € m.
|
|
Notes
|
|
2021
|
|
2020
|
|
2019
|
|
Earnings per share:
1
|
|
11
|
|
|
|
|
|
|
|
Basic
|
|
|
|
€
|
|
€
|
|
(€
|
|
Diluted
|
|
|
|
€
|
|
€
|
|
(€
|
|
Number of shares in million:
|
|
|
|
|
|
|
|
|
|
Denominator for basic earnings per share –
weighted-average shares outstanding
|
|
|
|
|
|
|
|
|
|
Denominator for diluted earnings per share –
adjusted weighted-average shares after assumed conversions
2
|
|
|
|
|
|
|
|
|
|
|
|
|
|
|
|
|
|
|
1
Earnings were adjusted by
€
363
million
,
€
349
million
and
€
330
million
before tax for the coupons paid on Additional Tier 1 Notes in April 2021, April 2020 and April 2019. In accordance with IAS 33 the coupons paid on Additional Tier 1 Notes are not attributable to Deutsche Bank shareholders and therefore need to be deducted in the calculation.
2
Due to the net loss situation for 2019 potentially dilutive shares are generally not considered for the earnings per share calculation, because to do so would decrease the net loss per share. Under a net income situation however, the number of adjusted weighted average shares after assumed conversion would have been increased by
60 million
shares for 2019.
The accompanying notes are an integral part of the Consolidated Financial Statements.
175
|
|
Deutsche Bank
|
Operating and Financial Review
|
|
|
Annual Report 2021
|
Deutsche Bank Group
|
|
|
|
|
Consolidated Statement of Comprehensive Income
|
in € m.
|
|
2021
|
|
2020
|
|
2019
|
|
Profit (loss) recognized in the income statement
|
|
|
|
|
|
(
|
|
Other comprehensive income
|
|
|
|
|
|
|
|
Items that will not be reclassified to profit or loss
|
|
|
|
|
|
|
|
Remeasurement gains (losses) related to defined benefit plans, before tax
|
|
|
|
|
|
(
|
|
Net fair value gains (losses) attributable to credit risk related to financial
liabilities designated as at fair value through profit or loss, before tax
|
|
(
|
|
(
|
|
(
|
|
Total of income tax related to items that will not be reclassified to profit or loss
|
|
(
|
|
|
|
|
|
Items that are or may be reclassified to profit or loss
|
|
|
|
|
|
|
|
Financial assets at fair value through other comprehensive income
|
|
|
|
|
|
|
|
Unrealized net gains (losses) arising during the period, before tax
|
|
(
|
|
|
|
|
|
Realized net (gains) losses arising during the period (reclassified to profit or loss),
before tax
|
|
(
|
|
(
|
|
(
|
|
Derivatives hedging variability of cash flows
|
|
|
|
|
|
|
|
Unrealized net gains (losses) arising during the period, before tax
|
|
|
|
(
|
|
(
|
|
Realized net (gains) losses arising during the period (reclassified to profit or loss),
before tax
|
|
(
|
|
|
|
(
|
|
Assets classified as held for sale
|
|
|
|
|
|
|
|
Unrealized net gains (losses) arising during the period, before tax
|
|
|
|
|
|
|
|
Realized net (gains) losses arising during the period (reclassified to profit or loss),
before tax
|
|
|
|
|
|
|
|
Foreign currency translation
|
|
|
|
|
|
|
|
Unrealized net gains (losses) arising during the period, before tax
|
|
|
|
(
|
|
(
|
|
Realized net (gains) losses arising during the period (reclassified to profit or loss),
before tax
|
|
(
|
|
|
|
(
|
|
Equity Method Investments
|
|
|
|
|
|
|
|
Net gains (losses) arising during the period
|
|
(
|
|
|
|
(
|
|
Total of income tax related to items that are or may be reclassified to profit or loss
|
|
|
|
(
|
|
|
|
Other comprehensive income (loss), net of tax
|
|
|
|
(
|
|
(
|
|
Total comprehensive income (loss), net of tax
|
|
|
|
(
|
|
(
|
|
Attributable to:
|
|
|
|
|
|
|
|
Noncontrolling interests
|
|
|
|
|
|
|
|
Deutsche Bank shareholders and additional equity components
|
|
|
|
(
|
|
(
|
|
|
|
|
|
|
|
|
The accompanying notes are an integral part of the Consolidated Financial Statements.
176
|
|
Deutsche Bank
|
Operating and Financial Review
|
|
|
Annual Report 2021
|
Deutsche Bank Group
|
|
|
|
|
Consolidated Balance Sheet
|
in € m.
|
|
Notes
|
|
Dec 31, 2021
|
|
Dec 31, 2020
|
|
Assets:
|
|
|
|
|
|
|
|
Cash and central bank balances
|
|
|
|
|
|
|
|
Interbank balances (w/o central banks)
|
|
|
|
|
|
|
|
Central bank funds sold and securities purchased under resale agreements
|
|
20
|
|
|
|
|
|
Securities borrowed
|
|
20
|
|
|
|
|
|
Financial assets at fair value through profit or loss
|
|
|
|
|
|
|
|
Trading assets
|
|
|
|
|
|
|
|
Positive market values from derivative financial instruments
|
|
|
|
|
|
|
|
Non-trading financial assets mandatory at fair value through profit and loss
|
|
|
|
|
|
|
|
Financial assets designated at fair value through profit or loss
|
|
|
|
|
|
|
|
Total financial assets at fair value through profit or loss
|
|
12, 13, 20, 35
|
|
|
|
|
|
Financial assets at fair value through other comprehensive income
|
|
15
|
|
|
|
|
|
Equity method investments
|
|
16
|
|
|
|
|
|
Loans at amortized cost
|
|
18, 19, 20
|
|
|
|
|
|
Property and equipment
|
|
21, 22
|
|
|
|
|
|
Goodwill and other intangible assets
|
|
23
|
|
|
|
|
|
Other assets
1
|
|
24, 25
|
|
|
|
|
|
Assets for current tax
|
|
|
|
|
|
|
|
Deferred tax assets
|
|
34
|
|
|
|
|
|
Total assets
|
|
|
|
|
|
|
|
|
|
|
|
|
|
|
|
Liabilities and equity:
|
|
|
|
|
|
|
|
Deposits
|
|
26
|
|
|
|
|
|
Central bank funds purchased and securities sold under repurchase agreements
|
|
20
|
|
|
|
|
|
Securities loaned
|
|
20
|
|
|
|
|
|
Financial liabilities at fair value through profit or loss
|
|
|
|
|
|
|
|
Trading liabilities
|
|
|
|
|
|
|
|
Negative market values from derivative financial instruments
|
|
|
|
|
|
|
|
Financial liabilities designated at fair value through profit or loss
|
|
|
|
|
|
|
|
Investment contract liabilities
|
|
|
|
|
|
|
|
Total financial liabilities at fair value through profit or loss
|
|
12, 13, 20, 35
|
|
|
|
|
|
Other short-term borrowings
|
|
29
|
|
|
|
|
|
Other liabilities
1
|
|
22, 24, 25
|
|
|
|
|
|
Provisions
|
|
19, 27
|
|
|
|
|
|
Liabilities for current tax
|
|
|
|
|
|
|
|
Deferred tax liabilities
|
|
34
|
|
|
|
|
|
Long-term debt
|
|
30
|
|
|
|
|
|
Trust preferred securities
|
|
30
|
|
|
|
|
|
Total liabilities
|
|
|
|
|
|
|
|
Common shares, no par value, nominal value of € 2.56
|
|
32
|
|
|
|
|
|
Additional paid-in capital
|
|
|
|
|
|
|
|
Retained earnings
|
|
|
|
|
|
|
|
Common shares in treasury, at cost
|
|
32
|
|
(
|
|
(
|
|
Accumulated other comprehensive income (loss), net of tax
|
|
|
|
(
|
|
(
|
|
Total shareholders’ equity
|
|
|
|
|
|
|
|
Additional equity components
|
|
|
|
|
|
|
|
Noncontrolling interests
|
|
|
|
|
|
|
|
Total equity
|
|
|
|
|
|
|
|
Total liabilities and equity
|
|
|
|
|
|
|
|
|
|
|
|
|
|
|
1
Includes non-current assets and disposal groups held for sale
.
The accompanying notes are an integral part of the Consolidated Financial Statements.
177
|
|
Deutsche Bank
|
Consolidated Statement of Changes in Equity
|
|
|
Annual Report 2021
|
|
|
|
|
|
Consolidated Statement of Changes in Equity
|
178
|
|
|
Deutsche Bank
|
Consolidated Statement of Changes in Equity
|
|
|
Annual Report 2021
|
|
|
|
|
|
|
|
|
|
|
|
|
|
|
|
|
Unrealized net gains (losses)
|
|
|
|
|
|
|
|
|
|
|
|
|
|
|
||||||
|
in € m.
|
|
Common shares
(no par value)
|
|
Additional
paid-in capital
|
|
Retained
earnings
|
|
Common shares
in treasury,
at cost
|
|
On financial
assets at fair
value through
other
compre-
hensive
income,
net of tax
2
|
|
Attributable to
change in own
credit risk of
financial
liabilities
designated as
at fair value
through profit
and loss,
net of tax
2
|
|
On
derivatives
hedging
variability of
cash flows,
net of tax
2
|
|
On assets
classified as
held for sale,
net of tax
2
|
|
Foreign
currency
translation,
net of tax
2
|
|
Unrealized
net gains
(losses) from
equity method
investments
|
|
Accumula-
ted other
comprehen-
sive income,
net of tax
1
|
|
Total
shareholders’
equity
|
|
Additional
equity
components
3
|
|
Noncontrolling
interests
|
|
Total equity
|
|
Balance as of December 31, 2018
|
|
|
|
|
|
|
|
(
|
|
(
|
|
|
|
|
|
|
|
|
|
|
|
|
|
|
|
|
|
|
|
|
|
IFRS 16 transition impact
|
|
|
|
|
|
(
|
|
|
|
|
|
|
|
|
|
|
|
|
|
|
|
|
|
(
|
|
|
|
|
|
(
|
|
Balance as of January 1, 2019 (IFRS 16)
|
|
|
|
|
|
|
|
(
|
|
(
|
|
|
|
|
|
|
|
|
|
|
|
|
|
|
|
|
|
|
|
|
|
Total comprehensive income (loss), net of tax
1
|
|
|
|
|
|
(
|
|
|
|
|
|
(
|
|
(
|
|
|
|
|
|
(
|
|
|
|
(
|
|
|
|
|
|
(
|
|
Gains (losses) attributable to equity instruments designated as at fair value through other comprehensive income, net of tax
|
|
|
|
|
|
|
|
|
|
|
|
|
|
|
|
|
|
|
|
|
|
|
|
|
|
|
|
|
|
|
|
Gains (losses) upon early extinguishment attributable to change in own credit risk of financial liabilities designated as at fair value through profit and loss, net of tax
|
|
|
|
|
|
|
|
|
|
|
|
|
|
|
|
|
|
|
|
|
|
|
|
|
|
|
|
|
|
|
|
Cash dividends paid
|
|
|
|
|
|
(
|
|
|
|
|
|
|
|
|
|
|
|
|
|
|
|
|
|
(
|
|
|
|
(
|
|
(
|
|
Coupon on additional equity components, before tax
|
|
|
|
|
|
(
|
|
|
|
|
|
|
|
|
|
|
|
|
|
|
|
|
|
(
|
|
|
|
|
|
(
|
|
Remeasurement gains (losses) related to defined benefit plans, net of tax
|
|
|
|
|
|
(
|
|
|
|
|
|
|
|
|
|
|
|
|
|
|
|
|
|
(
|
|
|
|
(
|
|
(
|
|
Net change in share awards in the reporting period
|
|
|
|
|
|
|
|
|
|
|
|
|
|
|
|
|
|
|
|
|
|
|
|
|
|
|
|
|
|
|
|
Treasury shares distributed under share-based compensation plans
|
|
|
|
|
|
|
|
|
|
|
|
|
|
|
|
|
|
|
|
|
|
|
|
|
|
|
|
|
|
|
|
Tax benefits related to share-based compensation plans
|
|
|
|
|
|
|
|
|
|
|
|
|
|
|
|
|
|
|
|
|
|
|
|
|
|
|
|
|
|
|
|
Option premiums and other effects from options on common shares
|
|
|
|
|
|
|
|
|
|
|
|
|
|
|
|
|
|
|
|
|
|
|
|
|
|
|
|
|
|
|
|
Purchases of treasury shares
|
|
|
|
|
|
|
|
(
|
|
|
|
|
|
|
|
|
|
|
|
|
|
|
|
(
|
|
|
|
|
|
(
|
|
Sale of treasury shares
|
|
|
|
|
|
|
|
|
|
|
|
|
|
|
|
|
|
|
|
|
|
|
|
|
|
|
|
|
|
|
|
Net gains (losses) on treasury shares sold
|
|
|
|
|
|
|
|
|
|
|
|
|
|
|
|
|
|
|
|
|
|
|
|
|
|
|
|
|
|
|
|
Other
|
|
|
|
|
|
|
|
|
|
|
|
|
|
|
|
|
|
|
|
|
|
|
|
|
|
(
|
|
(
|
|
|
|
Balance as of December 31, 2019
|
|
|
|
|
|
|
|
(
|
|
|
|
|
|
|
|
|
|
|
|
|
|
|
|
|
|
|
|
|
|
|
|
Total comprehensive income (loss), net of tax
1
|
|
|
|
|
|
|
|
|
|
|
|
(
|
|
(
|
|
|
|
(
|
|
(
|
|
(
|
|
(
|
|
|
|
|
|
(
|
|
Gains (losses) attributable to equity instruments designated as at fair value through other comprehensive income, net of tax
|
|
|
|
|
|
|
|
|
|
|
|
|
|
|
|
|
|
|
|
|
|
|
|
|
|
|
|
|
|
|
|
Gains (losses) upon early extinguishment attributable to change in own credit risk of financial liabilities designated as at fair value through profit and loss, net of tax
|
|
|
|
|
|
|
|
|
|
|
|
|
|
|
|
|
|
|
|
|
|
|
|
|
|
|
|
|
|
|
|
Cash dividends paid
|
|
|
|
|
|
|
|
|
|
|
|
|
|
|
|
|
|
|
|
|
|
|
|
|
|
|
|
(
|
|
(
|
|
Coupon on additional equity components, before tax
|
|
|
|
|
|
(
|
|
|
|
|
|
|
|
|
|
|
|
|
|
|
|
|
|
(
|
|
|
|
|
|
(
|
|
Remeasurement gains (losses) related to defined benefit plans, net of tax
|
|
|
|
|
|
|
|
|
|
|
|
|
|
|
|
|
|
|
|
|
|
|
|
|
|
|
|
|
|
|
|
Net change in share awards in the reporting period
|
|
|
|
(
|
|
|
|
|
|
|
|
|
|
|
|
|
|
|
|
|
|
|
|
(
|
|
|
|
(
|
|
(
|
|
Treasury shares distributed under share-based compensation plans
|
|
|
|
|
|
|
|
|
|
|
|
|
|
|
|
|
|
|
|
|
|
|
|
|
|
|
|
|
|
|
|
Tax benefits related to share-based compensation plans
|
|
|
|
|
|
|
|
|
|
|
|
|
|
|
|
|
|
|
|
|
|
|
|
|
|
|
|
|
|
|
|
Option premiums and other effects from options on common shares
|
|
|
|
|
|
|
|
|
|
|
|
|
|
|
|
|
|
|
|
|
|
|
|
|
|
|
|
|
|
|
|
Purchases of treasury shares
|
|
|
|
|
|
|
|
(
|
|
|
|
|
|
|
|
|
|
|
|
|
|
|
|
(
|
|
|
|
|
|
(
|
|
Sale of treasury shares
|
|
|
|
|
|
|
|
|
|
|
|
|
|
|
|
|
|
|
|
|
|
|
|
|
|
|
|
|
|
|
|
Net gains (losses) on treasury shares sold
|
|
|
|
|
|
|
|
|
|
|
|
|
|
|
|
|
|
|
|
|
|
|
|
|
|
|
|
|
|
|
|
Other
|
|
|
|
|
|
|
|
|
|
|
|
|
|
|
|
|
|
|
|
|
|
|
|
|
|
|
|
(
|
|
|
|
Balance as of December 31, 2020
|
|
|
|
|
|
|
|
(
|
|
|
|
|
|
|
|
|
|
(
|
|
(
|
|
(
|
|
|
|
|
|
|
|
|
|
Total comprehensive income (loss), net of tax
1
|
|
|
|
|
|
|
|
|
|
(
|
|
(
|
|
(
|
|
|
|
|
|
(
|
|
|
|
|
|
|
|
|
|
|
|
Gains (losses) attributable to equity instruments designated as at fair value through other comprehensive income, net of tax
|
|
|
|
|
|
|
|
|
|
|
|
|
|
|
|
|
|
|
|
|
|
|
|
|
|
|
|
|
|
|
|
Gains (losses) upon early extinguishment attributable to change in own credit risk
of financial liabilities designated as at fair value through profit and loss, net of tax
|
|
|
|
|
|
(
|
|
|
|
|
|
|
|
|
|
|
|
|
|
|
|
|
|
|
|
|
|
|
|
|
|
Cash dividends paid
|
|
|
|
|
|
|
|
|
|
|
|
|
|
|
|
|
|
|
|
|
|
|
|
|
|
|
|
(
|
|
(
|
|
Coupon on additional equity components, before tax
|
|
|
|
|
|
(
|
|
|
|
|
|
|
|
|
|
|
|
|
|
|
|
|
|
(
|
|
|
|
|
|
(
|
|
Remeasurement gains (losses) related to defined benefit plans, net of tax
|
|
|
|
|
|
|
|
|
|
|
|
|
|
|
|
|
|
|
|
|
|
|
|
|
|
|
|
|
|
|
|
Net change in share awards in the reporting period
|
|
|
|
(
|
|
|
|
|
|
|
|
|
|
|
|
|
|
|
|
|
|
|
|
(
|
|
|
|
(
|
|
(
|
|
Treasury shares distributed under share-based compensation plans
|
|
|
|
|
|
|
|
|
|
|
|
|
|
|
|
|
|
|
|
|
|
|
|
|
|
|
|
|
|
|
|
Tax benefits related to share-based compensation plans
|
|
|
|
|
|
|
|
|
|
|
|
|
|
|
|
|
|
|
|
|
|
|
|
|
|
|
|
|
|
|
|
Option premiums and other effects from options on common shares
|
|
|
|
(
|
|
|
|
|
|
|
|
|
|
|
|
|
|
|
|
|
|
|
|
(
|
|
|
|
|
|
(
|
|
Purchases of treasury shares
|
|
|
|
|
|
|
|
(
|
|
|
|
|
|
|
|
|
|
|
|
|
|
|
|
(
|
|
|
|
|
|
(
|
|
Sale of treasury shares
|
|
|
|
|
|
|
|
|
|
|
|
|
|
|
|
|
|
|
|
|
|
|
|
|
|
|
|
|
|
|
|
Net gains (losses) on treasury shares sold
|
|
|
|
|
|
|
|
|
|
|
|
|
|
|
|
|
|
|
|
|
|
|
|
|
|
|
|
|
|
|
|
Other
|
|
|
|
|
|
|
|
|
|
|
|
|
|
|
|
|
|
|
|
|
|
|
|
|
|
|
|
(
|
|
|
|
Balance as of December 31, 2021
|
|
|
|
|
|
|
|
(
|
|
(
|
|
(
|
|
(
|
|
|
|
(
|
|
(
|
|
(
|
|
|
|
|
|
|
|
|
|
|
|
|
|
|
|
|
|
|
|
|
|
|
|
|
|
|
|
|
|
|
|
|
|
|
|
|
|
|
|
|
1
Excluding remeasurement gains (losses) related to defined benefit plans, net of tax.
2
Excluding unrealized net gains (losses) from equity method investments
.
3
Includes Additional Tier 1 Notes, which constitute unsecured and subordinated notes of Deutsche Bank and are classified as equity in accordance with IFRS.
4
Includes net proceeds from issuance, purchase and sale of Additional Equity Components.
|
179
|
|
|
Deutsche Bank
|
Additional Notes
|
|
|
Annual Report 2021
|
|
|
|
|
|
Consolidated Statement of Cash Flows
|
180
|
|
|
Deutsche Bank
|
Additional Notes
|
|
|
Annual Report 2021
|
|
|
|
|
|
|
in € m.
|
|
2021
|
|
2020
|
|
2019
|
|
Net Income (loss)
|
|
|
|
|
|
(
|
|
Cash flows from operating activities:
|
|
|
|
|
|
|
|
Adjustments to reconcile net income to net cash provided by (used in) operating activities:
|
|
|
|
|
|
|
|
Provision for credit losses
|
|
|
|
|
|
|
|
Restructuring activities
|
|
|
|
|
|
|
|
Gain on sale of financial assets at fair value through other comprehensive income, equity method investments and other
|
|
(
|
|
(
|
|
(
|
|
Deferred income taxes, net
|
|
|
|
(
|
|
|
|
Impairment, depreciation and other amortization, and accretion
|
|
|
|
|
|
|
|
Share of net income from equity method investments
|
|
(
|
|
(
|
|
(
|
|
Income (loss) adjusted for noncash charges, credits and other items
|
|
|
|
|
|
|
|
Adjustments for net change in operating assets and liabilities:
|
|
|
|
|
|
|
|
Interest-earning time deposits with central banks and banks
|
|
|
|
(
|
|
(
|
|
Central bank funds sold, securities purchased under resale agreements, securities borrowed
|
|
|
|
|
|
(
|
|
Non-Trading financial assets mandatory at fair value through profit and loss
|
|
(
|
|
|
|
|
|
Financial assets designated at fair value through profit or loss
|
|
|
|
(
|
|
|
|
Loans at amortized cost
|
|
(
|
|
(
|
|
(
|
|
Other assets
|
|
|
|
(
|
|
|
|
Deposits
|
|
|
|
(
|
|
|
|
Financial liabilities designated at fair value through profit or loss and investment contract liabilities
1
|
|
|
|
(
|
|
(
|
|
Central bank funds purchased, securities sold under repurchase agreements, securities loaned
|
|
(
|
|
|
|
(
|
|
Other short-term borrowings
|
|
|
|
(
|
|
(
|
|
Other liabilities
|
|
(
|
|
|
|
(
|
|
Senior long-term debt
2
|
|
(
|
|
|
|
(
|
|
Trading assets and liabilities, positive and negative market values from derivative financial instruments, net
|
|
|
|
|
|
|
|
Other, net
|
|
(
|
|
|
|
(
|
|
Net cash provided by (used in) operating activities
|
|
(
|
|
|
|
(
|
|
Cash flows from investing activities:
|
|
|
|
|
|
|
|
Proceeds from:
|
|
|
|
|
|
|
|
Sale of financial assets at fair value through other comprehensive income
|
|
|
|
|
|
|
|
Maturities of financial assets at fair value through other comprehensive income
|
|
|
|
|
|
|
|
Sale of debt securities held to collect at amortized cost
|
|
|
|
|
|
|
|
Maturities of debt securities held to collect at amortized cost
|
|
|
|
|
|
|
|
Sale of equity method investments
|
|
|
|
|
|
|
|
Sale of property and equipment
|
|
|
|
|
|
|
|
Purchase of:
|
|
|
|
|
|
|
|
Financial assets at fair value through other comprehensive income
|
|
(
|
|
(
|
|
(
|
|
Debt Securities held to collect at amortized cost
|
|
(
|
|
(
|
|
(
|
|
Equity method investments
|
|
(
|
|
(
|
|
(
|
|
Property and equipment
|
|
(
|
|
(
|
|
(
|
|
Net cash received in (paid for) business combinations/divestitures
|
|
(
|
|
|
|
|
|
Other, net
|
|
(
|
|
(
|
|
(
|
|
Net cash provided by (used in) investing activities
|
|
|
|
(
|
|
(
|
|
Cash flows from financing activities:
|
|
|
|
|
|
|
|
Issuances of subordinated long-term debt
|
|
|
|
|
|
|
|
Repayments and extinguishments of subordinated long-term debt
|
|
(
|
|
(
|
|
(
|
|
Issuances of trust preferred securities
|
|
|
|
|
|
|
|
Repayments and extinguishments of trust preferred securities
|
|
(
|
|
(
|
|
(
|
|
Principal portion of lease payments
|
|
(
|
|
(
|
|
(
|
|
Common shares issued
|
|
|
|
|
|
|
|
Purchases of treasury shares
|
|
(
|
|
(
|
|
(
|
|
Sale of treasury shares
|
|
|
|
|
|
|
|
Additional Equity Components (AT1) issued
|
|
|
|
|
|
|
|
Purchases of Additional Equity Components (AT1)
|
|
(
|
|
(
|
|
(
|
|
Sale of Additional Equity Components (AT1)
|
|
|
|
|
|
|
|
Coupon on additional equity components, pre tax
|
|
(
|
|
(
|
|
(
|
|
Dividends paid to noncontrolling interests
|
|
(
|
|
(
|
|
(
|
|
Net change in noncontrolling interests
|
|
(
|
|
(
|
|
(
|
|
Cash dividends paid to Deutsche Bank shareholders
|
|
|
|
|
|
(
|
|
Other, net
|
|
|
|
|
|
|
|
Net cash provided by (used in) financing activities
|
|
|
|
(
|
|
(
|
|
Net effect of exchange rate changes on cash and cash equivalents
|
|
|
|
(
|
|
|
|
Net increase (decrease) in cash and cash equivalents
|
|
|
|
|
|
(
|
|
Cash and cash equivalents at beginning of period
|
|
|
|
|
|
|
|
Cash and cash equivalents at end of period
|
|
|
|
|
|
|
|
Net cash provided by (used in) operating activities include
|
|
|
|
|
|
|
|
Income taxes paid (received), net
|
|
|
|
|
|
|
|
Interest paid
|
|
|
|
|
|
|
|
Interest received
|
|
|
|
|
|
|
|
Dividends received
|
|
|
|
|
|
|
|
Cash and cash equivalents comprise
|
|
|
|
|
|
|
|
Cash and central bank balances (not included: Interest-earning time deposits with central banks of € 17.9 billion as of December 31, 2021, € 16.9 billion as of December 31, 2020 and € 16.2 billion as of December 31, 2019)
|
|
|
|
|
|
|
|
Interbank balances (w/o central banks) (not included: Interest-earning time deposits with banks of € 1.5 billion as of December 31, 2021, 2.1 billion as of December 31 2020 and 2.2 billion as of December 31 2019)
|
|
|
|
|
|
|
|
Total
|
|
|
|
|
|
|
|
|
|
|
|
|
|
|
1
Included are senior long-term debt issuances of
€
1.3
billion
and
€
2.3
billion
and repayments and extinguishments of
€
1.0
billion
and
€
3.5
billion
through December 31, 2021 and December 31, 2020, respectively
.
2
Included are issuances of
€
33.6
billion
and
€
67.4
billion
and repayments and extinguishments of
€
39.5
billion
and
€
51.4
billion
through December 31, 2021 and December 31, 2020, respectively.
3
Non-cash changes for Subordinated Long Term Debt are
€
123
million
in total and mainly driven by Foreign Exchange movements of
€
293
million
and Fair Value changes of
€ (
179
) million
.
4
Non-cash changes for Trust Preferred Securities are
€ (
289
) million
in total and mainly driven by Fair Value changes of
€ (
267
) million
.
The accompanying notes are an integral part of the Consolidated Financial Statements.
|
181
|
|
|
Deutsche Bank
|
Additional Notes
|
|
|
Annual Report 2021
|
|
|
|
|
|
Notes to the consolidated financial statements
01 –
Significant accounting policies and critical accounting estimates
Basis of accounting
Deutsche Bank Aktiengesellschaft, Frankfurt am Main (“Deutsche Bank” or the “Parent”) is a stock corporation organized under the laws of the Federal Republic of Germany. Deutsche Bank together with all entities in which Deutsche Bank has a controlling financial interest (collectively the “Group”, “Deutsche Bank” or “DB”) is a global provider of a full range of corporate and investment banking, private clients and asset management products and services.
The accompanying consolidated financial statements are stated in euros, the presentation currency of the Group. All financial information presented in million euros has been rounded to the nearest million. The consolidated financial statements have been prepared in accordance with International Financial Reporting Standards (“IFRS”) as issued by the International Accounting Standards Board (“IASB”).
EU carve-out
For purposes of the Group’s primary financial reporting outside the United States, the Group prepares its consolidated financial statements in accordance with IFRS as endorsed by the EU. For purposes of the Group’s consolidated financial statements prepared in accordance with IFRS as endorsed by the EU, the Group applies fair value hedge accounting for portfolio hedges of interest rate risk (fair value macro hedges) in accordance with the EU carve-out version of IAS 39. The purpose of applying the EU carve-out version of IAS 39 is to align the Group’s hedge accounting approach with its risk management practice and the accounting practice of its major European peers. Under the EU carve-out version of IAS 39, fair value macro hedge accounting may be applied to core deposits and hedge ineffectiveness is only recognized when the revised estimate of the amount of cash flows in scheduled time buckets falls below the original designated amount of that bucket. If the revised amount of cash flows in scheduled time buckets is more than the original designated amount then there is no hedge ineffectiveness. Under IFRS as issued by the IASB, hedge accounting for fair value macro hedges cannot be applied to core deposits. In addition, under IFRS as issued by the IASB hedge ineffectiveness arises for all fair value macro hedge accounting relationships whenever the revised estimate of the amount of cash flows in scheduled time buckets is either more or less than the original designated amount of that bucket.
For the financial year ended December 31, 2021, the application of the EU carve-out version of IAS 39 had a negative impact of
€
128
million
on profit before tax and of
€
85
million
on profit after tax. For the financial year ended December 31, 2020, the application of the EU carve-out had a positive impact of
€
180
million
on profit before taxes and of
€
12
million
on profit post taxes.
The Group’s regulatory capital and ratios thereof are also reported on the basis of the EU carve-out version of IAS 39. The impact on profit also impacts the calculation of the CET1 capital ratio. For the financial year ended December 31, 2021, application of the EU carve-out had a negative impact on the CET1 capital ratio of about
2
basis points and a positive impact of less than
1
basis point for the financial year ended December 31, 2020.
IFRS 7 disclosures
Disclosures about the nature and the extent of risks arising from financial instruments as required by IFRS 7, “Financial Instruments: Disclosures” are set forth in the Risk Report section of the Management Report and are an integral part of the Consolidated Financial Statements. These audited disclosures are marked in light blue in the Risk Report.
COVID-19 and Climate risk related disclosures
The impact of the COVID-19 pandemic on the Group’s financial statements is reflected as follows:
|
182
|
|
|
Deutsche Bank
|
Additional Notes
|
|
|
Annual Report 2021
|
|
|
|
|
|
- – The Management Report section includes the impact of COVID-19 on the Group’s financial targets and client franchise, on the Global Economy and on the Macroeconomic and market conditions in the chapters Strategy, Outlook and Risks and Opportunities, respectively.
- – The Risk Report section includes references to the COVID-19 pandemic in the Risk and Capital Management chapter, section “IFRS 9 impairment” specifically in the line items “Forward Looking Information”, “IFRS 9-Application of EBA guidance regarding Default, Forbearance in light of COVID-19 measures”, “Legislative and non-legislative moratoria and public guarantee schemes in light of COVID-19 Pandemic”, “ECL Model results” and “Focus Industries in light of COVID-19 Pandemic”. The Risk and Capital Performance chapter includes the impact of supervisory measures in reaction to the COVID-19 pandemic in the line item “Minimum capital requirements and additional capital buffers”.
- – The accompanying consolidated financial statements include COVID-19 related disclosures in Note 5 “Net interest income and net gains (losses) on financial assets/liabilities at fair value through profit or loss”, Note 13 “Financial instruments measured at fair value”, Note 23 “Goodwill and Other Intangible Assets” and Note 33 “Employee Benefits”.
- – The section Supplementary Information (Unaudited) describes the impact of COVID-19 on the Group transformation charges in the Non-GAAP Financial Measures chapter.
The impact from Climate risk on the Group’s financial statements is reflected as follows:
- – The Management Report section includes the impact of Climate risk on the Group’s financial targets and client franchise, on the Global Economy and on the Macroeconomic and market conditions in the chapters Risks and Opportunities and Sustainability respectively.
- – The Risk Report section includes references to Climate risk in the Risk and Capital Framework chapter, the Risk and Capital Management chapter (section “Credit Risk Management and Asset Quality”, line item IFRS 9 Impairment) and the Enterprise risk management chapter (section Environmental, social and governance risk).
Change in accounting estimates
In the second quarter 2021, the Group refined one of the process-related Stage 2 triggers in the Group’s ECL model. Financial assets added to the watchlist for discretionary reasons are now transferred to Stage 2, whereas prior to this change only assets added to the watchlist for mandatory reasons were transferred to Stage 2. The methodology change resulted in an increase of the Group’s allowance for loan losses of
€
60
million
during the financial year ended December 31, 2021.
In the third quarter 2021, the Group introduced refinements to its IFRS 9 expected credit loss (ECL) model to reflect a new regulatory definition of default. This new definition of default lead to transactions being migrated to Stage 3. As loss expectations to the underlying transactions are not expected to materially change, a recalibration of the Loss Given Default (LGD) factor in the ECL model is required. Starting in the third quarter 2021, the Group recorded a management overlay to adjust for the expected LGD recalibration impact that will be implemented in the ECL model in 2022. Therefore, while the implementation of the new definition of default is a change in estimate, the overall effect is immaterial when considered together with the management overlay. For further details please refer to Risk Report and the section “IFRS 9 impairment”.
In the fourth quarter 2021, a revised discount curve methodology that provides improved data quality for the determination of the underlying bond universe was approved for use in the UK. The Group’s adoption of this methodology resulted in a net actuarial gain of around
€
45
million
that was recognized through Other Comprehensive Income. This resulted in a corresponding increase to the overall pension surplus and the net defined benefit asset, due to the net presentation of the pension plan assets and the defined benefit obligation.
Critical accounting estimates
The preparation of financial statements under IFRS requires management to make estimates and assumptions for certain categories of assets and liabilities. These estimates and assumptions affect the reported amounts of assets and liabilities and disclosure of contingent assets and liabilities at the balance sheet date, and the reported amounts of revenue and expenses during the reporting period. Actual results could differ from management’s estimates, especially in relation to the COVID-19 pandemic. The Group’s significant accounting policies are described in “Significant Accounting Policies”.
Certain of the Group’s accounting policies require critical accounting estimates that involve complex and subjective judgments and the use of assumptions, some of which may be for matters that are inherently uncertain and susceptible to change. Such critical accounting estimates could change from period to period and may have a material impact on the Group’s financial condition, changes in financial condition or results of operations. Critical accounting estimates could also involve estimates where management could have reasonably used another estimate in the current accounting period. The Group has identified the following significant accounting policies that involve critical accounting estimates:
- – the impairment of associates (see “Associates” below)
- – the impairment of financial assets at fair value through other comprehensive income (see “Impairment of Loans and Provision for Off-balance Sheet Positions” below)
- – the determination of fair value (see “Determination of Fair Value” below)
- – the recognition of trade date profit (see “Recognition of Trade Date Profit” below)
- – the impairment of loans and provisions for off-balance sheet positions (see “Impairment of Loans and Provision for Off-balance Sheet Positions” below)
- – the impairment of goodwill and other intangibles (see “Goodwill and Other Intangible Assets” below)
- – the recognition and measurement of deferred tax assets (see “Income Taxes” below)
- – the accounting for legal and regulatory contingencies and uncertain tax positions (see “Provisions” below)
|
183
|
|
|
Deutsche Bank
|
Additional Notes
|
|
|
Annual Report 2021
|
|
|
|
|
|
Significant accounting policies
The following is a description of the significant accounting policies of the Group. Except for the changes in accounting policies and changes in accounting estimates described previously and noted below these policies have been consistently applied for 2019, 2020 and 2021.
|
184
|
|
|
Deutsche Bank
|
Additional Notes
|
|
|
Annual Report 2021
|
|
|
|
|
|
Principles of consolidation
The financial information in the Consolidated Financial Statements includes the parent company, Deutsche Bank AG, together with its consolidated subsidiaries, including certain structured entities presented as a single economic unit.
Subsidiaries
The Group’s subsidiaries are those entities which it directly or indirectly controls. Control over an entity is evidenced by the Group’s ability to exercise its power in order to affect any variable returns that the Group is exposed to through its involvement with the entity.
The Group sponsors the formation of structured entities and interacts with structured entities sponsored by third parties for a variety of reasons, including allowing clients to hold investments in separate legal entities, allowing clients to invest jointly in alternative assets, for asset securitization transactions, and for buying or selling credit protection.
When assessing whether to consolidate an entity, the Group evaluates a range of control factors, namely:
- – the purpose and design of the entity
- – the relevant activities and how these are determined
- – whether the Group’s rights result in the ability to direct the relevant activities
- – whether the Group has exposure or rights to variable returns
- – whether the Group has the ability to use its power to affect the amount of its returns
Where voting rights are relevant, the Group is deemed to have control where it holds, directly or indirectly, more than half of the voting rights over an entity unless there is evidence that another investor has the practical ability to unilaterally direct the relevant activities.
Potential voting rights that are deemed to be substantive are also considered when assessing control.
Likewise, the Group also assesses existence of control where it does not control the majority of the voting power but has the practical ability to unilaterally direct the relevant activities. This may arise in circumstances where the size and dispersion of holdings of the shareholders give the Group the power to direct the activities of the investee.
The Group reassesses the consolidation status at least at every quarterly reporting date. Therefore, any changes in the structure leading to a change in one or more of the control factors, require reassessment when they occur. This includes changes in decision making rights, changes in contractual arrangements, changes in the financing, ownership or capital structure as well as changes following a trigger event which was anticipated in the original documentation.
All intercompany transactions, balances and unrealized gains on transactions between Group companies are eliminated on consolidation.
Consistent accounting policies are applied throughout the Group for the purposes of consolidation. Issuances of a subsidiary’s stock to third parties are treated as non-controlling interests. Profit or loss attributable to non-controlling interests are reported separately in the Consolidated Statement of Income and Consolidated Statement of Comprehensive Income.
At the date that control of a subsidiary is lost, the Group: a) derecognizes the assets (including attributable goodwill) and liabilities of the subsidiary at their carrying amounts, b) derecognizes the carrying amount of any non-controlling interests in the former subsidiary, c) recognizes the fair value of the consideration received and any distribution of the shares of the subsidiary, d) recognizes any investment retained in the former subsidiary at its fair value and e) recognizes any resulting difference of the above items as a gain or loss in the income statement. Any amounts recognized in prior periods in other comprehensive income in relation to that subsidiary would be reclassified to the Consolidated Statement of Income or transferred directly to retained earnings if required by other IFRSs.
Associates
Investments in associates are accounted for under the equity method of accounting. An associate is an entity in which the Group has significant influence, but not a controlling interest, over the operating and financial management policy decisions of the entity. Significant influence is generally presumed when the Group holds between
20
%
and
50
%
of the voting rights. The existence and effect of potential voting rights that are currently exercisable or convertible are considered in assessing whether the Group has significant influence. Among the other factors that are considered in determining whether the Group has significant influence are representation on the board of directors (supervisory board in the case of German stock corporations) and material intercompany transactions. The existence of these factors could require the application of the equity method of accounting for a particular investment even though the Group’s investment is less than
20
%
of the voting stock.
Under the equity method of accounting, the Group’s investments in associates and jointly controlled entities are initially recorded at cost including any directly related transaction costs incurred in acquiring the associate, and subsequently increased (or decreased) to reflect both the Group’s pro-rata share of the post-acquisition net income (or loss) of the associate or jointly controlled entity and other movements included directly in the equity of the associate or jointly controlled entity. The Group’s share of the results of associates is adjusted to conform to the accounting policies of the Group and is reported in the Consolidated Statement of Income as Net income (loss) from equity method investments. The Group’s share in the associate’s profits and losses resulting from intercompany sales is eliminated on consolidation. Goodwill arising on the acquisition of an associate or a jointly controlled entity is included in the carrying value of the investment. As goodwill is not reported separately it is not specifically tested for impairment. Rather, the entire equity method investment is tested for impairment at each balance sheet date.
If there is objective evidence of impairment, an impairment test is performed by comparing the investment’s recoverable amount, which is the higher of its value in use and fair value less costs to sell, with its carrying amount. An impairment loss recognized in prior periods is only reversed if there has been a positive change in the estimates used to determine the investment’s recoverable amount since the last impairment loss was recognized. If this is the case the carrying amount of the investment is increased to its higher recoverable amount. The increased carrying amount of the investment in the associate attributable to a reversal of an impairment loss shall not exceed the carrying amount that would have been determined had no impairment loss been recognized for the investment in prior years.
At the date that the Group ceases to have significant influence over the associate or jointly controlled entity the Group recognizes a gain or loss on the disposal of the equity method investment equal to the difference between the sum of the fair value of any retained investment and the proceeds from disposing of the associate and the carrying amount of the investment. Amounts recognized in prior periods in other comprehensive income in relation to the associate are accounted for on the same basis as would have been required if the investee had directly disposed of the related assets or liabilities.
Critical accounting estimates:
The assessment of whether there is objective evidence of impairment may require significant management judgment and the estimates for impairment could change from period to period based on future events that may or may not occur. The Group considers this to be a critical accounting estimate.
|
185
|
|
|
Deutsche Bank
|
Additional Notes
|
|
|
Annual Report 2021
|
|
|
|
|
|
Foreign currency translation
The Consolidated Financial Statements are prepared in euro, which is the presentation currency of the Group. Various entities in the Group use a different functional currency, being the currency of the primary economic environment in which the entity operates.
An entity records foreign currency revenues, expenses, gains and losses in its functional currency using the exchange rates prevailing at the dates of recognition.
Monetary assets and liabilities denominated in currencies other than the entity’s functional currency are translated at the period end closing rate. Foreign exchange gains and losses resulting from the translation and settlement of these items are recognized in the Consolidated Statement of Income as net gains (losses) on financial assets/liabilities at fair value through profit or loss in order to align the translation amounts with those recognized from foreign currency related transactions (derivatives) which hedge these monetary assets and liabilities.
Non-monetary items that are measured at historical cost are translated using the historical exchange rate at the date of the transaction. Translation differences on non-monetary items which are held at fair value through profit or loss are recognized in profit or loss.
For purposes of translation into the presentation currency, assets and liabilities of foreign operations are translated at the period end closing rate and items of income and expense are translated into euros at the rates prevailing on the dates of the transactions, or average rates of exchange where these approximate actual rates. The exchange differences arising on the translation of a foreign operation are included in other comprehensive income. For foreign operations that are subsidiaries, the amount of exchange differences attributable to any non-controlling interests is recognized in non-controlling interests.
Upon disposal of a foreign subsidiary and associate (which results in loss of control or significant influence over that operation) the total cumulative exchange differences recognized in other comprehensive income are reclassified to profit or loss.
Upon partial disposal of a foreign operation that is a subsidiary and which does not result in loss of control, the proportionate share of cumulative exchange differences is reclassified from other comprehensive income to non-controlling interests as this is deemed a transaction with equity holders. For a partial disposal of an associate which does not result in a loss of significant influence, the proportionate share of cumulative exchange differences is reclassified from other comprehensive income to profit or loss.
|
186
|
|
|
Deutsche Bank
|
Additional Notes
|
|
|
Annual Report 2021
|
|
|
|
|
|
Interest, commissions and fees
Net interest income
– Interest income and expense from all interest-bearing assets and liabilities is recognized as net interest income using the effective interest rate method. The effective interest rate (EIR) is a method of calculating the amortized cost of a financial asset or a financial liability and of allocating the interest income or expense over the relevant period using the estimated future cash flows.
The estimated future cash flows used in the EIR calculation include those determined by all of the contractual terms of the asset or liability, all fees (including commissions) that are considered to be integral to the effective interest rate, direct and incremental transaction costs and all other premiums or discounts. However, if the financial instrument is carried at fair value through profit or loss, any associated fees are recognized in trading income when the instrument is initially recognized, provided there are no significant unobservable inputs used in determining its fair value.
If a financial asset is credit impaired, interest revenue is calculated by applying the effective interest rate to the amortized cost amount. The amortized cost amount of a financial asset is the gross carrying amount of a financial asset after adjusting for any impairment allowance. For assets which are initially recognized as purchased or credit impaired, interest revenue is calculated through the use of a credit-adjusted effective interest rate which takes into consideration expected credit losses.
The Group presents negative interest paid on interest-bearing assets as interest expense, and interest revenue received from interest-bearing liabilities as interest income.
The Group presents interest income and expense calculated using the EIR method separately in the Group’s consolidated statement of income.
Commissions and fee income
–The Group applies the IFRS 15, “Revenue from Contracts with Customers” five-step revenue recognition model to the recognition of Commissions and Fee Income, under which income must be recognized when control of goods and services is transferred, hence the contractual performance obligations to the customer has been satisfied.
Accordingly, after a contract with a customer has been identified in the first step, the second step is to identify the performance obligation – or a series of distinct performance obligations – provided to the customer. The Group must examine whether the service is capable of being distinct and is actually distinct within the context of the contract. A promised service is distinct if the customer can benefit from the service either on its own or together with other resources that are readily available to the customer, and the promise to transfer the service to the customer is separately identifiable from other promises in the contract. The amount of income is measured on the basis of the contractually agreed transaction price for the performance obligation defined in the contract. If a contract includes a variable consideration, the Group estimates the amount of consideration to which it will be entitled in exchange for transferring the promised goods or services to a customer. Income is recognized in profit and loss when the identified performance obligation has been satisfied. The Group does not present information about its remaining performance obligations if it is part of a contract that has an original expected duration of one year or less.
The Group determines the stand-alone selling price at contract inception of a distinct service underlying each performance obligation in the contract and allocates the transaction price in proportion to those stand-alone selling prices. The stand-alone selling price is the price at which DB would sell a promised service separately to a customer on an unbundled basis. The best evidence of a stand-alone selling price is the observable price of a service when the Group sells that service separately in similar circumstances and to similar customers. If the Group does not sell the service to a customer separately, it estimates the stand-alone selling price at an amount using a suitable method, for example, in loan syndication transactions the Group applies the requirements for recognition of trade day profit and considers the price at which other market participants provide the same service on an unbundled basis. As such when estimating a stand-alone selling price, the Group considers all information (including market conditions) that is reasonably available to it. In doing so, the Group maximizes the use of observable inputs and applies estimation methods consistently in similar circumstances.
The Group provides asset management services that give rise to asset management and performance fees and constitute a single performance obligation. The asset management and performance fee components are variable considerations such that at each reporting date the Group estimates the fee amount to which it will be entitled in exchange for transferring the promised services to the customer. The benefits arising from the asset management services are simultaneously received and consumed by the customer over time. The Group recognizes revenue over time by measuring the progress towards complete satisfaction of that performance obligation, subject to the removal of any uncertainty as to whether it is highly probable that a significant reversal in the cumulative amount of revenue recognized would occur or not. For the management fee component this is the end of the monthly or quarterly service period. For performance fees this date is when any uncertainty related to the performance component has been fully removed.
Loan commitment fees related to commitments that are accounted for off balance sheet are recognized in commissions and fee income over the life of the commitment if it is unlikely that the Group will enter into a specific lending arrangement. If it is probable that the Group will enter into a specific lending arrangement, the loan commitment fee is deferred until the origination of a loan and recognized as an adjustment to the loan’s effective interest rate.
Commissions and Fee Income predominantly earned from services that are received and consumed by the customer over time: Administration, assets under management, foreign commercial business, loan processing and guarantees sundry other customer services. The Group recognizes revenue from these services over time by measuring the progress towards complete satisfaction of that performance obligation, subject to the removal of any uncertainty as to whether it is highly probable that a significant reversal in the cumulative amount of revenue recognized would occur or not.
Commissions and Fee Income predominantly earned from providing services at a point in time or transaction-type services include: other securities, underwriting and advisory fees, brokerage fees, local payments, foreign currency/ exchange business and intermediary fees.
Expenses that are directly related and incremental to the generation of Commissions and Fee Income are presented net in Commissions and Fee Income in the Consolidated Statement of Income. This includes income and associated expense where the Group contractually owns the performance obligation (i.e. as Principal) in relation to the service that gives rise to the revenue and associated expense. In contrast, it does not include situations where the Group does not contractually own the performance obligation and is acting as agent. The determination of whether the Group is acting as principal or agent is based on the contractual terms of the underlying service arrangement. The gross Commissions and Fee Income and Expense amounts are disclosed in “Note 6 – Commissions and Fee Income”.
|
187
|
|
|
Deutsche Bank
|
Additional Notes
|
|
|
Annual Report 2021
|
|
|
|
|
|
Financial assets
The Group classifies financial assets in line with the classification and measurement requirements of IFRS 9, where financial assets are classified based on both the business model used for managing the financial assets and the contractual cash flow characteristics of the financial asset (known as Solely Payments of Principal and Interest or “SPPI”). There are three business models available:
- – Hold to Collect - Financial assets held with the objective to collect contractual cash flows. They are subsequently measured at amortized cost and are recorded in multiple lines on the Group’s consolidated balance sheet.
- – Hold to Collect and Sell - Financial assets held with the objective of both collecting contractual cash flows and selling financial assets. They are recorded as Financial assets at Fair Value through Other Comprehensive Income on the Group’s consolidated balance sheet.
- – Other - Financial assets that do not meet the criteria of either “Hold to Collect” or “Hold to Collect and Sell”. They are recorded as Financial Assets at Fair Value through Profit or Loss on the Group’s consolidated balance sheet.
The assessment of business model requires judgment based on facts and circumstances upon initial recognition. As part of this assessment, the Group considers quantitative factors (e.g., the expected frequency and volume of sales) and qualitative factors such as how the performance of the business model and the financial assets held within that business model are evaluated and reported to the Group’s key management personnel. In addition to taking into consideration the risks that affect the performance of the business model and the financial assets held within that business model, in particular, the way in which those market and credit risks are managed; and how managers of the business are compensated (e.g., whether the compensation is based on the fair value of the assets managed or on the contractual cash flows collected). This assessment results in an asset being classified in either a Hold to Collect, Hold to Collect and Sell or Other business model.
If the Group holds a financial asset either in a Hold to Collect or a Hold to Collect and Sell business model, then an assessment at initial recognition to determine whether the contractual cash flows of the financial asset are Solely Payments of Principal and Interest on the principal amount outstanding at initial recognition is required to determine the business model classification. Contractual cash flows, that are SPPI on the principal amount outstanding, are consistent with a basic lending arrangement. Interest in a basic lending arrangement is consideration for the time value of money and the credit risk associated with the principal amount outstanding during a particular period of time. It can also include consideration for other basic lending risks (e.g., liquidity risk) and costs (e.g., administrative costs) associated with holding the financial asset for a particular period of time; and a profit margin that is consistent with a basic lending arrangement.
Financial assets at fair value through profit or loss
Financial assets are classified at fair value through profit or loss if they are held in the Other business model because they are either held for trading or because they do not meet the criteria for Hold to Collect or Hold to Collect and Sell. In addition, it includes financial assets that meet the criteria for Hold to Collect or Hold to Collect and Sell business model, but the financial asset fails SPPI or where the Group designated the financial assets under the fair value option.
Financial assets classified as Financial assets at fair value through profit or loss are measured at fair value with realized and unrealized gains and losses included in Net gains (losses) on financial assets/liabilities at fair value through profit or loss. Interest on interest earning assets such as trading loans and debt securities and dividends on equity instruments are presented in Interest and Similar Income.
Financial assets classified at fair value through profit or loss are recognized or derecognized on trade date. Trade date is the date on which the Group commits to purchase or sell the asset.
Trading assets
– Financial assets are classified as held for trading if they have been originated, acquired or incurred principally for the purpose of selling or repurchasing them in the near term, or they form part of a portfolio of identified financial instruments that are managed together and for which there is evidence of a recent actual pattern of short-term profit-taking. Trading assets include debt and equity securities, derivatives held for trading purposes, and trading loans. This also includes loan commitments that are allocated to the Other business model and that are presented as derivatives held for trading.
Non-trading financial assets mandatory at fair value through profit and loss
–
The Group assigns any non-trading financial asset that does not fall into the Hold to Collect nor Hold to Collect and Sell business models into the Other business model and classifies them as Non-Trading Financial Assets mandatory at Fair Value through Profit and Loss. This includes predominately reverse repurchase agreements which are managed on a fair value basis. Additionally, any financial asset that falls into the Hold to Collect or Hold to Collect and Sell business models for which the contractual cash flow characteristics are not SPPI is classified by the Group as Non-Trading Financial Assets Mandatory at Fair Value through Profit and Loss.
Financial assets designated at fair value through profit or loss
– Certain financial assets that would otherwise be measured subsequently at amortized cost or at fair value through other comprehensive income, may be designated at Fair Value through Profit or Loss if the designation eliminates or significantly reduces a measurement or recognition inconsistency. The use of the fair value option under IFRS 9 is limited. The Group allows the fair value option to be designated only for those financial instruments for which a reliable estimate of fair value can be obtained.
Financial assets at fair value through other comprehensive income
A financial asset shall be classified and measured at Fair Value through Other Comprehensive Income (“FVOCI”), if the financial asset is held in a Hold to Collect and Sell business model and the contractual cash flows are SPPI, unless designated under the fair value option.
Under FVOCI, a financial asset is measured at its fair value with any changes being recognized in Other Comprehensive Income (”OCI”) and is assessed for impairment under the IFRS 9 expected credit loss model where provisions are recorded through profit or loss are recognized based on expectations of potential credit losses. The Group’s impairment policy is described further in the section “Impairment of Loans and Provision for Off-Balance Sheet Positions (IFRS 9)”. The foreign currency translation effect for FVOCI assets is recognized in profit or loss, as is the interest component by using the effective interest method. The amortization of premiums and accretion of discounts are recorded in net interest income. Realized gains and losses are reported in net gains (losses) on financial assets at FVOCI. Generally, the weighted-average cost method is used to determine the cost of FVOCI financial assets.
Financial assets classified as FVOCI are recognized or derecognized on trade date. Trade date is the date on which the Group commits to purchase or sell the asset.
It is possible to designate non-trading equity instruments as FVOCI. However, this category is expected to have limited usage by the Group and has not been used to date.
Financial assets at amortized cost
A financial asset is classified and subsequently measured at amortized cost if the financial asset is held in a Hold to Collect business model and the contractual cash flows are SPPI.
Under this measurement category, the financial asset is measured at fair value at initial recognition. Subsequently the carrying amount is reduced for principal payments, plus or minus the cumulative amortization using the effective interest method. The financial asset is assessed for impairment under the IFRS 9 expected credit loss model where provisions are recognized based on expectations of potential credit losses. The Group’s impairment of financial instruments policy is described further in the section “Impairment of Loans and Provision for Off-Balance Sheet Positions (IFRS 9)”. Financial assets measured at amortized cost are recognized on a settlement date basis.
Financial Assets at amortized cost include predominately Loans at amortized cost, Central bank funds sold and securities purchased under resale agreements, Securities borrowed and certain receivables presented in Other Assets.
Modification of financial assets and financial liabilities
When the terms of a financial asset are renegotiated or modified and the modification does not result in derecognition, a gain or loss is recognized in the income statement as the difference between the original contractual cash flows and the modified cash flows discounted at the original effective interest rate. The modified financial asset will continue to accrued interest at its original EIR. When a modification results in derecognition the original instrument is derecognized and the new instrument recognized at fair value.
Non-credit related or commercial renegotiations where an obligor has not experienced a significant increase in credit risk since origination, and has a readily exercisable right to early terminate the financial asset results in derecognition of the original agreement and recognition of a new financial asset based on the newly negotiated commercial terms.
For credit related modifications (i.e. those modifications due to significant increase in credit risk since inception) or those where the obligor does not have the readily exercisable right to early terminate, the Group assesses whether the modified terms result in the financial asset being significantly modified and therefore derecognized. This assessment includes a quantitative assessment of the impact of the change in cash flows from the modification of contractual terms and additionally, where necessary, a qualitative assessment of the impact of the change in the contractual terms. Where these modifications are not concluded to be significant, the financial asset is not derecognized and is accounted for as a modification as described above.
If the changes are concluded to be significant, the old instrument is derecognized and a new instrument recognized. The Group then recognizes a credit loss allowance based on 12-month expected credit losses. However, if following a modification that results in a derecognition of the original financial asset, there is evidence that the new financial asset is credit-impaired on initial recognition; then the new financial asset should be recognized as an originated credit-impaired financial asset and initially classified in Stage 3 (refer to section “Impairment of Loans and Provision for Off-Balance Sheet Positions” below).
When the terms of a financial liability are renegotiated or modified then the Group assesses whether the modified terms result in the financial liability being significantly modified and therefore derecognized. This assessment includes a quantitative assessment of the impact of the change in cash flows from the modification of contractual terms and additionally, where necessary, a qualitative assessment of the impact of the change in the contractual terms. Where these modifications are not concluded to be significant, the financial liability is not derecognized and a gain or loss is recognized in the income statement as the difference between the original contractual cash flows and the modified cash flows discounted at the original effective interest rate. Where there is derecognition the original financial liability is derecognized and the new liability recognized at its fair value.
Loan commitments
Loan commitments remain off-balance sheet, unless allocated to the Other business model and presented as derivatives held for trading. The Group does not recognize and measure changes in fair value of off-balance sheet loan commitments that result from changes in market interest rates or credit spreads. However, as specified in the sections “Impairment of Loans and Provision for Off-Balance Sheet Positions” below, these off-balance sheet loan commitments are in scope of the IFRS 9 impairment model.
|
188
|
|
|
Deutsche Bank
|
Additional Notes
|
|
|
Annual Report 2021
|
|
|
|
|
|
Financial liabilities
Under IFRS 9 financial liabilities are measured at amortized cost using the effective interest method, except for financial liabilities at fair value through profit or loss.
Financial liabilities at fair value through profit or loss
Financial liabilities at fair value through profit or loss include Trading Liabilities, Financial Liabilities Designated at Fair Value through Profit or Loss and Non-Participating Investment Contracts (“Investment Contracts”). Under IFRS 9 they are carried at fair value with realized and unrealized gains and losses included in net gains (losses) on financial assets and liabilities at fair value through profit or loss. For financial liabilities designated at fair value through profit and loss the fair value movements attributable to the Group’s own credit component for fair value movements is recognized in Other Comprehensive Income.
Financial liabilities classified at fair value through profit or loss are recognized or derecognized on trade date. Trade date is the date on which the Group commits to issue or repurchase the financial liability.
Interest on interest paying liabilities are presented in interest expense for financial instruments at fair value through profit or loss.
Trading liabilities
-
Financial liabilities that arise from debt issued are classified as held for trading if they have been originated or incurred principally for the purpose of repurchasing them in the near term. Trading liabilities consist primarily of derivative liabilities (including certain loan commitments) and short positions. This also includes loan commitments where the resulting loan upon funding is allocated to the other business model such that the undrawn loan commitment is classified as derivatives held for trading.
Financial liabilities designated at fair value through profit or loss
-
Certain financial liabilities that do not meet the definition of trading liabilities are designated at fair value through profit or loss using the fair value option. To be designated at fair value through profit or loss, financial liabilities must meet one of the following criteria: (1) the designation eliminates or significantly reduces a measurement or recognition inconsistency; (2) a group of financial liabilities is managed and its performance is evaluated on a fair value basis in accordance with a documented risk management or investment strategy; or (3) the instrument contains one or more embedded derivatives unless: (a) the embedded derivative does not significantly modify the cash flows that otherwise would be required by the contract; or (b) it is clear with little or no analysis that separation is prohibited. In addition, the Group allows the fair value option to be designated only for those financial instruments for which a reliable estimate of fair value can be obtained. Financial liabilities which are designated at fair value through profit or loss, under the fair value option, include repurchase agreements, loan commitments and structured note liabilities.
Investment contracts
-
All of the Group’s investment contracts are unit-linked contracts that match specific assets held by the Group. The contracts oblige the Group to use these assets to settle investment contract liabilities. They do not contain significant insurance risk or discretionary participation features. The contract liabilities are determined using current unit prices multiplied by the number of units attributed to the contract holders as of the balance sheet date. As this amount represents fair value, the liabilities have been classified as financial liabilities at fair value through profit or loss. Deposits collected under investment contracts are accounted for as an adjustment to the investment contract liabilities. Investment income attributable to investment contracts is included in the consolidated statement of Income. Investment contract claims reflect the excess of amounts paid over the account balance released. Investment contract policyholders are charged fees for policy administration, investment management, surrenders or other contract services.
Embedded derivatives
Some hybrid financial liability contracts contain both a derivative and a non-derivative component. In such cases, the derivative component is termed an embedded derivative, with the non-derivative component representing the host financial liability contract. If the economic characteristics and risks of embedded derivatives are not closely related to those of the host financial liability contract and the hybrid financial liability contract itself is not carried at fair value through profit or loss, the embedded derivative is bifurcated and reported at fair value, with gains and losses recognized in net gains (losses) on financial assets/liabilities at fair value through profit or loss. The host financial liability contract will continue to be accounted for in accordance with the appropriate accounting standard. The carrying amount of an embedded derivative is reported in the same Consolidated balance sheet line item as the host financial liability contract. Certain hybrid financial liability instruments have been designated at fair value through profit or loss using the fair value option.
Financial liabilities at amortized cost
Financial liabilities measured at amortized cost include long-term and short-term debt issued which are initially measured at fair value, which is the consideration received, net of transaction costs incurred. Repurchases of issued debt in the market are treated as extinguishments and any related gain or loss is recorded in the Consolidated Statement of Income. A subsequent sale of own bonds in the market is treated as a reissuance of debt. Financial liabilities measured at amortized cost are recognized on a settlement date basis.
|
189
|
|
|
Deutsche Bank
|
Additional Notes
|
|
|
Annual Report 2021
|
|
|
|
|
|
Offsetting of financial instruments
Financial assets and liabilities are offset, with the net amount presented in the Consolidated balance sheet, only if the Group holds a currently enforceable legal right to set off the recognized amounts and there is an intention to settle on a net basis or to realize an asset and settle the liability simultaneously. The legal right to set off the recognized amounts must be enforceable in both the normal course of business and in the event of default, insolvency or bankruptcy of both the Group and its counterparty. In all other situations they are presented gross. When financial assets and financial liabilities are offset in the Consolidated balance sheet, the associated income and expense items will also be offset in the Consolidated Statement of Income, unless specifically prohibited by an applicable accounting standard.
The majority of the offsetting applied by the Group relates to derivatives and repurchase and reverse repurchase agreements. A significant portion of offsetting is applied to interest rate derivatives and related cash margin balances, which are cleared through central clearing parties. For further information please refer to Note 17 “Offsetting Financial Assets and Financial Liabilities”.
|
190
|
|
|
Deutsche Bank
|
Additional Notes
|
|
|
Annual Report 2021
|
|
|
|
|
|
Determination of fair value
Fair value is defined as the price that would be received to sell an asset or paid to transfer a liability in an arm’s length transaction between market participants at the measurement date. The fair value of instruments that are quoted in active markets is determined using the quoted prices where they represent those at which regularly and recently occurring transactions take place.
The Group measures certain portfolios of financial assets and financial liabilities on the basis of their net risk exposures when the following criteria are met:
- – The group of financial assets and liabilities is managed on the basis of its net exposure to a particular market risk (or risks) or to the credit risk of a particular counterparty, in accordance with a documented risk management strategy,
- – The fair values are provided to key management personnel, and
- – The financial assets and liabilities are measured at fair value through profit or loss.
This portfolio valuation approach is consistent with how the Group manages its net exposures to market and counterparty credit risks.
Critical accounting estimates
– The Group uses valuation techniques to establish the fair value of instruments where prices quoted in active markets are not available. Therefore, where possible, parameter inputs to the valuation techniques are based on observable data derived from prices of relevant instruments traded in an active market. These valuation techniques involve some level of management estimation and judgment, the degree of which will depend on the price transparency for the instrument or market and the instrument’s complexity.
In reaching estimates of fair value management judgment needs to be exercised. The areas requiring significant management judgment are identified, documented and reported to senior management as part of the valuation control process and the standard monthly reporting cycle. The specialist model validation and valuation control groups focus attention on the areas of subjectivity and judgment.
The level of management judgment required in establishing fair value of financial instruments for which there is a quoted price in an active market is usually minimal. Similarly there is little subjectivity or judgment required for instruments valued using valuation models which are standard across the industry and where all parameter inputs are quoted in active markets.
The level of subjectivity and degree of management judgment required is more significant for those instruments valued using specialized and sophisticated models and where some or all of the parameter inputs are less liquid or less observable. Management judgment is required in the selection and application of appropriate parameters, assumptions and modelling techniques. In particular, where data are obtained from infrequent market transactions then extrapolation and interpolation techniques must be applied. Where no market data are available for a particular instrument then pricing inputs are determined by assessing other relevant sources of information such as historical data, fundamental analysis of the economics of the transaction and proxy information from similar transactions, and making appropriate adjustment to reflect the actual instrument being valued and current market conditions. Where different valuation techniques indicate a range of possible fair values for an instrument then management has to decide what point within the range of estimates appropriately represents the fair value. Further, some valuation adjustments may require the exercise of management judgment to achieve fair value.
Financial assets and liabilities carried at fair value are required to be disclosed according to the inputs to the valuation method that are used to determine their fair value. Specifically, segmentation is required between those valued using quoted market prices in an active market (level 1), valuation techniques based on observable parameters (level 2) and valuation techniques using significant unobservable parameters (level 3). Management judgment is required in determining the category to which certain instruments should be allocated. This specifically arises when the valuation is determined by a number of parameters, some of which are observable and others are not. Further, the classification of an instrument can change over time to reflect changes in market liquidity and therefore price transparency.
The Group provides a sensitivity analysis of the impact upon the level 3 financial instruments of using a reasonably possible alternative for the unobservable parameter. The determination of reasonably possible alternatives requires significant management judgment.
For financial instruments measured at amortized cost (which include loans, deposits and short and long term debt issued) the Group discloses the fair value. Generally there is limited or no trading activity in these instruments and therefore the fair value determination requires significant management judgment.
For further discussion of the valuation methods and controls and quantitative disclosures with respect to the determination of fair value, please refer to Note 13 “Financial Instruments carried at Fair Value” and Note 14 “Fair Value of Financial Instruments not carried at Fair Value”.
Recognition of trade date profit
Trade date profit is recognized if the fair value of the financial instrument measured at fair value through profit or loss is obtained from a quoted market price in an active market, or otherwise evidenced by comparison to other observable current market transactions or based on a valuation technique incorporating observable market data. If there are significant unobservable inputs used in the valuation technique, the financial instrument is recognized at the transaction price and any profit implied from the valuation technique at trade date is deferred.
Using systematic methods, the deferred amount is recognized over the period between trade date and the date when the market is expected to become observable, or over the life of the trade (whichever is shorter). Such methodology is used because it reflects the changing economic and risk profile of the instrument as the market develops or as the instrument itself progresses to maturity. Any remaining trade date deferred profit is recognized in the Consolidated Statement of Income when the transaction becomes observable. In the rare circumstances that a trade date loss arises, it would be recognized at inception of the transaction to the extent that it is probable that a loss has been incurred and a reliable estimate of the loss amount can be made.
Critical Accounting Estimates
– Management judgment is required in determining whether there exist significant unobservable inputs in the valuation technique of the underlying financial instrument (refer to section “Determination of Fair Value” for management judgment required in establishing fair value of financial instruments). Once deferred, the decision to subsequently recognize the trade date profit requires a careful assessment of the then current facts and circumstances supporting observability of parameters and/or risk mitigation.
|
191
|
|
|
Deutsche Bank
|
Additional Notes
|
|
|
Annual Report 2021
|
|
|
|
|
|
Derivatives and hedge accounting
Derivatives are used to manage exposures to interest rate, foreign currency, credit and other market price risks, including exposures arising from forecast transactions. All freestanding contracts that are considered derivatives for accounting purposes are carried at fair value on the Consolidated balance sheet regardless of whether they are held for trading or non-trading purposes.
The changes in fair value on derivatives held for trading are included in net gains (losses) on financial assets/liabilities at fair value through profit or loss.
Hedge accounting
IFRS 9 includes an accounting policy choice to defer the adoption of IFRS 9 hedge accounting and to continue with IAS 39 hedge accounting. The Group decided to exercise this accounting policy choice and did not adopt IFRS 9 hedge accounting as of January 1, 2018.
For accounting purposes there are three possible types of hedges: (1) hedges of changes in the fair value of assets, liabilities or unrecognized firm commitments (fair value hedges); (2) hedges of the variability of future cash flows from highly probable forecast transactions and floating rate assets and liabilities (cash flow hedges); and (3) hedges of the translation adjustments resulting from translating the functional currency financial statements of foreign operations into the presentation currency of the parent (hedges of net investments in foreign operations).
When hedge accounting is applied, the Group designates and documents the relationship between the hedging instrument and the hedged item as well as its risk management objective and strategy for undertaking the hedging transactions and the nature of the risk being hedged. This documentation includes a description of how the Group will assess the hedging instrument’s effectiveness in offsetting the exposure to changes in the hedged item’s fair value or cash flows attributable to the hedged risk. Hedge effectiveness is assessed at inception and throughout the term of each hedging relationship. Hedge effectiveness is always assessed, even when the terms of the derivative and hedged item are matched.
For hedges of changes in fair value, the changes in the fair value of the hedged asset, liability or unrecognized firm commitment, or a portion thereof, attributable to the risk being hedged, are recognized in the Consolidated Statement of Income along with changes in the entire fair value of the derivative. When hedging interest rate risk, any interest accrued or paid on both the derivative and the hedged item is reported in interest income or expense and the unrealized gains and losses from the hedge accounting fair value adjustments are reported in other revenue. Hedge ineffectiveness is reported in other revenue and is measured as the net effect of changes in the fair value of the hedging instrument and changes in the fair value of the hedged item arising from changes in the market rate or price related to the risk(s) being hedged.
If a fair value hedge of a debt instrument is discontinued prior to the instrument’s maturity because the derivative is terminated or the relationship is de-designated, any remaining interest rate-related fair value adjustments made to the carrying amount of the debt instrument (basis adjustments) are amortized to interest income or expense over the remaining term of the original hedging relationship. For other types of fair value adjustments and whenever a fair value hedged asset or liability is sold or otherwise derecognized, any basis adjustments are included in the calculation of the gain or loss on derecognition.
For hedges of variability in future cash flows, there is no change to the accounting for the hedged item and the derivative is carried at fair value, with changes in value reported initially in other comprehensive income to the extent the hedge is effective. These amounts initially recorded in other comprehensive income are subsequently reclassified into the Consolidated Statement of Income in the same periods during which the forecast transaction affects the Consolidated Statement of Income. Thus, for hedges of interest rate risk, the amounts are amortized into interest income or expense at the same time as the interest is accrued on the hedged transaction.
Hedge ineffectiveness is recorded in other income and is measured as changes in the excess (if any) in the absolute cumulative change in fair value of the actual hedging derivative over the absolute cumulative change in the fair value of the hypothetically perfect hedge.
When hedges of variability in cash flows attributable to interest rate risk are discontinued, amounts remaining in accumulated other comprehensive income are amortized to interest income or expense over the remaining life of the original hedge relationship, unless the hedged transaction is no longer expected to occur in which case the amount will be reclassified into other income immediately. When hedges of variability in cash flows attributable to other risks are discontinued, the related amounts in accumulated other comprehensive income are reclassified into either the same Consolidated Statement of Income caption and period as profit or loss from the forecast transaction, or into other income when the forecast transaction is no longer expected to occur.
For hedges of the translation adjustments resulting from translating the functional currency financial statements of foreign operations (hedges of net investments in foreign operations) into the functional currency of the parent, the portion of the change in fair value of the derivative due to changes in the spot foreign exchange rates is recorded as a foreign currency translation adjustment in other comprehensive income to the extent the hedge is effective; the remainder is recorded as other income in the Consolidated Statement of Income.
Changes in fair value of the hedging instrument relating to the effective portion of the hedge are subsequently recognized in profit or loss on disposal of the foreign operations.
Hedging derivatives are reported as other assets and other liabilities. In the event that a derivative is subsequently de-designated from a hedging relationship, it is transferred to financial assets/liabilities at fair value through profit or loss.
|
192
|
|
|
Deutsche Bank
|
Additional Notes
|
|
|
Annual Report 2021
|
|
|
|
|
|
Impairment of loans and provision for off-balance sheet positions
The impairment requirements of IFRS 9 apply to all credit exposures that are measured at amortized cost or FVOCI, and to off balance sheet lending commitments such as loan commitments and financial guarantees. For purposes of the impairment policy below, these instruments are referred to as (“Financial Assets”)
The determination of impairment losses under IFRS 9 uses an expected credit loss (“ECL”) model, where allowances are taken upon initial recognition of the Financial Asset, based on expectations of potential credit losses at the time of initial recognition.
Staged approach to the determination of expected credit losses
IFRS 9 states a three stage approach to impairment for Financial Assets that are not credit impaired at the date of origination or purchase. This approach is summarized as follows:
- – Stage 1: The Group recognizes a credit loss allowance at an amount equal to 12-month expected credit losses for all Financial Assets. This represents the portion of lifetime expected credit losses from default events that are expected within 12 months of the reporting date, assuming that credit risk has not increased significantly after initial recognition.
- – Stage 2: The Group recognizes a credit loss allowance at an amount equal to lifetime expected credit losses for those Financial Assets which are considered to have experienced a significant increase in credit risk since initial recognition. This requires the computation of ECL based on lifetime probability of default, lifetime loss given default and lifetime exposure at default that represents the probability of default occurring over the remaining lifetime of the Financial Asset. Allowance for credit losses are higher in this stage because of an increase in credit risk since origination or purchase and the impact of a longer time horizon being considered compared to 12 months in Stage 1.
-
–
Stage 3: The Group recognizes a loss allowance at an amount equal to lifetime expected credit losses, reflecting a Probability of Default of
Significant increase in credit risk
When determining whether the credit risk (i.e., risk of default) of a Financial Asset has increased significantly since initial recognition, the Group considers reasonable and supportable information that is relevant and available without undue cost or effort. This includes quantitative and qualitative information based on the Group’s historical experience, credit risk assessment and forward-looking information (including macro-economic factors). The assessment of significant credit deterioration is key in determining when to move from measuring an allowance based on 12-month ECLs to one that is based on lifetime ECLs (i.e., transfer from Stage 1 to Stage 2).
The Group’s framework for determining if there has been a significant increase in credit risk aligns with the internal Credit Risk Management (“CRM”) process and utilizes:
- – Rating related indicators – based on a model that compares lifetime PDs at the reporting date with the lifetime PD expectations at the date of initial recognition and subsequently applies a quantile approach to determine a threshold to define the trigger point for a financial asset’s transition into Stage 2; and
- – Process related indicators – which uses existing risk management indicators, that in Management’s view represent situations where the credit risk of financial assets has significantly increased. These include obligors being added to a credit watchlist, being mandatorily transferred to workout status, payments being 30 days or more past due or in forbearance.
These indicators are discussed further in section “IFRS 9 Impairment Approach” in the Risk Report.
Credit impaired financial assets in Stage 3
The Group has aligned its definition of credit impaired under IFRS 9 to when a Financial Asset has defaulted for regulatory purposes, according to the Capital Requirements Regulation under Art. 178.
The determination of whether a Financial Asset is credit impaired and therefore in Stage 3 focusses exclusively on default risk, without taking into consideration the effects of credit risk mitigants such as collateral or guarantees. Specifically, a Financial Asset is credit impaired and in Stage 3 when:
- – The Group considers the obligor is unlikely to pay its credit obligations to the Group. Determination may include forbearance actions, where a concession has been granted to the borrower or economic or legal reasons that are qualitative indicators of credit impairment; or
- – Contractual payments of either principal or interest by the obligor are past due by more than 90 days.
For Financial Assets considered to be credit impaired, the ECL allowance covers the amount of loss the Group is expected to suffer. The estimation of ECLs is done on a case-by-case basis for non-homogeneous portfolios, or by applying portfolio based parameters to individual Financial Assets in these portfolios via the Group’s ECL model for homogeneous portfolios. This estimate includes the use of discounted cash flows that are adjusted for scenarios.
Forecasts of future economic conditions when calculating ECLs are considered. The lifetime expected losses are estimated based on the probability-weighted present value of the difference between the contractual cash flows that are due to the Group under the contract; and the cash flows that the Group expects to receive.
A Financial Asset can be classified as credit impaired in Stage 3 but without an allowance for credit losses (i.e., no impairment loss is expected). This may be due to the value of collateral. The Group’s engine based ECL calculation is conducted on a monthly basis, whereas the case-by-case assessment of ECL in Stage 3 for non-homogeneous portfolio has to be performed at least on a quarterly basis.
Purchased or originated credit impaired financial assets in Stage 3
A Financial Asset is considered purchased or originated credit-impaired if there is objective evidence of impairment at the time of initial recognition. Such credit impaired Financial Assets are termed POCI Financial Assets. POCI Financial Assets are measured to reflect lifetime expected credit losses, and all subsequent changes in lifetime expected credit losses, whether positive or negative, are recognized in the income statement as a component of the provision for credit losses. POCI Financial Assets can only be classified in Stage 3 over the life of the Financial Asset.
Write-offs
The Group reduces the gross carrying amount of a Financial Asset when there is no reasonable expectation of recovery. Write-offs can relate to a Financial Asset in its entirety, or to a portion of it, and constitute a derecognition event. The Group considers all relevant information in making this determination, including but not limited to:
- – Foreclosure actions taken by the Group which have not been successful or have a high probability of not being successful
- – Collateral liquidation which has not, or will not lead to further considerable recoveries
- – Situations where no further recoveries are reasonably expected
Write-offs can take place before legal actions against the borrower to recover the debt have been concluded, and a write-off does not involve the Group forfeiting its legal right to recover the debt.
Interest Rate used in the IFRS 9 model
In the context of the ECL calculation, the Group applies in line with IFRS 9 an approximation of the EIR, which is usually the contractual interest rate (“CIR”) and which does not materially differ from the EIR. The CIR is deemed to be an appropriate approximation, as the interest rate is consistently used in the ECL model, interest recognition and for discounting of the ECL.
Collateral for financial assets considered in the impairment analysis
IFRS 9 requires cash flows expected from collateral and other credit enhancement to be reflected in the ECL calculation. The following are key aspects with respect to collateral and guarantees:
- – Eligibility of collateral, i.e. which collateral should be considered in the ECL calculation;
- – Collateral evaluation, i.e. what collateral (liquidation) value should be used; and
- – Projection of the available collateral amount over the life of a transaction.
These concepts are outlined in more detail in section “IFRS 9 Impairment Approach” in the Risk Report.
Critical accounting estimates
– The accounting estimates and judgments related to the impairment of Financial Assets is a critical accounting estimate because the underlying assumptions used can change from period to period and may significantly affect the Group’s results of operations.
In assessing assets for impairments, management judgment is required, particularly in projecting forward looking information and scenarios in particular in circumstances of economic and financial uncertainty, when developments and changes to expected cash flows can occur both with greater rapidity and less predictability. The actual amount of the future cash flows and their timing may differ from the estimates used by management and consequently may cause actual losses to differ from reported allowances.
For those non-homogeneous loans in Stage 3 the determination of the impairment allowance often requires the use of considerable judgment concerning such matters as local economic conditions, the financial performance of the counterparty and the value of any collateral held, for which there may not be a readily accessible market.
The determination of the expected credit losses in Stages 1 and 2 and for homogeneous loans in Stage 3 is calculated using the Group’s ECL model. The model incorporates numerous estimates and judgments. The Group performs a regular review of the model and underlying data and assumptions. The probability of defaults, loss recovery rates and judgments concerning ability of borrowers in foreign countries to transfer the foreign currency necessary to comply with debt repayments, amongst other things, are incorporated into this review.
Management judgement over the following critical accounting estimates has increased since early 2020 as a result of the COVID-19 pandemic:
- – Forward-Looking Information: Forward-Looking Information is incorporated into the measurement of the Group Allowance for Credit Losses in terms of adjustments to multi-year PD curves based on macro-economic forecasts. The identification of key macro-economic variables (MEVs) reflects a balance of quantitative and qualitative judgements. Statistical analysis, including for example, back-testing and model sensitivities, are performed to assess the explanatory power of MEVs, while expert input from credit officers ensures management comfort in the overall model behavior. The final model parameterization is based on a review challenge of impacts in internal governance forums and an independent validation performed by the Model Risk Management function. Furthermore, conceptual soundness of the estimation approach is ensured by model testing analysis prepared as part of model changes and an ongoing monitoring framework in order for the ECL provision to reflect management’s best estimate in the calculation of expected credit losses.
- – Significant Increase in Credit Risk: In line with the section “IFRS 9 Impairment Approach” in the Risk Report, the Group uses rating-related indicators to determine whether a financial asset’s credit risk has significantly increased since inception. For financial assets in non-homogeneous portfolios the ratings are determined for every counterparty individually based on credit officer’s expert judgement. For financial assets in the homogeneous portfolios (due to the large number of client relationships) the rating process is significantly automated with less judgement required by credit officers on individual counterparties. For both homogeneous and non-homogenous portfolios the rating-related indicators to determine whether the credit risk for a financial asset has significantly increased are based on a model that compares lifetime PDs at the reporting date with the lifetime PD expectations at the date of initial recognition and subsequently applying a quantile approach to determine a threshold which defines the trigger point for a financial asset’s transition into Stage 2. The determination of the quantile to define Stage 2 thresholds are determined by subject matter experts in the Group’s Risk function. This represents one of the key critical judgments in the Group’s IFRS 9 framework and is validated on an annual basis based on detailed stage-mover analyses, benchmarking with historical behaviors and peer comparisons.
- – Stage 3 LGD Setting for Homogeneous Portfolios: The allowance for credit losses in Stage 3 is determined for the Group’s homogeneous portfolios by an automated process based on partially time dependent LGDs reflecting the lower recovery expectation the longer the client is in default, thereby differentiating between secured and unsecured exposures. The LGDs are calibrated using the Group’s loss history built up over preceding decades, experienced market prices of non-performing portfolios sold and expert judgement. In the case of less material portfolios, the empirical calibration of the LGD is partially supported by expert credit officer judgements, especially for determining the client cure rates as one of the key inputs. The LGD settings are validated on an annual basis and are regularly reviewed by the Group’s independent model validation process which is part of the Model Risk Management function.
The quantitative disclosures are provided in Note 18 “Loans” and Note 19 “Allowance for credit losses”.
|
193
|
|
|
Deutsche Bank
|
Additional Notes
|
|
|
Annual Report 2021
|
|
|
|
|
|
Derecognition of financial assets and liabilities
Financial asset derecognition
A financial asset is considered for derecognition when the contractual rights to the cash flows from the financial asset expire, or the Group has either transferred the contractual right to receive the cash flows from that asset, or has assumed an obligation to pay those cash flows to one or more recipients, subject to certain criteria.
The Group derecognizes a transferred financial asset if it transfers substantially all the risks and rewards of ownership.
The Group enters into transactions in which it transfers previously recognized financial assets but retains substantially all the associated risks and rewards of those assets; for example, a sale to a third party in which the Group enters into a concurrent total return swap with the same counterparty. These types of transactions are accounted for as secured financing transactions.
In transactions in which substantially all the risks and rewards of ownership of a financial asset are neither retained nor transferred, the Group derecognizes the transferred asset if control over that asset is not retained, i.e., if the transferee has the practical ability to sell the transferred asset. The rights and obligations retained in the transfer are recognized separately as assets and liabilities, as appropriate. If control over the asset is retained, the Group continues to recognize the asset to the extent of its continuing involvement, which is determined by the extent to which it remains exposed to changes in the value of the transferred asset.
The derecognition criteria are also applied to the transfer of part of an asset, rather than the asset as a whole, or to a group of similar financial assets in their entirety, when applicable. If transferring a part of an asset, such part must be a specifically identified cash flow, a fully proportionate share of the asset, or a fully proportionate share of a specifically-identified cash flow.
If an existing financial asset is replaced by another asset from the same counterparty on substantially different terms, or if the terms of the financial asset are substantially modified (due to forbearance measures or otherwise), the existing financial asset is derecognized and a new asset is recognized. Any difference between the respective carrying amounts is recognized in the Consolidated Statement of Income.
Securitization
The Group securitizes various consumer and commercial financial assets, which is achieved via the transfer of these assets to a structured entity, which issues securities to investors to finance the acquisition of the assets. Financial assets awaiting securitization are classified and measured as appropriate under the policies in the “Financial Assets and Liabilities” section. If the structured entity is not consolidated then the transferred assets may qualify for derecognition in full or in part, under the policy on derecognition of financial assets. Synthetic securitization structures typically involve derivative financial instruments for which the policies in the “Derivatives and Hedge Accounting” section would apply. Those transfers that do not qualify for derecognition may be reported as secured financing or result in the recognition of continuing involvement liabilities. The investors and the securitization vehicles generally have no recourse to the Group’s other assets in cases where the issuers of the financial assets fail to perform under the original terms of those assets.
Interests in the securitized financial assets may be retained in the form of senior or subordinated tranches, interest only strips or other residual interests (collectively referred to as “retained interests”). Provided the Group’s retained interests do not result in consolidation of a structured entity, nor in continued recognition of the transferred assets, these interests are typically recorded in financial assets at fair value through profit or loss and carried at fair value. Consistent with the valuation of similar financial instruments, the fair value of retained tranches or the financial assets is initially and subsequently determined using market price quotations where available or internal pricing models that utilize variables such as yield curves, prepayment speeds, default rates, loss severity, interest rate volatilities and spreads. The assumptions used for pricing are based on observable transactions in similar securities and are verified by external pricing sources, where available. Where observable transactions in similar securities and other external pricing sources are not available, management judgment must be used to determine fair value. The Group may also periodically hold interests in securitized financial assets and record them at amortized cost.
In situations where the Group has a present obligation (either legal or constructive) to provide financial support to an unconsolidated securitization entity a provision will be created if the obligation can be reliably measured and it is probable that there will be an outflow of economic resources required to settle it.
When an asset is derecognized a gain or loss equal to the difference between the consideration received and the carrying amount of the transferred asset is recorded. When a part of an asset is derecognized, gains or losses on securitization depend in part on the carrying amount of the transferred financial assets, allocated between the financial assets derecognized and the retained interests based on their relative fair values at the date of the transfer.
Derecognition of financial liabilities
A financial liability is derecognized when the obligation under the liability is discharged or cancelled or expires. If an existing financial liability is replaced by another from the same lender on substantially different terms, or the terms of the existing liability are substantially modified, such an exchange or modification is treated as a derecognition of the original liability and the recognition of a new liability, and the difference in the respective carrying amounts is recognized in the Consolidated Statement of Income.
Repurchase and reverse repurchase agreements
Securities purchased under resale agreements (“reverse repurchase agreements”) and securities sold under agreements to repurchase (“repurchase agreements”) are treated as collateralized financings and are recognized initially at fair value, being the amount of cash disbursed and received, respectively. The party disbursing the cash takes possession of the securities serving as collateral for the financing and having a market value equal to, or in excess of, the principal amount loaned. The securities received under reverse repurchase agreements and securities delivered under repurchase agreements are not recognized on, or derecognized from, the balance sheet, because the risks and rewards of ownership are not obtained nor relinquished. Securities delivered under repurchase agreements which are not derecognized from the balance sheet and where the counterparty has the right by contract or custom to sell or repledge the collateral are disclosed in Note 20 “Transfer of Financial Assets, Assets Pledged and Received as Collateral”.
The Group allocates reverse repurchase portfolios that are managed on a fair value basis to the other business model under IFRS 9 and classifies them as “Non-trading financial assets mandatory at fair value through profit or loss”.
Interest earned on reverse repurchase agreements and interest incurred on repurchase agreements is reported as interest income and interest expense, respectively.
Securities borrowed and securities loaned
Securities borrowed transactions generally require the Group to deposit cash with the securities lender. In a securities loaned transaction, the Group generally receives either cash collateral, in an amount equal to or in excess of the market value of securities loaned, or securities. The Group monitors the fair value of securities borrowed and securities loaned and additional collateral is disbursed or obtained, if necessary.
The securities borrowed are not themselves recognized in the financial statements. If they are sold to third parties, the obligation to return the securities is recorded as a financial liability at fair value through profit or loss and any subsequent gain or loss is included in the Consolidated Statement of Income in net gains (losses) on financial assets/liabilities at fair value through profit or loss. Securities lent to counterparties are also retained on the Consolidated balance sheet.
The Group records the amount of cash advanced or received as securities borrowed and securities loaned, respectively, in the Consolidated balance sheet.
Fees received or paid are reported in interest income and interest expense, respectively. Securities lent to counterparties which are not derecognized from the Consolidated balance sheet and where the counterparty has the right by contract or custom to sell or repledge the collateral are disclosed in Note 20 “Transfer of Financial Assets, Assets Pledged and Received as Collateral”.
|
194
|
|
|
Deutsche Bank
|
Additional Notes
|
|
|
Annual Report 2021
|
|
|
|
|
|
Goodwill and other intangible assets
Goodwill arises on the acquisition of subsidiaries and associates and represents the excess of the aggregate of the cost of an acquisition and any non-controlling interests in the acquiree over the fair value of the identifiable net assets acquired at the date of the acquisition.
For the purpose of calculating goodwill, fair values of acquired assets, liabilities and contingent liabilities are determined by reference to market values or by discounting expected future cash flows to present value. This discounting is either performed using market rates or by using risk-free rates and risk-adjusted expected future cash flows. Any non-controlling interests in the acquiree are measured either at fair value or at the non-controlling interests’ proportionate share of the acquiree’s identifiable net assets (this is determined for each business combination).
Goodwill on the acquisition of subsidiaries is capitalized and reviewed for impairment annually or more frequently if there are indications that impairment may have occurred. For the purposes of impairment testing, goodwill acquired in a business combination is allocated to cash-generating units (“CGUs”), which are the smallest identifiable groups of assets that generate cash inflows largely independent of the cash inflows from other assets or groups of assets and that are expected to benefit from the synergies of the combination and considering the business level at which goodwill is monitored for internal management purposes. In identifying whether cash inflows from an asset (or a group of assets) are largely independent of the cash inflows from other assets (or groups of assets) various factors are considered, including how management monitors the entity’s operations or makes decisions about continuing or disposing of the entity’s assets and operations.
If goodwill has been allocated to a CGU and an operation within that unit is disposed of, the attributable goodwill is included in the carrying amount of the operation when determining the gain or loss on its disposal.
Corporate assets are allocated to a CGU when the allocation can be done on a reasonable and consistent basis. If this is not possible, the individual CGU is tested without the corporate assets. They are then tested on the level of the minimum collection of CGUs to which they can be allocated on a reasonable and consistent basis.
Intangible assets are recognized separately from goodwill when they are separable or arise from contractual or other legal rights and their fair value can be measured reliably. Intangible assets that have a finite useful life are stated at cost less any accumulated amortization and accumulated impairment losses. Customer-related intangible assets that have a finite useful life are amortized over periods of between 1 and 20 years on a straight-line basis based on their expected useful life. These assets are tested for impairment and their useful lives reaffirmed at least annually.
Certain intangible assets have an indefinite useful life and hence are not amortized, but are tested for impairment at least annually or more frequently if events or changes in circumstances indicate that impairment may have occurred.
Costs related to software developed or obtained for internal use are capitalized if it is probable that future economic benefits will flow to the Group and the cost can be measured reliably. Capitalized costs are amortized using the straight-line method over the asset’s useful life which is deemed to be either three, five or ten years. Eligible costs include external direct costs for materials and services, as well as payroll and payroll-related costs for employees directly associated with an internal-use software project. Overhead costs, as well as costs incurred during the research phase or after software is ready for use, are expensed as incurred. Capitalized software costs are tested for impairment either annually if still under development or any time when there is an indication of impairment once the software is in use.
Critical accounting estimates
– The determination of the recoverable amount in the impairment assessment of non-financial assets requires estimates based on quoted market prices, prices of comparable businesses, present value or other valuation techniques (such as the cost approach), or a combination thereof, necessitating management to make subjective judgments and assumptions. Because these estimates and assumptions could result in significant differences to the amounts reported if underlying circumstances were to change, the Group considers these estimates to be critical.
The quantitative disclosures are provided in Note 23 “Goodwill and other intangible assets”.
Provisions
Provisions are recognized if the Group has a present legal or constructive obligation as a result of past events, if it is probable that an outflow of resources will be required to settle the obligation, and a reliable estimate can be made of the amount of the obligation.
The amount recognized as a provision is the best estimate of the consideration required to settle the present obligation as of the balance sheet date, taking into account the risks and uncertainties surrounding the obligation.
If the effect of the time value of money is material, provisions are discounted and measured at the present value of the expenditure expected to be required to settle the obligation, using a pre-tax rate that reflects the current market assessments of the time value of money and the risks specific to the obligation. The increase in the provision due to the passage of time is recognized as interest expense.
When some or all of the economic benefits required to settle a provision are expected to be recovered from a third party (for example, because the obligation is covered by an insurance policy), an asset is recognized if it is virtually certain that reimbursement will be received.
If the Group has a contract that is onerous, the present obligation under the contract is recognized and measured as a provision. An onerous contract is a contract in which the unavoidable costs of meeting the obligations under the contract exceed the economic benefits expected to be received under it.
Critical accounting estimates
– The use of estimates is important in determining provisions for potential losses that may arise from litigation and regulatory proceedings. The Group estimates and provides for potential losses that may arise out of litigation and regulatory proceedings to the extent that such losses are probable and can be estimated, in accordance with IAS 37, “Provisions, Contingent Liabilities and Contingent Assets”. Significant judgment is required in making these estimates and the Group’s final liabilities may ultimately be materially different.
Contingencies in respect of legal matters are subject to many uncertainties and the outcome of individual matters is not predictable with assurance. Significant judgment is required in assessing probability and making estimates in respect of contingencies, and the Group’s final liability may ultimately be materially different. The Group’s total liability in respect of litigation, arbitration and regulatory proceedings is determined on a case-by-case basis and represents an estimate of probable losses after considering, among other factors, the progress of each case, the Group’s experience and the experience of others in similar cases, and the opinions and views of legal counsel. Predicting the outcome of the Group’s litigation matters is inherently difficult, particularly in cases in which claimants seek substantial or indeterminate damages. See Note 27 “Provisions” for further information on the uncertainties from the Group’s judicial, regulatory and arbitration proceedings.
|
195
|
|
|
Deutsche Bank
|
Additional Notes
|
|
|
Annual Report 2021
|
|
|
|
|
|
Income taxes
The Group recognizes the current and deferred tax consequences of transactions that have been included in the consolidated financial statements using the provisions of the respective jurisdictions’ tax laws. Current and deferred taxes are recognized in profit or loss except to the extent that the tax relates to items that are recognized directly in equity or other comprehensive income in which case the related tax is recognized either directly in equity or other comprehensive income accordingly.
Deferred tax assets and liabilities are recognized for future tax consequences attributable to temporary differences between the financial statement carrying amounts of existing assets and liabilities and their respective tax bases, unused tax losses and unused tax credits. Deferred tax assets are recognized only to the extent that it is probable that sufficient taxable profit will be available against which those unused tax losses, unused tax credits and deductible temporary differences can be utilized.
Deferred tax assets and liabilities are measured based on the tax rates that are expected to apply in the period that the asset is realized or the liability is settled, based on tax rates and tax laws that have been enacted or substantively enacted at the balance sheet date.
Current tax assets and liabilities are offset when (1) they arise from the same tax reporting entity or tax group of reporting entities, (2) the legally enforceable right to offset exists and (3) they are intended to be settled net or realized simultaneously.
Deferred tax assets and liabilities are offset when the legally enforceable right to offset current tax assets and liabilities exists and the deferred tax assets and liabilities relate to income taxes levied by the same taxing authority on either the same tax reporting entity or tax group of reporting entities.
Deferred tax liabilities are provided on taxable temporary differences arising from investments in subsidiaries, branches and associates and interests in joint ventures except when the timing of the reversal of the temporary difference is controlled by the Group and it is probable that the difference will not reverse in the foreseeable future. Deferred income tax assets are provided on deductible temporary differences arising from such investments only to the extent that it is probable that the differences will reverse in the foreseeable future and sufficient taxable income will be available against which those temporary differences can be utilized.
Deferred tax related to fair value remeasurement of financial assets classified as FVTOCI, cash flow hedges and other items, which are charged or credited directly to other comprehensive income, is also credited or charged directly to other comprehensive income and subsequently recognized in the Consolidated Statement of Income once the underlying transaction or event to which the deferred tax relates is recognized in the Consolidated Statement of Income.
For share-based payment transactions, the Group may receive a tax deduction related to the compensation paid in shares. The amount deductible for tax purposes may differ from the cumulative compensation expense recorded. At any reporting date, the Group must estimate the expected future tax deduction based on the current share price. The associated current and deferred tax consequences are recognized as income or expense in the consolidated statement of Income for the period. If the amount deductible, or expected to be deductible, for tax purposes exceeds the cumulative compensation expense, the excess tax benefit is recognized directly in equity.
Critical accounting estimates
– In determining the amount of deferred tax assets, the Group uses historical tax capacity and profitability information and, if relevant, forecasted operating results based upon approved business plans, including a review of the eligible carry-forward periods, available tax planning opportunities and other relevant considerations. The analysis of historical tax capacity includes the determination as to whether a history of recent losses exists at the reporting date. The determination of a history of recent losses is based on the pre-tax results adjusted for permanent differences and typically covers the current and the two preceding financial years. Each quarter, the Group re-evaluates its estimate related to deferred tax assets, including its assumptions about future profitability.
The Group believes that the accounting estimate related to the deferred tax assets is a critical accounting estimate because the underlying assumptions can change from period to period and requires significant management judgment. For example, tax law changes or variances in future projected operating performance could result in a change of the deferred tax asset. If the Group was not able to realize all or part of its net deferred tax assets in the future, an adjustment to its deferred tax assets would be charged to income tax expense or directly to equity in the period such determination was made. If the Group was to recognize previously unrecognized deferred tax assets in the future, an adjustment to its deferred tax asset would be credited to income tax expense or directly to equity in the period such determination was made.
The use of estimates is also important in determining provisions for potential losses that may arise from uncertain income tax positions. The Group estimates and provides for potential losses that may arise out of uncertain income tax positions, in accordance with IAS 12, “Income Taxes” and IFRIC 23, “Uncertainty over Income Tax Treatment”. Significant judgment is required in making these estimates and the Group’s final liabilities may ultimately be materially different.
For further information on the Group’s deferred taxes (including quantitative disclosures on recognized deferred tax assets) see Note 34 “Income Taxes”.
Business combinations and non-controlling Interests
The Group uses the acquisition method to account for business combinations. At the date the Group obtains control of the subsidiary, the cost of an acquisition is measured at the fair value of the consideration given, including any cash or non-cash consideration (equity instruments) transferred, any contingent consideration, any previously held equity interest in the acquiree and liabilities incurred or assumed. The excess of the aggregate of the cost of an acquisition and any non-controlling interests in the acquiree over the Group’s share of the fair value of the identifiable net assets acquired is recorded as goodwill. If the aggregate of the acquisition cost and any non-controlling interests is below the fair value of the identifiable net assets (negative goodwill), a gain is reported in other income. Acquisition-related costs are recognized as expenses in the period in which they are incurred.
In business combinations achieved in stages (“step acquisitions”), a previously held equity interest in the acquiree is remeasured to its acquisition-date fair value and the resulting gain or loss, if any, is recognized in profit or loss. Amounts recognized in prior periods in other comprehensive income associated with the previously held investment would be recognized on the same basis as would be required if the Group had directly disposed of the previously held equity interest.
Non-controlling interests are shown in the consolidated balance sheet as a separate component of equity, which is distinct from the Group’s shareholders’ equity. The net income attributable to non-controlling interests is separately disclosed on the face of the Consolidated Statement of Income. Changes in the ownership interest in subsidiaries which do not result in a change of control are treated as transactions between equity holders and are reported in additional paid-in capital (“APIC”).
|
196
|
|
|
Deutsche Bank
|
Additional Notes
|
|
|
Annual Report 2021
|
|
|
|
|
|
Non-current assets held for sale
Individual non-current assets (and disposal groups) are classified as held for sale if they are available for immediate sale in their present condition subject only to the customary sales terms of such assets (and disposal groups) and their sale is considered highly probable. For a sale to be highly probable, management must be committed to a sales plan and be actively looking for a buyer and has no substantive regulatory approvals outstanding. Furthermore, the assets (and disposal groups) must be actively marketed at a reasonable sales price in relation to their current fair value and the sale should be expected to be completed within one year. Non-current non-financial assets (and disposal groups) which meet the criteria for held for sale classification are measured at the lower of their carrying amount and fair value less costs of disposal and are presented within “Other assets” and “Other liabilities” in the balance sheet. Financial assets and liabilities meeting the criteria continue to be measured in accordance with IFRS 9. The comparatives are not represented when non-current assets (and disposal groups) are classified as held for sale. If the disposal group contains financial instruments, no adjustment to their carrying amounts is permitted.
Property and equipment
Property and equipment includes own-use properties, leasehold improvements, furniture and equipment and software (operating systems only). Right-of-use assets are presented together with property and equipment on the Group’s consolidated balance sheet. Own-use properties are carried at cost less accumulated depreciation and accumulated impairment losses. Depreciation is generally recognized using the straight-line method over the estimated useful lives of the assets. The range of estimated useful lives is 25 to 50 years for property and 3 to 10 years for furniture and equipment (including initial improvements to purchased buildings). Leasehold improvements are capitalized and subsequently depreciated on a straight-line basis over the shorter of the term of the lease and the estimated useful life of the improvement, which generally ranges from 3 to 25 years. Depreciation of property and equipment is included in general and administrative expenses. Maintenance and repairs are also charged to general and administrative expenses. Gains and losses on disposals are included in other income.
Property and equipment are assessed for any indication of impairment at each quarterly reporting date. If such indication exists, the recoverable amount, which is the higher of fair value less costs of disposal and value in use, must be estimated and an impairment charge is recorded to the extent the recoverable amount is less than its carrying amount. Value in use is the present value of the future cash flows expected to be derived from the asset. After the recognition of impairment of an asset, the depreciation charge is adjusted in future periods to reflect the asset’s revised carrying amount. If an impairment is later reversed, the depreciation charge is adjusted prospectively.
|
197
|
|
|
Deutsche Bank
|
Additional Notes
|
|
|
Annual Report 2021
|
|
|
|
|
|
Financial guarantees
Financial guarantee contracts are contracts that require the issuer to make specified payments to reimburse the holder for a loss it incurs because a specified debtor fails to make payments when due in accordance with the terms of a debt instrument.
Financial guarantees written
The Group has chosen to apply the fair value option to certain written financial guarantees that are managed on a fair value basis. Financial guarantees that the Group has not designated at fair value are recognized initially at fair value on the date the guarantee is given. Subsequent to initial recognition, the Group’s liabilities under such guarantees are measured at the higher of the amount initially recognized, less cumulative amortization, and the best estimate of the expenditure required to settle any financial obligation as of the balance sheet date. These estimates are determined based on experience with similar transactions and history of past losses, and management’s determination of the best estimate.
Any increase in the liability relating to guarantees is recorded in the Consolidated Statement of Income in provision for credit losses.
Financial guarantees purchased
Purchased financial guarantees result in reimbursements under IAS 37 to the extent that the financial guarantee is entered into to mitigate the credit exposure from debt instruments with HTC or HTCS business models. This results in recognition of a reimbursement asset for subsequent increases in the expected credit losses, to the extent it is virtually certain that the purchased financial guarantee will reimburse the Group for the loss incurred. Accordingly, when the credit risk of the borrower significantly deteriorates a reimbursement asset is recognized equal to the life-time expected credit losses and is presented as Other Assets in the Group’s Consolidated Balance Sheet. The corresponding reimbursement gain is recognized as a reduction in the Provision for credit losses in the Group’s Consolidated Statement of Income.
Purchased financial guarantees entered into to mitigate credit exposure from debt instruments allocated to HTC or HTCS business models may also be embedded in Collateralized Loan Obligations (CLO’s) issued by the Group. Such embedded guarantees are not accounted for separately as a reimbursement asset and instead accounted as part of the CLO’s liability held at amortized cost. The Group regularly revises its estimated contractual redemption payment (including the benefit of such embedded guarantees) from the CLO when the credit risk of a borrower covered by the embedded financial guarantee in the CLO significantly deteriorates. The revision is based on the life-time expected credit losses of the debt instrument (to the extent covered by the CLO).
Purchased financial guarantees entered into to mitigate credit exposure from debt instruments included in the Other business model are accounted for at fair value through profit or loss.
Leasing transactions
The Group enters into lease contracts, predominantly for land and buildings, as a lessee. Other categories are company cars and technical/IT equipment.
The Group assesses at contract inception whether a contract is, or contains, a lease. That is, if the contract conveys the right to control the use of an identified asset for a period of time in exchange for consideration.
The Group applies a single recognition and measurement approach for all leases with a term of more than 12 months, unless the underlying asset is of low value. As a lessee, at the lease commencement date, the Group recognizes a right-of-use asset representing its right to use the underlying leased asset and a lease liability representing its obligation to make lease payments.
The right-of-use asset is measured at cost, less any accumulated depreciation and impairment losses, and adjusted for any re-measurement of lease liabilities. The cost of right-of-use assets includes the amount of lease liabilities, adjusted for any lease payments made at or before the commencement date, plus any initial direct costs incurred and an estimate of costs to dismantle and remove the underlying asset or to restore the site on which it is located, less any lease incentives received. Right-of-use assets are depreciated on a straight-line basis over the lease term.
The lease liability is measured at the present value of lease payments to be made over the lease term. The lease payments include fixed payments (including in substance fixed payments) less any lease incentives receivable and variable lease payments that depend on an index or a rate. Variable lease payments that do not depend on an index or a rate are recognized as expenses in the period in which the event or condition that triggers the payment occurs.
In calculating the present value of lease payments, the Group uses its incremental borrowing rate at the lease commencement date because the interest rate implicit in the lease is not readily determinable. After the commencement date, the amount of lease liabilities is increased to reflect the accretion of interest and reduced for the lease payments made. In addition, the carrying amount of lease liabilities is re-measured if there is a modification, a change in the lease term or a change in the lease payments (e.g., changes to future payments resulting from a change in an index or rate used to determine such lease payments).
Right-of-use assets are assessed for any indication of impairment at each quarterly reporting date. If such indication exists, the recoverable amount, which is the fair value less costs of disposal, must be estimated and an impairment charge is recorded to the extent the recoverable amount is less than its carrying amount. As right-of-use assets do not have independently generated cash flows to calculate its value in use, the Group considers any sublease income that could reasonably be earned. After the recognition of impairment of an asset, the depreciation charge is adjusted in future periods to reflect the asset’s revised carrying amount. If an impairment is later reversed, the depreciation charge is adjusted prospectively.
The Group presents right-of-use assets “Property and Equipment” and lease liabilities in “Other Liabilities”.
The Group applies the short-term lease recognition exemption to its short-term leases, i.e., those leases that have a lease term of 12 months or less from the commencement date. It also applies the lease of low-value assets recognition exemption to leases of technical/IT equipment that are considered to be low value. Lease payments on short-term leases and leases of low value assets are recognized as expense on a straight-line basis over the lease term.
|
198
|
|
|
Deutsche Bank
|
Additional Notes
|
|
|
Annual Report 2021
|
|
|
|
|
|
Employee benefits
Pension benefits
The Group provides a number of pension plans. In addition to defined contribution plans, there are retirement benefit plans accounted for as defined benefit plans. The assets of all the Group’s defined contribution plans are held in independently administered funds. Contributions are generally determined as a percentage of salary and are expensed based on employee services rendered, generally in the year of contribution.
All retirement benefit plans accounted for as defined benefit plans are valued using the projected unit-credit method to determine the present value of the defined benefit obligation and the related service costs. Under this method, the determination is based on actuarial calculations which include assumptions about demographics, salary increases and interest and inflation rates. Actuarial gains and losses are recognized in other comprehensive income and presented in equity in the period in which they occur. The majority of the Group’s benefit plans is funded.
For the Group’s most significant pension plans in the key countries, the discount rate used at each measurement date is set based on a high quality corporate bond yield curve – derived based on bond universe information sourced from reputable third-party index data providers and rating agencies – reflecting the timing, amount and currency of the future expected benefit payments for the respective plan.
Other post-employment benefits
In addition, the Group maintains unfunded contributory post-employment medical plans for a number of current and retired employees who are mainly located in the United States. These plans pay stated percentages of eligible medical and dental expenses of retirees after a stated deductible has been met. The Group funds these plans on a cash basis as benefits are due. Analogous to retirement benefit plans these plans are valued using the projected unit-credit method. Actuarial gains and losses are recognized in full in the period in which they occur in other comprehensive income and presented in equity.
Refer to Note 33 “Employee benefits” for further information on the accounting for pension benefits and other post-employment benefits.
Termination benefits
Termination benefits arise when employment is terminated by the Group before the normal retirement date or whenever an employee accepts voluntary redundancy in exchange for these benefits. The Group recognizes termination benefits as a liability and an expense if the Group is demonstrably committed to a detailed formal plan without realistic possibility of withdrawal. In the case of an offer made to encourage voluntary redundancy, termination benefits are measured based on the number of employees expected to accept the offer. Benefits falling due more than twelve months after the end of the reporting period are discounted to their present value. The discount rate is determined by reference to market yields on high-quality corporate bonds.
Share-based compensation
Compensation expense for awards classified as equity instruments is measured at the grant date based on the fair value of the share-based award. For share awards, the fair value is the quoted market price of the share reduced by the present value of the expected dividends that will not be received by the employee and adjusted for the effect, if any, of restrictions beyond the vesting date. In case an award is modified such that its fair value immediately after modification exceeds its fair value immediately prior to modification, a remeasurement takes place and the resulting increase in fair value is recognized as additional compensation expense.
The Group records the offsetting amount to the recognized compensation expense in additional paid-in capital (“APIC”). Compensation expense is recorded on a straight-line basis over the period in which employees perform services to which the awards relate or over the period of the tranches for those awards delivered in tranches. Estimates of expected forfeitures are periodically adjusted in the event of actual forfeitures or for changes in expectations. The timing of expense recognition relating to grants which, due to early retirement provisions, include a nominal but non-substantive service period are accelerated by shortening the amortization period of the expense from the grant date to the date when the employee meets the eligibility criteria for the award, and not the vesting date. For awards that are delivered in tranches, each tranche is considered a separate award and amortized separately.
Compensation expense for share-based awards payable in cash is remeasured to fair value at each balance sheet date and recognized over the vesting period in which the related employee services are rendered. The related obligations are included in other liabilities until paid.
|
199
|
|
|
Deutsche Bank
|
Additional Notes
|
|
|
Annual Report 2021
|
|
|
|
|
|
Government Grants
The Group recognizes income from government grants when there is reasonable assurance that it will receive the grant and will comply with the conditions attached to the grant. The benefit is recognized in the period in which the grant is intended to compensate the Group for related costs and presented as a reduction of the related expense.
The Group considers the European Central Bank (ECB) as a government or similar body for the purposes of IAS 20. The effective interest rate for borrowings under the ECB’s Targeted Longer-Term Refinancing Operations III (“TLTRO III”)-refinancing program is determined based on the applicable ECB refinancing rates outside of TLTRO III. The Group accounts for the benefit as a government grant. The TLTRO III refinancing program is intended to stimulate credit creation in the Eurozone area by incentivizing lending by participating banks to non-financial corporations and households. The size of the benefit depends on the amounts borrowed and on meeting the various lending performance thresholds. During 2021, the IFRS Interpretations Committee (IFRS IC) received a request to clarify how to account for TLTRO III but, as of the date of these financial statements, has not yet published its final view on this matter. The Group has closely monitored the IFRS IC deliberations on this topic and the Group’s assessment of TLTRO III. In this respect while DB awaits the final agenda decision from the IFRS IC deliberations it does not expect a material impact from the decision.
For further information on the benefit recognized by the Group from the TLTRO III refinancing program see Note 5 “Net interest income and net gains (losses) on financial assets/liabilities at fair value through profit or loss”.
Obligations to purchase common shares
Forward purchases of Deutsche Bank shares, and written put options where Deutsche Bank shares are the underlying, are reported as obligations to purchase common shares if the number of shares is fixed and physical settlement for a fixed amount of cash is required. At inception, the obligation is recorded at the present value of the settlement amount of the forward or option. For forward purchases and written put options of Deutsche Bank shares, a corresponding charge is made to shareholders’ equity and reported as equity classified as an obligation to purchase common shares.
The liabilities are accounted for on an accrual basis, and interest costs, which consist of time value of money and dividends, on the liability are reported as interest expense. Upon settlement of such forward purchases and written put options, the liability is extinguished and the charge to equity is reclassified to common shares in treasury.
Deutsche Bank common shares subject to such forward contracts are not considered to be outstanding for purposes of basic earnings per share calculations, but are for dilutive earnings per share calculations to the extent that they are, in fact, dilutive.
Option and forward contracts on Deutsche Bank shares are classified as equity if the number of shares is fixed and physical settlement is required. All other contracts in which Deutsche Bank shares are the underlying are recorded as financial assets or liabilities at fair value through profit or loss.
Consolidated statement of cash flows
For purposes of the consolidated statement of cash flows, the Group’s cash and cash equivalents include highly liquid investments that are readily convertible into cash and which are subject to an insignificant risk of change in value. Such investments include cash and balances at central banks and demand deposits with banks.
The Group’s assignment of cash flows to the operating, investing or financing category depends on the business model (“management approach”). For the Group the primary operating activity is to manage financial assets and financial liabilities. Therefore, the issuance and management of long-term borrowings is a core operating activity which is different than for a non-financial company, where borrowing is not a principal revenue producing activity and thus is part of the financing category.
The Group views the issuance of senior long-term debt as an operating activity. Senior long-term debt comprises structured notes and asset-backed securities, which are designed and executed by the Corporate Bank and Investment Bank business line segments and which are revenue generating activities. The other component is debt issued by Treasury, which is considered interchangeable with other funding sources; all of the funding costs are allocated to business activities to establish their profitability.
Cash flows related to subordinated long-term debt and trust preferred securities are viewed differently than those related to senior-long term debt because they are managed as an integral part of the Group’s capital, primarily to meet regulatory capital requirements. As a result they are not interchangeable with other operating liabilities, but can only be interchanged with equity and thus are considered part of the financing category.
The amounts shown in the consolidated statement of cash flows do not precisely match the movements in the consolidated balance sheet from one period to the next as they exclude non-cash items such as movements due to foreign exchange translation and movements due to changes in the group of consolidated companies.
Movements in balances carried at fair value through profit or loss represent all changes affecting the carrying value. This includes the effects of market movements and cash inflows and outflows. The movements in balances carried at fair value are usually presented in operating cash flows.
|
200
|
|
|
Deutsche Bank
|
Additional Notes
|
|
|
Annual Report 2021
|
|
|
|
|
|
02 –
Recently adopted and new accounting pronouncements
Recently adopted accounting pronouncements
The following are those accounting pronouncements which are relevant to the Group and which have been adopted during 2021 in the preparation of these consolidated financial statements.
Interest Rate Benchmark Reform (Amendments to IFRS 9, IAS 39, IFRS 7, IFRS 4 and IFRS 16)
On January 1, 2021, the Group adopted amendments to IFRS 9, “Financial Instruments”, IAS 39, “Financial Instruments: Recognition and Measurement“, IFRS 7, “Financial Instruments: Disclosures”, IFRS 4, “Insurance Contracts” and IFRS 16, “Leases” as Phase 2 of the IASB’s project addressing the potential effects from the reform of the London Interbank Offered Rate (“LIBOR”) and Eonia (together “IBOR”) on financial reporting. The Group adopted Phase 1 requirements on January 1, 2019. Phase 1 continues to apply for certain USD LIBOR tenors where cessation is not due before June 2023.
The amendments in Phase 2 deal with replacement issues, therefore, they address issues that might affect financial reporting when an existing interest rate benchmark is replaced. This includes modification of financial assets, financial liabilities and lease liabilities as well as specific hedge accounting requirements. The amendments introduce a practical expedient for modifications required by the reform (modifications required as a direct consequence of the IBOR reform and made on an economically equivalent basis). These modifications are accounted for by updating the effective interest rate. All other modifications are accounted for using the current IFRS requirements. A similar practical expedient is introduced for lessee accounting applying IFRS 16, whereby when assessing the lease modification due to the IBOR reform the discount rate used in calculating the revised carrying value of the lease liability is amended for the change in the benchmark rate only. In addition, under the amendments hedge accounting is not discontinued solely because of the IBOR reform. Hedging relationships (and related documentation) must be amended to reflect modifications to the hedged item, hedging instrument and hedged risk. Amended hedging relationships should meet all qualifying criteria to apply hedge accounting, including effectiveness requirements. The amendments also require additional disclosures that allow users to understand the nature and extent of risks arising from the IBOR reform to which the entity is exposed to and how the entity manages those risks. In addition, the entity’s progress in transitioning from IBOR to alternative benchmark rates, and how the entity is managing this transition requires disclosure.
The Group established a Group-wide IBOR EU Benchmark Regulation transition program in 2018, aimed at managing a smooth transition from IBOR to the new Risk-free Rates (RFRs). The program is sponsored by the Chief Financial Officer and has senior representation from each division, region and infrastructure function. The program has been focused on identifying and quantifying exposures to various interest rate benchmarks, providing the capability to trade products referencing alternative RFRs and evaluating existing contracts that reference IBOR. Progress updates are provided monthly to the Group’s IBOR Transition Steering Committee and the CFO. Oversight of the program to prepare for the transition has been a major focus along with activities across all three lines of defense to minimize risk and disruption to customers and financial markets.
The Group has significant exposure to IBORs predominantly in financial instruments and many of these contracts mature after the cessation dates for each benchmark. The Group’s exposures from derivatives result from transactions that are entered in order to make markets for its clients and hedge its risks as well as from loans and deposits, bonds and securitizations. The Group has detailed plans, processes and procedures in place to support the transition by their planned cessation date.
As part of the program, the Group has undertaken a comprehensive transformation risk assessment which is refreshed regularly and has identified key inherent risks and mitigating actions to improve the control environment. Key risks include business strategic risk, legal and compliance risk, conduct risk, liquidity risk, market risk, credit risk, operational risk, transition risk, model risk, accounting, financial reporting and tax risk, information security and technology transformation risk.
The Group continues to implement plans, aiming to mitigate remaining risks associated with the expected discontinuation of IBOR-referenced benchmark interest rates. In this regard, the Group:
- – reviewed the fallback language for IBOR-linked instruments including the development of a new framework introduced to quantify the potential impact of positions difficult to transition, referred to as “tough legacy”;
- – a Conduct Risk Advisory forum was initiated in the beginning of 2020, aiming to discuss and review all conduct risks types (including new risks and current plan) relevant for the IBOR transition.
- – implemented the transition of its interest rate risk hedge accounting programs to the risk-free rates except for USD LIBOR which is in progress.
- – proactively engaged with clients to facilitate and support the transition of financial instruments to new RFRs.
|
201
|
|
|
Deutsche Bank
|
Additional Notes
|
|
|
Annual Report 2021
|
|
|
|
|
|
Although the Group has significant exposure to IBORs predominantly in financial instruments, the amendments did not have a material impact on transition on the Group’s consolidated financial statements.
In 2021, the Group made positive progress in its transition activities, particularly in IBORs that ceased publication January 3, 2022. Specifically for these IBORs the Group:
- – is able to offer clients the majority of products on an RFR equivalent basis.
- – has fallback language in place for the vast majority of the Group’s bilateral derivative transactions.
- – is proactively using effective fallback language available when conducting any new IBOR based transactions.
- – actively transitioned almost all existing contracts from IBOR to RFR with clients.
- – migrated its risk and pricing architecture from GBP, CHF, JPY and USD LIBOR to SONIA, SARON, TONAR and SOFR respectively, including our capital calculations.
- – amended the hedge documentation and hedged risk in hedge accounting relationships for the transition of GBP LIBOR, CHF LIBOR, JPY LIBOR, USD LIBOR and EONIA to SONIA, SARON, TONAR, SOFR and ESTR respectively.
As the industry transitions from IBOR to RFR, market liquidity is expected to reduce in IBOR based financial instruments and to increase in RFR based financial instruments. The valuation of financial instruments is accordingly expected to be derived with reference to RFRs. This is not expected to have a material impact on the Group’s consolidated income statement. In some jurisdictions and in some currencies, there are multiple reference rates emerging that may be adopted in certain financial instruments. The Group continues to examine these reference rates and will monitor market developments over time.
IFRS 4 “Insurance Contracts”
On January 1, 2021, the Group adopted amendments to IFRS 4 “Insurance Contracts” which extend the temporary exemption to apply IFRS 9 to annual periods beginning on or after January 1, 2023. The amendments did not have a material impact on the Group’s consolidated financial statements.
IFRS 16 “Leases”
On August 30, 2021, the Group adopted amendments to IFRS 16 “Leases” that extend the previously provided exemption for lessees from assessing whether a COVID-19-related rent concession is a lease modification to rent concessions for which any reduction in lease payments affects only payments originally due on or before June 30, 2022 (rather than only payments originally due on or before June 30, 2021). The amendments did not have a material impact on the Group’s consolidated financial statements.
New accounting pronouncements
The following accounting pronouncements were not effective as of December 31, 2021 and therefore have not been applied in preparing these consolidated financial statements.
IFRS 17 “Insurance Contracts”
In May 2017, the IASB issued IFRS 17, “Insurance Contracts”, which establishes the principles for the recognition, measurement, presentation and disclosure of insurance contracts within the scope of the standard. IFRS 17 replaces IFRS 4 which has given companies dispensation to carry on accounting for insurance contracts using national accounting standards, resulting in a multitude of different approaches. IFRS 17 solves the comparison problems created by IFRS 4 by requiring all insurance contracts to be accounted for in a consistent manner, benefiting both investors and insurance companies. Insurance obligations will be accounted for using current values – instead of historical cost. The information will be updated regularly, providing more useful information to users of financial statements. IFRS 17 is effective for annual periods beginning on or after January 1, 2023. Based on the Group’s current business activities it is expected that IFRS 17 will not have a material impact on the Group’s consolidated financial statements.
In June 2020, the IASB issued amendments to IFRS 17 “Insurance Contracts” that address concerns and implementation challenges that were identified after IFRS 17 was published in 2017. The amendments are effective for annual periods beginning on or after January 1, 2023 with early adoption permitted.
In December 2021, the IASB issued amendments to IFRS 17 “Insurance Contracts” that is a narrow-scope amendment to the transition requirements of IFRS 17 for entities that first apply IFRS 17 and IFRS 9 at the same time. The amendments (if elected) will be applicable when IFRS 17 is first applied. These amendments have yet to be endorsed by the EU.
|
202
|
|
|
Deutsche Bank
|
Additional Notes
|
|
|
Annual Report 2021
|
|
|
|
|
|
IAS 37 “Provisions, Contingent Liabilities and Contingent Assets”
In May 2020, the IASB issued amendments to IAS 37, “Provisions, Contingent Liabilities and Contingent Assets” to clarify what costs an entity considers in assessing whether a contract is onerous. The amendments specify that the ‘cost of fulfilling’ a contract comprises the ‘costs that relate directly to the contract’. Costs that relate directly to a contract can either be incremental costs of fulfilling that contract or an allocation of other costs that relate directly to fulfilling contracts. The amendments are effective for annual periods beginning on or after January 1, 2022 with early adoption permitted. The amendments will not have a material impact on the Group’s consolidated financial statements.
IAS 12 “Income Taxes”
In May 2021, the IASB issued amendments to IAS 12 “Income Taxes”. They change the deferred tax treatment related to assets and liabilities in a single transaction such that they introduce an exemption from the initial recognition exemption provided in IAS 12.15(b) and IAS 12.24. Accordingly, the initial recognition exemption does not apply to transactions in which both deductible and taxable temporary differences arise on initial recognition that result in the recognition of equal deferred tax assets and liabilities. The amendments will be effective for annual periods beginning on or after January 1, 2023 with early adoption permitted. The amendment will not have a material impact on the Group’s consolidated financial statements. These amendments have yet to be endorsed by the EU.
IAS 1 “Presentation of Financial Statements”
In January 2020 and July 2020, the IASB issued amendments to IAS 1 “Presentation of Financial Statements: Classification of Liabilities as Current or Non-Current”. They clarify that the classification of liabilities as current or non-current should be based on rights that are in existence at the end of the reporting period. The amendments also clarify that the classification is unaffected by expectations about whether an entity will exercise its right to defer settlement of a liability and make clear that settlement refers to the transfer to the counterparty of cash, equity instruments, other assets or services. The amendments will be effective for annual periods beginning on or after January 1, 2023 with early adoption permitted. The amendment will not have a material impact on the Group’s consolidated financial statements. These amendments have yet to be endorsed by the EU.
Improvements to IFRS 2018-2020 Cycles
In May 2020, the IASB issued amendments to multiple IFRS standards, which resulted from the IASB’s annual improvement project for the 2018-2020 cycles. These comprise amendments that result in accounting changes for presentation, recognition or measurement purposes as well as terminology or editorial amendments related to IFRS 1 “First-time Adoption of International Financial Reporting Standards”, IFRS 9 “Financial Instruments”, IFRS 16 “Leases” and IAS 41 “Agriculture”. The amendments to IFRS 9 clarify which fees an entity includes when assessing whether to derecognize a financial liability. The amendments will be effective for annual periods beginning on or after January 1, 2022 with early adoption permitted. The amendments will not have a material impact on the Group’s consolidated financial statements.
03 –
Acquisitions and dispositions
Business combinations
In the third quarter 2021, the Group completed the acquisition of
100
%
of the shares in Better Payment Germany GmbH, a Berlin-based early-stage payment service provider. Through this acquisition, the Group intends to expand its market share in payment processing and acceptance. The fair value of the purchase price paid for the acquisition consisted of
€
5
million
cash and an earn-out consideration of
€
3
million
contingent upon a number of KPIs to be achieved within 3 years following the acquisition. As part of the preliminary purchase price allocation, the Group recorded goodwill of
€
5
million
assigned to the Corporate Bank cash-generating unit (CB CGU). Given the specific valuation of the unit, the new goodwill in CB was considered impaired and immediately written off in 2021 (refer to Note 23 “Goodwill and Other Intangible Assets”).
During the years 2020 and 2019, the Group did not undertake any acquisitions accounted for as business combinations.
Dispositions
|
203
|
|
|
Deutsche Bank
|
Additional Notes
|
|
|
Annual Report 2021
|
|
|
|
|
|
The Group finalized several dispositions of subsidiaries/businesses during 2021, 2020 and 2019. These disposals were mainly comprised of businesses the Group had previously classified as held for sale, including the completion of the transfer of the Global Prime Finance Electronic Equities platform to BNP Paribas in 2021, the sale of Postbank Systems AG in 2020 and the sale of the Private Commercial Clients business in Portugal in 2019. For more detail, please refer to Note 24 “Non-Current Assets and Disposal Groups Held for Sale”. The total consideration received for these dispositions (thereof in cash) in 2021, 2020 and 2019 was
€
34
million
(cash
€
0
million
),
€
7
million
(cash
€
7
million
) and
€
1.8
billion
(cash
€
1.8
billion
), respectively. The table below shows the assets and liabilities that were included in these disposals. The amounts for 2021 represent the assets and liabilities held for sale of the Global Prime Finance Electronic Equities business at the end of the third quarter 2021 preceding the completion of the transfer to BNP Paribas in 2021.
|
in € m.
|
|
2021
|
|
2020
|
|
2019
|
|
Cash and cash equivalents
|
|
|
|
|
|
|
|
All remaining assets
|
|
|
|
|
|
|
|
Total assets disposed
|
|
|
|
|
|
|
|
Total liabilities disposed
|
|
|
|
|
|
|
|
|
|
|
|
|
|
|
04 –
Business segments and related information
The Group’s segmental information has been prepared in accordance with the “management approach”, which requires presentation of the segments on the basis of the internal management reports of the entity which are regularly reviewed by the chief operating decision maker, which is the Deutsche Bank Management Board, in order to allocate resources to a segment and to assess its financial performance.
Business segments
The Group’s segment reporting follows the organizational structure as reflected in its internal management reporting systems, which are the basis for assessing the financial performance of the business segments and for allocating resources to the business segments.
The bank’s business operations are organized under the divisional structure comprising the following corporate divisions:
- – Corporate Bank (CB)
- – Investment Bank (IB)
- – Private Bank (PB)
- – Asset Management (AM)
- – Capital Release Unit (CRU)
- – Corporate Other (CO)
The segmental information for the corporate divisions PB, AM, CRU and CO remained unchanged in its scope and the related segment information is outlined below. There was a change compared to the prior year presentation related to CB as well as IB which is described in the below section.
From the first quarter 2021 reporting onwards, the Corporate Bank reports revenues in the categories Institutional Client Services, Corporate Treasury Services and Business Banking. Institutional Client Services comprises of Cash Management for Institutional clients, Trust and Agency Services, as well as Securities Services, all of which were previously reported under “Global Transaction Banking’. Corporate Treasury Services provides the full suite of Trade Finance and Lending, as well as Corporate Cash Management for multinational and German large and mid-sized corporate clients, previously reported under ‘Global Transaction Banking’ and ‘Commercial Banking Germany’. Business Banking – previously reported under ‘Commercial Banking Germany’ - covers small corporates and entrepreneur clients in Germany and offers a holistic, largely standardized product suite. The prior years' segmental information is presented in the current structure.
The Investment Bank combines Deutsche Bank’s Fixed Income, Currency (FIC) Sales Trading and, Origination Advisory, as well as Deutsche Bank Research. Commencing from the second quarter of 2021, the Investment Bank presented CLO recovery gains and losses in its revenue category “Other”. Previously these gains and losses were presented in “FIC Sales Trading” and “Origination Advisory”. The prior years' segmental information is presented in the current structure.
The Private Bank includes Private Bank Germany and International Private Bank. The division covers personal and private clients, wealthy individuals, entrepreneurs and families. The international businesses also provide services to commercial clients.
Asset Management operates under the DWS brand. Asset Management provides investment solutions to individual investors and institutions with a diversified range of Active, Passive and Alternative Asset Management products and services.
Capital Release Unit includes the remaining assets transferred in from Equities Sales Trading business, lower yielding fixed income positions, particularly in Rates, former CIB Non-Strategic portfolio as well as a legacy loan portfolio from the former Private Commercial Bank in Poland. In the fourth quarter of 2021, the bank concluded the transition of Deutsche Bank’s Prime Finance and Electronic Equities platform to BNP Paribas.
|
204
|
|
|
Deutsche Bank
|
Additional Notes
|
|
|
Annual Report 2021
|
|
|
|
|
|
Corporate Other includes revenues, costs and resources held centrally that are not allocated to the individual business segments as well as valuation and timing differences from different accounting methods used for management reporting and IFRS.
In addition, based on management decisions during the reporting period further divisional changes were introduced. The prior years' segmental information is presented in the current structure.
Measurement of segment profit or loss
Segment reporting requires a presentation of the segment results based on management reporting methods, including a reconciliation between the results of the business segments and the consolidated financial statements, which is presented in the “Segmental Results of Operations” section within this note. The information provided about each segment is based on internal management reporting about segment profit or loss, assets and other information which is regularly reviewed by the chief operating decision maker. Segment assets are presented in the Group’s internal management reporting based on a consolidated view, i.e., the amounts do not include intersegment balances. The Group`s internal management reporting does not consider segment liabilities or interest expense separately. Similarly, depreciation and amortization, tax expenses and other comprehensive income are not presented separately internally and are therefore not disclosed here.
Non-IFRS compliant accounting methods used in the Group’s management reporting represent either valuation or classification differences. The largest valuation differences relate to measurement at fair value in management reporting versus measurement at amortized cost under IFRS and to the recognition of trading results from own shares in revenues in management reporting (in IB) and in equity under IFRS. The major classification difference relates to noncontrolling interest, which represents the net share of minority shareholders in revenues, provision for credit losses, noninterest expenses and income tax expenses. Noncontrolling interest is reported as a component of the profit before tax of the businesses in management reporting (with a reversal in CO) and a component of net income appropriation under IFRS.
Since the Group’s business activities are diverse in nature and its operations are integrated, certain estimates and judgments have been made to apportion revenue and expense items among the business segments.
The management reporting systems allocate the Group’s external net interest income according to the value of funding consumed or provided by each business segment’s activities, in accordance with the bank’s internal funds transfer pricing (“FTP”) framework. Furthermore, to retain comparability with those competitors that have legally independent units with their own equity funding, the Group allocates a net notional interest benefit on its consolidated capital, in line with each segment’s proportion of average shareholders’ equity.
Management uses certain measures for equity and related ratios as part of its internal reporting system because it believes that these measures provide it with a useful indication of the financial performance of the business segments. The Group discloses such measures to provide investors and analysts with further insight into how management operates the Group’s businesses and to enable them to better understand the Group’s results. These measures include allocation of average shareholder’s equity.
Funds Transfer Pricing
In the third quarter of 2019, the FTP framework was changed in order to enhance its effectiveness as a management tool, as well as to better support funding cost optimization. The new FTP framework aims to more accurately allocate funding costs and benefits to the firm’s business divisions in a risk-adjusted and uniform manner across the Group. The methodology changes do not impact overall group funding costs, however, the framework results in a re-allocation of costs and benefits between segments. This re-allocation resulted in a benefit to the trading businesses, partially offset by a reduction in funding benefits to the Private Bank (PB) and Corporate Bank (CB) versus the prior methodology. As part of the introduction of the new framework, a decision was made to hold certain transitional costs in Corporate Others (CO), which will reduce over time, reflecting the long dated nature of liabilities.
The impact of the new FTP framework for the first half of 2019 would have been a positive impact on the results of IB and CRU of approximately
€
140
million
and
€
30
million
, respectively, while the results of CB, PB and CO would have been lower by approximately
€
20
million
,
€
30
million
and
€
120
million
, respectively.
Allocation of Average Shareholder’s Equity
|
205
|
|
|
Deutsche Bank
|
Additional Notes
|
|
|
Annual Report 2021
|
|
|
|
|
|
Shareholders’ equity is fully allocated to the Group’s segments based on the regulatory capital demand of each segment. Regulatory capital demand reflects the combined contribution of each segment to the Groups’ Common Equity Tier 1 ratio, the Groups’ Leverage ratio and the Group’s Capital Loss under Stress. Contributions in each of the three dimensions are weighted to reflect their relative importance and level of constraint for the Group. Contributions to the Common Equity Tier 1 ratio and the Leverage ratio are measured through Risk Weighted Assets (RWA) and Leverage Ratio Exposure. The Group’s Capital Loss under Stress is a measure of the Group’s overall economic risk exposure under a defined stress scenario. Goodwill and other intangible assets are directly attributed to the Group’s segments in order to allow the determination of allocated tangible shareholders’ equity and the respective returns. Shareholders’ equity and tangible shareholders’ equity is allocated on a monthly basis and averaged across quarters and for the full year
US Tax Exempt Securities
Net interest income as a component of net revenues, profit (loss) before tax and related ratios are presented on a fully taxable-equivalent basis for US tax-exempt securities for the Investment Bank. This enables management to measure performance of taxable and tax-exempt securities on a comparable basis. This presentation resulted in an increase in Investment Bank net interest income of
€
40
million
for full year 2021,
€
45
million
for full year 2020 and
€
35
million
for full year 2019. This increase is offset in Group consolidated figures through a reversal in CO. The tax rate used in determining the fully taxable-equivalent of net interest income in respect of the majority of the US tax-exempt securities is
21
%
for 2021, 2020 and 2019.
Infrastructure Full-time Employees realignment
In the third quarter of 2021, approximately
9,000
FTEs moved from CO to the operating business segments driven by the bank’s decision that the Chief Operating Office (COO) will no longer be a separate Management Board function. Accordingly business-related parts of COO that support the Investment Bank and the Corporate Bank, which were previously run in Infrastructure, moved to those divisions. Comparative segmental financial information has been restated accordingly. This change did not result in a material financial impact at a segment level, as costs are allocated from CO to the operating business segments that are using the service of the respective infrastructure functions and with this move the costs are directly incurred by the divisions rather than being recharged from CO.
Segmental results of operations
The following tables present the results of the Group’s business segments, including the reconciliation to the consolidated results of operations under IFRS.
|
206
|
|
|
Deutsche Bank
|
Additional Notes
|
|
|
Annual Report 2021
|
|
|
|
|
|
|
|
|
2021
|
||||||||||||
|
in € m.
(unless stated otherwise)
|
|
Corporate
Bank
|
|
Investment
Bank
|
|
Private
Bank
|
|
Asset Management
|
|
Capital
Release Unit
|
|
Corporate
Other
|
|
Total
Consolidated
|
|
Net revenues
1
|
|
|
|
|
|
|
|
|
|
|
|
(
|
|
|
|
Provision for credit losses
|
|
(
|
|
|
|
|
|
|
|
(
|
|
|
|
|
|
Noninterest expenses
|
|
|
|
|
|
|
|
|
|
|
|
|
|
|
|
Compensation and benefits
|
|
|
|
|
|
|
|
|
|
|
|
|
|
|
|
General and administrative expenses
|
|
|
|
|
|
|
|
|
|
|
|
(
|
|
|
|
Impairment of goodwill and other intangible assets
|
|
|
|
|
|
|
|
|
|
|
|
|
|
|
|
Restructuring activities
|
|
|
|
|
|
|
|
|
|
(
|
|
(
|
|
|
|
Total noninterest expenses
|
|
|
|
|
|
|
|
|
|
|
|
|
|
|
|
Noncontrolling interests
|
|
|
|
(
|
|
|
|
|
|
|
|
(
|
|
|
|
Profit (loss) before tax
|
|
|
|
|
|
|
|
|
|
(
|
|
(
|
|
|
|
Cost/income ratio
|
|
|
|
|
|
|
|
|
|
N/M
|
|
N/M
|
|
|
|
Assets
2
|
|
|
|
|
|
|
|
|
|
|
|
|
|
|
|
Additions to non-current assets
|
|
|
|
|
|
|
|
|
|
|
|
|
|
|
|
Risk-weighted assets
|
|
|
|
|
|
|
|
|
|
|
|
|
|
|
|
Leverage exposure (fully loaded)
3
|
|
|
|
|
|
|
|
|
|
|
|
|
|
|
|
Average allocated shareholders' equity
|
|
|
|
|
|
|
|
|
|
|
|
|
|
|
|
Post-tax return on average shareholders’ equity
4
|
|
|
|
|
|
|
|
|
|
(
|
|
N/M
|
|
|
|
Post-tax return on average tangible shareholders’ equity
4
|
|
|
|
|
|
|
|
|
|
(
|
|
N/M
|
|
|
|
|
|
|
|
|
|
|
|
|
|
|
|
|
|
|
|
1
includes:
|
|
|
|
|
|
|
|
|
|
|
|
|
|
|
|
Net interest income
|
|
|
|
|
|
|
|
(
|
|
|
|
|
|
|
|
Net income (loss) from equity method investments
|
|
|
|
(
|
|
|
|
|
|
|
|
|
|
|
|
2
includes:
|
|
|
|
|
|
|
|
|
|
|
|
|
|
|
|
Equity method investments
|
|
|
|
|
|
|
|
|
|
|
|
|
|
|
|
|
|
|
|
|
|
|
|
|
|
|
|
|
|
|
N/M – Not meaningful
3
The Group leverage exposure is presented excluding certain Euro-based exposures facing Eurosystem central banks based on the ECB-decision (EU) 2020/1306 and after having obtained permission from the ECB. The segmental leverage exposures are presented without that deduction.
4
The post-tax return on average tangible shareholders’ equity and average shareholders’ equity at the Group level reflects the reported effective tax rate for the Group, which was
26
%
for the year ended December 31, 2021. For the post-tax return on average tangible shareholders’ equity and average shareholders’ equity of the segments, the Group effective tax rate was adjusted to exclude the impact of permanent differences not attributed to the segments, so that the segment tax rates were
28
%
for the year ended December 31, 2021. For further information, please refer to “Supplementary Information (Unaudited): Non-GAAP Financial Measures” of this annual report.
|
|
|
2020
|
||||||||||||
|
in € m.
(unless stated otherwise)
|
|
Corporate
Bank
|
|
Investment
Bank
|
|
Private
Bank
|
|
Asset Management
|
|
Capital
Release Unit
|
|
Corporate
Other
|
|
Total
Consolidated
|
|
Net revenues
1
|
|
|
|
|
|
|
|
|
|
(
|
|
(
|
|
|
|
Provision for credit losses
|
|
|
|
|
|
|
|
|
|
|
|
(
|
|
|
|
Noninterest expenses
|
|
|
|
|
|
|
|
|
|
|
|
|
|
|
|
Compensation and benefits
|
|
|
|
|
|
|
|
|
|
|
|
|
|
|
|
General and administrative expenses
|
|
|
|
|
|
|
|
|
|
|
|
(
|
|
|
|
Impairment of goodwill and other intangible assets
|
|
|
|
|
|
|
|
|
|
|
|
|
|
|
|
Restructuring activities
|
|
|
|
|
|
|
|
|
|
|
|
|
|
|
|
Total noninterest expenses
|
|
|
|
|
|
|
|
|
|
|
|
|
|
|
|
Noncontrolling interests
|
|
|
|
|
|
|
|
|
|
(
|
|
(
|
|
|
|
Profit (loss) before tax
|
|
|
|
|
|
(
|
|
|
|
(
|
|
(
|
|
|
|
Cost/income ratio
|
|
|
|
|
|
|
|
|
|
N/M
|
|
N/M
|
|
|
|
Assets
2
|
|
|
|
|
|
|
|
|
|
|
|
|
|
|
|
Additions to non-current assets
|
|
|
|
|
|
|
|
|
|
|
|
|
|
|
|
Risk-weighted assets
|
|
|
|
|
|
|
|
|
|
|
|
|
|
|
|
Leverage exposure (fully loaded)
3
|
|
|
|
|
|
|
|
|
|
|
|
|
|
|
|
Average allocated shareholders' equity
|
|
|
|
|
|
|
|
|
|
|
|
(
|
|
|
|
Post-tax return on average shareholders’ equity
4
|
|
|
|
|
|
(
|
|
|
|
(
|
|
N/M
|
|
|
|
Post-tax return on average tangible shareholders’ equity
4
|
|
|
|
|
|
(
|
|
|
|
(
|
|
N/M
|
|
|
|
|
|
|
|
|
|
|
|
|
|
|
|
|
|
|
|
1
includes:
|
|
|
|
|
|
|
|
|
|
|
|
|
|
|
|
Net interest income
|
|
|
|
|
|
|
|
|
|
|
|
|
|
|
|
Net income (loss) from equity method investments
|
|
|
|
|
|
|
|
|
|
|
|
|
|
|
|
2
includes:
|
|
|
|
|
|
|
|
|
|
|
|
|
|
|
|
Equity method investments
|
|
|
|
|
|
|
|
|
|
|
|
|
|
|
|
|
|
|
|
|
|
|
|
|
|
|
|
|
|
|
N/M – Not meaningful
Prior year segmental information presented in the current structure.
3
The Group leverage exposure is presented excluding certain Euro-based exposures facing Eurosystem central banks based on the ECB-decision (EU) 2020/1306 and after having obtained permission from the ECB. The segmental leverage exposures are presented without that deduction.
4
The post-tax return on average tangible shareholders’ equity and average shareholders’ equity at the Group level reflects the reported effective tax rate for the Group, which was
39
%
for the year ended December 31, 2020. For the post-tax return on average tangible shareholders’ equity and average shareholders’ equity of the segments, the Group effective tax rate was adjusted to exclude the impact of permanent differences not attributed to the segments, so that the segment tax rates were
28
%
for the year ended December 31, 2020. For further information, please refer to “Supplementary Information (Unaudited): Non-GAAP Financial Measures” of this annual report.
|
|
|
2019
|
||||||||||||
|
in € m.
(unless stated otherwise)
|
|
Corporate
Bank
|
|
Investment
Bank
|
|
Private
Bank
|
|
Asset Management
|
|
Capital
Release Unit
|
|
Corporate
Other
|
|
Total
Consolidated
|
|
Net revenues
1
|
|
|
|
|
|
|
|
|
|
|
|
|
|
|
|
Provision for credit losses
|
|
|
|
|
|
|
|
|
|
(
|
|
(
|
|
|
|
Noninterest expenses
|
|
|
|
|
|
|
|
|
|
|
|
|
|
|
|
Compensation and benefits
|
|
|
|
|
|
|
|
|
|
|
|
|
|
|
|
General and administrative expenses
|
|
|
|
|
|
|
|
|
|
|
|
(
|
|
|
|
Impairment of goodwill and other intangible assets
|
|
|
|
|
|
|
|
|
|
|
|
|
|
|
|
Restructuring activities
|
|
|
|
|
|
|
|
|
|
|
|
|
|
|
|
Total noninterest expenses
|
|
|
|
|
|
|
|
|
|
|
|
|
|
|
|
Noncontrolling interests
|
|
|
|
|
|
(
|
|
|
|
|
|
(
|
|
|
|
Profit (loss) before tax
|
|
|
|
|
|
(
|
|
|
|
(
|
|
(
|
|
(
|
|
Cost/income ratio
|
|
|
|
|
|
|
|
|
|
N/M
|
|
N/M
|
|
|
|
Assets
2
|
|
|
|
|
|
|
|
|
|
|
|
|
|
|
|
Additions to non-current assets
|
|
|
|
|
|
|
|
|
|
|
|
|
|
|
|
Risk-weighted assets
|
|
|
|
|
|
|
|
|
|
|
|
|
|
|
|
Leverage exposure (fully loaded)
|
|
|
|
|
|
|
|
|
|
|
|
|
|
|
|
Average allocated shareholders' equity
|
|
|
|
|
|
|
|
|
|
|
|
|
|
|
|
Post-tax return on average shareholders’ equity
3
|
|
(
|
|
|
|
(
|
|
|
|
(
|
|
N/M
|
|
(
|
|
Post-tax return on average tangible shareholders’ equity
3
|
|
(
|
|
|
|
(
|
|
|
|
(
|
|
N/M
|
|
(
|
|
|
|
|
|
|
|
|
|
|
|
|
|
|
|
|
|
1
includes:
|
|
|
|
|
|
|
|
|
|
|
|
|
|
|
|
Net interest income
|
|
|
|
|
|
|
|
(
|
|
|
|
|
|
|
|
Net income (loss) from equity method investments
|
|
|
|
|
|
|
|
|
|
|
|
|
|
|
|
2
includes:
|
|
|
|
|
|
|
|
|
|
|
|
|
|
|
|
Equity method investments
|
|
|
|
|
|
|
|
|
|
|
|
|
|
|
|
|
|
|
|
|
|
|
|
|
|
|
|
|
|
|
N/M – Not meaningful
Prior year segmental information presented in the current structure.
3
The post-tax return on average tangible shareholders’ equity and average shareholders’ equity at the Group level reflects the reported effective tax rate for the Group, which was
(
100
) %
for the year ended December 31, 2019. For the post-tax return on average tangible shareholders’ equity and average shareholders’ equity of the segments, the Group effective tax rate was adjusted to exclude the impact of permanent differences not attributed to the segments, so that the segment tax rates were
28
%
for the year ended December 31, 2019. For further information, please refer to “Supplementary Information (Unaudited): Non-GAAP Financial Measures” of this annual report.
Corporate Bank
|
|
|
|
|
|
|
|
|
2021 increase (decrease)
from 2020
|
|
2020 increase (decrease)
from 2019
|
||||
|
in € m.
(unless stated otherwise)
|
|
2021
|
|
2020
|
|
2019
|
|
in € m.
|
|
in %
|
|
in € m.
|
|
in %
|
|
Net revenues
|
|
|
|
|
|
|
|
|
|
|
|
|
|
|
|
Corporate Treasury Services
|
|
|
|
|
|
|
|
5
|
|
0
|
|
48
|
|
2
|
|
Institutional Client Services
|
|
|
|
|
|
|
|
20
|
|
2
|
|
(131)
|
|
(9)
|
|
Business Banking
|
|
|
|
|
|
|
|
(21)
|
|
(3)
|
|
(18)
|
|
(2)
|
|
Total net revenues
|
|
|
|
|
|
|
|
4
|
|
0
|
|
(101)
|
|
(2)
|
|
Of which:
|
|
|
|
|
|
|
|
|
|
|
|
|
|
|
|
Net interest income
|
|
|
|
|
|
|
|
(278)
|
|
(10)
|
|
248
|
|
9
|
|
Commissions and fee income
|
|
|
|
|
|
|
|
125
|
|
6
|
|
(114)
|
|
(5)
|
|
Remaining income
|
|
|
|
|
|
|
|
158
|
|
85
|
|
(235)
|
|
(56)
|
|
Provision for credit losses
|
|
(
|
|
|
|
|
|
(367)
|
|
N/M
|
|
80
|
|
28
|
|
Noninterest expenses
|
|
|
|
|
|
|
|
|
|
|
|
|
|
|
|
Compensation and benefits
|
|
|
|
|
|
|
|
46
|
|
3
|
|
(17)
|
|
(1)
|
|
General and administrative expenses
|
|
|
|
|
|
|
|
(154)
|
|
(5)
|
|
(16)
|
|
(1)
|
|
Impairment of goodwill and other intangible assets
|
|
|
|
|
|
|
|
5
|
|
N/M
|
|
(492)
|
|
N/M
|
|
Restructuring activities
|
|
|
|
|
|
|
|
13
|
|
47
|
|
(108)
|
|
(79)
|
|
Total noninterest expenses
|
|
|
|
|
|
|
|
(90)
|
|
(2)
|
|
(634)
|
|
(13)
|
|
Noncontrolling interests
|
|
|
|
|
|
|
|
0
|
|
N/M
|
|
0
|
|
N/M
|
|
Profit (loss) before tax
|
|
|
|
|
|
|
|
461
|
|
86
|
|
453
|
|
N/M
|
|
Total assets (in € bn)
1
|
|
|
|
|
|
|
|
8
|
|
3
|
|
9
|
|
4
|
|
Loans (gross of allowance for loan losses, in € bn)
|
|
|
|
|
|
|
|
8
|
|
7
|
|
(5)
|
|
(4)
|
|
Employees (full-time equivalent)
|
|
|
|
|
|
|
|
(55)
|
|
(0)
|
|
(151)
|
|
(1)
|
|
|
|
|
|
|
|
|
|
|
|
|
|
|
|
|
N/M – Not meaningful
Prior year segmental information presented in the current structure.
1
Segment assets represent consolidated view, i.e., the amounts do not include intersegment balances.
Investment Bank
|
|
|
|
|
|
|
|
|
2021 increase (decrease)
from 2020
|
|
2020 increase (decrease)
from 2019
|
||||
|
in € m.
(unless stated otherwise)
|
|
2021
|
|
2020
|
|
2019
|
|
in € m.
|
|
in %
|
|
in € m.
|
|
in %
|
|
Net revenues
|
|
|
|
|
|
|
|
|
|
|
|
|
|
|
|
Fixed Income, Currency (FIC) Sales Trading
|
|
|
|
|
|
|
|
(11)
|
|
(0)
|
|
1,550
|
|
28
|
|
Debt Origination
|
|
|
|
|
|
|
|
73
|
|
5
|
|
383
|
|
34
|
|
Equity Origination
|
|
|
|
|
|
|
|
174
|
|
47
|
|
221
|
|
149
|
|
Advisory
|
|
|
|
|
|
|
|
247
|
|
101
|
|
(126)
|
|
(34)
|
|
Origination Advisory
|
|
|
|
|
|
|
|
494
|
|
23
|
|
479
|
|
29
|
|
Other
|
|
(
|
|
|
|
(
|
|
(139)
|
|
N/M
|
|
235
|
|
N/M
|
|
Total net revenues
|
|
|
|
|
|
|
|
345
|
|
4
|
|
2,263
|
|
32
|
|
Provision for credit losses
|
|
|
|
|
|
|
|
(587)
|
|
(85)
|
|
581
|
|
N/M
|
|
Noninterest expenses
|
|
|
|
|
|
|
|
|
|
|
|
|
|
|
|
Compensation and benefits
|
|
|
|
|
|
|
|
118
|
|
6
|
|
(75)
|
|
(3)
|
|
General and administrative expenses
|
|
|
|
|
|
|
|
260
|
|
8
|
|
(750)
|
|
(18)
|
|
Impairment of goodwill and other intangible assets
|
|
|
|
|
|
|
|
0
|
|
N/M
|
|
0
|
|
N/M
|
|
Restructuring activities
|
|
|
|
|
|
|
|
33
|
|
N/M
|
|
(155)
|
|
(92)
|
|
Total noninterest expenses
|
|
|
|
|
|
|
|
411
|
|
8
|
|
(979)
|
|
(15)
|
|
Noncontrolling interests
|
|
(
|
|
|
|
|
|
(29)
|
|
N/M
|
|
(8)
|
|
(41)
|
|
Profit (loss) before tax
|
|
|
|
|
|
|
|
549
|
|
17
|
|
2,670
|
|
N/M
|
|
Total assets (in € bn)
1
|
|
|
|
|
|
|
|
42
|
|
7
|
|
72
|
|
14
|
|
Loans (gross of allowance for loan losses, in € bn)
|
|
|
|
|
|
|
|
24
|
|
34
|
|
(6)
|
|
(8)
|
|
Employees (full-time equivalent)
|
|
|
|
|
|
|
|
(382)
|
|
(5)
|
|
90
|
|
1
|
|
|
|
|
|
|
|
|
|
|
|
|
|
|
|
|
N/M – Not meaningful
Prior year segmental information presented in the current structure
1
Segment assets represent consolidated view, i.e., the amounts do not include intersegment balances.
|
207
|
|
|
Deutsche Bank
|
Additional Notes
|
|
|
Annual Report 2021
|
|
|
|
|
|
Private Bank
|
|
|
|
|
|
|
|
|
2021 increase (decrease)
from 2020
|
|
2020 increase (decrease)
from 2019
|
||||
|
in € m.
(unless stated otherwise)
|
|
2021
|
|
2020
|
|
2019
|
|
in € m.
|
|
in %
|
|
in € m.
|
|
in %
|
|
Net revenues:
|
|
|
|
|
|
|
|
|
|
|
|
|
|
|
|
Private Bank Germany
|
|
|
|
|
|
|
|
19
|
|
0
|
|
(120)
|
|
(2)
|
|
International Private Bank
|
|
|
|
|
|
|
|
90
|
|
3
|
|
7
|
|
0
|
|
IPB Personal Banking
1
|
|
|
|
|
|
|
|
38
|
|
4
|
|
(34)
|
|
(4)
|
|
IPB Private Banking
2
and Wealth Management
|
|
|
|
|
|
|
|
52
|
|
2
|
|
41
|
|
2
|
|
Total net revenues
|
|
|
|
|
|
|
|
109
|
|
1
|
|
(113)
|
|
(1)
|
|
Of which:
|
|
|
|
|
|
|
|
|
|
|
|
|
|
|
|
Net interest income
|
|
|
|
|
|
|
|
102
|
|
2
|
|
(339)
|
|
(7)
|
|
Commissions and fee income
|
|
|
|
|
|
|
|
155
|
|
5
|
|
187
|
|
7
|
|
Remaining income
|
|
|
|
|
|
|
|
(148)
|
|
(26)
|
|
40
|
|
7
|
|
Provision for credit losses
|
|
|
|
|
|
|
|
(265)
|
|
(37)
|
|
367
|
|
107
|
|
Noninterest expenses:
|
|
|
|
|
|
|
|
|
|
|
|
|
|
|
|
Compensation and benefits
|
|
|
|
|
|
|
|
(53)
|
|
(2)
|
|
(108)
|
|
(4)
|
|
General and administrative expenses
|
|
|
|
|
|
|
|
202
|
|
5
|
|
(280)
|
|
(6)
|
|
Impairment of goodwill and other intangible assets
|
|
|
|
|
|
|
|
0
|
|
N/M
|
|
(545)
|
|
N/M
|
|
Restructuring activities
|
|
|
|
|
|
|
|
(240)
|
|
(58)
|
|
287
|
|
N/M
|
|
Total noninterest expenses
|
|
|
|
|
|
|
|
(91)
|
|
(1)
|
|
(645)
|
|
(8)
|
|
Noncontrolling interests
|
|
|
|
|
|
(
|
|
(0)
|
|
(87)
|
|
1
|
|
N/M
|
|
Profit (loss) before tax
|
|
|
|
(
|
|
(
|
|
465
|
|
N/M
|
|
164
|
|
(62)
|
|
Total assets (in € bn)
3
|
|
|
|
|
|
|
|
14
|
|
5
|
|
26
|
|
10
|
|
Loans (gross of allowance for loan losses, in € bn)
|
|
|
|
|
|
|
|
17
|
|
7
|
|
10
|
|
5
|
|
Assets under Management (in € bn)
4
|
|
|
|
|
|
|
|
59
|
|
12
|
|
11
|
|
2
|
|
Net flows (in € bn)
|
|
|
|
|
|
|
|
14
|
|
88
|
|
12
|
|
N/M
|
|
Employees (full-time equivalent)
|
|
|
|
|
|
|
|
(1,665)
|
|
(6)
|
|
(1,657)
|
|
(5)
|
|
|
|
|
|
|
|
|
|
|
|
|
|
|
|
|
N/M – Not meaningful
Prior year segmental information presented in the current structure.
1
Including small businesses in Italy, Spain and India.
.
2
Including small mid caps in Italy, Spain and India
.
3
Segment assets represent consolidated view, i.e., the amounts do not include intersegment balances
.
4
We define assets under management as (a) assets we hold on behalf of customers for investment purposes and/or (b) client assets that are managed by us. We manage assets under management on a discretionary or advisory basis, or these assets are deposited with us. Deposits are considered assets under management if they serve investment purposes. In our Private Bank Germany and Private Commercial Business International, this includes all time deposits and savings deposits. In Wealth Management, we assume that all customer deposits are held with us primarily for investment purposes.
Asset Management
|
|
|
|
|
|
|
|
|
2021 increase (decrease)
from 2020
|
|
2020 increase (decrease)
from 2019
|
||||
|
in € m.
(unless stated otherwise)
|
|
2021
|
|
2020
|
|
2019
|
|
in € m.
|
|
in %
|
|
in € m.
|
|
in %
|
|
Net revenues
|
|
|
|
|
|
|
|
|
|
|
|
|
|
|
|
Management Fees
|
|
|
|
|
|
|
|
233
|
|
11
|
|
(5)
|
|
(0)
|
|
Performance and transaction fees
|
|
|
|
|
|
|
|
122
|
|
135
|
|
(111)
|
|
(55)
|
|
Other
|
|
|
|
|
|
(
|
|
123
|
|
N/M
|
|
13
|
|
N/M
|
|
Total net revenues
|
|
|
|
|
|
|
|
478
|
|
21
|
|
(103)
|
|
(4)
|
|
Provision for credit losses
|
|
|
|
|
|
|
|
3
|
|
148
|
|
1
|
|
59
|
|
Noninterest expenses
|
|
|
|
|
|
|
|
|
|
|
|
|
|
|
|
Compensation and benefits
|
|
|
|
|
|
|
|
82
|
|
11
|
|
(92)
|
|
(11)
|
|
General and administrative expenses
|
|
|
|
|
|
|
|
77
|
|
10
|
|
(88)
|
|
(10)
|
|
Impairment of goodwill and other intangible assets
|
|
|
|
|
|
|
|
(0)
|
|
N/M
|
|
0
|
|
N/M
|
|
Restructuring activities
|
|
|
|
|
|
|
|
(20)
|
|
(92)
|
|
(6)
|
|
(22)
|
|
Total noninterest expenses
|
|
|
|
|
|
|
|
138
|
|
9
|
|
(185)
|
|
(11)
|
|
Noncontrolling interests
|
|
|
|
|
|
|
|
66
|
|
42
|
|
5
|
|
4
|
|
Profit (loss) before tax
|
|
|
|
|
|
|
|
272
|
|
50
|
|
76
|
|
16
|
|
Total assets (in € bn)
1
|
|
|
|
|
|
|
|
1
|
|
10
|
|
(0)
|
|
(5)
|
|
Assets under Management (in € bn)
|
|
|
|
|
|
|
|
135
|
|
17
|
|
25
|
|
3
|
|
Net flows (in € bn)
|
|
|
|
|
|
|
|
17
|
|
N/M
|
|
5
|
|
N/M
|
|
Employees (full-time equivalent)
|
|
|
|
|
|
|
|
146
|
|
4
|
|
1
|
|
0
|
|
|
|
|
|
|
|
|
|
|
|
|
|
|
|
|
N/M – Not meaningful
Prior year segmental information presented in the current structure.
1
Segment assets represent consolidated view, i.e., the amounts do not include intersegment balances.
|
208
|
|
|
Deutsche Bank
|
Additional Notes
|
|
|
Annual Report 2021
|
|
|
|
|
|
Capital Release Unit
|
|
|
|
|
|
|
|
|
2021 increase (decrease)
from 2020
|
|
2020 increase (decrease)
from 2019
|
||||
|
in € m.
(unless stated otherwise)
|
|
2021
|
|
2020
|
|
2019
|
|
in € m.
|
|
in %
|
|
in € m.
|
|
in %
|
|
Net revenues
|
|
|
|
(
|
|
|
|
251
|
|
N/M
|
|
(442)
|
|
N/M
|
|
Provision for credit losses
|
|
(
|
|
|
|
(
|
|
(70)
|
|
N/M
|
|
43
|
|
N/M
|
|
Noninterest expenses
|
|
|
|
|
|
|
|
|
|
|
|
|
|
|
|
Compensation and benefits
|
|
|
|
|
|
|
|
(40)
|
|
(24)
|
|
(191)
|
|
(53)
|
|
General and administrative expenses
|
|
|
|
|
|
|
|
(468)
|
|
(26)
|
|
(1,124)
|
|
(39)
|
|
Impairment of goodwill and other intangible assets
|
|
|
|
|
|
|
|
0
|
|
N/M
|
|
0
|
|
N/M
|
|
Restructuring activities
|
|
(
|
|
|
|
|
|
(7)
|
|
N/M
|
|
(139)
|
|
(97)
|
|
Total noninterest expenses
|
|
|
|
|
|
|
|
(515)
|
|
(26)
|
|
(1,453)
|
|
(43)
|
|
Noncontrolling interests
|
|
|
|
(
|
|
|
|
0
|
|
N/M
|
|
(1)
|
|
N/M
|
|
Profit (loss) before tax
|
|
(
|
|
(
|
|
(
|
|
836
|
|
(38)
|
|
970
|
|
(31)
|
|
Total assets (in € bn)
1
|
|
|
|
|
|
|
|
(66)
|
|
(33)
|
|
(62)
|
|
(24)
|
|
Employees (full-time equivalent)
|
|
|
|
|
|
|
|
(211)
|
|
(44)
|
|
(136)
|
|
(22)
|
|
|
|
|
|
|
|
|
|
|
|
|
|
|
|
|
N/M – Not meaningful
Prior year segmental information presented in the current structure.
1
Segment assets represent consolidated view, i.e., the amounts do not include intersegment balances.
Corporate Other (CO)
|
|
|
|
|
|
|
|
|
2021 increase (decrease)
from 2020
|
|
2020 increase (decrease)
from 2019
|
||||
|
in € m.
(unless stated otherwise)
|
|
2021
|
|
2020
|
|
2019
|
|
in € m.
|
|
in %
|
|
in € m.
|
|
in %
|
|
Net revenues
|
|
(
|
|
(
|
|
|
|
340
|
|
(62)
|
|
(659)
|
|
N/M
|
|
Provision for credit losses
|
|
|
|
(
|
|
(
|
|
9
|
|
N/M
|
|
(3)
|
|
N/M
|
|
Noninterest expenses
|
|
|
|
|
|
|
|
|
|
|
|
|
|
|
|
Compensation and benefits
|
|
|
|
|
|
|
|
(206)
|
|
(6)
|
|
(188)
|
|
(6)
|
|
General and administrative expenses
|
|
(
|
|
(
|
|
(
|
|
644
|
|
(24)
|
|
263
|
|
(9)
|
|
Impairment of goodwill and other intangible assets
|
|
|
|
|
|
|
|
0
|
|
N/M
|
|
0
|
|
N/M
|
|
Restructuring activities
|
|
(
|
|
|
|
|
|
(3)
|
|
N/M
|
|
(38)
|
|
(93)
|
|
Total noninterest expenses
|
|
|
|
|
|
|
|
436
|
|
77
|
|
37
|
|
7
|
|
Noncontrolling interests
|
|
(
|
|
(
|
|
(
|
|
(37)
|
|
22
|
|
3
|
|
(2)
|
|
Profit (loss) before tax
|
|
(
|
|
(
|
|
(
|
|
(68)
|
|
7
|
|
(696)
|
|
N/M
|
|
Employees (full-time equivalent)
|
|
|
|
|
|
|
|
477
|
|
2
|
|
(1,085)
|
|
(4)
|
|
|
|
|
|
|
|
|
|
|
|
|
|
|
|
|
N/M – Not meaningful
Prior year segmental information presented in the current structure.
|
209
|
|
|
Deutsche Bank
|
Additional Notes
|
|
|
Annual Report 2021
|
|
|
|
|
|
Entity-wide disclosures
The Group’s Entity-Wide Disclosures include net revenues from internal and external counterparties. Excluding revenues from internal counterparties would require disproportionate IT investment and is not in line with the Bank's management approach. For details of the net revenue components please see “Management Report: Operating and Financial Review: Results of Operations: Corporate Divisions”.
The following table presents total net revenues (before provisions for credit losses) by geographic area for the years ended December 31, 2021, 2020 and 2019, respectively. The information presented for CB, IB, PB, AM and CRU has been classified based primarily on the location of the Group’s office in which the revenues are recorded. The information for CO is presented on a global level only, as management responsibility for CO is held centrally.
|
in € m.
|
|
2021
|
|
2020
|
|
2019
|
|
Germany:
|
|
|
|
|
|
|
|
Corporate Bank
|
|
|
|
|
|
|
|
Investment Bank
|
|
|
|
|
|
|
|
Private Bank
|
|
|
|
|
|
|
|
Asset Management
|
|
|
|
|
|
|
|
Capital Release Unit
|
|
|
|
|
|
|
|
Total Germany
|
|
|
|
|
|
|
|
UK:
|
|
|
|
|
|
|
|
Corporate Bank
|
|
|
|
|
|
|
|
Investment Bank
|
|
|
|
|
|
|
|
Private Bank
|
|
(
|
|
|
|
|
|
Asset Management
|
|
|
|
|
|
|
|
Capital Release Unit
|
|
(
|
|
(
|
|
(
|
|
Total UK
|
|
|
|
|
|
|
|
Rest of Europe, Middle East and Africa:
|
|
|
|
|
|
|
|
Corporate Bank
|
|
|
|
|
|
|
|
Investment Bank
|
|
|
|
|
|
|
|
Private Bank
|
|
|
|
|
|
|
|
Asset Management
|
|
|
|
|
|
|
|
Capital Release Unit
|
|
|
|
|
|
|
|
Total Rest of Europe, Middle East and Africa
|
|
|
|
|
|
|
|
Americas (primarily United States):
|
|
|
|
|
|
|
|
Corporate Bank
|
|
|
|
|
|
|
|
Investment Bank
|
|
|
|
|
|
|
|
Private Bank
|
|
|
|
|
|
|
|
Asset Management
|
|
|
|
|
|
|
|
Capital Release Unit
|
|
|
|
|
|
|
|
Total Americas
|
|
|
|
|
|
|
|
Asia/Pacific:
|
|
|
|
|
|
|
|
Corporate Bank
|
|
|
|
|
|
|
|
Investment Bank
|
|
|
|
|
|
|
|
Private Bank
|
|
|
|
|
|
|
|
Asset Management
|
|
|
|
|
|
|
|
Capital Release Unit
|
|
|
|
|
|
|
|
Total Asia/Pacific
|
|
|
|
|
|
|
|
Corporate and Other
|
|
(
|
|
(
|
|
|
|
Consolidated net revenues
1
|
|
|
|
|
|
|
|
|
|
|
|
|
|
|
1
Consolidated net revenues comprise interest and similar income, interest expenses and total noninterest income (including net commission and fee income). Revenues are attributed to countries based on the location in which the Group’s booking office is located. The location of a transaction on the Group’s books is sometimes different from the location of the headquarters or other offices of a customer and different from the location of the Group’s personnel who entered into or facilitated the transaction. Where the Group records a transaction involving its staff and customers and other third parties in different locations frequently depends on other considerations, such as the nature of the transaction, regulatory considerations and transaction processing considerations.
|
210
|
|
|
Deutsche Bank
|
Additional Notes
|
|
|
Annual Report 2021
|
|
|
|
|
|
Notes to the consolidated income statement
05 –
Net interest income and net gains (losses) on financial assets/liabilities at fair value through profit or loss
Net interest income
|
in € m.
|
|
2021
|
|
2020
|
|
2019
|
|
Interest and similar income:
|
|
|
|
|
|
|
|
Interest income on cash and central bank balances
|
|
|
|
|
|
|
|
Interest income on interbank balances (w/o central banks)
|
|
|
|
|
|
|
|
Central bank funds sold and securities purchased under resale agreements
|
|
|
|
|
|
|
|
Loans
|
|
|
|
|
|
|
|
Other
1
|
|
|
|
|
|
|
|
Total Interest and similar income from assets measured at amortized cost
|
|
|
|
|
|
|
|
Interest income on financial assets at fair value through other comprehensive income
|
|
|
|
|
|
|
|
Total interest and similar income calculated using the effective interest method
|
|
|
|
|
|
|
|
Financial assets at fair value through profit or loss
1
|
|
|
|
|
|
|
|
Total interest and similar income
|
|
|
|
|
|
|
|
Thereof: negative interest expense on financial liabilities
|
|
|
|
|
|
|
|
Interest expense:
|
|
|
|
|
|
|
|
Interest-bearing deposits
|
|
|
|
|
|
|
|
Central bank funds purchased and securities sold under repurchase agreements
|
|
|
|
|
|
|
|
Other short-term borrowings
|
|
|
|
|
|
|
|
Long-term debt
|
|
|
|
|
|
|
|
Trust preferred securities
|
|
|
|
|
|
|
|
Other
|
|
|
|
|
|
|
|
Total interest expense measured at amortized cost
|
|
|
|
|
|
|
|
Financial liabilities at fair value through profit or loss
|
|
|
|
|
|
|
|
Total interest expense
|
|
|
|
|
|
|
|
Thereof: negative interest income on financial assets
|
|
|
|
|
|
|
|
Net interest income
|
|
|
|
|
|
|
|
|
|
|
|
|
|
|
1
Prior years' comparatives aligned to presentation in the current year.
Other interest income for the year ended December 31, 2021, 2020 and 2019 included
€
0
million
,
€
43
million
, and
€
93
million
, respectively, which were related to government grants under the Targeted Longer-term Refinancing Operations II (TLTRO II)-program.
Impact of ECB Targeted Longer-term Refinancing Operations (TLTRO III)
The Governing Council of the ECB decided on a number of modifications to the terms and conditions of its Targeted Longer-term Refinancing Operations III (TLTRO III)-refinancing program in order to support further the provision of credit to households and firms in the face of the current economic disruption and heightened uncertainty caused by the COVID-19 pandemic.
The base interest rate under the TLTRO III-refinancing program is the average of the main refinancing operations rate with the exception of the period from June 24, 2020 to June 23, 2022, when a discount of
50
basis points applies (“base rate discount”). The applicable interest rate under the TLTRO III-refinancing program can further reduce by “new lending discounts” that apply if certain net lending thresholds are met. Accordingly, banks whose eligible net lending exceeds
0 %
between March 1, 2020 and March 31, 2021 pay a rate
0.5 %
lower than the average deposit facility rate for borrowings between June 24, 2020 and June 23, 2021. The interest rate outside of the period from June 24, 2020 to June 23, 2021 will be the average interest rate on the deposit facility (currently
(0.5) %
) with exception of the period from June 24, 2021 to June 23, 2022 when banks pay a rate
0.5 %
lower than the average deposit facility rate for borrowings provided their eligible net lending exceeds
0 %
between October 1, 2020 and December 31, 2021.
|
211
|
|
|
Deutsche Bank
|
Additional Notes
|
|
|
Annual Report 2021
|
|
|
|
|
|
As of December 31, 2021, the Group has borrowed
€
44.7
billion
(December 31, 2020:
€
37.5
billion
) under the TLTRO III-refinancing program. The Group accounts for the base rate discount and the new lending discounts as a government grant under IAS 20. The income from the government grant is included in other interest income. The Group recognizes the benefit from the TLTRO III refinancing program in the period in which the grant is intended to compensate the Group for the related borrowing costs if it has established reasonable assurance that it will meet the relevant lending thresholds. As of December 31, 2021 the Group met the requirements for recognition of the base rate discount and the new lending discounts for the periods from June 24, 2020 to June 23, 2021 and from June 24, 2021 to June 23, 2022. As a result, for the year ended
December 31, 2021 the Group applied an all-in rate of
(1) %
which resulted in interest income recognition of
€
494
million
, including the impact of a catch up recognition of the more favorable incentive rate in respect of participation in the second half of 2020. In contrast, for the year ended December 31, 2020 the Group did not establish reasonable assurance such that it applied the base rate discount only which resulted in interest income of
€
86
million
.
Net gains (losses) on financial assets/liabilities at fair value through profit or loss
|
in € m.
|
|
2021
|
|
2020
|
|
2019
|
|
Trading income (loss):
|
|
|
|
|
|
|
|
FIC Sales and Trading
|
|
|
|
|
|
|
|
Other trading income (loss)
|
|
(
|
|
(
|
|
(
|
|
Total trading income (loss)
|
|
|
|
|
|
|
|
Net gains (losses) on non-trading financial assets mandatory at fair value through profit or loss:
|
|
|
|
|
|
|
|
Breakdown by financial assets category:
|
|
|
|
|
|
|
|
Debt Securities
|
|
|
|
|
|
|
|
Equity Securities
|
|
|
|
|
|
|
|
Loans and loan commitments
|
|
|
|
(
|
|
|
|
Deposits
|
|
|
|
(
|
|
(
|
|
Others non-trading financial assets mandatory at fair value through profit and loss
|
|
|
|
|
|
|
|
Total net gains (losses) on non-trading financial assets mandatory at fair value through profit or loss:
|
|
|
|
|
|
|
|
Net gains (losses) on financial assets/liabilities designated at fair value through profit or loss:
|
|
|
|
|
|
|
|
Breakdown by financial asset/liability category:
|
|
|
|
|
|
|
|
Loans and loan commitments
|
|
|
|
|
|
(
|
|
Deposits
|
|
|
|
(
|
|
(
|
|
Long-term debt
|
|
|
|
(
|
|
(
|
|
Other financial assets/liabilities designated at fair value through profit or loss
|
|
|
|
|
|
|
|
Total net gains (losses) on financial assets/liabilities designated at fair value through profit or loss
|
|
|
|
(
|
|
(
|
|
Total net gains (losses) on financial assets/liabilities at fair value through profit or loss
|
|
|
|
|
|
|
|
|
|
|
|
|
|
|
Combined net interest income and net gains (losses) on financial assets/liabilities at fair value through profit or loss
|
in € m.
|
|
2021
|
|
2020
|
|
2019
|
|
Net interest income
|
|
|
|
|
|
|
|
Trading income (loss)
1
|
|
|
|
|
|
|
|
Net gains (losses) on non-trading financial assets mandatory at fair value through profit or loss
|
|
|
|
|
|
|
|
Net gains (losses) on financial assets/liabilities designated at fair value through profit or loss
|
|
|
|
(
|
|
(
|
|
Total net gains (losses) on financial assets/liabilities at fair value through profit or loss
|
|
|
|
|
|
|
|
Total net interest income and net gains (losses) on financial assets/liabilities at fair value
through profit or loss
2
|
|
|
|
|
|
|
|
Corporate Treasury Services
|
|
1,814
|
|
2,073
|
|
1,757
|
|
Institutional Client Services
|
|
326
|
|
311
|
|
405
|
|
Business Banking
|
|
526
|
|
555
|
|
556
|
|
Corporate Bank
|
|
|
|
|
|
|
|
FIC Sales Trading
|
|
|
|
|
|
|
|
Remaining Products
|
|
(
|
|
|
|
(
|
|
Investment Bank
|
|
|
|
|
|
|
|
Private Bank Germany
|
|
3,114
|
|
2,956
|
|
3,292
|
|
International Private Bank
|
|
1,733
|
|
1,693
|
|
1,699
|
|
Private Bank
|
|
|
|
|
|
|
|
Asset Management
|
|
|
|
(
|
|
|
|
Capital Release Unit
|
|
(
|
|
(
|
|
|
|
Corporate Other
|
|
(
|
|
(
|
|
|
|
Total net interest income and net gains (losses) on financial assets/liabilities at fair value
through profit or loss
|
|
|
|
|
|
|
|
|
|
|
|
|
|
|
1
Prior year segmental information presented in the current structure.
2
Trading income includes gains and losses from derivatives not qualifying for hedge accounting.
The Group’s trading and risk management businesses include significant activities in interest rate instruments and related derivatives. Under IFRS, interest and similar income earned from trading instruments and financial instruments designated at fair value through profit or loss (i.e., coupon and dividend income), and the costs of funding net trading positions, are part of net interest income. The Group’s trading activities can periodically shift income to either net interest income or to net gains (losses) of financial assets/liabilities at fair value through profit or loss depending on a variety of factors, including risk management strategies. The above table combines net interest income and net gains (losses) of financial assets/liabilities at fair value through profit or loss by business division.
|
212
|
|
|
Deutsche Bank
|
Additional Notes
|
|
|
Annual Report 2021
|
|
|
|
|
|
06 –
Commissions and fee income
|
in € m.
|
|
2021
|
|
2020
|
|
2019
|
|
Commission and fee income and expense:
|
|
|
|
|
|
|
|
Commission and fee income
|
|
|
|
|
|
|
|
Commission and fee expense
|
|
|
|
|
|
|
|
Net commissions and fee income
|
|
|
|
|
|
|
|
|
|
|
|
|
|
|
|
213
|
|
|
Deutsche Bank
|
Additional Notes
|
|
|
Annual Report 2021
|
|
|
|
|
|
Disaggregation of revenues by product type and business segment
|
|
|
Dec 31,2021
|
||||||||||||
|
in € m.
(unless stated otherwise)
|
|
Corporate
Bank
|
|
Investment
Bank
|
|
Private
Bank
|
|
Asset
Management
|
|
Capital
Release Unit
|
|
Corporate
Other
|
|
Total
Consolidated
|
|
Major type of services:
|
|
|
|
|
|
|
|
|
|
|
|
|
|
|
|
Commissions for administration
|
|
|
|
|
|
|
|
|
|
|
|
(
|
|
|
|
Commissions for assets under management
|
|
|
|
|
|
|
|
|
|
(
|
|
|
|
|
|
Commissions for other securities
|
|
|
|
(
|
|
|
|
|
|
|
|
|
|
|
|
Underwriting and advisory fees
|
|
|
|
|
|
|
|
|
|
(
|
|
(
|
|
|
|
Brokerage fees
|
|
|
|
|
|
|
|
|
|
|
|
(
|
|
|
|
Commissions for local payments
|
|
|
|
|
|
|
|
|
|
|
|
|
|
|
|
Commissions for foreign commercial business
|
|
|
|
|
|
|
|
|
|
(
|
|
(
|
|
|
|
Commissions for foreign currency/exchange business
|
|
|
|
|
|
|
|
|
|
|
|
(
|
|
|
|
Commissions for loan processing and guarantees
|
|
|
|
|
|
|
|
|
|
|
|
|
|
|
|
Intermediary fees
|
|
|
|
|
|
|
|
|
|
|
|
|
|
|
|
Fees for sundry other customer services
|
|
|
|
|
|
|
|
|
|
|
|
|
|
|
|
Total fee and commissions income
|
|
|
|
|
|
|
|
|
|
|
|
(
|
|
|
|
Gross expense
|
|
|
|
|
|
|
|
|
|
|
|
|
|
(
|
|
Net fees and commissions
|
|
|
|
|
|
|
|
|
|
|
|
|
|
|
|
|
|
|
|
|
|
|
|
|
|
|
|
|
|
|
|
|
|
Dec 31,2020
|
||||||||||||
|
in € m.
(unless stated otherwise)
|
|
Corporate
Bank
|
|
Investment
Bank
|
|
Private
Bank
|
|
Asset
Management
|
|
Capital
Release Unit
|
|
Corporate
Other
|
|
Total
Consolidated
|
|
Major type of services:
|
|
|
|
|
|
|
|
|
|
|
|
|
|
|
|
Commissions for administration
|
|
|
|
|
|
|
|
|
|
|
|
(
|
|
|
|
Commissions for assets under management
|
|
|
|
|
|
|
|
|
|
(
|
|
|
|
|
|
Commissions for other securities
|
|
|
|
|
|
|
|
|
|
|
|
|
|
|
|
Underwriting and advisory fees
|
|
|
|
|
|
|
|
|
|
|
|
(
|
|
|
|
Brokerage fees
|
|
|
|
|
|
|
|
|
|
|
|
(
|
|
|
|
Commissions for local payments
|
|
|
|
(
|
|
|
|
(
|
|
|
|
|
|
|
|
Commissions for foreign commercial business
|
|
|
|
|
|
|
|
|
|
|
|
(
|
|
|
|
Commissions for foreign currency/exchange business
|
|
|
|
|
|
|
|
|
|
|
|
(
|
|
|
|
Commissions for loan processing and guarantees
|
|
|
|
|
|
|
|
|
|
|
|
|
|
|
|
Intermediary fees
|
|
|
|
|
|
|
|
|
|
|
|
|
|
|
|
Fees for sundry other customer services
|
|
|
|
|
|
|
|
|
|
|
|
|
|
|
|
Total fee and commissions income
|
|
|
|
|
|
|
|
|
|
|
|
(
|
|
|
|
Gross expense
|
|
|
|
|
|
|
|
|
|
|
|
|
|
(
|
|
Net fees and commissions
|
|
|
|
|
|
|
|
|
|
|
|
|
|
|
|
|
|
|
|
|
|
|
|
|
|
|
|
|
|
|
Prior year segmental information presented in the current structure. Fee and commission income and gross expense have been restated by € 182 million for 2020. The reclassifications did not affect net fee and commission income.
|
|
|
Dec 31,2019
|
||||||||||||
|
in € m.
(unless stated otherwise)
|
|
Corporate
Bank
|
|
Investment
Bank
|
|
Private
Bank
|
|
Asset
Management
|
|
Capital
Release Unit
|
|
Corporate
Other
|
|
Total
Consolidated
|
|
Major type of services:
|
|
|
|
|
|
|
|
|
|
|
|
|
|
|
|
Commissions for administration
|
|
|
|
|
|
|
|
|
|
|
|
(
|
|
|
|
Commissions for assets under management
|
|
|
|
|
|
|
|
|
|
|
|
|
|
|
|
Commissions for other securities
|
|
|
|
(
|
|
|
|
|
|
|
|
|
|
|
|
Underwriting and advisory fees
|
|
|
|
|
|
|
|
|
|
|
|
(
|
|
|
|
Brokerage fees
|
|
|
|
|
|
|
|
|
|
|
|
|
|
|
|
Commissions for local payments
|
|
|
|
|
|
|
|
(
|
|
|
|
|
|
|
|
Commissions for foreign commercial business
|
|
|
|
|
|
|
|
|
|
|
|
(
|
|
|
|
Commissions for foreign currency/exchange business
|
|
|
|
|
|
|
|
|
|
|
|
|
|
|
|
Commissions for loan processing and guarantees
|
|
|
|
|
|
|
|
|
|
|
|
|
|
|
|
Intermediary fees
|
|
|
|
|
|
|
|
|
|
|
|
|
|
|
|
Fees for sundry other customer services
|
|
|
|
|
|
|
|
|
|
|
|
|
|
|
|
Total fee and commissions income
|
|
|
|
|
|
|
|
|
|
|
|
|
|
|
|
Gross expense
|
|
|
|
|
|
|
|
|
|
|
|
|
|
(
|
|
Net fees and commissions
|
|
|
|
|
|
|
|
|
|
|
|
|
|
|
|
|
|
|
|
|
|
|
|
|
|
|
|
|
|
|
Prior year segmental information presented in the current structure.
Revenue is recognized when performance obligations are satisfied. Performance obligation is satisfied by fund performance exceeding a hurdle rate (an agreed minimum annual return provided to investors). As of December 31, 2021, there were performance obligations to be satisfied of
€
244
million
with a time band of five years from 2023 to 2027 (as of December 31, 2020,
€
66
million
with a time band of seven years from 2022 to 2028) from alternative funds. The increase of the performance obligations to be satisfied was mainly driven by additional fund expected to generate future performance fees.
|
214
|
|
|
Deutsche Bank
|
Additional Notes
|
|
|
Annual Report 2021
|
|
|
|
|
|
As of December 31, 2021, and December 31, 2020, the Group’s balance of receivables from commission and fee income was
€
834
million
and
€
876
million
respectively. As of December 31, 2021, and December 31, 2020, the Group’s balance of contract liabilities associated to commission and fee income was
€
70
million
and
€
65
million
, respectively. Contract liabilities arise from the Group’s obligation to provide future services to a customer for which it has received consideration from the customer prior to completion of the services. The balances of receivables and contract liabilities do not vary significantly from period to period reflecting the fact that they predominately relate to recurring service contracts with service periods of less than one year such as monthly current account services and quarterly asset management services. As a result, prior period balances of contract liabilities are generally recognized in revenue in the subsequent period. Customer payment in exchange for services provided are generally subject to performance by the Group over the specific service period such that the Group’s right to payment arises at the end of the service period when its performance obligations are fully completed. Therefore, no material balance of contract asset is reported.
07 –
Net gains (losses) from derecognition of financial assets measured at amortized cost
For the twelve months ended December 31, 2021, the Group sold financial assets measured at amortized cost of
€
539
million
(December 31, 2020:
€
10
billion
and December 31, 2019:
€
390
million
). The sales in the comparative period related primarily to a Hold to Collect (HTC) portfolio in Postbank as well as sales made from a HTC portfolio in Treasury. A decision was made to divest the Postbank bond portfolio as part of the integration of Postbank into the Group. The Treasury sales were made as part of a strategy realignment for managing the interest rate risk in the Banking Book. As a result of these sales, the HTC business model is no longer valid for future acquisitions of assets in this portfolio.
The table below presents the gains and (losses) arising from derecognition of these securities.
|
in € m.
|
|
2021
|
|
2020¹
|
|
2019¹
|
|
Gains
|
|
|
|
|
|
|
|
Losses
|
|
(
|
|
(
|
|
(
|
|
Net gains (losses) from derecognition of financial assets measured at amortized cost
|
|
|
|
|
|
|
|
|
|
|
|
|
|
|
1
Prior years' comparatives aligned to presentation in the current year.
08 –
Other income (loss)
|
in € m.
|
|
2021
|
|
2020²
|
|
2019²
|
|
Other income (loss):
|
|
|
|
|
|
|
|
Insurance premiums
|
|
|
|
|
|
|
|
Net income (loss) from hedge relationships qualifying for hedge accounting
|
|
|
|
(
|
|
(
|
|
Remaining other income (loss)
1
|
|
(
|
|
|
|
(
|
|
Total other income (loss)
|
|
|
|
(
|
|
(
|
|
|
|
|
|
|
|
|
1
Includes net gains (losses) of
€
10
million
,
€ -
59
million
and
€
4
million
for the years ended December 31, 2021, 2020 and 2019, respectively, that are related to non-current assets and disposal groups held for sale.
2
Prior years' comparatives aligned to presentation in the current year.
09 –
General and administrative expenses
|
in € m.
|
|
2021
|
|
2020
|
|
2019
|
|
General and administrative expenses:
|
|
|
|
|
|
|
|
Information Technology
|
|
|
|
|
|
|
|
Occupancy, furniture and equipment expenses
|
|
|
|
|
|
|
|
Regulatory, Tax Insurance
1
|
|
|
|
|
|
|
|
Professional services
2
|
|
|
|
|
|
|
|
Banking Services and outsourced operations
2
|
|
|
|
|
|
|
|
Market Data and Research Services
|
|
|
|
|
|
|
|
Travel expenses
|
|
|
|
|
|
|
|
Marketing expenses
|
|
|
|
|
|
|
|
Other expenses
3
|
|
|
|
|
|
|
|
Total general and administrative expenses
|
|
|
|
|
|
|
|
|
|
|
|
|
|
|
1
Includes bank levy of
€
553
million
in 2021,
€
633
million
in 2020 and
€
622
million
in 2019.
2
Prior years' comparatives aligned to presentation in the current year.
3
Includes litigation related expenses of
€
466
million
in 2021,
€
158
million
in 2020 and
€
473
million
in 2019. See Note 27 “Provisions”, for more details on litigation.
|
215
|
|
|
Deutsche Bank
|
Additional Notes
|
|
|
Annual Report 2021
|
|
|
|
|
|
10 –
Restructuring
Restructuring is primarily driven by the implementation of the Group’s strategic changes as announced in the third quarter 2019. We have defined and are in the process of implementing measures that aim to strengthen the bank, position it for growth and simplify its organizational set-up. The measures also aim to reduce adjusted costs through higher efficiency, by optimizing and streamlining processes, and by exploiting synergies.
Restructuring expense is comprised of termination benefits, additional expenses covering the acceleration of deferred compensation awards not yet amortized due to the discontinuation of employment and contract termination costs related to real estate.
Net restructuring expense by division
|
in € m.
|
|
2021
|
|
2020
|
|
2019
|
|
Corporate Bank
|
|
|
|
|
|
|
|
Investment Bank
|
|
|
|
|
|
|
|
Private Bank
|
|
|
|
|
|
|
|
Asset Management
|
|
|
|
|
|
|
|
Capital Release Unit
|
|
(
|
|
|
|
|
|
Corporate Other
|
|
(
|
|
|
|
|
|
Total Net Restructuring Charges
|
|
|
|
|
|
|
|
|
|
|
|
|
|
|
Net restructuring by type
|
in € m.
|
|
2021
|
|
2020
|
|
2019
|
|
Restructuring – Staff related
|
|
|
|
|
|
|
|
thereof:
|
|
|
|
|
|
|
|
Termination Benefits
|
|
|
|
|
|
|
|
Retention Acceleration
|
|
|
|
|
|
|
|
Social Security
|
|
|
|
|
|
|
|
Restructuring – Non Staff related
|
|
|
|
|
|
|
|
Total Net Restructuring Charges
|
|
|
|
|
|
|
|
|
|
|
|
|
|
|
Provisions for restructuring amounted to
€
582
million
,
€
676
million
and
€
684
million
as of December 31, 2021, December 31, 2020 and December 31, 2019, respectively. The majority of the current provisions for restructuring are expected to be utilized in the next two years.
During 2021,
1,362
full-time equivalent staff was reduced through restructuring (2020:
1,447
and 2019:
2,564
).
Organizational changes
|
Full-time equivalent staff
|
|
2021
|
|
2020
|
|
2019
|
|
Corporate Bank
|
|
|
|
|
|
|
|
Investment Bank
|
|
|
|
|
|
|
|
Private Bank
|
|
|
|
|
|
|
|
Asset Management
|
|
|
|
|
|
|
|
Capital Release Unit
|
|
|
|
|
|
|
|
Infrastructure
|
|
|
|
|
|
|
|
Total full-time equivalent staff
|
|
|
|
|
|
|
|
|
|
|
|
|
|
|
|
216
|
|
|
Deutsche Bank
|
Additional Notes
|
|
|
Annual Report 2021
|
|
|
|
|
|
11 –
Earnings per share
Basic earnings per share amounts are computed by dividing net income (loss) attributable to Deutsche Bank shareholders by the average number of common shares outstanding during the year. The average number of common shares outstanding is defined as the average number of common shares issued, reduced by the average number of shares in treasury and by the average number of shares that will be acquired under physically-settled forward purchase contracts, and increased by undistributed vested shares awarded under deferred share plans.
Diluted earnings per share assumes the conversion into common shares of outstanding securities or other contracts to issue common stock, such as share options, convertible debt, unvested deferred share awards and forward contracts. The aforementioned instruments are only included in the calculation of diluted earnings per share if they are dilutive in the respective reporting period.
Computation of basic and diluted earnings per share
|
in € m.
|
|
2021
|
|
2020
|
|
2019
|
|
Net income (loss) attributable to Deutsche Bank shareholders and additional equity components
|
|
|
|
|
|
(
|
|
Coupons paid on additional equity components
|
|
(
|
|
(
|
|
(
|
|
Net income (loss) attributable to Deutsche Bank shareholders –
numerator for basic earnings per share
|
|
|
|
|
|
(
|
|
Effect of dilutive securities
|
|
|
|
|
|
|
|
Net income (loss) attributable to Deutsche Bank shareholders after assumed
conversions – numerator for diluted earnings per share
|
|
|
|
|
|
(
|
|
Number of shares in million
|
|
|
|
|
|
|
|
Weighted-average shares outstanding – denominator for basic earnings per share
|
|
|
|
|
|
|
|
Effect of dilutive securities:
|
|
|
|
|
|
|
|
Forwards
|
|
|
|
|
|
|
|
Employee stock compensation options
|
|
|
|
|
|
|
|
Deferred shares
|
|
|
|
|
|
|
|
Other (including trading options)
|
|
|
|
|
|
|
|
Dilutive potential common shares
|
|
|
|
|
|
|
|
Adjusted weighted-average shares after assumed conversions –
denominator for diluted earnings per share
|
|
|
|
|
|
|
|
|
|
|
|
|
|
|
Earnings per share
|
in €
|
|
2021
|
|
2020
|
|
2019
|
|
Basic earnings per share
|
|
|
|
|
|
(
|
|
Diluted earnings per share
|
|
|
|
|
|
(
|
|
|
|
|
|
|
|
|
Due to the net loss situation for 2019 potentially dilutive shares are generally not considered for the earnings per share calculation, because to do so would have been anti-dilutive and hence decreased the net loss per share.
Instruments outstanding and not included in the calculation of diluted earnings per share
1
|
Number of shares in m.
|
|
2021
|
|
2020
|
|
2019
|
|
Call options sold
|
|
|
|
|
|
|
|
Employee stock compensation options
|
|
|
|
|
|
|
|
Deferred shares
|
|
|
|
|
|
|
|
|
|
|
|
|
|
|
|
217
|
|
|
Deutsche Bank
|
Additional Notes
|
|
|
Annual Report 2021
|
|
|
|
|
|
Notes to the consolidated balance sheet
12 –
Financial assets/liabilities at fair value through profit or loss
|
in € m.
|
|
Dec 31, 2021
|
|
Dec 31, 2020
|
|
Financial assets classified as held for trading:
|
|
|
|
|
|
Trading assets:
|
|
|
|
|
|
Trading securities
|
|
|
|
|
|
Other trading assets
1
|
|
|
|
|
|
Total trading assets
|
|
|
|
|
|
Positive market values from derivative financial instruments
|
|
|
|
|
|
Total financial assets classified as held for trading
|
|
|
|
|
|
Non-trading financial assets mandatory at fair value through profit or loss:
|
|
|
|
|
|
Securities purchased under resale agreements
|
|
|
|
|
|
Securities borrowed
|
|
|
|
|
|
Loans
|
|
|
|
|
|
Other financial assets mandatory at fair value through profit or loss
|
|
|
|
|
|
Total Non-trading financial assets mandatory at fair value through profit or loss
|
|
|
|
|
|
Financial assets designated at fair value through profit or loss:
|
|
|
|
|
|
Loans
|
|
|
|
|
|
Other financial assets designated at fair value through profit or loss
|
|
|
|
|
|
Total financial assets designated at fair value through profit or loss
|
|
|
|
|
|
Total financial assets at fair value through profit or loss
|
|
|
|
|
|
|
|
|
|
|
1
Includes traded loans of
€
9.2
billion
and
€
8.3
billion
at December 31, 2021 and 2020 respectively.
|
in € m.
|
|
Dec 31, 2021
|
|
Dec 31, 2020
|
|
Financial liabilities classified as held for trading:
|
|
|
|
|
|
Trading liabilities:
|
|
|
|
|
|
Trading securities
|
|
|
|
|
|
Other trading liabilities
|
|
|
|
|
|
Total trading liabilities
|
|
|
|
|
|
Negative market values from derivative financial instruments
|
|
|
|
|
|
Total financial liabilities classified as held for trading
|
|
|
|
|
|
Financial liabilities designated at fair value through profit or loss:
|
|
|
|
|
|
Securities sold under repurchase agreements
|
|
|
|
|
|
Loan commitments
|
|
|
|
|
|
Long-term debt
|
|
|
|
|
|
Other financial liabilities designated at fair value through profit or loss
|
|
|
|
|
|
Total financial liabilities designated at fair value through profit or loss
|
|
|
|
|
|
Investment contract liabilities
|
|
|
|
|
|
Total financial liabilities at fair value through profit or loss
|
|
|
|
|
|
|
|
|
|
|
Financial assets liabilities designated at fair value through profit or loss
The Group has designated various lending relationships at fair value through profit or loss. Lending facilities consist of drawn loan assets and undrawn irrevocable loan commitments. The maximum exposure to credit risk on a drawn loan is its fair value. The Group’s maximum exposure to credit risk on drawn loans was
€
139
million
and
€
437
million
as of December 31, 2021, and 2020, respectively. Exposure to credit risk also exists for undrawn irrevocable loan commitments and is predominantly counterparty credit risk.
The credit risk on the securities purchased under resale agreements and securities borrowed designated under the fair value option is mitigated by the holding of collateral. The valuation of these instruments takes into account the credit enhancement in the form of the collateral received. As such there is no material movement during the year or cumulatively due to movements in counterparty credit risk on these instruments.
Changes in fair value of financial assets attributable to movements in counterparty credit risk
|
in € m.
|
|
Dec 31, 2021
|
|
Dec 31, 2020
|
|
Notional value of financial assets exposed to credit risk
|
|
|
|
|
|
Annual change in the fair value reflected in the Statement of Income
|
|
|
|
(
|
|
Cumulative change in the fair value
|
|
|
|
(
|
|
Notional of credit derivatives used to mitigate credit risk
|
|
|
|
|
|
Annual change in the fair value reflected in the Statement of Income
|
|
|
|
|
|
Cumulative change in the fair value
|
|
|
|
|
|
|
|
|
|
|
|
218
|
|
|
Deutsche Bank
|
Additional Notes
|
|
|
Annual Report 2021
|
|
|
|
|
|
Changes in fair value of financial liabilities attributable to movements in the Group’s credit risk
1
|
in € m.
|
|
Dec 31, 2021
|
|
Dec 31, 2020
|
|
Presented in Other comprehensive Income
|
|
|
|
|
|
Cumulative change in the fair value
|
|
|
|
(
|
|
Presented in Statement of income
|
|
|
|
|
|
Annual change in the fair value reflected in the Statement of Income
|
|
|
|
|
|
Cumulative change in the fair value
|
|
|
|
|
|
|
|
|
|
|
1
The fair value of a financial liability incorporates the credit risk of that financial liability. Changes in the fair value of financial liabilities issued by consolidated structured entities have been excluded as this is not related to the Group’s credit risk but to that of the legally isolated structured entity, which is dependent on the collateral it holds.
Transfers of the cumulative gains or losses within equity during the period
|
in € m.
|
|
Dec 31, 2021
|
|
Dec 31, 2020
|
|
Cumulative gains or losses within equity during the period
|
|
|
|
|
|
|
|
|
|
|
Amounts realized on derecognition of liabilities designated at fair value through profit or loss
|
in € m.
|
|
Dec 31, 2021
|
|
Dec 31, 2020
|
|
Amount presented in other comprehensive income realized at derecognition
|
|
|
|
|
|
|
|
|
|
|
The excess of the contractual amount repayable at maturity over the carrying value of financial liabilities
1
|
in € m.
|
|
Dec 31, 2021
|
|
Dec 31, 2020
|
|
Including undrawn loan commitments²
|
|
|
|
|
|
Excluding undrawn loan commitments
|
|
|
|
|
|
|
|
|
|
|
1
Assuming the liability is extinguished at the earliest contractual maturity that the Group can be required to repay. When the amount payable is not fixed, it is determined by reference to conditions existing at the reporting date.
2
The contractual cash flows at maturity for undrawn loan commitments assume full drawdown of the facility.
13 –
Financial Instruments carried at Fair Value
Valuation Methods and Control
The Group has an established valuation control framework which governs internal control standards, methodologies, and procedures over the valuation process.
Prices Quoted in Active Markets
–
The fair value of instruments that are quoted in active markets are determined using the quoted prices where they represent prices at which regularly and recently occurring transactions take place.
Valuation Techniques
– The Group uses valuation techniques to establish the fair value of instruments where prices, quoted in active markets, are not available. Valuation techniques used for financial instruments include modelling techniques, the use of indicative quotes for proxy instruments, quotes from recent and less regular transactions and broker quotes.
For some financial instruments a rate or other parameter, rather than a price, is quoted. Where this is the case then the market rate or parameter is used as an input to a valuation model to determine fair value. For some instruments, modelling techniques follow industry standard models, for example, discounted cash flow analysis and standard option pricing models. These models are dependent upon estimated future cash flows, discount factors and volatility levels. For more complex or unique instruments, more sophisticated modelling techniques are required, and may rely upon assumptions or more complex parameters such as correlations, prepayment speeds, default rates and loss severity.
Frequently, valuation models require multiple parameter inputs. Where possible, parameter inputs are based on observable data or are derived from the prices of relevant instruments traded in active markets. Where observable data is not available for parameter inputs, then other market information is considered. For example, indicative broker quotes and consensus pricing information are used to support parameter inputs where they are available. Where no observable information is available to support parameter inputs then they are based on other relevant sources of information such as prices for similar transactions, historic data, economic fundamentals, and research information, with appropriate adjustment to reflect the terms of the actual instrument being valued and current market conditions.
|
219
|
|
|
Deutsche Bank
|
Additional Notes
|
|
|
Annual Report 2021
|
|
|
|
|
|
Valuation Adjustments
– Valuation adjustments are an integral part of the valuation process. In making appropriate valuation adjustments, the Group follows methodologies that consider factors such as bid-offer spreads, counterparty/own credit and funding risk. Bid-offer spread valuation adjustments are required to adjust mid-market valuations to the appropriate bid or offer valuation. The bid or offer valuation is the best representation of the fair value for an instrument, and therefore its fair value. The carrying value of a long position is adjusted from mid to bid, and the carrying value of a short position is adjusted from mid to offer. Bid-offer valuation adjustments are determined from bid-offer prices observed in relevant trading activity and in quotes from other broker-dealers or other knowledgeable counterparties. Where the quoted price for the instrument is already a bid-offer price then no additional bid-offer valuation adjustment is necessary. Where the fair value of financial instruments is derived from a modelling technique, then the parameter inputs into that model are normally at a mid-market level. Such instruments are generally managed on a portfolio basis and, when specified criteria are met, valuation adjustments are taken to reflect the cost of closing out the net exposure the Bank has to individual market or counterparty risks. These adjustments are determined from bid-offer prices observed in relevant trading activity and quotes from other broker-dealers.
Where complex valuation models are used, or where less-liquid positions are being valued, then bid-offer levels for those positions may not be available directly from the market, and therefore for the close-out cost of these positions, models and parameters must be estimated. When these adjustments are designed, the Group closely examines the valuation risks associated with the model as well as the positions themselves, and the resulting adjustments are closely monitored on an ongoing basis.
Counterparty Credit Valuation Adjustments (CVAs) are required to cover expected credit losses to the extent that the valuation technique does not already include an expected credit loss factor relating to the non-performance risk of the counterparty. The CVA amount is applied to all relevant over-the-counter (OTC) derivatives, and is determined by assessing the potential credit exposure to a given counterparty and taking into account any collateral held, the effect of any relevant netting arrangements, expected loss given default and the probability of default, based on available market information, including Credit Default Swap (CDS) spreads. Where counterparty CDS spreads are not available, relevant proxies are used.
The fair value of the Group’s financial liabilities at fair value through profit or loss (i.e., OTC derivative liabilities and issued note liabilities designated at fair value through profit or loss) incorporates valuation adjustments to measure the change in the Group’s own credit risk (i.e. Debt Valuation Adjustments (DVA) for Derivatives and Own Credit Adjustment (OCA) for structured notes). For derivative liabilities the Group considers its own creditworthiness by assessing all counterparties’ expected future exposure to the Group, taking into account any collateral posted by the Group, the effect of relevant netting arrangements, the probability of default of the Group, based on the Group’s market CDS level and the expected loss given default, taking into account the seniority of derivative claims under resolution (statutory subordination). Issued note liabilities are discounted utilizing the spread at which similar instruments would be issued or bought back at the measurement date as this reflects the value from the perspective of a market participant who holds the identical item as an asset. This spread is further parameterized into a market level of funding component and an idiosyncratic own credit component. Under IFRS 9 the change in the own credit component is reported under Other Comprehensive Income (OCI).
When determining CVA and DVA, additional adjustments are made where appropriate to achieve fair value, due to the expected loss estimate of a particular arrangement, or where the credit risk being assessed differs in nature to that described by the available CDS instrument.
Funding Valuation Adjustments (FVA) are required to incorporate the market implied funding costs into the fair value of derivative positions. The FVA reflects a discounting spread applied to uncollateralized and partially collateralized derivatives and is determined by assessing the market-implied funding costs on both assets and liabilities.
Where there is uncertainty in the assumptions used within a modelling technique, an additional adjustment is taken to calibrate the model price to the expected market price of the financial instrument. Typically, such transactions have bid-offer levels which are less observable, and these adjustments aim to estimate the bid-offer by computing the liquidity-premium associated with the transaction. Where a financial instrument is of sufficient complexity that the cost of closing it out would be higher than the cost of closing out its component risks, then an additional adjustment is taken to reflect this.
IFRS requires the Group to use the assumptions that market participants would use when pricing the asset or liability. Where relevant, these assumptions may include assumptions about climate change. The Group has not made material adjustment to fair value for climate change beyond that already priced into market inputs
Valuation Control
– The Group has an independent specialized valuation control group within the Risk function which governs and develops the valuation control framework and manages the valuation control processes. The mandate of this specialist function includes the performance of the independent valuation control process for all businesses, the continued development of valuation control methodologies and techniques, as well as devising and governing the formal valuation control policy framework. Special attention of this independent valuation control group is directed to areas where management judgment forms part of the valuation process.
Results of the valuation control process are collected and analyzed as part of a standard monthly reporting cycle. Variances of differences outside of preset and approved tolerance levels are escalated both within the Finance function and with Senior Business Management for review, resolution and, if required, adjustment.
For instruments where fair value is determined from valuation models, the assumptions and techniques used within the models are independently validated by an independent specialist model validation group that is part of the Group’s Risk Management function.
|
220
|
|
|
Deutsche Bank
|
Additional Notes
|
|
|
Annual Report 2021
|
|
|
|
|
|
Quotes for transactions and parameter inputs are obtained from a number of third party sources including exchanges, pricing service providers, firm broker quotes and consensus pricing services. Price sources are examined and assessed to determine the quality of fair value information they represent, with greater emphasis given to those possessing greater valuation certainty and relevance. The results are compared against actual transactions in the market to ensure the model valuations are calibrated to market prices.
Price and parameter inputs to models, assumptions and valuation adjustments are verified against independent sources. Where they cannot be verified to independent sources due to lack of observable information, the estimate of fair value is subject to procedures to assess its reasonableness. Such procedures include performing revaluation using independently generated models (including where existing models are independently recalibrated), assessing the valuations against appropriate proxy instruments and other benchmarks, and performing extrapolation techniques. Assessment is made as to whether the valuation techniques produce fair value estimates that are reflective of market levels by calibrating the results of the valuation models against market transactions where possible.
Fair Value Hierarchy
The financial instruments carried at fair value have been categorized under the three levels of the IFRS fair value hierarchy as follows:
Level 1 – Instruments valued using quoted prices in active markets
are instruments where the fair value can be determined directly from prices which are quoted in active, liquid markets and where the instrument observed in the market is representative of that being priced in the Group’s inventory.
These include: government bonds, exchange-traded derivatives and equity securities traded on active, liquid exchanges.
Level 2 – Instruments valued with valuation techniques using observable market data
are instruments where the fair value can be determined by reference to similar instruments trading in active markets, or where a technique is used to derive the valuation but where all inputs to that technique are observable.
These include: many OTC derivatives; many investment-grade listed credit bonds; some CDS; many collateralized debt obligations (CDO); and many less-liquid equities.
Level 3 – Instruments valued using valuation techniques using market data
which is not directly observable are instruments where the fair value cannot be determined directly by reference to market-observable information, and some other pricing technique must be employed. Instruments classified in this category have an element which is unobservable and which has a significant impact on the fair value.
These include: more-complex OTC derivatives; distressed debt; highly-structured bonds; illiquid asset-backed securities (ABS); illiquid CDO’s (cash and synthetic); some private equity placements; many commercial real estate (CRE) loans; illiquid loans; and some municipal bonds.
|
221
|
|
|
Deutsche Bank
|
Additional Notes
|
|
|
Annual Report 2021
|
|
|
|
|
|
Carrying value of the financial instruments held at fair value
1
|
|
|
Dec 31, 2021
|
|
Dec 31, 2020
|
||||||||
|
in € m.
|
|
Quoted
prices in
active market
(Level 1)
|
|
Valuation
technique
observable
parameters
(Level 2)
|
|
Valuation
technique
unobservable
parameters
(Level 3)
|
|
Quoted
prices in
active market
(Level 1)
|
|
Valuation
technique
observable
parameters
(Level 2)
|
|
Valuation
technique
unobservable
parameters
(Level 3)
|
|
Financial assets held at fair value:
|
|
|
|
|
|
|
|
|
|
|
|
|
|
Trading assets
|
|
|
|
|
|
|
|
|
|
|
|
|
|
Trading securities
|
|
|
|
|
|
|
|
|
|
|
|
|
|
Other trading assets
|
|
|
|
|
|
|
|
|
|
|
|
|
|
Positive market values from derivative financial instruments
|
|
|
|
|
|
|
|
|
|
|
|
|
|
Non-trading financial assets mandatory at fair value through profit or loss
|
|
|
|
|
|
|
|
|
|
|
|
|
|
Financial assets designated at fair value through profit or loss
|
|
|
|
|
|
|
|
|
|
|
|
|
|
Financial assets at fair value through other comprehensive income
|
|
|
|
|
|
|
|
|
|
|
|
|
|
Other financial assets at fair value
|
|
|
|
|
|
|
|
|
|
|
|
|
|
Total financial assets held at fair value
|
|
|
|
|
|
|
|
|
|
|
|
|
|
|
|
|
|
|
|
|
|
|
|
|
|
|
|
Financial liabilities held at fair value:
|
|
|
|
|
|
|
|
|
|
|
|
|
|
Trading liabilities
|
|
|
|
|
|
|
|
|
|
|
|
|
|
Trading securities
|
|
|
|
|
|
|
|
|
|
|
|
|
|
Other trading liabilities
|
|
|
|
|
|
|
|
|
|
|
|
|
|
Negative market values from derivative financial instruments
|
|
|
|
|
|
|
|
|
|
|
|
|
|
Financial liabilities designated at fair value through profit or loss
|
|
|
|
|
|
|
|
|
|
|
|
|
|
Investment contract liabilities
|
|
|
|
|
|
|
|
|
|
|
|
|
|
Other financial liabilities at fair value
|
|
|
|
|
|
(
|
|
|
|
|
|
(
|
|
Total financial liabilities held at fair value
|
|
|
|
|
|
|
|
|
|
|
|
|
|
|
|
|
|
|
|
|
|
|
|
|
|
|
1
Amounts in this table are generally presented on a gross basis, in line with the Group’s accounting policy regarding offsetting of financial instruments, as described in Note 1 “Significant Accounting Policies and Critical Accounting Estimates”.
2
Predominantly relates to derivatives qualifying for hedge accounting.
3
Relates to derivatives which are embedded in contracts where the host contract is held at amortized cost but for which the embedded derivative is separated. The separated embedded derivatives may have a positive or a negative fair value but have been presented in this table to be consistent with the classification of the host contract. The separated embedded derivatives are held at fair value on a recurring basis and have been split between the fair value hierarchy classifications.
During the first quarter of 2021, the Group implemented a refinement to its levelling methodology with the effect that for certain trades where trade date profit was deferred, the fair value hierarchy classification is now based on current conditions rather than conditions that existed at the trade date. The impact of these changes was a movement from Level 3 to Level 2 of approximately
€
1
billion
of Positive market values from derivative financial instruments and
€
200
million
of Negative market values from derivative financial instruments.
During the fourth quarter of 2021, the Group implemented a refinement to its levelling methodology for certain loan portfolios to provide more reliable information. The change resulted in increase of Level 3 for “Other trading assets” and “Non-trading financial assets mandatory at fair value through profit or loss” by approximately
€
2.0
billion
.
The 2020 comparatives have not been restated for these refinements to levelling methodologies as these are changes in accounting estimates.
Until December 31, 2021 there were transfers from Level 2 to Level 1 on trading securities (
€
5
billion
of assets). The assessment of level 1 versus level 2 is based on liquidity testing procedures.
Valuation Techniques
The Group has an established valuation control framework which governs internal control standards, methodologies, valuation techniques and procedures over the valuation process and fair value measurement. The following is an explanation of the valuation techniques used in establishing the fair value of the different types of financial instruments that the Group trades.
Sovereign, Quasi-sovereign and Corporate Debt and Equity Securities
– Where there are no recent transactions then fair value may be determined from the last market price adjusted for all changes in risks and information since that date. Where a close proxy instrument is quoted in an active market then fair value is determined by adjusting the proxy value for differences in the risk profile of the instruments. Where close proxies are not available then fair value is estimated using more complex modelling techniques. These techniques include discounted cash flow models using current market rates for credit, interest, liquidity and other risks. For equity securities modeling techniques may also include those based on earnings multiples.
|
222
|
|
|
Deutsche Bank
|
Additional Notes
|
|
|
Annual Report 2021
|
|
|
|
|
|
Mortgage- and Other Asset-Backed Securities (MBS/ABS)
include residential and commercial MBS and other ABS including CDOs. ABS have specific characteristics as they have different underlying assets and the issuing entities have different capital structures. The complexity increases further where the underlying assets are themselves ABS, as is the case with many of the CDO instruments.
Where no reliable external pricing is available, ABS are valued, where applicable, using either relative value analysis which is performed based on similar transactions observable in the market, or industry-standard valuation models making largest possible use of available observable inputs. The industry standard models calculate principal and interest payments for a given deal based on assumptions that can be independently price tested. The inputs include prepayment speeds, loss assumptions (timing and severity) and a discount rate (spread, yield or discount margin). These inputs/assumptions are derived from actual transactions, external market research and market indices where appropriate.
Loans
– For certain loans fair value may be determined from the market price on a recently occurring transaction adjusted for all changes in risks and information since that transaction date. Where there are no recent market transactions then broker quotes, consensus pricing, proxy instruments or discounted cash flow models are used to determine fair value. Discounted cash flow models incorporate parameter inputs for credit risk, interest rate risk, foreign exchange risk, loss given default estimates and amounts utilized given default, as appropriate. Credit risk, loss given default and utilization given default parameters are determined using information from the loan or other credit markets, where available and appropriate.
Leveraged loans can have transaction-specific characteristics which can limit the relevance of market-observed transactions. Where similar transactions exist for which observable quotes are available from external pricing services then this information is used with appropriate adjustments to reflect the transaction differences. When no similar transactions exist, a discounted cash flow valuation technique is used with credit spreads derived from the appropriate leveraged loan index, incorporating the industry classification, subordination of the loan, and any other relevant information on the loan and loan counterparty.
Over-The-Counter Derivative Financial Instruments
– Market standard transactions in liquid trading markets, such as interest rate swaps, foreign exchange forward and option contracts in G7 currencies, and equity swap and option contracts on listed securities or indices are valued using market standard models and quoted parameter inputs. Parameter inputs are obtained from pricing services, consensus pricing services and recently occurring transactions in active markets wherever possible.
More complex instruments are modeled using more sophisticated modeling techniques specific for the instrument and are calibrated to available market prices. Where the model output value does not calibrate to a relevant market reference then valuation adjustments are made to the model output value to adjust for any difference. In less active markets, data is obtained from less frequent market transactions, broker quotes and through extrapolation and interpolation techniques. Where observable prices or inputs are not available, management judgment is required to determine fair values by assessing other relevant sources of information such as historical data, fundamental analysis of the economics of the transaction and proxy information from similar transactions.
Financial Liabilities Designated at Fair Value through Profit or Loss under the Fair Value Option
– The fair value of financial liabilities designated at fair value through profit or loss under the fair value option incorporates all market risk factors including a measure of the Group’s credit risk relevant for that financial liability. The financial liabilities include structured note issuances, structured deposits, and other structured securities issued by consolidated vehicles, which may not be quoted in an active market. The fair value of these financial liabilities is determined by discounting the contractual cash flows using the relevant credit-adjusted yield curve. The market risk parameters are valued consistently to similar instruments held as assets, for example, any derivatives embedded within the structured notes are valued using the same methodology discussed in the “Over-The-Counter Derivative Financial Instruments” section above.
Where the financial liabilities designated at fair value through profit or loss under the fair value option are collateralized, such as securities loaned and securities sold under repurchase agreements, the credit enhancement is factored into the fair valuation of the liability.
Investment Contract Liabilities
– Assets which are linked to the investment contract liabilities are owned by the Group. The investment contract obliges the Group to use these assets to settle these liabilities. Therefore, the fair value of investment contract liabilities is determined by the fair value of the underlying assets (i.e., amount payable on surrender of the policies).
Analysis of Financial Instruments with Fair Value Derived from Valuation Techniques Containing Significant Unobservable Parameters (Level 3)
Some of the financial assets and financial liabilities in Level 3 of the fair value hierarchy have identical or similar offsetting exposures to the unobservable input. However, according to IFRS they are required to be presented gross.
|
223
|
|
|
Deutsche Bank
|
Additional Notes
|
|
|
Annual Report 2021
|
|
|
|
|
|
Trading Securities
– Certain illiquid emerging market corporate bonds and illiquid highly structured corporate bonds are included in this level of the hierarchy. In addition, some of the holdings of notes issued by securitization entities, commercial and residential MBS, collateralized debt obligation securities and other ABS are reported here. The increase during the year was mainly due to purchases and net transfers between Level 2 and Level 3 due to changes in the observability of input parameters used to value these instruments, partially offset by sales, settlements, losses, deconsolidation.
Positive and Negative Market Values from Derivative Instruments
categorized in this level of the fair value hierarchy are valued based on one or more significant unobservable parameters. The unobservable parameters may include certain correlations, certain longer-term volatilities, certain prepayment rates, credit spreads and other transaction-specific parameters.
Level 3 derivatives include certain options where the volatility is unobservable; certain basket options in which the correlations between the referenced underlying assets are unobservable; longer-term interest rate option derivatives; multi-currency foreign exchange derivatives; and certain credit default swaps for which the credit spread is not observable.
The increase in assets during the year are driven by gains and transfers between Level 2 and Level 3 due to changes in the observability of input parameters used to value these instruments, partially offset by settlements. The increase in liabilities during the year are driven by losses and transfers between Level 2 and Level 3 due to changes in the observability of input parameters used to value these instruments, partially offset by settlement.
Other Trading Instruments
classified in Level 3 of the fair value hierarchy mainly consist of traded loans valued using valuation models based on one or more significant unobservable parameters. Level 3 loans comprise illiquid leveraged loans and illiquid residential and commercial mortgage loans. The increase during the year refers to purchases, issuances, gains and transfers between Level 2 and Level 3 due to changes in the observability of input parameters used to value these instruments, partially offset by sales and settlements.
Non-trading financial assets mandatory at fair value through profit or loss
classified in Level 3 of fair value hierarchy consist of any non-trading financial asset that does not fall into the Hold to Collect nor Hold to Collect and Sell business models. This includes predominately reverse repurchase agreements which are managed on a fair value basis. Additionally, any financial asset that falls into the Hold to Collect or Hold to Collect and Sell business models for which the contractual cash flow characteristics are not SPPI.
The increase during the year refers to purchases, issuances, gains and transfers between Level 2 and Level 3 due to changes in the observability of input parameters used to value these instruments, partially offset by sales and settlements.
Financial Assets/Liabilities designated at Fair Value through Profit or Loss
– Certain corporate loans and structured liabilities which were designated at fair value through profit or loss under the fair value option were categorized in this level of the fair value hierarchy. The corporate loans are valued using valuation techniques which incorporate observable credit spreads, recovery rates and unobservable utilization parameters. Revolving loan facilities are reported in the third level of the hierarchy because the utilization in the event of the default parameter is significant and unobservable.
In addition, certain hybrid debt issuances designated at fair value through profit or loss containing embedded derivatives are valued based on significant unobservable parameters. These unobservable parameters include single stock volatility correlations. The increase in assets during the year is driven by issuances. The increase in liabilities during the year is driven by issuances, losses and net transfers between Level 2 and Level 3 due to changes in the observability of input parameters used to value these instruments, partially offset by settlements.
Financial assets at fair value through other comprehensive income
include non-performing loan portfolios where there is no trading intent and the market is very illiquid. The increase during the year is driven by purchases, issuances, gains and transfers between Level 2 and Level 3 due to changes in the observability of input parameters used to value these instruments partially offset by sales and settlements.
|
224
|
|
|
Deutsche Bank
|
Additional Notes
|
|
|
Annual Report 2021
|
|
|
|
|
|
Reconciliation of financial instruments classified in Level 3
|
225
|
|
|
Deutsche Bank
|
Additional Notes
|
|
|
Annual Report 2021
|
|
|
|
|
|
Reconciliation of financial instruments classified in Level 3
|
|
|
Dec 31, 2021
|
||||||||||||||||||
|
in € m.
|
|
Balance,
beginning
of year
|
|
Changes
in the
group of
consoli-
dated
companies
|
|
Total
gains/
losses
1
|
|
Purchases
|
|
Sales
|
|
Issu-
ances
2
|
|
Settle-
ments
3
|
|
Transfers
into
Level 3
4
|
|
Transfers
out of
Level 3
4
|
|
Balance,
end of
year
|
|
Financial assets held at
fair value:
|
|
|
|
|
|
|
|
|
|
|
|
|
|
|
|
|
|
|
|
|
|
Trading securities
|
|
|
|
(
|
|
(
|
|
|
|
(
|
|
|
|
(
|
|
|
|
(
|
|
|
|
Positive market values
from derivative financial
instruments
|
|
|
|
|
|
|
|
|
|
|
|
|
|
(
|
|
|
|
(
|
|
|
|
Other trading assets
|
|
|
|
|
|
|
|
|
|
(
|
|
|
|
(
|
|
|
|
(
|
|
|
|
Non-trading financial assets mandatory at fair value through profit or loss
|
|
|
|
|
|
|
|
|
|
(
|
|
|
|
(
|
|
|
|
(
|
|
|
|
Financial assets designated at fair value through profit or loss
|
|
|
|
|
|
(
|
|
|
|
|
|
|
|
|
|
|
|
|
|
|
|
Financial assets at fair value through other comprehensive income
|
|
|
|
|
|
|
|
|
|
(
|
|
|
|
(
|
|
|
|
(
|
|
|
|
Other financial assets at
fair value
|
|
|
|
|
|
|
|
|
|
|
|
|
|
(
|
|
|
|
|
|
|
|
Total financial assets held
at fair value
|
|
|
|
(
|
|
|
|
|
|
(
|
|
|
|
(
|
|
|
|
(
|
|
|
|
Financial liabilities held
at fair value:
|
|
|
|
|
|
|
|
|
|
|
|
|
|
|
|
|
|
|
|
|
|
Trading securities
|
|
|
|
|
|
|
|
|
|
|
|
|
|
(
|
|
|
|
(
|
|
|
|
Negative market values
from derivative financial
instruments
|
|
|
|
|
|
|
|
|
|
|
|
|
|
(
|
|
|
|
(
|
|
|
|
Other trading liabilities
|
|
|
|
|
|
(
|
|
|
|
|
|
|
|
|
|
|
|
|
|
|
|
Financial liabilities
designated at fair value
through profit or loss
|
|
|
|
|
|
|
|
|
|
|
|
|
|
(
|
|
|
|
(
|
|
|
|
Other financial liabilities
at fair value
|
|
(
|
|
|
|
(
|
|
|
|
|
|
|
|
|
|
|
|
|
|
(
|
|
Total financial liabilities
held at fair value
|
|
|
|
|
|
|
|
|
|
|
|
|
|
(
|
|
|
|
(
|
|
|
|
|
|
|
|
|
|
|
|
|
|
|
|
|
|
|
|
|
|
|
|
|
1
Total gains and losses predominantly relate to net gains (losses) on financial assets/liabilities at fair value through profit or loss reported in the consolidated statement of income. The balance also includes net gains (losses) on financial assets at fair value through other comprehensive income reported in the consolidated statement of income and unrealized net gains (losses) on financial assets at fair value through other comprehensive income and exchange rate changes reported in other comprehensive income, net of tax. Further, certain instruments are hedged with instruments in level 1 or level 2 but the table above does not include the gains and losses on these hedging instruments. Additionally, both observable and unobservable parameters may be used to determine the fair value of an instrument classified within level 3 of the fair value hierarchy; the gains and losses presented below are attributable to movements in both the observable and unobservable parameters.
2
Issuances relate to the cash amount received on the issuance of a liability and the cash amount paid on the primary issuance of a loan to a borrower.
3
Settlements represent cash flows to settle the asset or liability. For debt and loan instruments this includes principal on maturity, principal amortizations and principal repayments. For derivatives all cash flows are presented in settlements
.
4
Transfers in and transfers out of Level 3 are related to changes in observability of input parameters. During the year they are recorded at their fair value at the beginning of year. For instruments transferred into Level 3 the table shows the gains and losses and cash flows on the instruments as if they had been transferred at the beginning of the year. Similarly, for instruments transferred out of Level 3 the table does not show any gains or losses or cash flows on the instruments during the year since the table is presented as if they have been transferred out at the beginning of the year.
5
Total gains and losses on financial assets at fair value through other comprehensive income include a loss of
€
13
million
recognized in other comprehensive income, net of tax.
6
This amount includes the effect of exchange rate changes. For total financial assets held at fair value this effect is a gain of
€
447
million
and for total financial liabilities held at fair value this is a loss of
€
44
million
.
7
For assets positive balances represent gains, negative balances represent losses. For liabilities positive balances represent losses, negative balances represent gains.
|
|
|
Dec 31, 2020
|
||||||||||||||||||
|
in € m.
|
|
Balance,
beginning
of year
|
|
Changes
in the
group of
consoli-
dated
companies
|
|
Total
gains/
losses
1
|
|
Purchases
|
|
Sales
|
|
Issu-
ances
2
|
|
Settle-
ments
3
|
|
Transfers
into
Level 3
4
|
|
Transfers
out of
Level 3
4
|
|
Balance,
end of
year
|
|
Financial assets held at
fair value:
|
|
|
|
|
|
|
|
|
|
|
|
|
|
|
|
|
|
|
|
|
|
Trading securities
|
|
|
|
(
|
|
(
|
|
|
|
(
|
|
|
|
(
|
|
|
|
(
|
|
|
|
Positive market values
from derivative financial
instruments
|
|
|
|
(
|
|
|
|
|
|
|
|
|
|
(
|
|
|
|
(
|
|
|
|
Other trading assets
|
|
|
|
|
|
(
|
|
|
|
(
|
|
|
|
(
|
|
|
|
(
|
|
|
|
Non-trading financial assets mandatory at fair value through profit or loss
|
|
|
|
|
|
(
|
|
|
|
(
|
|
|
|
(
|
|
|
|
(
|
|
|
|
Financial assets designated at fair value through profit or loss
|
|
|
|
|
|
(
|
|
|
|
|
|
|
|
(
|
|
|
|
|
|
|
|
Financial assets at fair value through other comprehensive income
|
|
|
|
|
|
(
|
|
|
|
(
|
|
|
|
(
|
|
|
|
(
|
|
|
|
Other financial assets at
fair value
|
|
|
|
|
|
(
|
|
|
|
|
|
|
|
|
|
(
|
|
(
|
|
|
|
Total financial assets held
at fair value
|
|
|
|
(
|
|
|
|
|
|
(
|
|
|
|
(
|
|
|
|
(
|
|
|
|
Financial liabilities held at
fair value:
|
|
|
|
|
|
|
|
|
|
|
|
|
|
|
|
|
|
|
|
|
|
Trading securities
|
|
|
|
|
|
(
|
|
|
|
|
|
|
|
|
|
|
|
(
|
|
|
|
Negative market values
from derivative financial
instruments
|
|
|
|
|
|
|
|
|
|
|
|
|
|
(
|
|
|
|
(
|
|
|
|
Other trading liabilities
|
|
|
|
|
|
(
|
|
|
|
|
|
|
|
(
|
|
|
|
(
|
|
|
|
Financial liabilities
designated at fair value
through profit or loss
|
|
|
|
|
|
|
|
|
|
|
|
|
|
(
|
|
|
|
(
|
|
|
|
Other financial liabilities
at fair value
|
|
(
|
|
|
|
|
|
|
|
|
|
|
|
(
|
|
(
|
|
(
|
|
(
|
|
Total financial liabilities
held at fair value
|
|
|
|
|
|
|
|
|
|
|
|
|
|
(
|
|
|
|
(
|
|
|
|
|
|
|
|
|
|
|
|
|
|
|
|
|
|
|
|
|
|
|
|
|
1
Total gains and losses predominantly relate to net gains (losses) on financial assets/liabilities at fair value through profit or loss reported in the consolidated statement of income. The balance also includes net gains (losses) on financial assets at fair value through other comprehensive income reported in the consolidated statement of income and unrealized net gains (losses) on financial assets at fair value through other comprehensive income and exchange rate changes reported in other comprehensive income, net of tax. Further, certain instruments are hedged with instruments in level 1 or level 2 but the table above does not include the gains and losses on these hedging instruments. Additionally, both observable and unobservable parameters may be used to determine the fair value of an instrument classified within level 3 of the fair value hierarchy; the gains and losses presented below are attributable to movements in both the observable and unobservable parameters.
2
Issuances relate to the cash amount received on the issuance of a liability and the cash amount paid on the primary issuance of a loan to a borrower.
3
Settlements represent cash flows to settle the asset or liability. For debt and loan instruments this includes principal on maturity, principal amortizations and principal repayments. For derivatives all cash flows are presented in settlements.
4
Transfers in and transfers out of Level 3 are related to changes in observability of input parameters. During the year they are recorded at their fair value at the beginning of year. For instruments transferred into Level 3 the table shows the gains and losses and cash flows on the instruments as if they had been transferred at the beginning of the year. Similarly, for instruments transferred out of Level 3 the table does not show any gains or losses or cash flows on the instruments during the year since the table is presented as if they have been transferred out at the beginning of the year.
5
Total gains and losses on financial assets at fair value through other comprehensive income include a gain of
€
11
million
recognized in other comprehensive income, net of tax.
6
This amount includes the effect of exchange rate changes. For total financial assets held at fair value this effect is a loss of
€
495
million
and for total financial liabilities held at fair value this is a gain of
€
66
million
.
7
For assets positive balances represent gains, negative balances represent losses. For liabilities positive balances represent losses, negative balances represent gains.
Sensitivity Analysis of Unobservable Parameters
Where the value of financial instruments is dependent on unobservable parameter inputs, the precise level for these parameters at the balance sheet date might be drawn from a range of reasonably possible alternatives. In preparing the financial statements, appropriate levels for these unobservable input parameters are chosen so that they are consistent with prevailing market evidence and in line with the Group’s approach to valuation control detailed above. Were the Group to have marked the financial instruments concerned using parameter values drawn from the extremes of the ranges of reasonably possible alternatives then as of December 31, 2021 it could have increased fair value by as much as
€ 1.7 billion
or decreased fair value by as much as
€ 1.2 billion
. As of December 31, 2020 it could have increased fair value by as much as
€ 1.8 billion
or decreased fair value by as much as
€ 1.4 billion
.
|
226
|
|
|
Deutsche Bank
|
Additional Notes
|
|
|
Annual Report 2021
|
|
|
|
|
|
The changes in sensitive amounts from December 31, 2020 to December 31, 2021 were a reduction in positive fair value movement of
€
90
million
, and a reduction in negative fair value movement of
€
152
million
. In the same period there has been a
€
1.6
billion
increase in Group level 3 assets and a
€
2.6
billion
increase in Group level 3 liabilities. Sensitivity related to the level 3 assets and liabilities has reduced throughout 2021 despite the level 3 increases reported in the same period due to a range of idiosyncratic factors, resulting in the net impact of reductions in certain level 3 exposures on items which are deemed to be more sensitive to unobservable input parameters outweighing the impact of increases in level 3 exposures as these increases have been on items deemed to be less sensitive to unobservable input parameters.
Our sensitivity calculation of unobservable parameters for Level 3 aligns to the approach used to assess valuation uncertainty for Prudent Valuation purposes. Prudent Valuation is a capital requirement for assets held at fair value. It provides a mechanism for quantifying and capitalizing valuation uncertainty in accordance with the European Commission Delegated Regulation (EU) 2016/101, which supplements Article 34 of Regulation (EU) No. 2019/876 (CRR), requiring institutions to apply as a deduction from CET 1 for the amount of any additional valuation adjustments on all assets measured at fair value calculated in accordance with Article 105 (14). This utilizes exit price analysis performed for the relevant assets and liabilities in the Prudent Valuation assessment. The downside sensitivity may be limited in some cases where the fair value is already demonstrably prudent.
This disclosure is intended to illustrate the potential impact of the relative uncertainty in the fair value of financial instruments for which valuation is dependent on unobservable input parameters. However, it is unlikely in practice that all unobservable parameters would be simultaneously at the extremes of their ranges of reasonably possible alternatives. Hence, the estimates disclosed above are likely to be greater than the true uncertainty in fair value at the balance sheet date. Furthermore, the disclosure is neither predictive nor indicative of future movements in fair value.
For many of the financial instruments considered here, in particular derivatives, unobservable input parameters represent only a subset of the parameters required to price the financial instrument, the remainder being observable. Hence for these instruments the overall impact of moving the unobservable input parameters to the extremes of their ranges might be relatively small compared with the total fair value of the financial instrument. For other instruments, fair value is determined based on the price of the entire instrument, for example, by adjusting the fair value of a reasonable proxy instrument. In addition, all financial instruments are already carried at fair values which are inclusive of valuation adjustments for the cost to close out that instrument and hence already factor in uncertainty as it reflects itself in market pricing. Any negative impact of uncertainty calculated within this disclosure, then, will be over and above that already included in the fair value contained in the financial statements.
Breakdown of the sensitivity analysis by type of instrument
1
|
|
|
Dec 31, 2021
|
|
Dec 31, 2020
|
||||
|
in € m.
|
|
Positive fair value
movement from
using reasonable
possible alternatives
|
|
Negative fair value
movement from
using reasonable
possible alternatives
|
|
Positive fair value
movement from
using reasonable
possible alternatives
|
|
Negative fair value
movement from
using reasonable
possible alternatives
|
|
Securities:
|
|
|
|
|
|
|
|
|
|
Debt securities
|
|
|
|
|
|
|
|
|
|
Commercial mortgage-backed securities
|
|
|
|
|
|
|
|
|
|
Mortgage and other asset-backed securities
|
|
|
|
|
|
|
|
|
|
Corporate, sovereign and other debt securities
|
|
|
|
|
|
|
|
|
|
Equity securities
|
|
|
|
|
|
|
|
|
|
Derivatives:
|
|
|
|
|
|
|
|
|
|
Credit
|
|
|
|
|
|
|
|
|
|
Equity
|
|
|
|
|
|
|
|
|
|
Interest related
|
|
|
|
|
|
|
|
|
|
Foreign Exchange
|
|
|
|
|
|
|
|
|
|
Other
|
|
|
|
|
|
|
|
|
|
Loans:
|
|
|
|
|
|
|
|
|
|
Loans
|
|
|
|
|
|
|
|
|
|
Other
|
|
|
|
|
|
|
|
|
|
Total
|
|
|
|
|
|
|
|
|
|
|
|
|
|
|
|
|
|
|
- 1 Where the exposure to an unobservable parameter is offset across different instruments then only the net impact is disclosed in the table.
2
Reassessment of trades have resulted a reclassification in Positive and Negative fair value movement from using reasonable possible alternatives in ‘Corporate, sovereign and other debt securities’ from ‘Equity securities’.
Quantitative Information about the Sensitivity of Significant Unobservable Inputs
The behavior of the unobservable parameters on Level 3 fair value measurement is not necessarily independent, and dynamic relationships often exist between the other unobservable parameters and the observable parameters. Such relationships, where material to the fair value of a given instrument, are explicitly captured via correlation parameters, or are otherwise controlled via pricing models or valuation techniques. Frequently, where a valuation technique utilizes more than one input, the choice of a certain input will bound the range of possible values for other inputs. In addition, broader market factors (such as interest rates, equity, credit or commodity indices or foreign exchange rates) can also have effects.
|
227
|
|
|
Deutsche Bank
|
Additional Notes
|
|
|
Annual Report 2021
|
|
|
|
|
|
The range of values shown below represents the highest and lowest inputs used to value the significant exposures within Level 3. The diversity of financial instruments that make up the disclosure is significant and therefore the ranges of certain parameters can be large. For example, the range of credit spreads on mortgage backed securities represents performing, more liquid positions with lower spreads then the less liquid, non-performing positions which will have higher credit spreads. As Level 3 contains the less liquid fair value instruments, the wide ranges of parameters seen is to be expected, as there is a high degree of pricing differentiation within each exposure type to capture the relevant market dynamics. There follows a brief description of each of the principal parameter types, along with a commentary on significant interrelationships between them.
Credit Parameters are used to assess the creditworthiness of an exposure, by enabling the probability of default and resulting losses of a default to be represented. The credit spread is the primary reflection of creditworthiness, and represents the premium or yield return above the benchmark reference instrument (typically LIBOR, or relevant Treasury Instrument, depending upon the asset being assessed), that a bond holder would require to allow for the credit quality difference between that entity and the reference benchmark. Higher credit spreads will indicate lower credit quality, and lead to a lower value for a given bond or other loan-asset that is to be repaid to the holder or lender by the borrower. Recovery Rates represent an estimate of the amount a lender would receive in the case of a default of a loan, or a bond holder would receive in the case of default of the bond. Higher recovery rates will give a higher valuation for a given bond position, if other parameters are held constant. Constant Default Rate (CDR) and Constant Prepayment Rate (CPR) allow more complex loan and debt assets to be assessed, as these parameters estimate the ongoing defaults arising on scheduled repayments and coupons, or whether the borrower is making additional (usually voluntary) prepayments. These parameters are particularly relevant when forming a fair value opinion for mortgage or other types of lending, where repayments are delivered by the borrower through time, or where the borrower may pre-pay the loan (seen for example in some residential mortgages). Higher CDR will lead to lower valuation of a given loan or mortgage as the lender will ultimately receive less cash.
Interest rates, credit spreads, inflation rates, foreign exchange rates and equity prices are referenced in some option instruments, or other complex derivatives, where the payoff a holder of the derivative will receive is dependent upon the behavior of these underlying references through time. Volatility parameters describe key attributes of option behavior by enabling the variability of returns of the underlying instrument to be assessed. This volatility is a measure of probability, with higher volatilities denoting higher probabilities of a particular outcome occurring. The underlying references (interest rates, credit spreads etc.) have an effect on the valuation of options, by describing the size of the return that can be expected from the option. Therefore, the value of a given option is dependent upon the value of the underlying instrument, and the volatility of that instrument, representing the size of the payoff, and the probability of that payoff occurring. Where volatilities are high, the option holder will see a higher option value as there is greater probability of positive returns. A higher option value will also occur where the payoff described by the option is significant.
Correlations are used to describe influential relationships between underlying references where a derivative or other instrument has more than one underlying reference. Behind some of these relationships, for example commodity correlation and interest rate-foreign exchange correlations, typically lie macroeconomic factors such as the impact of global demand on groups of commodities, or the pricing parity effect of interest rates on foreign exchange rates. More specific relationships can exist between credit references or equity stocks in the case of credit derivatives and equity basket derivatives, for example. Credit correlations are used to estimate the relationship between the credit performance of a range of credit names, and stock correlations are used to estimate the relationship between the returns of a range of equities. A derivative with a correlation exposure will be either long- or short-correlation. A high correlation suggests a strong relationship between the underlying references is in force, and this will lead to an increase in value of a long-correlation derivative. Negative correlations suggest that the relationship between underlying references is opposing, i.e., an increase in price of one underlying reference will lead to a reduction in the price of the other.
An EBITDA (‘earnings before interest, tax, depreciation and amortization’) multiple approach can be used in the valuation of less liquid securities. Under this approach the enterprise value (‘EV’) of an entity can be estimated via identifying the ratio of the EV to EBITDA of a comparable observable entity and applying this ratio to the EBITDA of the entity for which a valuation is being estimated. Under this approach a liquidity adjustment is often applied due to the difference in liquidity between the generally listed comparable used and the company under valuation. A higher EV/EBITDA multiple will result in a higher fair value.
|
228
|
|
|
Deutsche Bank
|
Additional Notes
|
|
|
Annual Report 2021
|
|
|
|
|
|
Financial instruments classified in Level 3 and quantitative information about unobservable inputs
|
|
|
Dec 31, 2021
|
||||||||||
|
|
|
Fair value
|
|
|
|
|
|
|
|
|
||
|
in € m.
(unless stated otherwise)
|
|
Assets
|
|
Liabilities
|
|
Valuation technique(s)¹
|
|
Significant unobservable
input(s) (Level 3)
|
|
Range
|
||
|
Financial instruments held at fair value –
Non-Derivative financial instruments held at fair value:
|
|
|
|
|
|
|
|
|
|
|
|
|
|
Mortgage and other asset backed
securities held for trading:
|
|
|
|
|
|
|
|
|
|
|
|
|
|
Commercial mortgage-backed
securities
|
|
|
|
|
|
Price based
|
|
Price
|
|
|
|
|
|
|
|
|
|
|
|
Discounted cash flow
|
|
Credit spread (bps)
|
|
|
|
|
|
Mortgage- and other asset-backed
securities
|
|
|
|
|
|
Price based
|
|
Price
|
|
|
|
|
|
|
|
|
|
|
|
Discounted cash flow
|
|
Credit spread (bps)
|
|
|
|
|
|
|
|
|
|
|
|
|
|
Recovery rate
|
|
|
|
|
|
|
|
|
|
|
|
|
|
Constant default rate
|
|
|
|
|
|
|
|
|
|
|
|
|
|
Constant prepayment rate
|
|
|
|
|
|
Total mortgage- and other asset-backed
securities
|
|
|
|
|
|
|
|
|
|
|
|
|
|
Debt securities and other
debt obligations
|
|
|
|
|
|
Price based
|
|
Price
|
|
|
|
|
|
Held for trading
|
|
|
|
|
|
Discounted cash flow
|
|
Credit spread (bps)
|
|
|
|
|
|
Corporate, sovereign and
other debt securities
|
|
|
|
|
|
|
|
|
|
|
|
|
|
Non-trading financial assets mandatory at fair value through profit or loss
|
|
|
|
|
|
|
|
|
|
|
|
|
|
Designated at fair value through profit or loss
|
|
|
|
|
|
|
|
|
|
|
|
|
|
Financial assets at fair value through other comprehensive income
|
|
|
|
|
|
|
|
|
|
|
|
|
|
Equity securities
|
|
|
|
|
|
Market approach
|
|
Price per net asset value
|
|
|
|
|
|
Held for trading
|
|
|
|
|
|
|
|
Enterprise value/EBITDA
(multiple)
|
|
|
|
|
|
Non-trading financial assets mandatory at fair value through profit or loss
|
|
|
|
|
|
Discounted cash flow
|
|
Weighted average cost capital
|
|
|
|
|
|
Designated at fair value through profit or loss
|
|
|
|
|
|
Price based
|
|
Price
|
|
|
|
|
|
Loans
|
|
|
|
|
|
Price based
|
|
Price
|
|
|
|
|
|
Held for trading
|
|
|
|
|
|
Discounted cash flow
|
|
Credit spread (bps)
|
|
|
|
|
|
Non-trading financial assets mandatory at fair value through profit or loss
|
|
|
|
|
|
|
|
|
|
|
|
|
|
Designated at fair value through profit or loss
|
|
|
|
|
|
|
|
Recovery rate
|
|
|
|
|
|
Financial assets at fair value through other comprehensive income
|
|
|
|
|
|
|
|
|
|
|
|
|
|
Loan commitments
|
|
|
|
|
|
Discounted cash flow
|
|
Credit spread (bps)
|
|
|
|
|
|
|
|
|
|
|
|
|
|
Recovery rate
|
|
|
|
|
|
|
|
|
|
|
|
Loan pricing model
|
|
Utilization
|
|
|
|
|
|
Other financial instruments
|
|
|
|
|
|
Discounted cash flow
|
|
IRR
|
|
|
|
|
|
|
|
|
|
|
|
|
|
Repo rate (bps)
|
|
(
|
|
|
|
Total non-derivative financial
instruments held at fair value
|
|
|
|
|
|
|
|
|
|
|
|
|
|
|
|
|
|
|
|
|
|
|
|
|
|
|
1
Valuation technique(s) and subsequently the significant unobservable input(s) relate to the respective total position.
2
Other financial assets include
€
13
million
of other trading assets and
€
2.0
billion
of other non-trading financial assets mandatory at fair value.
3
Other financial liabilities include
€
112
million
of securities sold under repurchase agreements designated at fair value.
|
|
|
Dec 31, 2021
|
||||||||||
|
|
|
Fair value
|
|
|
|
|
|
|
|
|
||
|
in € m.
(unless stated otherwise)
|
|
Assets
|
|
Liabilities
|
|
Valuation technique(s)
|
|
Significant unobservable
input(s) (Level 3)
|
|
Range
|
||
|
Financial instruments held at fair value:
|
|
|
|
|
|
|
|
|
|
|
|
|
|
Market values from derivative
financial instruments:
|
|
|
|
|
|
|
|
|
|
|
|
|
|
Interest rate derivatives
|
|
|
|
|
|
Discounted cash flow
|
|
Swap rate (bps)
|
|
(
|
|
|
|
|
|
|
|
|
|
|
|
Inflation swap rate
|
|
|
|
|
|
|
|
|
|
|
|
|
|
Constant default rate
|
|
|
|
|
|
|
|
|
|
|
|
|
|
Constant prepayment rate
|
|
|
|
|
|
|
|
|
|
|
|
Option pricing model
|
|
Inflation volatility
|
|
|
|
|
|
|
|
|
|
|
|
|
|
Interest rate volatility
|
|
|
|
|
|
|
|
|
|
|
|
|
|
IR - IR correlation
|
|
(
|
|
|
|
|
|
|
|
|
|
|
|
Hybrid correlation
|
|
(
|
|
|
|
Credit derivatives
|
|
|
|
|
|
Discounted cash flow
|
|
Credit spread (bps)
|
|
|
|
|
|
|
|
|
|
|
|
|
|
Recovery rate
|
|
|
|
|
|
|
|
|
|
|
|
Correlation pricing
model
|
|
Credit correlation
|
|
|
|
|
|
Equity derivatives
|
|
|
|
|
|
Option pricing model
|
|
Stock volatility
|
|
|
|
|
|
|
|
|
|
|
|
|
|
Index volatility
|
|
|
|
|
|
|
|
|
|
|
|
|
|
Index - index correlation
|
|
|
|
|
|
|
|
|
|
|
|
|
|
Stock - stock correlation
|
|
|
|
|
|
|
|
|
|
|
|
|
|
Stock Forwards
|
|
|
|
|
|
|
|
|
|
|
|
|
|
Index Forwards
|
|
|
|
|
|
FX derivatives
|
|
|
|
|
|
Option pricing model
|
|
Volatility
|
|
(
|
|
|
|
|
|
|
|
|
|
|
|
Quoted Vol
|
|
|
|
|
|
Other derivatives
|
|
|
|
|
|
Discounted cash flow
|
|
Credit spread (bps)
|
|
|
|
|
|
|
|
|
|
|
|
Option pricing model
|
|
Index volatility
|
|
|
|
|
|
|
|
|
|
|
|
|
|
Commodity correlation
|
|
|
|
|
|
Total market values from derivative
financial instruments
|
|
|
|
|
|
|
|
|
|
|
|
|
|
|
|
|
|
|
|
|
|
|
|
|
|
|
1
Includes derivatives which are embedded in contracts where the host contract is held at amortized cost but for which the embedded derivative is separated.
|
|
|
Dec 31, 2020
|
||||||||||
|
|
|
Fair value
|
|
|
|
|
|
|
|
|
||
|
in € m.
(unless stated otherwise)
|
|
Assets
|
|
Liabilities
|
|
Valuation technique(s)¹
|
|
Significant unobservable
input(s) (Level 3)
|
|
Range
|
||
|
Financial instruments held at fair value –
Non-Derivative financial instruments
held at fair value:
|
|
|
|
|
|
|
|
|
|
|
|
|
|
Mortgage and other asset backed
securities held for trading:
|
|
|
|
|
|
|
|
|
|
|
|
|
|
Commercial mortgage-backed
securities
|
|
|
|
|
|
Price based
|
|
Price
|
|
|
|
|
|
|
|
|
|
|
|
Discounted cash flow
|
|
Credit spread (bps)
|
|
|
|
|
|
Mortgage- and other asset-backed
securities
|
|
|
|
|
|
Price based
|
|
Price
|
|
|
|
|
|
|
|
|
|
|
|
Discounted cash flow
|
|
Credit spread (bps)
|
|
|
|
|
|
|
|
|
|
|
|
|
|
Recovery rate
|
|
|
|
|
|
|
|
|
|
|
|
|
|
Constant default rate
|
|
|
|
|
|
|
|
|
|
|
|
|
|
Constant prepayment rate
|
|
|
|
|
|
Total mortgage- and other asset-backed
securities
|
|
|
|
|
|
|
|
|
|
|
|
|
|
Debt securities and other debt
obligations
|
|
|
|
|
|
Price based
|
|
Price
|
|
|
|
|
|
Held for trading
|
|
|
|
|
|
Discounted cash flow
|
|
Credit spread (bps)
|
|
|
|
|
|
Corporate, sovereign and other
debt securities
|
|
|
|
|
|
|
|
|
|
|
|
|
|
Non-trading financial assets mandatory at fair value through profit or loss
|
|
|
|
|
|
|
|
|
|
|
|
|
|
Designated at fair value through profit or loss
|
|
|
|
|
|
|
|
|
|
|
|
|
|
Financial assets at fair value through other comprehensive income
|
|
|
|
|
|
|
|
|
|
|
|
|
|
Equity securities
|
|
|
|
|
|
Market approach
|
|
Price per net asset value
|
|
|
|
|
|
Held for trading
|
|
|
|
|
|
|
|
Enterprise value/EBITDA
(multiple)
|
|
|
|
|
|
Non-trading financial assets mandatory at fair value through profit or loss
|
|
|
|
|
|
Discounted cash flow
|
|
Weighted average cost capital
|
|
|
|
|
|
Designated at fair value through profit or loss
|
|
|
|
|
|
Price based
|
|
Price
|
|
|
|
|
|
Loans
|
|
|
|
|
|
Price based
|
|
Price
|
|
|
|
|
|
Held for trading
|
|
|
|
|
|
Discounted cash flow
|
|
Credit spread (bps)
|
|
|
|
|
|
Non-trading financial assets mandatory at fair value through profit or loss
|
|
|
|
|
|
|
|
|
|
|
|
|
|
Designated at fair value through profit or loss
|
|
|
|
|
|
|
|
Recovery rate
|
|
|
|
|
|
Financial assets at fair value through other comprehensive income
|
|
|
|
|
|
|
|
|
|
|
|
|
|
Loan commitments
|
|
|
|
|
|
Discounted cash flow
|
|
Credit spread (bps)
|
|
|
|
|
|
|
|
|
|
|
|
|
|
Recovery rate
|
|
|
|
|
|
|
|
|
|
|
|
Loan pricing model
|
|
Utilization
|
|
|
|
|
|
Other financial instruments
|
|
|
|
|
|
Discounted cash flow
|
|
IRR
|
|
|
|
|
|
|
|
|
|
|
|
|
|
Repo rate (bps)
|
|
|
|
|
|
Total non-derivative financial
instruments held at fair value
|
|
|
|
|
|
|
|
|
|
|
|
|
|
|
|
|
|
|
|
|
|
|
|
|
|
|
1
Valuation technique(s) and subsequently the significant unobservable input(s) relate to the respective total position.
2
Other financial assets include
€
16
million
of other trading assets and
€
1.4
billion
other financial assets mandatory at fair value.
3
Other financial liabilities include
€
192
million
of securities sold under repurchase agreements designated at fair value and
€
6
million
of other financial liabilities designated at fair value.
|
|
|
Dec 31, 2020
|
||||||||||
|
|
|
Fair value
|
|
|
|
|
|
|
|
|
||
|
in € m.
(unless stated otherwise)
|
|
Assets
|
|
Liabilities
|
|
Valuation technique(s)
|
|
Significant unobservable
input(s) (Level 3)
|
|
Range
|
||
|
Financial instruments held at fair value:
|
|
|
|
|
|
|
|
|
|
|
|
|
|
Market values from derivative
financial instruments:
|
|
|
|
|
|
|
|
|
|
|
|
|
|
Interest rate derivatives
|
|
|
|
|
|
Discounted cash flow
|
|
Swap rate (bps)
|
|
(
|
|
|
|
|
|
|
|
|
|
|
|
Inflation swap rate
|
|
|
|
|
|
|
|
|
|
|
|
|
|
Constant default rate
|
|
|
|
|
|
|
|
|
|
|
|
|
|
Constant prepayment rate
|
|
|
|
|
|
|
|
|
|
|
|
Option pricing model
|
|
Inflation volatility
|
|
|
|
|
|
|
|
|
|
|
|
|
|
Interest rate volatility
|
|
|
|
|
|
|
|
|
|
|
|
|
|
IR - IR correlation
|
|
(
|
|
|
|
|
|
|
|
|
|
|
|
Hybrid correlation
|
|
(
|
|
|
|
Credit derivatives
|
|
|
|
|
|
Discounted cash flow
|
|
Credit spread (bps)
|
|
|
|
|
|
|
|
|
|
|
|
|
|
Recovery rate
|
|
|
|
|
|
|
|
|
|
|
|
Correlation pricing
model
|
|
Credit correlation
|
|
|
|
|
|
Equity derivatives
|
|
|
|
|
|
Option pricing model
|
|
Stock volatility
|
|
|
|
|
|
|
|
|
|
|
|
|
|
Index volatility
|
|
|
|
|
|
|
|
|
|
|
|
|
|
Index - index correlation
|
|
|
|
|
|
|
|
|
|
|
|
|
|
Stock - stock correlation
|
|
|
|
|
|
|
|
|
|
|
|
|
|
Stock Forwards
|
|
|
|
|
|
|
|
|
|
|
|
|
|
Index Forwards
|
|
|
|
|
|
FX derivatives
|
|
|
|
|
|
Option pricing model
|
|
Volatility
|
|
(
|
|
|
|
|
|
|
|
|
|
|
|
Quoted Vol
|
|
|
|
|
|
Other derivatives
|
|
|
|
(
|
|
Discounted cash flow
|
|
Credit spread (bps)
|
|
|
|
|
|
|
|
|
|
|
|
Option pricing model
|
|
Index volatility
|
|
|
|
|
|
|
|
|
|
|
|
|
|
Commodity correlation
|
|
|
|
|
|
Total market values from derivative
financial instruments
|
|
|
|
|
|
|
|
|
|
|
|
|
|
|
|
|
|
|
|
|
|
|
|
|
|
|
1
Includes derivatives which are embedded in contracts where the host contract is held at amortized cost but for which the embedded derivative is separated.
Unrealized Gains or Losses on Level 3 Instruments held or in Issue at the Reporting Date
The unrealized gains or losses on Level 3 Instruments are not due solely to unobservable parameters. Many of the parameter inputs to the valuation of instruments in this level of the hierarchy are observable and the gain or loss is partly due to movements in these observable parameters over the period. Many of the positions in this level of the hierarchy are economically hedged by instruments which are categorized in other levels of the fair value hierarchy. The offsetting gains and losses that have been recorded on all such hedges are not included in the table below, which only shows the gains and losses related to the Level 3 classified instruments themselves held at the reporting date in accordance with IFRS 13. The unrealized gains and losses on Level 3 instruments are included in both net interest income and net gains on financial assets/liabilities at fair value through profit or loss in the consolidated income statement.
|
in € m.
|
|
Dec 31, 2021
|
|
Dec 31, 2020
|
|
Financial assets held at fair value:
|
|
|
|
|
|
Trading securities
|
|
(
|
|
|
|
Positive market values from derivative financial instruments
|
|
|
|
|
|
Other trading assets
|
|
|
|
(
|
|
Non-trading financial assets mandatory at fair value through profit or loss
|
|
|
|
(
|
|
Financial assets designated at fair value through profit or loss
|
|
(
|
|
|
|
Financial assets at fair value through other comprehensive income
|
|
(
|
|
|
|
Other financial assets at fair value
|
|
|
|
|
|
Total financial assets held at fair value
|
|
|
|
|
|
Financial liabilities held at fair value:
|
|
|
|
|
|
Trading securities
|
|
(
|
|
(
|
|
Negative market values from derivative financial instruments
|
|
(
|
|
(
|
|
Other trading liabilities
|
|
|
|
|
|
Financial liabilities designated at fair value through profit or loss
|
|
(
|
|
|
|
Other financial liabilities at fair value
|
|
|
|
(
|
|
Total financial liabilities held at fair value
|
|
(
|
|
(
|
|
Total
|
|
(
|
|
(
|
|
|
|
|
|
|
|
229
|
|
|
Deutsche Bank
|
Additional Notes
|
|
|
Annual Report 2021
|
|
|
|
|
|
Recognition of Trade Date Profit
If there are significant unobservable inputs used in a valuation technique, the financial instrument is recognized at the transaction price and any trade date profit is deferred. The table below presents the year-to-year movement of the trade date profits deferred due to significant unobservable parameters for financial instruments classified at fair value through profit or loss. The balance is predominantly related to derivative instruments.
|
in € m.
|
|
2021
|
|
2020
|
|
Balance, beginning of year
|
|
|
|
|
|
New trades during the period
|
|
|
|
|
|
Amortization
|
|
(
|
|
(
|
|
Matured trades
|
|
(
|
|
(
|
|
Subsequent move to observability
|
|
(
|
|
(
|
|
Exchange rate changes
|
|
|
|
(
|
|
Balance, end of year
|
|
|
|
|
|
|
|
|
|
|
14 –
Fair Value of Financial Instruments not carried at Fair Value
Financial instruments not carried at fair value are not managed on a fair value basis. For these instruments fair values are calculated for disclosure purposes only and do not impact the Group balance sheet or income statement. Additionally, since the instruments generally do not trade there is significant management judgment required to determine these fair values.
For the following financial instruments which are predominantly short-term the carrying value represents a reasonable estimate of the fair value:
| Assets | Liabilities |
| Cash and central bank balances | Deposits |
| Interbank balances (w/o central banks) | Central bank funds purchased and securities sold under repurchase agreements |
| Central bank funds sold and securities purchased under resale agreements | Securities loaned |
| Securities borrowed | Other short-term borrowings |
| Other financial assets | Other financial liabilities |
|
|
|
For retail lending portfolios with a large number of homogenous loans (e.g. residential mortgages), the fair value is calculated for each product type by discounting the portfolio’s contractual cash flows using the Group’s new loan rates for lending to issuers of similar credit quality. Key inputs for retail mortgages are the difference between historic and current product margins and the estimated prepayment rates. Capitalized broker fees included in the carrying value are considered to also be at fair value.
The fair value of the corporate lending portfolio is estimated by discounting the loan till its maturity based on loan specific credit spreads and funding costs for the Group.
For long-term debt and trust preferred securities, fair value is determined from quoted market prices, where available. Where quoted market prices are not available, fair value is estimated using a valuation technique that discounts the remaining contractual cash flows at a rate at which an instrument with similar characteristics is quoted in the market.
|
230
|
|
|
Deutsche Bank
|
Additional Notes
|
|
|
Annual Report 2021
|
|
|
|
|
|
Estimated fair value of financial instruments not carried at fair value on the balance sheet
1
|
|
|
Dec 31, 2021
|
||||||||
|
in € m.
|
|
Carrying value
|
|
Fair value
|
|
Quoted
prices in
active market
(Level 1)
|
|
Valuation
technique
observable
parameters
(Level 2)
|
|
Valuation
technique
unobservable
parameters
(Level 3)
|
|
Financial assets:
|
|
|
|
|
|
|
|
|
|
|
|
Cash and central bank balances
|
|
|
|
|
|
|
|
|
|
|
|
Interbank balances (w/o central banks)
|
|
|
|
|
|
|
|
|
|
|
|
Central bank funds sold and securities
purchased under resale agreements
|
|
|
|
|
|
|
|
|
|
|
|
Securities borrowed
|
|
|
|
|
|
|
|
|
|
|
|
Loans
|
|
|
|
|
|
|
|
|
|
|
|
Other financial assets
|
|
|
|
|
|
|
|
|
|
|
|
Financial liabilities:
|
|
|
|
|
|
|
|
|
|
|
|
Deposits
|
|
|
|
|
|
|
|
|
|
|
|
Central bank funds purchased and securities
sold under repurchase agreements
|
|
|
|
|
|
|
|
|
|
|
|
Securities loaned
|
|
|
|
|
|
|
|
|
|
|
|
Other short-term borrowings
|
|
|
|
|
|
|
|
|
|
|
|
Other financial liabilities
|
|
|
|
|
|
|
|
|
|
|
|
Long-term debt
|
|
|
|
|
|
|
|
|
|
|
|
Trust preferred securities
|
|
|
|
|
|
|
|
|
|
|
|
|
|
|
|
|
|
|
|
|
|
|
|
|
|
Dec 31, 2020
|
||||||||
|
in € m.
|
|
Carrying value
|
|
Fair value
|
|
Quoted
prices in
active market
(Level 1)
|
|
Valuation
technique
observable
parameters
(Level 2)
|
|
Valuation
technique
unobservable
parameters
(Level 3)
|
|
Financial assets:
|
|
|
|
|
|
|
|
|
|
|
|
Cash and central bank balances
|
|
|
|
|
|
|
|
|
|
|
|
Interbank balances (w/o central banks)
|
|
|
|
|
|
|
|
|
|
|
|
Central bank funds sold and securities
purchased under resale agreements
|
|
|
|
|
|
|
|
|
|
|
|
Securities borrowed
|
|
|
|
|
|
|
|
|
|
|
|
Loans
|
|
|
|
|
|
|
|
|
|
|
|
Other financial assets
|
|
|
|
|
|
|
|
|
|
|
|
Financial liabilities:
|
|
|
|
|
|
|
|
|
|
|
|
Deposits
|
|
|
|
|
|
|
|
|
|
|
|
Central bank funds purchased and securities
sold under repurchase agreements
|
|
|
|
|
|
|
|
|
|
|
|
Securities loaned
|
|
|
|
|
|
|
|
|
|
|
|
Other short-term borrowings
|
|
|
|
|
|
|
|
|
|
|
|
Other financial liabilities
|
|
|
|
|
|
|
|
|
|
|
|
Long-term debt
|
|
|
|
|
|
|
|
|
|
|
|
Trust preferred securities
|
|
|
|
|
|
|
|
|
|
|
|
|
|
|
|
|
|
|
|
|
|
|
1
Amounts generally presented on a gross basis, in line with the Group’s accounting policy regarding offsetting of financial instruments as described in Note 1 “Significant Accounting Policies and Critical Accounting Estimates”.
For loans, the difference between fair value and carrying value is due to the effect of product margin movements since initial recognition.
For long-term debt and trust preferred securities, the difference between fair value and carrying value is due to the effect of changes in the rates at which the Group could issue debt with similar maturity and subordination at the balance sheet date compared to when the instrument was issued.
|
231
|
|
|
Deutsche Bank
|
Additional Notes
|
|
|
Annual Report 2021
|
|
|
|
|
|
15 –
Financial assets at fair value through other comprehensive income
|
in € m.
|
|
Dec 31, 2021
|
|
Dec 31, 2020
|
|
Securities purchased under resale agreement
|
|
|
|
|
|
Debt securities:
|
|
|
|
|
|
German government
|
|
|
|
|
|
U.S. Treasury and U.S. government agencies
|
|
|
|
|
|
U.S. local (municipal) governments
|
|
|
|
|
|
Other foreign governments
|
|
|
|
|
|
Corporates
|
|
|
|
|
|
Other asset-backed securities
|
|
|
|
|
|
Mortgage-backed securities, including obligations of U.S. federal agencies
|
|
|
|
|
|
Other debt securities
|
|
|
|
|
|
Total debt securities
|
|
|
|
|
|
Loans
|
|
|
|
|
|
Total financial assets at fair value through other comprehensive income
|
|
|
|
|
|
|
|
|
|
|
16 –
Equity Method Investments
Investments in associates and jointly controlled entities are accounted for using the equity method of accounting.
The Group holds interests in
59
(2020:
60
) associates and
10
(2020:
11
) jointly controlled entities. Two associates are considered to be material to the Group.
Significant investments as of December 31, 2021
1
|
Investment
|
|
Principal place of business
|
|
Nature of relationship
|
|
Ownership percentage
|
|
Huarong Rongde Asset Management Company Limited
|
|
|
|
|
|
|
|
Harvest Fund Management Co., Ltd.
|
|
|
|
|
|
|
|
|
|
|
|
|
|
|
1
The Group has significant influence over these investees through its holding percentage and representation on the board seats.
Summarized financial information on Huarong Rongde Asset Management Company Limited
1
|
in € m.
|
|
Dec 31, 2020
|
|
Dec 31, 2019
|
|
Total net revenues
|
|
|
|
|
|
Net income
|
|
|
|
|
|
Other comprehensive income
|
|
|
|
|
|
Total comprehensive income
2
|
|
|
|
|
|
|
|
|
|
|
|
in € m.
|
|
Dec 31, 2020
|
|
Dec 31, 2019
|
|
Current assets
|
|
|
|
|
|
Non-Current assets
|
|
|
|
|
|
Total assets
|
|
|
|
|
|
Current liabilities
|
|
|
|
|
|
Non-Current liabilities
|
|
|
|
|
|
Total liabilities
|
|
|
|
|
|
Noncontrolling Interest
|
|
|
|
(
|
|
Net assets of the equity method investee
|
|
|
|
|
|
|
|
|
|
|
1
Due to the difference in reporting timelines for the Group and Huarong Rongde Asset Management Company Limited Equity method accounting was performed for December 2021 based on December 2020 PRC GAAP audited financials and for December 2020 based on December 2019 PRC GAAP audited financials.
2
The Group received dividends from Huarong Rongde Asset Management Company Limited of
€
0
million
during the reporting period 2021 (2020:
€
9
million
).
Reconciliation of total net assets of Huarong Rongde Asset Management Company Limited to the Group’s carrying amount
1
|
in € m.
|
|
Dec 31, 2020
|
|
Dec 31, 2019
|
|
Net assets of the equity method investee
|
|
|
|
|
|
Group's ownership percentage on the investee's equity
|
|
|
|
|
|
Group's share of net assets
|
|
|
|
|
|
Goodwill
|
|
|
|
|
|
Intangible Assets
|
|
|
|
|
|
Other adjustments
|
|
(
|
|
(
|
|
Carrying amount
2
|
|
|
|
|
|
|
|
|
|
|
1
Due to the difference in reporting timelines for the Group and Huarong Rongde Asset Management Company Limited Equity method accounting was performed for December 2021 based on December 2020 PRC GAAP audited financials and for December 2020 based on December 2019 PRC GAAP audited financials.
2
There is impairment loss of
€
97
million
in 2021 (
€
0
million
in 2020). The loss was driven by impairment write downs from underperforming credit balances in the weaker Chinese real estate sector in 2021.
|
232
|
|
|
Deutsche Bank
|
Additional Notes
|
|
|
Annual Report 2021
|
|
|
|
|
|
Summarized financial information on Harvest Fund Management Co., Ltd.
|
in € m.
|
|
Dec 31, 2021¹
|
|
Dec 31, 2020²
|
|
Total net revenues
|
|
|
|
|
|
Net income
|
|
|
|
|
|
Other comprehensive income
|
|
(
|
|
(
|
|
Total comprehensive income
3
|
|
|
|
|
|
|
|
|
|
|
|
in € m.
|
|
Dec 31, 2021
|
|
Dec 31, 2020
|
|
Current assets
|
|
|
|
|
|
Non-Current assets
|
|
|
|
|
|
Total assets
|
|
|
|
|
|
Current liabilities
|
|
|
|
|
|
Non-Current liabilities
|
|
|
|
|
|
Total liabilities
|
|
|
|
|
|
Noncontrolling Interest
|
|
|
|
|
|
Net assets of the equity method investee
|
|
|
|
|
|
|
|
|
|
|
1
December 2021 numbers are based on 2021 unaudited financials
.
2
December 2020 numbers are based on 2020 audited financials.
3
The Group received dividends from Harvest Fund Management Co., Ltd. of
€
68
million
during the reporting period 2021 (2020:
€
21
million
) and in 2020 reported an extraordinary dividend receivable of
€
6
million
, received in 2021.
Reconciliation of total net assets of Harvest Fund Management Co., Ltd.to the Group’s carrying amount
|
in € m.
|
|
Dec 31, 2021¹
|
|
Dec 31, 2020²
|
|
Net assets of the equity method investee
|
|
|
|
|
|
Group's ownership percentage on the investee's equity
|
|
|
|
|
|
Group's share of net assets
|
|
|
|
|
|
Goodwill
|
|
|
|
|
|
Intangible Assets
|
|
|
|
|
|
Other adjustments
|
|
|
|
|
|
Carrying amount
3
|
|
|
|
|
|
|
|
|
|
|
1
December 2021 numbers are based on 2021 unaudited financials.
2
December 2020 numbers are based on 2020 audited financials.
3
There is no impairment loss in 2021 (
€
0
million
in 2020).
Aggregated financial information on the Group’s share in associates and joint ventures that are individually immaterial
|
in € m.
|
|
Dec 31, 2021
|
|
Dec 31, 2020
|
|
Carrying amount of all associates that are individually immaterial to the Group
|
|
|
|
|
|
Aggregated amount of the Group's share of profit (loss) from continuing operations
|
|
|
|
|
|
Aggregated amount of the Group's share of post-tax profit (loss) from discontinued operations
|
|
|
|
|
|
Aggregated amount of the Group's share of other comprehensive income
|
|
(
|
|
(
|
|
Aggregated amount of the Group's share of total comprehensive income
|
|
|
|
|
|
|
|
|
|
|
17 –
Offsetting Financial Assets and Financial Liabilities
The Group is eligible to present certain financial assets and financial liabilities on a net basis on the balance sheet pursuant to criteria described in Note 1 “Significant Accounting Policies and Critical Accounting Estimates: Offsetting Financial Instruments”.
The following tables provide information on the impact of offsetting on the consolidated balance sheet, as well as the financial impact of netting for instruments subject to an enforceable master netting arrangement or similar agreement as well as available cash and financial instrument collateral.
|
233
|
|
|
Deutsche Bank
|
Additional Notes
|
|
|
Annual Report 2021
|
|
|
|
|
|
Assets
|
|
|
Dec 31, 2021
|
||||||||||||
|
|
|
|
|
|
|
|
|
Amounts not set off on the balance sheet
|
|
|
||||
|
in € m.
|
|
Gross
amounts
of financial
assets
|
|
Gross
amounts
set off
on the
balance
sheet
|
|
Net
amounts
of financial
assets
presented
on the
balance
sheet
|
|
Impact of
Master
Netting
Agreements
|
|
Cash
collateral
|
|
Financial
instrument
collateral¹
|
|
Net amount
|
|
Central bank funds sold and securities purchased
under resale agreements (enforceable)
|
|
|
|
(
|
|
|
|
|
|
|
|
(
|
|
|
|
Central bank funds sold and securities purchased
under resale agreements (non-enforceable)
|
|
|
|
|
|
|
|
|
|
|
|
(
|
|
|
|
Securities borrowed (enforceable)
|
|
|
|
|
|
|
|
|
|
|
|
(
|
|
|
|
Securities borrowed (non-enforceable)
|
|
|
|
|
|
|
|
|
|
|
|
|
|
|
|
Financial assets at fair value through profit or loss (enforceable)
|
|
|
|
(
|
|
|
|
(
|
|
(
|
|
(
|
|
|
|
Of which: Positive market values from derivative financial instruments (enforceable)
|
|
|
|
(
|
|
|
|
(
|
|
(
|
|
(
|
|
|
|
Financial assets at fair value through profit or loss (non-enforceable)
|
|
|
|
|
|
|
|
|
|
(
|
|
(
|
|
|
|
Of which: Positive market values from derivative financial instruments (non-enforceable)
|
|
|
|
|
|
|
|
|
|
(
|
|
(
|
|
|
|
Total financial assets at fair value through profit
or loss
|
|
|
|
(
|
|
|
|
(
|
|
(
|
|
(
|
|
|
|
Loans at amortized cost
|
|
|
|
|
|
|
|
|
|
(
|
|
(
|
|
|
|
Other assets
|
|
|
|
(
|
|
|
|
(
|
|
(
|
|
(
|
|
|
|
Of which: Positive market values from derivatives qualifying for hedge accounting (enforceable)
|
|
|
|
(
|
|
|
|
(
|
|
(
|
|
(
|
|
|
|
Remaining assets subject to netting
|
|
|
|
|
|
|
|
|
|
|
|
|
|
|
|
Remaining assets not subject to netting
|
|
|
|
|
|
|
|
|
|
(
|
|
(
|
|
|
|
Total assets
|
|
|
|
(
|
|
|
|
(
|
|
(
|
|
(
|
|
|
|
|
|
|
|
|
|
|
|
|
|
|
|
|
|
|
1
Excludes real estate and other non-financial instrument collateral.
Liabilities
|
|
|
Dec 31, 2021
|
||||||||||||
|
|
|
|
|
|
|
|
|
Amounts not set off on the balance sheet
|
|
|
||||
|
in € m.
|
|
Gross
amounts
of financial
assets
|
|
Gross
amounts
set off
on the
balance
sheet
|
|
Net
amounts
of financial
assets
presented
on the
balance
sheet
|
|
Impact of
Master
Netting
Agreements
|
|
Cash
collateral
|
|
Financial
instrument
collateral¹
|
|
Net amount
|
|
Deposits
|
|
|
|
|
|
|
|
|
|
|
|
|
|
|
|
Central bank funds purchased and securities sold
under repurchase agreements (enforceable)
|
|
|
|
(
|
|
|
|
|
|
|
|
(
|
|
|
|
Central bank funds purchased and securities sold
under repurchase agreements (non-enforceable)
|
|
|
|
|
|
|
|
|
|
|
|
|
|
|
|
Securities loaned (enforceable)
|
|
|
|
|
|
|
|
|
|
|
|
(
|
|
|
|
Securities loaned (non-enforceable)
|
|
|
|
|
|
|
|
|
|
|
|
(
|
|
|
|
Financial liabilities at fair value through profit or loss (enforceable)
|
|
|
|
(
|
|
|
|
(
|
|
(
|
|
(
|
|
|
|
Of which: Negative market values from derivative financial instruments (enforceable)
|
|
|
|
(
|
|
|
|
(
|
|
(
|
|
(
|
|
|
|
Financial liabilities at fair value through profit or loss (non-enforceable)
|
|
|
|
|
|
|
|
|
|
(
|
|
(
|
|
|
|
Of which: Negative market values from derivative financial instruments (non-enforceable)
|
|
|
|
|
|
|
|
|
|
(
|
|
(
|
|
|
|
Total financial liabilities at fair value through profit
or loss
|
|
|
|
(
|
|
|
|
(
|
|
(
|
|
(
|
|
|
|
Other liabilities
|
|
|
|
(
|
|
|
|
(
|
|
(
|
|
(
|
|
|
|
Of which: Negative market values from derivatives qualifying for hedge accounting (enforceable)
|
|
|
|
(
|
|
|
|
(
|
|
(
|
|
(
|
|
|
|
Remaining liabilities not subject to netting
|
|
|
|
|
|
|
|
|
|
|
|
|
|
|
|
Total liabilities
|
|
|
|
(
|
|
|
|
(
|
|
(
|
|
(
|
|
|
|
|
|
|
|
|
|
|
|
|
|
|
|
|
|
|
Assets
|
|
|
Dec 31, 2020
|
||||||||||||
|
|
|
|
|
|
|
|
|
Amounts not set off on the balance sheet
|
|
|
||||
|
in € m.
|
|
Gross
amounts
of financial
assets
|
|
Gross
amounts
set off
on the
balance
sheet
|
|
Net
amounts
of financial
assets
presented
on the
balance
sheet
|
|
Impact of
Master
Netting
Agreements
|
|
Cash
collateral
|
|
Financial
instrument
collateral¹
|
|
Net amount
|
|
Central bank funds sold and securities purchased
under resale agreements (enforceable)
|
|
|
|
(
|
|
|
|
|
|
|
|
(
|
|
|
|
Central bank funds sold and securities purchased
under resale agreements (non-enforceable)
|
|
|
|
|
|
|
|
|
|
|
|
(
|
|
|
|
Securities borrowed (enforceable)
|
|
|
|
|
|
|
|
|
|
|
|
|
|
|
|
Securities borrowed (non-enforceable)
|
|
|
|
|
|
|
|
|
|
|
|
|
|
|
|
Financial assets at fair value through profit or loss (enforceable)
|
|
|
|
(
|
|
|
|
(
|
|
(
|
|
(
|
|
|
|
Of which: Positive market values from derivative financial instruments (enforceable)
|
|
|
|
(
|
|
|
|
(
|
|
(
|
|
(
|
|
|
|
Financial assets at fair value through profit or loss (non-enforceable)
|
|
|
|
|
|
|
|
|
|
(
|
|
(
|
|
|
|
Of which: Positive market values from derivative financial instruments (non-enforceable)
|
|
|
|
|
|
|
|
|
|
(
|
|
(
|
|
|
|
Total financial assets at fair value through profit
or loss
|
|
|
|
(
|
|
|
|
(
|
|
(
|
|
(
|
|
|
|
Loans at amortized cost
|
|
|
|
|
|
|
|
|
|
(
|
|
(
|
|
|
|
Other assets
|
|
|
|
(
|
|
|
|
(
|
|
(
|
|
(
|
|
|
|
Of which: Positive market values from derivatives qualifying for hedge accounting (enforceable)
|
|
|
|
(
|
|
|
|
(
|
|
(
|
|
(
|
|
|
|
Remaining assets subject to netting
|
|
|
|
|
|
|
|
|
|
|
|
|
|
|
|
Remaining assets not subject to netting
|
|
|
|
|
|
|
|
|
|
(
|
|
(
|
|
|
|
Total assets
|
|
|
|
(
|
|
|
|
(
|
|
(
|
|
(
|
|
|
|
|
|
|
|
|
|
|
|
|
|
|
|
|
|
|
1
Excludes real estate and other non-financial instrument collateral.
Liabilities
|
|
|
Dec 31, 2020
|
||||||||||||
|
|
|
|
|
|
|
|
|
Amounts not set off on the balance sheet
|
|
|
||||
|
in € m.
|
|
Gross
amounts
of financial
assets
|
|
Gross
amounts
set off
on the
balance
sheet
|
|
Net
amounts
of financial
assets
presented
on the
balance
sheet
|
|
Impact of
Master
Netting
Agreements
|
|
Cash
collateral
|
|
Financial
instrument
collateral¹
|
|
Net amount
|
|
Deposits
|
|
|
|
|
|
|
|
|
|
|
|
|
|
|
|
Central bank funds purchased and securities sold
under repurchase agreements (enforceable)
|
|
|
|
(
|
|
|
|
|
|
|
|
(
|
|
|
|
Central bank funds purchased and securities sold
under repurchase agreements (non-enforceable)
|
|
|
|
|
|
|
|
|
|
|
|
(
|
|
|
|
Securities loaned (enforceable)
|
|
|
|
|
|
|
|
|
|
|
|
(
|
|
|
|
Securities loaned (non-enforceable)
|
|
|
|
|
|
|
|
|
|
|
|
(
|
|
|
|
Financial liabilities at fair value through profit or loss (enforceable)
|
|
|
|
(
|
|
|
|
(
|
|
(
|
|
(
|
|
|
|
Of which: Negative market values from derivative financial instruments (enforceable)
|
|
|
|
(
|
|
|
|
(
|
|
(
|
|
(
|
|
|
|
Financial liabilities at fair value through profit or loss (non-enforceable)
|
|
|
|
|
|
|
|
|
|
(
|
|
(
|
|
|
|
Of which: Negative market values from derivative financial instruments (non-enforceable)
|
|
|
|
|
|
|
|
|
|
(
|
|
(
|
|
|
|
Total financial liabilities at fair value through profit
or loss
|
|
|
|
(
|
|
|
|
(
|
|
(
|
|
(
|
|
|
|
Other liabilities
|
|
|
|
(
|
|
|
|
(
|
|
(
|
|
(
|
|
|
|
Of which: Negative market values from derivatives qualifying for hedge accounting (enforceable)
|
|
|
|
(
|
|
|
|
(
|
|
(
|
|
(
|
|
|
|
Remaining liabilities not subject to netting
|
|
|
|
|
|
|
|
|
|
(
|
|
(
|
|
|
|
Total liabilities
|
|
|
|
(
|
|
|
|
(
|
|
(
|
|
(
|
|
|
|
|
|
|
|
|
|
|
|
|
|
|
|
|
|
|
For 2020, other assets included
€ 1.4 billion
positive market values for derivative financial instruments which have been reclassified into asset held for sale, associated with the Prime Finance platform being transferred to BNP Paribas, along with the corresponding impact of master netting agreements and collateralization. Due to the same reason, other liabilities included
€ 1.9 billion
negative market values for derivative financial instruments which have been reclassified into liabilities held for sale, along with the corresponding impact of master netting agreements and collateralization. For further information please refer to Note 24 Non-Current Assets and Disposal Groups Held for Sale” to the consolidated financial statements.
|
234
|
|
|
Deutsche Bank
|
Additional Notes
|
|
|
Annual Report 2021
|
|
|
|
|
|
The column ‘Gross amounts set off on the balance sheet’ discloses the amounts offset in accordance with all the criteria described in Note 1 “Significant Accounting Policies and Critical Accounting Estimates: Offsetting Financial Instruments”.
The column ‘Impact of Master Netting Agreements’ discloses the amounts that are subject to master netting agreements but were not offset because they did not meet the net settlement/simultaneous settlement criteria; or because the rights of set off are conditional upon the default of the counterparty only. The amounts presented for other assets and other liabilities include cash margin receivables and payables respectively.
The columns ‘Cash collateral’ and ‘Financial instrument collateral’ disclose the cash and financial instrument collateral amounts received or pledged in relation to the total amounts of assets and liabilities, including those that were not offset.
Non-enforceable master netting agreements or similar agreements refer to contracts executed in jurisdictions where the rights of set off may not be upheld under the local bankruptcy laws.
The cash collateral received against the positive market values of derivatives and the cash collateral pledged towards the negative mark-to-market values of derivatives are booked within the ‘Other liabilities’ and ‘Other assets’ balances respectively.
The Cash and Financial instrument collateral amounts disclosed reflect their fair values. The rights of set off relating to the cash and financial instrument collateral are conditional upon the default of the counterparty.
18 –
Loans
The entire loan book presented includes loans classified at amortized cost, loans at fair value through other comprehensive income and loans at fair value through profit and loss.
The below table gives an overview of our loan exposure by industry, and is based on the NACE code of the counterparty. NACE (Nomenclature des Activités Économiques dans la Communauté Européenne) is a standard European industry classification system.
Loans by industry classification
|
in € m.
|
|
Dec 31, 2021
|
|
Dec 31, 2020
|
|
Agriculture, forestry and fishing
|
|
|
|
|
|
Mining and quarrying
|
|
|
|
|
|
Manufacturing
|
|
|
|
|
|
Electricity, gas, steam and air conditioning supply
|
|
|
|
|
|
Water supply, sewerage, waste management and remediation activities
|
|
|
|
|
|
Construction
|
|
|
|
|
|
Wholesale and retail trade, repair of motor vehicles and motorcycles
|
|
|
|
|
|
Transport and storage
|
|
|
|
|
|
Accommodation and food service activities
|
|
|
|
|
|
Information and communication
|
|
|
|
|
|
Financial and insurance activities
|
|
|
|
|
|
Real estate activities
|
|
|
|
|
|
Professional, scientific and technical activities
|
|
|
|
|
|
Administrative and support service activities
|
|
|
|
|
|
Public administration and defense, compulsory social security
|
|
|
|
|
|
Education
|
|
|
|
|
|
Human health services and social work activities
|
|
|
|
|
|
Arts, entertainment and recreation
|
|
|
|
|
|
Other service activities
|
|
|
|
|
|
Activities of households as employers, undifferentiated goods- and services-producing activities of households for own use
|
|
|
|
|
|
Activities of extraterritorial organizations and bodies
|
|
|
|
|
|
Gross loans
|
|
|
|
|
|
(Deferred expense)/unearned income
|
|
|
|
|
|
Loans less (deferred expense)/unearned income
|
|
|
|
|
|
Less: Allowance for loan losses
|
|
|
|
|
|
Total loans
|
|
|
|
|
|
|
|
|
|
|
|
235
|
|
|
Deutsche Bank
|
Additional Notes
|
|
|
Annual Report 2021
|
|
|
|
|
|
19 –
Allowance for Credit Losses
The allowance for credit losses consists of allowance for financial assets at amortized cost, financial assets at fair value through OCI and off-balance sheet lending commitments and guarantee business.
|
236
|
|
|
Deutsche Bank
|
Additional Notes
|
|
|
Annual Report 2021
|
|
|
|
|
|
Development of allowance for credit losses for financial assets at amortized cost
|
|
|
Dec 31, 2021
|
||||||||
|
|
|
Allowance for Credit Losses³
|
||||||||
|
in €
|
|
Stage 1
|
|
Stage 2
|
|
Stage 3
|
|
Stage 3 POCI⁴
|
|
Total
|
|
Balance, beginning of year
|
|
544
|
|
648
|
|
3,614
|
|
139
|
|
4,946
|
|
Movements in financial assets including new business and credit extensions
|
|
(245)
|
|
85
|
|
615
|
|
26
|
|
480
|
|
Transfers due to changes in creditworthiness
|
|
138
|
|
(197)
|
|
58
|
|
N/M
|
|
0
|
|
Changes due to modifications that did not result in
derecognition
|
|
N/M
|
|
N/M
|
|
N/M
|
|
N/M
|
|
N/M
|
|
Changes in models
|
|
0
|
|
0
|
|
0
|
|
0
|
|
0
|
|
Financial assets that have been derecognized during the period²
|
|
0
|
|
0
|
|
(561)
|
|
(5)
|
|
(566)
|
|
Recovery of written off amounts
|
|
0
|
|
0
|
|
55
|
|
23
|
|
78
|
|
Foreign exchange and other changes
|
|
3
|
|
(4)
|
|
(41)
|
|
(0)
|
|
(43)
|
|
Balance, end of reporting period
|
|
440
|
|
532
|
|
3,740
|
|
182
|
|
4,895
|
|
Provision for Credit Losses excluding country risk¹
|
|
(107)
|
|
(112)
|
|
673
|
|
26
|
|
480
|
|
|
|
|
|
|
|
|
|
|
|
|
1
Movements in financial assets including new business, transfers due to changes in creditworthiness and changes in models add up to Provision for Credit Losses excluding country risk.
2
This position includes charge offs of allowance for credit losses.
3
Allowance for credit losses does not include allowance for country risk amounting to
€
4
million
as of December 31, 2021.
4
The total amount of undiscounted expected credit losses at initial recognition on financial assets that are purchased or originated credit-impaired initially recognized during the reporting period was
€
0
million
in 2021 and
€
50
million
in 2020.
Development of allowance for credit losses for financial assets at amortized cost
|
|
|
Dec 31, 2020
|
||||||||
|
|
|
Allowance for Credit Losses³
|
||||||||
|
in €
|
|
Stage 1
|
|
Stage 2
|
|
Stage 3
|
|
Stage 3 POCI⁴
|
|
Total
|
|
Balance, beginning of year
|
|
549
|
|
492
|
|
3,015
|
|
36
|
|
4,093
|
|
Movements in financial assets including new business and credit extensions
|
|
(44)
|
|
309
|
|
1,348
|
|
72
|
|
1,686
|
|
Transfers due to changes in creditworthiness
|
|
77
|
|
(125)
|
|
49
|
|
N/M
|
|
0
|
|
Changes due to modifications that did not result in
derecognition
|
|
N/M
|
|
N/M
|
|
N/M
|
|
N/M
|
|
N/M
|
|
Changes in models
|
|
0
|
|
0
|
|
0
|
|
0
|
|
0
|
|
Financial assets that have been derecognized during the period²
|
|
0
|
|
0
|
|
(781)
|
|
0
|
|
(781)
|
|
Recovery of written off amounts
|
|
0
|
|
0
|
|
58
|
|
0
|
|
58
|
|
Foreign exchange and other changes
|
|
(38)
|
|
(28)
|
|
(75)
|
|
31
|
|
(110)
|
|
Balance, end of reporting period
|
|
544
|
|
648
|
|
3,614
|
|
139
|
|
4,946
|
|
Provision for Credit Losses excluding country risk¹
|
|
33
|
|
184
|
|
1,397
|
|
72
|
|
1,686
|
|
|
|
|
|
|
|
|
|
|
|
|
1
Movements in financial assets including new business, transfers due to changes in creditworthiness and changes in models add up to Provision for Credit Losses excluding country risk.
2
This position includes charge offs of allowance for credit losses.
3
Allowance for credit losses does not include allowance for country risk amounting to
€
5
million
as of December 31, 2020.
4
The total amount of undiscounted expected credit losses at initial recognition on financial assets that are purchased or originated credit-impaired initially recognized during the reporting period was
€
50
million
in 2020 and
€ 0 million
in 2019.
Development of allowance for credit losses for financial assets at amortized cost
|
|
|
Dec 31, 2019
|
||||||||
|
|
|
Allowance for Credit Losses³
|
||||||||
|
in €
|
|
Stage 1
|
|
Stage 2
|
|
Stage 3
|
|
Stage 3 POCI⁴
|
|
Total
|
|
Balance, beginning of year
|
|
509
|
|
501
|
|
3,247
|
|
3
|
|
4,259
|
|
Movements in financial assets including new business and credit extensions
|
|
(57)
|
|
102
|
|
550
|
|
40
|
|
636
|
|
Transfers due to changes in creditworthiness
|
|
120
|
|
(106)
|
|
(14)
|
|
|
|
0
|
|
Changes due to modifications that did not result in
derecognition
|
|
N/M
|
|
N/M
|
|
N/M
|
|
N/M
|
|
N/M
|
|
Changes in models
|
|
0
|
|
0
|
|
0
|
|
0
|
|
0
|
|
Financial assets that have been derecognized during the period²
|
|
0
|
|
0
|
|
(872)
|
|
(26)
|
|
(898)
|
|
Recovery of written off amounts
|
|
0
|
|
0
|
|
96
|
|
0
|
|
96
|
|
Foreign exchange and other changes
|
|
(22)
|
|
(4)
|
|
8
|
|
18
|
|
0
|
|
Balance, end of reporting period
|
|
549
|
|
492
|
|
3,015
|
|
36
|
|
4,093
|
|
Provision for Credit Losses excluding country risk¹
|
|
62
|
|
(4)
|
|
536
|
|
40
|
|
636
|
|
|
|
|
|
|
|
|
|
|
|
|
1
Movements in financial assets including new business, transfers due to changes in creditworthiness and changes in models add up to Provision for Credit Losses excluding country risk.
2
This position includes charge offs of allowance for credit losses.
3
Allowance for credit losses does not include allowance for country risk amounting to
€
3
million
as of December 31, 2019.
4
The total amount of undiscounted expected credit losses at initial recognition on financial assets that are purchased or originated credit-impaired initially recognized during the reporting period was
€ 0 million
in 2019.
Allowance for credit losses for financial assets at fair value through OCI
1
|
|
|
Dec 31, 2021
|
||||||||
|
|
|
Allowance for Credit Losses
|
||||||||
|
in € m.
|
|
Stage 1
|
|
Stage 2
|
|
Stage 3
|
|
Stage 3 POCI
|
|
Total
|
|
Fair Value through OCI
|
|
15
|
|
10
|
|
16
|
|
0
|
|
41
|
|
|
|
|
|
|
|
|
|
|
|
|
1
Allowance for credit losses against financial assets at fair value through OCI remained at very low levels (
€
20
million
at December 31, 2020 and
€
41
million
as of December 31, 2021). Due to immateriality, we do not provide any details on the year-over-year development.
|
|
|
Dec 31, 2020
|
||||||||
|
|
|
Allowance for Credit Losses
|
||||||||
|
in € m.
|
|
Stage 1
|
|
Stage 2
|
|
Stage 3
|
|
Stage 3 POCI
|
|
Total
|
|
Fair Value through OCI
|
|
12
|
|
6
|
|
2
|
|
0
|
|
20
|
|
|
|
|
|
|
|
|
|
|
|
|
1
Allowance for credit losses against financial assets at fair value through OCI were almost unchanged at very low levels (
€ 35 million
at December 31, 2019 and
€
20
million
as of December 31, 2020). Due to immateriality, we do not provide any details on the year-over-year development.
|
|
|
Dec 31, 2019
|
||||||||
|
|
|
Allowance for Credit Losses
|
||||||||
|
in € m.
|
|
Stage 1
|
|
Stage 2
|
|
Stage 3
|
|
Stage 3 POCI
|
|
Total
|
|
Fair Value through OCI
|
|
16
|
|
9
|
|
10
|
|
0
|
|
35
|
|
|
|
|
|
|
|
|
|
|
|
|
1
Allowance for credit losses against financial assets at fair value through OCI were almost unchanged at very low levels (
€ 13 million
at the beginning of year
2019
and
€ 35 million
as of December 31, 2019, respectively). Due to immateriality, we do not provide any details on the year-over-year development.
Development of allowance for credit losses for off-balance sheet positions
|
|
|
Dec 31, 2021
|
||||||||
|
|
|
Allowance for Credit Losses
2
|
||||||||
|
in € m.
|
|
Stage 1
|
|
Stage 2
|
|
Stage 3
|
|
Stage 3 POCI
|
|
Total
|
|
Balance, beginning of year
|
|
|
|
|
|
|
|
0
|
|
|
|
Movements including new business
|
|
(
|
|
|
|
|
|
0
|
|
|
|
Transfers due to changes in creditworthiness
|
|
|
|
(
|
|
|
|
0
|
|
|
|
Changes in models
|
|
|
|
|
|
|
|
|
|
|
|
Foreign exchange and other changes
|
|
|
|
|
|
|
|
0
|
|
|
|
Balance, end of reporting period
|
|
|
|
|
|
|
|
0
|
|
|
|
of which: Financial guarantees
|
|
|
|
|
|
|
|
0
|
|
|
|
Provision for Credit Losses excluding country risk
1
|
|
(
|
|
|
|
|
|
0
|
|
|
|
|
|
|
|
|
|
|
|
|
|
|
1
The above table breaks down the impact on provision for credit losses from movements in financial assets including new business, transfers due to changes in creditworthiness and changes in models.
2
Allowance for credit losses does not include allowance for country risk amounting to
€
6
million
as of December 31, 2021.
Development of allowance for credit losses for off-balance sheet positions
|
|
|
Dec 31, 2020
|
||||||||
|
|
|
Allowance for Credit Losses
2
|
||||||||
|
in € m.
|
|
Stage 1
|
|
Stage 2
|
|
Stage 3
|
|
Stage 3 POCI
|
|
Total
|
|
Balance, beginning of year
|
|
|
|
|
|
|
|
|
|
|
|
Movements including new business
|
|
|
|
|
|
|
|
|
|
|
|
Transfers due to changes in creditworthiness
|
|
|
|
|
|
(
|
|
|
|
|
|
Changes in models
|
|
|
|
|
|
|
|
|
|
|
|
Foreign exchange and other changes
|
|
|
|
|
|
(
|
|
|
|
|
|
Balance, end of reporting period
|
|
|
|
|
|
|
|
|
|
|
|
of which: Financial guarantees
|
|
|
|
|
|
|
|
|
|
|
|
Provision for Credit Losses excluding country risk
1
|
|
|
|
|
|
|
|
|
|
|
|
|
|
|
|
|
|
|
|
|
|
|
1
The above table breaks down the impact on provision for credit losses from movements in financial assets including new business, transfers due to changes in creditworthiness and changes in models.
2
Allowance for credit losses does not include allowance for country risk amounting to
€
4
million
as of December 31, 2020.
Development of allowance for credit losses for off-balance sheet positions
|
|
|
Dec 31, 2019
|
||||||||
|
|
|
Allowance for Credit Losses
2
|
||||||||
|
in € m.
|
|
Stage 1
|
|
Stage 2
|
|
Stage 3
|
|
Stage 3 POCI
|
|
Total
|
|
Balance, beginning of year
|
|
132
|
|
73
|
|
84
|
|
0
|
|
289
|
|
Movements including new business
|
|
(13)
|
|
(5)
|
|
88
|
|
0
|
|
70
|
|
Transfers due to changes in creditworthiness
|
|
9
|
|
(12)
|
|
3
|
|
0
|
|
0
|
|
Changes in models
|
|
0
|
|
0
|
|
0
|
|
0
|
|
0
|
|
Foreign exchange and other changes
|
|
(1)
|
|
(7)
|
|
(9)
|
|
0
|
|
(17)
|
|
Balance, end of reporting period
|
|
128
|
|
48
|
|
166
|
|
0
|
|
342
|
|
of which: Financial guarantees
|
|
89
|
|
30
|
|
143
|
|
0
|
|
262
|
|
Provision for Credit Losses excluding country risk
1
|
|
(4)
|
|
(17)
|
|
90
|
|
0
|
|
70
|
|
|
|
|
|
|
|
|
|
|
|
|
1
The above table breaks down the impact on provision for credit losses from movements in financial assets including new business, transfers due to changes in creditworthiness and changes in models.
2
Allowance for credit losses does not include allowance for country risk amounting to
€
4
million
as of December 31, 2019
.
|
237
|
|
|
Deutsche Bank
|
Additional Notes
|
|
|
Annual Report 2021
|
|
|
|
|
|
20 –
Transfer of Financial Assets, Assets Pledged and Received as Collateral
The Group enters into transactions in which it transfers financial assets held on the balance sheet and as a result may either be eligible to derecognize the transferred asset in its entirety or must continue to recognize the transferred asset to the extent of any continuing involvement, depending on certain criteria. These criteria are discussed in Note 1 “Significant Accounting Policies and Critical Accounting Estimates”.
Where financial assets are not eligible to be derecognized, the transfers are viewed as secured financing transactions, with any consideration received resulting in a corresponding liability. The Group is not entitled to use these financial assets for any other purposes. The most common transactions of this nature entered into by the Group are repurchase agreements, securities lending agreements and total return swaps, in which the Group retains substantially all of the associated credit, equity price, interest rate and foreign exchange risks and rewards associated with the assets as well as the associated income streams.
Information on asset types and associated transactions that did not qualify for derecognition
|
in € m.
|
|
Dec 31, 2021
|
|
Dec 31, 2020
|
|
Carrying amount of transferred assets
|
|
|
|
|
|
Trading securities not derecognized due to the following transactions:
|
|
|
|
|
|
Repurchase agreements
|
|
|
|
|
|
Securities lending agreements
|
|
|
|
|
|
Total return swaps
|
|
|
|
|
|
Other
|
|
|
|
|
|
Total trading securities
|
|
|
|
|
|
Other trading assets
|
|
|
|
|
|
Non-trading financial assets mandatory at fair value through profit or loss
|
|
|
|
|
|
Financial assets at fair value through other comprehensive income
|
|
|
|
|
|
Loans at amortized cost
1
|
|
|
|
|
|
Others
|
|
|
|
|
|
Total
|
|
|
|
|
|
Carrying amount of associated liabilities
|
|
|
|
|
|
|
|
|
|
|
¹
Loans where the associated liability is recourse only to the transferred assets had NIL carrying value and fair value as at December 31, 2021 and December 31, 2020. The associated liabilities had the same carrying value and fair value which resulted in a net position of
0
.
2
Prior year numbers have been restated following the reassessment of one trade.
Carrying value of assets transferred in which the Group still accounts for the asset to the extent of its continuing involvement
|
in € m.
|
|
Dec 31, 2021
|
|
Dec 31, 2020
|
|
Carrying amount of the original assets transferred
|
|
|
|
|
|
Trading securities
|
|
|
|
|
|
Financial assets designated at fair value through profit or loss
|
|
|
|
|
|
Non-trading financial assets mandatory at fair value through profit or loss
|
|
|
|
|
|
Carrying amount of the assets continued to be recognized
|
|
|
|
|
|
Trading securities
|
|
|
|
|
|
Financial assets designated at fair value through profit or loss
|
|
|
|
|
|
Non-trading financial assets mandatory at fair value through profit or loss
|
|
|
|
|
|
Carrying amount of associated liabilities
|
|
|
|
|
|
|
|
|
|
|
¹
Prior year numbers have been restated following the reassessment of one trade
.
The Group could retain some exposure to the future performance of a transferred asset either through new or existing contractual rights and obligations and still be eligible to derecognize the asset. This ongoing involvement will be recognized as a new instrument which may be different from the original financial asset that was transferred. Typical transactions include retaining senior notes of non-consolidated securitizations to which originated loans have been transferred; financing arrangements with structured entities to which the Group has sold a portfolio of assets; or sales of assets with credit-contingent swaps. The Group’s exposure to such transactions is not considered to be significant as any substantial retention of risks associated with the transferred asset will commonly result in an initial failure to derecognize. Transactions not considered to result in an ongoing involvement include normal warranties on fraudulent activities that could invalidate a transfer in the event of legal action, qualifying pass-through arrangements and standard trustee or administrative fees that are not linked to performance.
|
238
|
|
|
Deutsche Bank
|
Additional Notes
|
|
|
Annual Report 2021
|
|
|
|
|
|
The impact on the Group’s Balance Sheet of on-going involvement associated with transferred assets derecognized in full
|
|
|
Dec 31,2021
|
|
Dec 31,2020
|
||||||||
|
in € m.
|
|
Carrying
value
|
|
Fair value
|
|
Maximum
Exposure
to Loss¹
|
|
Carrying
value
|
|
Fair value
|
|
Maximum
Exposure
to Loss¹
|
|
Loans at amortized cost
|
|
|
|
|
|
|
|
|
|
|
|
|
|
Securitization notes
|
|
|
|
|
|
|
|
|
|
|
|
|
|
Other
|
|
|
|
|
|
|
|
|
|
|
|
|
|
Total loans at amortized cost
|
|
|
|
|
|
|
|
|
|
|
|
|
|
Financial assets held at fair value through profit or loss
|
|
|
|
|
|
|
|
|
|
|
|
|
|
Securitization notes
|
|
|
|
|
|
|
|
|
|
|
|
|
|
Non-standard Interest Rate, cross-currency or inflation-linked swap
|
|
|
|
|
|
|
|
|
|
|
|
|
|
Total financial assets held at fair value through profit or loss
|
|
|
|
|
|
|
|
|
|
|
|
|
|
Financial assets at fair value through other comprehensive income:
|
|
|
|
|
|
|
|
|
|
|
|
|
|
Securitization notes
|
|
|
|
|
|
|
|
|
|
|
|
|
|
Other
|
|
|
|
|
|
|
|
|
|
|
|
|
|
Total financial assets at fair value through other comprehensive income
|
|
|
|
|
|
|
|
|
|
|
|
|
|
Total financial assets representing on-going involvement
|
|
|
|
|
|
|
|
|
|
|
|
|
|
Financial liabilities held at fair value through profit or loss
|
|
|
|
|
|
|
|
|
|
|
|
|
|
Non-standard Interest Rate, cross-currency or inflation-linked swap
|
|
|
|
|
|
|
|
|
|
|
|
|
|
Total financial liabilities representing on-going involvement
|
|
|
|
|
|
|
|
|
|
|
|
|
|
|
|
|
|
|
|
|
|
|
|
|
|
|
1
The maximum exposure to loss is defined as the carrying value plus the notional value of any undrawn loan commitments not recognized as liabilities.
The impact on the Group’s Statement of Income of on-going involvement associated with transferred assets derecognized in full
|
|
|
Dec 31,2021
|
|
Dec 31,2020
|
||||||||
|
in € m.
|
|
Year-to-
date PL
|
|
Cumulative
PL
|
|
Gain/(loss)
on disposal
|
|
Year-to-
date PL
|
|
Cumulative
PL
|
|
Gain/(loss)
on disposal
|
|
Securitization notes
|
|
|
|
|
|
|
|
|
|
|
|
|
|
Non-standard Interest Rate, cross-currency or
inflation-linked swap
|
|
|
|
|
|
|
|
(
|
|
(
|
|
|
|
Net gains/(losses) recognized from on-going
involvement in derecognized assets
|
|
|
|
|
|
|
|
|
|
|
|
|
|
|
|
|
|
|
|
|
|
|
|
|
|
|
The Group pledges assets primarily as collateral against secured funding and for repurchase agreements, securities borrowing agreements as well as other borrowing arrangements and for margining purposes on OTC derivative liabilities. Pledges are generally conducted under terms that are usual and customary for standard securitized borrowing contracts and other transactions described.
Carrying value of the Group’s assets pledged as collateral for liabilities or contingent liabilities
1
|
in € m.
|
|
Dec 31, 2021
|
|
Dec 31, 2020
|
|
Financial assets at fair value through profit or loss
|
|
|
|
|
|
Financial assets at fair value through other comprehensive income
|
|
|
|
|
|
Loans
|
|
|
|
|
|
Other
|
|
|
|
|
|
Total
|
|
|
|
|
|
|
|
|
|
|
1
Excludes assets pledged as collateral from transactions that do not result in liabilities or contingent liabilities.
Total assets pledged to creditors available for sale or repledge
1
|
in € m.
|
|
Dec 31, 2021
|
|
Dec 31, 2020
|
|
Financial assets at fair value through profit or loss
|
|
|
|
|
|
Financial assets at fair value through other comprehensive income
|
|
|
|
|
|
Loans
|
|
|
|
|
|
Other
|
|
|
|
|
|
Total
|
|
|
|
|
|
|
|
|
|
|
1
Includes assets pledged as collateral from transactions that do not result in liabilities or contingent liabilities.
The Group receives collateral primarily in reverse repurchase agreements, securities lending agreements, derivatives transactions, customer margin loans and other transactions. These transactions are generally conducted under terms that are usual and customary for standard secured lending activities and the other transactions described. The Group, as the secured party, has the right to sell or re-pledge such collateral, subject to the Group returning equivalent securities upon completion of the transaction. This right is used primarily to cover short sales, securities loaned and securities sold under repurchase agreements.
Fair Value of collateral received
|
in € m.
|
|
Dec 31, 2021
|
|
Dec 31, 2020
|
|
Securities and other financial assets accepted as collateral
|
|
|
|
|
|
Of which:
|
|
|
|
|
|
Collateral sold or repledged
|
|
|
|
|
|
|
|
|
|
|
|
239
|
|
|
Deutsche Bank
|
Additional Notes
|
|
|
Annual Report 2021
|
|
|
|
|
|
21 –
Property and Equipment
|
in € m.
|
|
Owner occupied properties
|
|
Furniture and equipment
|
|
Leasehold improvements
|
|
Construction-in-progress
|
|
Property and equipment owned (IAS 16)
|
|
Right-of-use for leased assets (IFRS 16)
|
|
Total
|
|
Cost of acquisition:
|
|
|
|
|
|
|
|
|
|
|
|
|
|
|
|
Balance as of January 1, 2020
|
|
|
|
|
|
|
|
|
|
|
|
|
|
|
|
Changes in the group of consolidated companies
|
|
|
|
(
|
|
|
|
|
|
(
|
|
(
|
|
(
|
|
Additions
|
|
|
|
|
|
|
|
|
|
|
|
|
|
|
|
Transfers
|
|
|
|
|
|
|
|
(
|
|
|
|
(
|
|
(
|
|
Reclassifications (to)/from “held for sale”
|
|
(
|
|
(
|
|
|
|
(
|
|
(
|
|
(
|
|
(
|
|
Disposals
|
|
|
|
|
|
|
|
|
|
|
|
|
|
|
|
Exchange rate changes
|
|
(
|
|
(
|
|
(
|
|
(
|
|
(
|
|
(
|
|
(
|
|
Balance as of December 31, 2020
|
|
|
|
|
|
|
|
|
|
|
|
|
|
|
|
Changes in the group of consolidated companies
|
|
(
|
|
|
|
|
|
|
|
(
|
|
|
|
(
|
|
Additions
|
|
|
|
|
|
|
|
|
|
|
|
|
|
|
|
Transfers
|
|
|
|
(
|
|
|
|
(
|
|
|
|
|
|
|
|
Reclassifications (to)/from “held for sale”
|
|
(
|
|
(
|
|
(
|
|
(
|
|
(
|
|
|
|
(
|
|
Disposals
|
|
|
|
|
|
|
|
|
|
|
|
|
|
|
|
Exchange rate changes
|
|
|
|
|
|
|
|
|
|
|
|
|
|
|
|
Balance as of December 31, 2021
|
|
|
|
|
|
|
|
|
|
|
|
|
|
|
|
Accumulated depreciation and impairment:
|
|
|
|
|
|
|
|
|
|
|
|
|
|
|
|
Balance as of January 1, 2020
|
|
|
|
|
|
|
|
|
|
|
|
|
|
|
|
Changes in the group of consolidated companies
|
|
|
|
(
|
|
|
|
|
|
(
|
|
|
|
(
|
|
Depreciation
|
|
|
|
|
|
|
|
|
|
|
|
|
|
|
|
Impairment losses
|
|
|
|
|
|
|
|
|
|
|
|
|
|
|
|
Reversals of impairment losses
|
|
|
|
|
|
|
|
|
|
|
|
|
|
|
|
Transfers
|
|
|
|
|
|
|
|
|
|
|
|
|
|
|
|
Reclassifications (to)/from “held for sale”
|
|
(
|
|
(
|
|
|
|
|
|
(
|
|
|
|
(
|
|
Disposals
|
|
|
|
|
|
|
|
|
|
|
|
|
|
|
|
Exchange rate changes
|
|
(
|
|
(
|
|
(
|
|
|
|
(
|
|
(
|
|
(
|
|
Balance as of December 31, 2020
|
|
|
|
|
|
|
|
|
|
|
|
|
|
|
|
Changes in the group of consolidated companies
|
|
(
|
|
|
|
|
|
|
|
(
|
|
|
|
(
|
|
Depreciation
|
|
|
|
|
|
|
|
|
|
|
|
|
|
|
|
Impairment losses
|
|
|
|
|
|
|
|
|
|
|
|
|
|
|
|
Reversals of impairment losses
|
|
|
|
|
|
|
|
|
|
|
|
|
|
|
|
Transfers
|
|
|
|
|
|
|
|
|
|
|
|
|
|
|
|
Reclassifications (to)/from “held for sale”
|
|
(
|
|
(
|
|
(
|
|
|
|
(
|
|
|
|
(
|
|
Disposals
|
|
|
|
|
|
|
|
|
|
|
|
|
|
|
|
Exchange rate changes
|
|
|
|
|
|
|
|
|
|
|
|
|
|
|
|
Balance as of December 31, 2021
|
|
|
|
|
|
|
|
|
|
|
|
|
|
|
|
|
|
|
|
|
|
|
|
|
|
|
|
|
|
|
|
Carrying amount:
|
|
|
|
|
|
|
|
|
|
|
|
|
|
|
|
Balance as of December 31, 2020
|
|
|
|
|
|
|
|
|
|
|
|
|
|
|
|
Balance as of December 31, 2021
|
|
|
|
|
|
|
|
|
|
|
|
|
|
|
|
|
|
|
|
|
|
|
|
|
|
|
|
|
|
|
Depreciation expenses, impairment losses and reversal of impairment losses on property and equipment are recorded within general and administrative expenses for the income statement.
The carrying value of items of property and equipment on which there is a restriction on sale was
€
22
million
and
€
23
million
as of December 31, 2021 and December 31, 2020, respectively.
|
240
|
|
|
Deutsche Bank
|
Additional Notes
|
|
|
Annual Report 2021
|
|
|
|
|
|
Commitments for the acquisition of property and equipment were
€
35
million
at year-end 2021 and
€
27
million
at year-end 2020.
The Group leases many assets including land and buildings, vehicles and IT equipment for which it records right-of-use assets. During 2021, additions to right-of-use assets amounted to
€
254
million
and largely reflected new real estate leases. Depreciation charges of
€
631
million
recognized in 2021 mainly resulted from planned consumption of right-of-use assets for property leases over their contractual terms. The carrying amount of right-of-use assets of
€
3.5
billion
included in Total Property and equipment as of December 31, 2021 predominantly represented leased properties of
€
3.5
billion
and vehicle leases of
€
11
million
. For more information on the Group´s leased properties and related disclosures required under IFRS 16, please refer to Note 22 “Leases”.
22 –
Leases
The Group’s disclosures are as a lessee under lease arrangements covering property and equipment. The Group has applied judgement in presenting related information pursuant to IFRS 16 in a manner that it considers to be most relevant to an understanding of its financial performance and position.
The Group leases many assets including land and buildings, vehicles and IT equipment. The Group is a lessee for the majority of its offices and branches under long-term rental agreements. Most of the lease contracts are made under usual terms and conditions, which means they include options to extend the lease by a defined amount of time, price adjustment clauses and escalation clauses in line with general office rental market conditions. However, the lease agreements do not include any clauses that impose any restriction on the Group’s ability to pay dividends, engage in debt financing transactions or enter into further lease agreements.
As of December 31, 2021 (December 31, 2020), the Group recorded right-of-use assets on its balance sheet with a carrying amount of
€
3.5
billion
(
€
3.5
billion
), which are included in Property and equipment. The right-of-use assets predominantly represented leased properties of
€
3.5
billion
(
€
3.5
billion
) and vehicle leases of
€
11
million
(
€
12
million
). For more information on the year-to-date development of right-of-use assets, please refer to Note 21 “Property and Equipment”.
Corresponding to the recognition of the right-of-use assets, as of December 31, 2021 (December 31, 2020), the Group recorded lease liabilities on its balance sheet with a carrying amount of
€
4.0
billion
(
€
4.0
billion
), which are included in Other liabilities.
As of December 31, 2021, the lease liabilities included the discounted value of future lease payments of
€
495
million
for the Group headquarters in Frankfurt am Main that was sold and leased back on December 1, 2011. The contract was extended in the fourth quarter 2021 with a fixed term until the end of 2036 and includes two options to extend the lease for two additional 5-year periods up to the end of 2046.
During 2021 and 2020, interest expenses recorded from the compounding of the lease liabilities amounted to
€
86
million
and
€
79
million
, respectively. The contractual maturities for the undiscounted cash flows from these liabilities are shown in Note 31 “Maturity Analysis of the earliest contractual undiscounted cash flows of Financial Liabilities”.
Expenses recognized in 2021 (2020) relating to short-term leases and leases of low-value assets, for which the Group decided to apply the recognition exemption under IFRS 16 (and thus not to record right-of-use assets and corresponding lease liabilities on the balance sheet), amounted to
€
2
million
(
€
7
million
) and
€
0
million
(
€
2
million
), respectively.
Income recorded in 2021 (2020) from the subletting of right-of-use assets totaled
€
34
million
(
€
24
million
).
The total cash outflow for leases for 2021 (2020) was
€
767
million
(
€
729
million
) and represented mainly expenditures made for real estate rentals over
€
754
million
(
€
708
million
). Of the total cash outflow amount, payments of
€
679
million
(
€
653
million
) were made for the principal portion of lease liabilities, payments of
€
87
million
(
€
77
million
) were made for the interest portion.
Total future cash outflows to which the Group as a lessee is potentially exposed, that are not reflected in the measurement of the lease liabilities, mainly include potential payment exposures arising from extension options (2021:
€
5.3
billion
) and future payments for leases not yet commenced, but to which the Group is committed (2021:
€
1.1
billion
). Their expected maturities are shown in the table below.
|
241
|
|
|
Deutsche Bank
|
Additional Notes
|
|
|
Annual Report 2021
|
|
|
|
|
|
Future cash outflows to which the Group is potentially exposed that are not reflected in the measurement of lease liabilities
|
in € m.
|
|
Dec 31, 2021
|
|
Dec 31, 2020
|
|
Future cash outflows not reflected in lease liabilities:
|
|
|
|
|
|
Not later than one year
|
|
|
|
|
|
Later than one year and not later than five years
|
|
|
|
|
|
Later than five years
|
|
|
|
|
|
Future cash outflows not reflected in lease liabilities
|
|
|
|
|
|
|
|
|
|
|
23 –
Goodwill and Other Intangible Assets
Goodwill
Changes in Goodwill
The changes in the carrying amount of goodwill, as well as gross amounts and accumulated impairment losses of goodwill, for the years ended December 31, 2021, and December 31, 2020, are shown below by cash-generating units (“CGU”).
The Group’s business operations are organized under the following divisional structure: the Core Bank, which includes the Corporate Bank (“CB”), Investment Bank (“IB”), Private Bank (“PB”) and Asset Management (“AM”) corporate divisions and the Capital Release Unit (“CRU”). The CB, IB, PB and the AM corporate divisions as well as the CRU each are considered cash-generating units (CGUs).
Please also refer to Note 4 “Business Segments and Related Information” for more information regarding changes in the presentation of segment disclosures.
Goodwill allocated to cash-generating units
|
in € m.
|
|
Investment Bank
|
|
Corporate Bank
|
|
Asset
Manage-
ment
|
|
Private Bank
|
|
Total
|
|
Balance as of January 1, 2020
|
|
|
|
|
|
|
|
|
|
|
|
Goodwill acquired during the year
|
|
|
|
|
|
|
|
|
|
|
|
Purchase accounting adjustments
|
|
|
|
|
|
|
|
|
|
|
|
Transfers
|
|
|
|
|
|
|
|
|
|
|
|
Reclassification from (to) “held for sale”
|
|
|
|
|
|
|
|
|
|
|
|
Goodwill related to dispositions without being classified as “held for sale”
|
|
|
|
|
|
|
|
|
|
|
|
Impairment losses
1
|
|
|
|
|
|
|
|
|
|
|
|
Exchange rate changes/other
|
|
|
|
|
|
(
|
|
|
|
(
|
|
Balance as of December 31, 2020
|
|
|
|
|
|
|
|
|
|
|
|
Gross amount of goodwill
|
|
|
|
|
|
|
|
|
|
|
|
Accumulated impairment losses
|
|
(
|
|
(
|
|
(
|
|
(
|
|
(
|
|
Balance as of January 1, 2021
|
|
|
|
|
|
|
|
|
|
|
|
Goodwill acquired during the year
|
|
|
|
|
|
|
|
|
|
|
|
Purchase accounting adjustments
|
|
|
|
|
|
|
|
|
|
|
|
Transfers
|
|
|
|
|
|
|
|
|
|
|
|
Reclassification from (to) “held for sale”
|
|
|
|
|
|
(
|
|
|
|
(
|
|
Goodwill related to dispositions without being classified as “held for sale”
|
|
|
|
|
|
|
|
|
|
|
|
Impairment losses
1
|
|
|
|
(
|
|
|
|
|
|
(
|
|
Exchange rate changes/other
|
|
|
|
|
|
|
|
|
|
|
|
Balance as of December 31, 2021
|
|
|
|
|
|
|
|
|
|
|
|
Gross amount of goodwill
|
|
|
|
|
|
|
|
|
|
|
|
Accumulated impairment losses
|
|
(
|
|
(
|
|
(
|
|
(
|
|
(
|
|
|
|
|
|
|
|
|
|
|
|
|
1
Impairment losses of goodwill are recorded as impairment of goodwill and other intangible assets in the income statement.
Changes in goodwill in 2021 mainly included the reclassification of
€ 56 million
of AM goodwill to assets held for sale, following the designated sale of DWS’ digital investment platform to a joint venture with BlackFin (see Note 24). Following the acquisition of a payment service provider (Better Payment Germany GmbH) in September 2021 (see Note 3), as part of the purchase price allocation the Group had initially recorded goodwill of
€ 5 million
assigned to the CB CGU. Given the specific valuation of the CB CGU with a continued shortfall of its recoverable amount versus its carrying amount, the newly acquired goodwill was considered impaired and fully written off in 2021.
Changes in goodwill in 2020 solely related to foreign exchange rate movements of AM goodwill held in non-Group currencies.
|
242
|
|
|
Deutsche Bank
|
Additional Notes
|
|
|
Annual Report 2021
|
|
|
|
|
|
Changes in goodwill in 2019 were mainly driven by the transformational measures relating to the Group’s businesses and its reorganization. Triggered by the impact of a lowered outlook on business plans driven both by adjustments to macro-economic factors as well as by the impact of strategic decisions in preparation of the transformation announcement, in the second quarter 2019 the Group reviewed the recoverable amounts of its CGUs in the then existing structure. This review resulted in a short-fall of the recoverable amounts against the then existing respective CGUs carrying amounts for WM within the former Private Commercial Bank (“PCB”) corporate division and GTB CF within the former Corporate Investment Bank (“CIB”) corporate division.
With a recoverable amount of approximately
€
1.9
billion
for WM, goodwill in former CGU WM (
€
545
million
) was impaired and had to be fully written-off, mainly as a result of worsening macro-economic assumptions, including interest rate curves, as well as industry-specific market growth corrections for the WM business globally. For former CGU GTB CF, the recoverable amount of approximately
€
10.2
billion
led to the full impairment of allocated goodwill (
€
491
million
). This was mainly driven by adverse industry trends in Corporate Finance as well as by adjustments to macro-economic assumptions, including interest rate curves. The total impairment charges of
€
1.0
billion
were recorded in Impairment of goodwill and other intangible assets of the respective Private Bank (here: WM CGU;
€
545
million
) and Corporate Bank (
€
491
million
) segment results of the second quarter of 2019.
Goodwill Impairment Test
For the purposes of impairment testing, goodwill acquired in a business combination is allocated to CGUs. On the basis as described in Note 1 “Significant Accounting Policies and Critical Accounting Estimates”, the Group’s primary CGUs are as outlined above. Goodwill is tested for impairment annually in the fourth quarter by comparing the recoverable amount of each goodwill-carrying CGU with its carrying amount. In addition, in accordance with IAS 36, the Group tests goodwill whenever a triggering event is identified. The recoverable amount is the higher of a CGU’s fair value less costs of disposal and its value in use.
Following the aforementioned write-off of goodwill in the former GTB CF CGUs in the second quarter 2019 and the derecognition of ring-fenced goodwill included in the disposal of a nonintegrated subsidiary recorded in the third quarter 2019, the AM CGU was the only goodwill carrying CGU to be tested for annual impairment in 2019, 2020 and 2021. The annual goodwill impairment tests conducted in these periods did not result in an impairment loss on the Group’s primary goodwill-carrying CGU as the recoverable amounts of the AM CGU were higher than the respective carrying amounts.
A review of the Group’s strategy or certain political or global risks for the banking industry, uncertainties regarding the implementation of already adopted regulation and the introduction of legislation that is already under discussion could result in an impairment of goodwill in the future.
Carrying Amount
The carrying amount of a primary CGU is derived using a capital allocation model based on the Shareholders’ Equity Allocation Framework of the Group (please refer to Note 4, “Business Segments and Related Information” for more details). The allocation uses the Group’s total equity at the date of valuation, including Additional Tier 1 Notes (“AT1 Notes”), which constitute unsecured and subordinated notes of Deutsche Bank and which are classified as Additional equity components in accordance with IFRS. Total equity is adjusted for an add-on adjustment for goodwill attributable to noncontrolling interests.
Recoverable Amount
The Group determines the recoverable amounts of its primary CGUs on the basis of the higher of value in use and fair value less costs of disposal (Level 3 of the fair value hierarchy). It employs a discounted cash flow (DCF) model, which reflects the specifics of the banking business and its regulatory environment. The model calculates the present value of the estimated future earnings that are distributable to shareholders after fulfilling the respective regulatory capital requirements. The recoverable amounts also include the fair value of the AT1 Notes, allocated to the primary CGUs consistent to their treatment in the carrying amount.
The DCF model uses earnings projections and respective capitalization assumptions based on five-year financial plans as well as longer term expectations on the impact of regulatory developments, which are discounted to their present value. Estimating future earnings and capital requirements involves judgment and the consideration of past and current performances as well as expected developments in the respective markets, and in the overall macroeconomic and regulatory environments. Earnings projections beyond the initial five-year period are, where applicable, adjusted to derive a sustainable level. In case of a going concern, the cash flow to equity is assumed to increase by or converge towards a constant long-term growth rate for the AM CGU of up to
2.7
%
(2020: up to
3.1
%
). This is based on projected revenue forecasts of the CGU as well as expectations for the development of gross domestic product and inflation and is captured in the terminal value.
|
243
|
|
|
Deutsche Bank
|
Additional Notes
|
|
|
Annual Report 2021
|
|
|
|
|
|
Key Assumptions and Sensitivities
Key Assumptions:
The DCF value of a CGU is sensitive to the earnings projections, to the discount rate (cost of equity) applied and, to a lesser extent, to the long-term growth rate. The discount rates applied have been determined based on the capital asset pricing model and comprise a risk-free interest rate, a market risk premium and a factor covering the systematic market risk (beta factor). The values for the risk-free interest rate, the market risk premium and the beta factors are determined using external sources of information. CGU-specific beta factors are determined based on a respective group of peer companies. Variations in all of these components might impact the discount rates. For the AM CGU, the discount rates (after tax) applied for 2021 and 2020 were
9.1
%
and
9.8
%
, respectively.
Management determined the values for the key assumptions in the following table based on a combination of internal and external analysis. Estimates for efficiency and the cost reduction program are based on progress made to date and scheduled future projects and initiatives.
|
Primary goodwill-
carrying cash-generating unit
|
Description of key assumptions
|
Uncertainty associated with key assumptions and potential events/circumstances that could have a negative effect
|
|
| Asset Management |
|
|
|
|
|
|
||
Sensitivities
: In order to test the resilience of the recoverable amount, key assumptions used in the DCF model (for example, the discount rate and the earnings projections) are sensitized. Management believes that reasonable possible changes in key assumptions could cause an impairment loss in AM. Currently, in AM the recoverable amount exceeds the carrying amount by
32
%
/
€
2.1
billion
.
Change in certain key assumptions to cause the recoverable amount to equal the carrying amount
|
Change in Key Assumptions
|
|
AM
|
|
Discount rate (post tax) increase
|
|
|
|
from
|
|
|
|
to
|
|
|
|
Change in projected future earnings in each period by
|
|
|
|
Long term growth rate
|
|
N/M
|
|
|
|
|
|
244
|
|
|
Deutsche Bank
|
Additional Notes
|
|
|
Annual Report 2021
|
|
|
|
|
|
Other Intangible Assets
Changes of other intangible assets by asset classes for the years ended December 31, 2021 and December 31, 2020
|
|
|
Purchased intangible assets
|
|
Internally
generated
intangible
assets
|
|
Total other
intangible
assets
|
||||||||||||
|
|
|
Unamortized
|
|
Amortized
|
|
Amortized
|
|
|
||||||||||
|
in € m.
|
|
Retail
investment
management
agreements
|
|
Other
|
|
Total
unamortized
purchased
intangible
assets
|
|
Customer-
related
intangible
assets
|
|
Contract-
based
intangible
assets
|
|
Software
and
other
|
|
Total
amortized
purchased
intangible
assets
|
|
Software
|
|
|
|
Cost of acquisition/
manufacture:
|
|
|
|
|
|
|
|
|
|
|
|
|
|
|
|
|
|
|
|
Balance as of
January 1, 2020
|
|
|
|
|
|
|
|
|
|
|
|
|
|
|
|
|
|
|
|
Additions
|
|
|
|
|
|
|
|
|
|
|
|
|
|
|
|
|
|
|
|
Changes in the group of
consolidated companies
|
|
|
|
|
|
|
|
|
|
|
|
|
|
|
|
|
|
|
|
Disposals
|
|
|
|
|
|
|
|
|
|
|
|
|
|
|
|
|
|
|
|
Reclassifications from
(to) “held for sale”
|
|
|
|
|
|
|
|
|
|
|
|
(
|
|
(
|
|
(
|
|
(
|
|
Transfers
|
|
|
|
|
|
|
|
|
|
|
|
|
|
|
|
|
|
|
|
Exchange rate changes
|
|
(
|
|
(
|
|
(
|
|
(
|
|
|
|
(
|
|
(
|
|
(
|
|
(
|
|
Balance as of
December 31, 2020
|
|
|
|
|
|
|
|
|
|
|
|
|
|
|
|
|
|
|
|
Additions
|
|
|
|
|
|
|
|
|
|
|
|
|
|
|
|
|
|
|
|
Changes in the group of
consolidated companies
|
|
|
|
|
|
|
|
|
|
|
|
|
|
|
|
|
|
|
|
Disposals
|
|
|
|
|
|
|
|
|
|
|
|
|
|
|
|
|
|
|
|
Reclassifications from
(to) “held for sale”
|
|
|
|
|
|
|
|
|
|
|
|
|
|
|
|
(
|
|
(
|
|
Transfers
|
|
|
|
|
|
|
|
(
|
|
|
|
|
|
(
|
|
(
|
|
(
|
|
Exchange rate changes
|
|
|
|
|
|
|
|
|
|
|
|
|
|
|
|
|
|
|
|
Balance as of
December 31, 2021
|
|
|
|
|
|
|
|
|
|
|
|
|
|
|
|
|
|
|
|
Accumulated amortization
and impairment:
|
|
|
|
|
|
|
|
|
|
|
|
|
|
|
|
|
|
|
|
Balance as of
January 1, 2020
|
|
|
|
|
|
|
|
|
|
|
|
|
|
|
|
|
|
|
|
Amortization for the year
|
|
|
|
|
|
|
|
|
|
|
|
|
|
|
|
|
|
|
|
Changes in the group of
consolidated companies
|
|
|
|
|
|
|
|
|
|
|
|
|
|
|
|
|
|
|
|
Disposals
|
|
|
|
|
|
|
|
|
|
|
|
|
|
|
|
|
|
|
|
Reclassifications from
(to) “held for sale”
|
|
|
|
|
|
|
|
|
|
|
|
(
|
|
(
|
|
(
|
|
(
|
|
Impairment losses
|
|
|
|
|
|
|
|
|
|
|
|
|
|
|
|
|
|
|
|
Reversals of impairment
losses
|
|
|
|
|
|
|
|
|
|
|
|
|
|
|
|
|
|
|
|
Transfers
|
|
|
|
|
|
|
|
|
|
|
|
|
|
|
|
(
|
|
|
|
Exchange rate changes
|
|
(
|
|
|
|
(
|
|
(
|
|
|
|
(
|
|
(
|
|
(
|
|
(
|
|
Balance as of
December 31, 2020
|
|
|
|
|
|
|
|
|
|
|
|
|
|
|
|
|
|
|
|
Amortization for the year
|
|
|
|
|
|
|
|
|
|
|
|
|
|
|
|
|
|
|
|
Changes in the group of
consolidated companies
|
|
|
|
|
|
|
|
|
|
|
|
|
|
|
|
|
|
(
|
|
Disposals
|
|
|
|
|
|
|
|
|
|
|
|
|
|
|
|
|
|
|
|
Reclassifications from
(to) “held for sale”
|
|
|
|
|
|
|
|
|
|
|
|
|
|
|
|
(
|
|
(
|
|
Impairment losses
|
|
|
|
|
|
|
|
|
|
|
|
|
|
|
|
|
|
|
|
Reversals of impairment
losses
|
|
|
|
|
|
|
|
|
|
|
|
|
|
|
|
|
|
|
|
Transfers
|
|
|
|
|
|
|
|
|
|
|
|
|
|
|
|
|
|
|
|
Exchange rate changes
|
|
|
|
|
|
|
|
|
|
|
|
|
|
|
|
|
|
|
|
Balance as of
December 31, 2021
|
|
|
|
|
|
|
|
|
|
|
|
|
|
|
|
|
|
|
|
Carrying amount:
|
|
|
|
|
|
|
|
|
|
|
|
|
|
|
|
|
|
|
|
As of December 31, 2020
|
|
|
|
|
|
|
|
|
|
|
|
|
|
|
|
|
|
|
|
As of December 31, 2021
|
|
|
|
|
|
|
|
|
|
|
|
|
|
|
|
|
|
|
|
|
|
|
|
|
|
|
|
|
|
|
|
|
|
|
|
|
|
|
1
€
1.0
billion
were included in general and administrative expenses.
2
€
51
million
were mainly comprised of impairments of self-developed software recorded in general and administrative expenses.
3
€
2
million
were comprised of reversal of impairments of self-developed software recorded in general and administrative expenses.
4
€
1.0
billion
were included in general and administrative expenses.
5
€
152
million
were comprised of impairments of
€
149
million
on self-developed software and of
€
3
million
on customer-related intangibles, both recorded in general and administrative expenses.
|
245
|
|
|
Deutsche Bank
|
Additional Notes
|
|
|
Annual Report 2021
|
|
|
|
|
|
Amortizing Intangible Assets
In 2021, amortizing other intangible assets remained nearly unchanged, decreasing only slightly by net
€
21
million
. This reflects amortization expenses of
€
1.0
billion
, mostly for the scheduled consumption of capitalized software (
€
1.0
billion
) and the impairment of current platform software as well as software under construction (
€
149
million
). More information in regards to the related impact from the transformation strategy is included in Note 42 “Impact of Deutsche Bank’s transformation”. Additions to internally generated intangible assets of
€
1.1
billion
resulting from the capitalization of expenses incurred in conjunction with the Group’s development of own-used software compensated for the decrease in net book value. A weaker Euro exchange rate against major currencies accounted for positive exchange rate changes of
€
42
million
.
In 2020, amortizing other intangible assets decreased by
€
161
million
. This reduction was driven by amortization expenses of
€
1.0
billion
, mostly for the scheduled consumption of capitalized software (
€
1.0
billion
) and the impairment of current platform software as well as software under construction (
€
50
million
). Additions to internally generated intangible assets of
€
1.1
billion
resulting from the capitalization of expenses incurred in conjunction with the Group’s development of own-used software compensated for the decrease in net book value. A stronger Euro exchange rate against major currencies accounted for negative exchange rate changes of
€
112
million
.
In 2019, amortizing other intangible assets decreased by a net
€
1.1
billion
. This was mainly driven by amortization expenses of
€
1.3
billion
, mostly for the scheduled consumption of capitalized software (
€
1.2
billion
) and the impairment of current platform software as well as software under construction (
€
937
million
). Offsetting were additions to internally generated intangible assets of
€
1.0
billion
resulting from the capitalization of expenses incurred in conjunction with the Group’s development of own-used software. Furthermore, the weakening of the Euro against major currencies accounted for positive exchange rate changes of
€
26
million
.
Other intangible assets with finite useful lives are generally amortized over their useful lives based on the straight-line method.
Useful lives of other amortized intangible assets by asset class
|
|
|
Useful lives
in years
|
|
Internally generated intangible assets:
|
|
|
|
Software
|
|
up to 10
|
|
Purchased intangible assets:
|
|
|
|
Customer-related intangible assets
|
|
up to 20
|
|
Other
|
|
up to 10
|
|
|
|
|
Unamortized Intangible Assets
Within this asset class, the Group recognizes certain contract-based and marketing-related intangible assets, which are deemed to have an indefinite useful life.
In particular, the asset class comprises the below detailed investment management agreements related to retail mutual funds and certain trademarks. Due to the specific nature of these intangible assets, market prices are ordinarily not observable and, therefore, the Group values such assets based on the income approach, using a post-tax DCF-methodology.
Retail investment management agreements:
These assets, amounting to
€
760
million
, relate to the Group’s U.S. retail mutual fund business and are allocated to the AM CGU. Retail investment management agreements are contracts that give AM the exclusive right to manage a variety of mutual funds for a specified period. Since these contracts are easily renewable, the cost of renewal is minimal, and they have a long history of renewal, these agreements are not expected to have a foreseeable limit on the contract period. Therefore, the rights to manage the associated assets under management are expected to generate cash flows for an indefinite period of time. This intangible asset was recorded at fair value based upon a valuation provided by a third party at the date of acquisition of Zurich Scudder Investments, Inc. in 2002.
The recoverable amount was calculated as fair value less costs of disposal using the multi-period excess earnings method and the fair value measurement was categorized as Level 3 in the fair value hierarchy and is essentially flat compared to the carrying amount. The key assumptions in determining the fair value less costs of disposal include the asset mix, the flows forecast, the effective fee rate and discount rate as well as the terminal value growth rate. The discount rate (cost of equity) applied in the calculation was
9.8
%
in 2021 (
10.3
%
in 2020). The terminal value growth rate applied for 2021 is
4.1
%
(for 2020
4.1
%
). The reviews of the valuations for the years 2021 and 2020 neither resulted in any impairment nor a reversal of prior impairments.
|
246
|
|
|
Deutsche Bank
|
Additional Notes
|
|
|
Annual Report 2021
|
|
|
|
|
|
24 –
Non-Current Assets and Disposal Groups Held for Sale
Within the balance sheet, non-current assets and disposal groups held for sale are included in other assets and other liabilities.
|
in € m.
|
|
Dec 31, 2021
|
|
Dec 31, 2020
|
|
Cash and bank balances
|
|
|
|
0
|
|
Financial assets at fair value through profit or loss
|
|
|
|
|
|
Property and equipment
|
|
|
|
|
|
Goodwill and other intangible assets
|
|
|
|
|
|
Other assets
|
|
|
|
|
|
Total assets classified as held for sale
|
|
|
|
|
|
|
|
|
|
|
|
Financial liabilities at fair value through profit or loss
|
|
|
|
|
|
Other liabilities
|
|
|
|
|
|
Total liabilities classified as held for sale
|
|
|
|
|
|
|
|
|
|
|
As of December 31, 2021, and December 31, 2020, no unrealized gains (losses) relating to non-current assets classified as held for sale were recognized directly in accumulated other comprehensive income (loss) (net of tax).
DWS Partners with BlackFin to Unlock Full Potential of Digital Investment Platform IKS
In September 2021, DWS Group (“DWS”) and BlackFin Capital Partners (“BlackFin”) have agreed on a long-term strategic partnership to jointly evolve the digital investment platform into a platform eco system that provides comprehensive digital investment solutions and services to distribution partners, institutional investors and retail clients. It was agreed that DWS will transfer its digital investment platform into a joint venture with BlackFin, maintaining a stake of
30
%
. As of December 31, 2021, the Group classified the related assets and liabilities in the transaction perimeter as a disposal group held for sale in Asset Management. The remeasurement to the lower of carrying amount and fair value less costs to sell of these assets and liabilities did not result in the recognition of an impairment loss. Closing of the transaction is expected for the second half of 2022.
Transfer of Global Prime Finance Electronic Equities platform to BNP Paribas completed
As part of the Group’s strategic transformation and restructuring plans announced on July 7, 2019, the Management Board of Deutsche Bank had announced the exit of the Equities Sales Trading business. In this context, Deutsche Bank had entered into an agreement with BNP Paribas S.A. (“BNP Paribas “) to provide continuity of service to its prime finance and electronic equities clients, with a view to transferring technology and staff to BNP Paribas and to continue to operate the platform until clients are migrated to BNP Paribas, with revenues transferred to BNP Paribas and certain costs to be refunded to Deutsche Bank. On November 14, 2019, BNP Paribas and Deutsche Bank announced that the agreement to refer clients and to transfer technology and key staff from the respective businesses to BNP Paribas had received the necessary approvals and was therefore considered unconditional. The revenue transfer and cost reimbursement arrangement commenced on December 1, 2019. Accordingly, in the fourth quarter 2019, the assets (
€
5.0
billion
) and liabilities (
€
9.6
billion
) forming the transaction perimeter were classified as assets and liabilities held for sale of the Capital Release Unit (CRU). As of December 31, 2020, the disposal group was comprised of assets and liabilities amounting to
€
6.1
billion
and
€
9.9
billion
, respectively.
The Group and BNP Paribas have announced on January 5, 2022 that the transfer of clients, technology and key staff from Deutsche Bank’s Global Prime Finance and Electronic Equities businesses to BNP Paribas has been successfully completed by the end of 2021, in line with the targeted timeline. With this, Deutsche Bank has achieved a key milestone in its ongoing transformation.
Agreement to sell the Italian financial advisors network to Zurich Italy
In August 2021, Deutsche Bank and Zurich Insurance Group Italy (“Zurich Italy”) have reached an agreement wherein Zurich Italy will acquire Deutsche Bank’s Financial Advisors Network in Italy. The transaction is subject to outstanding substantive regulatory approvals and therefore was not considered a disposal group held for sale at year-end 2021. Closing is expected for the second half of 2022.
|
247
|
|
|
Deutsche Bank
|
Additional Notes
|
|
|
Annual Report 2021
|
|
|
|
|
|
Disposals in 2020
Division
: Infrastructure
Disposal
: On November 9, 2020, Deutsche Bank had announced the sale of its subsidiary Postbank Systems AG, including its around
1,500
employees, to Tata Consultancy Services (TCS). Following the fulfilment of all closing conditions achieved in the fourth quarter 2020, TCS acquired Postbank Systems AG and accordingly the subsidiary was deconsolidated at year-end 2020.
Financial impact
: Negative pre-tax impact of
€ (120) million
recorded in the fourth quarter 2020 within other revenues (
€ (104) million
) and non-interest expenses (
€ (16) million
). Impairment losses and reversals of impairment losses are included in Other income.
Date of disposal
: Fourth quarter 2020.
25 –
Other Assets and Other Liabilities
|
in € m.
|
|
Dec 31, 2021
|
|
Dec 31, 2020
|
|
Brokerage and securities related receivables
|
|
|
|
|
|
Cash/margin receivables
|
|
|
|
|
|
Receivables from prime brokerage
|
|
|
|
|
|
Pending securities transactions past settlement date
|
|
|
|
|
|
Receivables from unsettled regular way trades
|
|
|
|
|
|
Total brokerage and securities related receivables
|
|
|
|
|
|
Debt Securities held to collect
|
|
|
|
|
|
Accrued interest receivable
|
|
|
|
|
|
Assets held for sale
|
|
|
|
|
|
Other
|
|
|
|
|
|
Total other assets
|
|
|
|
|
|
|
|
|
|
|
|
in € m.
|
|
Dec 31, 2021
|
|
Dec 31, 2020
|
|
Brokerage and securities related payables
|
|
|
|
|
|
Cash/margin payables
|
|
|
|
|
|
Payables from prime brokerage
|
|
|
|
|
|
Pending securities transactions past settlement date
|
|
|
|
|
|
Payables from unsettled regular way trades
|
|
|
|
|
|
Total brokerage and securities related payables
|
|
|
|
|
|
Accrued interest payable
|
|
|
|
|
|
Liabilities held for sale
|
|
|
|
|
|
Lease liabilities
|
|
|
|
|
|
Other
|
|
|
|
|
|
Total other liabilities
|
|
|
|
|
|
|
|
|
|
|
For further details on the assets and liabilities held for sale, please refer to Note 24 “Non-Current Assets and Disposal Groups Held for Sale”.
26 –
Deposits
|
in € m.
|
|
Dec 31, 2021
|
|
Dec 31, 2020
|
|
Noninterest-bearing demand deposits
|
|
|
|
|
|
Interest-bearing deposits
|
|
|
|
|
|
Demand deposits
|
|
|
|
|
|
Time deposits
|
|
|
|
|
|
Savings deposits
|
|
|
|
|
|
Total interest-bearing deposits
|
|
|
|
|
|
Total deposits
|
|
|
|
|
|
|
|
|
|
|
|
248
|
|
|
Deutsche Bank
|
Additional Notes
|
|
|
Annual Report 2021
|
|
|
|
|
|
|
249
|
|
|
Deutsche Bank
|
Additional Notes
|
|
|
Annual Report 2021
|
|
|
|
|
|
27 –
Provisions
Movements by Class of Provisions
|
in € m.
|
|
Operational
Risk
|
|
Civil
Litigation
|
|
Regulatory
Enforcement
|
|
Re-
structuring
|
|
Other
|
|
Total
1
|
|
Balance as of January 1, 2020
|
|
|
|
|
|
|
|
|
|
|
|
|
|
Changes in the group of consolidated companies
|
|
|
|
|
|
(
|
|
(
|
|
(
|
|
(
|
|
New provisions
|
|
|
|
|
|
|
|
|
|
|
|
|
|
Amounts used
|
|
|
|
|
|
|
|
|
|
|
|
|
|
Unused amounts reversed
|
|
|
|
|
|
|
|
|
|
|
|
|
|
Effects from exchange rate fluctuations/Unwind of discount
|
|
|
|
(
|
|
(
|
|
|
|
(
|
|
(
|
|
Transfers
|
|
(
|
|
|
|
(
|
|
|
|
|
|
|
|
Balance as of December 31, 2020
|
|
|
|
|
|
|
|
|
|
|
|
|
|
Changes in the group of consolidated companies
|
|
|
|
|
|
|
|
|
|
|
|
|
|
New provisions
|
|
|
|
|
|
|
|
|
|
|
|
|
|
Amounts used
|
|
|
|
|
|
|
|
|
|
|
|
|
|
Unused amounts reversed
|
|
|
|
|
|
|
|
|
|
|
|
|
|
Effects from exchange rate fluctuations/Unwind of discount
|
|
|
|
|
|
|
|
|
|
|
|
|
|
Transfers
|
|
(
|
|
(
|
|
|
|
(
|
|
|
|
|
|
Balance as of December 31, 2021
|
|
|
|
|
|
|
|
|
|
|
|
|
|
|
|
|
|
|
|
|
|
|
|
|
|
|
1
For the remaining portion of provisions as disclosed on the consolidated balance sheet, please see Note 19 “Allowance for Credit Losses”, in which allowances for credit related off-balance sheet positions are disclosed.
Classes of Provisions
Operational Risk
provisions arise out of operational risk and exclude civil litigation and regulatory enforcement provisions, which are presented as separate classes of provisions. Operational risk is the risk of loss resulting from inadequate or failed internal processes, people and systems, or from external events. The definition used for the purposes of determining operational provisions differs from the risk management definition, as it excludes risk of loss resulting from civil litigation and regulatory enforcement matters. For risk management purposes, operational risk includes legal risk, as payments to customers, counterparties and regulatory bodies in civil litigations or regulatory enforcement matters constitute loss events for operational shortcomings, but excludes business and reputational risk.
Civil Litigation
provisions arise out of current or potential claims or proceedings alleging non-compliance with contractual or other legal or regulatory responsibilities, which have resulted or may result in demands from customers, counterparties or other parties in civil litigations.
Regulatory Enforcement
provisions arise out of current or potential claims or proceedings alleging non-compliance with legal or regulatory responsibilities, which have resulted or may result in an assessment of fines or penalties by governmental regulatory agencies, self-regulatory organizations or other enforcement authorities.
Restructuring
provisions arise out of restructuring activities. The Group aims to enhance its long-term competitiveness through major reductions in costs, duplication and complexity in the years ahead. For details see Note 10 “Restructuring”.
Other
provisions include several specific items arising from a variety of different circumstances, including the provision for the reimbursement of loan processing fees, deferred sales commissions, provisions for bank levies and mortgage repurchase demands.
Provisions and Contingent Liabilities
The Group recognizes a provision for potential loss only when there is a present obligation arising from a past event that is probable to result in an economic outflow that can be reliably estimated. Where a reliable estimate cannot be made for such an obligation, no provision is recognized and the obligation is deemed a contingent liability. Contingent liabilities also include possible obligations for which the possibility of future economic outflow is more than remote but less than probable. Where a provision has been taken for a particular claim, no contingent liability is recorded; for matters or sets of matters consisting of more than one claim, however, provisions may be recorded for some claims, and contingent liabilities (or neither a provision nor a contingent liability) may be recorded for others.
|
250
|
|
|
Deutsche Bank
|
Additional Notes
|
|
|
Annual Report 2021
|
|
|
|
|
|
The Group operates in a legal and regulatory environment that exposes it to significant litigation risks. As a result, the Group is involved in litigation, arbitration and regulatory proceedings and investigations in Germany and in a number of jurisdictions outside Germany, including the United States. In recent years, regulation and supervision in a number of areas have increased, and regulators, governmental bodies and others have sought to subject financial services providers to increasing oversight and scrutiny, which in turn has led to additional regulatory investigations and enforcement actions which are often followed by civil litigation.
In determining for which of the claims the possibility of a loss is probable, or less than probable but more than remote, and then estimating the possible loss for those claims, the Group takes into consideration a number of factors, including but not limited to the nature of the claim and its underlying facts, the procedural posture and litigation history of each case, rulings by the courts or tribunals, the Group’s experience and the experience of others in similar cases (to the extent this is known to the Group), prior settlement discussions, settlements by others in similar cases (to the extent this is known to the Group), available indemnities and the opinions and views of legal counsel and other experts.
The provisions the Group has recognized for civil litigation and regulatory enforcement matters as of December 31, 2021 and December 31, 2020 are set forth in the table above. For some matters for which the Group believes an outflow of funds is probable, no provisions were recognized as the Group could not reliably estimate the amount of the potential outflow.
For the matters for which a reliable estimate can be made, the Group currently estimates that, as of December 31, 2021, the aggregate future loss of which the possibility is more than remote but less than probable is approximately
€
1.7
billion
for civil litigation matters (December 31, 2020:
€
2.1
billion
) and
€
0.1
billion
for regulatory enforcement matters (December 31, 2020:
€
0.2
billion
). These figures include matters where the Group’s potential liability is joint and several and where the Group expects any such liability to be paid by a third party. For other significant civil litigation and regulatory enforcement matters, the Group believes the possibility of an outflow of funds is more than remote but less than probable but the amount is not reliably estimable, and accordingly such matters are not included in the contingent liability estimates. For still other significant civil litigation and regulatory enforcement matters, the Group believes the possibility of an outflow of funds is remote and therefore has neither recognized a provision nor included them in the contingent liability estimates.
This estimated possible loss, as well as any provisions taken, is based upon currently available information and is subject to significant judgment and a variety of assumptions, variables and known and unknown uncertainties. These uncertainties may include inaccuracies in or incompleteness of the information available to the Group, particularly at the preliminary stages of matters, and assumptions by the Group as to future rulings of courts or other tribunals or the likely actions or positions taken by regulators or adversaries may prove incorrect. Moreover, estimates of possible loss for these matters are often not amenable to the use of statistical or other quantitative analytical tools frequently used in making judgments and estimates, and are subject to even greater degrees of uncertainty than in many other areas where the Group must exercise judgment and make estimates. The estimated possible loss, as well as any provisions taken, can be and often are substantially less than the amount initially requested by regulators or adversaries or the maximum potential loss that could be incurred were the matters to result in a final adjudication adverse to the Group. Moreover, in several regions in which the Group operates, an adversary often is not required to set forth the amount it is seeking, and where it is, the amount may not be subject to the same requirements that generally apply to pleading factual allegations or legal claims.
The matters for which the Group determines that the possibility of a future loss is more than remote will change from time to time, as will the matters as to which a reliable estimate can be made and the estimated possible loss for such matters. Actual results may prove to be significantly higher or lower than the estimate of possible loss in those matters where such an estimate was made. In addition, loss may be incurred in matters with respect to which the Group believed the likelihood of loss was remote. In particular, the estimated aggregate possible loss does not represent the Group’s potential maximum loss exposure for those matters.
The Group may settle litigation or regulatory proceedings or investigations prior to a final judgment or determination of liability. It may do so to avoid the cost, management efforts or negative business, regulatory or reputational consequences of continuing to contest liability, even when the Group believes it has valid defenses to liability. It may also do so when the potential consequences of failing to prevail would be disproportionate to the costs of settlement. Furthermore, the Group may, for similar reasons, reimburse counterparties for their losses even in situations where it does not believe that it is legally compelled to do so.
Current Individual Proceedings
Set forth below are descriptions of civil litigation and regulatory enforcement matters or groups of matters for which the Group has taken material provisions, or for which there are material contingent liabilities that are more than remote, or for which there is the possibility of material business or reputational risk; similar matters are grouped together and some matters consist of a number of proceedings or claims. The disclosed matters include matters for which the possibility of a loss is more than remote but for which the Group cannot reliably estimate the possible loss. Sets of matters are presented in English-language alphabetical order based on the titles the Group has used for them.
|
251
|
|
|
Deutsche Bank
|
Additional Notes
|
|
|
Annual Report 2021
|
|
|
|
|
|
Anti-Money Laundering Matters Involving Former Correspondent Banking Relationships.
Deutsche Bank has received requests for information from government authorities concerning certain former correspondent banking relationships, including Danske Bank. Deutsche Bank is providing information to and otherwise cooperating with the investigating authorities. The Bank also completed an internal investigation focused on the Bank’s historical processing of correspondent banking transactions on behalf of customers of Danske Bank’s Estonia branch prior to cessation of the correspondent banking relationship with that branch in 2015, including of whether any violations of law, regulation or Bank policy occurred and the effectiveness of the related internal control environment.
Additionally, on September 24 and 25, 2019, based on a search warrant issued by the Local Court (
Amtsgericht
) in Frankfurt, the Frankfurt Public Prosecutor’s (FPP’s) office conducted investigations into Deutsche Bank in connection with suspicious activity reports relating to potential money laundering at Danske Bank. On October 13, 2020, the FPP closed its criminal investigation because the FPP did not find sufficient evidence to substantiate the money laundering suspicion. However, the Bank agreed to pay an administrative fine of
€
13.5
million
to the FPP for failing to submit suspicious activity reports (SARs) in Germany in a timely fashion, which Deutsche Bank paid in the fourth quarter of 2020.
On July 7, 2020, the New York State Department of Financial Services (DFS) issued a Consent Order, finding that Deutsche Bank violated New York State banking laws in connection with its relationships with three former Deutsche Bank clients--Danske Bank’s Estonia branch, Jeffrey Epstein and FBME Bank--and imposing a
U.S.$
150
million
civil penalty in connection with these three former relationships, which Deutsche Bank paid in the third quarter of 2020.
The remaining investigations are understood to be ongoing.
On July 15, 2020, Deutsche Bank was named as a defendant in a securities class action filed in the U.S. District Court for the District of New Jersey, alleging that the Bank made material misrepresentations regarding the effectiveness of its anti-money laundering (AML) controls and related remediation. The complaint cites allegations regarding control deficiencies raised in the DFS Consent Order related to the Bank’s relationships with Danske Bank’s Estonia branch, Jeffrey Epstein and FBME Bank. On September 30, 2020, the plaintiff filed an amended complaint that included additional allegations regarding the effectiveness of the Bank’s AML controls. On December 28, 2020, the court appointed lead plaintiff and lead counsel. Lead plaintiff filed a second amended complaint on March 1, 2021. On April 23, 2021, the Bank filed a motion to transfer the action, or in the alternative, to dismiss the second amended complaint. Briefing on the motion concluded on July 1, 2021.
The Group has not established a provision or contingent liability with respect to the remaining investigations and civil action.
BGH.
On April 27, 2021 the German Federal Court of Justice (BGH) issued a ruling that certain clauses used in the Bank’s General Terms and Conditions, which assume the customer consents following a notice and non-objection period, are void in relation to consumers (
Verbraucher
). The group received the written reasoning for this judgment on May 27, 2021. The relevant clauses were widely used in the German banking industry. The BGH overturned the prior decisions of both the Regional Court and Higher Regional Court of Cologne, which had dismissed the claim brought forward by a consumer protection association. As a result of this ruling, fees introduced or increased since 2018 on the basis of this modification mechanism are potentially ineffective and consumers (
Verbraucher
) can claim repayment of respective banking fees. The group has established a civil litigation class provision of
€
130
million
in the second quarter of 2021 with respect to this matter.
Cum-ex Investigations and Litigations.
Deutsche Bank has received inquiries from law enforcement authorities, including requests for information and documents, in relation to cum-ex transactions of clients. “Cum-ex” refers to trading activities in German shares around dividend record dates (trade date before and settlement date after dividend record date) for the purpose of obtaining German tax credits or refunds in relation to withholding tax levied on dividend payments including, in particular, transaction structures that have resulted in more than one market participant claiming such credit or refund with respect to the same dividend payment. Deutsche Bank is cooperating with the law enforcement authorities in these matters.
The Public Prosecutor in Cologne (
Staatsanwaltschaft Köln
, “CPP”) has been conducting a criminal investigation since August 2017 concerning two former employees of Deutsche Bank in relation to cum-ex transactions of certain former clients of the Bank. Deutsche Bank is a potential secondary participant pursuant to Section 30 of the German Law on Administrative Offences in this proceeding. This proceeding could result in a disgorgement of profits and fines. Deutsche Bank is cooperating with the CPP. At the end of May and beginning of June 2019, the CPP initiated criminal investigations against further current and former employees of Deutsche Bank and five former Management Board members. In July 2020, in the course of inspecting the CPP’s investigation file, Deutsche Bank learned that the CPP had further extended its investigation in June 2019 to include further current and former DB personnel, including one former Management Board member and one current Management Board member. Very limited information on the individuals was recorded in the file. The investigation is still at an early stage and the scope of the investigation may be further broadened.
In May 2021, Deutsche Bank learned through an information request received by Deutsche Oppenheim Family Office AG (“DOAG”) as legal successor of Sal. Oppenheim jr. Cie. AG Co. KGaA (“Sal. Oppenheim”) that the CPP in 2021 opened a criminal investigation proceeding in relation to cum-ex transactions against unknown former personnel of Sal. Oppenheim. DOAG provided the requested information on September 13 and October 15, 2021.
|
252
|
|
|
Deutsche Bank
|
Additional Notes
|
|
|
Annual Report 2021
|
|
|
|
|
|
Deutsche Bank acted as participant in and filed withholding tax refund claims through the electronic refund procedure (
elektronisches Datenträgerverfahren
) on behalf of, inter alia, two former custody clients in connection with their cum-ex transactions. In February 2018, Deutsche Bank received from the German Federal Tax Office (
Bundeszentralamt für Steuern
, “FTO”) a demand of approximately
€
49
million
for tax refunds paid to a former custody client. Deutsche Bank expects to receive a formal notice for the same amount. On December 20, 2019, Deutsche Bank received a liability notice from the FTO requesting payment of
€
2.1
million
by January 20, 2020 in connection with tax refund claims Deutsche Bank had submitted on behalf of another former custody client. In 2020, Deutsche Bank made the requested payment and filed an objection against the liability notice. On December 3, 2020, Deutsche Bank received another hearing letter from the FTO in relation to the
€
2.1
million
liability notice to which Deutsche Bank responded on April 16, 2021. On July 28, 2021, Deutsche Bank received a letter from the FTO stating that the revised tax assessment notice dated December 2019 was not a valid administrative act as it could not be served to Deutsche Bank’s client due to its liquidation already in 2016. On the same day, FTO issued another liability notice to Deutsche Bank arguing that it issued incorrect tax certificates. The
€
2.1
million
payment made by Deutsche Bank under the first liability notice was offset by FTO in the second liability notice. Thus, no further payments were made by Deutsche Bank. Deutsche Bank objected to the second liability notice on August 31, 2021 and filed the reasoning on October 14, 2021. On November 9, 2021, it submitted a further brief in this matter.
By letter dated February 26, 2018, The Bank of New York Mellon SA/NV (“BNY”) informed Deutsche Bank of its intention to seek indemnification for potential cum-ex related tax liabilities incurred by BHF Asset Servicing GmbH (“BAS”) and/or Frankfurter Service Kapitalanlage-GmbH (“Service KAG”, now named BNY Mellon Service Kapitalanlage-Gesellschaft mbH). Deutsche Bank had acquired BAS and Service KAG as part of the acquisition of Sal. Oppenheim in 2010 and sold them to BNY in the same year. BNY estimates the potential tax liability to amount to up to
€
120
million
(excluding interest of
6
%
p.a.). In November and December 2020 counsel to BNY informed Deutsche Bank that BNY and / or Service KAG (among others) have received notices from tax authorities in the estimated amount with respect to cum-ex related trades by certain investment funds in 2009 and 2010. BNY has filed objections against the notices.
On February 6, 2019, the Regional Court (
Landgericht
) Frankfurt am Main served Deutsche Bank with a claim by M.M.Warburg CO Gruppe GmbH and M.M.Warburg CO (AG Co.) KGaA (together “Warburg”) in connection with cum-ex transactions of Warburg with a custody client of Deutsche Bank during 2007 to 2011. Warburg claimed from Deutsche Bank indemnification against German taxes in relation to transactions conducted in the years 2007 to 2011. Further, Warburg claimed compensation of unspecified damages relating to these transactions. Based on the tax assessment notices received for 2007 to 2011, Warburg claimed a total of
€
250
million
(of which
€
166
million
is in relation to taxes and
€
84
million
is in relation to interest). On March 20, 2020, Warburg extended its claim against Deutsche Bank to indemnify Warburg in relation to the
€
176
million
(thereof
€
166
million
in relation to taxes and
€
10
million
in relation to interest) criminal confiscation order issued by the Regional Court Bonn in the criminal cum-ex trial on March 18, 2020 regarding the same transactions. On July 28, 2021 the German Federal Court of Justice (BGH) confirmed the criminal confiscation. On September 23, 2020, the Frankfurt Regional Court fully dismissed Warburg’s claim against Deutsche Bank on the grounds that Warburg as the tax debtor (
Steuerschuldner
) is primarily liable and cannot request payment from Deutsche Bank. The court further held that any claims are time-barred. On October 29, 2020, Warburg appealed the decision with the Higher Regional Court (
Oberlandesgericht
) Frankfurt am Main. Following appellate briefs by Warburg and Deutsche Bank the hearing of the appeal proceeding took place on November 3, 2021. On December 1, 2021, Warburg reduced its claim from the first instance proceeding. Warburg now claims
€
86
million
(thereof
€
63
million
in relation to taxes and
€
23
million
in relation to interest). Further, Warburg claims an amount of
€
54
million
in relation to the criminal confiscation. A further hearing took place on January 26, 2022. In a judgment dated March 2, 2022, the Higher Regional Court (
Oberlandesgericht
) Frankfurt am Main fully dismissed Warburg’s appeal. The court did not admit an appeal of its decision to the German Federal Court of Justice (BGH). Warburg may file an appeal against this non-admission (
Nichtzulassungsbeschwerde
).
On January 25, 2021, the Regional Court (
Landgericht
) Hamburg served Deutsche Bank with a claim by Warburg Invest Kapitalanlagegesellschaft mbH (“Warburg Invest”) in relation to transactions of two investment funds in 2009 and 2010, respectively. Warburg Invest was fund manager for both funds. Warburg Invest claims, from Deutsche Bank together with several other parties as joint and several debtors (
Gesamtschuldner
), indemnification against German taxes in relation to cum-ex transactions conducted by the two funds. Further, Warburg Invest claims compensation of unspecified damages relating to these transactions. In November 2020, Warburg Invest received a tax liability notice from tax authorities for one of the funds in the amount of
€
61
million
. Based on publicly available information Deutsche Bank estimates the tax amount for the second fund to be approximately
€
49
million
. Warburg Invest filed its claim against several parties including Deutsche Bank
inter alia
based on an allegation of intentional damage contrary to public policy (Section 826 German Civil Code) and the accusation that Deutsche Bank participated in a business model that was contrary to public policy (
sittenwidriges Geschäftsmodell
). On July 5, 2021, Deutsche Bank submitted its defense statement to the court. On December 31, 2021, two other defendants of the proceeding served a notice of dispute (
Streitverkündung
) to several parties including Deutsche Bank.
|
253
|
|
|
Deutsche Bank
|
Additional Notes
|
|
|
Annual Report 2021
|
|
|
|
|
|
On February 26, 2021, the Regional Court (
Landgericht
) Frankfurt am Main served Deutsche Bank with a claim by Seriva Vermögensverwaltungs GmbH (“Seriva”). Seriva is requesting that Deutsche Bank reissue certain tax certificates (
Steuerbescheinigungen
) that Deutsche Bank withdrew in April 2017 in light of Seriva’s cum-ex transactions. Deutsche Bank responded to Seriva’s statement of claim on April 6, 2021. On July 5, 2021, Deutsche Bank received a reply brief from Seriva. Deutsche Bank responded on August 17, 2021. The hearing took place on February 7, 2022. In a judgment dated February 28, 2022, the court dismissed Seriva’s claim. Seriva may appeal the decision.
The Group has not disclosed whether it has established a provision or contingent liability with respect to these matters because it has concluded that such disclosure can be expected to prejudice seriously their outcome.
FX Investigations and Litigations.
Deutsche Bank has received requests for information from certain regulatory and law enforcement agencies globally who investigated trading in, and various other aspects of, the foreign exchange market. Deutsche Bank cooperated with these investigations. Relatedly, Deutsche Bank has conducted its own internal global review of foreign exchange trading and other aspects of its foreign exchange business.
On October 19, 2016, the U.S. Commodity Futures Trading Commission (CFTC), Division of Enforcement, issued a letter (“CFTC Letter”) notifying Deutsche Bank that the CFTC Division of Enforcement “is not taking any further action at this time and has closed the investigation of Deutsche Bank” regarding foreign exchange. As is customary, the CFTC Letter states that the CFTC Division of Enforcement “maintains the discretion to decide to reopen the investigation at any time in the future.” The CFTC Letter has no binding impact on other regulatory and law enforcement agency investigations regarding Deutsche Bank’s foreign exchange trading and practices.
On December 7, 2016, it was announced that Deutsche Bank reached an agreement with CADE, the Brazilian antitrust enforcement agency, to settle an investigation into conduct by a former Brazil-based Deutsche Bank trader. As part of that settlement, Deutsche Bank paid a fine of BRL
€
51
million
and agreed to continue to comply with the CADE’s administrative process until it is concluded. This resolves CADE’s administrative process as it relates to Deutsche Bank, subject to Deutsche Bank’s continued compliance with the settlement terms.
On February 13, 2017, the U.S. Department of Justice (DOJ), Criminal Division, Fraud Section, issued a letter (“DOJ Letter”) notifying Deutsche Bank that the DOJ has closed its criminal inquiry “concerning possible violations of federal criminal law in connection with the foreign exchange markets.” As is customary, the DOJ Letter states that the DOJ may reopen its inquiry if it obtains additional information or evidence regarding the inquiry. The DOJ Letter has no binding impact on other regulatory and law enforcement agency investigations regarding Deutsche Bank’s foreign exchange trading and practices.
On April 20, 2017, it was announced that Deutsche Bank AG, DB USA Corporation and Deutsche Bank AG New York Branch reached an agreement with the Board of Governors of the Federal Reserve System to settle an investigation into Deutsche Bank’s foreign exchange trading and practices. Under the terms of the settlement, Deutsche Bank entered into a cease-and-desist order, and agreed to pay a civil monetary penalty of
U.S.$
137
million
. In addition, the Federal Reserve ordered Deutsche Bank to “continue to implement additional improvements in its oversight, internal controls, compliance, risk management and audit programs” for its foreign exchange business and other similar products, and to periodically report to the Federal Reserve on its progress.
On June 20, 2018, it was announced that Deutsche Bank AG and Deutsche Bank AG New York Branch reached an agreement with the New York State Department of Financial Services (DFS) to settle an investigation into Deutsche Bank’s foreign exchange trading and sales practices. Under the terms of the settlement, Deutsche Bank entered into a consent order, and agreed to pay a civil monetary penalty of
U.S.$
205
million
. In addition, the DFS ordered Deutsche Bank to continue to implement improvements in its oversight, internal controls, compliance, risk management and audit programs for its foreign exchange business, and to periodically report to the DFS on its progress.
Investigations conducted by certain other regulatory agencies are ongoing, and Deutsche Bank has cooperated with these investigations.
On February 25, 2020, plaintiffs in the “Indirect Purchasers” action pending in the U.S. District Court for the Southern District of New York (
Contant, et al
. v.
Bank of America Corp., et al.
) informed the court of a global settlement with all eleven defendants remaining in that action, including Deutsche Bank, collectively for
U.S.$
10
million
. Each individual defendant’s contribution, including Deutsche Bank’s, remains confidential. The court approved the settlement and dismissed with prejudice all claims alleged against Deutsche Bank in that action on November 19, 2020. Filed on November 7, 2018,
Allianz, et al. v. Bank of America Corporation, et al.
, was brought on an individual basis by a group of asset managers who opted out of the settlement in a consolidated action (
In re Foreign Exchange Benchmark Rates Antitrust Litigation
). Defendants’ motion to dismiss was granted and denied in part on May 28, 2020. Plaintiffs filed a third amended complaint on July 28, 2020. Discovery is ongoing.
|
254
|
|
|
Deutsche Bank
|
Additional Notes
|
|
|
Annual Report 2021
|
|
|
|
|
|
Deutsche Bank also has been named as a defendant in two Canadian class proceedings brought in the provinces of Ontario and Quebec. Filed on September 10, 2015, these class actions assert factual allegations similar to those made in the consolidated action in the United States and seek damages pursuant to the Canadian Competition Act as well as other causes of action. Plaintiffs’ motion for class certification in the Ontario action was granted on April 14, 2020. On July 2, 2021, Deutsche Bank entered an agreement to settle the Canadian class proceedings. The settlement agreement was approved by the Ontario Superior Court of Justice on September 23, 2021, and the Quebec Superior Court of Justice on October 20, 2021.
Deutsche Bank has also been named as a defendant in an amended and consolidated class action filed in Israel. This action asserts factual allegations similar to those made in the consolidated action in the United States and seeks damages pursuant to Israeli antitrust law as well as other causes of action. This action is in preliminary stages.
On November 10, 2020, Deutsche Bank was named in an action issued in the UK High Court of Justice (Commercial Court) brought by The ECU Group PLC. The proceedings have now settled on confidential terms.
On November 11, 2020, Deutsche Bank was named in an action issued in the UK High Court of Justice (Commercial Court) brought by many of the same plaintiffs who brought
Allianz, et al. v. Bank of America Corporation, et al.
referred to above. The claim is based upon factual allegations similar to those made in
Allianz, et al. v. Bank of America Corporation, et al.
The proceedings are at the pleadings stage.
On May 4, 2021, Deutsche Bank S.A. – Banco Alemao was named in a civil antitrust action brought in the São Paulo Civil Court of Central Jurisdiction by the Association of Brazilian Exporters (AEB) against certain FX dealers and affiliated financial institutions in Brazil. This action asserts factual allegations based on conduct investigated by CADE and seeks damages pursuant to Brazilian antitrust law. Deutsche Bank has not yet been served.
The Group has not disclosed whether it has established a provision or contingent liability with respect to these matters because it has concluded that such disclosure can be expected to seriously prejudice its outcome.
Interbank and Dealer Offered Rates Matters.
Regulatory and Law Enforcement Matters.
Deutsche Bank has responded to requests for information from, and cooperated with, various regulatory and law enforcement agencies, in connection with industry-wide investigations concerning the setting of the London Interbank Offered Rate (LIBOR), Euro Interbank Offered Rate (EURIBOR), Tokyo Interbank Offered Rate (TIBOR) and other interbank and/or dealer offered rates.
As previously reported, Deutsche Bank paid
€
725
million
to the European Commission pursuant to a settlement agreement dated December 4, 2013 in relation to anticompetitive conduct in the trading of interest rate derivatives.
Also as previously reported, on April 23, 2015, Deutsche Bank entered into separate settlements with the DOJ, the CFTC, the UK Financial Conduct Authority (FCA), and the New York State Department of Financial Services (DFS) to resolve investigations into misconduct concerning the setting of LIBOR, EURIBOR, and TIBOR. Under the terms of these agreements, Deutsche Bank paid penalties of
U.S.$
2.175
billion
to the DOJ, CFTC and DFS and
GBP
226.8
million
to the FCA. As part of the resolution with the DOJ, DB Group Services (UK) Limited (an indirectly-held, wholly-owned subsidiary of Deutsche Bank) pled guilty to one count of wire fraud in the U.S. District Court for the District of Connecticut and Deutsche Bank entered into a Deferred Prosecution Agreement with a three year term pursuant to which it agreed (among other things) to the filing of an Information in the U.S. District Court for the District of Connecticut charging Deutsche Bank with one count of wire fraud and one count of price fixing in violation of the Sherman Act. On April 23, 2018, the Deferred Prosecution Agreement expired, and the U.S. District Court for the District of Connecticut subsequently dismissed the criminal Information against Deutsche Bank.
Also, as previously reported, on March 20, 2017, Deutsche Bank paid
CHF
5.4
million
to the Swiss Competition Commission (WEKO) pursuant to a settlement agreement in relation to Yen LIBOR.
On October 25, 2017, Deutsche Bank entered into a settlement with a working group of U.S. state attorneys general resolving their interbank offered rate investigation. Among other conditions, Deutsche Bank made a settlement payment of
U.S. $
220
million
.
Other investigations of Deutsche Bank concerning the setting of various interbank and/or dealer offered rates remain ongoing.
The Group has not disclosed whether it has established a provision or contingent liability with respect to the remaining investigations because it has concluded that such disclosure can be expected to seriously prejudice its outcome.
Overview of Civil Litigations.
Deutsche Bank is party to 27 U.S. civil actions concerning alleged manipulation relating to the setting of various interbank and/or dealer offered rates which are described in the following paragraphs, as well as actions pending in each of the UK, Israel, Argentina and Spain. Most of the civil actions, including putative class actions, are pending in the U.S. District Court for the Southern District of New York (SDNY), against Deutsche Bank and numerous other defendants. All but three of the U.S. civil actions were filed on behalf of parties who allege losses as a result of manipulation relating to the setting of U.S. dollar LIBOR. The three U.S. civil actions pending against Deutsche Bank that do not relate to U.S. dollar LIBOR were also filed in the SDNY, and include one consolidated action concerning Pound Sterling (GBP) LIBOR, one action concerning Swiss franc (CHF) LIBOR, and one action concerning two Singapore Dollar (SGD) benchmark rates, the Singapore Interbank Offered Rate (SIBOR) and the Swap Offer Rate (SOR).
|
255
|
|
|
Deutsche Bank
|
Additional Notes
|
|
|
Annual Report 2021
|
|
|
|
|
|
Claims for damages for all 27 of the U.S. civil actions discussed have been asserted under various legal theories, including violations of the U.S. Commodity Exchange Act, federal and state antitrust laws, the U.S. Racketeer Influenced and Corrupt Organizations Act, and other federal and state laws. The Group has not disclosed whether it has established a provision or contingent liability with respect to these matters because it has concluded that such disclosure can be expected to prejudice seriously their outcome.
U.S. dollar LIBOR
. With two exceptions, all of the U.S. civil actions concerning U.S. dollar LIBOR are being coordinated as part of a multidistrict litigation (the “U.S. dollar LIBOR MDL”) in the SDNY. In light of the large number of individual cases pending against Deutsche Bank and their similarity, the civil actions included in the U.S. dollar LIBOR MDL are now subsumed under the following general description of the litigation pertaining to all such actions, without disclosure of individual actions except when the circumstances or the resolution of an individual case is material to Deutsche Bank.
Following a series of decisions in the U.S. dollar LIBOR MDL between March 2013 and March 2019 narrowing their claims, plaintiffs are currently asserting antitrust claims, claims under the U.S. Commodity Exchange Act and U.S. Securities Exchange Act and state law fraud, contract, unjust enrichment and other tort claims. The court has also issued decisions dismissing certain plaintiffs’ claims for lack of personal jurisdiction and on statute of limitations grounds.
On December 20, 2016, the district court issued a ruling dismissing certain antitrust claims while allowing others to proceed. Multiple plaintiffs have filed appeals of the district court’s December 20, 2016 ruling to the U.S. Court of Appeals for the Second Circuit, and those appeals proceeded in parallel with the ongoing proceedings in the district court. On December 30, 2021, the Second Circuit affirmed the district court’s decision on antitrust standing grounds but reversed the court’s decision on personal jurisdiction grounds, and it remanded the cases to the district court for further proceedings.
On July 29, 2020, Deutsche Bank executed a settlement agreement with plaintiffs in the amount of
U.S. $
425
thousand
to resolve a putative class action pending as part of the U.S. dollar LIBOR MDL asserting claims on behalf of lending institutions headquartered in the United States that originated, purchased outright, or purchased a participation interest in loans tied to U.S. dollar LIBOR (
The Berkshire Bank
v.
Bank of America
). The court granted the settlement final approval on March 15, 2021, and dismissed all claims against Deutsche Bank. Accordingly, the action is not included in the total number of actions above. The settlement amount, which Deutsche Bank has paid, is no longer reflected in Deutsche Bank’s litigation provisions.
On March 5, 2021, Deutsche Bank and the plaintiffs in a non-class action pending as part of the U.S. dollar LIBOR MDL (
Amabile
v.
Bank of America Corporation
) stipulated to the dismissal of the plaintiffs’ claims against Deutsche Bank. The court dismissed the plaintiffs’ claims on March 8, 2021.
On December 8, 2021, Deutsche Bank and the plaintiffs in four non-class actions pending as part of the U.S. dollar LIBOR MDL (the Schwab actions) stipulated to the dismissal of plaintiffs’ claims against Deutsche Bank. The court dismissed plaintiffs’ claims on December 10, 2021. On February 3, 2022, Deutsche Bank and the plaintiffs in two non-class actions pending as part of the U.S. dollar LIBOR MDL (the Philadelphia actions) stipulated to the dismissal of plaintiffs’ claims against Deutsche Bank. The court dismissed plaintiffs’ claims on February 4, 2022.
In January and March 2019, plaintiffs filed three putative class action complaints in the SDNY against several financial institutions, alleging that the defendants, members of the panel of banks that provided U.S. dollar LIBOR submissions, the organization that administers LIBOR, and their affiliates, conspired to suppress U.S. dollar LIBOR submissions from February 1, 2014 through the present. These actions were subsequently consolidated under
In re ICE LIBOR Antitrust Litigation
, and on July 1, 2019, the plaintiffs filed a consolidated amended complaint. On March 26, 2020, the court granted the defendants’ motion to dismiss the action, dismissing all claims against Deutsche Bank. Plaintiffs have appealed that decision to the U.S. Court of Appeals for the Second Circuit. Briefing of the appeal is complete. On December 28, 2020, DYJ Holdings, LLC filed a motion to intervene in the appeal as named plaintiff and proposed class representative, as one of the original named plaintiffs has withdrawn and dismissed its claims and the other two named plaintiffs have expressed a desire to withdraw from the case. On January 7, 2021, defendants filed a motion to dismiss the appeal for lack of subject matter jurisdiction. On April 6, 2021, the court granted the motion to intervene and denied defendants’ motion to dismiss. Oral argument was heard on November 29, 2021. This action is not part of the U.S. dollar LIBOR MDL.
|
256
|
|
|
Deutsche Bank
|
Additional Notes
|
|
|
Annual Report 2021
|
|
|
|
|
|
In August 2020, plaintiffs filed a non-class action in the U.S. District Court for the Northern District of California against several financial institutions, alleging that U.S. dollar LIBOR has been suppressed through the present. On November 10, 2020, plaintiffs moved the court for a preliminary and permanent injunction; briefing of that motion is complete. On November 11, 2020, certain defendants moved to transfer the action to the SDNY; briefing of that motion is complete. On May 24, 2021, plaintiffs filed a motion for an order to show cause why the court should not order plaintiffs’ previously requested injunction. Defendants moved to strike the motion. On June 3, 2021, the court issued an order (i) denying defendants’ motion to transfer the action to the SDNY, (ii) denying defendants’ motion to strike plaintiffs’ May 24 motion and (iii) setting a hearing for the injunction motions for September 9, 2021. On December 23, 2021, the court issued a written decision denying the injunction motions. On September 9, 2021, the court held a hearing on the injunction motions and tentatively denied the motions. On September 30, 2021, defendants moved to dismiss the complaint. The motions to dismiss are now fully briefed. This action is not part of the U.S. dollar LIBOR MDL.
There is a further UK civil action regarding U.S. dollar LIBOR brought by the U.S. Federal Deposit Insurance Corporation (FDIC), in which a claim for damages has been asserted pursuant to Article 101 of The Treaty on the Functioning of the European Union, Section 2 of Chapter 1 of the UK Competition Act 1998 and U.S. state laws. In January 2022, following a ruling issued by the U.S. Court of Appeals for the Second Circuit in relation to USD LIBOR antitrust claims, the FDIC has requested the defendant banks consider a short stay of the UK LIBOR proceedings, pending resolution of an application to reinstate these either in part or full in the US.
A further class action regarding LIBOR has been filed in Argentina seeking damages for losses allegedly suffered by holders of Argentine bonds with interest rates based on LIBOR. Deutsche Bank is defending this action.
SIBOR and SOR.
A putative class action alleging manipulation of the Singapore Interbank Offered Rate (SIBOR) and Swap Offer Rate (SOR) remains pending. On July 26, 2019, the SDNY granted defendants’ motion to dismiss the action, dismissing all claims against Deutsche Bank, and denied plaintiff’s motion for leave to file a fourth amended complaint. Plaintiff appealed that decision to the U.S. Court of Appeals for the Second Circuit. On March 17, 2021, the court reversed the SDNY’s decision and remanded the case to the district court. On October 1, 2021, defendants (including Deutsche Bank)) filed a petition for a writ of certiorari to the U.S. Supreme Court to review the Court of Appeals’ March 17, 2021 decision. The petition was denied on January 10, 2022. On October 25, 2021, plaintiffs filed their fourth amended complaint, which defendants moved to dismiss on November 24, 2021.
GBP LIBOR.
A putative class action alleging manipulation of the Pound Sterling (GBP) LIBOR remains pending. On December 21, 2018, the SDNY partially granted defendants’ motions to dismiss the action, dismissing all claims against Deutsche Bank. Plaintiffs filed a notice of appeal; the U.S. Court of Appeals for the Second Circuit ordered that the appeal be held in abeyance pending that court’s decision in the appeal of the SIBOR and SOR class action. Following that court’s decision in the SIBOR and SOR class action on March 17, 2021, the appeal is moving forward. Plaintiffs filed their opening brief on October 21, 2021, and all defendants-appellees’ except Deutsche Bank filed their briefs on January 20, 2022. Also on January 20, 2022, plaintiffs filed a motion for (1) severance of their appeal with respect to Deutsche Bank, (2) stay of the severed appeal as to Deutsche Bank, and (3) limited remand of that portion of the matter concerning Deutsche Bank to the district court to consider the approval of a proposed settlement between plaintiffs and Deutsche Bank. The Second Circuit granted plaintiffs’ motion on January 26, 2022.
CHF LIBOR.
A putative class action alleging manipulation of the Swiss Franc (CHF) LIBOR remains pending. On September 16, 2019, the SDNY granted defendants’ motion to dismiss the action, dismissing all claims against Deutsche Bank. Plaintiffs filed a notice of appeal; the U.S. Court of Appeals for the Second Circuit ordered that the appeal be held in abeyance pending that court’s decision in the appeal of the SIBOR and SOR class action. Following that court’s decision in the SIBOR and SOR class action on March 17, 2021, the CHF LIBOR action was remanded to the district court for further proceedings.
Spanish EURIBOR Claims.
68 claims in Spain have been filed against Deutsche Bank by claimants with mortgage loans held by banks and other financial institutions for damages resulting from alleged collusive behavior by Deutsche Bank following the European Commission’s Decision. Of the 68 claims, court proceedings with respect to 49 claims have commenced. The total value of the 68 claims is approximately
€
1
million
with the potential for more claims. Of those already commenced, 21 judgments have been handed down. In 10 of these judgements the claims were dismissed. In the remaining 11, the judgements upheld the application of the EU Damages Directive, albeit that in 6 of these no damages were awarded, with the remaining 5 resulting in damages being reduced to only
10
%
. The Bank is appealing all decisions where this EU Damages directive was applied.
|
257
|
|
|
Deutsche Bank
|
Additional Notes
|
|
|
Annual Report 2021
|
|
|
|
|
|
Investigations Into Referral Hiring Practices and Certain Business Relationships and Precious Metals.
On August 22, 2019, Deutsche Bank reached a settlement with the U.S. Securities and Exchange Commission (SEC) to resolve its investigation into the Bank’s hiring practices related to candidates referred by clients, potential clients and government officials. The Bank agreed to pay
U.S. $
16
million
as part of the settlement. The U.S. Department of Justice (DOJ) closed its investigation of the Bank regarding its hiring practices. Deutsche Bank has also reached settlements with the DOJ and the SEC, respectively, regarding their investigations of the Bank’s compliance with the U.S. Foreign Corrupt Practices Act (FCPA) and other laws with respect to the Bank’s engagement of finders and consultants. On January 8, 2021, Deutsche Bank entered into a deferred prosecution agreement (DPA) with the DOJ concerning its historical engagements of finders and consultants and, as part of its obligations in the DPA, agreed to pay approximately
U.S. $
80
million
in connection with this conduct. The DPA with the DOJ also involved a resolution involving spoofing in precious metals. As part of its obligations in the DPA relating to precious metals, Deutsche Bank agreed to pay approximately
U.S. $
8
million
, of which approximately
U. S. $
6
million
would be credited by virtue of Deutsche Bank’s 2018 resolution with the CFTC. On the same day, Deutsche Bank also reached a settlement with the SEC to resolve its investigation into conduct regarding the Bank’s compliance with the FCPA with respect to the Bank’s engagement of finders and consultants. The Bank agreed to pay approximately
U.S. $
43
million
in this SEC settlement.
On February 28, 2022, following a finding by the DOJ that the Bank violated the 2021 DPA based on untimely reporting by the Bank of certain allegations relating to environmental, social and governance (ESG)-related information at the Bank’s subsidiary DWS Group GmbH Co. KGaA, the Bank agreed with the DOJ to extend an existing monitorship and abide by the terms of a prior deferred prosecution agreement until February 2023 to allow the monitor to certify to the Bank’s implementation of the related internal controls. The DOJ has reserved all rights to take further action regarding the 2021 DPA if it deems necessary.
Jeffrey Epstein Investigations.
Deutsche Bank has received requests for information from regulatory and law enforcement agencies concerning the Bank’s former client relationship with Jeffrey Epstein (individually, and through related parties and entities). In December 2018, Deutsche Bank began the process to terminate its relationship with Epstein, which began in August 2013. Deutsche Bank has provided information to and otherwise cooperated with the investigating agencies. The Bank has also completed an internal investigation into the Epstein relationship.
On July 7, 2020, the New York State Department of Financial Services (DFS) issued a Consent Order, finding that Deutsche Bank violated New York State banking laws in connection with its relationships with three former Deutsche Bank clients, Danske Bank’s Estonia branch, Jeffrey Epstein and FBME Bank, and imposing a
U.S. $
150
million
civil penalty in connection with these three former relationships, which Deutsche Bank paid in the third quarter of 2020. As noted above, the Bank is also named as a defendant in a securities class action pending in the U.S. District Court for the District of New Jersey that includes allegations relating to the Bank’s relationship with Jeffrey Epstein and other entities.
The Group has not established a provision or contingent liability with respect to the Jeffrey Epstein investigations and civil action. The remaining investigations relating to Jeffrey Epstein are understood to be ongoing.
Mortgage-Related and Asset-Backed Securities Matters and Investigation. Regulatory and Governmental Matters. Deutsche
Bank, along with certain affiliates (collectively referred in these paragraphs to as “Deutsche Bank”), received subpoenas and requests for information from certain regulators and government entities, including members of the Residential Mortgage-Backed Securities Working Group of the U.S. Financial Fraud Enforcement Task Force, concerning its activities regarding the origination, purchase, securitization, sale, valuation and/or trading of mortgage loans, residential mortgage-backed securities (RMBS), commercial mortgage-backed securities (CMBS), collateralized debt obligations (CDOs), other asset-backed securities and credit derivatives. Deutsche Bank fully cooperated in response to those subpoenas and requests for information.
On December 23, 2016, Deutsche Bank announced that it reached a settlement-in-principle with the DOJ to resolve potential claims related to its RMBS business conducted from 2005 to 2007. The settlement became final and was announced by the DOJ on January 17, 2017. Under the settlement, Deutsche Bank paid a civil monetary penalty of
U.S. $
3.1
billion
and provided
U.S. $
4.1
billion
in consumer relief. The DOJ appointed an independent monitor to oversee and validate the provision of consumer relief.
In September 2016, Deutsche Bank received administrative subpoenas from the Maryland Attorney General seeking information concerning Deutsche Bank’s RMBS and CDO businesses from 2002 to 2009. On June 1, 2017, Deutsche Bank and the Maryland Attorney General reached a settlement to resolve the matter for
U.S. $
15
million
in cash and
U.S. $
80
million
in consumer relief (to be allocated from the overall
U.S. $
4.1
billion
consumer relief obligation agreed to as part of Deutsche Bank’s settlement with the DOJ).
On July 8, 2020, the DOJ-appointed monitor released his final report, validating that Deutsche Bank has fulfilled its U.S.$ 4.1 billion consumer relief obligations in its entirety, inclusive of the
U.S. $
80
million
commitment to the State of Maryland.
The Group has recorded provisions with respect to some of the outstanding regulatory investigations but not others. The Group has not disclosed the amount of these provisions because it has concluded that such disclosure can be expected to seriously prejudice the resolution of these matters.
Issuer and Underwriter Civil Litigation.
Deutsche Bank has been named as defendant in numerous civil litigations brought by private parties in connection with its various roles, including issuer or underwriter, in offerings of RMBS and other asset-backed securities. These cases, described below, allege that the offering documents contained material misrepresentations and omissions, including with regard to the underwriting standards pursuant to which the underlying mortgage loans were issued, or assert that various representations or warranties relating to the loans were breached at the time of origination. The Group has recorded provisions with respect to several of these civil cases, but has not recorded provisions with respect to all of these matters. The Group has not disclosed the amount of these provisions because it has concluded that such disclosure can be expected to prejudice seriously the resolution of these matters.
|
258
|
|
|
Deutsche Bank
|
Additional Notes
|
|
|
Annual Report 2021
|
|
|
|
|
|
Deutsche Bank is a defendant in a class action relating to its role as one of the underwriters of six RMBS offerings issued by Novastar Mortgage Corporation. No specific damages are alleged in the complaint. The lawsuit was brought by plaintiffs representing a class of investors who purchased certificates in those offerings. The parties reached a settlement to resolve the matter for a total of
U.S. $
165
million
, a portion of which was paid by the Bank. On August 30, 2017, FHFA/Freddie Mac filed an objection to the settlement and shortly thereafter appealed the district court’s denial of their request to stay settlement approval proceedings, which appeal was resolved against FHFA/Freddie Mac. The court approved the settlement on March 7, 2019 over FHFA/Freddie Mac’s objections. FHFA filed its appeal on June 28, 2019, which is pending.
Deutsche Bank is a defendant in an action related to RMBS offerings brought by the U.S. Federal Deposit Insurance Corporation (FDIC) as receiver for Citizens National Bank and Strategic Capital Bank (alleging an unspecified amount in damages against all defendants). In this action, the appellate court reinstated claims previously dismissed on statute of limitations grounds and petitions for rehearing and certiorari to the U.S. Supreme Court were denied. On July 31, 2017, the FDIC filed a second amended complaint, which defendants moved to dismiss on September 14, 2017. On October 18, 2019, defendants’ motion to dismiss was denied. Discovery is ongoing.
In June 2014, HSBC, as trustee, brought an action in New York state court against Deutsche Bank to revive a prior action, alleging that Deutsche Bank failed to repurchase mortgage loans in the ACE Securities Corp. 2006-SL2 RMBS offering. The revival action was stayed during the pendency of an appeal of the dismissal of a separate action wherein HSBC, as trustee, brought an action against Deutsche Bank alleging breaches of representations and warranties made by Deutsche Bank concerning the mortgage loans in the same offering. On March 29, 2016, the court dismissed the revival action. Plaintiff appealed and on July 8, 2019, plaintiff filed its opening appellate brief. On November 19, 2019, the appellate court affirmed the dismissal. On December 19, 2019, plaintiff filed a motion to appeal to the New York Court of Appeals in the appeals court, which was denied on February 13, 2020. On March 16, 2020, plaintiff petitioned the New York Court of Appeals for leave to appeal, which was granted on September 1, 2020. The appeal has been fully briefed and remains pending.
Deutsche Bank is a defendant in cases concerning two RMBS trusts that were brought initially by RMBS investors and subsequently by HSBC, as trustee, in New York state court. The cases allege breaches of loan-level representations and warranties in the ACE Securities Corp. 2006-FM1 and ACE Securities Corp. 2007-ASAP1 RMBS offerings, respectively. Both cases were dismissed on statute of limitations grounds by the trial court on March 28, 2018. Plaintiff appealed the dismissals. On April 25, 2019, the First Department affirmed the dismissals on claims for breach of representations and warranties and for breach of the implied covenant of good faith and fair dealing, but reversed the denial of the motions for leave to file amended complaints alleging failure to notify the trustee of alleged representations and warranty breaches. HSBC filed amended complaints on April 30, 2019, and Deutsche Bank filed its answers on June 3, 2019. Discovery is ongoing. On October 25, 2019, plaintiffs filed two complaints seeking to revive, under Section 205(a) of the New York Civil Practice Law and Rules, the breach of representations and warranties claims as to which dismissal was affirmed in the case concerning ACE 2006-FM1. On December 16, 2019, Deutsche Bank moved to dismiss these actions.
In the actions against Deutsche Bank solely as an underwriter of other issuers’ RMBS offerings, Deutsche Bank has contractual rights to indemnification from the issuers, but those indemnity rights may in whole or in part prove effectively unenforceable where the issuers are now or may in the future be in bankruptcy or otherwise defunct.
Trustee Civil Litigation.
Deutsche Bank National Trust Company (“DBNTC”) and Deutsche Bank Trust Company Americas (“DBTCA”) (collectively, the “Trustees”) are defendants in three separate civil lawsuits, and DBNTC is a defendant in a fourth civil lawsuit, brought by investors concerning the Trustees’ role as trustees of certain RMBS trusts. The actions generally allege claims for breach of contract, breach of fiduciary duty, breach of the duty to avoid conflicts of interest, negligence and/or violations of the U.S. Trust Indenture Act of 1939, based on the Trustees’ alleged failure to perform adequately certain obligations and/or duties as trustee for the trusts.
The four lawsuits include actions by (a) the National Credit Union Administration Board (“NCUA”), as an investor in 18 trusts that allegedly suffered total realized collateral losses of more than U.S.$ 3.7 billion; (b) certain CDOs (collectively, “Phoenix Light”) that hold RMBS certificates issued by 43 RMBS trusts, and seeking “hundreds of millions of dollars in damages”; (c) Commerzbank AG, as an investor in 50 RMBS trusts, seeking “hundreds of millions of dollars in losses”; and (d) IKB International, S.A. in Liquidation and IKB Deutsche Industriebank A.G. (collectively, “IKB”), as an investor in 22 RMBS trusts, seeking more than U.S.$ 268 million of damages. In the NCUA case, DBNTC’s motion to dismiss the amended complaint was granted in part and denied in part, dismissing NCUA’s tort claims but preserving its breach-of-contract claims. On January 27, 2021, the court in the IKB case granted in part and denied in part the Trustees’ motion to dismiss, dismissing certain of IKB’s claims but allowing most of its breach of contract and tort claims to go forward; on May 10, 2021, the Trustees filed a notice of appeal regarding certain aspects of that order and, on May 20, 2021, IKB filed a notice of cross-appeal with respect to other aspects of that order. Discovery is ongoing. On February 8, 2022, the court in the Phoenix Light case granted DBNTC’s and DBTCA’s motion for summary judgment, denied Phoenix Light’s motion for summary judgment, and dismissed the action. On February 8, 2022, the court in the Commerzbank case granted in part and denied in part DBNTC’s and DBTCA’s motion for summary judgment, dismissing all of the tort claims and dismissing the breach of contract claim relating to many of the trusts, and denied Commerzbank’s motion for summary judgment in its entirety.
The Group has established contingent liabilities with respect to certain of these matters, but the Group has not disclosed the amounts because it has concluded that such disclosure can be expected to seriously prejudice the outcome of these matters.
|
259
|
|
|
Deutsche Bank
|
Additional Notes
|
|
|
Annual Report 2021
|
|
|
|
|
|
Polish Mortgage Matters.
Starting in 2016, certain clients of Deutsche Bank Polska S.A. have reached out to Deutsche Bank Polska S.A. alleging that their mortgage loan agreements in foreign currency include unfair clauses and are invalid. These clients have demanded reimbursement of the alleged overpayments under such agreements totaling over
€
250
million
with more than
2,000
civil claims having been commenced in Polish courts. This type of cases is an industry wide issue in Poland and other banks are facing similar claims. Deutsche Bank Polska S.A. has and will take necessary legal actions to defend itself and challenge such claims in courts.
The Group has established a portfolio provision to cover potential losses from the existing and potential litigation related to mortgage loans in foreign currency. The amount of the portfolio provision is approximately
€
165
million
and may be subject to future changes in estimate depending in particular on the jurisprudence of local courts as well as the Court of Justice of European Union.
Postbank Voluntary Public Takeover Offer
.
On September 12, 2010, Deutsche Bank announced the decision to make a voluntary takeover offer for the acquisition of all shares in Deutsche Postbank AG (Postbank). On October 7, 2010, the Bank published its official takeover offer and offered Postbank shareholders a consideration of
€
25
for each Postbank share. This offer was accepted for a total of approximately
48.2
million
Postbank shares.
In November 2010, a former shareholder of Postbank, Effecten-Spiegel AG, which had accepted the takeover offer, brought a claim against Deutsche Bank alleging that the offer price was too low and was not determined in accordance with the applicable German laws. The plaintiff alleges that Deutsche Bank had been obliged to make a mandatory takeover offer for all shares in Postbank, at the latest, in 2009 as the voting rights of Deutsche Post AG in Postbank had to be attributed to Deutsche Bank pursuant to Section 30 of the German Takeover Act. Based thereon, the plaintiff alleges that the consideration offered by Deutsche Bank for the shares in Postbank in the 2010 voluntary takeover offer needed to be raised to
€
57.25
per share.
The Regional Court Cologne
(Landgericht)
dismissed the claim in 2011 and the Cologne appellate court dismissed the appeal in 2012. The Federal Court set this judgment aside and referred the case back to the Higher Regional Court Cologne to take evidence on certain allegations of the plaintiff.
Starting in 2014, additional former shareholders of Postbank, who accepted the 2010 tender offer, brought similar claims as Effecten-Spiegel AG against Deutsche Bank which are pending with the Regional Court Cologne and the Higher Regional Court of Cologne, respectively. On October 20, 2017, the Regional Court Cologne handed down a decision granting the claims in a total of 14 cases which were combined in one proceeding. The Regional Court Cologne took the view that Deutsche Bank was obliged to make a mandatory takeover offer already in 2008 so that the appropriate consideration to be offered in the takeover offer should have been
€
57.25
per Postbank share (instead of
€
25
). The additional consideration per share owed to shareholders which have accepted the takeover offer would thus amount to
€
32.25
. Deutsche Bank appealed this decision and the appeal was assigned to the 13th Senate of the Higher Regional Court of Cologne, which also heard the appeal of Effecten-Spiegel AG.
In 2019 and 2020 the Higher Regional Court Cologne called a number of witnesses in both cases. The individuals heard included current and former board members of Deutsche Bank, Deutsche Post AG and Postbank as well as other persons involved in the Postbank transaction. In addition, the Higher Regional Court Cologne issued orders for the production of relevant transaction documents entered into between Deutsche Bank and Deutsche Post AG in 2008 and 2009. Deutsche Bank had therefore deposited the originals of these documents with the court in 2019.
On December 16, 2020, the Higher Regional Court Cologne handed down a decision and fully dismissed the claims of Effecten-Spiegel AG. Further, in a second decision handed down on December 16, 2020, the Higher Regional Court Cologne allowed the appeal of Deutsche Bank against the decision of the Regional Court Cologne dated October 20, 2017 and dismissed all related claims of the relevant plaintiffs. The Higher Regional Court Cologne has granted leave to appeal to the German Federal Court (
Bundesgerichtshof
) as regards both decisions and all relevant plaintiffs have lodged their respective appeals with the Federal Court end of January and beginning of February 2021, respectively. Until October 15, 2021 the plaintiffs filed their reasonings of the appeal with the German Federal Court.
Deutsche Bank has been served with a large number of additional lawsuits filed against Deutsche Bank shortly before the end of 2017, almost all of which are now pending with the Regional Court Cologne. Some of the new plaintiffs allege that the consideration offered by Deutsche Bank AG for the shares in Postbank in the 2010 voluntary takeover should be raised to
€
64.25
per share.
The claims for payment against Deutsche Bank in relation to these matters total almost
€
700
million
(excluding interest).
The Group has established a contingent liability with respect to these matters but the Group has not disclosed the amount of this contingent liability because it has concluded that such disclosure can be expected to prejudice seriously the outcome of these matters.
|
260
|
|
|
Deutsche Bank
|
Additional Notes
|
|
|
Annual Report 2021
|
|
|
|
|
|
Further Proceedings Relating to the Postbank Takeover
.
In September 2015, former shareholders of Postbank filed in the Regional Court Cologne shareholder actions against Postbank to set aside the squeeze-out resolution taken in the shareholders meeting of Postbank in August 2015 (actions for voidance). Among other things, the plaintiffs alleged that Deutsche Bank was subject to a suspension of voting rights with respect to its shares in Postbank based on the allegation that Deutsche Bank failed to make a mandatory takeover offer. The squeeze out is final and the proceeding itself has no reversal effect, but may result in damage payments. The claimants refer to legal arguments similar to those asserted in the Effecten-Spiegel proceeding described above. In a decision on October 20, 2017, the Regional Court Cologne declared the squeeze-out resolution to be void. The court, however, did not rely on a suspension of voting rights due to an alleged failure of Deutsche Bank to make a mandatory takeover offer, but argued that Postbank violated information rights of Postbank shareholders in Postbank's shareholders meeting in August 2015. Postbank has appealed this decision. On May 15, 2020 DB Privat- und Firmenkundenbank AG (legal successor of Postbank due to a merger in 2018) was merged into Deutsche Bank AG. On July 3, 2020 Deutsche Bank AG withdrew the appeal as regards the actions for voidance because efforts and costs to pursue this appeal became disproportionate to the minor remaining economic importance of the case considering that the 2015 squeeze-out cannot be reversed. As a consequence, the first instance judgement which found that Postbank violated the information rights of its shareholders in the shareholders’ meeting has now become final.
The legal question of whether Deutsche Bank had been obliged to make a mandatory takeover offer for all Postbank shares prior to its 2010 voluntary takeover may also impact two pending appraisal proceedings (
Spruchverfahren
). These proceedings were initiated by former Postbank shareholders with the aim to increase the cash compensation offered in connection with the squeeze-out of Postbank shareholders in 2015 and the cash compensation offered and annual compensation paid in connection with the execution of a domination and profit and loss transfer agreement (
Beherrschungs- und Gewinnabführungsvertrag
) between DB Finanz-Holding AG (now DB Beteiligungs-Holding GmbH) and Postbank in 2012.
The applicants in the appraisal proceedings claim that a potential obligation of Deutsche Bank to make a mandatory takeover offer for Postbank at an offer price of
€
57.25
should be decisive when determining the adequate cash compensation in the appraisal proceedings. The Regional Court Cologne had originally followed this legal view of the applicants in two resolutions. In a decision dated June 2019, the Regional Court Cologne expressly gave up this legal view in the appraisal proceedings in connection with execution of a domination and profit and loss transfer agreement. According to this decision, the question whether Deutsche Bank was obliged to make a mandatory offer for all Postbank shares prior to its voluntary takeover offer in 2010 shall not be relevant for determining the appropriate cash compensation. It is likely that the Regional Court Cologne will take the same legal position in the appraisal proceedings in connection with the squeeze-out. On October 1, 2020, the Regional Court Cologne handed down a decision in the appraisal proceeding concerning the domination and profit and loss transfer agreement (dated December 5, 2012) according to which the annual compensation pursuant to Section 304 of the German Stock Corporation Act (
jährliche Ausgleichszahlung
) shall be increased by
€
0.12
to
€
1.78
per Postbank share and the settlement amount pursuant to Section 305 of the German Stock Corporation Act (
Abfindungsbetrag
) shall be increased by
€
4.56
to
€
29.74
per Postbank share. The increase of the settlement amount is of relevance for approximately
492,000
former Postbank shares whereas the increase of the annual compensation is of relevance for approximately
7
million
former Postbank shares. Deutsche Bank as well as the applicants have lodged an appeal against this decision.
The Group has not disclosed whether it has established a provision or contingent liability with respect to this matter because it has concluded that such disclosure can be expected to prejudice seriously its outcome.
Russia/UK Equities Trading Investigation.
Deutsche Bank has investigated the circumstances around equity trades entered into by certain clients with Deutsche Bank in Moscow and London. The total volume of transactions reviewed is significant. Deutsche Bank's internal investigation of potential violations of law, regulation and policy and into the related internal control environment has concluded, and Deutsche Bank has assessed the findings identified during the investigation; to date it has identified certain violations of Deutsche Bank’s policies and deficiencies in Deutsche Bank's control environment. Deutsche Bank has advised regulators and law enforcement authorities in several jurisdictions (including Germany, Russia, the UK and the United States) of this investigation. Deutsche Bank has taken disciplinary measures with regards to certain individuals in this matter.
On January 30, 2017, the DFS and the FCA announced settlements with the Bank related to their investigations into this matter. The settlements conclude the DFS’s and the FCA’s investigations into the Bank’s AML control function in its investment banking division, including in relation to the equity trading described above. Under the terms of the settlement agreement the DFS issued a Consent Order pursuant to which Deutsche Bank agreed to pay a civil monetary penalty of
U.S. $
425
million
and to engage an independent monitor for a term of up to two years. Under the terms of the settlement agreement with the FCA, Deutsche Bank agreed to pay a civil monetary penalty of approximately
GBP
163
million
. On May 30, 2017, the Federal Reserve announced its settlement with the Bank resolving this matter as well as additional AML issues identified by the Federal Reserve. Deutsche Bank paid a penalty of
U.S. $
41
million
. Deutsche Bank also agreed to retain independent third parties to assess its Bank Secrecy Act/AML program and review certain foreign correspondent banking activity of its subsidiary Deutsche Bank Trust Company Americas. The Bank was required to submit written remediation plans and programs.
|
261
|
|
|
Deutsche Bank
|
Additional Notes
|
|
|
Annual Report 2021
|
|
|
|
|
|
Deutsche Bank continues to cooperate with regulators and law enforcement authorities, including the DOJ which has its own investigation into these securities trades that is understood to be ongoing. The Group has recorded a provision with respect to the remaining investigation. The Group has not disclosed the amount of this provision because it has concluded that such disclosure can be expected to prejudice seriously the outcome of this matter.
Sovereign, Supranational and Agency Bonds (SSA) Investigations and Litigations
. Deutsche Bank has received inquiries from certain regulatory and law enforcement authorities, including requests for information and documents, pertaining to SSA bond trading. Deutsche Bank is cooperating with these investigations.
On December 20, 2018, the European Commission sent a Statement of Objections to Deutsche Bank regarding a potential breach of EU antitrust rules in relation to secondary market trading of SSA bonds denominated in U.S. dollars, Deutsche Bank proactively cooperated with the European Commission in this matter and as a result was granted immunity. On April 28, 2020, the European Commission issued its decision, finding that Deutsche Bank and three other banks breached EU antitrust rules. However, in accordance with the European Commission’s guidelines, no fine was imposed on Deutsche Bank given its immunity status.
Deutsche Bank is a defendant in several putative class action complaints filed in the U.S. District Court for the Southern District of New York by alleged direct and indirect market participants claiming violations of antitrust law and common law related to alleged manipulation of the secondary trading market for SSA bonds. Deutsche Bank reached an agreement to settle the actions by direct market participants for the amount of
U.S. $
48.5
million
and recorded a provision in the same amount. The settlement received final court approval on April 2, 2021. The action filed on behalf of alleged indirect market participants was voluntarily dismissed by the plaintiffs.
Deutsche Bank is also a defendant in putative class actions filed on November 7, 2017 and December 5, 2017 in the Ontario Superior Court of Justice and Federal Court of Canada, respectively, claiming violations of antitrust law and the common law relating to alleged manipulation of secondary trading of SSA bonds. The complaints rely on allegations similar to those in the U.S. class actions involving SSA bond trading, and seek compensatory and punitive damages. The cases are in their early stages.
Deutsche Bank was named as a defendant in a consolidated putative class action filed in the U.S. District Court for the Southern District of New York alleging violations of U.S. antitrust law and a claim for unjust enrichment relating to Mexican government bond trading. In October 2019, the court granted defendants’ motion to dismiss plaintiffs’ consolidated amended complaint without prejudice. In December 2019, plaintiffs filed a Second Amended Complaint, which the court dismissed without prejudice on November 30, 2020. On May 20, 2021, plaintiffs filed a motion for reconsideration. On January 22, 2021, Deutsche Bank was notified that the Mexican competition authority, COFECE, reached a resolution that imposes fines against DB Mexico and two of its former traders, as well as six other financial institutions and nine other traders, for engaging in alleged monopolistic practices in the Mexican government bond secondary market. DB Mexico has appealed. The fine against DB Mexico was approximately
U.S. $
427,000
.
Deutsche Bank was also named as a defendant in several putative class action complaints filed in the U.S. District Court for the Southern District of New York alleging violations of antitrust law and common law related to alleged manipulation of the secondary trading market for U.S. Agency bonds; on September 3, 2019, the court denied a motion to dismiss the complaint. Deutsche Bank has reached an agreement to settle the class actions for the amount of
U.S. $
15
million
, which amount was already fully reflected in existing litigation reserves and no additional provision was taken for this settlement amount. The court granted preliminary approval over the settlement on October 29, 2019, supported by an opinion issued November 8, 2019. The court held a final fairness hearing on June 9, 2020. On June 18, 2020, the court entered final judgement approving the class action settlement with Deutsche Bank and separately as to the class action settlements with the other defendants which will result in a total of
U.S. $
386.5
million
paid to the settlement class. A separate action was filed in the U.S. District Court for the Middle District of Louisiana on September 23, 2019, which was dismissed with prejudice as to Deutsche Bank by stipulation of the parties on October 30, 2019.
Other than as noted above, the Group has not disclosed whether it has established provisions or contingent liabilities with respect to the matters referred to above because it has concluded that such disclosure can be expected to prejudice seriously their outcome.
US Treasury Securities Investigations.
Deutsche Bank has received inquiries from certain regulatory and law enforcement authorities, including requests for information and documents, pertaining to U.S. Treasuries auctions, trading, and related market activity. Deutsche Bank has cooperated with these investigations.
|
262
|
|
|
Deutsche Bank
|
Additional Notes
|
|
|
Annual Report 2021
|
|
|
|
|
|
Deutsche Bank‘s subsidiary Deutsche Bank Securities Inc. (DBSI) was a defendant in several putative class actions alleging violations of U.S. antitrust law, the U.S. Commodity Exchange Act and common law related to the alleged manipulation of the U.S. Treasury securities market. These cases have been consolidated in the Southern District of New York. On November 16, 2017, plaintiffs filed a consolidated amended complaint, which did not name DBSI as a defendant. On December 11, 2017, the court dismissed DBSI from the class action without prejudice. On March 31, 2021, the court granted the defendants’ motion to dismiss. On May 14, 2021, the plaintiffs filed a second amended complaint, which also did not name DBSI as a defendant.
On June 18, 2020, the CFTC entered an order pursuant to settlement with DBSI for alleged spoofing by two Tokyo-based traders between January and December 2013. Without admitting or denying the findings or conclusions therein, Deutsche Bank consented to the entry of the order, including a civil monetary fine of
U.S. $
1.25
million
.
U.S. Treasury Spoofing Litigation.
Following the Bank’s settlement with the CFTC five separate putative class actions were filed in the Northern District of Illinois against Deutsche Bank AG and DBSI. The cases allege that Deutsche Bank and other unnamed entities participated in a scheme from January to December 2013 to spoof the market for Treasuries futures and options contracts and Eurodollars futures and options contracts. Plaintiffs filed a consolidated complaint on November 13, 2020. Deutsche Bank AG and DBSI filed a motion to dismiss on January 15, 2021; briefing on the motion to dismiss concluded on April 16, 2021. On September 20, 2021, the judge ordered supplemental briefing on the issues of Article III standing and jurisdictional discovery. Plaintiffs filed their opening brief on October 11, 2021, with briefing complete on November 1, 2021.
The Group has not disclosed whether it has established a provision or contingent liability with respect to these matters because it has concluded that such disclosure can be expected to prejudice seriously their outcome.
28 –
Credit related Commitments and Contingent Liabilities
Irrevocable lending commitments and lending related contingent liabilities
In the normal course of business the Group regularly enters into irrevocable lending commitments, including fronting commitments as well as contingent liabilities consisting of financial and performance guarantees, standby letters of credit and indemnity agreements on behalf of its customers. Under these contracts the Group is required to perform under an obligation agreement or to make payments to the beneficiary based on third party’s failure to meet its obligations. For these instruments it is not known to the Group in detail if, when and to what extent claims will be made. In the event that the Group has to pay out cash in respect of its fronting commitments, the Group would immediately seek reimbursement from the other syndicate lenders. The Group considers all the above instruments in monitoring the credit exposure and may require collateral to mitigate inherent credit risk. If the credit risk monitoring provides sufficient perception about a loss from an expected claim, a provision is established and recorded on the balance sheet.
The following table shows the Group’s revocable lending commitments, irrevocable lending commitments and lending related contingent liabilities without considering collateral or provisions. It shows the maximum potential utilization of the Group in case all these liabilities entered into must be fulfilled. The table therefore does not show the expected future cash flows from these liabilities as many of them will expire without being drawn and arising claims will be honored by the customers or can be recovered from proceeds of arranged collateral.
Irrevocable lending commitments and lending related contingent liabilities
|
in € m.
|
|
Dec 31, 2021
|
|
Dec 31, 2020
|
|
Irrevocable lending commitments
|
|
|
|
|
|
Revocable lending commitments
|
|
|
|
|
|
Contingent liabilities
|
|
|
|
|
|
Total
|
|
|
|
|
|
|
|
|
|
|
Other commitments and other contingent liabilities
The following table shows the Group’s other irrevocable commitments and other contingent liabilities without considering collateral or provisions. It shows the maximum potential utilization of the Group in case all these liabilities entered into must be fulfilled. The table therefore does not show the expected future cash flows from these liabilities as many of them will expire without being drawn and arising claims will be honored by the customers or can be recovered from proceeds of arranged collateral.
Other commitments and other contingent liabilities
|
in € m.
|
|
Dec 31, 2021
|
|
Dec 31, 2020
|
|
Other commitments
|
|
|
|
|
|
Other contingent liabilities
|
|
|
|
|
|
Total
|
|
|
|
|
|
|
|
|
|
|
|
263
|
|
|
Deutsche Bank
|
Additional Notes
|
|
|
Annual Report 2021
|
|
|
|
|
|
Government Assistance
In the course of its business, the Group regularly applies for and receives government support by means of Export Credit Agency (“ECA”) guarantees covering transfer and default risks for the financing of exports and investments into Emerging Markets and to a lesser extent, developed markets for Structured Trade Export Finance and short- and medium-term Trade Finance business. Almost all export-oriented states have established such ECAs to support their domestic exporters. The ECAs act in the name and on behalf of the government of their respective country and are either constituted directly as governmental departments or organized as private companies vested with the official mandate of the government to act on its behalf. Terms and conditions of such ECA guarantees are broadly similar due to the fact that most of the ECAs act within the scope of the Organization for Economic Cooperation and Development (“OECD”) consensus rules. The OECD consensus rules, an intergovernmental agreement of the OECD member states, define benchmarks intended to ensure that a fair competition between different exporting nations will take place.
In some countries dedicated funding programs with governmental support are offered for ECA-covered financings. The Group makes use of such programs to assist its clients in the financing of exported goods and services. In certain financings, the Group also receives government guarantees from national and international governmental institutions as collateral to support financings in the interest of the respective governments. The majority of such ECA guarantees received by the Group were issued either by Korean Export Credit Agencies (Korea Trade Insurance Corporation and The Export-Import Bank of Korea) acting on behalf of the Republic of Korea, by the Euler-Hermes Kreditversicherungs-AG acting on behalf of the Federal Republic of Germany, by the UK Export Finance Agency acting on behalf of the United Kingdom of Great Britain and Northern Ireland or by the Italian Export Credit Agency (SACE S.p.A.) acting on behalf of the Italian Republic.
Irrevocable payment commitments with regard to levies
Irrevocable payment commitments related to bank levy according to Bank Recovery and Resolution Directive (BRRD), the Single Resolution Fund (SRF) and the German deposit protection amounted to
€
1,078.8
million
as of December 31, 2021, and to
€
915.6
million
as of December 31, 2020.
29 –
Other Short-Term Borrowings
|
in € m.
|
|
Dec 31, 2021
|
|
Dec 31, 2020
|
|
Other short-term borrowings:
|
|
|
|
|
|
Commercial paper
|
|
|
|
|
|
Other
|
|
|
|
|
|
Total other short-term borrowings
|
|
|
|
|
|
|
|
|
|
|
30 –
Long-Term Debt and Trust Preferred Securities
Long-Term Debt by Earliest Contractual Maturity
|
in € m.
|
|
Due in
2022
|
|
Due in
2023
|
|
Due in
2024
|
|
Due in
2025
|
|
Due in
2026
|
|
Due after
2026
|
|
Total
Dec 31,
2021
|
|
Total
Dec 31,
2020
|
|
Senior debt:
|
|
|
|
|
|
|
|
|
|
|
|
|
|
|
|
|
|
Bonds and notes:
|
|
|
|
|
|
|
|
|
|
|
|
|
|
|
|
|
|
Fixed rate
|
|
|
|
|
|
|
|
|
|
|
|
|
|
|
|
|
|
Floating rate
|
|
|
|
|
|
|
|
|
|
|
|
|
|
|
|
|
|
Other
|
|
|
|
|
|
|
|
|
|
|
|
|
|
|
|
|
|
Subordinated debt:
|
|
|
|
|
|
|
|
|
|
|
|
|
|
|
|
|
|
Bonds and notes:
|
|
|
|
|
|
|
|
|
|
|
|
|
|
|
|
|
|
Fixed rate
|
|
|
|
|
|
|
|
|
|
|
|
|
|
|
|
|
|
Floating rate
|
|
|
|
|
|
|
|
|
|
|
|
|
|
|
|
|
|
Other
|
|
|
|
|
|
|
|
|
|
|
|
|
|
|
|
|
|
Total long-term debt
|
|
|
|
|
|
|
|
|
|
|
|
|
|
|
|
|
|
|
|
|
|
|
|
|
|
|
|
|
|
|
|
|
|
|
1
Prior years' comparatives aligned to presentation in the current year.
The Group did not have any defaults of principal, interest or other breaches with respect to its liabilities in 2021 and 2020.
Trust Preferred Securities
1
|
in € m.
|
|
Dec 31, 2021
|
|
Dec 31, 2020
|
|
Fixed rate
|
|
|
|
|
|
Floating rate
|
|
|
|
|
|
Total trust preferred securities
|
|
|
|
|
|
|
|
|
|
|
1
Perpetual instruments, redeemable at specific future dates at the Group’s option.
|
264
|
|
|
Deutsche Bank
|
Additional Notes
|
|
|
Annual Report 2021
|
|
|
|
|
|
31 –
Maturity Analysis of the earliest contractual undiscounted cash flows of Financial Liabilities
|
|
|
Dec 31, 2021
|
||||||||
|
in € m.
|
|
On demand
|
|
Due within
3 months
|
|
Due between
3 and 12
months
|
|
Due between
1 and 5 years
|
|
Due after
5 years
|
|
Noninterest bearing deposits
|
|
|
|
|
|
|
|
|
|
|
|
Interest bearing deposits
|
|
|
|
|
|
|
|
|
|
|
|
Trading liabilities
1
|
|
|
|
|
|
|
|
|
|
|
|
Negative market values from derivative financial
instruments
1
|
|
|
|
|
|
|
|
|
|
|
|
Financial liabilities designated at fair value
through profit or loss
|
|
|
|
|
|
|
|
|
|
|
|
Investment contract liabilities
2
|
|
|
|
|
|
|
|
|
|
|
|
Negative market values from derivative financial
instruments qualifying for hedge accounting
3
|
|
|
|
|
|
|
|
|
|
|
|
Central bank funds purchased
|
|
|
|
|
|
|
|
|
|
|
|
Securities sold under repurchase agreements
|
|
|
|
|
|
|
|
|
|
|
|
Securities loaned
|
|
|
|
|
|
|
|
|
|
|
|
Other short-term borrowings
|
|
|
|
|
|
|
|
|
|
|
|
Long-term debt
|
|
|
|
|
|
|
|
|
|
|
|
Trust preferred securities
|
|
|
|
|
|
|
|
|
|
|
|
Lease liabilities
|
|
|
|
|
|
|
|
|
|
|
|
Other financial liabilities
|
|
|
|
|
|
|
|
|
|
|
|
Off-balance sheet loan commitments
|
|
|
|
|
|
|
|
|
|
|
|
Financial guarantees
|
|
|
|
|
|
|
|
|
|
|
|
Total
4
|
|
|
|
|
|
|
|
|
|
|
|
|
|
|
|
|
|
|
|
|
|
|
1
Trading liabilities and derivatives not qualifying for hedge accounting balances are recorded at fair value. The Group believes that this best represents the cash flow that would have to be paid if these positions had to be closed out. Trading liabilities and derivatives not qualifying for hedge accounting balances are shown within “on demand” which Group’s management believes most accurately reflects the short-term nature of trading activities. The contractual maturity of the instruments may however extend over significantly longer periods.
2
These are investment contracts where the policy terms and conditions result in their redemption value equaling fair value.
3
Derivatives designated for hedge accounting are recorded at fair value and are shown in the time bucket at which the hedged relationship is expected to terminate.
4
The balances in the table do not agree to the numbers in the Group’s balance sheet as the cash flows included in the table are undiscounted. This analysis represents the worst case scenario for the Group if the Group was required to repay all liabilities earlier than expected. The Group believes that the likelihood of such an event occurring is remote.
|
|
|
Dec 31, 2020
|
||||||||
|
in € m.
|
|
On demand
|
|
Due within
3 months
|
|
Due between
3 and 12
months
|
|
Due between
1 and 5 years
|
|
Due after
5 years
|
|
Noninterest bearing deposits
|
|
|
|
|
|
|
|
|
|
|
|
Interest bearing deposits
|
|
|
|
|
|
|
|
|
|
|
|
Trading liabilities
1
|
|
|
|
|
|
|
|
|
|
|
|
Negative market values from derivative financial
instruments
1
|
|
|
|
|
|
|
|
|
|
|
|
Financial liabilities designated at fair value
through profit or loss
|
|
|
|
|
|
|
|
|
|
|
|
Investment contract liabilities
2
|
|
|
|
|
|
|
|
|
|
|
|
Negative market values from derivative financial
instruments qualifying for hedge accounting
3
|
|
|
|
|
|
|
|
|
|
|
|
Central bank funds purchased
|
|
|
|
|
|
|
|
|
|
|
|
Securities sold under repurchase agreements
|
|
|
|
|
|
|
|
|
|
|
|
Securities loaned
|
|
|
|
|
|
|
|
|
|
|
|
Other short-term borrowings
|
|
|
|
|
|
|
|
|
|
|
|
Long-term debt
|
|
|
|
|
|
|
|
|
|
|
|
Trust preferred securities
|
|
|
|
|
|
|
|
|
|
|
|
Lease liabilities
|
|
|
|
|
|
|
|
|
|
|
|
Other financial liabilities
|
|
|
|
|
|
|
|
|
|
|
|
Off-balance sheet loan commitments
|
|
|
|
|
|
|
|
|
|
|
|
Financial guarantees
|
|
|
|
|
|
|
|
|
|
|
|
Total
4
|
|
|
|
|
|
|
|
|
|
|
|
|
|
|
|
|
|
|
|
|
|
|
1
Trading liabilities and derivatives not qualifying for hedge accounting balances are recorded at fair value. The Group believes that this best represents the cash flow that would have to be paid if these positions had to be closed out. Trading liabilities and derivatives not qualifying for hedge accounting balances are shown within “on demand” which Group’s management believes most accurately reflects the short-term nature of trading activities. The contractual maturity of the instruments may however extend over significantly longer periods.
2
These are investment contracts where the policy terms and conditions result in their redemption value equaling fair value.
3
Derivatives designated for hedge accounting are recorded at fair value and are shown in the time bucket at which the hedged relationship is expected to terminate.
4
The balances in the table do not agree to the numbers in the Group’s balance sheet as the cash flows included in the table are undiscounted. This analysis represents the worst case scenario for the Group if the Group was required to repay all liabilities earlier than expected. The Group believes that the likelihood of such an event occurring is remote.
|
265
|
|
|
Deutsche Bank
|
Additional Notes
|
|
|
Annual Report 2021
|
|
|
|
|
|
Additional Notes
32 –
Common Shares
Common Shares
Deutsche Bank’s share capital consists of common shares issued in registered form without par value. Under German law, each share represents an equal stake in the subscribed capital. Therefore, each share has a nominal value of
€
2.56
, derived by dividing the total amount of share capital by the number of shares.
|
Number of shares
|
|
Issued and
fully paid
|
|
Treasury shares
|
|
Outstanding
|
|
Common shares, January 1, 2020
|
|
|
|
(
|
|
|
|
Shares issued under share-based compensation plans
|
|
|
|
|
|
|
|
Capital increase
|
|
|
|
|
|
|
|
Shares purchased for treasury
|
|
|
|
(
|
|
(
|
|
Shares sold or distributed from treasury
|
|
|
|
|
|
|
|
Common shares, December 31, 2020
|
|
|
|
(
|
|
|
|
Shares issued under share-based compensation plans
|
|
|
|
|
|
|
|
Capital increase
|
|
|
|
|
|
|
|
Shares purchased for treasury
|
|
|
|
(
|
|
(
|
|
Shares sold or distributed from treasury
|
|
|
|
|
|
|
|
Common shares, December 31, 2021
|
|
|
|
(
|
|
|
|
|
|
|
|
|
|
|
There are no issued ordinary shares that have not been fully paid.
Shares purchased for treasury mainly consist of shares purchased with the intention of being resold in the short-term as well as held by the Group for a period of time. In addition, the Group has bought back shares for equity compensation purposes. All such transactions were recorded in shareholders’ equity and no revenues and expenses were recorded in connection with these activities. Treasury stock held as of year-end will mainly be used for future share-based compensation.
Authorized Capital
The Management Board is authorized to increase the share capital by issuing new shares for cash consideration. As of December 31, 2021, Deutsche Bank AG had authorized but unissued capital of
€
2,560,000,000
which may be issued in whole or in part until April 30, 2026. Further details are governed by Section 4 of the Articles of Association.
|
Authorized capital
|
Consideration
|
Pre-emptive rights
|
Expiration date
|
|||
|
€
|
Cash
|
May be excluded pursuant to Section 186 (3) sentence 4 of the Stock Corporation Act and may be excluded in so far as it is necessary to grant pre-emptive rights to the holders of option rights, convertible bonds and convertible participatory rights
|
April 30, 2026
|
|||
|
€
|
Cash
|
May be excluded in so far as it is necessary to grant pre-emptive rights to the holders of option rights, convertible bonds and convertible participatory rights.
|
|
April 30, 2026
|
||
|
|
|
|
|
|
|
|
Conditional Capital
The Management Board is authorized to issue once or more than once, participatory notes that are linked with conversion rights or option rights and/or convertible bonds and/or bonds with warrants. The participatory notes, convertible bonds or bonds with warrants may also be issued by affiliated companies of Deutsche Bank AG. For this purpose share capital was increased conditionally upon exercise of these conversion and/or exchange rights or upon mandatory conversion.
|
Conditional capital
|
|
|
Purpose of conditional capital
|
|
|
Expiration date
|
||
|
€
|
|
|
May be used if holders of conversion or option rights that are linked with participatory notes or convertible bonds or bonds with warrants make use of their conversion or option rights or holders with conversion obligations of convertible participatory notes or convertible bonds fulfill their obligation to convert.
|
|
|
April 30, 2022
|
||
|
€
|
|
|
May be used to fulfill options that are awarded on or before the expiration date and will only be used to the extent that holders of issued options make use of their right to receive shares and shares are not delivered out of treasury shares
|
|
|
April 30, 2022
|
||
|
|
|
|
|
|
|
|
||
|
266
|
|
|
Deutsche Bank
|
Additional Notes
|
|
|
Annual Report 2021
|
|
|
|
|
|
Dividends
The following table presents the amount of dividends proposed or declared for the years ended December 31, 2021, 2020 and 2019, respectively.
|
|
|
2021
(proposed)
|
|
2020
|
|
2019
|
|
Cash dividends declared (in € )
|
|
|
|
|
|
|
|
Cash dividends declared per common share (in €)
|
|
|
|
|
|
|
|
|
|
|
|
|
|
|
No dividends have been declared since the balance sheet date.
33 –
Employee Benefits
Share-Based Compensation Plans
The Group made grants of share-based compensation under the DB Equity Plan. This plan represents a contingent right to receive Deutsche Bank common shares after a specified period of time. The award recipient is not entitled to receive dividends during the vesting period of the award.
The share awards granted under the terms and conditions of the DB Equity Plan may be forfeited fully or partly if the recipient voluntarily terminates employment before the end of the relevant vesting period (or release period for Upfront Awards). Vesting usually continues after termination of employment in cases such as redundancy or retirement. Deferred share awards are subject to forfeiture provisions and performance conditions until release.
In countries where legal or other restrictions hinder the delivery of shares, a cash plan variant of the DB Equity Plan was used for granting awards, and for employees of certain legal entities, deferred equity is replaced with restricted shares due to local regulatory requirements.
Please note that this table does not cover awards granted to the Management Board, and from 2018 this table does not cover AIFMD/UCITS MRTs, or DWS Share-Based Compensation Payments, please refer to separate DWS section that covers grants to this population.
|
267
|
|
|
Deutsche Bank
|
Additional Notes
|
|
|
Annual Report 2021
|
|
|
|
|
|
The following table sets forth the basic terms of these share plans:
|
Grant year(s)
|
|
Deutsche Bank Equity Plan
|
|
Vesting schedule
|
|
Eligibility
|
|
2019-2021
|
|
Annual Award
|
|
1/4: 12 months
1
|
|
Select employees as
|
|
|
|
|
|
1/4: 24 months
1
|
|
annual performance-based
|
|
|
|
|
|
1/4: 36 months
1
|
|
compensation
|
|
|
|
|
|
1/4: 48 months
1
|
|
(CB/IB/CRU and InstVV MRTs in an MBU)
2
|
|
|
|
Annual Award
|
|
1/3: 12 months
1
|
|
Select employees as
|
|
|
|
|
|
1/3: 24 months
1
|
|
annual performance-based
|
|
|
|
|
|
1/3: 36 months
1
|
|
compensation (non-CB/IB/CRU)
2
|
|
|
|
|
|
|
|
|
|
|
|
Annual Award
|
|
1/5: 12 months
1
|
|
Select employees as
|
|
|
|
|
|
1/5: 24 months
1
|
|
annual performance-based
|
|
|
|
|
|
1/5: 36 months
1
|
|
compensation (Senior Management)
|
|
|
|
|
|
1/5: 48 months
1
|
|
|
|
|
|
|
|
1/5: 60 months
1
|
|
|
|
|
|
Retention/New Hire
|
|
Individual specification
|
|
Select employees to attract and
retain the best talent
|
|
|
|
Annual Award – Upfront
|
|
Vesting immediately at grant
3
|
|
Regulated employees
|
|
2017 -2018
|
|
Annual Award
|
|
1/4: 12 months
1
|
|
Select employees as
|
|
|
|
|
|
1/4: 24 months
1
|
|
annual performance-based
|
|
|
|
|
|
1/4: 36 months
1
|
|
compensation
|
|
|
|
|
|
1/4: 48 months
1
|
|
|
|
|
|
|
|
Or cliff vesting after 54 months
1
|
|
Members of Senior Leadership Cadre
|
|
|
|
Retention/New Hire
|
|
Individual specification
|
|
Select employees to attract and retain the best talent
|
|
|
|
Key Retention Plan (KRP)
4
|
|
1/2: 50 months
3
|
|
Material Risk Takers (MRTs)
|
|
|
|
|
|
1/2: 62 months
3
|
|
|
|
|
|
|
|
Cliff vesting after 43 months
|
|
Non-Material Risk Takers (non-MRTs)
|
|
2016
|
|
Key Position Award (KPA)
5
|
|
Cliff-vesting after 4 years
3
|
|
Select employees as annual retention
|
|
|
|
|
|
|
|
|
1
For InstVV-regulated employees (and Senior Management) a further retention period of twelve months applies (six months for awards granted from 2017 -2018).
2
For grant year 2019 divisions were called CIB, for grant years 2020 and 2021 CIB is split into CB/IB/CRU.
3
Share delivery takes place after a further retention period of twelve months.
4
Equity-based awards granted under this plan in January 2017 were subject to an additional share price condition and were forfeited as a result of this condition not being met.
5
A predefined proportion of the individual’s KPA was subject to an additional share price condition and was forfeited as a result of this condition not being met.
Furthermore, the Group offers a broad-based employee share ownership plan entitled Global Share Purchase Plan (“GSPP”). The GSPP offers employees in specific countries the opportunity to purchase Deutsche Bank shares in monthly installments over one year. At the end of the purchase cycle, the Group matches the acquired stock in a ratio of one to one up to a maximum of ten free shares, provided that the employee remains at Deutsche Bank Group for another year. In total, about
11,838
staff from
18
countries enrolled in the twelfth cycle that began in November 2021.
The Group has other local share-based compensation plans, none of which, individually or in the aggregate, are material to the consolidated financial statements.
The following table sets out the movements in share award units, including grants under the cash plan variant of the DB Equity Plan.
|
Share units (in thousands)
|
|
2021
|
|
2020¹
|
|
Balance outstanding as of January 01
|
|
|
|
|
|
Granted
|
|
|
|
|
|
Released
|
|
(
|
|
(
|
|
Forfeited
|
|
(
|
|
(
|
|
Other movements
|
|
(
|
|
(
|
|
Balance outstanding as of December 31
|
|
|
|
|
|
|
|
|
|
|
1
2020 share units restated
The DB Equity Plan includes awards with share price hurdles under both the Key Position Award and the Key Retention Plan. The share price hurdle condition for both plans was measured during 2020 and was not met. As a result approximately 56 million share units were forfeited. In accordance with IFRS 2 the forfeiture due to a market performance condition did not result in a reversal to the recorded expense.
The following table sets out key information regarding awards granted, released and remaining in the year.
|
|
|
2021
|
|
2020
|
||||||||
|
|
|
Weighted average fair value per award granted in year
|
|
Weighted average share price at release in year
|
|
Weighted average remaining contractual life in years
|
|
Weighted average fair value per award granted in the year
|
|
Weighted average share price at release in year
|
|
Weighted average remaining contractual life in years
|
|
DB Equity Plan
|
|
€
|
|
€
|
|
|
|
€
|
|
€
|
|
|
|
|
|
|
|
|
|
|
|
|
|
|
|
|
Share-based payment transactions resulting in a cash payment give rise to a liability, which amounted to approximately
€
8
million
and
€
8
million
for the years ended December 31, 2021 and 2020, respectively.
The grant volume of outstanding share awards was approximately
€
0.9
billion
and
€
0.9
billion
as of December 31, 2021 and 2020, respectively. Thereof, approximately
€
0.7
billion
and
€
0.7
billion
had been recognized as compensation expense in the reporting year or prior to that. Hence, compensation expense for deferred share-based compensation not yet recognized amounted to approximately
€
0.2
billion
and
€
0.2
billion
as of December 31, 2021 and 2020, respectively.
DWS Share-Based Compensation Plans
The DWS Group made grants of share-based compensation under the DWS Equity Plan. This plan represents a contingent right to receive a cash payment by referencing to the value of DWS shares during a specified time period.
In September 2018 one-off IPO related awards under the DWS Stock Appreciation Rights (SAR) Plan were granted to all DWS employees. A limited number of DWS senior managers were granted a one-off IPO-related Performance Share Unit (PSU) under the DWS Equity Plan instead. For members of the Executive Board, one-off IPO-related awards under the DWS Equity Plan were granted in January 2019.
The DWS SAR Plan represents a contingent right to receive a cash payment equal to any appreciation (or gain) in the value of a set number of notional DWS shares over a fixed period of time. This award does not provide any entitlement to receive DWS shares, voting rights or associated dividends.
The DWS Equity Plan is a phantom share plan representing a contingent right to receive a cash payment by referencing to the value of DWS shares during a specified period of time.
The award recipient for any share-based compensation plan is not entitled to receive dividends during the vesting period of the award.
|
268
|
|
|
Deutsche Bank
|
Additional Notes
|
|
|
Annual Report 2021
|
|
|
|
|
|
The share awards granted under the terms and conditions of any share-based compensation plan are forfeited fully or partly if the recipient voluntarily terminates employment before the end of the relevant vesting period (or the end of the retention period for Upfront Awards). Vesting usually continues after termination of employment in cases such as redundancy or retirement.
The following table sets forth the basic terms of the DWS share-based plans:
|
Grant year(s)
|
|
Award Type
|
|
Vesting schedule
|
|
Eligibility
|
|
2021
|
|
Annual Awards
|
|
1/4: 12 months
1
|
|
Select employees as annual
|
|
|
|
|
|
1/4: 24 months
1
|
|
performance-based
|
|
|
|
|
|
1/4: 36 months
1
|
|
compensation (InstVV MRTs)
|
|
|
|
|
|
1/4: 48 months
1
|
|
|
|
|
|
Annual Awards
|
|
1/3: 12 months
1
|
|
Select employees as annual
|
|
|
|
|
|
1/3: 24 months
1
|
|
performance-based
|
|
|
|
|
|
1/3: 36 months
1
|
|
compensation (non-InstVV MRTs)
|
|
|
|
Annual Awards (Senior Management)
|
|
1/5: 12 months
1
|
|
Members of the Executive Board
|
|
|
|
|
|
1/5: 24 months
1
|
|
|
|
|
|
|
|
1/5: 36 months
1
|
|
|
|
|
|
|
|
1/5: 48 months
1
|
|
|
|
|
|
|
|
1/5: 60 months
1
|
|
|
|
|
|
Annual Award - Upfront
|
|
Vesting immediately at grant
1
|
|
Regulated employees
|
|
|
|
Retention/New Hire
|
|
Individual specification
|
|
Select employees to attract and retain the best talent
|
|
2019-2020
|
|
Annual Awards
|
|
1/3: 12 months
1
|
|
Select employees as annual performance-based
|
|
|
|
|
|
1/3: 24 months
1
|
|
compensation
|
|
|
|
|
|
1/3: 36 months
1
|
|
|
|
|
|
Annual Awards (Senior Management)
|
|
1/5: 12 months
1
|
|
Members of the Executive Board
|
|
|
|
|
|
1/5: 24 months
1
|
|
|
|
|
|
|
|
1/5: 36 months
1
|
|
|
|
|
|
|
|
1/5: 48 months
1
|
|
|
|
|
|
|
|
1/5: 60 months
1
|
|
|
|
|
|
Annual Award - Upfront
|
|
Vesting immediately at grant
1
|
|
Regulated employees
|
|
|
|
Retention/New Hire
|
|
Individual specification
|
|
Select employees to attract and retain the best talent
|
|
|
|
Performance Share Unit (PSU) Award
|
|
1/3: March 2022
1
|
|
Members of the Executive Board
|
|
|
|
(one-off IPO related award granted in 2019)
|
|
1/3: March 2023
1
|
|
|
|
|
|
|
|
1/3: March 2024
1
|
|
|
|
2018
|
|
Retention/New Hire
|
|
Individual specification
|
|
Select employees to attract and retain the best talent
|
|
|
Performance Share Unit (PSU) Award
|
|
1/3: March 2022
1
|
|
Select Senior Managers
|
|
|
|
(one-off IPO related award )
1
|
|
1/3: March 2023
1
|
|
|
|
|
|
|
|
1/3: March 2024
1
|
|
|
|
|
|
SAR Award (one-off IPO related award)
|
|
For non-MRTs:
1 June 2021
3
|
|
all DWS employees
2
|
|
|
|
|
|
For MRTs:
1 March 2023
1,3
|
|
|
|
|
|
|
|
|
|
|
1
Depending on their individual regulatory status, a six months retention period (AIFMD/UCITS MRTs) or a 12-months retention period (InstVV MRTs) applies after vesting.
2
Unless the employee received PSU Award.
3
In 2020, two Early Exercise windows were offered to non-MRTs leading to accelerated vesting and exercise upon acceptance. For outstanding awards, a 4-year exercise period applies following vesting/retention period.
The following table sets out the movements in share award units.
|
|
|
DWS Equity Plan
|
|
DWS SAR Plan
|
||||||||
|
|
|
2021
|
|
2020
|
|
2021
|
|
2020
|
||||
|
Share units (in thousands)
|
|
Number of Awards
|
|
Number of Awards
|
|
Number of Awards
|
|
Weighted-average exercise price
|
|
Number of Awards
|
|
Weighted-average exercise price
|
|
Outstanding at beginning of year
|
|
|
|
2,040
|
|
|
|
€
|
|
2,087
|
|
€ 24.65
|
|
Granted
|
|
|
|
|
|
|
|
|
|
|
|
|
|
Issued or Exercised
|
|
(
|
|
(
|
|
(
|
|
€
|
|
(
|
|
€
|
|
Forfeited
|
|
(
|
|
(
|
|
(
|
|
€
|
|
(
|
|
€
|
|
Expired
|
|
|
|
|
|
(
|
|
€
|
|
|
|
|
|
Other Movements
|
|
(
|
|
(
|
|
|
|
€
|
|
(
|
|
€
|
|
Outstanding at end of year
|
|
|
|
|
|
|
|
€
|
|
|
|
€
|
|
Of which, exercisable
|
|
|
|
|
|
|
|
|
|
|
|
|
|
|
|
|
|
|
|
|
|
|
|
|
|
|
|
269
|
|
|
Deutsche Bank
|
Additional Notes
|
|
|
Annual Report 2021
|
|
|
|
|
|
The following table sets out key information regarding awards granted, released and remaining in the year.
|
|
|
2021
|
|
2020
|
||||||||
|
|
|
Weighted average fair value per award granted in year
|
|
Weighted average share price at release/ exercise in year
|
|
Weighted average remaining contractual life in years
|
|
Weighted average fair value per award granted in the year
|
|
Weighted average share price at release/ exercise in year
|
|
Weighted average remaining contractual life in years
|
|
DWS Equity Plan
|
|
€
|
|
€
|
|
|
|
€
|
|
€
|
|
|
|
DWS SAR Plan
|
|
n/a
|
|
€
|
|
|
|
n/a
|
|
€
|
|
|
|
|
|
|
|
|
|
|
|
|
|
|
|
|
The fair value of outstanding share-based awards was approximately
€
83
million
and
€
85
million
as of December 31, 2021 and 2020, respectively. Of the awards, approximately
€
69
million
and
€
61
million
has been recognized in the income statement up to the period ending 2021 and 2020 respectively, of which
€
29
million
and
€
21
million
as of December 31, 2021 and 2020 relate to fully vested awards. Total unrecognized expense related to share-based plans was approximately
€
14
million
and
€
25
million
as of December 31, 2021 and 2020 respectively, dependent on future share price development.
During 2020, eligible employees were invited to exercise their SAR Awards as part of two distinct Early Exercise Offers. SAR Awards which were not exercised continue to be subject to the terms and conditions of the DWS SAR Plan Rules, including forfeiture provisions.
The fair value of the DWS SAR Plan awards have been measured using the generalized Black-Scholes model. The liabilities incurred are re-measured at the end of each reporting period until settlement. The principal inputs being the market value on reporting date, discounted for any dividends foregone over the holding periods of the award, and adjustment for expected and actual levels of vesting which includes estimating the number of eligible employees leaving the Group and number of employees eligible for early retirement. The inputs used in the measurement of the fair values at grant date and measurement date of the DWS SAR Plan awards were as follows.
|
|
|
Measurement date
Dec 31, 2021
|
|
Measurement date
Dec 31, 2020
|
|
Units (in thousands)
|
|
|
|
|
|
Fair value
|
|
€
|
|
€
|
|
Share price
|
|
€
|
|
€
|
|
Exercise price
|
|
€
|
|
€
|
|
Expected volatility (weighted-average)
|
|
|
|
|
|
Expected life (weighted-average) in years
|
|
|
|
|
|
Expected dividends (% of income)
|
|
|
|
|
|
|
|
|
|
|
Given the limited trading in the market of implied DWS share price volatility, the expected volatility of the DWS share price has been based on an evaluation of the historical volatility for a comparable peer group over the preceding 5-year period. The expected dividend level is linked to the latest DWS Group communication.
Post-employment Benefit Plans
Nature of Plans
The Group sponsors a number of post-employment benefit plans on behalf of its employees, both defined contribution plans and defined benefit plans. The Group’s plans are accounted for based on the nature and substance of the plan. Generally, for defined benefit plans the value of a participant’s accrued benefit is based on each employee’s remuneration and length of service; contributions to defined contribution plans are typically based on a percentage of each employee’s remuneration. The rest of this note focuses predominantly on the Group’s defined benefit plans.
The Group’s defined benefit plans are primarily described on a geographical basis, reflecting differences in the nature and risks of benefits, as well as in the respective regulatory environments. In particular, the requirements set by local regulators can vary significantly and determine the design and financing of the benefit plans to a certain extent. Key information is also shown based on participant status, which provides a broad indication of the maturity of the Group’s obligations.
|
270
|
|
|
Deutsche Bank
|
Additional Notes
|
|
|
Annual Report 2021
|
|
|
|
|
|
|
|
|
Dec 31, 2021
|
||||||||
|
in € m.
|
|
Germany
|
|
UK
|
|
U.S.
|
|
Other
|
|
Total
|
|
Defined benefit obligation related to
|
|
|
|
|
|
|
|
|
|
|
|
Active plan participants
|
|
|
|
|
|
|
|
|
|
|
|
Participants in deferred status
|
|
|
|
|
|
|
|
|
|
|
|
Participants in payment status
|
|
|
|
|
|
|
|
|
|
|
|
Total defined benefit obligation
|
|
|
|
|
|
|
|
|
|
|
|
Fair value of plan assets
|
|
|
|
|
|
|
|
|
|
|
|
Funding ratio (in %)
|
|
|
|
|
|
|
|
|
|
|
|
|
|
|
|
|
|
|
|
|
|
|
1
US Total defined benefit obligation is inclusive of the unfunded US Medicare Plan (
€
170
million
) in addition to defined benefit pension plans. The US defined benefit pension funding ratio excluding Medicare is
97
%
.
|
|
|
Dec 31, 2020
|
||||||||
|
in € m.
|
|
Germany
|
|
UK
|
|
U.S.
|
|
Other
|
|
Total
|
|
Defined benefit obligation related to
|
|
|
|
|
|
|
|
|
|
|
|
Active plan participants
|
|
|
|
|
|
|
|
|
|
|
|
Participants in deferred status
|
|
|
|
|
|
|
|
|
|
|
|
Participants in payment status
|
|
|
|
|
|
|
|
|
|
|
|
Total defined benefit obligation
|
|
|
|
|
|
|
|
|
|
|
|
Fair value of plan assets
|
|
|
|
|
|
|
|
|
|
|
|
Funding ratio (in %)
|
|
|
|
|
|
|
|
|
|
|
|
|
|
|
|
|
|
|
|
|
|
|
1
US Total defined benefit obligation is inclusive of the unfunded US Medicare Plan (
€
168
million
) in addition to defined benefit pension plans. The US defined benefit pension funding ratio excluding Medicare is
96
%
.
The majority of the Group’s defined benefit plan obligations relate to Germany, the United Kingdom and the United States. Within the other countries, the largest obligation relates to Switzerland. In Germany and some continental European countries, post-employment benefits are usually agreed on a collective basis with respective employee workers councils, unions or their equivalent. The Group’s main pension plans are governed by boards of trustees, fiduciaries or their equivalent.
Post-employment benefits can form an important part of an employee’s total remuneration. The Group’s approach is that their design shall be attractive to employees in the respective market, but sustainable for the Group to provide over the longer term. At the same time, the Group tries to limit its risks related to provision of such benefits. Consequently, the Group has moved to offer defined contribution plans in many locations over recent years.
In the past the Group typically offered pension plans based on final pay prior to retirement. These types of benefits still form a significant part of the pension obligations for participants in deferred and payment status. Currently, in Germany and the United States, the main defined benefit pension plans for active staff are cash account type plans where the Group credits an annual amount to individual accounts based on an employee’s current compensation. Dependent on the plan rules, the accounts increase either at a fixed interest rate or participate in market movements of certain underlying investments to limit the investment risk for the Group. Sometimes, in particular in Germany, there is a guaranteed benefit amount within the plan rules, e.g. payment of at least the amounts contributed. Upon retirement, beneficiaries may usually opt for a lump sum, a fixed number of annual instalments or for conversion of the accumulated account balance into a life annuity. This conversion is often based on market conditions and mortality assumptions at retirement.
The Group also sponsors retirement and termination indemnity plans in several countries, as well as some post-employment medical plans for a number of current and retired employees, mainly in the United States. The post-employment medical plans typically pay fixed percentages of medical expenses of eligible retirees after a set deductible has been met. In the United States, once a retiree is eligible for Medicare, the Group contributes to a Health Reimbursement Account and the retiree is no longer eligible for the Group’s medical program. The Group’s total defined benefit obligation for post-employment medical plans was
€
201
million
and
€
202
million
at December 31, 2021 and December 31, 2020, respectively. In combination with the benefit structure, these plans represent limited risk for the Group, given the nature and size of the post-retirement medical plan liabilities versus the size of the Group’s balance sheet at year end 2021.
The following amounts of expected benefit payments from the Group’s defined benefit plans include benefits attributable to employees’ past and estimated future service and include both amounts paid from the Group’s external pension trusts and paid directly by the Group in respect of unfunded plans.
|
in € m.
|
|
Germany
|
|
UK
|
|
U.S.
|
|
Other
|
|
Total
|
|
Actual benefit payments 2021
|
|
|
|
|
|
|
|
|
|
|
|
Benefits expected to be paid 2022
|
|
|
|
|
|
|
|
|
|
|
|
Benefits expected to be paid 2023
|
|
|
|
|
|
|
|
|
|
|
|
Benefits expected to be paid 2024
|
|
|
|
|
|
|
|
|
|
|
|
Benefits expected to be paid 2025
|
|
|
|
|
|
|
|
|
|
|
|
Benefits expected to be paid 2026
|
|
|
|
|
|
|
|
|
|
|
|
Benefits expected to be paid 2027 – 2031
|
|
|
|
|
|
|
|
|
|
|
|
Weighted average duration of defined benefit
obligation (in years)
|
|
14
|
|
20
|
|
11
|
|
12
|
|
15
|
|
|
|
|
|
|
|
|
|
|
|
|
Multi-employer Plans
|
271
|
|
|
Deutsche Bank
|
Additional Notes
|
|
|
Annual Report 2021
|
|
|
|
|
|
In Germany, the Group is a member of the BVV Versicherungsverein des Bankgewerbes a.G. (BVV) together with other financial institutions. The BVV offers retirement benefits to eligible employees in Germany as a complement to post-employment benefit promises of the Group. Both employers and employees contribute on a regular basis to the BVV. The BVV provides annuities of a fixed amount to individuals on retirement and increases these fixed amounts if surplus assets arise within the plan. According to legislation in Germany, the employer is ultimately liable for providing the benefits to its employees. An increase in benefits may also arise due to additional obligations to retirees for the effects of inflation. BVV is a multi-employer defined benefit plan. However, in line with industry practice, the Group accounts for it as a defined contribution plan since insufficient information is available to identify assets and liabilities relating to the Group’s current and former employees, primarily because the BVV does not fully allocate plan assets to beneficiaries nor to member companies.
Governance and Risk
The Group maintains a Pensions Committee to oversee its pension and related risks on a global basis. This Committee meets quarterly and reports directly to the Senior Executive Compensation Committee.
Within this context, the Group develops and maintains guidelines for governance and risk management, including funding, asset allocation and actuarial assumption setting.
During and after acquisitions or changes in the external environment (e.g., legislation, taxation), topics such as the general plan design or potential plan amendments are considered. Any plan changes follow a process requiring approval by Group Human Resources and, above a certain threshold, also of the Pensions Committee.
Pension risk management is embedded in the Group’s risk management organization, with strong focus on market risks given importance of capital market developments (e.g., interest rate, credit spread, price inflation) for the value of plan assets and liabilities, hence IFRS and regulatory capital. Risk management thereby encompasses regular measurement, monitoring and reporting of risks via specific metrics, as well as a risk control framework, e.g. via the establishment of risk limits or thresholds as applicable. Risk management activities also include the consideration, review and measurement of other financial risks, e.g. risks from demographic and other actuarial assumptions (e.g., longevity risk) but also the assessment of model, valuation and other non-financial risks.
In the Group’s key pension countries, the Group’s largest post-employment benefit plan risk exposures relate to potential changes in credit spreads, interest rates, price inflation and longevity, that are partially mitigated through the investment strategy adopted. To the extent that pension plans are funded, the assets held mitigate some of the liability risks, but introduce investment risk.
Overall, the Group seeks to minimize the impact of pensions on the Group’s financial position from market movements, subject to balancing the trade-offs involved in financing post-employment benefits, regulatory capital and constraints from local funding or accounting requirements.
Funding
The Group maintains various external pension trusts to fund the majority of its defined benefit plan obligations. The Group’s funding principle is to maintain funding of the defined benefit obligation by plan assets within a range of
90 %
to
100 %
of the obligation, subject to meeting any local statutory requirements. The Group has also determined that certain plans should remain unfunded, although their funding approach is subject to periodic review, e.g. when local regulations or practices change. Obligations for the Group’s unfunded plans are accrued on the balance sheet.
For many of the externally funded defined benefit plans there are local minimum funding requirements. The Group can decide on any additional plan contributions, with reference to the Group’s funding principle. There are some locations, e.g. the United Kingdom, where the trustees and the Group jointly agree contribution levels. In most countries the Group expects to receive an economic benefit from any plan surpluses of plan assets compared to defined benefit obligations, typically by way of reduced future contributions. Given the relatively high funding level and the investment strategy adopted in the Group’s key funded defined benefit plans, any minimum funding requirements that may apply are not expected to place the Group under any material adverse cash strain in the short term. With reference to the Group’s funding principle, the Group considers not re-claiming benefits paid from the Group’s assets as an equivalent to making cash contributions into the external pension trusts during the year.
For post-retirement medical plans, the Group accrues for obligations over the period of employment and pays the benefits from Group assets when the benefits become due.
Actuarial Methodology and Assumptions
December 31 is the measurement date for all plans. All plans are valued by independent qualified actuaries using the projected unit credit method. A Group policy provides guidance to ensure consistency globally on setting actuarial assumptions which are finally determined by the Group’s Pensions Committee. Senior management of the Group is regularly informed of movements and changes in key actuarial assumptions.
The key actuarial assumptions applied in determining the defined benefit obligations at December 31 are presented below in the form of weighted averages.
|
272
|
|
|
Deutsche Bank
|
Additional Notes
|
|
|
Annual Report 2021
|
|
|
|
|
|
|
|
|
Dec 31, 2021
|
|
Dec 31, 2020
|
||||||||||||
|
|
|
Germany
|
|
UK
|
|
U.S.
1
|
|
Other
|
|
Germany
|
|
UK
|
|
U.S.
1
|
|
Other
|
|
Discount rate (in %)
|
|
|
|
|
|
|
|
|
|
|
|
|
|
|
|
|
|
Rate of price inflation (in %)
|
|
|
|
|
|
|
|
|
|
|
|
|
|
|
|
|
|
Rate of nominal increase in
future compensation levels (in %)
|
|
|
|
|
|
|
|
|
|
|
|
|
|
|
|
|
|
Rate of nominal increase for
pensions in payment (in %)
|
|
|
|
|
|
|
|
|
|
|
|
|
|
|
|
|
|
|
|
|
|
|
|
|
|
|
|
|
|
|
|
|
|
|
|
Assumed life expectancy
at age 65
|
|
|
|
|
|
|
|
|
|
|
|
|
|
|
|
|
|
For a male aged 65
at measurement date
|
|
|
|
|
|
|
|
|
|
|
|
|
|
|
|
|
|
For a female aged 65
at measurement date
|
|
|
|
|
|
|
|
|
|
|
|
|
|
|
|
|
|
For a male aged 45
at measurement date
|
|
|
|
|
|
|
|
|
|
|
|
|
|
|
|
|
|
For a female aged 45
at measurement date
|
|
|
|
|
|
|
|
|
|
|
|
|
|
|
|
|
|
|
|
|
|
|
|
|
|
|
|
|
|
|
|
|
|
|
|
|
|
|
|
|
|
|
|
|
|
|
|
|
|
|
|
|
|
Mortality tables applied
|
|
Modified
Richttafeln
Heubeck
2018G
|
|
SAPS (S3)
Light/
Very Light
with CMI
2020
projections
|
|
PRI-2012
with
MP-2021
projection
|
|
Country
specific
tables
|
|
Modified
Richttafeln
Heubeck
2018G
|
|
SAPS (S3)
Light\
Very Light
with CMI
2019
projections
|
|
PRI-2012
with
MP-2020
projection
|
|
Country
specific
tables
|
|
|
|
|
|
|
|
|
|
|
|
|
|
|
|
|
|
|
1
Cash balance interest crediting rate in line with the 30-year US government bond yield
.
For the Group’s most significant pension plans in the key countries, the discount rate used at each measurement date is set based on a high quality corporate bond yield curve, which is derived using a bond universe sourced from reputable third-party market data providers, and reflects the timing, amount and currency of the future expected benefit payments for the respective plan. In Q4 2021, a revised discount curve methodology that provides improved data quality for the determination of the underlying bond universe was approved for use in the UK. The adoption of this methodology resulted in around
€
45
million
net actuarial gain that was recognized through Other Comprehensive Income. This resulted in a corresponding increase to the overall pension surplus and the net defined benefit asset, due to the net presentation of the pension plan assets and the defined benefit obligation.
The price inflation assumptions in the Eurozone and the United Kingdom are set with reference to market measures of inflation based on inflation swap rates in those markets at each measurement date. For other countries, the price inflation assumptions are typically based on long term forecasts by Consensus Economics Inc.
The assumptions for the increases in future compensation levels and for increases to pensions in payment are developed separately for each plan, where relevant. Each is set based on the price inflation assumption and reflecting the Group’s reward structure or policies in each market, as well as relevant local statutory and plan-specific requirements.
Among other assumptions, mortality assumptions can be significant in measuring the Group’s obligations under its defined benefit plans. These assumptions have been set in accordance with current best estimate in the respective countries. Future potential improvements in longevity have been considered and included where appropriate.
Due to the long-term nature of mortality assumptions and lack of clarity over the longer term impacts of the pandemic on health outcomes, there has been no specific allowance for the impact of COVID-19 in any region, other than for recent experience which was captured as part of the annual valuation process.
In the financial year ended December 31, 2020, the Group recognized a
€
48
million
of past service credit in connection with the inclusion of a lump-sum payment option to one of the German retirement benefit arrangements primarily in the Private Bank division. This reduction in defined benefit plan obligations was reported as part of Compensation and benefits in the Consolidated Statement of Income.
|
273
|
|
|
Deutsche Bank
|
Additional Notes
|
|
|
Annual Report 2021
|
|
|
|
|
|
Reconciliation in Movement of Liabilities and Assets – Impact on Financial Statements
|
|
|
2021
|
||||||||
|
in € m.
|
|
Germany
|
|
UK
|
|
U.S.
|
|
Other
|
|
Total
|
|
Change in the present value of the defined benefit obligation:
|
|
|
|
|
|
|
|
|
|
|
|
Balance, beginning of year
|
|
|
|
|
|
|
|
|
|
|
|
Defined benefit cost recognized in Profit Loss
|
|
|
|
|
|
|
|
|
|
|
|
Current service cost
|
|
|
|
|
|
|
|
|
|
|
|
Interest cost
|
|
|
|
|
|
|
|
|
|
|
|
Past service cost and gain or loss arising from settlements
|
|
|
|
(
|
|
|
|
(
|
|
|
|
Defined benefit cost recognized in Other Comprehensive Income
|
|
|
|
|
|
|
|
|
|
|
|
Actuarial gain or loss arising from changes in financial
assumptions
|
|
(
|
|
(
|
|
(
|
|
(
|
|
(
|
|
Actuarial gain or loss arising from changes in demographic assumptions
|
|
|
|
(
|
|
|
|
(
|
|
(
|
|
Actuarial gain or loss arising from experience
|
|
|
|
(
|
|
|
|
|
|
|
|
Cash flow and other changes
|
|
|
|
|
|
|
|
|
|
|
|
Contributions by plan participants
|
|
|
|
|
|
|
|
|
|
|
|
Benefits paid
|
|
(
|
|
(
|
|
(
|
|
(
|
|
(
|
|
Payments in respect to settlements
|
|
|
|
|
|
|
|
|
|
|
|
Acquisitions/Divestitures
|
|
|
|
|
|
|
|
|
|
|
|
Exchange rate changes
|
|
|
|
|
|
|
|
|
|
|
|
Other
|
|
|
|
|
|
|
|
|
|
|
|
Balance, end of year
|
|
|
|
|
|
|
|
|
|
|
|
thereof:
|
|
|
|
|
|
|
|
|
|
|
|
Unfunded
|
|
|
|
|
|
|
|
|
|
|
|
Funded
|
|
|
|
|
|
|
|
|
|
|
|
|
|
|
|
|
|
|
|
|
|
|
|
Change in fair value of plan assets:
|
|
|
|
|
|
|
|
|
|
|
|
Balance, beginning of year
|
|
|
|
|
|
|
|
|
|
|
|
Defined benefit cost recognized in Profit Loss
|
|
|
|
|
|
|
|
|
|
|
|
Interest income
|
|
|
|
|
|
|
|
|
|
|
|
Defined benefit cost recognized in Other Comprehensive Income
|
|
|
|
|
|
|
|
|
|
|
|
Return from plan assets less interest income
|
|
|
|
|
|
|
|
|
|
|
|
Cash flow and other changes
|
|
|
|
|
|
|
|
|
|
|
|
Contributions by plan participants
|
|
|
|
|
|
|
|
|
|
|
|
Contributions by the employer
|
|
|
|
|
|
|
|
|
|
|
|
Benefits paid
1
|
|
(
|
|
(
|
|
(
|
|
(
|
|
(
|
|
Payments in respect to settlements
|
|
|
|
|
|
|
|
|
|
|
|
Acquisitions/Divestitures
|
|
|
|
|
|
|
|
|
|
|
|
Exchange rate changes
|
|
|
|
|
|
|
|
|
|
|
|
Other
|
|
|
|
|
|
|
|
|
|
|
|
Plan administration costs
|
|
|
|
(
|
|
(
|
|
(
|
|
(
|
|
Balance, end of year
|
|
|
|
|
|
|
|
|
|
|
|
Funded status, end of year
|
|
(
|
|
|
|
(
|
|
|
|
|
|
|
|
|
|
|
|
|
|
|
|
|
|
Change in irrecoverable surplus (asset ceiling)
|
|
|
|
|
|
|
|
|
|
|
|
Balance, beginning of year
|
|
0
|
|
0
|
|
0
|
|
(38)
|
|
(38)
|
|
Interest cost
|
|
|
|
|
|
|
|
|
|
|
|
Changes in irrecoverable surplus
|
|
|
|
|
|
|
|
(
|
|
(
|
|
Exchange rate changes
|
|
|
|
|
|
|
|
(
|
|
(
|
|
Balance, end of year
|
|
|
|
|
|
|
|
(
|
|
(
|
|
|
|
|
|
|
|
|
|
|
|
|
|
Net asset (liability) recognized
|
|
(
|
|
|
|
(
|
|
(
|
|
|
|
|
|
|
|
|
|
|
|
|
|
|
1
For funded plans only.
2
Thereof
€
1,207
million
recognized in Other assets and
€
813
million
in Other liabilities.
|
|
|
2020
|
||||||||
|
in € m.
|
|
Germany
|
|
UK
|
|
U.S.
|
|
Other
|
|
Total
|
|
Change in the present value of the defined benefit obligation:
|
|
|
|
|
|
|
|
|
|
|
|
Balance, beginning of year
|
|
|
|
|
|
|
|
|
|
|
|
Defined benefit cost recognized in Profit Loss
|
|
|
|
|
|
|
|
|
|
|
|
Current service cost
|
|
|
|
|
|
|
|
|
|
|
|
Interest cost
|
|
|
|
|
|
|
|
|
|
|
|
Past service cost and gain or loss arising from settlements
|
|
(
|
|
|
|
|
|
|
|
(
|
|
Defined benefit cost recognized in Other Comprehensive Income
|
|
|
|
|
|
|
|
|
|
|
|
Actuarial gain or loss arising from changes in financial
assumptions
|
|
|
|
|
|
|
|
|
|
|
|
Actuarial gain or loss arising from changes in demographic
assumptions
|
|
|
|
(
|
|
(
|
|
|
|
|
|
Actuarial gain or loss arising from experience
|
|
(
|
|
(
|
|
|
|
(
|
|
(
|
|
Cash flow and other changes
|
|
|
|
|
|
|
|
|
|
|
|
Contributions by plan participants
|
|
|
|
|
|
|
|
|
|
|
|
Benefits paid
|
|
(
|
|
(
|
|
(
|
|
(
|
|
(
|
|
Payments in respect to settlements
|
|
|
|
|
|
|
|
|
|
|
|
Acquisitions/Divestitures
|
|
(
|
|
|
|
|
|
|
|
(
|
|
Exchange rate changes
|
|
|
|
(
|
|
(
|
|
(
|
|
(
|
|
Other
|
|
(
|
|
|
|
|
|
|
|
|
|
Balance, end of year
|
|
|
|
|
|
|
|
|
|
|
|
thereof:
|
|
|
|
|
|
|
|
|
|
|
|
Unfunded
|
|
|
|
|
|
|
|
|
|
|
|
Funded
|
|
|
|
|
|
|
|
|
|
|
|
|
|
|
|
|
|
|
|
|
|
|
|
Change in fair value of plan assets:
|
|
|
|
|
|
|
|
|
|
|
|
Balance, beginning of year
|
|
|
|
|
|
|
|
|
|
|
|
Defined benefit cost recognized in Profit Loss
|
|
|
|
|
|
|
|
|
|
|
|
Interest income
|
|
|
|
|
|
|
|
|
|
|
|
Defined benefit cost recognized in Other Comprehensive Income
|
|
|
|
|
|
|
|
|
|
|
|
Return from plan assets less interest income
|
|
|
|
|
|
|
|
|
|
|
|
Cash flow and other changes
|
|
|
|
|
|
|
|
|
|
|
|
Contributions by plan participants
|
|
|
|
|
|
|
|
|
|
|
|
Contributions by the employer
|
|
|
|
|
|
|
|
|
|
|
|
Benefits paid
3
|
|
(
|
|
(
|
|
(
|
|
(
|
|
(
|
|
Payments in respect to settlements
|
|
|
|
|
|
|
|
|
|
|
|
Acquisitions/Divestitures
|
|
(
|
|
|
|
|
|
|
|
(
|
|
Exchange rate changes
|
|
|
|
(
|
|
(
|
|
(
|
|
(
|
|
Other
|
|
|
|
|
|
|
|
|
|
|
|
Plan administration costs
|
|
|
|
(
|
|
(
|
|
(
|
|
(
|
|
Balance, end of year
|
|
|
|
|
|
|
|
|
|
|
|
Funded status, end of year
|
|
(
|
|
|
|
(
|
|
(
|
|
(
|
|
|
|
|
|
|
|
|
|
|
|
|
|
Change in irrecoverable surplus (asset ceiling)
|
|
|
|
|
|
|
|
|
|
|
|
Balance, beginning of year
|
|
|
|
|
|
|
|
(
|
|
(
|
|
Interest cost
|
|
|
|
|
|
|
|
|
|
|
|
Changes in irrecoverable surplus
|
|
|
|
|
|
|
|
|
|
|
|
Exchange rate changes
|
|
|
|
|
|
|
|
|
|
|
|
Balance, end of year
|
|
|
|
|
|
|
|
(
|
|
(
|
|
|
|
|
|
|
|
|
|
|
|
|
|
Net asset (liability) recognized
|
|
(
|
|
|
|
(
|
|
(
|
|
(
|
|
|
|
|
|
|
|
|
|
|
|
|
1
Contains a past service credit of € 48 million due to the introduction of a capital option for a specific plan sponsored by former Postbank
.
2
Postbank Systems AG
.
3
For funded plans only.
4
Thereof € 877 million recognized in Other assets and € 1,265 million in Other liabilities
.
There are no reimbursement rights for the Group.
Investment Strategy
The Group’s investment objective is to protect the Group from adverse impacts of its defined benefit pension plans on key financial metrics. The primary focus is to protect the plans’ IFRS funded status in the case of adverse market scenarios. In 2021, there has been a shift in the investment strategy in selected markets to balance competing key financial metrics. Investment managers manage pension assets in line with investment mandates or guidelines as agreed with the pension plans’ trustees and investment committees.
|
274
|
|
|
Deutsche Bank
|
Additional Notes
|
|
|
Annual Report 2021
|
|
|
|
|
|
For key defined benefit plans for which the Group aims to protect the IFRS funded status, the Group applies a liability driven investment (LDI) approach. Risks from mismatches between fluctuations in the present value of the defined benefit obligations and plan assets due to capital market movements are minimized, subject to balancing relevant trade-offs. This is achieved by allocating plan assets closely to the market risk factor exposures of the pension liability to interest rates, credit spreads and inflation. Thereby, plan assets broadly reflect the underlying risk profile and currency of the pension obligations.
Where the desired hedging level for market risks cannot be achieved with physical instruments (i.e., corporate and government bonds), derivatives are employed. Derivative overlays mainly include interest rate, inflation swaps and credit default swaps. Other instruments are also used, such as interest rate futures and options. In practice, a completely hedged approach is impractical, for instance because of insufficient market depth for ultra-long-term corporate bonds, as well as liquidity and cost considerations. Therefore, plan assets contain further return-seeking asset categories such as equity, real estate, high yield bonds or emerging markets bonds to create long-term value and achieve diversification benefits.
In 2020, the Group entered into two buy-in transactions with a third party insurer to de-risk € 1.2 billion of exposure to the UK defined benefit pension schemes funded from existing assets, with no additional employer contribution required. The recognition of the insurance policies as qualifying plan assets in Q1 and Q4 negatively impacted Other Comprehensive Income in the Group’s financial statement by approximately € 115 million and € 60 million, respectively.
Plan asset allocation to key asset classes
The following table shows the asset allocation of the Group’s funded defined benefit plans to key asset classes, i.e. exposures include physical securities in discretely managed portfolios and underlying asset allocations of any commingled funds used to invest plan assets.
Asset amounts in the following table include both “quoted” (i.e., Level 1 assets in accordance with IFRS 13 – amounts invested in markets where the fair value can be determined directly from prices which are quoted in active, liquid markets) and “other” (i.e., Level 2 and 3 assets in accordance with IFRS 13) assets.
|
275
|
|
|
Deutsche Bank
|
Additional Notes
|
|
|
Annual Report 2021
|
|
|
|
|
|
|
|
|
Dec 31, 2021
|
|
Dec 31, 2020
|
||||||||||||||||
|
in € m.
|
|
Germany
|
|
UK
|
|
U.S.
|
|
Other
|
|
Total
|
|
Germany
|
|
UK
|
|
U.S.
|
|
Other
|
|
Total
|
|
Cash and cash equivalents
|
|
|
|
|
|
|
|
|
|
|
|
|
|
|
|
|
|
|
|
|
|
Equity instruments
1
|
|
|
|
|
|
|
|
|
|
|
|
|
|
|
|
|
|
|
|
|
|
Investment-grade bonds
2
|
|
|
|
|
|
|
|
|
|
|
|
|
|
|
|
|
|
|
|
|
|
Government
|
|
|
|
|
|
|
|
|
|
|
|
|
|
|
|
|
|
|
|
|
|
Non-government bonds
|
|
|
|
|
|
|
|
|
|
|
|
|
|
|
|
|
|
|
|
|
|
Non-investment-grade bonds
|
|
|
|
|
|
|
|
|
|
|
|
|
|
|
|
|
|
|
|
|
|
Government
|
|
|
|
|
|
|
|
|
|
|
|
|
|
|
|
|
|
|
|
|
|
Non-government bonds
|
|
|
|
|
|
|
|
|
|
|
|
|
|
|
|
|
|
|
|
|
|
Securitized and other Debt Investments
|
|
|
|
|
|
|
|
|
|
|
|
|
|
|
|
|
|
|
|
|
|
Insurance
|
|
|
|
|
|
|
|
|
|
|
|
|
|
|
|
|
|
|
|
|
|
Alternatives
|
|
|
|
|
|
|
|
|
|
|
|
|
|
|
|
|
|
|
|
|
|
Real estate
|
|
|
|
|
|
|
|
|
|
|
|
|
|
|
|
|
|
|
|
|
|
Commodities
|
|
|
|
|
|
|
|
|
|
|
|
|
|
|
|
|
|
|
|
|
|
Private equity
|
|
|
|
|
|
|
|
|
|
|
|
|
|
|
|
|
|
|
|
|
|
Other
3
|
|
|
|
|
|
|
|
|
|
|
|
|
|
|
|
|
|
|
|
|
|
Derivatives (Market Value)
|
|
|
|
|
|
|
|
|
|
|
|
|
|
|
|
|
|
|
|
|
|
Interest rate
|
|
|
|
|
|
|
|
|
|
|
|
|
|
(
|
|
(
|
|
|
|
|
|
Credit
|
|
|
|
(
|
|
|
|
|
|
(
|
|
|
|
(
|
|
|
|
|
|
|
|
Inflation
|
|
|
|
(
|
|
|
|
|
|
(
|
|
|
|
(
|
|
|
|
|
|
(
|
|
Foreign exchange
|
|
(
|
|
|
|
|
|
|
|
|
|
|
|
|
|
|
|
|
|
|
|
Other
|
|
|
|
|
|
(
|
|
|
|
|
|
|
|
|
|
(
|
|
|
|
|
|
Total fair value of plan assets
|
|
|
|
|
|
|
|
|
|
|
|
|
|
|
|
|
|
|
|
|
|
|
|
|
|
|
|
|
|
|
|
|
|
|
|
|
|
|
|
|
|
|
1
Allocation of equity exposure is broadly in line with the typical index in the respective market, e.g. the equity portfolio’s benchmark of the UK retirement benefit plans is the MSCI All Countries World Index.
2
Investment-grade means BBB and above. Average credit rating exposure for the Group’s main plans is around A.
3
This position contains commingled funds which could not be segregated into the other asset categories
.
The following table sets out the Group’s funded defined benefit plan assets only invested in “quoted” assets, i.e. Level 1 assets in accordance with IFRS 13.
|
|
|
Dec 31, 2021
|
|
Dec 31, 2020
|
||||||||||||||||
|
in € m.
|
|
Germany
|
|
UK
|
|
U.S.
|
|
Other
|
|
Total
|
|
Germany
|
|
UK
|
|
U.S.
|
|
Other
|
|
Total
|
|
Cash and cash equivalents
|
|
|
|
|
|
|
|
|
|
|
|
|
|
|
|
|
|
|
|
|
|
Equity instruments
1
|
|
|
|
|
|
|
|
|
|
|
|
|
|
|
|
|
|
|
|
|
|
Investment-grade bonds
2
|
|
|
|
|
|
|
|
|
|
|
|
|
|
|
|
|
|
|
|
|
|
Government
|
|
|
|
|
|
|
|
|
|
|
|
|
|
|
|
|
|
|
|
|
|
Non-government bonds
|
|
|
|
|
|
|
|
|
|
|
|
|
|
|
|
|
|
|
|
|
|
Non-investment-grade bonds
|
|
|
|
|
|
|
|
|
|
|
|
|
|
|
|
|
|
|
|
|
|
Government
|
|
|
|
|
|
|
|
|
|
|
|
|
|
|
|
|
|
|
|
|
|
Non-government bonds
|
|
|
|
|
|
|
|
|
|
|
|
|
|
|
|
|
|
|
|
|
|
Securitized and other Debt Investments
|
|
|
|
|
|
|
|
|
|
|
|
|
|
|
|
|
|
|
|
|
|
Insurance
|
|
|
|
|
|
|
|
|
|
|
|
|
|
|
|
|
|
|
|
|
|
Alternatives
|
|
|
|
|
|
|
|
|
|
|
|
|
|
|
|
|
|
|
|
|
|
Real estate
|
|
|
|
|
|
|
|
|
|
|
|
|
|
|
|
|
|
|
|
|
|
Commodities
|
|
|
|
|
|
|
|
|
|
|
|
|
|
|
|
|
|
|
|
|
|
Private equity
|
|
|
|
|
|
|
|
|
|
|
|
|
|
|
|
|
|
|
|
|
|
Other
|
|
|
|
|
|
|
|
|
|
|
|
|
|
|
|
|
|
|
|
|
|
Derivatives (Market Value)
|
|
|
|
|
|
|
|
|
|
|
|
|
|
|
|
|
|
|
|
|
|
Interest rate
|
|
|
|
|
|
(
|
|
|
|
(
|
|
|
|
|
|
(
|
|
|
|
(
|
|
Credit
|
|
|
|
|
|
|
|
|
|
|
|
|
|
(
|
|
|
|
|
|
(
|
|
Inflation
|
|
|
|
|
|
|
|
|
|
|
|
|
|
|
|
|
|
|
|
|
|
Foreign exchange
|
|
|
|
|
|
|
|
|
|
|
|
|
|
|
|
|
|
|
|
|
|
Other
|
|
|
|
|
|
|
|
|
|
|
|
|
|
|
|
|
|
|
|
|
|
Total fair value of quoted
plan assets
|
|
|
|
|
|
|
|
|
|
|
|
|
|
|
|
|
|
|
|
|
|
|
|
|
|
|
|
|
|
|
|
|
|
|
|
|
|
|
|
|
|
|
1
Allocation of equity exposure is broadly in line with the typical index in the respective market, e.g. the equity portfolio’s benchmark of the UK retirement benefit plans is the MSCI All Countries World Index
.
2
Investment-grade means BBB and above. Average credit rating exposure for the Group’s main plans is around A
.
The following tables show the asset allocation of the “quoted” and “other” defined benefit plan assets by key geography in which they are invested.
|
276
|
|
|
Deutsche Bank
|
Additional Notes
|
|
|
Annual Report 2021
|
|
|
|
|
|
|
|
|
Dec 31, 2021
|
||||||||||||
|
in € m.
|
|
Germany
|
|
United
Kingdom
|
|
United
States
|
|
Other
Eurozone
|
|
Other
developed
countries
|
|
Emerging
markets
|
|
Total
|
|
Cash and cash equivalents
|
|
|
|
|
|
|
|
|
|
|
|
|
|
|
|
Equity instruments
|
|
|
|
|
|
|
|
|
|
|
|
|
|
|
|
Government bonds
(investment-grade and above)
|
|
|
|
|
|
|
|
|
|
|
|
|
|
|
|
Government bonds
(non-investment-grade)
|
|
|
|
|
|
|
|
|
|
|
|
|
|
|
|
Non-government bonds
(investment-grade and above)
|
|
|
|
|
|
|
|
|
|
|
|
|
|
|
|
Non-government bonds
(non-investment-grade)
|
|
|
|
|
|
|
|
|
|
|
|
|
|
|
|
Securitized and other Debt Investments
|
|
|
|
|
|
|
|
|
|
|
|
|
|
|
|
Subtotal
|
|
|
|
|
|
|
|
|
|
|
|
|
|
|
|
Share (in %)
|
|
|
|
|
|
|
|
|
|
|
|
|
|
|
|
Other asset categories
|
|
|
|
|
|
|
|
|
|
|
|
|
|
|
|
Fair value of plan assets
|
|
|
|
|
|
|
|
|
|
|
|
|
|
|
|
|
|
|
|
|
|
|
|
|
|
|
|
|
|
|
|
|
|
Dec 31, 2020
|
||||||||||||
|
in € m.
|
|
Germany
|
|
United
Kingdom
|
|
United
States
|
|
Other
Eurozone
|
|
Other
developed
countries
|
|
Emerging
markets
|
|
Total
|
|
Cash and cash equivalents
|
|
(
|
|
|
|
|
|
|
|
|
|
|
|
|
|
Equity instruments
|
|
|
|
|
|
|
|
|
|
|
|
|
|
|
|
Government bonds
(investment-grade and above)
|
|
|
|
|
|
|
|
|
|
|
|
|
|
|
|
Government bonds
(non-investment-grade)
|
|
|
|
|
|
|
|
|
|
|
|
|
|
|
|
Non-government bonds
(investment-grade and above)
|
|
|
|
|
|
|
|
|
|
|
|
|
|
|
|
Non-government bonds
(non-investment-grade)
|
|
|
|
|
|
|
|
|
|
|
|
|
|
|
|
Securitized and other Debt Investments
|
|
|
|
|
|
|
|
|
|
|
|
|
|
|
|
Subtotal
|
|
|
|
|
|
|
|
|
|
|
|
|
|
|
|
Share (in %)
|
|
|
|
|
|
|
|
|
|
|
|
|
|
|
|
Other asset categories
|
|
|
|
|
|
|
|
|
|
|
|
|
|
|
|
Fair value of plan assets
|
|
|
|
|
|
|
|
|
|
|
|
|
|
|
|
|
|
|
|
|
|
|
|
|
|
|
|
|
|
|
Plan assets include derivative transactions with Group entities with an overall positive market value of around
€
553
million
at December 31, 2021 and
€
210
million
December 31, 2020, respectively. There is neither a material amount of securities issued by the Group nor other claims on Group assets included in the fair value of plan assets. The plan assets do not include any real estate which is used by the Group.
After the receipt of the German supreme fiscal court’s (Bundesfinanzhof) favorable decision for tax year 2010 in March 2021, the German tax authorities also concluded on the tax treatment of our pension plan assets as it relates to tax years 2011-2013 consistent with the court’s favorable decision for the year 2010.
Key Risk Sensitivities
The Group’s defined benefit obligations are sensitive to changes in capital market conditions and actuarial assumptions. Sensitivities to capital market movements and key assumption changes are presented in the following table. Each market risk factor or assumption is changed in isolation. Sensitivities of the defined benefit obligations are approximated using geometric extrapolation methods based on plan durations for the respective assumption. Duration is a risk measure that indicates the broad sensitivity of the obligations to a change in an underlying assumption and provides a reasonable approximation for small to moderate changes in those assumptions.
For example, the interest rate duration is derived from the change in the defined benefit obligation to a change in the interest rate based on information provided by the local actuaries of the respective plans. The resulting duration is used to estimate the remeasurement liability loss or gain from changes in the interest rate. For other assumptions, a similar approach is used to derive the respective sensitivity results.
For defined benefit pension plans, changes in capital market conditions will impact the plan obligations via actuarial assumptions (e.g. via the discount rate and price inflation rate) as well as the plan assets’ fair value. Where the Group applies a LDI approach or has insured part of the obligations as in the UK, the Group’s overall risk exposure to such changes is reduced. To help readers gain a better understanding of the Group’s risk exposures to key capital market movements, the net impact of the change in the defined benefit obligations and plan assets due to a change of the related market risk factor or underlying actuarial assumption is shown. Where changes in actuarial assumptions do not affect plan assets, only the impact on the defined benefit obligations is reported.
Asset-related sensitivities are derived for the Group’s major plans by using risk sensitivity factors determined by the Group’s Market Risk Management function. These sensitivities are calculated based on information provided by the plans’ investment managers and extrapolated linearly to reflect the approximate change of the plan assets’ market value in case of a change in the underlying risk factor.
The sensitivities illustrate plausible variations over time in capital market movements and key actuarial assumptions. The Group is not in a position to provide a view on the likelihood of these capital market or assumption changes. While these sensitivities illustrate the overall impact on the funded status of the changes shown, the significance of the impact and the range of reasonable possible alternative assumptions may differ between the different plans that comprise the aggregated results. Even though plan assets and plan obligations are sensitive to similar risk factors, actual changes in plan assets and obligations may not fully offset each other due to imperfect correlations between market risk factors and actuarial assumptions. Caution should be used when extrapolating these sensitivities due to non-linear effects that changes in capital market conditions and key actuarial assumptions may have on the overall funded status. Any management actions that may be taken to mitigate the inherent risks in the post-employment defined benefit plans are not reflected in these sensitivities.
|
277
|
|
|
Deutsche Bank
|
Additional Notes
|
|
|
Annual Report 2021
|
|
|
|
|
|
|
|
|
Dec 31, 2021
|
|
Dec 31, 2020
|
||||||||||||
|
in € m.
|
|
Germany
|
|
UK
|
|
U.S.
|
|
Other
|
|
Germany
|
|
UK
|
|
U.S.
|
|
Other
|
|
Interest rate (–50 bp):
|
|
|
|
|
|
|
|
|
|
|
|
|
|
|
|
|
|
(Increase) in DBO
|
|
(
|
|
(
|
|
(
|
|
(
|
|
(
|
|
(
|
|
(
|
|
(
|
|
Expected increase in plan assets
1
|
|
|
|
|
|
|
|
|
|
|
|
|
|
|
|
|
|
Expected net impact on funded status (de-) increase
|
|
(
|
|
(
|
|
(
|
|
(
|
|
(
|
|
(
|
|
(
|
|
(
|
|
|
|
|
|
|
|
|
|
|
|
|
|
|
|
|
|
|
|
Interest rate (+50 bp):
|
|
|
|
|
|
|
|
|
|
|
|
|
|
|
|
|
|
Decrease in DBO
|
|
|
|
|
|
|
|
|
|
|
|
|
|
|
|
|
|
Expected (decrease) in plan assets
1
|
|
(
|
|
(
|
|
(
|
|
(
|
|
(
|
|
(
|
|
(
|
|
(
|
|
Expected net impact on funded status (de-) increase
|
|
|
|
|
|
|
|
|
|
|
|
|
|
|
|
|
|
|
|
|
|
|
|
|
|
|
|
|
|
|
|
|
|
|
|
Credit spread (–50 bp):
|
|
|
|
|
|
|
|
|
|
|
|
|
|
|
|
|
|
(Increase) in DBO
|
|
(
|
|
(
|
|
(
|
|
(
|
|
(
|
|
(
|
|
(
|
|
(
|
|
Expected increase in plan assets
1
|
|
|
|
|
|
|
|
|
|
|
|
|
|
|
|
|
|
Expected net impact on funded status (de-) increase
|
|
(
|
|
(
|
|
(
|
|
(
|
|
(
|
|
(
|
|
(
|
|
(
|
|
|
|
|
|
|
|
|
|
|
|
|
|
|
|
|
|
|
|
Credit spread (+50 bp):
|
|
|
|
|
|
|
|
|
|
|
|
|
|
|
|
|
|
Decrease in DBO
|
|
|
|
|
|
|
|
|
|
|
|
|
|
|
|
|
|
Expected (decrease) in plan assets
1
|
|
(
|
|
(
|
|
(
|
|
(
|
|
(
|
|
(
|
|
(
|
|
(
|
|
Expected net impact on funded status (de-) increase
|
|
|
|
|
|
|
|
|
|
|
|
|
|
|
|
|
|
|
|
|
|
|
|
|
|
|
|
|
|
|
|
|
|
|
|
Rate of price inflation (–50 bp):
2
|
|
|
|
|
|
|
|
|
|
|
|
|
|
|
|
|
|
Decrease in DBO
|
|
|
|
|
|
|
|
|
|
|
|
|
|
|
|
|
|
Expected (decrease) in plan assets
1
|
|
(
|
|
(
|
|
|
|
(
|
|
(
|
|
(
|
|
|
|
(
|
|
Expected net impact on funded status (de-) increase
|
|
|
|
|
|
|
|
|
|
|
|
|
|
|
|
|
|
|
|
|
|
|
|
|
|
|
|
|
|
|
|
|
|
|
|
Rate of price inflation (+50 bp):
2
|
|
|
|
|
|
|
|
|
|
|
|
|
|
|
|
|
|
(Increase) in DBO
|
|
(
|
|
(
|
|
|
|
(
|
|
(
|
|
(
|
|
|
|
(
|
|
Expected increase in plan assets
1
|
|
|
|
|
|
|
|
|
|
|
|
|
|
|
|
|
|
Expected net impact on funded status (de-) increase
|
|
(
|
|
(
|
|
|
|
(
|
|
(
|
|
(
|
|
|
|
(
|
|
|
|
|
|
|
|
|
|
|
|
|
|
|
|
|
|
|
|
Rate of real increase in future compensation
levels (–50 bp):
|
|
|
|
|
|
|
|
|
|
|
|
|
|
|
|
|
|
Decrease in DBO, net impact on funded status
|
|
|
|
|
|
|
|
|
|
|
|
|
|
|
|
|
|
|
|
|
|
|
|
|
|
|
|
|
|
|
|
|
|
|
|
Rate of real increase in future compensation
levels (+50 bp):
|
|
|
|
|
|
|
|
|
|
|
|
|
|
|
|
|
|
(Increase) in DBO, net impact on funded status
|
|
(
|
|
(
|
|
|
|
(
|
|
(
|
|
(
|
|
|
|
(
|
|
|
|
|
|
|
|
|
|
|
|
|
|
|
|
|
|
|
|
Longevity improvements by 10 %:
3
|
|
|
|
|
|
|
|
|
|
|
|
|
|
|
|
|
|
(Increase) in DBO, net impact on funded status
|
|
(
|
|
(
|
|
(
|
|
(
|
|
(
|
|
(
|
|
(
|
|
(
|
|
|
|
|
|
|
|
|
|
|
|
|
|
|
|
|
|
|
1
Expected changes in the fair value of plan assets contain the simulated impact from the biggest plans in Germany, the UK, the U.S., Channel Islands, Switzerland and Belgium which cover over 99 % of the total fair value of plan assets. The fair value of plan assets for other plans is assumed to be unchanged for this presentation.
2
Incorporates sensitivity to changes in pension benefits to the extent linked to the price inflation assumption.
3
Estimated to be equivalent to an increase of around 1 year in overall life expectancy.
4
Due to buy-in transaction the net impact on funded status reduces by
€
45
million
due to expected gains within the plan assets
.
Expected cash flows
The following table shows expected cash flows for post-employment benefits in 2022, including contributions to the Group’s external pension trusts in respect of funded plans, direct payment to beneficiaries in respect of unfunded plans, as well as contributions to defined contribution plans.
|
|
|
2022
|
|
in € m.
|
|
Total
|
|
Expected contributions to
|
|
|
|
Defined benefit plan assets
|
|
|
|
BVV
|
|
|
|
Other defined contribution plans
|
|
|
|
Expected benefit payments for unfunded defined benefit plans
|
|
|
|
Expected total cash flow related to post-employment benefits
|
|
|
|
|
|
|
Expense of employee benefits
The following table presents a breakdown of specific expenses according to the requirements of IAS 19 and IFRS 2.
|
278
|
|
|
Deutsche Bank
|
Additional Notes
|
|
|
Annual Report 2021
|
|
|
|
|
|
|
in € m.
|
|
2021
|
|
2020
|
|
2019
|
|
Expenses for defined benefit plans:
|
|
|
|
|
|
|
|
Service cost
1
|
|
|
|
|
|
|
|
Net interest cost (income)
|
|
|
|
|
|
|
|
Total expenses defined benefit plans
|
|
|
|
|
|
|
|
Expenses for defined contribution plans:
|
|
|
|
|
|
|
|
BVV
|
|
|
|
|
|
|
|
Other defined contribution plans
|
|
|
|
|
|
|
|
Total expenses for defined contribution plans
|
|
|
|
|
|
|
|
Total expenses for post-employment benefit plans
|
|
|
|
|
|
|
|
Employer contributions to state-mandated pension plans
|
|
|
|
|
|
|
|
Pensions related payments social security in Germany
|
|
|
|
|
|
|
|
Contributions to pension fund for Postbank´s postal civil servants
|
|
|
|
|
|
|
|
Further pension related state-mandated benefit plans
|
|
|
|
|
|
|
|
Total employer contributions to state-mandated benefit plans
|
|
|
|
|
|
|
|
Expenses for share-based payments:
|
|
|
|
|
|
|
|
Expenses for share-based payments, equity settled
2
|
|
|
|
|
|
|
|
Expenses for share-based payments, cash settled
2
|
|
|
|
|
|
|
|
Expenses for cash retention plans
2
|
|
|
|
|
|
|
|
Expenses for severance payments
3
|
|
|
|
|
|
|
|
|
|
|
|
|
|
|
1
Severance related items under Service Costs are reclassified to Expenses for Severance payments.
2
Including expenses for new hire awards and the acceleration of expenses not yet amortized due to the discontinuation of employment including those amounts which are recognized as part of the Group’s restructuring expenses
.
3
Excluding the acceleration of expenses for deferred compensation awards not yet amortized
.
Severance related items under Service Costs were reclassified to Expense for Severance payments
.
34 –
Income Taxes
|
in € m.
|
|
2021
|
|
2020
|
|
2019
|
|
Current tax expense (benefit):
|
|
|
|
|
|
|
|
Tax expense (benefit) for current year
|
|
|
|
|
|
|
|
Adjustments for prior years
|
|
|
|
(
|
|
|
|
Total current tax expense (benefit)
|
|
|
|
|
|
|
|
Deferred tax expense (benefit):
|
|
|
|
|
|
|
|
Origination and reversal of temporary differences, unused tax losses and tax credits
|
|
|
|
(
|
|
(
|
|
Effect of changes in tax law and/or tax rate
|
|
(
|
|
(
|
|
(
|
|
Adjustments for prior years
|
|
(
|
|
(
|
|
|
|
Total deferred tax expense (benefit)
|
|
|
|
(
|
|
|
|
Total income tax expense (benefit)
|
|
|
|
|
|
|
|
|
|
|
|
|
|
|
Total deferred tax expense includes benefits from previously unrecognized tax losses (tax credits/deductible temporary differences) and the reversal of previous write-downs of deferred tax assets and expenses arising from write-downs of deferred tax assets, which decreased the deferred tax expense by
€
242
million
in 2021, decreased the deferred tax benefit by
€
96
million
in 2020, and increased the deferred tax expense by
€
2,785
million
in 2019.
Difference between applying German statutory (domestic) income tax rate and actual income tax expense/(benefit)
|
in € m.
|
|
2021
|
|
2020
|
|
2019
|
|
Expected tax expense (benefit) at domestic income tax rate of 31.3% (31.3% for 2020 and 31.3% for 2019)
|
|
|
|
|
|
(
|
|
Foreign rate differential
|
|
(
|
|
(
|
|
|
|
Tax-exempt gains on securities and other income
|
|
(
|
|
(
|
|
(
|
|
Loss (income) on equity method investments
|
|
(
|
|
(
|
|
(
|
|
Nondeductible expenses
|
|
|
|
|
|
|
|
Impairments of goodwill
|
|
|
|
|
|
|
|
Changes in recognition and measurement of deferred tax assets
1
|
|
(
|
|
|
|
|
|
Effect of changes in tax law and/or tax rate
|
|
(
|
|
(
|
|
(
|
|
Effect related to share-based payments
|
|
|
|
(
|
|
|
|
Other
1
|
|
|
|
(
|
|
|
|
Actual income tax expense (benefit)
|
|
|
|
|
|
|
|
|
|
|
|
|
|
|
1
Current and deferred tax expense/(benefit) relating to prior years are mainly reflected in the line items “Changes in recognition and measurement of deferred tax assets” and “Other”.
The Group is under continuous examinations by tax authorities in various jurisdictions. “Other” in the preceding table includes the effects of these examinations by the tax authorities.
The domestic income tax rate, including corporate tax, solidarity surcharge, and trade tax, used for calculating deferred tax assets and liabilities was
31.3
%
for 2021, 2020 and 2019.
|
279
|
|
|
Deutsche Bank
|
Additional Notes
|
|
|
Annual Report 2021
|
|
|
|
|
|
Income taxes credited or charged to equity (other comprehensive income/additional paid in capital)
|
in € m.
|
|
2021
|
|
2020
|
|
2019
|
|
Actuarial gains (losses) related to defined benefit plans
|
|
(
|
|
|
|
|
|
Net fair value gains (losses) attributable to credit risk related to financial
liabilities designated as at fair value through profit or loss
|
|
|
|
|
|
|
|
Financial assets mandatory at fair value through other comprehensive income:
|
|
|
|
|
|
|
|
Unrealized net gains (losses) arising during the period
|
|
|
|
(
|
|
(
|
|
Realized net gains (losses) arising during the period (reclassified to profit or loss)
|
|
|
|
|
|
|
|
Derivatives hedging variability of cash flows:
|
|
|
|
|
|
|
|
Unrealized net gains (losses) arising during the period
|
|
(
|
|
|
|
|
|
Net gains (losses) reclassified to profit or loss
|
|
|
|
(
|
|
|
|
Other equity movement:
|
|
|
|
|
|
|
|
Unrealized net gains (losses) arising during the period
|
|
|
|
(
|
|
|
|
Net gains (losses) reclassified to profit or loss
|
|
|
|
|
|
|
|
Income taxes credited (charged) to other comprehensive income
|
|
|
|
(
|
|
|
|
Other income taxes credited (charged) to equity
|
|
|
|
|
|
(
|
|
|
|
|
|
|
|
|
Major components of the Group’s gross deferred tax assets and liabilities
|
in € m.
|
|
Dec 31, 2021
|
|
Dec 31, 2020
|
|
Deferred tax assets:
|
|
|
|
|
|
Unused tax losses
|
|
|
|
|
|
Unused tax credits
|
|
|
|
|
|
Deductible temporary differences:
|
|
|
|
|
|
Trading activities, including derivatives
|
|
|
|
|
|
Employee benefits, including equity settled share based payments
|
|
|
|
|
|
Accrued interest expense
|
|
|
|
|
|
Loans and borrowings, including allowance for loans
|
|
|
|
|
|
Leases
|
|
|
|
|
|
Intangible Assets
|
|
|
|
|
|
Fair value OCI (IFRS 9)
|
|
|
|
|
|
Other assets
|
|
|
|
|
|
Other provisions
|
|
|
|
|
|
Other liabilities
|
|
|
|
|
|
Total deferred tax assets pre offsetting
|
|
|
|
|
|
Deferred tax liabilities:
|
|
|
|
|
|
Taxable temporary differences:
|
|
|
|
|
|
Trading activities, including derivatives
|
|
|
|
|
|
Employee benefits, including equity settled share based payments
|
|
|
|
|
|
Loans and borrowings, including allowance for loans
|
|
|
|
|
|
Leases
|
|
|
|
|
|
Intangible Assets
|
|
|
|
|
|
Fair value OCI (IFRS 9)
|
|
|
|
|
|
Other assets
|
|
|
|
|
|
Other provisions
|
|
|
|
|
|
Other liabilities
|
|
|
|
|
|
Total deferred tax liabilities pre offsetting
|
|
|
|
|
|
|
|
|
|
|
Deferred tax assets and liabilities, after offsetting
|
in € m.
|
|
Dec 31, 2021
|
|
Dec 31, 2020
|
|
Presented as deferred tax assets
|
|
|
|
|
|
Presented as deferred tax liabilities
|
|
|
|
|
|
Net deferred tax assets
|
|
|
|
|
|
|
|
|
|
|
The change in the balance of deferred tax assets and deferred tax liabilities might not equal the deferred tax expense/(benefit). In general, this is due to (1) deferred taxes that are booked directly to equity, (2) the effects of exchange rate changes on tax assets and liabilities denominated in currencies other than euro, (3) the acquisition and disposal of entities as part of ordinary activities and (4) the reclassification of deferred tax assets and liabilities which are presented on the face of the balance sheet as components of other assets and liabilities.
Items for which no deferred tax assets were recognized
|
in € m.
|
|
Dec 31, 2021¹
|
|
Dec 31, 2020¹
|
|
Deductible temporary differences
|
|
(
|
|
(
|
|
Not expiring
|
|
(
|
|
(
|
|
Expiring in subsequent period
|
|
|
|
(
|
|
Expiring after subsequent period
|
|
(
|
|
(
|
|
Unused tax losses
|
|
(
|
|
(
|
|
Expiring after subsequent period
|
|
(
|
|
(
|
|
Unused tax credits
|
|
(
|
|
(
|
|
|
|
|
|
|
1
Amounts in the table refer to deductible temporary differences, unused tax losses and tax credits for federal income tax purposes.
|
280
|
|
|
Deutsche Bank
|
Additional Notes
|
|
|
Annual Report 2021
|
|
|
|
|
|
Deferred tax assets were not recognized on these items because it is not probable that future taxable profit will be available against which the unused tax losses, unused tax credits and deductible temporary differences can be utilized.
As of December 31, 2021 and December 31, 2020, the Group recognized deferred tax assets of
€
5.4
billion
and
€
5.1
billion
, respectively, that exceeded deferred tax liabilities in entities which have suffered a loss in either the current or preceding period. This is based on management’s assessment that it is probable that the respective entities will have taxable profits against which the unused tax losses, unused tax credits and deductible temporary differences can be utilized. Generally, in determining the amounts of deferred tax assets to be recognized, management uses historical profitability information and, if relevant, forecasted operating results, based upon approved business plans, including a review of the eligible carry-forward periods, tax planning opportunities and other relevant considerations.
As of December 31, 2021 and December 31, 2020, the Group had temporary differences associated with the Group’s parent company’s investments in subsidiaries, branches and associates and interests in joint ventures of
€
242
million
and
€
254
million
respectively (prior year's comparative aligned to presentation in the current year), in respect of which no deferred tax liabilities were recognized.
35 –
Derivatives
Derivative financial instruments and hedging activities
Derivative contracts used by the Group include swaps, futures, forwards, options and other similar types of contracts. In the normal course of business, the Group enters into a variety of derivative transactions for sales, market-making and risk management purposes. The Group’s objectives in using derivative instruments are to meet customers’ risk management needs and to manage the Group’s exposure to risks.
In accordance with the Group’s accounting policy relating to derivatives and hedge accounting as described in Note 1 “Significant Accounting Policies and Critical Accounting Estimates”, all derivatives are carried at fair value in the balance sheet regardless of whether they are held for trading or non-trading purposes.
Derivatives held for sales and market-making purposes
Sales and market-making
The majority of the Group’s derivatives transactions relate to sales and market-making activities. Sales activities include the structuring and marketing of derivative products to customers to enable them to take, transfer, modify or reduce current or expected risks. Market-making involves quoting bid and offer prices to other market participants, enabling revenue to be generated based on spreads and volume.
Risk management
The Group uses derivatives in order to reduce its exposure to market risks as part of its asset and liability management. This is achieved by entering into derivatives that hedge specific portfolios of fixed rate financial instruments and forecast transactions as well as strategic hedging against overall balance sheet exposures. The Group actively manages interest rate risk through, among other things, the use of derivative contracts. Utilization of derivative financial instruments is modified from time to time within prescribed limits in response to changing market conditions, as well as to changes in the characteristics and mix of the related assets and liabilities.
Derivatives qualifying for hedge accounting
The Group applies hedge accounting if derivatives meet the specific criteria described in Note 1 “Significant Accounting Policies and Critical Accounting Estimates”.
In fair value hedge relationship, the Group uses primarily interest rate swaps and options, in order to protect itself against movements in the fair value of fixed-rate financial instruments due to movements in market interest rates. In a cash flow hedge relationship, the Group uses interest rate swaps in order to protect itself against exposure to variability in interest rates. The Group enters into foreign exchange forwards and swaps for hedges of translation adjustments resulting from translating the financial statements of net investments in foreign operations into the reporting currency of the parent at period end spot rates.
|
281
|
|
|
Deutsche Bank
|
Additional Notes
|
|
|
Annual Report 2021
|
|
|
|
|
|
Interest rate risk
The Group uses interest rate swaps and options to manage its exposure to interest rate risk by modifying the re-pricing characteristics of existing and/or forecasted assets and liabilities, including funding and investment activities. The interest rate swaps and options are designated in either a fair value hedge or a cash flow hedge. For fair value hedges, the Group uses interest rate swaps and options contracts to manage the fair value movements of fixed rate financial instruments due to changes in benchmark interest. For cash flow hedges, we use interest rate swaps to manage the exposure to cash flow variability of our variable rate instruments as a result of changes in benchmark interest rates.
The Group manages its interest rate risk exposure on a portfolio basis with frequent changes in the portfolio due to the origination of new loans and bonds, repayments of existing loans and bonds, issuance of new funding liabilities and repayment of existing funding liabilities. Accordingly, a dynamic hedging accounting approach is adopted for the portfolio, in which individual hedge relationships are designated and de-designated on a more frequent basis (e.g. on a monthly basis).
The Group assesses and measures hedge effectiveness of a hedging relationship based on the change in the fair value or cash flows of the derivative hedging instrument relative to the change in the fair value or cash flows of the hedged item attributable to the hedged risk. Potential sources of ineffectiveness can be attributed to differences between hedging instruments and hedged items:
- – Mismatches in the terms of hedged items and hedging instruments, for example the frequency and timing of when interest rates are reset, frequency of payment and callable features.
- – Difference in the discounting rate applied to the hedged item and the hedging instrument, taking into consideration differences in the reset frequency of the hedged item and hedging instrument.
- – Derivatives used as hedging instrument with a non-zero fair value at inception date of the hedging relationship, resulting in mismatch in terms with the hedged item.
Foreign exchange risk
The Group manages its foreign currency risk (including U.S. dollar and British pound) from investments in foreign operation through net investment hedges using a combination of foreign exchange forwards and swaps as hedging instruments.
As the investments in foreign operations are only hedged to the extent of the notional amount of the hedging derivative instrument the Group generally does not expect to incur significant ineffectiveness on hedges of net investments in foreign operations. Potential sources of ineffectiveness are limited to situations where derivatives with a non-zero fair value at inception date of the hedging relationship are used as hedging instrument, or where the spot foreign currency risk has been designated as hedged risk, resulting in mismatch in terms with the hedged item.
Hedge Accounting and Interest Rate Benchmarks
The table below shows the Group’s
hedge accounting relationships impacted by the IASB Benchmark Reform amendments, the significant interest rate benchmarks the Group is exposed to which are subject to expected future reform, and the nominal amounts of the derivative hedging instruments as at December 31, 2021 and December 31, 2020. As at December 31, 2021 there were no hedge relationships with hedging instruments, hedged items or the hedged risk being an IBOR benchmark which ceased to be quoted in early 2022. The derivative hedging instruments provide a close approximation to the extent of the risk exposure the Group manages through hedge accounting relationships.
Hedge accounting relationships impacted by the IASB Benchmark Reform amendments
|
|
|
Dec 31, 2021
|
|
Dec 31, 2020
|
|
in € m.
|
|
Notional
|
|
Notional
|
|
Fair value hedge
|
|
|
|
|
|
CHF LIBOR
|
|
|
|
|
|
GBP LIBOR
|
|
|
|
|
|
JPY LIBOR
|
|
|
|
|
|
USD LIBOR
|
|
|
|
|
|
|
|
|
|
|
|
282
|
|
|
Deutsche Bank
|
Additional Notes
|
|
|
Annual Report 2021
|
|
|
|
|
|
Fair value hedge accounting
Derivatives held as fair value hedges
|
|
|
Dec 31, 2021
|
|
2021
|
|
Dec 31, 2020
|
|
2020
|
||||||||
|
in € m.
|
|
Assets
|
|
Liabilities
|
|
Nominal
amount
|
|
Fair Value
changes used
for hedge
effectiveness
|
|
Assets
|
|
Liabilities
|
|
Nominal
amount
|
|
Fair Value
changes used
for hedge
effectiveness
|
|
Derivatives held as fair value hedges
|
|
|
|
|
|
|
|
(
|
|
|
|
|
|
|
|
|
|
|
|
|
|
|
|
|
|
|
|
|
|
|
|
|
|
|
|
|
|
2021
|
|
2020
|
|
in € m.
|
|
Hedge
ineffectiveness
|
|
Hedge
ineffectiveness
|
|
Result of fair value hedges
|
|
|
|
(
|
|
|
|
|
|
|
Financial instruments designated as fair value hedges
|
|
|
Dec 31, 2021
|
|
2021
|
||||||||||
|
|
|
Carrying amount of Financial
instruments designated as fair
value hedges
|
|
Accumulated amount of
fair value hedge
adjustments - Total
|
|
Accumulated amount of
fair value hedge
adjustments - Terminated
hedge relationships
|
|
Fair Value
changes used
for hedge
effectiveness
|
||||||
|
in € m.
|
|
Assets
|
|
Liabilities
|
|
Assets
|
|
Liabilities
|
|
Assets
|
|
Liabilities
|
|
|
|
Financial assets at fair value through
other comprehensive income
|
|
|
|
|
|
(
|
|
|
|
|
|
|
|
(
|
|
Bonds at amortized cost
|
|
|
|
|
|
|
|
|
|
|
|
|
|
(
|
|
Long-term debt
|
|
|
|
|
|
|
|
|
|
|
|
|
|
|
|
Deposits
|
|
|
|
|
|
|
|
|
|
|
|
|
|
|
|
Loans at amortized cost
|
|
|
|
|
|
|
|
|
|
|
|
|
|
|
|
|
|
|
|
|
|
|
|
|
|
|
|
|
|
|
|
|
|
Dec 31, 2020
|
|
2020
|
||||||||||
|
|
|
Carrying amount of Financial
instruments designated as fair
value hedges
|
|
Accumulated amount of
fair value hedge
adjustments - Total
|
|
Accumulated amount of
fair value hedge
adjustments - Terminated
hedge relationships
|
|
Fair Value
changes used
for hedge
effectiveness
|
||||||
|
in € m.
|
|
Assets
|
|
Liabilities
|
|
Assets
|
|
Liabilities
|
|
Assets
|
|
Liabilities
|
|
|
|
Financial assets at fair value through
other comprehensive income
|
|
|
|
|
|
|
|
|
|
|
|
|
|
|
|
Bonds at amortized cost
|
|
|
|
|
|
|
|
|
|
|
|
|
|
|
|
Long-term debt
|
|
|
|
|
|
|
|
|
|
|
|
|
|
(
|
|
Deposits
|
|
|
|
|
|
|
|
|
|
|
|
|
|
|
|
Loans at amortized cost
|
|
0
|
|
0
|
|
0
|
|
0
|
|
0
|
|
0
|
|
0
|
|
|
|
|
|
|
|
|
|
|
|
|
|
|
|
|
Cash flow hedge accounting
Derivatives held as cash flow hedges
|
|
|
Dec 31, 2021
|
|
2021
|
|
Dec 31, 2020
|
|
2020
|
||||||||
|
in € m.
|
|
Assets
|
|
Liabilities
|
|
Nominal
amount
|
|
Fair Value
changes used
for hedge
effectiveness
|
|
Assets
|
|
Liabilities
|
|
Nominal
amount
|
|
Fair Value
changes used
for hedge
effectiveness
|
|
Derivatives held as cash flow hedges
|
|
|
|
|
|
|
|
(
|
|
|
|
|
|
|
|
(
|
|
|
|
|
|
|
|
|
|
|
|
|
|
|
|
|
|
|
Cash flow hedge balances
|
in € m.
|
|
Dec 31, 2021
|
|
Dec 31, 2020
|
|
Dec 31, 2019
|
|
Reported in Equity
1
|
|
(
|
|
|
|
|
|
thereof relates to terminated programs
|
|
|
|
|
|
|
|
Gains (losses) posted to equity for the year ended
|
|
|
|
(
|
|
(
|
|
Gains (losses) removed from equity for the year ended
|
|
(
|
|
|
|
(
|
|
thereof relates to terminated programs
|
|
|
|
|
|
|
|
Changes of hedged item's value used for hedge effectiveness
|
|
|
|
(
|
|
|
|
Ineffectiveness recorded within PL
|
|
|
|
(
|
|
|
|
|
|
|
|
|
|
|
1
Reported in equity refers to accumulated other comprehensive income as presented in the Consolidated Balance Sheet.
|
283
|
|
|
Deutsche Bank
|
Additional Notes
|
|
|
Annual Report 2021
|
|
|
|
|
|
In accordance with IAS 39.96 the gains and losses posted to equity in a cash flow hedge relationship is the lesser of cumulative gain or loss on the hedging instrument from the inception of the hedge and the cumulative change in fair value of the expected future cash flows on the hedged item from inception of the hedge. As a result, changes of the hedged item’s value used for hedge effectiveness are not fully recorded in equity if it exceeds the hedging instrument’s fair value changes used for hedge effectiveness. Consequently, hedge ineffectiveness recorded within PL does not always reconcile to the difference between the changes of the hedged item’s value used for hedge effectiveness and the hedging instrument’s fair value changes used for hedge effectiveness.
As of December 31, 2021 the longest term cash flow hedge matures in 2025.
The financial instruments designated as cash flow hedges are recognized as Loans at amortized cost in the Group’s Consolidated Balance Sheet.
Net investment hedge accounting
Derivatives held as net investment hedges
|
|
|
Dec 31, 2021
|
|
2021
|
|
Dec 31, 2020
|
|
2020
|
||||||||
|
in € m.
|
|
Assets
|
|
Liabilities
|
|
Nominal amount
|
|
Fair Value
changes used
for hedge
effectiveness
|
|
Assets
|
|
Liabilities
|
|
Nominal amount
|
|
Fair Value
changes used
for hedge
effectiveness
|
|
Derivatives held as net investment hedges
|
|
|
|
|
|
|
|
(
|
|
|
|
|
|
|
|
|
|
|
|
|
|
|
|
|
|
|
|
|
|
|
|
|
|
|
|
|
|
2021
|
|
2020
|
||||
|
in € m.
|
|
Fair value changes
recognised in
Equity
1
|
|
Hedge
ineffectiveness
|
|
Fair value changes
recognised in
Equity
1
|
|
Hedge
ineffectiveness
|
|
Result of net investment hedges
|
|
|
|
(
|
|
(
|
|
(
|
|
|
|
|
|
|
|
|
|
|
1
Reported in equity refers to accumulated other comprehensive income as presented in the Consolidated Balance Sheet.
Profile of derivatives held as net investment hedges
|
in € m.
|
|
Within 1 year
|
|
1–3 years
|
|
3–5 years
|
|
Over 5 years
|
|
As of December 31, 2021
|
|
|
|
|
|
|
|
|
|
Nominal amount Foreign exchange forwards
|
|
|
|
|
|
|
|
|
|
Nominal amount Foreign exchange swaps
|
|
|
|
|
|
|
|
|
|
Total
|
|
|
|
|
|
|
|
|
|
As of December 31, 2020
|
|
|
|
|
|
|
|
|
|
Nominal amount Foreign exchange forwards
|
|
|
|
|
|
|
|
|
|
Nominal amount Foreign exchange swaps
|
|
|
|
|
|
|
|
|
|
Total
|
|
|
|
|
|
|
|
|
|
|
|
|
|
|
|
|
|
|
The
Group uses a foreign exchange forward strategy. As indicated in the above table, the vast majority of forward contracts mature within the year. The Group did not calculate an average foreign currency rate because the amount of contracts that mature after 1 year are not material.
36 –
Related Party Transactions
Parties are considered to be related if one party has the ability to directly or indirectly control the other party or exercise significant influence over the other party in making financial or operational decisions. The Group’s related parties include:
- – key management personnel including close family members and entities which are controlled, significantly influenced by, or for which significant voting power is held by key management personnel or their close family members,
- – subsidiaries, joint ventures and associates and their respective subsidiaries, and
- – post-employment benefit plans for the benefit of Deutsche Bank employees.
Transactions with Key Management Personnel
Key management personnel are those persons having authority and responsibility for planning, directing and controlling the activities of Deutsche Bank, directly or indirectly. The Group considers the members of the Management Board and of the Supervisory Board of the parent company to constitute key management personnel for purposes of IAS 24.
|
284
|
|
|
Deutsche Bank
|
Additional Notes
|
|
|
Annual Report 2021
|
|
|
|
|
|
Compensation expense of key management personnel
|
in € m.
|
|
2021
|
|
2020
|
|
2019
|
|
Short-term employee benefits
|
|
|
|
|
|
|
|
Post-employment benefits
|
|
|
|
|
|
|
|
Other long-term benefits
|
|
|
|
|
|
|
|
Termination benefits
|
|
|
|
|
|
|
|
Share-based payment
|
|
|
|
|
|
|
|
Total
|
|
|
|
|
|
|
|
|
|
|
|
|
|
|
The above table does not contain compensation that employee representatives and former board members on the Supervisory Board have received. The aggregated compensation paid to such members for their services as employees of Deutsche Bank or status as former employees (retirement, pension and deferred compensation) amounted to
€
1
million
as of December 31, 2021,
€
1
million
as of December 31, 2020 and
€
1
million
as of December 31, 2019.
Among the Group’s transactions with key management personnel as of December 31, 2021 were loans and commitments of
€
8
million
and deposits of
€
13
million
. As of December 31, 2020, the Group’s transactions with key management personnel were loans and commitments of
€
8
million
and deposits of
€
21
million
.
In addition, the Group provides banking services, such as payment and account services as well as investment advice, to key management personnel.
Transactions with Subsidiaries, Joint Ventures and Associates
Transactions between Deutsche Bank AG and its subsidiaries meet the definition of related party transactions. If these transactions are eliminated on consolidation, they are not disclosed as related party transactions. Transactions between the Group and its associated companies and joint ventures and their respective subsidiaries also qualify as related party transactions.
Transactions for subsidiaries, joint ventures and associates are presented combined in below table as these are not material individually.
Loans
|
in € m.
|
|
2021
|
|
2020
|
|
Loans outstanding, beginning of year
|
|
|
|
|
|
Net movement in loans during the period
|
|
|
|
(
|
|
Changes in the group of consolidated companies
|
|
|
|
|
|
Exchange rate changes/other
|
|
(
|
|
|
|
Loans outstanding, end of year
1
|
|
|
|
|
|
Other credit risk related transactions:
|
|
|
|
|
|
Allowance for loan losses
|
|
|
|
|
|
Provision for loan losses
|
|
|
|
|
|
Guarantees and commitments
|
|
|
|
|
|
|
|
|
|
|
1
Loans past due were
€
0
million
as of December 31, 2021 and
€
0
million
as of December 31, 2020. For the total loans the Group held collateral of
€
0
million
and
€
5
million
as of December 31, 2021 and December 31, 2020, respectively.
Deposits
|
in € m.
|
|
2021
|
|
2020
|
|
Deposits outstanding, beginning of year
|
|
|
|
|
|
Net movement in deposits during the period
|
|
|
|
(
|
|
Changes in the group of consolidated companies
|
|
|
|
|
|
Exchange rate changes/other
|
|
|
|
(
|
|
Deposits outstanding, end of year
|
|
|
|
|
|
|
|
|
|
|
Other Transactions
Trading assets and positive market values from derivative financial transactions with associated companies amounted to
€
2
million
as of December 31, 2021 and
€
1
million
as of December 31, 2020. Trading liabilities and negative market values from derivative financial transactions with associated companies amounted to
€
0
million
as of December 31, 2021 and
€
0
million
as of December 31, 2020.
Other assets related to transactions with associated companies amounted to
€
42
million
as of December 31, 2021, and
€
55
million
as of December 31, 2020. Other liabilities related to transactions with associated companies were
€
1
million
as of December 31, 2021, and
€
2
million
as of December 31, 2020.
|
285
|
|
|
Deutsche Bank
|
Additional Notes
|
|
|
Annual Report 2021
|
|
|
|
|
|
Transactions with Pension Plans
Under IFRS, post-employment benefit plans are considered related parties. The Group has business relationships with a number of its pension plans pursuant to which it provides financial services to these plans, including investment management services. The Group’s pension funds may hold or trade Deutsche Bank shares or securities.
Transactions with related party pension plans
|
in € m.
|
|
2021
|
|
2020
|
|
Equity shares issued by the Group held in plan assets
|
|
|
|
|
|
Other assets
|
|
|
|
|
|
Fees paid from plan assets to asset managers of the Group
|
|
|
|
|
|
Market value of derivatives with a counterparty of the Group
|
|
|
|
|
|
Notional amount of derivatives with a counterparty of the Group
|
|
|
|
|
|
|
|
|
|
|
37 –
Information on Subsidiaries
Composition of the Group
Deutsche Bank AG is the direct or indirect holding company for the Group’s subsidiaries.
The Group consists of
563
(2020:
628
) consolidated entities, thereof
225
(2020:
242
) consolidated structured entities.
376
(2020:
420
) of the entities controlled by the Group are directly or indirectly held by the Group at 100 % of the ownership interests (share of capital). Third parties also hold ownership interests in
187
(2020:
208
) of the consolidated entities (non-controlling interests). As of December 31, 2021 and 2020, one subsidiary has material non-controlling interests. Non-controlling interests for all other subsidiaries are neither individually nor cumulatively material to the Group.
Subsidiaries with material non-controlling interests
|
|
|
Dec 31, 2021
|
|
Dec 31, 2020
|
|
DWS Group GmbH Co. KGaA
|
|
|
|
|
|
Proportion of ownership interests and voting rights held by non-controlling interests
|
|
|
|
|
|
Place of business
|
|
|
|
|
|
|
|
|
|
|
|
in € m
|
|
Dec 31, 2021
|
|
Dec 31, 2020
|
|
Net income attributable to non-controlling interests
|
|
|
|
|
|
Accumulated non-controlling interests of the subsidiary
|
|
|
|
|
|
Dividends paid to non-controlling interests
|
|
|
|
|
|
Summarized financial information:
|
|
|
|
|
|
Total assets
|
|
|
|
|
|
Total liabilities
|
|
|
|
|
|
Total net revenues
|
|
|
|
|
|
Net income (loss)
|
|
|
|
|
|
Total comprehensive income (loss), net of tax
|
|
|
|
|
|
|
|
|
|
|
Significant restrictions to access or use the Group’s assets
Statutory, contractual or regulatory requirements as well as protective rights of noncontrolling interests might restrict the ability of the Group to access and transfer assets freely to or from other entities within the Group and to settle liabilities of the Group.
The following restrictions impact the Group’s ability to use assets:
- – The Group has pledged assets to collateralize its obligations under repurchase agreements, securities financing transactions, collateralized loan obligations and for margining purposes for OTC derivative liabilities.
- – The assets of consolidated structured entities are held for the benefit of the parties that have bought the notes issued by these entities.
- – Regulatory and central bank requirements or local corporate laws may restrict the Group’s ability to transfer assets to or from other entities within the Group in certain jurisdictions.
|
286
|
|
|
Deutsche Bank
|
Additional Notes
|
|
|
Annual Report 2021
|
|
|
|
|
|
Restricted assets
|
|
|
Dec 31, 2021
|
|
Dec 31, 2020
|
||||
|
in € m.
|
|
Total
assets
|
|
Restricted
assets
|
|
Total
assets
|
|
Restricted
assets
|
|
Interest-earning deposits with banks
|
|
|
|
|
|
|
|
|
|
Financial assets at fair value through profit or loss
|
|
|
|
|
|
|
|
|
|
Financial assets at fair value through other comprehensive income
|
|
|
|
|
|
|
|
|
|
Loans at amortized cost
|
|
|
|
|
|
|
|
|
|
Other
|
|
|
|
|
|
|
|
|
|
Total
|
|
|
|
|
|
|
|
|
|
|
|
|
|
|
|
|
|
|
The table above excludes assets that are not encumbered at an individual entity level but which may be subject to restrictions in terms of their transferability within the Group. Such restrictions may be based on local connected lending requirements or similar regulatory restrictions. In this situation, it is not feasible to identify individual balance sheet items that cannot be transferred. This is also the case for regulatory minimum liquidity requirements. The Group identifies the volume of liquidity reserves in excess of local stress liquidity outflows. The aggregate amount of such liquidity reserves that are considered restricted for this purpose is
€
25.5
billion
as of December 31, 2021 (as of December 31, 2020:
€
43.5
billion
).
38 –
Structured entities
Nature, purpose and extent of the Group’s interests in structured entities
The Group engages in various business activities with structured entities which are designed to achieve a specific business purpose. A structured entity is one that has been set up so that any voting rights or similar rights are not the dominant factor in deciding who controls the entity. An example is when voting rights relate only to administrative tasks and the relevant activities are directed by contractual arrangements.
A structured entity often has some or all of the following features or attributes:
- – Restricted activities;
- – A narrow and well defined objective;
- – Insufficient equity to permit the structured entity to finance its activities without subordinated financial support;
- – Financing in the form of multiple contractually linked instruments to investors that create concentrations of credit or other risks (tranches).
The principal uses of structured entities are to provide clients with access to specific portfolios of assets and to provide market liquidity for clients through securitizing financial assets. Structured entities may be established as corporations, trusts or partnerships. Structured entities generally finance the purchase of assets by issuing debt and equity securities that are collateralized by and/or indexed to the assets held by the structured entities. The debt and equity securities issued by structured entities may include tranches with varying levels of subordination.
Structured entities are consolidated when the substance of the relationship between the Group and the structured entities indicate that the structured entities are controlled by the Group, as discussed in Note 1 “Significant Accounting Policies and Critical Accounting Estimates”.
Consolidated structured entities
The Group has contractual arrangements which may require it to provide financial support to the following types of consolidated structured entities.
Securitization vehicles
The Group uses securitization vehicles for funding purchase of diversified pool of assets. The Group provides financial support to these entities in the form of liquidity facility. As of December 31, 2021, and December 31, 2020, there were no outstanding loan commitments to these entities.
Funds
The Group may provide funding and liquidity facility or guarantees to funds consolidated by the group. As of December 31, 2021 and December 31, 2020, the notional value of the liquidity facilities and guarantees provided by the Group to such funds was
€
1.2
billion
and
€
1.0
billion
, respectively.
Deutsche Bank did not provide non-contractual support during the year to consolidated structured entities.
|
287
|
|
|
Deutsche Bank
|
Additional Notes
|
|
|
Annual Report 2021
|
|
|
|
|
|
Unconsolidated structured entities
These are entities which are not consolidated because the Group does not control them through voting rights, contract, funding agreements, or other means. The extent of the Group’s interests to unconsolidated structured entities will vary depending on the type of structured entities.
Below is a description of the Group’s involvements in unconsolidated structured entities by type.
Repackaging and investment entities
Repackaging and investment entities are established to meet clients’ investment needs through the combination of securities and derivatives. These entities are not consolidated by the Group because the Group does not have power to influence the returns obtained from the entities. These entities are usually set up to provide a certain investment return pre-agreed with the investor, and the Group is not able to change the investment strategy or return during the life of the transaction.
Third party funding entities
The Group provides funding to structured entities that hold a variety of assets. These entities may take the form of funding entities, trusts and private investment companies. The funding is collateralized by the asset in the structured entities. The group’s involvement involves predominantly both lending and loan commitments.
The vehicles used in these transactions are controlled by the borrowers where the borrowers have the ability to decide whether to post additional margin or collateral in respect of the financing. In such cases, where borrowers can decide to continue or terminate the financing, the borrowers will consolidate the vehicle.
Securitization Vehicles
The Group establishes securitization vehicles which purchase diversified pools of assets, including fixed income securities, corporate loans, and asset-backed securities (predominantly commercial and residential mortgage-backed securities and credit card receivables). The vehicles fund these purchases by issuing multiple tranches of debt and equity securities, the repayment of which is linked to the performance of the assets in the vehicles.
The Group may transfer assets to these securitization vehicles and provides financial support to these entities in the form of liquidity facilities.
The Group also invests and provides liquidity facilities to third party sponsored securitization vehicles.
The securitization vehicles that are not consolidated into the Group are those where the Group does not hold the power or ability to unilaterally remove the servicer or special servicer who has been delegated power over the activities of the entity.
Funds
The Group establishes structured entities to accommodate client requirements to hold investments in specific assets. The Group also invests in funds that are sponsored by third parties. A group entity may act as fund manager, custodian or some other capacity and provide funding and liquidity facilities to both group sponsored and third party funds. The funding provided is collateralized by the underlying assets held by the fund.
The Group does not consolidate funds when Deutsche Bank is deemed agent or when another third party investor has the ability to direct the activities of the fund.
Other
These are Deutsche Bank sponsored or third party structured entities that do not fall into any criteria above. These entities are not consolidated by the Group when the Group does not hold power over the decision making of these entities.
Income derived from involvement with structured entities
The Group earns management fees and, occasionally, performance-based fees for its investment management service in relation to funds. Interest income is recognized on the funding provided to structured entities. Any trading revenue as a result of derivatives with structured entities and from the movements in the value of notes held in these entities is recognized in ‘Net gains/losses on financial assets/liabilities held at fair value through profit and loss’.
Interests in unconsolidated structured entities
The Group’s interests in unconsolidated structured entities refer to contractual and non-contractual involvement that exposes the Group to variability of returns from the performance of the structured entities. Examples of interests in unconsolidated structured entities include debt or equity investments, liquidity facilities, guarantees and certain derivative instruments in which the Group is absorbing variability of returns from the structured entities.
|
288
|
|
|
Deutsche Bank
|
Additional Notes
|
|
|
Annual Report 2021
|
|
|
|
|
|
Interests in unconsolidated structured entities exclude instruments which introduce variability of returns into the structured entities. For example, when the Group purchases credit protection from an unconsolidated structured entity whose purpose and design is to pass through credit risk to investors, the Group is providing the variability of returns to the entity rather than absorbing variability. The purchased credit protection is therefore not considered as an interest for the purpose of the table below.
Maximum exposure to unconsolidated structured entities
The maximum exposure to loss is determined by considering the nature of the interest in the unconsolidated structured entity. The maximum exposure for loans and trading instruments is reflected by their carrying amounts in the consolidated balance sheet. The maximum exposure for derivatives and off balance sheet commitments such as guarantees, liquidity facilities and loan commitments under IFRS 12, as interpreted by the Group, is reflected by the notional amounts. Such amounts or their development do not reflect the economic risks faced by the Group because they do not take into account the effects of collateral or hedges nor the probability of such losses being incurred. At December 31, 2021, the notional related to the positive and negative replacement values of derivatives and off balance sheet commitments were
€
104
billion
,
€
296
billion
and
€
22
billion
respectively. At December 31, 2020, the notional related to the positive and negative replacement values of derivatives and off balance sheet commitments were
€
78
billion
,
€
238
billion
and
€
16
billion
respectively.
Size of structured entities
The Group provides a different measure for size of structured entities depending on their type. The following measures have been considered as appropriate indicators for evaluating the size of structured entities:
- – Funds – Net asset value or assets under management where the Group holds fund units and notional of derivatives when the Group’s interest comprises of derivatives.
- – Securitizations – notional of notes in issue (excluding interest only and excess notes where applicable) when the Group derives its interests through notes its holds and notional of derivatives when the Group’s interests is in the form of derivatives.
- – Third party funding entities – Total assets in entities
- – Repackaging and investment entities – Fair value of notes in issue
For Third party funding entities, size information is not publicly available, therefore the Group has disclosed the greater of the collateral the Group has received/pledged or the notional of the exposure the Group has to the entity.
Based on the above definitions, the total size of structured entities is
€
2,168
billion
, of which the majority of
€
1,251
billion
is from Funds. In 2020, it was
€
1,878
billion
and
€
1,088
billion
respectively.
The following table shows, by type of structured entity, the carrying amounts of the Group’s interests recognized in the consolidated statement of financial position as well as the maximum exposure to loss resulting from these interests. The carrying amounts presented below do not reflect the true variability of returns faced by the Group because they do not take into account the effects of collateral or hedges.
|
289
|
|
|
Deutsche Bank
|
Additional Notes
|
|
|
Annual Report 2021
|
|
|
|
|
|
Carrying amounts and size relating to Deutsche Bank’s interests
|
|
|
Dec 31, 2021
|
||||||||
|
in € m.
|
|
Repacka-
ging and
Investment
Entities
|
|
Third Party
Funding
Entities
|
|
Securiti-
zations
|
|
Funds
|
|
Total
|
|
Assets
|
|
|
|
|
|
|
|
|
|
|
|
Cash and central bank balances
|
|
|
|
|
|
|
|
|
|
|
|
Interbank balances (w/o central banks)
|
|
|
|
|
|
|
|
|
|
|
|
Central bank funds sold and securities
purchased under resale agreements
|
|
|
|
|
|
|
|
|
|
|
|
Securities Borrowed
|
|
|
|
|
|
|
|
|
|
|
|
Total financial assets at fair value
through profit or loss
|
|
|
|
|
|
|
|
|
|
|
|
Trading assets
|
|
|
|
|
|
|
|
|
|
|
|
Positive market values
(derivative financial instruments)
|
|
|
|
|
|
|
|
|
|
|
|
Non-trading financial assets mandatory at fair value through profit or loss
|
|
|
|
|
|
|
|
|
|
|
|
Financial assets designated at fair
value through profit or loss
|
|
|
|
|
|
|
|
|
|
|
|
Financial assets at fair value through other comprehensive income
|
|
|
|
|
|
|
|
|
|
|
|
Loans at amortized cost
|
|
|
|
|
|
|
|
|
|
|
|
Other assets
|
|
|
|
|
|
|
|
|
|
|
|
Total assets
|
|
|
|
|
|
|
|
|
|
|
|
|
|
|
|
|
|
|
|
|
|
|
|
Liabilities
|
|
|
|
|
|
|
|
|
|
|
|
Total financial liabilities at fair value
through profit or loss
|
|
|
|
|
|
|
|
|
|
|
|
Negative market values
(derivative financial instruments)
|
|
|
|
|
|
|
|
|
|
|
|
Other short-term borrowings
|
|
|
|
|
|
|
|
|
|
|
|
Other liabilities
|
|
|
|
|
|
|
|
|
|
|
|
Total liabilities
|
|
|
|
|
|
|
|
|
|
|
|
Off-balance sheet exposure
|
|
|
|
|
|
|
|
|
|
|
|
Total
|
|
|
|
|
|
|
|
|
|
|
|
|
|
|
|
|
|
|
|
|
|
|
|
|
|
Dec 31, 2020
|
||||||||
|
in € m.
|
|
Repacka-
ging and
Investment
Entities
|
|
Third Party
Funding
Entities
|
|
Securiti-
zations
|
|
Funds
|
|
Total
|
|
Assets
|
|
|
|
|
|
|
|
|
|
|
|
Cash and central bank balances
|
|
|
|
|
|
|
|
|
|
|
|
Interbank balances (w/o central banks)
|
|
|
|
|
|
|
|
|
|
|
|
Central bank funds sold and securities
purchased under resale agreements
|
|
|
|
|
|
|
|
|
|
|
|
Securities Borrowed
|
|
|
|
|
|
|
|
|
|
|
|
Total financial assets at fair value
through profit or loss
|
|
|
|
|
|
|
|
|
|
|
|
Trading assets
|
|
|
|
|
|
|
|
|
|
|
|
Positive market values
(derivative financial instruments)
|
|
|
|
|
|
|
|
|
|
|
|
Non-trading financial assets mandatory at fair value through profit or loss
|
|
|
|
|
|
|
|
|
|
|
|
Financial assets designated at fair
value through profit or loss
|
|
|
|
|
|
|
|
|
|
|
|
Financial assets at fair value through other comprehensive income
|
|
|
|
|
|
|
|
|
|
|
|
Loans at amortized cost
|
|
|
|
|
|
|
|
|
|
|
|
Other assets
|
|
|
|
|
|
|
|
|
|
|
|
Total assets
|
|
|
|
|
|
|
|
|
|
|
|
|
|
|
|
|
|
|
|
|
|
|
|
Liabilities
|
|
|
|
|
|
|
|
|
|
|
|
Total financial liabilities at fair value
through profit or loss
|
|
|
|
|
|
|
|
|
|
|
|
Negative market values
(derivative financial instruments)
|
|
|
|
|
|
|
|
|
|
|
|
Other short-term borrowings
|
|
|
|
|
|
|
|
|
|
|
|
Other liabilities
|
|
|
|
|
|
|
|
|
|
|
|
Total liabilities
|
|
|
|
|
|
|
|
|
|
|
|
Off-balance sheet exposure
|
|
|
|
|
|
|
|
|
|
|
|
Total
|
|
|
|
|
|
|
|
|
|
|
|
|
|
|
|
|
|
|
|
|
|
|
Trading assets –Total trading assets as of December 31, 2021 and December 31, 2020 of
€
12.2
billion
and
€
11.0
billion
are comprised primarily of
€
3.2
billion
and
€
2.4
billion
in Securitizations and
€
4.0
billion
and
€
4.3
billion
in Funds structured entities respectively. The Group’s interests in securitizations are collateralized by the assets contained in these entities. Where the Group holds fund units these are typically in regards to market making in funds or otherwise serve as hedges for notes issued to clients. Moreover the credit risk arising from loans made to Third party funding structured entities is mitigated by the collateral received.
Non-trading financial assets mandatory at fair value through profit or loss – Reverse repurchase agreements to Funds comprise the majority of the interests in this category and are collateralized by the underlying securities.
Loans – Loans as of December 31, 2021 and December 31, 2020 consist of
€
103.1
billion
and
€
84.9
billion
investment in securitization tranches and financing to Third party funding entities. The Group’s financing to Third party funding entities is collateralized by the assets in those structured entities.
Other assets – Other assets as of December 31, 2021 and December 31, 2020 of
€
16.1
billion
and
€
24.0
billion
, respectively, consist primarily of prime brokerage receivables and cash margin balances.
Pending Receivables – Pending Receivable balances are not included in this disclosure note due to the fact that these balances arise from typical customer supplier relationships out of e.g. brokerage type activities and their inherent volatility would not provide users of the financial statements with effective information about Deutsche Bank’s exposures to structured entities.
Financial support
Deutsche Bank did not provide non-contractual support during the year to unconsolidated structured entities.
Sponsored unconsolidated structured entities where the Group has no interest as of December 31, 2021 and December 31, 2020.
As a sponsor, the Group is involved in the legal set up and marketing of the entity and supports the entity in different ways, namely:
|
290
|
|
|
Deutsche Bank
|
Additional Notes
|
|
|
Annual Report 2021
|
|
|
|
|
|
- – transferring assets to the entities
- – providing seed capital to the entities
- – providing operational support to ensure the entity’s continued operation
- – providing guarantees of performance to the structured entities.
The Group is also deemed a sponsor for a structured entity if market participants would reasonably associate the entity with the Group. Additionally, the use of the Deutsche Bank name for the structured entity indicates that the Group has acted as a sponsor.
The gross revenues from sponsored entities where the Group did not hold an interest as of December 31, 2021 and December 31, 2020 were
€
254
million
and
€ (
134
) million
respectively. Instances where the Group does not hold an interest in an unconsolidated sponsored structured entity include cases where any seed capital or funding to the structured entity has already been repaid in full to the Group during the year. This amount does not take into account the impacts of hedges and is recognized in Net gains/losses on financial assets/liabilities at fair value through profit and loss. The aggregated carrying amounts of assets transferred to sponsored unconsolidated structured entities in 2021 were
€
3.2
billion
for securitization and
€
1.4
billion
for repackaging and investment entities. In 2020, they were
€
1.4
billion
for securitization and
€
1.2
billion
for repackaging and investment entities.
39 –
Current and non-current assets and liabilities
Asset and liability line items by amounts recovered or settled within or after one year
|
291
|
|
|
Deutsche Bank
|
Additional Notes
|
|
|
Annual Report 2021
|
|
|
|
|
|
Asset items as of December 31, 2021
|
|
|
Amounts recovered or settled
|
|
Total
|
||
|
in € m.
|
|
within one year
|
|
after one year
|
|
Dec 31, 2021
|
|
Cash and central bank balances
|
|
|
|
|
|
|
|
Interbank balances (w/o central banks)
|
|
|
|
|
|
|
|
Central bank funds sold and securities purchased under resale agreements
|
|
|
|
|
|
|
|
Securities borrowed
|
|
|
|
|
|
|
|
Financial assets at fair value through profit or loss
|
|
|
|
|
|
|
|
Financial assets at fair value through other comprehensive income
|
|
|
|
|
|
|
|
Equity method investments
|
|
|
|
|
|
|
|
Loans at amortized cost
|
|
|
|
|
|
|
|
Property and equipment
|
|
|
|
|
|
|
|
Goodwill and other intangible assets
|
|
|
|
|
|
|
|
Other assets
|
|
|
|
|
|
|
|
Assets for current tax
|
|
|
|
|
|
|
|
Total assets before deferred tax assets
|
|
|
|
|
|
|
|
Deferred tax assets
|
|
|
|
|
|
|
|
Total assets
|
|
|
|
|
|
|
|
|
|
|
|
|
|
|
Liability items as of December 31, 2021
|
|
|
Amounts recovered or settled
|
|
Total
|
||
|
in € m.
|
|
within one year
|
|
after one year
|
|
Dec 31, 2021
|
|
Deposits
|
|
|
|
|
|
|
|
Central bank funds purchased and securities sold under repurchase agreements
|
|
|
|
|
|
|
|
Securities loaned
|
|
|
|
|
|
|
|
Financial liabilities at fair value through profit or loss
|
|
|
|
|
|
|
|
Other short-term borrowings
|
|
|
|
|
|
|
|
Other liabilities
|
|
|
|
|
|
|
|
Provisions
|
|
|
|
|
|
|
|
Liabilities for current tax
|
|
|
|
|
|
|
|
Long-term debt
|
|
|
|
|
|
|
|
Trust preferred securities
|
|
|
|
|
|
|
|
Total liabilities before deferred tax liabilities
|
|
|
|
|
|
|
|
Deferred tax liabilities
|
|
|
|
|
|
|
|
Total liabilities
|
|
|
|
|
|
|
|
|
|
|
|
|
|
|
Asset items as of December 31, 2020
|
|
|
Amounts recovered or settled
|
|
Total
|
||
|
in € m.
|
|
within one year
|
|
after one year
|
|
Dec 31, 2020
|
|
Cash and central bank balances
|
|
|
|
|
|
|
|
Interbank balances (w/o central banks)
|
|
|
|
|
|
|
|
Central bank funds sold and securities purchased under resale agreements
|
|
|
|
|
|
|
|
Securities borrowed
|
|
|
|
|
|
|
|
Financial assets at fair value through profit or loss
|
|
|
|
|
|
|
|
Financial assets at fair value through other comprehensive income
|
|
|
|
|
|
|
|
Equity method investments
|
|
|
|
|
|
|
|
Loans at amortized cost
|
|
|
|
|
|
|
|
Property and equipment
|
|
|
|
|
|
|
|
Goodwill and other intangible assets
|
|
|
|
|
|
|
|
Other assets
|
|
|
|
|
|
|
|
Assets for current tax
|
|
|
|
|
|
|
|
Total assets before deferred tax assets
|
|
|
|
|
|
|
|
Deferred tax assets
|
|
|
|
|
|
|
|
Total assets
|
|
|
|
|
|
|
|
|
|
|
|
|
|
|
Liability items as of December 31, 2020
|
|
|
Amounts recovered or settled
|
|
Total
|
||
|
in € m.
|
|
within one year
|
|
after one year
|
|
Dec 31, 2020
|
|
Deposits
|
|
|
|
|
|
|
|
Central bank funds purchased and securities sold under repurchase agreements
|
|
|
|
|
|
|
|
Securities loaned
|
|
|
|
|
|
|
|
Financial liabilities at fair value through profit or loss
|
|
|
|
|
|
|
|
Other short-term borrowings
|
|
|
|
|
|
|
|
Other liabilities
|
|
|
|
|
|
|
|
Provisions
|
|
|
|
|
|
|
|
Liabilities for current tax
|
|
|
|
|
|
|
|
Long-term debt
|
|
|
|
|
|
|
|
Trust preferred securities
|
|
|
|
|
|
|
|
Total liabilities before deferred tax liabilities
|
|
|
|
|
|
|
|
Deferred tax liabilities
|
|
|
|
|
|
|
|
Total liabilities
|
|
|
|
|
|
|
|
|
|
|
|
|
|
|
40 –
Events after the reporting period
On February 24, 2022, Russia commenced a large-scale invasion against Ukraine. In response, the West has moved to impose broad-based sanctions targeting Russia, including but not limited to certain Russian banks and the Russian Central Bank, companies, parliamentary members and members of the Russian elite and their families. It is possible that additional sanctions and other measures may be imposed in the future. Developments with regards to the military conflict are fast moving and the extent of any financial and non-financial impact on the Group is currently not known.
As of December 31, 2021, the Group’s operating subsidiary in Russia, OOO "Deutsche Bank" (DB Moscow), had capital of
€
0.2
billion
, with the foreign currency risk being actively managed and fully hedged as of January 2022. Total assets of DB Moscow amounted to
€
1.5
billion
, of which approximately
€
0.5
billion
(Russian Ruble equivalent) was deposited with the Central Bank in Russia. The Group also operates a technology service center in Russia, OOO "Deutsche Bank TechCentre" (DBTC), which is one of several technology centers around the world, with close to
1,600
employees at the end of 2021 (approximately
5
%
of the Group’s technology workforce). The Group is continuously assessing the operational setup of DBTC, which could result in additional costs to our cost base in the future.
As of December 31, 2021, the Group’s loan exposure to Russia amounted to
€
1.4
billion
on a gross basis, which represents approximately
0.3
%
of the total loan book. On a net basis, after taking into account guarantees and asset collateral, the loan exposure amounted to
€
0.6
billion
. The majority of this loan exposure relates to large Russian companies with material operations and cash-flow outside of Russia. Loans may be provided onshore by DB Moscow, or offshore by other Group entities outside of Russia. In addition, the wealth management business has offshore loans to counterparties with a Russian connection, collateralized in line with the Group’s policies. As of December 31, 2021, the Group also had derivative exposures to Russia. The majority of these positions are currently in the process of being unwound with the Group being in a net liability position. Accordingly, no additional material credit risk exists, while contagion market risk and settlement risk may arise. In addition, as of December 31, 2021, exposures related to undrawn commitments amounted to
€
1.0
billion
and to written financial and trade guarantees to
€
0.5
billion
.
|
292
|
|
|
Deutsche Bank
|
Additional Notes
|
|
|
Annual Report 2021
|
|
|
|
|
|
The Group has managed its market risk to Russia by performing regular risk assessments of its risk profile. To mitigate a broader contagion risk, action was taken was to reduce direct exposure prior to and immediately after events unfolded. This was achieved by entering into additional hedges and selective de-risking. The Group continues to closely monitor the situation by performing further contagion stress testing on different scenarios, with a key focus on potential reactions from the Central Bank of Russia.
The Group’s financial and non-financial exposure to Ukraine is not material but is being closely monitored.
Overall, the potential financial and non-financial impact of the ongoing situation on the Group will depend on how the crisis unfolds. The crisis and its impact on local and global economic conditions could impact our ability to generate revenues or meet our financial targets, increase our costs, negatively impact specific portfolios, result in higher-than-expected credit losses or potential impairments of assets, and potentially have a negative impact on our operations in Russia or Ukraine. Given the uncertainty of the situation, it is currently not possible to estimate any future impact on the financial statements.
|
293
|
|
|
Deutsche Bank
|
Additional Notes
|
|
|
Annual Report 2021
|
|
|
|
|
|
41 –
Regulatory capital information
General definitions
The calculation of our own funds incorporates the capital requirements following the “Regulation (EU) No 575/2013 on prudential requirements for credit institutions and investment firms” (Capital Requirements Regulation or “CRR”) and the “Directive 2013/36/EU on access to the activity of credit institutions and the prudential supervision of credit institutions and investment firms” (Capital Requirements Directive or “CRD”) which have been further amended with subsequent Regulations and Directives. The CRD has been implemented into German law. The information in this section as well as in the section “Development of risk-weighted Assets” is based on the regulatory principles of consolidation.
This section refers to the capital adequacy of the group of entities consolidated for banking regulatory purposes pursuant to the CRR and the German Banking Act (“Kreditwesengesetz” or “KWG”). Therein not included are insurance companies or companies outside the finance sector.
The total own funds pursuant to the effective regulations as of year-end 2021 comprises Tier 1 and Tier 2 (T2) capital. Tier 1 capital is subdivided into Common Equity Tier 1 (CET 1) capital and Additional Tier 1 (AT1) capital.
Common Equity Tier 1 (CET 1) capital consists primarily of common share capital (reduced by own holdings) including related share premium accounts, retained earnings (including losses for the financial year, if any) and accumulated other comprehensive income, subject to regulatory adjustments (i.e. prudential filters and deductions), as well as minority interests qualifying for inclusion in consolidated CET1 capital. Prudential filters for CET 1 capital, according to Articles 32 to 35 CRR, include (i) securitization gains on sale, (ii) cash flow hedges and changes in the value of own liabilities, and (iii) additional value adjustments. CET 1 capital deductions for instance includes (i) intangible assets (exceeding their prudential value), (ii) deferred tax assets that rely on future profitability, (iii) negative amounts resulting from the calculation of expected loss amounts, (iv) net defined benefit pension fund assets, (v) reciprocal cross holdings in the capital of financial sector entities and, (vi) significant and non-significant investments in the capital (CET 1, AT1, T2) of financial sector entities above certain thresholds. All items not deducted (i.e., amounts below the threshold) are subject to risk-weighting.
Additional Tier 1 (AT1) capital consists of AT1 capital instruments and related share premium accounts as well as noncontrolling interests qualifying for inclusion in consolidated AT1 capital. To qualify as AT1 capital under CRR/CRD, instruments must have principal loss absorption through a conversion to common shares or a write-down mechanism allocating losses at a trigger point and must also meet further requirements (perpetual with no incentive to redeem; institution must have full dividend/coupon discretion at all times, etc.).
Tier 2 (T2) capital comprises eligible capital instruments, the related share premium accounts and subordinated long-term debt, certain loan loss provisions and noncontrolling interests that qualify for inclusion in consolidated T2 capital. To qualify as T2 capital, capital instruments or subordinated debt must have an original maturity of at least five years. Moreover, eligible capital instruments may inter alia not contain an incentive to redeem, a right of investors to accelerate repayment, or a credit sensitive dividend feature
We present in this report certain figures based on the CRR definition of own fund instruments applicable for Additional Tier 1
(AT1) capital and Tier 2 (T2) capital and figures based thereon, (including Tier 1, Total Capital and Leverage Ratio) on a “fully loaded” basis. We calculate such “fully loaded” figures excluding the transitional arrangements for own fund instruments as provided in the currently applicable CRR/CRD.
Our CET1 and RWA figures include the transitional impacts from the IFRS 9 add-back also in the “fully-loaded” figures given it is an immaterial difference.
Transitional arrangements are applicable for AT1 and T2 instruments. Capital instruments issued on or prior to December 31, 2011, that no longer qualify as AT1 or T2 capital under the fully loaded CRR/CRD as currently applicable are subject to grandfathering rules during the transitional period and are being phased out from 2013 to 2022 with their recognition capped at
20
%
in 2020 and
10
%
in 2021 (in relation to the portfolio eligible for grandfathering which was still in issue on December 31, 2012) with grandfathering phasing out completely from January 1, 2022.
The current CRR as applicable since June 27, 2019 provides further grandfathering rules for AT1 and T2 instruments issued prior to June 27, 2019. Thereunder, AT1 and T2 instruments issued through special purpose entities are grandfathered until December 31, 2021. Beyond 2021, transitional arrangements only exist for AT1 and T2 instruments which continue to qualify until June 26, 2025 even if they do not meet certain new requirements that apply since June 27, 2019. We have immaterial amounts of such instruments outstanding at yearend 2021, which practically removes the difference between “fully loaded” and “transitional” AT1 and T2 instruments starting from January 1, 2022.
|
294
|
|
|
Deutsche Bank
|
Additional Notes
|
|
|
Annual Report 2021
|
|
|
|
|
|
We believe that these “fully loaded” calculations provide useful information to investors as they reflect our progress against known future regulatory capital standards. Many of our competitors have been describing calculations on a “fully loaded” basis, however, our competitors’ assumptions and estimates regarding “fully loaded” calculations may vary such that, our “fully loaded” measures may not be comparable with similarly labelled measures used by our competitors.
Capital instruments
Our Management Board received approval from the 2020 Annual General Meeting to buy back up to
206.7
million
shares before the end of April 2025. Thereof
103.3
million
shares can be purchased by using derivatives, this includes
41.3
million
derivatives with a maturity exceeding 18 months. During the period from the 2020 Annual General Meeting until the 2021 Annual General Meeting (May 27, 2021),
28.7
million
shares were purchased. The shares purchased were used for equity compensation purposes in the same period or are to be used in the upcoming period so that the number of shares held in Treasury from buybacks was
3.7
million
as of the 2021 Annual General Meeting.
The 2021 Annual General Meeting granted our Management Board the approval to buy back up to
206.7
million
shares before the end of April 2026. Thereof
103.3
million
shares can be purchased by using derivatives, this includes
41.3
million
derivatives with a maturity exceeding 18 months. These authorizations substitute the authorizations of the previous year. During the period from the 2021 Annual General Meeting until December 31, 2021,
4.0
million
shares and
24.0
million
call options were purchased. The shares in inventory are to be used in this period or upcoming periods for equity compensation purposes; the number of shares held in Treasury from buybacks was
0.7
million
as of December 31, 2021. The call options are to be used also for equity compensation purposes in the upcoming periods.
Since the 2017 Annual General Meeting, renewed at the 2021 Annual General Meeting, and as of December 31, 2021, authorized capital available to the Management Board is
€
2,560
million
(
1,000
million
shares). As of December 31, 2021, the conditional capital against cash stands at
€
512
million
(
200
million
shares). The Management Board has decided that it will not make use of this conditional capital. Additional conditional capital for equity compensation amounts to
€
51.2
million
(
20
million
shares). Further, the 2018 Annual General Meeting authorized the issuance of participatory notes and other Hybrid Debt Securities that fulfill the regulatory requirements to qualify as Additional Tier 1 capital with an equivalent value of
€
8.0
billion
.
Our legacy Hybrid Tier 1 capital instruments (substantially all noncumulative trust preferred securities) are not recognized under fully loaded CRR/CRD rules as Additional Tier 1 capital, mainly because they have no write-down or equity conversion feature. During the transitional phase-out period the maximum recognizable amount of Additional Tier 1 instruments from Basel 2.5 compliant issuances as of December 31, 2012 will be reduced at the beginning of each financial year by
10
%
or
€
1.3
billion
, through 2022. For December 31, 2021, this resulted in eligible Additional Tier 1 instruments of
€
8.9
billion
(i.e.
€
8.3
billion
AT1 Notes recognized under fully loaded CRR/CRD rules as well as
€
0.6
billion
of legacy Hybrid Tier 1 instruments recognizable during the transition period; the latter are recognized as regulatory capital as of December 2021 for the last time). In 2021, the bank issued AT1 notes amounting to
€
2.5
billion
. Furthermore, the bank redeemed legacy Hybrid Tier 1 instruments with a notional of
€
0.5
billion
.
The total of our Tier 2 capital instruments as of December 31, 2021 recognized during the transition period under CRR/CRD was
€
7.4
billion
(nominal value of
€
8.8
billion
). Tier 2 instruments recognized under fully loaded CRR/CRD rules amounted to
€
7.3
billion
(nominal value of
€
8.7
billion
). In 2021, the bank issued Tier 2 capital instruments with a nominal value of
U.S.$
1.25
billion
(equivalent amount of
€
1.1
billion
). Furthermore, Tier 2 capital instruments with a notional of
€
0.3
billion
were redeemed.
Minimum capital requirements and additional capital buffers
Failure to meet minimum capital requirements can result in supervisory measures such as restrictions of profit distributions or limitations on certain businesses such as lending. We complied with the regulatory capital adequacy requirements in 2021.
|
295
|
|
|
Deutsche Bank
|
Additional Notes
|
|
|
Annual Report 2021
|
|
|
|
|
|
Details on regulatory capital
Own Funds Template (incl. RWA and capital ratios)
|
|
|
|
||||
|
in € m.
|
|
|
Dec 31, 2021
|
|
|
Dec 31, 2020³
|
|
Common Equity Tier 1 (CET 1) capital: instruments and reserves
|
|
|
|
|
|
|
|
Capital instruments, related share premium accounts and other reserves
|
|
|
|
|
|
|
|
Retained earnings
|
|
|
|
|
|
|
|
Accumulated other comprehensive income (loss), net of tax
|
|
|
(
|
|
|
(
|
|
Independently reviewed interim profits net of any foreseeable charge or dividend
1
|
|
|
|
|
|
|
|
Other
|
|
|
|
|
|
|
|
Common Equity Tier 1 (CET 1) capital before regulatory adjustments
|
|
|
|
|
|
|
|
|
|
|
|
|
|
|
|
Common Equity Tier 1 (CET 1) capital: regulatory adjustments
|
|
|
|
|
|
|
|
Additional value adjustments (negative amount)
|
|
|
(
|
|
|
(
|
|
Other prudential filters (other than additional value adjustments)
|
|
|
(
|
|
|
(
|
|
Goodwill and other intangible assets (net of related tax liabilities) (negative amount)
|
|
|
(
|
|
|
(
|
|
Deferred tax assets that rely on future profitability excluding those arising from
temporary differences (net of related tax liabilities where the conditions in Art. 38 (3)
CRR are met) (negative amount)
|
|
|
(
|
|
|
(
|
|
Negative amounts resulting from the calculation of expected loss amounts
|
|
|
(
|
|
|
(
|
|
Defined benefit pension fund assets (net of related tax liabilities) (negative amount)
|
|
|
(
|
|
|
(
|
|
Direct, indirect and synthetic holdings by an institution of own CET 1 instruments (negative amount)
|
|
|
|
|
|
|
|
Direct, indirect and synthetic holdings by the institution of the CET 1 instruments of financial sector entities where the institution has a significant investment in those entities (amount above the 10 % / 15 % thresholds and net of eligible short positions) (negative amount)
|
|
|
|
|
|
|
|
Deferred tax assets arising from temporary differences (net of related tax liabilities where the conditions in Art. 38 (3) CRR are met) (amount above the 10 % / 15 % thresholds) (negative amount)
|
|
|
(
|
|
|
(
|
|
Other regulatory adjustments
2
|
|
|
(
|
|
|
(
|
|
Total regulatory adjustments to Common Equity Tier 1 (CET 1) capital
|
|
|
(
|
|
|
(
|
|
Common Equity Tier 1 (CET 1) capital
|
|
|
|
|
|
|
|
|
|
|
|
|
|
|
|
Additional Tier 1 (AT1) capital: instruments
|
|
|
|
|
|
|
|
Capital instruments and the related share premium accounts
|
|
|
|
|
|
|
|
Amount of qualifying items referred to in Art. 484 (4) CRR and the related share
premium accounts subject to phase out from AT1
|
|
|
|
|
|
|
|
Additional Tier 1 (AT1) capital before regulatory adjustments
|
|
|
|
|
|
|
|
|
|
|
|
|
|
|
|
Additional Tier 1 (AT1) capital: regulatory adjustments
|
|
|
|
|
|
|
|
Direct, indirect and synthetic holdings by an institution of own AT1 instruments
(negative amount)
|
|
|
(
|
|
|
(
|
|
Residual amounts deducted from AT1 capital with regard to deduction from CET 1 capital during the transitional period pursuant to Art. 472 CRR
|
|
|
|
|
|
N/M
|
|
Other regulatory adjustments
|
|
|
|
|
|
|
|
Total regulatory adjustments to Additional Tier 1 (AT1) capital
|
|
|
(
|
|
|
(
|
|
Additional Tier 1 (AT1) capital
|
|
|
|
|
|
|
|
Tier 1 capital (T1 = CET 1 + AT1)
|
|
|
|
|
|
|
|
|
|
|
|
|
|
|
|
Tier 2 (T2) capital
|
|
|
|
|
|
|
|
Total capital (TC = T1 + T2)
|
|
|
|
|
|
|
|
Total risk-weighted assets
|
|
|
|
|
|
|
|
Capital ratios
|
|
|
|
|
|
|
|
Common Equity Tier 1 capital ratio (as a percentage of risk-weighted assets)
|
|
|
|
|
|
|
|
Tier 1 capital ratio (as a percentage of risk-weighted assets)
|
|
|
|
|
|
|
|
Total capital ratio (as a percentage of risk-weighted assets)
|
|
|
|
|
|
|
|
|
|
|
|
|
|
|
N/M – Not meaningful
1
Full year profit is recognized as per ECB Decision (EU) 2015/656 in accordance with the Article 26(2) of Regulation (EU) No 575/2013 (ECB/2015/4).
2
Includes capital deductions of
€
1.1
billion
(December 2020:
€
0.9
billion
) based on ECB guidance on irrevocable payment commitments related to the Single Resolution Fund and the Deposit Guarantee Scheme,
€
0.7
billion
(December 2020:
€
0.7
billion
) based on ECB’s supervisory recommendation for a prudential provisioning of non-performing exposures,
€
17
million
resulting from minimum value commitments as per Article 36 (1)(n) of the CRR which became effective 30 June 2021 and CET 1 increase of
€
39
million
(December 2020:
€
54
million
) from IFRS 9 transitional provision as per Article 473a of the CRR. Capital deductions of
€
0.7
billion
, based on regular ECB review, included at December 2020, have been released as of December 31, 2021.
|
296
|
|
|
Deutsche Bank
|
Additional Notes
|
|
|
Annual Report 2021
|
|
|
|
|
|
3
The Common Equity Tier 1 capital for December 31, 2020 has been updated to reflect a dividend payment of zero for the financial year 2020
.
Reconciliation of shareholders’ equity to Own Funds
|
|
|
CRR/CRD
|
||
|
in € m.
|
|
Dec 31, 2021
|
|
Dec 31, 2020 ³
|
|
Total shareholders’ equity per accounting balance sheet (IASB IFRS)
|
|
|
|
|
|
Difference between equity per IASB IFRS / EU IFRS
4
|
|
(
|
|
|
|
Total shareholders’ equity per accounting balance sheet (EU IFRS)
|
|
|
|
|
|
Deconsolidation/Consolidation of entities
|
|
|
|
|
|
Of which:
|
|
|
|
|
|
Additional paid-in capital
|
|
|
|
|
|
Retained earnings
|
|
|
|
|
|
Accumulated other comprehensive income (loss), net of tax
|
|
|
|
|
|
Total shareholders' equity per regulatory balance sheet
|
|
|
|
|
|
Minority Interests (amount allowed in consolidated CET 1)
|
|
|
|
|
|
AT1 coupon and shareholder dividend deduction
1
|
|
(
|
|
(
|
|
Common Equity Tier 1 (CET 1) capital before regulatory adjustments
|
|
|
|
|
|
Additional value adjustments
|
|
(
|
|
(
|
|
Other prudential filters (other than additional value adjustments)
|
|
(
|
|
(
|
|
Goodwill and other intangible assets (net of related tax liabilities) (negative amount)
|
|
(
|
|
(
|
|
Deferred tax assets that rely on future profitability
|
|
(
|
|
(
|
|
Defined benefit pension fund assets (net of related tax liabilities) (negative amount)
|
|
(
|
|
(
|
|
Direct, indirect and synthetic holdings by the institution of the CET 1 instruments of financial sector entities
where the institution has a significant investment in those entities
|
|
|
|
|
|
Other regulatory adjustments
2
|
|
(
|
|
(
|
|
Common Equity Tier 1 capital
|
|
|
|
|
|
|
|
|
|
|
1
Full year profit is recognized as per ECB Decision (EU) 2015/656 in accordance with the Article 26(2) of Regulation (EU) No 575/2013 (ECB/2015/4)
.
2
Includes capital deductions of
€
1.1
billion
(December 2020:
€
0.9
billion
) based on ECB guidance on irrevocable payment commitments related to the Single Resolution Fund and the Deposit Guarantee Scheme,
€
0.7
billion
(December 2020:
€
0.7
billion
) based on ECB’s supervisory recommendation for a prudential provisioning of non-performing exposures,
€
0.6
billion
(December 2020:
€
0.1
billion
) negative amounts resulting from the calculation of expected loss amounts,
€
17
million
resulting from minimum value commitments as per Article 36 (1)(n) of the CRR which became effective 30 June 2021 and CET 1 increase of
€
39
million
(December 2020:
€
54
million
) from IFRS 9 transitional provision as per Article 473a of the CRR. Capital deductions of
€
0.7
billion
, based on regular ECB review, included at December 2020, have been released as of December 31, 2021.
3
The Common Equity Tier 1 capital for December 31, 2020 has been updated to reflect a dividend payment of zero for the financial year 2020
.
4
Differences in “equity per balance sheet” result entirely from deviations in profit (loss) after taxes due to the application of EU carve-out rules as set forth in the chapter "Basis of preparation/impact of changes in accounting principles". These rules were initially applied in the first quarter 2020
.
Capital management
Our Treasury function manages solvency, capital adequacy, leverage and bail-in capacity ratios at Group level and locally in each region, as applicable. Treasury implements our capital strategy, which itself is developed by the Group Risk Committee and approved by the Management Board. Treasury, directly or through the Group Asset and Liability Committee, manages, among other things, issuance and repurchase of shares and capital instruments, hedging of capital ratios against foreign exchange swings, setting capacities for key financial resources, design of shareholders’ equity allocation, and regional capital planning. We are fully committed to maintaining our sound capitalization both from an economic and regulatory perspective. We continuously monitor and adjust our overall capital demand and supply in an effort to achieve an appropriate balance of the economic and regulatory considerations at all times and from all perspectives. These perspectives include book equity based on IFRS accounting standards, regulatory and economic capital as well as specific capital requirements from rating agencies.
Treasury manages the issuance and repurchase of capital instruments, namely Common Equity Tier 1, Additional Tier 1 and Tier 2 capital instruments as well as TLAC/MREL eligible debt instruments. Treasury constantly monitors the market for liability management trades. Such trades represent a countercyclical opportunity to create Common Equity Tier 1 capital by buying back our issuances below par.
Treasury manages the sensitivity of our capital ratios against swings in currencies. For this purpose, Treasury determines which currencies are to be hedged, develops suitable hedging strategies in close cooperation with Risk Management and finally executes these hedges. The capital invested into our foreign subsidiaries and branches in our core currencies Euro, US Dollar, Chinese Renminbi and Pound Sterling is not hedged in order to balance respective effects from movements in capital deduction items and risk weighted assets. The capital invested in non-core currencies is either partly hedged taking capital demand into account or fully hedged.
|
297
|
|
|
Deutsche Bank
|
Additional Notes
|
|
|
Annual Report 2021
|
|
|
|
|
|
Resource limit setting
Usage of key financial resources is influenced through the following governance processes and incentives.
Target resource capacities are reviewed in our annual strategic plan in line with our CET 1 and Leverage Ratio ambitions. As a part of our quarterly process, the Group Asset and Liability Committee approves divisional resource limits for total capital demand (defined as the sum of Risk Weighted Assets (RWA) and certain RWA equivalents of Capital Deduction Items) and leverage exposure that are based on the strategic plan but adjusted for market conditions and the short-term outlook. Limits are enforced through a close monitoring process and an excess charging mechanism.
Overall regulatory capital requirements are principally driven by either our CET 1 ratio (solvency) or leverage ratio (leverage) requirements, whichever is the more binding constraint. For the internal capital allocation, the combined contribution of each segment to the Group’s Common Equity Tier 1 ratio, the Group’s Leverage ratio and the Group’s Capital Loss under Stress are weighted to reflect their relative importance and level of constraint to the Group. Contributions to the Common Equity Tier 1 ratio and the Leverage ratio are measured through RWA and Leverage Ratio Exposure (LRE). The Group’s Capital Loss under Stress is a measure of the Group’s overall economic risk exposure under a defined stress scenario. Goodwill and other intangible assets are directly allocated to the respective segments, supporting the calculation of the allocated tangible shareholders equity and the respective rate of return.
Most of our subsidiaries and a number of our branches are subject to legal and regulatory capital requirements. In developing, implementing and testing our capital and liquidity, we fully take such legal and regulatory requirements into account. Any material capital requests of our branches and subsidiaries across the globe are presented to and approved by the Group Investment Committee prior to execution.
Further, Treasury is represented on the Investment Committee of the largest Deutsche Bank pension fund which sets the investment guidelines for this fund. This representation is intended to ensure that pension assets are aligned with pension liabilities, thus protecting our capital base.
42 –
Impact of Deutsche Bank’s transformation
The information presented in this Note refers to a number of transformational measures relating to the Group’s businesses and its organization Deutsche Bank announced on July 7, 2019. The immediate and secondary impacts that these measures had on the Group’s operating results and financial position are disclosed below.
Impairment and amortization of Self-developed software and other related impacts
In line with the transformation announcement, the Group reviewed current platform software and software under construction assigned to businesses subject to the transformation strategy. Accordingly, the reassessment of the respective recoverable amounts led to an impairment of self-developed software of
€
131
million
and
€
36
million
for the financial year ended December 31, 2021 and 2020, respectively. Most of the software impairment of
€
131
million
is related to the implementation of cloud computing.
In addition, the Group recorded amortization on software and other related impacts subject to the transformation strategy of
€
451
million
and
€
178
million
for the financial year ended December 31, 2021 and 2020, respectively. The amortization on software and other related impacts of
€
451
million
include
€
350
million
that is related to the settlement in September 2021 of an IT service contract. The impairment write-down as well as the software amortization are included within the general and administrative expenses of the Group’s results in 2021 and 2020, respectively.
Impairment of Right of Use assets and other related impacts
The Group recognized impairments, accelerated or higher depreciation of Right-of-Use (RoU) assets, asset write downs and accelerated depreciation on leasehold improvements and furniture, onerous contracts provisions for non-lease costs, depreciation of capitalized reinstatement costs and other one-time relocation costs of
€
269
million
and
€
201
million
for the financial year ended December 31, 2021 and 2020, respectively. Certain of these costs related to incremental or accelerated decisions are driven by the changes in our expected operations due to the COVID-19 pandemic.
Deferred tax asset valuation adjustments
|
298
|
|
|
Deutsche Bank
|
Additional Notes
|
|
|
Annual Report 2021
|
|
|
|
|
|
Each quarter, the Group re-evaluates its estimate related to deferred tax assets, including its assumptions about future profitability. In connection with the transformation the Group adjusted the estimate related to deferred tax assets in affected jurisdictions, such as the UK and the U.S., and recognized
€
0
million
and
€
37
million
of valuation adjustments for the financial year ended December 31, 2021 and 2020, respectively.
Restructuring severance charges
Starting with the announcement of the transformation of Deutsche Bank on July 7, 2019, we designated all restructuring expenses as related to the transformation announcement and the subsequent business re-organization and perimeter changes resulting in
€
261
million
and
€
485
million
restructuring expenses for the Group for the financial year ended December 31, 2021 and 2020, respectively. These charges are comprised of termination benefits, additional expenses covering the acceleration of deferred compensation awards not yet amortized due to the discontinuation of employment and contract termination costs related to real estate.
1,362
and
1,447
full-time equivalent employees (FTE) were impacted by the re-organization and changes during the financial year 2021 and 2020, respectively.
In addition to these restructuring expenses,
€
209
million
and
€
203
million
of severance related to the transformation announcement were recorded for the financial year ended December 31, 2021 and 2020, respectively.
Other transformation related expenses
As a result of the strategic transformation, the Group recognized other transformation related expenses including expenses for Audit, Accounting Tax, consulting fees and IT consulting fees of
€
152
million
and
€
75
million
for the financial year ended December 31, 2021 and 2020, respectively.
43
–
IBOR Reform
In recent years, transactions in the unsecured short-term financing market, which IBOR interest rate benchmarks seek to measure, have significantly reduced. As a result, IBOR reform projects were initiated under the leadership of the Financial Stability Board (FSB) and central bank working groups, to create alternative and robust benchmark interest rates or so-called risk-free rates (“RFRs”).
Many of the reforms are now effective while others are well progressed. In 2019, EURIBOR was reformed to comply with the EU financial benchmarks regulation and continues to be available. EONIA ceased to exist from January 3, 2022 and has been replaced by the “€STR” euro short-term rate €STR. Publication of IBOR settings for all tenors of GBP LIBOR, CHF LIBOR, EUR LIBOR and JPY LIBOR ceased on January 3, 2022. Three JPY LIBOR and three GBP LIBOR benchmarks will continue in ‘synthetic’ form for limited periods but are not available for use in new products. For USD LIBOR, publication of settings for 1-week and 2-months USD LIBOR has ended as of December 31, 2021. Five remaining USD LIBOR settings will continue to be published until the end of June 2023 although they are generally not available for use in new products. A decision about whether to continue any of the USD LIBOR settings in ‘synthetic’, and thus non-representative, form will be taken closer to that date.
The following table shows the notional values of financial instruments, external to the Group, which reference IBORs where it is expected that there will no longer be a requirement to quote IBOR rates. The table includes those financial instruments with a maturity date that extends past the date when the requirement to submit quotes is expected to end. For the IBOR rates disclosed below, the maturity date of the financial instruments maturity is after December 31, 2021, except for USD LIBOR referenced contracts with tenors other than 1-week or 2-months where the date is for those maturing after June 30, 2023.
|
299
|
|
|
Deutsche Bank
|
Additional Notes
|
|
|
Annual Report 2021
|
|
|
|
|
|
Interest Rate Benchmark (IBOR) Reform
|
|
|
2021
|
||||||||||||
|
in € m.
|
|
USD LIBOR
|
|
GBP LIBOR
|
|
CHF LIBOR
|
|
JPY LIBOR
|
|
EONIA
|
|
Other IBORs
|
|
Multiple basis
1
|
|
Non-Derivative Financial assets:
|
|
|
|
|
|
|
|
|
|
|
|
|
|
|
|
Bonds (floating rate notes)
|
|
|
|
|
|
|
|
|
|
|
|
|
|
|
|
Securitizations
|
|
|
|
|
|
|
|
|
|
|
|
|
|
|
|
Syndicated Loans
|
|
|
|
|
|
|
|
|
|
|
|
|
|
|
|
Repurchase agreements / Other Secured Lending
|
|
|
|
|
|
|
|
|
|
|
|
|
|
|
|
Loans / Advances (Total Limit)
|
|
|
|
|
|
|
|
|
|
|
|
|
|
|
|
Retail / Commercial Mortgages
|
|
|
|
|
|
|
|
|
|
|
|
|
|
|
|
Other
|
|
|
|
|
|
|
|
|
|
|
|
|
|
|
|
Derivative Financial assets:
2
|
|
|
|
|
|
|
|
|
|
|
|
|
|
|
|
Interest Rate Derivatives – Exchange Traded
|
|
|
|
|
|
|
|
|
|
|
|
|
|
|
|
Interest Rate Derivatives – OTC
|
|
|
|
|
|
|
|
|
|
|
|
|
|
|
|
Other OTC Derivatives
|
|
|
|
|
|
|
|
|
|
|
|
|
|
|
|
Total financial assets
|
|
|
|
|
|
|
|
|
|
|
|
|
|
|
|
|
|
|
|
|
|
|
|
|
|
|
|
|
|
|
|
Non-Derivative Financial liabilities:
|
|
|
|
|
|
|
|
|
|
|
|
|
|
|
|
Bonds (floating rate notes)
|
|
|
|
|
|
|
|
|
|
|
|
|
|
|
|
Repos / Other Secured Lending
|
|
|
|
|
|
|
|
|
|
|
|
|
|
|
|
Deposits
|
|
|
|
|
|
|
|
|
|
|
|
|
|
|
|
Other
|
|
|
|
|
|
|
|
|
|
|
|
|
|
|
|
Derivative Financial liabilities:
2
|
|
|
|
|
|
|
|
|
|
|
|
|
|
|
|
Interest Rate Derivatives – Exchange Traded
|
|
|
|
|
|
|
|
|
|
|
|
|
|
|
|
Interest Rate Derivatives – OTC
|
|
|
|
|
|
|
|
|
|
|
|
|
|
|
|
Other OTC Derivatives
|
|
|
|
|
|
|
|
|
|
|
|
|
|
|
|
Total financial liabilities
|
|
|
|
|
|
|
|
|
|
|
|
|
|
|
|
|
|
|
|
|
|
|
|
|
|
|
|
|
|
|
|
Off-balance sheet:
|
|
|
|
|
|
|
|
|
|
|
|
|
|
|
|
Loan Commitments
|
|
|
|
|
|
|
|
|
|
|
|
|
|
|
|
Other Commitments
|
|
|
|
|
|
|
|
|
|
|
|
|
|
|
|
Other
|
|
|
|
|
|
|
|
|
|
|
|
|
|
|
|
Total off-balance sheet
|
|
|
|
|
|
|
|
|
|
|
|
|
|
|
|
|
|
|
|
|
|
|
|
|
|
|
|
|
|
|
1
Multiple basis relates to underlying contracts utilizing multiple benchmarks subject to reforms, (e.g. floating- floating interest rate swaps which have cash flows in GBP IBOR and USD IBOR).
2
The Group also has exposure to interest rate benchmark reform in respect of its cash collateral balances across some of its Credit Support Annex agreements. This exposure is not presented in the table due to its short term nature
.
The table above shows the exposure to legacy IBORs based upon the contractual terms and the reference rate that currently applies. All the positions referencing GBP LIBOR, CHF LIBOR, JPY LIBOR, EUR LIBOR, EONIA and those USD LIBOR tenors ceasing in early 2022 have either effective fall back provisions in place which will result in the benchmark rate on these products changing to an alternative reference rate when the respective IBOR ceases on January 3, 2022, or are expected to utilize GBP and JPY synthetic IBOR in 2022 as the transition arrangements are finalized. The Group IBOR program is tracking such contracts that are expected to utilize GBP and JPY synthetic LIBOR in 2022. The notional value of these positions amounts to approximately
€
1.15
billion
across a limited number of clients and products, the majority of which are lending products and the remainder derivatives clients. The majority of these positions is expected to transition to new benchmark rates during the first quarter of 2022.
|
300
|
|
|
Deutsche Bank
|
Additional Notes
|
|
|
Annual Report 2021
|
|
|
|
|
|
44 –
Condensed Deutsche Bank AG (parent company only) financial information
In May 2020 the former subsidiary DB Privat- und Firmenkundenbank AG was merged with Deutsche Bank AG effective retrospectively as of January 1, 2020. The comparative data in the subsequent tables was not adjusted.
Condensed statement of income
|
in € m.
|
|
2021
|
|
2020
|
|
2019
|
|
Interest income, excluding dividends from subsidiaries
|
|
|
|
|
|
|
|
Dividends received from subsidiaries:
|
|
|
|
|
|
|
|
Bank subsidiaries
|
|
|
|
|
|
|
|
Nonbank subsidiaries
|
|
|
|
|
|
|
|
Interest expense
|
|
|
|
|
|
|
|
Net interest and dividend income
|
|
|
|
|
|
|
|
Provision for credit losses
|
|
|
|
|
|
|
|
Net interest and dividend income after provision for credit losses
|
|
|
|
|
|
|
|
Noninterest income:
|
|
|
|
|
|
|
|
Commissions and fee income
|
|
|
|
|
|
|
|
Net gains (losses) on financial assets/liabilities at fair value through profit or loss
|
|
|
|
|
|
|
|
Other income (loss)
1
|
|
(
|
|
|
|
(
|
|
Total noninterest income
|
|
|
|
|
|
(
|
|
Noninterest expenses:
|
|
|
|
|
|
|
|
Compensation and benefits
|
|
|
|
|
|
|
|
General and administrative expenses
|
|
|
|
|
|
|
|
Services provided by (to) affiliates, net
|
|
|
|
|
|
|
|
Impairment of goodwill and other intangible assets
|
|
|
|
|
|
|
|
Total noninterest expenses
|
|
|
|
|
|
|
|
Income (loss) before income taxes
|
|
|
|
|
|
(
|
|
Income tax expense (benefit)
|
|
|
|
(
|
|
|
|
Net income (loss) attributable to Deutsche Bank shareholders and additional equity components
|
|
|
|
|
|
(
|
|
|
|
|
|
|
|
|
1
Includes net gains (losses) on financial assets mandatory at fair value through other comprehensive income as well as impairments and write-ups on investments in subsidiaries. In 2020 the gain from the merger of DB Privat-und Firmenkundenbank with Deutsche Bank AG is also included.
Condensed statement of comprehensive income
|
in € m.
|
|
2021
|
|
2020
|
|
2019
|
|
Net income (loss) attributable to Deutsche Bank shareholders and additional equity components
|
|
|
|
|
|
(
|
|
Other comprehensive income (loss), net of tax
|
|
|
|
(
|
|
(
|
|
Total comprehensive income (loss), net of tax
|
|
|
|
|
|
(
|
|
|
|
|
|
|
|
|
|
301
|
|
|
Deutsche Bank
|
Additional Notes
|
|
|
Annual Report 2021
|
|
|
|
|
|
Condensed balance sheet
|
in € m.
|
|
Dec 31, 2021
|
|
Dec 31, 2020
|
|
Assets:
|
|
|
|
|
|
Cash and central bank balances:
|
|
|
|
|
|
Interbank balances (w/o central banks):
|
|
|
|
|
|
Bank subsidiaries
|
|
|
|
|
|
Other
|
|
|
|
|
|
Central bank funds sold, securities purchased under resale agreements, securities borrowed:
|
|
|
|
|
|
Bank subsidiaries
|
|
|
|
|
|
Nonbank subsidiaries
|
|
|
|
|
|
Other
|
|
|
|
|
|
Financial assets at fair value through profit or loss:
|
|
|
|
|
|
Bank subsidiaries
|
|
|
|
|
|
Nonbank subsidiaries
|
|
|
|
|
|
Other
|
|
|
|
|
|
Financial assets at fair value through other comprehensive income
|
|
|
|
|
|
Investments in associates
|
|
|
|
|
|
Investment in subsidiaries:
|
|
|
|
|
|
Bank subsidiaries
|
|
|
|
|
|
Nonbank subsidiaries
|
|
|
|
|
|
Loans:
|
|
|
|
|
|
Bank subsidiaries
|
|
|
|
|
|
Nonbank subsidiaries
|
|
|
|
|
|
Other
|
|
|
|
|
|
Other assets:
|
|
|
|
|
|
Bank subsidiaries
|
|
|
|
|
|
Nonbank subsidiaries
|
|
|
|
|
|
Other
|
|
|
|
|
|
Total assets
|
|
|
|
|
|
Liabilities and equity:
|
|
|
|
|
|
Deposits:
|
|
|
|
|
|
Bank subsidiaries
|
|
|
|
|
|
Nonbank subsidiaries
|
|
|
|
|
|
Other
|
|
|
|
|
|
Central bank funds purchased, securities sold under repurchase agreements and securities loaned:
|
|
|
|
|
|
Bank subsidiaries
|
|
|
|
|
|
Nonbank subsidiaries
|
|
|
|
|
|
Other
|
|
|
|
|
|
Financial liabilities at fair value through profit or loss:
|
|
|
|
|
|
Bank subsidiaries
|
|
|
|
|
|
Nonbank subsidiaries
|
|
|
|
|
|
Other
|
|
|
|
|
|
Other short-term borrowings:
|
|
|
|
|
|
Bank subsidiaries
|
|
|
|
|
|
Nonbank subsidiaries
|
|
|
|
|
|
Other
|
|
|
|
|
|
Other liabilities:
|
|
|
|
|
|
Bank subsidiaries
|
|
|
|
|
|
Nonbank subsidiaries
|
|
|
|
|
|
Other
|
|
|
|
|
|
Long-term debt
|
|
|
|
|
|
Total liabilities
|
|
|
|
|
|
Total shareholders’ equity
|
|
|
|
|
|
Additional equity components
|
|
|
|
|
|
Total equity
|
|
|
|
|
|
Total liabilities and equity
|
|
|
|
|
|
|
|
|
|
|
|
302
|
|
|
Deutsche Bank
|
Additional Notes
|
|
|
Annual Report 2021
|
|
|
|
|
|
Condensed statement of cash flows
|
in € m.
|
|
2021
|
|
2020
|
|
2019
|
|
Net cash provided by (used in) operating activities
|
|
(
|
|
|
|
(
|
|
Cash flows from investing activities:
|
|
|
|
|
|
|
|
Proceeds from:
|
|
|
|
|
|
|
|
Sale of financial assets at fair value through other comprehensive income
|
|
|
|
|
|
|
|
Maturities of financial assets at fair value through other comprehensive income
|
|
|
|
|
|
|
|
Sale of debt securities held to collect at amortized cost
|
|
|
|
|
|
|
|
Maturities of debt securities held to collect at amortized cost
|
|
|
|
|
|
|
|
Sale of equity method investments
|
|
|
|
|
|
|
|
Sale of property and equipment
|
|
|
|
|
|
|
|
Purchase of:
|
|
|
|
|
|
|
|
Financial assets at fair value through other comprehensive income
|
|
(
|
|
(
|
|
(
|
|
Debt Securities held to collect at amortized cost
|
|
(
|
|
(
|
|
(
|
|
Investments in associates
|
|
(
|
|
(
|
|
(
|
|
Property and equipment
|
|
(
|
|
(
|
|
(
|
|
Net change in investments in subsidiaries
|
|
|
|
|
|
|
|
Other, net
|
|
(
|
|
(
|
|
(
|
|
Net cash provided by (used in) investing activities
|
|
|
|
|
|
(
|
|
Cash flows from financing activities:
|
|
|
|
|
|
|
|
Issuances of subordinated long-term debt
|
|
|
|
|
|
|
|
Repayments and extinguishments of subordinated long-term debt
|
|
(
|
|
(
|
|
(
|
|
Issuances of trust preferred securities
|
|
|
|
|
|
|
|
Repayments and extinguishments of trust preferred securities
|
|
|
|
|
|
|
|
Principal portion of lease payments
|
|
(
|
|
(
|
|
(
|
|
Common shares issued
|
|
|
|
|
|
|
|
Purchases of treasury shares
|
|
(
|
|
(
|
|
(
|
|
Sale of treasury shares
|
|
|
|
|
|
|
|
Additional Equity Components (AT1) issued
|
|
|
|
|
|
|
|
Purchases of Additional Equity Components (AT1)
|
|
(
|
|
(
|
|
(
|
|
Sale of Additional Equity Components (AT1)
|
|
|
|
|
|
|
|
Coupon on additional equity components, pre tax
|
|
(
|
|
(
|
|
(
|
|
Cash dividends paid
|
|
|
|
|
|
(
|
|
Net cash provided by (used in) financing activities
|
|
|
|
|
|
(
|
|
Net effect of exchange rate changes on cash and cash equivalents
|
|
|
|
(
|
|
|
|
Net increase (decrease) in cash and cash equivalents
|
|
|
|
|
|
(
|
|
thereof: Group internal merger
|
|
0
|
|
25,166
|
|
0
|
|
Cash and cash equivalents at beginning of period
|
|
|
|
|
|
|
|
Cash and cash equivalents at end of period
|
|
|
|
|
|
|
|
Net cash provided by (used in) operating activities include
|
|
|
|
|
|
|
|
Income taxes paid (received), net
|
|
|
|
|
|
|
|
Interest paid
|
|
|
|
|
|
|
|
Interest received
|
|
|
|
|
|
|
|
Dividends received
|
|
|
|
|
|
|
|
Cash and cash equivalents comprise
|
|
|
|
|
|
|
|
Cash and central bank balances (not included Interest-earning time deposits with central banks)
|
|
|
|
|
|
|
|
Interbank balances (w/o central banks)
|
|
|
|
|
|
|
|
Total
|
|
|
|
|
|
|
|
|
|
|
|
|
|
|
Parent company’s long-term debt by earliest contractual maturity
|
|
|
Due in
2022
|
|
Due in
2023
|
|
Due in
2024
|
|
Due in
2025
|
|
Due in
2026
|
|
Due after
2026
|
|
Total
Dec 31,
2021
|
|
Total
Dec 31,
2020
|
|
in € m.
|
|
|
|
|
|
|
|
|
|
|
|
|
|
|
|
|
|
Senior debt:
|
|
|
|
|
|
|
|
|
|
|
|
|
|
|
|
|
|
Bonds and notes:
|
|
|
|
|
|
|
|
|
|
|
|
|
|
|
|
|
|
Fixed rate
|
|
|
|
|
|
|
|
|
|
|
|
|
|
|
|
|
|
Floating rate
|
|
|
|
|
|
|
|
|
|
|
|
|
|
|
|
|
|
Other
|
|
|
|
|
|
|
|
|
|
|
|
|
|
|
|
69,254
|
|
Subordinated debt
|
|
|
|
|
|
|
|
|
|
|
|
|
|
|
|
|
|
Bonds and notes:
|
|
|
|
|
|
|
|
|
|
|
|
|
|
|
|
|
|
Fixed rate
|
|
|
|
|
|
|
|
|
|
|
|
|
|
|
|
|
|
Floating rate
|
|
|
|
|
|
|
|
|
|
|
|
|
|
|
|
|
|
Other
|
|
|
|
|
|
|
|
|
|
|
|
|
|
|
|
|
|
Total long-term debt
|
|
|
|
|
|
|
|
|
|
|
|
|
|
|
|
|
|
|
|
|
|
|
|
|
|
|
|
|
|
|
|
|
|
|
1
Prior years' comparatives aligned to presentation in the current year.
|
303
|
|
|
Deutsche Bank
|
Additional Notes
|
|
|
Annual Report 2021
|
|
|
|
|
|
[Page intentionally left blank for SEC filing purposes]
|
304
|
|
|
Deutsche Bank
|
Additional Notes
|
|
|
Annual Report 2021
|
|
|
|
|
|
[Page intentionally left blank for SEC filing purposes]
|
305
|
|
|
Deutsche Bank
|
Additional Notes
|
|
|
Annual Report 2021
|
|
|
|
|
|
Report of Independent Registered Public Accounting Firm
To the Shareholders and Supervisory Board Deutsche Bank Aktiengesellschaft:
Opinion on the Consolidated Financial Statements
We have audited the accompanying consolidated statements of income, comprehensive income, changes in equity and cash flows of Deutsche Bank Aktiengesellschaft and subsidiaries (the Company) for the year ended December 31, 2019, and the related notes and the specific disclosures described in Note 1 to the consolidated financial statements as being part of the financial statements (collectively, the consolidated financial statements). In our opinion, the consolidated financial statements present fairly, in all material respects, the results of the operations of the Company and its cash flows for the year ended December 31, 2019, in conformity with International Financial Reporting Standards (IFRS) as issued by the International Accounting Standards Board (IASB).
Basis for Opinion
These consolidated financial statements are the responsibility of the Company’s management. Our responsibility is to express an opinion on these consolidated financial statements based on our audit. We are a public accounting firm registered with the Public Company Accounting Oversight Board (United States) (PCAOB) and are required to be independent with respect to the Company in accordance with the U.S. federal securities laws and the applicable rules and regulations of the Securities and Exchange Commission and the PCAOB.
We conducted our audit in accordance with the standards of the PCAOB. Those standards require that we plan and perform the audit to obtain reasonable assurance about whether the consolidated financial statements are free of material misstatement, whether due to error or fraud. Our audit included performing procedures to assess the risks of material misstatement of the consolidated financial statements, whether due to error or fraud, and performing procedures that respond to those risks. Such procedures included examining, on a test basis, evidence regarding the amounts and disclosures in the consolidated financial statements. Our audit also included evaluating the accounting principles used and significant estimates made by management, as well as evaluating the overall presentation of the consolidated financial statements. We believe that our audit provides a reasonable basis for our opinion.
KPMG AG
Wirtschaftsprüfungsgesellschaft
We or our predecessor firms served as the Company’s and its predecessor companies’ auditor from 1952 to 2019.
Frankfurt am Main, Germany
March 13, 2020
|
306
|
|
|
Deutsche Bank
|
Additional Notes
|
|
|
Annual Report 2021
|
|
|
|
|
|
Report of Independent Registered Public Accounting Firm
To the Shareholders and the Supervisory Board of Deutsche Bank Aktiengesellschaft:
Opinion on the Financial Statements
We have audited the accompanying consolidated balance sheets of Deutsche Bank Aktiengesellschaft (“the Company”) as of December 31, 2021 and 2020, the related consolidated statements of income, comprehensive income, changes in equity and cash flows for each of the two years in the period ended December 31, 2021, the related notes and the specific disclosures described in Note 1 to the consolidated financial statements as being part of the financial statements (collectively referred to as the “consolidated financial statements”). In our opinion, the consolidated financial statements present fairly, in all material respects, the financial position of the Company at December 31, 2021 and 2020, and the results of its operations and its cash flows for each of the two years in the period ended December 31, 2021, in conformity with International Financial Reporting Standards as issued by the International Accounting Standards Board.
We also have audited, in accordance with the standards of the Public Company Accounting Oversight Board (United States) (PCAOB), the Company’s internal control over financial reporting as of December 31, 2021, based on criteria established in Internal Control-Integrated Framework issued by the Committee of Sponsoring Organizations of the Treadway Commission (2013 framework) and our report dated March 7, 2022 expressed an unqualified opinion thereon.
Basis for Opinion
These financial statements are the responsibility of the Company’s management. Our responsibility is to express an opinion on the Company’s financial statements based on our audits. We are a public accounting firm registered with the PCAOB and are required to be independent with respect to the Company in accordance with the U.S. federal securities laws and the applicable rules and regulations of the Securities and Exchange Commission and the PCAOB.
We conducted our audits in accordance with the standards of the PCAOB. Those standards require that we plan and perform the audit to obtain reasonable assurance about whether the financial statements are free of material misstatement, whether due to error or fraud. Our audits included performing procedures to assess the risks of material misstatement of the financial statements, whether due to error or fraud, and performing procedures that respond to those risks. Such procedures included examining, on a test basis, evidence regarding the amounts and disclosures in the financial statements. Our audits also included evaluating the accounting principles used and significant estimates made by management, as well as evaluating the overall presentation of the financial statements. We believe that our audits provide a reasonable basis for our opinion.
Critical Audit Matters
The critical audit matters communicated below are matters arising from the current period audit of the financial statements that were communicated or required to be communicated to the audit committee and that: (1) relate to accounts or disclosures that are material to the financial statements and (2) involved our especially challenging, subjective or complex judgments. The communication of critical audit matters does not alter in any way our opinion on the consolidated financial statements, taken as a whole, and we are not, by communicating the critical audit matters below, providing separate opinions on the critical audit matters or on the accounts or disclosures to which they relate.
|
307
|
|
|
Deutsche Bank
|
Additional Notes
|
|
|
Annual Report 2021
|
|
|
|
|
|
Valuation of level 3 financial instruments and related inputs not quoted in active markets
|
Description of the Matter
|
Management uses valuation techniques to establish the fair value of level 3 financial instruments and related inputs not quoted in active markets. The Company held level 3 financial assets and financial liabilities measured at fair value of EUR 25,182 million and EUR 11,424 million as of December 31, 2021. The relevant financial instruments are reported within financial assets and liabilities at fair value through profit or loss. Information on the valuation techniques, models and methodologies used in the measurement of fair value is provided in notes 1 and 13 of the notes to the consolidated financial statements.
Financial instruments and related inputs that are not quoted in active markets include structured derivatives valued using complex models; derivatives with non-standard collateral arrangements; more-complex OTC derivatives; distressed debt; highly-structured bonds; illiquid loans; credit spreads used to determine valuation adjustments (Credit Valuation Adjustment); and other inputs which cannot be observed mainly for instruments with longer-dated maturities.
Auditing the valuation of level 3 financial instruments and related inputs not quoted in active markets was complex due to the valuation techniques and models being utilized and the unobservability of the significant inputs used.
|
|
How We Addressed the Matter in Our Audit
|
We obtained an understanding, evaluated the design and tested the operating effectiveness of the controls over management’s processes to determine fair value of financial instruments and determination of significant unobservable inputs therein. This includes controls relating to independent price verification; independent validation of valuation models, including assessment of model limitations; monitoring valuation model usage; and calculation of fair value adjustments.
We evaluated the valuation techniques, models and methodologies, and tested the inputs used in those models. We performed an independent revaluation of a sample of derivatives and other financial instruments at fair value that are not quoted in active markets, using independent models and inputs. We also independently assessed the reasonableness of a sample of proxy inputs used by comparing them to market data sources and evaluated their relevance to the underlying positions.
In addition, we evaluated the methodology and inputs used by management in determining fair value adjustments against the requirements of IFRS 13 and performed recalculations for a sample of these valuation adjustments using our own independent data and methodology.
We involved our financial instruments valuation specialists in the procedures related to valuation models, independent revaluation and fair value adjustments.
|
|
308
|
|
|
Deutsche Bank
|
Additional Notes
|
|
|
Annual Report 2021
|
|
|
|
|
|
|
Description of the Matter
|
As of December 31, 2021, the Company recognized an allowance for credit losses of EUR 5,379 million, with EUR 1,216 million relating to stage 1 and stage 2 allowances. Information on the inclusion of forward-looking information into the model-based calculation of expected credit losses and their adjustments for stages 1 and 2 is provided in notes 1 and 19 of the notes to the consolidated financial statements.
The estimated probabilities of default (PD) used in the model-based calculation of expected credit losses on non-defaulted financial instruments (IFRS 9 stage 1 and stage 2) are based on historical information, combined with current economic developments and forward-looking macroeconomic forecasts (e.g., gross domestic product and unemployment rates). Statistical techniques are used to transform the base scenario for future macroeconomic developments into multiple scenarios. These scenarios are the basis for deriving multi-year PD curves for different rating and counterparty classes, which are used in the calculation of expected credit losses.
Given the economic uncertainties from the ongoing COVID-19 pandemic and related risks to the global economy, the estimation of forward-looking information requires significant judgement. To reflect these uncertainties, management must assess whether to make adjustments to its standard process for inclusion of macroeconomic variables into the expected credit loss model and forecasting methods, either by adjusting the macroeconomic variables or through the inclusion of management overlays.
Auditing the forward-looking information, included in the model-based calculation of expected credit losses, and any adjustment thereof, was complex due to the economic uncertainty and use of judgment.
|
|
How We Addressed the Matter in Our Audit
|
We obtained an understanding of the processes implemented by management, assessed the design of the controls over the selection, determination, monitoring and validation of forward-looking information in respect of the requirements under IFRS 9, and tested their operating effectiveness.
We evaluated management’s review of its expected credit loss model and forecasting methods conducted through the model validation process. Furthermore, we evaluated the methods used to include the selected variables in the baseline scenario and the multi-scenario analysis.
We assessed the baseline macroeconomic forecasts by comparing them with the macroeconomic forecasts published by external sources.
We also evaluated the methodology applied by management whether to, adjust its standard process for inclusion of macroeconomic variables or to adjust the model results through management overlays. In doing so, we assessed the results of management’s sensitivity analysis and compared the macroeconomic variables used to our own benchmark analysis. We also assessed that the adjustments were included in the calculation of expected credit losses according to management’s methodology.
To assess the inclusion of forward-looking information in the model-based calculation of expected credit losses, we involved internal credit risk modelling specialists to assist us.
|
|
309
|
|
|
Deutsche Bank
|
Additional Notes
|
|
|
Annual Report 2021
|
|
|
|
|
|
|
Description of the Matter
|
As of December 31, 2021, the Company reported goodwill of EUR 2,806 million that was exclusively allocated to its Asset Management cash-generating unit (CGU). Information on the measurement of goodwill is provided in notes 1 and 23 of the notes to the consolidated financial statements.
For purposes of the impairment test, the recoverable amount of the Asset Management CGU is calculated using the discounted cash flow model. In this context, significant assumptions are made regarding the earnings projections, the discount rate and the long-term growth rate. The discount rate is derived using the Capital Asset Pricing Model.
Auditing the measurement of goodwill for the Asset Management CGU involved a high degree of judgment due to the earnings projections, discount rate and long-term growth rate contained in the discounted cash flow model.
|
|
How We Addressed the Matter in Our Audit
|
We obtained an understanding of the process for preparing the earnings projections and calculating the recoverable amount of goodwill for the Asset Management CGU. In this respect, we also obtained an understanding of management’s controls regarding the earnings projections, the discount rate and the long-term growth rate, assessed the design of such controls and tested their operating effectiveness.
We analyzed the significant assumptions described above with a focus on significant changes in the planning assumptions compared with the prior year. In this regard, we assessed the consistency and reasonableness of the significant assumptions used in the discounted cash flow model by comparing them with external market expectations.
In analyzing the expected future cash flows of the Asset Management CGU, we compared the earnings projections with the prior fiscal year’s projections and the actual results achieved and evaluated any significant deviations. Furthermore, we assessed the significant valuation parameters used for the estimate of the recoverable amount, such as the discount rate and long- term growth rate, to the extent they are within a range of externally available forecasts.
We also recalculated the arithmetical accuracy of the discounted cash flow model used.
To assess the above assumptions made in the recoverability of goodwill, we involved internal business valuation specialists.
|
|
Description of the Matter
|
As of December 31, 2021, the Company reported net deferred tax assets of EUR 5,717 million. Information on the recognition and measurement of deferred tax assets is provided in notes 1 and 34 of the notes to the consolidated financial statements.
The recognition and measurement of deferred tax assets is based on the estimation of the ability to utilize unused tax losses and deductible temporary differences against potential future taxable income. This estimate is based, among others, on assumptions regarding forecasted operating results based upon the approved business plan. Auditing the deferred tax assets was complex because of the use of judgment in estimation of future taxable income and the ability to use tax losses.
|
|
How We Addressed the Matter in Our Audit
|
We obtained an understanding of the process to determine whether deductible temporary differences and unused tax losses are identified and measured in accordance with the provisions of tax law and rules for accounting for deferred taxes under IAS 12, evaluated the design and tested the operating effectiveness of the related controls.
We tested the assumptions used to develop and allocate elements of the approved business plan as a basis for estimating the future taxable income of the relevant group companies and tax groups.
Furthermore, we evaluated the recognition of deferred tax assets, by analyzing the key assumptions made in estimating future taxable income. We assessed the estimates made in the forecasted operating results by comparing the underlying key assumptions with historical and prospective data available externally. We compared the historical forecasts with the actual results. In addition, we assessed the estimated tax adjustments and we performed sensitivity analyses on the utilization periods of the respective deferred tax assets.
To assess the assumptions used in the recoverability of the deferred taxes, we involved our tax professionals and internal business valuation specialists.
|
/s/ Ernst Young GmbH Wirtschaftsprüfungsgesellschaft
We have served as the Company’s auditor since 2020.
Eschborn/Frankfurt am Main, Germany
March 7, 2022
|
310
|
|
|
Deutsche Bank
|
Additional Notes
|
|
|
Annual Report 2021
|
|
|
|
|
|
Confirmations
[Page intentionally left blank for SEC filing purposes]
|
311
|
|
|
Deutsche Bank
|
Additional Notes
|
|
|
Annual Report 2021
|
|
|
|
|
|
Responsibility Statement by the Management Board
[Page intentionally left blank for SEC filing purposes]
|
312
|
|
|
Deutsche Bank
|
Additional Notes
|
|
|
Annual Report 2021
|
|
|
|
|
|
3-
Compensation Report
|
|
Introduction – 328
|
|
|
|
328
|
Compensation of the Management Board
|
||
|
|
Principles for Management Board Compensation – 328
|
|
|
|
|
Responsibility and procedures for setting and reviewing Management Board compensation – 328
|
|
|
|
|
Guiding principle: Alignment of Management Board compensation to corporate strategy – 329
|
|
|
|
|
Compensation principles – 330
|
|
|
|
|
Compensation-related developments in 2021 – 330
|
|
|
|
|
Adjustment to the compensation system from January 1, 2021 – 330
|
|
|
|
|
Approval of the new compensation system by the Annual General Meeting 2021 – 331
|
|
|
|
|
Changes on the Management Board in 2021 – 332
|
|
|
|
|
Development of business and alignment of Management Board compensation to corporate strategy in 2021 – 332
|
|
|
|
|
Principles governing the determination of compensation – 333
|
|
|
|
|
Structure of the Management Board compensation system 2021 – 333
|
|
|
|
|
Composition of the target total compensation and maximum compensation – 334
|
|
|
|
|
Application of the compensation system in the financial year – 335
|
|
|
|
|
Non-performance-based components (fixed compensation) – 335
|
|
|
|
|
Performance-based components (variable compensation) – 336
|
|
|
|
|
Appropriateness of Management Board compensation and compliance with the set maximum compensation – 347
|
|
|
|
|
Deferrals and holding periods – 348
|
|
|
|
|
Information on shares and fulfilling the share ownership obligation (Shareholding Guidelines) – 350
|
|
|
|
|
Backtesting, malus and clawback – 349
|
|
|
|
|
Benefits as of the end of the mandate – 351
|
|
|
|
|
Benefits upon early termination – 352
|
|
|
|
|
Other service contract provisions – 352
|
|
|
|
|
Deviations from the compensation system – 353
|
|
|
|
|
Management Board compensation 2021 – 353
|
|
|
|
|
Current Management Board members – 353
|
|
|
|
|
Former members of the Management Board – 356
|
|
|
|
|
Outlook for the 2022 financial year – 357
|
|
|
|
|
Planned changes on the Management Board – 357
|
|
|
|
|
Total target compensation and maximum compensation – 357
|
|
|
|
|
Targets and objectives for 2022 – 358
|
|
|
|
359
|
Compensation of members of the Supervisory Board
|
||
|
|
Supervisory Board Compensation for the 2021 and 2020 financial year – 360
|
|
|
|
362
|
Comparative presentation of compensation and earnings trends
|
|
|
|
365
|
Compensation of the employees (unaudited)
|
||
|
|
Regulatory Environment – 365
|
|
|
|
|
Compensation Governance – 365
|
|
|
|
|
Compensation Strategy – 367
|
||
|
|
Group Compensation Framework – 368
|
||
|
|
Employee Groups with specific Compensation Structures – 369
|
||
|
|
Determination of performance-based Variable Compensation – 370
|
||
|
|
Variable Compensation Structure – 371
|
||
|
|
Ex-post Risk Adjustment of Variable Compensation – 372
|
||
|
|
Compensation Decisions for 2021 – 373
|
||
|
|
Material Risk Taker Compensation Disclosure – 374
|
|
|
|
313
|
|
|
Deutsche Bank
|
Additional Notes
|
|
|
Annual Report 2021
|
|
|
|
|
|
Introduction
The compensation report for the year 2021 provides detailed information on compensation in the Deutsche Bank Group.
Compensation Report for the Management Board and the Supervisory Board
The Compensation Report for the Management Board and the Supervisory Board for the 2021 financial year was prepared jointly by the Management Board and the Supervisory Board of Deutsche Bank Aktiengesellschaft (hereinafter: Deutsche Bank AG or the Bank) in accordance with Section 162 of the German Stock Corporation Act (AktG). The Compensation Report describes the fundamental features of the compensation systems for Deutsche Bank’s Management Board and Supervisory Board and provides information on the compensation granted and owed by Deutsche Bank in the 2021 financial year to each incumbent or former member of the Management Board and Supervisory Board.
The Compensation Report fulfills the current legal and regulatory requirements, in particular of Section 162 of the German Stock Corporation Act (AktG) and the Remuneration Ordinance for Institutions (InstitutsVergV) and takes into account the recommendations set out in the German Corporate Governance Code (GCGC). It is also in compliance with the applicable requirements of the accounting rules for capital market-oriented companies (German Commercial Code (HGB), International Financial Reporting Standards (IFRS)) as well as the guidelines issued by the working group Guidelines for Sustainable Management Board Remuneration Systems.
[As relevant for compensation determination purposes, the stated financial figures are prepared in accordance with International Financial Reporting Standards (IFRS) as issued by the International Accounting Standards Board (“IASB”) and endorsed by the European Union (“EU”), including application of fair value hedge accounting for portfolio hedges of interest rate risk (fair value macro hedges) in accordance with the EU carve-out version of IAS 39.]
Employee Compensation Report
This part of the compensation report discloses information with regard to the compensation system and structure that applies to the employees in Deutsche Bank Group (including DWS Group). The report provides details on the Group Compensation Framework and it outlines the decisions on Variable Compensation for 2021. Furthermore, this part contains quantitative disclosures specific to employees identified as Material Risk Takers (MRTs) in accordance with the Remuneration Ordinance for Institutions (
Institutsvergütungsverordnung
– InstVV).
Compensation of the Management Board
Principles for Management Board Compensation
Responsibility and procedures for setting and reviewing Management Board compensation
The Supervisory Board as a whole is responsible for the decisions on the design of the compensation system as well as for setting the individual compensation amounts and procedures for awarding the compensation. The Compensation Control Committee supports the Supervisory Board in its tasks of designing and monitoring the implementation of the system and prepares proposals for resolutions for the Supervisory Board. As necessary, the Compensation Control Committee recommends that the Supervisory Board makes adjustments to the system. In the case of significant changes, but at least every four years, the compensation system for the Management Board is submitted to the General Meeting for approval in accordance with Section 120a (1) of the German Stock Corporation Act (AktG). The compensation system was last approved by the General Meeting 2021 by a majority of 97.76 %.
|
314
|
|
|
Deutsche Bank
|
Additional Notes
|
|
|
Annual Report 2021
|
|
|
|
|
|
On the basis of the approved compensation system, the Supervisory Board sets the target total compensation for each Management Board member for the respective financial year, while taking into account the scope and complexity of the respective Management Board member’s functional responsibilities, the length of service of the Management Board member on the Management Board as well as the company’s financial situation. In the process, the Supervisory Board also considers the customary market compensation, also based on both horizontal and vertical comparisons, and sets the upper limit for total compensation (maximum compensation) (additional information is provided in the section “Appropriateness of Management Board compensation and compliance with the set maximum compensation”).
Guiding principle: Alignment of Management Board compensation to corporate strategy
Deutsche Bank aims to make a positive contribution to its clients, employees, investors and society in general by fostering economic growth and social progress. Deutsche Bank would like to offer its clients solutions and provide an active contribution to foster the creation of value by its clients. This approach is also intended to ensure that Deutsche Bank is competitive and profitable and can operate on the basis of a strong capital and liquidity position. Deutsche Bank is committed to a corporate culture that appropriately aligns risks and revenues.
Deutsche Bank has set ambitious targets for the Group for the period up to and including 2022. These include the further stabilization of the Bank, the successful completion of the transformation of the Group, and sustainable profitability. The achievement of these goals can be measured in concrete terms by the following key figures communicated by the Management Board: (1) a planned revenue for the Group of around € 24.4 billion, (2) a continuous reduction in costs, (3) a Common Equity Tier 1 ratio (CET1 ratio) of over 12.5 %, and (4) a return on equity (RoTE) of 8 %.
In the interest of the shareholders, the Management Board compensation system is aligned to the business strategy as well as the sustainable and long-term development of Deutsche Bank and provides suitable incentives for a consistent achievement of the set targets. Through the composition of total compensation comprising non-performance-based (fixed) and performance-based (variable) compensation components, through the assessment of performance across short-term and long-term periods and through the consideration of relevant, challenging performance parameters, the implementation of the Group strategy and the alignment with the sustainable and long-term performance of the Group are rewarded in a clear and understandable manner. The structure of the targets and objectives therefore comprises a balanced mix of both financial and non-financial parameters and indicators.
Through the structuring of the compensation system, the members of the Management Board are motivated to achieve the targets and objectives linked to Deutsche Bank’s strategy, to work individually and as a team continually towards the long-term positive development of Deutsche Bank, without taking on disproportionately high risks. The Supervisory Board thus ensures there is always a strong link between compensation and performance in line with shareholder interests (“pay for performance”).
|
315
|
|
|
Deutsche Bank
|
Additional Notes
|
|
|
Annual Report 2021
|
|
|
|
|
|
Compensation principles
The design of the compensation system and thus the assessment of individual compensation amounts are based on the compensation principles outlined below. The Supervisory Board takes them into consideration when adopting its resolutions in this context:
|
|
|
|
|
|
Corporate strategy
|
|
The compensation system for the Management Board members is closely linked to Deutsche Bank’s strategy, thereby focusing their work on its implementation and the long-term positive development of the Group, without taking disproportionatel risks.
|
|
|
Shareholders’ interests
|
|
The interests of shareholders are always taken into account when designing the specific structure of the compensation system, determining individual compensation amounts and structuring the means of compensation allocation and delivery.
|
|
|
Individual and collective objectives
|
|
Setting individual, divisional and collective objectives fosters not only the sustainable and long-term development of each of the business divisions, infrastructure areas or regions the Management Board members are responsible for, but also the performance of the Management Board as a collective management body.
|
|
|
Long-term perspective
|
|
A long-term link to Deutsche Bank’s performance is secured by setting a greater percentage of long-term objectives in comparison to short-term objectives and by granting variable compensation exclusively in deferred form and mostly as share-based compensation with vesting and holding periods of up to seven years.
|
|
|
Sustainability
|
|
Economic, social and ecological objectives in accordance with Deutsche Bank’s ESG (Environmental, Social and Governance) strategy provide incentives to act responsibly, also in the context of sustainability, and thus make an important contribution to Deutsche Bank`s long-term performance.
|
|
|
Appropriateness and upper limits (caps)
|
|
The appropriateness of the compensation amounts is ensured through the review of the compensation based on a horizontal comparison with peers and a vertical comparison with the workforce as well as suitable compensation caps on the achievable variable compensation and maximum compensation.
|
|
|
Transparency
|
|
By avoiding unnecessary complexity in the structures and through clear and understandable reporting, the transparency of the compensation system is increased in accordance with the expectations of investors and the public as well as the regulatory requirements.
|
|
|
Governance
|
|
The structuring of the compensation system and the assessment to determine the individual compensation take place within the framework of the statutory and regulatory requirements.
|
|
|
|
|
|
|
Compensation-related developments in 2021
Adjustment to the compensation system from January 1, 2021
The compensation system for the members of the Management Board was lastly adjusted effective as of January 1, 2021. In its review of the compensation system, the Supervisory Board pursued in particular the following objectives:
- – Simplification of the compensation structures to improve understandability and transparency
- – Consideration of current market practices of comparable financial institutions (peers)
- – Implementation of recent legal and regulatory developments
As a result of the review, the Supervisory Board identified three areas requiring action and decided to make the related adjustments:
|
316
|
|
|
Deutsche Bank
|
Additional Notes
|
|
|
Annual Report 2021
|
|
|
|
|
|
|
|
||||
|
Option to facilitate a more rapid compliance with the shareholding obligation
|
|
The Supervisory Board can resolve to increase the proportion of share-based variable compensation to as much as 100 % until the shareholding obligation agreed with the Management Board members is fulfilled. This does not lead to an increase in overall variable compensation but only to an increase in the percentage awarded on the basis of shares.
|
||
|
Increased consistency within the compensation system through structural adjustments
|
|
Consistent weightings and clearer structures provide greater transparency regarding the compensation components.
|
||
|
|
-
|
|
The variable compensation components are no longer weighted differently but in the same manner for all members of the Management Board.
|
|
|
|
-
|
|
All individual and divisional objectives are bundled within the short-term component and the objectives to be achieved collectively are reflected in the long-term component.
|
|
|
|
-
|
|
The maximum target achievement levels for the short-term component and the long-term component are harmonized at 150 % (instead of previously 200 % for the short-term component).
|
|
|
Management Board compensation closely linked to Deutsche Bank’s ESG strategy
|
|
The compensation structures are more strongly linked to sustainability objectives derived from Deutsche Bank’s ESG strategy.
|
||
|
|
-
|
|
ESG targets are included in the Balanced Scorecards as part of the short-term component.
ESG targets can also be included in individual objectives.
|
|
|
|
-
|
|
Within the long-term component there is an ESG Matrix with objectives to be achieved collectively in the Environmental, Social and Governance areas. This results in an ESG-Factor of 20 % of the total variable compensation.
|
|
|
|
|
|
|
|
The following overview shows the changes in the compensation structure applicable with effect from 2021 in comparison to the previous compensation system:

Approval of the new compensation system by the Annual General Meeting 2021
The compensation system for members of the Management Board of Deutsche Bank as adjusted with effect from January 1, 2021, was submitted to the ordinary General Meeting on May 27, 2021, for approval in accordance with Section 120a (1) of the German Stock Corporation Act (AktG). The General Meeting approved the compensation system with a majority of 97.76 %.
|
317
|
|
|
Deutsche Bank
|
Additional Notes
|
|
|
Annual Report 2021
|
|
|
|
|
|
Implementation of the adjusted compensation system took place within the framework of the Management Board service contracts through the voluntary agreement of the Management Board members to the required contract amendments and applied to all Management Board members incumbent during the 2021 financial year.
Changes on the Management Board in 2021
Frank Kuhnke resigned from office as member of the Management Board and Chief Operating Officer with effect from April 30, 2021. Rebecca Short was appointed member of the Management Board with effect from May 1, 2021, for a period of three years. With effect from May 1, 2021, the Supervisory Board resolved changes in the functional responsibilities assigned to individual Management Board members. The Management Board comprised 10 members throughout 2021. The proportion of women in the Management Board has been 20 % since May 1, 2021.
Development of business and alignment of Management Board compensation to corporate strategy in 2021
Management Board compensation is closely aligned with Deutsche Bank’s strategic targets. All of the individual and collective objectives agreed with the Management Board members as well as their assessment parameters for the 2021 financial year were discussed by the Compensation Control Committee at the beginning of the year and subsequently resolved on by the Supervisory Board. The objectives serve overall in fostering the strategic transformation of the Group. The achievement levels determined with respect to the objectives for the 2021 financial year at the beginning of the year 2022 reflect the extent to which the individual objectives were achieved and thus contributed to the Bank’s performance.
Despite the persistently challenging economic environment, and also during the second year of the COVID-19 pandemic, Deutsche Bank was successful in delivering on its transformation and generated the highest net profit in a decade. In 2021, Deutsche Bank continued to realign its business model, while significantly reducing costs and regaining sustainable profitability. 97 % of the planned restructuring costs were already recognized by the end of 2021.
Profit before tax amounted to € 3.4 billion and net profit rose to € 2.5 billion, which is more than four times the amount achieved in 2020. All business segments were profitable in 2021 and revenues increased by 6 % to € 25.4 billion. This is largely due to strong growth in new business and gains in market share: The Corporate Bank loan book grew by € 8 billion in 2021. Investment Bank revenues rose by 4 % compared to an already strong previous year. The Private Bank recorded € 23 billion in net inflows into investment products and €15 billion in net new client loans, while deposits grew by € 7 billion. Asset Management saw net inflows of € 48 billion and a good performance in assets under management, now at € 928 billion – both record levels.
In all business areas Deutsche Bank saw a strong growth in client demand for products that take Environmental, Social and Governance (ESG) aspects into account. By the end of 2021, sustainable financing and investments product offerings accounted for € 157 billion. Thus the € 200 billion target initially projected for 2025 in this context will probably already be achieved in 2022. Sustainability, as one of the top management priorities since 2019, has increasingly taken center stage in Deutsche Bank’s endeavors.
The individual objectives are bundled in the short-term component (Short-Term Award (STA)) and account for a share of 40 % of the total variable compensation. The Supervisory Board determined an achievement level for these components for the 2021 financial year of between 130 % and 142 %. The performance of the Management Board as a collective body is reflected in the long-term component (Long-Term Award (LTA)), which accounts for a share of 60 % of the total variable compensation. Overall, the achievement level of the collective objectives based solely on the 2021 financial year was 71.21 %. This achievement level accounts for 60 % of the Long-Term Award to be granted for the 2021 financial year. 30% will be for the 2022 financial year and 10 % for the 2023 financial year. As achievement levels for prior years (at 30 % from 2020 and 10 % from 2019) also affected the Long-Term Award for the 2021 financial year, the achievement level of this component for the 2021 financial year was 66.27 % based on the weighted achievement levels of the three financial years. Details on the individual achievement levels are presented as an overview in this report in the chapter "Application of the compensation system in the financial year".
Principles governing the determination of compensation
Structure of the Management Board compensation system 2021
The compensation system consists of non-performance-based (fixed) and performance-based (variable) components. The fixed compensation and variable compensation together form the total compensation for a Management Board member. The Supervisory Board defines target and maximum amounts (caps) for all compensation components.
|
318
|
|
|
Deutsche Bank
|
Additional Notes
|
|
|
Annual Report 2021
|
|
|
|
|
|
Management Board Compensation System 2021
|
Components
|
|
Objective
|
|
Implementation
|
||
|
Non-performance related compensation
|
||||||
|
Base salary
|
|
The base compensation rewards the assumption of the role and responsibility of the respective member of the Management Board. The fixed compensation is intended to ensure a fair and market-oriented income and to ensure that undue risks are avoided. In addition, members of the Management Board are granted recurrent, other benefits and contributions for pension benefits.
|
|
-
|
|
Monthly payment; Amount of basic compensation on an annual basis between € 2.4 million and € 3.6 million.
|
|
Fringe benefits
|
|
|
-
|
|
Company cars and driver services, if applicable moving expenses, rent subsidies, insurance premiums and business representation expenses
|
|
|
Pension
|
|
|
-
|
|
A single and contractually agreed annual contribution or allowance of € 650,000 for adequate pension provision
|
|
|
|
||||||
|
Performance related compensation
|
||||||
|
Short Term Award (STA)
|
|
The STA rewards the individual value contribution of each member of the Management Board to achieving short- and medium-term corporate objectives in accordance with the corporate strategy. It consists of three elements, which are tailored to the role and responsibilities of the respective Management Board member and can be individually influenced by their degree of achievement by the respective Management Board member.
|
|
-
|
|
40 % of the total variable compensation with 3 elements related to individual performance
(1) Individual objectives (20 %);
(2) Individual Balanced Scorecard (10 %);
(3) Annual priorities (10 %)
|
|
|
|
|
-
|
|
Maximum target reached 150 %
|
|
|
|
|
|
-
|
|
Assessment period 1 year
|
|
|
|
|
|
-
|
|
Earliest possible disbursement in 4 tranches in cash (Restricted Incentive Awards) - after 1, 3, 5 and 7 years after grant
|
|
|
|
|
|
-
|
|
Target Contribution at 100 % Achievement: Between € 1.640 million and € 2.160 million
|
|
|
|
||||||
|
Long Term Award (LTA)
|
|
In calculating variable compensation, the focus is on achieving long-term objectives linked to the strategy. To underline this, the Supervisory Board has put a focus on this component with a share of the LTA of 60 % of the total variable target compensation. For the LTA, the Supervisory Board sets common objectives for the members of the Management Board. Since 2021, the ESG factor has been an important part of the LTA. With its implementation and development, Deutsche Bank’s sustainability strategy is systematically linked to the Management Board compensation.
|
|
-
|
|
60 % of total variable compensation with 4 group targets
(1) ESG factor (20 %);
(2) Relative total shareholder return (15 %);
(3) Organic capital growth (15 %);
(4) Group component (10 %): core capital ratio, leverage ratio, adjusted costs, return on tangible equity
|
|
|
|
|
-
|
|
Maximum target reached 150 %
|
|
|
|
|
|
-
|
|
Assessment period 3 years with a weighting of 60 % (FY), 30 % (FY+1), 10 % (FY+2)
|
|
|
|
|
|
-
|
|
Payment in 4 tranches exclusively in shares (Restricted Equity Awards) – earliest possible payment after 2, 3, 4, 5 years plus a respective holding period of 1 year after grant
|
|
|
|
|
|
-
|
|
Target Contribution at 100 % Achievement: Between € 2.460 million and € 3.240 million
|
|
|
|
|
|
|
|
|
|
|
319
|
|
|
Deutsche Bank
|
Additional Notes
|
|
|
Annual Report 2021
|
|
|
|
|
|
Overview
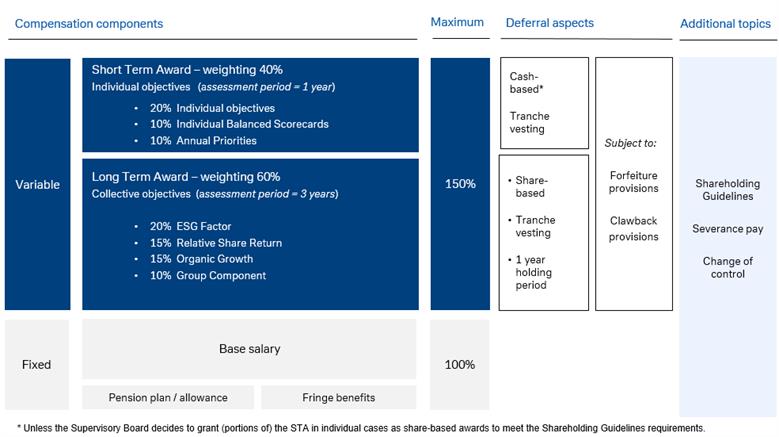
Detailed information on the compensation system for members of the Management Board of Deutsche Bank AG is available on the company’s website: Compensation system for the Management Board Members from January 2021 onward.
Composition of the target total compensation and maximum compensation
The Supervisory Board determines for each Management Board member a target (reference) total compensation on the basis of the compensation system approved by the General Meeting. It also determines, in accordance with the recommendation of the German Corporate Governance Code, what relative proportions the fixed compensation on the one hand and short-term and long-term variable compensation on the other hand have in the target total compensation. In this context, the Supervisory Board ensures in particular that the performance-based compensation linked to achieving long-term objectives exceeds the portion of performance-based compensation linked to short-term objectives.
When setting the target total compensation for each member of the Management Board, the Supervisory Board takes into account the scope and complexity of the respective Management Board member’s functional responsibility as well as the experience and length of service of the member on the Management Board. Furthermore, the compensation amounts are reviewed for their appropriateness on the basis of market data for suitable peer groups. On the basis of these criteria, the Supervisory Board set the relative percentages for the compensation components within the target total compensation as follows:
Relative shares of the total annual target compensation allocated to the different compensation components (%)
|
Compensation components
|
|
Relative share of total compensation in %
|
|
Base Salary
|
|
~ 33-37%
|
|
Regular fringe benefits
|
|
~ 1%
|
|
Pension service costs / pension allowance
|
|
~ 7-9%
|
|
Short-Term Award
|
|
~ 22-23%
|
|
Long-Term Award
|
|
~ 33-34%
|
|
Reference total compensation
|
|
100%
|
|
|
|
|
The compensation of the Management Board members is limited (capped) in several ways (maximum compensation).
Pursuant to § 25a para. 5 of the German Banking Act (Kreditwesengesetz – KWG), the ratio of fixed to variable compensation is generally limited to 1:1 (cap regulation), i.e. the amount of variable compensation must not exceed that of fixed compensation, unless the shareholders of a bank resolve to increase the ratio to up to 1:2. The General Meeting in May 2014 made use of this possibility and increased the ratio to 1:2.
|
320
|
|
|
Deutsche Bank
|
Additional Notes
|
|
|
Annual Report 2021
|
|
|
|
|
|
The Supervisory Board additionally limited the maximum possible achievement levels for the short-term objectives (STA) and long-term objectives (LTA) consistently to 150 % of the target variable compensation. Furthermore, it specified an additional amount limit (cap) for the aggregate amount of base salary, STA and LTA of € 9.85 million. This means that even with target achievement levels that would lead to higher compensation amounts, compensation is capped at a maximum of € 9.85 million. After the target achievement level is assessed, if the calculation should result in variable compensation or total compensation that exceeds one of the specified caps, the variable compensation is to be reduced. This is to take place through a pro rata reduction of the STA and LTA.
Target and maximum amounts of base salary and variable compensation
|
|
|
2021
|
|
2020
|
||||||
|
in €
|
|
Base
salary
|
|
Short-Term
Award
|
|
Long-Term
Award
|
|
Total
compensation
2
|
|
Total
compensation
2
|
|
CEO
|
|
|
|
|
|
|
|
|
|
|
|
Target value
|
|
3,600,000
|
|
2,160,000
|
|
3,240,000
|
|
9,000,000
|
|
8,700,000
|
|
Maximum value
|
|
3,600,000
|
|
3,240,000
|
|
4,860,000
|
|
9,850,000
|
|
9,850,000
|
|
President and ordinary board member responsible for PB/AM
1
|
|
|
|
|
|
|
|
|
|
|
|
Target value
|
|
3,000,000
|
|
1,760,000
|
|
2,640,000
|
|
7,400,000
|
|
7,400,000
|
|
Maximum value
|
|
3,000,000
|
|
2,640,000
|
|
3,960,000
|
|
9,600,000
|
|
9,850,000
|
|
Ordinary Board Members responsible for Finance (CFO) and Risk Management (CRO)
|
|
|
|
|
|
|
|
|
|
|
|
Target value
|
|
2,800,000
|
|
1,680,000
|
|
2,520,000
|
|
7,000,000
|
|
6,700,000
|
|
Maximum value
|
|
2,800,000
|
|
2,520,000
|
|
3,780,000
|
|
9,100,000
|
|
9,400,000
|
|
All other Ordinary Board Members
|
|
|
|
|
|
|
|
|
|
|
|
Target value
|
|
2,400,000
|
|
1,640,000
|
|
2,460,000
|
|
6,500,000
|
|
6,500,000
|
|
Maximum value
|
|
2,400,000
|
|
2,460,000
|
|
3,690,000
|
|
8,550,000
|
|
9,200,000
|
|
|
|
|
|
|
|
|
|
|
|
|
1
PB = Retail Bank / AM = Asset Management.
2.
Limit the maximum total amount of basic salary and variable compensation to the upper limit set by the Supervisory Board.
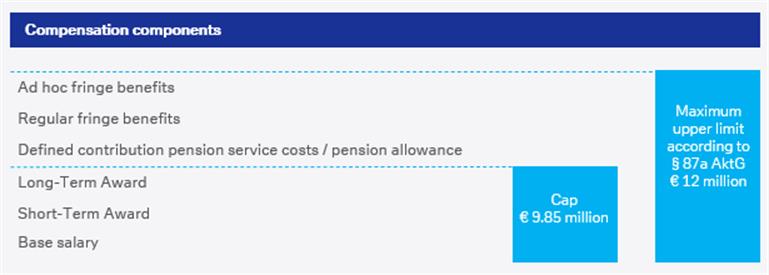
In addition, in accordance with Section 87a (1) sentence 2 No. 1 of the German Stock Corporation Act (AktG), the Supervisory Board also set an upper limit for the maximum total compensation of € 12 million for each Management Board member (Maximum Compensation). The Maximum Compensation is set consistently for all Management Board members. The Maximum Compensation corresponds to the sum of all compensation components for any financial year. This comprises not only the base salary, STA and LTA, but also the fringe benefits and service costs for the
company pension plan or pension allowances.
Application of the compensation system in the financial year
Non-performance-based components (fixed compensation)
The fixed compensation components in the form of base salary, fringe benefits and contributions to the pension plan or pension allowances were granted in the financial year as non-performance-based compensation and in accordance with the individual agreements in the service contracts.
The expenses for fringe benefits and pension service costs vary in their annual amounts. Although the contribution to Deutsche Bank’s pension plan is defined consistently for all Management Board members, the amounts to be contributed by Deutsche Bank during the year in the form of pension service cost accruals vary, however, based on the length of service on the Management Board within the financial year, the age of the Management Board member and actuarial figures (additional information is provided in the section “Benefits upon regular contract termination”).
|
321
|
|
|
Deutsche Bank
|
Additional Notes
|
|
|
Annual Report 2021
|
|
|
|
|
|
Performance-based components (variable compensation)
The Supervisory Board, based on the proposal of the Compensation Control Committee, determined the variable compensation for the Management Board members for the 2021 financial year. Variable compensation comprises two components, a short-term component (Short-Term Award (STA)) with a weighting of 40 % and a long-term component (Long-Term Award (LTA)) with a weighting of 60 % in relation to the target variable compensation.
All objectives, measurements and assessment criteria that were used for the assessment of performance for the 2021 financial year are derived from Deutsche Bank’s strategy and are in line with the compensation system approved by the General Meeting. The objectives were selected to set suitable incentives for the Management Board members, to promote the development of Deutsche Bank’s earnings and the alignment with the interests of shareholders as well as to fulfill Deutsche Bank’s social responsibility through the inclusion of sustainability aspects and climate protection. The challenging objectives reflect the Bank’s ambitions. If the objectives are not achieved, the variable compensation can be zero; in case of over-achievement, the maximum achievement level is limited to 150 % of the target value.
Balance of financial and non-financial objectives
Financial and non-financial objectives are considered in a balanced way when setting the objectives. In relation to the total variable compensation, the financial targets prevailed in the 2021 financial year with a share of around 54 %. Both the financial and non-financial objectives have been chosen in such a way that they are quantitatively or qualitatively measurable at the end of the financial year. Around 73 % of the targets are quantitative measurable and a portion of around 27 % is measured qualitatively.
Short-Term Award (STA)
The amount of the
Short-Term Award
for the 2021 financial year is based on the achievement level of the short and medium-term individual and divisional objectives. It comprises the following three elements with a weighting within the STA as indicated:
- – Individual Objectives (50 %)
- – Individual Balanced Scorecards (25 %)
- – Annual Priorities (25 %)
For each of these elements, the Supervisory Board determines the achievement level based on an assessment at the beginning of the following year of the performance during the previous year. The achievement of the three components determines the achievement level for each Management Board member which determines the amount of the short-term component for the previous fiscal year.
|
322
|
|
|
Deutsche Bank
|
Additional Notes
|
|
|
Annual Report 2021
|
|
|
|
|
|
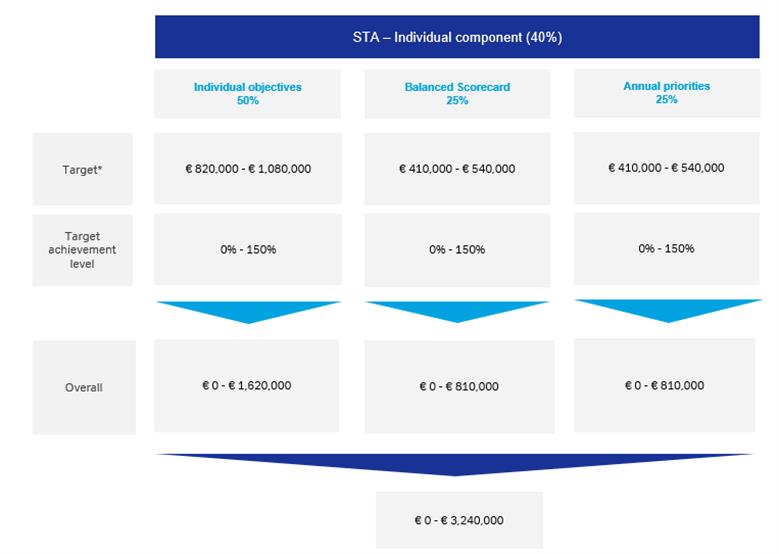
Determination of the cash value of the Short-Term Award
*
On the basis of 100 %. Pro rata temporis upon joining or leaving during the year
All objectives of the STA are assessed over a period of one year. The achievement levels for the STA objectives can be up to a maximum of 150 %. If an objective is not met, the achievement level can be as low as zero. The STA determined for the financial year is generally granted in the form of cash compensation (Restricted Incentive Awards).
The disbursement takes place in 4 tranches of 25 % each, after 1, 3, 5, and 7 years, i.e. over a total vesting period of 7 years after the performance period. All tranches are subject to specific performance and forfeiture conditions during this retention period. The Supervisory Board can resolve to grant the STA in the form of Restricted Equity Awards instead of cash compensation in order to facilitate a faster fulfillment of the shareholding requirement agreed with the Management Board members.
Individual objectives
At the beginning of the year, the Supervisory Board sets individual and divisional objectives for each member of the Management Board, the weightings of these objectives in relation to one another and the relevant quantitatively or qualitatively measurable performance criteria for their assessment. In this context, the objectives are chosen in such a way that they are challenging, ambitious and sufficiently concrete in order to ensure there is an appropriate alignment of performance and compensation and that the “pay-for-performance” principle is taken into account.
The individual and divisional objectives are derived from the corporate strategy and foster its implementation. They are set for each Management Board member in consideration of his or her respective area of responsibility and the contribution of this area of responsibility to advancing Deutsche Bank’s overall strategy. Individual objectives can also be defined as project or regional targets. Besides operational measures, the implementation of strategic projects and initiatives can be agreed as objectives as well, if they are directly instrumental in the implementation of the strategy, by contributing to, for example, the structure, organization and long-term development of Deutsche Bank.
|
323
|
|
|
Deutsche Bank
|
Additional Notes
|
|
|
Annual Report 2021
|
|
|
|
|
|
At the beginning of the 2021 financial year, between 4 and 6 individual objectives were set with different weightings for each Management Board member. In light of the changes on the Management Board effective May 1, 2021, an adjustment was made during the year to the Business Allocation Plan. The objectives were correspondingly adjusted to reflect the new areas of functional responsibility. Accordingly, the Management Board members had up to 8 objectives in total in the financial year, including some that applied only for part of the year. All of the objectives that applied during the year were taken into account in the year-end assessment in accordance with their weightings and pro rata temporis according to the duration of their respective applicability. The following overview shows the objectives resolved by the Supervisory Board for the Management Board members according to their objective category and their weightings pro rata in relation to the full year.
|
324
|
|
|
Deutsche Bank
|
Additional Notes
|
|
|
Annual Report 2021
|
|
|
|
|
|
|
Management Board Member
|
|
Duration
|
|
Weighting %
|
|
Individual objectives
|
|
|
|
|
||||
|
|
|
|
|
|
|
|
|
Christian Sewing
|
|
Jan - Dec
|
|
21.67%
|
|
Continue to develop Deutsche Bank culture vision
|
|
|
|
|
20.00%
|
|
Deliver on Deutsche Bank Group strategy execution and group objectives
|
|
|
|
|
|
15.00%
|
|
Further evolve Deutsche Bank culture, with a focus on integrity and conduct
|
|
|
|
|
|
10.00%
|
|
Implement Bank-wide ESG Sustainable Banking strategy
|
|
|
|
|
|
10.00%
|
|
Strengthen positioning with key political stakeholders
|
|
|
|
|
Jan - Apr
|
|
6.67%
|
|
Deliver on strategy for the divisions Corporate Bank and Investment Bank to achieve sustainable profitability
|
|
|
|
|
3.33%
|
|
Ensure delivery of critical remediation activities within the area of financial crime
|
|
|
|
|
May - Dec
|
|
13.33%
|
|
Provide oversight to transformation for the Human Resources and Real Estate divisions
|
|
|
||||||
|
|
||||||
|
Karl von Rohr
|
|
Jan - Dec
|
|
40.00%
|
|
Deliver on strategy execution for the division Private Bank
|
|
|
|
|
20.00%
|
|
Provide Oversight for Regions Germany EMEA
|
|
|
|
|
|
15.00%
|
|
Support the execution of the DWS strategy as DWS chairman
|
|
|
|
|
|
10.00%
|
|
Ensure delivery on critical remediation activities within the area of financial crime
|
|
|
|
|
|
10.00%
|
|
Further evolve Deutsche Bank culture, with a focus on integrity and conduct
|
|
|
|
|
|
5.00%
|
|
Achieve group-wide financial objectives 2021
|
|
|
|
||||||
|
|
||||||
|
Fabrizio Campelli
|
|
Jan - Apr
|
|
16.67%
|
|
Drive Deutsche Bank`s transformation agenda
|
|
|
|
|
8.33%
|
|
Manage the transformation of the Human Resources division
|
|
|
|
|
|
5.00%
|
|
Drive delivery of Management Board priorities across Deutsche Bank
|
|
|
|
|
Jan - Dec
|
|
10.00%
|
|
Further evolve Deutsche Bank culture, with a focus on integrity and conduct
|
|
|
|
May - Dec
|
|
24.58%
|
|
Deliver on strategy for the divisions Corporate Bank and Investment Bank to achieve sustainable profitability
|
|
|
|
|
16.67%
|
|
Ensure delivery of critical remediation activities within the area of financial crime
|
|
|
|
|
|
14.58%
|
|
Drive stronger front-to-back alignment for the Corporate Bank and Investment Bank divisions
|
|
|
|
|
Aug - Dec
|
|
4.17%
|
|
Provide oversight to Region UK and Ireland
|
|
|
||||||
|
|
||||||
|
Bernd Leukert
|
|
Jan - Dec
|
|
36.67%
|
|
Execute strategy for the division Technology, Data Innovation
|
|
|
|
|
20.00%
|
|
Technology: Continue improvement of IT-structures
|
|
|
|
|
|
16.67%
|
|
Data: Drive quality enhancements
|
|
|
|
|
|
15.00%
|
|
Innovation: Drive client-centric technology approach across the bank
|
|
|
|
|
|
5.00%
|
|
Further evolve Deutsche Bank culture, with a focus on integrity and conduct
|
|
|
|
|
May - Dec
|
|
6.67%
|
|
Integrate certain areas under the former COO responsibility
|
|
|
||||||
|
|
||||||
|
Stuart Lewis
|
|
Jan - Dec
|
|
30.00%
|
|
Foster a strong risk-return culture throughout the bank
|
|
|
|
|
23.75%
|
|
Continue to develop and strengthen the risk organization
|
|
|
|
|
|
22.08%
|
|
Processing of regulatory and internal audit findings
|
|
|
|
|
|
8.33%
|
|
Further evolve Deutsche Bank culture, with a focus on integrity and conduct
|
|
|
|
|
Jan - Apr
|
|
10.00%
|
|
Ensure delivery of critical remediation activities within the area of financial crime
|
|
|
|
Jan - Jul
|
|
5.83%
|
|
Provide oversight to Region UK and Ireland
|
|
|
||||||
|
|
||||||
|
James von Moltke
|
|
Jan - Dec
|
|
40.00%
|
|
Ensure execution of Group financial plan through Group Performance Management
|
|
|
|
|
25.00%
|
|
Strengthen investor and Rating Agencies engagement
|
|
|
|
|
|
15.00%
|
|
Deliver Balance Sheet Liquidity Optimization
|
|
|
|
|
|
15.00%
|
|
Execute Group Finance strategy, including Financial Analytics Enhancement
|
|
|
|
|
|
5.00%
|
|
Further evolve Deutsche Bank culture, with a focus on integrity and conduct
|
|
|
|
||||||
|
|
||||||
|
Alexander von zur Mühlen
|
|
Jan - Dec
|
|
40.00%
|
|
Execute strategy for the region APAC
|
|
|
|
|
30.00%
|
|
Strengthen APAC franchise and client focus
|
|
|
|
|
|
20.00%
|
|
Ensure delivery of critical remediation activities within the area of financial crime
|
|
|
|
|
|
10.00%
|
|
Further evolve Deutsche Bank culture, with a focus on integrity and conduct
|
|
|
|
||||||
|
|
||||||
|
Christiana Riley
|
|
Jan - Dec
|
|
30.00%
|
|
Execute strategy for the regions North and South America
|
|
|
|
|
25.00%
|
|
Strengthen engagement with US regulators
|
|
|
|
|
|
20.00%
|
|
Ensure delivery of critical remediation activities within the area of financial crime
|
|
|
|
|
|
20.00%
|
|
Strengthen client engagement
|
|
|
|
|
|
5.00%
|
|
Further evolve Deutsche Bank culture, with a focus on integrity and conduct
|
|
|
|
||||||
|
|
||||||
|
Rebecca Short
|
|
May - Dec
|
|
30.00%
|
|
Drive Capital Release Unit reductions
|
|
|
|
|
30.00%
|
|
Drive Deutsche Bank`s transformation agenda
|
|
|
|
|
|
30.00%
|
|
Drive direct cost reduction
|
|
|
|
|
|
10.00%
|
|
Further evolve Deutsche Bank culture, with a focus on integrity and conduct
|
|
|
|
||||||
|
|
||||||
|
Prof. Dr. Stefan Simon
|
|
Jan - Dec
|
|
26.67%
|
|
Further drive down bank- wide litigation portfolio
|
|
|
|
|
25.00%
|
|
Improve strategic engagement with regulatory authorities
|
|
|
|
|
|
13.33%
|
|
Drive overhaul of policy including setting and implementation
|
|
|
|
|
|
8.33%
|
|
Further evolve Deutsche Bank culture, with a focus on integrity and conduct
|
|
|
|
|
May - Dec
|
|
26.67%
|
|
Ensure delivery of critical remediation activities within the area of financial crime
|
|
|
|
|
|
|
|
|
|
|
|
|
|
|
|
|
For the qualitative objectives, the Supervisory Board set expectations and financial and/or non-financial performance criteria at the beginning of the year (and at the time of the realignment of the objectives as of May 1, 2021). These enable the Supervisory Board to objectively assess the performance contribution of the respective Management Board member towards the concrete execution of the objectives which are to be assessed for the performance year at the beginning of the following year. The achievement levels thus determined for the individual objectives are combined into an average for each Management Board member according to pre-defined weightings. The achievement level determined in this manner is multiplied by 50 % of the target amount of variable compensation for the STA. This results in the calculated payment amount for the component comprising the individual objectives.
The achievement levels for the individual objectives were between 123 % and 146 % for the 2021 financial year. An overview of the overall achievement levels of the Management Board members’ individual contributions to performance in the financial year is provided at the end of this sub-section Short-Term Award.
Individual Balanced Scorecard
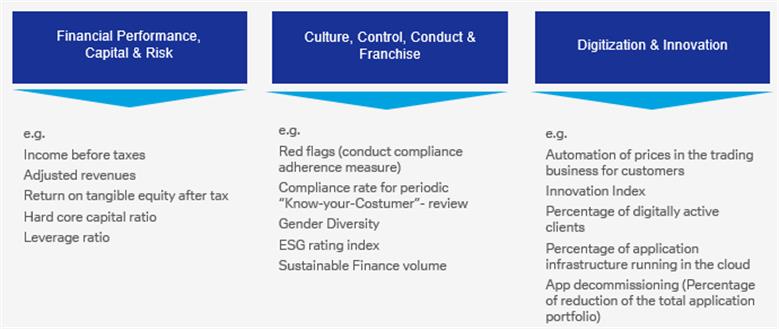
In addition to the individual objectives, the Short-Term Award (STA) is also based on the results of the individual Balanced Scorecards of the Management Board members. Balanced Scorecards make it possible to transform strategic objectives into operating practices through concrete actions. With the Balanced Scorecards, the Bank has an appropriate tool for the steering and control of key performance indicators that can be used to check the achievement level of financial and non-financial objectives against pre-defined measurement parameters at any time and to measure them transparently for the performance year at the beginning of the following year. At the same time, the Balanced Scorecards provide an overview of the priorities of the individual divisions across the entire Group. The respective Management Board members’ functional responsibilities are linked with pre-defined key financial figures and non-financial targets from various categories. A total of 53 Key Performance Indicators (KPIs) are assigned to these categories, of which 10 to 28 are relevant for each Management Board member depending on their areas of functional responsibility and the respective number of scorecards. The following chart shows the categories and some of the KPIs, in particular those with general applicability:
The methodology for the Balanced Scorecards has been continually developed further since their introduction and adjusted to meet changing requirements. In order to link aspects from Environmental, Social and Governance (ESG) areas as well as sustainability more closely to the compensation system, these topics were given an even greater consideration in 2021.
|
325
|
|
|
Deutsche Bank
|
Additional Notes
|
|
|
Annual Report 2021
|
|
|
|
|
|
The objectives within the individual categories are set at the beginning of the year for each Management Board member individually and corresponding Key Performance Indicators or parameters are assigned thereto. In addition, the percentage weighting is set for each category. The weightings that the individual categories have within the overall Balanced Scorecard can be up to 65 % depending on the functional responsibility of the Management Board member. The objectives in the Balanced Scorecard cannot be the same as the objectives of the sub-component “individual objectives” in order to avoid that individual objectives are considered and assessed more than once.

The key performance indicators of the BSC are measured continuously throughout the year and an overall assessment is made at the end of the year. For each individual objective, the Balanced Scorecard shows if it was fulfilled or exceeded based on the defined performance criteria (“green”), or only achieved to less than 100 % (“amber”) or not achieved (“red”). When all objectives of a category are exceeded, the achievement level can be up to 150 %. However, if none of the targets of a category is met, the achievement level is 0 %. From the overall achievement levels of the three categories and their weightings, an overall achievement level for the individual Balanced Scorecard is derived.
1
Resulting bands of KPI categories: Green (100-150 %); Green to amber (75-125 %), Green to red (50-100 %), Amber to red (25 %-75 %), Red (0 %).
The individual Balanced Scorecard achievement levels were between 100 % and 147 % for the 2021 financial year. An overview of the overall achievement levels of the Management Board members’ individual contributions to performance in the financial year 2021 is provided at the end of this sub-section Short-Term Award.
Annual Priorities
With the help of Annual Priorities, the Supervisory Board assesses the profitability and performance-related contributions of each Management Board member towards consistently pre-defined focus topics for the year. These focus topics are derived from, and meant to further support, Deutsche Bank’s strategy. They are different from the individual objectives and Balanced Scorecards in order to avoid that the same objectives are considered or assessed more than once. This provides the possibility to set operational focal points annually depending on the current priorities and the stage of strategy execution. The performance criteria to be used for the assessment can be of both a financial and non-financial nature.
For the 2021 financial year, the Supervisory Board specified focal point topics as Annual Priorities that are related to the following areas:
- – Corporate strategy / transformation
- – Risk management
Within the corporate strategy / transformation area, the Supervisory Board assesses the achievement levels of project-related activities that are related to the corporate and transformation strategy in the “Book of Work” assigned to the individual Management Board members and measured throughout the year. Each activity is in turn linked to measurement criteria that enable a quantitative measurement. Based on this, an individual level of achievement of the performance of each individual Management Board member can be derived at the end of the financial year.
With regard to risk management, the Supervisory Board assesses how each individual member of the Management Board reacted to certain and sometimes unforeseen events and developments that occurred during the financial year, particularly from the risk management perspective. At the end of the year, the achievement level is assessed qualitatively.
The achievement levels with respect to the Annual Priorities were between 125 % and 150 % for the 2021 financial year. An overview of the overall achievement levels of the Management Board members’ individual contributions to performance in the financial year is provided at the end of this sub-section Short-Term Award.
|
326
|
|
|
Deutsche Bank
|
Additional Notes
|
|
|
Annual Report 2021
|
|
|
|
|
|
Overall achievement of the Short-Term Award
For the 2021 financial year, the following overall levels of achievement have been determined for the members of the Management Board on the basis of the level of achievement with respect to the objectives for the three components identified by the Supervisory Board in the Short-Term Award:
Short-Term Award overall achievement
|
|
|
Target
Value
(in €)
|
|
Target
achievement level
(in %)
|
|
Overall
achievement STA
(in €)
|
|
|
|
|
|
|||
|
Christian Sewing
|
|
2,160,000
|
|
142%
|
|
3,065,400
|
|
Karl von Rohr
|
|
1,760,000
|
|
136%
|
|
2,393,600
|
|
Fabrizio Campelli
|
|
1,640,000
|
|
135%
|
|
2,218,783
|
|
Bernd Leukert
|
|
1,640,000
|
|
132%
|
|
2,161,383
|
|
Stuart Lewis
|
|
1,680,000
|
|
134%
|
|
2,258,200
|
|
James von Moltke
|
|
1,680,000
|
|
136%
|
|
2,278,500
|
|
Alexander von zur Mühlen
|
|
1,640,000
|
|
130%
|
|
2,132,000
|
|
Christiana Riley
|
|
1,640,000
|
|
132%
|
|
2,162,750
|
|
Rebecca Short
1
|
|
1,093,333
|
|
132%
|
|
1,440,467
|
|
Prof. Dr. Stefan Simon
|
|
1,640,000
|
|
130%
|
|
2,134,050
|
|
Frank Kuhnke
2
|
|
546,667
|
|
116%
|
|
634,133
|
|
|
|
|
|
|
|
|
1
Member since May 1, 2021.
2
Member until April 30, 2021. The target achievement level was determined in connection with the departure.
Long-Term Award (LTA)
When determining the variable compensation, a major focus is placed on the achievement of long-term objectives linked to Deutsche Bank’s strategy. To emphasize this, the Supervisory Board decided that the LTA accounts for 60 % of the total target variable compensation. At the beginning of each financial year, the Supervisory Board specifies the collective long-term objectives for the Management Board members for the LTA. The objectives and their weighting in the LTA for 2021 are:
- – ESG Factor (33.33 %)
- – Relative Total Shareholder Return of the Deutsche Bank share (25 %)
- – Organic Capital Growth (25 %)
- – Group Component (16.67 %)
The Relative Total Shareholder Return (RTSR) of the Deutsche Bank share and Organic Capital Growth already formed the basis for the assessment of the LTA when the compensation system was approved by the General Annual Meeting in 2017 and have been retained for the measurement of the LTA. For the consistent alignment of Management Board compensation with the Bank’s sustainability strategy, the Client Culture Factor applicable until 2020 was transferred into the ESG Factor, which was newly introduced starting from the 2021 financial year. The importance of the ESG Factor is particularly emphasized through the highest weighting within the LTA at 33.33 %, as well as its weighting of 20 % of total variable compensation. Through the continuation of the objectives underlying the Group Component relating to core capital, leverage ratio, costs and return on equity, the long-term tracking of these metrics for Deutsche Bank’s capital, risk, costs and earnings profile is ensured. By moving the Group Component from the STA to the LTA, there is a bundling of all collective objectives for the Management Board members in the long-term component, and the contribution to sustainability is emphasized as an aspect relevant for the compensation of all Management Board members.
All objectives of the LTA are assessed over a period of three years. At the end of each financial year, the Supervisory Board determines the level of achievement for each of the collective objectives during the preceding year. 60 % of the target amount of each objective of the LTA is multiplied by the achievement level determined in this manner, and this amount feeds into the variable compensation for the preceding financial year. In the following year, 30 % of the target amount is multiplied by the respective achievement level, and in the next following year 10 %. This ensures that weighted outcomes of the achievement levels for three financial years feed into the amount of the LTA to be determined each year.
|
327
|
|
|
Deutsche Bank
|
Additional Notes
|
|
|
Annual Report 2021
|
|
|
|
|
|
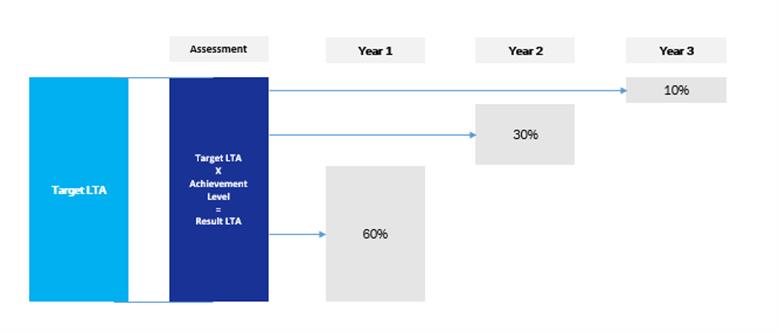
The achievement levels for the LTA objectives can be up to a maximum of 150 %. If the objective is not met, the achievement level can be as low as zero. The LTA determined for a financial year is granted in the form of Restricted Equity Awards, which vest over a deferral period of 5 years, in 4 tranches after 2, 3, 4, and 5 years, and are subject to the share price performance during this period. Each tranche that vests is followed by an additional one-year holding period so that the Management Board members can dispose of the first LTA tranche at the earliest after three years, and of the full amount only after six years. During the deferral and holding periods, the tranches are subject to specific performance and forfeiture conditions.
ESG factor
Deutsche Bank has set for itself the aim of spearheading sustainability initiatives in the financial sector and thus contributing to a more environmentally, socially and financially well-governed economy. To closely and consistently link Management Board compensation to the Bank’s sustainability strategy, the Supervisory Board resolved to combine the Bank’s strategic sustainability targets in an Environmental, Social and Governance Matrix (ESG Matrix) and to implement the results as one of the collective objectives, the ESG Factor, within the LTA.
To this end, the targets and objectives related to corporate governance, the control environment and improvement measures for the prevention of financial crime, which were bundled together in the Client Culture Factor that was applicable until 2020, were expanded to include environmental and social aspects and were combined in the newly implemented ESG Matrix.
The ESG Factor comprises the largest portion of the LTA with a share of 33.33 %. This corresponds to 20 % of the total variable compensation and emphasizes the importance of the ESG agenda for Deutsche Bank. At the beginning of each financial year, the Supervisory Board sets target amounts as well as upper and lower limits for all of the objectives bundled in the ESG Matrix. Based on these fixed threshold values, the assessment of the achievements for the previous year takes place retrospectively. The following chart shows the target amounts, the results as of the end of the year and the resulting achievement level for the 2021 financial year:
|
328
|
|
|
Deutsche Bank
|
Additional Notes
|
|
|
Annual Report 2021
|
|
|
|
|
|
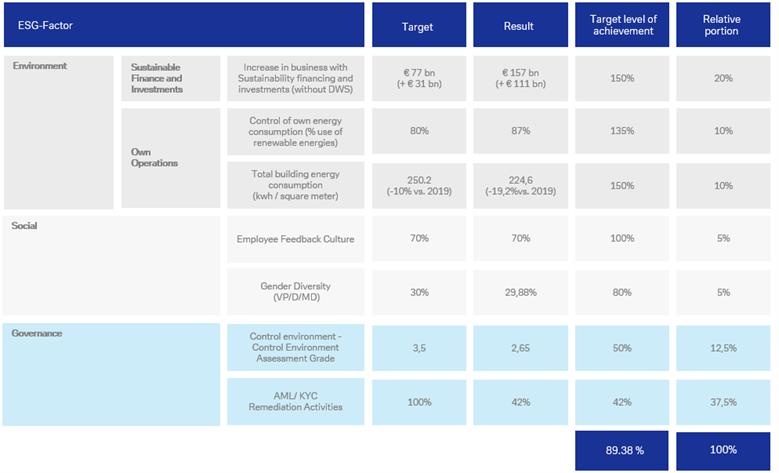
In the 2021 financial year, the performance figures of the ESG Matrix, measured against the pre-defined target amounts and upper and lower limits, developed as follows:
- – Based on a total volume of sustainable financings and investments of 46 billion euros by the end of 2020, the objective set for 2021 for an increase of € 31 billion euros was clearly exceeded with an actual increase of € 111 billion to a total volume of € 157 billion. This means that the objective reached the maximum achievement level of 150 %. The Supervisory Board took this development as a reason to set a more ambitious target for this objective for the 2022 financial year in order to make this objective a stronger incentive for Management Board members (see section “Outlook for the 2022 financial year”).
- – With regard to the second objective under Environment, i.e. own operations, already 87 % of the Bank’s own energy consumption was drawn from renewable energy sources as of the end of the year. Assuming a target of 80 % and a cap of 90 %, the achievement level for this objective was 135 %.
- – The total building-related energy consumption was successfully lowered in 2021 by 19.2 % compared to 2019. The target value of a 15 % reduction was thus exceeded and reached the target achievement level of 150 %.
- – In the Social area, the objective “Employee feedback culture” was measured on the basis of the last employee survey, which is decisive for the full-year figure of 70 %. The achievement level reached in 2021 was thus 100 %.
- – The development with regard to Gender diversity, however, remained below the target figure. Here the achievement level was 80 %,
- – The two performance indicators taken over from the former Culture Client Factor in the Governance area fed into the assessment with achievement levels of 50 % for the so-called Control Environment Assessment Grade and 42 % in terms of measures to combat economic crime and prevent money laundering activities and the fulfillment of regulatory requirements.
From the weighted achievement levels for the individual objectives, an overall achievement level for the ESG Factor for the 2021 financial year has been calculated and set at 89,38 %. A portion of 60 % of the variable target compensation attributable to the ESG factor is multiplied by the overall target achievement level for 2021 and thus determines the largest portion of the variable compensation granted for 2021. A portion of 30 % of the target compensation is based on the achievement level for the Client Culture Factor that was applicable for the 2020 financial year and set at 37,5 %, and a portion of 10 % is determined based on the achievement level for the 2019 financial year at 50 %. This results in a weighted overall achievement level of 69.88 % for the granting of the portion of the LTA that is attributable to the ESG Factor.
Relative Total Shareholder Return (RTSR)
|
329
|
|
|
Deutsche Bank
|
Additional Notes
|
|
|
Annual Report 2021
|
|
|
|
|
|
A key strategic target of the Bank is the performance of the Deutsche Bank share in comparison to the performance of the shares of its competitors (Relative Total Shareholder Return (RTSR)). The target for the RTSR for the Deutsche Bank share in comparison to selected financial institutions is intended to strengthen the sustainable performance of the Deutsche Bank share. The RTSR links the interests of the Management Board with those of shareholders. In addition, the RTSR provides a relative measurement of performance, creating an incentive to outperform the relevant peers.
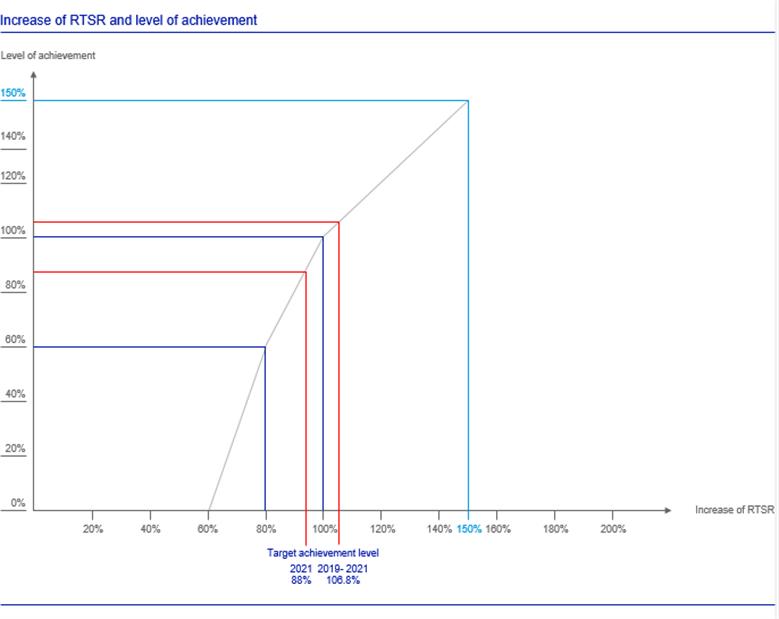
The RTSR is derived from the total shareholder return of the Deutsche Bank share in relation to the average total shareholder returns of a selected peer group. The Total Shareholder Return is defined as the share price performance plus theoretically reinvested gross dividends. The RTSR is calculated as a percentage based on the total shareholder return of the Deutsche Bank share in relation to the average total shareholder returns of the peer group. If the RTSR average is greater than 100 %, then the target achievement level increases proportionally to an upper limit of 150 % of the target figure, i.e., the target achievement level increases by 1 % for each percentage point above 100 %. If the RTSR average is less than 100 %, the target achievement level declines disproportionately. For each percentage point decline of the RTSR in the range of 80 % and less than 100 % the target achievement level declines by two percentage points. In the range between less than 60 % and 80 %, the target achievement level is reduced for each percentage point decline by three percentage points. If the RTSR does not exceed 60 % over the entire assessment period, the target achievement level is zero.
The peer group used as the basis for calculating the RTSR is selected from among the companies with generally comparable business activities as well as a comparable size and international presence. The Supervisory Board reviews the composition of the peer group regularly. The peer group for the RTSR in 2021 is comprised of the following 11 banks: Banco Santander, BNP Paribas, HSBC, UBS, Bank of America, Citigroup, JP Morgan Chase, UniCredit, Barclays, Credit Suisse and Société Générale.
In 2021, Deutsche Bank’s share price increased by 123.1 % and developed better than the shares of 4 out of 11 competitors in the peer group with an average share price plus of 130.6 % but remained below the average share price development of the peer group. The achievement level for the 2021 financial year thus came to 88 %. A portion of 60 % of the target variable compensation attributable to the RTSR is multiplied by the overall achievement level for 2021. A portion of 30 % of the target compensation is based on the achievement level for the 2020 financial year, which was 160 %, and a portion of 10 % is determined based on the achievement level of 60 % for the 2019 financial year. This results in a weighted overall achievement level of 106.8 % for the granting of the portion of the LTA that is attributable to the RTSR.
|
330
|
|
|
Deutsche Bank
|
Additional Notes
|
|
|
Annual Report 2021
|
|
|
|
|
|
Organic Capital Growth
Another key objective of Deutsche Bank is its growth. As an incentive for the Management Board members to promote growth, the Supervisory Board defined organic capital growth on a net basis as a long-term objective for the LTA.
Organic Capital Growth is defined as the balance of the following changes (which are reported in the Consolidated Statement of Changes in Equity) occurring during the financial year, divided by total shareholders’ equity as of December 31 of the preceding financial year:
- – Total comprehensive income, net of tax
- – Coupon on additional equity components, net of tax
- – Remeasurement gains (losses) related to defined benefit pension plans, net of tax
- – Option premiums and other effects from options on Deutsche Bank shares
- – Net gains (losses) on treasury shares sold
Based thereon, “inorganic” changes in equity, in particular the payment of a dividend or a capital increase, are of no relevance to the achievement of the objective.
Starting from an average Organic Capital Growth of 2.5 % (lower limit), the target achievement level increases by 1 % for each 0.05 % of growth up to the 150 % cap, which will be reached upon an Organic Capital Growth of 10 % or more (upper limit cap). If capital growth does not exceed 2.5 % in the assessment period, the target achievement level is zero.
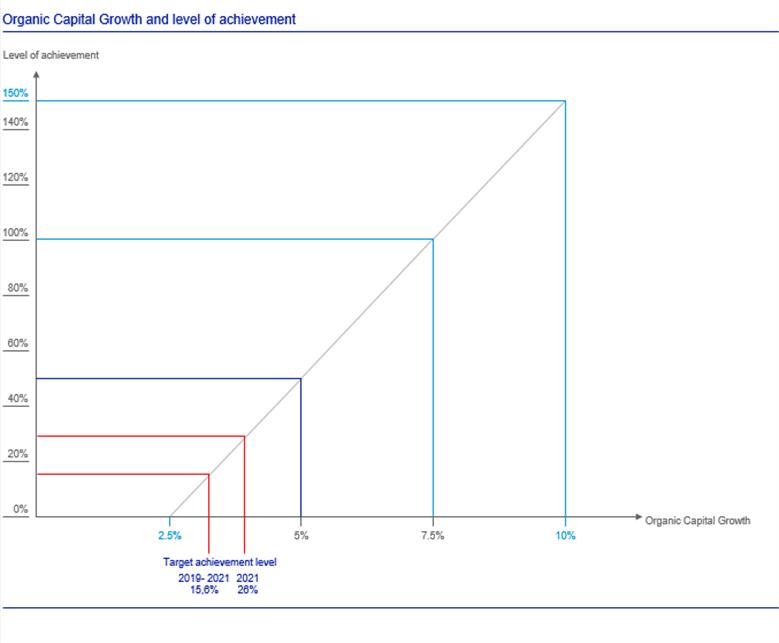
Organic Capital Growth pursuant to the definition specified above developed positively in 2021 at 3.83 % and thus for the first time in the three-year period was above the lower limit of 2.5 %. This results in an achievement level of 26 %. A portion of 60 % of the target variable compensation attributable to Organic Capital Growth is multiplied by the overall achievement level for 2021. A portion of 30 % of the target compensation is based on the achievement level for the 2020 financial year, which was 0 %, and a portion of 10 % is determined based on the achievement level for the 2019 financial year of 0 %. This results in a weighted overall achievement level of 15.6 % for the granting of the portion of the LTA that is attributable to Organic Capital Growth.
|
331
|
|
|
Deutsche Bank
|
Additional Notes
|
|
|
Annual Report 2021
|
|
|
|
|
|
Group Component
Through the Group Component, the Supervisory Board links the key financial figures supporting the corporate strategy with the Management Board’s compensation and thus establishes an incentive to sustainably foster the Bank’s capital, risk, costs and earnings profile. The Group Component also provides a link to the compensation for employees, as this is an employee compensation system component.
The Supervisory Board resolved to take the Group Component out of the STA and integrate it as a fourth objective in the LTA. As a result, all of the objectives to be achieved collectively are bundled in the long-term component. The measurement over a three-year period supports the long-term monitoring of these objectives. The key financial figures of the Group Component have remained unchanged since 2017.
|
LTA group component
|
|
|
|
Core capital ratio
|
|
Common Equity Tier 1 capital ratio of the Bank in relation to its risk-weighted assets
|
|
Leverage ratio
|
|
The Bank’s core capital as a percentage of its total leverage exposure pursuant to
the definitions of the Capital Requirements Regulation / Capital Requirements
Directive 4
|
|
Adjusted costs (excluding transformation charges)
|
|
Total noninterest expenses, excluding transformation costs, restructuring, severance and litigation costs
as well as impairments of goodwill and other intangible assets
|
|
Return on tangible equity
|
|
Net income (or loss) attributable to shareholders as a percentage of average
tangible shareholders’ equity. The latter is determined by deducting goodwill and
other intangible assets from shareholders’ equity
|
|
|
|
|
The four objectives specified above have been assigned an equal weighting. If the performance metric-based objectives are not achieved during the assessment period, the Supervisory Board may determine that a Group Component will not be granted.
In the 2021 financial year, the four performance indicators for the Group Component of the LTA developed as follows: The target achievement levels of the Common Equity Tier 1 (CET1) capital ratio and the leverage ratio (additional information is provided in the “Leverage ratio” section of the Risk Report) were 100 % and the target achievement rate for the adjusted non-interest expenses was 20 %. The target achievement level of the objective for the Group Return on tangible equity reached 90 % in 2021.
The overall achievement level of all four equally weighted objectives of the Group Component was 77.5 %. A portion of 60 % of the target variable compensation attributable to the Group Component is multiplied by the overall achievement level for 2021. A portion of 30 % of the target compensation is based on the achievement level for the 2020 financial year, which was 72.5 %, and a portion of 10 % is determined based on the achievement level for the 2019 financial year at 60 %. This results in a weighted overall achievement level of 74.25 % for the granting of the portion of the LTA that is attributable to the Group Component.
Long-Term Award overall achievement
|
in %
|
|
Objectives
|
|
Relative portion
|
|
Target achievement level
|
|
Overall achievement
LTA
|
|
Long-Term Award
(cumulative over 3 years)
|
|
ESG-Factor
|
|
33.33%
|
|
69.88%
|
|
66.27%
|
|
|
Relative return on shares
|
|
25.00%
|
|
106.80%
|
|
0.00%
|
|
|
|
Organic capital-growth
|
|
25.00%
|
|
15.60%
|
|
0.00%
|
|
|
|
Group component
|
|
16.67%
|
|
74.25%
|
|
0.00%
|
|
|
|
|
|
|
|
|
|
|
|
Appropriateness of Management Board compensation and compliance with the set maximum compensation
The Supervisory Board regularly reviews the appropriateness of the individual compensation components as well as the amount of total compensation. The review of the appropriateness of Management Board compensation concluded that the Management Board compensation resulting from the achievement levels for the 2021 financial year is appropriate.
Horizontal appropriateness
Through the horizontal comparison, the Supervisory Board ensures that the target total compensation is appropriate in relation to the tasks and achievements of the Management Board as well as the company’s situation and is also customary in the market. In this context, the level and structure of compensation, in particular, are examined at comparable companies (peer groups). Suitable companies in consideration of Deutsche Bank’s market position (in particular with regard to business sector, size and country) are used as the basis for this comparison. The assessment of horizontal appropriateness takes place in comparison with the following three peer groups.
|
332
|
|
|
Deutsche Bank
|
Additional Notes
|
|
|
Annual Report 2021
|
|
|
|
|
|
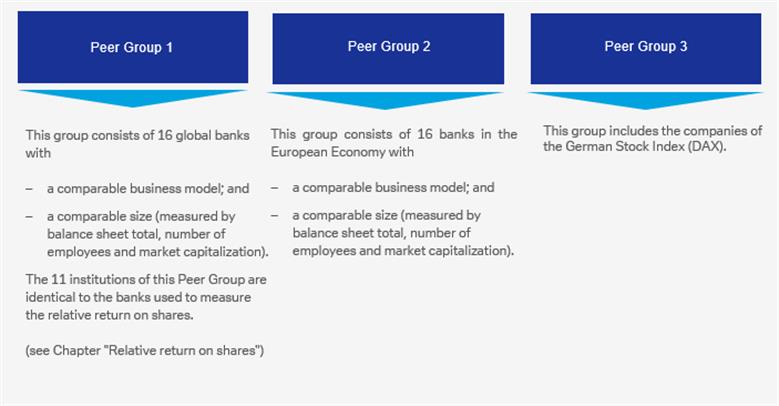
The horizontal appropriateness of the Management Board compensation is reviewed annually by the Supervisory Board. The Supervisory Board regularly engages external compensation advisors for the review of horizontal appropriateness, making sure that these advisors are independent from the Management Board and Deutsche Bank. The Supervisory Board takes the results of the review into consideration when setting the target total compensation for the Management Board members.
Vertical appropriateness
In addition to the horizontal comparison, the Supervisory Board considers a vertical comparison, which compares the compensation of the Management Board and the compensation of the workforce. Within the vertical comparison, the Supervisory Board considers in particular, in accordance with the German Corporate Governance Code, the development of the compensation over time. This involves a comparison of the Management Board compensation and the compensation of two groups of employees. Taken into account are, on the one hand, the compensation of the senior management, which comprises the first management level below the Management Board and members of the top executive committees of the divisions, as well as of management board members of significant institutions within the Deutsche Bank Group and of corresponding management board-1 level positions with management responsibility. The senior management compensation is compared to, on the other hand, the compensation of all other employees of Deutsche Bank Group worldwide (tariff and non-tariff employees).
Compliance with the set maximum compensation (cap)
The maximum compensation limit (cap) is set at € 12 million for each Management Board member. This is based on the actual expense and/or actual disbursement of the compensation awarded for a financial year. The base salaries are fixed amounts. The expenses for fringe benefits vary from Management Board Member to Management Board Member in any given year. The contribution to Deutsche Bank’s pension plan or pension allowance is set at the same amount for all Management Board members. However, the amount to be recognized by the Bank during the year for Deutsche Bank’s pension service costs fluctuates based on actuarial variables. As the expense amount for the multi-year variable compensation components of the STA and LTA are not determined until up to seven years due to the deferral periods, compliance with the maximum compensation set for the 2021 financial year can only be conclusively reported within the framework of the Compensation Reports for the financial years up to 2029. Compliance with the maximum compensation limit as defined under Section 87a of the German Stock Corporation Act (AktG) is, however, already ensured for the 2021 financial year.
Deferrals and holding periods
|
333
|
|
|
Deutsche Bank
|
Additional Notes
|
|
|
Annual Report 2021
|
|
|
|
|
|
The Remuneration Ordinance for Institutions (InstitutsVergV) generally stipulates a three-year assessment period for the determination of the variable compensation for Management Board members. Deutsche Bank complies with this requirement by assessing each of the objectives of the LTA over a three-year period. If the relevant three years cannot be attributed to a member of the Management Board due to that member having joined the Bank only recently, the achievement level for the objectives will be determined for the period that can be attributed to the member. The deferral period for the LTA is in principle five years. If the assessment period is shorter than the prescribed minimum, the deferral period of the variable compensation to be granted is extended by the number of years missing for the minimum assessment period. The STA has an assessment period of one year. The deferral period for the STA is in principle seven years.
The LTA is granted in the form of a share-based instrument (Restricted Equity Awards (REAs)).
The disbursement takes place over a deferral period of 5 years in 4 tranches, beginning with a tranche of 40 % in year 2 after the end of the performance period and 3 tranches of 20 % in years 3, 4, and 5 after the end of the performance period. After the deferral period, the REAs of each tranche are also subject to an additional holding period of one year. Accordingly, the Management Board members cannot dispose of the shares underlying the REAs until after 3 years, at the earliest, and in full until after 6 years. During the deferral and holding periods, the value of the REAs is linked to the performance of the Deutsche Bank share and is therefore tied to the long-term performance of the Bank, and thereby strengthens the alignment of the Management Board members’ incentives with Deutsche Bank’s performance.
The STA is generally granted in the form of deferred cash compensation (restricted incentive awards - RIAs). It is paid out in four tranches of 25 % each over a total period of seven years after 1, 3, 5 and 7 years after the end of the assessment period. However, if the STA accounts for more than 50 % of the total variable compensation, the portion exceeding 50 % is also granted in the form of restricted equity awards. This ensures that at least 50 % of the total variable compensation is always granted in share-based form in accordance with the regulatory requirements. The portion exceeding 50 % is subject to the same deferral rules as the share-based compensation from the LTA.
Instead of receiving Restricted Equity Awards and Restricted Incentive Awards as described above, holders of specific functions at certain Deutsche Bank U.S. entities are required by applicable regulation to be compensated under different plans. Restricted compensation for these persons consist of restricted share awards and restricted cash awards. The recipient will be the beneficial owner of the awards from the Award Date and the awards will be held on the recipient’s behalf. These awards will be restricted for a period of time (subject to the applicable plan rules and award statements, including performance conditions and forfeiture provisions). The restriction period is aligned with retention periods applicable to Deutsche Bank´s usual deferred awards. With regard to the Management Board of Deutsche Bank AG, these rules apply to Christiana Riley due to her role as CEO of Deutsche Bank USA Corp.
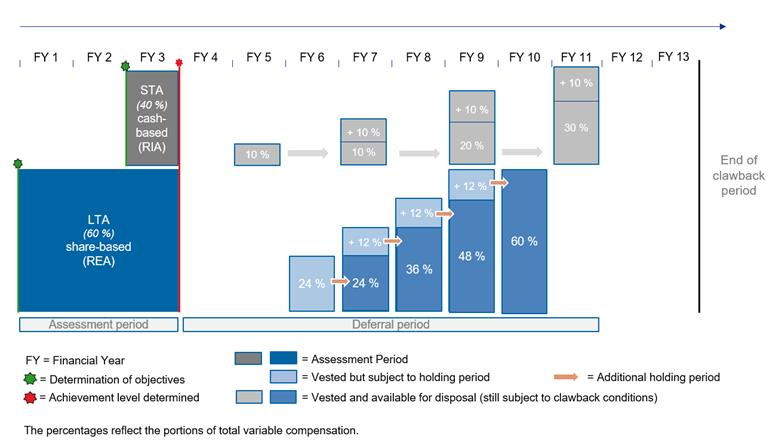
For the RIAs and REAs, specific forfeiture conditions apply during the deferral and holding periods (additional information is provided in the section “Backtesting, malus and clawback").
Backtesting, malus and clawback
By granting compensation components in a deferred form spread out over several years, a long-term incentive is created. In addition, the individual tranches are subject to specific forfeiture conditions until they vest.
|
334
|
|
|
Deutsche Bank
|
Additional Notes
|
|
|
Annual Report 2021
|
|
|
|
|
|
The Supervisory Board regularly reviews the results achieved by Management Board members in the past are sustainable (backtesting). If the outcome is that the achievements rewarded by the granting of the variable compensation were not sustainable, the awards may be partially or fully forfeited.
Also, if the Group’s results are negative, previously granted variable compensation may be declared fully or partially forfeited during the deferral period. In addition, the awards may be fully or partially forfeited if specific solvency or liquidity conditions are not met. Furthermore, awards may be forfeited in whole or in part in the event of individual misconduct (including breaches of regulations), dismissal for cause or negative individual contributions to performance (malus).
In addition, the contracts of the Management Board members also enable the Supervisory Board to reclaim already paid or delivered compensation components due to certain individual negative performance contributions by the Management Board member (clawback) in accordance with the provisions pursuant to Sections 18 (5) and 20 (6) of the Remuneration Ordinance for Institutions (InstitutsVergV). The clawback is possible for the entire variable compensation for a financial year until the end of two years after the end of the deferral period of the last tranche of the compensation elements awarded on a deferred basis for the respective financial year.
The Supervisory Board regularly reviews in due time before the respective due dates the possibility of a full or partial forfeiture (malus) or reclaiming (clawback) of the Management Board members’ variable compensation components. In the 2021 financial year, the Supervisory Board made use of the possibility to partially declare the forfeiture of variable compensation and, at its meeting on February 3, 2021, resolved that a portion of the variable compensation granted to a former member of the Management Board on March 1, 2019, in the form of Restricted Incentive Awards, is to be forfeited.
Information on shares and fulfilling the share ownership obligation (Shareholding Guidelines)
All members of the Management Board are required to acquire a significant amount of Deutsche Bank shares and to hold them on a long-term basis. This requirement is meant to foster the identification of the Management Board members with Deutsche Bank and its shareholders and to ensure a long-term link to the development of the Deutsche Bank’s business.
For the Chief Executive Officer, the number of shares to be held is equal to 200 % of his annual gross base salary, and for the other Management Board members, 100 % of their annual base salary. The requirements of the shareholding obligation must first be fulfilled on the date on which the share-based variable compensation that has been granted to the Management Board member since his or her appointment to the Management Board (waiting period) in total corresponds to 1.33 times the shareholding obligation. Compliance with the requirements is reviewed semi-annually. If the required number of shares is not met, the Management Board members must correct any deficiencies by the next review.
In the context of granting variable compensation, the Supervisory Board can resolve on an individual basis that not only the LTA but also parts of the STA or the STA as a whole may be awarded in shares until the shareholding obligation is fulfilled. This will ensure faster compliance with the shareholding obligation.
Members of the Management Board
The following table shows the number of outstanding share awards of the current Management Board members as of February 19, 2021 and February 11, 2022 as well as the number of share awards newly granted, delivered or forfeited in this period.
|
Members of the Management Board
|
|
Balance as of
Feb 19, 2021
|
|
Granted
|
|
Delivered
|
|
Forfeited
|
|
Balance as of
Feb 11, 2022
|
|
Christian Sewing
|
|
485,115
|
|
208,115
|
|
–
|
|
–
|
|
693,230
|
|
Karl von Rohr
|
|
392,851
|
|
153,343
|
|
26,356
|
|
–
|
|
519,839
|
|
Fabrizio Campelli
|
|
278,603
|
|
145,836
|
|
85,540
|
|
–
|
|
338,899
|
|
Bernd Leukert
|
|
25,309
|
|
136,115
|
|
10,124
|
|
–
|
|
151,300
|
|
Stuart Lewis
|
|
348,142
|
|
134,859
|
|
–
|
|
–
|
|
483,001
|
|
James von Moltke
|
|
430,513
|
|
145,836
|
|
11,884
|
|
–
|
|
564,465
|
|
Alexander von zur Mühlen
|
|
251,256
|
|
103,422
|
|
76,397
|
|
–
|
|
278,282
|
|
Christiana Riley
|
|
215,841
|
|
134,859
1
|
|
102,354
2
|
|
–
|
|
248,345
3
|
|
Rebecca Short
4
|
|
–
|
|
–
|
|
–
|
|
–
|
|
92,754
|
|
Prof. Dr. Stefan Simon
|
|
31,740
|
|
130,329
|
|
12,696
|
|
–
|
|
149,373
|
|
|
|
|
|
|
|
|
|
|
|
|
1
Under the underlying plan, the 134,859 restricted shares originally granted were taxed at the time of grant, with 70,917 shares remaining on an after-tax basis. We refer to the corresponding presentation in the chapter "Deferral and retention periods".
2
Included are 63,942 share awards delivered to cover the amount of tax due under the underlying plan (see footnote 1).
3
Includes a net number of 70,917 share entitlements under the underlying plan (see footnote 1).
4
Member since 1 May 2021.
|
335
|
|
|
Deutsche Bank
|
Additional Notes
|
|
|
Annual Report 2021
|
|
|
|
|
|
The table below shows the total number of Deutsche Bank shares held by the incumbent Management Board members as of the reporting dates February 19, 2021, and February 11, 2022 as well as the number of share-based awards and the fulfillment level for the shareholding obligation.
|
|
|
|
|
as of February 11, 2022
|
||||||||||||
|
Members of the Management Board
|
|
Number of Deutsche Bank shares
(in Units)
as of
Feb 19, 2021
|
|
Number of Deutsche Bank shares
(in Units)
|
|
Restricted Equity Award(s)/ Outstanding Equity Units
(deferred with additional
retention period)
(in Units)
|
|
thereof 75% of Restricted Equity Award(s)/ Outstanding Equity Units chargeable to share obligation
(deferred with additional
retention period)
(in Units)
|
|
Total value of Deutsche Bank shares and Restricted Equity Award(s)/ Outstanding Equity Units chargeable to share obligation
(in Units)
|
|
Share retention obligation must be fulfilled
Yes / No
|
|
Level of required shareholding obligation
(in Units)
1
|
|
Fulfillment ratio
(in %)
|
|
Christian Sewing
|
|
163,665
|
|
192,000
|
|
693,230
|
|
519,923
|
|
711,923
|
|
No
|
|
500,069
|
|
142%
|
|
Karl von Rohr
|
|
17,283
|
|
30,058
|
|
519,839
|
|
389,879
|
|
419,937
|
|
Yes
|
|
208,362
|
|
202%
|
|
Fabrizio Campelli
|
|
86,303
|
|
132,010
|
|
338,899
|
|
254,174
|
|
386,184
|
|
No
|
|
166,690
|
|
232%
|
|
Bernd Leukert
|
|
1,500
|
|
7,882
|
|
151,300
|
|
113,475
|
|
121,357
|
|
No
|
|
166,690
|
|
73%
|
|
Stuart Lewis
|
|
174,434
|
|
174,434
|
|
483,001
|
|
362,251
|
|
536,685
|
|
Yes
|
|
194,471
|
|
276%
|
|
James von Moltke
|
|
68,486
|
|
74,753
|
|
564,465
|
|
423,349
|
|
498,102
|
|
Yes
|
|
194,471
|
|
256%
|
|
Alexander von zur Mühlen
|
|
270,333
|
|
320,829
|
|
278,282
|
|
208,712
|
|
529,541
|
|
No
|
|
166,690
|
|
318%
|
|
Christiana Riley
|
|
55,082
|
|
82,504
|
|
248,345
|
|
186,259
|
|
268,763
|
|
No
|
|
166,690
|
|
161%
|
|
Rebecca Short
2
|
|
0
|
|
36,451
|
|
92,754
|
|
69,566
|
|
106,017
|
|
No
|
|
166,690
|
|
64%
|
|
Prof. Dr. Stefan Simon
|
|
0
|
|
0
|
|
149,373
|
|
112,030
|
|
112,030
|
|
No
|
|
166,690
|
|
67%
|
|
Total
|
|
837,086
|
|
1,050,921
|
|
3,519,488
|
|
2,639,616
|
|
3,690,537
|
|
|
|
|
|
|
|
|
|
|
|
|
|
|
|
|
|
|
|
|
|
|
|
|
1
The calculation of the total value of the Deutsche Bank shares and share awards / outstanding shares eligible for the shareholding requirements is based on the share price
€ 14,3980 (Xetra closing price on February 11, 2022).
2
Member since May 1, 2021.
All Management Board members fulfilled the shareholding obligations in 2021 or are currently in the waiting period.
The Chairman of the Management Board, Mr. Sewing, voluntarily committed to invest 15 % of his monthly net salary in Deutsche Bank shares from September 2019 until the end of December 2022. In each case, purchases take place on the 22nd day of each month or on the following trading day.
Benefits as of the end of the mandate
Benefits upon regular contract termination
The Supervisory Board allocates an entitlement to pension plan benefits to the Management Board members. These entitlements involve a defined contribution pension plan. Under this pension plan, a personal pension account is set up for each participating member of the Management Board with effect from the start of office as a Management Board member.
The members of the Management Board, including the Management Board Chairman, receive a uniform, contractually defined, fixed annual contribution amount of € 650,000. The contribution accrues interest that is credited in advance and determined by means of an age-related factor, up to the age of 60. For entitlements from a first-time or renewed appointment starting from the 2021 financial year, interest accrues at an average rate of 2 % per annum, for legacy entitlements 4 %. From the age of 61 onwards, an additional contribution equal to the amount resulting from applying the above interest rate to the balance of the pension account as of December 31 of the previous year will be credited to the pension account. The annual contributions, taken together, form the pension capital amount available to pay the future pension benefits upon the occurrence of a pension event (retirement age, disability or death). The pension account balance is vested from the start.
If a Management Board member is subject to non-German income tax, the granting of an annual pension allowance of € 650,000 may be selected as an alternative to the defined-contribution pension plan entitlement. This is subject to the precondition that receiving the customary pension plan contributions entails not insignificant tax-related disadvantages for the Management Board member compared to receiving a pension allowance. This option can be exercised once and from then on applies to the entire term of office of the Management Board member.
The following table shows the annual contributions, the interest credits, the account balances and the annual service costs for the years 2021 and 2020 as well as the corresponding defined benefit obligations for each member of the Management Board in office in 2021 as of December 31, 2020 and December 31, 2021. The different balances are attributable to the different lengths of service on the Management Board, the respective age-related factors, and the different contribution rates.
|
336
|
|
|
Deutsche Bank
|
Additional Notes
|
|
|
Annual Report 2021
|
|
|
|
|
|
|
Members of the
Management Board
|
|
Annual contribution,
in the year
|
|
Interest credit,
in the year
|
|
Account balance,
end of year
|
|
Service cost (IFRS),
in the year
|
|
Present value of the
defined benefit
obligation (IFRS),
end of year
|
||||||||||
|
in €
|
|
2021
|
|
2020
|
|
2021
|
|
2020
|
|
2021
|
|
2020
|
|
2021
|
|
2020
|
|
2021
|
|
2020
|
|
Christian Sewing
|
|
773,500
|
|
936,000
|
|
0
|
|
0
|
|
6,516,000
|
|
5,742,500
|
|
701,494
|
|
936,063
|
|
6,263,328
|
|
5,816,960
|
|
Karl von Rohr
|
|
754,000
|
|
786,500
|
|
0
|
|
0
|
|
4,721,001
|
|
3,967,001
|
|
772,131
|
|
831,427
|
|
4,866,754
|
|
4,205,087
|
|
Fabrizio Campelli
|
|
1,007,500
|
|
1,046,500
|
|
0
|
|
0
|
|
2,234,918
|
|
1,227,418
|
|
906,767
|
|
1,008,742
|
|
2,091,609
|
|
1,224,209
|
|
Bernd Leukert
|
|
812,500
|
|
1,135,334
|
|
0
|
|
0
|
|
1,947,834
|
|
1,135,334
|
|
785,526
|
|
851,694
|
|
1,957,432
|
|
1,181,299
|
|
Stuart Lewis
|
|
754,000
|
|
786,500
|
|
0
|
|
0
|
|
6,411,938
|
|
5,657,938
|
|
756,618
|
|
818,838
|
|
6,919,079
|
|
6,358,878
|
|
James von Moltke
|
|
871,000
|
|
903,500
|
|
0
|
|
0
|
|
4,189,250
|
|
3,318,250
|
|
820,820
|
|
895,972
|
|
4,095,605
|
|
3,385,498
|
|
Alexander von zur Mühlen
1
|
|
0
|
|
0
|
|
0
|
|
0
|
|
0
|
|
0
|
|
0
|
|
0
|
|
0
|
|
0
|
|
Christiana Riley
1
|
|
0
|
|
0
|
|
0
|
|
0
|
|
0
|
|
0
|
|
0
|
|
0
|
|
0
|
|
0
|
|
Rebecca Short
2
|
|
554,668
|
|
0
|
|
0
|
|
0
|
|
554,668
|
|
0
|
|
476,303
|
|
0
|
|
496,829
|
|
0
|
|
Prof. Dr. Stefan Simon
|
|
871,000
|
|
1,293,501
|
|
0
|
|
0
|
|
2,164,501
|
|
1,293,501
|
|
824,015
|
|
903,039
|
|
2,128,664
|
|
1,335,674
|
|
Frank Kuhnke
3
|
|
812,500
|
|
845,000
|
|
0
|
|
0
|
|
2,528,500
|
|
1,716,000
|
|
799,956
|
|
867,588
|
|
2,500,385
|
|
1,759,798
|
|
|
|
|
|
|
|
|
|
|
|
|
|
|
|
|
|
|
|
|
|
|
1
The Management Board member receives a pension allowance, which is shown in the chapter "Compensation granted and owed (inflow table)”.
2
Member since May 1, 2021.
3
Member until April 30, 2021.
Benefits upon early termination
The Management Board members are in principle entitled to receive a severance payment upon an early termination of their appointment, provided the Bank is not entitled to revoke the appointment or give notice under the contractual agreement for cause. In accordance with the recommendation of the German Corporate Governance Code, the severance payment amounts to up to two times the annual compensation at the maximum and must not exceed the amount that would be payable as compensation for the remaining term of the service contract. The calculation of the severance payment is based on the annual compensation for the previous financial year and, if applicable, on the expected annual compensation for the current financial year. The severance payment is determined and granted in accordance with the statutory and regulatory requirements, in particular with the provisions of the Remuneration Ordinance for Institutions (InstitutsVergV).
Frank Kuhnke left the Management Board with effect from the end of April 30, 2021. As foreseen in his service contract, severance benefits were agreed with him. The severance agreement provided for compensation for a non-compete clause (“Karenzentschädigung”) in line with his service contract in the amount of € 1,560,000 as well as a severance payment as compensation for the early termination of his service contract in the amount of € 1,902,111.33. The first installment of 20 % amount was disbursed in April 2021 as a cash payment. Another installment equivalent to 20 % was awarded in shares and is due for delivery on June 1, 2022. A further installment of 30 % was awarded as deferred cash compensation with a holding period until June 1, 2026. A final installment of 30 % was awarded as deferred compensation in shares with a holding period until June 1, 2027. The severance payment, is subject to all contractually agreed provisions on variable compensation components, including the possibility of a clawback of variable compensation.
In the event of a change of control, Management Board members have a special right to termination of their service contract. However, in such case, there is no entitlement to a severance payment.
Other service contract provisions
Term of the service contract
The term of the Management Board service contracts is linked to the duration of the appointment and is a maximum of five years in accordance with Section 84 of the German Stock Corporation Act (AktG). The Supervisory Board shall decide at an early stage, no later than six months before the expiry of the appointment period, on a renewed appointment. In the case of the Management Board member’s reappointment, the service contract is extended for the duration of a renewed appointment.
For first-time appointments, a contract term of three years is not to be exceeded. The Management Board service contract ends automatically with the expiry of the appointment period without requiring the express notice of termination.
Reduction of base salary regarding compensation from other mandates
The employment contracts of the Management Board members contain an obligation of the members to ensure that they will not receive any compensation to which they would otherwise be entitled in their capacity as a member of any corporate body, in particular a supervisory board, advisory board or similar body of any group entity of the Bank pursuant to § 18 Stock Corporation Act. Accordingly, Management Board members do not receive any compensation for mandates on boards of Deutsche Bank subsidiaries.
|
337
|
|
|
Deutsche Bank
|
Additional Notes
|
|
|
Annual Report 2021
|
|
|
|
|
|
A Management Board member’s base salary will be reduced in an amount equal to 50 % of the compensation from a mandate – in particular supervisory board or advisory board mandates – at a company that does not belong to Deutsche Bank Group. There is no such deduction of any compensation that does not exceed € 100,000 per mandate and calendar year.
In the 2021 financial year, the base salary of one member of the Management Board was reduced by the amount of the compensation from one mandate at a company that does not belong to Deutsche Bank Group, since the compensation exceeded the threshold amount.
Post-contractual non-compete clause
After their resignation from the Management Board, the members are as a general rule subject to a one-year non-compete clause. During the non-compete period, Deutsche Bank pays the Management Board member compensation (waiting allowance “Karenzentschädigung”) amounting to 65 % of his or her annual base salary. The waiting allowance shall be credited against any claim for severance pay. In addition, the waiting allowance will be reduced by any income that the Management Board member earns during the non-compete period from self-employed, salaried or other paid activities that are not subject to the non-compete clause.
Deutsche Bank may waive a Management Board member’s compliance with the post-contractual non-compete clause. From the date of the waiver. If and when such waiver is granted, Deutsche Bank’s obligation to pay the waiting allowance (“Karenzentschädigung”) ends.
Deviations from the compensation system
There were no deviations from the compensation system in the 2021 financial year.
Management Board compensation 2021
Current Management Board members
Total compensation 2021
The Supervisory Board determined the aforementioned compensation on an individual basis for 2021 and 2020 as follows:
|
|
|
2021
|
|
2020
|
||||||||||
|
in €
|
|
Base
salary
1
|
|
Short Term Award
|
|
Long Term Award
|
|
Total
compensation
|
|
Target Total compensation
|
|
Ratio
to Target
|
|
Total
compensation
2
|
|
Christian Sewing
|
|
3,600,000
|
|
3,065,400
|
|
2,147,048
|
|
8,812,448
|
|
9,000,000
|
|
98%
|
|
7,368,045
|
|
Karl von Rohr
|
|
3,000,000
|
|
2,393,600
|
|
1,749,447
|
|
7,143,047
|
|
7,400,000
|
|
97%
|
|
5,882,495
|
|
Fabrizio Campelli
|
|
2,400,000
|
|
2,218,783
|
|
1,630,166
|
|
6,248,949
|
|
6,500,000
|
|
96%
|
|
5,179,137
|
|
Bernd Leukert
|
|
2,400,000
|
|
2,161,383
|
|
1,630,166
|
|
6,191,549
|
|
6,500,000
|
|
95%
|
|
4,909,270
|
|
Stuart Lewis
|
|
2,800,000
|
|
2,258,200
|
|
1,669,926
|
|
6,728,126
|
|
7,000,000
|
|
96%
|
|
4,979,403
|
|
James von Moltke
|
|
2,800,000
|
|
2,278,500
|
|
1,669,926
|
|
6,748,426
|
|
7,000,000
|
|
96%
|
|
5,262,470
|
|
Alexander von zur Mühlen
|
|
2,400,000
|
|
2,132,000
|
|
1,630,166
|
|
6,162,166
|
|
6,500,000
|
|
95%
|
|
2,094,333
|
|
Christiana Riley
|
|
2,400,000
|
|
2,162,750
|
|
1,630,166
|
|
6,192,916
|
|
6,500,000
|
|
95%
|
|
4,779,103
|
|
Rebecca Short
3
|
|
1,600,000
|
|
1,440,467
|
|
1,086,777
|
|
4,127,244
|
|
4,333,333
|
|
95%
|
|
–
|
|
Prof. Dr. Stefan Simon
|
|
2,400,000
|
|
2,134,050
|
|
1,630,166
|
|
6,164,216
|
|
6,500,000
|
|
95%
|
|
2,124,126
|
|
Frank Kuhnke
4
|
|
800,000
|
|
634,133
|
|
543,389
|
|
1,977,522
|
|
2,166,667
|
|
91%
|
|
4,760,403
|
|
Total
|
|
26,600,000
|
|
22,879,266
|
|
17,017,343
|
|
66,496,609
|
|
69,400,000
|
|
96%
|
|
47,338,785
|
|
|
|
|
|
|
|
|
|
|
|
|
|
|
|
|
1
In the column "Basic salary", the target values set by the Supervisory Board are shown in EUR for reasons of comparability. The actual inflow differs from this target value for Management Board members Alexander von zur Mühlen and Christiana Riley due to currency fluctuations and for Bernd Leukert due to the offsetting of compensation from mandates. The inflow is shown in the chapter " Compensation granted and owed (inflow table).
2
For the Management Board members Alexander von zur Mühlen and Christiana Riley, currency fluctuations were excluded for reasons of comparability.
3
Member since May 1, 2021.
4
Member until April 30, 2021.
The number of share awards granted to the members of the Management Board in the form of Restricted Equity Awards (REA) in 2022 for the 2021 financial year was calculated by dividing the respective amounts in euro by the higher of either the average Xetra closing price of the Deutsche Bank share during the last ten trading days in February 2022 or the Xetra closing price on February 28, 2022 (€ 12.8930).
|
338
|
|
|
Deutsche Bank
|
Additional Notes
|
|
|
Annual Report 2021
|
|
|
|
|
|
|
Members of the Management Board
|
|
Restricted Equity Award(s)
(deferred with additional
retention period)
(in Units)
1
|
|
Christian Sewing
|
|
202,143
|
|
Karl von Rohr
|
|
160,670
|
|
Fabrizio Campelli
|
|
149,265
|
|
Bernd Leukert
|
|
147,039
|
|
Stuart Lewis
|
|
152,336
|
|
James von Moltke
|
|
153,123
|
|
Alexander von zur Mühlen
|
|
145,900
|
|
Christiana Riley
|
|
147,092
|
|
Rebecca Short
2
|
|
98,008
|
|
Prof. Dr. Stefan Simon
|
|
145,979
|
|
Frank Kuhnke
3
|
|
45,665
|
|
Total
|
|
1,547,220
|
|
|
|
|
1
The Restricted Equity Awards are commercially rounded for presentation purposes.
2
Member since May 1, 2021.
3
Member until April 30, 2021.
Granted and owed compensation (inflow table)
The following table shows the compensation paid and owed in the 2021 and 2020 financial years to incumbent members of the Management Board in the 2021 financial year, pursuant to Section 162 (1) sentence 1 of the German Stock Corporation Act (AktG). This involves the compensation components that were either actually paid or delivered to the individual Management Board members within the reporting period (“paid”) or were already legally due during the reporting period but not yet delivered (“owed”).
Besides the compensation amounts, the table additionally shows the relative proportions of fixed and variable compensation of the total compensation pursuant to Section 162 (1) sentence 2 of the German Stock Corporation Act (AktG).
|
|
|
Christian Sewing
|
|
Karl von Rohr
|
||||||||||||
|
|
|
2021
|
|
2020
|
|
2021
|
|
2020
|
||||||||
|
|
|
in € t.
|
|
in %
|
|
in € t.
|
|
in %
|
|
in € t.
|
|
in %
|
|
in € t.
|
|
in %
|
|
Fixed compensation components:
|
|
|
|
|
|
|
|
|
|
|
|
|
|
|
|
|
|
Base salary
|
|
3,600
|
|
93%
|
|
3,117
|
|
93%
|
|
3,000
|
|
93%
|
|
2,750
|
|
94%
|
|
Pension allowance
|
|
0
|
|
0%
|
|
0
|
|
0%
|
|
0
|
|
0%
|
|
0
|
|
0%
|
|
Fringe benefits
|
|
(8)
1
|
|
0%
|
|
4
|
|
0%
|
|
24
|
|
1%
|
|
11
|
|
0%
|
|
Total fixed compensation
|
|
3,592
|
|
93%
|
|
3,120
|
|
93%
|
|
3,024
|
|
93%
|
|
2,761
|
|
94%
|
|
Variable compensation components:
|
|
|
|
|
|
|
|
|
|
|
|
|
|
|
|
|
|
Deferred variable compensation
|
|
|
|
|
|
|
|
|
|
|
|
|
|
|
|
|
|
thereof Restricted Incentive Awards:
|
|
|
|
|
|
|
|
|
|
|
|
|
|
|
|
|
|
2017 Restricted Incentive Award: Buyout
|
|
0
|
|
0%
|
|
0
|
|
0%
|
|
0
|
|
0%
|
|
0
|
|
0%
|
|
2017 Restricted Incentive Award: Sign On
|
|
0
|
|
0%
|
|
0
|
|
0%
|
|
0
|
|
0%
|
|
0
|
|
0%
|
|
2019 Restricted Incentive Award for 2018
|
|
232
|
|
6%
|
|
232
|
|
7%
|
|
169
|
|
5%
|
|
169
|
|
6%
|
|
2020 Restricted Incentive Award for 2019
|
|
43
|
|
1%
|
|
0
|
|
0%
|
|
43
|
|
1%
|
|
0
|
|
0%
|
|
thereof Equity Awards:
|
|
|
|
|
|
|
|
|
|
|
|
|
|
|
|
|
|
2017 Restricted Equity Award: Buyout
|
|
0
|
|
0%
|
|
0
|
|
0%
|
|
0
|
|
0%
|
|
0
|
|
0%
|
|
2015 DB Equity Plan for 2014
|
|
0
|
|
0%
|
|
0
|
|
0%
|
|
0
|
|
0%
|
|
0
|
|
0%
|
|
Fringe benefits
|
|
0
|
|
0%
|
|
0
|
|
0%
|
|
0
|
|
0%
|
|
0
|
|
0%
|
|
Total variable compensation
|
|
275
|
|
7%
|
|
232
|
|
7%
|
|
211
|
|
7%
|
|
169
|
|
6%
|
|
Total compensation
|
|
3,867
|
|
100%
|
|
3,352
|
|
100%
|
|
3,235
|
|
100%
|
|
2,930
|
|
100%
|
|
|
|
|
|
|
|
|
|
|
|
|
|
|
|
|
|
|
1
Due to the economic participation in the costs of a company car provided, which exceeds the amount of the other fringe benefits, a negative balance is to be shown for the financial year 2021.
|
339
|
|
|
Deutsche Bank
|
Additional Notes
|
|
|
Annual Report 2021
|
|
|
|
|
|
|
|
|
Fabrizio Campelli
|
|
Bernd Leukert
|
||||||||||||
|
|
|
2021
|
|
2020
|
|
2021
|
|
2020
|
||||||||
|
|
|
in € t.
|
|
in %
|
|
in € t.
|
|
in %
|
|
in € t.
|
|
in %
|
|
in € t.
|
|
in %
|
|
Fixed compensation components:
|
|
|
|
|
|
|
|
|
|
|
|
|
|
|
|
|
|
Base salary
|
|
2,400
|
|
99%
|
|
2,200
|
|
99%
|
|
2,394
1
|
|
99%
|
|
2,200
|
|
99%
|
|
Pension allowance
|
|
0
|
|
0%
|
|
0
|
|
0%
|
|
0
|
|
0%
|
|
0
|
|
0%
|
|
Fringe benefits
|
|
12
|
|
0%
|
|
22
|
|
1%
|
|
25
|
|
1%
|
|
22
|
|
1%
|
|
Total fixed compensation
|
|
2,412
|
|
100%
|
|
2,222
|
|
100%
|
|
2,419
|
|
100%
|
|
2,222
|
|
100%
|
|
Variable compensation components:
|
|
|
|
|
|
|
|
|
|
|
|
|
|
|
|
|
|
Deferred variable compensation
|
|
|
|
|
|
|
|
|
|
|
|
|
|
|
|
|
|
thereof Restricted Incentive Awards:
|
|
|
|
|
|
|
|
|
|
|
|
|
|
|
|
|
|
2017 Restricted Incentive Award: Buyout
|
|
0
|
|
0%
|
|
0
|
|
0%
|
|
0
|
|
0%
|
|
0
|
|
0%
|
|
2017 Restricted Incentive Award: Sign On
|
|
0
|
|
0%
|
|
0
|
|
0%
|
|
0
|
|
0%
|
|
0
|
|
0%
|
|
2019 Restricted Incentive Award for 2018
|
|
0
|
|
0%
|
|
0
|
|
0%
|
|
0
|
|
0%
|
|
0
|
|
0%
|
|
2020 Restricted Incentive Award for 2019
|
|
7
|
|
0%
|
|
0
|
|
0%
|
|
0
|
|
0%
|
|
0
|
|
0%
|
|
thereof Equity Awards:
|
|
|
|
|
|
|
|
|
|
|
|
|
|
|
|
|
|
2017 Restricted Equity Award: Buyout
|
|
0
|
|
0%
|
|
0
|
|
0%
|
|
0
|
|
0%
|
|
0
|
|
0%
|
|
2015 DB Equity Plan for 2014
|
|
0
|
|
0%
|
|
0
|
|
0%
|
|
0
|
|
0%
|
|
0
|
|
0%
|
|
Fringe benefits
|
|
0
|
|
0%
|
|
0
|
|
0%
|
|
0
|
|
0%
|
|
0
|
|
0%
|
|
Total variable compensation
|
|
7
|
|
0%
|
|
0
|
|
0%
|
|
0
|
|
0%
|
|
0
|
|
0%
|
|
Total compensation
|
|
2,420
|
|
100%
|
|
2,222
|
|
100%
|
|
2,419
|
|
100%
|
|
2,222
|
|
100%
|
|
|
|
|
|
|
|
|
|
|
|
|
|
|
|
|
|
|
1
The fixed compensation shown includes the crediting of compensation from mandates.
|
|
|
Stuart Lewis
|
|
James von Moltke
|
||||||||||||
|
|
|
2021
|
|
2020
|
|
2021
|
|
2020
|
||||||||
|
|
|
in € t.
|
|
in %
|
|
in € t.
|
|
in %
|
|
in € t.
|
|
in %
|
|
in € t.
|
|
in %
|
|
Fixed compensation components:
|
|
|
|
|
|
|
|
|
|
|
|
|
|
|
|
|
|
Base salary
|
|
2,800
|
|
91%
|
|
2,283
|
|
78%
|
|
2,800
|
|
70%
|
|
2,283
|
|
63%
|
|
Pension allowance
|
|
0
|
|
0%
|
|
0
|
|
0%
|
|
0
|
|
0%
|
|
0
|
|
0%
|
|
Fringe benefits
|
|
80
|
|
3%
|
|
29
|
|
1%
|
|
52
|
|
1%
|
|
43
|
|
1%
|
|
Total fixed compensation
|
|
2,880
|
|
94%
|
|
2,312
|
|
79%
|
|
2,852
|
|
71%
|
|
2,326
|
|
64%
|
|
Variable compensation components:
|
|
|
|
|
|
|
|
|
|
|
|
|
|
|
|
|
|
Deferred variable compensation
|
|
|
|
|
|
|
|
|
|
|
|
|
|
|
|
|
|
thereof Restricted Incentive Awards:
|
|
|
|
|
|
|
|
|
|
|
|
|
|
|
|
|
|
2017 Restricted Incentive Award: Buyout
|
|
0
|
|
0%
|
|
0
|
|
0%
|
|
140
|
|
3%
|
|
280
|
|
8%
|
|
2017 Restricted Incentive Award: Sign On
|
|
0
|
|
0%
|
|
0
|
|
0%
|
|
67
|
|
2%
|
|
67
|
|
2%
|
|
2019 Restricted Incentive Award for 2018
|
|
156
|
|
5%
|
|
156
|
|
5%
|
|
169
|
|
4%
|
|
169
|
|
5%
|
|
2020 Restricted Incentive Award for 2019
|
|
43
|
|
1%
|
|
0
|
|
0%
|
|
43
|
|
1%
|
|
0
|
|
0%
|
|
thereof Equity Awards:
|
|
|
|
|
|
|
|
|
|
|
|
|
|
|
|
|
|
2017 Restricted Equity Award: Buyout
|
|
0
|
|
0%
|
|
0
|
|
0%
|
|
124
|
|
3%
|
|
177
|
|
5%
|
|
2015 DB Equity Plan for 2014
|
|
0
|
|
0%
|
|
443
|
|
15%
|
|
0
|
|
0%
|
|
0
|
|
0%
|
|
Fringe benefits
|
|
0
|
|
0%
|
|
0
|
|
0%
|
|
616
|
|
15%
|
|
616
|
|
17%
|
|
Total variable compensation
|
|
199
|
|
6%
|
|
599
|
|
21%
|
|
1,157
|
|
29%
|
|
1,309
|
|
36%
|
|
Total compensation
|
|
3,079
|
|
100%
|
|
2,912
|
|
100%
|
|
4,009
|
|
100%
|
|
3,635
|
|
100%
|
|
|
|
|
|
|
|
|
|
|
|
|
|
|
|
|
|
|
|
|
|
Alexander von zur Mühlen
|
|
Christiana Riley
|
||||||||||||
|
|
|
2021
|
|
2020
|
|
2021
|
|
2020
|
||||||||
|
|
|
in € t.
|
|
in %
|
|
in € t.
|
|
in %
|
|
in € t.
|
|
in %
|
|
in € t.
|
|
in %
|
|
Fixed compensation components:
|
|
|
|
|
|
|
|
|
|
|
|
|
|
|
|
|
|
Base salary
|
|
2,345
1
|
|
74%
|
|
963
1
|
|
75%
|
|
2,328
1
|
|
76%
|
|
2,194
1
|
|
72%
|
|
Pension allowance
|
|
650
|
|
21%
|
|
271
|
|
21%
|
|
650
|
|
21%
|
|
650
|
|
21%
|
|
Fringe benefits
|
|
64
|
|
2%
|
|
15
|
|
1%
|
|
85
|
|
3%
|
|
95
|
|
3%
|
|
Total fixed compensation
|
|
3,059
|
|
97%
|
|
1,249
|
|
97%
|
|
3,063
|
|
99%
|
|
2,938
|
|
97%
|
|
Variable compensation components:
|
|
|
|
|
|
|
|
|
|
|
|
|
|
|
|
|
|
Deferred variable compensation
|
|
|
|
|
|
|
|
|
|
|
|
|
|
|
|
|
|
thereof Restricted Incentive Awards:
|
|
|
|
|
|
|
|
|
|
|
|
|
|
|
|
|
|
2017 Restricted Incentive Award: Buyout
|
|
0
|
|
0%
|
|
0
|
|
0%
|
|
0
|
|
0%
|
|
0
|
|
0%
|
|
2017 Restricted Incentive Award: Sign On
|
|
0
|
|
0%
|
|
0
|
|
0%
|
|
0
|
|
0%
|
|
0
|
|
0%
|
|
2019 Restricted Incentive Award for 2018
|
|
0
|
|
0%
|
|
0
|
|
0%
|
|
0
|
|
0%
|
|
0
|
|
0%
|
|
2020 Restricted Incentive Award for 2019
|
|
0
|
|
0%
|
|
0
|
|
0%
|
|
0
|
|
0%
|
|
0
|
|
0%
|
|
thereof Equity Awards:
|
|
|
|
|
|
|
|
|
|
|
|
|
|
|
|
|
|
2017 Restricted Equity Award: Buyout
|
|
0
|
|
0%
|
|
0
|
|
0%
|
|
0
|
|
0%
|
|
0
|
|
0%
|
|
2015 DB Equity Plan for 2014
|
|
0
|
|
0%
|
|
0
|
|
0%
|
|
0
|
|
0%
|
|
0
|
|
0%
|
|
Fringe benefits
|
|
98
|
|
3%
|
|
33
|
|
3%
|
|
17
|
|
1%
|
|
96
|
|
3%
|
|
Total variable compensation
|
|
98
|
|
3%
|
|
33
|
|
3%
|
|
17
|
|
1%
|
|
96
|
|
3%
|
|
Total compensation
|
|
3,157
|
|
100%
|
|
1,282
|
|
100%
|
|
3,079
|
|
100%
|
|
3,034
|
|
100%
|
|
|
|
0
|
|
0
|
|
0
|
|
0
|
|
0
|
|
0
|
|
0
|
|
0
|
1
As the fixed compensation is granted in local currency, it is subject to FX-rate changes.
|
340
|
|
|
Deutsche Bank
|
Additional Notes
|
|
|
Annual Report 2021
|
|
|
|
|
|
|
|
|
Rebecca Short (Member since May 1, 2021)
|
|
Prof. Dr. Stefan Simon
|
||||||||||||
|
|
|
2021
|
|
2020
|
|
2021
|
|
2020
|
||||||||
|
|
|
in € t.
|
|
in %
|
|
in € t.
|
|
in %
|
|
in € t.
|
|
in %
|
|
in € t.
|
|
in %
|
|
Fixed compensation components:
|
|
|
|
|
|
|
|
|
|
|
|
|
|
|
|
|
|
Base salary
|
|
1,600
|
|
100%
|
|
-
|
|
-
|
|
2,400
|
|
98%
|
|
1,000
|
|
99%
|
|
Pension allowance
|
|
0
|
|
0%
|
|
-
|
|
-
|
|
0
|
|
0%
|
|
0
|
|
0%
|
|
Fringe benefits
|
|
6
|
|
0%
|
|
-
|
|
-
|
|
46
|
|
2%
|
|
7
|
|
1%
|
|
Total fixed compensation
|
|
1,606
|
|
100%
|
|
-
|
|
-
|
|
2,446
|
|
100%
|
|
1,007
|
|
100%
|
|
Variable compensation components:
|
|
|
|
|
|
|
|
|
|
|
|
|
|
|
|
|
|
Deferred variable compensation
|
|
|
|
|
|
|
|
|
|
|
|
|
|
|
|
|
|
thereof Restricted Incentive Awards:
|
|
|
|
|
|
|
|
|
|
|
|
|
|
|
|
|
|
2017 Restricted Incentive Award: Buyout
|
|
0
|
|
0%
|
|
-
|
|
-
|
|
0
|
|
0%
|
|
0
|
|
0%
|
|
2017 Restricted Incentive Award: Sign On
|
|
0
|
|
0%
|
|
-
|
|
-
|
|
0
|
|
0%
|
|
0
|
|
0%
|
|
2019 Restricted Incentive Award for 2018
|
|
0
|
|
0%
|
|
-
|
|
-
|
|
0
|
|
0%
|
|
0
|
|
0%
|
|
2020 Restricted Incentive Award for 2019
|
|
0
|
|
0%
|
|
-
|
|
-
|
|
0
|
|
0%
|
|
0
|
|
0%
|
|
thereof Equity Awards:
|
|
|
|
|
|
|
|
-
|
|
|
|
|
|
|
|
|
|
2017 Restricted Equity Award: Buyout
|
|
0
|
|
0%
|
|
-
|
|
-
|
|
0
|
|
0%
|
|
0
|
|
0%
|
|
2015 DB Equity Plan for 2014
|
|
0
|
|
0%
|
|
-
|
|
-
|
|
0
|
|
0%
|
|
0
|
|
0%
|
|
Fringe benefits
|
|
0
|
|
0%
|
|
-
|
|
-
|
|
0
|
|
0%
|
|
0
|
|
0%
|
|
Total variable compensation
|
|
0
|
|
0%
|
|
-
|
|
-
|
|
0
|
|
0%
|
|
0
|
|
0%
|
|
Total compensation
|
|
1,606
|
|
100%
|
|
-
|
|
-
|
|
2,446
|
|
100%
|
|
1,007
|
|
100%
|
|
|
|
|
|
|
|
|
|
|
|
|
|
|
|
|
|
|
|
|
|
Frank Kuhnke (Member until April 30, 2021)
|
||||||
|
|
|
2021
|
|
2020
|
||||
|
|
|
in € t.
|
|
in %
|
|
in € t.
|
|
in %
|
|
Fixed compensation components:
|
|
|
|
|
|
|
|
|
|
Base salary
|
|
800
|
|
35%
|
|
2,200
|
|
100%
|
|
Severance benefits
1
|
|
1,420
|
|
63%
|
|
0
|
|
-
|
|
Pension allowance
|
|
0
|
|
0%
|
|
0
|
|
0%
|
|
Fringe benefits
|
|
1
|
|
0%
|
|
7
|
|
0%
|
|
Total fixed compensation
|
|
2,221
|
|
98%
|
|
2,207
|
|
100%
|
|
Variable compensation components:
|
|
|
|
|
|
|
|
|
|
Deferred variable compensation
|
|
|
|
|
|
|
|
|
|
thereof Restricted Incentive Awards:
|
|
|
|
|
|
|
|
|
|
2017 Restricted Incentive Award: Buyout
|
|
0
|
|
0%
|
|
0
|
|
0%
|
|
2017 Restricted Incentive Award: Sign On
|
|
0
|
|
0%
|
|
0
|
|
0%
|
|
2019 Restricted Incentive Award for 2018
|
|
0
|
|
0%
|
|
0
|
|
0%
|
|
2020 Restricted Incentive Award for 2019
|
|
43
|
|
2%
|
|
0
|
|
0%
|
|
thereof Equity Awards:
|
|
|
|
|
|
|
|
|
|
2017 Restricted Equity Award: Buyout
|
|
0
|
|
0%
|
|
0
|
|
0%
|
|
2015 DB Equity Plan for 2014
|
|
0
|
|
0%
|
|
0
|
|
0%
|
|
Fringe benefits
|
|
0
|
|
0%
|
|
0
|
|
0%
|
|
Total variable compensation
|
|
43
|
|
2%
|
|
0
|
|
0%
|
|
Total compensation
|
|
2,264
|
|
100%
|
|
2,207
|
|
100%
|
|
|
|
|
|
|
|
|
|
|
1
For details to the severance benefits, please refer to chapter “Benefits upon early termination”.
With respect to the deferred compensation components of previous years approved in the reporting year, the Supervisory Board confirmed that the respective performance conditions were met.
Former members of the Management Board
Granted and owed compensation (inflow table)
The following table shows the compensation paid and owed to the former members of the Management Board in the 2021 financial year pursuant to Section 162 (1) sentence 1 of the German Stock Corporation Act (AktG). This involves the compensation components that were either actually delivered to the former Management Board members within the reporting period (“paid”) or were already legally due during the reporting period but not yet delivered (“owed”). Pursuant to Section 162 (5) of the German Stock Corporation Act (AktG), no personal data is provided on former members of the Management Board who ended their work for the Management Board before December 31, 2011.
|
341
|
|
|
Deutsche Bank
|
Additional Notes
|
|
|
Annual Report 2021
|
|
|
|
|
|
|
|
|
Werner Steinmüller
Member until July 31, 2020
|
|
Sylvie Matherat
Member until July 31, 2019
|
|
Garth Ritchie
Member until July 31, 2019
|
|
Frank Strauß
Member until July 31, 2019
|
|
||||||||
|
|
|
2021
|
|
2021
|
|
2021
|
|
2021
|
|
||||||||
|
|
|
in € t.
|
|
in %
|
|
in € t.
|
|
in %
|
|
in € t.
|
|
in %
|
|
in € t.
|
|
in %
|
|
|
Severance benefits
|
|
130
|
|
4%
|
|
0
|
|
0%
|
|
1,639
|
|
79%
|
|
0
|
|
0%
|
|
|
Deferred variable compensation
|
|
|
|
|
|
|
|
|
|
|
|
|
|
|
|
|
|
|
Restricted Incentive Awards
|
|
191
|
|
6%
|
|
186
|
|
88%
|
|
432
|
|
21%
|
|
326
|
|
100%
|
|
|
Equity Awards
|
|
0
|
|
0%
|
|
0
|
|
0%
|
|
0
|
|
0%
|
|
0
|
|
0%
|
|
|
Fringe benefits
|
|
130
|
|
4%
|
|
26
|
|
12%
|
|
0
|
|
0%
|
|
0
|
|
0%
|
|
|
Pension benefits
|
|
2,666
1
|
|
86%
|
|
0
|
|
0%
|
|
0
|
|
0%
|
|
0
|
|
0%
|
|
|
Total compensation
|
|
3,117
|
|
100%
|
|
211
|
|
100%
|
|
2,071
|
|
100%
|
|
326
|
|
100%
|
|
|
|
|
|
|
|
|
|
|
|
|
|
|
|
|
|
|
|
|
1
The shown value represents capital payments.
|
|
|
Nicolas Moreau
Member until Dec 31, 2018
|
||||||
|
|
|
2021
|
||||||
|
|
|
DB AG
|
|
DWS Management GmbH
|
|
Overall
|
|
|
|
|
|
in € t.
|
|
in € t.
|
|
in € t.
|
|
in %
|
|
Deferred variable compensation
|
|
|
|
|
|
|
|
|
|
Restricted Incentive Awards
|
|
79
|
|
90
|
|
169
|
|
57%
|
|
Equity Awards
1
|
|
0
|
|
130
|
|
130
|
|
43%
|
|
Fringe benefits
|
|
0
|
|
0
|
|
0
|
|
0%
|
|
Pension benefits
|
|
0
|
|
0
|
|
0
|
|
0%
|
|
Total compensation
|
|
79
|
|
220
|
|
299
|
|
100%
|
|
|
|
|
|
|
|
|
|
|
1
The equity awards shown are share-based instruments granted by DWS Management GmbH. Details of these instruments can be found in the DWS Annual Report.
|
|
|
Kimberly Hammonds
Member until May 24, 2018
|
|
Dr. Marcus Schenck
Member until May 24, 2018
|
|
John Cryan
Member until April 8, 2018
|
Hermann-Josef Lamberti
Member until May 31, 2012
|
|
|||||||||
|
|
|
2021
|
|
2021
|
|
2021
|
|
2021
|
|
||||||||
|
|
|
in € t.
|
|
in %
|
|
in € t.
|
|
in %
|
|
in € t.
|
|
in %
|
|
in € t.
|
|
in %
|
|
|
Deferred variable compensation
|
|
|
|
|
|
|
|
|
|
|
|
|
|
|
|
|
|
|
Restricted Incentive Awards
|
|
52
|
|
42%
|
|
65
|
|
100%
|
|
47
|
|
100%
|
|
0
|
|
0%
|
|
|
Equity Awards
|
|
0
|
|
0%
|
|
0
|
|
0%
|
|
0
|
|
0%
|
|
0
|
|
0%
|
|
|
Fringe benefits
|
|
73
|
|
59%
|
|
0
|
|
0%
|
|
0
|
|
0%
|
|
0
|
|
0%
|
|
|
Pension benefits
|
|
0
|
|
0%
|
|
0
|
|
0%
|
|
0
|
|
0%
|
|
1,414
|
|
100%
|
|
|
Total compensation
|
|
124
|
|
100%
|
|
65
|
|
100%
|
|
47
|
|
100%
|
|
1,414
|
|
100%
|
|
|
|
|
|
|
|
|
|
|
|
|
|
|
|
|
|
|
|
|
|
|
|
Josef Ackermann
Member until May 31, 2012
|
|
||
|
|
|
2021
|
|
||
|
|
|
in € t.
|
|
in %
|
|
|
Deferred variable compensation
|
|
|
|
|
|
|
Restricted Incentive Awards
|
|
0
|
|
0%
|
|
|
Equity Awards
|
|
0
|
|
0%
|
|
|
Fringe benefits
|
|
0
|
|
0%
|
|
|
Pension benefits
|
|
924
|
|
100%
|
|
|
Total compensation
|
|
924
|
|
100%
|
|
|
|
|
|
|
|
|
Outlook for the 2022 financial year
Planned changes on the Management Board
Stuart Lewis will resign as member of the Management Board and Chief Risk Officer according to plan with effect from the day of the General Meeting on May 18, 2022. The appointment of his successor, Olivier Vigneron, takes place with effect from May 19, 2022. Olivier Vigneron will initially work for Deutsche Bank as Senior Group Director (Generalbevollmächtigter), starting as of March 1, 2022. As a result, a smooth transition of tasks and responsibilities of the Chief Risk Officer can be secured. The Management Board will thus continue to comprise 10 members.
Total target compensation and maximum compensation
|
342
|
|
|
Deutsche Bank
|
Additional Notes
|
|
|
Annual Report 2021
|
|
|
|
|
|
The Supervisory Board has decided that the total target compensation for 2022 will in principle remain unchanged compared to 2021. The total target compensation for the new board member Olivier Vigneron in his future function as Chief Risk Officer will be € 6,500,000 in line with the compensation of other Management Board members with responsibility for an infrastructure area (except for the CFO and the current CRO). This sum consists of a basic salary of € 2,400,000 gross and a target variable compensation of € 4,100,000 gross. The maximum variable compensation is € 6,150,000 gross.
The limits on compensation for the members of the Management Board remain unchanged versus the 2021 financial year. This means that the maximum possible achievement level for variable compensation amounts to 150%, and there is a cap at € 9.85 million that limits the sum of base salary, STA and LTA. In addition, in accordance with Section 87a (1) sentence 2 No. 1 of the German Stock Corporation Act (AktG), the limit set for total compensation is maintained unchanged at € 12 million uniformly for all members of the Management board as the maximum cap based on the financial year.
Targets and objectives for 2022
The structure of the targets and objectives and the individual components of Management Board compensation applied in 2022 will be in line with the compensation system approved by the General Meeting.
Short-Term Award
Unchanged from 2021, the amount of the Short-Term Award for the 2022 financial year will continue to be based on the achievement level of the short and medium-term individual and divisional objectives. It comprises three elements with different weightings:
- – Individual Objectives (50 %)
- – Individual Balanced Scorecards (25 %)
- – Annual Priorities (25 %)
For each of these elements, an achievement level is determined for the performance year at the beginning of the following year based on an assessment of the measurement and performance criteria set by the Supervisory Board at the beginning of the year under review. The achievement level determines the factor for calculating the amount of the Short-Term Award for the preceding financial year.
Long-Term Award
In 2022, when determining the variable compensation, the focus is, again, placed on the achievement of long-term objectives linked to the strategy. The objectives and their weightings within the LTA for 2022 are unchanged compared to 2021:
- – ESG Factor (33.33 %)
- – Relative Total Shareholder Return (25 %)
- – Organic Capital Growth (25 %)
- – Group Component (16.67 %)
The ESG matrix will be continuously and consistently developed over time in line with sustainability strategy. As announced when the new compensation system was published in 2021, an amendment was made to an important objective in the area of climate risk management. The disclosure of the corporate credit book carbon footprint and the setting of CO2 intensity reduction targets for key industries will be pursued by the end of 2022 in line with the Net Zero Banking Alliance commitment. The high importance of this objective for the bank’s sustainability strategy is reflected in a corresponding weighting within the matrix. In the area of own business, a reduction was made to a target and thus a concentration on the permanent reduction of building energy requirements. The importance of the ambitious roadmap to reach 35% of women in vice president to managing director positions by 2025 is reflected in a higher weighting within the matrix. The two corporate governance objectives remain high in their weighting, at 50% of the ESG factor. This underlines the importance of measures to combat economic crime and prevent money laundering activities, as well as compliance with regulatory requirements.
|
343
|
|
|
Deutsche Bank
|
Additional Notes
|
|
|
Annual Report 2021
|
|
|
|
|
|
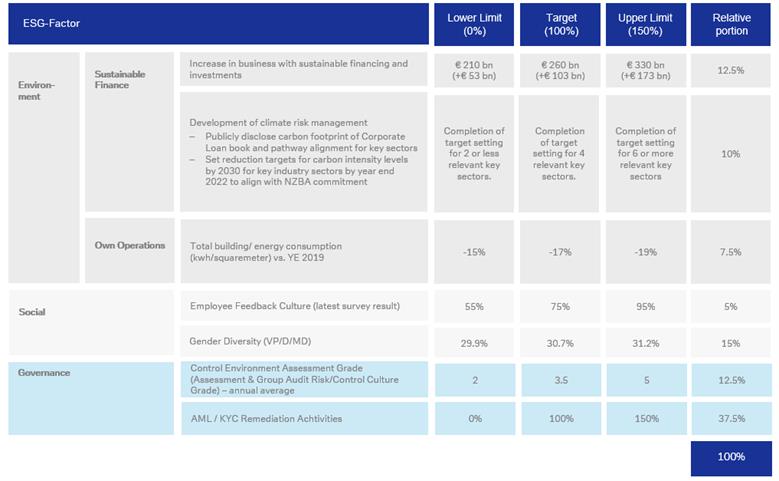
The objectives of the ESG Matrix for the financial year 2022 are therefore the following:
The targets for the Relative Total Shareholder Return in relation to the average share returns of a selected peer group and for the Organic Capital Growth remain unchanged in 2022.
The Group component will continue to consist of 4 sub-objectives in 2022. Two of them, the "Core capital ratio (CET1 ratio)" and "Return on tangible equity (RoTE)" are unchanged compared to 2021 financial year. New objectives are the "cost-income ratio" and a sustainable finance volume metric.
Compensation of members of the Supervisory Board
Supervisory Board compensation is regulated in Section 14 of the Articles of Association, which can be amended by the General Meeting if necessary. The compensation provisions redesigned in 2013 were last amended by resolution of the General Meeting on May 27, 2021, and became effective on July 23, 2021. Accordingly, the following provisions apply:
The members of the Supervisory Board receive fixed annual compensation (“Supervisory Board Compensation”). The annual base compensation amounts to € 100,000 for each Supervisory Board member. The Supervisory Board Chairman receives twice that amount and the Deputy Chairperson one and a half times that amount.
Members and chairs of the committees of the Supervisory Board are paid additional fixed annual compensation as follows:
|
|
|
Dec 31, 2021
|
||
|
Committee
in €
|
|
Chair
|
|
Member
|
|
Audit Committee
|
|
200,000
|
|
100,000
|
|
Risk Committee
|
|
200,000
|
|
100,000
|
|
Nomination Committee
|
|
100,000
|
|
50,000
|
|
Mediation Committee
|
|
0
|
|
0
|
|
Integrity Committee
|
|
200,000
|
|
100,000
|
|
Chairman’s Committee
|
|
100,000
|
|
50,000
|
|
Compensation Control Committee
|
|
100,000
|
|
50,000
|
|
Strategy Committee
|
|
100,000
|
|
50,000
|
|
Technology, Data and Innovation Committee
|
|
200,000
|
|
100,000
|
|
|
|
|
|
|
*Starting from the entry of the amendment to the Articles of Association in the Commercial Register on July 23, 2021. Until this date, the additional fixed annual compensation paid for Technology, Data and Innovation Committee work in the 2021 financial year was as follows: Chair: €100,000, members: €50,000.
|
344
|
|
|
Deutsche Bank
|
Additional Notes
|
|
|
Annual Report 2021
|
|
|
|
|
|
75 % of the compensation determined is disbursed to each Supervisory Board member after submitting invoices within the first three month of the following year. The other 25 % is converted by the company at the same time into company shares based on the average closing price on the Frankfurt Stock Exchange (Xetra or successor system) during the last ten trading days of the preceding January, calculated to three digits after the decimal point. The share value of this number of shares is paid to the respective Supervisory Board member in February of the year following his departure from the Supervisory Board or the expiration of his term of office, based on the average closing price on the Frankfurt Stock Exchange (Xetra or successor system) during the last ten trading days of the preceding January, provided that the member does not leave the Supervisory Board due to important cause which would have justified dismissal (forfeiture regulation).
In case of a change in Supervisory Board membership during the year, compensation for the financial year will be paid on a pro rata basis, rounded up/down to full months. For the year of departure, the entire compensation is paid in cash; a forfeiture regulation applies to 25 % of the compensation for that financial year.
The company reimburses the Supervisory Board members for the cash expenses they incur in the performance of their office, including any value added tax (VAT) on their compensation and reimbursements of expenses. Furthermore, any employer contributions to social security schemes that may be applicable under foreign law to the performance of their Supervisory Board work shall be paid for each Supervisory Board member affected. Finally, the Supervisory Board Chairman will be reimbursed appropriately for travel expenses incurred in performing representative tasks due to his function and reimbursed for costs for the security measures required based on his function.
In the interest of the company, the members of the Supervisory Board will be included in an appropriate amount, with a deductible, in any financial liability insurance policy held by the company. The premiums for this are paid by the company.
Supervisory Board Compensation for the 2021 and 2020 financial years
Individual members of the Supervisory Board received the following compensation for the 2021 and 2020 financial years (excluding value added tax). The following two tables show the compensation paid and owed to the members of the Supervisory Board in the 2021 and 2020 financial years pursuant to Section 162 (1) sentence 1 of the German Stock Corporation Act (AktG).
|
|
|
Compensation for fiscal year 2021
|
||||||||||||
|
Members of the Supervisory Board
|
|
Base salary
|
|
Compensation for Committees
1
|
|
Total Compensation
|
|
Thereof payable in 1st quarter 2022
|
||||||
|
|
|
in €
|
|
in %
|
|
in €
|
|
in %
|
|
in €
|
|
in €
|
|
in %
|
|
Dr. Paul Achleitner
|
|
200,000
|
|
23%
|
|
670,833
|
|
77%
|
|
870,833
|
|
653,125
|
|
75%
|
|
Detlef Polaschek
|
|
150,000
|
|
33%
|
|
300,000
|
|
67%
|
|
450,000
|
|
337,500
|
|
75%
|
|
Ludwig Blomeyer-Bartenstein
|
|
100,000
|
|
33%
|
|
200,000
|
|
67%
|
|
300,000
|
|
225,000
|
|
75%
|
|
Frank Bsirske
2
|
|
83,333
|
|
33%
|
|
166,667
|
|
67%
|
|
250,000
|
|
250,000
|
|
100%
|
|
Mayree Clark
|
|
100,000
|
|
22%
|
|
350,000
|
|
78%
|
|
450,000
|
|
337,500
|
|
75%
|
|
Jan Duscheck
|
|
100,000
|
|
37%
|
|
170,833
|
|
63%
|
|
270,833
|
|
203,125
|
|
75%
|
|
Dr. Gerhard Eschelbeck
|
|
100,000
|
|
46%
|
|
116,667
|
|
54%
|
|
216,667
|
|
162,500
|
|
75%
|
|
Sigmar Gabriel
|
|
100,000
|
|
50%
|
|
100,000
|
|
50%
|
|
200,000
|
|
150,000
|
|
75%
|
|
Timo Heider
|
|
100,000
|
|
34%
|
|
191,667
|
|
66%
|
|
291,667
|
|
218,750
|
|
75%
|
|
Martina Klee
|
|
100,000
|
|
59%
|
|
70,833
|
|
41%
|
|
170,833
|
|
128,125
|
|
75%
|
|
Henriette Mark
|
|
100,000
|
|
40%
|
|
150,000
|
|
60%
|
|
250,000
|
|
187,500
|
|
75%
|
|
Gabriele Platscher
|
|
100,000
|
|
33%
|
|
200,000
|
|
67%
|
|
300,000
|
|
225,000
|
|
75%
|
|
Bernd Rose
|
|
100,000
|
|
31%
|
|
220,833
|
|
69%
|
|
320,833
|
|
240,625
|
|
75%
|
|
Gerd Alexander Schütz
3
|
|
41,667
|
|
83%
|
|
8,333
|
|
17%
|
|
50,000
|
|
50,000
|
|
100%
|
|
John Alexander Thain
|
|
100,000
|
|
50%
|
|
100,000
|
|
50%
|
|
200,000
|
|
150,000
|
|
75%
|
|
Michele Trogni
|
|
100,000
|
|
26%
|
|
291,667
|
|
74%
|
|
391,667
|
|
293,750
|
|
75%
|
|
Dr. Dagmar Valcárcel
|
|
100,000
|
|
22%
|
|
350,000
|
|
78%
|
|
450,000
|
|
337,500
|
|
75%
|
|
Stefan Viertel
|
|
100,000
|
|
41%
|
|
141,667
|
|
59%
|
|
241,667
|
|
181,250
|
|
75%
|
|
Dr. Theodor Weimer
|
|
100,000
|
|
50%
|
|
100,000
|
|
50%
|
|
200,000
|
|
150,000
|
|
75%
|
|
Frank Werneke
4
|
|
8,333
|
|
100%
|
|
0
|
|
0%
|
|
8,333
|
|
6,250
|
|
75%
|
|
Prof. Dr. Norbert Winkeljohann
|
|
100,000
|
|
20%
|
|
395,833
|
|
80%
|
|
495,833
|
|
371,875
|
|
75%
|
|
Frank Witter
5
|
|
58,333
|
|
41%
|
|
83,333
|
|
59%
|
|
141,667
|
|
106,250
|
|
75%
|
|
Total
|
|
2,141,666
|
|
33%
|
|
4,379,166
|
|
67%
|
|
6,520,833
|
|
4,965,625
|
|
76%
|
|
|
|
|
|
|
|
|
|
|
|
|
|
|
|
|
1
The respective memberships of the Supervisory Board committees in the 2021 financial year are presented on page 392.
2
Member of the Supervisory Board until October 27, 2021.
3
Member of the Supervisory Board until May 27, 2021.
4
Member of the Supervisory Board since November 25, 2021.
5
Member of the Supervisory Board since May 27, 2021.
|
345
|
|
|
Deutsche Bank
|
Additional Notes
|
|
|
Annual Report 2021
|
|
|
|
|
|
|
|
|
Compensation for fiscal year 2020
|
||||||||||||
|
Members of the Supervisory Board
|
|
Base salary
|
|
Compensation for Committees
1
|
|
Total Compensation
|
|
Thereof paid in 1st quarter 2021
|
||||||
|
|
|
in €
|
|
in %
|
|
in €
|
|
in %
|
|
in €
|
|
in €
|
|
in %
|
|
Dr. Paul Achleitner
2
|
|
183,333
|
|
23%
|
|
618,750
|
|
77%
|
|
802,083
|
|
601,563
|
|
75%
|
|
Detlef Polaschek
|
|
150,000
|
|
33%
|
|
300,000
|
|
67%
|
|
450,000
|
|
337,500
|
|
75%
|
|
Ludwig Blomeyer-Bartenstein
|
|
100,000
|
|
33%
|
|
200,000
|
|
67%
|
|
300,000
|
|
225,000
|
|
75%
|
|
Frank Bsirske
|
|
100,000
|
|
33%
|
|
200,000
|
|
67%
|
|
300,000
|
|
225,000
|
|
75%
|
|
Mayree Clark
|
|
100,000
|
|
24%
|
|
325,000
|
|
76%
|
|
425,000
|
|
318,750
|
|
75%
|
|
Jan Duscheck
|
|
100,000
|
|
40%
|
|
150,000
|
|
60%
|
|
250,000
|
|
187,500
|
|
75%
|
|
Dr. Gerhard Eschelbeck
|
|
100,000
|
|
67%
|
|
50,000
|
|
33%
|
|
150,000
|
|
112,500
|
|
75%
|
|
Sigmar Gabriel
3
|
|
83,333
|
|
50%
|
|
83,333
|
|
50%
|
|
166,667
|
|
125,000
|
|
75%
|
|
Katherine Garrett-Cox
4
|
|
41,667
|
|
42%
|
|
58,333
|
|
58%
|
|
100,000
|
|
100,000
|
|
100%
|
|
Timo Heider
|
|
100,000
|
|
40%
|
|
150,000
|
|
60%
|
|
250,000
|
|
187,500
|
|
75%
|
|
Martina Klee
|
|
100,000
|
|
67%
|
|
50,000
|
|
33%
|
|
150,000
|
|
112,500
|
|
75%
|
|
Henriette Mark
|
|
100,000
|
|
40%
|
|
150,000
|
|
60%
|
|
250,000
|
|
187,500
|
|
75%
|
|
Gabriele Platscher
|
|
100,000
|
|
33%
|
|
200,000
|
|
67%
|
|
300,000
|
|
225,000
|
|
75%
|
|
Bernd Rose
|
|
100,000
|
|
36%
|
|
175,000
|
|
64%
|
|
275,000
|
|
206,250
|
|
75%
|
|
Gerd Alexander Schütz
|
|
100,000
|
|
57%
|
|
75,000
|
|
43%
|
|
175,000
|
|
131,250
|
|
75%
|
|
Stephan Szukalski
5
|
|
100,000
|
|
50%
|
|
100,000
|
|
50%
|
|
200,000
|
|
200,000
|
|
100%
|
|
John Alexander Thain
|
|
100,000
|
|
50%
|
|
100,000
|
|
50%
|
|
200,000
|
|
150,000
|
|
75%
|
|
Michele Trogni
|
|
100,000
|
|
29%
|
|
250,000
|
|
71%
|
|
350,000
|
|
262,500
|
|
75%
|
|
Dr. Dagmar Valcárcel
|
|
100,000
|
|
24%
|
|
325,000
|
|
76%
|
|
425,000
|
|
318,750
|
|
75%
|
|
Dr. Theodor Weimer
6
|
|
58,333
|
|
54%
|
|
50,000
|
|
46%
|
|
108,333
|
|
81,250
|
|
75%
|
|
Prof. Dr. Norbert Winkeljohann
|
|
100,000
|
|
22%
|
|
350,000
|
|
78%
|
|
450,000
|
|
337,500
|
|
75%
|
|
Total
|
|
2,116,666
|
|
35%
|
|
3,960,416
|
|
65%
|
|
6,077,083
|
|
4,632,813
|
|
76%
|
|
|
|
|
|
|
|
|
|
|
|
|
|
|
|
|
1
The respective memberships of the Supervisory Board committees in the 2020 financial year are presented on page XV of the Annual Report 2020.
2
In the context of the discussion of a voluntary waiver by senior managers of the Bank of portions of their compensation claims, Dr. Achleitner offered to waive a portion of his future compensation claim equivalent to one-twelfth (€72,917) of his compensation for the 2020 financial year pursuant to the Articles of Association. The Management Board accepted this offer.
3
Member of the Supervisory Board since March 11, 2020.
4
Member of the Supervisory Board until May 20, 2020.
5
Member of the Supervisory Board until December 31, 2020.
6
Member of the Supervisory Board since May 20, 2020.
Following the submission of invoices 25 % of the compensation determined for each Supervisory Board member for the 2021 financial year was converted into notional shares of the company on the basis of a share price of € 11.620 (average closing price on the Frankfurt Stock Exchange (Xetra) during the last ten trading days of January 2022). Members who left the Supervisory Board in 2021 were paid the entire amount of compensation in cash.
The following table shows the number of notional shares of the Supervisory Board members, to three digits after the decimal point, that were awarded in the first three months 2022 as part of their 2021 compensation, and the change versus the prior year, the number of notional shares accrued from previous years as part of the compensation, the total number of notional shares accumulated during the respective periods of membership in the Supervisory Board, and the change versus the prior year, as well as the total amounts paid out in February 2022 for members that left the Supervisory Board.
|
346
|
|
|
Deutsche Bank
|
Additional Notes
|
|
|
Annual Report 2021
|
|
|
|
|
|
|
|
|
Number of notional shares
|
|
|
||||||||
|
Members of the Supervisory Board
|
|
Converted in
February 2022
as part of the
compensation
2021
|
|
Change compared to previous year in %
|
|
Total number accrued
during the current
term of office
|
|
Total (cumulative)
|
|
Change compared to previous year in %
|
|
In February 2022
payable
in €¹
|
|
Dr. Paul Achleitner
|
|
18,735.657
|
|
-17%
|
|
85,709.128
|
|
104,444.785
|
|
22%
|
|
0
|
|
Detlef Polaschek
|
|
9,681.583
|
|
-23%
|
|
35,228.225
|
|
44,909.808
|
|
27%
|
|
0
|
|
Ludwig Blomeyer-Bartenstein
|
|
6,454.389
|
|
-23%
|
|
23,485.483
|
|
29,939.872
|
|
27%
|
|
0
|
|
Frank Bsirske
2
|
|
0
|
|
N/A
|
|
23,485.483
|
|
23,485.483
|
|
0%
|
|
272,901
|
|
Mayree Clark
|
|
9,681.583
|
|
-19%
|
|
30,167.795
|
|
39,849.378
|
|
32%
|
|
0
|
|
Jan Duscheck
|
|
5,826.879
|
|
-17%
|
|
19,571.236
|
|
25,398.115
|
|
30%
|
|
0
|
|
Dr. Gerhard Eschelbeck
|
|
4,661.503
|
|
11%
|
|
13,992.360
|
|
18,653.863
|
|
33%
|
|
0
|
|
Sigmar Gabriel
|
|
4,302.926
|
|
-8%
|
|
4,671.099
|
|
8,974.025
|
|
92%
|
|
0
|
|
Timo Heider
|
|
6,275.100
|
|
-10%
|
|
19,571.236
|
|
25,846.336
|
|
32%
|
|
0
|
|
Martina Klee
|
|
3,675.416
|
|
-13%
|
|
11,742.742
|
|
15,418.158
|
|
31%
|
|
0
|
|
Henriette Mark
|
|
5,378.657
|
|
-23%
|
|
19,571.236
|
|
24,949.893
|
|
27%
|
|
0
|
|
Gabriele Platscher
|
|
6,454.389
|
|
-23%
|
|
23,485.483
|
|
29,939.872
|
|
27%
|
|
0
|
|
Bernd Rose
|
|
6,902.610
|
|
-10%
|
|
20,271.901
|
|
27,174.511
|
|
34%
|
|
0
|
|
Gerd Alexander Schütz
3
|
|
0
|
|
N/A
|
|
12,443.407
|
|
12,443.407
|
|
0%
|
|
144,592
|
|
John Alexander Thain
|
|
4,302.926
|
|
-23%
|
|
15,656.989
|
|
19,959.915
|
|
27%
|
|
0
|
|
Michele Trogni
|
|
8,426.583
|
|
-14%
|
|
25,552.883
|
|
33,979.446
|
|
33%
|
|
0
|
|
Dr. Dagmar Valcárcel
|
|
9,681.583
|
|
-19%
|
|
17,239.860
|
|
26,921.443
|
|
56%
|
|
0
|
|
Stefan Viertel
4
|
|
5,199.369
|
|
N/A
|
|
0
|
|
5,199.369
|
|
N/A
|
|
0
|
|
Dr. Theodor Weimer
|
|
4,302.926
|
|
42%
|
|
3,036.214
|
|
7,339.140
|
|
142%
|
|
0
|
|
Frank Werneke
5
|
|
179.289
|
|
N/A
|
|
0
|
|
179.289
|
|
N/A
|
|
0
|
|
Prof. Dr. Norbert Winkeljohann
|
|
10,667.671
|
|
-15%
|
|
27,895.277
|
|
38,562.948
|
|
38%
|
|
0
|
|
Frank Witter
6
|
|
3,047.906
|
|
N/A
|
|
0
|
|
3,047.906
|
|
N/A
|
|
0
|
|
Total
|
|
133,838.925
|
|
-17%
|
|
432,778.037
|
|
566,616.962
|
|
31%
|
|
417,493
|
|
|
|
|
|
|
|
|
|
|
|
|
|
|
1
At a value of €11.620 based on the average closing price on the Frankfurt Stock Exchange (Xetra or successor system) during the last ten trading days of January 2022.
2
Member until October 27, 2021.
3
Member until May 27, 2021.
4
Member since January 1, 2021.
5
Member since November 25, 2021.
6
Member since May 27, 2021.
All employee representatives on the Supervisory Board, with the exception of Frank Bsirske (member until October 27, 2021), Jan Duscheck and Frank Werneke (member since November 25, 2021), are employed by Deutsche Bank Group. In the 2021 financial year, we paid such members a total amount of € 1.29 million in the form of salary, retirement and pension compensation in addition to their Supervisory Board compensation.
We do not provide members of the Supervisory Board with any benefits after they have left the Supervisory Board, though members who are or were employed by us are entitled to the benefits associated with the termination of such employment. During 2021, we set aside € 0.06 million for pension, retirement or similar benefits for the members of the Supervisory Board who are or were employed by us.
With the agreement of the Bank’s Management Board, Dr. Paul Achleitner performs representative functions in various ways on an unpaid basis for the Bank and participates in opportunities for referrals of business for the Bank. These tasks are related to the functional responsibilities of the Chairman of the Supervisory Board of Deutsche Bank AG. In this respect, the reimbursement of costs is provided for in the Articles of Association. On the basis of a separate contractual agreement, the Bank provides Dr. Paul Achleitner with infrastructure and support services free of charge for his services in the interest of the Bank. He is therefore entitled to avail himself of internal resources for preparing and carrying out these activities. The Bank’s security and car services are available for Dr. Paul Achleitner for use free of charge for these tasks. The Bank also reimburses travel expenses and attendance fees and covers the taxes for any non-cash benefits provided. On September 24, 2012, the Chairman’s Committee approved the conclusion of this agreement. The provisions apply for the duration of Dr. Paul Achleitner’s tenure as Chairman of the Supervisory Board and are reviewed on an annual basis for appropriateness. Under this agreement between Deutsche Bank and Dr. Achleitner, support services equivalent to € 95,000 (2020: € 135,000) were provided and reimbursements for expenses amounting to € 209,589 (2020 € 150,290) were paid during the 2021 financial year.
Comparative presentation of compensation and earnings trends
|
347
|
|
|
Deutsche Bank
|
Additional Notes
|
|
|
Annual Report 2021
|
|
|
|
|
|
The following table shows the comparative presentation of the change from year to year in the compensation, in the earnings of the company and the Group as well as the average compensation of employees on a full-time equivalent basis. The information provided pursuant to Section 162 (1) sentence 2 No. 2 of the German Stock Corporation Act (AktG) will be successively expanded with the change from one financial year to the prior year until a reporting period of five years is reached. Starting with the 2025 financial year, the year-to-year changes will be shown for each of the past five years.
The information on the compensation of the current and former members of the Management Board and Supervisory Board reflects the individualized statement in the Compensation Report of the paid or owed compensation pursuant to Section 162 (1) sentence 2 No. 1 of the German Stock Corporation Act (AktG). The presentation of the development of the company’s earnings is to reflect, according to the legal requirements, those of the stand-alone listed company, i.e. Deutsche Bank AG. Accordingly, the net income (net loss) of Deutsche Bank AG is used to present earnings within the meaning of Section 162 (1) sentence 2 No. 2 of the German Stock Corporation Act (AktG). As the Management Board compensation is measured on the basis of Group figures, the earnings figures for the Group are additionally shown for the comparative presentation. These Group earnings figures are net income (net loss), cost-income ratio and Return on Tangible Equity (RoTE). For the group of employees for the comparison, the data relevant for Deutsche Bank Group were used in light of Deutsche Bank’s global workforce. The group of employees for the comparison comprises all of the employees worldwide of Deutsche Bank Group.
|
348
|
|
|
Deutsche Bank
|
Additional Notes
|
|
|
Annual Report 2021
|
|
|
|
|
|
|
|
|
2021
|
|
2020
|
|
Annual change from 2020
in %
|
|
1. Company profit development
|
|
|
|
|
|
|
|
Net income (net loss) of Deutsche Bank AG (in € bn)
|
|
1,961
|
|
(1,769)
|
|
N/M
|
|
Net income (net loss) of Deutsche Bank Group (in € bn)
|
|
2,365
|
|
495
|
|
N/M
|
|
Cost-income ratio of Deutsche Bank Group (in %)
|
|
84.6%
|
|
88.3%
|
|
(4)
|
|
Return on Tangible Equity (RoTE) of Deutsche Bank Group (in %)
|
|
3.8%
|
|
0.2%
|
|
N/M
|
|
2. Average compensation employees
|
|
|
|
|
|
|
|
World-wide on a full-time equivalent basis
1
|
|
118,477
|
|
118,765
|
|
(0)
|
|
3. Management Board compensation (in € tsd.)
|
|
|
|
|
|
|
|
Current Management Board members
|
|
|
|
|
|
|
|
Christian Sewing
|
|
3,867
|
|
3,352
|
|
15
|
|
Karl von Rohr
|
|
3,235
|
|
2,930
|
|
10
|
|
Fabrizio Campelli
|
|
2,420
|
|
2,222
|
|
9
|
|
Bernd Leukert
|
|
2,419
|
|
2,222
|
|
9
|
|
Stuart Lewis
|
|
3,079
|
|
2,912
|
|
6
|
|
James von Moltke
|
|
4,009
|
|
3,635
|
|
10
|
|
Alexander von zur Mühlen (Member since August 1, 2020)
|
|
3,157
|
|
1,282
|
|
146
|
|
Christiana Riley
|
|
3,079
|
|
3,034
|
|
1
|
|
Rebecca Short (Member since May 1, 2021)
|
|
1,606
|
|
-
|
|
N/M
|
|
Stefan Simon (Member since August 1, 2020)
|
|
2,446
|
|
1,007
|
|
143
|
|
Members who left the Management Board during the financial year
|
|
|
|
|
|
|
|
Frank Kuhnke (Member until 30 April 2021)
|
|
2,264
|
|
2,207
|
|
3
|
|
Members who left the Management Board before the financial year
|
|
|
|
|
|
|
|
Werner Steinmüller (Member until July 31, 2020)
|
|
3,117
|
|
2,436
|
|
28
|
|
Sylvie Matherat (Member until July 31, 2019)
|
|
211
|
|
910
|
|
(77)
|
|
Garth Ritchie (Member until July 31, 2019)
|
|
2,071
|
|
2,809
|
|
(26)
|
|
Frank Strauß (Member until July 31, 2019)
|
|
326
|
|
2,168
|
|
(85)
|
|
Nicolas Moreau (Member until Dec 31, 2018)
|
|
299
|
|
1,826
|
|
(84)
|
|
Kimberly Hammonds (Member until May 24, 2018)
|
|
124
|
|
52
|
|
138
|
|
Dr. Marcus Schenck (Member until May 24, 2018)
|
|
65
|
|
65
|
|
−
|
|
John Cryan (Member until April 8, 2018)
|
|
47
|
|
47
|
|
−
|
|
Hermann-Josef Lamberti (Member until May 31, 2012)
|
|
1,414
|
|
1,450
|
|
(2)
|
|
Josef Ackermann (Member until May 31, 2012)
|
|
924
|
|
911
|
|
1
|
|
4. Supervisory Board compensation (in € tsd.)
|
|
|
|
|
|
|
|
Current Supervisory Board members
|
|
|
|
|
|
|
|
Dr. Paul Achleitner
|
|
871
|
|
802
|
|
9
|
|
Detlef Polaschek
|
|
450
|
|
450
|
|
−
|
|
Ludwig Blomeyer-Bartenstein
|
|
300
|
|
300
|
|
−
|
|
Mayree Clark
|
|
450
|
|
425
|
|
6
|
|
Jan Duscheck
|
|
271
|
|
250
|
|
8
|
|
Dr. Gerhard Eschelbeck
|
|
217
|
|
150
|
|
44
|
|
Sigmar Gabriel (Member since March 11, 2020)
|
|
200
|
|
167
|
|
20
|
|
Timo Heider
|
|
292
|
|
250
|
|
17
|
|
Martina Klee
|
|
171
|
|
150
|
|
14
|
|
Henriette Mark
|
|
250
|
|
250
|
|
−
|
|
Gabriele Platscher
|
|
300
|
|
300
|
|
−
|
|
Bernd Rose
|
|
321
|
|
275
|
|
17
|
|
John Alexander Thain
|
|
200
|
|
200
|
|
−
|
|
Michele Trogni
|
|
392
|
|
350
|
|
12
|
|
Dr. Dagmar Valcárcel
|
|
450
|
|
425
|
|
6
|
|
Stefan Viertel (Member since January 1, 2021)
|
|
242
|
|
-
|
|
N/M
|
|
Dr. Theodor Weimer (Member since May 20, 2020)
|
|
200
|
|
108
|
|
85
|
|
Frank Werneke (Member since November 25, 2021)
|
|
8
|
|
-
|
|
N/M
|
|
Prof. Dr. Norbert Winkeljohann
|
|
496
|
|
450
|
|
10
|
|
Frank Witter (Member since May 27, 2021)
|
|
142
|
|
-
|
|
N/M
|
|
Former Members of the Supervisory Board
|
|
|
|
|
|
|
|
Frank Bsirske (Member until October 27, 2021)
|
|
250
|
|
300
|
|
(17)
|
|
Gerd Alexander Schütz (Member until May 27, 2021)
|
|
50
|
|
175
|
|
(71)
|
|
Stephan Szukalski (Member until December 31, 2020)
|
|
-
|
|
200
|
|
N/M
|
|
Katherine Garrett-Cox (Member until May 20, 2020)
|
|
-
|
|
100
|
|
N/M
|
|
|
|
|
|
|
|
|
1
The average compensation of employees is determined by the total compensation of the year divided by the number of employees (full-time equivalent).
|
349
|
|
|
Deutsche Bank
|
Additional Notes
|
|
|
Annual Report 2021
|
|
|
|
|
|
Compensation of the employees (unaudited)
The content of the 2021 Employee Compensation Report is based on the qualitative and quantitative remuneration disclosure requirements outlined in Article 450 No. 1 (a) to (j) Capital Requirements Regulation (CRR) in conjunction with Section 16 of the Remuneration Ordinance for Institutions (
Institutsvergütungsverordnung
– InstVV).
This Compensation Report takes a group-wide view and covers all consolidated entities of the Deutsche Bank Group. In accordance with regulatory requirements, equivalent reports for 2021 are prepared for the following Significant Institutions within Deutsche Bank Group: BHW Bausparkasse AG, Germany; Deutsche Bank Luxembourg S.A., Luxembourg; Deutsche Bank S.p.A., Italy; Deutsche Bank Mutui S.p.A., Italy; Deutsche Bank S.A.E., Spain.
Regulatory Environment
Ensuring compliance with regulatory requirements is an overarching consideration in our Group Compensation Strategy. We strive to be at the forefront of implementing regulatory requirements with respect to compensation and will continue to work closely with our prudential supervisor, the European Central Bank (ECB), to be in compliance with all existing and new requirements.
As an EU-headquartered institution, Deutsche Bank is subject to the Capital Requirements Regulation / Directive (CRR / CRD) globally, as transposed into German national law in the German Banking Act and InstVV. We have already comprehensively adopted the rules in its current version, InstVV 4.0 effective September 25, 2021, for all of Deutsche Bank subsidiaries and branches world-wide to the extent required in accordance with Section 27 InstVV. As a Significant Institution within the meaning of InstVV, Deutsche Bank identifies all employees whose work is deemed to have a material impact on the overall risk profile (Material Risk Takers or MRTs) in accordance with the updated criteria stipulated in the German Baking Act and in the Commission Delegated Regulation 2021/923. MRTs are, as in the past years, identified at a Group level and at the level of Significant Institutions. Moreover, as per the requirements which came into force in 2021 and in accordance with the German Banking Act, Deutsche Bank also identifies MRTs for all CRR institutions at a solo level.
Taking into account more specific sectorial legislation and in accordance with InstVV, some of Deutsche Bank’s subsidiaries (in particular within the DWS Group) fall under the local transpositions of the Alternative Investments Fund Managers Directive (AIFMD) or the Undertakings for Collective Investments in Transferable Securities Directive (UCITS). We also identify MRTs in these subsidiaries. Identified employees are subject to the remuneration provisions outlined in the Guidelines on sound remuneration policies under AIFMD/UCITS published by the European Securities and Markets Authority (ESMA).
Deutsche Bank takes into account the regulations targeted at employees who engage directly or indirectly with the bank’s clients, for instance as per the local transpositions of the Markets in Financial Instruments Directive II – MiFID II. Accordingly, we have implemented specific provisions for employees deemed to be Relevant Persons to ensure that they act in the best interest of our clients.
Where applicable, Deutsche Bank is also subject to specific rules and regulations implemented by local regulators. Many of these requirements are aligned with the InstVV. However, where variations are apparent, proactive and open discussions with regulators have enabled us to follow the local regulations whilst ensuring that any impacted employees or locations remain within the bank’s overall Group Compensation Framework. This includes, for example, the compensation structures applied to Covered Employees in the United States under the requirements of the Federal Reserve Board. In any case, we apply the InstVV requirements as minimum standards globally.
Compensation Governance
Deutsche Bank has a robust governance structure enabling it to operate within the clear parameters of its Compensation Strategy and Policy.
In accordance with the German two-tier board structure, the Supervisory Board governs the compensation of the Management Board members while the Management Board oversees compensation matters for all other employees in the Group. Both the Supervisory Board and the Management Board are supported by specific committees and functions, in particular the Compensation Control Committee (CCC), the Compensation Officer, and the Senior Executive Compensation Committee (SECC).
|
350
|
|
|
Deutsche Bank
|
Additional Notes
|
|
|
Annual Report 2021
|
|
|
|
|
|
In line with their responsibilities, the bank’s control functions are involved in the design and application of the bank’s remuneration systems, in the identification of MRTs and in determining the total amount of VC. This includes assessing the impact of employees’ behavior and the business-related risks, performance criteria, granting of remuneration and severances as well as ex-post risk adjustments.
Reward Governance structure
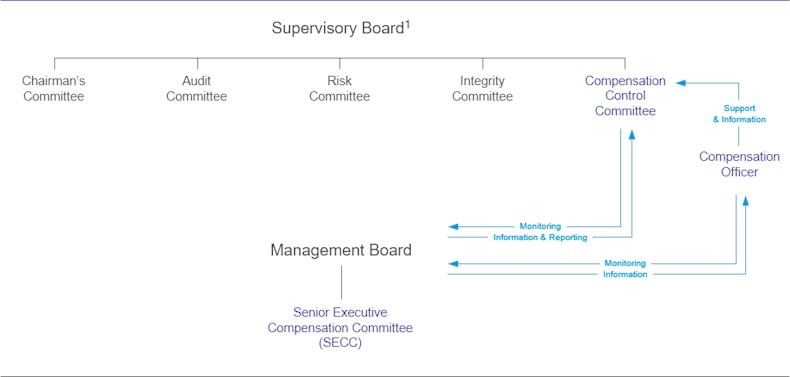
|
1
Does not comprise a complete list of Supervisory Board Committees.
Compensation Control Committee (CCC)
The Supervisory Board has set up the CCC to support in establishing and monitoring the structure of the compensation system for the Management Board Members of Deutsche Bank AG. Furthermore, the CCC monitors the appropriateness of the compensation systems for the employees of Deutsche Bank Group, as established by the Management Board and the SECC. The CCC reviews whether the total amount of variable compensation is affordable and set in accordance with the risk, capital and liquidity situation as well as in alignment with the business and risk strategies. Furthermore, the CCC supports the Supervisory Board in monitoring the MRT identification process.
The CCC consists of the Chairperson of the Supervisory Board and five further Supervisory Board Members, three of which are employee representatives. The Committee held six meetings in the calendar year 2021. The members of the Risk Committee attended two meetings as guests. Further details can be found in the Report of the Supervisory Board within the Annual Report.
Compensation Officer
The Management Board, in cooperation with the CCC, has appointed a Group Compensation Officer to support the Supervisory Boards of Deutsche Bank AG and of the bank’s Significant Institutions in Germany in performing their compensation related duties. The Compensation Officer is involved in the conceptual review, development, monitoring and application of the employees’ compensation systems, the MRT identification and remuneration disclosures on an ongoing basis. The Compensation Officer performs all relevant monitoring obligations independently, provides an assessment on the appropriateness of the design and practices of the compensation systems for employees at least annually and regularly supports and advises the CCC.
|
351
|
|
|
Deutsche Bank
|
Additional Notes
|
|
|
Annual Report 2021
|
|
|
|
|
|
Senior Executive Compensation Committee (SECC)
The SECC is a delegated committee established by the Management Board which has the mandate to develop sustainable compensation principles, to prepare recommendations on Total Compensation levels and to ensure appropriate compensation governance and oversight. The SECC establishes the Compensation and Benefits Strategy and Policy. Moreover, using quantitative and qualitative factors, the SECC assesses Group and divisional performance as a basis for compensation decisions and makes recommendations to the Management Board regarding the total amount of annual variable compensation and its allocation across business divisions and infrastructure functions.
In order to maintain its independence, only representatives from infrastructure and control functions who are not aligned to any of the business divisions are members of the SECC. In 2021, the SECC’s membership comprised of the Global Head of Human Resources and the Chief Financial Officer as Co-Chairpersons, as well as the Chief Risk Officer (the latter two are Management Board Members), the Global Head of Compliance, the Global Head of Performance Reward as well as an additional representative from both Finance and Risk as voting members. The Compensation Officer, the Deputy Compensation Officer and an additional representative from Finance participated as non-voting members. The SECC generally meets on a monthly basis but with more frequent meetings during the compensation process. It held 16 meetings in total with regard to the compensation process for the performance year 2021.
Compensation Strategy
Deutsche Bank recognizes that its compensation framework plays a vital role in supporting its strategic objectives. It enables us to attract and retain the individuals required to achieve our bank’s objectives. The Compensation and Benefits Strategy is aligned to Deutsche Bank’s business strategy, risk strategy, and to its corporate values and beliefs as outlined below.
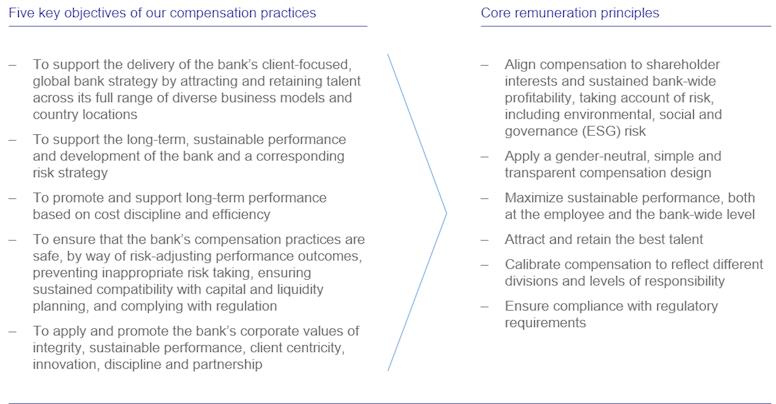
|
|
352
|
|
|
Deutsche Bank
|
Additional Notes
|
|
|
Annual Report 2021
|
|
|
|
|
|
Group Compensation Framework
Our compensation framework, generally applicable globally across all regions and business lines, emphasizes an appropriate balance between Fixed Pay (FP) and Variable Compensation (VC) – together forming Total Compensation (TC). It aligns incentives for sustainable performance at all levels of Deutsche Bank whilst ensuring the transparency of compensation decisions and their impact on shareholders and employees. The underlying principles of our compensation framework are applied to all employees equally, irrespective of differences in seniority, tenure, gender or ethnicity.
Pursuant to CRD and the requirements subsequently adopted in the German Banking Act, Deutsche Bank is subject to a ratio of 1:1 with regard to fixed-to-variable remuneration components, which was increased to 1:2 with shareholder approval on May 22, 2014 with an approval rate of 95.27 %, based on valid votes by 27.68 % of the share capital represented at the Annual General Meeting. Nonetheless, the bank has determined that employees in specific infrastructure functions should continue to be subject to a ratio of at least 1:1 while Control Functions as defined by InstVV are subject to a ratio of 2:1.
The bank has assigned a Reference Total Compensation (RTC) to eligible employees that describes a reference value for their role. This value provides our employees orientation on their FP and VC. Actual individual TC can be at, above or below the Reference Total Compensation, depending on VC decisions.
Fixed Pay
is used to compensate employees for their skills, experience and competencies, commensurate with the requirements, size and scope of their role. The appropriate level of FP is determined with reference to the prevailing market rates for each role, internal comparisons and applicable regulatory requirements. FP plays a key role in permitting us to meet our strategic objectives by attracting and retaining the right talent. For the majority of our employees, FP is the primary compensation component.
Variable Compensation
reflects affordability and performance at Group, divisional, and individual level. It allows us to differentiate individual performance and to drive behavior through appropriate incentives that can positively influence culture. It also allows for flexibility in the cost base. VC generally consists of two elements – the Group VC Component and the Individual VC Component.
The Group VC Component
is based on one of the overarching goals of the compensation framework – to ensure an explicit link between VC and the performance of the Group. To assess our annual achievements in reaching our strategic targets, the four Key Performance Indicators (KPIs) utilized as the basis for determining the 2021 Group VC Component were: Common Equity Tier 1 (CET 1) Capital Ratio, Leverage Ratio, Adjusted Costs, and Post-Tax Return on Tangible Equity (RoTE). These four KPIs represent the bank’s capital, leverage, profitability, and cost targets.
The Individual VC Component
is delivered either in the form of Individual VC, generally applicable for employees at the level of Vice President (VP) and above, or as Recognition Award, generally applicable for employees at the level of Assistant Vice President (AVP) and below. In case of negative performance contributions or misconduct, an employee’s VC can be reduced accordingly and can go down to zero. VC is granted and paid out subject to Group affordability. Under our compensation framework, there continues to be no guarantee of VC in an existing employment relationship. Such arrangements are utilized only on a very limited basis for new hires in the first year of employment and are subject to the bank’s standard deferral requirements.
Key components of the compensation framework
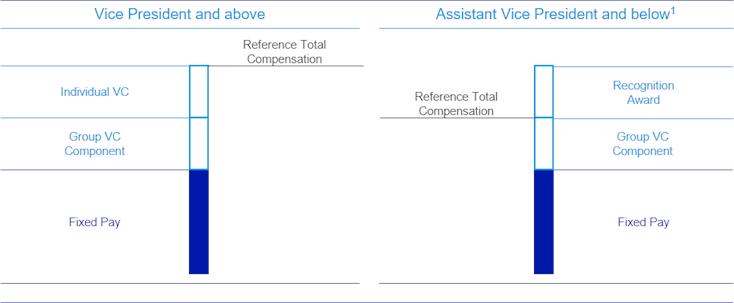
|
1
Some Assistant Vice Presidents and below in select entities and divisions are eligible for Individual VC in lieu of the Recognition Award.
|
353
|
|
|
Deutsche Bank
|
Additional Notes
|
|
|
Annual Report 2021
|
|
|
|
|
|
Individual VC
takes into consideration a number of financial and non-financial factors, including the applicable divisional performance, the employee’s individual performance, conduct, and adherence to values and beliefs, as well as additional factors such as the bank’s strategic decisions and retention considerations.
Recognition Awards
provide the opportunity to acknowledge and reward outstanding contributions made by the employees of lower seniority levels in a timely and transparent manner. Generally, the overall size of the Recognition Award budget is directly linked to a set percentage of FP for the eligible population and it is currently paid out twice a year, based on a review of nominations and contributions in a process managed at the divisional level.
In the context of InstVV,
severance payments
are considered variable compensation. The bank’s severance framework ensures full alignment with the respective InstVV requirements.
Employee benefits
complement Total Compensation and are considered FP from a regulatory perspective, as they have no direct link to performance or discretion. They are granted in accordance with applicable local market practices and requirements. Pension expenses represent the main element of the bank’s benefits portfolio globally.
Employee Groups with specific Compensation Structures
For some areas of our bank, compensation structures apply that deviate, within regulatory boundaries, in some aspects from the Group Compensation Framework outlined above.
Postbank units
While generally executive staff of former Postbank follow the remuneration structure of Deutsche Bank, the compensation for any other staff in Postbank units is based on specific frameworks agreed with trade unions or with the respective workers’ councils. Where no collective agreements exist, compensation is subject to individual contracts. In general, non-executive and tariff staff in Postbank units receive VC, but the structure and portion of VC can differ between legal entities.
DWS
The vast majority of DWS asset management entities and employees fall under AIFMD or UCITS, while a limited number of employees remain in scope of bank’s Group Compensation Framework and InstVV. DWS has established its own compensation governance, policy, and structures, as well as Risk Taker identification process in line with AIFMD/UCITS requirements. These structures and processes are aligned with InstVV where required, but tailored towards the Asset Management business. Pursuant to the ESMA Guidelines, DWS’s compensation strategy is designed to ensure an appropriate ratio between fixed and variable compensation.
Generally, DWS applies remuneration rules that are equivalent to the Deutsche Bank Group approach, but use DWS Group-related parameters, where possible. Notable deviations from the Group Compensation Framework include the use of share-based instruments linked to DWS shares and fund-linked instruments. These serve to improve the alignment of employee compensation with DWS’ shareholders’ and investors’ interests.
Control Functions
In line with InstVV, the bank has defined control functions that are subject to specific regulatory requirements. These control functions comprise Risk, Compliance, Anti-Financial Crime, Group Audit, parts of Human Resources, and the Compensation Officer and his Deputy. To prevent conflicts of interest, the parameters used to determine the Individual VC Component of these control functions do not follow the same parameters being used for the business they oversee. Based on their risk profile, these functions are subject to a fixed-to-variable pay ratio of 2:1.
In addition, for some corporate functions that perform internal control roles (including Legal, Group Finance, Group Tax, Regulation, and other parts of Human Resources), the bank has determined a fixed-to-variable pay ratio of 1:1.
Tariff staff
Within Deutsche Bank Group there are 15,667 tariff employees in Germany (based on full-time equivalent). Tariff staff are either subject to a collective agreement (
Tarifvertrag für das private Bankgewerbe und die öffentlichen Banken
), as negotiated between trade unions and employer associations, or subject to agreements as negotiated with the respective trade unions directly. The remuneration of tariff staff is included in the quantitative disclosures in this report.
|
354
|
|
|
Deutsche Bank
|
Additional Notes
|
|
|
Annual Report 2021
|
|
|
|
|
|
Determination of performance-based Variable Compensation
In 2021, we continued to put a strong focus on our governance related to compensation decision-making processes. A robust set of rule-based principles for compensation decisions with close links to the performance of both business and individual were applied.
The total amount of VC for any given performance year is initially determined at Group level, taking into account the bank’s profitability, solvency, and liquidity position and then allocated to divisions and infrastructure functions based on their performance in support of achieving the bank’s strategic objectives.
In a first step, Deutsche Bank assesses the bank’s profitability, solvency and liquidity position in line with its Risk Appetite Framework, including a holistic review against the bank’s multi-year strategic plan to determine what the bank “can” award in line with regulatory requirements (i.e. Group affordability). In the next step, the bank assesses divisional risk-adjusted performance, i.e. what the bank “should” award in order to provide an appropriate compensation for contributions to the bank’s success.
When assessing divisional performance, a range of considerations are referenced. Performance is assessed in the context of financial and – based on Balanced Scorecards – non-financial targets. The financial targets for front-office divisions are subject to appropriate risk-adjustment, in particular by referencing the degree of future potential risks to which Deutsche Bank may be exposed, and the amount of capital required to absorb severe unexpected losses arising from these risks. For the infrastructure functions, the financial performance assessment is mainly based on the achievement of cost targets. While the allocation of VC to infrastructure functions, and in particular to control functions, depends on the overall performance of Deutsche Bank, it is not dependent on the performance of the division(s) that these functions oversee.
At the level of the individual employee, we have established Variable Compensation Guiding Principles, which detail the factors and metrics that have to be taken into account when making Individual VC decisions. Our managers must fully appreciate the risk-taking activities of individuals to ensure that VC allocations are balanced and risk-taking is not inappropriately incentivized. The factors and metrics to be considered include, but are not limited to, (i) business delivery (“What”), i.e. quantitative and qualitative financial, risk-adjusted and non-financial performance metrics, and (ii) behavior (“How”), i.e. culture, conduct and control considerations such as qualitative inputs from control functions or disciplinary sanctions. Generally, performance is assessed based on a one year period. However, for Management Board members of Significant Institutions, the performance across three years is taken into account.
|
355
|
|
|
Deutsche Bank
|
Additional Notes
|
|
|
Annual Report 2021
|
|
|
|
|
|
Variable Compensation Structure
Our compensation structures are designed to provide a mechanism that promotes and supports long-term performance of our employees and our bank. Whilst a portion of VC is paid upfront, these structures require that an appropriate portion is deferred to ensure alignment to the sustainable performance of the Group. For both parts of VC, we use Deutsche Bank shares as instruments and as an effective way to align compensation with Deutsche Bank’s sustainable performance and the interests of shareholders.
We continue to go beyond regulatory requirements with the scope as well as the amount of VC that is deferred and our minimum deferral periods for certain employee groups. The deferral rate and period are determined based on the risk categorization of the employee, the division and the business unit. Where applicable, we start to defer parts of variable compensation for MRTs where VC is set at or above € 50,000 or where VC exceeds 1/3 of TC. For non-MRTs, deferrals start at higher levels of VC. MRTs are on average subject to deferral rates in excess of the minimum 40 % (60 % for Senior Management) as required by InstVV. For MRTs in Material Business Units (MBU) we apply a deferral rate of at least 50 %. The VC threshold for MRTs requiring at least 60 % deferral is set at € 500,000.
Furthermore, Directors and Managing Directors in Corporate Bank (CB), Investment Bank (IB) or Capital Release Unit (CRU) are subject to a VC deferral rate of 100 % with respect to any VC in excess of € 500,000. Moreover, if Fixed Pay for these employees exceeds an amount of € 500,000, the full VC is deferred.
As detailed in the table below, deferral periods range from three to five years, dependent on employee groups. For MRTs the minimum deferral period was increased from three years to four years in compliance with InstVV 4.0 requirement, applicable as of 2021.
Overview on 2021 Award Types (excluding DWS Group)
|
Award Type
|
|
Description
|
|
Beneficiaries
|
|
Deferral Period
|
|
Retention Period
|
|
Proportion
|
|
|
|
|
|
|
|
|
|
|
|
|
|
Upfront:
Cash VC
|
|
Upfront cash portion
|
|
All eligible employees
|
|
N/A
|
|
N/A
|
|
MRTs with
VC ≥ € 50,000 or where VC exceeds 1/3 of TC: 50 % of upfront VC
Non-MRTs with 2021 TC ≤ € 500,000: 100 % of upfront VC
|
|
Upfront:
Equity Upfront Award (EUA)
|
|
Upfront equity portion (linked to Deutsche Bank’s share price over the retention period)
|
|
All MRTs with VC ≥ € 50,000 or where VC exceeds 1/3 of TC
All employees with 2021 TC € 500,000
|
|
N/A
|
|
Twelve months
|
|
50 % of upfront VC
|
|
Deferred:
Restricted Incentive Award (RIA)
|
|
Deferred cash portion
|
|
All employees with deferred VC
|
|
Equal tranche vesting:
MRTs: 4 years
Sen. Mgmt.1: 5 years
Other: 3 years
|
|
N/A
|
|
50 % of deferred VC
|
|
Deferred:
Restricted Equity Award (REA)
|
|
Deferred equity portion (linked to Deutsche Bank’s share price over the vesting and retention period)
|
|
All employees with deferred VC
|
|
Equal tranche vesting:
MRTs: 4 years
Sen. Mgmt.1: 5 years
Other: 3 years
|
|
Twelve months for MRTs
|
|
50 % of deferred VC
|
N/A – Not applicable
1
For the purpose of Performance Year 2021 annual awards, Senior Management is defined as DB AG MB-1 positions; voting members of Business Division Top Executive Committees; MB members of Significant Institutions; respective MB-1 positions with managerial responsibility. For the specific deferral rules for the Management Board of DB AG refer to the Compensation Report for the Management Board.
Our employees are not allowed to sell, pledge, transfer or assign a deferred award or any rights in respect to the award. They may not enter into any transaction having an economic effect of hedging any variable compensation, for example offsetting the risk of price movement with respect to the equity-based award. Our Human Resources and Compliance functions, overseen by the Compensation Officer, work together to monitor employee trading activity and to ensure that all our employees comply with this requirement.
|
356
|
|
|
Deutsche Bank
|
Additional Notes
|
|
|
Annual Report 2021
|
|
|
|
|
|
Ex-post Risk Adjustment of Variable Compensation
In line with regulatory requirements relating to ex-post risk adjustment of variable compensation, we believe that a long-term view on conduct and performance of our employees is a key element of deferred VC. As a result, all deferred awards are subject to performance conditions and forfeiture provisions as detailed below.
Overview on Deutsche Bank Group performance conditions and forfeiture provisions of Variable Compensation granted for Performance Year 2021
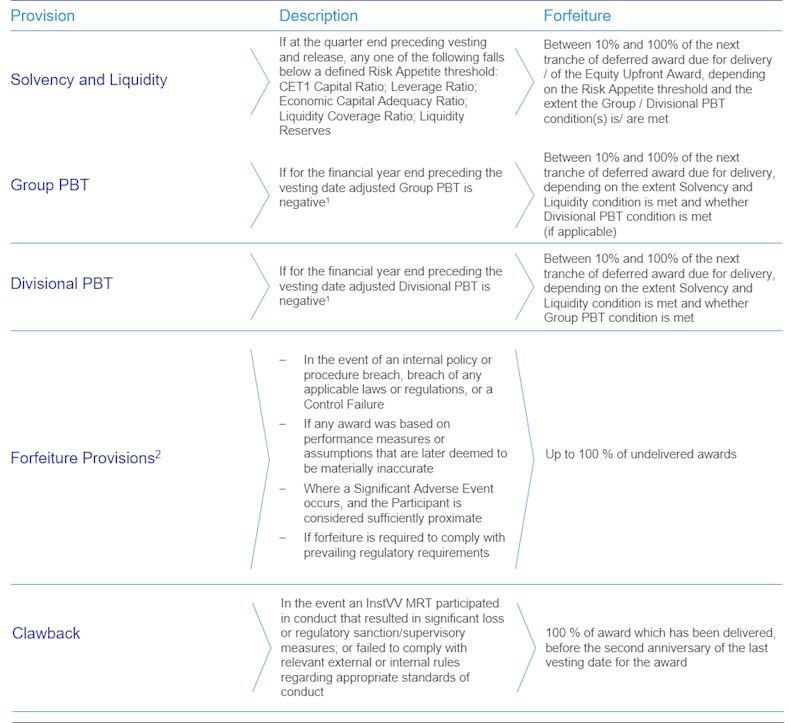
|
1
Considering clearly defined and governed adjustments for relevant Profit and Loss items (e.g., business restructurings; impairments of goodwill or intangibles).
2
Other provisions may apply as outlined in the respective plan rules.
|
357
|
|
|
Deutsche Bank
|
Additional Notes
|
|
|
Annual Report 2021
|
|
|
|
|
|
Compensation Decisions for 2021
Year-end considerations and decisions for 2021
All compensation decisions are made within the boundaries of regulatory requirements. These requirements form the overarching and limiting principle of determining compensation in Deutsche Bank. In particular, management must ensure that compensation decisions are not detrimental to maintaining a sound capital base and liquidity resources of the bank.
Due to the continued focus on our strategy and the dedication of our employees, 2021 was a very successful year for Deutsche Bank: All our businesses performed well – especially when taking into account the continuing COVID-19 pandemic and the bank’s ongoing transformation – and almost all of the anticipated transformation costs have now been recognized. As a result, we are considerably more profitable with a pre-tax profit of € 3.4 billion and a net profit of € 2.5 billion. We have also made further progress and remain fully disciplined on costs. This allows us to build firm foundations for sustainable profitability, and sets the path to the final stage of our announced transformation.
Although 2021 was a very positive year for Deutsche Bank, we once more applied a prudent and forward-looking approach when deciding on the 2021 variable compensation and deferral structures, without losing sight of the need to remunerate our employees fairly. These decisions are taken according to performance and in line with market conditions, and of course within the boundaries of affordability. Again, when determining the amount of year-end performance-based VC, we have exercised more moderation than the results at the Group and divisional level would have required. As in previous years, the SECC has been constantly monitoring and reviewing the impact of potential VC awards not only with regard to our capital and liquidity base but also taking into account our ambitious cost targets.
In the context of the above considerations, the Management Board confirmed that the bank is in a position to award variable compensation, including a year-end performance-based VC pool of € 2.099 billion for 2021. The VC for the Management Board of Deutsche Bank AG was determined by our Supervisory Board in a separate process. It is, however, included in the tables and charts below.
As part of the overall 2021 VC awards granted in March 2022, the Group VC Component was awarded to all eligible employees in line with the assessment of the four defined KPIs, as outlined in the chapter Group Compensation Framework. The Management Board determined a payout rate of 77.5 % for the Group VC Component in 2021 (2020: 72.5 %).
The increase of 2021 VC awards compared to 2020 is driven by a combination of factors. Deutsche Bank’s improved performance plays a part, with the composition of the staff population including the addition of key senior roles essential for the effective execution of our strategy and certain FX effects also impacting the relative size of the VC awards.
Compensation awards for 2021 – all employees
|
|
|
2021
|
|
2020
|
||||||||||||||||||
|
in € m.
(unless stated otherwise)¹
|
|
Super-
visory
Board²
|
|
Mana-
gement
Board
3
|
|
IB
3
|
|
CB
3
|
|
PB
3
|
|
AM
3
|
|
CRU
3
|
|
Control
Func-
tions
3
|
|
Corporate
Func-
tions
3
|
|
Group
Total
|
|
Group
Total
|
|
Number of employees (full-time equivalent)
|
|
22
|
|
11
|
|
7,202
|
|
13,265
|
|
28,100
|
|
4,072
|
|
267
|
|
5,936
|
|
24,117
|
|
82,969
|
|
84,659
|
|
Total compensation
|
|
7
|
|
79
|
|
2,215
|
|
1,280
|
|
2,471
|
|
762
|
|
100
|
|
662
|
|
2,342
|
|
9,912
|
|
10,119
|
|
Base salary and allowances
|
|
7
|
|
27
|
|
1,098
|
|
929
|
|
1,889
|
|
422
|
|
64
|
|
568
|
|
1,813
|
|
6,811
|
|
6,940
|
|
Pension expenses
|
|
0
|
|
8
|
|
63
|
|
80
|
|
154
|
|
39
|
|
5
|
|
49
|
|
139
|
|
537
|
|
554
|
|
Fixed Pay according to
§ 2 InstVV
|
|
7
|
|
35
|
|
1,161
|
|
1,009
|
|
2,044
|
|
461
|
|
69
|
|
617
|
|
1,952
|
|
7,348
|
|
7,494
|
|
Year-end performance-based VC
4
|
|
0
|
|
40
|
|
1,018
|
|
188
|
|
249
|
|
230
|
|
23
|
|
37
|
|
315
|
|
2,099
|
|
1,857
|
|
Other VC
4
|
|
0
|
|
1
|
|
5
|
|
7
|
|
45
|
|
57
|
|
0
|
|
2
|
|
19
|
|
135
|
|
286
|
|
Severance payments
|
|
0
|
|
3
|
|
31
|
|
77
|
|
133
|
|
15
|
|
8
|
|
7
|
|
57
|
|
330
|
|
482
|
|
Variable Pay according to § 2 InstVV
|
|
0
|
|
44
|
|
1,054
|
|
271
|
|
427
|
|
301
|
|
31
|
|
46
|
|
390
|
|
2,564
|
|
2,625
|
|
|
|
|
|
|
|
|
|
|
|
|
|
|
|
|
|
|
|
|
|
|
|
|
1
The table may contain marginal rounding differences. FTE (full-time equivalent) as of December 31, 2021.
2
Supervisory Board includes the Deutsche Bank AG Supervisory Board Members. They are not considered for the Group Total number of employees. Employee representatives are considered with their compensation for the Supervisory Board role only (their employee compensation is included in the relevant divisional column). The remuneration for members of the Deutsche Bank AG Supervisory Board is not reflected in the Group Total.
3
Management Board includes the Management Board Members of Deutsche Bank AG. IB = Investment Bank; CB = Corporate Bank; PB = Private Bank; AM = Asset Management; CRU = Capital Release Unit. Control Functions include Chief Risk Office, Group Audit, Compliance and Anti-Financial Crime. Corporate Functions include any Infrastructure function which is neither captured as a Control Function nor part of any division.
4
Year-end performance-based VC includes Individual and Group VC. Other VC includes other contractual VC commitments such as sign-on awards, retention awards, recognition awards, DWS Performance Share Unit-Award (PSU-Award) and specific VC elements for tariff staff and civil servants. It also includes fringe benefits awarded to Management Board Members of Deutsche Bank AG which are to be classified as variable remuneration. The table does not include new hire replacement awards for lost entitlements from previous employers (buyouts).
|
358
|
|
|
Deutsche Bank
|
Additional Notes
|
|
|
Annual Report 2021
|
|
|
|
|
|
Reported year-end performance-based Variable Compensation and deferral rates year over year – all employees
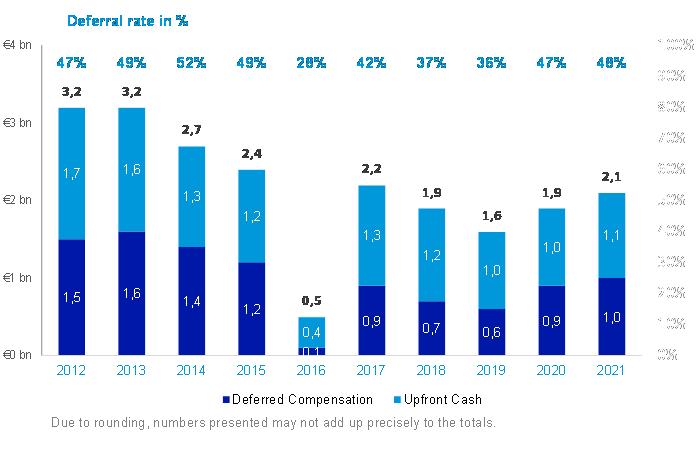
Deutsche Bank continues to apply deferral structures that go beyond the regulatory minimum, resulting in an overall deferral rate (all employees including non-MRT population) of 48 % in 2021. For the MRT population only, the deferral rate amounts to 92 %.
Material Risk Taker Compensation Disclosure
On a global basis, 1,263 employees were identified as MRTs according to InstVV for financial year 2021, compared to 2,298 employees for 2020. This decrease is attributable to the reduced number of quantitative (remuneration driven) MRTs as a result of the newly applicable remuneration thresholds following regulatory changes in 2021. The number of 2021 Group MRTs amounts to 1,005 individuals. Moreover, 181 individuals were identified by Significant Institutions and 129 individuals were identified by Other CRR Institutions. The remuneration elements for all Group MRTs (contrary to 2020 where both Group MRTs and MRTs identified by Significant Institutions, which are also reported by the respective entities, were included) are detailed in the tables below in accordance with Section 16 InstVV and Article 450 CRR.
|
359
|
|
|
Deutsche Bank
|
Additional Notes
|
|
|
Annual Report 2021
|
|
|
|
|
|
Remuneration for 2021 - Material Risk Takers (REM 1)
|
|
|
|
|
2021
|
|
||||||||
|
|
|
in € m.
(unless stated otherwise)¹
|
|
Super-
visory
Board²
|
|
Manage-
ment
Board
3
|
|
Senior Management
4
|
|
Other Material Risk Takers
|
|
Group
Total
|
|
|
Fixed Pay
|
|
Number of MRTs
5
|
|
22
|
|
11
|
|
118
|
|
807
|
|
958
|
|
|
|
Total Fixed Pay
|
|
7
|
|
35
|
|
134
|
|
529
|
|
704
|
|
|
|
|
of which: cash-based
|
|
5
|
|
27
|
|
128
|
|
503
|
|
664
|
|
|
|
|
of which: shares or equivalent ownership interests
|
|
2
|
|
0
|
|
0
|
|
0
|
|
2
|
|
|
|
|
of which: share-linked instruments or equivalent non-cash instruments
|
|
0
|
|
0
|
|
0
|
|
0
|
|
0
|
|
|
|
|
of which: other instruments
|
|
0
|
|
0
|
|
0
|
|
0
|
|
0
|
|
|
|
|
of which: other forms
|
|
0
|
|
8
|
|
6
|
|
26
|
|
39
|
|
|
|
Variable Pay
|
|
Number of MRTs
5
|
|
0
|
|
11
|
|
114
|
|
803
|
|
928
|
|
|
|
Total Variable Pay
6
|
|
0
|
|
44
|
|
130
|
|
526
|
|
699
|
|
|
|
|
of which: cash-based
|
|
0
|
|
23
|
|
62
|
|
266
|
|
351
|
|
|
|
|
of which: deferred
|
|
0
|
|
21
|
|
50
|
|
221
|
|
292
|
|
|
|
|
of which: shares or equivalent ownership interests
|
|
0
|
|
21
|
|
56
|
|
254
|
|
330
|
|
|
|
|
of which: deferred
|
|
0
|
|
21
|
|
47
|
|
219
|
|
287
|
|
|
|
|
of which: share-linked instruments or equivalent non-cash instruments
|
|
0
|
|
0
|
|
11
|
|
7
|
|
18
|
|
|
|
|
of which: deferred
|
|
0
|
|
0
|
|
9
|
|
5
|
|
14
|
|
|
|
|
of which: other instruments
|
|
0
|
|
0
|
|
1
|
|
0
|
|
1
|
|
|
|
|
of which: deferred
|
|
0
|
|
0
|
|
1
|
|
0
|
|
1
|
|
|
|
|
of which: other forms
|
|
0
|
|
0
|
|
0
|
|
0
|
|
0
|
|
|
|
|
of which: deferred
|
|
0
|
|
0
|
|
0
|
|
0
|
|
0
|
|
|
|
|
|
Total Pay
|
|
7
|
|
79
|
|
263
|
|
1,055
|
|
1,404
|
|
|
|
|
|
|
|
|
|
|
|
|
|
|
|
|
1
The table may contain marginal rounding differences.
2
Supervisory Board includes the Deutsche Bank AG Supervisory Board Members.
3
Management Board includes the Management Board Members of Deutsche Bank AG.
4
Senior Management is defined as DB AG MB-1 positions and voting members of Business Division Top Executive Committees.
5
Beneficiaries only (HC reported for Supervisory Board and Management Board, FTE reported for the remaining part). Therefore the totals do not add up to the 1,005 individuals identified as Group MRTs.
6
Variable Pay includes Deutsche Bank´s Year-end performance-based VC for 2021, Other VC and severance payments. It also includes fringe benefits awarded to Management Board Members of Deutsche Bank AG which are to be classified as variable remuneration. The table does not include new hire replacement awards for lost entitlements from previous employers (buyouts).
Guaranteed variable remuneration and severance payments - Material Risk Takers (REM 2)
|
|
|
2021
|
|
||||||||
|
in € m.
(unless stated otherwise)¹
|
|
Super-
visory
Board²
|
|
Manage-
ment
Board
3
|
|
Senior Management
4
|
|
Other Material Risk Takers
|
|
Group
Total
|
|
|
Guaranteed variable remuneration awards
|
|
|
|
|
|
|
|
|
|
|
|
|
Number of MRTs
5
|
|
0
|
|
0
|
|
1
|
|
3
|
|
4
|
|
|
Total amount
|
|
0
|
|
0
|
|
0
|
|
3
|
|
3
|
|
|
of which: paid during financial year, not taken into account in bonus cap
|
|
0
|
|
0
|
|
0
|
|
0
|
|
0
|
|
|
Severance payments awarded in previous periods, paid out during financial year
|
|
|
|
|
|
|
|
|
|
|
|
|
Number of MRTs
5
|
|
0
|
|
0
|
|
0
|
|
0
|
|
0
|
|
|
Total amount
|
|
0
|
|
0
|
|
0
|
|
0
|
|
0
|
|
|
Severance payments awarded during financial year
|
|
|
|
|
|
|
|
|
|
|
|
|
Number of MRTs
5
|
|
0
|
|
1
|
|
6
|
|
28
|
|
35
|
|
|
Total amount
6
|
|
0
|
|
3
|
|
4
|
|
8
|
|
16
|
|
|
of which: paid during financial year
|
|
0
|
|
2
|
|
3
|
|
8
|
|
13
|
|
|
of which: deferred
|
|
0
|
|
2
|
|
2
|
|
0
|
|
3
|
|
|
of which: paid during financial year, not taken into account in bonus cap
|
|
0
|
|
3
|
|
4
|
|
8
|
|
16
|
|
|
|
|
|
|
|
|
|
|
|
|
|
|
1
The table may contain marginal rounding differences.
2
Supervisory Board includes the Deutsche Bank AG Supervisory Board Members.
3
Management Board includes the Management Board Members of Deutsche Bank AG.
4
Senior Management is defined as DB AG MB-1 positions and voting members of Business Division Top Executive Committees.
5
Beneficiaries only (HC reported for all categories).
6
Severance payments are generally not taken into account for the bonus cap. The highest single severance payment made in 2021 amounts to € 3,462,111.
|
360
|
|
|
Deutsche Bank
|
Additional Notes
|
|
|
Annual Report 2021
|
|
|
|
|
|
Deferred remuneration - Material Risk Takers (REM 3)
|
|
|
2021
|
||||||||||||||
|
in € m.
(unless stated otherwise)¹
|
|
Total amount of deferred remuneration awarded for previous performance periods
|
|
Of which due to vest in the financial year
|
|
Of which vesting in subsequent financial years
|
|
Amount of performance adjustment made in the financial year to deferred remuneration that was due to vest in the financial year
|
|
Amount of performance adjustment made in the financial year to deferred remuneration that was due to vest in future performance years
|
|
Total amount of adjustment during the financial year due to ex post implicit adjustments
5
|
|
Total amount of deferred remuneration awarded before the financial year actually paid out in the financial year
6
|
|
Total of amount of deferred remuneration awarded for previous performance period that has vested but is subject to retention periods
|
|
Supervisory Board
2
|
|
0
|
|
0
|
|
0
|
|
0
|
|
0
|
|
0
|
|
0
|
|
0
|
|
Cash-based
|
|
0
|
|
0
|
|
0
|
|
0
|
|
0
|
|
0
|
|
0
|
|
0
|
|
Shares or equivalent ownership interests
|
|
0
|
|
0
|
|
0
|
|
0
|
|
0
|
|
0
|
|
0
|
|
0
|
|
Share-linked instruments or equivalent non-cash instruments
|
|
0
|
|
0
|
|
0
|
|
0
|
|
0
|
|
0
|
|
0
|
|
0
|
|
Other instruments
|
|
0
|
|
0
|
|
0
|
|
0
|
|
0
|
|
0
|
|
0
|
|
0
|
|
Other forms
|
|
0
|
|
0
|
|
0
|
|
0
|
|
0
|
|
0
|
|
0
|
|
0
|
|
Management Board
3
|
|
62
|
|
5
|
|
57
|
|
0
|
|
0
|
|
6
|
|
5
|
|
1
|
|
Cash-based
|
|
25
|
|
4
|
|
22
|
|
0
|
|
0
|
|
0
|
|
4
|
|
0
|
|
Shares or equivalent ownership interests
|
|
37
|
|
1
|
|
36
|
|
0
|
|
0
|
|
6
|
|
1
|
|
1
|
|
Share-linked instruments or equivalent non-cash instruments
|
|
0
|
|
0
|
|
0
|
|
0
|
|
0
|
|
0
|
|
0
|
|
0
|
|
Other instruments
|
|
0
|
|
0
|
|
0
|
|
0
|
|
0
|
|
0
|
|
0
|
|
0
|
|
Other forms
|
|
0
|
|
0
|
|
0
|
|
0
|
|
0
|
|
0
|
|
0
|
|
0
|
|
Senior management
4
|
|
336
|
|
58
|
|
278
|
|
0
|
|
0
|
|
30
|
|
58
|
|
15
|
|
Cash-based
|
|
172
|
|
38
|
|
134
|
|
0
|
|
0
|
|
0
|
|
38
|
|
0
|
|
Shares or equivalent ownership interests
|
|
150
|
|
19
|
|
131
|
|
0
|
|
0
|
|
29
|
|
19
|
|
15
|
|
Share-linked instruments or equivalent non-cash instruments
|
|
12
|
|
1
|
|
11
|
|
0
|
|
0
|
|
0
|
|
1
|
|
1
|
|
Other instruments
|
|
1
|
|
0
|
|
1
|
|
0
|
|
0
|
|
0
|
|
0
|
|
0
|
|
Other forms
|
|
0
|
|
0
|
|
0
|
|
0
|
|
0
|
|
0
|
|
0
|
|
0
|
|
Other Material Risk Takers
|
|
1,319
|
|
292
|
|
1,027
|
|
1
|
|
2
|
|
111
|
|
289
|
|
67
|
|
Cash-based
|
|
712
|
|
175
|
|
537
|
|
0
|
|
1
|
|
0
|
|
173
|
|
0
|
|
Shares or equivalent ownership interests
|
|
599
|
|
117
|
|
482
|
|
0
|
|
1
|
|
110
|
|
115
|
|
67
|
|
Share-linked instruments or equivalent non-cash instruments
|
|
7
|
|
1
|
|
6
|
|
0
|
|
0
|
|
0
|
|
1
|
|
1
|
|
Other instruments
|
|
1
|
|
0
|
|
0
|
|
0
|
|
0
|
|
0
|
|
0
|
|
0
|
|
Other forms
|
|
0
|
|
0
|
|
0
|
|
0
|
|
0
|
|
0
|
|
0
|
|
0
|
|
Total amount
|
|
1,717
|
|
355
|
|
1,362
|
|
1
|
|
2
|
|
147
|
|
352
|
|
84
|
|
|
|
|
|
|
|
|
|
|
|
|
|
|
|
|
|
|
1
The table may contain marginal rounding differences.
2
Supervisory Board includes the Deutsche Bank AG Supervisory Board Members.
3
Management Board includes the Management Board Members of Deutsche Bank AG.
4
Senior Management is defined as DB AG MB-1 positions and voting members of Business Division Top Executive Committees.
5
Changes of value of deferred remuneration due to the changes of prices of instruments.
6
Defined as remuneration awarded before the financial year which vested in the financial year (including where subject to a retention period).
Remuneration of high earners – Material Risk Takers (REM 4)
|
|
|
2021
|
|
in €
|
|
Number of individuals
1
|
|
Total Pay
2
|
|
|
|
1,000,000 to 1,499,999
|
|
234
|
|
1,500,000 to 1,999,999
|
|
115
|
|
2,000,000 to 2,499,999
|
|
56
|
|
2,500,000 to 2,999,999
|
|
33
|
|
3,000,000 to 3,499,999
|
|
19
|
|
3,500,000 to 3,999,999
|
|
19
|
|
4.000,000 to 4,499,999
|
|
9
|
|
4,500,000 to 4,999,999
|
|
4
|
|
5,000,000 to 5,999,999
|
|
10
|
|
6,000,000 to 6,999,999
|
|
6
|
|
7,000,000 to 7,999,999
|
|
8
|
|
8,000,000 to 8,999,999
|
|
3
|
|
9,000,000 to 9,999,999
|
|
3
|
|
10,000,000 to 10,999,999
|
|
1
|
|
Total
|
|
520
|
|
|
|
|
1
Comprises MRTs only (including 2021 leavers).
|
361
|
|
|
Deutsche Bank
|
Additional Notes
|
|
|
Annual Report 2021
|
|
|
|
|
|
2
Includes all components of FP and VC (including severances). Buyouts are not included.
In total, 520 MRTs received a Total Pay of € 1 million or more for 2021 (in comparison to 614 MRTs in 2020). This decrease is mainly attributable to a reduced number of retention and severance payments awarded.
Compensation Awards 2021 – Material Risk Takers (REM 5)
|
|
|
Management Body Remuneration
|
|
Business Areas
|
|
|
||||||||||||||||
|
in € m.
(unless stated otherwise)¹
|
|
Super-
visory
Board
2
|
|
Manage-
ment
Board
2
|
|
Total Management Body
|
|
IB
2
|
|
CB
2
|
|
PB
2
|
|
AM
2
|
|
CRU
2
|
|
Corporate functions
2
|
|
Independent internal control functions
2
|
|
Total
|
|
Total number of Material Risk Takers
3
|
|
|
|
|
|
|
|
|
|
|
|
|
|
|
|
|
|
|
|
|
|
958
|
|
of which: Management Body
|
|
22
|
|
11
|
|
33
|
|
N/A
|
|
N/A
|
|
N/A
|
|
N/A
|
|
N/A
|
|
N/A
|
|
N/A
|
|
N/A
|
|
of which: Senior Management
4
|
|
N/A
|
|
N/A
|
|
N/A
|
|
20
|
|
18
|
|
7
|
|
5
|
|
5
|
|
55
|
|
8
|
|
118
|
|
of which: Other Material Risk Takers
|
|
N/A
|
|
N/A
|
|
N/A
|
|
465
|
|
73
|
|
76
|
|
15
|
|
20
|
|
117
|
|
41
|
|
807
|
|
Total Pay of Material Risk Takers
|
|
7
|
|
79
|
|
86
|
|
861
|
|
87
|
|
98
|
|
41
|
|
25
|
|
169
|
|
36
|
|
1,404
|
|
of which: variable pay
5
|
|
-
|
|
44
|
|
44
|
|
462
|
|
41
|
|
44
|
|
27
|
|
9
|
|
64
|
|
9
|
|
699
|
|
of which: fixed pay
|
|
7
|
|
35
|
|
42
|
|
399
|
|
46
|
|
54
|
|
15
|
|
16
|
|
105
|
|
27
|
|
704
|
|
|
|
|
|
|
|
|
|
|
|
|
|
|
|
|
|
|
|
|
|
|
|
|
1
The table may contain marginal rounding differences.
2
Supervisory Board includes the Deutsche Bank AG Supervisory Board Members, Management Board includes the Management Board Members of Deutsche Bank AG. IB = Investment Bank; CB = Corporate Bank; PB = Private Bank; AM = Asset Management; CRU = Capital Release Unit. Control Functions include Chief Risk Office, Group Audit, Compliance and Anti-Financial Crime. Corporate Functions include any Infrastructure function which is neither captured as a Control Function nor part of any division.
3
HC reported for Supervisory Board and Management Board, FTE reported for the remaining part. Therefore the totals do not add up to the 1.005 individuals identified as Group MRTs.
4
Senior Management is defined as DB AG MB-1 positions and voting members of Business Division Top Executive Committees.
5
Variable Pay includes Deutsche Bank´s Year-end performance-based VC for 2021, Other VC and severance payments. It also includes fringe benefits awarded to Management Board Members of Deutsche Bank AG which are to be classified as variable remuneration. The table does not include new hire replacement awards for lost entitlements from previous employers (buyouts).
|
362
|
|
|
Deutsche Bank
|
Additional Notes
|
|
|
Annual Report 2021
|
|
|
|
|
|
4-
Corporate Governance Statement according to Sections 289f and 315d of the German Commercial Code
|
379
|
Management Board and Supervisory Board
|
|
|
|
|
394
|
Reporting and Transparency
|
|
|
|
|
394
|
Related Party Transactions
|
|
|
|
|
395
|
Auditing and Controlling
|
|
|
|
|
398
|
Compliance with the German Corporate Governance Code
|
|
|
|
|
363
|
|
|
Deutsche Bank
|
Additional Notes
|
|
|
Annual Report 2021
|
|
|
|
|
|
All information presented in this Corporate Governance Statement according to Section 289f and 315d of the German Commercial Code is as of February 11, 2022.
Management Board and Supervisory Board
Management Board
The Management Board of Deutsche Bank AG is responsible for the management of the company in accordance with the law, the Articles of Association of Deutsche Bank AG and the Terms of Reference for the Management Board with the objective of creating sustainable value in the interests of the company. It considers the interests of shareholders, employees and other company-related stakeholders. The members of the Management Board are collectively responsible for managing the bank’s business. The Management Board, as the Group Management Board, manages Deutsche Bank Group in accordance with uniform guidelines; it exercises general control over all Group companies.
The Management Board decides on all matters prescribed by law and the Articles of Association and ensures compliance with the legal requirements and internal guidelines (compliance). It also takes the necessary measures to ensure that adequate internal guidelines are developed and implemented. The Management Board's responsibilities include, in particular, the bank’s strategic management and direction, the allocation of resources, financial accounting and reporting, control and risk management, as well as a properly functioning business organization and corporate control. The Management Board decides on the appointments to the senior management level below the Management Board and, in particular, on the appointment of Global Key Function Holders. In appointing people to management functions in the Group, the Management Board takes diversity into account and strives, in particular, to achieve an appropriate representation of women (more detailed information in section “Targets for the proportion of women in management positions/gender quota“ in this Corporate Governance Statement).
The Management Board works closely together with the Supervisory Board in a cooperative relationship of trust and for the benefit of the company. The Management Board reports to the Supervisory Board at a minimum within the scope prescribed by law or administrative guidelines, in particular on all issues with relevance for the Group concerning strategy, the intended business policy, planning, business development, risk situation, risk management, staff development, reputation and compliance.
A comprehensive presentation of the duties, responsibilities and procedures of our Management Board is specified in its Terms of Reference, the current version of which is available on our website (www.db.com/ir/en/documents.htm).
Personnel changes to the Management Board and the current members of the Management Board
The following members of the Management Board were appointed for a three-year period:
- – Rebecca Short with effect from May 1, 2021
- – Olivier Vigneron with effect from May 20, 2022.
The following member left the Management Board:
- – Frank Kuhnke as of April 30, 2021.
Furthermore, in March 2021, Stuart Lewis informed the Supervisory Board of his decision to retire after the Annual General Meeting in May 2022.
The following information is provided on the current members of the Management Board on the year in which they were born, year in which they were first appointed and year in which their term expires as well as their current positions and area of responsibility according to the current Business Allocation Plan for the Management Board. Also specified are their other board mandates or directorships outside of Deutsche Bank Group as well as all memberships in legally prescribed supervisory boards or other comparable domestic or foreign supervisory bodies of commercial enterprises. The members of our Management Board have generally undertaken not to assume chairmanships of supervisory boards of companies outside Deutsche Bank Group.
|
364
|
|
|
Deutsche Bank
|
Additional Notes
|
|
|
Annual Report 2021
|
|
|
|
|
|
Christian Sewing
Year of birth: 1970
First appointed: 2015
Term expires: 2026
Christian Sewing became a member of our Management Board on January 1, 2015, and is our Chief Executive Officer with effect from April 8, 2018. He is responsible on the Management Board for Communications Corporate Social Responsibility (CSR), Research and Group Audit. He was responsible for the Corporate Bank and the Investment Bank until April 2021. Since May 2021 Mr. Sewing has been responsible for Human Resources.
Prior to assuming his role on the Management Board, Mr. Sewing was Global Head of Group Audit and held a number of positions before that in Risk, including Deputy Chief Risk Officer (from 2012 to 2013) and Chief Credit Officer (from 2010 to 2012) of Deutsche Bank.
From 2005 until 2007, Mr. Sewing was a member of the Management Board of Deutsche Genossenschafts-Hypothekenbank.
Before graduating with a diploma from the Bankakademie Bielefeld and Hamburg, Mr. Sewing completed a bank apprenticeship at Deutsche Bank in 1989.
Mr. Sewing does not have any external directorships subject to disclosure.
Karl von Rohr
Year of birth: 1965
First appointed: 2015
Term expires: 2023
Karl von Rohr became a member of our Management Board on November 1, 2015, and President as of April 8, 2018. He is responsible on the Management Board for the Private Bank and Asset Management. He is also Regional Chief Executive Officer (CEO) for Germany, as well as for the EMEA Region (Europe, Middle East and Africa).
Mr. von Rohr joined Deutsche Bank in 1997. From November 2015 to November 2019 he was the Management Board member responsible for Human Resources and until July 2020, he was responsible for Legal, Group Governance and Government Regulatory Affairs. From 2013 to 2015 he was Global Chief Operating Officer, Regional Management. Prior to this, he was Head of Human Resources for Deutsche Bank in Germany and member of the Management Board of Deutsche Bank Privat- und Geschäftskunden AG. During his time at Deutsche Bank, he has held various senior management positions in other divisions in Germany and Belgium.
He studied law at the universities of Bonn (Germany), Kiel (Germany), Lausanne (Switzerland) and at Cornell University (U.S.A.).
Mr. von Rohr does not have any external directorships subject to disclosure.
He is Chairman of the Supervisory Board of DWS Group GmbH Co. KGaA.
Fabrizio Campelli
Year of birth: 1973
First appointed: 2019
Term expires: 2022
Fabrizio Campelli became a member of our Management Board on November 1, 2019. He was our Chief Transformation Officer and the Management Board member responsible for Transformation and Human Resources until April 2021. Since May 2021, Mr. Campelli is responsible for the Corporate Bank and the Investment Bank and since August 2021 also for UK Ireland.
He previously spent four years as the Global Head of Deutsche Bank Wealth Management. Before that, he was Head of Strategy Organizational Development as well as Deputy Chief Operating Officer for Deutsche Bank Group.
He joined Deutsche Bank in 2004 after working at McKinsey Company in the firm’s London and Milan offices, focusing on strategic assignments mainly for global financial institutions.
He
holds an MBA from MIT Sloan School of Management and a Business Administration degree from Bocconi University in Milan.
|
365
|
|
|
Deutsche Bank
|
Additional Notes
|
|
|
Annual Report 2021
|
|
|
|
|
|
Mr. Campelli has been a member of the following Supervisory Boards: BVV Versicherungsverein des Bankgewerbes a.G. and BVV Versorgungskasse des Bankgewerbes e.V.
Bernd Leukert
Year of birth: 1967
First appointed: 2020
Term expires: 2022
Bernd Leukert became a member of our Management Board on January 1, 2020. He is our Chief Technology, Data and Innovation Officer and is responsible for the Chief Information Offices for the Infrastructure areas and the business divisions, Chief Technology Office and the Chief Security Office. He has also been responsible for Data Governance and Oversight and Trade Settlement since May, 2021, as well as for Cloud and Innovation since August 2021.
He joined Deutsche Bank on September 1, 2019. He previously worked for many years at SAP SE, the global software company. From 2014 to 2019, he was responsible for product development and innovations as well as the Digital Business Services division on the Executive Board. He joined SAP in 1994 and held various management positions.
Mr. Leukert studied Industrial Engineering and Management at the University of Karlsruhe and at Trinity College Dublin, graduating in 1994 with a Master’s Degree in Business Administration.
He is member of the Supervisory Board of Bertelsmann SE Co. KGaA.
He is a member of the Supervisory Board of DWS Group GmbH Co. KGaA.
Stuart Lewis
Year of birth: 1965
First appointed: 2012
Term expires: 2023
Stuart Lewis became a member of our Management Board on June 1, 2012. He is our Chief Risk Officer responsible for the functions managing Credit Risk, Non-Financial Risk, Market Risk and Liquidity Risk as well as for the Risk-Infrastructure units. He was responsible for Compliance, Anti-Financial Crime (AFC) and the Business Selection and Conflicts Office until April 2021 and for the United Kingdom Ireland region until July 2021.
He joined Deutsche Bank in 1996. Prior to assuming his current role, Mr. Lewis was Deputy Chief Risk Officer and subsequently Chief Risk Officer of the Corporate Investment Bank from 2010 to 2012. Between 2006 and 2010 he was Chief Credit Officer.
Before joining Deutsche Bank in 1996, he worked at Credit Suisse and Continental Illinois National Bank in London.
He studied at the University of Dundee, where he obtained an LLB (Hons), and he holds an LLM from the London School of Economics. He also attended the College of Law, Guildford.
Mr. Lewis does not have any external directorships subject to disclosure.
He has held the position of Visiting Professor in Practice in the Finance Department at the London School of Economics since 2017.
James von Moltke
Year of birth: 1969
First appointed: 2017
Term expires: 2023
James von Moltke became a member of our Management Board on July 1, 2017. He is our Chief Financial Officer and in this function he is responsible for, among other things, Finance, Group Tax, Treasury and Investor Relations.
Before Mr. von Moltke joined Deutsche Bank he served as Treasurer of Citigroup. He started his career at Credit Suisse First Boston in London in 1992. In 1995, he joined J.P. Morgan, working at the bank for 10 years in New York and Hong Kong. After next working at Morgan Stanley in New York for four years, where he led the Financial Technology advisory team globally, Mr. von Moltke joined Citigroup as Head of Corporate MA in 2009 and three years later became the Global Head of Financial Planning.
He holds a Bachelor of Arts degree from New College, University of Oxford.
|
366
|
|
|
Deutsche Bank
|
Additional Notes
|
|
|
Annual Report 2021
|
|
|
|
|
|
Mr. von Moltke does not have any external directorships subject to disclosure.
Alexander von zur Mühlen
Year of birth: 1975
First appointed: 2020
Term expires: 2023
Alexander von zur Mühlen became a member of our Management Board on August 1, 2020. He is our Regional CEO Asia Pacific.
Mr. von zur Mühlen joined Deutsche Bank in 1998 and over the years has held a range of management roles in London and Frankfurt across infrastructure and business divisions. From 2018 to 2020 he was responsible for the Group’s strategic development and was the advisor to the Chief Executive Officer (CEO). Before that, he served as Co-Head of Global Capital Markets, with a regional focus on Asia Pacific and EMEA. From 2009 to 2017, he was Group Treasurer.
Alexander von zur Mühlen holds a Diploma in Business Administration from the Berlin School of Economics and Law in Berlin.
Mr. von zur Mühlen does not have any external directorships subject to disclosure.
Christiana Riley
Year of birth: 1978
First appointed: 2020
Term expires: 2022
Christiana Riley became a member of our Management Board on January 1, 2020. She is our Regional CEO Americas.
Mrs. Riley joined Deutsche Bank in 2006 where she was recently the Chief Financial Officer of the Corporate Investment Bank. She previously spent nine years in Group Strategy Planning, which she lead from 2011 to 2015. Prior to this Mrs. Riley worked at the management consultancy McKinsey Company and at the investment bank Greenhill Co.
She graduated cum laude in 2000 from Princeton University in America where she studied Romance Languages, Literature and Linguistics. She also studied at London Business School in the UK, where she gained a Master of Business Administration in 2005.
Mrs. Riley is a member of the Supervisory Board of The Clearing House Payments Company LLC.
She is Chief Executive Officer of DB USA Corporation.
Rebecca Short
Year of birth: 1974
First appointed: 2021
Term expires: 2024
Rebecca Short became a member of our Management Board on May 1, 2021. She is our Chief Transformation Officer and the Management Board member responsible for Transformation, Global Procurement and the Capital Release Unit.
She previously spent almost six years within Finance as Head of Group Planning Performance Management.
She joined Deutsche Bank on its graduate programme in Auckland in 1998. She moved to London in 2000 with Credit Risk Management where she spent 12 years, formerly as European Head of Corporates. She then set up a new Risk-wide team, Strategic Risk Analysis Reporting, in 2012 before moving to a senior central management role in Audit in 2013 where she spent two years.
She has a BCom (Honours) degree in Finance Accounting from the University of Otago, Dunedin, New Zealand.
Mrs. Short does not have any external directorships subject to disclosure.
Professor Dr. Stefan Simon
Year of birth: 1969
First appointed: 2020
Term expires: 2023
|
367
|
|
|
Deutsche Bank
|
Additional Notes
|
|
|
Annual Report 2021
|
|
|
|
|
|
Professor Dr. Stefan Simon became a member of our Management Board on August 1, 2020. He is our Chief Administrative Officer (CAO) and is responsible for Government and Regulatory Affairs as well as for Legal and Governance. Additionally, since May 2021 he has been responsible for Compliance, Anti-Financial-Crime (AFC) and the Business Selection and Conflicts Office, as well as for Controls Testing Assurance since August 2021.
Professor Dr. Simon joined Deutsche Bank on August 1, 2019. He was a member of Deutsche Bank’s Supervisory Board from August 2016 until July 2019 and was Chairman of its Integrity Committee. He is a lawyer and tax consultant and between 1997 and 2016 worked at the law firm Flick Gocke Schaumburg, where he became a partner in 2002. Since 2008 he has also been an Honorary Professor at the University of Cologne.
He studied law at the University of Cologne and received his doctorate there in 1998.
Professor Dr. Simon is Chairman of the Advisory Council of Leop. Krawinkel GmbH Co. KG.
|
368
|
|
|
Deutsche Bank
|
Additional Notes
|
|
|
Annual Report 2021
|
|
|
|
|
|
Supervisory Board
The Supervisory Board of Deutsche Bank AG appoints, supervises and advises the Management Board and is directly involved in decisions of fundamental importance to the bank. It works together closely with the Management Board in a cooperative relationship of trust and for the benefit of the company.
The internal organization of the Supervisory Board and its committees as well as the tasks and profiles of the individual members are subject to specific statutory and regulatory requirements that further specify and supplement the corporate-law regulations concerning corporate governance. Such requirements are founded on, among other things, the German Banking Act (Kreditwesengesetz), the Remuneration Ordinance for Institutions (Institutsvergütungsverordnung), the guidelines of the European Banking Authority (EBA) and European Securities and Markets Authority (ESMA) and the administrative practices of the European Central Bank as our supervisory authority. In individual cases, these diverge from the recommendations of the German Corporate Governance Code (“GCGC”).
The Supervisory Board’s tasks, meeting preparations and follow-ups, as well as general rules for the committees, are set out in Terms of Reference for the Supervisory Board. The current version is available on the Deutsche Bank website (www.db.com/ir/en/documents.htm). The number of meetings held during the financial year is specified in the Report of the Supervisory Board.
Together with the Management Board, the Supervisory Board arranges for a long-term succession planning: The Nomination Committee supports the Chairman’s Committee and the Supervisory Board in identifying candidates to fill a position on the bank’s Management Board. In doing so, the Committee prepares a position description with a candidate profile and states the expected time commitment. Suitable candidates are identified, in some cases in collaboration with external recruiting consultants, and structured interviews are conducted. Besides this external succession planning, the Management Board and Supervisory Board maintain a list of internal candidates. The Nomination Committee and the Supervisory Board regularly receive reports from the Management Board on the internal succession planning and the process from the perspective of the Management Board. For the selection of suitable candidates, external and internal, the Nomination Committee takes into account the balance and diversity of the knowledge, skills and experience of all members of the Management Board. It also seeks to foster diversity on the Management Board, for example, with regard to gender, nationality and age. Building
on the work of the Nomination Committee, the Chairman’s Committee submits a recommendation for the Supervisory Board’s resolution. Based on this, the Supervisory Board decides on the appointment of Management Board members. Besides proposals for the appointment of members of the Management Board, the Chairman’s Committee also submits proposals for the dismissal of Management Board members. The decision on such dismissal is the Supervisory Board’s responsibility.
Based on proposals of the Compensation Control Committee, the Supervisory Board determines the total compensation of the individual members of the Management Board, resolves on the compensation system for the Management Board and reviews it regularly.
The Supervisory Board receives reports from the Management Board at least within the scope prescribed by law or administrative guidelines, in particular on all issues of relevance for the Group concerning strategy, intended business policy, planning, business development, risk situation, risk management, staff development, reputation and compliance. Furthermore, Group Audit informs the Audit Committee of any deficiencies identified regularly, and in the case of severe deficiencies without undue delay. The Chairman of the Supervisory Board is informed accordingly of any serious findings relating to the members of the Management Board. The Supervisory Board and Management Board adopted an Information Regime, which specifies not only the reporting to the Supervisory Board, but also, among other things the Supervisory Board’s enquiries and requests for information from employees of the company as well as the exchange of information in connection with preparations for the meetings and between the meetings.
The Chairman of the Supervisory Board plays a crucial role in the proper functioning of the Supervisory Board and has a leadership role in this. He can issue internal guidelines and principles concerning the Supervisory Board’s internal organization and communications, the coordination of the work within the Supervisory Board and the Supervisory Board’s interaction with the Management Board. Between meetings, the Chairman of the Supervisory Board, and, to the extent expedient, the chairpersons of the Supervisory Board committees, maintain regular contact with the members of the Management Board, especially with the Chairperson of the Management Board, and deliberate with them, among other things, on issues of Deutsche Bank Group’s strategy, planning, the development of its business, risk situation, risk management, risk controlling, governance, compliance, compensation systems, IT, data and digitalization as well as material litigation cases. The Chairman of the Supervisory Board and – within their respective functional responsibility – the chairpersons of the Supervisory Board committees are informed without delay by the Chairman of the Management Board or by the respectively responsible Management Board member about important events of material significance for the assessment of the situation, development and management of Deutsche Bank Group. The Chairman of the Supervisory Board engages in discussions with investors on Supervisory Board-related topics when necessary and regularly informs the Supervisory Board of the substance of such discussions.
|
369
|
|
|
Deutsche Bank
|
Additional Notes
|
|
|
Annual Report 2021
|
|
|
|
|
|
The types of business that require the approval of the Supervisory Board to be transacted are specified in the Article of Association of Deutsche Bank AG. The Supervisory Board meets regularly without the Management Board. After due consideration and insofar as materially appropriate, the Supervisory Board, or any of its committees, may, in order to perform their tasks, consult auditors, legal advisors and other internal or external advisors. In performing their tasks, the Chairman of the Supervisory Board, the chairpersons of the committees and the Supervisory Board members are supported by the Office of the Supervisory Board, which is independent of the Management Board.
The Nomination Committee and Supervisory Board addressed the assessment prescribed by law of the Supervisory Board pursuant to Section 25d of the German Banking Act (KWG), which is also the self-assessment of the Supervisory Board pursuant to Section D.13 of the German Corporate Governance Code (GCGC) at several meetings. The concrete implementation of and the schedule for the assessment were deliberated on and set out at the meetings of the Nomination Committee on September 16, 2021 and October 25, 2021. Services of an external advisor were not mandated in this context. The assessment was performed essentially on the basis of extensive questionnaires regarding the work of the Supervisory Board, of the Supervisory Board committees and of the Management Board, individual interviews conducted by members of the Nomination Committee with the members of the Management Board, and an assessment of the individual members of both the Management Board and Supervisory Board. The final discussion of the assessment took place at the Supervisory Board meeting in plenum on February 2, 2022, and the results were set out in a final report. The Supervisory Board continues to hold the opinion that the Supervisory Board and Management Board have achieved a high standard and that there are no reservations, in particular, regarding the professional qualifications, personal reliability and time availability of the members of the Management Board and of the Supervisory Board.
|
370
|
|
|
Deutsche Bank
|
Additional Notes
|
|
|
Annual Report 2021
|
|
|
|
|
|
Members of the Supervisory Board
The Supervisory Board has 20 members. In accordance with the German Co-Determination Act (Mitbestimmungsgesetz), it comprises an equal number of shareholder representatives and employee representatives.
In accordance with the Articles of Association, the members of the Supervisory Board are elected for the period until the conclusion of the General Meeting which adopts the resolutions concerning the ratification of the acts of management for the fourth financial year following the beginning of the term of office. For the election of shareholder representatives, the General Meeting may establish that the terms of office of individual members may begin or end on differing dates. In accordance with the Terms of Reference for the Supervisory Board since July 2020, shareholder representatives are proposed to the General Meeting for election for a maximum of approximately four years, i.e. until the conclusion of the General Meeting which adopts the resolutions concerning the ratification of the acts of management for the third financial year following the beginning of the term of office, whereby the financial year in which the term of office begins is not taken into account.
The following table shows information on the current members of our Supervisory Board.
|
371
|
|
|
Deutsche Bank
|
Additional Notes
|
|
|
Annual Report 2021
|
|
|
|
|
|
|
Member
|
Principal occupation
|
Supervisory board memberships and other directorships
|
|
Dr. Paul Achleitner
Year of birth: 1956
First elected: May 31, 2012
Term expires: 2022
|
Chairman of the Supervisory Board,
Deutsche Bank AG
|
Bayer AG; Henkel AG Co. KGaA (member of the Shareholders’ Committee)
|
|
Ludwig Blomeyer-Bartenstein*
Year of birth: 1957
First elected: May 24, 2018
Term expires: 2023
|
Spokesman of the Management Bremen, Deutsche Bank AG
|
Frowein Co. Beteiligungs AG; Bürgschaftsbank Bremen GmbH (Member of the Board of Directors)
|
|
Mayree Clark
Year of birth: 1957
First elected: May 24, 2018
Term expires: 2023
|
Supervisory Board member
|
Ally Financial, Inc. (Member of the Board of Directors), Allvue Systems Holdings, Inc. (Member of the Board of Directors) (since August 2021)
|
|
Jan Duscheck*
Year of birth: 1984
Appointed by the court: August 2, 2016
Term expires: 2023
|
Head of National Working Group Banking,
trade union ver.di (Vereinte Dienstleistungsgewerkschaft)
|
No memberships or directorships subject to disclosure
|
|
Dr. Gerhard Eschelbeck
Year of birth: 1965
First elected: May 18, 2017
Term expires: 2022
|
Chief Information Security Officer, Aurora Innovation, Inc.
|
Onapsis Inc. (Member of the Board of Directors); WootCloud Inc. (Member of the Board of Directors)
|
|
Sigmar Gabriel
Year of birth: 1959
Appointed by the court: March 11, 2020
Term expires: 2025
|
Former German Federal Government Minister
|
GP Günter Papenburg AG; Siemens Energy AG
|
|
Timo Heider*
Year of birth: 1975
First elected: May 23, 2013
Term expires: 2023
|
Staff Council member
|
BHW Bausparkasse AG (Deputy Chairman); PCC Services GmbH der Deutschen Bank (Deputy Chairman); Pensionskasse der BHW Bausparkasse AG VVaG (Deputy Chairman)
|
|
Martina Klee*
Year of birth: 1962
First elected: May 29, 2008
Term expires: 2023
|
Staff Council member
|
Sterbekasse für die Angestellten der Deutsche Bank-Gruppe VVaG
|
|
Henriette Mark*
Year of birth: 1957
First elected: June 10, 2003
Term expires: 2023
|
Staff Council member
|
No memberships or directorships subject to disclosure
|
|
Gabriele Platscher*
Year of birth: 1957
First elected: June 10, 2003
Term expires: 2023
|
Staff Council member
|
BVV Versicherungsverein des Bankgewerbes a.G.
(Deputy Chairperson);
BVV Versorgungskasse des Bankgewerbes e.V.
(Deputy Chairperson);
BVV Pensionsfonds des Bankgewerbes AG
(Deputy Chairperson)
|
|
Detlef Polaschek*
Year of birth: 1960
First elected: May 24, 2018
Term expires: 2023
|
Deputy Chairman of the Supervisory Board;Staff Council member
|
No memberships of directorships subject to disclosure
|
|
Bernd Rose*
Year of birth: 1967
First elected: May 23, 2013
Term expires: 2023
|
Staff Council member
|
Postbank Filialvertrieb AG; ver.di Vermögensverwaltungsgesellschaft m.b.H. (Deputy Chairman)
|
|
|
|
|
|
John Alexander Thain
Year of birth: 1955
First elected: May 24, 2018
Term expires: 2023
|
Supervisory Board member
|
Uber Technologies Inc. (Member of the Board of Directors); Aperture Investors LLC (Member of the Board of Directors); Pine Island Acquisition Corp. (Chairman of the Board of Directors) (since January 2021)
|
|
Michele Trogni
Year of birth: 1965
First elected: May 24, 2018
Term expires: 2023
|
Operating Partner Eldridge
|
SE2 LLC (Chairperson of the Board of Directors); Horizon Acquisition Corporation (Member of the Board of Directors) (until October 2021)
|
|
Dr. Dagmar Valcárcel
Year of birth: 1966
Appointed by the court: August 1, 2019
Term expires: 2025
|
Supervisory Board member
|
amedes Holding GmbH; Antin Infrastructure Partners S.A. (Member of the Board of Directors (since September 2021)
|
|
Stefan Viertel*
Year of birth: 1964
Succession as substitute member:
January 1, 2021**
Term expires: 2023
|
Staff Council member
|
No memberships or directorships subject to disclosure
|
|
Dr. Theodor Weimer
Year of birth: 1959
First elected: May 20, 2020
Term expires: 2025
|
Chief Executive Officer, Deutsche Börse AG
|
Knorr Bremse AG
|
|
Frank Werneke*
Year of birth: 1967
Appointed by the court: November 25, 2021
Term expires: 2023
|
Chairman of the trade union ver.di (Vereinte Dienstleistungsgewerkschaft
|
ZDF Enterprises GmbH; Member of the Television Council of the Zweites Deutsches Fernsehen (ZDF); ver.di Vermögensgesellschaft m.b.H.
|
|
Professor Dr. Norbert Winkeljohann
Year of birth: 1957
First elected: August 1, 2018
Term expires: 2023
|
Supervisory Board member
|
Bayer AG (Chairman); Heristo AG (Chairman) (until January 2021); Georgsmarienhütte Holding GmbH; Sievert AG (Chairman); Bohnenkamp AG (Chairman)
|
|
Frank Witter
Year of birth: 1959
First elected: May 27, 2021
Term expires: 2025
|
Supervisory Board member
|
Traton SE; Vfl Wolfsburg-Fußball GmbH (Chairman); NorthVolt AB (until July 2021); CGI Inc. (Member of the Board of Directors (since July 2021)
|
*Employees representatives.
** Mr. Viertel already was a member of the Supervisory Board from August 1, 2010 to May 23, 2013.
On November 19, 2021, the Nomination Committee of Deutsche Bank’s Supervisory Board announced that it recommends proposing Alexander Wynaendts for election to the Supervisory Board. From 2008 to 2020, he served as CEO of Aegon N.V., a leading European financial institution providing life insurance, pensions and asset management. The Supervisory Board followed this recommendation and intends to propose to shareholders at the Annual General Meeting on May 19, 2022 that Mr. Wynaendts be elected to the Supervisory Board. Subject to and following this election, the members of the Supervisory Board intend to elect him as Chairman.
|
372
|
|
|
Deutsche Bank
|
Additional Notes
|
|
|
Annual Report 2021
|
|
|
|
|
|
Objectives for the composition of the Supervisory Board, Profile of Requirements, diversity concept and status of implementation
The composition of the Supervisory Board should ensure the effective and qualified control of and advice for the Management Board of an internationally operating, broadly positioned bank. In this connection, its members as a whole must possess the knowledge, abilities and expert experience to properly complete its tasks, and the members in their entirety of the Supervisory Board and the Audit Committee must be familiar with the banking sector. Attention should be placed, in particular, on the integrity, personality, willingness to perform, professionalism and independence of the individuals proposed for election. Furthermore, the members must be able to devote sufficient time to performing their mandates. The objective is for the Supervisory Board as a whole to possess all of the knowledge and experience considered to be essential while taking into account the activities of Deutsche Bank Group, also with regard to the observance of the relevant bank supervisory regulations.
The suitability of each individual member to perform their mandate is assessed both internally and externally by the Nomination Committee and the Supervisory Board as well as by regulatory authorities, determined and monitored continuously. The suitability assessment covers the expertise, reliability and time available of the individual members. In addition, there is an assessment of the knowledge, skills and experience of the Supervisory Board in its entirety that are necessary for it to perform its control function (collective suitability). Passing the suitability assessment and the continual suitability of the Supervisory Board member during the entire mandate with Deutsche Bank AG are mandatory regulatory prerequisites for the performance of his or her work.
As set out in the Profile of Requirements for the Supervisory Board, each Supervisory Board member must have an understanding of the fields of expertise specified below that is appropriate for the size and complexity of Deutsche Bank AG. The Profile of Requirements was last discussed and subsequently adopted at the meeting of the Supervisory Board on December 16, 2021 with an expansion in the fields of expertise to include Environmental, Social and Governance (ESG) and Anti-Money Laundering and the prevention of terrorist financing. Experts shall have profound expertise in the individual fields.
The fields of expertise include, in particular, the fields listed below:
- – Knowledge in the areas of banking, financial services, financial markets and the financial industry, including the home market and the bank’s key markets outside Europe
- – Knowledge of the relevant clients for the bank, the market expectations and the operational environment
- – Risk management (investigation, assessment, mitigation, management and control of financial and non-financial risks, capital and liquidity management, shareholdings)
- – Accounting (according to International Financial Reporting Standards (IFRS) and the German Commercial Code (HGB)) and audits of annual financial statements (financial expert)
- – Environmental, Social and Governance (ESG) as well as Corporate and Social Responsibility (CSR), including reporting
- – Taxation
- – Internal audit
- – Compliance and internal controls
- – Anti-Money Laundering and prevention of terrorist financing
- – Strategic planning, business and risk strategies as well as their implementation
- – Digitalization
- – Information technology (IT), IT systems and IT security
- – Regulatory framework and legal requirements, in particular, knowledge of the legal systems relevant for the bank
- – Knowledge of the social, political and regulatory expectations in the home market
- – Selection procedure for management body members and assessment of their suitability
- – Governance and corporate culture
- – Human resources and staff management
- – Compensation and compensation systems (compensation expert)
- – Management of a large, international regulated company
- – Internal organization of the bank
The Supervisory Board believes that it complies with the specified concrete objectives regarding its composition and the Profile of Requirements. The members of the Supervisory Board as a whole possess the knowledge, ability and expert experience to properly complete their tasks.
The Supervisory Board shall be composed such that the number of independent members among the shareholder representatives will be at least six. The following shareholder representatives are independent: Dr. Paul Achleitner, Ms. Mayree Clark, Dr. Gerhard Eschelbeck, Mr. Sigmar Gabriel, Mr. John Alexander Thain, Ms. Michele Trogni, Dr. Dagmar Valcárcel, Dr. Theodor Weimer, Professor Dr. Norbert Winkeljohann and Mr. Frank Witter. In the preceding financial year, there were no former members of the Management Board on the Supervisory Board.
|
373
|
|
|
Deutsche Bank
|
Additional Notes
|
|
|
Annual Report 2021
|
|
|
|
|
|
There is a regular maximum age limit of 70. In well-founded, individual cases, a Supervisory Board member may be elected or appointed for a period that extends at the latest until the end of the fourth Annual General Meeting that takes place after he or she has reached the age of 70. This age limit was taken into account in the election proposals to the General Meeting and shall also be taken into account for the next Supervisory Board elections or subsequent appointments for Supervisory Board positions that become vacant.
For members of the Supervisory Board elected or appointed after July 2020, the length of each individual Supervisory Board membership shall not, as a rule, exceed 12 years. Otherwise, the Supervisory Board member on the shareholder representatives’ side will not be considered independent.
The Supervisory Board respects diversity when proposing members for appointment. In light of the international operations of Deutsche Bank, care should be taken that the Supervisory Board has an appropriate number of members with long-term international experience. Currently, the professional careers or private lives of five members of the Supervisory Board are centered outside Germany. Furthermore, all of the shareholder representatives on the Supervisory Board have many years of international experience from their current or former activities, for example, as management board members or chief executive officers or in a comparable executive function of corporations or organizations with international operations. In these two ways, the Supervisory Board believes the international activities of the company are sufficiently taken into account. The objective is to retain the currently existing international profile.
Special importance has already been attached to an appropriate consideration of women in the selection process since the Supervisory Board elections in 2008. For the election proposals to the General Meeting, the Supervisory Board takes into account the recommendations of the Nomination Committee and the legal requirements according to which the Supervisory Board shall be composed of at least 30 % women and at least 30 % men. In reviewing potential candidates for a new election or subsequent appointments to Supervisory Board positions that have become vacant, qualified women are included in the selection process and appropriately considered in the election proposals. At the end of the financial year, three women and seven men were members of the Supervisory Board on both the employee representatives’ side and shareholder representatives’ side. The statutory minimum quota of 30% has thus been fulfilled for many years now.
The age structure is diverse, ranging from 38 to 66 years of age at the end of the financial year and spanning three generations, according to the general definition of the term. The length of membership on the Supervisory Board of Deutsche Bank ranged from under one year to around 19 years at the end of the financial year.
The diverse range of the members’ educational and professional backgrounds includes banking, business administration, economics, law, German studies, political science and information technology. The resumes of the members of the Supervisory Board are published on Deutsche Bank’s website (www.db.com/ir/en/supervisory-board.htm).
The members of the Supervisory Board may not exercise functions on a management body of, or perform advisory duties at, major competitors. Material conflicts of interest involving a member of the Supervisory Board that are not merely temporary shall result in the termination of that member’s Supervisory Board mandate. Members of the Supervisory Board may not hold more than the allowed number of supervisory board mandates according to Section 25d of the German Banking Act (KWG) or mandates in supervisory bodies of companies which have similar requirements. These requirements were met in the preceding financial year.
Some members of the Supervisory Board are, or were last year, in high-ranking positions at other companies that Deutsche Bank has business relations with. Business transactions with these companies are conducted under the same conditions as those between unrelated third parties. These transactions, in our opinion, do not affect the independence of the Supervisory Board members involved.
|
374
|
|
|
Deutsche Bank
|
Additional Notes
|
|
|
Annual Report 2021
|
|
|
|
|
|
Standing Committees
The Supervisory Board has established the following eight standing committees: Chairman’s Committee, Nomination Committee, Audit Committee, Risk Committee, Integrity Committee, Compensation Control Committee, Strategy Committee and Technology, Data and Innovation Committee. To the extent required, the committees coordinate their work and consult each other on an ad hoc basis. The committee chairpersons report regularly to the Supervisory Board on the work of the committees. The Report of the Supervisory Board provides information on the concrete work of the committees over the preceding year. Please see below details relating to DB’s Audit Committee and Compensation Control Committee, including the names of committee members and a summary of the terms of reference under which the committee operates.
Audit Committee
: It supports the Supervisory Board in particular in monitoring the financial reporting process, and it can submit recommendations or suggestions to the Supervisory Board on ensuring the integrity of the financial reporting process. Furthermore, the Audit Committee supports the Supervisory Board in monitoring the effectiveness of the risk management system, particularly of the internal control system and the internal audit system, the auditing of the financial statements, especially with regard to the auditor’s independence and the additional services provided by the auditor, and the Management Board’s prompt remediation – through suitable measures – of the deficiencies identified by the auditor and bank-internal control functions based on internal and external audits, in particular relating to weaknesses in risk controls, as well as non-compliance with policies, laws and regulatory requirements. The Committee is entitled to inspect all business documentation of the bank, including the business information stored on data carriers. The Audit Committee pre-reviews the annual and consolidated financial statements and management reports as well as the separate non-financial report and the separate consolidated non-financial report, if they were prepared. It discusses the audit reports with the auditor and prepares the decisions of the Supervisory Board on establishing the annual financial statements and the approval of the consolidated financial statements as well as the resolution proposal on the appropriation of distributable profit. The Audit Committee submits corresponding recommendations to the Supervisory Board. It also provides support to the Supervisory Board with regard to engaging any external assurances for the non-financial statement and the consolidated non-financial statement or for the separate non-financial report and separate consolidated non-financial report. It discusses important changes to the audit and accounting methods. The Audit Committee also discusses the quarterly financial statements and the report on the limited review of the quarterly financial statements with the Management Board and the auditor prior to their publication. Furthermore, the Audit Committee submits proposals to the Supervisory Board for the appointment of the auditor and prepares the proposal of the Supervisory Board to the General Meeting for the election of the auditor. The Audit Committee advises the Supervisory Board on issuing the audit mandate to the auditor elected by the General Meeting, submits proposals to the Supervisory Board for the auditor’s remuneration and can specify areas of focus for the audit. It supports the Supervisory Board in monitoring the independence, qualifications and efficiency of the auditor as well as the rotation of the members of the audit team. It monitors and assesses the quality of the audit. Mandates for non-audit-related services given to the auditor or to companies to which the auditor is related in legal, economic or personnel terms need the prior consent of the Audit Committee (in this context, see also the Principal Accountant Fees and Services section in this Corporate Governance Statement/Corporate Governance Report). The Audit Committee issues guidelines for the employment of staff – including former staff – of the auditor by the company. It arranges to be informed regularly about the work done by Group Audit, the effectiveness of the internal audit system and in particular about its annual audit plan the focal areas of its auditing activity and on the results of its audits. The Audit Committee is responsible, in particular, for receiving and handling the quarterly, annual and ad hoc reports of Group Audit. The Management Board informs the Audit Committee about special audits, substantial complaints and other exceptional measures on the part of German and foreign bank regulatory authorities. The Committee regularly obtains reports on the receipt and handling of complaints from employees of the bank and its subsidiaries, from shareholders of Deutsche Bank AG and from third parties. In particular complaints concerning accounting, internal accounting controls, auditing and other financial reporting matters must be submitted to the Committee without undue delay. Reports concerning compliance matters and the prevention of money laundering are presented at the meetings of the Committee on a regular basis. The Chairman of the Audit Committee is entitled, in addition to the Chairman of the Supervisory Board, to obtain information directly from the Head of Compliance and the Anti-Money Laundering Officer. The Audit Committee is responsible for acknowledging communications about significant reductions in the budgets of Group Audit as well as the Compliance and Anti-Financial Crime infrastructure areas and for taking receipt of and handling the Compliance Report by the Head of Compliance as well as the Anti-Money Laundering Officer’s Report, which are issued at least once a year. Furthermore, every member of the Committee is entitled to obtain, through its Chairperson, information directly from the heads of the bank’s departments that are responsible for the tasks that involve the Audit Committee. The Management Board must be informed without undue delay when information is obtained. With the prior consent of the Management Board, the Committee may obtain information in connection with its tasks from other senior executives of the bank who report directly to the Management Board. The Committee Chairperson is to inform all Committee members of the information obtained.
The current members of the Audit Committee are Professor Dr. Norbert Winkeljohann (Chairman), Dr. Paul Achleitner, Henriette Mark, Gabriele Platscher, Detlef Polaschek, Bernd Rose, Dr. Dagmar Valcárcel, Stefan Viertel, Dr. Theodor Weimer and Frank Witter.
|
375
|
|
|
Deutsche Bank
|
Additional Notes
|
|
|
Annual Report 2021
|
|
|
|
|
|
Compensation Control Committee
: It supports the Supervisory Board in the appropriate structuring of the compensation systems for the members of the Management Board. It also monitors the appropriate structure of the compensation systems for the Management Board members and employees and, in particular, the appropriate structure of the compensation for the Head of the compliance function, for the Anti-Money Laundering Officer and for the employees who have a material influence on the bank's overall risk profile. The Compensation Control Committee supports the Supervisory Board in monitoring the process to identify Group risk takers in accordance with Section 27 (2) sentence 1 of the Remuneration Ordinance for Institutions (InstitutsVergV) as well as the appropriate structure of the compensation systems for the company’s employees. It monitors if the compensation systems of employees in control functions are in accordance with InstitutsVergV requirements.The Committee assesses the effects of the compensation systems on risk, capital and liquidity management, while ensuring that the compensation systems are aligned to the business strategy focused on the banks sustainable development, to the risk strategies derived from this and to the compensation strategies at the company and Group levels. It prepares the Supervisory Board’s resolutions on the compensation of the Management Board, considering, in particular, the effects of the resolutions on the company’s risks and risk management. The long-term interests of shareholders, investors and other stakeholders as well as the public interest are also taken into account. It also prepares the Supervisory Board's resolutions on setting the total amount of variable compensation for the members of the Management Board in accordance with Section 45 (2) sentence 1 No. 5a of the German Banking Act (KWG) in consideration of Section 7 of the Remuneration Ordinance for Institutions (InstitutsVergV) and on setting the appropriate compensation parameters, targets for contributions to performance, payment and deferral periods as well as the conditions for a full forfeiture or partial reduction of variable compensation. It also checks regularly, at least annually, whether the adopted specifications are still appropriate. Furthermore, it checks, as part of its support to the Supervisory Board in monitoring the appropriate structure of the compensation systems for employees, regularly, but at least annually, in particular, whether the total amount of variable compensation has been set in accordance with Section 45 (2) sentence 1 No. 5a of the German Banking Act (KWG) in consideration of Section 7 of the Remuneration Ordinance for Institutions (InstitutsVergV) and whether the specified principles to assess the compensation parameters, contributions to performance as well as the payment and deferral periods, including the conditions for a full forfeiture or partial reduction of the variable compensation, are appropriate. In addition, it supports the Supervisory Board in monitoring whether the internal controls and other relevant areas are properly involved in the structuring of the compensation systems. The Committee is authorized to obtain, via its Chairperson, information relating to the Committee tasks from the Head of Group Audit and from the heads of the organizational units responsible for structuring the compensation systems. Furthermore the committee supports the Supervisory Board in producing the proposals for resolutions on the structuring of variable and fixed compensation in accordance with section 25a (5) sentence 6 KWG.
The current members of the Compensation Control Committee are Dr. Paul Achleitner (Chairman), Dr. Gerhard Eschelbeck, Detlef Polaschek, Bernd Rose, Dr. Dagmar Valcárcel and Frank Werneke.
Please see below the members of the remaining six committees. The tasks and further details of all standing committees are regulated in separate Terms of Reference. The current versions are available on the Deutsche Bank website (www.db.com/ir/en/documents.htm).
Chairman’s Committee
: Dr. Paul Achleitner (Chairman), Frank Bsirske (until September 26, 2021), Detlef Polaschek, Frank Werneke (since December 16, 2021), Professor Dr. Norbert Winkeljohann
Nomination Committee
: Mayree Clark, (Chairperson), Dr. Paul Achleitner, Frank Bsirske (until September 26, 2021), Detlef Polaschek, Gerd Alexander Schütz (until January 28, 2021), Frank Werneke (since December 16, 2021), Professor Dr. Norbert Winkeljohann (since February 3, 2021)
Risk Committee
: Mayree Clark (Chairperson), Dr. Paul Achleitner, Ludwig Blomeyer-Bartenstein, Jan Duscheck, Michele Trogni, Stefan Viertel, Professor Dr. Norbert Winkeljohann
Integrity Committee
: Dr. Dagmar Valcárcel (Chairperson), Dr. Paul Achleitner, Ludwig Blomeyer-Bartenstein, Sigmar Gabriel, Timo Heider, Gabriele Platscher
Strategy Committee
: John Alexander Thain (Chairman), Dr. Paul Achleitner, Frank Bsirske (until September 26, 2021), Mayree Clark, Timo Heider, Henriette Mark, Detlef Polaschek, Michele Trogni, Frank Werneke (since December 16, 2021)
Technology, Data and Innovation Committee
: Michele Trogni (Chairperson), Dr. Paul Achleitner, Jan Duscheck, Dr. Gerhard Eschelbeck, Timo Heider (since July 29, 2021), Martina Klee, Bernd Rose, Frank Witter (since July 29, 2021)
|
376
|
|
|
Deutsche Bank
|
Additional Notes
|
|
|
Annual Report 2021
|
|
|
|
|
|
Share Plans
For information on our employee share programs, please refer to the additional Note 33 “Employee Benefits” to the Consolidated Financial Statements.
|
377
|
|
|
Deutsche Bank
|
Additional Notes
|
|
|
Annual Report 2021
|
|
|
|
|
|
Reporting and Transparency
Directors’ Share Ownership
Management Board: For information on the share ownership of the Management Board, please refer to our detailed Compensation Report in the Management Report.
Supervisory Board: The members of our Supervisory Board held the following numbers of our shares and share awards under our employee share plans.
|
Members of the Supervisory Board
|
|
Number of
shares
|
|
Number of
share awards
|
|
Dr. Paul Achleitner
|
|
145,000
|
|
0
|
|
Ludwig Blomeyer-Bartenstein
|
|
4,631
|
|
2,739
1
|
|
Mayree Clark
|
|
109,444
|
|
0
|
|
Jan Duscheck
|
|
0
|
|
0
|
|
Dr. Gerhard Eschelbeck
|
|
0
|
|
0
|
|
Sigmar Gabriel
|
|
0
|
|
0
|
|
Timo Heider
|
|
0
|
|
0
|
|
Martina Klee
|
|
2,621
|
|
10
|
|
Henriette Mark
|
|
1,524
|
|
0
|
|
Gabriele Platscher
|
|
1,615
|
|
10
|
|
Detlef Polaschek
|
|
693
|
|
10
|
|
Bernd Rose
|
|
0
|
|
0
|
|
John Alexander Thain
|
|
100,000
|
|
0
|
|
Michele Trogni
|
|
15,000
|
|
0
|
|
Dr. Dagmar Valcárcel
|
|
0
|
|
0
|
|
Stefan Viertel
|
|
1,007
|
|
0
|
|
Dr. Theodor Weimer
|
|
108,000
|
|
0
|
|
Frank Werneke
|
|
0
|
|
0
|
|
Professor Dr. Norbert Winkeljohann
|
|
0
|
|
0
|
|
Frank Witter
|
|
0
|
|
0
|
|
Total
|
|
489,535
|
|
2,769
|
|
|
|
|
|
|
1
Restricted Equity Awards. Mr. Blomeyer-Bartenstein has an entitlement linked to 2,739 shares through Restricted Equity Awards as part of his variable compensation. These are due in 2022 till 2026.
The members of the Supervisory Board held 489,535 shares, amounting to less than 0.02 % of our shares as of this Corporate Governance Statement.
As listed in the “Number of share awards” column in the table, the members who are employees of Deutsche Bank hold matching awards granted under the Global Share Purchase Plan, which are scheduled to be delivered to them on November 1, 2022, as well as Restricted Equity Awards (deferred share awards), which are granted to employees with deferred variable compensation. The latter are marked separately in the table, and the further details concerning them as a compensation instrument are reported in the section “Employee Compensation Report”.
As described in the “Management Report: Compensation Report: Compensation System for Supervisory Board Members”, 25 % of each member’s compensation for services as a member of the Supervisory Board for a given prior year is, rather than being paid in cash, converted into notional shares of Deutsche Bank AG in February of the following year. The cash value of the notional shares is paid to the member in February of the year following their departure from the Supervisory Board or the expiration of their term of office, based on the market price of the Deutsche Bank share near the payment date.
Related Party Transactions
For information on related party transactions please refer to Note 36 “Related Party Transactions“.
|
378
|
|
|
Deutsche Bank
|
Additional Notes
|
|
|
Annual Report 2021
|
|
|
|
|
|
Auditing and Controlling
Audit Committee Financial Expert
The Supervisory Board determined that the following members of the Audit Committee are “Audit Committee Financial Experts”, as such term is defined by the implementation rules of the U.S. Securities and Exchange Commission issued pursuant to Section 407 of the Sarbanes-Oxley Act of 2002: Dr. Paul Achleitner, Dr. Dagmar Valcárcel, Dr. Theodor Weimer, Professor Dr. Norbert Winkeljohann and Frank Witter. These audit committee financial experts are “independent” of the bank, as defined in Rule 10A-3 under the U.S. Securities Exchange Act of 1934. In accordance with the provisions of Sections 107 (4) and 100 (5) of the German Stock Corporation Act (AktG) as well as Section 25d (9) of the German Banking Act (KWG), they have the required expert knowledge in financial accounting and auditing.
Compensation Control Committee Compensation Expert
Pursuant to Section 25d (12) of the German Banking Act (KWG), at least one member of the Compensation Control Committee must have sufficient expertise and professional experience in the field of risk management and risk controlling, in particular, with regard to the mechanisms to align compensation systems to the company’s overall risk appetite and strategy and the bank’s capital base. The Supervisory Board determined that Dr. Paul Achleitner, Chairman of the Compensation Control Committee, and Dr. Dagmar Valcárcel fulfill the requirements of Section 25d (12) of the German Banking Act (KWG) and therefore have the required expertise and professional experience in risk management and risk controlling as Compensation Control Committee Compensation Experts”..
Values and leadership principles of Deutsche Bank AG and Deutsche Bank Group
Deutsche Bank Group Code of Conduct and Code of Ethics for Senior Financial Officers
Deutsche Bank Group’s Code of Conduct sets out Deutsche Banks’s purpose, values and beliefs and minimum standards of conduct that we expect all members of our Management Board and employees to follow. These values and standards govern employee interactions with our clients, competitors, business partners, government and regulatory authorities, and shareholders, as well as with other employees. In addition, the Code forms the cornerstone of our policies, which provide guidance on compliance with applicable laws and regulations.
In accordance with Section 406 of the Sarbanes-Oxley Act of 2002, we adopted a Code of Ethics for Senior Financial Officers of Deutsche Bank AG and Deutsche Bank Group with special obligations that apply to our “Senior Financial Officers”, which currently consist of Deutsche Bank’s Chairman of the Management Board and the Chief Financial Officer as well as certain other Senior Financial Officers. There were no amendments or waivers to this Code of Ethics in 2021.
The current versions of the Code of Conduct as well as the Code of Ethics for Senior Financial Officers of Deutsche Bank AG and Deutsche Bank Group are available from Deutsche Bank’s website: www.db.com/ir/en/documents.htm.
|
379
|
|
|
Deutsche Bank
|
Additional Notes
|
|
|
Annual Report 2021
|
|
|
|
|
|
Corporate Governance at Deutsche Bank AG and Deutsche Bank Group
Deutsche Bank established a Group Governance function to define, implement and monitor the corporate governance framework of Deutsche Bank AG and Deutsche Bank Group and to perform this governance function throughout the Group. Group Governance addresses corporate governance issues in Deutsche Bank AG and Deutsche Bank Group, while focusing closely on clear organizational structures aligned to the key elements of good corporate governance.
Deutsche Bank AG and Deutsche Bank Group are committed to ensuring a corporate governance framework in accordance with international standards and statutory provisions. In support of this objective, Deutsche Bank AG and Deutsche Bank Group have instituted clear corporate governance principles.
Further details on corporate governance are published on Deutsche Bank’s website (www.db.com/ir/en/corporate-governance.htm).
Principal accountant fees and services
In accordance with German law, our principal accountant is appointed at our Annual General Meeting based on a recommendation of our Supervisory Board. The Audit Committee of our Supervisory Board prepares such a recommendation. Subsequent to the principal accountant’s appointment, the Audit Committee awards the contract and in its sole authority approves the terms and scope of the audit and all audit engagement fees as well as monitors the principal accountant’s independence. Ernst Young GmbH Wirtschaftsprüfungsgesellschaft („EY“) was our principal accountant for the 2020 and 2021 fiscal years, respectively.
The tables set forth below contain the aggregate fees billed for each of the last two fiscal years by EY in each of the following categories: (1) Audit fees, which are fees for professional services for the audit of our annual financial statements or services that are normally provided by the accountant in connection with statutory and regulatory filings or engagements for those fiscal years, (2) Audit-related fees, which are fees for assurance and related services that are reasonably related to the performance of the audit or review of our financial statements and are not reported as Audit fees, (3) Tax-related fees, which are fees for professional services rendered for tax compliance, tax consulting and tax planning, and (4) All other fees, which are fees for products and services other than Audit fees, Audit-related fees and Tax-related fees. These amounts include expenses and exclude Value Added Tax (VAT).
Fees billed by EY
|
Fee category in € m.
|
|
2021
|
|
2020
|
|
Audit fees
|
|
54
|
|
53
|
|
Audit-related fees
|
|
8
|
|
5
|
|
Tax-related fees
|
|
1
|
|
0
|
|
All other fees
|
|
1
|
|
0
|
|
Total fees
|
1
|
64
|
|
58
|
|
|
|
|
|
|
The Audit fees include fees for professional services for the audit of our annual financial statements and consolidated financial statements and do not include audit fees for DWS and its subsidiaries that are not audited by EY. The Audit-related fees include fees for other assurance services required by law or regulations, in particular for financial service specific attestation, for quarterly reviews, for spin-off audits and for merger audits, as well as fees for voluntary assurance services, like voluntary audits for internal management purposes and the issuance of comfort letters. Our Tax-related fees include fees for services relating to the preparation and review of tax returns and related compliance assistance and advice, tax consultation and advice relating to Group tax planning strategies and initiatives and assistance with assessing compliance with tax regulations.
Under SEC regulations, the principal accountant fees are required to be presented as follows: audit fees were € 56 million in 2021 compared to € 55 million in 2020, audit-related fees were € 6 million in 2021 compared to € 3 million in 2020, tax-related fees were € 1 million in 2021 compared to € 0 million in 2020, and all other fees were € 1 million in 2021 compared to € 0 million in 2020.
|
380
|
|
|
Deutsche Bank
|
Additional Notes
|
|
|
Annual Report 2021
|
|
|
|
|
|
United States law and regulations, and our own policies, generally require that all engagements of our principal accountant be pre-approved by our Audit Committee or pursuant to policies and procedures adopted by it. Our Audit Committee has adopted the following policies and procedures for consideration and approval of requests to engage our principal accountant to perform non-audit services. Engagement requests must in the first instance be submitted to the Accounting Engagement Team. If the request relates to services that would impair the independence of our principal accountant, the request must be rejected. Our Audit Committee has given its pre-approval for specified assurance, financial advisory and tax services, provided the expected fees for any such service do not exceed € 1 million. If the engagement request relates to such specified pre-approved services, it may be approved by the Accounting Engagement Team and must thereafter be reported to the Audit Committee. If the engagement request relates neither to prohibited non-audit services nor to pre-approved non-audit services, it must be forwarded to the Audit Committee for consideration. In addition, to facilitate the consideration of engagement requests between its meetings, the Audit Committee has delegated approval authority to several of its members who are “independent” as defined by the Securities and Exchange Commission and the New York Stock Exchange. Such members are required to report any approvals made by them to the Audit Committee at its next meeting.
Additionally, United States law and regulations permit the pre-approval requirement to be waived with respect to engagements for non-audit services aggregating to no more than five percent of the total amount of revenues we paid to our principal accountant, if such engagements were not recognized by us at the time of engagement and were promptly brought to the attention of our Audit Committee or a designated member thereof and approved prior to the completion of the audit. In 2020 and 2021, the percentage of the total amount of revenues we paid to our principal accountant for non-audit services that was subject to such a waiver was less than 5 % for each year.
|
381
|
|
|
Deutsche Bank
|
Additional Notes
|
|
|
Annual Report 2021
|
|
|
|
|
|
Compliance with the German Corporate Governance Code
[Page intentionally left blank for SEC filing purposes]
|
382
|
|
|
Deutsche Bank
|
Additional Notes
|
|
|
Annual Report 2021
|
|
|
|
|
|
Declaration pursuant to Section 161 German Stock Corporation Act (AktG) (Declaration of Conformity 2021)
[Page intentionally left blank for SEC filing purposes]
|
383
|
|
|
Deutsche Bank
|
Additional Notes
|
|
|
Annual Report 2021
|
|
|
|
|
|
[Page intentionally left blank for SEC filing purposes]
|
384
|
|
|
Deutsche Bank
|
Additional Notes
|
|
|
Annual Report 2021
|
|
|
|
|
|
[Page intentionally left blank for SEC filing purposes]
|
385
|
|
|
Deutsche Bank
|
Additional Notes
|
|
|
Annual Report 2021
|
|
|
|
|
|
5-
Supplementary Information (Unaudited)
| 403 | Non-GAAP Financial Measures |
| 414 | Declaration of Backing |
| 415 | Group Five-Year Record |
| 416 | Imprint / Publications |
|
386
|
|
|
Deutsche Bank
|
Additional Notes
|
|
|
Annual Report 2021
|
|
|
|
|
|
Non-GAAP Financial Measures
This document and other documents the Group has published or may publish contain non-GAAP financial measures. Non-GAAP financial measures are measures of the Group’s historical or future performance, financial position or cash flows that contain adjustments that exclude or include amounts that are included or excluded, as the case may be, from the most directly comparable measure calculated and presented in accordance with IFRS in the Group’s financial statements.
Return on Equity Ratios
The Group reports a post-tax return on average shareholders’ equity and a post-tax return on average tangible shareholders’ equity, each of which is a non-GAAP financial measure.
The post-tax returns on average shareholders’ equity and average tangible shareholders' equity are calculated as profit (loss) attributable to Deutsche Bank shareholders after AT1 coupon as a percentage of average shareholders’ equity and average tangible shareholders' equity, respectively.
Profit (loss) attributable to Deutsche Bank shareholders after AT1 coupon for the segments is a non-GAAP financial measure and is defined as profit (loss) excluding post-tax profit (loss) attributable to noncontrolling interests and after AT1 coupon, which are allocated to segments based on their allocated average tangible shareholders’ equity. For the Group, it reflects the reported effective tax rate, which was 26 % for the full year 2021, 39 % for 2020 and (100) % for 2019. For the segments, the applied tax rate was 28 % for all reported periods in 2021, 2020 and 2019.
At the Group level, tangible shareholders' equity is shareholders’ equity as reported in the Consolidated Balance Sheet excluding goodwill and other intangible assets. Tangible shareholders’ equity for the segments is calculated by deducting goodwill and other intangible assets from shareholders’ equity as allocated to the segments. Shareholders’ equity and tangible shareholders’ equity are presented on an average basis.
The Group believes that a presentation of average tangible shareholders’ equity makes comparisons to its competitors easier, and refers to this measure in the return on equity ratios presented by the Group. However, average tangible shareholders’ equity is not a measure provided for in IFRS, and the Group’s ratios based on this measure should not be compared to other companies’ ratios without considering differences in the calculations.
The reconciliation of the aforementioned ratios is set forth in the table below:
|
|
|
2021
|
||||||||||||
|
in € m.
(unless stated otherwise)
|
|
Corporate
Bank
|
|
Investment
Bank
|
|
Private
Bank
|
|
Asset
Management
|
|
Capital
Release Unit
|
|
Corporate
Other
|
|
Total
|
|
Profit (loss) before tax
|
|
1,000
|
|
3,715
|
|
366
|
|
816
|
|
(1,364)
|
|
(1,014)
|
|
3,518
|
|
Profit (loss)
|
|
720
|
|
2,675
|
|
263
|
|
587
|
|
(982)
|
|
(669)
|
|
2,595
|
|
Profit (loss) attributable to
noncontrolling interests
|
|
0
|
|
0
|
|
0
|
|
0
|
|
0
|
|
144
|
|
144
|
|
Profit (loss) attributable to DB
shareholders and additional
equity components
|
|
720
|
|
2,675
|
|
263
|
|
587
|
|
(982)
|
|
(813)
|
|
2,451
|
|
Profit (loss) attributable to additional equity components
|
|
81
|
|
195
|
|
97
|
|
16
|
|
37
|
|
0
|
|
426
|
|
Profit (loss) attributable to Deutsche Bank shareholders
|
|
639
|
|
2,480
|
|
167
|
|
571
|
|
(1,019)
|
|
(813)
|
|
2,025
|
|
|
|
|
|
|
|
|
|
|
|
|
|
|
|
|
|
Average allocated shareholders' equity
|
|
10,301
|
|
24,181
|
|
12,663
|
|
4,815
|
|
4,473
|
|
104
|
|
56,537
|
|
Deduct: Average allocated goodwill and other intangible assets
1
|
|
721
|
|
1,087
|
|
1,256
|
|
2,889
|
|
96
|
|
0
|
|
6,049
|
|
Average allocated tangible shareholders' equity
|
|
9,580
|
|
23,094
|
|
11,408
|
|
1,926
|
|
4,377
|
|
104
|
|
50,489
|
|
Post-tax return on average
shareholders’ equity
|
|
6.2 %
|
|
10.3 %
|
|
1.3 %
|
|
11.9 %
|
|
(22.8) %
|
|
N/M
|
|
3.6 %
|
|
Post-tax return on average
tangible shareholders’ equity
|
|
6.7 %
|
|
10.7 %
|
|
1.5 %
|
|
29.7 %
|
|
(23.3) %
|
|
N/M
|
|
4.0 %
|
|
|
|
|
|
|
|
|
|
|
|
|
|
|
|
|
1
Goodwill and other intangible assets related to the share of DWS that is not held by Deutsche Bank are excluded since the first quarter of 2018.
|
387
|
|
|
Deutsche Bank
|
Additional Notes
|
|
|
Annual Report 2021
|
|
|
|
|
|
|
|
|
2020
|
||||||||||||
|
in € m.
(unless stated otherwise)
|
|
Corporate
Bank
|
|
Investment
Bank
|
|
Private
Bank
|
|
Asset
Management
|
|
Capital
Release Unit
|
|
Corporate
Other
|
|
Total
|
|
Profit (loss) before tax
|
|
539
|
|
3,166
|
|
(99)
|
|
544
|
|
(2,200)
|
|
(947)
|
|
1,003
|
|
Profit (loss)
|
|
388
|
|
2,280
|
|
(71)
|
|
392
|
|
(1,584)
|
|
(792)
|
|
612
|
|
Profit (loss) attributable to
noncontrolling interests
|
|
0
|
|
0
|
|
0
|
|
0
|
|
0
|
|
129
|
|
129
|
|
Profit (loss) attributable to DB
shareholders and additional
equity components
|
|
388
|
|
2,280
|
|
(71)
|
|
392
|
|
(1,584)
|
|
(921)
|
|
483
|
|
Profit (loss) attributable to additional equity components
|
|
72
|
|
169
|
|
79
|
|
14
|
|
48
|
|
0
|
|
382
|
|
Profit (loss) attributable to Deutsche Bank shareholders
|
|
315
|
|
2,111
|
|
(151)
|
|
378
|
|
(1,632)
|
|
(921)
|
|
101
|
|
|
|
|
|
|
|
|
|
|
|
|
|
|
|
|
|
Average allocated shareholders' equity
|
|
9,945
|
|
22,911
|
|
11,553
|
|
4,757
|
|
6,166
|
|
(23)
|
|
55,308
|
|
Deduct: Average allocated goodwill and other intangible assets
1
|
|
603
|
|
1,133
|
|
1,255
|
|
2,993
|
|
142
|
|
(0)
|
|
6,127
|
|
Average allocated tangible shareholders' equity
|
|
9,341
|
|
21,777
|
|
10,298
|
|
1,764
|
|
6,024
|
|
(23)
|
|
49,182
|
|
Post-tax return on average
shareholders’ equity
|
|
3.2 %
|
|
9.2 %
|
|
(1.3) %
|
|
7.9 %
|
|
(26.5) %
|
|
N/M
|
|
0.2 %
|
|
Post-tax return on average
tangible shareholders’ equity
|
|
3.4 %
|
|
9.7 %
|
|
(1.5) %
|
|
21.4 %
|
|
(27.1) %
|
|
N/M
|
|
0.2 %
|
|
|
|
|
|
|
|
|
|
|
|
|
|
|
|
|
Prior year segmental information presented in the current structure
1
Goodwill and other intangible assets related to the share of DWS that is not held by Deutsche Bank are excluded since the first quarter of 2018.
|
|
|
2019
|
||||||||||||
|
in € m.
(unless stated otherwise)
|
|
Corporate
Bank
|
|
Investment
Bank
|
|
Private
Bank
|
|
Asset
Management
|
|
Capital
Release Unit
|
|
Corporate
Other
|
|
Total
|
|
Profit (loss) before tax
|
|
86
|
|
496
|
|
(263)
|
|
468
|
|
(3,170)
|
|
(251)
|
|
(2,634)
|
|
Profit (loss)
|
|
62
|
|
357
|
|
(189)
|
|
337
|
|
(2,283)
|
|
(3,549)
|
|
(5,265)
|
|
Profit (loss) attributable to
noncontrolling interests
|
|
0
|
|
0
|
|
0
|
|
0
|
|
0
|
|
125
|
|
125
|
|
Profit (loss) attributable to DB
shareholders and additional
equity components
|
|
62
|
|
357
|
|
(189)
|
|
337
|
|
(2,283)
|
|
(3,673)
|
|
(5,390)
|
|
Profit (loss) attributable to additional equity components
|
|
62
|
|
137
|
|
64
|
|
11
|
|
54
|
|
0
|
|
328
|
|
Profit (loss) attributable to Deutsche Bank shareholders
|
|
(0)
|
|
221
|
|
(253)
|
|
325
|
|
(2,337)
|
|
(3,673)
|
|
(5,718)
|
|
|
|
|
|
|
|
|
|
|
|
|
|
|
|
|
|
Average allocated shareholders' equity
|
|
10,340
|
|
21,736
|
|
11,663
|
|
4,865
|
|
7,253
|
|
4,314
|
|
60,170
|
|
Deduct: Average allocated goodwill and other intangible assets
1
|
|
491
|
|
1,277
|
|
1,318
|
|
3,050
|
|
117
|
|
1,274
|
|
7,528
|
|
Average allocated tangible shareholders' equity
|
|
9,849
|
|
20,458
|
|
10,345
|
|
1,815
|
|
7,136
|
|
3,039
|
|
52,643
|
|
Post-tax return on average
shareholders’ equity
|
|
(0.0) %
|
|
1.0 %
|
|
(2.2) %
|
|
6.7 %
|
|
(32.2) %
|
|
N/M
|
|
(9.5) %
|
|
Post-tax return on average
tangible shareholders’ equity
|
|
(0.0) %
|
|
1.1 %
|
|
(2.4) %
|
|
17.9 %
|
|
(32.8) %
|
|
N/M
|
|
(10.9) %
|
|
|
|
|
|
|
|
|
|
|
|
|
|
|
|
|
Prior year segmental information presented in the current structure
1
Goodwill and other intangible assets related to the share of DWS that is not held by Deutsche Bank are excluded since the first quarter of 2018.
|
388
|
|
|
Deutsche Bank
|
Additional Notes
|
|
|
Annual Report 2021
|
|
|
|
|
|
Adjusted post-tax return (Group)
The Group believes that a presentation of Adjusted post-tax return makes comparisons to its competitors easier.
|
in € m.
(unless stated otherwise)
|
|
2021
|
|
2020
|
|
2019
|
|
Profit (loss) attributable to Deutsche Bank shareholders
|
|
2,025
|
|
101
|
|
(5,718)
|
|
Specific revenue items
|
|
(73)
|
|
(30)
|
|
8
|
|
Transformation charges
|
|
1,003
|
|
490
|
|
1,145
|
|
Impairment of goodwill / other intangibles
|
|
5
|
|
0
|
|
1,037
|
|
Restructuring severance
|
|
470
|
|
688
|
|
805
|
|
Tax adjustments
|
|
(392)
|
|
(313)
|
|
2,000
|
|
of which: Tax effect of above adjustment items
1
|
|
(393)
|
|
(321)
|
|
(839)
|
|
of which: Adjustments for share based payment related effects
|
|
1
|
|
(29)
|
|
54
|
|
of which: Adjustments for DTA valuation adjustments
|
|
0
|
|
37
|
|
2,785
|
|
Adjusted profit (loss) attributable to Deutsche Bank shareholders
|
|
3,037
|
|
936
|
|
(723)
|
|
Average allocated tangible shareholders' equity
|
|
50,489
|
|
49,182
|
|
52,643
|
|
Adjusted post-tax return on average tangible shareholders’ equity
|
|
6.0 %
|
|
1.9 %
|
|
(1.4) %
|
|
|
|
|
|
|
|
|
Prior year segmental information presented in the current structure.
1
Pre-tax adjustments taxed at a rate of 28 %.
Core Bank
The Core Bank represents the Group excluding the Capital Release Unit (CRU)
The following table presents the results of the Core Bank
|
in € m.
(unless stated otherwise)
|
|
2021
|
|
2020
|
|
2019
|
|
Profit (loss) before tax
|
|
4,882
|
|
3,203
|
|
536
|
|
Profit (loss)
|
|
3,577
|
|
2,196
|
|
(2,982)
|
|
Profit (loss) attributable to noncontrolling interests
|
|
144
|
|
129
|
|
125
|
|
Profit (loss) attributable to Deutsche Bank shareholders and additional equity components
|
|
3,433
|
|
2,067
|
|
(3,107)
|
|
Profit (loss) attributable to additional equity components
|
|
388
|
|
334
|
|
274
|
|
Profit (loss) attributable to Deutsche Bank shareholders
|
|
3,044
|
|
1,733
|
|
(3,381)
|
|
|
|
|
|
|
|
|
|
Average allocated shareholders' equity
|
|
52,064
|
|
49,142
|
|
52,918
|
|
Deduct: Average allocated goodwill and other intangible assets
|
|
5,953
|
|
5,985
|
|
7,411
|
|
Average allocated tangible shareholders' equity
|
|
46,111
|
|
43,157
|
|
45,507
|
|
Post-tax return on average shareholders’ equity
|
|
5.8 %
|
|
3.5 %
|
|
(6.4) %
|
|
Post-tax return on average tangible shareholders’ equity
|
|
6.6 %
|
|
4.0 %
|
|
(7.4) %
|
|
|
|
|
|
|
|
|
Prior year segmental information presented in the current structure.
The following table presents a reconciliation of Adjusted profit (loss) before tax of the Core Bank
|
in € m.
(unless stated otherwise)
|
|
2021
|
|
2020
|
|
2019
|
|
Profit (loss) before tax - Group
|
|
3,518
|
|
1,003
|
|
(2,634)
|
|
Profit (loss) before tax - CRU
|
|
(1,364)
|
|
(2,200)
|
|
(3,170)
|
|
Profit (loss) before tax - Core Bank
|
|
4,882
|
|
3,203
|
|
536
|
|
Specific revenue items
|
|
(74)
|
|
(38)
|
|
(108)
|
|
Transformation charges
|
|
945
|
|
328
|
|
635
|
|
Impairment of goodwill / other intangibles
|
|
5
|
|
0
|
|
1,037
|
|
Restructuring severance
|
|
464
|
|
671
|
|
649
|
|
Adjusted profit (loss) before tax – Core Bank
|
|
6,221
|
|
4,164
|
|
2,749
|
|
|
|
|
|
|
|
|
Prior year segmental information presented in the current structure.
|
389
|
|
|
Deutsche Bank
|
Additional Notes
|
|
|
Annual Report 2021
|
|
|
|
|
|
Adjusted post-tax return (Core Bank)
The following table presents a reconciliation of adjusted post-tax return on average tangible shareholders’ equity of the Core Bank.
|
in € m.
(unless stated otherwise)
|
|
2021
|
|
2020
|
|
2019
|
|
Profit (loss) attributable to Deutsche Bank shareholders
|
|
3,044
|
|
1,733
|
|
(3,381)
|
|
Specific revenue items
|
|
(74)
|
|
(38)
|
|
(108)
|
|
Transformation charges
|
|
945
|
|
328
|
|
635
|
|
Impairment of goodwill / other intangibles
|
|
5
|
|
0
|
|
1,037
|
|
Restructuring severance
|
|
464
|
|
671
|
|
649
|
|
Tax adjustments
|
|
(374)
|
|
(261)
|
|
2,219
|
|
of which: Tax effect of above adjustment items
1
|
|
(375)
|
|
(269)
|
|
(620)
|
|
of which: Adjustments for share based payment related effects
|
|
1
|
|
(29)
|
|
54
|
|
of which: Adjustments for DTA valuation adjustments
|
|
0
|
|
37
|
|
2,785
|
|
Adjusted profit (loss) attributable to Deutsche Bank shareholders
|
|
4,010
|
|
2,433
|
|
1,051
|
|
Average allocated tangible shareholders' equity
|
|
46,111
|
|
43,157
|
|
45,507
|
|
Adjusted post-tax return on average tangible shareholders’ equity
|
|
8.7 %
|
|
5.6 %
|
|
2.3 %
|
|
|
|
|
|
|
|
|
Prior year segmental information presented in the current structure.
1
Pre-tax adjustments taxed at a rate of 28 %.
Transformation charges
Transformation charges are costs, included in adjusted costs, that are directly related to Deutsche Bank’s transformation as a result of the strategy announced on July 7, 2019 and certain costs related to incremental or accelerated decisions driven by the changes in the expected operations due to the COVID-19 pandemic. Such charges include the transformation-related impairment of software and real estate, the accelerated software amortization and other transformation charges like onerous contract provisions or legal and consulting fees related to the strategy execution. The table represents the transformation charges by the respective cost category.
|
in € m.
|
|
2021
|
|
2020
|
|
2019
|
|
Compensation and benefits
|
|
8
|
|
8
|
|
0
|
|
Information Technology
|
|
689
|
|
257
|
|
977
|
|
Professional services
|
|
35
|
|
18
|
|
12
|
|
Occupancy
|
|
258
|
|
196
|
|
137
|
|
Communication, data services, marketing
|
|
4
|
|
7
|
|
0
|
|
Other
|
|
8
|
|
4
|
|
18
|
|
Transformation charges
|
|
1,003
|
|
490
|
|
1,145
|
|
|
|
|
|
|
|
|
|
390
|
|
|
Deutsche Bank
|
Additional Notes
|
|
|
Annual Report 2021
|
|
|
|
|
|
Adjusted costs
Adjusted costs is one of the Group’s key performance indicators and is a non-GAAP financial measure for which the most directly comparable IFRS financial measure is noninterest expenses. Adjusted costs is calculated by deducting (i) impairment of goodwill and other intangible assets, (ii) net litigation charges and (iii) restructuring and severance (in total referred to as nonoperating costs) from noninterest expenses under IFRS. The Group believes that a presentation of noninterest expenses excluding the impact of these items provides a more meaningful depiction of the costs associated with the operating businesses. To show the development of the cost initiatives excluding costs that are directly related to Deutsche Bank’s transformation as a result of the strategy announced on July 7, 2019, the Group also presents Adjusted costs excluding transformation charges, in which the transformation charges described above are deducted from Adjusted costs.
BNP Paribas and Deutsche Bank signed a master transaction agreement to provide continuity of service to Deutsche Bank’s Prime Finance and Electronic Equities clients. Under the agreement Deutsche Bank operated the platform until clients could be migrated to BNP Paribas by the end of 2021. Expenses of the transferred business were eligible for reimbursement by BNP Paribas. To show the development of the cost initiatives excluding not only transformation charges but also these eligible reimbursable expenses, the Group also presents Adjusted costs excluding transformation charges and expenses eligible for reimbursement related to Prime Finance.
|
|
|
2021
|
|
||||||||||||
|
in € m.
|
|
Corporate
Bank
|
|
Investment
Bank
|
|
Private
Bank
|
|
Asset
Management
|
|
Capital
Release Unit
|
|
Corporate
Other
|
|
Total
consolidated
|
|
|
Noninterest expenses
|
|
4,153
|
|
5,830
|
|
7,423
|
|
1,664
|
|
1,432
|
|
1,004
|
|
21,505
|
|
|
Impairment of goodwill and other
intangible assets
|
|
5
|
|
0
|
|
0
|
|
0
|
|
0
|
|
0
|
|
5
|
|
|
Litigation charges, net
|
|
2
|
|
99
|
|
134
|
|
2
|
|
230
|
|
1
|
|
466
|
|
|
Restructuring and severance
|
|
111
|
|
87
|
|
237
|
|
21
|
|
6
|
|
7
|
|
470
|
|
|
Adjusted costs
|
|
4,036
|
|
5,644
|
|
7,051
|
|
1,641
|
|
1,195
|
|
996
|
|
20,564
|
|
|
Transformation charges
|
|
58
|
|
60
|
|
221
|
|
3
|
|
57
|
|
603
|
|
1,003
|
|
|
Adjusted costs ex. transformation charges
|
|
3,978
|
|
5,584
|
|
6,830
|
|
1,638
|
|
1,138
|
|
393
|
|
19,561
|
|
|
Expenses eligible for reimbursement related to Prime Finance
|
|
|
|
|
|
|
|
|
|
|
|
|
|
302
|
|
|
Adjusted costs ex. transformation charges and expenses eligible for reimbursement related to Prime Finance
|
|
|
|
|
|
|
|
|
|
|
|
|
|
19,259
|
|
|
|
|
|
|
|
|
|
|
|
|
|
|
|
|
|
|
|
|
|
2020
|
|
||||||||||||
|
in € m.
|
|
Corporate
Bank
|
|
Investment
Bank
|
|
Private
Bank
|
|
Asset
Management
|
|
Capital
Release Unit
|
|
Corporate
Other
|
|
Total
consolidated
|
|
|
Noninterest expenses
|
|
4,243
|
|
5,418
|
|
7,513
|
|
1,526
|
|
1,947
|
|
568
|
|
21,216
|
|
|
Impairment of goodwill and other
intangible assets
|
|
0
|
|
0
|
|
0
|
|
0
|
|
0
|
|
0
|
|
0
|
|
|
Litigation charges, net
|
|
99
|
|
20
|
|
83
|
|
(1)
|
|
25
|
|
(67)
|
|
158
|
|
|
Restructuring and severance
|
|
79
|
|
26
|
|
520
|
|
37
|
|
17
|
|
10
|
|
688
|
|
|
Adjusted costs
|
|
4,066
|
|
5,373
|
|
6,911
|
|
1,490
|
|
1,905
|
|
625
|
|
20,370
|
|
|
Transformation charges
|
|
59
|
|
84
|
|
122
|
|
5
|
|
162
|
|
58
|
|
490
|
|
|
Adjusted costs ex. transformation charges
|
|
4,007
|
|
5,289
|
|
6,788
|
|
1,485
|
|
1,743
|
|
567
|
|
19,880
|
|
|
Expenses eligible for reimbursement related to Prime Finance
|
|
|
|
|
|
|
|
|
|
|
|
|
|
360
|
|
|
Adjusted costs ex. transformation charges and expenses eligible for reimbursement related to Prime Finance
|
|
|
|
|
|
|
|
|
|
|
|
|
|
19,520
|
|
|
|
|
|
|
|
|
|
|
|
|
|
|
|
|
|
|
Prior year segmental information presented in the current structure.
|
391
|
|
|
Deutsche Bank
|
Additional Notes
|
|
|
Annual Report 2021
|
|
|
|
|
|
|
|
|
2019
|
||||||||||||
|
in € m.
|
|
Corporate
Bank
|
|
Investment
Bank
|
|
Private
Bank
|
|
Asset
Management
|
|
Capital
Release Unit
|
|
Corporate
Other
|
|
Total
consolidated
|
|
Noninterest expenses
|
|
4,877
|
|
6,397
|
|
8,159
|
|
1,711
|
|
3,400
|
|
531
|
|
25,076
|
|
Impairment of goodwill and other
intangible assets
|
|
492
|
|
0
|
|
545
|
|
0
|
|
0
|
|
0
|
|
1,037
|
|
Litigation charges, net
|
|
(4)
|
|
135
|
|
(21)
|
|
(5)
|
|
129
|
|
238
|
|
473
|
|
Restructuring and severance
|
|
150
|
|
218
|
|
156
|
|
41
|
|
157
|
|
83
|
|
805
|
|
Adjusted costs
|
|
4,239
|
|
6,044
|
|
7,479
|
|
1,675
|
|
3,115
|
|
209
|
|
22,761
|
|
Transformation charges
|
|
160
|
|
211
|
|
190
|
|
30
|
|
510
|
|
43
|
|
1145
|
|
Adjusted costs ex. transformation charges
|
|
4,079
|
|
5,832
|
|
7,290
|
|
1,644
|
|
2,605
|
|
166
|
|
21,616
|
|
Expenses eligible for reimbursement related to Prime Finance
|
|
|
|
|
|
|
|
|
|
|
|
|
|
102
|
|
Adjusted costs ex. transformation charges and expenses eligible for reimbursement related to Prime Finance
|
|
|
|
|
|
|
|
|
|
|
|
|
|
21,514
|
|
|
|
|
|
|
|
|
|
|
|
|
|
|
|
|
Prior year segmental information presented in the current structure.
|
392
|
|
|
Deutsche Bank
|
Additional Notes
|
|
|
Annual Report 2021
|
|
|
|
|
|
Revenues excluding specific items
Revenues excluding specific items is a performance indicator that is a non-GAAP financial measure most directly comparable to the IFRS financial measure net revenues. Revenues excluding specific items is calculated by adjusting net revenues under IFRS for specific revenue items which generally fall outside the usual nature or scope of the business and are likely to distort an accurate assessment of the divisional operating performance. Excluded items are Debt Valuation Adjustment (DVA) and material transactions or events that are either one-off in nature or belong to a portfolio of connected transactions or events where the PL impact is limited to a specific period of time. The Group believes that a presentation of net revenues excluding the impact of these items provides a more meaningful depiction of the revenues associated with the business.
|
|
|
2021
|
|
||||||||||||
|
in € m.
|
|
Corporate
Bank
|
|
Investment
Bank
|
|
Private
Bank
|
|
Asset
Management
|
|
Capital
Release Unit
|
|
Corporate
Other
|
|
Total
consolidated
|
|
|
Revenues
|
|
5,150
|
|
9,631
|
|
8,234
|
|
2,708
|
|
26
|
|
(211)
|
|
25,538
|
|
|
DVA
|
|
0
|
|
(28)
|
|
0
|
|
0
|
|
(2)
|
|
0
|
|
(30)
|
|
|
Sale of PB Systems to TCS
|
|
0
|
|
0
|
|
0
|
|
0
|
|
0
|
|
0
|
|
0
|
|
|
Change in valuation of an investment
- FIC ST
|
|
0
|
|
0
|
|
0
|
|
0
|
|
0
|
|
0
|
|
0
|
|
|
Sal. Oppenheim workout
- International Private Bank (IPB)
|
|
0
|
|
0
|
|
103
|
|
0
|
|
0
|
|
0
|
|
103
|
|
|
Update in valuation methodology – CRU
|
|
0
|
|
0
|
|
0
|
|
0
|
|
0
|
|
0
|
|
0
|
|
|
Total Specific revenue items
|
|
0
|
|
(28)
|
|
103
|
|
0
|
|
(2)
|
|
0
|
|
73
|
|
|
Revenues excluding specific items
|
|
5,150
|
|
9,659
|
|
8,132
|
|
2,708
|
|
28
|
|
(211)
|
|
25,465
|
|
|
|
|
|
|
|
|
|
|
|
|
|
|
|
|
|
|
|
|
|
2020
|
|
||||||||||||
|
in € m.
|
|
Corporate
Bank
|
|
Investment
Bank
|
|
Private
Bank
|
|
Asset
Management
|
|
Capital
Release Unit
|
|
Corporate
Other
|
|
Total
consolidated
|
|
|
Revenues
|
|
5,146
|
|
9,286
|
|
8,126
|
|
2,229
|
|
(225)
|
|
(552)
|
|
24,011
|
|
|
DVA
|
|
0
|
|
6
|
|
0
|
|
0
|
|
(8)
|
|
0
|
|
(2)
|
|
|
Sale of PB Systems to TCS
|
|
(16)
|
|
0
|
|
(88)
|
|
0
|
|
0
|
|
0
|
|
(104)
|
|
|
Change in valuation of an investment
- FIC ST
|
|
0
|
|
22
|
|
0
|
|
0
|
|
0
|
|
0
|
|
22
|
|
|
Sal. Oppenheim workout
- International Private Bank (IPB)
|
|
0
|
|
0
|
|
114
|
|
0
|
|
0
|
|
0
|
|
114
|
|
|
Update in valuation methodology – CRU
|
|
0
|
|
0
|
|
0
|
|
0
|
|
0
|
|
0
|
|
0
|
|
|
Total Specific revenue items
|
|
(16)
|
|
28
|
|
26
|
|
0
|
|
(8)
|
|
0
|
|
30
|
|
|
Revenues excluding specific items
|
|
5,161
|
|
9,258
|
|
8,100
|
|
2,229
|
|
(217)
|
|
(552)
|
|
23,981
|
|
|
|
|
|
|
|
|
|
|
|
|
|
|
|
|
|
|
Prior year segmental information presented in the current structure.
|
|
|
2019
|
||||||||||||
|
in € m.
|
|
Corporate
Bank
|
|
Investment
Bank
|
|
Private
Bank
|
|
Asset
Management
|
|
Capital
Release Unit
|
|
Corporate
Other
|
|
Total
consolidated
|
|
Revenues
|
|
5,247
|
|
7,023
|
|
8,239
|
|
2,332
|
|
217
|
|
107
|
|
23,165
|
|
DVA
|
|
0
|
|
(140)
|
|
0
|
|
0
|
|
(35)
|
|
0
|
|
(175)
|
|
Sale of PB Systems to TCS
|
|
0
|
|
0
|
|
0
|
|
0
|
|
0
|
|
0
|
|
0
|
|
Change in valuation of an investment
- FIC ST
|
|
0
|
|
143
|
|
0
|
|
0
|
|
0
|
|
0
|
|
143
|
|
Sal. Oppenheim workout
- International Private Bank (IPB)
|
|
0
|
|
0
|
|
105
|
|
0
|
|
0
|
|
0
|
|
105
|
|
Update in valuation methodology – CRU
|
|
0
|
|
0
|
|
0
|
|
0
|
|
(81)
|
|
0
|
|
(81)
|
|
Total Specific revenue items
|
|
0
|
|
3
|
|
105
|
|
0
|
|
(116)
|
|
0
|
|
(8)
|
|
Revenues excluding specific items
|
|
5,247
|
|
7,020
|
|
8,134
|
|
2,332
|
|
332
|
|
107
|
|
23,173
|
|
|
|
|
|
|
|
|
|
|
|
|
|
|
|
|
Prior year segmental information presented in the current structure.
|
393
|
|
|
Deutsche Bank
|
Additional Notes
|
|
|
Annual Report 2021
|
|
|
|
|
|
Revenues on a currency adjusted basis
Revenues on a currency-adjusted basis is calculated by translating prior-period revenues that were generated in non-euro currencies into euros at the foreign exchange rates that prevailed during the current year period. These adjusted figures, and period-to-period percentage changes based thereon, are intended to provide information on the development of underlying business volumes.
Adjusted profit (loss) before tax
Adjusted profit (loss) before tax is calculated by adjusting the profit (loss) before tax under IFRS for specific revenue items, transformation charges, impairments of goodwill and other intangibles, as well as restructuring and severance expenses. The Group believes that a presentation of profit (losses) before tax excluding the impact of the foregoing items provides a more meaningful depiction of the profitability of the operating business.
|
|
|
2021
|
|
||||||||||||
|
in € m.
|
|
Corporate
Bank
|
|
Investment
Bank
|
|
Private
Bank
|
|
Asset
Management
|
|
Capital
Release Unit
|
|
Corporate
Other
|
|
Total
consolidated
|
|
|
Profit (loss) before tax
|
|
1,000
|
|
3,715
|
|
366
|
|
816
|
|
(1,364)
|
|
(1,014)
|
|
3,518
|
|
|
Specific revenue items
|
|
0
|
|
28
|
|
(103)
|
|
0
|
|
2
|
|
0
|
|
(73)
|
|
|
Transformation charges
|
|
58
|
|
60
|
|
221
|
|
3
|
|
57
|
|
603
|
|
1,003
|
|
|
Impairment of goodwill / other intangibles
|
|
5
|
|
0
|
|
0
|
|
0
|
|
0
|
|
0
|
|
5
|
|
|
Restructuring severance
|
|
111
|
|
87
|
|
237
|
|
21
|
|
6
|
|
7
|
|
470
|
|
|
Adjusted profit (loss) before tax
|
|
1,174
|
|
3,891
|
|
721
|
|
840
|
|
(1,298)
|
|
(404)
|
|
4,923
|
|
|
|
|
|
|
|
|
|
|
|
|
|
|
|
|
|
|
|
|
|
2020
|
|
||||||||||||
|
in € m.
|
|
Corporate
Bank
|
|
Investment
Bank
|
|
Private
Bank
|
|
Asset
Management
|
|
Capital
Release Unit
|
|
Corporate
Other
|
|
Total
consolidated
|
|
|
Profit (loss) before tax
|
|
539
|
|
3,166
|
|
(99)
|
|
544
|
|
(2,200)
|
|
(947)
|
|
1,003
|
|
|
Specific revenue items
|
|
16
|
|
(28)
|
|
(26)
|
|
0
|
|
8
|
|
0
|
|
(30)
|
|
|
Transformation charges
|
|
59
|
|
84
|
|
122
|
|
5
|
|
162
|
|
58
|
|
490
|
|
|
Impairment of goodwill / other intangibles
|
|
0
|
|
0
|
|
0
|
|
0
|
|
0
|
|
0
|
|
0
|
|
|
Restructuring severance
|
|
79
|
|
26
|
|
520
|
|
37
|
|
17
|
|
10
|
|
688
|
|
|
Adjusted profit (loss) before tax
|
|
692
|
|
3,247
|
|
518
|
|
586
|
|
(2,013)
|
|
(879)
|
|
2,151
|
|
|
|
|
|
|
|
|
|
|
|
|
|
|
|
|
|
|
Prior year segmental information presented in the current structure.
|
|
|
2019
|
||||||||||||
|
in € m.
|
|
Corporate
Bank
|
|
Investment
Bank
|
|
Private
Bank
|
|
Asset
Management
|
|
Capital
Release Unit
|
|
Corporate
Other
|
|
Total
consolidated
|
|
Profit (loss) before tax
|
|
86
|
|
496
|
|
(263)
|
|
468
|
|
(3,170)
|
|
(251)
|
|
(2,634)
|
|
Specific revenue items
|
|
0
|
|
(3)
|
|
(105)
|
|
0
|
|
116
|
|
0
|
|
8
|
|
Transformation charges
|
|
160
|
|
211
|
|
190
|
|
30
|
|
510
|
|
43
|
|
1,145
|
|
Impairment of goodwill / other intangibles
|
|
492
|
|
0
|
|
545
|
|
0
|
|
0
|
|
0
|
|
1,037
|
|
Restructuring severance
|
|
150
|
|
218
|
|
156
|
|
41
|
|
157
|
|
83
|
|
805
|
|
Adjusted profit (loss) before tax
|
|
888
|
|
924
|
|
522
|
|
540
|
|
(2,388)
|
|
(124)
|
|
361
|
|
|
|
|
|
|
|
|
|
|
|
|
|
|
|
|
Prior year segmental information presented in the current structure.
|
394
|
|
|
Deutsche Bank
|
Additional Notes
|
|
|
Annual Report 2021
|
|
|
|
|
|
Adjustments regarding BGH ruling on pricing agreements for Private Bank
In the second quarter of 2021, the bank introduced a pro-forma disclosure, which is a non-GAAP financial measure, that excludes impacts related to a BGH ruling on pricing agreements from PB’s revenues, profit before tax and post-tax return on average tangible shareholder’s equity. The bank introduced this disclosure to improve comparability of PB’s operational trends compared to the prior quarters.
|
in € m.
(unless stated otherwise)
|
|
2021
|
|
2020
|
|
2019
|
|
Net Revenues
|
|
8,234
|
|
8,126
|
|
8,239
|
|
BGH ruling on pricing agreements - impact of forgone revenues
|
|
154
|
|
–
|
|
–
|
|
of which: Private Bank Germany - BGH ruling on pricing agreements - impact of forgone revenues
|
|
152
|
|
–
|
|
–
|
|
Net revenues ex BGH ruling on pricing agreements
|
|
8,388
|
|
8,126
|
|
8,239
|
|
of which: Private Bank Germany net revenues ex BGH ruling on pricing agreements
|
|
5,160
|
|
4,989
|
|
5,109
|
|
Revenue specific items
|
|
(103)
|
|
(26)
|
|
(105)
|
|
Net revenues ex specific items ex BGH ruling on pricing agreements
|
|
8,285
|
|
8,100
|
|
8,134
|
|
therein: Private Bank Germany – revenues ex specific items ex BGH ruling on pricing agreements
|
|
5,160
|
|
5,077
|
|
5,109
|
|
|
|
|
|
|
|
|
|
Adjusted profit (loss) before tax
|
|
721
|
|
518
|
|
522
|
|
BGH ruling - total impact
|
|
284
|
|
–
|
|
–
|
|
of which: impact of forgone revenues
|
|
154
|
|
–
|
|
–
|
|
of which: impact of additional adjusted costs
|
|
2
|
|
–
|
|
–
|
|
of which: impact of litigation charges
|
|
128
|
|
–
|
|
–
|
|
Adjusted profit (loss) before tax ex BGH ruling on pricing agreements
|
|
1,005
|
|
518
|
|
522
|
|
Adjusted profit (loss) ex BGH ruling on pricing agreements
|
|
724
|
|
373
|
|
376
|
|
Profit (loss) attributable to noncontrolling interests
|
|
–
|
|
–
|
|
–
|
|
Profit (loss) attributable to additional equity components
|
|
97
|
|
79
|
|
64
|
|
Adjusted Profit (loss) attributable to Deutsche Bank shareholders ex BGH ruling on pricing agreements
|
|
627
|
|
293
|
|
312
|
|
Average allocated tangible shareholders' equity
|
|
11,408
|
|
10,298
|
|
10,345
|
|
Adjusted post-tax RoTE ex BGH ruling on pricing agreements (in %)
|
|
5.0 %
|
|
3.0 %
|
|
3.0 %
|
|
Reported post-tax RoTE (in %)
|
|
1.0 %
|
|
(2.0) %
|
|
(2.0) %
|
|
|
|
|
|
|
|
|
Net assets (adjusted)
Net assets (adjusted) are defined as IFRS Total assets adjusted to reflect the recognition of legal netting agreements, offsetting of cash collateral received and paid and offsetting pending settlements balances. The Group believes that a presentation of net assets (adjusted) makes comparisons to its competitors easier.
|
in € b.
(unless stated otherwise)
|
|
2021
|
|
2020
|
|
2019
|
|
Total assets
|
|
1,325
|
|
1,325
|
|
1,298
|
|
Deduct: Derivatives (incl. hedging derivatives) credit line netting
|
|
239
|
|
266
|
|
266
|
|
Deduct: Derivatives cash collateral received / paid
|
|
65
|
|
83
|
|
74
|
|
Deduct: Securities Financing Transactions credit line netting
|
|
2
|
|
1
|
|
1
|
|
Deduct: Pending settlements netting
|
|
15
|
|
12
|
|
10
|
|
Net assets
|
|
1,003
|
|
962
|
|
946
|
|
|
|
|
|
|
|
|
|
395
|
|
|
Deutsche Bank
|
Additional Notes
|
|
|
Annual Report 2021
|
|
|
|
|
|
Book Value and Tangible Book Value per Basic Share Outstanding
Book value per basic share outstanding and tangible book value per basic share outstanding are non-GAAP financial measures that are used and relied upon by investors and industry analysts as capital adequacy metrics. Book value per basic share outstanding represents the Bank’s total shareholders’ equity divided by the number of basic shares outstanding at period-end. Tangible book value represents the Bank’s total shareholders’ equity less goodwill and other intangible assets. Tangible book value per basic share outstanding is computed by dividing tangible book value by period-end basic shares outstanding.
Tangible Book Value
|
in € m.
|
|
|
|
|
|
|
|
2021 increase (decrease)
from 2020
|
|
2020 increase (decrease)
from 2019
|
||||
|
(unless stated otherwise)
|
|
2021
|
|
2020
|
|
2019
|
|
in € m.
|
|
in %
|
|
in € m.
|
|
in %
|
|
Total shareholders’ equity (Book value)
|
|
58,096
|
|
54,774
|
|
55,857
|
|
3,322
|
|
6
|
|
(1,083)
|
|
(2)
|
|
Goodwill and other intangible assets
1
|
|
(6,079)
|
|
(5,997)
|
|
(6,254)
|
|
(82)
|
|
1
|
|
257
|
|
(4)
|
|
Tangible shareholders’ equity (Tangible
book value)
|
|
52,017
|
|
48,777
|
|
49,603
|
|
3,240
|
|
7
|
|
(827)
|
|
(2)
|
|
|
|
|
|
|
|
|
|
|
|
|
|
|
|
|
1
Excludes Goodwill and other intangible assets attributable to partial sale of DWS.
Basic Shares Outstanding
|
in € m.
|
|
|
|
|
|
|
|
2021 increase (decrease)
from 2020
|
|
2020 increase (decrease)
from 2019
|
||||
|
(unless stated otherwise)
|
|
2021
|
|
2020
|
|
2019
|
|
in € m.
|
|
in %
|
|
in € m.
|
|
in %
|
|
Number of shares
|
|
2,066.8
|
|
2,066.8
|
|
2,066.8
|
|
0
|
|
0
|
|
0
|
|
0
|
|
Shares outstanding:
|
|
|
|
|
|
|
|
|
|
|
|
|
|
|
|
Treasury shares
|
|
(0.7)
|
|
(1.3)
|
|
(0.7)
|
|
0.7
|
|
(49.6)
|
|
(0.7)
|
|
100.5
|
|
Vested share awards
|
|
34.5
|
|
38.6
|
|
52.4
|
|
(4.1)
|
|
(10.7)
|
|
(13.8)
|
|
(26.3)
|
|
Basic shares outstanding
|
|
2,100.6
|
|
2,104.1
|
|
2,118.5
|
|
(3.4)
|
|
(0.2)
|
|
(14.4)
|
|
(0.7)
|
|
|
|
|
|
|
|
|
|
|
|
|
|
|
|
|
|
Book value per basic share outstanding in €
|
|
27.66
|
|
26.03
|
|
26.37
|
|
1.63
|
|
6.3
|
|
(0.34)
|
|
(1.3)
|
|
Tangible book value per basic share
outstanding in €
|
|
24.76
|
|
23.18
|
|
23.41
|
|
1.58
|
|
6.8
|
|
(0.23)
|
|
(1.0)
|
|
|
|
|
|
|
|
|
|
|
|
|
|
|
|
|
|
396
|
|
|
Deutsche Bank
|
Additional Notes
|
|
|
Annual Report 2021
|
|
|
|
|
|
Regulatory fully loaded measures
Our regulatory assets, exposures, risk-weighted assets, capital and ratios thereof are calculated for regulatory purposes and are set forth throughout this document under the CRR/CRD as currently applicable.
We present in this report certain figures based on the CRR definition of own fund instruments applicable for Additional Tier 1 (AT1) capital and Tier 2 (T2) capital and figures based thereon, including Tier 1, Total Capital and Leverage Ratio) on a “fully loaded” basis. We calculate such “fully loaded” figures excluding the transitional arrangements for own fund instruments as provided in the currently applicable CRR/CRD.
Our CET1 and RWA figures include the transitional impacts from the IFRS 9 add-back also in the “fully-loaded” figures given it is an immaterial difference.
Transitional arrangements are applicable for AT1 and T2 instruments. Capital instruments issued on or prior to December 31, 2011, that no longer qualify as AT1 or T2 capital under the fully loaded CRR/CRD as currently applicable are subject to grandfathering rules during the transitional period and are being phased out from 2013 to 2022 with their recognition capped at 20 % in 2020 and 10 % in 2021 (in relation to the portfolio eligible for grandfathering which was still in issue on December 31, 2012) with grandfathering phasing out completely from January 1, 2022.
The current CRR as applicable since June 27, 2019 provides further grandfathering rules for AT1 and T2 instruments issued prior to June 27, 2019. Thereunder, AT1 and T2 instruments issued through special purpose entities are grandfathered until December 31, 2021. Beyond 2021, transitional arrangements only exist for AT1 and T2 instruments which continue to qualify until June 26, 2025 even if they do not meet certain new requirements that apply since June 27, 2019. We have immaterial amounts of such instruments outstanding at yearend 2021, which practically removes the difference between “fully loaded” and “transitional” AT1 and T2 instruments starting from January 1, 2022.
We believe that these “fully loaded” calculations provide useful information to investors as they reflect our progress against known future the regulatory capital standards. Many of our competitors have been describing calculations on a “fully loaded” basis, however, our competitors’ assumptions and estimates regarding “fully loaded” calculations may vary such that our “fully loaded” measures may not be comparable with similarly labelled measures used by our competitors.
|
397
|
|
|
Deutsche Bank
|
Additional Notes
|
|
|
Annual Report 2021
|
|
|
|
|
|
Declaration of Backing
[Page intentionally left blank for SEC filing purposes]
|
398
|
|
|
Deutsche Bank
|
Additional Notes
|
|
|
Annual Report 2021
|
|
|
|
|
|
Group Five-Year Record
[Page intentionally left blank for SEC filing purposes]
|
399
|
|
|
Deutsche Bank
|
Additional Notes
|
|
|
Annual Report 2021
|
|
|
|
|
|
Imprint / Publications
[Page intentionally left blank for SEC filing purposes]
|
400
|
|
|
Deutsche Bank
|
Additional Notes
|
|
|
Annual Report 2021
|
|
|
|
|
|
[Page intentionally left blank for SEC filing purposes]
|
401
|
|
|
Deutsche Bank
|
Imprint
|
|
|
Annual Report 2021 on Form 20-F
|
|
|
|
|
|
Supplemental Financial Information (Unaudited)
Information Required by Subpart 1400 of SEC Regulation S-K
Amounts for 2021, 2020 and 2019 are prepared in accordance with IFRS, which is consistent with the Group’s Financial Statements.
Financial condition
Average balance sheet based upon month-end balances
|
Average balance sheet and interest and similar income
|
|
2021
|
|
2020
|
|
2019
|
||||||||||||
|
in € m.
(unless stated otherwise)
|
|
Average
balance
|
|
Interest
|
|
Average
yield/rate
|
|
Average
balance
|
|
Interest
|
|
Average
yield/rate
|
|
Average
balance
|
|
Interest
|
|
Average
yield/rate
|
|
Assets:
1
|
|
|
|
|
|
|
|
|
|
|
|
|
|
|
|
|
|
|
|
Interest-earning deposits with banks:
2,4
|
|
|
|
|
|
|
|
|
|
|
|
|
|
|
|
|
|
|
|
In German offices
|
|
97,389
|
|
(352)
|
|
(0.36) %
|
|
68,237
|
|
(14)
|
|
(0.02) %
|
|
72,196
|
|
(278)
|
|
(0.39) %
|
|
In Non-German offices
|
|
82,684
|
|
203
|
|
0.25 %
|
|
74,415
|
|
422
|
|
0.57 %
|
|
90,280
|
|
1,981
|
|
2.19 %
|
|
Total interest-earning deposits with banks
|
|
180,073
|
|
(149)
|
|
(0.08) %
|
|
142,653
|
|
408
|
|
0.29 %
|
|
162,476
|
|
1,702
|
|
1.05 %
|
|
Central bank funds sold:
5
|
|
|
|
|
|
|
|
|
|
|
|
|
|
|
|
|
|
|
|
In German offices
|
|
0
|
|
0
|
|
0.00 %
|
|
0
|
|
0
|
|
0.00 %
|
|
0
|
|
0
|
|
0.00 %
|
|
In Non-German offices
|
|
0
|
|
0
|
|
0.00 %
|
|
0
|
|
1
|
|
0.00 %
|
|
0
|
|
3
|
|
0.00 %
|
|
Total central bank funds sold
|
|
0
|
|
0
|
|
0.00 %
|
|
0
|
|
1
|
|
0.00 %
|
|
0
|
|
3
|
|
0.00 %
|
|
Securities purchased under resale agreements:
4,5
|
|
|
|
|
|
|
|
|
|
|
|
|
|
|
|
|
|
|
|
In German offices
|
|
2,426
|
|
42
|
|
1.74 %
|
|
2,974
|
|
23
|
|
0.78 %
|
|
1,837
|
|
(5)
|
|
(0.25) %
|
|
In Non-German offices
|
|
6,262
|
|
231
|
|
3.68 %
|
|
6,357
|
|
284
|
|
4.47 %
|
|
8,130
|
|
330
|
|
4.06 %
|
|
Total securities purchased under resale agreements
|
|
8,687
|
|
273
|
|
3.14 %
|
|
9,331
|
|
307
|
|
3.30 %
|
|
9,967
|
|
326
|
|
3.27 %
|
|
Securities borrowed:
4
|
|
|
|
|
|
|
|
|
|
|
|
|
|
|
|
|
|
|
|
In German offices
|
|
101
|
|
4
|
|
4.18 %
|
|
79
|
|
12
|
|
14.96 %
|
|
136
|
|
16
|
|
11.51 %
|
|
In Non-German offices
|
|
0
|
|
19
|
|
N/M
|
|
33
|
|
4
|
|
13.61 %
|
|
2,335
|
|
63
|
|
2.70 %
|
|
Total securities borrowed
|
|
101
|
|
23
|
|
23.03 %
|
|
111
|
|
16
|
|
14.57 %
|
|
2,471
|
|
79
|
|
3.19 %
|
|
Interest-earning financial assets at fair value through profit or loss:
4
|
|
|
|
|
|
|
|
|
|
|
|
|
|
|
|
|
|
|
|
In German offices
|
|
48,855
|
|
321
|
|
0.66 %
|
|
39,225
|
|
373
|
|
0.95 %
|
|
25,805
|
|
378
|
|
1.47 %
|
|
In Non-German offices
|
|
157,248
|
|
2,656
|
|
1.69 %
|
|
166,474
|
|
3,341
|
|
2.01 %
|
|
223,855
|
|
6,585
|
|
2.94 %
|
|
Total interest-earning financial assets at fair value through profit or loss
|
|
206,103
|
|
2,977
|
|
1.44 %
|
|
205,698
|
|
3,714
|
|
1.81 %
|
|
249,660
|
|
6,963
|
|
2.79 %
|
|
Financial assets at fair value through OCI:
4
|
|
|
|
|
|
|
|
|
|
|
|
|
|
|
|
|
|
|
|
In German offices
|
|
3,080
|
|
6
|
|
0.18 %
|
|
4,292
|
|
8
|
|
0.19 %
|
|
6,784
|
|
49
|
|
0.72 %
|
|
In Non-German offices
|
|
35,526
|
|
497
|
|
1.40 %
|
|
44,391
|
|
628
|
|
1.42 %
|
|
42,715
|
|
976
|
|
2.28 %
|
|
Total financial assets at fair value through OCI
|
|
38,606
|
|
502
|
|
1.30 %
|
|
48,683
|
|
637
|
|
1.31 %
|
|
49,500
|
|
1,025
|
|
2.07 %
|
|
Loans at amortized cost:
3,4
|
|
|
|
|
|
|
|
|
|
|
|
|
|
|
|
|
|
|
|
In German offices
|
|
245,221
|
|
5,176
|
|
2.11 %
|
|
232,312
|
|
5,241
|
|
2.26 %
|
|
222,854
|
|
5,497
|
|
2.47 %
|
|
In Non-German offices
|
|
201,300
|
|
5,474
|
|
2.72 %
|
|
205,374
|
|
6,345
|
|
3.09 %
|
|
196,620
|
|
8,263
|
|
4.20 %
|
|
Total loans
|
|
446,521
|
|
10,650
|
|
2.39 %
|
|
437,686
|
|
11,586
|
|
2.65 %
|
|
419,475
|
|
13,760
|
|
3.28 %
|
|
Total other interest-earning assets
4
|
|
58,178
|
|
493
|
|
0.85 %
|
|
76,096
|
|
218
|
|
0.29 %
|
|
62,815
|
|
387
|
|
0.62 %
|
|
Total interest-earning assets
|
|
938,269
|
|
14,769
|
|
1.57 %
|
|
920,259
|
|
16,887
|
|
1.83 %
|
|
956,362
|
|
24,244
|
|
2.53 %
|
|
Cash and due from banks
|
|
17,939
|
|
|
|
|
|
21,477
|
|
|
|
|
|
21,093
|
|
|
|
|
|
Noninterest-earning financial assets at fair value through profit or loss:
|
|
|
|
|
|
|
|
|
|
|
|
|
|
|
|
|
|
|
|
In German offices
|
|
159,417
|
|
|
|
|
|
212,204
|
|
|
|
|
|
205,937
|
|
|
|
|
|
In Non-German offices
|
|
137,555
|
|
|
|
|
|
164,528
|
|
|
|
|
|
161,727
|
|
|
|
|
|
All other assets
|
|
96,307
|
|
|
|
|
|
90,771
|
|
|
|
|
|
88,078
|
|
|
|
|
|
Allowance for credit losses
|
|
(4,905)
|
|
|
|
|
|
(4,681)
|
|
|
|
|
|
(4,232)
|
|
|
|
|
|
Total assets
|
|
1,344,581
|
|
|
|
|
|
1,404,557
|
|
|
|
|
|
1,428,965
|
|
|
|
|
|
% of assets attributable to Non-German offices
|
|
56 %
|
|
|
|
|
|
57 %
|
|
|
|
|
|
59 %
|
|
|
|
|
|
|
|
|
|
|
|
|
|
|
|
|
|
|
|
|
|
|
|
|
|
S-1
|
|
|
Deutsche Bank
|
Imprint
|
|
|
Annual Report 2021 on Form 20-F
|
|
|
|
|
|
|
Average balance sheet and interest expense
|
|
2021
|
|
2020
|
|
2019
|
||||||||||||
|
in € m.
(unless stated otherwise)
|
|
Average
balance
|
|
Interest
|
|
Average
yield/rate
|
|
Average
balance
|
|
Interest
|
|
Average
yield/rate
|
|
Average
balance
|
|
Interest
|
|
Average
yield/rate
|
|
Liabilities and equity:
1
|
|
|
|
|
|
|
|
|
|
|
|
|
|
|
|
|
|
|
|
Interest-bearing deposits:
4
|
|
|
|
|
|
|
|
|
|
|
|
|
|
|
|
|
|
|
|
In German offices:
|
|
|
|
|
|
|
|
|
|
|
|
|
|
|
|
|
|
|
|
Time deposits
|
|
67,256
|
|
355
|
|
0.53 %
|
|
79,905
|
|
469
|
|
0.59 %
|
|
87,672
|
|
732
|
|
0.83 %
|
|
Savings deposits
|
|
85,372
|
|
329
|
|
0.39 %
|
|
84,507
|
|
358
|
|
0.42 %
|
|
87,988
|
|
435
|
|
0.49 %
|
|
Demand deposits
|
|
77,993
|
|
(394)
|
|
(0.51) %
|
|
67,098
|
|
(134)
|
|
(0.20) %
|
|
54,763
|
|
353
|
|
0.64 %
|
|
Total in German offices
|
|
230,621
|
|
289
|
|
0.13 %
|
|
231,510
|
|
693
|
|
0.30 %
|
|
230,423
|
|
1,519
|
|
0.66 %
|
|
In Non-German offices:
|
|
|
|
|
|
|
|
|
|
|
|
|
|
|
|
|
|
|
|
Time deposits
|
|
39,570
|
|
468
|
|
1.18 %
|
|
40,661
|
|
766
|
|
1.88 %
|
|
42,085
|
|
1,487
|
|
3.53 %
|
|
Savings deposits
|
|
1,621
|
|
21
|
|
1.30 %
|
|
1,226
|
|
22
|
|
1.76 %
|
|
657
|
|
9
|
|
1.43 %
|
|
Demand deposits
|
|
86,777
|
|
231
|
|
0.27 %
|
|
78,487
|
|
348
|
|
0.44 %
|
|
76,957
|
|
591
|
|
0.77 %
|
|
Total in Non-German offices
|
|
127,969
|
|
720
|
|
0.56 %
|
|
120,374
|
|
1,135
|
|
0.94 %
|
|
119,699
|
|
2,088
|
|
1.74 %
|
|
Total interest-bearing deposits
|
|
358,590
|
|
1,009
|
|
0.28 %
|
|
351,884
|
|
1,828
|
|
0.52 %
|
|
350,122
|
|
3,607
|
|
1.03 %
|
|
Central bank funds purchased:
5
|
|
|
|
|
|
|
|
|
|
|
|
|
|
|
|
|
|
|
|
In German offices
|
|
0
|
|
0
|
|
0.00 %
|
|
1,903
|
|
8
|
|
0.40 %
|
|
0
|
|
0
|
|
0.00 %
|
|
In Non-German offices
|
|
8
|
|
0
|
|
0.00 %
|
|
442
|
|
0
|
|
0.06 %
|
|
192
|
|
3
|
|
1.32 %
|
|
Total central bank funds purchased
|
|
8
|
|
0
|
|
0.00 %
|
|
2,345
|
|
8
|
|
0.34 %
|
|
192
|
|
3
|
|
1.32 %
|
|
Securities sold under repurchase agreements:
4,5
|
|
|
|
|
|
|
|
|
|
|
|
|
|
|
|
|
|
|
|
In German offices
|
|
113
|
|
43
|
|
38.03 %
|
|
835
|
|
32
|
|
3.78 %
|
|
289
|
|
29
|
|
9.85 %
|
|
In Non-German offices
|
|
2,237
|
|
105
|
|
4.70 %
|
|
2,532
|
|
129
|
|
5.10 %
|
|
4,893
|
|
332
|
|
6.79 %
|
|
Total securities sold under repurchase agreements
|
|
2,350
|
|
148
|
|
6.30 %
|
|
3,366
|
|
161
|
|
4.78 %
|
|
5,182
|
|
361
|
|
6.96 %
|
|
Securities loaned:
4
|
|
|
|
|
|
|
|
|
|
|
|
|
|
|
|
|
|
|
|
In German offices
|
|
0
|
|
7
|
|
N/M
|
|
52
|
|
5
|
|
9.24 %
|
|
2
|
|
0
|
|
9.15 %
|
|
In Non-German offices
|
|
1,027
|
|
33
|
|
3.19 %
|
|
822
|
|
(1)
|
|
(0.13) %
|
|
2,336
|
|
74
|
|
3.16 %
|
|
Total securities loaned
|
|
1,027
|
|
39
|
|
3.85 %
|
|
874
|
|
4
|
|
0.43 %
|
|
2,338
|
|
74
|
|
3.16 %
|
|
Interest-bearing financial liabilities at fair value through profit or loss:
4
|
|
|
|
|
|
|
|
|
|
|
|
|
|
|
|
|
|
|
|
In German offices
|
|
32,045
|
|
319
|
|
1.00 %
|
|
20,758
|
|
226
|
|
1.09 %
|
|
14,219
|
|
190
|
|
1.34 %
|
|
In Non-German offices
|
|
85,881
|
|
904
|
|
1.05 %
|
|
83,963
|
|
1,265
|
|
1.51 %
|
|
102,232
|
|
3,032
|
|
2.97 %
|
|
Total interest-bearing financial liabilities at fair value through profit or loss
|
|
117,926
|
|
1,223
|
|
1.04 %
|
|
104,721
|
|
1,490
|
|
1.42 %
|
|
116,451
|
|
3,222
|
|
2.77 %
|
|
Commercial paper:
5
|
|
|
|
|
|
|
|
|
|
|
|
|
|
|
|
|
|
|
|
In German offices
|
|
602
|
|
0
|
|
(0.01) %
|
|
69
|
|
0
|
|
0.09 %
|
|
0
|
|
0
|
|
0.00 %
|
|
In Non-German offices
|
|
1,168
|
|
9
|
|
0.81 %
|
|
1,540
|
|
18
|
|
1.17 %
|
|
2,142
|
|
31
|
|
1.45 %
|
|
Total commercial paper
|
|
1,770
|
|
9
|
|
0.53 %
|
|
1,609
|
|
18
|
|
1.12 %
|
|
2,142
|
|
31
|
|
1.45 %
|
|
Other short-term borrowings:
4
|
|
|
|
|
|
|
|
|
|
|
|
|
|
|
|
|
|
|
|
In German offices
|
|
675
|
|
21
|
|
3.08 %
|
|
505
|
|
8
|
|
1.59 %
|
|
560
|
|
12
|
|
2.22 %
|
|
In Non-German offices
|
|
1,414
|
|
38
|
|
2.68 %
|
|
2,334
|
|
33
|
|
1.41 %
|
|
9,392
|
|
119
|
|
1.27 %
|
|
Total other short-term borrowings
|
|
2,089
|
|
59
|
|
2.81 %
|
|
2,839
|
|
41
|
|
1.44 %
|
|
9,952
|
|
131
|
|
1.32 %
|
|
Long-term debt and trust preferred securities:
4
|
|
|
|
|
|
|
|
|
|
|
|
|
|
|
|
|
|
|
|
In German offices
|
|
107,416
|
|
417
|
|
0.39 %
|
|
97,060
|
|
877
|
|
0.90 %
|
|
92,883
|
|
850
|
|
0.92 %
|
|
In Non-German offices
|
|
41,130
|
|
561
|
|
1.37 %
|
|
48,435
|
|
639
|
|
1.32 %
|
|
58,582
|
|
1,246
|
|
2.13 %
|
|
Total long-term debt and trust preferred securities
|
|
148,546
|
|
978
|
|
0.66 %
|
|
145,496
|
|
1,517
|
|
1.04 %
|
|
151,465
|
|
2,096
|
|
1.38 %
|
|
Total other interest-bearing liabilities
4
|
|
58,436
|
|
186
|
|
0.32 %
|
|
72,638
|
|
272
|
|
0.37 %
|
|
76,871
|
|
970
|
|
1.26 %
|
|
Total interest-bearing liabilities
|
|
690,742
|
|
3,652
|
|
0.53 %
|
|
685,772
|
|
5,338
|
|
0.78 %
|
|
714,716
|
|
10,495
|
|
1.47 %
|
|
|
|
|
|
|
|
|
|
|
|
|
|
|
|
|
|
|
|
|
|
S-2
|
|
|
Deutsche Bank
|
Imprint
|
|
|
Annual Report 2021 on Form 20-F
|
|
|
|
|
|
|
Average balance sheet and interest expense
|
|
2021
|
|
2020
|
|
2019
|
||||||||||||
|
in € m.
(unless stated otherwise)
|
|
Average
balance
|
|
Interest
|
|
Average
yield/rate
|
|
Average
balance
|
|
Interest
|
|
Average
yield/rate
|
|
Average
balance
|
|
Interest
|
|
Average
yield/rate
|
|
Noninterest-bearing deposits:
|
|
|
|
|
|
|
|
|
|
|
|
|
|
|
|
|
|
|
|
In German offices
|
|
193,115
|
|
|
|
|
|
193,022
|
|
|
|
|
|
203,378
|
|
|
|
|
|
In Non-German offices
|
|
29,900
|
|
|
|
|
|
24,570
|
|
|
|
|
|
22,641
|
|
|
|
|
|
Noninterest-bearing financial liabilities at fair value through profit or loss:
|
|
|
|
|
|
|
|
|
|
|
|
|
|
|
|
|
|
|
|
In German offices
|
|
151,743
|
|
|
|
|
|
197,946
|
|
|
|
|
|
184,845
|
|
|
|
|
|
In Non-German offices
|
|
130,709
|
|
|
|
|
|
161,446
|
|
|
|
|
|
164,734
|
|
|
|
|
|
All other noninterest-bearing liabilities
|
|
83,425
|
|
|
|
|
|
79,220
|
|
|
|
|
|
72,210
|
|
|
|
|
|
Total shareholders’ equity
|
|
56,537
|
|
|
|
|
|
55,302
|
|
|
|
|
|
60,170
|
|
|
|
|
|
Additional equity components
|
|
6,779
|
|
|
|
|
|
5,644
|
|
|
|
|
|
4,670
|
|
|
|
|
|
Noncontrolling interests
|
|
1,630
|
|
|
|
|
|
1,634
|
|
|
|
|
|
1,600
|
|
|
|
|
|
Total equity
|
|
64,947
|
|
|
|
|
|
62,580
|
|
|
|
|
|
66,441
|
|
|
|
|
|
Total liabilities and equity
|
|
1,344,581
|
|
|
|
|
|
1,404,557
|
|
|
|
|
|
1,428,965
|
|
|
|
|
|
% of liabilities attributable to Non-German offices
|
|
40 %
|
|
|
|
|
|
41 %
|
|
|
|
|
|
43 %
|
|
|
|
|
|
Rate spread
|
|
1.05 %
|
|
|
|
|
|
1.06 %
|
|
|
|
|
|
1.07 %
|
|
|
|
|
|
Net interest margin (Net interest income to
total interest-earning assets):
|
|
|
|
|
|
|
|
|
|
|
|
|
|
|
|
|
|
|
|
In German offices
|
|
1.03 %
|
|
|
|
|
|
1.06 %
|
|
|
|
|
|
0.91 %
|
|
|
|
|
|
In Non-German offices
|
|
1.30 %
|
|
|
|
|
|
1.37 %
|
|
|
|
|
|
1.72 %
|
|
|
|
|
|
Total
|
|
1.18 %
|
|
|
|
|
|
1.25 %
|
|
|
|
|
|
1.44 %
|
|
|
|
|
|
|
|
|
|
|
|
|
|
|
|
|
|
|
|
|
|
|
|
|
N/M – Not meaningful
1
The allocation of the assets and liabilities between German and Non-German offices are based on the location of the entity which carries the respective asset or liability.
2
Interest-earning deposits with banks include interest earning deposit with central bank and interest earning deposit with bank w/o central bank.
3
Loans include impaired loans.
4
Figures in interest revenue and expense positions are based on net effect of negative interest revenue and expenses. However, negative interest revenue and expenses are reported in ‘’others’’ in interest and similar income and interest expenses, respectively, in Note 5 to the consolidated financial statement.
5
As per the Securities Exchange Commission’s revised guidance, Central bank funds sold, Securities purchased under resale agreements, Central bank funds purchase, Securities sold under repurchase agreements and Commercial paper have been disclosed separately along with prior year’s figure.
Analysis of changes in interest and similar income and interest expense
|
S-3
|
|
|
Deutsche Bank
|
Imprint
|
|
|
Annual Report 2021 on Form 20-F
|
|
|
|
|
|
|
|
|
2021 over 2020 due to changes in¹
|
|
2020 over 2019 due to changes in¹
|
||||||||
|
in € m.
|
|
Net
change
|
|
Volume
|
|
Rate
|
|
Net
change
|
|
Volume
|
|
Rate
|
|
Interest and similar income:
|
|
|
|
|
|
|
|
|
|
|
|
|
|
Interest-earning deposits with banks:
|
|
|
|
|
|
|
|
|
|
|
|
|
|
German offices
|
|
(338)
|
|
(9)
|
|
(329)
|
|
264
|
|
14
|
|
249
|
|
Non-German offices
|
|
(219)
|
|
43
|
|
(262)
|
|
(1,558)
|
|
(299)
|
|
(1,260)
|
|
Total interest-earning deposits with banks
|
|
(557)
|
|
34
|
|
(591)
|
|
(1,295)
|
|
(284)
|
|
(1,010)
|
|
Central bank funds sold:
|
|
|
|
|
|
|
|
|
|
|
|
|
|
German offices
|
|
0
|
|
0
|
|
0
|
|
0
|
|
0
|
|
0
|
|
Non-German offices
|
|
(1)
|
|
0
|
|
(1)
|
|
(2)
|
|
0
|
|
(2)
|
|
Total central bank funds sold
|
|
(1)
|
|
0
|
|
(1)
|
|
(2)
|
|
0
|
|
(2)
|
|
Securities purchased under resale agreements:
|
|
|
|
|
|
|
|
|
|
|
|
|
|
German offices
|
|
19
|
|
(5)
|
|
24
|
|
28
|
|
(1)
|
|
29
|
|
Non-German offices
|
|
(54)
|
|
(4)
|
|
(50)
|
|
(46)
|
|
(77)
|
|
31
|
|
Total securities purchased under resale agreements
|
|
(35)
|
|
(9)
|
|
(26)
|
|
(18)
|
|
(78)
|
|
60
|
|
Securities borrowed:
|
|
|
|
|
|
|
|
|
|
|
|
|
|
German offices
|
|
(8)
|
|
3
|
|
(10)
|
|
(4)
|
|
(8)
|
|
4
|
|
Non-German offices
|
|
15
|
|
(9)
|
|
23
|
|
(59)
|
|
(112)
|
|
53
|
|
Total securities borrowed
|
|
7
|
|
(6)
|
|
13
|
|
(63)
|
|
(119)
|
|
57
|
|
Financial assets at fair value through profit or loss:
|
|
|
|
|
|
|
|
|
|
|
|
|
|
German offices
|
|
(52)
|
|
79
|
|
(131)
|
|
(5)
|
|
156
|
|
(161)
|
|
Non-German offices
|
|
(685)
|
|
(178)
|
|
(507)
|
|
(3,244)
|
|
(1,448)
|
|
(1,796)
|
|
Total financial assets at fair value through profit or loss
|
|
(737)
|
|
(98)
|
|
(639)
|
|
(3,249)
|
|
(1,293)
|
|
(1,956)
|
|
Financial assets at fair value through OCI:
|
|
|
|
|
|
|
|
|
|
|
|
|
|
German offices
|
|
(3)
|
|
(2)
|
|
0
|
|
(41)
|
|
(14)
|
|
(27)
|
|
Non-German offices
|
|
(132)
|
|
(124)
|
|
(8)
|
|
(347)
|
|
37
|
|
(384)
|
|
Total financial assets at fair value through OCI
|
|
(134)
|
|
(126)
|
|
(8)
|
|
(388)
|
|
23
|
|
(411)
|
|
Loans at amortized cost:
|
|
|
|
|
|
|
|
|
|
|
|
|
|
German offices
|
|
(66)
|
|
283
|
|
(348)
|
|
(256)
|
|
227
|
|
(483)
|
|
Non-German offices
|
|
(870)
|
|
(124)
|
|
(747)
|
|
(1,918)
|
|
354
|
|
(2,272)
|
|
Total loans
|
|
(936)
|
|
159
|
|
(1,095)
|
|
(2,174)
|
|
581
|
|
(2,754)
|
|
Other interest-earning assets
|
|
275
|
|
(24
)
|
|
300
|
|
(169)
|
|
74
|
|
(243)
|
|
Total interest and similar income
|
|
(2,117)
|
|
(72)
|
|
(2,045)
|
|
(7,357)
|
|
(1,096)
|
|
(6,261)
|
|
Interest expense:
|
|
|
|
|
|
|
|
|
|
|
|
|
|
Interest-bearing deposits:
|
|
|
|
|
|
|
|
|
|
|
|
|
|
German offices
|
|
(404)
|
|
(3)
|
|
(401)
|
|
(826)
|
|
7
|
|
(833)
|
|
Non-German offices
|
|
(415)
|
|
68
|
|
(483)
|
|
(953)
|
|
12
|
|
(965)
|
|
Total interest-bearing deposits
|
|
(819
)
|
|
65
|
|
(884
)
|
|
(1,779)
|
|
19
|
|
(1,798)
|
|
Central bank funds purchased:
|
|
|
|
|
|
|
|
|
|
|
|
|
|
German offices
|
|
(8)
|
|
(4)
|
|
(4)
|
|
8
|
|
7
|
|
1
|
|
Non-German offices
|
|
0
|
|
0
|
|
0
|
|
(2)
|
|
1
|
|
(4)
|
|
Total central bank funds purchased
agreements
|
|
(8)
|
|
(4)
|
|
(4)
|
|
5
|
|
9
|
|
(3)
|
|
Securities sold under repurchase agreements:
|
|
|
|
|
|
|
|
|
|
|
|
|
|
German offices
|
|
11
|
|
(49)
|
|
60
|
|
3
|
|
29
|
|
(26)
|
|
Non-German offices
|
|
(24)
|
|
(14)
|
|
(10)
|
|
(203)
|
|
(134)
|
|
(69)
|
|
Total securities sold under repurchase
agreements
|
|
(13)
|
|
(63)
|
|
51
|
|
(200)
|
|
(105)
|
|
(95)
|
|
Securities loaned:
|
|
|
|
|
|
|
|
|
|
|
|
|
|
German offices
|
|
2
|
|
0
|
|
2
|
|
5
|
|
5
|
|
0
|
|
Non-German offices
|
|
34
|
|
0
|
|
34
|
|
(75)
|
|
(29)
|
|
(46)
|
|
Total securities loaned
|
|
36
|
|
0
|
|
36
|
|
(70)
|
|
(24)
|
|
(46)
|
|
Financial liabilities at fair value through profit or loss:
|
|
|
|
|
|
|
|
|
|
|
|
|
|
German offices
|
|
93
|
|
114
|
|
(20)
|
|
36
|
|
76
|
|
(40)
|
|
Non-German offices
|
|
(361)
|
|
28
|
|
(389)
|
|
(1,767)
|
|
(471)
|
|
(1,297)
|
|
Total financial liabilities at fair value through profit or loss
|
|
(267)
|
|
142
|
|
(410)
|
|
(1,732)
|
|
(395)
|
|
(1,337)
|
|
Commercial paper:
|
|
|
|
|
|
|
|
|
|
|
|
|
|
German offices
|
|
0
|
|
0
|
|
0
|
|
0
|
|
0
|
|
0
|
|
Non-German offices
|
|
(9)
|
|
(4)
|
|
(5)
|
|
(13)
|
|
(8)
|
|
(5)
|
|
Total commercial paper
|
|
(9)
|
|
(4)
|
|
(5)
|
|
(13)
|
|
(8)
|
|
(5)
|
|
Other short-term borrowings:
|
|
|
|
|
|
|
|
|
|
|
|
|
|
German offices
|
|
13
|
|
3
|
|
9
|
|
(4)
|
|
(1)
|
|
(3)
|
|
Non-German offices
|
|
5
|
|
(16)
|
|
22
|
|
(86)
|
|
(98)
|
|
12
|
|
Total other short-term borrowings
|
|
18
|
|
(13)
|
|
31
|
|
(91)
|
|
(99)
|
|
8
|
|
Long-term debt and trust preferred securities:
|
|
|
|
|
|
|
|
|
|
|
|
|
|
German offices
|
|
(461)
|
|
85
|
|
(546)
|
|
27
|
|
38
|
|
(11)
|
|
Non-German offices
|
|
(78)
|
|
(99)
|
|
21
|
|
(606)
|
|
(190)
|
|
(416)
|
|
Total long-term debt and trust preferred securities
|
|
(539)
|
|
(14)
|
|
(525)
|
|
(579)
|
|
(152)
|
|
(427)
|
|
Other interest-bearing liabilities
|
|
(86)
|
|
12
|
|
(98)
|
|
(698)
|
|
(11)
|
|
(687)
|
|
Total interest expense
|
|
(1,686)
|
|
121
|
|
(1,807)
|
|
(5,156)
|
|
(767)
|
|
(4,389)
|
|
Net change in net interest income
|
|
(431)
|
|
(193)
|
|
(238)
|
|
(2,201)
|
|
(329)
|
|
(1,871)
|
|
|
|
|
|
|
|
|
|
|
|
|
|
|
1
Changes due to combination of volume and rate are allocated proportionally.
Investment portfolio
The Group’s total investment portfolio as of December 31, 2021 was € 38.2 billion (debt securities at fair value through other comprehensive income € 23.4 billion and debt securities at amortized cost € 14.8 billion).
The following table presents the approximate weighted-average yields (based on amortized cost) by maturity distribution of the Group’s investment portfolio as of December 31, 2021:
|
|
|
Up to one year
|
|
More than one year
and up to five years
|
|
More than five years
and up to ten years
|
|
More than ten years
|
|
Total
|
||||||||||
|
in € m.
|
|
Amount
|
|
Yield
|
|
Amount
|
|
Yield
|
|
Amount
|
|
Yield
|
|
Amount
|
|
Yield
|
|
Amount
|
|
Yield
|
|
German government
|
|
275
|
|
0.1 %
|
|
402
|
|
1.3 %
|
|
402
|
|
0.2 %
|
|
241
|
|
0.7 %
|
|
1,319
|
|
0.6 %
|
|
U.S. Treasury and U.S.
government agencies
|
|
2,121
|
|
1.7 %
|
|
8,531
|
|
2.4 %
|
|
6,367
|
|
0.5 %
|
|
628
|
|
1.8 %
|
|
17,648
|
|
1.6 %
|
|
U.S. local (municipal)
governments
|
|
0
|
|
0.0 %
|
|
286
|
|
3.1 %
|
|
52
|
|
3.2 %
|
|
282
|
|
4.0 %
|
|
620
|
|
3.5 %
|
|
Other foreign
governments
|
|
3,305
|
|
1.0 %
|
|
3,155
|
|
2.2 %
|
|
3,310
|
|
0.9 %
|
|
1,953
|
|
0.5 %
|
|
11,723
|
|
1.2 %
|
|
Corporates
|
|
415
|
|
3.7 %
|
|
646
|
|
5.9 %
|
|
254
|
|
1.2 %
|
|
63
|
|
1.4 %
|
|
1,378
|
|
4.2 %
|
|
Other asset-backed
securities
|
|
0
|
|
0.0 %
|
|
0
|
|
0.0 %
|
|
0
|
|
0.0 %
|
|
0
|
|
0.0 %
|
|
0
|
|
0.0 %
|
|
Mortgage-backed
securities, including
obligations of U.S.
federal agencies
|
|
1,084
|
|
1.8 %
|
|
862
|
|
2.1 %
|
|
6
|
|
3.4 %
|
|
708
|
|
3.4 %
|
|
2,660
|
|
2.3 %
|
|
Other debt securities
|
|
598
|
|
2.5 %
|
|
885
|
|
4.3 %
|
|
656
|
|
1.4 %
|
|
739
|
|
0.6 %
|
|
2,879
|
|
2.3 %
|
|
|
|
|
|
|
|
|
|
|
|
|
|
|
|
|
|
|
|
|
|
|
|
S-4
|
|
|
Deutsche Bank
|
Imprint
|
|
|
Annual Report 2021 on Form 20-F
|
|
|
|
|
|
Loan Portfolio
Analysis of maturities of the Group’s loan portfolio (excluding lease financing)
|
Dec 31, 2021
in € m.
|
|
Within 1 year
|
|
After 1 but
within 5 years
|
|
After 5 but
within 15 years
|
|
After 15 years
|
|
Total
|
|
|
German:
|
|
|
|
|
|
|
|
|
|
|
|
|
Agriculture, forestry and fishing
|
|
52
|
|
39
|
|
106
|
|
56
|
|
253
|
|
|
Mining and quarrying
|
|
55
|
|
39
|
|
50
|
|
1
|
|
145
|
|
|
Manufacturing
|
|
5,430
|
|
3,336
|
|
1,604
|
|
212
|
|
10,581
|
|
|
Electricity, gas, steam and air conditioning supply
|
|
515
|
|
364
|
|
597
|
|
148
|
|
1,624
|
|
|
Water supply, sewerage, waste management and remediation activities
|
|
158
|
|
132
|
|
128
|
|
31
|
|
450
|
|
|
Construction
|
|
308
|
|
238
|
|
475
|
|
384
|
|
1,405
|
|
|
Wholesale and retail trade, repair of motor vehicles and motorcycles
|
|
4,123
|
|
1,336
|
|
1,019
|
|
474
|
|
6,952
|
|
|
Transport and storage
|
|
436
|
|
528
|
|
251
|
|
59
|
|
1,274
|
|
|
Accommodation and food service activities
|
|
37
|
|
364
|
|
312
|
|
143
|
|
856
|
|
|
Information and communication
|
|
717
|
|
489
|
|
152
|
|
180
|
|
1,538
|
|
|
Financial and insurance activities
|
|
3,740
|
|
4,060
|
|
2,562
|
|
938
|
|
11,300
|
|
|
Real estate activities
|
|
2,086
|
|
2,500
|
|
3,558
|
|
4,331
|
|
12,475
|
|
|
Professional, scientific and technical activities
|
|
718
|
|
849
|
|
1,810
|
|
1,290
|
|
4,667
|
|
|
Administrative and support service activities
|
|
2,592
|
|
56
|
|
482
|
|
376
|
|
3,506
|
|
|
Public administration and defense, compulsory social security
|
|
2,191
|
|
557
|
|
117
|
|
15
|
|
2,880
|
|
|
Education
|
|
9
|
|
19
|
|
46
|
|
37
|
|
110
|
|
|
Human health services and social work activities
|
|
345
|
|
531
|
|
1,306
|
|
766
|
|
2,949
|
|
|
Arts, entertainment and recreation
|
|
208
|
|
34
|
|
93
|
|
147
|
|
483
|
|
|
Other service activities
|
|
716
|
|
599
|
|
439
|
|
359
|
|
2,113
|
|
|
Activities of households as employers, undifferentiated goods- and services-producing activities of households for own use
|
|
6,147
|
|
12,152
|
|
44,490
|
|
108,385
|
|
171,174
|
|
|
Activities of extraterritorial organizations and bodies
|
|
0
|
|
0
|
|
0
|
|
0
|
|
0
|
|
|
Total German
|
|
30,584
|
|
28,223
|
|
59,599
|
|
118,332
|
|
236,738
|
|
|
Non-German:
|
|
|
|
|
|
|
|
|
|
|
|
|
Agriculture, forestry and fishing
|
|
279
|
|
57
|
|
53
|
|
5
|
|
394
|
|
|
Mining and quarrying
|
|
1,508
|
|
680
|
|
665
|
|
7
|
|
2,860
|
|
|
Manufacturing
|
|
20,131
|
|
4,499
|
|
1,557
|
|
45
|
|
26,232
|
|
|
Electricity, gas, steam and air conditioning supply
|
|
948
|
|
943
|
|
1,238
|
|
65
|
|
3,194
|
|
|
Water supply, sewerage, waste management and remediation activities
|
|
96
|
|
122
|
|
11
|
|
1
|
|
230
|
|
|
Construction
|
|
1,240
|
|
1,479
|
|
419
|
|
104
|
|
3,242
|
|
|
Wholesale and retail trade, repair of motor vehicles and motorcycles
|
|
11,735
|
|
2,413
|
|
768
|
|
571
|
|
15,487
|
|
|
Transport and storage
|
|
1,671
|
|
2,366
|
|
682
|
|
40
|
|
4,759
|
|
|
Accommodation and food service activities
|
|
220
|
|
860
|
|
293
|
|
42
|
|
1,415
|
|
|
Information and communication
|
|
3,376
|
|
2,087
|
|
343
|
|
43
|
|
5,848
|
|
|
Financial and insurance activities
|
|
41,324
|
|
49,295
|
|
8,186
|
|
1,135
|
|
99,939
|
|
|
Real estate activities
|
|
14,278
|
|
13,461
|
|
2,847
|
|
159
|
|
30,745
|
|
|
Professional, scientific and technical activities
|
|
963
|
|
756
|
|
323
|
|
311
|
|
2,354
|
|
|
Administrative and support service activities
|
|
2,842
|
|
3,118
|
|
745
|
|
105
|
|
6,810
|
|
|
Public administration and defense, compulsory social security
|
|
1,384
|
|
844
|
|
1,969
|
|
0
|
|
4,197
|
|
|
Education
|
|
56
|
|
14
|
|
28
|
|
17
|
|
114
|
|
|
Human health services and social work activities
|
|
289
|
|
500
|
|
102
|
|
163
|
|
1,053
|
|
|
Arts, entertainment and recreation
|
|
41
|
|
513
|
|
15
|
|
16
|
|
585
|
|
|
Other service activities
|
|
855
|
|
1,492
|
|
545
|
|
255
|
|
3,147
|
|
|
Activities of households as employers, undifferentiated goods- and services-producing activities of households for own use
|
|
13,696
|
|
8,736
|
|
9,455
|
|
10,124
|
|
42,011
|
|
|
Activities of extraterritorial organizations and bodies
|
|
0
|
|
1
|
|
0
|
|
0
|
|
1
|
|
|
Total Non-German
|
|
116,931
|
|
94,235
|
|
30,243
|
|
13,209
|
|
254,618
|
|
|
Gross loans
|
|
147,515
|
|
122,458
|
|
89,842
|
|
131,541
|
|
491,356
|
|
|
(Deferred expense)/unearned income
|
|
(162)
|
|
(215)
|
|
205
|
|
399
|
|
227
|
|
|
Loans less (deferred expense)/unearned income
|
|
147,677
|
|
122,673
|
|
89,637
|
|
131,142
|
|
491,129
|
|
|
|
|
|
|
|
|
|
|
|
|
|
|
Volumes of loans in loan portfolio (excluding lease financing) with residual maturities of more than one year from that date
|
Dec 31,2021
in € m.
|
|
Within 1 years
|
|
After one but
within 5 years
|
|
After 5 but
within 15 years
|
|
After 15 years
|
|
Total
|
|
Fixed rate loans
|
|
52,209
|
|
39,051
|
|
67,287
|
|
118,995
|
|
277,541
|
|
Floating or adjustable rate loans
|
|
95,306
|
|
83,407
|
|
22,555
|
|
12,546
|
|
213,815
|
|
Total
|
|
147,515
|
|
122,458
|
|
89,842
|
|
131,541
|
|
491,356
|
|
|
|
|
|
|
|
|
|
|
|
|
|
S-5
|
|
|
Deutsche Bank
|
Imprint
|
|
|
Annual Report 2021 on Form 20-F
|
|
|
|
|
|
Allowances for Credit Losses
In accordance with updated SEC disclosure requirements as of September 2020, we below show Loans at amortized cost, Allowance for loan losses, net charge offs and two credit ratios by NACE code. Numbers for exposures and allowances differ from those disclosed in the Asset Quality section of this report, where we apply a broader scope (all Financial assets at amortized cost rather than just loans) in line with IFRS 9 requirements.
Loans at amortized Cost by Industry type
|
|
|
Dec 31, 2021
|
||||||||
|
in € m.
|
|
Loans at amotized cost (Gross carrying Amount)
|
|
Allowance for credit losses
|
|
Net Charge Offs
|
|
Allowance for credit losses to total loans at amortized cost at end of period (%) ¹
|
|
Net charge-offs during the period to average loans at amotized cost outstanding during the period (%)
|
|
Agriculture, forestry and fishing
|
|
645
|
|
12
|
|
1
|
|
1.91%
|
|
0.22%
|
|
Mining and quarrying
|
|
2,783
|
|
17
|
|
16
|
|
0.60%
|
|
0.64%
|
|
Manufacturing
|
|
35,404
|
|
543
|
|
46
|
|
1.53%
|
|
0.17%
|
|
Electricity, gas, steam and air conditioning supply
|
|
4,548
|
|
45
|
|
(0)
|
|
0.99%
|
|
(0.00%)
|
|
Water supply, sewerage, waste management and remediation activities
|
|
681
|
|
11
|
|
1
|
|
1.54%
|
|
0.08%
|
|
Construction
|
|
4,374
|
|
200
|
|
14
|
|
4.56%
|
|
0.32%
|
|
Wholesale and retail trade, repair of motor vehicles and motorcycles
|
|
21,285
|
|
432
|
|
160
|
|
2.03%
|
|
0.78%
|
|
Transport and storage
|
|
5,330
|
|
75
|
|
24
|
|
1.40%
|
|
0.45%
|
|
Accommodation and food service activities
|
|
2,259
|
|
73
|
|
1
|
|
3.22%
|
|
0.04%
|
|
Information and communication
|
|
6,363
|
|
111
|
|
0
|
|
1.75%
|
|
0.01%
|
|
Financial and insurance activities
|
|
106,343
|
|
430
|
|
19
|
|
0.40%
|
|
0.02%
|
|
Real estate activities
|
|
40,629
|
|
188
|
|
7
|
|
0.46%
|
|
0.02%
|
|
Professional, scientific and technical activities
|
|
6,959
|
|
104
|
|
14
|
|
1.49%
|
|
0.19%
|
|
Administrative and support service activities
|
|
9,759
|
|
167
|
|
7
|
|
1.71%
|
|
0.07%
|
|
Public administration and defense, compulsory social security
|
|
6,183
|
|
18
|
|
(0)
|
|
0.30%
|
|
(0.00%)
|
|
Education
|
|
225
|
|
3
|
|
0
|
|
1.18%
|
|
0.08%
|
|
Human health services and social work activities
|
|
3,869
|
|
28
|
|
1
|
|
0.73%
|
|
0.03%
|
|
Arts, entertainment and recreation
|
|
1,062
|
|
8
|
|
(1)
|
|
0.74%
|
|
(0.06%)
|
|
Other service activities
|
|
4,941
|
|
100
|
|
(10)
|
|
2.02%
|
|
(0.19%)
|
|
Activities of households as employers, undifferentiated goods- and services-producing activities of households for own use
|
|
212,434
|
|
2,190
|
|
189
|
|
1.03%
|
|
0.09%
|
|
Activities of extraterritorial organizations and bodies
|
|
1
|
|
1
|
|
0
|
|
64.65%
|
|
0.00%
|
|
Total
|
|
476,077
|
|
4,754
|
|
488
|
|
1.00%
|
|
0.11%
|
|
|
|
|
|
|
|
|
|
|
|
|
1
Credit ratio defined as allowance for credit losses to total loans at amortized cost at the end of period in this table excludes collateral. Considering collateral, credit ratio is materially higher.
Loan at Amortized Cost exposure went up by € 44 billion or 10 % in 2021 compared to 2020, which was mainly due to the increase in Investment Bank and Private Bank.
Loan loss allowance slightly declined by € 54 million or 1 % in 2021.
Net charge-offs reduced by € 236 million or 33 % in 2021, due to non-recurrence of write-offs in Financial and insurance activities from 2020.
|
S-6
|
|
|
Deutsche Bank
|
Imprint
|
|
|
Annual Report 2021 on Form 20-F
|
|
|
|
|
|
|
|
|
Dec 31, 2020
|
||||||||
|
in € m.
|
|
Loans at amotized cost (Gross carrying Amount)
|
|
Allowance for credit losses
|
|
Net Charge Offs
|
|
Allowance for credit losses to total loans at amortized cost at end of period (%) ¹
|
|
Net charge-offs during the period to average loans at amotized cost outstanding during the period (%)
|
|
Agriculture, forestry and fishing
|
|
637
|
|
14
|
|
0
|
|
2.20%
|
|
0.04%
|
|
Mining and quarrying
|
|
2,871
|
|
106
|
|
20
|
|
3.70%
|
|
0.68%
|
|
Manufacturing
|
|
26,050
|
|
556
|
|
107
|
|
2.14%
|
|
0.41%
|
|
Electricity, gas, steam and air conditioning supply
|
|
3,419
|
|
40
|
|
(0)
|
|
1.16%
|
|
(0.01%)
|
|
Water supply, sewerage, waste management and remediation activities
|
|
681
|
|
12
|
|
0
|
|
1.70%
|
|
0.02%
|
|
Construction
|
|
4,440
|
|
212
|
|
23
|
|
4.77%
|
|
0.51%
|
|
Wholesale and retail trade, repair of motor vehicles and motorcycles
|
|
20,697
|
|
557
|
|
37
|
|
2.69%
|
|
0.18%
|
|
Transport and storage
|
|
5,575
|
|
108
|
|
8
|
|
1.94%
|
|
0.15%
|
|
Accommodation and food service activities
|
|
2,427
|
|
35
|
|
11
|
|
1.44%
|
|
0.44%
|
|
Information and communication
|
|
5,525
|
|
110
|
|
2
|
|
2.00%
|
|
0.03%
|
|
Financial and insurance activities
|
|
84,770
|
|
389
|
|
164
|
|
0.46%
|
|
0.19%
|
|
Real estate activities
|
|
41,796
|
|
188
|
|
50
|
|
0.45%
|
|
0.12%
|
|
Professional, scientific and technical activities
|
|
7,707
|
|
121
|
|
7
|
|
1.57%
|
|
0.09%
|
|
Administrative and support service activities
|
|
9,112
|
|
125
|
|
16
|
|
1.37%
|
|
0.18%
|
|
Public administration and defense, compulsory social security
|
|
6,139
|
|
22
|
|
(0)
|
|
0.36%
|
|
(0.00%)
|
|
Education
|
|
205
|
|
2
|
|
0
|
|
0.89%
|
|
0.24%
|
|
Human health services and social work activities
|
|
3,436
|
|
17
|
|
1
|
|
0.50%
|
|
0.03%
|
|
Arts, entertainment and recreation
|
|
929
|
|
7
|
|
10
|
|
0.79%
|
|
1.12%
|
|
Other service activities
|
|
4,696
|
|
75
|
|
1
|
|
1.59%
|
|
0.01%
|
|
Activities of households as employers, undifferentiated goods- and services- producing activities of households for own use
|
|
200,694
|
|
2,110
|
|
266
|
|
1.05%
|
|
0.13%
|
|
Activities of extraterritorial organizations and bodies
|
|
1
|
|
1
|
|
0
|
|
54.52%
|
|
0.00%
|
|
Total
|
|
431,807
|
|
4,808
|
|
723
|
|
1.11%
|
|
0.17%
|
|
|
|
|
|
|
|
|
|
|
|
|
1
Credit ratio defined as allowance for credit losses to total loans at amortized cost at the end of period in this table excludes collateral. Considering collateral, credit ratio is materially higher.
Loan at Amortized Cost exposure remained roughly stable, with a slight reduction of € 2 billion in 2020 compared to 2019.
Loan loss allowance increased by € 817 million or 20 % in 2020 versus 2019, which was attributable to sectors: Activities as households, Financial and insurance activities as well as Wholesale and retail trade, driven by new defaults across business divisions and the increase against the existing POCI loan portfolio in 2020.
Net charge-offs decreased by € 78 million or 10 % in 2020 year-over-year, due to less write-offs in our shipping portfolio within the Transportation and storage sector.
|
S-7
|
|
|
Deutsche Bank
|
Imprint
|
|
|
Annual Report 2021 on Form 20-F
|
|
|
|
|
|
|
|
|
Dec 31, 2019
|
||||||||
|
in € m.
|
|
Loans at amotized cost (Gross carrying Amount)
|
|
Allowance for credit losses
|
|
Net Charge Offs
|
|
Allowance for credit losses to total loans at amortized cost at end of period (%) ¹
|
|
Net charge-offs during the period to average loans at amotized cost outstanding during the period (%)
|
|
Agriculture, forestry and fishing
|
|
666
|
|
12
|
|
10
|
|
1.81%
|
|
1.48%
|
|
Mining and quarrying
|
|
2,529
|
|
19
|
|
(0)
|
|
0.75%
|
|
(0.01%)
|
|
Manufacturing
|
|
28,489
|
|
546
|
|
130
|
|
1.92%
|
|
0.46%
|
|
Electricity, gas, steam and air conditioning supply
|
|
4,082
|
|
13
|
|
2
|
|
0.32%
|
|
0.06%
|
|
Water supply, sewerage, waste management and remediation activities
|
|
755
|
|
11
|
|
1
|
|
1.41%
|
|
0.17%
|
|
Construction
|
|
3,616
|
|
233
|
|
45
|
|
6.45%
|
|
1.24%
|
|
Wholesale and retail trade, repair of motor vehicles and motorcycles
|
|
20,520
|
|
425
|
|
129
|
|
2.07%
|
|
0.63%
|
|
Transport and storage
|
|
4,703
|
|
76
|
|
118
|
|
1.62%
|
|
2.52%
|
|
Accommodation and food service activities
|
|
2,432
|
|
22
|
|
3
|
|
0.90%
|
|
0.11%
|
|
Information and communication
|
|
5,726
|
|
43
|
|
16
|
|
0.75%
|
|
0.27%
|
|
Financial and insurance activities
|
|
86,791
|
|
220
|
|
(49)
|
|
0.25%
|
|
(0.06%)
|
|
Real estate activities
|
|
44,841
|
|
151
|
|
7
|
|
0.34%
|
|
0.02%
|
|
Professional, scientific and technical activities
|
|
8,899
|
|
117
|
|
10
|
|
1.31%
|
|
0.11%
|
|
Administrative and support service activities
|
|
5,354
|
|
59
|
|
(7)
|
|
1.11%
|
|
(0.14%)
|
|
Public administration and defense, compulsory social security
|
|
6,606
|
|
12
|
|
0
|
|
0.19%
|
|
0.00%
|
|
Education
|
|
333
|
|
2
|
|
1
|
|
0.52%
|
|
0.22%
|
|
Human health services and social work activities
|
|
3,466
|
|
17
|
|
2
|
|
0.50%
|
|
0.07%
|
|
Arts, entertainment and recreation
|
|
836
|
|
6
|
|
5
|
|
0.77%
|
|
0.57%
|
|
Other service activities
|
|
4,050
|
|
76
|
|
38
|
|
1.88%
|
|
0.95%
|
|
Activities of households as employers, undifferentiated goods- and services-producing activities of households for own use
|
|
199,138
|
|
1,929
|
|
341
|
|
0.97%
|
|
0.17%
|
|
Activities of extraterritorial organizations and bodies
|
|
3
|
|
1
|
|
(0)
|
|
20.18%
|
|
(0.00%)
|
|
Total
|
|
433,834
|
|
3,990
|
|
802
|
|
0.92%
|
|
0.18%
|
|
|
|
|
|
|
|
|
|
|
|
|
1
Credit ratio defined as allowance for credit losses to total loans at amortized cost at the end of period in this table excludes collateral. Considering collateral, credit ratio is materially higher.
Foreign outstandings
The following tables list only those countries for which the cross-border outstandings exceeded 0.75 % of the Group’s total assets as of December 31, 2021, 2020 and 2019. Offsetting of local country claims is done for third party liabilities of the respective foreign offices that represent legal obligations of the foreign offices and for which no payment is guaranteed at locations outside of the country of the office. As of December 31, 2021, there were no outstandings that exceeded 0.75 % of total assets in any country currently facing debt restructuring or liquidity problems that the Group expects would materially impact the country’s ability to service its obligations.
|
|
|
Dec 31, 2021
|
||||||||||||
|
in € m.
(unless stated otherwise)
|
|
Banks and
other financial
institutions
|
|
Governments
and Official
institutions
|
|
Other
1
|
|
Commit-
ments
|
|
Net local
country claim
|
|
Total
|
|
in %
|
|
USA
|
|
5,246
|
|
32,696
|
|
85,922
|
|
7,863
|
|
133,783
|
|
265,510
|
|
20.05
|
|
Great Britain
|
|
3,056
|
|
21,943
|
|
16,152
|
|
6,478
|
|
22,610
|
|
70,239
|
|
5.31
|
|
Luxembourg
|
|
8,167
|
|
4,142
|
|
28,865
|
|
3,889
|
|
7,911
|
|
52,974
|
|
4.00
|
|
Italy
|
|
2,535
|
|
11,904
|
|
10,266
|
|
1,547
|
|
23,435
|
|
49,687
|
|
3.75
|
|
France
|
|
2,865
|
|
15,147
|
|
19,620
|
|
7,212
|
|
2,542
|
|
47,386
|
|
3.58
|
|
Spain
|
|
1,934
|
|
16,311
|
|
10,688
|
|
1,786
|
|
−
|
|
30,719
|
|
2.32
|
|
Switzerland
|
|
1,477
|
|
3,784
|
|
13,403
|
|
4,733
|
|
1,185
|
|
24,582
|
|
1.86
|
|
Ireland
|
|
208
|
|
2,887
|
|
12,785
|
|
2,177
|
|
−
|
|
18,057
|
|
1.36
|
|
Netherlands
|
|
927
|
|
3,115
|
|
6,459
|
|
4,662
|
|
−
|
|
15,163
|
|
1.15
|
|
Belgium
|
|
1,202
|
|
5,219
|
|
2,865
|
|
1,647
|
|
−
|
|
10,933
|
|
0.83
|
|
|
|
|
|
|
|
|
|
|
|
|
|
|
|
|
1
Other includes commercial and industrial, insurance and other loans.
|
S-8
|
|
|
Deutsche Bank
|
Imprint
|
|
|
Annual Report 2021 on Form 20-F
|
|
|
|
|
|
|
|
|
Dec 31, 2020
|
||||||||||||
|
in € m.
(unless stated otherwise)
|
|
Banks and
other financial
institutions
|
|
Governments
and Official
institutions
|
|
Other
1
|
|
Commit-
ments
|
|
Net local
country claim
|
|
Total
|
|
in %
|
|
United States
|
|
4,962
|
|
30,094
|
|
73,257
|
|
5,761
|
|
109,188
|
|
223,262
|
|
16.85
|
|
Great Britain
|
|
3,576
|
|
20,387
|
|
13,243
|
|
5,854
|
|
33,159
|
|
76,219
|
|
5.75
|
|
France
|
|
2,951
|
|
18,369
|
|
21,550
|
|
6,173
|
|
3,420
|
|
52,463
|
|
3.96
|
|
Italy
|
|
1,796
|
|
14,286
|
|
9,687
|
|
1,072
|
|
22,742
|
|
49,583
|
|
3.74
|
|
Luxembourg
|
|
7,979
|
|
4,732
|
|
28,323
|
|
2,867
|
|
5,535
|
|
49,436
|
|
3.73
|
|
Spain
|
|
1,796
|
|
10,308
|
|
13,090
|
|
2,920
|
|
−
|
|
28,114
|
|
2.12
|
|
Netherlands
|
|
1,137
|
|
2,814
|
|
9,246
|
|
5,567
|
|
−
|
|
18,765
|
|
1.42
|
|
Switzerland
|
|
1,596
|
|
3,885
|
|
6,294
|
|
4,898
|
|
1,070
|
|
17,743
|
|
1.34
|
|
Ireland
|
|
272
|
|
2,481
|
|
12,508
|
|
1,288
|
|
−
|
|
16,548
|
|
1.25
|
|
Belgium
|
|
1,090
|
|
5,171
|
|
3,705
|
|
1,599
|
|
−
|
|
11,565
|
|
0.87
|
|
|
|
|
|
|
|
|
|
|
|
|
|
|
|
|
1
Other includes commercial and industrial, insurance and other loans.
|
|
|
Dec 31, 2019
|
||||||||||||
|
in € m.
(unless stated otherwise)
|
|
Banks and
other financial
institutions
|
|
Governments
and Official
institutions
|
|
Other
1
|
|
Commit-
ments
|
|
Net local
country claim
|
|
Total
|
|
in %
|
|
United States
|
|
4,276
|
|
27,261
|
|
89,587
|
|
10,671
|
|
134,877
|
|
266,673
|
|
20.55
|
|
Great Britain
|
|
2,602
|
|
17,252
|
|
14,242
|
|
5,950
|
|
35,686
|
|
75,732
|
|
5.84
|
|
Luxembourg
|
|
8,781
|
|
7,929
|
|
39,403
|
|
2,994
|
|
7,968
|
|
67,076
|
|
5.17
|
|
France
|
|
4,152
|
|
13,836
|
|
26,823
|
|
6,109
|
|
3,352
|
|
54,272
|
|
4.18
|
|
Italy
|
|
4,106
|
|
14,898
|
|
15,505
|
|
1,166
|
|
6,065
|
|
41,739
|
|
3.22
|
|
Spain
|
|
3,214
|
|
7,482
|
|
13,197
|
|
1,366
|
|
−
|
|
25,259
|
|
1.95
|
|
Ireland
|
|
787
|
|
1,570
|
|
20,329
|
|
1,418
|
|
−
|
|
24,103
|
|
1.86
|
|
Switzerland
|
|
3,142
|
|
5,541
|
|
8,441
|
|
5,204
|
|
666
|
|
22,994
|
|
1.77
|
|
Netherlands
|
|
1,690
|
|
2,638
|
|
9,928
|
|
5,469
|
|
−
|
|
19,726
|
|
1.52
|
|
Japan
|
|
511
|
|
305
|
|
9,129
|
|
332
|
|
−
|
|
10,277
|
|
0.79
|
|
|
|
|
|
|
|
|
|
|
|
|
|
|
|
|
1
Other includes commercial and industrial, insurance and other loans.
|
S-9
|
|
|
Deutsche Bank
|
Imprint
|
|
|
Annual Report 2021 on Form 20-F
|
|
|
|
|
|
Deposits
Information regarding average deposits balances and average interest rates on deposits is outlined in the table of Financial Condition above.
For purposes of the disclosure of uninsured time deposits, the residual amount of total time deposits vs insured time deposits has been considered. Insured time deposits have been identified considering both statutory and voluntary deposit protection schemes in each relevant jurisdiction. Below is an overview of the deposit protection schemes applicable for Deutsche Bank in its home country Germany:
Statutory depositor protection is stipulated by European directives in the European Union. These directives have been transformed into national law by the Deposit Guarantee Act (Einlagensicherungsgesetz, or EinSiG) in Germany. The statutory guarantee scheme ensures entitlement to compensation amounting up to €100k per depositor across all types of deposits – demand, time, and savings deposits – from selected depositors such as private individuals, partnerships, and corporations outside the financial industry.
The statutory deposit guarantee scheme is supplemented by a voluntary deposit guarantee fund established by the Federal Association of German Banks (BdB). This additional scheme protects deposits from private individuals, partnerships, and corporations outside the financial industry, covering current, time, and savings deposits, to the extent these are not already covered by the statutory compensation scheme, up to a coverage level per depositor of 15 % of the bank's own funds.
For this disclosure, across all domestic and foreign branches of Deutsche Bank AG, deposits from banks were considered 100 % uninsured, deposits from retail clients 100 % insured. For deposits from other depositors, a fixed percentage based on the proportion of time deposits to total deposits covered under the German statutory deposit guarantee scheme has been applied to estimate non-insured time deposits for this client group. All remaining entities of the Deutsche Bank group have determined the amount of uninsured time deposits following local requirements. As of year-end 2021, the group did not have any time deposits under FDIC insurance coverage on its books.
|
in € m.
|
|
Dec 31, 2021
|
|
|
U.S. time deposits in excess of FDIC insurance limit or similar state deposit insurance regimes
|
|
0
|
|
|
Time deposits that are otherwise uninsured, by maturity
|
|
|
|
|
3 months or less
|
|
20,917
|
|
|
over 3 months to 6 months
|
|
14,615
|
|
|
over 6 months to 12 months
|
|
8,430
|
|
|
over 12 months
|
|
16,874
|
|
|
Total Time deposits that are otherwise uninsured
|
|
60,836
|
|
|
Total Uninsured time deposits
|
|
60,836
|
|
|
|
|
|
|
Total deposits by foreign depositors in German offices were € 55.7 billion, € 44.8 billion and € 43.4 billion as of December 31, 2021, 2020 and 2019, respectively.
|
S-10
|
|
|
Deutsche Bank
|
Imprint
|
|
|
Annual Report 2021 on Form 20-F
|
|
|
|
|
|
Imprint
Deutsche Bank Aktiengesellschaft
Taunusanlage 12
60325 Frankfurt am Main (for letters and postcards: 60262)
Germany
Telephone: +49 69 910-00
deutsche.bank@db.com
|
S-11
|
TABLE OF CONTENTS
Part IItem 1: Identity Of Directors, Senior Management and AdvisersItem 2: Offer Statistics and Expected TimetableItem 3: Key InformationItem 4: Information on The CompanyItem 4A: Unresolved Staff CommentsItem 5: Operating and Financial Review and ProspectsItem 6: Directors, Senior Management and EmployeesItem 7: Major Shareholders and Related Party TransactionsItem 8: Financial InformationItem 9: The Offer and ListingItem 10: Additional InformationItem 11: Quantitative and Qualitative Disclosures About Credit, Market and Other RiskItem 12: Description Of Securities Other Than Equity SecuritiesPart IIItem 13: Defaults, Dividend Arrearages and DelinquenciesItem 14: Material Modifications To The Rights Of Security Holders and Use Of ProceedsItem 15: Controls and ProceduresItem 16A: Audit Committee Financial ExpertItem 16B: Code Of EthicsItem 16C: Principal Accountant Fees and ServicesItem 16D: Exemptions From The Listing Standards For Audit CommitteesItem 16E: Purchases Of Equity Securities By The Issuer and Affiliated PurchasersItem 16F: Change in Registrant S Certifying AccountantItem 16G: Corporate GovernanceItem 16H: Mine Safety DisclosureItem 16I: Disclosure Regarding Foreign Jurisdictions That Prevent InspectionsPart IIIItem 17: Financial StatementsItem 18: Financial StatementsItem 19: Exhibits