UNITED STATES
SECURITIES AND EXCHANGE COMMISSION
Washington, D.C. 20549
|
FORM 10-K
|
(Mark One)
x
ANNUAL REPORT PURSUANT TO SECTION 13 OR 15(d) OF THE SECURITIES EXCHANGE ACT OF 1934
For the fiscal year ended December 31, 2018
OR
¨
TRANSITION REPORT PURSUANT TO SECTION 13 OR 15(d) OF THE SECURITIES EXCHANGE ACT OF 1934
For the transition period from________to________
Commission File Number 001-38434
|
Dropbox, Inc.
|
|
(Exact name of registrant as specified in its charter)
|
|
Delaware
|
26-0138832
|
|||
|
(State or other jurisdiction of
incorporation or organization)
|
(I.R.S. Employer
Identification Number)
|
|||
|
Dropbox, Inc.
333 Brannan Street
San Francisco, California 94107
(Address of principal executive offices, including zip code)
(415) 857-6800
(Registrant's telephone number, including area code)
|
||
|
Title of each class
Class A Common Stock, par value $0.00001 per share
|
Name of exchange on which registered
The NASDAQ Stock Market LLC
(Nasdaq Global Select Market)
|
||
|
Securities registered pursuant to Section 12(g) of the Act
None
|
|||
Indicate by check mark if the registrant is a well-known seasoned issuer, as defined in Rule 405 of the Securities Act. Yes
¨
No
x
Indicate by check mark if the registrant is not required to file reports pursuant to Section 13 or Section 15(d) of the Securities Exchange Act of 1934 (the "Exchange Act"). Yes
¨
No
x
Indicate by check mark whether the registrant (1) has filed all reports required to be filed by Section 13 or 15(d) of the Securities Exchange Act of 1934 during the preceding 12 months (or for such shorter period that the registrant was required to file such reports) and (2) has been subject to such filing requirements for the past 90 days. Yes
x
No
¨
Indicate by check mark whether the registrant has submitted electronically every Interactive Data File required to be submitted pursuant to Rule 405 of Regulation S-T (§232.405 of this chapter) during the preceding 12 months (or for such shorter period that the registrant was required to submit such files). Yes
x
No
¨
Indicate by a check mark if disclosure of delinquent filers pursuant to Item 405 of Regulation S-K (§229.405 of this chapter) is not contained herein, and will not be contained, to the best of registrant’s knowledge, in definitive proxy or information statements incorporated by reference in Part III of this Form 10-K or any amendment to this Form 10-K.
x
Indicate by check mark whether the registrant is a large accelerated filer, an accelerated filer, a non-accelerated filer, a smaller reporting company, or an emerging growth company. See the definitions of “large accelerated filer,” “accelerated filer,” “smaller reporting company,” and “emerging growth company” in Rule 12b-2 of the Exchange Act. (Check one):
|
Large accelerated filer
|
|
¨
|
|
Accelerated filer
|
|
¨
|
|
Non-accelerated filer
|
|
x
|
|
Smaller reporting company
|
|
¨
|
|
Emerging growth
company
|
|
¨
|
|
|
||
If an emerging growth company, indicate by check mark if the registrant has elected not to use the extended transition period for complying with any new or revised financial accounting standards provided pursuant to Section 7(a)(2)(B) of the Securities Act.
¨
Indicate by check mark whether the registrant is a shell company (as defined in Rule 12b-2 of the Exchange Act). Yes
¨
No
x
The aggregate market value of the registrant's Class A common stock held by non-affiliates of the registrant, based on the closing price of a share of the registrant's Class A common stock on June 29, 2018 as reported by the NASDAQ Global Select Market on such date was approximately
$6,438.9
million. Shares of the registrant’s Class A common stock held by each executive officer, director and holder of 5% or more of the outstanding Class A common stock have been excluded as such persons may be deemed to be affiliates. This calculation does not reflect a determination that certain persons are affiliates of the registrant for any other purpose.
As of February 19, 2019, there were 213,030,982 shares of the registrant's Class A common stock, $0.00001 par value, were outstanding (which excludes 14,733,333 shares of Class A common stock subject to restricted stock awards that were granted pursuant to the Co-Founder Grants, and vest upon the satisfaction of a service condition and achievement of certain stock price goals); 198,242,857 shares of the registrant’s Class B common stock, $0.00001 par value, were outstanding; and no shares of the registrant’s Class C common stock, $0.00001 par value, were outstanding.
DOCUMENTS INCORPORATED BY REFERENCE
Portions of the registrant's definitive Proxy Statement relating to the 2019 Annual Meeting of Stockholders are incorporated herein by references in Part II and Part III of this Annual Report on Form 10-K to the extent stated herein. Such Proxy Statement will be filed with the Securities and Exchange Commission within 120 days of the registrant's fiscal year ended December 31, 2018.
|
TABLE OF CONTENTS
|
||
|
Page
|
||
|
Part I
|
||
|
Item 1.
|
||
|
Item 1A.
|
||
|
Item 1B.
|
||
|
Item 2.
|
||
|
Item 3.
|
||
|
Item 4.
|
||
|
Part II
|
||
|
Item 5.
|
||
|
Item 6.
|
||
|
Item 7.
|
||
|
Item 7A.
|
||
|
Item 8.
|
||
|
Item 9.
|
||
|
Item 9A.
|
||
|
Item 9B.
|
||
|
Part III
|
||
|
Item 10.
|
||
|
Item 11.
|
||
|
Item 12.
|
||
|
Item 13.
|
||
|
Item 14.
|
||
|
Part IV
|
||
|
Item 15.
|
||
|
Item 16.
|
||
2
SPECIAL NOTE REGARDING FORWARD-LOOKING STATEMENTS
This Annual Report on Form 10-K contains forward-looking statements within the meaning of Section 27A of the Securities Act of 1933, as amended, and Section 21E of the Securities Exchange Act of 1934, as amended, which statements involve substantial risk and uncertainties. Forward-looking statements generally relate to future events or our future financial or operating performance. In some cases, you can identify forward-looking statements because they contain words such as “may,” “will,” “should,” “expects,” “plans,” “anticipates,” “could,” “intends,” “target,” “projects,” “contemplates,” “believes,” “estimates,” “predicts,” “potential,” or “continue” or the negative of these words or other similar terms or expressions that concern our expectations, strategy, plans, or intentions. Forward-looking statements contained in this Annual Report on Form 10-K include, but are not limited to, statements about:
|
•
|
our ability to retain and upgrade paying users;
|
|
•
|
our ability to attract new users or convert registered users to paying users;
|
|
•
|
our future financial performance, including trends in revenue, costs of revenue, gross profit or gross margin, operating expenses, paying users, and free cash flow;
|
|
•
|
our ability to achieve or maintain profitability;
|
|
•
|
the demand for our platform or for content collaboration solutions in general;
|
|
•
|
possible harm caused by significant disruption of service or loss or unauthorized access to users’ content;
|
|
•
|
our ability to effectively integrate our platform with others;
|
|
•
|
our ability to compete successfully in competitive markets;
|
|
•
|
our ability to respond to rapid technological changes;
|
|
•
|
our expectations and management of future growth;
|
|
•
|
our ability to grow due to our lack of a significant outbound sales force;
|
|
•
|
our ability to attract large organizations as users;
|
|
•
|
our ability to offer high-quality customer support;
|
|
•
|
our ability to manage our international expansion;
|
|
•
|
our ability to attract and retain key personnel and highly qualified personnel;
|
|
•
|
our ability to protect our brand;
|
|
•
|
our ability to prevent serious errors or defects in our platform;
|
|
•
|
our ability to maintain, protect, and enhance our intellectual property; and
|
|
•
|
our ability to successfully identify, acquire, and integrate companies and assets.
|
We caution you that the foregoing list may not contain all of the forward-looking statements made in this Annual Report on Form 10-K.
You should not rely upon forward-looking statements as predictions of future events. We have based the forward-looking statements contained in this Annual Report on Form 10-K primarily on our current expectations and projections about future events and trends that we believe may affect our business, financial condition, results of operations, and prospects. The outcome of the events described in these forward-looking statements is subject to risks, uncertainties, and other factors described in the section titled “Risk Factors” and elsewhere in this Annual Report on Form 10-K. Moreover, we operate in a very competitive and rapidly changing environment. New risks and uncertainties emerge from time to time, and it is not
3
possible for us to predict all risks and uncertainties that could have an impact on the forward-looking statements contained in this Annual Report on Form 10-K. We cannot assure you that the results, events, and circumstances reflected in the forward-looking statements will be achieved or occur, and actual results, events, or circumstances could differ materially from those described in the forward-looking statements.
The forward-looking statements made in this Annual Report on Form 10-K relate only to events as of the date on which the statements are made. We undertake no obligation to update any forward-looking statements made in this Annual Report on Form 10-K to reflect events or circumstances after the date of this Annual Report on Form 10-K or to reflect new information or the occurrence of unanticipated events, except as required by law. We may not actually achieve the plans, intentions, or expectations disclosed in our forward-looking statements, and you should not place undue reliance on our forward-looking statements. Our forward-looking statements do not reflect the potential impact of any future acquisitions, mergers, dispositions, joint ventures, or investments we may make.
4
PART I.
ITEM 1. BUSINESS
Overview
Dropbox is a leading global collaboration platform that's transforming the way people work together, from the smallest business to the largest enterprise. With over 500 million registered users across more than 180 countries, our products are designed to establish a more enlightened way of working.
Dropbox was founded in 2007 with a simple idea: Life would be a lot better if everyone could access their most important information anytime from any device. Over the past decade, we’ve largely accomplished that mission—but along the way we recognized that for most of our users, sharing and collaborating on Dropbox was even more valuable than storing files.
Our market opportunity has grown as we’ve expanded from keeping files in sync to keeping teams in sync. Today, Dropbox is well positioned to reimagine the way work gets done. We’re focused on reducing the inordinate amount of time and energy the world wastes on “work about work”—tedious tasks like searching for content, switching between applications, and managing workflows. We believe the need for our platform will continue to grow as teams become more fluid and global, and content is increasingly fragmented across incompatible tools and devices. Dropbox breaks down silos by centralizing the flow of information between the products and services our users prefer, even if they’re not our own.
The popularity of our platform drives viral growth, which has allowed us to scale rapidly and efficiently. We’ve built a thriving global business with 12.7 million paying users.
What Sets Us Apart
Since the beginning, we’ve focused on simplifying the lives of our users. In a world where business software can be frustrating to use, challenging to integrate, and expensive to sell, we take a different approach.
Simple and intuitive design
While traditional tools developed in the desktop age have struggled to keep up with evolving user demands, Dropbox was designed for the cloud era. We build simple, beautiful products that bring joy to our users and make it easier for them to do their best work.
Open ecosystem
Because people use a wide variety of tools and platforms, Dropbox works seamlessly with other products, integrating with partners from Google and Microsoft to Slack and Zoom.
Viral, bottom-up adoption
Every year, millions of individual users sign up for Dropbox at work. Bottom-up adoption within organizations has been critical to our success as users increasingly choose their own tools at work. We generate over 90% of our revenue from self-serve channels—users who purchase a subscription through our app or website.
Performance and security
Our custom-built infrastructure allows us to maintain high standards of performance, availability, and security. Dropbox is built on proprietary, block-level sync technology to achieve industry-leading performance. We designed our platform with multiple layers of redundancy to guard against data loss and deliver high availability. We also offer numerous layers of protection, from secure file data transfer and encryption to network configuration and application-level controls.
Our Solution
Dropbox allows individuals, teams, and organizations to collaborate more effectively. Anyone can sign up for free through our website or app, and upgrade to a paid subscription plan for premium features. Our platform offers an elegant solution to the challenges described above.
Key elements of our platform
5
|
•
|
Unified home for content.
We provide a unified home for the world’s content and the relevant context around it. To date, our users have added hundreds of billions of pieces of content to Dropbox, totaling over an exabyte (more than 1,000,000,000 gigabytes) of data. When users join Dropbox, they gain access to a digital workspace that supports the full content lifecycle—they can create and organize their content, access it from anywhere, share it with internal and external collaborators, and review feedback and history.
|
|
•
|
Global sharing network.
We’ve built one of the largest collaboration platforms in the world, with more than 4.5 billion connections to shared content. We cater to the needs of dynamic, dispersed teams. The overwhelming majority of our customers use Dropbox to share and collaborate. As we continue to grow, more users benefit from frictionless sharing, and powerful network effects increase the utility and stickiness of our platform.
|
|
•
|
New product experiences and integrations.
The insights we glean from our community of users and our deep integrations with best-of-breed companies lead us to develop new product experiences and extend the capabilities of our platform. Products like Paper and Smart Sync, deep integrations with companies like Zoom, and our acquisition of e-signature and document workflow solution HelloSign help us provide our users with the functionality they need to do their best work.
Machine learning further improves the user experience by enabling more intelligent search and better organization and utility of information. This ongoing innovation broadens the value of our platform and deepens user engagement.
|
These elements reinforce one another to produce a powerful flywheel effect. As users create and share more content with more people, they expand our global sharing network. This network allows us to gather insights and feedback that help us create new product experiences. And with our scale, we can instantly put these innovations in the hands of millions. This, in turn, helps attract more users and content, which further propels the flywheel.
Our Capabilities
Dropbox is a digital workspace where individuals and teams can create content, access it from anywhere, and share it with collaborators. The power of our platform lies in the breadth of our capabilities and the diverse ways our users make Dropbox work for them. We monetize through a range of subscription plans. Our platform capabilities are described below:
Create
Paper
. With Paper, users can co-author content, tag others, create timelines, assign tasks with due dates, embed and comment on files, tables, checklists, code snippets, and rich media—all in real-time. We designed Paper to be simple and beautiful so users can focus on the most important ideas and tasks at hand.
Doc scanner
. The doc scanner in our mobile app lets users create content in Dropbox from hard copies. This includes transforming everything from printed materials to whiteboard brainstorming sessions into digital documents that users can edit and share. We apply proprietary machine learning techniques to automatically detect the document being scanned, extract it from the background, fit it to a rectangular shape, remove shadows, adjust the contrast, and save it as a PDF or image file. For Dropbox Business teams, scanned content is analyzed using Optical Character Recognition so text within these scans is searchable in Dropbox.
Access and organize
Search
. Dropbox has powerful search capabilities that allow users to quickly find the files and folders they need. Our autocomplete technology surfaces and prioritizes content based on users’ previous activity. For Dropbox Professional subscribers and Dropbox Business teams, full text search allows users to scan the entire content of their files.
Rich previews
. Rich previews allow users to easily interact with files across any device without having to open different applications. Users can comment on, annotate, review, and present files, and see who viewed and edited them. We support previews of over 280 file types, and Dropbox users currently preview files tens of millions of times every day.
Smart Sync
. With Smart Sync, users can access all of their content natively on their computers without taking up storage space on their local hard drives. We intelligently sync files to a user’s computer as they need them, and users can control which files or folders are always synced locally. With Smart Sync, files that are only stored in the cloud appear in the local file system and can be opened directly from Windows File Explorer or Mac Finder, instead of having to navigate to our web interface. Smart Sync is available to Dropbox Professional subscribers and Dropbox Business teams.
6
Version history
. As paying users work on files, our servers keep snapshots of all their changes. Users can see a file’s complete version history so they can reference and retrieve older versions if needed. Version histories are kept between 30 to 120 days for paying users, depending on subscription plan.
Third-party ecosystem
. Our open and thriving ecosystem fosters deeper relationships with our users and developers. Developers can build applications that connect to Dropbox through our DBX Developer Platform.
For example, email apps can plug into Dropbox to send attachments or shared links, video-conferencing apps allow users to start meetings and share content natively from Dropbox, and eSignature apps give users the ability to manage and maintain contract workflows all from within Dropbox.
As of December 31, 2018, Dropbox was receiving over 50 billion API calls per month and over 500,000 developers had registered and built applications on our platform. In addition, more than 75% of Dropbox Business teams have linked to one or more third-party applications.
Share
Folders
. There are three types of folders in Dropbox: private, shared, and team folders. A private folder allows an individual to sync files between devices. A shared folder allows users to quickly and easily start a project space for group collaboration. A team folder, which is only available for Dropbox Business teams, is a central, administrator-managed hub where they can store and collaborate on content.
Shared links
. Users can share files and folders with anyone, including non-Dropbox users, by creating a Dropbox link. Once created, the link can be sent through email, text, Facebook, Twitter, instant message, or other channels. The recipient can view the file with a rich preview or see all the files in a shared folder. Dropbox Professional subscribers and Dropbox Business teams can set passwords and expiration dates and specify whether recipients can comment on or download the files.
Showcase
. Showcase gives users a way to present their work to clients and business partners through a customizable, professionally branded webpage. Users can display visual previews of multiple files on the same page and add relevant context with introductory text and captions and an introduction. Showcase also lets users track how recipients engage with their content, including analytics on who has viewed, commented, or downloaded content on a per-person and per-file basis.
File requests
. With file requests, users can invite anyone to submit files into a specified Dropbox folder through a simple link—regardless of whether the recipient has a Dropbox account. File requests are ideal for tasks such as collecting bids from contractors or requesting submissions from coworkers and clients. All submitted files are organized into a Dropbox folder that’s private to the requesting user.
Collaborate
Comments and annotations
. Dropbox comments and annotations marry content with the conversations and relevant context around it. Instead of being scattered across separate silos, such as email and chat, the editing and development of content are tied to a file. Users can give feedback on specific parts of files through a rich, innovative overlay on our web and mobile platforms.
File activity stream.
An activity feed lives next to every file preview on our web interface, telling users what’s happening with a file. The feed shows when someone opens a file, edits a file, or shares a file.
Notifications
. We use real-time notifications across all our channels—web, desktop, email, and mobile—to keep users up-to-date on what’s happening with their work. Users can choose to be notified when someone opens, edits, shares, or comments on a file, or adds a file to their shared folders.
Viewer information and presence
. On both file previews and Paper docs, Dropbox shows users in real-time who’s viewing a doc and when a doc was last viewed by other users. On desktop, the Dropbox badge is a subtle overlay to Microsoft Word, Excel, and PowerPoint that lets users know if someone opens or edits the file they’re working in. The Dropbox badge gives users real-time insight into how others are interacting with their content, bringing modern collaboration features often found only in web-based documents to desktop files.
Secure
Security protections.
We employ strong protections for all of the data on our platform.
7
|
•
|
Encryption
. Dropbox file data at rest is encrypted using 256-bit Advanced Encryption Standard, or AES. To protect data in transit between Dropbox apps such as desktop, mobile, API, or web and our servers, Dropbox uses Secure Sockets Layer, or SSL, and Transport Layer Security, or TLS, for data transfer, creating a secure tunnel protected by 128-bit or higher AES encryption.
|
|
•
|
File recovery
. Every deletion event in Dropbox is recorded, including when groups of files are deleted. Users can easily recover files through our web interface. Dropbox Plus subscribers may recover prior versions for up to 30 days after deletion, and Dropbox Professional and Dropbox Business subscribers may recover prior versions for up to 120 days after deletion.
|
Administrator controls
. Dropbox Business team administrators have many ways to customize security settings in both global and granular ways.
|
•
|
Sharing permissions
: Team administrators can set up and monitor how their members share team folders, and can set sharing permissions on all folders, sub-folders, and links through the sharing tab.
|
|
•
|
Remote device wipe
: Team administrators can delete their organization’s Dropbox content from a member’s linked devices, which is especially useful should someone lose a device or leave the team.
|
|
•
|
Audit log
: Team administrators can monitor which members are sharing files and logging into Dropbox, among other events. They can review activity logs, create full reports for specific time ranges, and pull activity reports on specific members. Advanced and Enterprise team administrators have access to audit logs with file-event tracking.
|
|
•
|
Device approvals
: Advanced and Enterprise team administrators can manage how members access Dropbox on their devices.
|
|
•
|
Tiered administrator roles
: Advanced and Enterprise teams have the ability to set multiple administrator roles, each with a different set of permissions.
|
|
•
|
Network control
: Enterprise team administrators can restrict personal Dropbox usage on their organization’s network.
|
Third-party security integrations
. We’ve partnered with industry-leading third parties to enable us to provide a wide range of IT processes and satisfy industry compliance standards, including:
|
•
|
Security information and event management
: Allows Dropbox Business administrators to oversee and manage employee activity, and access sensitive data through the administrator page.
|
|
•
|
Data loss prevention
: Protects sensitive data like personally identifiable information and payment card industry data stored in Dropbox Business accounts.
|
|
•
|
eDiscovery and legal hold
: Enables secure search and the ability to collect and preserve electronically stored information in Dropbox Business accounts.
|
|
•
|
Digital rights management
: Provides third-party encryption for company data stored in Dropbox Business accounts.
|
|
•
|
Data migration and on-premises backup
: Assists in transferring large amounts of data between locations and securing sensitive information with on-site data backup.
|
|
•
|
Identity management
: Allows companies to keep their Dropbox Business team authenticated with an external identity provider like Active Directory.
|
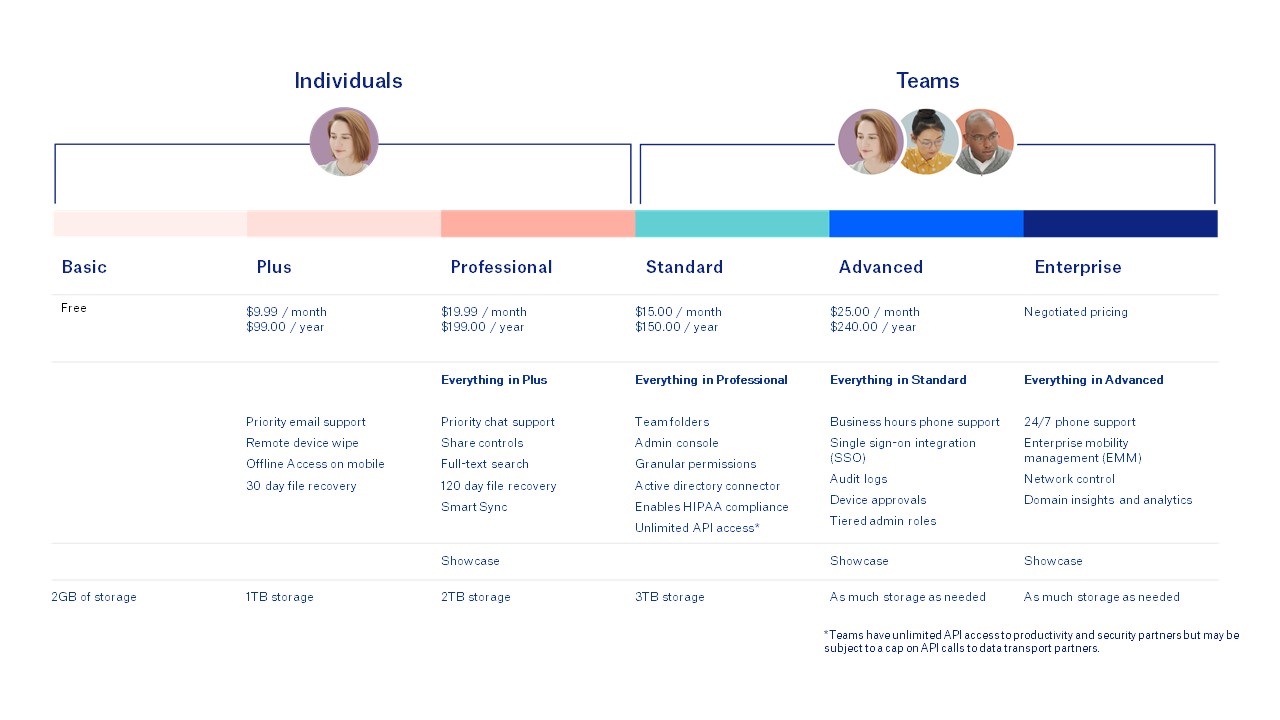
Our Subscription Plans
We offer subscription plans to serve the varying needs of our diverse customer base, which includes individuals, teams, and organizations of all sizes.
8
Our Customers
We’ve built a thriving global business with 12.7 million paying users. As of December 31, 2018, we had more than 400,000 paying Dropbox Business teams. Our customer base is highly diversified, and in 2016, 2017, and 2018, no customer accounted for more than 1% of our revenue. Our customers include individuals, teams, and organizations of all sizes, from freelancers and small businesses to Fortune 100 companies. They work across a wide range of industries, including professional services, technology, media, education, industrials, consumer and retail, and financial services. Within companies, our platform is used by all types of teams and functions, including sales, marketing, product, design, engineering, finance, legal, and human resources.
How we support our customers
All of our users can access support through the following resources:
|
•
|
Help center
: Provides an online repository of helpful information about our platform, responses to frequently asked questions, and best practices for use.
|
|
•
|
Community support
: Facilitates collaboration between users on answers, solutions, and ideas about our platform in an online community.
|
|
•
|
Twitter support
: Provides users real-time product and service updates, and offers tips and troubleshooting information.
|
|
•
|
Guided troubleshooting
: Offers step-by-step instructions to resolve common questions and provides a portal to submit help requests for questions that aren’t otherwise available.
|
We also offer additional support for our paying users as described above in “Our Subscription Plans.”
Our Sales and Marketing Approach
As users share content and collaborate on our platform, they introduce and invite new users, driving viral growth. We generate 90% of our revenue from self-serve channels, which reduces customer acquisition costs.
We’ve developed an efficient marketing function that’s focused on building brand awareness and reinforcing our self-serve model. Our goal is to rapidly demonstrate the value of our platform to our users in order to convert them to paying users and upgrade them to our premium offerings. We reach them through in-product prompts and notifications, time-limited trials of paid subscription plans, email, and lifecycle marketing. In 2018, hundreds of millions of devices—including computers,
9
phones, and tablets—were actively connected to the Dropbox platform, representing a large number of touchpoints to communicate with our users.
We complement our self-serve strategy with a focused outbound sales effort targeted at organizations with existing organic adoption of Dropbox. Once prospects are identified, our sales team works to broaden adoption of our platform into wider-scale deployments. We also acquire some users through paid marketing and distribution partnerships in which hardware manufacturers pre-install our software on their devices.
Our Technology Infrastructure and Operations
Our users trust us with their most important content, and we focus on providing them with a secure and easy-to-use platform. More than 90% of our users’ data is stored on our own custom-built infrastructure, which has been designed from the ground up to be reliable and secure, and to provide annual data durability of at least 99.999999999%. We have datacenter co-location facilities in California, Texas, and Virginia.
We also utilize Amazon Web Services, or AWS, for the remainder of our users’ storage needs and to help deliver our services. These AWS datacenters are located in the United States and Europe, which allows us to localize where content is stored. Our technology infrastructure, combined with select use of AWS resources, provides us with a distributed and scalable architecture on a global scale.
We designed our platform with multiple layers of redundancy to guard against data loss and deliver high availability. Incremental backups are performed hourly and full backups are performed daily. In addition, as a default, redundant copies of content are stored independently in at least two separate geographic regions and replicated reliably within each region.
Our Employees
As of December 31, 2018, we had 2,323 full-time employees. We also engage contractors and consultants. None of our employees are represented by a labor union. We have not experienced any work stoppages, and we believe that our employee relations are strong.
Our Commitment to Security and Privacy
Trust is the foundation of our relationship with our users, and we take significant measures every day to protect their privacy and security.
Security
Our sophisticated infrastructure is designed to protect our users’ content while it is transferred, stored, and processed. We offer multiple layers of protection, including secure file data transfer, encryption, network configuration, and application-level controls. For Dropbox Business teams, our tools also empower administrators with control and visibility features that allow them to customize our platform to their organizations’ needs. Our information security policies and management framework are designed to build a culture of security, and we continually assess risks and improve the security, confidentiality, integrity, and availability of our systems. We voluntarily engage third-party security auditors to test our systems and controls at least annually against the most widely recognized security standards and regulations.
We also encourage and support independent research through our bug bounty program, where we work with leading security researchers from around the world to maintain the high standards of security our users have come to expect.
Dropbox supports HIPAA and HITECH compliance. We sign business associate agreements with our customers who require them in order to comply with the Health Insurance Portability and Accountability Act, or HIPAA, and the Health Information Technology for Economic and Clinical Health Act, or HITECH. We also offer a HIPAA assessment report performed by an independent third party.
Privacy
We’re committed to keeping user data private. Our privacy policy details how users’ information is protected and the steps we take to protect it. Dropbox also has terms and guidelines for third-party developers to create applications that connect to Dropbox while respecting user privacy. Dropbox is certified under the EU-U.S. and Swiss-U.S. Privacy Shield and operates a robust privacy program.
10
Our Competition
The market for content collaboration platforms is competitive and rapidly changing. Certain features of our platform compete in the cloud storage market with products offered by Amazon, Apple, Google, and Microsoft, and in the content collaboration market with products offered by Atlassian, Google, and Microsoft. We compete with Box on a more limited basis in the cloud storage market for deployments by large enterprises. We also compete with smaller private companies that offer point solutions in the cloud storage market or the content collaboration market.
We believe that the principal competitive factors in our markets include the following:
|
•
|
user-centric design;
|
|
•
|
ease of adoption and use;
|
|
•
|
scale of user network;
|
|
•
|
features and platform experience;
|
|
•
|
performance;
|
|
•
|
brand;
|
|
•
|
security and privacy;
|
|
•
|
accessibility across several devices, operating systems, and applications;
|
|
•
|
third-party integration;
|
|
•
|
customer support;
|
|
•
|
continued innovation; and
|
|
•
|
pricing.
|
We believe we compete favorably across these factors and are largely unhindered by legacy constraints. However, some of our competitors may have greater name recognition, longer operating histories, more varied services, the ability to bundle a broader range of products and services, larger marketing budgets, established marketing relationships, access to larger user bases, major distribution agreements with hardware manufacturers and resellers, and greater financial, technical, and other resources.
Intellectual Property
We believe that our intellectual property rights are valuable and important to our business. We rely on patents, patent applications, trademarks, copyrights, trade secrets, know-how license agreements, confidentiality procedures, non-disclosure agreements, employee disclosure and invention assignment agreements, and other contractual rights to establish and protect our proprietary rights. In addition, from time to time we’ve purchased patents, inbound licenses, trademarks, domain names, and patent applications from third parties.
We have over 750 issued patents and more than 600 pending patent applications in the United States and abroad. These patents and patent applications seek to protect our proprietary inventions relevant to our business. In addition, we have a large number of inbound licenses to key patents in the file collaboration, storage, syncing, and sharing markets.
We have trademark rights in our name, our logo, and other brand indicia, and have trademark registrations for select marks in the United States and many other jurisdictions around the world. We also have registered domain names for websites that we use in our business, such as www.dropbox.com, and similar variations.
We intend to pursue additional intellectual property protection to the extent we believe it would be beneficial and cost effective. Despite our efforts to protect our intellectual property rights, they may not be respected in the future or may be invalidated, circumvented, or challenged. In addition, the laws of various foreign countries where our products are distributed may not protect our intellectual property rights to the same extent as laws in the United States.
Corporate Information
We were incorporated in May 2007 as Evenflow, Inc., a Delaware corporation, and changed our name to Dropbox, Inc. in October 2009. Our principal offices are located at 333 Brannan Street, San Francisco, California, 94107, and our telephone
11
number is (415) 857-6800. We completed our initial public offering in March 2018, and our Class A common stock is listed on the NASDAQ Global Select Market under the symbol “DBX.”
Available Information
Our website is located at http://www.dropbox.com/, and our investor relations website is located at http://investors.dropbox.com/. We have used, and intend to continue to use, our investor relations website as a means of disclosing material non-public information and for complying with our disclosure obligations under Regulation FD. The following filings are available through our investor relations website after we file them with the Securities and Exchange Commission ("SEC"): Annual Report on Form 10-K, Quarterly Reports on Form 10-Q, current reports on Form 8-K, and our Proxy Statement for our annual meeting of stockholders. These filings are also available for download free of charge on our investor relations website. The SEC also maintains an Internet website that contains reports, proxy statements and other information about issuers, like us, that file electronically with the SEC. The address of that website is www.sec.gov. The contents of these websites are not incorporated into this filing. Further, the Company’s references to the URLs for these websites are intended to be inactive textual references only.
12
ITEM 1A. RISK FACTORS
Investing in our Class A common stock involves a high degree of risk. In addition to the other information set forth in this Annual Report, you should carefully consider the risks and uncertainties described below, together with all of the other information in this Annual Report on Form 10-K, including the section titled “Management’s Discussion and Analysis of Financial Condition and Results of Operations” and our consolidated financial statements and related notes, before making a decision to invest in our Class A common stock. Our business, results of operations, financial condition, or prospects could also be harmed by risks and uncertainties that are not presently known to us or that we currently believe are not material. If any of the risks actually occur, our business, results of operations, financial condition, and prospects could be materially and adversely affected. In that event, the market price of our Class A common stock could decline, and you could lose all or part of your investment.
Risks Related to Our Business and Our Industry
Our business depends on our ability to retain and upgrade paying users, and any decline in renewals or upgrades could adversely affect our future results of operations.
Our business depends upon our ability to maintain and expand our relationships with our users. Our business is subscription based, and paying users are not obligated to and may not renew their subscriptions after their existing subscriptions expire. As a result, we cannot provide assurance that paying users will renew their subscriptions utilizing the same tier of our products or upgrade to premium offerings. Renewals of subscriptions to our platform may decline or fluctuate because of several factors, such as dissatisfaction with our products and support, a user no longer having a need for our products, or the perception that competitive products provide better or less expensive options. In addition, some paying users downgrade or do not renew their subscriptions.
We encourage paying users to upgrade to our premium offerings by recommending additional features and through in-product prompts and notifications. Additionally, we seek to expand within organizations through viral means by adding new users, having workplaces purchase additional products, or expanding the use of Dropbox into other departments within a workplace. We often see enterprise IT decision-makers deciding to adopt Dropbox after noticing substantial organic adoption by individuals and teams within the organization. If our paying users fail to renew or cancel their subscriptions, or if we fail to upgrade our paying users to premium offerings or expand within organizations, our business, results of operations, and financial condition may be harmed.
Although it is important to our business that our users renew their subscriptions after their existing subscriptions expire and that we expand our commercial relationships with our users, given the volume of our users, we do not actively monitor the retention rates of our individual users. As a result, we may be unable to address any retention issues with specific users in a timely manner, which could harm our business.
Our future growth could be harmed if we fail to attract new users or convert registered users to paying users.
We must continually add new users to grow our business beyond our current user base and to replace users who choose not to continue to use our platform. Historically, our revenue has been driven by our self-serve model, and we generate more than 90% of our revenue from self-serve channels. Any decrease in user satisfaction with our products or support could harm our brand, word-of-mouth referrals, and ability to grow.
Additionally, many of our users initially access our platform free of charge. We strive to demonstrate the value of our platform to our registered users, thereby encouraging them to convert to paying users through in-product prompts and notifications, and time-limited trials of paid subscription plans. As of
December 31, 2018
, we served over 500 million registered users but only 12.7 million paying users. The actual number of unique users is lower than we report as one person may register more than once for our platform. As a result, we have fewer unique registered users that we may be able to convert to paying users. A majority of our registered users may never convert to a paid subscription to our platform.
In addition, our user growth rate may slow in the future as our market penetration rates increase and we turn our focus to converting registered users to paying users rather than growing the total number of registered users. If we are not able to continue to expand our user base or fail to convert our registered users to paying users, demand for our paid services and our revenue may grow more slowly than expected or decline.
Our revenue growth rate has declined in recent periods and may continue to slow in the future.
13
We have experienced significant revenue growth in prior periods. However, our rates of revenue growth are slowing and may continue to slow in the future. Many factors may contribute to declines in our growth rates, including higher market penetration, increased competition, slowing demand for our platform, a decrease in the growth of the overall content collaboration market, a failure by us to continue capitalizing on growth opportunities, and the maturation of our business, among others. You should not rely on the revenue growth of any prior quarterly or annual period as an indication of our future performance. If our growth rates decline, investors’ perceptions of our business and the trading price of our Class A common stock could be adversely affected.
We have a history of net losses, we anticipate increasing expenses in the future, and we may not be able to achieve or maintain profitability.
We have incurred net losses on an annual basis since our inception. We incurred net losses of
$484.9
million, $111.7 million, and $210.2 million, in the years ended December 31, 2018, 2017 and 2016, respectively, and we had an accumulated deficit of
$1,659.5
million as of
December 31, 2018
. As we strive to grow our business, we expect expenses to increase in the near term, particularly as we continue to make investments to scale our business. For example, we will need an increasing amount of technical infrastructure to continue to satisfy the needs of our user base. We also expect our research and development expenses to increase as we plan to continue to hire employees for our engineering, product, and design teams to support these efforts. In addition, we will incur additional rent expense in connection with our move to our new corporate headquarters, and additional general and administrative expenses to support both our growth as well as our transition to being a publicly traded company. These investments may not result in increased revenue or growth in our business. We may encounter unforeseen or unpredictable factors, including unforeseen operating expenses, complications, or delays, which may result in increased costs. Furthermore, it is difficult to predict the size and growth rate of our market, user demand for our platform, user adoption and renewal of our platform, the entry of competitive products and services, or the success of existing competitive products and services. As a result, we may not achieve or maintain profitability in future periods. If we fail to grow our revenue sufficiently to keep pace with our investments and other expenses, our results of operations and financial condition would be adversely affected.
Our business could be damaged, and we could be subject to liability if there is any unauthorized access to our data or our users’ content, including through privacy and data security breaches.
The use of our platform involves the transmission, storage, and processing of user content, some of which may be considered personally identifiable, confidential, or sensitive. We face security threats from malicious third parties that could obtain unauthorized access to our systems, infrastructure, and networks. We anticipate that these threats will continue to grow in scope and complexity over time. For example, in 2016, we learned that an old set of Dropbox user credentials for approximately 68 million accounts was released. These credentials consisted of email addresses and passwords protected by cryptographic techniques known as hashing and salting. Hashing and salting can make it more difficult to obtain the original password, but may not fully protect the original password from being obtained. We believe these Dropbox user credentials were obtained in 2012 and related to a security incident we disclosed to users. In response, we notified all existing users we believed to be affected and completed a password reset for anyone who had not updated their password since mid-2012. We have responded to this event by expanding our security team and data monitoring capabilities and continuing to work on features such as two-factor authentication to increase protection of user information. While we believe our corrective actions will reduce the likelihood of similar incidents occurring in the future, third parties might use techniques that we are unable to defend against to compromise and infiltrate our systems, infrastructure, and networks. We may fail to detect the existence of a breach of user content and be unable to prevent unauthorized access to user and company content. The techniques used to obtain unauthorized access, disable or degrade service, or sabotage systems change frequently and are often not recognized until launched against a target. They may originate from less regulated or remote areas around the world, or from state-sponsored actors. If our security measures are breached, or our users’ content is otherwise accessed through unauthorized means, or if any such actions are believed to occur, our platform may be perceived as insecure, and we may lose existing users or fail to attract and retain new users.
We may rely on third parties when deploying our infrastructure, and in doing so, expose it to security risks outside of our direct control. We rely on outside vendors and contractors to perform services necessary for the operation of the business, and they may fail to adequately secure our user and company content.
In addition, certain developers or other partners who create applications that integrate with our platform, may receive or store information provided by us or by our users through these applications. If these third parties or developers fail to adopt or adhere to adequate data security practices, or in the event of a breach of their networks, our data or our users' data may be improperly accessed, used, or disclosed.
14
Third parties may attempt to compromise our employees and their privileged access into internal systems to gain access to accounts, our information, our networks, or our systems. Employee error, malfeasance, or other errors in the storage, use, or transmission of personal information could result in an actual or perceived breach of user privacy. Our users may also disclose or lose control of their passwords, or use the same or similar passwords on third parties’ systems, which could lead to unauthorized access to their accounts on our platform.
Any unauthorized or inadvertent access to, or an actual or perceived security breach of, our systems, infrastructure, or networks could result in an actual or perceived loss of, or unauthorized access to, our data or our users’ content, regulatory investigations and orders, litigation, indemnity obligations, damages, penalties, fines, and other costs in connection with actual and alleged contractual breaches, violations of applicable laws and regulations, and other liabilities. Any such incident could also materially damage our reputation and harm our business, results of operations, and financial condition, including reducing our revenue, causing us to issue credits to users, negatively impacting our ability to accept and process user payment information, eroding our users’ trust in our services and payment solutions, subjecting us to costly user notification or remediation, harming our ability to retain users, harming our brand, or increasing our cost of acquiring new users. We maintain errors, omissions, and cyber liability insurance policies covering certain security and privacy damages. However, we cannot be certain that our coverage will be adequate for liabilities actually incurred or that insurance will continue to be available to us on economically reasonable terms, or at all. Further, if a high profile security breach occurs with respect to another content collaboration solutions provider, our users and potential users could lose trust in the security of content collaboration solutions providers generally, which could adversely impact our ability to retain users or attract new ones.
Our business could be harmed by any significant disruption of service on our platform or loss of content.
Our brand, reputation, and ability to attract, retain, and serve our users are dependent upon the reliable performance of our platform, including our underlying technical infrastructure. Our users rely on our platform to store digital copies of their valuable content, including financial records, business information, documents, photos, and other important content. Our technical infrastructure may not be adequately designed with sufficient reliability and redundancy to avoid performance delays or outages that could be harmful to our business. If our platform is unavailable when users attempt to access it, or if it does not load as quickly as they expect, users may not use our platform as often in the future, or at all.
As our user base and the amount and types of information stored, synced, and shared on our platform continues to grow, we will need an increasing amount of technical infrastructure, including network capacity and computing power, to continue to satisfy the needs of our users. During 2015 and 2016, we migrated the vast majority of user content to our own custom-built infrastructure in co-location facilities that we directly lease and operate. As we add to our infrastructure, we may move or transfer additional content.
Further, as we continue to grow and scale our business to meet the needs of our users, we may overestimate or underestimate our infrastructure capacity requirements, which could adversely affect our results of operations. The costs associated with leasing and maintaining our custom-built infrastructure in co-location facilities and third-party datacenters already constitute a significant portion of our capital and operating expenses. We continuously evaluate our short- and long-term infrastructure capacity requirements to ensure adequate capacity for new and existing users while minimizing unnecessary excess capacity costs. If we overestimate the demand for our platform and therefore secure excess infrastructure capacity, our operating margins could be reduced. If we underestimate our infrastructure capacity requirements, we may not be able to service the expanding needs of new and existing users, and our hosting facilities, network, or systems may fail.
In addition, the datacenters that we use are vulnerable to damage or interruption from human error, intentional bad acts, earthquakes, floods, fires, war, terrorist attacks, power losses, hardware failures, systems failures, telecommunications failures, and similar events, any of which could disrupt our service, destroy user content, or prevent us from being able to continuously back up or record changes in our users’ content. In the event of significant physical damage to one of these datacenters, it may take a significant period of time to achieve full resumption of our services, and our disaster recovery planning may not account for all eventualities. Damage or interruptions to these datacenters could harm our platform and business.
We generate revenue from sales of subscriptions to our platform, and any decline in demand for our platform or for content collaboration solutions in general could negatively impact our business.
We generate, and expect to continue to generate, revenue from the sale of subscriptions to our platform. As a result, widespread acceptance and use of content collaboration solutions in general, and our platform in particular, is critical to our future growth and success. If the content collaboration market fails to grow or grows more slowly than we currently anticipate, demand for our platform could be negatively affected.
15
Changes in user preferences for content collaboration may have a disproportionately greater impact on us than if we offered multiple platforms or disparate products. Demand for content collaboration solutions in general, and our platform in particular, is affected by a number of factors, many of which are beyond our control. Some of these potential factors include:
|
•
|
awareness of the content collaboration category generally;
|
|
•
|
availability of products and services that compete with ours;
|
|
•
|
ease of adoption and use;
|
|
•
|
features and platform experience;
|
|
•
|
performance;
|
|
•
|
brand;
|
|
•
|
security and privacy;
|
|
•
|
customer support; and
|
|
•
|
pricing.
|
The content collaboration market is subject to rapidly changing user demand and trends in preferences. If we fail to successfully predict and address these changes and trends, meet user demands, or achieve more widespread market acceptance of our platform, our business, results of operations, and financial condition could be harmed.
Our business depends upon the interoperability of our platform across devices, operating systems, and third-party applications that we do not control.
One of the most important features of our platform is its broad interoperability with a range of diverse devices, operating systems, and third-party applications. Our platform is accessible from the web and from devices running Windows, Mac OS, iOS, Android, WindowsMobile, and Linux. We also have integrations with Microsoft, Adobe, Apple, Salesforce, Atlassian, Slack, IBM, Cisco, VMware, Okta, Symantec, Palo Alto Networks, and a variety of other productivity, collaboration, data management, and security vendors. We are dependent on the accessibility of our platform across these third-party operating systems and applications that we do not control. Several of our competitors own, develop, operate, or distribute operating systems, app stores, third-party datacenter services, and other software, and also have material business relationships with companies that own, develop, operate, or distribute operating systems, applications markets, third-party datacenter services, and other software that our platform requires in order to operate. Moreover, some of these competitors have inherent advantages developing products and services that more tightly integrate with their software and hardware platforms or those of their business partners.
Third-party services and products are constantly evolving, and we may not be able to modify our platform to assure its compatibility with that of other third parties following development changes. In addition, some of our competitors may be able to disrupt the operations or compatibility of our platform with their products or services, or exert strong business influence on our ability to, and terms on which we, operate and distribute our platform. For example, we currently offer products that directly compete with several large technology companies that we rely on to ensure the interoperability of our platform with their products or services. As our respective products evolve, we expect this level of competition to increase. Should any of our competitors modify their products or standards in a manner that degrades the functionality of our platform or gives preferential treatment to competitive products or services, whether to enhance their competitive position or for any other reason, the interoperability of our platform with these products could decrease and our business, results of operations, and financial condition could be harmed.
We operate in competitive markets, and we must continue to compete effectively.
The market for content collaboration platforms is competitive and rapidly changing. Certain features of our platform compete in the cloud storage market with products offered by Amazon, Apple, Google, and Microsoft, and in the content collaboration market with products offered by Atlassian, Google, and Microsoft. We compete with Box on a more limited basis in the cloud storage market for deployments by large enterprises. We also compete with smaller private companies that offer
16
point solutions in the cloud storage market or the content collaboration market. We believe the principal competitive factors in our markets include the following:
|
•
|
user-centric design;
|
|
•
|
ease of adoption and use;
|
|
•
|
scale of user network;
|
|
•
|
features and platform experience
|
|
•
|
performance;
|
|
•
|
brand;
|
|
•
|
security and privacy
|
|
•
|
accessibility across several devices, operating system, and applications;
|
|
•
|
third-party integration;
|
|
•
|
customer support;
|
|
•
|
continued innovation; and
|
|
•
|
pricing.
|
With the introduction of new technologies and market entrants, we expect competition to intensify in the future. Many of our actual and potential competitors benefit from competitive advantages over us, such as greater name recognition, longer operating histories, more varied products and services, larger marketing budgets, more established marketing relationships, access to larger user bases, major distribution agreements with hardware manufacturers and resellers, and greater financial, technical, and other resources. Some of our competitors may make acquisitions or enter into strategic relationships to offer a broader range of products and services than we do. These combinations may make it more difficult for us to compete effectively. We expect these trends to continue as competitors attempt to strengthen or maintain their market positions.
Demand for our platform is also sensitive to price. Many factors, including our marketing, user acquisition and technology costs, and our current and future competitors’ pricing and marketing strategies, can significantly affect our pricing strategies. Certain of our competitors offer, or may in the future offer, lower-priced or free products or services that compete with our platform or may bundle and offer a broader range of products and services. Similarly, certain competitors may use marketing strategies that enable them to acquire users at a lower cost than us. There can be no assurance that we will not be forced to engage in price-cutting initiatives or to increase our marketing and other expenses to attract and retain users in response to competitive pressures, either of which could materially and adversely affect our business, results of operations, and financial condition.
We may not be able to respond to rapid technological changes, extend our platform, or develop new features or products.
The content collaboration market is characterized by rapid technological change and frequent new product and service introductions. Our ability to grow our user base and increase revenue from existing users will depend heavily on our ability to enhance and improve our platform, introduce new features and products, increase our strategic partnerships with third parties, and interoperate across an increasing range of devices, operating systems, and third-party applications. Users may require features and capabilities that our current platform does not have. We invest significantly in research and development, and our goal is to focus our spending on measures that improve quality and ease of adoption and create organic user demand for our platform. For example, in 2017, we released Smart Sync, an advanced productivity feature, and introduced Paper, a new collaborative product experience. More recently, in 2018, we announced Dropbox Extensions, which allows users to initiate and manage workflows with third-party partner applications from Dropbox. There is no assurance that our enhancements to our platform or our new product experiences, partnerships, features, or capabilities will be compelling to our users or gain market acceptance. If our research and development investments do not accurately anticipate user demand, we are unsuccessful in establishing or maintaining our strategic partnerships, or if we fail to develop our platform in a manner that satisfies user preferences in a timely and cost-effective manner, we may fail to retain our existing users or increase demand for our platform.
17
The introduction of new products and services by competitors or the development of entirely new technologies to replace existing offerings could make our platform obsolete or adversely affect our business, results of operations, and financial condition. We may experience difficulties with software development, design, or marketing that could delay or prevent our development, introduction, or implementation of new product experiences, features, or capabilities. We have in the past experienced delays in our internally planned release dates of new features and capabilities, and there can be no assurance that new product experiences, features, or capabilities will be released according to schedule. Any delays could result in adverse publicity, loss of revenue or market acceptance, or claims by users brought against us, all of which could have a material and adverse effect on our reputation, business, results of operations, and financial condition. Moreover, new features to our platform may require substantial investment, and we have no assurance that such investments will be successful. If users do not widely adopt our new product experiences, features, and capabilities, we may not be able to realize a return on our investment. If we are unable to develop, license, or acquire new features and capabilities to our platform on a timely and cost-effective basis, or if such enhancements do not achieve market acceptance, our business, results of operations, and financial condition could be adversely affected.
We may not successfully manage our growth or plan for future growth.
Since our founding in 2007, we have experienced rapid growth. For example, our headcount has grown from 1,612 employees as of December 31, 2016, to 2,323 employees as of
December 31, 2018
, with employees located both in the United States and internationally. The growth and expansion of our business places a continuous significant strain on our management, operational, and financial resources. Further growth of our operations to support our user base or our expanding third-party relationships, our information technology systems, and our internal controls and procedures may not be adequate to support our operations. In addition, as we continue to grow, we face challenges of integrating, developing, and motivating a rapidly growing employee base in various countries around the world. Certain members of our management have not previously worked together for an extended period of time and some do not have prior experience managing a public company, which may affect how they manage our growth. Managing our growth will also require significant expenditures and allocation of valuable management resources.
In addition, our rapid growth may make it difficult to evaluate our future prospects. Our ability to forecast our future results of operations is subject to a number of uncertainties, including our ability to effectively plan for and model future growth. We have encountered in the past, and may encounter in the future, risks and uncertainties frequently experienced by growing companies in rapidly changing industries. If we fail to achieve the necessary level of efficiency in our organization as it grows, or if we are not able to accurately forecast future growth, our business, results of operations, and financial condition could be harmed.
Our lack of a significant outbound sales force may limit the potential growth of our business.
Historically, our business model has been driven by organic adoption and viral growth, with more than 90% of our revenue generated from self-serve channels. As a result, we do not have a significant outbound sales force, which has enabled us to be more efficient with our sales and marketing spend. Although we believe our business model can continue to scale without a large outbound sales force, our word-of-mouth and user referral marketing model may not continue to be as successful as we anticipate, and our limited experience selling directly to large organizations through our outbound sales force may impede our future growth. As we continue to scale our business, an enhanced sales infrastructure could assist in reaching larger organizations and growing our revenue. Identifying and recruiting additional qualified sales personnel and training them would require significant time, expense, and attention, and would significantly impact our business model. Further, adding more sales personnel would change our cost structure and results of operations, and we may have to reduce other expenses in order to accommodate a corresponding increase in sales and marketing expenses. If our limited experience selling and marketing to large organizations prevents us from reaching larger organizations and growing our revenue, and if we are unable to hire, develop, and retain talented sales personnel in the future, our business, results of operations, and financial condition could be adversely affected.
We may expand sales to large organizations, which could lengthen sales cycles and result in greater deployment challenges.
As our business evolves, we may need to invest more resources into sales to large organizations. Large organizations may undertake a significant evaluation and negotiation process, which can lengthen our sales cycle. We may also face unexpected deployment challenges with large organizations or more complicated deployment of our platform. Large organizations may demand more configuration and integration of our platform or require additional security management or control features. We may spend substantial time, effort, and money on sales efforts to large organizations without any assurance that our efforts will
18
produce any sales. As a result, sales to large organizations may lead to greater unpredictability in our business, results of operations, and financial condition.
Any failure to offer high-quality customer support may harm our relationships with our users and our financial results.
We have designed our platform to be easy to adopt and use with minimal to no support necessary. Any increased user demand for customer support could increase costs and harm our results of operations. In addition, as we continue to grow our operations and support our global user base, we need to be able to continue to provide efficient customer support that meets our customers’ needs globally at scale. Paying users receive additional customer support features and the number of our paying users has grown significantly, which will put additional pressure on our support organization. For example, the number of paying users has grown from 8.8 million as of December 31, 2016, to 12.7 million as of
December 31, 2018
. If we are unable to provide efficient customer support globally at scale, our ability to grow our operations may be harmed and we may need to hire additional support personnel, which could harm our results of operations. Our new user signups are highly dependent on our business reputation and on positive recommendations from our existing users. Any failure to maintain high-quality customer support, or a market perception that we do not maintain high-quality customer support, could harm our reputation, business, results of operations, and financial condition.
Our quarterly results may fluctuate significantly and may not fully reflect the underlying performance of our business.
Our quarterly results of operations, including our revenue, gross margin, operating margin, profitability, cash flow from operations, and deferred revenue, may vary significantly in the future and period-to-period comparisons of our results of operations may not be meaningful. Accordingly, the results of any one quarter should not be relied upon as an indication of future performance. Our quarterly results of operations may fluctuate as a result of a variety of factors, many of which are outside of our control, and as a result, may not fully reflect the underlying performance of our business. Fluctuation in quarterly results may negatively impact the value of our securities. Factors that may cause fluctuations in our quarterly results of operations include, without limitation, those listed below:
|
•
|
our ability to retain and upgrade paying users;
|
|
•
|
our ability to attract new paying users and convert registered to paying users;
|
|
•
|
the timing of expenses and recognition of revenue;
|
|
•
|
the amount and timing of operating expenses related to the maintenance and expansion of our business, operations, and infrastructure, as well as entry into operating and capital leases;
|
|
•
|
the timing of expenses related to acquisitions;
|
|
•
|
any large indemnification payments to our users or other third parties;
|
|
•
|
changes in our pricing policies or those of our competitors;
|
|
•
|
the timing and success of new product feature and service introductions by us or our competitors;
|
|
•
|
network outages or actual or perceived security breaches;
|
|
•
|
changes in the competitive dynamics of our industry, including consolidation among competitors;
|
|
•
|
changes in laws and regulations that impact our business; and
|
|
•
|
general economic and market conditions.
|
Our results of operations may not immediately reflect downturns or upturns in sales because we recognize revenue from our users over the term of their subscriptions with us.
We recognize revenue from subscriptions to our platform over the terms of these subscriptions. Our subscription arrangements generally have monthly or annual contractual terms, and we also have a small percentage of multi-year contractual terms. Amounts that have been billed are initially recorded as deferred revenue until the revenue is recognized. As a result, a large portion of our revenue for each quarter reflects deferred revenue from subscriptions entered into during previous
19
quarters, and downturns or upturns in subscription sales, or renewals and potential changes in our pricing policies may not be reflected in our results of operations until later periods. Our subscription model also makes it difficult for us to rapidly increase our revenue through additional sales in any period, as subscription revenue from new users is recognized over the applicable subscription term. By contrast, a significant majority of our costs are expensed as incurred, which occurs as soon as a user starts using our platform. As a result, an increase in users could result in our recognition of more costs than revenue in the earlier portion of the subscription term. We may not attain sufficient revenue to maintain positive cash flow from operations or achieve profitability in any given period.
We depend on our key personnel and other highly qualified personnel, and if we fail to attract, integrate, and retain our personnel, and maintain our unique corporate culture, our business could be harmed.
We depend on the continued service and performance of our key personnel. In particular, Andrew W. Houston, our President and Chief Executive Officer and one of our co-founders, is critical to our vision, strategic direction, culture, and offerings. From time to time, there may be changes in our management team resulting from the hiring or departure of our executives. For example, in the third quarter of 2018 we announced that Dennis Woodside, our former Chief Operating Officer, had resigned such role, remaining an advisor through the end of 2018. Some of our other key personnel have recently joined us and are still being integrated into our company. We may continue to make changes to our management team, which could make it difficult to execute on our business plans and strategies. New hires also require significant training and, in most cases, take significant time before they achieve full productivity. Our failure to successfully integrate these key personnel into our business could adversely affect our business.
We do not have long-term employment agreements with any of our officers or key personnel. In addition, many of our key technologies and systems are custom-made for our business by our key personnel. The loss of key personnel, including key members of our management team, as well as certain of our key marketing, sales, product development, or technology personnel, could disrupt our operations and have an adverse effect on our ability to grow our business.
To execute our growth plan, we must attract and retain highly qualified personnel. Competition for these employees is intense, particularly in the San Francisco Bay Area where our headquarters is located, and we may not be successful in attracting and retaining qualified personnel. We have from time to time in the past experienced, and we expect to continue to experience, difficulty in hiring and retaining highly skilled employees with appropriate qualifications. Our recent hires and planned hires may not become as productive as we expect, and we may be unable to hire, integrate, or retain sufficient numbers of qualified individuals. Many of the companies with which we compete for experienced personnel have greater resources than we have. In addition, in making employment decisions, particularly in the internet and high-technology industries, job candidates often consider the value of the equity they are to receive in connection with their employment. Employees may be more likely to leave us if the shares they own or the shares underlying their equity incentive awards have significantly appreciated or significantly reduced in value. Many of our employees may receive significant proceeds from sales of our equity in the public markets, which may reduce their motivation to continue to work for us. If we fail to attract new personnel, or fail to retain and motivate our current personnel, our business and growth prospects could be harmed.
Additionally, if we do not maintain and continue to develop our corporate culture as we grow and evolve, it could harm our ability to foster the innovation, creativity, and teamwork we believe that we need to support our growth. Additions of executive-level management and large numbers of employees could significantly and adversely impact our culture.
Our business depends on a strong brand, and if we are not able to maintain and enhance our brand, our ability to expand our base of users will be impaired and our business, results of operations, and financial condition will be harmed.
We believe that our brand identity and awareness have contributed to our success and have helped fuel our efficient go-to-market strategy. We also believe that maintaining and enhancing the Dropbox brand is critical to expanding our base of users. We anticipate that, as our market becomes increasingly competitive, maintaining and enhancing our brand may become increasingly difficult and expensive. Any unfavorable publicity or consumer perception of our platform or the providers of content collaboration solutions generally could adversely affect our reputation and our ability to attract and retain users. Additionally, if we fail to promote and maintain the Dropbox brand, our business, results of operations, and financial condition will be materially and adversely affected.
We are continuing to expand our operations outside the United States, where we may be subject to increased business and economic risks that could impact our results of operations.
We have paying users across 180 countries and approximately half of our revenue in the year ended
December 31, 2018
was generated from paying users outside the United States. We expect to continue to expand our international operations, which
20
may include opening offices in new jurisdictions and providing our platform in additional languages. Any new markets or countries into which we attempt to sell subscriptions to our platform may not be receptive. For example, we may not be able to expand further in some markets if we are not able to satisfy certain government- and industry-specific requirements. In addition, our ability to manage our business and conduct our operations internationally requires considerable management attention and resources and is subject to the particular challenges of supporting a rapidly growing business in an environment of multiple languages, cultures, customs, legal and regulatory systems, alternative dispute systems, and commercial markets. International expansion has required, and will continue to require, investment of significant funds and other resources. Operating internationally subjects us to new risks and may increase risks that we currently face, including risks associated with:
|
•
|
compliance with applicable international laws and regulations, including laws and regulations with respect to privacy, data protection, consumer protection, and unsolicited email, and the risk of penalties to our users and individual members of management or employees if our practices are deemed to be out of compliance;
|
|
•
|
recruiting and retaining talented and capable employees outside the United States, and maintaining our company culture across all of our offices;
|
|
•
|
providing our platform and operating our business across a significant distance, in different languages and among different cultures, including the potential need to modify our platform and features to ensure that they are culturally appropriate and relevant in different countries;
|
|
•
|
management of an employee base in jurisdictions that may not give us the same employment and retention flexibility as does the United States;
|
|
•
|
operating in jurisdictions that do not protect intellectual property rights to the same extent as does the United States;
|
|
•
|
compliance by us and our business partners with anti-corruption laws, import and export control laws, tariffs, trade barriers, economic sanctions, and other regulatory limitations on our ability to provide our platform in certain international markets;
|
|
•
|
foreign exchange controls that might require significant lead time in setting up operations in certain geographic territories and might prevent us from repatriating cash earned outside the United States;
|
|
•
|
political and economic instability;
|
|
•
|
changes in diplomatic and trade relationships, including the imposition of new trade restrictions, trade protection measures, import or export requirements, trade embargoes and other trade barriers;
|
|
•
|
double taxation of our international earnings and potentially adverse tax consequences due to changes in the income and other tax laws of the United States or the international jurisdictions in which we operate; and
|
|
•
|
higher costs of doing business internationally, including increased accounting, travel, infrastructure, and legal compliance costs.
|
Compliance with laws and regulations applicable to our global operations substantially increases our cost of doing business in international jurisdictions. We may be unable to keep current with changes in laws and regulations as they change. Although we have implemented policies and procedures designed to support compliance with these laws and regulations, there can be no assurance that we will always maintain compliance or that all of our employees, contractors, partners, and agents will comply. Any violations could result in enforcement actions, fines, civil and criminal penalties, damages, injunctions, or reputational harm. If we are unable comply with these laws and regulations or manage the complexity of our global operations successfully, our business, results of operations, and financial condition could be adversely affected.
Our results of operations, which are reported in U.S. dollars, could be adversely affected if currency exchange rates fluctuate substantially in the future.
We conduct our business across 180 countries around the world. As we continue to expand our international operations, we will become more exposed to the effects of fluctuations in currency exchange rates. This exposure is the result of selling in multiple currencies and operating in foreign countries where the functional currency is the local currency. In 2018, 30% of our sales were denominated in currencies other than U.S. dollars. Our expenses, by contrast, are primarily denominated in U.S.
21
dollars. As a result, any increase in the value of the U.S. dollar against these foreign currencies could cause our revenue to decline relative to our costs, thereby decreasing our gross margins. Our results of operations are primarily subject to fluctuations in the euro and British pound sterling. Because we conduct business in currencies other than U.S. dollars, but report our results of operations in U.S. dollars, we also face remeasurement exposure to fluctuations in currency exchange rates, which could hinder our ability to predict our future results and earnings and could materially impact our results of operations. We do not currently maintain a program to hedge exposures to non-U.S. dollar currencies.
We depend on our infrastructure and third-party datacenters, and any disruption in the operation of these facilities or failure to renew the services could adversely affect our business.
We host our services and serve all of our users using a combination of our own custom-built infrastructure that we lease and operate in co-location facilities and third-party datacenter services such as Amazon Web Services. While we typically control and have access to the servers we operate in co-location facilities and the components of our custom-built infrastructure that are located in those co-location facilities, we control neither the operation of these facilities nor our third-party service providers. Furthermore, we have no physical access or control over the services provided by Amazon Web Services.
Datacenter leases and agreements with the providers of datacenter services expire at various times. The owners of these datacenters and providers of these datacenter services may have no obligation to renew their agreements with us on commercially reasonable terms, or at all. Problems faced by datacenters, with our third-party datacenter service providers, with the telecommunications network providers with whom we or they contract, or with the systems by which our telecommunications providers allocate capacity among their users, including us, could adversely affect the experience of our users. Our third-party datacenter operators could decide to close their facilities or cease providing services without adequate notice. In addition, any financial difficulties, such as bankruptcy, faced by our third-party datacenters operators or any of the service providers with whom we or they contract may have negative effects on our business, the nature and extent of which are difficult to predict.
If the datacenters and service providers that we use are unable to keep up with our growing needs for capacity, or if we are unable to renew our agreements with datacenters, and service providers on commercially reasonable terms, we may be required to transfer servers or content to new datacenters or engage new service providers, and we may incur significant costs, and possible service interruption in connection with doing so. Any changes in third-party service levels at datacenters or any real or perceived errors, defects, disruptions, or other performance problems with our platform could harm our reputation and may result in damage to, or loss or compromise of, our users’ content. Interruptions in our platform might, among other things, reduce our revenue, cause us to issue refunds to users, subject us to potential liability, harm our reputation, or decrease our renewal rates.
We have relationships with third parties to provide, develop, and create applications that integrate with our platform, and our business could be harmed if we are not able to continue these relationships.
We use software and services licensed and procured from third parties to develop and offer our platform. We may need to obtain future licenses and services from third parties to use intellectual property and technology associated with the development of our platform, which might not be available to us on acceptable terms, or at all. Any loss of the right to use any software or services required for the development and maintenance of our platform could result in delays in the provision of our platform until equivalent technology is either developed by us, or, if available from others, is identified, obtained, and integrated, which could harm our platform and business. Any errors or defects in third-party software or services could result in errors or a failure of our platform, which could harm our business, results of operations, and financial condition.
We also depend on our ecosystem of developers to create applications that will integrate with our platform. As of
December 31, 2018
, Dropbox was receiving over 50 billion API calls per month, and more than 500,000 developers had registered and built applications on our platform. Our reliance on this ecosystem of developers creates certain business risks relating to the quality of the applications built using our APIs, service interruptions of our platform from these applications, lack of service support for these applications, and possession of intellectual property rights associated with these applications. We may not have the ability to control or prevent these risks. As a result, issues relating to these applications could adversely affect our business, brand, and reputation.
We are subject to a variety of U.S. and international laws that could subject us to claims, increase the cost of operations, or otherwise harm our business due to changes in the laws, changes in the interpretations of the laws, greater enforcement of the laws, or investigations into compliance with the laws.
22
We are subject to compliance with various laws, including those covering copyright, indecent content, child protection, consumer protection, and similar matters. There have been instances where improper or illegal content has been stored on our platform without our knowledge. As a service provider, we do not regularly monitor our platform to evaluate the legality of content stored on it. While to date we have not been subject to material legal or administrative actions as result of this content, the laws in this area are currently in a state of flux and vary widely between jurisdictions. Accordingly, it may be possible that in the future we and our competitors may be subject to legal actions, along with the users who uploaded such content. In addition, regardless of any legal liability we may face, our reputation could be harmed should there be an incident generating extensive negative publicity about the content stored on our platform. Such publicity could harm our business and results of operations.
We are also subject to consumer protection laws that may impact our sales and marketing efforts, including laws related to subscriptions, billing, and auto-renewal. These laws, as well as any changes in these laws, could adversely affect our self-serve model and make it more difficult for us to retain and upgrade paying users and attract new ones. Additionally, we have in the past, are currently, and may from time to time in the future become the subject of inquiries and other actions by regulatory authorities as a result of our business practices, including our subscription, billing, and auto-renewal policies. Consumer protection laws may be interpreted or applied by regulatory authorities in a manner that could require us to make changes to our operations or incur fines, penalties or settlement expenses, which may result in harm to our business, results of operations, and brand.
Our platform depends on the ability of our users to access the internet and our platform has been blocked or restricted in some countries for various reasons. For example, our platform is blocked in the People’s Republic of China. If we fail to anticipate developments in the law, or fail for any reason to comply with relevant law, our platform could be further blocked or restricted and we could be exposed to significant liability that could harm our business.
We are also subject to various U.S. and international anti-corruption laws, such as the U.S. Foreign Corrupt Practices Act, the U.K. Bribery Act, and Irish Criminal Justice (Corruption Offences) Act 2018, as well as other similar anti-bribery and anti-kickback laws and regulations. These laws and regulations generally prohibit companies and their employees and intermediaries from authorizing, offering, or providing improper payments or benefits to officials and other recipients for improper purposes. Although we take precautions to prevent violations of these laws, our exposure for violating these laws increases as we continue to expand our international presence and any failure to comply with such laws could harm our reputation and our business.
We are subject to export and import control laws and regulations that could impair our ability to compete in international markets or subject us to liability if we violate such laws and regulations.
We are subject to U.S. export controls and sanctions regulations that prohibit the shipment or provision of certain products and services to certain countries, governments, and persons targeted by U.S. sanctions. While we take precautions to prevent our products and services from being exported in violation of these laws, including implementing IP address blocking, we cannot guarantee that the precautions we take will prevent violations of export control and sanctions laws. For example, in 2011, we provided certain downloadable portions of our software to international users that, prior to export, required either a one-time product review or application for an encryption registration number in lieu of such product review. These exports were likely made in violation of U.S. export control and sanction laws. In March 2011, we filed a Final Voluntary Self Disclosure with the U.S. Department of Commerce’s Bureau of Industry and Security, or BIS, concerning these potential violations. In June 2012, BIS notified us that it had completed its review of these matters and closed its review with the issuance of a Warning Letter. No monetary penalties were assessed against us by BIS with respect to the 2011 filing. In addition, in 2017, we discovered that our platform has been accessed by certain users in apparent violation of United States sanctions regulations. We filed an Initial Voluntary Self Disclosure in October 2017 with the Office of Foreign Assets Control, or OFAC, and a Final Voluntary Self Disclosure with OFAC in February 2018. In October 2018, OFAC notified us that it had completed its review of these matters and closed its review with the issuance of a Cautionary Letter. No monetary penalties were assessed with respect to the 2018 filing. If in the future we are found to be in violation of U.S. sanctions or export control laws, it could result in substantial fines and penalties for us and for the individuals working for us.
In addition, various countries regulate the import and export of certain encryption and other technology, including import and export permitting and licensing requirements, and have enacted laws that could limit our ability to distribute our products or could limit our users’ ability to access our platform in those countries. Changes in our platform or client-side software, or future changes in export and import regulations may prevent our users with international operations from deploying our platform globally or, in some cases, prevent the export or import of our platform to certain countries, governments, or persons altogether. Any change in export or import regulations, economic sanctions or related legislation, or change in the countries, governments, persons or technologies targeted by such regulations, could result in decreased use of our platform by, or in our
23
decreased ability to export or sell subscriptions to our platform to, existing or potential users with international operations. Any decreased use of our platform or limitation on our ability to export or sell our products would likely adversely affect our business, results of operations, and financial results.
Our actual or perceived failure to comply with privacy, data protection, and information security laws, regulations, and obligations could harm our business.
We receive, store, process, and use personal information and other user content. There are numerous federal, state, local, and international laws and regulations regarding privacy, data protection, information security, and the storing, sharing, use, processing, transfer, disclosure, and protection of personal information and other content, the scope of which are changing, subject to differing interpretations, and may be inconsistent among countries, or conflict with other rules. We are also subject to the terms of our privacy policies and obligations to third parties related to privacy, data protection, and information security. We strive to comply with applicable laws, regulations, policies, and other legal obligations relating to privacy, data protection, and information security to the extent possible. However, the regulatory framework for privacy and data protection worldwide is, and is likely to remain, uncertain for the foreseeable future, and it is possible that these or other actual or alleged obligations may be interpreted and applied in a manner that is inconsistent from one jurisdiction to another and may conflict with other rules or our practices.
We also expect that there will continue to be new laws, regulations, and industry standards concerning privacy, data protection, and information security proposed and enacted in various jurisdictions. For example, in May 2018, the General Data Protection Regulation, or GDPR, went into effect in the European Union, or EU. The GDPR imposed more stringent data protection requirements and provides greater penalties for noncompliance than previous data protection laws. Further, following a referendum in June 2016 in which voters in the United Kingdom approved an exit from the EU, the United Kingdom government has initiated a process to leave the EU, or Brexit. Brexit has created uncertainty with regard to the regulation of data protection in the United Kingdom. In particular, it is unclear whether the United Kingdom will enact data protection laws or regulations designed to be consistent with the GDPR and how data transfers to and from the United Kingdom will be regulated. Additionally, although we have self-certified under the U.S.-EU and U.S.-Swiss Privacy Shield Frameworks with regard to our transfer of certain personal data from the EU and Switzerland to the United States, some regulatory uncertainty remains surrounding the future of data transfers from the EU and Switzerland to the United States, and we are closely monitoring regulatory developments in this area. Additionally, California recently enacted legislation, the California Consumer Privacy Act of 2018, that will afford consumers expanded privacy protections when it goes into effect on January 1, 2020. Legislators have stated that they intend to propose amendments to this legislation, and it remains unclear what, if any, modifications will be made to this legislation or how it will be interpreted. The effects of this legislation potentially are far-reaching, however, and may require us to modify our data processing practices and policies and to incur substantial costs and expenses in an effort to comply. Similarly, there are a number of legislative proposals in the European Union, the United States, at both the federal and state level, as well as other jurisdictions that could impose new obligations in areas affecting our business. In addition, some countries are considering or have passed legislation implementing data protection requirements or requiring local storage and processing of data, or similar requirements, that could increase the cost and complexity of delivering our services.
With laws and regulations such as the GDPR in the EU and the California Consumer Privacy Act in the U.S. imposing new and relatively burdensome obligations, and with substantial uncertainty over the interpretation and application of these and other laws and regulations, we may face challenges in addressing their requirements and making necessary changes to our policies and practices, and may incur significant costs and expenses in an effort to do so. Any failure or perceived failure by us to comply with our privacy policies, our privacy-related obligations to users or other third parties, or any of our other legal obligations relating to privacy, data protection, or information security may result in governmental investigations or enforcement actions, litigation, claims, or public statements against us by consumer advocacy groups or others, and could result in significant liability or cause our users to lose trust in us, which could have an adverse effect on our reputation and business. Furthermore, the costs of compliance with, and other burdens imposed by, the laws, regulations, and policies that are applicable to the businesses of our users may limit the adoption and use of, and reduce the overall demand for, our services.
Additionally, if third parties we work with, such as vendors or developers, violate applicable laws or regulations or our policies, such violations may also put our users’ content at risk and could in turn have an adverse effect on our business. Any significant change to applicable laws, regulations, or industry practices regarding the collection, use, retention, security, or disclosure of our users’ content, or regarding the manner in which the express or implied consent of users for the collection, use, retention, or disclosure of such content is obtained, could increase our costs and require us to modify our services and features, possibly in a material manner, which we may be unable to complete, and may limit our ability to store and process user data or develop new services and features.
24
Our business could be adversely impacted by changes in internet access for our users or laws specifically governing the internet.
Our platform depends on the quality of our users’ access to the internet. Certain features of our platform require significant bandwidth and fidelity to work effectively. Internet access is frequently provided by companies that have significant market power that could take actions that degrade, disrupt or increase the cost of user access to our platform, which would negatively impact our business. We could incur greater operating expenses and our user acquisition and retention could be negatively impacted if network operators:
|
•
|
implement usage-based pricing;
|
|
•
|
discount pricing for competitive products;
|
|
•
|
otherwise materially change their pricing rates or schemes;
|
|
•
|
charge us to deliver our traffic at certain levels or at all;
|
|
•
|
throttle traffic based on its source or type;
|
|
•
|
implement bandwidth caps or other usage restrictions; or
|
|
•
|
otherwise try to monetize or control access to their networks.
|
On June 11, 2018, the repeal of the Federal Communications Commission’s, or FCC, “net neutrality” rules took effect and returned to a “light-touch” regulatory framework. The prior rules were designed to ensure that all online content is treated the same by internet service providers and other companies that provide broadband services. Additionally, on September 30, 2018, California enacted the California Internet Consumer Protection and Net Neutrality Act of 2018, making California the fourth state to enact a state-level net neutrality law since the FCC repealed its nationwide regulations, mandating that all broadband services in California must be provided in accordance with state net neutrality requirements. The U.S. Department of Justice has sued to block the law going into effect, and California has agreed to delay enforcement until the resolution of the FCC’s repeal of the federal rules. A number of other states are considering legislation or executive actions that would regulate the conduct of broadband providers. We cannot predict whether the FCC order or state initiatives will be modified, overturned, or vacated by legal action of the court, federal legislation, or the FCC. With the repeal of net neutrality rules in effect, we could incur greater operating expenses, which could harm our results of operations. As the internet continues to experience growth in the number of users, frequency of use, and amount of data transmitted, the internet infrastructure that we and our users rely on may be unable to support the demands placed upon it. The failure of the internet infrastructure that we or our users rely on, even for a short period of time, could undermine our operations and harm our results of operations.
In addition, there are various laws and regulations that could impede the growth of the internet or other online services, and new laws and regulations may be adopted in the future. These laws and regulations could, in addition to limiting internet neutrality, involve taxation, tariffs, privacy, data protection, content, copyrights, distribution, electronic contracts and other communications, consumer protection, and the characteristics and quality of services, any of which could decrease the demand for, or the usage of, our platform. Legislators and regulators may make legal and regulatory changes, or interpret and apply existing laws, in ways that require us to incur substantial costs, expose us to unanticipated civil or criminal liability, or cause us to change our business practices. These changes or increased costs could materially harm our business, results of operations, and financial condition.
We are currently, and may be in the future, party to intellectual property rights claims and other litigation matters and, if resolved adversely, they could have a significant impact on our business, results of operations, or financial condition.
We own a large number of patents, copyrights, trademarks, domain names, and trade secrets and, from time to time, are subject to litigation based on allegations of infringement, misappropriation or other violations of intellectual property, or other rights. As we face increasing competition and gain an increasingly high profile, the possibility of intellectual property rights claims, commercial claims, and other assertions against us grows. We have in the past been, are currently, and may from time to time in the future become, a party to litigation and disputes related to our intellectual property, our business practices, and our platform. The costs of supporting litigation and dispute resolution proceedings are considerable, and there can be no assurances that a favorable outcome will be obtained. We may need to settle litigation and disputes on terms that are unfavorable to us, or we may be subject to an unfavorable judgment that may not be reversible upon appeal. The terms of any settlement or judgment may require us to cease some or all of our operations or pay substantial amounts to the other party. With respect to any
25
intellectual property rights claim, we may have to seek a license to continue practices found to be in violation of third-party rights, which may not be available on reasonable terms and may significantly increase our operating expenses. A license to continue such practices may not be available to us at all, and we may be required to develop alternative non-infringing technology or practices or discontinue the practices. The development of alternative, non-infringing technology or practices could require significant effort and expense. Our business, results of operations, and financial condition could be materially and adversely affected as a result.
Our failure to protect our intellectual property rights and proprietary information could diminish our brand and other intangible assets.
We rely and expect to continue to rely on a combination of patents, patent licenses, trade secrets, domain name protections, trademarks, and copyright laws, as well as confidentiality and license agreements with our employees, consultants, and third parties, to protect our intellectual property and proprietary rights. In the United States and abroad, we have over 750 issued patents and more than 600 pending patent applications. However, third parties may knowingly or unknowingly infringe our proprietary rights, third parties may challenge our proprietary rights, pending and future patent, trademark, and copyright applications may not be approved, and we may not be able to prevent infringement without incurring substantial expense. We have also devoted substantial resources to the development of our proprietary technologies and related processes. In order to protect our proprietary technologies and processes, we rely in part on trade secret laws and confidentiality agreements with our employees, consultants, and third parties. These agreements may not effectively prevent disclosure of confidential information and may not provide an adequate remedy in the event of unauthorized disclosure of confidential information. In addition, others may independently discover our trade secrets, in which case we would not be able to assert trade secret rights, or develop similar technologies and processes. Further, laws in certain jurisdictions may afford little or no trade secret protection, and any changes in, or unexpected interpretations of, the intellectual property laws in any country in which we operate may compromise our ability to enforce our intellectual property rights. Costly and time-consuming litigation could be necessary to enforce and determine the scope of our proprietary rights. If the protection of our proprietary rights is inadequate to prevent use or appropriation by third parties, the value of our platform, brand, and other intangible assets may be diminished and competitors may be able to more effectively replicate our platform and its features. Any of these events could materially and adversely affect our business, results of operations, and financial condition.
Our use of open source software could negatively affect our ability to offer and sell subscriptions to our platform and subject us to possible litigation.
A portion of the technologies we use incorporates open source software, and we may incorporate open source software in the future. Open source software is generally licensed by its authors or other third parties under open source licenses. These licenses may subject us to certain unfavorable conditions, including requirements that we offer our platform that incorporates the open source software for no cost, that we make publicly available source code for modifications or derivative works we create based upon, incorporating or using the open source software, and/or that we license such modifications or derivative works under the terms of the particular open source license. Additionally, if a third-party software provider has incorporated open source software into software that we license from such provider, we could be required to disclose any of our source code that incorporates or is a modification of our licensed software. If an author or other third party that distributes open source software that we use or license were to allege that we had not complied with the conditions of the applicable license, we could be required to incur significant legal expenses defending against those allegations and could be subject to significant damages, enjoined from offering or selling our solutions that contained the open source software, and required to comply with the foregoing conditions. Any of the foregoing could disrupt and harm our business, results of operations, and financial condition.
Our ability to sell subscriptions to our platform could be harmed by real or perceived material defects or errors in our platform.
The software technology underlying our platform is inherently complex and may contain material defects or errors, particularly when first introduced or when new features or capabilities are released. We have from time to time found defects or errors in our platform, and new defects or errors in our existing platform or new software may be detected in the future by us or our users. There can be no assurance that our existing platform and new software will not contain defects. Any real or perceived errors, failures, vulnerabilities, or bugs in our platform could result in negative publicity or lead to data security, access, retention, or other performance issues, all of which could harm our business. The costs incurred in correcting such defects or errors may be substantial and could harm our results of operations and financial condition. Moreover, the harm to our reputation and legal liability related to such defects or errors may be substantial and could harm our business, results of operations, and financial condition.
26
We also utilize hardware purchased or leased and software and services licensed from third parties to offer our platform. Any defects in, or unavailability of, our or third-party software, services, or hardware that cause interruptions to the availability of our services, loss of data, or performance issues could, among other things:
|
•
|
cause a reduction in revenue or delay in market acceptance of our platform;
|
|
•
|
require us to issue refunds to our users or expose us to claims for damages;
|
|
•
|
cause us to lose existing users and make it more difficult to attract new users;
|
|
•
|
divert our development resources or require us to make extensive changes to our platform, which would increase our expenses;
|
|
•
|
increase our technical support costs; and
|
|
•
|
harm our reputation and brand.
|
We have acquired, and may in the future acquire, other businesses, and we may also receive offers to be acquired, any of which could require significant management attention, disrupt our business, or dilute stockholder value.
As part of our business strategy, we have acquired, and may in the future acquire, other companies, employee teams, or technologies to complement or expand our products, obtain personnel, or otherwise grow our business. The pursuit of acquisitions may divert the attention of management and cause us to incur various expenses in identifying, investigating, and pursuing suitable acquisitions, whether or not they are consummated.
We have limited experience making acquisitions. We may not be able to find suitable acquisition candidates and we may not be able to complete acquisitions on favorable terms, if at all. If we do complete acquisitions, we may not ultimately strengthen our competitive position or achieve the anticipated benefits from such acquisitions, due to a number of factors, including:
|
•
|
acquisition-related costs, liabilities, or tax impacts, some of which may be unanticipated;
|
|
•
|
difficulty integrating and retaining the personnel, intellectual property, technology infrastructure, and operations of an acquired business;
|
|
•
|
ineffective or inadequate, controls, procedures, or policies at an acquired business;
|
|
•
|
multiple product lines or services offerings, as a result of our acquisitions, that are offered, priced, and supported differently;
|
|
•
|
potential unknown liabilities or risks associated with an acquired business, including those arising from existing contractual obligations or litigation matters;
|
|
•
|
inability to maintain relationships with key customers, suppliers, and partners of an acquired business;
|
|
•
|
lack of experience in new markets, products or technologies;
|
|
•
|
diversion of management's attention from other business concerns; and
|
|
•
|
use of resources that are needed in other parts of our business.
|
We may not be able to integrate acquired businesses successfully or effectively manage the combined company following an acquisition. If we fail to successfully integrate acquisitions, or the people or technologies associated with those acquisitions, the results of operations of the combined company could be adversely affected. Any integration process will require significant time, resources, and attention from management, and disrupt the ordinary functioning of our business, and we may not be able to manage the process successfully, which could adversely affect our business, results of operations, and financial condition.
27
Any acquisition we complete could be viewed negatively by users, developers, partners, or investors, and could have adverse effects on our existing business relationships. In addition, we may not successfully evaluate or utilize acquired technology or accurately forecast the financial impact of an acquisition transaction, including accounting charges.
We may have to pay a substantial portion of our available cash, incur debt, or issue equity securities to pay for any such acquisitions, each of which could affect our financial condition or the value of our capital stock. The sale of equity to finance any such acquisitions could result in dilution to our stockholders. If we incur more debt, it would result in increased fixed obligations and could also subject us to covenants or other restrictions that would impede our ability to flexibly operate our business.
Our business may be significantly impacted by a change in the economy, including any resulting effect on consumer or business spending.
Our business may be affected by changes in the economy generally, including any resulting effect on spending by our business and consumer users. Some of our users may view a subscription to our platform as a discretionary purchase, and our paying users may reduce their discretionary spending on our platform during an economic downturn. If an economic downturn were to occur, we may experience such a reduction in the future, especially in the event of a prolonged recessionary period. As a result, our business, results of operations, and financial condition may be significantly affected by changes in the economy generally.
Our business could be disrupted by catastrophic events.
Occurrence of any catastrophic event, including earthquake, fire, flood, tsunami, or other weather event, power loss, telecommunications failure, software or hardware malfunctions, cyber-attack, war, or terrorist attack, could result in lengthy interruptions in our service. In particular, our U.S. headquarters and some of the datacenters we utilize are located in the San Francisco Bay Area, a region known for seismic activity, and our insurance coverage may not compensate us for losses that may occur in the event of an earthquake or other significant natural disaster. In addition, acts of terrorism could cause disruptions to the internet or the economy as a whole. Even with our disaster recovery arrangements, our service could be interrupted. If our systems were to fail or be negatively impacted as a result of a natural disaster or other event, our ability to deliver products to our users would be impaired or we could lose critical data. If we are unable to develop adequate plans to ensure that our business functions continue to operate during and after a disaster, and successfully execute on those plans in the event of a disaster or emergency, our business, results of operations, financial condition, and reputation would be harmed.
We may have exposure to greater than anticipated tax liabilities, which could adversely impact our results of operations.
While to date we have not incurred significant income taxes in operating our business, we are subject to income taxes in the United States and various jurisdictions outside of the United States. Our effective tax rate could fluctuate due to changes in the mix of earnings and losses in countries with differing statutory tax rates. Our tax expense could also be impacted by changes in non-deductible expenses, changes in excess tax benefits of stock-based compensation, changes in the valuation of deferred tax assets and liabilities and our ability to utilize them, the applicability of withholding taxes and effects from acquisitions.
Our tax provision could also be impacted by changes in accounting principles, changes in U.S. federal, state, or international tax laws applicable to corporate multinationals such as the recent legislation enacted in the United States, United Kingdom and Australia, other fundamental law changes currently being considered by many countries, and changes in taxing jurisdictions’ administrative interpretations, decisions, policies, and positions. Additionally, in October 2015, the Organization for Economic Co-Operation and Development released final guidance covering various topics, including transfer pricing, country-by-country reporting, and definitional changes to permanent establishment that could ultimately impact our tax liabilities.
We are subject to review and audit by U.S. federal, state, local, and foreign tax authorities. Such tax authorities may disagree with tax positions we take and if any such tax authority were to successfully challenge any such position, our financial results and operations could be materially and adversely affected. We may also be subject to additional tax liabilities due to changes in non-income based taxes resulting from changes in federal, state, or international tax laws, changes in taxing jurisdictions’ administrative interpretations, decisions, policies, and positions, results of tax examinations, settlements or judicial decisions, changes in accounting principles, changes to the business operations, including acquisitions, as well as the evaluation of new information that results in a change to a tax position taken in a prior period.
Our ability to use our net operating loss carryforwards and certain other tax attributes may be limited.
28
As of
December 31, 2018
, we had $923.6 million of federal and $403.5 million of state net operating loss carryforwards available to reduce future taxable income. Of our federal net operating loss carryforwards, $307.4 million will begin to expire in 2031 and $616.2 million will carryforward indefinitely, while state net operating losses begin to expire in 2029. As of
December 31, 2018
, we also had $265.1 million of foreign net operating loss carryforwards available to reduce future taxable income, which will carryforward indefinitely. In addition, we had $22.9 million of foreign acquired net operating losses, which will carryforward indefinitely. It is possible that we will not generate taxable income in time to use these net operating loss carryforwards before their expiration or at all. Under Sections 382 and 383 of the Internal Revenue Code of 1986, as amended, or the Code, if a corporation undergoes an “ownership change,” the corporation’s ability to use its pre-change net operating loss carryforwards and other pre-change attributes, such as research tax credits, to offset its post-change income may be limited. In general, an “ownership change” will occur if there is a cumulative change in our ownership by “5-percent shareholders” that exceeds 50 percentage points over a rolling three-year period. Similar rules may apply under state tax laws. We performed a study for the period through
December 31, 2018
and determined that no ownership changes exceeding 50 percentage points had occurred. Our ability to use net operating loss and tax credit carryforwards to reduce future taxable income and liabilities may be subject to annual limitations as a result of ownership changes from January 1, 2019 and subsequent years.
Our operating results may be harmed if we are required to collect sales or other related taxes for our subscription services in jurisdictions where we have not historically done so.
We collect sales and value-added tax as part of our subscription agreements in a number of jurisdictions. One or more states or countries may seek to impose incremental or new sales, use, or other tax collection obligations on us, including for past sales by us or our resellers and other partners. A successful assertion by a state, country, or other jurisdiction that we should have been or should be collecting additional sales, use, or other taxes on our services could, among other things, result in substantial tax liabilities for past sales, create significant administrative burdens for us, discourage users from purchasing our platform, or otherwise harm our business, results of operations, and financial condition.
Our results of operations and financial condition could be materially affected by the enactment of legislation implementing changes in the U.S. or foreign taxation of international business activities or the adoption of other tax reform policies.
On December 22, 2017, the legislation commonly referred to as the Tax Cuts and Jobs Act ("Tax Reform Act") was enacted, which contains significant changes to U.S. tax law, including, but not limited to, a reduction in the corporate tax rate and a transition to a new territorial system of taxation. The primary impact of the new legislation on our provision for income taxes was a reduction of the future tax benefits of our deferred tax assets as a result of the reduction in the corporate tax rate. However, since we have recorded a full valuation allowance against our deferred tax assets, these changes did not have a material impact on our consolidated financial statements. As we expand the scale of our international business activities, any changes in the U.S. or foreign taxation of such activities may increase our worldwide effective tax rate and harm our business, results of operations, and financial condition.
If we fail to maintain an effective system of disclosure controls and internal control over financial reporting, our ability to produce timely and accurate financial statements or comply with applicable regulations could be impaired.
We are subject to the reporting requirements of the Securities Exchange Act of 1934, as amended, or the Exchange Act, the Sarbanes-Oxley Act of 2002, or the Sarbanes-Oxley Act, and the rules and regulations of the applicable listing standards of the Nasdaq Global Select Market, or Nasdaq. We expect that the requirements of these rules and regulations will continue to increase our legal, accounting, and financial compliance costs, make some activities more difficult, time-consuming and costly, and place significant strain on our personnel, systems, and resources.
The Sarbanes-Oxley Act requires, among other things, that we maintain effective disclosure controls and procedures and internal control over financial reporting. We are continuing to develop and refine our disclosure controls and other procedures that are designed to ensure that information required to be disclosed by us in the reports that we will file with the SEC is recorded, processed, summarized, and reported within the time periods specified in SEC rules and forms and that information required to be disclosed in reports under the Exchange Act is accumulated and communicated to our principal executive and financial officers. We are also continuing to improve our internal control over financial reporting. In order to maintain and improve the effectiveness of our disclosure controls and procedures and internal control over financial reporting, we have expended, and anticipate that we will continue to expend, significant resources, including accounting-related costs and significant management oversight.
Our current controls and any new controls that we develop may become inadequate because of changes in conditions in our business. Additionally, to the extent we acquire other businesses, the acquired company may not have a sufficiently robust
29
system of internal controls and we may uncover new deficiencies. Weaknesses in our disclosure controls and internal control over financial reporting may be discovered in the future. Any failure to develop or maintain effective controls or any difficulties encountered in their implementation or improvement could harm our results of operations or cause us to fail to meet our reporting obligations and may result in a restatement of our financial statements for prior periods. Any failure to implement and maintain effective internal control over financial reporting also could adversely affect the results of periodic management evaluations and annual independent registered public accounting firm attestation reports regarding the effectiveness of our internal control over financial reporting that we will eventually be required to include in our periodic reports that will be filed with the SEC. Ineffective disclosure controls and procedures and internal control over financial reporting could also cause investors to lose confidence in our reported financial and other information, which would likely have a negative effect on the trading price of our Class A common stock. In addition, if we are unable to continue to meet these requirements, we may not be able to remain listed on Nasdaq. We are not currently required to comply with the SEC rules that implement Section 404 of the Sarbanes-Oxley Act and are therefore not required to make a formal assessment of the effectiveness of our internal control over financial reporting for that purpose. We will be required to provide an annual management report on the effectiveness of our internal control over financial reporting commencing with our fiscal 2019 Annual Report on Form 10-K.
Our independent registered public accounting firm is not required to formally attest to the effectiveness of our internal control over financial reporting until our first annual report filed with the SEC where we are an “accelerated filer” or a “large accelerated filer.” At such time, our independent registered public accounting firm may issue a report that is adverse in the event it is not satisfied with the level at which our internal control over financial reporting is documented, designed, or operating. Any failure to maintain effective disclosure controls and internal control over financial reporting could materially and adversely affect our business, results of operations, and financial condition and could cause a decline in the trading price of our Class A common stock.
Our reported results of operations may be adversely affected by changes in accounting principles generally accepted in the United States.
Generally accepted accounting principles in the United States are subject to interpretation by the Financial Accounting Standards Board, or FASB, the SEC, and various bodies formed to promulgate and interpret appropriate accounting principles. A change in these principles or interpretations could have a significant effect on our reported results of operations, and may even affect the reporting of transactions completed before the announcement or effectiveness of a change. It is difficult to predict the impact of future changes to accounting principles or our accounting policies, any of which could negatively affect our results of operations.
We have publicly disclosed market opportunity estimates, growth forecasts, and key metrics, including the key metrics included in this Annual Report on Form 10-K which could prove to be inaccurate, and any real or perceived inaccuracies may harm our reputation and negatively affect our business.
Market opportunity estimates and growth forecasts are subject to significant uncertainty and are based on assumptions and estimates that may not prove to be accurate. The estimates and forecasts we disclose relating to the size and expected growth of our target market may prove to be inaccurate. Even if the markets in which we compete meet the size estimates and growth we have forecasted, our business could fail to grow at similar rates, if at all. We also rely on assumptions and estimates to calculate certain of our key metrics, such as paying users, average revenue per paying user, and free cash flow. We regularly review and may adjust our processes for calculating our key metrics to improve their accuracy. Our key metrics may differ from estimates published by third parties or from similarly titled metrics of our competitors due to differences in methodology. We have found that aggregate user activity metrics are not leading indicators of revenue or conversion. For that reason, we do not comprehensively track user activity across the Dropbox platform for financial planning and forecasting purposes. If investors or analysts do not perceive our metrics to be accurate representations of our business, or if we discover material inaccuracies in our metrics, our reputation, business, results of operations, and financial condition would be harmed.
Our revolving credit facility provides our lenders with a first-priority lien against substantially all of our intellectual property and certain other assets, and contains financial covenants and other restrictions on our actions that may limit our operational flexibility or otherwise adversely affect our results of operations.
We are party to a revolving credit and guarantee agreement, as amended, which contains a number of covenants that limit our ability and our subsidiaries’ ability to, among other things, incur additional indebtedness, pay dividends, make redemptions and repurchases of stock, make investments, loans and acquisitions, create liens, engage in transactions with affiliates, merge or consolidate with other companies, or sell substantially all of our assets. We are also required to maintain certain financial covenants, including a maximum consolidated leverage ratio and a minimum liquidity balance. The terms of our revolving credit facility may restrict our current and future operations and could adversely affect our ability to finance our future
30
operations or capital needs or to execute preferred business strategies. In addition, complying with these covenants may make it more difficult for us to successfully execute our business strategy and compete against companies who are not subject to such restrictions.
A failure by us to comply with the covenants or payment requirements specified in our credit agreement, as amended, could result in an event of default under the agreement, which would give the lenders the right to terminate their commitments to provide additional loans under our revolving credit facility and to declare all borrowings outstanding, together with accrued and unpaid interest and fees, to be immediately due and payable. In addition, the lenders would have the right to proceed against the collateral we granted to them, which consists of substantially all our intellectual property and certain other assets. If the debt under our revolving credit facility were to be accelerated, we may not have sufficient cash or be able to borrow sufficient funds to refinance the debt or sell sufficient assets to repay the debt, which could immediately materially and adversely affect our business, cash flows, results of operations, and financial condition. Even if we were able to obtain new financing, it may not be on commercially reasonable terms or on terms that are acceptable to us.
Our operations may be interrupted and our business, results of operations, and financial condition could be adversely affected if we default on our leasing or credit obligations.
We finance a significant portion of our expenditures through leasing arrangements, some of which are not required to be reflected on our balance sheet, and we may enter into additional similar arrangements in the future. As of
December 31, 2018
, we had an aggregate of
$1,394.9
million of commitments to settle contractual obligations. In particular, we have used these types of arrangements to finance some of our equipment and datacenters. In addition, we may draw upon our revolving credit facility to finance our operations or for other corporate purposes. If we default on these leasing or credit obligations, our leasing partners and lenders may, among other things:
|
•
|
require repayment of any outstanding lease obligations;
|
|
•
|
terminate our leasing arrangements;
|
|
•
|
terminate our access to the leased datacenters we utilize;
|
|
•
|
stop delivery of ordered equipment;
|
|
•
|
sell or require us to return our leased equipment;
|
|
•
|
require repayment of any outstanding amounts drawn on our revolving credit facility;
|
|
•
|
terminate our revolving credit facility; or
|
|
•
|
require us to pay significant fees, penalties, or damages.
|
In October 2017, we entered into a new lease agreement to rent office space in San Francisco, California, to serve as our new corporate headquarters. The total minimum obligations under this lease agreement are expected to be approximately $831.6 million. Before moving to our new corporate headquarters, we will continue to operate in our current corporate headquarters, during which time we will be incurring rent expense on both our current and new corporate headquarters. After moving to our new corporate headquarters, we plan to vacate our current corporate headquarters. If we are unable to move into our new headquarters as scheduled, our results of operations could be adversely impacted as a result of additional rent expense.
If some or all of these events were to occur, our operations may be interrupted and our ability to fund our operations or obligations, as well as our business, results of operations, and financial condition, could be adversely affected.
We may need additional capital, and we cannot be certain that additional financing will be available on favorable terms, or at all.
Historically, we have funded our operations and capital expenditures primarily through equity issuances, cash generated from our operations, and debt financing for capital purchases. Although we currently anticipate that our existing cash, cash equivalents and short-term investments, amounts available under our existing credit facilities, and cash flow from operations will be sufficient to meet our cash needs for the foreseeable future, we may require additional financing. We evaluate financing opportunities from time to time, and our ability to obtain financing will depend, among other things, on our development efforts, business plans, operating performance, and condition of the capital markets at the time we seek financing. We cannot
31
assure you that additional financing will be available to us on favorable terms when required, or at all. If we raise additional funds through the issuance of equity or equity-linked or debt securities, those securities may have rights, preferences or privileges senior to the rights of our Class A common stock, and our stockholders may experience dilution.
Risks Related to Ownership of Our Class A Common Stock
The trading price of our Class A common stock may be volatile, and you could lose all or part of your investment.
The trading price of our Class A common stock may be volatile and could be subject to fluctuations in response to various factors, some of which are beyond our control. Factors that could cause fluctuations in the trading price of our Class A common stock include the following:
|
•
|
price and volume fluctuations in the overall stock market from time to time;
|
|
•
|
volatility in the trading prices and trading volumes of technology stocks;
|
|
•
|
changes in operating performance and stock market valuations of other technology companies generally, or those in our industry in particular;
|
|
•
|
sales of shares of our Class A common stock by us or our stockholders;
|
|
•
|
failure of securities analysts to maintain coverage of us, changes in financial estimates by securities analysts who follow our company, or our failure to meet these estimates or the expectations of investors;
|
|
•
|
the financial projections we may provide to the public, any changes in those projections, or our failure to meet those projections;
|
|
•
|
announcements by us or our competitors of new products, features, or services;
|
|
•
|
the public’s reaction to our press releases, other public announcements, and filings with the SEC;
|
|
•
|
rumors and market speculation involving us or other companies in our industry;
|
|
•
|
actual or anticipated changes in our results of operations or fluctuations in our results of operations;
|
|
•
|
actual or anticipated developments in our business, our competitors’ businesses or the competitive landscape generally;
|
|
•
|
litigation involving us, our industry, or both, or investigations by regulators into our operations or those of our competitors;
|
|
•
|
developments or disputes concerning our intellectual property or other proprietary rights;
|
|
•
|
announced or completed acquisitions of businesses, products, services, or technologies by us or our competitors;
|
|
•
|
new laws or regulations or new interpretations of existing laws or regulations applicable to our business;
|
|
•
|
changes in accounting standards, policies, guidelines, interpretations, or principles;
|
|
•
|
any significant change in our management; and
|
|
•
|
general economic conditions and slow or negative growth of our markets.
|
In addition, in the past, following periods of volatility in the overall market and the market price of a particular company’s securities, securities class action litigation has often been instituted against these companies. This litigation, if instituted against us, could result in substantial costs and a diversion of our management’s attention and resources.
32
The multi-class structure of our common stock has the effect of concentrating voting control with those stockholders who held our capital stock prior to the completion of our IPO, and it may depress the trading price of our Class A common stock.
Our Class A common stock has one vote per share, our Class B common stock has ten votes per share, and our Class C common stock has no voting rights, except as otherwise required by law. As of
December 31, 2018
, our directors, executive officers and holders of more than 5% of our common stock, and their respective affiliates, held in the aggregate 87.1% of the voting power of our capital stock, with our Co-Founders holding approximately 53% of the voting power of our capital stock (including the Co-Founder Grants and voting agreements that our co-founders entered into with certain of our stockholders that covered an aggregate of 1.2% of the voting power of our capital stock as of
December 31, 2018
). We are including the Co-Founder Grants in this calculation since they are legally issued and outstanding shares of our Class A common stock and our co-founders are able to vote these shares prior to their vesting. Because of the ten-to-one voting ratio between our Class B and Class A common stock, the holders of our Class B common stock collectively will continue to control a majority of the combined voting power of our common stock and therefore be able to control all matters submitted to our stockholders for approval so long as the shares of Class B common stock represent at least 9.1% of all outstanding shares of our Class A and Class B common stock. This concentrated control will limit or preclude other stockholders' ability to influence corporate matters for the foreseeable future, including the election of directors, amendments of our organizational documents and any merger, consolidation, sale of all or substantially all of our assets, or other major corporate transaction requiring stockholder approval. In addition, this may prevent or discourage unsolicited acquisition proposals or offers for our capital stock that other stockholders may feel are in their best interests as one of our stockholders.
Future transfers or sales by holders of Class B common stock will generally result in those shares converting to Class A common stock, except for certain transfers described in our amended and restated certificate of incorporation, including transfers effected for estate planning purposes where sole dispositive power and exclusive voting control with respect to the shares of Class B common stock is retained by the transferring holder and transfers between our co-founders. In addition, each outstanding share of Class B common stock held by a stockholder who is a natural person, or held by the permitted entities or permitted transferees of such stockholder (as described in our amended and restated certificate of incorporation), will convert automatically into one share of Class A common stock upon the death of such natural person. In the event of the death or permanent and total disability of a co-founder, shares of Class B common stock held by such co-founder, his permitted entities or permitted transferees will convert to Class A common stock, provided that the conversion will be deferred for nine months, or up to 18 months if approved by a majority of our independent directors, following his death or permanent and total disability. Transfers between our co-founders are permitted transfers and will not result in conversion of the shares of Class B common stock that are transferred; however, upon the death or total and permanent disability of the transferring co-founder, the transferred shares would convert to Class A common stock following the deferral period of nine months, or up to 18 months if approved by a majority of our independent directors. The conversion of Class B common stock to Class A common stock will have the effect, over time, of increasing the relative voting power of those individual holders of Class B common stock who retain their shares in the long term.
In addition, because our Class C common stock carries no voting rights (except as otherwise required by law), if we issue Class C common stock in the future, the holders of Class B common stock may be able to elect all of our directors and to determine the outcome of most matters submitted to a vote of our stockholders for a longer period of time than would be the case if we issued Class A common stock rather than Class C common stock in such transactions.
In addition, in July 2017, FTSE Russell and Standard & Poor’s announced that they would cease to allow most newly public companies utilizing dual or multi-class capital structures to be included in their indices. Affected indices include the Russell 2000 and the S&P 500, S&P MidCap 400, and S&P SmallCap 600, which together make up the S&P Composite 1500. Under the announced policies, our multi-class capital structure likely makes us ineligible for inclusion in any of these indices, and as a result, mutual funds, exchange-traded funds, and other investment vehicles that attempt to passively track these indices will not be investing in our stock. These policies are still new and it is as of yet unclear what effect, if any, they will have on the valuations of publicly traded companies excluded from the indices, but it is possible that they may depress these valuations compared to those of other similar companies that are included.
Because of the relatively small number of shares of our Class A common stock outstanding after our IPO and the number of shares of Class A common stock held by our founders as a result of their RSAs, which shares have full voting rights, our co-founders will have significant influence over any vote of the Class A common stock voting as a separate class.
As of
December 31, 2018
, we had 225,750,948 shares of Class A common stock legally issued and outstanding. As a result, until the public float of our Class A common stock increases, which is expected to occur primarily as a result of conversion of shares of Class B common stock into shares of Class A common stock upon transfer, our co-founders will hold a significant percentage of the outstanding Class A common stock. Although the terms of our amended and restated certificate of
33
incorporation only provide for a separate vote of the holders of the Class A common stock on matters occurring after the conversion of the Class B common stock as a class, under Delaware law, certain actions may require the approval of the holders of the Class A common stock voting as a separate class. For example, if we amend our amended and restated certificate of incorporation to adversely affect our Class A common stock, Delaware law could require approval of the holders of our Class A common stock voting separately as a single class. For any vote of the Class A common stock voting as a separate class, our co-founders will heavily influence such vote until the number of outstanding shares of Class A common stock significantly increases. Further, our co-founders will have the right to vote those shares until the termination of the award even if the performance targets have not been met or are not expected to be met. To the extent that the RSAs vest, our co-founders will have the ability to gain liquidity by selling shares of our Class A common stock without reducing their voting power by converting their Class B common stock.
Substantial future sales could depress the market price of our Class A common stock.
The market price of our Class A common stock could decline as a result of a large number of sales of shares of such stock, and the perception that these sales could occur may also depress the market price of our Class A common stock.
Under our investors’ rights agreement, certain stockholders can require us to register shares owned by them for public sale in the United States. In addition, we filed a registration statement to register shares reserved for future issuance under our equity compensation plans. As a result, subject to the satisfaction of applicable exercise periods, the shares issued upon exercise of outstanding stock options or upon settlement of outstanding RSU awards are available for immediate resale in the United States in the open market.
Sales of our shares may make it more difficult for us to sell equity securities in the future at a time and at a price that we deem appropriate. These sales also could cause the trading price of our Class A common stock to fall and make it more difficult for you to sell shares of our Class A common stock.
Delaware law and provisions in our restated certificate of incorporation and restated bylaws could make a merger, tender offer, or proxy contest difficult, thereby depressing the market price of our Class A common stock.
Our status as a Delaware corporation and the anti-takeover provisions of the Delaware General Corporation Law may discourage, delay, or prevent a change in control by prohibiting us from engaging in a business combination with an interested stockholder for a period of three years after the person becomes an interested stockholder, even if a change of control would be beneficial to our existing stockholders. In addition, our restated certificate of incorporation and restated bylaws contain provisions that may make the acquisition of our company more difficult, including the following:
|
•
|
any transaction that would result in a change in control of our company requires the approval of a majority of our outstanding Class B common stock voting as a separate class;
|
|
•
|
our multi-class common stock structure, which provides our holders of Class B common stock with the ability to significantly influence the outcome of matters requiring stockholder approval, even if they own significantly less than a majority of the shares of our outstanding Class A common stock, Class B common stock, and Class C common stock;
|
|
•
|
when the outstanding shares of Class B common stock represent less than a majority of the total combined voting power of our Class A and Class B common stock, or the Voting Threshold Date, our Board of Directors will be classified into three classes of directors with staggered three-year terms, and directors will only be able to be removed from office for cause;
|
|
•
|
until the Class B common stock, as a class, converts to Class A common stock, any amendments to our restated certificate of incorporation will require the approval of two-thirds of the combined vote of our then-outstanding shares of Class A common stock and Class B common stock; and following the conversion of our Class B common stock, as a class, to Class A common stock, certain amendments to our amended and restated certificate of incorporation will require the approval of two-thirds of our then outstanding voting power;
|
|
•
|
four amended and restated bylaws will provide that approval of stockholders holding two-thirds of our outstanding voting power voting as a single class is required for stockholders to amend or adopt any provision of our bylaws;
|
34
|
•
|
after the Voting Threshold Date our stockholders will only be able to take action at a meeting of stockholders, and will not be able to take action by written consent for any matter;
|
|
•
|
until the Voting Threshold Date, our stockholders will be able to act by written consent only if the action is first recommended or approved by the Board of Directors;
|
|
•
|
vacancies on our Board of Directors will be able to be filled only by our Board of Directors and not by stockholders;
|
|
•
|
only our chairman of the Board of Directors, chief executive officer, a majority of Board of Directors or until the Class B common stock, as a class, converts to Class A common stock, a stockholder holding thirty percent of the combined voting power of our Class A and Class B common stock are authorized to call a special meeting of stockholders;
|
|
•
|
certain litigation against us can only be brought in Delaware;
|
|
•
|
our restated certificate of incorporation authorizes undesignated preferred stock, the terms of which may be established and shares of which may be issued, without the approval of the holders of Class A common stock; and
|
|
•
|
advance notice procedures apply for stockholders to nominate candidates for election as directors or to bring matters before an annual meeting of stockholders.
|
These anti-takeover defenses could discourage, delay, or prevent a transaction involving a change in control of our company. These provisions could also discourage proxy contests and make it more difficult for stockholders to elect directors of their choosing and to cause us to take other corporate actions they desire, any of which, under certain circumstances, could limit the opportunity for our stockholders to receive a premium for their shares of our capital stock, and could also affect the price that some investors are willing to pay for our Class A common stock.
Our amended and restated bylaws designate a state or federal court located within the State of Delaware as the exclusive forum for substantially all disputes between us and our stockholders, and also provide that the federal district courts will be the exclusive forum for resolving any complaint asserting a cause of action arising under the Securities Act, each of which could limit our stockholders’ ability to choose the judicial forum for disputes with us or our directors, officers, or employees.
Our amended and restated bylaws provide that, unless we consent in writing to the selection of an alternative forum, the sole and exclusive forum for (1) any derivative action or proceeding brought on our behalf, (2) any action asserting a claim of breach of a fiduciary duty owed by any of our directors, officers, or other employees to us or our stockholders, (3) any action arising pursuant to any provision of the Delaware General Corporation Law, or the certificate of incorporation or the amended and restated bylaws or (4) any other action asserting a claim that is governed by the internal affairs doctrine shall be the Court of Chancery of the State of Delaware (or, if the Court of Chancery does not have jurisdiction, the federal district court for the District of Delaware), in all cases subject to the court having jurisdiction over indispensable parties named as defendants.
Our amended and restated bylaws also provide that the federal district courts of the United States of America will be the exclusive forum for resolving any complaint asserting a cause of action arising under the Securities Act, or a Federal Forum Provision.
Any person or entity purchasing or otherwise acquiring any interest in any of our securities shall be deemed to have notice of and consented to this provision. These exclusive-forum provisions may limit a stockholder’s ability to bring a claim in a judicial forum of its choosing for disputes with us or our directors, officers, or other employees, which may discourage lawsuits against us and our directors, officers, and other employees.
As previously disclosed in our Current Report on Form 8-K filed with the SEC on December 19, 2018, in light of the decision issued by the Delaware Court of Chancery in Matthew Sciabacucchi v. Matthew B. Salzberg et al., C.A. No. 2017-0931-JTL (Del. Ch.), finding Federal Forum Provisions are not valid under Delaware law, we do not intend to enforce the Federal Forum Provision in our amended and restated bylaws unless and until such time there is a final determination by the Delaware Supreme Court regarding the validity of such provisions. To the extent the Delaware Supreme Court makes a final determination that provisions such as the Federal Forum Provision are not valid as a matter of Delaware law, our board of directors intends to amend our amended and restated bylaws to remove the Federal Forum Provision.
35
If we face relevant litigation and are unable to enforce these provisions, we may incur additional costs associated with resolving the dispute in other jurisdictions, which could harm our results of operations.
Our Class A common stock market price and trading volume could decline if securities or industry analysts do not publish research or publish inaccurate or unfavorable research about our business.
The trading market for our Class A common stock will depend in part on the research and reports that securities or industry analysts publish about us or our business. The analysts’ estimates are based upon their own opinions and are often different from our estimates or expectations. If one or more of the analysts who cover us downgrade our Class A common stock or publish inaccurate or unfavorable research about our business, the price of our securities would likely decline. If few securities analysts commence coverage of us, or if one or more of these analysts cease coverage of us or fail to publish reports on us regularly, demand for our securities could decrease, which might cause the price and trading volume of our Class A common stock to decline.
We do not intend to pay dividends for the foreseeable future.
We have never declared nor paid cash dividends on our capital stock. We currently intend to retain any future earnings to finance the operation and expansion of our business, and we do not expect to declare or pay any dividends in the foreseeable future. As a result, stockholders must rely on sales of their Class A common stock after price appreciation as the only way to realize any future gains on their investment. In addition, our revolving credit facility contains restrictions on our ability to pay dividends.
36
ITEM 1B. URESOLVED STAFF COMMENTS
None.
ITEM 2. PROPERTIES
Our corporate headquarters is located in San Francisco, California, pursuant to operating leases that expire in 2033. We lease additional offices in San Francisco and around the world, including in Austin, Texas; Seattle, Washington; New York, New York; Dublin, Ireland; London, United Kingdom; Tel Aviv, Israel; Sydney, Australia; and Tokyo, Japan. We have datacenter co-location facilities in California, Texas, and Virginia. We believe that these facilities are generally suitable to meet our needs.
ITEM 3. LEGAL PROCEEDINGS
Legal Proceedings
We are currently involved in, and may in the future be involved in, legal proceedings, claims, and government investigations in the ordinary course of business, including legal proceedings with third parties asserting infringement of their intellectual property rights. For example, in April 2015, Synchronoss Technologies, Inc., a public company that provides cloud-based products, filed a patent infringement lawsuit against us in the United States District Court for the District of New Jersey, claiming three counts of patent infringement and seeking injunctive relief. The case was subsequently transferred to the United States District Court for the Northern District of California. Trial is set for August 2019. We do not currently believe that this matter is likely to have a material adverse impact on our consolidated results of operations, cash flows, or our financial position. We intend to vigorously defend this lawsuit, and believe we have valid defenses to the claims. However, any litigation is inherently uncertain, and any judgment or injunctive relief entered against us or any adverse settlement could materially and adversely impact our business, results of operations, financial condition, and prospects.
Future litigation may be necessary, among other things, to defend ourselves or our users by determining the scope, enforceability, and validity of third-party proprietary rights or to establish our proprietary rights. The results of any current or future litigation cannot be predicted with certainty, and regardless of the outcome, litigation can have an adverse impact on us because of defense and settlement costs, diversion of management resources, and other factors.
ITEM 4. MINE SAFETY DISCLOSURES
Not applicable.
37
PART II
ITEM 5. MARKET FOR REGISTRANT’S COMMON EQUITY, RELATED STOCKHOLDER MATTERS AND ISSUER PURCHASES OF EQUITY SECURITIES
Market Information for Class A Common Stock
Our Class A common stock has been listed on the Nasdaq Global Market under the symbol "DBX" since March 23, 2018. Prior to that date, there was no public trading market for our Class A common stock.
Holders of Record
As of February 19, 2019, we had 945 holde
rs of record of our Class A and Class B common stock, and no holders of our Class C common stock. The actual number of stockholders is greater than this number of record holders and includes stockholders who are beneficial owners, but whose shares are held in street name by brokers and other nominees.
Dividend Policy
We have never declared or paid any cash dividends on our capital stock. We currently intend to retain any future earnings and do not expect to pay any dividends in the foreseeable future. Any future determination to declare cash dividends will be made at the discretion of our Board of Directors, subject to applicable laws, and will depend on a number of factors, including our financial condition, results of operations, capital requirements, contractual restrictions, general business conditions, and other factors that our Board of Directors may deem relevant. In addition, the terms of our revolving credit facility place certain limitations on the amount of cash dividends we can pay, even if no amounts are currently outstanding.
Stock Performance Graph
This performance graph shall not be deemed “soliciting material” or to be “filed” with the Securities and Exchange Commission, or the SEC, for purposes of Section 18 of the Securities Exchange Act of 1934, as amended, or the Exchange Act, or otherwise subject to the liabilities under that Section, and shall not be deemed to be incorporated by reference into any of our filings under the Securities Act of 1933, as amended, or the Securities Act.
The following graph compares (i) the cumulative total stockholder return on our Class A common stock from March 23, 2018 (the date our Class A common stock commenced trading on the NASDAQ Global Select Market) through December 31, 2018 with (ii) the cumulative total return of the Standard & Poor's 500 Index and the NASDAQ Computer Index over the same period, assuming the investment of $100 in our common stock and in both of the other indices on March 23, 2018 and the reinvestment of dividends. The graph uses the closing market price on March 23, 2018 of $28.48 per share as the initial value of our common stock. As discussed above, we have never declared or paid a cash dividend on our common stock and do not anticipate declaring or paying a cash dividend in the foreseeable future.
38
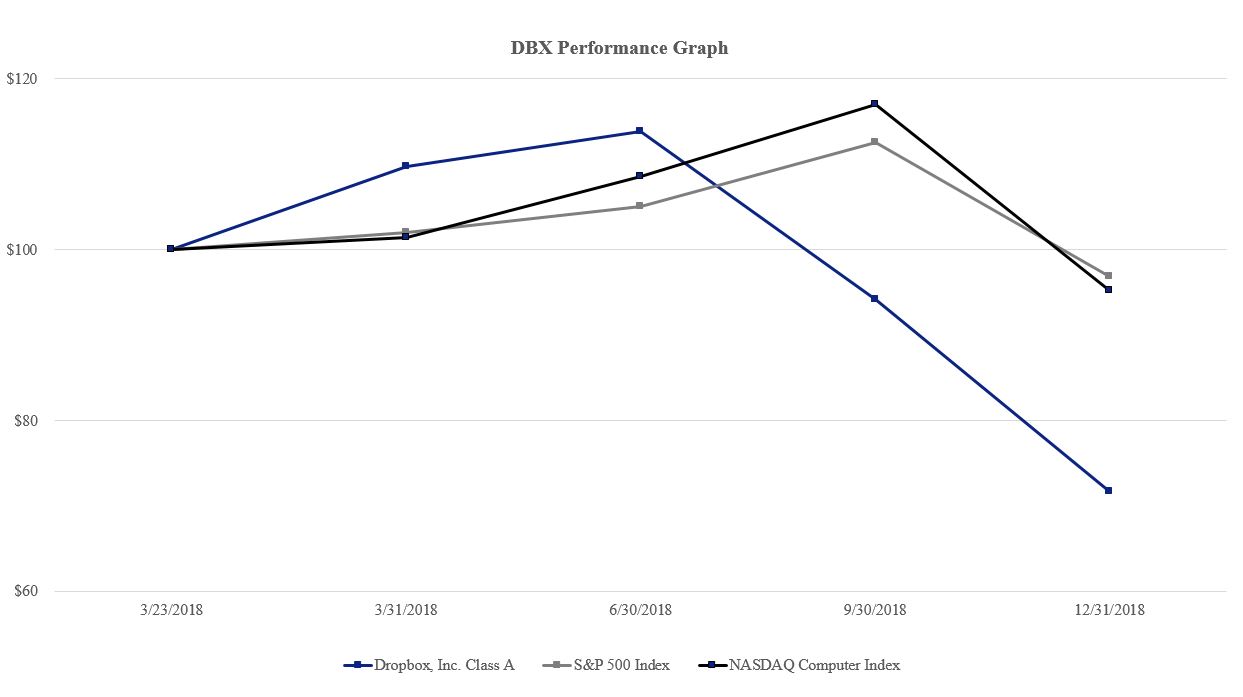
|
Company Index
|
Base period 3/23/18
|
3/31/2018
|
6/30/2018
|
9/30/2018
|
12/31/2018
|
|||||||||||||||
|
Dropbox, Inc. Class A
|
$
|
100
|
|
$
|
110
|
|
$
|
114
|
|
$
|
94
|
|
$
|
72
|
|
|||||
|
S&P 500 Index
|
100
|
|
102
|
|
105
|
|
113
|
|
97
|
|
||||||||||
|
NASDAQ Computer Index
|
100
|
|
101
|
|
109
|
|
117
|
|
95
|
|
||||||||||
* Returns are based on historical results and are not necessarily indicative of future performance. See the disclosure in Part I, Item 1A, “Risk Factors.”
Unregistered Sales of Equity Securities
Options and RSU issuances
From January 1, 2018 through March 23, 2018 (the date of the filing of our registration statement on Form S-8, File No. 333-223863), we issued and sold to our employees, consultants, and other services providers an aggregate of 130,735 shares of Class B common stock upon the exercise of options issued under our 2008 Plan at exercise prices from $4.28 to $25.23, for an aggregate exercise price of $0.8 million.
From January 1, 2018 through March 23, 2018 (the date of the filing of our registration statement on Form S-8, File No. 333-223863), we granted to our directors, officers, employees, consultants, and other service providers an aggregate of 11.0 million restricted stock units to be settled in shares of our Class A common stock under our equity compensation plans.
Use of Proceeds from Public Offering of Class A Common Stock and Concurrent Private Placement
On March 27, 2018, we closed our IPO, in which we sold 26,822,409 shares of our Class A common stock at a price to the public of $21.00 per share. The offer and sale of the shares in the IPO were registered under the Securities Act pursuant to a registration statement on Form S-1 (File No. 333-223182), which was declared effective by the SEC on March 22, 2018. Immediately subsequent to the closing of our IPO, Salesforce Ventures LLC purchased 4,761,905 shares of our Class A common stock from us at $21.00 per share. On March 28, 2018, the underwriters exercised their option to purchase an additional 5,400,000 shares of our Class A common stock at $21.00 per share. This transaction closed on April 3, 2018, resulting in additional proceeds of $108.4 million. In aggregate, we raised $746.6 million in net proceeds after deducting underwriters’ discounts and commissions of $30.1 million and before deducting offering expenses of approximately $6.9 million, net of reimbursements. We utilized a portion of the net proceeds to satisfy our tax withholding and remittance
39
obligations related to the release of restricted stock units, or the RSU settlement. Additionally, we utilized a portion of the net proceeds to purchase investment grade, interest bearing instruments pursuant to the investment policy approved by our board of directors. We also intend to use the net proceeds we received from our IPO and the concurrent private placement for general corporate purposes, including working capital, operating expenses, and capital expenditures. Additionally, we may use a portion of the net proceeds we received from our IPO and the concurrent private placement to acquire businesses, products, services, or technologies. The managing underwriters of our IPO were Goldman, Sachs & Co. LLC and J.P. Morgan Securities LLC. No payments were made by us to directors, officers or persons owning ten percent or more of our common stock or to their associates, or to our affiliates, other than payments in the ordinary course of business to officers for salaries and to non-employee directors pursuant to our director compensation policy.
Issuer Purchases of Equity Securities
None.
ITEM 6. SELECTED CONSOLIDATED FINANCIAL AND OTHER DATA
The following selected consolidated financial data should be read in conjunction with “Management’s Discussion and Analysis of Financial Condition and Results of Operations” and the consolidated financial statements and related notes thereto included elsewhere in this Annual Report on Form 10-K. The consolidated statements of operations data for each of the years ended December 31,
2018
,
2017
, and
2016
and the consolidated balance sheet data as of December 31,
2018
, and
2017
, are derived from our audited consolidated financial statements that are included elsewhere in this Annual Report on Form 10-K. The consolidated statement of operations data for the year ended December 31, 2015 and the consolidated balance sheet data as of December 31, 2016 are derived from our audited consolidated financial statements not included in this Annual Report on Form 10-K. Our historical results are not necessarily indicative of our future results. The selected consolidated financial data in this section are not intended to replace the consolidated financial statements and related notes thereto included elsewhere in this Annual Report on Form 10-K and are qualified in their entirety by the consolidated financial statements and related notes thereto included elsewhere in this Annual Report on Form 10-K.
Consolidated Statements of Operations Data
|
|
Year ended December 31,
|
||||||||||||||
|
|
2018
|
2017
|
2016
|
2015
|
|||||||||||
|
|
(In millions except for per share amounts)
|
||||||||||||||
|
Revenue
|
$
|
1,391.7
|
|
$
|
1,106.8
|
|
$
|
844.8
|
|
$
|
603.8
|
|
|||
|
Cost of revenue
(1)
|
394.7
|
|
368.9
|
|
390.6
|
|
407.4
|
|
|||||||
|
Gross profit
|
997.0
|
|
737.9
|
|
454.2
|
|
196.4
|
|
|||||||
|
Operating expenses:
(1)
|
|||||||||||||||
|
Research and development
|
768.2
|
|
380.3
|
|
289.7
|
|
201.6
|
|
|||||||
|
Sales and marketing
|
439.6
|
|
314.0
|
|
250.6
|
|
193.1
|
|
|||||||
|
General and administrative
|
283.2
|
|
157.3
|
|
107.4
|
|
107.9
|
|
|||||||
|
Total operating expenses
|
1,491.0
|
|
851.6
|
|
647.7
|
|
502.6
|
|
|||||||
|
Loss from operations
|
(494.0
|
)
|
(113.7
|
)
|
(193.5
|
)
|
(306.2
|
)
|
|||||||
|
Interest income (expense), net
|
7.1
|
|
(11.0
|
)
|
(16.4
|
)
|
(15.2
|
)
|
|||||||
|
Other income (expense), net
|
6.8
|
|
13.2
|
|
4.9
|
|
(4.2
|
)
|
|||||||
|
Loss before income taxes
|
(480.1
|
)
|
(111.5
|
)
|
(205.0
|
)
|
(325.6
|
)
|
|||||||
|
Provision for income taxes
|
(4.8
|
)
|
(0.2
|
)
|
(5.2
|
)
|
(0.3
|
)
|
|||||||
|
Net loss
|
$
|
(484.9
|
)
|
$
|
(111.7
|
)
|
$
|
(210.2
|
)
|
$
|
(325.9
|
)
|
|||
|
Net loss per share attributable to common stockholders, basic and diluted
(2)
|
$
|
(1.35
|
)
|
$
|
(0.57
|
)
|
$
|
(1.11
|
)
|
$
|
(1.77
|
)
|
|||
|
Weighted-average shares used in computing net loss per share attributable to common stockholders, basic and diluted
|
358.6
|
|
195.9
|
|
189.1
|
|
184.5
|
|
|||||||
|
(1)
|
Includes stock-based compensation as follows:
|
40
|
|
Year ended December 31,
|
||||||||||||||
|
|
2018
|
2017
|
2016
|
2015
|
|||||||||||
|
|
(In millions)
|
||||||||||||||
|
Cost of revenue
|
$
|
47.0
|
|
$
|
12.2
|
|
$
|
8.2
|
|
$
|
2.6
|
|
|||
|
Research and development
|
368.2
|
|
93.1
|
|
72.7
|
|
36.1
|
|
|||||||
|
Sales and marketing
|
94.3
|
|
33.7
|
|
44.6
|
|
19.8
|
|
|||||||
|
General and administrative
|
140.6
|
|
25.6
|
|
22.1
|
|
7.6
|
|
|||||||
|
Total stock-based compensation
(3)
|
$
|
650.1
|
|
$
|
164.6
|
|
$
|
147.6
|
|
$
|
66.1
|
|
|||
|
(2)
|
See Note 12, “Net Loss Per Share” to our consolidated financial statements included elsewhere in this Annual Report on Form 10-K for an explanation of the method used to calculate basic and diluted net loss per share attributable to common stockholders.
|
|
(3)
|
During the year ended December 31, 2018, the Company recognized the cumulative unrecognized stock-based compensation of $418.7 million related to our two-tier restricted stock units ("RSUs") upon the effectiveness of our registration statement for our Initial Public Offering ("IPO"). Refer to "Significant Impacts of Stock-Based Compensation" included elsewhere in this Annual Report on Form 10-K for further information.
|
Consolidated Balance Sheet Data
|
|
As of December 31,
|
||||||||||
|
|
2018
|
2017
|
2016
|
||||||||
|
|
(In millions)
|
||||||||||
|
Cash, cash equivalents, and short-term investments
|
$
|
1,089.3
|
|
$
|
430.0
|
|
$
|
352.7
|
|
||
|
Working capital
|
372.7
|
|
(220.3
|
)
|
(221.9
|
)
|
|||||
|
Property and equipment, net
|
310.6
|
|
341.9
|
|
444.0
|
|
|||||
|
Total assets
|
1,694.1
|
|
1,019.9
|
|
1,004.2
|
|
|||||
|
Deferred revenue, current and non-current
|
485.6
|
|
419.2
|
|
354.9
|
|
|||||
|
Capital lease obligations, current and non-current
|
163.7
|
|
174.3
|
|
257.2
|
|
|||||
|
Total stockholders’ equity
|
676.8
|
|
102.9
|
|
122.8
|
|
|||||
41
ITEM 7. MANAGEMENT’S DISCUSSION AND ANALYSIS OF FINANCIAL CONDITION AND RESULTS OF OPERATIONS
The following discussion and analysis of our financial condition and results of operations should be read in conjunction with the section titled “Selected Consolidated Financial and Other Data” and the consolidated financial statements and related notes thereto included elsewhere in this Annual Report on Form 10-K. This discussion contains forward-looking statements that involve risks and uncertainties. Our actual results could differ materially from those discussed below. Factors that could cause or contribute to such differences include, but are not limited to, those identified below and those discussed in the section titled “Risk Factors” included elsewhere in this Annual Report on Form 10-K.
Overview
Our modern economy runs on knowledge. Today, knowledge lives in the cloud as digital content, and Dropbox is a global collaboration platform where more and more of this content is created, accessed, and shared with the world. We serve more than 500 million registered users across 180 countries.
Since our founding in 2007, our market opportunity has grown as we’ve expanded from keeping files in sync to keeping teams in sync. We believe the need for our platform will continue to grow as teams become more fluid and global, and content is increasingly fragmented across incompatible tools and devices. Dropbox breaks down silos by centralizing the flow of information between the products and services our users prefer, even if they’re not our own.
By solving these universal problems, we’ve become invaluable to our users. The popularity of our platform drives viral growth, which has allowed us to scale rapidly and efficiently. We’ve built a thriving global business with 12.7 million paying users.
Our Subscription Plans
We generate revenue from individuals, teams, and organizations by selling subscriptions to our platform, which serve the varying needs of our diverse customer base. Subscribers can purchase individual licenses through our Plus and Professional plans, or purchase multiple licenses through a Standard, Advanced, or Enterprise team plan. Each team represents a separately billed deployment that is managed through a single administrative dashboard. Teams must have a minimum of three users, but can also have more than tens of thousands of users. Customers can choose between an annual or monthly plan, with a small number of large organizations on multi-year plans. A majority of our customers opt for our annual plans. We typically bill our customers at the beginning of their respective terms and recognize revenue ratably over the term of the subscription period. International customers can pay in U.S. dollars or a select number of foreign currencies.
Our premium subscription plans, such as Professional and Advanced, provide more functionality than other subscription plans and have higher per user prices. Our Standard and Advanced subscription plans offer robust capabilities for businesses, and the vast majority of Dropbox Business teams purchase our Standard or Advanced subscription plans. While our Enterprise subscription plan offers more opportunities for customization, companies can subscribe to any of these team plans for their business needs.
Our Customers
Our customer base is highly diversified, and in the period presented, no customer accounted for more than 1% of our revenue. Our customers include individuals, teams, and organizations of all sizes, from freelancers and small businesses to Fortune 100 companies. They work across a wide range of industries, including professional services, technology, media, education, industrials, consumer and retail, and financial services. Within companies, our platform is used by all types of teams and functions, including sales, marketing, product, design, engineering, finance, legal, and human resources.
42
Our Business Model
Drive new signups
We acquire users efficiently and at relatively low costs through word-of-mouth referrals, direct in-product referrals, and sharing of content. Anyone can create a Dropbox account for free through our website or app and be up and running in minutes. These users often share and collaborate with other non-registered users, attracting new signups into our network.
Increase conversion of registered users to our paid subscription plans
We generate over 90% of our revenue from self-serve channels—users who purchase a subscription through our app or website. We actively encourage our registered users to become paying users through in-product prompts and notifications, time-limited free trials of paid subscription plans, email campaigns, and lifecycle marketing.
Upgrade and expand existing customers
We offer a range of paid subscription plans, from Plus and Professional for individuals to Standard, Advanced, and Enterprise for teams. We analyze usage patterns within our network and run hundreds of targeted marketing campaigns to encourage paying users to upgrade their plans. We prompt individual subscribers who collaborate with others on Dropbox to purchase our Standard or Advanced plans for a better team experience, and we also encourage existing Dropbox Business teams to purchase additional licenses or to upgrade to premium subscription plans.
Key Business Metrics
We review a number of operating and financial metrics, including the following key metrics to evaluate our business, measure our performance, identify trends affecting our business, formulate business plans, and make strategic decisions.
Paying users
We define paying users as the number of users who have active paid licenses for access to our platform as of the end of the period. One person would count as multiple paying users if the person had more than one active license. For example, a 50-person Dropbox Business team would count as 50 paying users, and an individual Dropbox Plus user would count as one paying user. If that individual Dropbox Plus user was also part of the 50-person Dropbox Business team, we would count the individual as two paying users. As of December 31, 2018, across all of our paying users, more than 30% subscribe to a Dropbox team plan while the remainder are on a Dropbox individual plan.
We have experienced growth in the number of paying users across our products, with the majority of paying users for the periods presented coming from our self-serve channels.
The below table sets forth the number of paying users as of December 31,
2018
,
2017
, and
2016
:
|
|
As of December 31,
|
|||||||
|
|
2018
|
2017
|
2016
|
|||||
|
|
(In millions)
|
|||||||
|
Paying users
|
12.7
|
|
11.0
|
|
8.8
|
|
||
Average revenue per paying user
We define average revenue per paying user, or ARPU, as our revenue for the period presented divided by the average paying users during the same period. For interim periods, we use annualized revenue, which is calculated by dividing the revenue for the particular period by the number of days in that period and multiplying this value by 365 days. Average paying users are calculated based on adding the number of paying users as of the beginning of the period to the number of paying users as of the end of the period, and then dividing by two.
In 2017, we launched our Dropbox Business Advanced plan. At the time of launch, we grandfathered existing Dropbox Business teams into the Dropbox Business Advanced plan at their legacy price. During the second quarter of 2018, a significant portion of those grandfathered teams renewed at a higher price. As a result of these renewals, and combined with an increased
43
mix of sales towards our higher-priced subscription plans, we experienced an increase in our average revenue per paying user for the year ended
December 31, 2018
, compared to the year ended
December 31, 2017
.
Our ARPU increased for the year ended
December 31, 2017
, compared to the year ended
December 31, 2016
, primarily due to an increased mix of sales towards our higher priced subscription plans, including our Dropbox Business Advanced plan launched in early 2017.
The below table sets forth our ARPU for the years ended December 31,
2018
,
2017
, and
2016
.
|
|
Year ended December 31,
|
||||||||||
|
|
2018
|
2017
|
2016
|
||||||||
|
ARPU
|
$
|
117.64
|
|
$
|
111.91
|
|
$
|
110.54
|
|
||
Non-GAAP Financial Measure
In addition to our results determined in accordance with U.S. generally accepted accounting principles, or GAAP, we believe that free cash flow, or FCF, a non-GAAP financial measure, is useful in evaluating our liquidity.
Free cash flow
We define FCF as GAAP net cash provided by operating activities less capital expenditures. We believe that FCF is a liquidity measure and that it provides useful information regarding cash provided by operating activities and cash used for investments in property and equipment required to maintain and grow our business. FCF is presented for supplemental informational purposes only and should not be considered a substitute for financial information presented in accordance with GAAP. FCF has limitations as an analytical tool, and it should not be considered in isolation or as a substitute for analysis of other GAAP financial measures, such as net cash provided by operating activities. Some of the limitations of FCF are that FCF does not reflect our future contractual commitments, excludes investments made to acquire assets under capital leases, and may be calculated differently by other companies in our industry, limiting its usefulness as a comparative measure.
Our FCF increased for the year ended
December 31, 2018
, compared to the year ended
December 31, 2017
, primarily due to higher cash provided by operating activities, which was driven by increased subscription sales, as a majority of our paying users are invoiced in advance. These cash inflows were partially offset by an increase in capital expenditures primarily related to the build-out of our new corporate headquarters.
Our FCF increased for the year ended
December 31, 2017
, compared to the year ended
December 31, 2016
, primarily due to higher cash provided by operating activities, which was driven by increased subscription sales, as a majority of our paying users are invoiced in advance. In addition, FCF increased due to a decrease in capital expenditures related to our office and datacenter build-outs.
We expect our FCF to fluctuate in future periods as we purchase infrastructure equipment to support our user base and invest in our new and existing office spaces, including our new corporate headquarters, to support our plans for growth. These activities, along with certain increased operating expenses as described below, may result in a decrease in FCF as a percentage of revenue in future periods.
The following is a reconciliation of FCF to the most comparable GAAP measure, net cash provided by operating activities:
|
|
Year ended December 31,
|
||||||||||
|
|
2018
|
2017
|
2016
|
||||||||
|
|
(In millions)
|
||||||||||
|
Net cash provided by operating activities
|
$
|
425.4
|
|
$
|
330.3
|
|
$
|
252.6
|
|
||
|
Capital expenditures
|
(63.0
|
)
|
(25.3
|
)
|
(115.2
|
)
|
|||||
|
Free cash flow
|
$
|
362.4
|
|
$
|
305.0
|
|
$
|
137.4
|
|
||
Components of Our Results of Operations
44
Revenue
We generate revenue from sales of subscriptions to our platform.
Revenue is recognized ratably over the related contractual term generally beginning on the date that our platform is made available to a customer. Our subscription agreements typically have monthly or annual contractual terms, although a small percentage have multi-year contractual terms. Our agreements are generally non-cancelable. We typically bill in advance for monthly contracts and annually in advance for contracts with terms of one year or longer. Amounts that have been billed are initially recorded as deferred revenue until the revenue is recognized.
Our revenue is driven primarily by the number of paying users and the price we charge for access to our platform, which varies based on the type of plan to which a customer subscribes. We generate over 90% of our revenue from self-serve channels. No customer represented more than 1% of our revenue in the periods presented.
Cost of revenue and gross margin
Cost of revenue.
Our cost of revenue consists primarily of expenses associated with the storage, delivery, and distribution of our platform for both paying users and free users, also known as Basic users. These costs, which we refer to as infrastructure costs, include depreciation of our servers located in co-location facilities that we lease and operate, rent and facilities expense for those datacenters, network and bandwidth costs, support and maintenance costs for our infrastructure equipment, and payments to third-party datacenter service providers. Cost of revenue also includes costs, such as salaries, bonuses, employer payroll taxes and benefits, travel-related expenses, and stock-based compensation, which we refer to as employee-related costs, for employees whose primary responsibilities relate to supporting our infrastructure and delivering user support. Other non-employee costs included in cost of revenue include credit card fees related to processing customer transactions, and allocated overhead, such as facilities, including rent, utilities, depreciation on leasehold improvements and other equipment shared by all departments, and shared information technology costs. In addition, cost of revenue includes amortization of developed technologies, professional fees related to user support initiatives, and property taxes related to the datacenters.
In recent years, we have taken several steps to improve the efficiency of the infrastructure that supports our platform. These efforts include an initiative that focused on migrating the vast majority of user data stored on the infrastructure of third-party service providers to our own lower cost, custom-built infrastructure in co-location facilities that we directly lease and operate. In order to host user data on our own infrastructure, we leased or purchased infrastructure that is depreciated within our cost of revenue. During the migration to our internal infrastructure, we duplicated our users’ data between our internal infrastructure and that of our third-party service providers, resulting in higher storage costs. We reduced this practice over time until we completed the migration in the fourth quarter of 2016. Related to this initiative, we no longer duplicate data between our internal infrastructure and that of any third-party service providers. We expect to continue to realize benefits from expanding our internal infrastructure due to our operating scale and lower unit costs.
Starting in 2016, we also took measures to manage the storage footprint of certain long-inactive Basic users, freeing up additional storage capacity. Specifically, we closed the accounts of certain Basic users who had not engaged in any activity on the Dropbox platform in the last year and did not respond to multiple e-mail inquiries from us regarding their inactivity. We continue to regularly take similar measures to manage long-inactive and non-responsive Basic user accounts, and our total registered user numbers do not include accounts that have been closed. This effort, along with additional usage optimizations in 2017, enabled us to continue operating our business within our existing infrastructure base without a need for extensive incremental capital expenditures and leasing activity.
These efforts are collectively referred to as our Infrastructure Optimization, and some are ongoing.
Our Infrastructure Optimization reduced unit costs and helped limit capital expenditures and associated depreciation. Combined with the concurrent increase in our base of paying users, we experienced a reduction in our cost of revenue, an increase in our gross margins, and an improvement in our free cash flow in the periods presented.
During the first quarter of 2018, based on considerations including our asset replacement cycle and our ongoing Infrastructure Optimization efforts, we revisited the useful life estimates of certain infrastructure equipment. These optimization efforts include efficiencies that allow us to utilize certain infrastructure equipment for longer periods of time. As a result, we determined that the useful lives of the impacted infrastructure equipment, which are depreciated through cost of revenue, should be increased from three to four years. We accounted for this as a change in estimate that was applied prospectively, effective as of January 1, 2018. This change in useful life resulted in a reduction in depreciation expense within cost of revenue of $16.1 million during the year ended
December 31, 2018
.
We plan to continue increasing the capacity and enhancing the capability and reliability of our infrastructure to support user growth and increased use of our platform. We expect that cost of revenue, excluding the impact of certain stock-based compensation charges described in “—Significant Impacts of Stock-Based Compensation”, will increase in absolute dollars in
45
future periods. In addition, as a result of certain stock-based compensation charges described in “—Significant Impacts of Stock-Based Compensation”, our cost of revenue increased significantly in absolute dollars during the year ended
December 31, 2018
due to the completion of our initial public offering.
Gross margin.
Gross margin is gross profit expressed as a percentage of revenue. Our gross margin may fluctuate from period to period based on the timing of additional capital expenditures and the related depreciation expense, or other increases in our infrastructure costs, as well as revenue fluctuations. As we continue to increase the utilization of our internal infrastructure, we generally expect our gross margin, excluding the impact of certain stock-based compensation charges described in “—Significant Impacts of Stock-Based Compensation”, to remain relatively constant in the near term and to increase modestly in the long term.
Operating expenses
Research and development
. Our research and development expenses consist primarily of employee-related costs for our engineering, product, and design teams, and allocated overhead. Additionally, research and development expenses include internal development-related third-party hosting fees. We have expensed almost all of our research and development costs as they were incurred.
We plan to continue to hire employees for our engineering, product, and design teams to support our research and development efforts. We expect that research and development costs will increase in absolute dollars in future periods and, excluding the impact of certain stock-based compensation charges described in “—Significant Impacts of Stock-Based Compensation”, vary from period to period as a percentage of revenue.
Sales and marketing
. Our sales and marketing expenses relate to both self-serve and outbound sales activities, and consist primarily of employee-related costs, brand marketing costs, lead generation costs, sponsorships and allocated overhead. Sales commissions earned by our outbound sales team and the related payroll taxes, as well as commissions earned by third-party resellers that we consider to be incremental and recoverable costs of obtaining a contract with a user, are deferred and amortized over an estimated period of benefit of five years. Additionally, sales and marketing expenses include non-employee costs related to app store fees and fees payable to third-party sales representatives.
We plan to continue to invest in sales and marketing to grow our user base and increase our brand awareness, including marketing efforts to continue to drive our self-serve business model. We expect that sales and marketing expenses will increase in absolute dollars in future periods and, excluding the impact of certain stock-based compensation charges described in “—Significant Impacts of Stock-Based Compensation”, vary from period to period as a percentage of revenue. The trend and timing of sales and marketing expenses will depend in part on the timing of marketing campaigns.
General and administrative
. Our general and administrative expenses consist primarily of employee-related costs for our legal, finance, human resources, and other administrative teams, as well as certain executives. In addition, general and administrative expenses include allocated overhead, outside legal, accounting and other professional fees, non-income based taxes, and contributions to the Dropbox Charitable Foundation.
We expect to incur additional general and administrative expenses to support the growth of the Company as well as our transition to being a publicly traded company, which includes the recognition of stock-based compensation expense related to grants of restricted stock made to our co-founders. We expect that general and administrative expenses will increase in absolute dollars in future periods and, excluding the impact of certain stock-based compensation charges described in “—Significant Impacts of Stock-Based Compensation”, vary from period to period as a percentage of revenue.
As a result of certain stock-based compensation charges described in “—Significant Impacts of Stock-Based Compensation”, our research and development, sales and marketing, and general and administrative expenses increased significantly in absolute dollars and as a percentage of revenue during the year ended
December 31, 2018
due to the completion of our initial public offering.
Interest income (expense), net
Interest income (expense), net consists primarily of interest income earned from our money market funds classified as cash and cash equivalents and short-term investments, partially offset by interest expense related to our capital lease obligations for infrastructure and our imputed financing obligation for our liability to the legal owner of our previous corporate headquarters. Beginning in the fourth quarter of 2018, we no longer incur interest expense for our imputed financing obligation due to the termination of our master lease for our previous corporate headquarters in the third quarter of 2018.
Other income, net
46
Other income, net consists of other non-operating gains or losses, including those related to lease arrangements, which include ongoing subleases. Sublease income in excess of our original lease obligation is split with the original lessor per the terms of the sublease agreement, with our portion recorded to other income, net. Other income, net also includes foreign currency transaction gains and losses, and realized gains and losses related to our short-term investments.
Provision for income taxes
Provision for income taxes consists primarily of U.S. federal and state income taxes and income taxes in certain foreign jurisdictions in which we conduct business. For the periods presented, the difference between the U.S. statutory rate and our effective tax rate is primarily due to the valuation allowance on deferred tax assets. Our effective tax rate is also impacted by earnings realized in foreign jurisdictions with statutory tax rates lower than the federal statutory tax rate. We maintain a full valuation allowance on our net deferred tax assets for federal, state, and certain foreign jurisdictions as we have concluded that it is not more likely than not that the deferred assets will be realized.
As of December 31, 2018, we had $923.6 million of federal and $403.5 million of state net operating loss carryforwards available to reduce future taxable income. Of our federal net operating loss carryforwards, $307.4 million will begin to expire in 2031 and $616.2 million will carryforward indefinitely, while state net operating losses begin to expire in 2029. As of December 31, 2018, we also had $265.1 million of foreign net operating loss carryforwards available to reduce future taxable income, which will carryforward indefinitely. In addition, we had $22.9 million of foreign acquired net operating losses, which will carryforward indefinitely. It is possible that we will not generate taxable income in time to use these net operating loss carryforwards before their expiration. In addition, under Section 382 and 383 of the Internal Revenue Code of 1986, as amended, or the Code, if a corporation undergoes an “ownership change,” the corporation’s ability to use its pre-change net operating loss carryforwards and other pre-change attributes, such as research tax credits, to offset its post-change income may be limited. In general, an “ownership change” will occur if there is a cumulative change in our ownership by “5-percent shareholders” that exceeds 50 percentage points over a rolling three-year period. Similar rules may apply under state tax laws. We performed a study for the period through December 31, 2018, and determined that no ownership changes exceeding 50 percentage points have occurred. Our ability to use net operating loss and tax credit carryforwards to reduce future taxable income and liabilities may be subject to annual limitations as a result of ownership changes from January 1, 2019, and subsequent years.
The Tax Cuts and Jobs Act, or the Tax Reform Act, was enacted on December 22, 2017 and provides for significant changes to U.S. tax law. Among other provisions, the Tax Reform Act reduces the U.S. corporate income tax rate to 21% effective in 2018. The Tax Reform Act also contains a number of provisions that may impact us in future years. At December 31, 2017, we had not completed our accounting for all of the enactment-date income tax effects of the Tax Reform Act for remeasurement of deferred tax assets and liabilities, one-time transition tax, and tax on global intangible low-taxed income. During the twelve months ended December 31, 2018 we completed our accounting for all of the enactment-date income tax effects of the Tax Reform Act. Upon completing our analysis, we have recognized no material adjustments to our provisional amounts recorded for the year ended December 31, 2017.
We continue to monitor ongoing guidance in this area, as the U.S. Treasury Department, the IRS, and other standard-setting bodies could interpret or issue guidance on how provisions of the Tax Reform Act will be applied or otherwise administered that is different from our interpretation.
As a result of the reduction in the corporate rate, we remeasured our U.S. deferred tax assets and liabilities as of December 31, 2017 to reflect the lower rate expected to apply when these temporary differences reverse. As of December 31, 2017, we determined the remeasurement resulted in a reduction in deferred tax assets of $63.1 million, which was fully offset by a corresponding change to our valuation allowance. There were no material changes from provisional amounts recorded for the year ended December 31, 2017.
The Tax Reform Act repeals the corporate alternative minimum tax, or AMT, effective beginning in 2018 and permits AMT credit carryforwards to be refunded to the extent unused through 2021. Since we do not anticipate the use of these credits to reduce future federal taxes, we recognized an income tax benefit and established an income tax receivable to reflect anticipated refunds of $1.4 million for our 2016 AMT credit carryforward during the year ended December 31, 2018. There were no material changes from provisional amounts recorded for the year ended December 31, 2017.
The Tax Reform Act also provides for a transition to a new territorial system of taxation and generally requires companies to include certain untaxed foreign earnings of non-U.S. subsidiaries into taxable income in 2017, or the Transition Tax. As a result of the cumulative deficits in our foreign subsidiaries, we have no Transition Tax inclusion.
The Tax Reform Act subjects a U.S. shareholder to current tax on global intangible low-taxed income (GILTI) earned by certain foreign subsidiaries. The FASB Staff Q&A, Topic 740 No. 5, Accounting for Global Intangible Low-Taxed Income, states that an entity can make an accounting policy election to either recognize deferred taxes for temporary differences expected to reverse as GILTI in future years or provide for the tax expense related to GILTI in the year the tax is incurred. We
47
have elected to recognize the tax on GILTI as a period expense in the period the tax is incurred. As a result of the tested losses in our foreign subsidiaries under GILTI regulations, we have no GILTI inclusion for the year ended December 31, 2018.
Results of Operations
The following tables set forth our results of operations for the periods presented and as a percentage of our total revenue for those periods:
|
|
Year ended December 31,
|
||||||||||
|
|
2018
|
2017
|
2016
|
||||||||
|
|
(In millions)
|
||||||||||
|
Revenue
|
$
|
1,391.7
|
|
$
|
1,106.8
|
|
$
|
844.8
|
|
||
|
Cost of revenue
(1)
|
394.7
|
|
368.9
|
|
390.6
|
|
|||||
|
Gross profit
|
997.0
|
|
737.9
|
|
454.2
|
|
|||||
|
Operating expenses:
(1)
|
|||||||||||
|
Research and development
|
768.2
|
|
380.3
|
|
289.7
|
|
|||||
|
Sales and marketing
|
439.6
|
|
314.0
|
|
250.6
|
|
|||||
|
General and administrative
|
283.2
|
|
157.3
|
|
107.4
|
|
|||||
|
Total operating expenses
|
1,491.0
|
|
851.6
|
|
647.7
|
|
|||||
|
Loss from operations
|
(494.0
|
)
|
(113.7
|
)
|
(193.5
|
)
|
|||||
|
Interest income (expense), net
|
7.1
|
|
(11.0
|
)
|
(16.4
|
)
|
|||||
|
Other income, net
|
6.8
|
|
13.2
|
|
4.9
|
|
|||||
|
Loss before income taxes
|
(480.1
|
)
|
(111.5
|
)
|
(205.0
|
)
|
|||||
|
Provision for income taxes
|
(4.8
|
)
|
(0.2
|
)
|
(5.2
|
)
|
|||||
|
Net loss
|
$
|
(484.9
|
)
|
$
|
(111.7
|
)
|
$
|
(210.2
|
)
|
||
|
(1)
|
Includes stock-based compensation as follows:
|
|
|
Year ended December 31,
|
||||||||||
|
|
2018
|
2017
|
2016
|
||||||||
|
|
(In millions)
|
||||||||||
|
Cost of revenue
|
$
|
47.0
|
|
$
|
12.2
|
|
$
|
8.2
|
|
||
|
Research and development
|
368.2
|
|
93.1
|
|
72.7
|
|
|||||
|
Sales and marketing
|
94.3
|
|
33.7
|
|
44.6
|
|
|||||
|
General and administrative
|
140.6
|
|
25.6
|
|
22.1
|
|
|||||
|
Total stock-based compensation
(2)
|
$
|
650.1
|
|
$
|
164.6
|
|
$
|
147.6
|
|
||
|
(2)
|
During the year ended December 31, 2018, we recognized the cumulative unrecognized stock-based compensation of $418.7 million related to our two-tier restricted stock units upon the effectiveness of our registration statement for our IPO. Refer to "Significant Impacts of Stock-Based Compensation" included elsewhere in this Annual Report on Form 10-K for further information.
|
48
|
|
Year ended December 31,
|
|||||||
|
|
2018
|
2017
|
2016
|
|||||
|
|
(As a % of revenue)
|
|||||||
|
Revenue
|
100
|
%
|
100
|
%
|
100
|
%
|
||
|
Cost of revenue
|
28
|
|
33
|
|
46
|
|
||
|
Gross profit
|
72
|
|
67
|
|
54
|
|
||
|
Operating expenses:
|
—
|
|
||||||
|
Research and development
|
55
|
|
34
|
|
34
|
|
||
|
Sales and marketing
|
32
|
|
28
|
|
30
|
|
||
|
General and administrative
|
20
|
|
14
|
|
13
|
|
||
|
Total operating expenses
|
107
|
|
77
|
|
77
|
|
||
|
Loss from operations
|
(35
|
)
|
(10
|
)
|
(23
|
)
|
||
|
Interest income (expense), net
|
1
|
|
(1
|
)
|
(2
|
)
|
||
|
Other income, net
|
—
|
|
1
|
|
1
|
|
||
|
Loss before income taxes
|
(34
|
)
|
(10
|
)
|
(24
|
)
|
||
|
Provision for income taxes
|
—
|
|
—
|
|
(1
|
)
|
||
|
Net loss
|
(35
|
)%
|
(10
|
)%
|
(25
|
)%
|
||
Comparison of the year ended December 31,
2018
and
2017
Revenue
|
|
Year ended
December 31,
|
|
|
|||||||||||
|
|
2018
|
2017
|
$ Change
|
% Change
|
||||||||||
|
|
(In millions)
|
|
|
|||||||||||
|
Revenue
|
$
|
1,391.7
|
|
$
|
1,106.8
|
|
$
|
284.9
|
|
26
|
%
|
|||
Revenue increased
$284.9
million or
26%
during the year ended December 31,
2018
, as compared to the year ended December 31,
2017
. This increase was primarily due to a 16% increase in the number of paying users between periods. The average revenue per paying user also increased between periods primarily due to an increased mix of sales towards our higher priced subscription plans, including our Dropbox Business Advanced plan launched in early 2017.
Cost of revenue, gross profit, and gross margin
|
|
Year ended
December 31,
|
|
|
|||||||||||
|
|
2018
|
2017
|
$ Change
|
% Change
|
||||||||||
|
|
(In millions)
|
|
|
|||||||||||
|
Cost of revenue
|
$
|
394.7
|
|
$
|
368.9
|
|
$
|
25.8
|
|
7
|
%
|
|||
|
Gross profit
|
997.0
|
|
737.9
|
|
259.1
|
|
35
|
%
|
||||||
|
Gross margin
|
72
|
%
|
67
|
%
|
||||||||||
Cost of revenue increased
$25.8
million or
7%
during the year ended December 31,
2018
, as compared to the year ended December 31,
2017
, primarily due to an increase of $34.8 million in stock-based compensation, which included expense recognized due to the achievement of the performance vesting condition of our two-tier RSUs upon the effectiveness of the registration statement related to our IPO. Cost of revenue also increased due to $10.1 million in credit card transaction fees due to higher sales and professional fees for user support, and $4.3 million in overhead-related costs. These increases were partially offset by a decrease of $23.3 million in our infrastructure costs primarily due to continued infrastructure usage optimization
49
efforts, which included a reduction in depreciation expense due to the change in depreciable useful life of certain of our infrastructure equipment, which was effective on January 1, 2018.
Our gross margin increased from
67%
during the year ended December 31,
2017
to
72%
during the year ended December 31,
2018
, primarily due to a
26%
increase in our revenue during the period and a decrease in our infrastructure costs as described above. The increase in gross margin was partially offset by the increase in stock-based compensation from the achievement of the performance vesting condition related to our two-tier RSUs upon the effectiveness of the registration statement related to our IPO.
Research and development
|
|
Year ended
December 31,
|
|
|
|||||||||||
|
|
2018
|
2017
|
$ Change
|
% Change
|
||||||||||
|
|
(In millions)
|
|
|
|||||||||||
|
Research and development
|
$
|
768.2
|
|
$
|
380.3
|
|
$
|
387.9
|
|
102
|
%
|
|||
Research and development expenses increased
$387.9
million or
102%
during the year ended December 31,
2018
, as compared to the year ended December 31,
2017
, primarily due to an increase of $275.1 million in stock-based compensation, which included expense recognized due to the achievement of the performance vesting condition of our two-tier RSUs upon the effectiveness of the registration statement related to our IPO. Further, the increase in research and development expense was due to an increase of $61.8 million in employee-related expenses, excluding stock-based compensation, which was due to headcount growth and employer payroll taxes related to the release of our two-tier RSUs, and an increase of $39.9 million in overhead-related costs.
Sales and marketing
|
|
Year ended
December 31,
|
|
|
|||||||||||
|
|
2018
|
2017
|
$ Change
|
% Change
|
||||||||||
|
|
(In millions)
|
|
|
|||||||||||
|
Sales and marketing
|
$
|
439.6
|
|
$
|
314.0
|
|
$
|
125.6
|
|
40
|
%
|
|||
Sales and marketing expenses increased
$125.6
million or
40%
during the year ended December 31
2018
, as compared to the year ended December 31,
2017
, primarily due to an increase of $60.6 million in stock-based compensation, which included expense recognized due to the achievement of the performance vesting condition of our two-tier RSUs upon the effectiveness of the registration statement related to our IPO. Sales and marketing expenses also increased $22.3 million due to brand marketing costs, lead generation costs, third-party sales representative fees, and sponsorships. In addition, the increase in sales and marketing expense was due to an increase of $17.5 million in employee-related expenses, excluding stock-based compensation, which was due to headcount growth and employer payroll taxes related to the release of our two-tier RSUs, and an increase of app store fees as a result of increased sales.
General and administrative
|
|
Year ended
December 31,
|
|
|
|||||||||||
|
|
2018
|
2017
|
$ Change
|
% Change
|
||||||||||
|
|
(In millions)
|
|
|
|||||||||||
|
General and administrative
|
$
|
283.2
|
|
$
|
157.3
|
|
$
|
125.9
|
|
80
|
%
|
|||
General and administrative expenses increased
$125.9
million or
80%
during the year ended December 31,
2018
, as compared to the year ended December 31,
2017
, primarily due to an increase of $115.0 million in stock-based compensation, which included expense recognized due to the achievement of the performance vesting condition of our two-tier RSUs, and the
50
performance-based vesting condition for the Co-Founder Grants in connection with our IPO. In addition, general and administrative expenses increased $12.0 million due to employee-related expenses, excluding stock-based compensation, due to headcount growth and employer payroll taxes related to the release of our two-tier RSUs. These increases were offset by a decrease of $11.3 million in contributions to the Dropbox Charitable Foundation, of which $9.4 million was a non-cash contribution of Class A common stock for its initial funding, and $1.9 million was related to cash contributions made during the year ended December 31, 2017.
Interest income (expense), net
Interest income (expense), net increased
$18.1
million during the year ended December 31,
2018
, as compared to the year ended December 31,
2017
, primarily due to an increase in interest income from our money market funds and short-term investments of $13.8 million, and a decrease of interest expense of $4.2 million due to fewer assets acquired under capital leases.
Other income, net
Other income, net decreased
$6.4
million during the year ended December 31,
2018
, as compared to the year ended December 31,
2017
, primarily due to foreign currency losses of $1.9 million during the year ended December 31, 2018, compared to foreign currency gains of $5.0 million during the year ended December 31, 2017, primarily related to monetary assets and liabilities denominated in euros and pounds.
Provision for income taxes
Provision for income taxes increased by
$4.6
million during the year ended December 31,
2018
as compared to the year ended December 31,
2017
, primarily as a result of an increase in foreign taxes and the one-time benefit recorded during the year ended December 31, 2017 from the repeal of the AMT pursuant to the Tax Reform Act.
Comparison of the year ended December 31,
2017
and
2016
Revenue
|
|
Year ended
December 31,
|
|
|
|||||||||||
|
|
2017
|
2016
|
$ Change
|
% Change
|
||||||||||
|
|
(In millions)
|
|
|
|||||||||||
|
Revenue
|
$
|
1,106.8
|
|
$
|
844.8
|
|
$
|
262.0
|
|
31
|
%
|
|||
Revenue increased
$262.0 million
or
31%
during the year ended December 31,
2017
as compared to the year ended December 31,
2016
. This increase was primarily due to a 25% increase in the number of paying users between periods. The average revenue per paying user also increased slightly between periods primarily due to an increased mix of sales towards our higher priced subscription plans, including our Dropbox Business Advanced plan launched in early 2017.
Cost of revenue, gross profit, and gross margin
|
|
Year ended
December 31,
|
|
|
|||||||||||
|
|
2017
|
2016
|
$ Change
|
% Change
|
||||||||||
|
|
(In millions)
|
|
|
|||||||||||
|
Cost of revenue
|
$
|
368.9
|
|
$
|
390.6
|
|
$
|
(21.7
|
)
|
(6
|
)%
|
|||
|
Gross profit
|
737.9
|
|
454.2
|
|
283.7
|
|
62
|
%
|
||||||
|
Gross margin
|
67
|
%
|
54
|
%
|
||||||||||
Cost of revenue decreased
$21.7 million
or
6%
during the year ended December 31,
2017
, as compared to the year ended December 31,
2016
, primarily due to a $35.1 million decrease in our infrastructure costs due to our Infrastructure Optimization. Further, the decrease in cost of revenue was due to a $5.9 million decrease in amortization of developed technologies, as certain
51
intangible assets became fully amortized during 2016. These decreases were partially offset by an increase of $11.0 million in employee-related expenses, which was due to headcount growth, and an increase of $8.3 million in credit card transaction fees and professional fees for user support.
Our gross margin increased from 54% during the year ended December 31,
2016
to 67% during the year ended December 31,
2017
primarily due to a 31% increase in our revenue during the period and our Infrastructure Optimization.
Research and development
|
|
Year ended
December 31,
|
|
|
|||||||||||
|
|
2017
|
2016
|
$ Change
|
% Change
|
||||||||||
|
|
(In millions)
|
|
|
|||||||||||
|
Research and development
|
$
|
380.3
|
|
$
|
289.7
|
|
$
|
90.6
|
|
31
|
%
|
|||
Research and development expenses increased
$90.6 million
or
31%
during the year ended December 31,
2017
, as compared to the year ended December 31,
2016
, primarily due to an increase of $64.7 million in employee-related expenses, which was due to headcount growth. Further, the increase in research and development expense was due to an increase of $14.1 million in overhead-related costs and an increase of $4.5 million in internal development-related third-party hosting fees.
Sales and marketing
|
|
Year ended
December 31,
|
|
|
|||||||||||
|
|
2017
|
2016
|
$ Change
|
% Change
|
||||||||||
|
|
(In millions)
|
|
|
|||||||||||
|
Sales and marketing
|
$
|
314.0
|
|
$
|
250.6
|
|
$
|
63.4
|
|
25
|
%
|
|||
Sales and marketing expenses increased
$63.4 million
or
25%
during the year ended December 31,
2017
, as compared to the year ended December 31,
2016
, primarily due to an increase of $40.9 million in spend related to brand campaign fees, lead generation fees, and third-party sales representative fees. In addition, sales and marketing expenses increased due to $17.8 million in employee-related expenses excluding stock-based compensation, which was due to headcount growth. Stock-based compensation decreased $10.9 million due to the modification of an executive stock grant during 2016, that resulted in a charge of $18.8 million in that prior period. Sales and marketing expenses also increased $7.6 million due to an increase in overhead-related costs and an increase in app store fees as a result of increased sales.
General and administrative
|
|
Year ended
December 31,
|
|
|
|||||||||||
|
|
2017
|
2016
|
$ Change
|
% Change
|
||||||||||
|
|
(In millions)
|
|
|
|||||||||||
|
General and administrative
|
$
|
157.3
|
|
$
|
107.4
|
|
$
|
49.9
|
|
46
|
%
|
|||
General and administrative expenses increased
$49.9 million
or
46%
during the year ended December 31,
2017
, as compared to the year ended December 31,
2016
, primarily due to an increase of $17.3 million in non-income based taxes as a result of the growth in our business. General and administrative expenses during 2016 included a $12.4 million benefit relating to a non-income based tax ruling. In addition, employee-related expenses increased $13.3 million during 2017, as compared to 2016, due to headcount growth, and other general and administrative expenses increased $11.3 million related to the funding of the Dropbox Charitable Foundation. Included in this amount was an equity-based charitable contribution of $9.4 million and cash contributions of $1.9 million. Further, general and administrative expenses increased $4.3 million due to legal-related expenses and accounting services.
52
Interest income (expense), net
Interest income (expense), net decreased $5.4 million during the year ended December 31,
2017
, as compared to the year ended December 31,
2016
, primarily due to a decrease in interest expense of $3.3 million due to fewer assets acquired under capital leases. In addition, interest income from our money market funds increased by $2.1 million.
Other income, net
Other income, net increased $8.3 million during the year ended December 31,
2017
, as compared to the year ended December 31,
2016
, primarily due to an increase of $8.6 million in foreign currency gains related to monetary assets and liabilities denominated in euros and British pound sterling.
Provision for income taxes
Provision for income taxes decreased by $5.0 million during the year ended December 31, 2017 as compared to the year ended December 31, 2016, primarily as a result of a change in our U.S. alternative minimum tax ("AMT") position. We were subject to U.S. AMT during 2016, and were not subject to U.S. AMT during 2017. In addition, as a result of the repeal of AMT as part of the Tax Reform Act, we recognized a benefit and established a receivable in 2017 to reflect anticipated refunds of our 2016 AMT credit carryforward.
Quarterly Results of Operations
The following table sets forth our unaudited quarterly statements of operations data for each of the last eight quarters ended December 31,
2018
. The information for each of these quarters has been prepared on the same basis as the audited annual financial statements included elsewhere in this Annual Report on Form 10-K and, in the opinion of management, includes all adjustments, which includes only normal recurring adjustments, necessary for the fair statement of the results of operations for these periods. This data should be read in conjunction with our audited consolidated financial statements and related notes thereto included elsewhere in this Annual Report on Form 10-K. These quarterly results of operations are not necessarily indicative of our future results of operations that may be expected for any future period.
|
|
Three months ended
|
||||||||||||||||||||||||||||||
|
|
December 31,
2018 |
September 30,
2018 |
June 30,
2018 |
March 31,
2018 |
December 31,
2017 |
September 30,
2017 |
June 30,
2017 |
March 31,
2017 |
|||||||||||||||||||||||
|
|
(In millions, except per share amounts)
|
||||||||||||||||||||||||||||||
|
Revenue
|
$
|
375.9
|
|
$
|
360.3
|
|
$
|
339.2
|
|
$
|
316.3
|
|
$
|
305.5
|
|
$
|
286.7
|
|
$
|
266.7
|
|
$
|
247.9
|
|
|||||||
|
Cost of revenue
(1)
|
94.4
|
|
90.2
|
|
89.5
|
|
120.6
|
|
91.7
|
|
91.5
|
|
92.2
|
|
93.5
|
|
|||||||||||||||
|
Gross profit
|
281.5
|
|
270.1
|
|
249.7
|
|
195.7
|
|
213.8
|
|
195.2
|
|
174.5
|
|
154.4
|
|
|||||||||||||||
|
Operating expenses:
(1)(2)
|
|||||||||||||||||||||||||||||||
|
Research and development
|
136.8
|
|
133.2
|
|
119.7
|
|
378.5
|
|
104.0
|
|
97.2
|
|
89.8
|
|
89.3
|
|
|||||||||||||||
|
Sales and marketing
|
100.2
|
|
95.0
|
|
87.4
|
|
157.0
|
|
102.9
|
|
74.7
|
|
69.2
|
|
67.2
|
|
|||||||||||||||
|
General and administrative
|
56.5
|
|
50.8
|
|
49.8
|
|
126.1
|
|
44.2
|
|
39.6
|
|
42.2
|
|
31.3
|
|
|||||||||||||||
|
Total operating expenses
|
293.5
|
|
279.0
|
|
256.9
|
|
661.6
|
|
251.1
|
|
211.5
|
|
201.2
|
|
187.8
|
|
|||||||||||||||
|
Loss from operations
|
$
|
(12.0
|
)
|
$
|
(8.9
|
)
|
$
|
(7.2
|
)
|
$
|
(465.9
|
)
|
$
|
(37.3
|
)
|
$
|
(16.3
|
)
|
$
|
(26.7
|
)
|
$
|
(33.4
|
)
|
|||||||
|
Net loss
|
$
|
(9.5
|
)
|
$
|
(5.8
|
)
|
$
|
(4.1
|
)
|
$
|
(465.5
|
)
|
$
|
(37.7
|
)
|
$
|
(14.1
|
)
|
$
|
(26.8
|
)
|
$
|
(33.1
|
)
|
|||||||
|
Net loss per share attributable to common stockholders, basic and diluted
|
$
|
(0.02
|
)
|
$
|
(0.01
|
)
|
$
|
(0.01
|
)
|
$
|
(2.13
|
)
|
$
|
(0.19
|
)
|
$
|
(0.07
|
)
|
$
|
(0.14
|
)
|
$
|
(0.17
|
)
|
|||||||
|
(1)
|
Includes stock-based compensation as follows:
|
53
|
|
Three months ended
|
||||||||||||||||||||||||||||||
|
|
December 31,
2018 |
September 30,
2018 |
June 30,
2018 |
March 31,
2018 |
December 31,
2017 |
September 30,
2017 |
June 30,
2017 |
March 31,
2017 |
|||||||||||||||||||||||
|
|
(In millions)
|
||||||||||||||||||||||||||||||
|
Cost of revenue
|
$
|
3.1
|
|
$
|
3.2
|
|
$
|
2.9
|
|
$
|
37.8
|
|
$
|
2.9
|
|
$
|
2.9
|
|
$
|
3.3
|
|
$
|
3.1
|
|
|||||||
|
Research and development
|
29.2
|
|
28.2
|
|
27.9
|
|
282.9
|
|
26.7
|
|
22.9
|
|
21.7
|
|
21.8
|
|
|||||||||||||||
|
Sales and marketing
|
5.9
|
|
8.1
|
|
7.9
|
|
72.4
|
|
10.8
|
|
7.5
|
|
7.7
|
|
7.7
|
|
|||||||||||||||
|
General and administrative
|
15.3
|
|
15.5
|
|
16.4
|
|
93.4
|
|
7.0
|
|
6.4
|
|
6.0
|
|
6.2
|
|
|||||||||||||||
|
Total stock-based compensation
(2)(3)
|
$
|
53.5
|
|
$
|
55.0
|
|
$
|
55.1
|
|
$
|
486.5
|
|
$
|
47.4
|
|
$
|
39.7
|
|
$
|
38.7
|
|
$
|
38.8
|
|
|||||||
|
(2)
|
During the three months ended March 31, 2018 we recognized the cumulative unrecognized stock-based compensation of $418.7 million related to our two-tier RSUs upon the effectiveness of our registration statement for our IPO. During the quarter, we also released 26.8 million shares of common stock underlying the vested two-tier RSUs, and as a result recorded $13.9 million in employer related payroll tax expenses associated with these same awards. Refer to "Significant Impacts of Stock-Based Compensation" included elsewhere in this Annual Report on Form 10-K for further information.
|
|
(3)
|
During the year ended December 31, 2017, our Board of Directors voted to approve a modification of vesting schedules for certain unvested one-tier and two-tier RSUs to align the vesting schedules for all RSUs to vest once per quarter. As a result, we recognized an incremental $10.0 million in stock-based compensation during the three months ended March 31, 2018. Refer to "Significant Impacts of Stock-Based Compensation" included elsewhere in this Annual Report on Form 10-K for further information.
|
|
|
Three months ended
|
||||||||||||||||||||||
|
|
December 31,
2018 |
September 30,
2018 |
June 30,
2018 |
March 31,
2018 |
December 31,
2017 |
September 30,
2017 |
June 30,
2017 |
March 31,
2017 |
|||||||||||||||
|
|
(As a % of revenue)
|
||||||||||||||||||||||
|
Revenue
|
100
|
%
|
100
|
%
|
100
|
%
|
100
|
%
|
100
|
%
|
100
|
%
|
100
|
%
|
100
|
%
|
|||||||
|
Cost of revenue
|
25
|
|
25
|
|
26
|
|
38
|
|
30
|
|
32
|
|
35
|
|
38
|
|
|||||||
|
Gross profit
|
75
|
|
75
|
|
74
|
|
62
|
|
70
|
|
68
|
|
65
|
|
62
|
|
|||||||
|
Operating expenses:
|
|||||||||||||||||||||||
|
Research and development
|
36
|
|
37
|
|
35
|
|
120
|
|
34
|
|
34
|
|
34
|
|
36
|
|
|||||||
|
Sales and marketing
|
27
|
|
26
|
|
26
|
|
50
|
|
34
|
|
26
|
|
26
|
|
27
|
|
|||||||
|
General and administrative
|
15
|
|
14
|
|
15
|
|
40
|
|
14
|
|
14
|
|
16
|
|
13
|
|
|||||||
|
Total operating expenses
|
78
|
|
77
|
|
76
|
|
209
|
|
82
|
|
74
|
|
75
|
|
76
|
|
|||||||
|
Loss from operations
|
(3
|
)%
|
(2
|
)%
|
(2
|
)%
|
(147
|
)%
|
(12
|
)%
|
(6
|
)%
|
(10
|
)%
|
(13
|
)%
|
|||||||
|
Net Loss
|
(3
|
)%
|
(2
|
)%
|
(1
|
)%
|
(147
|
)%
|
(12
|
)%
|
(5
|
)%
|
(10
|
)%
|
(13
|
)%
|
|||||||
Quarterly revenue trends
Our revenue increased sequentially in each of the quarters presented primarily due to increases in the number of paying users and increases in ARPU. Seasonality in our revenue is not material.
Quarterly cost of revenue and gross margin trends
Except for the three months ended March 31, 2018, our cost of revenue fluctuated in each of the quarters presented primarily due to the timing of our Infrastructure Optimization efforts, which combined with increases in our revenue caused our gross margins to increase or remain constant. In addition, our cost of revenue increased significantly, in absolute dollars and as a percentage of revenue, during the three months ended March 31, 2018, due to the completion of our initial public offering, as further described in "—Significant Impacts of Stock-Based Compensation".
Quarterly operating expense trends
Except for the three months ended March 31, 2018, our total quarterly operating expenses increased sequentially in the quarters presented primarily due to headcount growth in connection with the expansion of our business and other events that are discussed herein. In addition, our quarterly operating expenses increased significantly, in absolute dollars and as a percentage of revenue, during the three months ended March 31, 2018, due to the completion of our initial public offering, as further described in "—Significant Impacts of Stock-Based Compensation".
Research and development
54
Our research and development expenses increased at a faster rate during the three months ended March 31, 2018, comparatively to other quarters, primarily due to the completion of our initial public offering, as further described in "—Significant Impacts of Stock-Based Compensation".
Sales and marketing
Our sales and marketing expenses fluctuated in the quarters presented primarily due to employee-related expenses and brand advertising campaigns. The timing of brand advertising campaigns can impact the trends in sales and marketing expenses. Our sales and marketing expenses increased at a faster rate during the three months ended March 31, 2018, primarily due to the completion of our initial public offering, as further described in "—Significant Impacts of Stock-Based Compensation".
General and administrative
Our general and administrative expenses fluctuated in the quarters presented, primarily due to increases in employee-related expenses and legal, accounting, and other professional fees. Our general and administrative expenses for the three months ended June 30, 2017 included expense of $9.4 million for a non-cash charitable donation of shares of our common stock as initial funding for the Dropbox Charitable Foundation. Additionally, as a result of our initial public offering, and in the same quarter, we began recognizing stock-based compensation expense related to market-based awards granted to our co-founders in 2017 ("Co-Founder Grants"), as further described in "—Significant Impacts of Stock-Based Compensation".
Liquidity and Capital Resources
As of December 31, 2018, we had cash and cash equivalents of $
519.3
million and short-term investments of $
570.0
million, which were held for working capital purposes. Our cash, cash equivalents, and short-term investments consist primarily of cash, money market funds, corporate notes and obligations, U.S. treasury securities, U.S. agency obligations, commercial paper, and certificates of deposits. As of December 31, 2018, we had $133.8 million of our cash and cash equivalents held by our foreign subsidiaries. We do not expect to incur material taxes in the event we repatriate any of these amounts.
On March 27, 2018, upon the completion of our IPO and concurrent private placement, we received aggregate proceeds of $638.2 million, net of underwriters' discounts and commissions. On March 28, 2018, the underwriters exercised their option to purchase an additional 5,400,000 shares of our Class A common stock. This transaction closed on April 3, 2018, resulting in additional proceeds of $108.4 million, net of underwriters' discounts and commissions. Our net proceeds from the IPO, the concurrent private placement, and underwriters' option totaled $746.6 million, before deducting offering costs of $6.9 million, net of reimbursements.
Since our inception, we have financed our operations primarily through equity issuances, cash generated from our operations, and capital leases to finance infrastructure-related assets in co-location facilities that we directly lease and operate. We enter into capital leases in part to better match the timing of payments for infrastructure-related assets with that of cash received from our paying users. In our business model, some of our registered users convert to paying users over time, and consequently there is a lag between initial investment in infrastructure assets and cash received from some of our users.
Our principal uses of cash in recent periods have been funding our operations, purchases of short-term investments, the satisfaction of tax withholdings in connection with the settlement of restricted stock units, making principal payments on our capital lease obligations, and capital expenditures.
In April 2017, we entered into a $600.0 million credit facility with a syndicate of financial institutions. Pursuant to the terms of the revolving credit facility, we may issue letters of credit under the revolving credit facility, which reduce the total amount available for borrowing under such facility. The revolving credit facility terminates on April 4, 2022. In February 2018, we amended our revolving credit facility to, among other things, permit us to make certain investments, enter into an unsecured standby letter of credit facility, and increase our standby letter of credit sublimit to $187.5 million. We also increased our borrowing capacity under the revolving credit facility from $600.0 million to $725.0 million. We may from time to time request increases in the borrowing capacity under our revolving credit facility of up to $275.0 million, provided no event of default has occurred or is continuing or would result from such increase.
Interest on borrowings under the revolving credit facility accrues at a variable rate tied to the prime rate or the LIBOR rate, at our election. Interest is payable quarterly in arrears. Pursuant to the terms of the revolving credit facility, we are required to pay an annual commitment fee that accrues at a rate of 0.20% per annum on the unused portion of the borrowing commitments under the revolving credit facility. In addition, we are required to pay a fee in connection with letters of credit issued under the revolving credit facility that accrues at a rate of 1.5% per annum on the amount of such letters of credit
55
outstanding. There is an additional fronting fee of 0.125% per annum multiplied by the average aggregate daily maximum amount available under all letters of credit.
The revolving credit facility contains customary conditions to borrowing, events of default, and covenants, including covenants that restrict our ability to incur indebtedness, grant liens, make distributions to our holders or our subsidiaries’ equity interests, make investments, or engage in transactions with our affiliates. In addition, the revolving credit facility contains financial covenants, including a consolidated leverage ratio covenant and a minimum liquidity balance. We were in compliance with all covenants under the revolving credit facility as of December 31, 2018.
As of December 31, 2018, we had no amounts outstanding under the revolving credit facility and an aggregate of $68.5 million in letters of credit outstanding under the revolving credit facility. Our total available borrowing capacity under the revolving credit facility was $656.5 million as of December 31, 2018.
We believe our existing cash and cash equivalents, together with our short-term investments, cash provided by operations and amounts available under the revolving credit facility, will be sufficient to meet our needs for the foreseeable future. Our future capital requirements will depend on many factors including our revenue growth rate, subscription renewal activity, billing frequency, the timing and extent of spending to support further infrastructure development and research and development efforts, the timing and extent of additional capital expenditures to invest in existing and new office spaces, such as our new corporate headquarters, the satisfaction of tax withholding obligations for the release of restricted stock units, the expansion of sales and marketing and international operation activities, the introduction of new product capabilities and enhancement of our platform, and the continuing market acceptance of our platform. We have and may in the future enter into arrangements to acquire or invest in complementary businesses, services, and technologies, including intellectual property rights. We may be required to seek additional equity or debt financing. In the event that additional financing is required from outside sources, we may not be able to raise it on terms acceptable to us or at all. If we are unable to raise additional capital when desired, our business, results of operations, and financial condition would be materially and adversely affected.
Our cash flow activities were as follows for the periods presented:
|
|
Year ended December 31,
|
||||||||||
|
|
2018
|
2017
|
2016
|
||||||||
|
|
(In millions)
|
||||||||||
|
Net cash provided by operating activities
|
$
|
425.4
|
|
$
|
330.3
|
|
$
|
252.6
|
|
||
|
Net cash used in investing activities
|
(633.8
|
)
|
(23.9
|
)
|
(118.0
|
)
|
|||||
|
Net cash provided by (used in) financing activities
|
300.8
|
|
(231.7
|
)
|
(134.5
|
)
|
|||||
|
Effect of exchange rate changes on cash and cash equivalents
|
(3.1
|
)
|
2.6
|
|
(4.3
|
)
|
|||||
|
Net increase (decrease) in cash and cash equivalents
|
$
|
89.3
|
|
$
|
77.3
|
|
$
|
(4.2
|
)
|
||
Operating activities
Our largest source of operating cash is cash collections from our paying users for subscriptions to our platform. Our primary uses of cash from operating activities are for employee-related expenditures, infrastructure-related costs, and marketing expenses. Net cash provided by operating activities is impacted by our net loss adjusted for certain non-cash items, including depreciation and amortization expenses and stock-based compensation, as well as the effect of changes in operating assets and liabilities.
For the year ended December 31, 2018, net cash provided by operating activities was $
425.4
million, which mostly consisted of our net loss of $
484.9
million, adjusted for stock-based compensation expense of $
650.1
million and depreciation and amortization expenses of $
166.8
million, and net cash inflow of $
83.2
million from operating assets and liabilities. The inflow from operating assets and liabilities was primarily due to an increase of $
66.4
million in deferred revenue from increased subscription sales, as a majority of our paying users are invoiced in advance. Additionally, cash provided by operating activities increased due to an increase in other operating assets and liabilities of $
16.8
million. Our net cash provided by operating activities for the year ended December 31, 2018 also included a payment of $13.8 million of employer payroll taxes related to the release of our two-tier RSUs in connection with our IPO, which was paid in the first quarter of 2018.
For the year ended December 31, 2017, net cash provided by operating activities was $330.3 million, which mostly consisted of our net loss of $111.7 million, adjusted for depreciation and amortization expenses of $181.8 million and stock-based compensation expense of $164.6 million, and net cash inflow of $81.3 million from operating assets and liabilities. The
56
inflow from operating assets and liabilities was primarily due to an increase of $64.3 million in deferred revenue from increased subscription sales, as a majority of our paying users are invoiced in advance. The increase in net cash provided by operating activities during the year ended December 31, 2017, compared to the year ended December 31, 2016, was primarily due to a reduction of our net loss, as adjusted for stock-based compensation and depreciation and amortization expenses, as well as cash inflow from changes in operating assets and liabilities.
For the year ended December 31, 2016, net cash provided by operating activities was $252.6 million, which primarily consisted of our net loss of $210.2 million, adjusted for depreciation and amortization expenses of $191.6 million and stock-based compensation expense of $147.6 million, as well as a net cash inflow of $118.8 million from operating assets and liabilities. The inflow from operating assets and liabilities was primarily due to an increase of $87.6 million in deferred revenue from increased subscription sales, as a majority of our paying users are invoiced in advance, and an increase of $35.6 million in accrued compensation and benefits due to the introduction of our annual bonus plan.
Investing activities
Net cash used in investing activities is primarily impacted by purchases of short-term investments, purchases of property and equipment to make improvements to existing and new office spaces, and for purchasing infrastructure equipment in co-location facilities that we directly lease and operate.
For the year ended December 31, 2018, net cash used in investing activities was $
633.8
million, which primarily related to purchases of short-term investments of $
850.4
million and capital expenditures of $
63.0
million related to our office and datacenter build-outs. These outflows were partially offset by inflows of $
283.6
million related to proceeds from maturities and sales of short-term investments.
For the year ended December 31, 2017, net cash used in investing activities was $23.9 million, which mostly consisted of capital expenditures related to our infrastructure equipment and office build-outs. The decrease in cash used in investing activities during the year ended December 31, 2017, compared to the year ended December 31, 2016, was primarily due to decreases in capital expenditures for infrastructure equipment and leasehold improvements related to our current corporate headquarters.
For the year ended December 31, 2016, net cash used in investing activities was $118.0 million, which mostly consisted of capital expenditures related to our infrastructure and office build-outs.
Financing activities
Net cash provided by (used in) financing activities is primarily impacted by the completion of our IPO, repurchases of common stock to satisfy the tax withholding obligation for the release of RSUs and capital lease obligations for our infrastructure equipment. In 2017, we began releasing shares of common stock underlying vested one-tier RSUs, which generally have a service-based vesting condition over a four-year period and resulted in cash outflows to satisfy the employee tax withholding obligation for those employees who elected to net share settle their awards. See “—Significant Impacts of Stock-Based Compensation” for additional information.
For the year ended December 31, 2018, net cash provided by financing activities was $
300.8
million, which primarily consisted of $746.6 million in net proceeds from the completion of our IPO and concurrent private placement. The proceeds were offset by $
351.9
million for the satisfaction of tax withholding obligations for the release of restricted stock units and $
109.1
million in principal payments against capital lease obligations.
For the year ended December 31, 2017, net cash used in financing activities was $231.7 million, which primarily consisted of $133.0 million in principal payments against capital lease obligations and $87.9 million for the satisfaction of tax withholding obligations for the release of restricted stock units. The increase in cash used by financing activities during the year ended December 31, 2017, compared to the year ended December 31, 2016, was primarily due to the increase of $87.9 million related to the satisfaction of tax withholding obligations for the release of restricted stock units.
For the year ended December 31, 2016, net cash used in financing activities was $134.5 million, which primarily consisted of $137.9 million in principal payments against capital lease obligations and $3.8 million in principal payments against a note payable issued in 2015, offset by $8.8 million in proceeds received for a sale-leaseback agreement.
Contractual Obligations
57
Our principal commitments consist of obligations under operating leases for office space and datacenter operations, and capital leases for datacenter equipment. The following table summarizes our commitments to settle contractual obligations in cash as of December 31,
2018
, for the periods presented below:
|
Total
|
Less than
1 year
|
1 - 3 years
|
3 - 5 years
|
More than
5 years
|
|||||||||||||||
|
|
(In millions)
|
||||||||||||||||||
|
Operating lease commitments
(1)
|
$
|
1,122.2
|
|
$
|
96.4
|
|
$
|
205.2
|
|
$
|
169.0
|
|
$
|
651.6
|
|
||||
|
Capital lease commitments
(2)
|
176.0
|
|
82.4
|
|
75.6
|
|
18.0
|
|
—
|
|
|||||||||
|
Other commitments
(3)
|
96.7
|
|
57.0
|
|
39.4
|
|
0.3
|
|
—
|
|
|||||||||
|
Total contractual obligations
|
$
|
1,394.9
|
|
$
|
235.8
|
|
$
|
320.2
|
|
$
|
187.3
|
|
$
|
651.6
|
|
||||
|
(1)
|
Consists of future non-cancelable minimum rental payments under operating leases for our offices and datacenters, excluding rent payments from our sub-tenants and variable operating expenses. As of December 31,
2018
, we are entitled to non-cancelable rent payments from our sub-tenants of $43.5 million, which will be collected over the next 5 years.
|
|
(2)
|
Consists of future non-cancelable minimum rental payments under capital leases primarily for our infrastructure.
|
|
(3)
|
Consists of commitments to third-party vendors for services related to our infrastructure, infrastructure warranty contracts, asset retirement obligations for office modifications, and a note payable related to financing of our infrastructure.
|
In addition to the contractual obligations set forth above, as of December 31,
2018
, we had an aggregate of $68.5 million in letters of credit outstanding under our revolving credit facility.
In May 2018, we amended our lease for our current corporate headquarters, modifying the original lease termination date from 2027 to 2019. As a result of the amendment, we expect to vacate our current corporate headquarters in August 2019, but are obligated to pay rent through February 2020. Accordingly, our future operating lease commitments were reduced by $192.4 million. The lease amendment did not have a material impact to our consolidated statement of operations in the year ended December 31, 2018, nor do we expect it to be material through our lease termination date in 2019. See Note 10, "Commitments and Contingencies" to our consolidated financial statements included elsewhere in this Annual Report on Form 10-K for further information.
In 2017, we entered into a new lease agreement for office space in San Francisco, California, to serve as our new corporate headquarters. We took initial possession of our new corporate headquarters in June 2018 and began to recognize rent expense in the same period.
Off-Balance Sheet Arrangements
As of December 31,
2018
, we did not have any relationships with unconsolidated entities or financial partnerships, such as entities often referred to as structured finance or variable interest entities, which would have been established for the purpose of facilitating off balance sheet arrangements or other contractually narrow or limited purposes.
Significant Impacts of Stock-Based Compensation
Restricted Stock Units
We have granted restricted stock units, or RSUs, to our employees and members of our Board of Directors under our 2008 Equity Incentive Plan, or 2008 Plan, our 2017 Equity Incentive Plan, or 2017 Plan and our 2018 Equity Incentive Plan, or 2018 Plan. We have two types of RSUs outstanding as of December 31, 2018:
|
•
|
One-tier RSUs, which have a service-based vesting condition over a four-year period. These awards typically have a cliff vesting period of one year and continue to vest quarterly thereafter. We recognize compensation expense associated with one-tier RSUs ratably on a straight-line basis over the requisite service period.
|
|
•
|
Two-tier RSUs, which have both a service-based vesting condition and a liquidity event-related performance vesting condition. These awards typically have a service-based vesting period of four years with a cliff vesting period of one year and continue to vest monthly thereafter. Upon satisfaction of the Performance Vesting
|
58
Condition, these awards vest quarterly. The Performance Vesting Condition was satisfied upon the effectiveness of the registration statement related to our IPO. Our last grant date for two-tier RSUs was May 2015. We recognize compensation expense associated with two-tier RSUs using the accelerated attribution method over the requisite service period.
Upon the effectiveness of the registration statement related to our IPO, we recognized stock-based compensation related to our two-tier RSUs using the accelerated attribution method, with a cumulative catch-up in the amount of $418.7 million attributable to service provided prior to such effective date. As of December 31, 2018, the unamortized stock-based compensation related to our two-tier RSUs was $0.1 million, which will be recognized if the requisite service is provided over a remaining weighted average period of 0.2 years.
Co-Founder Grants
In December 2017, the Board of Directors approved a grant to our co-founders of restricted stock awards, or RSAs, with respect to 14.7 million shares of Class A Common Stock in the aggregate, or collectively, the Co-Founder Grants, of which 10.3 million RSAs were granted to Mr. Houston, the Company’s co-founder and Chief Executive Officer, and 4.4 million RSAs were granted to Mr. Ferdowsi, the Company’s co-founder and Director. These Co-Founder Grants have service-based, market-based, and performance-based vesting conditions. While the Co-Founder Grants have certain stockholder rights prior to their vesting, such as the right to vote the shares with the other holders of our Class A common stock, the Co-Founder Grants will be excluded from Class A common stock issued and outstanding until the satisfaction of these vesting conditions.
The Co-Founder Grants are eligible to vest over the ten-year period following the date the Company’s shares of Class A common stock began trading on the Nasdaq Global Select Market in connection with our IPO, which occurred on March 23, 2018. The Co-Founder Grants comprise nine tranches that are eligible to vest based on the achievement of stock price goals (each, a "Stock Price Target"), measured over a consecutive thirty-day trading period during the Performance Period, which will begin on January 1, 2019, as follows:
|
Company Stock Price
Target
|
Shares Eligible to Vest for
Mr. Houston
|
Shares Eligible to Vest
for Mr. Ferdowsi
|
||
|
$30.00
|
2,066,667
|
880,000
|
||
|
$37.50
|
1,033,334
|
440,000
|
||
|
$45.00
|
1,033,334
|
440,000
|
||
|
$52.50
|
1,033,333
|
440,000
|
||
|
$60.00
|
1,033,333
|
440,000
|
||
|
$67.50
|
1,033,333
|
440,000
|
||
|
$75.00
|
1,033,333
|
440,000
|
||
|
$82.50
|
1,033,333
|
440,000
|
||
|
$90.00
|
1,033,333
|
440,000
|
||
During the first four years of the Performance Period, no more than 20% of the shares subject to each Co-Founder Grant would be eligible to vest in any calendar year. After the first four years, all shares are eligible to vest based on the achievement of the Company Stock Price Targets. The Co-Founder Grants contain an implied performance-based vesting condition that was satisfied on the date of our IPO.
We estimated the grant date fair value of the Co-Founder Grants using a model based on multiple stock price paths developed through the use of a Monte Carlo simulation that incorporates into the valuation the possibility that the Stock Price Targets may not be satisfied. The average grant date fair value of each Co-Founder Grant was estimated to be $10.60 per share, and we will recognize total stock-based compensation expense of $156.2 million over the requisite service period of each tranche, which ranged from 2.9 to 6.9 years, using the accelerated attribution method. If the Stock Price Targets are met sooner than the derived service period, we will adjust our stock-based compensation to reflect the cumulative expense associated with the vested awards. We will recognize stock-based compensation expense if the requisite service period is provided, regardless of whether the market conditions are achieved.
The performance vesting condition for the Co-Founder Grants was satisfied on the date that our shares of Class A common stock began trading on the Nasdaq Global Select Market in connection with our IPO. We recognized the cumulative
59
unrecognized expense of our Co-Founder Grants of $10.6 million in the first quarter of 2018, using the accelerated attribution method, which increased our general and administrative expenses.
Award Modifications
During the year ended the year ended December 31, 2017, our Board of Directors voted to approve a modification of vesting schedules for certain unvested one-tier and two-tier RSUs to align the vesting schedules for all RSUs to vest once per quarter. The modification was effective February 15, 2018, which resulted in accelerated vesting of impacted RSUs that had met their service requirement as of that date. As a result, we recognized an incremental $10.0 million in stock-based compensation during the first quarter of 2018, which is included in the results for the year ended December 31, 2018, related to these modified RSUs. We do not expect to record incremental stock-based compensation related to this modification in future periods.
See Note 1, “Description of the Business and Summary of Significant Accounting Policies” and Note 11, “Stockholders’ Equity” to our consolidated financial statements included elsewhere in this Annual Report on Form 10-K for more information regarding our equity awards.
60
Critical Accounting Policies and Judgments
Our consolidated financial statements and the related notes thereto included elsewhere in this Annual Report on Form 10-K are prepared in accordance with generally accepted accounting principles, or GAAP, in the United States. The preparation of consolidated financial statements also requires us to make estimates and assumptions that affect the reported amounts of assets, liabilities, revenue, costs and expenses, and related disclosures. We base our estimates on historical experience and on various other assumptions that we believe to be reasonable under the circumstances. Actual results could differ significantly from the estimates made by management. To the extent that there are differences between our estimates and actual results, our future financial statement presentation, financial condition, results of operations, and cash flows will be affected.
We believe that the accounting policies described below involve a greater degree of judgment and complexity. Accordingly, these are the policies we believe are the most critical to aid in fully understanding and evaluating our consolidated financial condition and results of operations.
Revenue recognition
We generate revenue from sales of subscriptions to our platform. Subscription fees exclude sales and other indirect taxes. We determine revenue recognition through the following steps:
|
•
|
Identification of the contract, or contracts, with a customer
|
|
•
|
Identification of the performance obligations in the contract
|
|
•
|
Determination of the transaction price
|
|
•
|
Allocation of the transaction price to the performance obligations in the contract
|
|
•
|
Recognition of revenue when, or as, we satisfy a performance obligation
|
Our subscription agreements typically have monthly or annual contractual terms, and a small percentage have multi-year contractual terms. Revenue is recognized ratably over the related contractual term generally beginning on the date that our platform is made available to a customer. Our agreements are generally non-cancelable. We typically bill in advance for monthly contracts and annually in advance for contracts with terms of one year or longer.
Deferred commissions
Certain sales commissions and the related payroll taxes earned by our outbound sales team, as well as commissions earned by third-party resellers, are considered to be incremental and recoverable costs of obtaining a contract with a customer. These costs are deferred and then amortized over a period of benefit that we have determined to be five years. We determined the period of benefit by taking into consideration our historical customer attrition rates, the useful life of our technology, and the impact of competition in our industry.
Common stock valuations
Since August 2015, we have granted RSUs as the only stock-based payment awards to our employees, excluding the Co-Founder Grants. While we stopped granting stock options in August 2015, we currently have stock options outstanding that will continue to vest through 2019 if the requisite service is provided.
The fair values of the common stock underlying the RSUs prior to the date of our IPO were determined by our Board of Directors, with input from management and contemporaneous third-party valuations, which were performed at least quarterly. If RSUs were granted a short period of time prior to the date of a valuation report, we retrospectively assessed the fair value used for financial reporting purposes after considering the fair value reflected in the subsequent valuation report and other facts and circumstances on the date of grant as discussed below.
Given the absence of a public trading market for our common stock prior to our IPO, and in accordance with the American Institute of Certified Public Accountants Practice Guide,
Valuation of Privately-Held-Company Equity Securities
Issued as Compensation,
or AICPA Guide, our Board of Directors exercised reasonable judgment and considered numerous objective and subjective factors to determine the best estimate of the fair value of our common stock including:
|
•
|
The results of contemporaneous valuations of our common stock by unrelated third parties;
|
|
•
|
The rights, preferences, and privileges of our convertible preferred stock relative to those of our common stock;
|
61
|
•
|
Market multiples of comparable public companies in our industry as indicated by their market capitalization and guideline merger and acquisition transactions;
|
|
•
|
Our performance and market position relative to our competitors, who may change from time to time;
|
|
•
|
Our historical financial results and estimated trends and prospects for our future performance;
|
|
•
|
Valuations published by institutional investors that hold investments in our capital stock;
|
|
•
|
The economic and competitive environment;
|
|
•
|
The likelihood and timeline of achieving a liquidity event, such as an initial public offering or sale, given prevailing market conditions;
|
|
•
|
Any adjustments necessary to recognize a lack of marketability for our common stock; and
|
|
•
|
Precedent sales of or offers to purchase our capital stock.
|
In valuing our common stock, our Board of Directors determined the fair value of our common stock using both the income and market approach valuation methods. The income approach estimates value based on the expectation of future cash flows that a company will generate. These future cash flows are discounted to their present values using a discount rate based on our weighted average cost of capital, and is adjusted to reflect the risks inherent in our cash flows. The market approach estimates value based on a comparison of the subject company to comparable public companies in a similar line of business. From the comparable companies, a representative market value multiple is determined and then applied to the subject company’s financial forecasts to estimate the value of the subject company.
For valuations prior to August 31, 2017, the equity valuation was based on both the income and the market approach valuation methods, in addition to giving consideration to recent secondary sales of our common stock. The Option Pricing Method was selected as the principal equity allocation method. These methods were consistent with prior valuations.
For valuations as of and subsequent to August 31, 2017, we have used a hybrid method to determine the fair value of our common stock, in addition to giving consideration to recent secondary sales of our common stock. Under the hybrid method, multiple valuation approaches were used and then combined into a single probability weighted valuation. Our approach included the use of initial public offering scenarios, a scenario assuming continued operation as a private entity, and a scenario assuming an acquisition of the company.
Application of these approaches involves the use of estimates, judgment, and assumptions that are highly complex and subjective, such as those regarding our expected future revenue, expenses, and cash flows, discount rates, market multiples, the selection of comparable companies, and the probability of future events. Changes in any or all of these estimates and assumptions, or the relationships between those assumptions, impact our valuations as of each valuation date and may have a material impact on the valuation of common stock.
For valuations after our initial public offering, our Board of Directors determines the fair value of each share of underlying common stock based on the closing price of our Class A common stock as reported on the date of the grant.
Fair value of market condition awards
The Co-Founder Grants contain market-based vesting conditions. The market-based vesting condition is considered when calculating the grant date fair value of these awards, which requires the use of various estimates and assumptions. The grant date fair value of the Co-Founder Grants was estimated using a model based on multiple stock price paths developed through the use of a Monte Carlo simulation that incorporates into the valuation the possibility that the market condition may not be satisfied. A Monte Carlo simulation requires the use of various assumptions, including our underlying stock price, volatility, and the risk-free interest rate as of the valuation date, corresponding to the length of time remaining in the performance period, and expected dividend yield. A Monte Carlo simulation also calculates a derived service period for each of the nine vesting tranches, which is the measure of the expected time to achieve the market conditions. Expense associated with market-based awards is recognized over the requisite service period of each tranche using the accelerated attribution method, regardless of whether the market conditions are achieved.
62
Recent Accounting Pronouncements
See Note 1, “Description of the Business and Summary of Significant Accounting Policies” to our consolidated financial statements included elsewhere in this Annual Report on Form 10-K for recently adopted accounting pronouncements and recently issued accounting pronouncements not yet adopted as of the date of this Annual Report on Form 10-K.
ITEM 7A. QUANTITATIVE AND QUALITATIVE DISCLOSURES ABOUT MARKET RISK
Interest rate risk
We had cash and cash equivalents of $
519.3
million and short-term investments of $
570.0
million as of December 31,
2018
. We hold our cash and cash equivalents and short-term investments for working capital purposes. Our cash, cash equivalents, and short-term investments consist primarily of cash, money market funds, corporate notes and obligations, U.S. treasury securities, U.S. agency obligations, commercial paper, and certificates of deposits. The primary objectives of our investment activities are the preservation of capital, the fulfillment of liquidity needs, and the control of cash and investments. We do not enter into investments for trading or speculative purposes. Due to the short-term nature of these instruments, we believe that we do not have any material exposure to changes in the fair value of our investment portfolio as a result of changes in interest rates. Decreases in interest rates, however, would reduce future interest income.
Any borrowings under the revolving credit facility bear interest at a variable rate tied to the prime rate or the LIBOR rate. As of December 31,
2018
, we had no amounts outstanding under the revolving credit facility. We do not have any other long-term debt or financial liabilities with floating interest rates that would subject us to interest rate fluctuations.
As of December 31,
2018
, a hypothetical change in interest rates by 100 basis points would not have a significant impact on our cash and cash equivalents or the fair value of our investment portfolio.
Foreign currency exchange risk
Our results of operations and cash flows are subject to fluctuations due to changes in foreign currency exchange rates relative to U.S. dollars, our reporting currency.
All of our domestic revenue and a certain portion of our international revenue is generated in U.S. dollars, with the remainder generated in euros, British pounds sterling, Australian dollars, Canadian dollars, and Japanese yen. The functional currency of Dropbox International Unlimited, our international headquarters and largest international entity, is the U.S. dollar.
Our expenses are generally denominated in the currencies in which our operations are located, which are primarily the United States and, to a lesser extent, Europe and Asia. Our results of operations and cash flows are, therefore, subject to fluctuations due to changes in foreign currency exchange rates in ways that are unrelated to our operating performance.
As exchange rates may fluctuate significantly between periods, revenue and operating expenses, when converted into U.S. dollars, may also experience significant fluctuations between periods. Historically, a majority of our revenue and operating expenses have been denominated in U.S. dollars, euros, and British pounds sterling. Although we are impacted by the exchange rate movements from a number of currencies relative to the U.S. dollar, our results of operations are particularly impacted by fluctuations in the U.S. dollar-euro and U.S. dollar-British pounds sterling exchange rates. In the year ended December 31, 2018, 30% of our sales were denominated in currencies other than U.S. dollars. Our expenses, by contrast, are primarily denominated in U.S. dollars. As a result, any increase in the value of the U.S. dollar against these foreign currencies could cause our revenue to decline relative to our costs, thereby decreasing our margins.
We recorded $1.9 million and $3.6 million in net foreign currency transaction losses in the years ended December 31,
2018
and
2016
, respectively, and $5.0 million in net foreign currency transaction gains in the year ended December 31,
2017
. A hypothetical 10% change in foreign currency rates would not have resulted in material gains or losses for the years ended December 31,
2018
,
2017
and
2016
.
To date, we have not engaged in any hedging activities. As our international operations grow, we will continue to reassess our approach to managing risks relating to fluctuations in currency rates.
Inflation risk
We do not believe that inflation has had a material effect on our business, results of operations, or financial condition. Nonetheless, if our costs were to become subject to significant inflationary pressures, we may not be able to fully offset such higher costs. Our inability or failure to do so could harm our business, results of operations, or financial condition.
63
ITEM 8. FINANCIAL STATEMENTS AND SUPPLEMENTARY DATA
DROPBOX, INC.
INDEX TO CONSOLIDATED FINANCIAL STATEMENTS
|
|
Page
|
The supplementary financial information required by this Item 8 is included in Item 7 under the caption "Quarterly Results of Operations."
64
REPORT OF INDEPENDENT REGISTERED PUBLIC ACCOUNTING FIRM
To the Stockholders and the Board of Directors of Dropbox, Inc.
Opinion on the Financial Statements
We have audited the accompanying consolidated balance sheets of Dropbox, Inc. (the Company) as of December 31, 2018 and 2017, the related consolidated statements of operations, comprehensive loss, stockholders' equity and cash flows for each of the three years in the period ended December 31, 2018, and the related notes (collectively referred to as the “consolidated financial statements”). In our opinion, the consolidated financial statements present fairly, in all material respects, the financial position of the Company at December 31, 2018 and 2017, and the results of its operations and its cash flows for each of the three years in the period ended December 31, 2018, in conformity with U.S. generally accepted accounting principles.
Basis for Opinion
These financial statements are the responsibility of the Company's management. Our responsibility is to express an opinion on the Company’s financial statements based on our audits. We are a public accounting firm registered with the Public Company Accounting Oversight Board (United States) (PCAOB) and are required to be independent with respect to the Company in accordance with the U.S. federal securities laws and the applicable rules and regulations of the Securities and Exchange Commission and the PCAOB.
We conducted our audits in accordance with the standards of the PCAOB. Those standards require that we plan and perform the audit to obtain reasonable assurance about whether the financial statements are free of material misstatement, whether due to error or fraud. The Company is not required to have, nor were we engaged to perform, an audit of its internal control over financial reporting. As part of our audits we are required to obtain an understanding of internal control over financial reporting but not for the purpose of expressing an opinion on the effectiveness of the Company's internal control over financial reporting. Accordingly, we express no such opinion.
Our audits included performing procedures to assess the risks of material misstatement of the financial statements, whether due to error or fraud, and performing procedures that respond to those risks. Such procedures included examining, on a test basis, evidence regarding the amounts and disclosures in the financial statements. Our audits also included evaluating the accounting principles used and significant estimates made by management, as well as evaluating the overall presentation of the financial statements. We believe that our audits provide a reasonable basis for our opinion.
|
/s/ Ernst & Young LLP
|
|
We have served as the Company’s auditor since 2013.
|
|
San Francisco, California
|
|
February 22, 2019
|
65
DROPBOX, INC.
CONSOLIDATED BALANCE SHEETS
(In millions, except for par value)
|
|
As of December 31,
|
||||||
|
|
2018
|
2017
|
|||||
|
Assets
|
|||||||
|
Current assets:
|
|||||||
|
Cash and cash equivalents
|
$
|
519.3
|
|
$
|
430.0
|
|
|
|
Short-term investments
|
570.0
|
|
—
|
|
|||
|
Trade and other receivables, net
|
28.6
|
|
29.3
|
|
|||
|
Prepaid expenses and other current assets
|
92.3
|
|
58.8
|
|
|||
|
Total current assets
|
1,210.2
|
|
518.1
|
|
|||
|
Property and equipment, net
|
310.6
|
|
341.9
|
|
|||
|
Intangible assets, net
|
14.7
|
|
17.0
|
|
|||
|
Goodwill
|
96.5
|
|
98.9
|
|
|||
|
Other assets
|
62.1
|
|
44.0
|
|
|||
|
Total assets
|
$
|
1,694.1
|
|
$
|
1,019.9
|
|
|
|
Liabilities and stockholders’ equity
|
|||||||
|
Current liabilities:
|
|||||||
|
Accounts payable
|
$
|
33.3
|
|
$
|
31.9
|
|
|
|
Accrued and other current liabilities
|
164.5
|
|
129.8
|
|
|||
|
Accrued compensation and benefits
|
80.9
|
|
56.1
|
|
|||
|
Capital lease obligation
(1)
|
73.8
|
|
102.7
|
|
|||
|
Deferred revenue
|
485.0
|
|
417.9
|
|
|||
|
Total current liabilities
|
837.5
|
|
738.4
|
|
|||
|
Capital lease obligation, non-current
(1)
|
89.9
|
|
71.6
|
|
|||
|
Deferred rent, non-current
|
81.0
|
|
69.8
|
|
|||
|
Other non-current liabilities
|
8.9
|
|
37.2
|
|
|||
|
Total liabilities
|
1,017.3
|
|
917.0
|
|
|||
|
Commitments and contingencies (Note 10)
|
|
|
|||||
|
Stockholders’ equity:
|
|||||||
|
Convertible preferred stock, $0.00001 par value; no shares authorized, issued and outstanding as of December 31, 2018; 151.2 shares authorized, 147.6 shares issued and outstanding with liquidation preference of $624.7 as of December 31, 2017
|
—
|
|
615.3
|
|
|||
|
Preferred stock, $0.00001 par value; 240.0 shares authorized and no shares issued and outstanding as of December 31, 2018; no shares authorized, issued and outstanding as of December 31, 2017
|
—
|
|
—
|
|
|||
|
Common stock, $0.00001 par value; Class A common stock - 2,400.0 shares authorized and 211.0 shares issued and outstanding as of December 31, 2018; 533.3 shares authorized and 8.9 shares issued and outstanding as of December 31, 2017; Class B common stock - 475.0 shares authorized and 198.6 shares issued and outstanding as of December 31, 2018; 466.7 shares authorized and 187.9 issued and outstanding as of December 31, 2017; Class C common stock - 800.0 shares authorized and no shares issued and outstanding as of December 31, 2018; no shares authorized, issued and outstanding as of December 31, 2017
|
—
|
|
—
|
|
|||
|
Additional paid-in capital
|
2,337.5
|
|
533.1
|
|
|||
|
Accumulated deficit
|
(1,659.5
|
)
|
(1,049.7
|
)
|
|||
|
Accumulated other comprehensive income (loss)
|
(1.2
|
)
|
4.2
|
|
|||
|
Total stockholders’ equity
|
676.8
|
|
102.9
|
|
|||
|
Total liabilities and stockholders’ equity
|
$
|
1,694.1
|
|
$
|
1,019.9
|
|
|
|
(1)
|
Includes amounts attributable to related party transactions. See Note 14, "Related Party Transactions" for further details.
|
See accompanying Notes to Consolidated Financial Statements.
66
DROPBOX, INC.
CONSOLIDATED STATEMENTS OF OPERATIONS
(In millions, except per share data)
|
|
Year ended December 31,
|
||||||||||
|
|
2018
|
|
2017
|
2016
|
|||||||
|
Revenue
|
$
|
1,391.7
|
|
$
|
1,106.8
|
|
$
|
844.8
|
|
||
|
Cost of revenue
(1)
|
394.7
|
|
368.9
|
|
390.6
|
|
|||||
|
Gross profit
|
997.0
|
|
737.9
|
|
454.2
|
|
|||||
|
Operating expenses
(1)(2)
:
|
|||||||||||
|
Research and development
|
768.2
|
|
380.3
|
|
289.7
|
|
|||||
|
Sales and marketing
|
439.6
|
|
314.0
|
|
250.6
|
|
|||||
|
General and administrative
(3)
|
283.2
|
|
157.3
|
|
107.4
|
|
|||||
|
Total operating expenses
|
1,491.0
|
|
851.6
|
|
647.7
|
|
|||||
|
Loss from operations
|
(494.0
|
)
|
(113.7
|
)
|
(193.5
|
)
|
|||||
|
Interest income (expense), net
|
7.1
|
|
(11.0
|
)
|
(16.4
|
)
|
|||||
|
Other income, net
|
6.8
|
|
13.2
|
|
4.9
|
|
|||||
|
Loss before income taxes
|
(480.1
|
)
|
(111.5
|
)
|
(205.0
|
)
|
|||||
|
Provision for income taxes
|
(4.8
|
)
|
(0.2
|
)
|
(5.2
|
)
|
|||||
|
Net loss
|
$
|
(484.9
|
)
|
$
|
(111.7
|
)
|
$
|
(210.2
|
)
|
||
|
Net loss per share attributable to common stockholders, basic and diluted
|
$
|
(1.35
|
)
|
$
|
(0.57
|
)
|
$
|
(1.11
|
)
|
||
|
Weighted-average shares used in computing net loss per share attributable to common stockholders, basic and diluted
|
358.6
|
|
195.9
|
|
189.1
|
|
|||||
|
(1)
|
Includes stock-based compensation as follows (in millions):
|
|
|
Year ended December 31,
|
||||||||||
|
|
2018
|
2017
|
2016
|
||||||||
|
Cost of revenue
|
$
|
47.0
|
|
$
|
12.2
|
|
$
|
8.2
|
|
||
|
Research and development
|
368.2
|
|
93.1
|
|
72.7
|
|
|||||
|
Sales and marketing
|
94.3
|
|
33.7
|
|
44.6
|
|
|||||
|
General and administrative
|
140.6
|
|
25.6
|
|
22.1
|
|
|||||
|
(2)
|
During the year ended December 31, 2018, the Company recognized the cumulative unrecognized stock-based compensation of
$418.7 million
related to the two-tier restricted stock units upon the effectiveness of the Company's registration statement for its initial public offering. See Note 1, "Description of the Business and Summary of Significant Accounting Policies
"
for further details.
|
|
(3)
|
During the year ended the year ended December 31, 2017, general and administrative expense includes
$9.4 million
for a non-cash charitable contribution and
$1.9 million
of cash contributions to the Dropbox Charitable Foundation, a related party. See Note 14, "Related Party Transactions" for further details.
|
See accompanying Notes to Consolidated Financial Statements.
67
DROPBOX, INC.
CONSOLIDATED STATEMENTS OF COMPREHENSIVE LOSS
(In millions)
|
|
Year ended December 31,
|
||||||||||
|
|
2018
|
|
2017
|
|
2016
|
||||||
|
Net loss
|
$
|
(484.9
|
)
|
$
|
(111.7
|
)
|
$
|
(210.2
|
)
|
||
|
Other comprehensive income (loss), net of tax:
|
|||||||||||
|
Change in foreign currency translation adjustments
|
(4.9
|
)
|
5.2
|
|
(1.3
|
)
|
|||||
|
Change in net unrealized losses on short-term investments
|
(0.5
|
)
|
—
|
|
—
|
|
|||||
|
Total other comprehensive income (loss), net of tax
|
$
|
(5.4
|
)
|
$
|
5.2
|
|
$
|
(1.3
|
)
|
||
|
Comprehensive loss
|
$
|
(490.3
|
)
|
|
$
|
(106.5
|
)
|
$
|
(211.5
|
)
|
|
See accompanying Notes to Consolidated Financial Statements.
68
DROPBOX, INC.
CONSOLIDATED STATEMENTS OF STOCKHOLDERS’ EQUITY
(In millions)
|
|
Convertible
preferred stock
|
Class A and Class B common stock
|
Additional
paid-in
capital
|
Accumulated
deficit
|
Accumulated
other
comprehensive
income (loss)
|
Total
stockholders’
equity
|
|||||||||||||||||||||||
|
|
Shares
|
Amount
|
Shares
|
Amount
|
|||||||||||||||||||||||||
|
Balance at December 31, 2015
|
147.6
|
|
$
|
615.3
|
|
187.3
|
|
—
|
|
$
|
297.3
|
|
$
|
(727.3
|
)
|
$
|
0.3
|
|
$
|
185.6
|
|
||||||||
|
Vesting of early exercised stock options
|
—
|
|
—
|
|
—
|
|
—
|
|
0.5
|
|
—
|
|
—
|
|
0.5
|
|
|||||||||||||
|
Issuance of common stock, options and awards related to acquisitions
|
—
|
|
—
|
|
0.1
|
|
—
|
|
0.7
|
|
—
|
|
—
|
|
0.7
|
|
|||||||||||||
|
Repurchase of unvested common stock (related to early exercised stock options)
|
—
|
|
—
|
|
(0.3
|
)
|
—
|
|
(0.1
|
)
|
—
|
|
—
|
|
(0.1
|
)
|
|||||||||||||
|
Stock-based compensation
|
—
|
|
—
|
|
—
|
|
—
|
|
147.6
|
|
—
|
|
—
|
|
147.6
|
|
|||||||||||||
|
Other comprehensive loss
|
—
|
|
—
|
|
—
|
|
—
|
|
—
|
|
—
|
|
(1.3
|
)
|
(1.3
|
)
|
|||||||||||||
|
Net loss
|
—
|
|
—
|
|
—
|
|
—
|
|
—
|
|
(210.2
|
)
|
—
|
|
(210.2
|
)
|
|||||||||||||
|
Balance at December 31, 2016
|
147.6
|
|
615.3
|
|
187.1
|
|
—
|
|
446.0
|
|
(937.5
|
)
|
(1.0
|
)
|
122.8
|
|
|||||||||||||
|
Cumulative-effect adjustment from adoption of ASU 2016-09
|
—
|
|
—
|
|
—
|
|
—
|
|
0.5
|
|
(0.5
|
)
|
—
|
|
—
|
|
|||||||||||||
|
Release of restricted stock units
|
—
|
|
—
|
|
14.6
|
|
—
|
|
—
|
|
—
|
|
—
|
|
—
|
|
|||||||||||||
|
Shares repurchased for tax withholdings on release of restricted stock
|
—
|
|
—
|
|
(5.5
|
)
|
—
|
|
(87.9
|
)
|
—
|
|
—
|
|
(87.9
|
)
|
|||||||||||||
|
Donation of common stock to charitable foundation
|
—
|
|
—
|
|
0.6
|
|
—
|
|
9.4
|
|
—
|
|
—
|
|
9.4
|
|
|||||||||||||
|
Exercise of stock options and awards
|
—
|
|
—
|
|
0.2
|
|
—
|
|
0.5
|
|
—
|
|
—
|
|
0.5
|
|
|||||||||||||
|
Repurchase of unvested common stock (related to early exercised stock options)
|
—
|
|
—
|
|
(0.2
|
)
|
—
|
|
—
|
|
—
|
|
—
|
|
—
|
|
|||||||||||||
|
Stock-based compensation
|
—
|
|
—
|
|
—
|
|
—
|
|
164.6
|
|
—
|
|
—
|
|
164.6
|
|
|||||||||||||
|
Other comprehensive income
|
—
|
|
—
|
|
—
|
|
—
|
|
—
|
|
—
|
|
5.2
|
|
5.2
|
|
|||||||||||||
|
Net loss
|
—
|
|
—
|
|
—
|
|
—
|
|
—
|
|
(111.7
|
)
|
—
|
|
(111.7
|
)
|
|||||||||||||
|
Balance at December 31, 2017
|
147.6
|
|
615.3
|
|
196.8
|
|
$
|
—
|
|
533.1
|
|
(1,049.7
|
)
|
4.2
|
|
102.9
|
|
||||||||||||
|
Release of restricted stock units
|
—
|
|
—
|
|
40.4
|
|
—
|
|
—
|
|
—
|
|
—
|
|
—
|
|
|||||||||||||
|
Shares repurchased for tax withholdings on release of restricted stock
|
—
|
|
—
|
|
(15.6
|
)
|
—
|
|
(226.9
|
)
|
(124.9
|
)
|
—
|
|
(351.8
|
)
|
|||||||||||||
|
Conversion of preferred stock to common stock in connection with initial public offering
|
(147.6
|
)
|
(615.3
|
)
|
147.6
|
|
—
|
|
615.3
|
|
—
|
|
—
|
|
—
|
|
|||||||||||||
|
Issuance of common stock in connection with initial public offering and private placement, net of underwriters' discounts and commissions and issuance costs
|
—
|
|
—
|
|
37.0
|
|
—
|
|
739.7
|
|
—
|
|
—
|
|
739.7
|
|
|||||||||||||
|
Exercise of stock options and awards
|
—
|
|
—
|
|
3.4
|
|
—
|
|
26.2
|
|
—
|
|
—
|
|
26.2
|
|
|||||||||||||
69
|
Stock-based compensation
|
—
|
|
—
|
|
—
|
|
—
|
|
650.1
|
|
—
|
|
—
|
|
650.1
|
|
|||||||||||||
|
Other comprehensive income (loss)
|
—
|
|
—
|
|
—
|
|
—
|
|
—
|
|
—
|
|
(5.4
|
)
|
(5.4
|
)
|
|||||||||||||
|
Net loss
|
—
|
|
—
|
|
—
|
|
—
|
|
—
|
|
(484.9
|
)
|
—
|
|
(484.9
|
)
|
|||||||||||||
|
Balance at December 31, 2018
|
—
|
|
$
|
—
|
|
409.6
|
|
—
|
|
$
|
2,337.5
|
|
$
|
(1,659.5
|
)
|
$
|
(1.2
|
)
|
$
|
676.8
|
|
||||||||
See accompanying Notes to Consolidated Financial Statements.
70
DROPBOX, INC.
CONSOLIDATED STATEMENTS OF CASH FLOWS
(In millions)
|
|
Year ended December 31,
|
||||||||||
|
|
2018
|
|
2017
|
2016
|
|||||||
|
Cash flow from operating activities
|
|||||||||||
|
Net loss
|
$
|
(484.9
|
)
|
$
|
(111.7
|
)
|
$
|
(210.2
|
)
|
||
|
Adjustments to reconcile net loss to net cash provided by operating activities:
|
|||||||||||
|
Depreciation and amortization
|
166.8
|
|
181.8
|
|
191.6
|
|
|||||
|
Stock-based compensation
|
650.1
|
|
164.6
|
|
147.6
|
|
|||||
|
Amortization of deferred commissions
|
12.1
|
|
6.6
|
|
3.7
|
|
|||||
|
Donation of common stock to charitable foundation
|
—
|
|
9.4
|
|
—
|
|
|||||
|
Other
|
(1.9
|
)
|
(1.7
|
)
|
1.1
|
|
|||||
|
Changes in operating assets and liabilities:
|
|||||||||||
|
Trade and other receivables, net
|
0.1
|
|
(14.4
|
)
|
1.0
|
|
|||||
|
Prepaid expenses and other current assets
|
(47.9
|
)
|
(18.2
|
)
|
—
|
|
|||||
|
Other assets
|
(11.2
|
)
|
(10.6
|
)
|
(7.8
|
)
|
|||||
|
Accounts payable
|
(1.7
|
)
|
16.2
|
|
5.5
|
|
|||||
|
Accrued and other current liabilities
|
40.3
|
|
34.0
|
|
(12.4
|
)
|
|||||
|
Accrued compensation and benefits
|
25.0
|
|
14.4
|
|
35.6
|
|
|||||
|
Deferred revenue
|
66.4
|
|
64.3
|
|
87.6
|
|
|||||
|
Non-current liabilities
|
12.2
|
|
(4.4
|
)
|
9.3
|
|
|||||
|
Net cash provided by operating activities
|
425.4
|
|
330.3
|
|
252.6
|
|
|||||
|
Cash flow from investing activities
|
|||||||||||
|
Capital expenditures
|
(63.0
|
)
|
(25.3
|
)
|
(115.2
|
)
|
|||||
|
Purchase of intangible assets
|
(3.0
|
)
|
(0.8
|
)
|
(8.5
|
)
|
|||||
|
Purchases of short-term investments
|
(850.4
|
)
|
—
|
|
—
|
|
|||||
|
Proceeds from maturities of short-term investments
|
212.4
|
|
—
|
|
—
|
|
|||||
|
Proceeds from sales of short-term investments
|
71.2
|
|
—
|
|
—
|
|
|||||
|
Other
|
(1.0
|
)
|
2.2
|
|
5.7
|
|
|||||
|
Net cash used in investing activities
|
(633.8
|
)
|
(23.9
|
)
|
(118.0
|
)
|
|||||
|
Cash flow from financing activities
|
|||||||||||
|
Proceeds from initial public offering and private placement, net of underwriters' discounts and commissions
|
746.6
|
|
—
|
|
—
|
|
|||||
|
Payments of deferred offering costs
|
(4.5
|
)
|
(2.5
|
)
|
—
|
|
|||||
|
Shares repurchased for tax withholdings on release of restricted stock
|
(351.9
|
)
|
(87.9
|
)
|
—
|
|
|||||
|
Proceeds from issuance of common stock, net of repurchases
|
26.2
|
|
0.5
|
|
—
|
|
|||||
|
Principal payments on capital lease obligations
(1)
|
(109.1
|
)
|
(133.0
|
)
|
(137.9
|
)
|
|||||
|
Principal payments against note payable
|
(3.5
|
)
|
(3.9
|
)
|
(3.8
|
)
|
|||||
|
Proceeds from sale-leaseback agreement
|
—
|
|
—
|
|
8.8
|
|
|||||
|
Fees paid for revolving credit facility
|
(0.4
|
)
|
(2.6
|
)
|
—
|
|
|||||
|
Other
|
(2.6
|
)
|
(2.3
|
)
|
(1.6
|
)
|
|||||
|
Net cash provided by (used in) financing activities
|
300.8
|
|
(231.7
|
)
|
(134.5
|
)
|
|||||
|
Effect of exchange rate changes on cash and cash equivalents
|
(3.1
|
)
|
2.6
|
|
(4.3
|
)
|
|||||
|
Change in cash and cash equivalents
|
89.3
|
|
77.3
|
|
(4.2
|
)
|
|||||
|
Cash and cash equivalents—beginning of period
|
430.0
|
|
352.7
|
|
356.9
|
|
|||||
|
Cash and cash equivalents—end of period
|
$
|
519.3
|
|
$
|
430.0
|
|
$
|
352.7
|
|
||
71
|
Supplemental cash flow data:
|
|||||||||||
|
Cash paid during the period for:
|
|||||||||||
|
Interest
|
$
|
8.3
|
|
$
|
10.8
|
|
$
|
14.9
|
|
||
|
Income taxes
|
$
|
1.4
|
|
$
|
3.4
|
|
$
|
1.5
|
|
||
|
Non-cash investing and financing activities:
|
|||||||||||
|
Property and equipment received and accrued in accounts payable and accrued liabilities
|
$
|
7.3
|
|
$
|
2.4
|
|
$
|
7.6
|
|
||
|
Property and equipment acquired under capital leases
|
$
|
98.5
|
|
$
|
44.9
|
|
$
|
92.2
|
|
||
|
Fair value of shares issued related to acquisitions of businesses and other assets
|
$
|
—
|
|
$
|
—
|
|
$
|
0.7
|
|
||
|
Deferred offering costs accrued in accounts payable and accrued liabilities
|
$
|
—
|
|
$
|
1.6
|
|
$
|
—
|
|
||
|
(1)
|
Includes amounts attributable to related party transactions. See Note 14, "Related Party Transactions" for further details.
|
See accompanying Notes to Consolidated Financial Statements.
72
DROPBOX, INC.
NOTES TO CONSOLIDATED FINANCIAL STATEMENTS
(Amounts in tables are in millions except per share data, or as otherwise noted)
Note 1. Description of the Business and Summary of Significant Accounting Policies
Business
Dropbox, Inc. (the “Company” or “Dropbox”) is a global collaboration platform. Dropbox was incorporated in May 2007 as Evenflow, Inc., a Delaware corporation, and changed its name to Dropbox, Inc. in October 2009. The Company is headquartered in San Francisco, California.
Basis of presentation and consolidation
The accompanying consolidated financial statements have been prepared in accordance with the United States of America generally accepted accounting principles (“GAAP”). The accompanying consolidated financial statements include the accounts of Dropbox and its wholly owned subsidiaries. All intercompany balances and transactions have been eliminated in consolidation.
Initial public offering and private placement
On March 27, 2018, the Company closed its initial public offering ("IPO"), in which the Company issued and sold
26,822,409
shares of Class A common stock at
$21.00
per share. The Company received aggregate proceeds of
$538.2 million
, net of underwriters' discounts and commissions, before deducting offering costs of
$6.9 million
, net of reimbursements.
Immediately prior to the closing of the Company’s IPO,
147,310,563
shares of convertible preferred stock outstanding converted into an equivalent number of shares of Class B common stock. Further, pursuant to transfer agreements with certain of the Company’s stockholders,
258,620
shares of the Company’s convertible preferred stock and
2,609,951
shares of the Company’s Class B common stock automatically converted into an equivalent number of shares of Class A common stock.
Immediately subsequent to the closing of the Company's IPO, Salesforce Ventures LLC purchased
4,761,905
shares of Class A common stock from the Company at
$21.00
per share. The Company received aggregate proceeds of
$100.0 million
and did not pay any underwriting discounts or commissions with respect to the shares that were sold in the private placement.
On March 28, 2018, the underwriters exercised their option to purchase an additional
5,400,000
shares of the Company's Class A common stock at
$21.00
per share. This transaction closed on April 3, 2018, resulting in additional proceeds of
$108.4 million
, net of underwriters' discounts and commissions.
The Company’s net proceeds from the IPO, the concurrent private placement, and underwriters' option totaled
$746.6 million
, before deducting offering costs of
$6.9 million
, net of reimbursements.
Upon the effectiveness of the registration statement for the Company's IPO, which was March 22, 2018, the liquidity event-related performance vesting condition, referred to as the Performance Vesting Condition, associated with the Company's two-tier restricted stock units ("RSUs") was satisfied. As a result, the Company recognized the cumulative unrecognized stock-based compensation related to its two-tier RSUs using the accelerated attribution method of
$418.7 million
attributable to service prior to such effective date. As of
December 31, 2018
, the remaining unamortized stock-based compensation related to the two-tier RSUs was
$0.1 million
, which will be recognized if the requisite service is provided over a weighted average period of
0.2
years.
During the first quarter of 2018, the Company's Board of Directors approved the acceleration of the Performance Vesting Condition for which the service condition was satisfied, to occur upon the effectiveness of the registration statement for the Company's IPO, rather than six months following an IPO. As a result, the Company released
26.8 million
shares of common stock underlying the two-tier RSUs for which the Performance Vesting Condition was satisfied, and recorded
$13.9 million
in employer related payroll tax expenses associated with these same awards. See “—Stock-based compensation” for further discussion regarding the Company's two-tier RSUs.
Use of estimates
73
DROPBOX, INC.
NOTES TO CONSOLIDATED FINANCIAL STATEMENTS
(Amounts in tables are in millions except per share data, or as otherwise noted)
The preparation of financial statements in conformity with GAAP requires management to make estimates and assumptions that affect the amounts reported and disclosed in the Company’s consolidated financial statements and accompanying notes. These estimates are based on information available as of the date of the consolidated financial statements. On a regular basis, management evaluates these estimates and assumptions. Actual results may differ materially from these estimates.
The Company’s most significant estimates and judgments involve the measurement of the Company’s stock-based compensation, including the estimation of the underlying deemed fair value of common stock for periods prior to the Company's IPO, and the estimation of the fair value of market-based awards.
Financial information about segments and geographic areas
The Company manages its operations and allocates resources as a single operating segment. Further, the Company manages, monitors, and reports its financials as a single reporting segment. The Company’s chief operating decision-maker is its Chief Executive Officer, who reviews financial information presented on a consolidated basis for purposes of making operating decisions, assessing financial performance, and allocating resources. See Note 15, "Geographic Areas" for information regarding the Company's long-lived assets and revenue by geography.
Stock Split
On March 7, 2018, the Company effected a 1-for-1.5 reverse stock split of its capital stock. All of the share and per share information referenced throughout the consolidated financial statements and notes to the consolidated financial statements have been retroactively adjusted to reflect this reverse stock split.
Foreign currency transactions
The assets and liabilities of the Company’s foreign subsidiaries are translated from their respective functional currencies into U.S. dollars at the rates in effect at the balance sheet date and revenue and expense amounts are translated at the average exchange rate for the period. Foreign currency translation gains and losses are recorded in other comprehensive income (loss).
Gains and losses realized from foreign currency transactions (those transactions denominated in currencies other than the foreign subsidiaries’ functional currency) are included in other income, net. Monetary assets and liabilities are remeasured using foreign currency exchange rates at the end of the period, and non-monetary assets are remeasured based on historical exchange rates. The Company recorded $
1.9
million and
$3.6 million
in net foreign currency transaction losses in the years ended December 31,
2018
and
2016
, respectively, and recorded
$5.0 million
in net foreign currency gains in the year ended December 31,
2017
.
Revenue recognition
The Company derives its revenue from subscription fees from customers for access to its platform. The Company’s policy is to exclude sales and other indirect taxes when measuring the transaction price of its subscription agreements. The Company accounts for revenue contracts with customers through the following steps:
|
•
|
Identification of the contract, or contracts, with a customer
|
|
•
|
Identification of the performance obligations in the contract
|
|
•
|
Determination of the transaction price
|
|
•
|
Allocation of the transaction price to the performance obligations in the contract
|
|
•
|
Recognition of revenue when, or as, the Company satisfies a performance obligation
|
The Company’s subscription agreements generally have monthly or annual contractual terms and a small percentage have multi-year contractual terms. Revenue is recognized ratably over the related contractual term beginning on the date that the platform is made available to a customer. Access to the platform represents a series of distinct services as the Company continually provides access to, and fulfills its obligation to the end customer over the subscription term. The series of distinct services represents a single performance obligation that is satisfied over time. The Company recognizes revenue ratably
74
DROPBOX, INC.
NOTES TO CONSOLIDATED FINANCIAL STATEMENTS
(Amounts in tables are in millions except per share data, or as otherwise noted)
because the customer receives and consumes the benefits of the platform throughout the contract period. The Company’s contracts are generally non-cancelable.
The Company bills in advance for monthly contracts and typically bills annually in advance for contracts with terms of
one year or longer
. The Company also recognizes an immaterial amount of unbilled receivables, primarily relating to consideration for services completed but not billed at the reporting date. Unbilled receivables are classified as receivables when the Company has the right to invoice the customer.
The Company records contract liabilities when cash payments are received or due in advance of performance to deferred revenue. Deferred revenue primarily relates to the advance consideration received from the customer.
The price of subscriptions is generally fixed at contract inception and therefore, the Company’s contracts do not contain a significant amount of variable consideration. As a result, the amount of revenue recognized in the periods presented from performance obligations satisfied (or partially satisfied) in previous periods was not material.
The Company recognized
$411.6 million
,
$353.0 million
, and
$266.9 million
of revenue during the years ended December 31,
2018
,
2017
and
2016
, respectively, that was included in the deferred revenue balances at the beginning of the respective periods.
As of December 31,
2018
, future estimated revenue related to performance obligations that are unsatisfied or partially unsatisfied at the end of the reporting period was
$529.9 million
. The substantial majority of the unsatisfied performance obligations will be satisfied over the next
twelve
months.
Stock-based compensation
The Company has granted RSUs to its employees and members of the Board of Directors under the 2008 Equity Incentive Plan (“2008 Plan”), the 2017 Equity Incentive Plan (“2017 Plan”), and the 2018 Equity Incentive Plan ("2018 Plan"). The Company had
two
types of RSUs outstanding as of December 31,
2018
:
|
•
|
One-tier RSUs, which have a service-based vesting condition over a
four
-year period. These awards typically have a cliff vesting period of
one
year and continue to vest quarterly thereafter. The Company began granting one-tier RSUs under its 2008 Plan in August 2015 and it continues to grant one-tier RSUs under its 2018 Plan. The Company recognizes compensation expense associated with one-tier RSUs ratably on a straight-line basis over the requisite service period and accounts for forfeitures in the period in which they occur.
|
|
•
|
Two-tier RSUs, which have both a service-based vesting condition and a Performance Vesting Condition. The service-based vesting period for these awards is typically
four
years with a cliff vesting period of
one
year and continue to vest monthly thereafter. Upon satisfaction of the Performance Vesting Condition, these awards vest quarterly. The Performance Vesting Condition was satisfied on the the effectiveness of the registration statement related to the Company's IPO. Prior to August 2015, the Company granted two-tier RSUs under the 2008 Plan. The last grant date for two-tier RSUs was in May 2015. The Company recognizes compensation expense associated with two-tier RSUs using the accelerated attribution method over the requisite service period.
|
The Performance Vesting Condition for the two-tier RSUs was satisfied upon the effectiveness of the registration statement related to the Company's IPO, which was March 22, 2018. On that date, the Company recognized the cumulative unrecognized expense of the two-tier RSUs, using the accelerated attribution method, which is included in the Company's results for the year ended December 31, 2018. See "—Initial public offering and private placement” for further discussion. As of December 31, 2018, the remaining unamortized stock-based compensation related to the two-tier RSUs was
$0.1 million
, which will be recognized if the requisite service is provided over a weighted average period of
0.2
years.
Since August 2015, the Company has granted RSUs as the only stock-based payment awards to its employees, with the exception of awards granted to its co-founders, and has not granted any stock options since then. The fair values of the common stock underlying the RSUs granted in periods prior to the date of the Company's IPO were determined by the Board of Directors, with input from management and contemporaneous third-party valuations, which were performed at least quarterly.
75
DROPBOX, INC.
NOTES TO CONSOLIDATED FINANCIAL STATEMENTS
(Amounts in tables are in millions except per share data, or as otherwise noted)
Given the absence of a public trading market for the Company's common stock prior to its IPO, and in accordance with the American Institute of Certified Public Accountants Practice Guide,
Valuation of Privately-Held-Company Equity Securities
Issued as Compensation,
or AICPA Guide, the Company's Board of Directors exercised reasonable judgment and considered numerous objective and subjective factors to determine the best estimate of the fair value of its common stock including:
|
•
|
The results of contemporaneous valuations of its common stock by unrelated third parties;
|
|
•
|
The rights, preferences, and privileges of its convertible preferred stock relative to those of its common stock;
|
|
•
|
Market multiples of comparable public companies in its industry as indicated by their market capitalization and guideline merger and acquisition transactions;
|
|
•
|
The Company's performance and market position relative to its competitors, who may change from time to time;
|
|
•
|
The Company's historical financial results and estimated trends and prospects for its future performance;
|
|
•
|
Valuations published by institutional investors that hold investments in its capital stock;
|
|
•
|
The economic and competitive environment;
|
|
•
|
The likelihood and timeline of achieving a liquidity event, such as an initial public offering or sale, given prevailing market conditions;
|
|
•
|
Any adjustments necessary to recognize a lack of marketability for its common stock; and
|
|
•
|
Precedent sales of or offers to purchase its capital stock.
|
In valuing the Company's common stock, the Board of Directors determined the fair value of its common stock using both the income and market approach valuation methods. The income approach estimates value based on the expectation of future cash flows that a company will generate. These future cash flows are discounted to their present values using a discount rate based on our weighted average cost of capital, and is adjusted to reflect the risks inherent in the Company's cash flows. The market approach estimates value based on a comparison of the subject company to comparable public companies in a similar line of business. From the comparable companies, a representative market value multiple is determined and then applied to the subject company’s financial forecasts to estimate the value of the subject company.
For valuations after the Company's IPO, the Board of Directors determines the fair value of each share of underlying common stock based on the closing price of the Company's Class A common stock as reported on the Nasdaq Global Select Market on the date of the grant.
In December 2017, the Board of Directors approved a grant to the Company’s co-founders of restricted stock awards (“RSAs”) with respect to
14.7 million
shares of Class A Common Stock in the aggregate (collectively, the “Co-Founder Grants”), of which
10.3 million
RSAs were granted to Mr. Houston, the Company’s co-founder and Chief Executive Officer, and
4.4 million
RSAs were granted to Mr. Ferdowsi, the Company’s co-founder and Director. These Co-Founder Grants have service-based, market-based, and performance-based vesting conditions.
The Co-Founder Grants comprise
nine
tranches that are eligible to vest based on the achievement of stock price goals, or, each, a Stock Price Target. The Company estimated the grant date fair value of the Co-Founder Grants using a model based on multiple stock price paths developed through the use of a Monte Carlo simulation that incorporates into the valuation the possibility that the Stock Price Targets may not be satisfied. The average grant date fair value of each Co-Founder Grant was estimated to be
$10.60
per share, and the Company will recognize aggregate stock-based compensation expense of
$156.2 million
over the requisite service period of each tranche, which ranged from
2.9
to
6.9
years, using the accelerated attribution method. If the Stock Price Targets are met sooner than the derived service period, the Company will adjust its stock-based compensation to reflect the cumulative expense associated with the vested awards. The Company will recognize expense if the requisite service is provided, regardless of whether the market conditions are achieved.
The Co-Founder Grants contain an implied performance-based vesting condition because the Stock Price Targets are based on the trailing 30-day average price of the shares from an established national securities exchange or automated quotation system. Accordingly, no vesting could occur until the completion of the Company’s IPO. The relevant performance-based vesting condition for the Co-Founder Grants was satisfied on the date the Company’s shares of Class A common stock commenced trading on the Nasdaq Global Select Market, in connection with the Company’s IPO, which was March 23, 2018.
76
DROPBOX, INC.
NOTES TO CONSOLIDATED FINANCIAL STATEMENTS
(Amounts in tables are in millions except per share data, or as otherwise noted)
The Company recognized
$37.0 million
in stock-based compensation related to the Co-Founder Grants during the year ended December 31, 2018.
On January 1, 2017, the Company adopted ASU No. 2016-09: Improvement to Employee Share-based Payment Accounting (Topic 718) issued by the Financial Accounting Standards Board, which among other items, provides an accounting policy election to account for forfeitures as they occur, rather than to account for them based on an estimate of expected forfeitures. The Company elected to account for forfeitures as they occur and therefore, stock-based compensation expense for the years ended December 31, 2018 and 2017, has been calculated based on actual forfeitures in the Company’s consolidated statements of operations, rather than the Company’s previous approach which was net of estimated forfeitures. The net cumulative effect of this change as of January 1, 2017, was not material. Stock-based compensation expense for the year ended December 31, 2016, was recorded net of estimated forfeitures, which were based on historical forfeitures and adjusted to reflect changes in facts and circumstances, if any.
Cost of revenue
Cost of revenue consists primarily of expenses associated with the storage, delivery, and distribution of the Company’s platform for both paying users and Basic users. These costs, which are referred to as infrastructure costs, include depreciation of servers located in co-location facilities that the Company leases and operates, rent and facilities expense for those datacenters, network and bandwidth costs, support and maintenance costs for infrastructure equipment, and payments to third-party datacenter service providers. Cost of revenue also includes costs, such as salaries, bonuses, benefits, travel-related expenses, and stock-based compensation, which are referred to as employee-related costs, for employees whose primary responsibilities relate to supporting the Company’s infrastructure and delivering user support. Other non-employee costs included in cost of revenue include credit card fees related to processing customer transactions and allocated overhead, such as facilities, including rent, utilities, depreciation on leasehold improvements and other equipment shared by all departments, and shared information technology costs. In addition, cost of revenue includes amortization of developed technologies, professional fees related to user support initiatives, and property taxes related to the datacenters.
Advertising and promotional expense
Advertising and promotional expenses are included in sales and marketing expenses within the consolidated statements of operations and are expensed when incurred. Advertising and promotional expenses were $
100.9
million,
$80.1 million
, and
$46.6 million
in the years ended December 31,
2018
,
2017
, and
2016
, respectively.
Cash and cash equivalents
Cash consists primarily of cash on deposit with banks. Cash equivalents include highly liquid investments purchased with an original maturity date of 90 days or less from the date of purchase and primarily consist of money market funds. Cash equivalents also include amounts in transit from payment processors for credit and debit card transactions, which typically settle within five days. Cash and cash equivalents are recorded at cost, which approximates fair value.
Short-term investments
The Company’s short-term investments are primarily comprised of corporate notes and obligations, U.S. treasury securities, certificates of deposits, U.S. agency obligations, and commercial paper. The Company determines the appropriate classification of its short-term investments at the time of purchase and reevaluates such designation at each balance sheet date. The Company has classified and accounted for its short-term investments as available-for-sale securities as the Company may sell these securities at any time for use in its current operations or for other purposes, even prior to maturity. As a result, the Company classifies its short-term investments, including securities with stated maturities beyond twelve months, within current assets in the consolidated balance sheets.
The Company's short-term investments are classified as available-for-sale securities and are recorded at fair value each reporting period. Unrealized gains and losses on these short-term investments are reported as a separate component of accumulated other comprehensive income (loss) in the consolidated balance sheets until realized. Interest income is reported within interest income (expense), net in the consolidated statements of operations. The Company periodically evaluates its short-term investments to assess whether those with unrealized loss positions are other-than-temporarily impaired. The Company considers various factors in determining whether to recognize an impairment charge, including the length of time the
77
DROPBOX, INC.
NOTES TO CONSOLIDATED FINANCIAL STATEMENTS
(Amounts in tables are in millions except per share data, or as otherwise noted)
investment has been in a loss position, the extent to which the fair value is less than the Company’s cost basis, and the financial condition and near-term prospects of the investee. Realized gains and losses are determined based on the specific identification method and are reported in other income, net in the consolidated statements of operations. If the Company determines that the decline in an investment’s fair value is other-than-temporary, the difference is recognized as an impairment loss in the consolidated statements of operations.
Trade and other receivables, net
Trade and other receivables, net consists primarily of trade receivables that are recorded at the invoice amount, net of an allowance for doubtful accounts.
The allowance for doubtful accounts is based on the Company’s assessment of the collectability of accounts. The Company regularly reviews the adequacy of the allowance for doubtful accounts by considering the age of each outstanding invoice, the collection history of each customer, and other relevant factors to determine the appropriate amount of the allowance. Accounts receivable deemed uncollectable are charged against the allowance for doubtful accounts when identified. The Company's allowance for doubtful accounts was
$1.2 million
and
$1.0 million
as of December 31, 2018 and 2017, respectively.
Concentrations of credit risk
Financial instruments that potentially subject the Company to significant concentrations of credit risk consist primarily of cash, cash equivalents, short-term investments, and accounts receivable. The Company places its cash, cash equivalents, and short-term investments with well-established financial institutions. Cash equivalents consist primarily of highly rated money market funds.
Trade accounts receivables are typically unsecured and are derived from revenue earned from customers located around the world. Two customers accounted for
14%
and
23%
of total trade and other receivables, net as of December 31,
2018
. Two customers accounted for
18%
and
27%
of total trade and other receivables, net as of December 31,
2017
. No customer accounted for more than 10% of the Company’s revenue in the periods presented.
Non-trade receivables
The Company records non-trade receivables to reflect amounts due for activities outside of its subscription agreements. Historically, the Company’s non-trade receivables have related primarily to receivables resulting from tenant improvement allowances. Non-trade receivables totaled $
46.2
million and
$5.2 million
, as of December 31,
2018
and
2017
, respectively, and are classified within prepaid expenses and other current assets in the accompanying consolidated balance sheets. The Company recognized its initial tenant improvement allowance receivable related to its new corporate headquarters once it took initial possession of the first phase in June 2018. As of December 31,
2018
,
$40.5 million
is included in prepaid expenses and other current assets related to this tenant improvement allowance receivable. See "—Lease obligations” for further discussion on the corresponding recording of the lease incentive obligation.
Deferred commissions, net
Deferred commissions, net is stated at gross deferred commissions less accumulated amortization. Sales commissions earned by the Company’s sales force and third-party resellers, as well as related payroll taxes, are considered to be incremental and recoverable costs of obtaining a contract with a customer. As a result, these amounts have been capitalized as deferred commissions within prepaid and other current assets and other assets on the consolidated balance sheet. The Company deferred incremental costs of obtaining a contract of
$32.0 million
and
$19.4 million
during the years ended December 31,
2018
and
2017
, respectively.
Deferred commissions, net included in prepaid and other current assets were
$14.5 million
and
$8.1 million
as of December 31,
2018
and
2017
, respectively. Deferred commissions, net included in other assets were
$38.3 million
and
$24.8 million
as of December 31,
2018
and
2017
, respectively.
78
DROPBOX, INC.
NOTES TO CONSOLIDATED FINANCIAL STATEMENTS
(Amounts in tables are in millions except per share data, or as otherwise noted)
Deferred commissions are amortized over a period of benefit of
five
years. The period of benefit was estimated by considering factors such as historical customer attrition rates, the useful life of the Company’s technology, and the impact of competition in its industry. Amortized costs were
$12.1 million
,
$6.6 million
, and
$3.7 million
for the years ended December 31,
2018
,
2017
, and
2016
, respectively. Amortized costs are included in sales and marketing expense in the accompanying consolidated statements of operations. There was
no
impairment loss in relation to the deferred costs for any period presented.
Property and equipment, net
Equipment is stated at cost less accumulated depreciation. Depreciation is computed using the straight-line method over the estimated useful life of the related asset, which is generally
three
to
seven
years. Leasehold improvements are amortized on a straight-line basis over the shorter of their estimated useful lives or the term of the related lease. In the first quarter of 2018, the Company determined that the useful lives of certain infrastructure equipment, which are depreciated through cost of revenue, should be increased from
three
to
four
years. The Company accounted for this as a change in estimate that was applied prospectively, effective as of January 1, 2018. This change in useful life resulted in a reduction in depreciation expense within cost of revenue of
$16.1 million
during the year ended December 31, 2018.
The following table presents the estimated useful lives of property and equipment:
|
|
|
|
|
Property and equipment
|
|
Useful life
|
|
Buildings
|
|
20 to 30 years
|
|
Datacenter and other computer equipment
|
|
3 to 5 years
|
|
Office equipment and other
|
|
3 to 7 years
|
|
Leasehold improvements
|
|
Lesser of estimated useful life or remaining lease term
|
Lease obligations
The Company leases office space, datacenters, and equipment under non-cancelable capital and operating leases with various expiration dates through 2033. Certain of the Company’s operating lease agreements contain tenant improvement allowances from its landlords. These allowances are accounted for as lease incentive obligations and are amortized as reductions to rent expense over the lease term. In June 2018, the Company took initial possession of the first phase of its new corporate headquarters and recorded a lease incentive obligation related to this phase. As of December 31, 2018,
$2.6 million
was included in accrued and other current liabilities and
$36.4 million
was included in deferred rent, non-current in the Company's consolidated balance sheets.
In addition, certain of the operating lease agreements contain rent concession, rent escalation, and option to renew provisions. Rent concession and rent escalation provisions are considered in determining the straight-line rent expense to be recorded over the lease term. Lease expense is recognized on a straight-line basis over the lease term commencing on the date the Company has the right to use the leased property. The Company does not assume renewals in its determination of the lease term unless the renewals are deemed to be reasonably assured at lease inception.
In 2012, the Company undertook a series of structural improvements to the floor that it occupied in its previous corporate headquarters. As a result of the requirement to fund construction costs and its responsibility for cost overruns during the construction period, the Company was considered the deemed owner of the floor for accounting purposes. Due to the presence of a standby letter of credit as a security deposit, the Company was deemed to have continuing involvement after the construction period. As such, it accounted for this arrangement as owned real estate and recorded a building asset and an imputed financing obligation for its liability to the legal owners. In September 2018, the Company terminated its master lease for its previous corporate headquarters, the impact of which is described in Note 4, "Property and Equipment, Net".
The Company leases certain equipment from various third parties, including from a related party, through equipment financing leases under capital leases. See Note 14, “Related Party Transactions” for additional details. These leases either include a bargain purchase option, a full transfer of ownership at the completion of the lease term, or the terms of the leases are at least 75 percent of the useful lives of the assets and are therefore classified as capital leases. These leases are capitalized in
79
DROPBOX, INC.
NOTES TO CONSOLIDATED FINANCIAL STATEMENTS
(Amounts in tables are in millions except per share data, or as otherwise noted)
property and equipment, net and the related amortization of assets under capital leases is included in depreciation and amortization expense in the Company’s consolidated statements of operations. Initial asset values and lease obligations are based on the present value of future minimum lease payments.
Internal use software
The Company capitalizes certain costs related to developed or modified software solely for its internal use and cloud based applications used to deliver its platform. The Company capitalizes costs during the application development stage once the preliminary project stage is complete, management authorizes and commits to funding the project, and it is probable that the project will be completed and that the software will be used to perform the function intended. Costs related to preliminary project activities and post implementation activities are expensed as incurred. Capitalized internal use software costs were
not
material to the Company’s consolidated financial statements during the years ended December 31,
2018
,
2017
, and
2016
.
Business combinations
The Company uses best estimates and assumptions to assign a fair value to the tangible and intangible assets acquired and liabilities assumed in business combinations as of the acquisition date. These estimates are inherently uncertain and subject to refinement. During the measurement period, which may be up to one year from the acquisition date, adjustments to the fair value of these tangible and intangible assets acquired and liabilities assumed may be recorded, with the corresponding offset to goodwill. Upon the conclusion of the measurement period or final determination of the fair value of assets acquired or liabilities assumed, whichever comes first, any subsequent adjustments are recorded to the Company’s consolidated statements of operations.
Long-lived assets, including goodwill and other acquired intangible assets, net
The Company evaluates the recoverability of property and equipment and finite-lived intangible assets for possible impairment whenever events or circumstances indicate that the carrying amount of such assets may not be recoverable. The evaluation is performed at the lowest level for which identifiable cash flows are largely independent of the cash flows of other assets and liabilities. Recoverability of these assets is measured by a comparison of the carrying amounts to the future undiscounted cash flows the assets are expected to generate. If such review determines that the carrying amount of specific property and equipment or intangible assets is not recoverable, the carrying amount of such assets is reduced to its fair value.
The Company reviews goodwill for impairment at least annually in the fourth quarter, or more frequently if events or changes in circumstances would more likely than not reduce the fair value of its single reporting unit below its carrying value.
The Company has not recorded impairment charges on property and equipment, goodwill, or intangible assets for the periods presented in these consolidated financial statements.
Acquired property and equipment and finite-lived intangible assets are amortized over their useful lives. The Company evaluates the estimated remaining useful life of these assets when events or changes in circumstances warrant a revision to the remaining period of amortization. If the Company reduces the estimated useful life assumption for any asset, the remaining unamortized balance is amortized or depreciated over the revised estimated useful life on a prospective basis.
Deferred offering costs
Deferred offering costs, which consist of direct incremental legal, accounting, and consulting fees related to the Company's IPO, were capitalized. The deferred offering costs were offset against IPO proceeds within the consolidated statements of stockholders' equity. There were
no
deferred offering costs outstanding as of December 31, 2018. As of December 31, 2017, the Company had capitalized approximately
$4.1 million
of deferred offering costs within other assets on the consolidated balance sheet.
Income taxes
Deferred income tax balances reflect the effects of temporary differences between the financial reporting and tax bases of the Company’s assets and liabilities using enacted tax rates expected to apply when taxes are actually paid or recovered. In addition, deferred tax assets are recorded for net operating loss and credit carryforwards.
80
DROPBOX, INC.
NOTES TO CONSOLIDATED FINANCIAL STATEMENTS
(Amounts in tables are in millions except per share data, or as otherwise noted)
A valuation allowance is provided against deferred tax assets unless it is more likely than not that they will be realized based on all available positive and negative evidence. Such evidence includes, but is not limited to, recent cumulative earnings or losses, expectations of future taxable income by taxing jurisdiction, and the carry-forward periods available for the utilization of deferred tax assets.
The Company uses a two-step approach to recognizing and measuring uncertain income tax positions. The first step is to evaluate the tax position for recognition by determining if the weight of available evidence indicates it is more likely than not that the position will be sustained on audit. The second step is to measure the tax benefit as the largest amount, which is more than 50% likely of being realized upon ultimate settlement. The Company recognizes interest and penalties related to unrecognized tax benefits as income tax expense. Significant judgment is required to evaluate uncertain tax positions.
Although the Company believes that it has adequately reserved for its uncertain tax positions, it can provide no assurance that the final tax outcome of these matters will not be materially different. The Company evaluates its uncertain tax positions on a regular basis and evaluations are based on a number of factors, including changes in facts and circumstances, changes in tax law, such as the Tax Cuts and Jobs Act, correspondence with tax authorities during the course of an audit, and effective settlement of audit issues.
To the extent that the final tax outcome of these matters is different than the amounts recorded, such differences will affect the provision for income taxes in the period in which such determination is made and could have a material impact on the Company’s financial condition and results of operations.
Fair value measurement
The Company applies fair value accounting for all financial assets and liabilities and non-financial assets and liabilities that are recognized or disclosed at fair value in the financial statements on a recurring basis. The Company defines fair value as the price that would be received from selling an asset or paid to transfer a liability in an orderly transaction between market participants at the measurement date. When determining fair value measurements for assets and liabilities, the Company considers the principal or most advantageous market in which it would transact and the market-based risk measurements or assumptions that market participants would use in pricing the asset or liability, such as risks inherent in valuation techniques, transfer restrictions, and credit risk. Fair value is estimated by applying the following hierarchy, which prioritizes the inputs used to measure fair value into three levels and bases the categorization within the hierarchy upon the lowest level of input that is available and significant to the fair value measurement:
Level 1
—Quoted prices in active markets for identical assets or liabilities.
Level 2
—Observable inputs other than quoted prices in active markets for identical assets and liabilities, quoted prices for identical or similar assets or liabilities in inactive markets, or other inputs that are observable or can be corroborated by observable market data for substantially the full term of the assets or liabilities.
Level 3
—Inputs that are generally unobservable and typically reflect management’s estimate of assumptions that market participants would use in pricing the asset or liability.
Recently issued accounting pronouncements not yet adopted
In February 2016, the Financial Accounting Standards Board ("FASB") issued Accounting Standards Update ("ASU") No. 2016-02,
Leases (Topic 842)
. Most prominent among the changes in the standard is the recognition of right of use assets and lease liabilities by lessees for those leases classified as operating leases under current GAAP. Under the standard, disclosures are required to meet the objective of enabling users of financial statements to assess the amount, timing, and uncertainty of cash flows arising from leases. The Company is required to adopt the standard using the modified retrospective approach and has elected to use the optional transition method related to comparative reporting at adoption. The new standard is effective for fiscal years beginning after December 15, 2018. The Company will recognize a material operating lease liability and related right-of-use asset on the consolidated balance sheet on January 1, 2019. The lease liability and corresponding right-of-use asset primarily relate to its office space and data center operating leases. The prospective impact on the consolidated statement of operations under the new standard is substantially similar compared to the current lease accounting model. The Company's accounting for capital leases related to infrastructure equipment, now referred to as financing leases under the new standard, is substantially unchanged under the new standard.
81
DROPBOX, INC.
NOTES TO CONSOLIDATED FINANCIAL STATEMENTS
(Amounts in tables are in millions except per share data, or as otherwise noted)
In June 2016, the FASB issued ASU No. 2016-13,
Financial Instruments-Credit Losses (Topic 326): Measurement of Credit Losses on Financial Instruments
, which requires the measurement and recognition of expected credit losses for financial assets held at amortized cost. It also eliminates the concept of other-than-temporary impairment and requires credit losses related to available-for-sale debt securities to be recorded through an allowance for credit losses rather than as a reduction in the amortized cost basis of the securities. These changes will result in more timely recognition of credit losses. The guidance is effective for fiscal years beginning after December 15, 2019, and interim periods within those fiscal years. Early adoption is permitted. The Company is currently evaluating the impact and timing of adopting ASU No. 2016-13.
In February 2018, the FASB issued ASU No. 2018-02,
Reclassification of Certain Tax Effects from Accumulated Other Comprehensive Income
. Under existing U.S. GAAP, the effects of changes in tax rates and laws on deferred tax balances are recorded as a component of income tax expense in the period in which the law was enacted. When deferred tax balances related to items originally recorded in accumulated other comprehensive income are adjusted, certain tax effects become stranded in accumulated other comprehensive income. The amendments in ASU No. 2018-02 allow a reclassification from accumulated other comprehensive income to retained earnings for stranded tax effects resulting from the 2017 Tax Reform Act. The amendments in ASU No. 2018-02 also require certain disclosures about stranded tax effects. The guidance is effective for fiscal years beginning after December 15, 2018 and interim periods within those fiscal years. The Company does not expect the impact of adoption to have a material impact on its consolidated financial statements.
In June 2018, the FASB issued ASU No. 2018-07,
Improvements to Nonemployee Share-Based Payment Accounting.
Under existing U.S. GAAP, the measurement date for equity awards granted to nonemployees is the earlier of the performance commitment date or the date the performance is complete. The amendments in ASU No. 2018-07 allow for measurement of these awards on the grant date, consistent with equity awards granted to employees. The guidance is effective for fiscal years beginning after December 15, 2018 and interim periods within those fiscal years. The Company does not expect the impact of adoption to have a material impact on its consolidated financial statements.
In August 2018, the FASB issued ASU No. 2018-13,
Fair Value Measurement (Topic 820),
which amends disclosure requirements for fair value measurements by requiring new disclosures, modifying existing requirements, and eliminating others.
The amendments are the result of a broader disclosure project, which aims to improve the effectiveness of disclosures. ASU No. 2018-13 is effective for fiscal years beginning after December 15, 2019 and interim periods within those fiscal years. Early adoption is permitted. The Company does not expect the adoption to have a significant impact on its disclosures and is currently evaluating the timing of adopting ASU No. 2018-13.
In August 2018, the FASB issued ASU No. 2018-15,
Intangibles - Goodwill and Other - Internal-Use Software (Subtopic 350-40), Customer's Accounting for Implementation Costs Incurred in a Cloud Computing Arrangement That Is a Service Contract.
Under existing U.S. GAAP, there is diversity in practice in accounting for the costs of implementing cloud computing arrangements that are service contracts. The amendments in ASU No. 2018-15 amend the definition of a hosting arrangement and requires a customer in a hosting arrangement that is a service contract to capitalize certain costs as if the arrangement were an internal-use software project. The guidance is effective for fiscal years beginning after December 15, 2019 and interim periods within those fiscal years. Early adoption is permitted. The Company is currently evaluating the impact and timing of adopting ASU No. 2018-15.
Recently adopted accounting pronouncements
In January 2016, the FASB issued ASU No. 2016-01,
Financial Instruments Overall: Recognition and Measurement of Financial Assets and Financial Liabilities
(Subtopic 825)
, which primarily affects the accounting for equity investments, financial liabilities under the fair value option and the presentation and disclosure requirements for financial instruments. In addition, the FASB clarified guidance related to the valuation allowance assessment when recognizing deferred tax assets resulting from unrealized losses on available-for-sale debt securities. The accounting for other financial instruments, such as loans, investments in debt securities and financial liabilities is largely unchanged. The Company adopted ASU No. 2016-01 on January 1, 2018. The adoption of the standard did not have a material impact on the Company's consolidated financial statements.
In October 2016, the FASB issued ASU No. 2016-16,
Income Taxes: Intra-Entity Transfers Other than Inventory (Topic 740)
, which requires entities to recognize the income tax consequences of an intra-entity transfer of an asset other than inventory when the transfer occurs. The Company adopted ASU No. 2016-16 on January 1, 2018. The adoption of the guidance did not have a material impact on the Company's consolidated financial statements.
82
DROPBOX, INC.
NOTES TO CONSOLIDATED FINANCIAL STATEMENTS
(Amounts in tables are in millions except per share data, or as otherwise noted)
Note 2. Cash, Cash Equivalents and Short-Term Investments
The amortized cost, unrealized gains and losses and estimated fair value of the Company's cash, cash equivalents and short-term investments as of
December 31, 2018
consisted of the following:
|
Amortized cost
|
Unrealized gain
|
Unrealized loss
|
Estimated fair value
|
||||||||||||
|
Cash
|
$
|
103.0
|
|
$
|
—
|
|
$
|
—
|
|
103.0
|
|
||||
|
Cash equivalents
|
|||||||||||||||
|
Money market funds
|
355.5
|
|
—
|
|
—
|
|
355.5
|
|
|||||||
|
Commercial paper
|
27.4
|
|
—
|
|
—
|
|
27.4
|
|
|||||||
|
U.S. Treasury securities
|
33.4
|
|
—
|
|
—
|
|
33.4
|
|
|||||||
|
Total cash and cash equivalents
|
$
|
519.3
|
|
$
|
—
|
|
$
|
—
|
|
$
|
519.3
|
|
|||
|
Short-term investments
|
|||||||||||||||
|
Corporate notes and obligations
|
269.6
|
|
0.1
|
|
(0.5
|
)
|
269.2
|
|
|||||||
|
U.S. Treasury securities
|
176.0
|
|
—
|
|
(0.1
|
)
|
175.9
|
|
|||||||
|
Certificates of deposit
|
70.6
|
|
—
|
|
—
|
|
70.6
|
|
|||||||
|
U.S. agency obligations
|
37.1
|
|
—
|
|
—
|
|
37.1
|
|
|||||||
|
Commercial paper
|
17.2
|
|
—
|
|
—
|
|
17.2
|
|
|||||||
|
Total short-term investments
|
570.5
|
|
0.1
|
|
(0.6
|
)
|
570.0
|
|
|||||||
|
Total
|
$
|
1,089.8
|
|
$
|
0.1
|
|
$
|
(0.6
|
)
|
$
|
1,089.3
|
|
|||
The Company's cash and cash equivalents at December 31, 2017 consisted of cash of
$62.9 million
and money market funds of
$367.1 million
. The Company did
not
have short-term investments as of December 31, 2017.
Included in cash and cash equivalents is cash in transit from payment processors for credit and debit card transactions of
$11.9 million
and
$13.3 million
as of
December 31, 2018
and December 31, 2017, respectively.
All short-term investments were designated as available-for-sale securities as of
December 31, 2018
.
The following table presents the contractual maturities of the Company’s short-term investments as of
December 31, 2018
:
|
Amortized cost
|
Estimated fair value
|
||||||
|
Due within one year
|
$
|
327.6
|
|
$
|
327.5
|
|
|
|
Due between one to three years
|
242.9
|
|
242.5
|
|
|||
|
Total
|
$
|
570.5
|
|
$
|
570.0
|
|
|
As of
December 31, 2018
, the following short-term investments were in unrealized loss positions:
|
Less than 12 months
|
12 months or greater
|
Total
|
|||||||||||||||||||||
|
Fair value
|
Unrealized losses
|
Fair value
|
Unrealized losses
|
Fair value
|
Unrealized losses
|
||||||||||||||||||
|
Corporate notes and obligations
|
$
|
209.5
|
|
$
|
(0.5
|
)
|
$
|
—
|
|
$
|
—
|
|
$
|
209.5
|
|
$
|
(0.5
|
)
|
|||||
|
U.S. Treasury securities
|
127.8
|
|
(0.1
|
)
|
—
|
|
—
|
|
127.8
|
|
(0.1
|
)
|
|||||||||||
|
Total
|
$
|
337.3
|
|
$
|
(0.6
|
)
|
$
|
—
|
|
$
|
—
|
|
$
|
337.3
|
|
$
|
(0.6
|
)
|
|||||
83
DROPBOX, INC.
NOTES TO CONSOLIDATED FINANCIAL STATEMENTS
(Amounts in tables are in millions except per share data, or as otherwise noted)
The Company had
202
short-term investments in unrealized loss positions as of
December 31, 2018
. There were
no
material gross unrealized losses from available-for-sale securities and
no
material realized gains or losses from available-for-sale securities that were reclassified out of accumulated other comprehensive income for the year ended
December 31, 2018
.
For investments in available-for-sale debt securities that have unrealized losses, the Company evaluates whether (i) it has the intention to sell any of these investments and (ii) whether it is not more likely than not that it will be required to sell any of these investments before recovery of the entire amortized cost basis. Based on this evaluation, the Company determined that there were
no
other-than-temporary impairments associated with short-term investments as of
December 31, 2018
.
The Company recorded
$16.8 million
,
$3.0 million
, and
$0.9 million
in interest income from its cash, cash equivalents and short-term investments for the years ended December 31, 2018, 2017 and 2016, respectively.
Note 3. Fair Value Measurements
The Company measures its financial instruments at fair value each reporting period using a fair value hierarchy that prioritizes the use of observable inputs and minimizes the use of unobservable inputs when measuring fair value. A financial instrument’s classification within the fair value hierarchy is based upon the lowest level of input that is significant to the fair value measurement.
The following table presents information about the Company’s financial instruments that are measured at fair value on a recurring basis using the input categories discussed in Note 1:
|
As of December 31, 2018
|
|||||||||||||||
|
Level 1
|
Level 2
|
Level 3
|
Total
|
||||||||||||
|
Cash equivalents
|
|||||||||||||||
|
Money market funds
|
$
|
355.5
|
|
$
|
—
|
|
$
|
—
|
|
$
|
355.5
|
|
|||
|
U.S Treasury securities
|
—
|
|
33.4
|
|
—
|
|
33.4
|
|
|||||||
|
Commercial paper
|
—
|
|
27.4
|
|
—
|
|
27.4
|
|
|||||||
|
Total cash equivalents
|
$
|
355.5
|
|
$
|
60.8
|
|
$
|
—
|
|
$
|
416.3
|
|
|||
|
Short-term investments
|
|||||||||||||||
|
Corporate notes and obligations
|
—
|
|
269.2
|
|
—
|
|
269.2
|
|
|||||||
|
U.S. Treasury securities
|
—
|
|
175.9
|
|
—
|
|
175.9
|
|
|||||||
|
Certificates of deposit
|
—
|
|
70.6
|
|
—
|
|
70.6
|
|
|||||||
|
U.S. agency obligations
|
—
|
|
37.1
|
|
—
|
|
37.1
|
|
|||||||
|
Commercial paper
|
—
|
|
17.2
|
|
—
|
|
17.2
|
|
|||||||
|
Total short-term investments
|
—
|
|
570.0
|
|
—
|
|
570.0
|
|
|||||||
|
Total cash equivalents and short-term investments
|
$
|
355.5
|
|
$
|
630.8
|
|
$
|
—
|
|
$
|
986.3
|
|
|||
The total cash equivalents held by the Company as of December 31, 2017 were
$367.1 million
and were entirely comprised of money market funds classified within Level 1 of the fair value hierarchy.
The Company had
no
transfers between levels of the fair value hierarchy.
The carrying amounts of certain financial instruments, including cash held in banks, accounts receivable and accounts payable approximate fair value due to their short-term maturities and are excluded from the fair value table above.
84
DROPBOX, INC.
NOTES TO CONSOLIDATED FINANCIAL STATEMENTS
(Amounts in tables are in millions except per share data, or as otherwise noted)
Note 4. Property and Equipment, Net
Property and equipment, net consisted of the following:
|
|
As of December 31,
|
|||||||
|
|
2018
|
|
2017
|
|||||
|
Building
|
$
|
—
|
|
$
|
36.6
|
|
||
|
Datacenter and other computer equipment
|
695.3
|
|
663.1
|
|
||||
|
Furniture and fixtures
|
23.8
|
|
21.2
|
|
||||
|
Leasehold improvements
|
122.6
|
|
118.6
|
|
||||
|
Construction in process
|
32.8
|
|
7.2
|
|
||||
|
Total property and equipment
|
874.5
|
|
846.7
|
|
||||
|
Accumulated depreciation and amortization
|
(563.9
|
)
|
(504.8
|
)
|
||||
|
Property and equipment, net
|
$
|
310.6
|
|
$
|
341.9
|
|
||
As described in Note 1, "Description of the Business and Summary of Significant Accounting Policies", the Company terminated its master lease for its previous corporate headquarters in September 2018. The termination resulted in de-recognizing the gross building asset of
$36.6 million
, related accumulated depreciation of
$12.2 million
, and an imputed financing obligation of
$25.5 million
, of which
$2.8 million
was included in accrued and other current liabilities and
$22.7 million
was included in other non-current liabilities. The Company recorded the difference between the net asset and liability that were de-recognized to other income, net during the year ended
December 31, 2018
.
The Company leases certain infrastructure from various third parties, including from a former related party, through equipment financing leases under capital leases. See Note 14, “Related Party Transactions” for additional details. Infrastructure assets as of December 31,
2018
and
2017
, respectively, included a total of $
362.8
million and
$417.9 million
acquired under capital lease agreements. These leases are capitalized in property and equipment, and the related amortization of assets under capital leases is included in depreciation and amortization expense. The accumulated amortization of the infrastructure assets under capital leases totaled $
211.7
million and
$259.0 million
as of December 31,
2018
and
2017
, respectively.
Construction in process includes costs primarily related to construction of leasehold improvements for office buildings and datacenters, and as of December 31, 2018, primarily relates to costs incurred related to our new corporate headquarters.
Depreciation expense related to property and equipment was $
158.6
million,
$170.7 million
, and
$173.8 million
for the years ended December 31,
2018
,
2017
, and
2016
, respectively.
Note 5. Business Combinations
The Company did not complete any business combinations during the years ended December 31, 2018, 2017 and 2016.
85
DROPBOX, INC.
NOTES TO CONSOLIDATED FINANCIAL STATEMENTS
(Amounts in tables are in millions except per share data, or as otherwise noted)
Note 6. Intangible Assets, Net
Intangible assets consisted of the following:
|
|
As of December 31,
|
Weighted-
average remaining useful life (In years) |
||||||||
|
|
2018
|
|
2017
|
|||||||
|
Developed technology
|
$
|
47.0
|
|
$
|
50.9
|
|
0.0
|
|||
|
Patents
|
13.0
|
|
13.0
|
|
8.1
|
|||||
|
Software
|
19.2
|
|
17.8
|
|
2.3
|
|||||
|
Assembled workforce in asset acquisitions
|
12.6
|
|
10.1
|
|
1.8
|
|||||
|
Licenses
|
4.6
|
|
4.6
|
|
2.4
|
|||||
|
Non-compete agreements, trademarks and other
|
4.0
|
|
4.0
|
|
6.1
|
|||||
|
Total intangibles
|
100.4
|
|
100.4
|
|
||||||
|
Accumulated amortization
|
(85.7
|
)
|
(83.4
|
)
|
||||||
|
Intangible assets, net
|
$
|
14.7
|
|
$
|
17.0
|
|
||||
Amortization expense was $
6.1
million,
$10.5 million
, and
$17.3 million
for the years ended December 31,
2018
,
2017
, and
2016
, respectively.
Expected future amortization expense for intangible assets as of December 31,
2018
, is as follows:
|
2019
|
$
|
4.7
|
|
|
2020
|
3.8
|
|
|
|
2021
|
1.5
|
|
|
|
2022
|
0.8
|
|
|
|
2023
|
0.8
|
|
|
|
Thereafter
|
3.1
|
|
|
|
Total
|
$
|
14.7
|
|
Note 7. Goodwill
Goodwill represents the excess of the purchase price in a business combination over the fair value of net tangible and intangible assets acquired. Goodwill amounts are not amortized, but tested for impairment on an annual basis. There was
no
impairment of goodwill as of December 31,
2018
and
2017
. Goodwill consisted of the following:
|
Balance at December 31, 2016
|
$
|
96.0
|
|
|
Effect of foreign currency translation
|
2.9
|
|
|
|
Balance at December 31, 2017
|
98.9
|
|
|
|
Effect of foreign currency translation
|
(2.4
|
)
|
|
|
Balance at December 31, 2018
|
$
|
96.5
|
|
86
DROPBOX, INC.
NOTES TO CONSOLIDATED FINANCIAL STATEMENTS
(Amounts in tables are in millions except per share data, or as otherwise noted)
Note 8. Accrued and Other Current Liabilities
Accrued and other current liabilities consisted of the following:
|
|
As of December 31,
|
|||||||
|
|
2018
|
2017
|
||||||
|
Non-income taxes payable
|
$
|
75.7
|
|
$
|
69.7
|
|
||
|
Accrued legal and other external fees
|
28.1
|
|
21.3
|
|
||||
|
Deferred rent
|
41.0
|
|
14.6
|
|
||||
|
Financing obligations, current
|
2.6
|
|
9.7
|
|
||||
|
Income taxes payable
|
0.3
|
|
0.4
|
|
||||
|
Other accrued and current liabilities
|
16.8
|
|
14.1
|
|
||||
|
Total accrued and other current liabilities
|
$
|
164.5
|
|
$
|
129.8
|
|
||
Deferred rent as of December 31,
2018
increased from December 31, 2017 primarily due to the amendment of the lease for the Company's current corporate headquarters and the shortening of its lease term in May 2018, as described further in Note 10, "Commitments and Contingencies". This lease modification resulted in a reclassification of deferred rent from deferred rent, non-current to accrued and other current liabilities, and is included in the deferred rent amount in the table above.
Note 9. Revolving Credit Agreement
In April 2017, the Company entered into an amended and restated credit and guaranty agreement which provided for a
$600.0 million
revolving loan facility (the “revolving credit facility”). In conjunction with the revolving credit facility, the Company paid upfront issuance fees of
$2.6 million
, which are being amortized over the
five
-year term of the agreement.
In February 2018, the Company amended its revolving credit facility to, among other things, permit the Company to make certain investments, enter into an unsecured standby letter of credit facility and increase its standby letter of credit sublimit to
$187.5 million
. The Company increased its borrowing capacity under the revolving credit facility from
$600.0 million
to
$725.0 million
. The Company may from time to time request increases in its borrowing capacity under the revolving credit facility of up to
$275.0 million
, provided no event of default has occurred or is continuing or would result from such increase. In conjunction with the amendment, the Company paid upfront issuance fees of
$0.4 million
, which are being amortized over the remaining term of the agreement.
Pursuant to the terms of the revolving credit facility, the Company may issue letters of credit under the revolving credit facility, which reduce the total amount available for borrowing. Pursuant to the terms of the revolving credit facility, the Company is required to pay an annual commitment fee that accrues at a rate of
0.20%
per annum on the unused portion of the borrowing commitments under the revolving credit facility. In addition, the Company is required to pay a fee in connection with letters of credit issued under the revolving credit facility, which accrues at a rate of
1.5%
per annum on the amount of such letters of credit outstanding. There is an additional fronting fee of
0.125%
per annum multiplied by the average aggregate daily maximum amount available under all letters of credit. Borrowings under the revolving credit facility bear interest, at the Company’s option, at an annual rate based on LIBOR plus a spread of
1.50%
or at an alternative base rate plus a spread of
0.50%
.
The revolving credit facility contains customary conditions to borrowing, events of default and covenants, including covenants that restrict the Company’s ability to incur indebtedness, grant liens, make distributions to holders of the Company or its subsidiaries’ equity interests, make investments, or engage in transactions with its affiliates. In addition, the revolving credit facility contains financial covenants, including a consolidated leverage ratio covenant and a minimum liquidity balance of
$100.0 million
, which includes any available borrowing capacity. The Company was in compliance with the covenants of the revolving credit facility as of December 31, 2018 and December 31, 2017, respectively.
87
DROPBOX, INC.
NOTES TO CONSOLIDATED FINANCIAL STATEMENTS
(Amounts in tables are in millions except per share data, or as otherwise noted)
The Company had an aggregate of
$68.5 million
of letters of credit outstanding under the revolving credit facility as of December 31, 2018, and the Company’s total available borrowing capacity under the revolving credit facility was
$656.5 million
as of December 31, 2018. The Company’s letters of credit expire between April of 2019 and April of 2022.
Note 10. Commitments and Contingencies
Leases
The Company has entered into various non-cancelable operating lease agreements for certain offices and datacenters with contractual lease periods expiring at various dates through 2033. The facility lease agreements generally provide for escalating rental payments and for options to renew, which could increase future minimum lease payments if exercised. The Company recognizes rent expense on a straight-line basis over the lease period and accounts for the difference between straight-line rent and actual lease payments as deferred rent.
Gross rent expense was $
85.9
million,
$71.0 million
,
$67.9 million
for the years ended December 31,
2018
,
2017
, and
2016
, respectively. Sublease income, which is recorded as a reduction of rental expense, was $
11.8
million,
$10.6 million
, and
$4.5 million
for the years ended December 31,
2018
,
2017
, and
2016
, respectively. Sublease income in excess of the Company’s original lease obligation is split with the original lessor per the terms of the sublease agreement, with the Company’s portion recorded to other income, net.
In 2018, the Company amended its lease agreement for its current corporate headquarters, modifying the original lease termination date from 2027 to 2019. As a result of the amendment, the Company expects to vacate its current corporate headquarters in August 2019, but is obligated to pay rent through February 2020. Accordingly, the Company's future operating lease commitments were reduced by
$192.4 million
.
As described in Note 1, "Description of the Business and Summary of Significant Accounting Policies”, the Company was considered the deemed owner of a floor in its previous corporate headquarters, for accounting purposes, as part of a build-to-suit lease agreement and initially recorded a building asset and an imputed financing obligation for its obligation to the legal owner in the amount of
$36.6 million
. As of December 31, 2017, the imputed financing obligation totaled
$27.4 million
, of which
$2.6 million
was classified within accrued and other current liabilities, and
$24.8 million
was classified within other non-current liabilities. In 2018, the Company terminated its master lease for its previous corporate headquarters. As the master lease was nearing expiration, the early termination did not have a material impact on the Company's future operating lease commitments.
In 2017, the Company entered into a new lease agreement for office space in San Francisco, California, to serve as its new corporate headquarters. The Company took initial possession of the first phase of its new corporate headquarters in June 2018 and began to recognize rent expense. The Company expects to start making recurring rental payments under the lease in the third quarter of 2019. Included in the operating lease commitments below are total expected minimum obligations under the lease agreement of
$831.6 million
, which exclude expected tenant improvement reimbursements from the landlord of approximately
$75.0 million
and variable operating expenses. The Company’s obligations under the lease are supported by a
$34.2 million
letter of credit, which reduced the borrowing capacity under the revolving credit facility.
Other Commitments
Other commitments include payments to third-party vendors for services related to the Company’s infrastructure, infrastructure warranty contracts, and asset retirement obligations for office modifications.
Future minimum payments under the Company’s non-cancelable leases, financing obligations, and other commitments as of December 31,
2018
, are as follows, and exclude non-cancelable rent payments from the Company’s sub-tenants:
88
DROPBOX, INC.
NOTES TO CONSOLIDATED FINANCIAL STATEMENTS
(Amounts in tables are in millions except per share data, or as otherwise noted)
|
Capital
lease
commitments
|
Operating
lease
commitments
(1)
|
Other
commitments
|
||||||||||
|
Year ended December 31:
|
||||||||||||
|
2019
|
$
|
82.4
|
|
$
|
96.4
|
|
$
|
57.0
|
|
|||
|
2020
|
45.3
|
|
106.2
|
|
37.2
|
|
||||||
|
2021
|
30.3
|
|
99.0
|
|
2.2
|
|
||||||
|
2022
|
17.4
|
|
92.9
|
|
—
|
|
||||||
|
2023
|
0.6
|
|
76.1
|
|
0.3
|
|
||||||
|
Thereafter
|
—
|
|
651.6
|
|
—
|
|
||||||
|
Future minimum payments
|
176.0
|
|
$
|
1,122.2
|
|
$
|
96.7
|
|
||||
|
Less interest and taxes
|
(12.3
|
)
|
||||||||||
|
Less current portion of the present value of minimum lease payments
|
(73.8
|
)
|
||||||||||
|
Capital lease obligations, net of current portion
|
$
|
89.9
|
|
|||||||||
|
(1)
|
Consists of future non-cancelable minimum rental payments under operating leases for the Company’s offices and datacenters, excluding rent payments from the Company’s sub-tenants and variable operating expenses. As of December 31,
2018
, the Company is entitled to non-cancelable rent payments from its sub-tenants of
$43.5 million
, which will be collected over the next five years.
|
Legal matters
From time to time, the Company is a party to a variety of claims, lawsuits, and proceedings which arise in the ordinary course of business, including claims of alleged infringement of intellectual property rights. The Company records a liability when it believes that it is probable that a loss will be incurred and the amount of loss or range of loss can be reasonably estimated. The Company discloses losses that are reasonably possible and when the amount of loss or range of loss can be reasonably estimated. In its opinion, resolution of pending matters is not likely to have a material adverse impact on its consolidated results of operations, cash flows, or its financial position. Given the unpredictable nature of legal proceedings, the Company bases its estimate on the information available at the time of the assessment. As additional information becomes available, the Company reassesses the potential liability and may revise the estimate.
Indemnification
The Company’s arrangements generally include certain provisions for indemnifying customers against liabilities if its products or services infringe a third party’s intellectual property rights. It is not possible to determine the maximum potential amount under these indemnification obligations due to the limited history of prior indemnification claims.
Note 11. Stockholders’ Equity
Common stock
The Company’s amended and restated certificate of incorporation authorizes the issuance of Class A common stock, Class B common stock, and Class C common stock. Holders of Class A common stock, Class B common stock, and Class C common stock are entitled to dividends on a pro rata basis, when, as, and if declared by the Company’s Board of Directors, subject to the rights of the holders of the Company’s preferred stock. Holders of Class A common stock are entitled to
one
vote per share, holders of Class B common stock are entitled to
10
votes per share, and holders of Class C common stock are entitled to
zero
votes per share. During the year ended
December 31, 2018
, holders of
157.0 million
shares of Class B common stock voluntarily converted their shares into an equivalent number of shares of Class A common stock.
As of December 31,
2018
, the Company had authorized
2,400.0 million
shares of Class A common stock,
475.0 million
shares of Class B common stock, and
800.0 million
shares of Class C common stock, each at par value of
$0.00001
. As
89
DROPBOX, INC.
NOTES TO CONSOLIDATED FINANCIAL STATEMENTS
(Amounts in tables are in millions except per share data, or as otherwise noted)
of December 31,
2018
,
211.0 million
shares of Class A common stock,
198.6 million
shares of Class B common stock, and
no
shares of Class C common stock were issued and outstanding. As of December 31,
2017
,
8.9 million
shares of Class A common stock,
187.9 million
shares of Class B common stock, and
no
shares of Class C common stock were issued and outstanding. Class A shares issued and outstanding as of December 31,
2018
and December 31,
2017
exclude
14.7 million
unvested restricted stock awards granted to the Company’s co-founders. See "Co-Founder Grants" section below for further details.
Convertible preferred stock
Immediately prior to the closing of the Company’s IPO, all of the
147.3 million
shares of convertible preferred stock converted into an equivalent number of shares of Class B common stock. Further, pursuant to transfer agreements with certain of the Company’s stockholders,
0.3 million
shares of the Company’s convertible preferred stock automatically converted into an equivalent number of shares of Class A common stock.
The authorized, issued and outstanding shares of convertible preferred stock and liquidation preferences as of December 31, 2017 were as follows:
|
Shares
|
Per share
price at issuance |
Aggregate
liquidation preference |
Dividend
per share amount |
||||||||||||
|
Authorized
|
Outstanding
|
||||||||||||||
|
Series A
|
63.9
|
63.9
|
$
|
0.09
|
|
$
|
6.0
|
|
$
|
0.02
|
|
||||
|
Series A-1
|
52.0
|
51.9
|
0.03
|
|
1.3
|
|
0.02
|
|
|||||||
|
Series B
|
19.5
|
19.5
|
13.58
|
|
264.8
|
|
1.08
|
|
|||||||
|
Series C
|
15.8
|
12.3
|
$
|
28.65
|
|
352.6
|
|
$
|
2.30
|
|
|||||
|
151.2
|
147.6
|
$
|
624.7
|
|
|||||||||||
Preferred stock
The Company's Board of Directors will have the authority, without further action by the Company's stockholders, to issue up to
240.0 million
shares of undesignated preferred stock with rights and preferences, including voting rights, designated from time to time by the Board of Directors.
Equity incentive plans
Under the 2018 Plan, the Company may grant stock-based awards to purchase or directly issue shares of common stock to employees, directors, and consultants. Options are granted at a price per share equal to the fair market value of the Company's common stock at the date of grant. Options granted are exercisable over a maximum term of
10 years
from the date of grant and generally vest over a period of
four
years.
No
options have been granted since August of 2015. RSUs and RSAs are also granted under the 2018 Plan. The 2018 Plan will terminate
10
years after the later of (i) its adoption or (ii) the most recent stockholder-approved increase in the number of shares reserved under the 2018 Plan, unless terminated earlier by the Company's Board of Directors. The 2018 Plan was adopted on March 22, 2018 with a reserve of
41.4 million
shares of Class A common stock for future issuance. As of December 31,
2018
, there were
26.3 million
stock-based awards issued and outstanding and
57.1 million
shares available for issuance under the 2008 Equity Incentive Plan, the 2017 Equity Incentive Plan, and the 2018 Plan (collectively, the "Plans").
90
DROPBOX, INC.
NOTES TO CONSOLIDATED FINANCIAL STATEMENTS
(Amounts in tables are in millions except per share data, or as otherwise noted)
Stock option and restricted stock activity for the Plans was as follows for the years ended December 31,
2018
,
2017
, and
2016
:
|
|
|
Options outstanding
|
Restricted stock
outstanding
|
|||||||||||||||
|
|
Number of
shares
available for
issuance
under the
Plans
|
Number of
shares
outstanding
under the
Plans
|
Weighted-
average
exercise
price
per share
|
Weighted-
average
remaining
contractual
term
(In years)
|
Number of
Plan
shares
outstanding
|
Weighted-
average
grant date
fair value
per share
|
||||||||||||
|
Balance at December 31, 2015
|
14.6
|
|
13.4
|
|
$
|
17.51
|
|
8.1
|
43.5
|
|
$
|
17.67
|
|
|||||
|
Options and RSUs canceled
|
14.1
|
|
(8.0
|
)
|
22.04
|
|
(6.1
|
)
|
20.06
|
|
||||||||
|
Restricted stock granted
|
(16.6
|
)
|
—
|
|
—
|
|
16.6
|
|
15.59
|
|
||||||||
|
Balance at December 31, 2016
|
12.1
|
|
5.4
|
|
$
|
10.68
|
|
6.5
|
54.0
|
|
$
|
16.41
|
|
|||||
|
Additional shares authorized
|
6.7
|
|
—
|
|
—
|
|
—
|
|
—
|
|
||||||||
|
Options exercised and RSUs released
|
—
|
|
(0.1
|
)
|
6.00
|
|
(14.6
|
)
|
17.12
|
|
||||||||
|
Options and RSUs canceled
|
6.2
|
|
(0.3
|
)
|
17.44
|
|
(6.0
|
)
|
17.96
|
|
||||||||
|
Shares repurchased for tax withholdings on release of restricted stock
|
5.5
|
|
—
|
|
—
|
|
—
|
|
17.09
|
|
||||||||
|
Restricted stock granted
|
(21.5
|
)
|
—
|
|
—
|
|
21.5
|
|
15.70
|
|
||||||||
|
Balance at December 31, 2017
|
9.0
|
|
5.0
|
|
$
|
10.52
|
|
5.5
|
54.9
|
|
$
|
15.60
|
|
|||||
|
Reserved for issuance under the 2018 Plan
|
41.4
|
|
—
|
|
$
|
—
|
|
—
|
|
$
|
—
|
|
||||||
|
Additional shares authorized
|
1.3
|
|
—
|
|
$
|
—
|
|
—
|
|
$
|
—
|
|
||||||
|
Options exercised and RSUs released
|
—
|
|
(3.4
|
)
|
$
|
7.75
|
|
(40.4
|
)
|
$
|
15.42
|
|
||||||
|
Options and RSUs canceled
|
6.0
|
|
(0.3
|
)
|
$
|
22.90
|
|
(5.7
|
)
|
$
|
16.78
|
|
||||||
|
Shares repurchased for tax withholdings on release of restricted stock
|
15.6
|
|
—
|
|
$
|
—
|
|
—
|
|
$
|
15.45
|
|
||||||
|
Restricted stock granted
|
(16.2
|
)
|
—
|
|
$
|
—
|
|
16.2
|
|
$
|
20.26
|
|
||||||
|
Balance at December 31, 2018
|
57.1
|
|
1.3
|
|
$
|
14.68
|
|
5.0
|
25.0
|
|
$
|
18.68
|
|
|||||
|
Vested at December 31, 2018
|
1.3
|
|
$
|
14.68
|
|
—
|
|
$
|
—
|
|
||||||||
|
Unvested at December 31, 2018
|
—
|
|
$
|
—
|
|
25.0
|
|
$
|
18.68
|
|
||||||||
The following table summarizes information about the pre-tax intrinsic value of options exercised and the weighted-average grant date fair value per share of options granted during the years ended December 31,
2018
,
2017
, and
2016
:
|
|
Year ended
December 31,
|
|||||||||||
|
|
2018
|
|
2017
|
|
2016
|
|||||||
|
Intrinsic value of options exercised
|
$
|
59.0
|
|
$
|
1.2
|
|
$
|
—
|
|
|||
As of December 31,
2018
, unamortized stock-based compensation expense related to unvested stock options, RSAs (excluding the Co-Founder Grants, which are non-Plan RSAs), and one-tier RSUs was
$429.0 million
. The weighted-average period over which such compensation expense will be recognized if the requisite service is provided is approximately
2.8
years as of December 31,
2018
.
91
DROPBOX, INC.
NOTES TO CONSOLIDATED FINANCIAL STATEMENTS
(Amounts in tables are in millions except per share data, or as otherwise noted)
The total fair value of RSUs, as of their respective vesting dates, during the years ended December 31, 2018, 2017 and 2016 were
$913.5 million
,
$232.5 million
, and
$77.2 million
, respectively.
Co-Founder Grants
In December 2017, the Board of Directors approved a grant to the Company’s co-founders of non-Plan RSAs with respect to
14.7 million
shares of Class A Common Stock in the aggregate (collectively, the “Co-Founder Grants”), of which
10.3 million
RSAs were granted to Mr. Houston, the Company’s co-founder and Chief Executive Officer, and
4.4 million
RSAs were granted to Mr. Ferdowsi, the Company’s co-founder and Director. These Co-Founder Grants have service-based, market-based, and performance-based vesting conditions. The Co-Founder Grants are excluded from Class A common stock issued and outstanding until the satisfaction of these vesting conditions. The Co-Founder Grants also provide the holders with certain stockholder rights, such as the right to vote the shares with the other holders of Class A common stock and a right to cumulative declared dividends. However, the Co-Founder Grants are not considered a participating security for purposes of calculating net loss per share attributable to common stockholders in Note 12, "Net Loss Per Share", as the right to the cumulative declared dividends is forfeitable if the service condition is not met.
The Co-Founder Grants are eligible to vest over the
ten
-year period following the date the Company’s shares of Class A common stock commenced trading on the Nasdaq Global Select Market in connection with the Company’s IPO. The Co-Founder Grants comprise
nine
tranches that are eligible to vest based on the achievement of stock price goals, each of which are referred to as a Stock Price Target, measured over a consecutive thirty-day trading period during the Performance Period. The Performance Period will begin on January 1, 2019.
During the first
four
years of the Performance Period, no more than
20%
of the shares subject to each Co-Founder Grant would be eligible to vest in any calendar year. After the first
four
years, all shares are eligible to vest based on the achievement of the Stock Price Targets.
The Company calculated the grant date fair value of the Co-Founder Grants based on multiple stock price paths developed through the use of a Monte Carlo simulation. A Monte Carlo simulation also calculates a derived service period for each of the
nine
vesting tranches, which is the measure of the expected time to achieve each Stock Price Target. A Monte Carlo simulation requires the use of various assumptions, including the underlying stock price, volatility, and the risk-free interest rate as of the valuation date, corresponding to the length of time remaining in the performance period, and expected dividend yield. The weighted-average grant date fair value of each Co-Founder Grant was estimated to be
$10.60
per share. The weighted-average derived service period of each Co-Founder Grant was estimated to be
5.2
years, and ranged from
2.9
-
6.9
years. The Company will recognize aggregate stock-based compensation expense of
$156.2 million
over the derived service period of each tranche using the accelerated attribution method as long as the co-founders satisfy their service-based vesting conditions. If the Stock Price Targets are met sooner than the derived service period, the Company will adjust its stock-based compensation to reflect the cumulative expense associated with the vested awards. The Company will recognize expense if the requisite service is provided, regardless of whether the market conditions are achieved.
The Performance Vesting Condition for the Co-Founder Grants was satisfied on the date the Company’s shares of Class A common stock commenced trading on the Nasdaq Global Select Market in connection with the Company’s IPO, which was March 23, 2018. The Company recognized
$37.0 million
in stock-based compensation related to the Co-Founder Grants during the year ended December 31,
2018
. As of December 31,
2018
, unamortized stock-based compensation expense related to the Co-Founder Grants was
$119.3 million
. The weighted-average period over which such compensation expense will be recognized if the requisite service is provided is approximately
4.0
years as of December 31,
2018
.
Award modifications
During the year ended December 31, 2017, the Company's Board of Directors voted to approve a modification of vesting schedules for certain unvested one-tier and two-tier RSUs to align the vesting schedules for all RSUs to vest once per quarter. The modification was effective February 15, 2018, which resulted in accelerated vesting of impacted RSUs that had met their service requirement as of that date. As a result, the Company recognized an incremental
$10.0 million
in stock-based compensation during the first quarter of 2018, which is included in the results for the year ended December 31, 2018, related to these modified one-tier and two-tier RSUs.
92
DROPBOX, INC.
NOTES TO CONSOLIDATED FINANCIAL STATEMENTS
(Amounts in tables are in millions except per share data, or as otherwise noted)
During the year ended December 31, 2016, the Company’s Board of Directors voted to approve the exchange of stock options previously granted to an executive officer under the Plan for one-tier RSUs. In total, options to purchase
4.3 million
shares of common stock were exchanged for
2.2 million
RSUs. Total compensation expense for the modified awards is
$37.7 million
, of which
$18.8 million
in stock-based compensation expense was recognized on the date of exchange representing the portion that vested immediately. Out of the total
$37.7 million
in stock-based compensation expense,
$8.9 million
was incremental to what would have been recognized related to the original stock option award. As of December 31,
2018
, there was
no
remaining unamortized expense relating to these awards.
Note 12. Net Loss Per Share
The Company computes net loss per share using the two-class method required for multiple classes of common stock and participating securities. The rights, including the liquidation and dividend rights, of the Class A common stock and Class B common stock are substantially identical, other than voting rights. Accordingly, the Class A common stock and Class B common stock share equally in the Company’s net losses. Before the IPO, the Company’s outstanding securities also included convertible preferred stock. The holders of convertible preferred stock did not have a contractual obligation to share in the Company’s losses, and as a result, net losses were not allocated to these securities.
The following table sets forth the calculation of basic and diluted net loss per share attributable to common stockholders during the periods presented. The shares issued in the IPO and the private placement and the shares of Class A and Class B common stock issued upon conversion of the outstanding shares of convertible preferred stock in the IPO are included in the table below weighted for the period outstanding in the year ended December 31, 2018. Additionally, the voluntary conversions of Class B common stock into Class A common stock are included in the table below weighted for the period outstanding in the year ended December 31, 2018:
|
|
Year ended December 31,
|
||||||||||||||||||||||
|
|
2018
|
2017
|
2016
|
||||||||||||||||||||
|
|
Class A
|
Class B
|
Class A
|
Class B
|
Class A
|
Class B
|
|||||||||||||||||
|
Numerator:
|
|||||||||||||||||||||||
|
Net loss attributable to common stockholders
|
$
|
(138.7
|
)
|
$
|
(346.2
|
)
|
$
|
(3.6
|
)
|
$
|
(108.1
|
)
|
$
|
(6.1
|
)
|
$
|
(204.1
|
)
|
|||||
|
Denominator:
|
|||||||||||||||||||||||
|
Weighted-average number of common shares outstanding used in computing basic and diluted net loss per common share
|
102.6
|
|
256.0
|
|
6.3
|
|
189.6
|
|
5.5
|
|
183.6
|
|
|||||||||||
|
Net loss per common share, basic and diluted
|
$
|
(1.35
|
)
|
$
|
(1.35
|
)
|
$
|
(0.57
|
)
|
$
|
(0.57
|
)
|
$
|
(1.11
|
)
|
$
|
(1.11
|
)
|
|||||
Since the Company was in a loss position for all periods presented, basic net loss per share attributable to common stockholders is the same as diluted net loss per share for all periods as the inclusion of all potential common shares outstanding would have been anti-dilutive. The weighted-average impact of potentially dilutive securities that were not included in the diluted per share calculations because they would be anti-dilutive were as follows:
|
|
Year ended December 31,
|
|||||||
|
|
2018
|
|
2017
|
|
2016
|
|||
|
Convertible preferred stock
|
—
|
|
147.6
|
|
147.6
|
|
||
|
Restricted stock units
|
35.0
|
|
52.7
|
|
47.9
|
|
||
|
Options to purchase shares of common stock
|
4.0
|
|
5.1
|
|
7.9
|
|
||
|
Co-Founder Grants
(1)
|
14.7
|
|
0.8
|
|
—
|
|
||
|
Shares subject to repurchase from early-exercised options and unvested restricted stock
|
0.1
|
|
0.2
|
|
0.9
|
|
||
|
Total
|
53.8
|
|
206.4
|
|
204.3
|
|
||
93
DROPBOX, INC.
NOTES TO CONSOLIDATED FINANCIAL STATEMENTS
(Amounts in tables are in millions except per share data, or as otherwise noted)
|
(1)
|
In December 2017, the Board of Directors approved a grant to the Company’s co-founders of non-Plan RSAs with respect to
14.7 million
shares of Class A Common Stock. The table above reflects the weighted-average impact for the period they were outstanding for the year ended December 31, 2017. See Note 11 "Stockholders' Equity" for further details.
|
Note 13. Income Taxes
For the years ended December 31,
2018
,
2017
, and
2016
the Company’s income (loss) from continuing operations before provision for income taxes was as follows:
|
|
Year ended December 31,
|
|||||||||||
|
|
2018
|
|
2017
|
|
2016
|
|||||||
|
Domestic
|
$
|
(497.1
|
)
|
$
|
(76.9
|
)
|
$
|
(94.4
|
)
|
|||
|
Foreign
|
17.0
|
|
(34.6
|
)
|
(110.6
|
)
|
||||||
|
Loss before income taxes
|
$
|
(480.1
|
)
|
$
|
(111.5
|
)
|
$
|
(205.0
|
)
|
|||
The components of the provision for income taxes in the years ended December 31,
2018
,
2017
, and
2016
were as follows:
|
|
Year ended December 31,
|
|||||||||||
|
|
2018
|
|
2017
|
|
2016
|
|||||||
|
Current:
|
||||||||||||
|
Federal
|
$
|
(0.1
|
)
|
$
|
0.1
|
|
$
|
(1.5
|
)
|
|||
|
State
|
(0.2
|
)
|
(0.3
|
)
|
(0.6
|
)
|
||||||
|
Foreign
|
(4.6
|
)
|
(2.3
|
)
|
(2.9
|
)
|
||||||
|
Deferred:
|
—
|
|
||||||||||
|
Federal
|
—
|
|
1.4
|
|
—
|
|
||||||
|
State
|
—
|
|
—
|
|
—
|
|
||||||
|
Foreign
|
0.1
|
|
0.9
|
|
(0.2
|
)
|
||||||
|
Provision for income taxes
|
$
|
(4.8
|
)
|
$
|
(0.2
|
)
|
$
|
(5.2
|
)
|
|||
Income tax benefit attributable to loss from continuing operations differed from the amounts computed by applying the statutory U.S. federal income tax rate of
21%
for 2018 and
34%
for 2017 and 2016 to pretax loss from continuing operations as a result of the following:
|
|
Year ended December 31,
|
|||||||||||
|
|
2018
|
|
2017
|
|
2016
|
|||||||
|
Tax benefit at federal statutory rate
|
$
|
100.8
|
|
$
|
37.9
|
|
$
|
69.7
|
|
|||
|
State taxes, net of federal benefit
|
10.7
|
|
1.7
|
|
2.2
|
|
||||||
|
Foreign rate differential
|
1.8
|
|
(12.3
|
)
|
(38.8
|
)
|
||||||
|
Research and other credits
|
86.5
|
|
25.4
|
|
12.6
|
|
||||||
|
Permanent differences
|
(18.4
|
)
|
(9.0
|
)
|
(3.5
|
)
|
||||||
|
Tax Cuts and Jobs Act impact
|
—
|
|
(61.7
|
)
|
—
|
|
||||||
|
Change in valuation allowance
|
(240.7
|
)
|
38.9
|
|
(40.7
|
)
|
||||||
|
Stock-based compensation
|
57.3
|
|
(20.1
|
)
|
(4.8
|
)
|
||||||
|
Other nondeductible items
|
(2.8
|
)
|
(1.0
|
)
|
(1.9
|
)
|
||||||
|
Provision for income taxes
|
$
|
(4.8
|
)
|
$
|
(0.2
|
)
|
$
|
(5.2
|
)
|
|||
94
DROPBOX, INC.
NOTES TO CONSOLIDATED FINANCIAL STATEMENTS
(Amounts in tables are in millions except per share data, or as otherwise noted)
The significant components of the Company’s deferred tax assets and liabilities as of December 31,
2018
and
2017
were as follows:
|
|
As of December 31,
|
|||||||
|
|
2018
|
2017
|
||||||
|
Deferred tax assets:
|
||||||||
|
Net operating loss carryforwards
|
$
|
264.8
|
|
$
|
119.6
|
|
||
|
Research credit carryforwards
|
157.3
|
|
67.9
|
|
||||
|
Stock-based compensation
|
11.1
|
|
20.0
|
|
||||
|
Accruals and reserves
|
42.0
|
|
34.0
|
|
||||
|
Fixed assets and intangible assets
|
0.7
|
|
—
|
|
||||
|
Other
|
1.1
|
|
—
|
|
||||
|
Gross deferred tax assets
|
477.0
|
|
241.5
|
|
||||
|
Valuation allowance
|
(476.0
|
)
|
(233.7
|
)
|
||||
|
Total deferred tax assets, net of valuation allowance
|
1.0
|
|
7.8
|
|
||||
|
Deferred tax liabilities:
|
||||||||
|
Fixed assets and intangible assets
|
—
|
|
6.6
|
|
||||
|
Other
|
—
|
|
0.4
|
|
||||
|
Total deferred tax liability
|
—
|
|
7.0
|
|
||||
|
Net deferred tax assets
|
$
|
1.0
|
|
$
|
0.8
|
|
||
For the years ended December 31,
2018
and
2017
, based on all available objective evidence, including the existence of cumulative losses, the Company determined that it was not more likely than not that the U.S., Ireland, and Israel net deferred tax assets were fully realizable as of December 31,
2018
and
2017
. Accordingly, the Company established a full valuation allowance against its U.S. and Ireland deferred tax assets and a partial valuation allowance against its Israeli deferred tax assets.
As of December 31,
2018
, the Company had
$923.6 million
of federal,
$403.5 million
of state, and
$288.0 million
of foreign net operating loss carryforwards available to reduce future taxable income. Of the federal net operating loss carryforwards,
$307.4 million
will begin to expire in 2031 and
$616.2 million
will carryforward indefinitely, while state net operating losses begin to expire in 2029.
As of December 31,
2018
, the Company had research credit carryforwards of
$145.0 million
and
$76.8 million
for federal and state income tax purposes, respectively, of which
$36.1 million
and
$19.1 million
is the unrecognized tax benefit portion related to the research credit carryforwards for federal and state, respectively. The federal credit carryforward will begin to expire in 2027. The state research credits have no expiration date. The Company also had
$3.7 million
of state enterprise zone credit carryforwards, which will begin to expire in 2023.
As of December 31,
2018
, the Company also had
$265.1 million
of foreign net operating loss carryforwards available to reduce future taxable income, which will carryforward indefinitely. In addition, the Company had
$22.9 million
of foreign acquired net operating losses, which will carryforward indefinitely.
Under Section 382 and 383 of the Internal Revenue Code of 1986, as amended, or the Code, if a corporation undergoes an “ownership change,” the corporation’s ability to use its pre-change net operating loss carryforwards and other pre-change attributes, such as research tax credits, to offset its post-change income may be limited. In general, an “ownership change” will occur if there is a cumulative change in our ownership by “5-percent shareholders” that exceeds
50 percentage
points over a rolling
three
-year period. Similar rules may apply under state tax laws. The Company performed a study for the period through December 31,
2018
, and determined that
no
ownership changes exceeding 50 percentage points have occurred. The Company’s ability to use net operating loss and tax credit carryforwards to reduce future taxable income and liabilities may be subject to annual limitations as a result of ownership changes from January 1, 2019, and subsequent years.
95
DROPBOX, INC.
NOTES TO CONSOLIDATED FINANCIAL STATEMENTS
(Amounts in tables are in millions except per share data, or as otherwise noted)
As of December 31,
2018
, the balance of unrecognized tax benefits was
$59.8 million
of which
$4.5 million
, if recognized, would affect the effective tax rate and
$55.3 million
would result in adjustment to deferred tax assets with corresponding adjustments to the valuation allowance.
A reconciliation of the beginning and ending amount of unrecognized tax benefit is as follows:
|
|
Year ended December 31,
|
|||||||||||
|
|
2018
|
|
2017
|
|
2016
|
|||||||
|
Balance of gross unrecognized tax benefits at the beginning of the fiscal year
|
$
|
25.6
|
|
$
|
15.7
|
|
$
|
7.9
|
|
|||
|
Gross increases related to prior period tax positions
|
1.1
|
|
—
|
|
2.2
|
|
||||||
|
Gross increases related to current period tax positions
|
33.1
|
|
9.9
|
|
5.6
|
|
||||||
|
Balance of gross unrecognized tax benefits at the end of the fiscal year
|
$
|
59.8
|
|
$
|
25.6
|
|
$
|
15.7
|
|
|||
The Company recognizes interest and/or penalties related to income tax matters as a component of income tax expense. As of December 31,
2018
, the amount of accrued interest and penalties related to uncertain tax positions was
$1.3 million
. Interest and penalties recognized for the year ended December 31,
2018
,
2017
, and 2016 was
$0.7 million
,
$0.2 million
, and
$0.4 million
respectively.
The Company files income tax returns in the U.S. federal, multiple states, and foreign jurisdictions. All of the Company’s tax years from 2007 remain open for examination by the federal and state authorities, and from 2013 by foreign authorities.
The Company generally does not provide deferred income taxes for the undistributed earnings of its foreign subsidiaries as the Company intends to reinvest such earnings indefinitely. Should circumstances change and it becomes apparent that some or all of the undistributed earnings will no longer be indefinitely reinvested, the Company will accrue for income taxes not previously recognized. As of December 31,
2018
, there were no cumulative undistributed earnings in its Irish subsidiary and, as a result, there were no unrecorded deferred tax liabilities. The amount of undistributed earnings in the Company’s other foreign subsidiaries, if any, are immaterial.
Impact of the Tax Cuts and Jobs Act
The Tax Cuts and Jobs Act (the “Tax Reform Act”) was enacted on December 22, 2017 and provides for significant changes to U.S. tax law. Among other provisions, the Tax Reform Act reduces the U.S. corporate income tax rate to 21% effective in 2018. The Tax Reform Act also contains a number of provisions that may impact the Company in future years. At December 31, 2017, the Company had not completed its accounting for all of the enactment-date income tax effects of the Tax Reform Act for remeasurement of deferred tax assets and liabilities, one-time transition tax, and tax on global intangible low-taxed income. During the twelve months ended December 31, 2018 the Company completed the accounting for all of the enactment-date income tax effects of the Tax Reform Act. Upon completing the analysis, the Company has recognized no material adjustments to its provisional amounts recorded for the year ended December 31, 2017.
The Company will continue to monitor ongoing guidance in this area, as the U.S. Treasury Department, the IRS, and other standard-setting bodies could interpret or issue guidance on how provisions of the Tax Reform Act will be applied or otherwise administered that is different from the Company’s interpretation.
As a result of the reduction in the corporate rate, the Company has remeasured its U.S. deferred tax assets and liabilities as of December 31, 2017 to reflect the lower rate expected to apply when these temporary differences reverse. As of December 31, 2017, the Company determined the remeasurement resulted in a reduction in deferred tax assets of
$63.1 million
, which was fully offset by a corresponding change to the Company’s valuation allowance. There were no material changes from provisional amounts recorded for the year ended December 31, 2017.
The Tax Reform Act repealed the corporate alternative minimum tax (“AMT”) effective beginning in 2018 and permits AMT credit carryforwards to be refunded to the extent unused through 2021. Since the Company does not anticipate the use of these credits to reduce future federal taxes, it recognized an income tax benefit and established an income tax receivable to
96
DROPBOX, INC.
NOTES TO CONSOLIDATED FINANCIAL STATEMENTS
(Amounts in tables are in millions except per share data, or as otherwise noted)
reflect anticipated refunds of
$1.4 million
for its 2016 AMT credit carryforward during the year ended December 31, 2017. There were no material changes from provisional amounts recorded for the year ended December 31, 2017.
The Tax Reform Act also provides for a transition to a new territorial system of taxation and generally requires companies to include certain untaxed foreign earnings of non-U.S. subsidiaries into taxable income in 2017 (“Transition Tax”). As a result of the cumulative deficits in the Company’s foreign subsidiaries, the Company has
no
Transition Tax inclusion.
The Tax Reform Act subjects a US shareholder to current tax on global intangible low-taxed income (GILTI) earned by certain foreign subsidiaries. The FASB Staff Q&A, Topic 740 No. 5, Accounting for Global Intangible Low-Taxed Income, states that an entity can make an accounting policy election to either recognize deferred taxes for temporary differences expected to reverse as GILTI in future years or provide for the tax expense related to GILTI in the year the tax is incurred. The Company has elected to recognize the tax on GILTI as a period expense in the period the tax is incurred. As a result of the tested losses in its foreign subsidiaries, under GILTI regulations, the Company has no GILTI inclusion for the year ended 2018.
Note 14. Related Party Transactions
Dropbox Charitable Foundation
During the year ended December 31, 2016,
two
of the Company’s controlling shareholders formed the Dropbox Charitable Foundation, a Delaware non-stock corporation (the “Foundation”). The primary purpose of the Foundation is to engage in charitable and educational activities within the meaning of Section 501(c)(3) of the Code. The Foundation is governed by a Board of Directors, a majority of which are independent. Both shareholders made contributions to the Foundation during the year ended December 31, 2016, comprised entirely of shares of Dropbox common stock. The Company has not consolidated the Foundation in the accompanying consolidated financial statements, as the Company does not have control of the entity.
During the year ended
December 31, 2018
, the Company did
not
make cash contributions to the Foundation. During the year ended December 31, 2017, the Company donated shares of Class B common stock to initially fund the Foundation and recorded
$9.4 million
of expense to general and administrative expenses based on the Company’s estimate of the then current fair value of the contributed shares. The Company made additional cash contributions to the Foundation of
$1.9 million
during year ended December 31, 2017.
Hewlett Packard Enterprise
The Company has engaged in various commercial relationships with Hewlett Packard Enterprise (“HPE”), whose former chief executive officer was appointed to the Dropbox Board of Directors in September 2017. These commercial relationships include infrastructure equipment under capital leases, the purchase of commercial products and other services, and a multi-year subscription agreement for access to the Dropbox platform. The chief executive officer of HPE resigned from her position at HPE effective February 1, 2018.
From the beginning of fiscal 2018 through the date of the resignation of the former chief executive officer of HPE, the Company made payments of
$5.5 million
for infrastructure equipment under capital leases and for commercial products and services provided by HPE.
From the date of appointment of HPE’s chief executive officer to the Dropbox Board of Directors through December 31, 2017, the Company made payments of
$18.4 million
for infrastructure equipment under capital leases and for commercial products and services provided by HPE. As of December 31, 2017, the Company had a remaining obligation of
$87.1 million
for equipment under capital lease from HPE. Related to the multi-year subscription agreement, the Company recognized an immaterial amount of revenue from the date of appointment of HPE’s former chief executive officer to the Dropbox Board of Directors through December 31, 2017, and had an immaterial balance of deferred revenue and outstanding trade receivables as of December 31, 2017.
Note 15. Geographic Areas
Long-lived assets
The following table sets forth long-lived assets by geographic area:
|
|
As of December 31,
|
|||||||
|
|
2018
|
2017
|
||||||
|
United States
|
$
|
293.6
|
|
$
|
323.7
|
|
||
|
International
(1)
|
17.0
|
|
18.2
|
|
||||
|
Total property and equipment, net
|
$
|
310.6
|
|
$
|
341.9
|
|
||
|
(1)
|
No single country other than the United States had a property and equipment balance greater than 10% of total property and equipment, net, as of December 31,
2018
and
2017
.
|
Revenue
Revenue by geography is generally based on the address of the customer as defined in the Company’s subscription agreement. The following table sets forth revenue by geographic area for the years ended December 31,
2018
,
2017
, and
2016
:
|
|
Year ended December 31,
|
||||||||||
|
|
2018
|
|
2017
|
2016
|
|||||||
|
United States
|
$
|
706.5
|
|
$
|
575.7
|
|
$
|
455.9
|
|
||
|
International
(1)
|
685.2
|
|
531.1
|
|
388.9
|
|
|||||
|
Total revenue
|
$
|
1,391.7
|
|
$
|
1,106.8
|
|
$
|
844.8
|
|
||
|
(1)
|
No single country outside of the United States accounted for more than 10 percent of total revenue during the years ended December 31,
2018
,
2017
, and
2016
|
Note 16. Subsequent Events
On February 8, 2019, the Company acquired all outstanding stock of HelloSign, Inc. ("HelloSign"), which provides an e-signature and document workflow platform. The preliminary purchase consideration is estimated to be approximately
$230 million
, consisting primarily of cash payments. Of the
$230 million
of consideration,
$48.5 million
is subject to on-going employee service. The related expense will be recognized over the required service period of up to
three
years, while the related payments will begin in the first quarter of 2020 if the requisite service is provided.
The purchase price will be allocated to the tangible and intangible assets and liabilities acquired based on their fair values at the acquisition date. The Company is currently performing the procedures necessary to determine the purchase price allocation, and the Company will record the initial fair value estimates during the three months ending March 31, 2019.
ITEM 9. CHANGES IN AND DISAGREEMENTS WITH ACCOUNTANTS ON ACCOUNTING AND FINANCIAL DISCLOSURE
None.
ITEM 9A. CONTROLS AND PROCEDURES
Evaluation of Disclosure Controls and Procedures
97
Our Management, with the participation of our principal executive officer and principal financial officer, has evaluated the effectiveness of our disclosure controls and procedures (as defined in Rules 13a-15(e) and 15d-15(e) under the Securities Exchange Act of 1934, as amended (the “Exchange Act”)), as of the end of the period covered by this Annual Report on Form 10-K. Based on such evaluation, our principal executive officer and principal financial officer have concluded that as of such date, our disclosure controls and procedures were effective at a reasonable assurance level.
Management's Report on Internal Control Over Financial Reporting
This Annual Report on Form 10-K does not include a report of management's assessment regarding internal control over financial reporting or an attestation report of our independent registered public accounting firm as permitted in this transition period under the rules of the SEC for newly public companies.
Changes in Internal Control Over Financial Reporting
There was no change in our internal control over financial reporting (as defined in Rules 13a-15(d) and 15d-15(d) under the Exchange Act) that occurred during the period covered by this Annual Report on Form 10-K that has materially affected, or is reasonably likely to materially affect, our internal control over financial reporting.
Inherent Limitations on Effectiveness of Disclosure Controls and Procedures
Our management, including our principal executive officer and principal financial officer, do not expect that our disclosure controls and procedures or our internal control over financial reporting will prevent all errors and all fraud. A control system, no matter how well designed and operated, can provide only reasonable, not absolute, assurance that the objectives of the control system are met. Further, the design of a control system must reflect the fact that there are resource constraints, and the benefits of controls must be considered relative to their costs. Because of the inherent limitations in all control systems, no evaluation of controls can provide absolute assurance that all control issues and instances of fraud, if any, have been detected. These inherent limitations include the realities that judgments in decision-making can be faulty, and that breakdowns can occur because of a simple error or mistake. Additionally, controls can be circumvented by the individual acts of some persons, by collusion of two or more people or by management override of the controls. The design of any system of controls is also based in part upon certain assumptions about the likelihood of future events, and there can be no assurance that any design will succeed in achieving its stated goals under all potential future conditions; over time, controls may become inadequate because of changes in conditions, or the degree of compliance with policies or procedures may deteriorate. Due to inherent limitations in a cost-effective control system, misstatements due to error or fraud may occur and not be detected.
ITEM 9B. OTHER INFORMATION
Not applicable.
PART III
ITEM 10. DIRECTORS, EXECUTIVE OFFICERS AND CORPORATE GOVERNANCE
The information required by this item is incorporated by reference to our Proxy Statement relating to our 2019 Meeting of Stockholders. The Proxy Statement will be filed with the Securities and Exchange Commission within 120 days of the end of the fiscal year ended December 31, 2018.
Code of Conduct
We maintain a Code of Conduct that incorporates our code of ethics applicable to all employees, including all officers. Our Code of Conduct is published on the Investor Relations website at investors.dropbox.com under "Corporate Governance". We intend to satisfy the disclosure requirement under Item 5.05 of Form 8-K regarding amendments to, or waiver from, a provision of our Code of Conduct by posting such information on the website address and location specified above.
ITEM 11. EXECUTIVE COMPENSATION
The information required by this item is incorporated by reference to our Proxy Statement relating to our 2019 Meeting of Stockholders. The Proxy Statement will be filed with the Securities and Exchange Commission within 120 days of the end of the fiscal year ended December 31, 2018.
98
ITEM 12. SECURITY OWNERSHIP OF CERTAIN BENEFICIAL OWNERS AND MANAGEMENT AND RELATED STOCKHOLDER MATTERS
The information required by this item is incorporated by reference to our Proxy Statement relating to our 2019 Meeting of Stockholders. The Proxy Statement will be filed with the Securities and Exchange Commission within 120 days of the end of the fiscal year ended December 31, 2018.
ITEM 13. CERTAIN RELATIONSHIPS AND RELATED PARTY TRANSACTIONS, AND DIRECTOR INDEPENDENCE
The information required by this item is incorporated by reference to our Proxy Statement relating to our 2019 Meeting of Stockholders. The Proxy Statement will be filed with the Securities and Exchange Commission within 120 days of the end of the fiscal year ended December 31, 2018.
ITEM 14. PRINCIPAL ACCOUNTING FEES AND SERVICES
The information required by this item is incorporated by reference to our Proxy Statement relating to our 2019 Meeting of Stockholders. The Proxy Statement will be filed with the Securities and Exchange Commission within 120 days of the end of the fiscal year ended December 31, 2018.
PART IV
ITEM 15. EXHIBITS AND FINANCIAL STATEMENT SCHEDULES.
The following documents are filed as a part of this Annual Report on Form 10-K
|
(a)
|
Financial statements
|
Our Consolidated Financial Statements are listed in the “Index to Consolidated Financial Statements” under Part II, Item 8 of this Annual Report on Form 10-K.
|
(b)
|
Financial statement schedules.
|
All financial statement schedules not listed above have been omitted because the information called for is not required or is shown either in the consolidated financial statements or in the notes thereto.
|
(c)
|
Exhibits
|
The documents listed in the Exhibit Index of this Annual Report on Form 10-K are incorporated by reference or are filed with this Annual Report on Form 10-K, in each case as indicated therein (numbered in accordance with Item 601 of Regulation S-K).
99
EXHIBIT INDEX
|
Form
|
File Number
|
Exhibit
|
Filed with SEC
|
|||||||
|
Exhibit
Number
|
|
Description
|
||||||||
|
3.1
|
|
S-1/A
|
333-223182
|
3.4
|
March 12, 2018
|
|||||
|
3.2
|
|
10-Q
|
001-38434
|
3.2
|
May 11, 2018
|
|||||
|
3.3
|
|
10-Q
|
001-38434
|
3.3
|
May 11, 2018
|
|||||
|
4.1
|
|
S-1/A
|
333-223182
|
4.1
|
March 12, 2018
|
|||||
|
4.2
|
|
S-1
|
333-223182
|
4.2
|
February 23, 2018
|
|||||
|
4.3
|
|
10-Q
|
001-38434
|
4.3
|
May 11, 2018
|
|||||
|
10.1+
|
|
S-1
|
333-223182
|
10.1
|
February 23, 2018
|
|||||
|
10.2+
|
|
S-1/A
|
333-223182
|
10.2
|
March 21, 2018
|
|||||
|
10.3+
|
|
S-1/A
|
333-223182
|
10.3
|
March 21, 2018
|
|||||
|
10.4+
|
|
S-1/A
|
333-223182
|
10.4
|
March 21, 2018
|
|||||
|
10.5+
|
|
S-1/A
|
333-223182
|
10.5
|
March 21, 2018
|
|||||
|
10.6+
|
|
S-1/A
|
333-223182
|
10.6
|
March 21, 2018
|
|||||
|
10.7+
|
|
S-1/A
|
333-223182
|
10.7
|
March 21, 2018
|
|||||
|
10.8+
|
|
S-1
|
333-223182
|
10.8
|
February 23, 2018
|
|||||
|
10.9+
|
|
S-1
|
333-223182
|
10.9
|
February 23, 2018
|
|||||
|
10.10+
|
|
S-1
|
333-223182
|
10.10
|
February 23, 2018
|
|||||
100
|
Form
|
File Number
|
Exhibit
|
Filed with SEC
|
|||||||
|
10.11+
|
|
S-1
|
333-223182
|
10.11
|
February 23, 2018
|
|||||
|
10.12+
|
|
S-1/A
|
333-223182
|
10.12
|
March 12, 2018
|
|||||
|
10.13+
|
|
S-1/A
|
333-223182
|
10.13
|
March 12, 2018
|
|||||
|
10.14+
|
|
S-1/A
|
333-223182
|
10.14
|
March 12, 2018
|
|||||
|
10.15
|
|
S-1
|
333-223182
|
10.15
|
February 23, 2018
|
|||||
|
10.16
|
|
S-1
|
333-223182
|
10.16
|
February 23, 2018
|
|||||
|
10.17
|
|
S-1
|
333-223182
|
10.17
|
February 23, 2018
|
|||||
|
10.18
|
|
S-1
|
333-223182
|
10.18
|
February 23, 2018
|
|||||
|
10.19
|
|
10-Q
|
001-38434
|
10.1
|
August 10, 2018
|
|||||
|
10.20
|
|
S-1
|
333-223182
|
10.19
|
February 23, 2018
|
|||||
|
10.21
|
|
10-Q
|
001-38434
|
10.2
|
August 10, 2018
|
|||||
|
10.22
|
|
S-1
|
333-223182
|
10.20
|
February 23, 2018
|
|||||
|
10.23
|
|
S-1
|
333-223182
|
10.21
|
February 23, 2018
|
|||||
|
10.24
|
|
S-1/A
|
333-223182
|
10.22
|
March 12, 2018
|
|||||
|
10.25+
|
|
S-1/A
|
333-223182
|
10.23
|
March 12, 2018
|
|||||
|
21.1
|
|
S-1
|
333-223182
|
21.1
|
February 23, 2018
|
|||||
101
|
Form
|
File Number
|
Exhibit
|
Filed with SEC
|
|||||||
|
23.1*
|
||||||||||
|
24.1*
|
||||||||||
|
31.1*
|
||||||||||
|
31.2*
|
||||||||||
|
32.1†
|
||||||||||
|
101.INS*
|
XBRL Instance Document.
|
|||||||||
|
101.SCH*
|
XBRL Taxonomy Extension Schema Document.
|
|||||||||
|
101.CAL*
|
XBRL Taxonomy Extension Calculation Linkbase Document.
|
|||||||||
|
101.DEF*
|
XBRL Taxonomy Extension Definition Linkbase Document.
|
|||||||||
|
101.LAB*
|
XBRL Taxonomy Extension Label Linkbase Document.
|
|||||||||
|
101.PRE*
|
XBRL Taxonomy Extension Presentation Linkbase Document.
|
|||||||||
|
*
|
Filed herewith.
|
|
+
|
Indicates management contract or compensatory plan.
|
|
†
|
The certifications attached as Exhibit 32.1 that accompany this Annual Report on Form 10-K are deemed furnished and not filed with the Securities and Exchange Commission and are not to be incorporated by reference into any filing of Dropbox, Inc. under the Securities Act of 1933, as amended, or the Securities Exchange Act of 1934, as amended, whether made before or after the date of this Annual Report on Form 10-K, irrespective of any general incorporation language contained in such filing.
|
102
ITEM 16. FORM 10-K SUMMARY
None.
SIGNATURES
Pursuant to the requirements of Section 13 or 15(d) of the Securities Exchange Act of 1934, as amended, the registrant has duly caused this Annual Report on Form 10-K to be signed on its behalf by the undersigned, thereunto duly authorized, in San Francisco, California, on
February 22, 2019
.
|
DROPBOX, INC.
|
||
|
By:
|
|
/s/ Andrew W. Houston
|
|
|
Andrew W. Houston
|
|
|
|
Chief Executive Officer
|
|
POWER OF ATTORNEY
KNOW ALL PERSONS BY THESE PRESENTS, that each person whose signature appears below constitutes and appoints Andrew W. Houston and Ajay V. Vashee, and each of them, as his or her true and lawful attorney-in-fact and agent with full power of substitution and resubstitution, for such individual in any and all capacities, to sign any and all amendments to this Annual Report on Form 10-K, and to file the same, with all exhibits thereto and other documents in connection therewith, with the Securities and Exchange Commission, granting unto said attorneys-in-fact and agents, and each of them, full power and authority to do and perform each and every act and thing requisite and necessary to be done in connection therewith, as fully for all intents and purposes as he or she might or could do in person, hereby ratifying and confirming all that said attorneys-in-fact and agents, or any of them, or the individual’s substitute, may lawfully do or cause to be done by virtue hereof.
Pursuant to the requirements of the Securities Exchange Act of 1934, as amended, this report has been signed by the following persons on behalf of the Company and in the capacities and on the dates indicated.
103
|
Signature
|
|
Title
|
|
Date
|
|
/s/ Andrew W. Houston
Andrew W. Houston
|
|
Chief Executive Officer and Chairman
(Principal Executive Officer)
|
|
February 22, 2019
|
|
/s/ Ajay V. Vashee
Ajay V. Vashee
|
|
Chief Financial Officer
(Principal Financial Officer)
|
|
February 22, 2019
|
|
/s/ Timothy J. Regan
Timothy J. Regan
|
|
Chief Accounting Officer
(Principal Accounting Officer)
|
|
February 22, 2019
|
|
/s/ Donald W. Blair
Donald W. Blair
|
|
Director
|
|
February 22, 2019
|
|
/s/ Arash Ferdowsi
Arash Ferdowsi
|
|
Director
|
|
February 22, 2019
|
|
/s/ Paul E. Jacobs
Paul E. Jacobs
|
|
Director
|
|
February 22, 2019
|
|
/s/ Robert J. Mylod Jr.
Robert J. Mylod, Jr.
|
|
Director
|
|
February 22, 2019
|
|
/s/ Condoleezza Rice
Condoleezza Rice
|
|
Director
|
|
February 22, 2019
|
|
/s/ R. Bryan Schreier
R. Bryan Schreier
|
|
Director
|
|
February 22, 2019
|
|
/s/ Margaret C. Whitman
Margaret C. Whitman
|
|
Director
|
|
February 22, 2019
|
104
TABLE OF CONTENTS
Part IItem 1. BusinessItem 1A. Risk FactorsItem 1B. Uresolved Staff CommentsItem 2. PropertiesItem 3. Legal ProceedingsItem 4. Mine Safety DisclosuresPart IIItem 5. Market For Registrant S Common Equity, Related Stockholder Matters and Issuer Purchases Of Equity SecuritiesItem 6. Selected Consolidated Financial and Other DataItem 7. Management S Discussion and Analysis Of Financial Condition and Results Of OperationsItem 7A. Quantitative and Qualitative Disclosures About Market RiskItem 8. Financial Statements and Supplementary DataNote 1. Description Of The Business and Summary Of Significant Accounting PoliciesNote 2. Cash, Cash Equivalents and Short-term InvestmentsNote 3. Fair Value MeasurementsNote 4. Property and Equipment, NetNote 5. Business CombinationsNote 6. Intangible Assets, NetNote 7. GoodwillNote 8. Accrued and Other Current LiabilitiesNote 9. Revolving Credit AgreementNote 10. Commitments and ContingenciesNote 11. Stockholders EquityNote 12. Net Loss Per ShareNote 13. Income TaxesNote 14. Related Party TransactionsNote 15. Geographic AreasNote 16. Subsequent EventsItem 9. Changes in and Disagreements with Accountants on Accounting and Financial DisclosureItem 9A. Controls and ProceduresItem 9B. Other InformationPart IIIItem 10. Directors, Executive Officers and Corporate GovernanceItem 11. Executive CompensationItem 12. Security Ownership Of Certain Beneficial Owners and Management and Related Stockholder MattersItem 13. Certain Relationships and Related Party Transactions, and Director IndependenceItem 14. Principal Accounting Fees and ServicesPart IVItem 15. Exhibits and Financial Statement SchedulesItem 16. Form 10-k Summary