DUCOMMUN INC /DE/
10-Ks and 10-Qs
|
|
|
|
|
|
|
|
|
|
|
|
|
|
|
|
|
|
|
|
|
|
|
|
|
|
|
|
|
|
|
|
|
|
|
|
|
|
|
|
|
|
|
|
|
|
|
|
|
|
|
|
|
|
|
|
UNITED STATES
SECURITIES AND EXCHANGE COMMISSION
Washington, D.C. 20549
_________________________________________________________
FORM 10-K
_________________________________________________________
|
x
|
ANNUAL REPORT PURSUANT TO SECTION 13 OR 15(d) OF THE SECURITIES EXCHANGE ACT OF 1934
|
For the fiscal year ended
December 31, 2017
OR
|
¨
|
TRANSITION REPORT PURSUANT TO SECTION 13 OR 15(d) OF THE SECURITIES EXCHANGE ACT OF 1934
|
For the transition period from
to
Commission File Number 1-8174
_________________________________________________________
DUCOMMUN INCORPORATED
(Exact name of registrant as specified in its charter)
_________________________________________________________
|
Delaware
|
|
95-0693330
|
|
(State or other jurisdiction of
incorporation or organization)
|
|
(I.R.S. Employer
Identification No.)
|
|
200 Sandpointe Avenue, Suite 700, Santa Ana, California
|
|
92707-5759
|
|
(Address of principal executive offices)
|
|
(Zip code)
|
Registrant’s telephone number, including area code: (657) 335-3665
Securities registered pursuant to Section 12(b) of the Act:
|
Title of each class
|
|
Name of each exchange on which registered
|
|
Common Stock, $.01 par value per share
|
|
New York Stock Exchange
|
Securities registered pursuant to Section 12(g) of the Act:
None
(Title of class)
_________________________________________________________
Indicate by check mark if the registrant is a well-known seasoned issuer, as defined in Rule 405 of the Securities Act. Yes
¨
No
x
Indicate by check mark if the registrant is not required to file reports pursuant to Section 13 or Section 15(d) of the Act. Yes
¨
No
x
Indicate by check mark whether the registrant (1) has filed all reports required to be filed by Section 13 or 15(d) of the Securities Exchange Act of 1934 during the preceding 12 months (or for such shorter period that the registrant was required to file such reports), and (2) has been subject to such filing requirements for the past 90 days. Yes
x
No
¨
Indicate by check mark whether the registrant has submitted electronically and posted on its corporate Web site, if any, every Interactive Data File required to be submitted and posted pursuant to Rule 405 of Regulation S-T (§232.405 of this chapter) during the preceding 12 months (or for such shorter period that the registrant was required to submit and post such files). Yes
x
No
¨
Indicate by check mark if disclosure of delinquent filers pursuant to Item 405 of Regulation S-K (§229.405 of this chapter) is not contained herein, and will not be contained, to the best of registrant’s knowledge, in definitive proxy or information statements incorporated by reference in Part III of this Form 10-K or any amendment to this Form 10-K.
¨
Indicate by check mark whether the registrant is a large accelerated filer, an accelerated filer, a non-accelerated filer or a smaller reporting company. See the definitions of “large accelerated filer,” “accelerated filer,” “smaller reporting company,” and “emerging growth company” in Rule 12b-2 of the Exchange Act.
|
Large accelerated filer
|
|
¨
|
Accelerated filer
|
|
x
|
|
Non-accelerated filer
|
|
¨
|
Smaller reporting company
|
|
¨
|
|
Emerging growth company
|
¨
|
||||
If an emerging growth company, indicate by check mark if the registrant has elected not to use the extended transition period for complying with any new or revised financial accounting standards provided pursuant to Section 13(a) of the Exchange Act.
¨
Indicate by check mark whether the registrant is a shell company (as defined in Rule 12b-2 of the Exchange Act). Yes
¨
No
x
The aggregate market value of the voting and non-voting common equity held by non-affiliates computed by reference to the price of which the common equity was last sold, or the average bid and asked price of such common equity, as of the last business day of the registrant’s most recently completed second fiscal quarter ended July 1, 2017 was $357 million.
The number of shares of common stock outstanding on
February 14, 2018
was 11,340,653.
DOCUMENTS INCORPORATED BY REFERENCE
The following documents are incorporated by reference:
(a) Proxy Statement for the 2018 Annual Meeting of Shareholders (the “2018 Proxy Statement”), incorporated partially in Part III hereof.
DUCOMMUN INCORPORATED AND SUBSIDIARIES
|
|
|
Page
|
|
Item 1.
|
||
|
Item 1A.
|
||
|
Item 1B.
|
||
|
Item 2.
|
||
|
Item 3.
|
||
|
Item 4.
|
||
|
Item 5.
|
||
|
Item 6.
|
||
|
Item 7.
|
||
|
Item 7A.
|
||
|
Item 8.
|
||
|
Item 9.
|
||
|
Item 9A.
|
||
|
Item 9B.
|
||
|
Item 10.
|
||
|
Item 11.
|
||
|
Item 12.
|
||
|
Item 13.
|
||
|
Item 14.
|
||
|
Item 15.
|
||
|
Item 16.
|
||
2
FORWARD-LOOKING STATEMENTS AND RISK FACTORS
This Annual Report on Form 10-K (“Form 10-K”) contains forward-looking statements within the meaning of Section 27A of the Securities Act of 1933, Section 21E of the Securities Exchange Act of 1934 and the Private Securities Litigation Reform Act of 1995. Forward-looking statements may be preceded by, followed by or include the words “believe,” “expect,” “anticipate,” “intend,” “plan,” “estimate” or similar expressions. These statements are based on the beliefs and assumptions of our management. Generally, forward-looking statements include information concerning our possible or assumed future actions, events or results of operations. Forward-looking statements specifically include, without limitation, the information in this Form 10-K regarding: future sales, earnings, cash flow, uses of cash and other measures of financial performance, projections or expectations for future operations, our plans with respect to restructuring activities, completed acquisitions, future acquisitions and dispositions and expected business opportunities that may be available to us.
Although we believe that the expectations reflected in the forward-looking statements are based on reasonable assumptions, these forward-looking statements are subject to numerous factors, risks and uncertainties that could cause actual outcomes and results to be materially different from those projected. We cannot guarantee future results, performance or achievements. Moreover, neither we nor any other person assumes responsibility for the accuracy and completeness of the forward-looking statements. All written and oral forward-looking statements made in connection with this Form 10-K that are attributable to us or persons acting on our behalf are expressly qualified in their entirety by “Risk Factors” contained within Part I, Item 1A of this Form 10-K and other cautionary statements included herein. We are under no duty to update any of the forward-looking statements after the date of this Form 10-K to conform such statements to actual results or to changes in our expectations.
The information in this Form 10-K is not a complete description of our business. There can be no assurance that other factors will not affect the accuracy of these forward-looking statements or that our actual results will not differ materially from the results anticipated in such forward-looking statements. While it is impossible to identify all such factors, factors that could cause actual results to differ materially from those estimated by us include, but are not limited to, those factors or conditions described under Risk Factors contained within Part I, Item 1A of this Form 10-K and the following:
|
•
|
our ability to manage and otherwise comply with our covenants with respect to our outstanding indebtedness;
|
|
•
|
our ability to service our indebtedness;
|
|
•
|
our acquisitions, business combinations, joint ventures, divestitures, or restructuring activities may entail certain operational and financial risks;
|
|
•
|
the cyclicality of our end-use markets and the level of new commercial and military aircraft orders;
|
|
•
|
industry and customer concentration;
|
|
•
|
production rates for various commercial and military aircraft programs;
|
|
•
|
the level of U.S. Government defense spending, including the impact of sequestration;
|
|
•
|
compliance with applicable regulatory requirements and changes in regulatory requirements, including regulatory requirements applicable to government contracts and sub-contracts;
|
|
•
|
further consolidation of customers and suppliers in our markets;
|
|
•
|
product performance and delivery;
|
|
•
|
start-up costs, manufacturing inefficiencies and possible overruns on contracts;
|
|
•
|
increased design, product development, manufacturing, supply chain and other risks and uncertainties associated with our growth strategy to become a Tier Two supplier of higher-level assemblies;
|
|
•
|
our ability to manage the risks associated with international operations and sales;
|
|
•
|
possible goodwill and other asset impairments;
|
|
•
|
economic and geopolitical developments and conditions;
|
|
•
|
unfavorable developments in the global credit markets;
|
|
•
|
our ability to operate within highly competitive markets;
|
|
•
|
technology changes and evolving industry and regulatory standards;
|
|
•
|
the risk of environmental liabilities; and
|
|
•
|
litigation with respect to us.
|
3
We caution the reader that undue reliance should not be placed on any forward-looking statements, which speak only as of the date of this Form 10-K. We do not undertake any duty or responsibility to update any of these forward-looking statements to reflect events or circumstances after the date of this Form 10-K or to reflect actual outcomes.
GENERAL
Ducommun Incorporated (“Ducommun,” “the Company,” “we,” “us” or “our”) is a leading global provider of engineering and manufacturing services for high-performance products and high-cost-of failure applications used primarily in the aerospace and defense (“A&D”), industrial, medical and other industries (collectively, “Industrial”). Ducommun differentiates itself as a full-service solution-based provider, offering a wide range of value-added products and services in our primary businesses of electronics, structures, and integrated solutions. We operate through two primary business segments: Electronic Systems and Structural Systems. We are the successor to a business that was founded in California in 1849 and reincorporated in Delaware in 1970.
ACQUISITIONS
Acquisitions have been an important element of our growth strategy. We have supplemented our organic growth by identifying, acquiring and integrating acquisition opportunities that result in broader, more sophisticated product and service offerings while diversifying and expanding our customer base and markets.
For example, in September 2017, we acquired all the outstanding interests of Lightning Diversion Systems, LLC (the “LDS Acquisition”), a worldwide leader in lightning protection systems serving the aerospace and defense industries for $60.0 million (net of cash acquired), funded by drawing down on our revolving credit facility. The LDS Acquisition is part of our strategy to enhance revenue growth by focusing on advanced proprietary technology on various aerospace and defense platforms.
PRODUCTS AND SERVICES
Business Segment Information
We operate through two primary strategic businesses Electronic Systems and Structural Systems, each of which is a reportable segment. The results of operations among our operating segments vary due to differences in competitors, customers, extent of proprietary deliverables and performance. Electronic Systems designs, engineers and manufactures high-reliability electronic and electromechanical products used in worldwide technology-driven markets including A&D and Industrial end-use markets. Electronic Systems’ product offerings primarily range from prototype development to complex assemblies as discussed in more detail below. Structural Systems designs, engineers and manufactures large, complex contoured aerostructure components and assemblies and supplies composite and metal bonded structures and assemblies. Structural Systems’ products are primarily used on commercial aircraft, military fixed-wing aircraft and military and commercial rotary-wing aircraft.
Electronic Systems
Electronic Systems has multiple major product offerings in electronics manufacturing for diverse, high-reliability applications: complex cable assemblies and interconnect systems, printed circuit board assemblies, higher-level electronic, electromechanical, and mechanical components and assemblies, and lightning diversion systems. Components, assemblies, and lightning diversion products are provided principally for domestic and foreign commercial and military fixed-wing aircraft, military and commercial rotary-wing aircraft and space programs. Further, we provide select industrial high-reliability applications for the industrial automation and medical and other end-use markets. We build custom, high-performance electronics and electromechanical systems. Our products include sophisticated radar enclosures, aircraft avionics racks and shipboard communications and control enclosures, printed circuit board assemblies, cable assemblies, wire harnesses, and interconnect systems, lightning diversion strips, surge suppressors, conformal shields and other high-level complex assemblies. Electronic Systems utilizes a highly-integrated production process, including manufacturing, engineering, fabrication, machining, assembly, electronic integration, and related processes. Engineering, technical and program management services, including design, development, and integration and testing of circuit card assemblies and cable assemblies, are provided to a wide range of customers.
In response to customer needs and utilizing our in-depth engineering expertise, Electronic Systems is also considered a leading supplier of engineered products including, illuminated pushbutton switches and panels for aviation and test systems, microwave and millimeter switches and filters for radio frequency systems and test instrumentation, and motors and resolvers for motion control.
4
Electronic Systems also provides engineering expertise for aerospace system design, development, integration, and testing. We leverage the knowledge base, capabilities, talent, and technologies of this focused capability into direct support of our customers.
Structural Systems
Structural Systems has three major product offerings to support a global customer base: commercial aircraft, military fixed-wing aircraft, and military and commercial rotary-wing aircraft. Our applications include structural components, structural assemblies and bonded (metal and composite) components. In the structural components products, Structural Systems designs, engineers, and manufactures large complex contoured aluminum, titanium and Inconel
®
aerostructure components for the aerospace industry. Structural assembly products include winglets, engine components, and fuselage structural panels for aircraft. Metal and composite bonded structures and assemblies products include aircraft wing spoilers, large fuselage skins, rotor blades on rotary-wing aircraft and components, flight control surfaces and engine components. To support these products, Structural Systems maintains advanced machine milling, stretch-forming, hot-forming, metal bonding, composite layup, and chemical milling capabilities and has an extensive engineering capability to support both design and manufacturing.
AEROSPACE AND DEFENSE END-USE MARKETS OVERVIEW
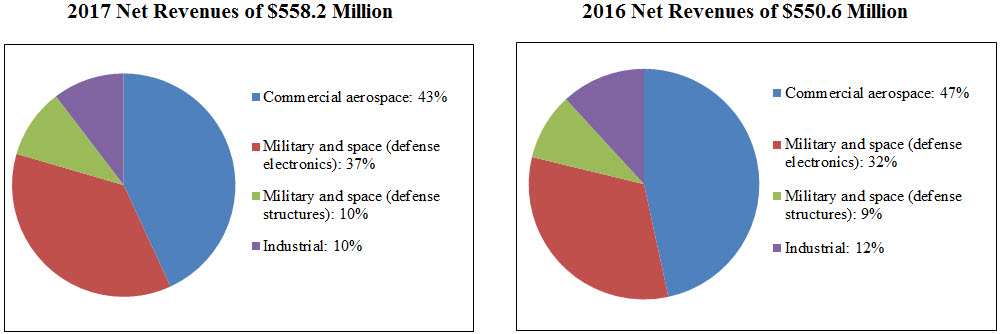
Our largest end-use markets are the aerospace and defense markets and our revenues from these markets represented
90%
of our total net revenues in
2017
. These markets are serviced by suppliers which are stratified, from the lowest value provided to the highest, into four tiers: Tier Three, Tier Two, Tier One and original equipment manufacturers (“OEMs”). The OEMs provide the highest value and are also known as prime contractors (“Primes”). We derive a significant portion of our revenues from subcontracts with OEMs. As the prime contractor for various programs and platforms, the OEMs sell to their customers, who may include, depending upon the application, the U.S. Federal Government, foreign, state and local governments, global commercial airline carriers, regional jet carriers and various other customers. The OEMs also sell to global leasing companies that lease commercial aircraft. A significant portion of our revenues is earned from subcontracts with the Primes. Tier Three suppliers principally provide components or detailed parts. Tier Two suppliers provide more complex, value-added parts and may also assume more design risk, manufacturing risk, supply chain risk and project management risk than Tier Three suppliers. Tier One suppliers manufacture aircraft sections and purchase assemblies. We currently compete primarily with Tier Two and Tier Three suppliers. Our business growth strategy is to differentiate ourselves from competitors by providing more complex assemblies to our customers as a Tier Two supplier.
Commercial Aerospace End-Use Market
The commercial aerospace end-use market is highly cyclical and is impacted by the level of global air passenger traffic in general, which in turn is influenced by global economic conditions, fleet fuel and maintenance costs and geopolitical developments. Revenues from the commercial aerospace end-use market represented
43%
of our total net revenues for
2017
.
Global economic growth, a primary driver for air travel, has returned to the long-term annual average of approximately three percent. Passenger traffic in 2017 is estimated to grow by more than seven percent, exceeding the long-term trend of approximately five percent. While growth was strong across all major world regions, there continues to be variation between regions and airline business models. Airlines operating in the Asia Pacific regions and Europe, as well as low-cost-carriers globally, are currently leading the growth in passenger traffic.
In addition, airline financial performance also plays a role in the demand for new capacity. Airlines continue to focus on increasing revenue through alliances, partnerships, new marketing initiatives, and effective leveraging of ancillary services and related revenues. Airlines are also focusing on reducing costs and renewing fleets to leverage more efficient airplanes. Net profits in 2017 are expected to approximate $35 billion, consistent with 2016.
Further, the availability of internal or external funding impacts commercial aircraft build rates. Failure of our customers to obtain financing may result in cancellation or deferral of orders.
The long-term outlook for the industry continues to remain positive due to the fundamental drivers of air travel growth: economic growth and the increasing propensity to travel due to increased trade, globalization, and improved airline services driven by liberalization of air traffic rights between countries. The Boeing Company’s (“Boeing”) 20 year forecast projections in their
2017
Annual Report on Form 10-K filed with the Securities and Exchange Commission (the “SEC”) projects a long-term average growth rate of almost five percent per year for passenger traffic and more than four percent for cargo traffic. This is based on long-term global economic growth projections of almost three percent average annual gross domestic product (“GDP”) growth, Boeing projects a $6 trillion market for more than 41,000 new airplanes over the next 20 years. We believe we are well positioned given our product capabilities to participate in the steady projected growth rate for commercial air traffic and build rates for large commercial aircraft for the airframe manufacturing industry.
5
Defense End-Use Market
Our defense end-use market includes products used in military and space, including technologies and structures applications. The defense end-use market is highly cyclical and is impacted by the level of government defense spending. Government defense spending is impacted by national defense policies and priorities, political climates, fiscal budgetary constraints, U.S. Federal budget deficits, projected economic growth and the level of global military or security threats, or other conflicts. Revenues from the military and space end-use market in
2017
represented
47%
of our total net revenues during
2017
.
In November 2017, Congress passed the National Defense Authorization Act for fiscal year 2018 (“FY2018”), which authorizes a U.S. Department of Defense (“U.S. DoD”) budget topline higher than the administration’s budget request from May. While the appropriations process for FY2018 remains incomplete, both the House and Senate appropriations committees have also produced bills that increase the U.S. DoD budget topline above the administration’s request. On February 9, 2018, Congress passed a fifth Continuing Resolution that maintains current funding levels through March 23, 2018 and includes increases to the Budget Control Act caps for defense and non-defense spending for FY2018 and FY2019. However, the Budget Control Act continues to mandate limits on U.S. government discretionary spending and remains in effect. As a result, continued budget uncertainty and the risk of future sequestration cuts will remain unless Congress acts to repeal or suspend this law.
Funding timeliness also remains a risk. If Congress is unable to pass appropriations bills or an omnibus spending bill before the expiration of the current Continuing Resolution, a government shutdown could result which may have impacts above and beyond those resulting from budget cuts, sequestration impacts or program-level appropriations. For example, requirements to furlough employees in the U.S. DoD, the Department of Transportation, or other government agencies could result in payment delays, impair our ability to perform work on existing contracts, and/or negatively impact future orders.
In addition, there continues to be uncertainty with respect to program-level appropriations for the U.S. DoD and other government agencies, including the National Aeronautics and Space Administration (“NASA”), within the overall budgetary framework described above. Future budget cuts or investment priority changes could result in reductions, cancellations and/or delays of existing contracts or programs. Any of these impacts could have a material effect on the results of our operations, financial position, and/or cash flows. For additional information related to our revenues from customers whose principal sales are to the U.S. Government and our direct sales to the U.S. Government, see “Risk Factors” contained within Part I, Item 1A of this Annual Report on Form 10-K (“Form 10-K”).
INDUSTRIAL END-USE MARKETS OVERVIEW
Our industrial, medical and other (collectively, “Industrial”) end-use markets are diverse and are impacted by the customers’ needs for increasing electronic content and a desire to outsource. Factors expected to impact these markets include capital and industrial goods spending and general economic conditions. Our products are used in heavy industrial manufacturing systems and certain medical applications. Revenues from the Industrial end-use markets were
10%
of our total net revenues during
2017
.
We believe our business in these markets has stabilized and we are well positioned for these markets.
SALES AND MARKETING
Our commercial revenues are substantially dependent on airframe manufacturers’ production rates of new aircraft. Deliveries of new aircraft by airframe manufacturers are dependent on the financial capacity of its customers, primarily airlines and leasing companies, to purchase the aircraft. Thus, revenues from commercial aircraft could be affected as a result of changes in new aircraft orders, or the cancellation or deferral by airlines of purchases of ordered aircraft. Further, our revenues from commercial aircraft programs could be affected by changes in our customers’ inventory levels and changes in our customers’ aircraft production build rates. In recent years, both major large aircraft manufacturers, Boeing and Airbus, have announced higher build rates due to increases in production of existing programs, including more fully-developed models, and by the introduction of new platforms.
Military components manufactured by us are employed in many of the country’s front-line fighters, bombers, rotary-wing aircraft and support aircraft, as well as land and sea-based applications. Our defense business is diversified among a number of military manufacturers and programs. In the space sector, we continue to support various unmanned launch vehicle and satellite programs.
Our sales into the Industrial end-use markets are customer focused in the various markets and driven primarily by their capital spending and manufacturing outsourcing demands.
6
We continue to broaden and diversify our customer base in the end-use markets we serve by providing innovative product and service solutions through drawing on our core competencies, experience and technical expertise. Net revenues related to military and space (defense technologies and defense structures), commercial aerospace, and Industrial end-use markets in
2017
and
2016
were as follows:
Many of our contracts are fixed price contracts subject to termination at the convenience of the customer (as well as for default). In the event of termination for convenience, the customer generally is required to pay the costs we have incurred and certain other fees through the date of termination. Larger, long-term government subcontracts may have provisions for milestone payments, progress payments or cash advances for purchase of inventory.
Our marketing efforts primarily consist of developing strong, long-term relationships with our customers, which provide the basis for future sales. These close relationships allow us to gain a better insight into each customer’s business needs, identify ways to provide greater value to the customer, and allow us to be designed in early in various products and/or high volume products.
SEASONALITY
The timing of our revenues is governed by the purchasing patterns of our customers, and, as a result, we may not generate revenues equally during the year. However, no material portion of our business is considered to be seasonal.
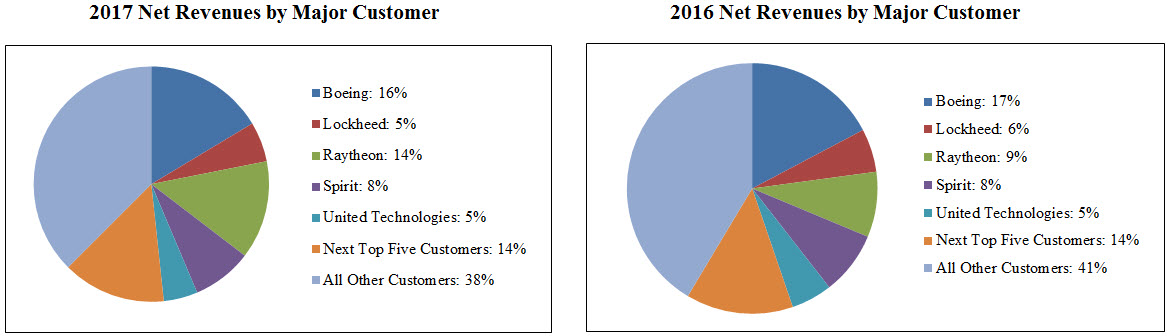
MAJOR CUSTOMERS
We currently generate the majority of our revenues from the aerospace and defense industries. As a result, we have significant revenues from certain customers. Boeing and Raytheon Company (“Raytheon”) were each greater than 10 percent and Lockheed Martin Corporation (“Lockheed Martin”), Spirit AeroSystems Holdings, Inc. (“Spirit”), and United Technologies Corporation (“United Technologies”) each were greater than five percent of our
2017
net revenues. Revenues from our top ten customers, including Boeing, Raytheon, Lockheed Martin, Spirit, and United Technologies, were
62%
of total net revenues during
2017
. Net revenues by major customer for
2017
and
2016
were as follows:
Net revenues from our customers, except the U.S. Government, are diversified over a number of different military and space, commercial aerospace, industrial, medical and other products. For additional information on revenues from major customers, see Note 18 to our consolidated financial statements included in Part IV, Item 15(a) of this Form 10-K.
7
RESEARCH AND DEVELOPMENT
We perform concurrent engineering with our customers and product development activities under our self-funded programs, as well as under contracts with others. Concurrent engineering and product development activities are performed for commercial, military and space applications.
RAW MATERIALS AND COMPONENTS
Raw materials and components used in the manufacturing of our products include aluminum, titanium, steel and carbon fibers, as well as a wide variety of electronic interconnect and circuit card assemblies and components. These raw materials are generally available from a number of suppliers and are generally in adequate supply. However, from time to time, we have experienced increases in lead times for and limited availability of, aluminum, titanium and certain other raw materials and/or components. Moreover, certain components, supplies and raw materials for our operations are purchased from single source suppliers and occasionally, directed by our customers. In such instances, we strive to develop alternative sources and design modifications to minimize the potential for business interruptions.
COMPETITION
The markets we serve are highly competitive, and our products and services are affected by varying degrees of competition. We compete worldwide with domestic and international companies in most markets. These companies may have competitive advantages as a result of greater financial resources, economies of scale and bundled products and services that we do not offer. Additional information related to competition is discussed in Risk Factors contained within Part I, Item 1A of this Form 10-K. Our ability to compete depends principally upon the breadth of our technical capabilities, the quality of our goods and services, competitive pricing, product performance, design and engineering capabilities, new product innovation, the ability to solve specific customer needs, and customer relationships.
PATENTS AND LICENSES
We have several patents, but we do not believe that our operations are dependent upon any single patent or group of patents. In general, we rely on technical superiority, continual product improvement, exclusive product features, superior lead time, on-time delivery performance, quality, and customer relationships to maintain our competitive advantage.
BACKLOG
We define backlog as customer placed purchase orders (“POs”) and long-term agreements (“LTAs”) with firm fixed price and firm delivery dates of 24 months or less. Backlog is subject to delivery delays or program cancellations, which are beyond our control. Backlog is affected by timing differences in the placement of customer orders and tends to be concentrated in certain programs and customers. As a result, trends in our overall level of backlog may not be indicative of trends in our future revenues. Backlog was
$726.5 million
at
December 31, 2017
, compared to
$641.3 million
at
December 31, 2016
. The increase in backlog was primarily in the commercial aerospace and military and space end-use markets.
$544.0 million
of total backlog is expected to be delivered during 2018.
ENVIRONMENTAL MATTERS
Our business, operations and facilities are subject to numerous stringent federal, state and local environmental laws and regulations issued by government agencies, including the Environmental Protection Agency (“EPA”). Among other matters, these regulatory authorities impose requirements that regulate the emission, discharge, generation, management, transport and disposal of hazardous materials, pollutants and contaminants. These regulations govern public and private response actions to hazardous or regulated substances that threaten to release, or have been released to the environment, and they require us to obtain and maintain licenses and permits in connection with our operations. We may also be required to investigate and remediate the effects of the release or disposal of materials at sites associated with past and present operations. Additionally, this extensive regulatory framework imposes significant compliance burdens and risks on us. We anticipate that capital expenditures will continue to be required for the foreseeable future to upgrade and maintain our environmental compliance efforts, however, we do not expect such expenditures to be material in 2018 and the foreseeable future.
Structural Systems has been directed by California environmental agencies to investigate and take corrective action for groundwater contamination at its facilities located in Adelanto (a.k.a., El Mirage) and Monrovia, California. Based on currently available information, we have accrued
$1.5 million
for our estimated liabilities related to these sites. For further information, see Note 17 in the accompanying notes to consolidated financial statements included in Part IV, Item 15(a) of this Form 10-K. In addition, see Risk Factors contained within Part I, Item 1A of this Form 10-K for certain risks related to environmental matters.
8
EMPLOYEES
As of
December 31, 2017
, we employed
2,600
people, of which
360
are subject to collective bargaining agreements expiring in
June 2018
and
January 2019
. We believe our relations with our employees are good. See Risk Factors contained within Part I, Item 1A of this Form 10-K for additional information regarding certain risks related to our employees.
AVAILABLE INFORMATION
General information about us can be obtained from our website address at
www.ducommun.com
. Our Annual Reports on Form 10-K, Quarterly Reports on Form 10-Q, Current Reports on Form 8-K, and amendments to those reports, if any, are available free of charge on our website as soon as reasonably practicable after they are filed with or furnished to the SEC. Information included in our website is not incorporated by reference in this Annual Report on Form 10-K. The SEC also maintains a website at
www.sec.gov
that contains reports, proxy statements and other information regarding SEC registrants, including our company.
Our business, financial condition, results of operations and cash flows may be affected by known and unknown risks, uncertainties and other factors. We have summarized below the significant, known material risks to our business. Additional risk factors not currently known to us or that we currently believe are immaterial may also impair our business, financial condition, results of operations and cash flows. Any of these risks, uncertainties and other factors could cause our future financial results to differ materially from recent financial results or from currently anticipated future financial results. The risk factors below should be considered together with the information included elsewhere in this Annual Report on Form 10-K (“Form 10-K”) as well as other required filings by us to the SEC.
RISKS RELATED TO OUR CAPITAL STRUCTURE
Our indebtedness could limit our financing options, adversely affect our financial condition, and prevent us from fulfilling our debt obligations.
In July 2015, we completed the refinancing of our existing debt by entering into a new credit facility to replace the existing credit facilities. This credit facility consists of a $275.0 million senior secured term loan, which matures on June 26, 2020 (“Term Loan”), and a $200.0 million senior secured revolving credit facility (“Revolving Credit Facility”), which matures on June 26, 2020 (collectively, the “Credit Facilities”).
At
December 31, 2017
, we had a total of
$218.1 million
of outstanding long-term debt which was comprised of
$160.0 million
under the Term Loan and
$58.1 million
under the Revolving Credit Facility. The total long-term debt was primarily the result of our acquisitions, LaBarge Inc. in 2011 and LDS in September 2017. There are no further required payments under the Credit Facilities until June 2020.
Our ability to complete a debt refinancing in the future may be limited, as discussed below in this risk factor. We may have to undertake alternative financing plans, such as selling assets; reducing or delaying scheduled expansions and/or capital investments; or seeking various forms of capital. Our ability to complete alternative financing plans may be affected by circumstances and economic events outside of our control. We cannot ensure that we would be able to refinance our debt or enter into alternative financing plans in adequate amounts on commercially reasonable terms, terms acceptable to us or at all, or that such plans guarantee that we would be able to meet our debt obligations.
Our level of debt could:
|
•
|
limit our ability to obtain additional financing to fund future working capital, capital expenditures, investments or acquisitions or other general corporate requirements;
|
|
•
|
require a substantial portion of our cash flows to be dedicated to debt service payments instead of other purposes, thereby reducing the amount of cash flows available for working capital, capital expenditures, investments or acquisitions or other general corporate purposes;
|
|
•
|
increase our vulnerability to adverse changes in general economic, industry and competitive conditions;
|
|
•
|
place us at a disadvantage compared to other, less leveraged competitors;
|
|
•
|
expose us to the risk of increased borrowing costs and higher interest rates as approximately 40% of our borrowings under our Credit Facilities bear interest at variable rates, which could further adversely impact our cash flows;
|
9
|
•
|
limit our flexibility to plan for and react to changes in our business and the industry in which we compete;
|
|
•
|
restrict us from making strategic acquisitions or causing us to make non-strategic divestitures;
|
|
•
|
expose us to risk of unfavorable changes in the global credit markets; and
|
|
•
|
make it more difficult for us to satisfy our obligations with respect to the Credit Facilities and our other debt.
|
The occurrence of any one of these events could have an adverse effect on our business, financial condition, results of operations and ability to satisfy our obligations in respect of our outstanding debt.
We require a considerable amount of cash to service our indebtedness.
Our ability to make payments on our debt in the future and to fund planned capital expenditures and working capital needs, will depend upon our ability to generate significant cash in the future. Our ability to generate cash is subject to economic, financial, competitive, legislative, regulatory and other factors that may be beyond our control.
The Credit Facilities bear interest, at our option, at a rate equal to either (i) the Eurodollar Rate (defined as a London Interbank Offered Rate [“LIBOR”]) plus an applicable margin ranging from 1.50% to 2.75% per year or (ii) the Base Rate (defined as the highest of [a] Federal Funds Rate plus 0.50%, [b] Bank of America’s prime rate, and [c] the Eurodollar Rate plus 1.00%) plus an applicable margin ranging from 0.50% to 1.75% per year, in each case based upon the consolidated total net adjusted leverage ratio, typically payable quarterly. In October 2015, we entered into interest rate cap hedges designated as cash flow hedges, with maturity dates of June 2020 and notional value in aggregate, totaling $135.0 million. At
December 31, 2017
, the outstanding balance on the Credit Facilities was
$218.1 million
with an average interest rate of
3.73%
. Should interest rates increase significantly, even though $135.0 million of our debt was hedged, our debt service cost will increase. Any inability to generate sufficient cash flow could have a material adverse effect on our financial condition or results of operations.
While we expect to meet all of our financial obligations, we cannot ensure that our business will generate sufficient cash flow from operations in an amount sufficient to enable us to pay our debt or to fund our other liquidity needs.
We require a considerable amount of cash to fund our anticipated voluntary principal prepayments on our Credit Facilities.
Our ability to continue to reduce the debt outstanding under our Credit Facilities through voluntary principal prepayments will be a contributing factor to our ability to meet the leverage ratio covenant and keeping our interest rate towards the lower end of the interest rate range as defined in the Credit Facilities. Our ability to make such prepayments will depend upon our ability to generate significant cash in the future. We cannot ensure that our business will generate sufficient cash flow from operations to fund any such prepayments.
The covenants in the credit agreement to our Credit Facilities impose restrictions that may limit our operating and financial flexibility.
We are required to comply with a leverage covenant as defined in the credit agreement to the Credit Facilities. The leverage covenant is defined as Consolidated Funded Indebtedness less unrestricted cash and cash equivalents in excess of $10.0 million, divided by consolidated earnings before interest, taxes and depreciation and amortization (“EBITDA”). The leverage covenant decreases over the term of the Credit Facilities, which will require us to lower our outstanding debt or increase our EBITDA in the future. We believe the voluntary prepayments on the Credit Facilities will help reduce our leverage, as defined in the credit agreement.
At
December 31, 2017
, we were in compliance with the leverage covenant under the Credit Facility. However, there is no assurance that we will continue to be in compliance with the leverage covenant in future periods.
Our credit agreement to the Credit Facilities contains a number of significant restrictions and covenants that limit our ability, among other things, to incur additional indebtedness, to create liens, to make certain payments, investments, to engage in transactions with affiliates, to sell certain assets or enter into mergers.
These covenants could materially and adversely affect our ability to finance our future operations or capital needs. Furthermore, they may restrict our ability to expand, pursue our business strategies and otherwise conduct our business. Our ability to comply with these covenants may be affected by circumstances and events beyond our control, such as prevailing economic conditions and changes in regulations, and we cannot ensure that we will be able to comply with such covenants. These restrictions also limit our ability to obtain future financings to withstand a future downturn in our business or the economy in general.
10
A breach of any covenant in credit agreement to the Credit Facilities would result in a default under the Credit Facilities agreement. A default, if not waived, could result in acceleration of the debt outstanding under the agreement. A default could permit our lenders to foreclose on any of our assets securing such debt. Even if new financing were available at that time, it may not be on terms or amounts that are acceptable to us or terms as favorable as our current agreements. If our debt is in default for any reason, our business, results of operations and financial condition could be materially and adversely affected.
The typical trading volume of our common stock may affect an investor’s ability to sell significant stock holdings in the future without negatively impacting stock price.
The level of trading activity may vary daily and typically represents only a small percentage of outstanding shares. As a result, a stockholder who sells a significant amount of shares in a short period of time could negatively affect our share price.
Our amount of debt may require us to raise additional capital to fund operations.
We may sell additional shares of common stock or other equity securities to raise capital in the future, which could dilute the value of an investor’s holdings.
RISKS RELATED TO OUR BUSINESS
Our end-use markets are cyclical.
We sell our products into aerospace, defense, and industrial end-use markets, which are cyclical and have experienced periodic declines. Our sales are, therefore, unpredictable and tend to fluctuate based on a number of factors, including global economic conditions, geopolitical developments and conditions, and other developments affecting our end-use markets and the customers served. Consequently, results of operations in any period should not be considered indicative of the operating results that may be experienced in any future period.
We depend upon a selected base of industries and customers, which subjects us to unique risks which may adversely affect us.
We currently generate a majority of our revenues from customers in the aerospace and defense industry. Our business depends, in part, on the level of new military and commercial aircraft orders. As a result, we have significant sales to certain customers. Sales to the Boeing Company and Spirit AeroSystems Holdings, Inc. comprise the majority of our commercial aerospace end-use market. A significant portion of our net sales in our military and space end-use markets are made under subcontracts with OEMs, under their prime contracts with the U. S. Government. We had significant sales to Lockheed Martin Corporation, Raytheon Company, and United Technologies Corporation in
2017
in our defense technologies end-use market.
Our customers may experience delays in the launch of new products, labor strikes, diminished liquidity or credit unavailability, weak demand for their products, or other difficulties in their business. In addition, sequestration and a shift in government spending priorities have caused and may continue to cause additional uncertainty in the placement of orders.
Our sales to our top ten customers, which represented
62%
of our total
2017
net revenues, were diversified over a number of different aerospace and defense and Industrial products. Any significant change in production rates by these customers would have a material effect on our results of operations and cash flows. There is no assurance that our current significant customers will continue to buy products from us at current levels, or that we will retain any or all of our existing customers, or that we will be able to form new relationships with customers upon the loss of one or more of our existing customers. This risk may be further complicated by pricing pressures, intense competition prevalent in our industry and other factors. A significant reduction in sales to any of our major customers, the loss of a major customer, or a default of a major customer on accounts receivable could have a material adverse impact on our financial results.
In addition, we generally make sales under purchase orders and contracts that are subject to cancellation, modification or rescheduling. Changes in the economic environment and the financial condition of the industries we serve could result in customer cancellation of contractual orders or requests for rescheduling. Some of our contracts have specific provisions relating to schedule and performance, and failure to deliver in accordance with such provisions could result in cancellations, modifications, rescheduling and/or penalties, in some cases at the customers’ convenience and without prior notice. While we have normally recovered our direct and indirect costs, such cancellations, modifications, or rescheduling that cannot be replaced in a timely fashion, could have a material adverse effect on our financial results.
A significant portion of our business depends upon U.S. Government defense spending.
We derive a significant portion of our business from customers whose principal sales are to the U.S. Government and from direct sales by us to the U.S. Government. Accordingly, the success of our business depends upon government spending
11
generally or for specific departments or agencies in particular. Such spending, among other factors, is subject to the uncertainties of governmental appropriations and national defense policies and priorities, constraints of the budgetary process, timing and potential changes in these policies and priorities, and the adoption of new laws or regulations or changes to existing laws or regulations.
These and other factors could cause the government and government agencies, or prime contractors that use us as a subcontractor, to reduce their purchases under existing contracts, to exercise their rights to terminate contracts at-will or to abstain from exercising options to renew contracts, any of which could have a material adverse effect on our business, financial condition and results of operations.
Further, the levels of U.S. Department of Defense (“U.S. DoD”) spending in future periods are difficult to predict and are impacted by numerous factors such as the political environment, U.S. foreign policy, macroeconomic conditions and the ability of the U.S. Government to enact relevant legislation such as the authorization and appropriations bills. The Budget Control Act (“2011 Act”) established limits on U.S. government discretionary spending, including a reduction of defense spending between the 2012 and 2021 U.S. Government fiscal years. Accordingly, long-term uncertainty remains with respect to overall levels of defense spending and it is likely that U.S. Government discretionary spending levels will continue to be subject to pressure.
We are subject to extensive regulation and audit by the Defense Contract Audit Agency.
T
he accuracy and appropriateness of certain costs and expenses used to substantiate our direct and indirect costs for the U.S. Government contracts are subject to extensive regulation and audit by the Defense Contract Audit Agency, an arm of the U.S. DoD. Such audits and reviews could result in adjustments to our contract costs and profitability. However, we cannot ensure the outcome of any future audits and adjustments may be required to reduce net sales or profits upon completion and final negotiation of audits. If any audit or review were to uncover inaccurate costs or improper activities, we could be subject to penalties and sanctions, including termination of contracts, forfeiture of profits, suspension of payments, fines and suspension or prohibition from conducting future business with the U.S. Government. Any such outcome could have a material adverse effect on our financial results.
We are subject to a number of procurement laws and regulations. Our business and our reputation could be adversely affected if we fail to comply with these laws.
We must comply with and are affected by laws and regulations relating to the award, administration and performance of U.S. Government contracts. Government contract laws and regulations affect how we do business with our customers and impose certain risks and costs on our business. A violation of specific laws and regulations, by us, our employees, others working on our behalf, a supplier or a venture partner, could harm our reputation and result in the imposition of fines and penalties, the termination of our contracts, suspension or debarment from bidding on or being awarded contracts, loss of our ability to export products or services and civil or criminal investigations or proceedings.
In some instances, these laws and regulations impose terms or rights that are different from those typically found in commercial transactions. For example, the U.S. Government may terminate any of our government contracts and subcontracts either at its convenience or for default based on our performance. Upon termination for convenience of a fixed-price type contract, we normally are entitled to receive the purchase price for delivered items, reimbursement for allowable costs for work-in-process and an allowance for profit on the contract or adjustment for loss if completion of performance would have resulted in a loss.
Contracts with some of our customers, including Federal government contracts, contain provisions which give our customers a variety of rights that are unfavorable to us and the OEMs to whom we provide products and services, including the ability to terminate a contract at any time for convenience.
Contracts with some of our customers, including Federal government contracts, contain provisions and are subject to laws and regulations that provide rights and remedies not typically found in commercial contracts. These provisions may allow our customers to:
|
•
|
terminate existing contracts, in whole or in part, for convenience, as well as for default, or if funds for contract performance for any subsequent year become unavailable;
|
|
•
|
terminate existing contracts if we are suspended or debarred from doing business with the federal government or with a governmental agency;
|
|
•
|
prohibit future procurement awards with a particular agency as a result of a finding of an organizational conflict of interest based upon prior related work performed for the agency that would give a contractor an unfair advantage over competing contractors;
|
|
•
|
claim rights in products and systems produced by us; and
|
12
|
•
|
control or prohibit the export of the products and related services we offer.
|
If the U.S. Government terminates a contract for convenience, the counterparty with whom we have contracted on a subcontract may terminate its contract with us. As a result of any such termination, whether on a direct government contract or subcontract, we may recover only our incurred or committed costs, settlement expenses and profit on work completed prior to the termination. If the U.S. Government terminates a direct contract with us for default, we may not even recover those amounts and instead may be liable for excess costs incurred by the U.S. Government in procuring undelivered items and services from another source.
In addition, the U.S. Government is typically required to open all programs to competitive bidding and, therefore, may not automatically renew any of its prime contracts. If one or more of our government prime or subcontracts is terminated or canceled, our failure to replace sales generated from such contracts would result in lower sales and have an adverse effect on our business, results of operations and financial condition.
Further consolidation in the aerospace industry could adversely affect our business and financial results.
The aerospace and defense industry is experiencing significant consolidation, including our customers, competitors and suppliers. Consolidation among our customers may result in delays in the awarding of new contracts and losses of existing business. Consolidation among our competitors may result in larger competitors with greater resources and market share, which could adversely affect our ability to compete successfully. Consolidation among our suppliers may result in fewer sources of supply and increased cost to us.
Our growth strategy includes evaluating selected acquisitions, which entails certain risks to our business and financial performance.
We have historically achieved a portion of our growth through acquisitions and expect to evaluate selected future acquisitions as part of our strategy for growth. Any acquisition of another business entails risks and it is possible that we will not realize the expected benefits from an acquisition or that an acquisition will adversely affect our existing operations. Acquisitions entail certain risks, including:
|
•
|
difficulty in integrating the operations and personnel of the acquired company within our existing operations or in maintaining uniform standards;
|
|
•
|
loss of key employees or customers of the acquired company;
|
|
•
|
the failure to achieve anticipated synergies;
|
|
•
|
unrecorded liabilities of acquired companies that we fail to discover during our due diligence investigations or that are not subject to indemnification or reimbursement by the seller; and
|
|
•
|
management and other personnel having their time and resources diverted to evaluate, negotiate and integrate acquisitions.
|
We may not be successful in achieving expected operating efficiencies and sustaining or improving operating expense reductions, and may experience business disruptions associated with restructuring, facility consolidations, realignment, cost reduction, and other strategic initiatives.
Over the past year, we have implemented a number of restructuring, realignment, and cost reduction initiatives, including facility consolidations, organizational realignments, and reductions in our workforce. While we have realized some efficiencies from these actions, we may not realize the benefits of these initiatives to the extent we anticipated. Further, such benefits may be realized later than expected, and the ongoing difficulties in implementing these measures may be greater than anticipated, which could cause us to incur additional costs or result in business disruptions. In addition, if these measures are not successful or sustainable, we may have to undertake additional realignment and cost reduction efforts, which could result in significant additional charges. Moreover, if our restructuring and realignment efforts prove ineffective, our ability to achieve our other strategic and business plan goals may be adversely affected.
We rely on our suppliers to meet the quality and delivery expectations of our customers.
Our ability to deliver our products and services on schedule and to satisfy specific quality levels is dependent upon a variety of factors, including execution of internal performance plans, availability of raw materials, internal and supplier produced parts and structures, conversion of raw materials into parts and assemblies, and performance of suppliers and others.
We rely on numerous third-party suppliers for raw materials and a large proportion of the components used in our production process. Certain of these raw materials and components are available only from single sources or a limited number of suppliers,
13
or similarly, customers’ specifications may require us to obtain raw materials and/or components from a single source or certain suppliers. Many of our suppliers are small companies with limited financial resources and manufacturing capabilities. We do not currently have the ability to manufacture these components ourselves. These and other factors, including the loss of a critical supplier or raw materials and/or component shortages, could cause disruptions or cost inefficiencies in our operations compared to our competitors that have greater direct purchasing power, which could have a material adverse effect on our financial results.
We use estimates when bidding on fixed-price contracts. Changes in our estimates could adversely affect our financial results.
We enter into contracts providing for a firm, fixed-price for the sale of some of our products regardless of the production costs incurred by us. In many cases, we make multi-year firm, fixed-price commitments to our customers, without assurance that our anticipated production costs will be achieved. Contract bidding and accounting require judgment relative to assessing risks, estimating contract net sales and costs, including estimating cost increases over time and efficiencies to be gained, and making assumptions for supplier sourcing and quality, manufacturing scheduling and technical issues over the life of the contract. Such assumptions can be particularly difficult to estimate for contracts with new customers. Our failure to accurately estimate these costs can result in reduced profits or incurred losses. Due to the significance of the judgments and estimates involved, it is possible that materially different amounts could be obtained if different assumptions were used or if the underlying circumstances were to change. Therefore, any changes in our underlying assumptions, circumstances or estimates could have a material adverse effect on our financial results. For example, in the third quarter of 2015, we recorded a charge in the Structural Systems segment related to a regional jet program for estimated cost overruns of $10.0 million. See “Provision for Estimated Losses on Contracts” in Note 1 to our consolidated financial statements included in Part IV, Item 15(a) of this Form 10-K for further information.
As we move up the value chain to become a Tier Two supplier, enhanced design, product development, manufacturing, supply chain project management and other skills will be required.
We may encounter difficulties as we execute our growth strategy to move up the value chain to become a Tier Two supplier of more complex, value-added assemblies. Difficulties we may encounter include, but are not limited to, the need for enhanced and expanded product design skills, enhanced ability to control and influence our suppliers, enhanced quality control systems and infrastructure, enhanced large-scale project management skills, and expanded industry certifications. Assuming incremental project design responsibilities would require us to assume additional risk in developing cost estimates and could expose us to increased risk of losses. There can be no assurance that we will be successful in obtaining the enhanced skills required to be a Tier Two supplier or that our customers will outsource such functions to us.
Risks associated with operating and conducting our business outside the United States could adversely impact us.
We have manufacturing facilities in Thailand and Mexico and also derive a portion of our net revenues from direct foreign sales. Further, our customers may derive portions of their revenues from non-U.S. customers. As a result, we are subject to the risks of conducting and operating our business internationally, including:
|
•
|
political instability;
|
|
•
|
economic and geopolitical developments and conditions;
|
|
•
|
compliance with a variety of international laws, as well as U.S. laws affecting the activities of U.S. companies conducting business abroad, including, but not limited to, the Foreign Corrupt Practices Act;
|
|
•
|
imposition of taxes, export controls, tariffs, embargoes and other trade restrictions;
|
|
•
|
difficulties repatriating funds or restrictions on cash transfers; and
|
|
•
|
potential for new tariffs imposed on imports by the new U.S. administration.
|
While the impact of these factors is difficult to predict, any one or more of these factors could have a material adverse effect on our financial results.
Goodwill and/or other assets could be impaired in the future, which could result in substantial charges.
Goodwill is tested for impairment on an annual basis during our fourth quarter or more frequently if events or circumstances occur which could indicate potential impairment. For example, our annual goodwill impairment testing in the fourth quarter of 2015 indicated the Structural Systems reporting unit’s carrying value exceeded its fair value as a result of the lowered revenues and cash flows outlook in our military and space end-use markets due to the decrease in U.S. government defense spending and
14
thus, requiring us to perform Step Two of the goodwill impairment test. Based on the Step Two test, we impaired the entire goodwill for the Structural Systems reporting unit of $57.2 million in 2015.
We also test intangible assets with indefinite life periods for potential impairment annually and on an interim basis if there are indicators of potential impairment. For example, in performing our annual impairment test in the fourth quarter of 2015, we concluded the fair value of the indefinite-lived trade name to be zero as a result of divesting businesses in Electronic Systems and our discontinuation of the use of the trade name. Thus, we recorded an impairment of $32.9 million, which was the remaining carrying value of the trade name.
In addition, we evaluate amortizable intangible assets, fixed assets, and production cost of contracts for impairment if there are indicators of a potential impairment.
In assessing the recoverability of goodwill, management is required to make certain critical estimates and assumptions. These estimates and assumptions include projected sales levels, including the addition of new customers, programs or platforms and increased content on existing programs or platforms, improvements in manufacturing efficiency, and reductions in operating costs. Due to many variables inherent in the estimation of a business’s fair value and the relative size of our recorded goodwill, differences in estimates and assumptions may have a material effect on the results of our impairment analysis. If any of these or other estimates and assumptions are not realized in the future, or if market multiples decline, we may be required to record an additional impairment charge for goodwill.
Further, additional impairment charges may be incurred against other intangible assets or long-term assets if asset utilization declines, customer demand declines or other circumstances indicate that the asset carrying value may not be recoverable.
Our production cost of contracts as of December 31, 2017 was $
11.2 million
or
2%
of total assets. Our goodwill and other intangible assets as of December 31, 2017 were
$232.1 million
, or
41%
of total assets. See “Goodwill and Indefinite-Lived Intangible Assets” and “Production Cost of Contracts” in Note 8 of our consolidated financial statements included in Part IV, Item 15(a) of this Form 10-K for further information.
OTHER RISKS
Our operations are subject to numerous extensive, complex, costly and evolving laws, regulations and restrictions, and failure to comply with these laws, regulations and restrictions could subject us to penalties and sanctions that could harm our business.
Prime contracts with various agencies of the U.S. Government, and subcontracts with other prime contractors, are subject to numerous laws and regulations which affect how we do business with our customers and may impose added costs to our business. As a result, our contracts and operations are subject to numerous, extensive, complex, costly and evolving laws, regulations and restrictions, principally by the U.S. Government or their agencies. These laws, regulations and restrictions govern items including, but not limited to, the formation, administration and performance of U.S. Government contracts, disclosure of cost and pricing data, civil penalties for violations or false claims to the U.S. Government for payment, define reimbursable costs, establish ethical standards for the procurement process and control the import and export of defense articles and services.
Noncompliance could expose us to liability for penalties, including termination of our U.S. Government contracts and subcontracts, disqualification from bidding on future U.S. Government contracts and subcontracts, suspension or debarment from U.S. Government contracting and various other fines and penalties
.
Noncompliance found by any one agency could result in fines, penalties, debarment or suspension from receiving additional contracts with all U.S. Government agencies. Given our dependence on U.S. Government business, suspension or debarment could have a material adverse effect on our financial results.
In addition, the U.S. Government may revise its procurement practices or adopt new contract rules and regulations, at any time, including increased usage of fixed-price contracts and procurement reform. Such changes could impair our ability to obtain new contracts or subcontracts or renew contracts or subcontracts under which we currently perform when those contracts are put up for competitive bidding. Any new contracting methods could be costly or administratively difficult for us to implement and could adversely affect our future net revenues.
In addition, our international operations subject us to numerous U.S. and foreign laws and regulations, including, without limitation, regulations relating to import-export control, technology transfer restrictions, repatriation of earnings, exchange controls, the Foreign Corrupt Practices Act and the anti-boycott provisions of the U.S. Export Administration Act. Changes in regulations or political environments may affect our ability to conduct business in foreign markets including investment, procurement and repatriation of earnings. Failure by us or our sales representatives or consultants to comply with these laws
15
and regulations could result in certain liabilities and could possibly result in suspension or debarment from government contracts or suspension of our export privileges, which could have a material adverse effect on our financial results.
Customer pricing pressures could reduce the demand and/or price for our products and services.
The markets we serve are highly competitive and price sensitive. We compete worldwide with a number of domestic and international companies that have substantially greater manufacturing, purchasing, marketing and financial resources than we do. Many of our customers have the in-house capability to fulfill their manufacturing requirements. Our larger competitors may be able to compete more effectively for very large-scale contracts than we can by providing different or greater capabilities or benefits such as technical qualifications, past performance on large-scale contracts, geographic presence, price and availability of key professional personnel. If we are unable to successfully compete for new business, our net revenues growth and operating margins may decline.
Several of our major customers have completed extensive cost containment efforts and we expect continued pricing pressures in 2018 and beyond. Competitive pricing pressures may have an adverse effect on our financial condition and operating results. Further, there can be no assurance that competition from existing or potential competitors in other segments of our business will not have a material adverse effect on our financial results. If we do not continue to compete effectively and win contracts, our future business, financial condition, results of operations and our ability to meet our financial obligations may be materially compromised.
Our products and processes are subject to risk of obsolescence as a result of changes in technology and evolving industry and regulatory standards.
The future success of our business depends in large part upon our and our customers’ ability to maintain and enhance technological capabilities, develop and market manufacturing services that meet changing customer needs and successfully anticipate or respond to technological advances in manufacturing processes on a cost-effective and timely basis, while meeting evolving industry and regulatory standards. To address these risks, we invest in product design and development, and incur related capital expenditures. There can be no guarantee that our product design and development efforts will be successful, or that funds required to be invested in product design and development or incurred as capital expenditures will not increase materially in the future.
Environmental liabilities could adversely affect our financial results.
We are subject to various federal, local, and foreign environmental laws and regulations, including those relating to the use, storage, transport, discharge and disposal of hazardous chemicals and materials used and emissions generated during our manufacturing process. We do not carry insurance for these potential environmental liabilities. Any failure by us to comply with present or future regulations could subject us to future liabilities or the suspension of production, which could have a material adverse effect on our financial results. Moreover, some environmental laws relating to contaminated sites can impose joint and several liability retroactively regardless of fault or the legality of the activities giving rise to the contamination. Compliance with existing or future environmental laws and regulations may require extensive capital expenditures, increase our cost or impact our production capabilities. Even if such expenditures are made, there can be no assurance that we will be able to comply. We have been directed to investigate and take corrective action for groundwater contamination at certain sites. Our ultimate liability for such matters will depend upon a number of factors. See Note 17 to our consolidated financial statements included in Part IV, Item 15(a) of this Form 10-K for further information.
Cyber security attacks, internal system or service failures may adversely impact our business and operations.
Any system or service disruptions, including those caused by projects to improve our information technology systems, if not anticipated and appropriately mitigated, could disrupt our business and impair our ability to effectively provide products and related services to our customers and could have a material adverse effect on our business. We could also be subject to systems failures, including network, software or hardware failures, whether caused by us, third-party service providers, intruders or hackers, computer viruses, natural disasters, power shortages or terrorist attacks. Cyber security threats are evolving and include, but are not limited to, malicious software, unauthorized attempts to gain access to sensitive, confidential or otherwise protected information related to us or our products, customers or suppliers, or other acts that could lead to disruptions in our business. Any such failures could cause loss of data and interruptions or delays in our business, cause us to incur remediation costs, subject us to claims and damage our reputation. In addition, the failure or disruption of our communications or utilities could cause us to interrupt or suspend our operations or otherwise adversely affect our business. Our property and business interruption insurance may be inadequate to compensate us for all losses that may occur as a result of any system or operational failure or disruption which would adversely affect our business, results of operations and financial condition.
16
We may not have the ability to renew facilities leases on terms favorable to us and relocation of operations presents risks due to business interruption.
Certain of our manufacturing facilities and offices are leased and have lease terms that expire between 2019 and 2022. The majority of these leases provide renewal options at the fair market rental rate at the time of renewal, which, if renewed, could be significantly higher than our current rental rates. We may be unable to offset these cost increases by charging more for our products and services. Furthermore, continued economic conditions may continue to negatively impact and create greater pressure in the commercial real estate market, causing higher incidences of landlord default and/or lender foreclosure of properties, including properties occupied by us. While we maintain certain non-disturbance rights in most cases, it is not certain that such rights will in all cases be upheld and our continued right of occupancy in such instances is potentially jeopardized. An occurrence of any of these events could have a material adverse effect on our financial results.
Additionally, if we choose to move any of our operations, those operations will be subject to additional relocation costs and associated risks of business interruption.
The occurrence of litigation in which we could be named as a defendant is unpredictable.
From time to time, we and our subsidiaries are involved in various legal and other proceedings that are incidental to the conduct of our business. While we believe no current proceedings, if adversely determined, could have a material adverse effect on our financial results, no assurances can be given. Any such claims may divert financial and management resources that would otherwise be used to benefit our operations and could have a material adverse effect on our financial results.
Product liability claims in excess of insurance could adversely affect our financial results and financial condition.
We face potential liability for personal injury or death as a result of the failure of products designed or manufactured by us. Although we currently maintain product liability insurance (including aircraft product liability insurance), any material product liability not covered by insurance could have a material adverse effect on our financial condition, results of operations and cash flows.
Damage or destruction of our facilities caused by storms, earthquake or other causes could adversely affect our financial results and financial condition.
We have operations located in regions of the U.S. that may be exposed to damaging storms, earthquakes and other natural disasters. Although we maintain standard property casualty insurance covering our properties and may be able to recover costs associated with certain natural disasters through insurance, we do not carry any earthquake insurance because of the cost of such insurance. Many of our properties are located in Southern California, an area subject to earthquake activity. Our California facilities generated $185.3 million in net revenues during 2017. Even if covered by insurance, any significant damage or destruction of our facilities due to storms, earthquakes or other natural disasters could result in our inability to meet customer delivery schedules and may result in the loss of customers and significant additional costs to us. Thus, any significant damage or destruction of our properties could have a material adverse effect on our business, financial condition or results of operations.
We are dependent upon our ability to attract and retain key personnel.
Our success depends in part upon our ability to attract and retain key engineering, technical and managerial personnel, at both the executive and plant level. We face competition for management, engineering and technical personnel from other companies and organizations. The loss of members of our senior management group, or key engineering and technical personnel, could negatively impact our ability to grow and remain competitive in the future and could have a material adverse effect on our financial results.
17
Labor disruptions by our employees could adversely affect our business.
As of
December 31, 2017
, we employed
2,600
people. Two of our operating facilities are parties to collective bargaining agreements, covering
140
full time hourly employees in one of those facilities and
220
full time hourly employees in the other facility, and will expire in
June 2018
and
January 2019
, respectively. Although we have not experienced any material labor-related work stoppage and consider our relations with our employees to be good, labor stoppages may occur in the future. If the unionized workers were to engage in a strike or other work stoppage, if we are unable to negotiate acceptable collective bargaining agreements with the unions or if other employees were to become unionized, we could experience a significant disruption of our operations, higher ongoing labor costs and possible loss of customer contracts, which could have an adverse effect on our business and results of operations.
We have identified material weaknesses in the past in our internal controls over financial reporting which could, if not remediated, adversely impact the reliability of our financial reports, cause us to submit our financial reports in an untimely fashion, result in material misstatements in our financial statements and cause current and potential stockholders to lose confidence in our financial reporting, which in turn could adversely affect the trading price of our common stock.
In 2016, we concluded that there was a material weakness in our internal control over financial reporting related to the annual accounting for income taxes. There was an incorrect recording to a deferred tax asset of $1.6 million when this amount should have decreased our income tax benefit for the year and fourth quarter ended December 31, 2015. We assessed the materiality of this error and do not believe it is material to any prior interim or annual periods, however, we determined it was appropriate to revise our consolidated financial statements as of and for the year and quarter ended December 31, 2015 in this Form 10-K. Therefore, we have revised our December 31, 2015 consolidated balance sheet to increase non-current deferred tax liabilities by $1.6 million and revised our consolidated statement of operations for the year ended December 31, 2015 to increase our net loss by $1.6 million. We have also revised all related footnote disclosures in these consolidated financial statements to correct this error. This error had no effect on net cash provided by operating activities on our consolidated cash flow statement for the year ended December 31, 2015, however, we determined that our internal control over financial reporting relating to the annual accounting for income taxes was not effective as of December 31, 2016. This material weakness was remediated as of December 31, 2107.
Under standards established by the Public Company Accounting Oversight Board (“PCAOB”), a material weakness is a deficiency, or combination of deficiencies, in internal control over financial reporting, such that there is a reasonable possibility that a material misstatement of our annual or interim financial statements will not be prevented or detected and corrected on a timely basis.
When a material weakness occurs, we plan to complete the remediation process as quickly as possible. If our remedial measures are insufficient to address the material weakness, or if additional material weaknesses or significant deficiencies in our internal control over financial reporting are discovered or occur in the future, our consolidated financial statements may contain material misstatements and we could be required to restate our financial results. In addition, if we are unable to successfully remediate a material weakness and if we are unable to produce accurate and timely financial statements, our stock price may be adversely affected and we may be unable to maintain compliance with applicable stock exchange listing requirements and debt covenant requirements.
Unanticipated changes in our tax provision or exposure to additional income tax liabilities could affect our profitability.
Significant judgment is required in determining our provision for income taxes. In the ordinary course of our business, there are transactions and calculations where the ultimate tax determination is uncertain. Furthermore, changes in income tax laws and regulations, or their interpretation, could result in higher or lower income tax rates assessed or changes in the taxability of certain sales or the deductibility of certain expenses, thereby affecting our income tax expense and profitability. We recorded provisional estimates of the impact of the Tax Cuts and Jobs Act (the “2017 Tax Act”) enacted on December 22, 2017 in accordance with SEC Staff Accounting Bulletin No. 118 (“SAB 118”). These estimates are subject to further analysis and review which may result in material adjustments in 2018. In addition, we are regularly under audit by tax authorities. The final determination of tax audits and any related litigation could be materially different from our historical income tax provisions and accruals.
None.
18
We occupy 29 owned or leased facilities, totaling 2.1 million square feet of manufacturing area and office space. At
December 31, 2017
, facilities which were in excess of 50,000 square feet each were occupied as follows:
|
Location
|
Segment
|
Square
Feet
|
Expiration
of Lease
|
|||
|
Carson, California
|
Structural Systems
|
299,000
|
Owned
|
|||
|
Monrovia, California
|
Structural Systems
|
274,000
|
Owned
|
|||
|
Parsons, Kansas
|
Structural Systems
|
176,000
|
Owned
|
|||
|
Coxsackie, New York
|
Structural Systems
|
151,000
|
Owned
|
|||
|
Carson, California
|
Electronic Systems
|
117,000
|
2021
|
|||
|
Phoenix, Arizona
|
Electronic Systems
|
100,000
|
2022
|
|||
|
Joplin, Missouri
|
Electronic Systems
|
92,000
|
Owned
|
|||
|
Adelanto, California
|
Structural Systems
|
88,000
|
Owned
|
|||
|
Orange, California
|
Structural Systems
|
80,000
|
Owned
|
|||
|
Appleton, Wisconsin
|
Electronic Systems
|
77,000
|
Owned
|
|||
|
Carson, California
|
Structural Systems
|
77,000
|
2019
|
|||
|
Huntsville, Arkansas
|
Electronic Systems
|
69,000
|
2020
|
|||
|
Berryville, Arkansas
|
Electronic Systems
|
65,000
|
Owned
|
|||
|
Joplin, Missouri
|
Electronic Systems
|
55,000
|
2021
|
|||
|
Tulsa, Oklahoma
|
Electronic Systems
|
55,000
|
Owned
|
|||
|
Orange, California
|
Structural Systems
|
53,000
|
2019
|
|||
Management believes these properties are adequate to meet our current requirements, are in good condition and are suitable for their present use.
See Note 17 to our consolidated financial statements included in Part IV, Item 15(a) of this Annual Report on Form 10-K for a description of our legal proceedings.
Not applicable.
19
Our common stock is listed on the New York Stock Exchange under the symbol DCO. As of
December 31, 2017
, we had 178 holders of record of our common stock. We have not paid any dividends since the first quarter of 2011 and we do not expect to pay dividends for the foreseeable future. See “Available Liquidity” in Part II, Item 7, Management’s Discussion and Analysis—Liquidity and Capital Resources—Available Liquidity, of this Annual Report on Form 10-K for further discussion on dividend restrictions under our Credit Facility. The following table sets forth the high and low closing prices per share of our common stock as reported on the New York Stock Exchange for the fiscal periods indicated:
|
Years Ended December 31,
|
||||||||||||||||
|
2017
|
2016
|
|||||||||||||||
|
High
|
Low
|
High
|
Low
|
|||||||||||||
|
First Quarter
|
$
|
32.18
|
|
$
|
24.35
|
|
$
|
16.98
|
|
$
|
12.89
|
|
||||
|
Second Quarter
|
$
|
34.46
|
|
$
|
28.12
|
|
$
|
20.69
|
|
$
|
14.32
|
|
||||
|
Third Quarter
|
$
|
32.55
|
|
$
|
26.24
|
|
$
|
24.41
|
|
$
|
19.02
|
|
||||
|
Fourth Quarter
|
$
|
35.02
|
|
$
|
25.81
|
|
$
|
29.46
|
|
$
|
18.80
|
|
||||
See “Part III, Item 12. SECURITY OWNERSHIP OF CERTAIN BENEFICIAL OWNERS AND MANAGEMENT AND RELATED STOCKHOLDER MATTERS” for information relating to shares to be issued under equity compensation plans.
Issuer Purchases of Equity Securities
None.
20
Performance Graph
The following graph compares the yearly percentage change in our cumulative total shareholder return with the cumulative total return of the Russell 2000 Index and the Spade Index for the periods indicated, assuming the reinvestment of any dividends. The graph is not necessarily indicative of future price performance:
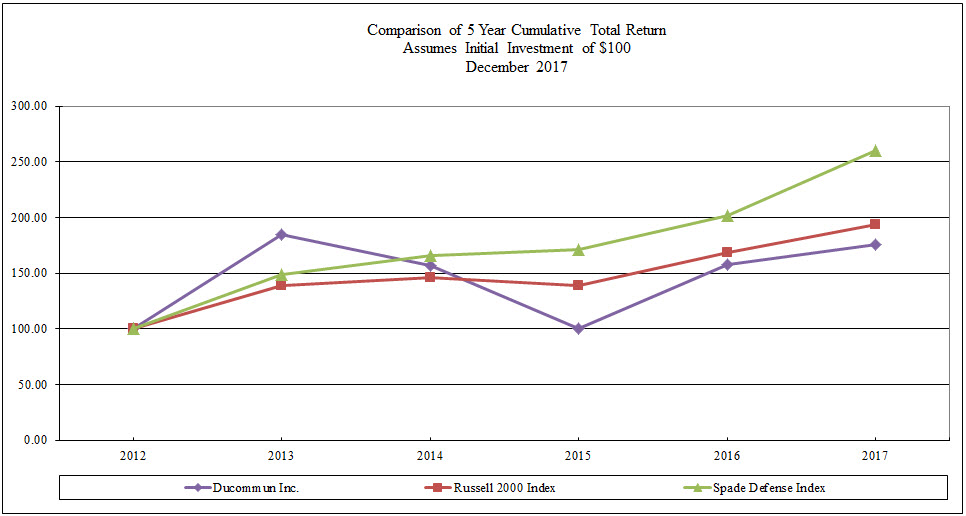
21
The following selected consolidated financial data should be read in conjunction with Part II, Item 7 and Part IV, Item 15(a) of this Annual Report on Form 10-K (“Form 10-K”):
|
(In thousands, except per share amounts)
Years Ended December 31,
|
||||||||||||||||||||
|
2017(a)(b)(c)
|
2016(d)
|
2015(e)(f)
|
2014
|
2013(g)
|
||||||||||||||||
|
Net Revenues
|
$
|
558,183
|
|
$
|
550,642
|
|
$
|
666,011
|
|
$
|
742,045
|
|
$
|
736,650
|
|
|||||
|
Gross Profit as a Percentage of Net Revenues
|
18.4
|
%
|
19.3
|
%
|
15.1
|
%
|
18.9
|
%
|
16.9
|
%
|
||||||||||
|
Income (Loss) Before Taxes
|
7,609
|
|
38,113
|
|
(106,590
|
)
|
26,240
|
|
9,385
|
|
||||||||||
|
Income Tax (Benefit) Expense
|
(12,468
|
)
|
12,852
|
|
(31,711
|
)
|
6,373
|
|
(1,993
|
)
|
||||||||||
|
Net Income (Loss)
|
$
|
20,077
|
|
$
|
25,261
|
|
$
|
(74,879
|
)
|
$
|
19,867
|
|
$
|
11,378
|
|
|||||
|
Per Common Share
|
||||||||||||||||||||
|
Basic earnings (loss) per share
|
$
|
1.78
|
|
$
|
2.27
|
|
$
|
(6.78
|
)
|
$
|
1.82
|
|
$
|
1.06
|
|
|||||
|
Diluted earnings (loss) per share
|
$
|
1.74
|
|
$
|
2.24
|
|
$
|
(6.78
|
)
|
$
|
1.79
|
|
$
|
1.05
|
|
|||||
|
Working Capital
|
$
|
140,778
|
|
$
|
139,635
|
|
$
|
179,655
|
|
$
|
217,670
|
|
$
|
225,323
|
|
|||||
|
Total Assets
(h)
|
$
|
566,753
|
|
$
|
515,429
|
|
$
|
557,081
|
|
$
|
747,599
|
|
$
|
762,645
|
|
|||||
|
Long-Term Debt, Including Current Portion
(h)
|
$
|
216,055
|
|
$
|
166,899
|
|
$
|
240,687
|
|
$
|
290,052
|
|
$
|
332,702
|
|
|||||
|
Total Shareholders’ Equity
|
$
|
235,583
|
|
$
|
212,103
|
|
$
|
185,734
|
|
$
|
256,570
|
|
$
|
234,271
|
|
|||||
|
(a)
|
The results for 2017 included LDS’ results of operations since the date of acquisition of September 2017.
|
|
(b)
|
The results for 2017 included the adoption of the Tax Cuts and Jobs Act and as a result, we recorded a provisional deferred income tax benefit of $13.0 million related to the re-measurement for the year ended December 31, 2017. See Note 16 to our consolidated financial statements included in Part IV, Item 15(a) of this Annual Report on Form 10-K for further information.
|
|
(c)
|
The results for 2017 included restructuring charges of $8.8 million. See Note 3 to our consolidated financial statements included in Part IV, Item 15(a) of this Annual Report on Form 10-K for further information.
|
|
(d)
|
The results for 2016 included a gain on divestitures, net in our Electronic Systems operating segment of
$17.6 million
related to the divestitures of our Pittsburgh and Miltec operations.
|
|
(e)
|
The results for 2015 included a goodwill impairment charge in our Structural Systems operating segment and an indefinite-lived trade name intangible asset impairment charge in our Electronic Systems operating segment of $57.2 million and $32.9 million, respectively, resulting from our annual impairment testing.
|
|
(f)
|
The results for 2015 included a loss on extinguishment of debt of $14.7 million related to the retirement of the $200.0 million senior unsecured notes and existing credit facility.
|
|
(g)
|
The results for 2013 included a $14.1 million in charges related to the Embraer Legacy 450/500 and Boeing 777 wing tip contracts and was comprised of $7.0 million of asset impairment charges for production cost of contracts; $5.2 million of forward loss reserves and $1.9 million of inventory write-offs.
|
|
(h)
|
Total assets and long-term debt for the years 2014 - 2013 have not been recasted for the impact of the adoption of Accounting Standards Update 2015-03, as amended by Accounting Standards Update 2015-15, which required the reclassification of certain debt issuance costs from an asset to a liability. See Note 1 to our consolidated financial statements included in Part IV, Item 15(a) of this Annual Report on Form 10-K for further information.
|
22
Overview
Ducommun Incorporated (“Ducommun,” “the Company,” “we,” “us” or “our”) is a leading global provider of engineering and manufacturing services for high-performance products and high-cost-of failure applications used primarily in the aerospace, defense, industrial, natural resources, medical and other industries. We differentiate ourselves as a full-service solution-based provider, offering a wide range of value-added products and services in our primary businesses of electronics, structures and integrated solutions. We operate through two primary business segments: Electronic Systems and Structural Systems, each of which is a reportable segment.
Recap of the year ended
December 31, 2017
:
|
•
|
Net revenues of
$558.2 million
|
|
•
|
Net income of
$20.1 million
, or
$1.74
per diluted share, which includes $12.5 million of income tax benefit primarily due to the adoption of the Tax Cuts and Jobs Act
|
|
•
|
Adjusted EBITDA of
$53.5 million
|
|
•
|
Backlog of
$726.5 million
|
|
•
|
Completed the acquisition of Lightning Diversion Systems, LLC
|
Non-GAAP Financial Measures
Adjusted earnings before interest, taxes, depreciation and amortization, and restructuring charges (“Adjusted EBITDA”) was
$53.5 million
and
$54.8 million
for years ended
December 31, 2017
and
December 31, 2016
, respectively.
When viewed with our financial results prepared in accordance with accounting principles generally accepted in the United States of America (“GAAP”) and accompanying reconciliations, we believe Adjusted EBITDA provides additional useful information to clarify and enhance the understanding of the factors and trends affecting our past performance and future prospects. We define these measures, explain how they are calculated and provide reconciliations of these measures to the most comparable GAAP measure in the table below. Adjusted EBITDA and the related financial ratios, as presented in this Annual Report on Form 10-K (“Form 10-K”), are supplemental measures of our performance that are not required by, or presented in accordance with, GAAP. They are not a measurement of our financial performance under GAAP and should not be considered as alternatives to net income or any other performance measures derived in accordance with GAAP, or as an alternative to net cash provided by operating activities as measures of our liquidity. The presentation of these measures should not be interpreted to mean that our future results will be unaffected by unusual or nonrecurring items.
We use Adjusted EBITDA non-GAAP operating performance measures internally as complementary financial measures to evaluate the performance and trends of our businesses. We present Adjusted EBITDA and the related financial ratios, as applicable, because we believe that measures such as these provide useful information with respect to our ability to meet our operating commitments.
Adjusted EBITDA has limitations as an analytical tool, and you should not consider it in isolation or as substitutes for analysis of our results as reported under GAAP. Some of these limitations are:
|
•
|
They do not reflect our cash expenditures, future requirements for capital expenditures or contractual commitments;
|
|
•
|
They do not reflect changes in, or cash requirements for, our working capital needs;
|
|
•
|
They do not reflect the significant interest expense or the cash requirements necessary to service interest or principal payments on our debt;
|
|
•
|
Although depreciation and amortization are non-cash charges, the assets being depreciated and amortized will often have to be replaced in the future, and Adjusted EBITDA does not reflect any cash requirements for such replacements;
|
|
•
|
They are not adjusted for all non-cash income or expense items that are reflected in our statements of cash flows;
|
|
•
|
They do not reflect the impact on earnings of charges resulting from matters unrelated to our ongoing operations; and
|
23
|
•
|
Other companies in our industry may calculate Adjusted EBITDA differently from us, limiting their usefulness as comparative measures.
|
Because of these limitations, Adjusted EBITDA and the related financial ratios should not be considered as measures of discretionary cash available to us to invest in the growth of our business or as a measure of cash that will be available to us to meet our obligations. You should compensate for these limitations by relying primarily on our GAAP results and using Adjusted EBITDA only as supplemental information. See our consolidated financial statements contained in this Form 10-K.
However, in spite of the above limitations, we believe that Adjusted EBITDA is useful to an investor in evaluating our results of operations because these measures:
|
•
|
Are widely used by investors to measure a company’s operating performance without regard to items excluded from the calculation of such terms, which can vary substantially from company to company depending upon accounting methods and book value of assets, capital structure and the method by which assets were acquired, among other factors;
|
|
•
|
Help investors to evaluate and compare the results of our operations from period to period by removing the effect of our capital structure from our operating performance; and
|
|
•
|
Are used by our management team for various other purposes in presentations to our Board of Directors as a basis for strategic planning and forecasting.
|
The following financial items have been added back to or subtracted from our net income when calculating Adjusted EBITDA:
|
•
|
Interest expense may be useful to investors for determining current cash flow;
|
|
•
|
Income tax expense may be useful to investors because it represents the taxes which may be payable for the period and the change in deferred taxes during the period, and may reduce cash flow available for use in our business;
|
|
•
|
Depreciation may be useful to investors because it generally represents the wear and tear on our property and equipment used in our operations;
|
|
•
|
Amortization expense may be useful to investors because it represents the estimated attrition of our acquired customer base and the diminishing value of product rights;
|
|
•
|
Stock-based compensation may be useful to our investors for determining current cash flow;
|
|
•
|
Restructuring charges may be useful to our investors in evaluating our core operating performance;
|
|
•
|
Purchase accounting inventory step-ups may be useful to our investors as they do not necessarily reflect the current or on-going cash charges related to our core operating performance;
|
|
•
|
Net gain on divestitures may be useful to our investors in evaluating our on-going operating performance;
|
|
•
|
Loss on extinguishment of debt may be useful to our investors for determining current cash flow;
|
|
•
|
Asset impairments (including goodwill and intangible assets) may be useful to our investors as it generally represents a decline in value in our assets used in our operations.
|
24
Reconciliations of net income (loss) to Adjusted EBITDA and the presentation of Adjusted EBITDA as a percentage of net revenues were as follows:
|
(In thousands)
Years Ended December 31,
|
||||||||||||
|
2017
|
2016
|
2015
|
||||||||||
|
Net income (loss)
|
$
|
20,077
|
|
$
|
25,261
|
|
$
|
(74,879
|
)
|
|||
|
Interest expense
|
8,261
|
|
8,274
|
|
18,709
|
|
||||||
|
Income tax (benefit) expense
|
(12,468
|
)
|
12,852
|
|
(31,711
|
)
|
||||||
|
Depreciation
|
13,162
|
|
13,326
|
|
15,707
|
|
||||||
|
Amortization
|
9,683
|
|
9,534
|
|
11,139
|
|
||||||
|
Stock-based compensation expense
|
4,675
|
|
3,007
|
|
3,495
|
|
||||||
|
Restructuring charges
(1)
|
8,838
|
|
182
|
|
2,125
|
|
||||||
|
Inventory purchase accounting adjustments
(2)
|
1,235
|
|
—
|
|
—
|
|
||||||
|
Gain on divestitures, net
(3)
|
—
|
|
(17,604
|
)
|
—
|
|
||||||
|
Loss on extinguishment of debt
|
—
|
|
—
|
|
14,720
|
|
||||||
|
Goodwill impairment
(4)
|
—
|
|
—
|
|
57,243
|
|
||||||
|
Intangible asset impairment
(5)
|
—
|
|
—
|
|
32,937
|
|
||||||
|
Adjusted EBITDA
|
$
|
53,463
|
|
$
|
54,832
|
|
$
|
49,485
|
|
|||
|
% of net revenues
|
9.6
|
%
|
10.0
|
%
|
7.4
|
%
|
||||||
|
(1)
|
2017 included $0.5 million of restructuring charges that were recorded as cost of goods sold.
|
|
(2)
|
2017 included inventory purchase accounting adjustments of inventory that was stepped up as part of our purchase price allocation from our acquisition of Lightning Diversion Systems, LLC (“LDS”) in September 2017 and is part of our Electronic Systems operating segment.
|
|
(3)
|
2016 included gain on divestitures, net in our Electronic Systems operating segment related to the divestitures of our Pittsburgh and Miltec operations.
|
|
(4)
|
2015 included goodwill impairment related to our Structural Systems operating segment.
|
|
(5)
|
2015 included intangible asset impairment related to our Electronic Systems operating segment.
|
25
RESULTS OF OPERATIONS
2017 Compared to 2016
The following table sets forth net revenues, selected financial data, the effective (benefit) tax rate and diluted earnings per share:
|
(in thousands, except per share data)
Years Ended December 31,
|
||||||||||||||
|
2017
|
%
of Net Revenues
|
2016
|
%
of Net Revenues
|
|||||||||||
|
Net Revenues
|
$
|
558,183
|
|
100.0
|
%
|
$
|
550,642
|
|
100.0
|
%
|
||||
|
Cost of Sales
|
455,363
|
|
81.6
|
%
|
444,449
|
|
80.7
|
%
|
||||||
|
Gross Profit
|
102,820
|
|
18.4
|
%
|
106,193
|
|
19.3
|
%
|
||||||
|
Selling, General and Administrative Expenses
|
79,435
|
|
14.2
|
%
|
77,443
|
|
14.1
|
%
|
||||||
|
Restructuring Charges
|
8,360
|
|
1.5
|
%
|
182
|
|
—
|
%
|
||||||
|
Operating Income
|
15,025
|
|
2.7
|
%
|
28,568
|
|
5.2
|
%
|
||||||
|
Interest Expense
|
(8,261
|
)
|
(1.5
|
)%
|
(8,274
|
)
|
(1.5
|
)%
|
||||||
|
Gain on Divestitures, Net
|
—
|
|
—
|
%
|
17,604
|
|
3.2
|
%
|
||||||
|
Other Income, Net
|
845
|
|
0.2
|
%
|
215
|
|
—
|
%
|
||||||
|
Income Before Taxes
|
7,609
|
|
1.4
|
%
|
38,113
|
|
6.9
|
%
|
||||||
|
Income Tax (Benefit) Expense
|
(12,468
|
)
|
nm
|
|
12,852
|
|
nm
|
|
||||||
|
Net Income
|
$
|
20,077
|
|
3.6
|
%
|
$
|
25,261
|
|
4.6
|
%
|
||||
|
Effective (Benefit) Tax Rate
|
(163.8
|
)%
|
nm
|
|
33.7
|
%
|
nm
|
|
||||||
|
Diluted Earnings Per Share
|
$
|
1.74
|
|
nm
|
|
$
|
2.24
|
|
nm
|
|
||||
nm = not meaningful
Net Revenues by End-Use Market and Operating Segment
Net revenues by end-use market and operating segment during 2017 and 2016, respectively, were as follows:
|
(In thousands)
Years Ended December 31,
|
% of Net Revenues
|
|||||||||||||||||
|
Change
|
2017
|
2016
|
2017
|
2016
|
||||||||||||||
|
Consolidated Ducommun
|
||||||||||||||||||
|
Military and space
|
||||||||||||||||||
|
Defense electronics
|
$
|
25,979
|
|
$
|
203,164
|
|
$
|
177,185
|
|
36.4
|
%
|
32.2
|
%
|
|||||
|
Defense structures
|
4,662
|
|
56,392
|
|
51,730
|
|
10.1
|
%
|
9.4
|
%
|
||||||||
|
Commercial aerospace
|
(15,899
|
)
|
240,735
|
|
256,634
|
|
43.1
|
%
|
46.6
|
%
|
||||||||
|
Industrial
|
(7,201
|
)
|
57,892
|
|
65,093
|
|
10.4
|
%
|
11.8
|
%
|
||||||||
|
Total
|
$
|
7,541
|
|
$
|
558,183
|
|
$
|
550,642
|
|
100.0
|
%
|
100.0
|
%
|
|||||
|
Structural Systems
|
||||||||||||||||||
|
Military and space (defense structures)
|
$
|
4,662
|
|
$
|
56,392
|
|
$
|
51,730
|
|
23.4
|
%
|
21.0
|
%
|
|||||
|
Commercial aerospace
|
(9,667
|
)
|
185,068
|
|
194,735
|
|
76.6
|
%
|
79.0
|
%
|
||||||||
|
Total
|
$
|
(5,005
|
)
|
$
|
241,460
|
|
$
|
246,465
|
|
100.0
|
%
|
100.0
|
%
|
|||||
|
Electronic Systems
|
||||||||||||||||||
|
Military and space (defense electronics)
|
$
|
25,979
|
|
$
|
203,164
|
|
$
|
177,185
|
|
64.1
|
%
|
58.3
|
%
|
|||||
|
Commercial aerospace
|
(6,232
|
)
|
55,667
|
|
61,899
|
|
17.6
|
%
|
20.3
|
%
|
||||||||
|
Industrial
|
(7,201
|
)
|
57,892
|
|
65,093
|
|
18.3
|
%
|
21.4
|
%
|
||||||||
|
Total
|
$
|
12,546
|
|
$
|
316,723
|
|
$
|
304,177
|
|
100.0
|
%
|
100.0
|
%
|
|||||
26
Net revenues for 2017 were
$558.2 million
compared to
$550.6 million
for 2016. The year-over-year increase was primarily due to the following:
|
•
|
$30.6 million higher revenues in our military and space end-use markets mainly due to increased demand, which favorably impacted our helicopter, missile, and fixed-wing platforms that was partially offset by the divestiture of our Miltec operations in March 2016; partially offset by
|
|
•
|
$15.9 million lower revenues in our commercial aerospace end-use markets mainly due to the winding down of a regional jet program and continued softness in demand within the regional and business jet end-use markets; and
|
|
•
|
$7.2 million lower revenues in our industrial end-use markets.
|
Net Revenues by Major Customers
A significant portion of our net revenues are from our top ten customers as follows:
|
Years Ended December 31,
|
||||||
|
2017
|
2016
|
|||||
|
Boeing Company
|
16.4
|
%
|
17.3
|
%
|
||
|
Lockheed Martin Corporation
|
5.5
|
%
|
5.6
|
%
|
||
|
Raytheon Company
|
13.5
|
%
|
8.4
|
%
|
||
|
Spirit AeroSystems Holdings, Inc.
|
8.2
|
%
|
8.2
|
%
|
||
|
United Technologies Corporation
|
4.7
|
%
|
5.3
|
%
|
||
|
Top ten customers
(1)
|
62.5
|
%
|
58.6
|
%
|
||
(1) Includes The Boeing Company (“Boeing”), Lockheed Martin Corporation (“Lockheed Martin”), Raytheon Company (“Raytheon”), Spirit AeroSystems Holdings, Inc. (“Spirit”), and United Technologies Corporation (“United Technologies”).
The revenues from Boeing, Lockheed Martin, Raytheon, Spirit, and United Technologies are diversified over a number of commercial, military and space programs and were made by both operating segments.
Gross Profit
Gross profit consists of net revenues less cost of sales. Cost of sales includes the cost of production of finished products and other expenses related to inventory management, manufacturing quality, and order fulfillment. Gross profit margin decreased to 18.4% in 2017 compared to 19.3% in 2016 primarily due to unfavorable product mix, partially offset by higher volume.
Selling, General and Administrative (“SG&A”) Expenses
SG&A expenses increased $2.0 million in 2017 compared to 2016 primarily due to the higher compensation and benefit costs of $3.1 million, partially offset by a decrease due to the divestitures of our Pittsburgh and Miltec operations and closure of certain facilities of $1.3 million.
Restructuring Charges
Restructuring charges increased $8.7 million (of which $0.5 million was included in cost of sales) in 2017 compared to 2016 primarily due to the restructuring plan that was implemented in 2017 that is expected to increase operating efficiencies. See Note 3 to our consolidated financial statements included in Part IV, Item 15(a) of this Annual Report on Form 10-K for further information on restructuring activities.
Interest Expense
Interest expense was essentially flat in 2017 compared to 2016 primarily due to a lower outstanding Term Loan balance a result of voluntary principal prepayments on our credit facilities, offset by higher utilization of the Revolving Credit Facility, including the acquisition of LDS. See Note 10 to our consolidated financial statements included in Part IV, Item 15(a) of this Annual Report on Form 10-K for further information on our long-term debt.
Income Tax Expense
We recorded an income tax benefit of
$12.5 million
(an effective tax benefit rate of
163.8%
) in 2017, compared to income tax expense of
$12.9 million
(an effective tax rate of
33.7%
) in 2016. The decrease in the effective tax rate for 2017 compared to 2016 was primarily due to $13.0 million of provisional deferred income tax benefit recorded in connection with the Tax Cuts
27
and Jobs Act (the “2017 Tax Act”). The reduction in the U.S. corporate tax rate from 35.0% to 21.0% required the federal portion of our deferred tax assets and liabilities at December 31, 2017 to be re-measured at the enacted tax rate expected to apply when the temporary differences are to be realized or settled using 21.0%. In addition, the pre-tax income in 2017 was lower compared to 2016 pre-tax income which caused tax incentives such as research and development tax credits and discrete items to have a greater impact on our effective tax rate.
Our unrecognized tax benefits were $5.3 million and $3.0 million in 2017 and 2016, respectively. We record interest and penalty charge, if any, related to uncertain tax positions as a component of tax expense and unrecognized tax benefits. The amounts accrued for interest and penalty charges as of December 31, 2017 and 2016 were not significant. If recognized, $3.4 million would affect the effective tax rate. We do not reasonably expect significant increases or decreases to our unrecognized tax benefits in the next twelve months.
We file U.S. Federal and state income tax returns. During the fourth quarter of 2017, the Internal Revenue Service (“IRS”) completed the audit of tax years 2013, 2014, and 2015. Consequently, Federal income tax returns after 2015 are subject to examination. California franchise (income) tax returns after 2012 and other state income tax returns after 2012 are subject to examination. While we are no longer subject to examination prior to those periods, carryforwards generated prior to those periods may still be adjusted upon examination by the IRS or state taxing authority if they either have been or will be used in a subsequent period. We believe we have adequately accrued for tax deficiencies or reductions in tax benefits, if any, that could result from the examination and all open audit years.
Net Income and Earnings per Diluted Share
Net income and earnings per diluted share for 2017 were
$20.1 million
, or
$1.74
, compared to net income and earnings per diluted share for 2016 were
$25.3 million
, or
$2.24
. The decrease in net income in 2017 compared to 2016 was primarily due to the following:
|
•
|
Prior year included a pre-tax gain on divestitures, net of our Pittsburgh and Miltec operations of $17.6 million;
|
|
•
|
Higher restructuring charges of $8.7 million (of which $0.5 million is included in cost of sales)
|
|
•
|
Lower gross profit of $2.9 million (which excludes $0.5 million of restructuring charges in cost of sales); and
|
|
•
|
Higher SG&A expenses of $2.0 million; partially offset by
|
|
•
|
Lower income tax expense of $25.3 million.
|
28
Business Segment Performance
We report our financial performance based upon the two reportable operating segments: Structural Systems and Electronic Systems. The results of operations differ between our reportable operating segments due to differences in competitors, customers, extent of proprietary deliverables and performance. The following table summarizes our business segment performance for
2017
and
2016
:
|
%
|
(In thousands)
Years Ended December 31,
|
%
of Net Revenues
|
%
of Net Revenues
|
||||||||||||||
|
Change
|
2017
|
2016
|
2017
|
2016
|
|||||||||||||
|
Net Revenues
|
|||||||||||||||||
|
Structural Systems
|
(2.0
|
)%
|
$
|
241,460
|
|
$
|
246,465
|
|
43.3
|
%
|
44.8
|
%
|
|||||
|
Electronic Systems
|
4.1
|
%
|
316,723
|
|
304,177
|
|
56.7
|
%
|
55.2
|
%
|
|||||||
|
Total Net Revenues
|
1.4
|
%
|
$
|
558,183
|
|
$
|
550,642
|
|
100.0
|
%
|
100.0
|
%
|
|||||
|
Segment Operating Income
|
|||||||||||||||||
|
Structural Systems
|
$
|
5,477
|
|
$
|
16,497
|
|
2.3
|
%
|
6.7
|
%
|
|||||||
|
Electronic Systems
|
30,940
|
|
28,983
|
|
9.8
|
%
|
9.5
|
%
|
|||||||||
|
36,417
|
|
45,480
|
|
||||||||||||||
|
Corporate General and Administrative Expenses
(1)
|
(21,392
|
)
|
(16,912
|
)
|
(3.8
|
)%
|
(3.1
|
)%
|
|||||||||
|
Total Operating Income
|
$
|
15,025
|
|
$
|
28,568
|
|
2.7
|
%
|
5.2
|
%
|
|||||||
|
Adjusted EBITDA
|
|||||||||||||||||
|
Structural Systems
|
|||||||||||||||||
|
Operating Income
|
$
|
5,477
|
|
$
|
16,497
|
|
|||||||||||
|
Other Income
|
200
|
|
141
|
|
|||||||||||||
|
Depreciation and Amortization
|
8,860
|
|
8,688
|
|
|||||||||||||
|
Restructuring Charges
|
5,866
|
|
—
|
|
|||||||||||||
|
20,403
|
|
25,326
|
|
8.4
|
%
|
10.3
|
%
|
||||||||||
|
Electronic Systems
|
|||||||||||||||||
|
Operating Income
|
30,940
|
|
28,983
|
|
|||||||||||||
|
Other Income
|
645
|
|
—
|
|
|||||||||||||
|
Depreciation and Amortization
|
13,888
|
|
14,087
|
|
|||||||||||||
|
Restructuring Charges
|
1,190
|
|
182
|
|
|||||||||||||
|
Inventory purchase accounting adjustments
|
1,235
|
|
—
|
|
|||||||||||||
|
47,898
|
|
43,252
|
|
15.1
|
%
|
14.2
|
%
|
||||||||||
|
Corporate General and Administrative Expenses
(1)
|
|||||||||||||||||
|
Operating Loss
|
(21,392
|
)
|
(16,912
|
)
|
|||||||||||||
|
Other Income
|
—
|
|
74
|
|
|||||||||||||
|
Depreciation and Amortization
|
97
|
|
85
|
|
|||||||||||||
|
Stock-Based Compensation Expense
|
4,675
|
|
3,007
|
|
|||||||||||||
|
Restructuring Charges
|
1,782
|
|
—
|
|
|||||||||||||
|
(14,838
|
)
|
(13,746
|
)
|
||||||||||||||
|
Adjusted EBITDA
|
$
|
53,463
|
|
$
|
54,832
|
|
9.6
|
%
|
10.0
|
%
|
|||||||
|
Capital Expenditures
|
|||||||||||||||||
|
Structural Systems
|
$
|
20,679
|
|
$
|
15,661
|
|
|||||||||||
|
Electronic Systems
|
5,019
|
|
3,032
|
|
|||||||||||||
|
Corporate Administration
|
775
|
|
—
|
|
|||||||||||||
|
Total Capital Expenditures
|
$
|
26,473
|
|
$
|
18,693
|
|
|||||||||||
|
(1)
|
Includes costs not allocated to either the Structural Systems or Electronic Systems operating segments.
|
29
Structural Systems
Structural Systems’ net revenues in 2017 compared to 2016 decreased $5.0 million primarily due to the following:
|
•
|
$9.7 million lower revenues in commercial aerospace end-use markets mainly due to the wind down of a regional jet program and continued softness in demand within the regional and business jet end-use markets; partially offset by
|
|
•
|
$4.7 million higher revenues in military and space end-use markets mainly due to increased demand which favorably impacted our helicopter platforms.
|
The Structural Systems operating income in 2017 compared to 2016 decreased primarily due to restructuring charges of $5.9 million, the impact of new program development on large airframe platforms, and lower manufacturing volume.
Electronic Systems
Electronic Systems’ net revenues in 2017 compared to 2016 increased $12.5 million primarily due to the following:
|
•
|
$25.9 million higher revenues in our military and space end-use markets mainly due to increased demand, which favorably impacted our missile, fixed-wing, and helicopter platforms; partially offset by
|
|
•
|
$7.2 million lower revenues in our Industrial end-use markets; and
|
|
•
|
$6.2 million lower revenues in our commercial aerospace end-use markets mainly due to continued softness in demand in the business jet market.
|
Electronic Systems segment operating income
in 2017 compared to 2016 increased primarily due to higher manufacturing volume, partially offset by restructuring charges of $1.2 million and unfavorable product mix.
Corporate General and Administrative (“CG&A”) Expenses
CG&A expenses in 2017 compared to 2016 increased primarily due to higher compensation and benefit costs of $3.1 million and restructuring charges of $1.8 million.
30
Backlog
We define backlog as customer placed purchase orders (“POs”) and long-term agreements (“LTAs”) with firm fixed price and firm delivery dates of 24 months or less. Backlog is subject to delivery delays and program cancellations, which are beyond our control. Backlog is affected by timing differences in the placement of customer orders and tends to be concentrated in several programs to a greater extent than our net sales. Backlog in Industrial end-use markets tends to be of a shorter duration and is generally fulfilled within a 3-month period. As a result of these factors, trends in our overall level of backlog may not be indicative of trends in our future net sales.
Backlog was
$726.5 million
at
December 31, 2017
, compared to
$641.3 million
at
December 31, 2016
, as shown in more detail below. The increase in backlog was primarily in the commercial aerospace end-use markets and defense technologies end-use markets.
$544.0 million
of total backlog is expected to be delivered during
2018
. The following table summarizes our backlog for
2017
and
2016
:
|
(In thousands)
December 31,
|
||||||||||||
|
Change
|
2017
|
2016
|
||||||||||
|
Consolidated Ducommun
|
||||||||||||
|
Military and space
|
||||||||||||
|
Defense electronics
|
$
|
18,931
|
|
$
|
216,508
|
|
$
|
197,577
|
|
|||
|
Defense structures
|
2,044
|
|
60,921
|
|
58,877
|
|
||||||
|
Commercial aerospace
|
60,313
|
|
417,981
|
|
357,668
|
|
||||||
|
Industrial
|
3,938
|
|
31,068
|
|
27,130
|
|
||||||
|
Total
|
$
|
85,226
|
|
$
|
726,478
|
|
$
|
641,252
|
|
|||
|
Structural Systems
|
||||||||||||
|
Military and space (defense structures)
|
$
|
2,044
|
|
$
|
60,921
|
|
$
|
58,877
|
|
|||
|
Commercial aerospace
|
42,068
|
|
361,586
|
|
319,518
|
|
||||||
|
Total
|
$
|
44,112
|
|
$
|
422,507
|
|
$
|
378,395
|
|
|||
|
Electronic Systems
|
||||||||||||
|
Military and space (defense electronics)
|
$
|
18,931
|
|
$
|
216,508
|
|
$
|
197,577
|
|
|||
|
Commercial aerospace
|
18,245
|
|
56,395
|
|
38,150
|
|
||||||
|
Industrial
|
3,938
|
|
31,068
|
|
27,130
|
|
||||||
|
Total
|
$
|
41,114
|
|
$
|
303,971
|
|
$
|
262,857
|
|
|||
31
2016 Compared to 2015
The following table sets forth net revenues, selected financial data, the effective tax (benefit) rate and diluted earnings (loss) per share:
|
(in thousands, except per share data)
Years Ended December 31,
|
||||||||||||||
|
2016
|
%
of Net Revenues 2016
|
2015
|
%
of Net Revenues 2015
|
|||||||||||
|
Net Revenues
|
$
|
550,642
|
|
100.0
|
%
|
$
|
666,011
|
|
100.0
|
%
|
||||
|
Cost of Sales
|
444,449
|
|
80.7
|
%
|
565,219
|
|
84.9
|
%
|
||||||
|
Gross Profit
|
106,193
|
|
19.3
|
%
|
100,792
|
|
15.1
|
%
|
||||||
|
Selling, General and Administrative Expenses
|
77,443
|
|
14.1
|
%
|
83,796
|
|
12.6
|
%
|
||||||
|
Goodwill Impairment
|
—
|
|
—
|
%
|
57,243
|
|
8.6
|
%
|
||||||
|
Intangible Asset Impairment
|
—
|
|
—
|
%
|
32,937
|
|
4.9
|
%
|
||||||
|
Restructuring Charges
|
182
|
|
—
|
%
|
2,125
|
|
0.3
|
%
|
||||||
|
Operating Income (Loss)
|
28,568
|
|
5.2
|
%
|
(75,309
|
)
|
(11.3
|
)%
|
||||||
|
Interest Expense
|
(8,274
|
)
|
(1.5
|
)%
|
(18,709
|
)
|
(2.8
|
)%
|
||||||
|
Gain on Divestitures, Net
|
17,604
|
|
3.2
|
%
|
—
|
|
—
|
%
|
||||||
|
Loss on Extinguishment of Debt
|
—
|
|
—
|
%
|
(14,720
|
)
|
(2.2
|
)%
|
||||||
|
Other Income
|
215
|
|
—
|
%
|
2,148
|
|
0.3
|
%
|
||||||
|
Income (Loss) Before Taxes
|
38,113
|
|
6.9
|
%
|
(106,590
|
)
|
(16.0
|
)%
|
||||||
|
Income Tax Expense (Benefit)
|
12,852
|
|
nm
|
|
(31,711
|
)
|
nm
|
|
||||||
|
Net Income (Loss)
|
$
|
25,261
|
|
4.6
|
%
|
$
|
(74,879
|
)
|
(11.2
|
)%
|
||||
|
Effective Tax (Benefit) Rate
|
33.7
|
%
|
nm
|
|
(29.7
|
)%
|
nm
|
|
||||||
|
Diluted Earnings (Loss) Per Share
|
$
|
2.24
|
|
nm
|
|
$
|
(6.78
|
)
|
nm
|
|
||||
nm = not meaningful
32
Net Revenues by End-Use Market and Operating Segment
Net revenues by end-use market and operating segment during
2016
and
2015
, respectively, were as follows:
|
(In thousands)
Years Ended December 31,
|
% of Net Revenues
|
|||||||||||||||||
|
Change
|
2016
|
2015
|
2016
|
2015
|
||||||||||||||
|
Consolidated Ducommun
|
||||||||||||||||||
|
Military and space
|
||||||||||||||||||
|
Defense electronics
|
$
|
(35,352
|
)
|
$
|
177,185
|
|
$
|
212,537
|
|
32.2
|
%
|
31.9
|
%
|
|||||
|
Defense structures
|
(23,364
|
)
|
51,730
|
|
75,094
|
|
9.4
|
%
|
11.3
|
%
|
||||||||
|
Commercial aerospace
|
7,333
|
|
256,634
|
|
249,301
|
|
46.6
|
%
|
37.4
|
%
|
||||||||
|
Industrial
|
(63,986
|
)
|
65,093
|
|
129,079
|
|
11.8
|
%
|
19.4
|
%
|
||||||||
|
Total
|
$
|
(115,369
|
)
|
$
|
550,642
|
|
$
|
666,011
|
|
100.0
|
%
|
100.0
|
%
|
|||||
|
Structural Systems
|
||||||||||||||||||
|
Military and space (defense structures)
|
$
|
(23,364
|
)
|
$
|
51,730
|
|
$
|
75,094
|
|
21.0
|
%
|
27.5
|
%
|
|||||
|
Commercial aerospace
|
(3,490
|
)
|
194,735
|
|
198,225
|
|
79.0
|
%
|
72.5
|
%
|
||||||||
|
Total
|
$
|
(26,854
|
)
|
$
|
246,465
|
|
$
|
273,319
|
|
100.0
|
%
|
100.0
|
%
|
|||||
|
Electronic Systems
|
||||||||||||||||||
|
Military and space (defense electronics)
|
$
|
(35,352
|
)
|
$
|
177,185
|
|
$
|
212,537
|
|
58.3
|
%
|
54.1
|
%
|
|||||
|
Commercial aerospace
|
10,823
|
|
61,899
|
|
51,076
|
|
20.3
|
%
|
13.0
|
%
|
||||||||
|
Industrial
|
(63,986
|
)
|
65,093
|
|
129,079
|
|
21.4
|
%
|
32.9
|
%
|
||||||||
|
Total
|
$
|
(88,515
|
)
|
$
|
304,177
|
|
$
|
392,692
|
|
100.0
|
%
|
100.0
|
%
|
|||||
Net revenues for 2016 were
$550.6 million
compared to
$666.0 million
for 2015. The year-over-year decrease was primarily due to the following:
|
•
|
$64.0 million lower revenues in our industrial end-use markets mainly due to the divestiture of our Pittsburgh operation in January 2016 and closure of our Houston operation in December 2015;
|
|
•
|
$58.7 million lower revenues in our military and space end-use markets mainly due to the divestiture of our Miltec operations in March 2016, as well as program delays and budget changes, which impacted our fixed-wing and helicopter platforms and pushed out scheduled deliveries of these products to customers; partially offset by
|
|
•
|
$7.3 million higher revenues in our commercial aerospace end-use markets mainly due to added content with existing customers.
|
Net Revenues by Major Customers
A significant portion of our net revenues are from our top ten customers as follows:
|
Years Ended December 31,
|
||||||
|
2016
|
2015
|
|||||
|
Boeing
|
17.3
|
%
|
16.0
|
%
|
||
|
Lockheed Martin
|
5.6
|
%
|
1.2
|
%
|
||
|
Raytheon
|
8.4
|
%
|
8.7
|
%
|
||
|
Spirit
|
8.2
|
%
|
7.4
|
%
|
||
|
United Technologies
|
5.3
|
%
|
6.1
|
%
|
||
|
Top ten customers
(1)
|
58.6
|
%
|
55.7
|
%
|
||
(1) Includes Boeing, Raytheon, Spirit, and United Technologies for 2016 and 2015 and Lockheed Martin for 2016.
The revenues from Boeing, Lockheed Martin, Raytheon, Spirit, and United Technologies are diversified over a number of commercial, military and space programs and were made by both operating segments.
33
Gross Profit
Gross profit consists of net revenues less cost of sales. Cost of sales includes the cost of production of finished products and other expenses related to inventory management, manufacturing quality, and order fulfillment. Gross profit margin increased to 19.3% in 2016 compared to 15.1% in 2015 primarily due to the following:
|
•
|
2015 included a forward loss reserve charge related to a regional jet program of $12.2 million; and
|
|
•
|
Total material costs as a percentage of revenues decreased 1.8% compared to the prior year as a result of our on-going supply chain initiatives and improved operating performance.
|
Selling, General and Administrative Expenses
SG&A expenses decreased $6.4 million in 2016 compared to 2015 primarily due to the decrease of $9.4 million related to the divestitures of our Pittsburgh and Miltec operations and closures of facilities.
Interest Expense
Interest expense decreased in 2016 compared to 2015 primarily due to a lower outstanding debt balance as a result of net voluntary principal prepayments on our new credit facilities and a lower average interest rate as a result of completing the refinancing of our debt in July 2015. See Note 10 to our consolidated financial statements included in Part IV, Item 15(a) of this Annual Report on Form 10-K for further information on our long-term debt.
Income Tax Expense (Benefit)
We recorded income tax expense of
$12.9 million
(an effective tax rate of
33.7%
) in 2016, compared to an income tax benefit of
$31.7 million
(an effective tax benefit rate of
29.7%
) in 2015. The increase in the effective tax rate for 2016 compared to 2015 was primarily due to pre-tax income in 2016, which included a gain on divestitures, net of our Pittsburgh and Miltec operations of $17.6 million compared to a pre-tax loss in the prior year. The $17.6 million gain on divestitures, net resulted in an increase in our state tax liability in 2016. The increase was partially offset by the U.S. Federal research and development tax credit that was permanently extended in 2015 and the deduction for Qualified Domestic Production Activities.
Our unrecognized tax benefits were $3.0 million in both 2016 and 2015. We record interest and penalty charge, if any, related to uncertain tax positions as a component of tax expense and unrecognized tax benefits. The amounts accrued for interest and penalty charge as of December 31, 2016 and 2015 were not significant. If recognized, $2.0 million would affect the effective tax rate. We do not reasonably expect significant increases or decreases to our unrecognized tax benefits in the next twelve months.
We file U.S. Federal and state income tax returns. Federal income tax returns after 2012, California franchise (income) tax returns after 2011 and other state income tax returns after 2011 are subject to examination. We are no longer subject to examination prior to those periods, although carryforwards generated prior to those periods may still be adjusted upon examination by the Internal Revenue Service (“IRS”) or state taxing authority if they either have been or will be used in a subsequent period. During 2016, the IRS commenced an audit of our 2014 and 2015 tax years. Although the outcome of tax examinations cannot be predicted with certainty, we believe we have adequately accrued for tax deficiencies or reductions in tax benefits, if any, that could result from the examination and all open audit years.
34
Net Income (Loss) and Earnings (Loss) per Diluted Share
Net income and income per diluted share for 2016 were
$25.3 million
, or
$2.24
per diluted share, compared to a net loss and loss per share for 2015 were
$(74.9) million
, or
$(6.78)
. The increase in net income in 2016 compared to 2015 was primarily due to the following:
|
•
|
Prior year included a non-cash pre-tax goodwill impairment charge of $57.2 million;
|
|
•
|
Prior year included a non-cash pre-tax charge related to the impairment of an indefinite-lived trade name of $32.9 million;
|
|
•
|
Prior year included a loss on extinguishment of debt of $14.7 million related to completing a new credit facility to replace the existing credit facilities along with the redemption of the $200.0 million senior unsecured notes;
|
|
•
|
Prior year included a forward loss reserve charge related to a regional jet program of $12.2 million;
|
|
•
|
A pre-tax gain on divestitures, net of our Pittsburgh and Miltec operations of $17.6 million;
|
|
•
|
Lower interest expense of $10.4 million;
|
|
•
|
Lower SG&A expenses related to the divestitures of our Pittsburgh and Miltec operations and closures of facilities in aggregate totaling $9.4 million; and
|
|
•
|
Improved operating performance; partially offset by
|
|
•
|
Higher income tax expense of $44.6 million.
|
35
Business Segment Performance
We report our financial performance based upon the two reportable operating segments; Structural Systems and Electronic Systems. The results of operations differ between our reportable operating segments due to differences in competitors, customers, extent of proprietary deliverables and performance. The following table summarizes our business segment performance for
2016
and
2015
:
|
%
|
(In thousands)
Years Ended December 31,
|
%
of Net Revenues
|
%
of Net Revenues
|
||||||||||||||
|
Change
|
2016
|
2015
|
2016
|
2015
|
|||||||||||||
|
Net Revenues
|
|||||||||||||||||
|
Structural Systems
|
(9.8
|
)%
|
$
|
246,465
|
|
$
|
273,319
|
|
44.8
|
%
|
41.0
|
%
|
|||||
|
Electronic Systems
|
(22.5
|
)%
|
304,177
|
|
392,692
|
|
55.2
|
%
|
59.0
|
%
|
|||||||
|
Total Net Revenues
|
(17.3
|
)%
|
$
|
550,642
|
|
$
|
666,011
|
|
100.0
|
%
|
100.0
|
%
|
|||||
|
Segment Operating Income (Loss)
|
|||||||||||||||||
|
Structural Systems
|
$
|
16,497
|
|
$
|
(53,010
|
)
|
6.7
|
%
|
(19.4
|
)%
|
|||||||
|
Electronic Systems
|
28,983
|
|
(4,472
|
)
|
9.5
|
%
|
(1.1
|
)%
|
|||||||||
|
45,480
|
|
(57,482
|
)
|
||||||||||||||
|
Corporate General and Administrative Expenses
(1)
|
(16,912
|
)
|
(17,827
|
)
|
(3.1
|
)%
|
(2.7
|
)%
|
|||||||||
|
Total Operating Income (Loss)
|
$
|
28,568
|
|
$
|
(75,309
|
)
|
5.2
|
%
|
(11.3
|
)%
|
|||||||
|
Adjusted EBITDA
|
|||||||||||||||||
|
Structural Systems
|
|||||||||||||||||
|
Operating Income (Loss)
(2)(3)
|
$
|
16,497
|
|
$
|
(53,010
|
)
|
|||||||||||
|
Other Income
(4)
|
141
|
|
1,510
|
|
|||||||||||||
|
Depreciation and Amortization
|
8,688
|
|
9,417
|
|
|||||||||||||
|
Goodwill Impairment
|
—
|
|
57,243
|
|
|||||||||||||
|
Restructuring Charges
|
—
|
|
1,294
|
|
|||||||||||||
|
25,326
|
|
16,454
|
|
10.3
|
%
|
6.0
|
%
|
||||||||||
|
Electronic Systems
|
|||||||||||||||||
|
Operating Income (Loss)
(3)(5)
|
28,983
|
|
(4,472
|
)
|
|||||||||||||
|
Other Income
|
—
|
|
712
|
|
|||||||||||||
|
Depreciation and Amortization
|
14,087
|
|
17,267
|
|
|||||||||||||
|
Intangible Asset Impairment
|
—
|
|
32,937
|
|
|||||||||||||
|
Restructuring Charges
|
182
|
|
831
|
|
|||||||||||||
|
43,252
|
|
47,275
|
|
14.2
|
%
|
12.0
|
%
|
||||||||||
|
Corporate General and Administrative Expenses
(1)
|
|||||||||||||||||
|
Operating Loss
|
(16,912
|
)
|
(17,827
|
)
|
|||||||||||||
|
Other Income (Expense)
|
74
|
|
(74
|
)
|
|||||||||||||
|
Depreciation and Amortization
|
85
|
|
162
|
|
|||||||||||||
|
Stock-Based Compensation Expense
|
3,007
|
|
3,495
|
|
|||||||||||||
|
(13,746
|
)
|
(14,244
|
)
|
||||||||||||||
|
Adjusted EBITDA
|
$
|
54,832
|
|
$
|
49,485
|
|
10.0
|
%
|
7.4
|
%
|
|||||||
|
Capital Expenditures
|
|||||||||||||||||
|
Structural Systems
|
$
|
15,661
|
|
$
|
11,559
|
|
|||||||||||
|
Electronic Systems
|
3,032
|
|
4,419
|
|
|||||||||||||
|
Corporate Administration
|
—
|
|
10
|
|
|||||||||||||
|
Total Capital Expenditures
|
$
|
18,693
|
|
$
|
15,988
|
|
|||||||||||
36
|
(1)
|
Includes costs not allocated to either the Structural Systems or Electronic Systems operating segments.
|
|
(2)
|
Goodwill impairment related to Structural Systems operating segment.
|
|
(3)
|
2015 includes restructuring charges for severance and benefits and loss on early exit from leases of $0.8 million and $1.3 million recorded in the Electronic Systems and Structural Systems operating segments, respectively.
|
|
(4)
|
Insurance recoveries related to property and equipment included as other income.
|
|
(5)
|
Intangible asset impairment related to Electronic Systems operating segment.
|
Structural Systems
Structural Systems’ net revenues in 2016 compared to 2015 decreased $26.9 million primarily due to the following:
|
•
|
$23.4 million decrease in military and space revenues mainly due to program delays and budget changes which impacted scheduled deliveries on our fixed-wing and helicopter platforms; and
|
|
•
|
$3.5 million decrease in commercial aerospace revenues mainly due to the wind down of a regional jet program and continued softness in the commercial helicopter end-use market.
|
The Structural Systems operating income in 2016 compared to 2015 increased primarily due to higher operating margins in 2016 and the prior year included a $57.2 million non-cash goodwill impairment charge and forward loss reserve charge related to a regional jet program of $12.2 million.
Electronic Systems
Electronic Systems’ net revenues in 2016 decreased primarily due to the following:
|
•
|
$64.0 million decrease in our industrial revenues mainly due to the divestiture of our Pittsburgh operation in January 2016 and closure of our Houston operation in December 2015; and
|
|
•
|
$35.3 million decrease in our military and space revenue mainly due to the divestiture of our Miltec operation in March 2016 and program delays and budget changes, which impacted scheduled deliveries on our fixed-wing and helicopter platforms; partially offset by
|
|
•
|
$10.8 million increase in our commercial aerospace revenue mainly due to added content with existing customers.
|
Electronic Systems segment operating income
in 2016 compared to 2015 increased primarily due to the prior year included a $32.9 million non-cash impairment charge of an indefinite-lived trade name intangible asset and higher operating margins in 2016.
Corporate General and Administrative Expenses
CG&A expenses in 2016 compared to 2015 decreased primarily due to lower professional services fees of $1.3 million and lower compensation and benefits of $1.1 million, partially offset by one-time retirement charges of $0.9 million.
LIQUIDITY AND CAPITAL RESOURCES
Available Liquidity
Total debt, the weighted-average interest rate, cash and cash equivalents and available credit facilities were as follows:
|
|
||||||||
|
(In millions)
December 31,
|
||||||||
|
2017
|
2016
|
|||||||
|
Total debt, including long-term portion
|
$
|
218.1
|
|
$
|
170.0
|
|
||
|
Weighted-average interest rate on debt
|
3.73
|
%
|
3.25
|
%
|
||||
|
Term Loan interest rate
|
3.74
|
%
|
3.31
|
%
|
||||
|
Cash and cash equivalents
|
$
|
2.2
|
|
$
|
7.4
|
|
||
|
Unused Revolving Credit Facility
|
$
|
141.6
|
|
$
|
199.0
|
|
||
Our credit facility consists of a $275.0 million senior secured term loan, which matures on June 26, 2020 (“Term Loan”), and a $200.0 million senior secured revolving credit facility (“Revolving Credit Facility”), which matures on June 26, 2020 (collectively, the “Credit Facilities”). We are required to make mandatory prepayments of amounts outstanding under the Term Loan. As of December 31, 2017, we were in compliance with all covenants required under the Credit Facilities. See Note 10 to
37
our consolidated financial statements included in Part IV, Item 15(a) of this Annual Report on Form 10-K for further information. The undrawn portions of the commitments of the Credit Facilities are subject to a commitment fee ranging from 0.175% to 0.300%, based upon the consolidated total net adjusted leverage ratio. In July 2017, we entered into a technical amendment to the Credit Facilities (“First Amendment”) which provides more flexibility to close certain qualified acquisitions permitted under the Credit Facilities.
In October 2015, we entered into interest rate cap hedges designated as cash flow hedges with maturity dates of June 2020, and in aggregate, totaling $135.0 million of our debt. We paid a total of $1.0 million in connection with entering into the interest rate cap hedges.
In September 2017, we acquired all the outstanding interests of LDS for a purchase price of $60.0 million, net of cash acquired, all payable in cash. Upon the closing of the transaction, we paid $61.4 million in cash by drawing down on the Revolving Credit Facility. The remaining $0.6 million was paid in October 2017 in cash, also by drawing down on the Revolving Credit Facility. See Note 2 to our consolidated financial statements included in Part IV, Item 15(a) of this Annual Report on Form 10-K for further information.
We expect to spend a total of $15.0 million to $17.0 million for capital expenditures in 2018 financed by cash generated from operations, which will be lower than 2017, principally to support new contract awards at Structural Systems and Electronic Systems. As part of our strategic plan to become a Tier Two supplier and win new contract awards, additional up-front investment in tooling will be required for newer programs which have higher engineering content and higher levels of complexity in assemblies.
We believe the ongoing aerospace and defense subcontractor consolidation makes acquisitions an increasingly important component of our future growth. We will continue to make prudent acquisitions and capital expenditures for manufacturing equipment and facilities to support long-term contracts for commercial and military aircraft and defense programs.
We continue to depend on operating cash flow and the availability of our Credit Facilities to provide short-term liquidity. Cash generated from operations and bank borrowing capacity is expected to provide sufficient liquidity to meet our obligations during the next twelve months.
Cash Flow Summary
2017 Compared to 2016
Net cash provided by operating activities during 2017 decreased to
$35.4 million
compared to
$43.3 million
during 2016 primarily due to lower net income as a result of restructuring charges and lower gross margin, and lower accounts payable.
Net cash used in investing activities in 2017 of
$86.2 million
compared to cash provided by of
$34.9 million
in 2016 primarily due to the payments for the purchase of LDS, net of cash acquired of $59.8 million in the current year. In addition, the prior year included proceeds from the divestiture of our Pittsburgh and Miltec operations of $51.9 million. Further, 2017 included higher purchases of property and equipment mainly to support the expansion of our Parsons, Kansas facility.
Net cash provided by financing activities during
2017
was
$45.5 million
compared to cash used in of
$76.2 million
during 2016 primarily due to net borrowings from the Revolving Credit Facility that was used for the purchase of LDS, partially offset by repayments on the Credit Facilities.
2016 Compared to 2015
Net cash provided by operating activities during 2016 increased to $43.3 million compared to $23.7 million during 2015 primarily due to higher net income as a result of lower interest expense and higher gross margin percentage.
Net cash provided by investing activities in 2016 of $34.9 million primarily due to proceeds from the divestiture of the Pittsburgh and Miltec operations, partially offset by capital expenditures, principally to support new contract awards in both Structural Systems and Electronic Systems.
Net cash used in financing activities during 2016 was $76.2 million compared to $50.4 million during 2015 primarily due to net voluntary principal prepayments on our new credit facilities of $75.0 million primarily as a result of the proceeds received from divestiture of the Pittsburgh and Miltec operations during the current-year.
38
Contractual Obligations
A summary of our contractual obligations at
December 31, 2017
was as follows (in thousands):
|
Payments Due by Period
|
||||||||||||||||||||
|
Total
|
Less Than
1 Year
|
1-3 Years
|
3-5 Years
|
More Than
5 Years
|
||||||||||||||||
|
Long-term debt, including current portion
|
$
|
218,100
|
|
$
|
—
|
|
$
|
218,100
|
|
$
|
—
|
|
$
|
—
|
|
|||||
|
Future interest on long-term debt
|
28,483
|
|
10,266
|
|
18,217
|
|
—
|
|
—
|
|
||||||||||
|
Operating leases
|
12,360
|
|
3,586
|
|
5,347
|
|
2,874
|
|
553
|
|
||||||||||
|
Pension liability
|
19,387
|
|
1,739
|
|
3,574
|
|
3,806
|
|
10,268
|
|
||||||||||
|
Total
(1)
|
$
|
278,330
|
|
$
|
15,591
|
|
$
|
245,238
|
|
$
|
6,680
|
|
$
|
10,821
|
|
|||||
|
(1)
|
As of December 31, 2017, we have recorded $5.3 million in long-term liabilities related to uncertain tax positions. We are not able to reasonably estimate the timing of the long-term payments, or the amount by which our liability may increase or decrease over time, therefore, the liability or uncertain tax positions has not been included in the contractual obligations table.
|
We have estimated that the fair value of our indemnification obligations as insignificant based upon our history with such obligations and insurance coverage and have included no such obligation in the table above.
Our ultimate liability with respect to groundwater contamination at certain Structural Systems facilities will depend upon a number of factors, including changes in existing laws and regulations, the design and cost of construction, operation and maintenance activities, and the allocation of liability among potentially responsible parties. The above table does not include obligations related to these matters. See Note 17 to our consolidated financial statements included in Part IV, Item 15(a) of this Annual Report on Form 10-K for discussion of our environmental liabilities.
Off-Balance Sheet Arrangements
Our off-balance sheet arrangements consist of operating leases and indemnities.
CRITICAL ACCOUNTING POLICIES
Critical accounting policies are those accounting policies that can have a significant impact on the presentation of our financial condition and results of operations and that require the use of subjective estimates based upon past experience and management’s judgment. Because of the uncertainty inherent in such estimates, actual results may differ from these estimates. Below are those policies applied in preparing our financial statements that management believes are the most dependent on the application of estimates and assumptions. See Note 1 to our consolidated financial statements included in Part IV, Item 15(a) of this Annual Report on Form 10-K for additional accounting policies.
Revenue Recognition
Except as described below, we recognize revenue, including revenue from products sold under long-term contracts, when persuasive evidence of an arrangement exists, the price is fixed or determinable, collection is reasonably assured and delivery of products has occurred or services have been rendered.
We have a significant number of contracts for which we recognize revenue under the contract method of accounting and record revenues and cost of sales on each contract in accordance with the percentage-of-completion method of accounting, using the units-of-delivery method. Under the units-of-delivery method, revenue is recognized based upon the number of units delivered during a period and the costs are recognized based on the actual costs allocable to the delivered units. Costs allocable to undelivered units are reported on the balance sheet as inventory. This method is used in circumstances in which a company produces units of a basic product under production-type contracts in a continuous or sequential production process to buyers’ specifications. These contracts are primarily fixed-price contracts that vary widely in terms of size, length of performance period, and expected gross profit margins.
Provision for Estimated Losses on Contracts
We record provisions for total anticipated losses on contracts considering total estimated costs to complete the contract compared to total anticipated revenues in the period in which such losses are identified. The provisions for estimated losses on contracts require management to make certain estimates and assumptions, including those with respect to the future revenue under a contract and the future cost to complete the contract. Management’s estimate of the future cost to complete a contract
39
may include assumptions as to improvements in manufacturing efficiency and reductions in operating and material costs. If any of these or other assumptions and estimates do not materialize in the future, we may be required to record additional provisions for estimated losses on contracts.
Production Cost of Contracts
Production cost of contracts includes tooling and other special-purpose machinery necessary to build parts as specified in a contract, and non-recurring production costs such as design and engineering costs. Production costs of contracts are recorded to cost of goods sold using the units of delivery method. We review long-lived assets within production costs of contracts for impairment on an annual basis (which we perform during the fourth quarter) or when events or changes in circumstances indicate that the carrying value of our long-lived assets may not be recoverable. An impairment charge is recognized when the carrying value of an asset exceeds the projected undiscounted future cash flows expected from its use and disposal.
Goodwill and Indefinite-Lived Intangible Asset
Our business acquisitions have resulted in the recognition of goodwill. Goodwill is not amortized but is subject to annual evaluation for impairment (which we perform based on the first day of the fourth fiscal quarter) and between annual tests, if events indicate it is more likely than not that the fair value of a reporting unit is less than its carrying value.
A significant amount of judgment is involved in determining if an indicator of impairment has occurred. Such indicators may include deterioration in general economic conditions, negative developments in equity and credit markets, adverse changes in the markets in which we operate, increases in costs that have a negative effect on earnings and cash flows, or a trend of negative or declining cash flows over multiple periods, among others.
Goodwill is allocated at the reporting unit level, which is defined as an operating segment or one level below an operating segment. We have two internal reporting units: Structural Systems and Electronic Systems. The application of the goodwill impairment test requires significant judgment, including the identification of the reporting units, and the determination of both the carrying value and the fair value of the reporting units. The carrying value of each reporting unit is determined by assigning the assets and liabilities, including existing goodwill, to those reporting units. The determination of the fair value of each reporting unit requires significant judgment, including our estimation of future cash flows, which is dependent upon internal forecasts, estimation of the long-term rate of growth of our businesses, estimation of the useful lives of the assets which will generate the cash flows, determination of our weighted-average cost of capital and other factors. In determining the appropriate discount rate, we considered the weighted-average cost of capital for each reporting unit which, among other factors, considers the cost of common equity capital and the marginal cost of debt of market participants.
The estimates and assumptions used to calculate the fair value of a reporting unit may change from period to period based upon actual operating results, market conditions and our view of the future trends. The estimates and assumptions used to determine whether impairment exists and determine the amount of such impairment, if any, are subject to a high degree of uncertainty. The estimated fair value of a reporting unit would change materially if different assumptions and estimates were used.
We initially perform an assessment of qualitative factors to determine if it is necessary to perform the two-step goodwill impairment test. We test goodwill for impairment using the two-step method if, based on our assessment of the qualitative factors, we determined that it is more likely than not that the fair value of a reporting unit is less than its carrying amount, or if we decide to bypass the qualitative assessment. When performing the two-step impairment test, we use a combination of an income approach, which estimates fair value of the reporting unit based upon future discounted cash flows, and a market approach, which estimates fair value using market multiples for transactions in a set of comparable companies. If the carrying value of the reporting unit exceeds its fair value, we then perform the second step of the impairment test to measure the amount of the impairment loss, if any. The second step compares the implied fair value of goodwill with the carrying amount of that goodwill. The implied fair value of goodwill is determined in the same manner as the amount of goodwill recognized in a business combination. The implied fair value of the reporting unit’s goodwill is calculated by creating a hypothetical purchase price allocation as if the reporting unit had just been acquired. This balance sheet contains all assets and liabilities recorded at fair value (including any intangible assets that may not have any corresponding carrying value on our balance sheet). The implied value of the reporting unit’s goodwill is calculated by subtracting the fair value of the net assets from the fair value of the reporting unit. If the carrying amount of goodwill exceeds the implied fair value of that goodwill, an impairment loss is recognized in an amount equal to that excess.
We perform our annual evaluation for impairment of goodwill based on the first day of the fourth fiscal quarter each year. The carrying amount of goodwill at the date of the most recent annual impairment test for the Electronic Systems internal reporting unit was
$117.4 million
. As of the date of our 2017 annual evaluation for goodwill impairment, we used a qualitative
40
assessment noting it was not more likely than not that the fair value of a reporting unit is less than its carrying amount and thus, goodwill was not deemed impaired.
We review our indefinite-lived intangible asset for impairment on an annual basis or when events or changes in circumstances indicate that the carrying value of our intangible asset may not be recoverable. We may first assess qualitative factors to determine whether it is more likely than not that an indefinite-lived intangible asset is impaired as a basis for determining whether it is necessary to perform the quantitative impairment test. Impairment indicators include, but are not limited to, cost factors, financial performance, adverse legal or regulatory developments, industry and market conditions and general economic conditions. If the carrying amount of the indefinite-lived intangible asset exceeds its fair value, we would recognize an impairment loss in the amount of such excess. In performing our annual impairment test in the fourth quarter of 2015, we concluded the fair value of the indefinite-lived trade name to be zero as a result of divesting businesses in Electronic Systems and our discontinuation of the use of the trade name. Thus, we recorded a $32.9 million of trade name impairment to the Electronic Systems trade name carrying value to decrease its trade name carrying value to zero as of December 31, 2015. See Note 7 in Part IV, Item 15(a) of this Annual Report on Form 10-K for further information.
Other Intangible Assets
We amortize purchased other intangible assets with finite lives over the estimated economic lives of the assets, ranging from three to eighteen years generally using the straight-line method. The value of other intangibles acquired through business combinations has been estimated using present value techniques which involve estimates of future cash flows. Actual results could vary, potentially resulting in impairment charges.
Accounting for Stock-Based Compensation
We use the Black-Scholes-Merton (“Black-Scholes”) valuation model in determining stock-based compensation expense for our options, net of an estimated forfeiture rate, on a straight-line basis over the requisite service period of the award. The stock options typically vest over four years and the estimated forfeiture rate is based on historical experience. The Black-Scholes valuation model requires assumptions and judgments using inputs such as stock price volatility, risk-free interest rates, and expected options terms. As a result, our estimates could differ from actual results.
For performance and restricted stock units, we calculate compensation expense, net of an estimated forfeiture rate, on a straight line basis over the requisite service/performance period of the awards, with fair value being based on the closing stock price on the date of grant except for market condition awards for which fair value was based on a Monte Carlo simulation model. The performance stock units vest based on a three-year performance cycle. The restricted stock units vest over various periods of time ranging from one to three years. We estimate the forfeiture rate based on our historical experience.
Inventories
Inventories are stated at the lower of cost or net realizable value with cost being determined using a moving average cost basis for raw materials and actual cost for work-in-process and finished goods, with units being relieved and charged to cost of sales on a first-in, first-out basis. Market value for raw materials is based on replacement cost and for other inventory classifications it is based on net realizable value. Inventoried costs include raw materials, outside processing, direct labor and allocated overhead, adjusted for any abnormal amounts of idle facility expense, freight, handling costs, and wasted materials (spoilage) incurred. Costs under long-term contracts are accumulated into, and removed from, inventory on the same basis as other contracts. We assess the inventory carrying value and reduce it, if necessary, to its net realizable value based on customer orders on hand, and internal demand forecasts using management’s best estimates given information currently available. We maintain a reserve for potentially excess and obsolete inventories and inventories that are carried at costs that are higher than their estimated net realizable values.
We net progress payments from customers related to inventory purchases against inventories in the consolidated balance sheets.
Income Taxes
The provision for income taxes is determined using an estimated annual effective tax rate, which is generally less than the U.S. federal statutory rate, primarily as a result of research and development (“R&D”) tax credits available in the United States and deductions available in the United States for domestic production activities. Our effective tax rate may be subject to fluctuations during the year as new information is obtained, which may affect the assumptions used to estimate the annual effective tax rate, including factors such as valuation allowances against deferred tax assets, the recognition or derecognition of tax benefits related to uncertain tax positions, expected utilization of R&D tax credits and changes in or the interpretation of tax laws in jurisdictions where we conduct business.
41
Deferred tax assets and liabilities are recognized, using enacted tax rates, for the expected future tax consequences of temporary differences between the book and tax bases of recorded assets and liabilities, operating losses, and tax credit carryforwards. Deferred tax assets are evaluated quarterly and are reduced by a valuation allowance if it is more likely than not that some portion or all of the deferred tax assets will not be realized.
Tax positions taken or expected to be taken in a tax return are recognized when it is more-likely-than-not, based on technical merits, to be sustained upon examination by taxing authorities. The amount recognized is measured as the largest amount of benefit that is greater than
50%
likely of being realized upon ultimate settlement, including resolution of related appeals and/or litigation process, if any.
On December 22, 2017, the Tax Cuts and Jobs Act (the “2017 Tax Act”) was enacted. The 2017 Tax Act represents major tax reform legislation that, among other provisions, reduces the U.S. corporate tax rate. Certain provisional amounts for the income tax effects of the 2017 Tax Act, including $13.0 million of deferred income tax benefit recorded principally due to the re-measurement of the federal portion of our deferred tax assets and liabilities, are reflected in our financial results in accordance with SEC Staff Accounting Bulletin No. 118 (“SAB 118”), which provides SEC staff guidance regarding the application of Accounting Standards Codification (“ASC”) Topic 740, “Income Taxes,” in the reporting period in which the 2017 Tax Act became law. See Note 16 in Part IV, Item 15(a) of this Annual Report on Form 10-K for further information.
Environmental Liabilities
Environmental liabilities are recorded when environmental assessments and/or remedial efforts are probable and costs can be reasonably estimated. Generally, the timing of these accruals coincides with the completion of a feasibility study or our commitment to a formal plan of action. Further, we review and update our environmental accruals as circumstances change and/or additional information is obtained that reasonably could be expected to have a meaningful effect on the outcome of a matter or the estimated cost thereof.
Recent Accounting Pronouncements
See Note 1 to our consolidated financial statements included in Part IV, Item 15(a) of this Annual Report on Form 10-K for a description of recent accounting pronouncements.
Our main market risk exposure relates to changes in U.S. interest rates on our outstanding long-term debt. At
December 31, 2017
, we had borrowings of
$218.1 million
under our Credit Facilities which bears interest, at our option, at a rate equal to either an alternate base rate or an adjusted LIBOR rate for a one-, two-, three-, or six-month interest period chosen by us, plus an applicable margin percentage. This LIBOR rate has a margin ranging from 1.50% to 2.75%. A hypothetical 10% increase or decrease in the interest rate would have an immaterial impact on our financial condition and results of operations.
The financial statements and supplementary data together with the report thereon of PricewaterhouseCoopers LLP included in Part IV, Item 15(a) 1 and 2 of this Annual Report on Form 10-K and are included herein by reference.
None.
Disclosure Controls and Procedures
Disclosure controls and procedures (as defined in Rules 13a-15(e) and 15d-15(e) under the Securities Exchange Act of 1934, as amended (“Exchange Act”)) are designed to provide reasonable assurance that information required to be disclosed in reports we file or submit under the Exchange Act is recorded, processed, summarized and reported within the time periods specified in the rules and forms of the SEC and that such information is accumulated and communicated to our management, including the Chief Executive Officer and Chief Financial Officer, as appropriate to allow timely decisions regarding required disclosures.
Under the supervision and with the participation of our management, including the Chief Executive Officer and the Chief Financial Officer, we carried out an evaluation of the effectiveness of the design and operation of our disclosure controls and
42
procedures as of the end of the period covered by this Annual Report on Form 10-K. Based on this evaluation, the Company’s Chief Executive Officer and Chief Financial Officer concluded that our disclosure controls and procedures were effective at the reasonable assurance level as of December 31, 2017.
Management’s Report on Internal Control Over Financial Reporting
Management is responsible for establishing and maintaining adequate internal control over financial reporting as defined in Rules 13a-15(f) and 15d-15(f) under the Exchange Act. The Company’s internal control over financial reporting is a process designed to provide reasonable assurance regarding the reliability of financial reporting and the preparation of financial statements for external purposes in accordance with generally accepted accounting principles (“GAAP”). The Company’s internal control over financial reporting includes those policies and procedures that (i) pertain to the maintenance of records that, in reasonable detail, accurately and fairly reflect the transactions and dispositions of the assets of the Company; (ii) provide reasonable assurance that transactions are recorded as necessary to permit preparation of financial statements in accordance with GAAP, and that receipts and expenditures of the Company are being made only in accordance with authorizations of management and directors of the Company; and (iii) provide reasonable assurance regarding prevention or timely detection of unauthorized acquisition, use or disposition of the Company’s assets that could have a material effect on our financial statements.
Because of its inherent limitations, internal control over financial reporting may not prevent or detect misstatements. Also, projections of any evaluation of effectiveness to future periods are subject to the risk that controls may become inadequate because of changes in conditions, or that the degree of compliance with the policies or procedures may deteriorate.
Management of the Company has assessed the effectiveness of the Company’s internal control over financial reporting as of December 31, 2017. In making this assessment, management used the criteria set forth by the Committee of Sponsoring Organizations of the Treadway Commission (“COSO”)
Internal Control-Integrated Framework
(2013).
Based on our assessment and those criteria, management concluded that the Company maintained effective internal control over financial reporting as of December 31, 2017.
The effectiveness of the Company’s internal control over financial reporting as of December 31, 2017 has been audited by PricewaterhouseCoopers LLP, an independent registered public accounting firm, as stated in their report, which is included in Item 15 of this Annual Report on Form 10-K.
Remediation of Prior Year Material Weakness
We previously identified and disclosed in our 2016 Annual Report on Form 10-K, as well as in our Quarterly Report on Form 10-Q (Form “10-Q”) for each interim period in fiscal 2017, a material weakness in our internal control over financial reporting regarding the following:
We did not maintain effective controls related to the quarterly and annual accounting and disclosures for income taxes. Specifically, we did not maintain effective controls related to the preparation, analysis and review of the income tax provision and significant income tax balance sheet accounts required to assess the accuracy and completeness of the income tax amounts reported within the consolidated financial statements and disclosures at period end.
During 2017, we successfully completed the testing necessary to conclude that the controls were operating effectively as of December 31, 2017 and have concluded that the material weakness related to the accounting and disclosures for income taxes has been remediated.
Changes in Internal Control Over Financial Reporting
There were no changes in our internal control over financial reporting (as defined in Rules 13a-15(f) and 15d-15(f) under the Exchange Act) that have materially affected, or are reasonably likely to materially affect, our internal control over financial reporting during the quarter ended December 31, 2017.
None.
43
Directors of the Registrant
The information under the caption “Election of Directors” in the
2018
Proxy Statement is incorporated herein by reference.
Executive Officers of the Registrant
The information under the caption “Executive Officers of the Registrant” in the
2018
Proxy Statement is incorporated herein by reference.
On December 31, 2017, Anthony J. Reardon resigned as an employee of the Company but will continue to serve as a non-employee Chairman of the Board.
Audit Committee and Audit Committee Financial Expert
The information under the caption “Committees of the Board of Directors” relating to the Audit Committee of the Board of Directors in the
2018
Proxy Statement is incorporated herein by reference.
Compliance with Section 16(a) of the Exchange Act
The information under the caption “Section 16(a) Beneficial Ownership Reporting Compliance” in the
2018
Proxy Statement is incorporated herein by reference.
Code of Ethics
The information under the caption “Code of Ethics” in the
2018
Proxy Statement is incorporated herein by reference.
Changes to Procedures to Recommend Nominees
There have been no material changes to the procedures by which security holders may recommend nominees to the Company’s Board of Directors since the date of the Company’s last proxy statement.
The information under the captions “Compensation of Executive Officers,” “Compensation of Directors,” “Compensation Committee Interlocks and Insider Participation” and “Compensation Committee Report” in the
2018
Proxy Statement is incorporated herein by reference.
The information under the caption “Security Ownership of Certain Beneficial Owners and Management” in the
2018
Proxy Statement is incorporated herein by reference.
Securities Authorized for Issuance under Equity Compensation Plans
The following table provides information about our compensation plans under which equity securities are authorized for issuance:
44
|
Number of Securities
to be Issued Upon
Exercise of
Outstanding
Options,
Warrants and Rights
(a)
|
Weighted-Average
Exercise Price of
Outstanding
Options,
Warrants and Rights
(b)
|
Number of Securities
Remaining
Available for
Future Issuance
Under Equity
Compensation Plans
(Excluding Securities
Reflected
in Column
(a))(c)(2)
|
||||||||
|
Equity Compensation Plans
|
||||||||||
|
Approved by security holders
(1)
|
713,069
|
|
$
|
23.38
|
|
77,693
|
|
|||
|
Not approved by security holders
|
—
|
|
—
|
|
—
|
|
||||
|
Total
|
713,069
|
|
77,693
|
|
||||||
|
(1)
|
The number of securities to be issued consists of
306,225
for stock options,
185,344
for restricted stock units and
221,500
for performance stock units at target. The weighted average exercise price applies only to the stock options.
|
|
(2)
|
Awards are not restricted to any specified form or structure and may include, without limitation, sales or bonuses of stock, restricted stock, stock options, reload stock options, stock purchase warrants, other rights to acquire stock, securities convertible into or redeemable for stock, stock appreciation rights, limited stock appreciation rights, phantom stock, dividend equivalents, performance units or performance shares, and an award may consist of one such security or benefit, or two or more of them in tandem or in alternative.
|
The information under the caption “Election of Directors” in the
2018
Proxy Statement is incorporated herein by reference.
The information under the caption “Principal Accountant Fees and Services” contained in the
2018
Proxy Statement is incorporated herein by reference.
45
|
(a)
|
1.
Financial Statements
|
||
|
The following consolidated financial statements of Ducommun Incorporated and subsidiaries, are incorporated by reference in Item 8 of this report.
|
|||
|
|
|
Page
|
|
|
|
|||
|
|
|||
|
|
|||
|
|
|||
|
|
|||
|
|
|||
|
|
|||
|
|
|||
|
2.
Financial Statement Schedule
|
|||
|
The following schedule for the years ended December 31, 2017, 2016 and 2015 is filed herewith:
|
|||
|
Schedule II - Valuation and Qualifying Accounts
|
|
||
|
All other schedules have been omitted because they are not applicable, not required, or the information has been otherwise supplied in the financial statements or notes thereto.
|
|||
|
3.
Exhibits
|
|||
|
See Item 15(b) for a list of exhibits.
|
—
|
|
|
|
ITEM 16. FORM 10-K SUMMARY
|
—
|
|
|
Signatures
|
—
|
|
|
46
Report of Independent Registered Public Accounting Firm
To the Board of Directors and Shareholders of Ducommun Incorporated
Opinions on the Financial Statements and Internal Control over Financial Reporting
We have audited the accompanying consolidated balance sheets of Ducommun Incorporated and its subsidiaries (the “Company”) as of December 31, 2017 and 2016, and the related consolidated statements of operations, comprehensive income (loss), changes in shareholders’ equity and cash flows for each of the three years in the period ended December 31, 2017, including the related notes and financial statement schedule listed in the index appearing under Item 15(a)2 (collectively referred to as the “consolidated financial statements”). We also have audited the Company’s internal control over financial reporting as of December 31, 2017, based on criteria established in
Internal Control - Integrated Framework
(2013)
issued by the Committee of Sponsoring Organizations of the Treadway Commission (COSO).
In our opinion, the consolidated
financial statements referred to above present fairly, in all material respects, the financial position of the Company as of December 31, 2017 and 2016, and the results of their operations and their cash flows for each of the three years in the period ended December 31, 2017 in conformity with accounting principles generally accepted in the United States of America. Also in our opinion, the Company maintained, in all material respects, effective internal control over financial reporting as of December 31, 2017, based on criteria established in
Internal Control - Integrated Framework
(2013) issued by the COSO.
Basis for Opinions
The Company’s management is responsible for these consolidated financial statements, for maintaining effective internal control over financial reporting, and for its assessment of the effectiveness of internal control over financial reporting, included in Management’s Report on Internal Control Over Financial Reporting appearing under Item 9A. Our responsibility is to express opinions on the Company’s consolidated
financial statements and on the Company’s internal control over financial reporting based on our audits. We are a public accounting firm registered with the Public Company Accounting Oversight Board (United States) (“PCAOB”) and are required to be independent with respect to the Company in accordance with the U.S. federal securities laws and the applicable rules and regulations of the Securities and Exchange Commission and the PCAOB.
We conducted our audits in accordance with the standards of the PCAOB. Those standards require that we plan and perform the audits to obtain reasonable assurance about whether the consolidated
financial statements are free of material misstatement, whether due to error or fraud, and whether effective internal control over financial reporting was maintained in all material respects.
Our audits of the consolidated
financial statements included performing procedures to assess the risks of material misstatement of the consolidated
financial statements, whether due to error or fraud, and performing procedures that respond to those risks. Such procedures included examining, on a test basis, evidence regarding the amounts and disclosures in the consolidated
financial statements. Our audits also included evaluating the accounting principles used and significant estimates made by management, as well as evaluating the overall presentation of the consolidated
financial statements. Our audit of internal control over financial reporting included obtaining an understanding of internal control over financial reporting, assessing the risk that a material weakness exists, and testing and evaluating the design and operating effectiveness of internal control based on the assessed risk. Our audits also included performing such other procedures as we considered necessary in the circumstances. We believe that our audits provide a reasonable basis for our opinions.
Definition and Limitations of Internal Control over Financial Reporting
A company’s internal control over financial reporting is a process designed to provide reasonable assurance regarding the reliability of financial reporting and the preparation of financial statements for external purposes in accordance with generally accepted accounting principles. A company’s internal control over financial reporting includes those policies and procedures that (i) pertain to the maintenance of records that, in reasonable detail, accurately and fairly reflect the transactions and dispositions of the assets of the company; (ii) provide reasonable assurance that transactions are recorded as necessary to permit preparation of financial statements in accordance with generally accepted accounting principles, and that receipts and expenditures of the company are being made only in accordance with authorizations of management and directors of the company; and (iii) provide reasonable assurance regarding prevention or timely detection of unauthorized acquisition, use, or disposition of the company’s assets that could have a material effect on the financial statements.
47
Because of its inherent limitations, internal control over financial reporting may not prevent or detect misstatements. Also, projections of any evaluation of effectiveness to future periods are subject to the risk that controls may become inadequate because of changes in conditions, or that the degree of compliance with the policies or procedures may deteriorate.
/s/ PricewaterhouseCoopers LLP
Los Angeles, California
February 28, 2018
We have served as the Company’s auditor since 1989.
48
Ducommun Incorporated and Subsidiaries
(In thousands, except share and per share data)
|
|
December 31,
|
|||||||
|
|
2017
|
2016
|
||||||
|
Assets
|
||||||||
|
Current Assets
|
||||||||
|
Cash and cash equivalents
|
$
|
2,150
|
|
$
|
7,432
|
|
||
|
Accounts receivable (less allowance for doubtful accounts of $868 and $495 at December 31, 2017 and 2016, respectively)
|
74,064
|
|
76,239
|
|
||||
|
Inventories
|
122,161
|
|
119,896
|
|
||||
|
Production cost of contracts
|
11,204
|
|
11,340
|
|
||||
|
Other current assets
|
11,435
|
|
11,034
|
|
||||
|
Total Current Assets
|
221,014
|
|
225,941
|
|
||||
|
Property and Equipment, Net
|
110,252
|
|
101,590
|
|
||||
|
Goodwill
|
117,435
|
|
82,554
|
|
||||
|
Intangibles, Net
|
114,693
|
|
101,573
|
|
||||
|
Non-Current Deferred Income Taxes
|
261
|
|
286
|
|
||||
|
Other Assets
|
3,098
|
|
3,485
|
|
||||
|
Total Assets
|
$
|
566,753
|
|
$
|
515,429
|
|
||
|
Liabilities and Shareholders’ Equity
|
||||||||
|
Current Liabilities
|
||||||||
|
Current portion of long-term debt
|
$
|
—
|
|
$
|
3
|
|
||
|
Accounts payable
|
51,907
|
|
57,024
|
|
||||
|
Accrued liabilities
|
28,329
|
|
29,279
|
|
||||
|
Total Current Liabilities
|
80,236
|
|
86,306
|
|
||||
|
Long-Term Debt, Less Current Portion
|
216,055
|
|
166,896
|
|
||||
|
Non-Current Deferred Income Taxes
|
15,981
|
|
31,417
|
|
||||
|
Other Long-Term Liabilities
|
18,898
|
|
18,707
|
|
||||
|
Total Liabilities
|
331,170
|
|
303,326
|
|
||||
|
Commitments and Contingencies (Notes 14, 17)
|
|
|
||||||
|
Shareholders’ Equity
|
||||||||
|
Common stock - $0.01 par value; 35,000,000 shares authorized; 11,332,841 and 11,193,813 shares issued and outstanding at December 31, 2017 and 2016, respectively
|
113
|
|
112
|
|
||||
|
Additional paid-in capital
|
80,223
|
|
76,783
|
|
||||
|
Retained earnings
|
161,364
|
|
141,287
|
|
||||
|
Accumulated other comprehensive loss
|
(6,117
|
)
|
(6,079
|
)
|
||||
|
Total Shareholders’ Equity
|
235,583
|
|
212,103
|
|
||||
|
Total Liabilities and Shareholders’ Equity
|
$
|
566,753
|
|
$
|
515,429
|
|
||
See accompanying notes to consolidated financial statements.
49
Ducommun Incorporated and Subsidiaries
(In thousands, except per share amounts)
|
|
Years Ended December 31,
|
|||||||||||
|
|
2017
|
2016
|
2015
|
|||||||||
|
Net Revenues
|
$
|
558,183
|
|
$
|
550,642
|
|
$
|
666,011
|
|
|||
|
Cost of Sales
|
455,363
|
|
444,449
|
|
565,219
|
|
||||||
|
Gross Profit
|
102,820
|
|
106,193
|
|
100,792
|
|
||||||
|
Selling, General and Administrative Expenses
|
79,435
|
|
77,443
|
|
83,796
|
|
||||||
|
Goodwill Impairment
|
—
|
|
—
|
|
57,243
|
|
||||||
|
Intangible Asset Impairment
|
—
|
|
—
|
|
32,937
|
|
||||||
|
Restructuring Charges
|
8,360
|
|
182
|
|
2,125
|
|
||||||
|
Operating Income (Loss)
|
15,025
|
|
28,568
|
|
(75,309
|
)
|
||||||
|
Interest Expense
|
(8,261
|
)
|
(8,274
|
)
|
(18,709
|
)
|
||||||
|
Gain on Divestitures, Net
|
—
|
|
17,604
|
|
—
|
|
||||||
|
Loss on Extinguishment of Debt
|
—
|
|
—
|
|
(14,720
|
)
|
||||||
|
Other Income, Net
|
845
|
|
215
|
|
2,148
|
|
||||||
|
Income (Loss) Before Taxes
|
7,609
|
|
38,113
|
|
(106,590
|
)
|
||||||
|
Income Tax (Benefit) Expense
|
(12,468
|
)
|
12,852
|
|
(31,711
|
)
|
||||||
|
Net Income (Loss)
|
$
|
20,077
|
|
$
|
25,261
|
|
$
|
(74,879
|
)
|
|||
|
Earnings (Loss) Per Share
|
||||||||||||
|
Basic earnings (loss) per share
|
$
|
1.78
|
|
$
|
2.27
|
|
$
|
(6.78
|
)
|
|||
|
Diluted earnings (loss) per share
|
$
|
1.74
|
|
$
|
2.24
|
|
$
|
(6.78
|
)
|
|||
|
Weighted-Average Number of Shares Outstanding
|
||||||||||||
|
Basic
|
11,290
|
|
11,151
|
|
11,047
|
|
||||||
|
Diluted
|
11,558
|
|
11,299
|
|
11,047
|
|
||||||
See accompanying notes to consolidated financial statements.
50
Ducommun Incorporated and Subsidiaries
Consolidated Statements of Comprehensive Income (Loss)
(In thousands)
|
Years Ended December 31,
|
||||||||||||
|
2017
|
2016
|
2015
|
||||||||||
|
Net Income (Loss)
|
$
|
20,077
|
|
$
|
25,261
|
|
$
|
(74,879
|
)
|
|||
|
Other Comprehensive Income (Loss), Net of Tax:
|
||||||||||||
|
Pension Adjustments:
|
||||||||||||
|
Amortization of actuarial loss included in net income, net of tax benefit of $302, $283, and $330 for 2017, 2016, and 2015, respectively
|
508
|
|
479
|
|
557
|
|
||||||
|
Actuarial (loss) gain arising during the period, net of tax (benefit) expense of $(194), $(413), and $300 for 2017, 2016, and 2015, respectively
|
(304
|
)
|
(650
|
)
|
491
|
|
||||||
|
Decrease in net unrealized gains and losses on cash flow hedges, net of tax benefit of $145, $180, and $0 for 2017, 2016, and 2015, respectively
|
(242
|
)
|
(305
|
)
|
—
|
|
||||||
|
Other Comprehensive (Loss) Income, Net of Tax
|
(38
|
)
|
(476
|
)
|
1,048
|
|
||||||
|
Comprehensive Income (Loss), Net of Tax
|
$
|
20,039
|
|
$
|
24,785
|
|
$
|
(73,831
|
)
|
|||
See accompanying notes to consolidated financial statements.
51
Ducommun Incorporated and Subsidiaries
Consolidated Statements of Changes in Shareholders’ Equity
(In thousands, except share data)
|
Shares
Outstanding
|
Common
Stock
|
Treasury
Stock
|
Additional
Paid-In
Capital
|
Retained
Earnings
|
Accumulated
Other
Comprehensive
Loss
|
Total
Shareholders’
Equity
|
|||||||||||||||||||||
|
Balance at December 31, 2014
|
10,952,268
|
|
$
|
110
|
|
$
|
—
|
|
$
|
72,206
|
|
$
|
190,905
|
|
$
|
(6,651
|
)
|
$
|
256,570
|
|
|||||||
|
Net loss
|
—
|
|
—
|
|
—
|
|
—
|
|
(74,879
|
)
|
—
|
|
(74,879
|
)
|
|||||||||||||
|
Other comprehensive income, net of tax
|
—
|
|
—
|
|
—
|
|
—
|
|
—
|
|
1,048
|
|
1,048
|
|
|||||||||||||
|
Stock options exercised
|
167,523
|
|
1
|
|
—
|
|
3,083
|
|
—
|
|
—
|
|
3,084
|
|
|||||||||||||
|
Stock repurchased related to the exercise of stock options
|
(137,194
|
)
|
(1
|
)
|
—
|
|
(4,209
|
)
|
—
|
|
—
|
|
(4,210
|
)
|
|||||||||||||
|
Stock awards vested
|
101,721
|
|
1
|
|
—
|
|
(1
|
)
|
—
|
|
—
|
|
—
|
|
|||||||||||||
|
Stock-based compensation
|
—
|
|
—
|
|
—
|
|
3,495
|
|
—
|
|
—
|
|
3,495
|
|
|||||||||||||
|
Excess tax benefits from share-based compensation
|
—
|
|
—
|
|
—
|
|
626
|
|
—
|
|
—
|
|
626
|
|
|||||||||||||
|
Balance at December 31, 2015
|
11,084,318
|
|
$
|
111
|
|
$
|
—
|
|
$
|
75,200
|
|
$
|
116,026
|
|
$
|
(5,603
|
)
|
$
|
185,734
|
|
|||||||
|
Net income
|
—
|
|
—
|
|
—
|
|
—
|
|
25,261
|
|
—
|
|
25,261
|
|
|||||||||||||
|
Other comprehensive loss, net of tax
|
—
|
|
—
|
|
—
|
|
—
|
|
—
|
|
(476
|
)
|
(476
|
)
|
|||||||||||||
|
Stock options exercised
|
132,325
|
|
1
|
|
—
|
|
2,121
|
|
—
|
|
—
|
|
2,122
|
|
|||||||||||||
|
Stock repurchased related to the exercise of stock options
|
(151,916
|
)
|
(1
|
)
|
—
|
|
(3,464
|
)
|
—
|
|
—
|
|
(3,465
|
)
|
|||||||||||||
|
Stock awards vested
|
129,086
|
|
1
|
|
—
|
|
(1
|
)
|
—
|
|
—
|
|
—
|
|
|||||||||||||
|
Stock-based compensation
|
—
|
|
—
|
|
—
|
|
3,007
|
|
—
|
|
—
|
|
3,007
|
|
|||||||||||||
|
Tax shortfall from share-based compensation
|
—
|
|
—
|
|
—
|
|
(80
|
)
|
—
|
|
—
|
|
(80
|
)
|
|||||||||||||
|
Balance at December 31, 2016
|
11,193,813
|
|
$
|
112
|
|
$
|
—
|
|
$
|
76,783
|
|
$
|
141,287
|
|
$
|
(6,079
|
)
|
$
|
212,103
|
|
|||||||
|
Net income
|
—
|
|
—
|
|
—
|
|
—
|
|
20,077
|
|
—
|
|
20,077
|
|
|||||||||||||
|
Other comprehensive loss, net of tax
|
—
|
|
—
|
|
—
|
|
—
|
|
—
|
|
(38
|
)
|
(38
|
)
|
|||||||||||||
|
Stock options exercised
|
212,775
|
|
2
|
|
—
|
|
4,334
|
|
—
|
|
—
|
|
4,336
|
|
|||||||||||||
|
Stock repurchased related to the exercise of stock options
|
(219,164
|
)
|
(2
|
)
|
—
|
|
(6,902
|
)
|
—
|
|
—
|
|
(6,904
|
)
|
|||||||||||||
|
Stock awards vested
|
145,417
|
|
1
|
|
—
|
|
(1
|
)
|
—
|
|
—
|
|
—
|
|
|||||||||||||
|
Stock-based compensation
|
—
|
|
—
|
|
—
|
|
6,009
|
|
—
|
|
—
|
|
6,009
|
|
|||||||||||||
|
Balance at December 31, 2017
|
11,332,841
|
|
$
|
113
|
|
$
|
—
|
|
$
|
80,223
|
|
$
|
161,364
|
|
$
|
(6,117
|
)
|
$
|
235,583
|
|
|||||||
See accompanying notes to consolidated financial statements.
52
Ducommun Incorporated and Subsidiaries
(In thousands)
|
Years Ended December 31,
|
||||||||||||
|
2017
|
2016
|
2015
|
||||||||||
|
Cash Flows from Operating Activities
|
||||||||||||
|
Net Income (Loss)
|
$
|
20,077
|
|
$
|
25,261
|
|
$
|
(74,879
|
)
|
|||
|
Adjustments to Reconcile Net Income (Loss) to
|
||||||||||||
|
Net Cash Provided by Operating Activities:
|
||||||||||||
|
Depreciation and amortization
|
22,845
|
|
22,860
|
|
26,846
|
|
||||||
|
Gain on divestitures, net
|
—
|
|
(17,604
|
)
|
—
|
|
||||||
|
Goodwill impairment
|
—
|
|
—
|
|
57,243
|
|
||||||
|
Intangible asset impairment
|
—
|
|
—
|
|
32,937
|
|
||||||
|
Property and equipment impairment due to restructuring
|
3,607
|
|
—
|
|
—
|
|
||||||
|
Stock-based compensation expense
|
4,675
|
|
3,007
|
|
3,495
|
|
||||||
|
Deferred income taxes
|
(15,411
|
)
|
3,519
|
|
(29,110
|
)
|
||||||
|
Excess tax benefits from stock-based compensation
|
—
|
|
(248
|
)
|
(626
|
)
|
||||||
|
Provision for doubtful accounts
|
373
|
|
112
|
|
132
|
|
||||||
|
Noncash loss on extinguishment of debt
|
—
|
|
—
|
|
4,970
|
|
||||||
|
Other
|
(1,182
|
)
|
(7,204
|
)
|
5,628
|
|
||||||
|
Changes in Assets and Liabilities:
|
||||||||||||
|
Accounts receivable
|
2,720
|
|
3,220
|
|
4,444
|
|
||||||
|
Inventories
|
(533
|
)
|
(5,182
|
)
|
20,985
|
|
||||||
|
Production cost of contracts
|
(267
|
)
|
(1,536
|
)
|
330
|
|
||||||
|
Other assets
|
40
|
|
2,974
|
|
5,884
|
|
||||||
|
Accounts payable
|
(4,015
|
)
|
15,055
|
|
(13,978
|
)
|
||||||
|
Accrued and other liabilities
|
2,505
|
|
(966
|
)
|
(20,623
|
)
|
||||||
|
Net Cash Provided by Operating Activities
|
35,434
|
|
43,268
|
|
23,678
|
|
||||||
|
Cash Flows from Investing Activities
|
||||||||||||
|
Purchases of property and equipment
|
(27,610
|
)
|
(17,001
|
)
|
(15,891
|
)
|
||||||
|
Proceeds from sale of assets
|
913
|
|
16
|
|
904
|
|
||||||
|
Insurance recoveries related to property and equipment
|
288
|
|
—
|
|
1,510
|
|
||||||
|
Proceeds from divestitures
|
—
|
|
51,893
|
|
—
|
|
||||||
|
Payments for purchase of Lightning Diversion Systems, LLC, net of cash acquired
|
(59,798
|
)
|
—
|
|
—
|
|
||||||
|
Net Cash (Used in) Provided by Investing Activities
|
(86,207
|
)
|
34,908
|
|
(13,477
|
)
|
||||||
|
Cash Flows from Financing Activities
|
||||||||||||
|
Borrowings from senior secured revolving credit facility
|
395,900
|
|
71,800
|
|
65,000
|
|
||||||
|
Repayment of senior secured revolving credit facility
|
(337,800
|
)
|
(71,800
|
)
|
(65,000
|
)
|
||||||
|
Borrowings from term loan
|
—
|
|
—
|
|
275,000
|
|
||||||
|
Repayments of senior unsecured notes and term loans
|
(10,000
|
)
|
(75,000
|
)
|
(320,000
|
)
|
||||||
|
Repayments of other debt
|
(3
|
)
|
(23
|
)
|
(26
|
)
|
||||||
|
Debt issuance costs
|
—
|
|
—
|
|
(4,848
|
)
|
||||||
|
Excess tax benefits from stock-based compensation
|
—
|
|
248
|
|
626
|
|
||||||
|
Net cash paid from issuance of common stock under stock plans
|
(2,606
|
)
|
(1,423
|
)
|
(1,126
|
)
|
||||||
|
Net Cash Provided by (Used in) Financing Activities
|
45,491
|
|
(76,198
|
)
|
(50,374
|
)
|
||||||
|
Net (Decrease) Increase in Cash and Cash Equivalents
|
(5,282
|
)
|
1,978
|
|
(40,173
|
)
|
||||||
|
Cash and Cash Equivalents at Beginning of Year
|
7,432
|
|
5,454
|
|
45,627
|
|
||||||
|
Cash and Cash Equivalents at End of Year
|
$
|
2,150
|
|
$
|
7,432
|
|
$
|
5,454
|
|
|||
See accompanying notes to consolidated financial statements.
53
DUCOMMUN INCORPORATED AND SUBSIDIARIES
NOTES TO CONSOLIDATED FINANCIAL STATEMENTS
Description of Business
We are a leading global provider of engineering and manufacturing services for high-performance products and high-cost-of failure applications used primarily in the aerospace and defense, industrial, medical, and other industries. Our subsidiaries are organized into
two
primary businesses: Electronic Systems segment and Structural Systems segment, each of which is a reportable operating segment. Electronic Systems designs, engineers and manufactures high-reliability electronic and electromechanical products used in worldwide technology-driven markets including aerospace and defense, industrial, medical, and other end-use markets. Electronic Systems’ product offerings primarily range from prototype development to complex assemblies. Structural Systems designs, engineers and manufactures large, complex contoured aerostructure components and assemblies and supplies composite and metal bonded structures and assemblies. Structural Systems’ products are primarily used on commercial aircraft, military fixed-wing aircraft and military and commercial rotary-wing aircraft. All reportable operating segments follow the same accounting principles.
Basis of Presentation
The consolidated financial statements include the accounts of Ducommun Incorporated and its subsidiaries (“Ducommun,” the “Company,” “we,” “us” or “our”), after eliminating intercompany balances and transactions.
In the opinion of management, all adjustments, consisting of recurring accruals, have been made that are necessary to fairly state our consolidated financial position, results of operations, comprehensive income (loss) and cash flows in accordance with accounting principles generally accepted in the United States of America (“GAAP”).
Our fiscal quarters typically end on the Saturday closest to the end of March, June and September for the first three fiscal quarters of each year, and ends on December 31 for our fourth fiscal quarter. As a result of using fiscal quarters for the first three quarters combined with leap years, our first and fourth fiscal quarters can range between 12 1/2 weeks to 13 1/2 weeks while the second and third fiscal quarters remain at a constant 13 weeks per fiscal quarter.
Use of Estimates
Certain amounts and disclosures included in the consolidated financial statements required management to make estimates and judgments that affect the amount of assets, liabilities (including forward loss reserves), revenues and expenses, and related disclosures of contingent assets and liabilities. These estimates are based on historical experience and on various other assumptions that are believed to be reasonable under the circumstances, the results of which form the basis for making judgments about the carrying values of assets and liabilities that are not readily apparent from other sources. Actual results could differ from these estimates.
Reclassifications
Certain prior period amounts have been reclassified to conform to current year’s presentation.
Supplemental Cash Flow Information
|
(In thousands)
Years Ended December 31,
|
||||||||||||
|
2017
|
2016
|
2015
|
||||||||||
|
Interest paid
|
$
|
7,307
|
|
$
|
6,877
|
|
$
|
26,501
|
|
|||
|
Taxes paid
|
$
|
3,125
|
|
$
|
9,778
|
|
$
|
1,150
|
|
|||
|
Non-cash activities:
|
||||||||||||
|
Purchases of property and equipment not paid
|
$
|
2,104
|
|
$
|
3,241
|
|
$
|
1,549
|
|
|||
Fair Value
Assets and liabilities that are measured, recorded or disclosed at fair value on a recurring basis are categorized using the fair value hierarchy. The fair value hierarchy has three levels based on the reliability of the inputs used to determine the fair value.
54
Level 1, the highest level, refers to the values determined based on quoted prices in active markets. Level 2 refers to fair values estimated using significant observable inputs. Level 3, the lowest level, includes fair values estimated using significant unobservable inputs.. See Note 4 for further information.
Cash Equivalents
Cash equivalents consist of highly liquid instruments purchased with original maturities of
three months or less
.These assets are valued at cost, which approximates fair value, which we classify as Level 1. See Fair Value above.
Derivative Instruments
We recognize derivative instruments on our consolidated balance sheets at their fair value. On the date that we enter into a derivative contract, we designate the derivative instrument as a fair value hedge, a cash flow hedge, a hedge of a net investment in a foreign operation, or a derivative instrument that will not be accounted for using hedge accounting methods. As of December 31, 2017 and December 31, 2016, all of our derivative instruments were designated as cash flow hedges.
We record changes in the fair value of a derivative instrument that is highly effective and that is designated and qualifies as a cash flow hedge in other comprehensive income (loss), net of tax until our earnings are affected by the variability of cash flows of the underlying hedge. We record any hedge ineffectiveness and amounts excluded from effectiveness testing in current period earnings within interest expense. We report changes in the fair values of derivative instruments that are not designated or do not qualify for hedge accounting in current period earnings. We classify cash flows from derivative instruments on the consolidated statements of cash flows in the same category as the item being hedged or on a basis consistent with the nature of the instrument.
When we determine that a derivative instrument is not highly effective as a hedge, we discontinue hedge accounting prospectively. In all situations in which we discontinue hedge accounting and the derivative instrument remains outstanding, we will carry the derivative instrument at its fair value on our consolidated balance sheets and recognize subsequent changes in its fair value in our current period earnings.
Allowance for Doubtful Accounts
We maintain an allowance for doubtful accounts for estimated losses from the inability of customers to make required payments. The allowance for doubtful accounts is evaluated periodically based on the aging of accounts receivable, the financial condition of customers and their payment history, historical write-off experience and other assumptions, such as current assessment of economic conditions.
Inventories
Inventories are stated at the lower of cost or net realizable value with cost being determined using a moving average cost basis for raw materials and actual cost for work-in-process and finished goods, with units being relieved and charged to cost of sales on a first-in, first-out basis. Inventoried costs include raw materials, outside processing, direct labor and allocated overhead, adjusted for any abnormal amounts of idle facility expense, freight, handling costs, and wasted materials (spoilage) incurred. Costs under long-term contracts are accumulated into, and removed from, inventory on the same basis as other contracts. We assess the inventory carrying value and reduce it, if necessary, to its net realizable value based on customer orders on hand, and internal demand forecasts using management’s best estimates given information currently available.
We net progress payments from customers related to inventory purchases against inventories in the consolidated balance sheets.
Production Cost of Contracts
Production cost of contracts includes non-recurring production costs, such as design and engineering costs, and tooling and other special-purpose machinery necessary to build parts as specified in a contract. Production costs of contracts are recorded to cost of goods sold using the units of delivery method. We review long-lived assets within production costs of contracts for impairment on an annual basis (which we perform during the fourth quarter) or when events or changes in circumstances indicate that the carrying value of our long-lived assets may not be recoverable. An impairment charge is recognized when the carrying value of an asset exceeds the projected undiscounted future cash flows expected from its use and disposal. As of
December 31, 2017
and
2016
, production costs of contracts were
$11.2 million
and
$11.3 million
, respectively.
Property and Equipment and Depreciation
Property and equipment, including assets recorded under capital leases, are recorded at cost. Depreciation and amortization are computed using the straight-line method over the estimated useful lives of the related assets, or the lease term if shorter for leasehold improvements. Repairs and maintenance are charged to expense as incurred. We evaluate long-lived assets for
55
recoverability considering undiscounted cash flows, when significant changes in conditions occur, and recognize impairment losses if any, based upon the fair value of the assets.
Goodwill and Indefinite-Lived Intangible Asset
Goodwill is evaluated for impairment on a annual basis on the first day of the fourth fiscal quarter or more frequently if events or changes in circumstances indicate that the asset may be impaired. Our impairment evaluation of goodwill consists of a qualitative assessment to determine if it is more likely than not that the fair value of a reporting unit is less than its carrying amount. If our qualitative assessment indicates it is more likely than not that the estimated fair value of a reporting unit exceeds its carrying value, no further analysis is required and goodwill is not impaired. Otherwise, we will follow a two-step quantitative goodwill impairment test to determine if goodwill is impaired.
In the first step, we determine the fair value of the reporting unit using expected future discounted cash flows and market valuation approaches considering comparable Company revenue and Earnings Before Interest, Taxes, Depreciation and Amortization (“EBITDA”) multiples. If the carrying value of the reporting unit exceeds its fair value, we then perform the second step of the impairment test to measure the amount of the goodwill impairment loss, if any.
The second step requires fair valuation of all the reporting unit’s assets and liabilities in a manner similar to a purchase price allocation, with any residual fair value being allocated to goodwill. This residual fair value of goodwill is then compared to the carrying value of goodwill to determine impairment. An impairment charge will be recognized equal to the excess of the carrying value of goodwill over the implied fair value of goodwill.
In 2015, as a result of the annual goodwill impairment test, we recorded
$57.2 million
of goodwill impairment to the Structural Systems operating segment reducing the goodwill carrying value to
zero
as of December 31, 2015.
We review our indefinite-lived intangible asset for impairment on an annual basis or when events or changes in circumstances indicate that the carrying value of our intangible asset may not be recoverable. We may first assess qualitative factors to determine whether it is more likely than not that an indefinite-lived intangible asset is impaired as a basis for determining whether it is necessary to perform the quantitative impairment test. Impairment indicators include, but are not limited to, cost factors, financial performance, adverse legal or regulatory developments, industry and market conditions and general economic conditions. If the carrying amount of the indefinite-lived intangible asset exceeds its fair value, we would recognize an impairment loss in the amount of such excess. In performing our annual impairment test in the fourth quarter of 2015, we concluded the fair value of the indefinite-lived trade name to be
zero
as a result of divesting businesses in Electronic Systems and our discontinuation of the use of the trade name. Thus, we recorded a
$32.9 million
of trade name impairment to the Electronic Systems trade name carrying value to decrease its trade name carrying value to zero as of December 31, 2015.
Other Intangible Assets
We amortize purchased other intangible assets with finite lives over the estimated economic lives of the assets, ranging from
fourteen
to
eighteen
years generally using the straight-line method. The value of other intangibles acquired through business combinations has been estimated using present value techniques which involve estimates of future cash flows. We evaluate other intangible assets for recoverability considering undiscounted cash flows, when significant changes in conditions occur, and recognize impairment losses, if any, based upon the estimated fair value of the assets.
Accumulated Other Comprehensive Loss
Accumulated other comprehensive loss, as reflected in the consolidated balance sheets under the equity section, was composed of cumulative pension and retirement liability adjustments, net of tax, and unrealized losses on cash flow hedges, net of tax.
Revenue Recognition
Except as described below, we recognize revenue, including revenue from products sold under long-term contracts, when persuasive evidence of an arrangement exists, the price is fixed or determinable, collection is reasonably assured and delivery of products has occurred or services have been rendered.
We have a significant number of contracts for which we recognize revenue under the contract method of accounting and record revenues and cost of sales on each contract in accordance with the percentage-of-completion method of accounting, using the units-of-delivery method. Under the units-of-delivery method, revenue is recognized based upon the number of units delivered during a period and the costs are recognized based on the actual costs allocable to the delivered units. Costs allocable to undelivered units are reported on the balance sheet as inventory. This method is used in circumstances in which a company produces units of a basic product under production-type contracts in a continuous or sequential production process to buyers’ specifications. These contracts are primarily fixed-price contracts that vary widely in terms of size, length of performance period, and expected gross profit margins.
56
Provision for Estimated Losses on Contracts
We record provisions for the total anticipated losses on contracts considering total estimated costs to complete the contract compared to total anticipated revenues in the period in which such losses are identified. The provisions for estimated losses on contracts require management to make certain estimates and assumptions, including those with respect to the future revenue under a contract and the future cost to complete the contract. Management's estimate of the future cost to complete a contract may include assumptions as to improvements in manufacturing efficiency, reductions in operating and material costs, and our ability to resolve claims and assertions with our customers. If any of these or other assumptions and estimates do not materialize in the future, we may be required to record additional provisions for estimated losses on contracts.
In 2015, we recorded a charge in Structural Systems related to estimated cost overruns as a result of a change in the contract requirements for the remaining contractual period for a regional jet program of
$10.0 million
. This amount was recorded as part of cost of goods sold in our results of operations and increased accrued liabilities by
$7.6 million
and other long-term liabilities by
$2.4 million
.
Income Taxes
The provision for income taxes is determined using an estimated annual effective tax rate, which is generally less than the U.S. federal statutory rate, primarily as a result of research and development (“R&D”) tax credits available in the United States and deductions available in the United States for domestic production activities. Our effective tax rate may be subject to fluctuations during the year as new information is obtained, which may affect the assumptions used to estimate the annual effective tax rate, including factors such as valuation allowances against deferred tax assets, the recognition or derecognition of tax benefits related to uncertain tax positions, expected utilization of R&D tax credits and changes in or the interpretation of tax laws in jurisdictions where we conduct business.
Deferred tax assets and liabilities are recognized, using enacted tax rates, for the expected future tax consequences of temporary differences between the book and tax bases of recorded assets and liabilities, operating losses, and tax credit carryforwards. Deferred tax assets are evaluated quarterly and are reduced by a valuation allowance if it is more likely than not that some portion or all of the deferred tax assets will not be realized.
Tax positions taken or expected to be taken in a tax return are recognized when it is more-likely-than-not, based on technical merits, to be sustained upon examination by taxing authorities. The amount recognized is measured as the largest amount of benefit that is greater than
50%
likely of being realized upon ultimate settlement, including resolution of related appeals and/or litigation process, if any.
On December 22, 2017, the Tax Cuts and Jobs Act (the “2017 Tax Act”) was enacted. The 2017 Tax Act represents major tax reform legislation that, among other provisions, reduces the U.S. corporate tax rate. Certain provisional amounts for the income tax effects of the 2017 Tax Act, including
$13.0 million
of deferred income tax benefit recorded principally due to the re-measurement of the federal portion of our deferred tax assets and liabilities, are reflected in our financial results in accordance with SEC Staff Accounting Bulletin No. 118 (“SAB 118”), which provides SEC staff guidance regarding the application of Accounting Standards Codification (“ASC”) Topic 740, “Income Taxes,” in the reporting period in which the 2017 Tax Act became law. See Note 16 for further information.
Litigation and Commitments
In the normal course of business, we are defendants in certain litigation, claims and inquiries, including matters relating to environmental laws. In addition, we make various commitments and incur contingent liabilities. Management’s estimates regarding contingent liabilities could differ from actual results.
Environmental Liabilities
Environmental liabilities are recorded when environmental assessments and/or remedial efforts are probable and costs can be reasonably estimated. Generally, the timing of these accruals coincides with the completion of a feasibility study or our commitment to a formal plan of action. Further, we review and update our environmental accruals as circumstances change and/or additional information is obtained that reasonably could be expected to have a meaningful effect on the outcome of a matter or the estimated cost thereof.
Accounting for Stock-Based Compensation
We measure and recognize compensation expense for share-based payment transactions to our employees and non-employees at their estimated fair value. The expense is measured at the grant date, based on the calculated fair value of the share-based award, and is recognized over the requisite service period (generally the vesting period of the equity award). The fair value of stock options are determined using the Black-Scholes-Merton (“Black-Scholes”) valuation model, which requires assumptions
57
and judgments regarding stock price volatility, risk-free interest rates, and expected options terms. Management’s estimates could differ from actual results. The fair value of unvested stock awards is determined based on the closing price of the underlying common stock on the date of grant except for market condition awards for which the fair value was based on a Monte Carlo simulation model.
Earnings (Loss) Per Share
Basic earnings per share are computed by dividing income available to common shareholders by the weighted-average number of common shares outstanding in each period. Diluted earnings per share are computed by dividing income available to common shareholders plus income associated with dilutive securities by the weighted-average number of common shares outstanding, plus any potential dilutive shares that could be issued if exercised or converted into common stock in each period.
The net earnings (loss) and weighted-average number of common shares outstanding used to compute earnings (loss) per share were as follows:
|
(In thousands, except per share data)
Years Ended December 31,
|
||||||||||||
|
|
2017
|
2016
|
2015
|
|||||||||
|
Net income (loss)
|
$
|
20,077
|
|
$
|
25,261
|
|
$
|
(74,879
|
)
|
|||
|
Weighted-average number of common shares outstanding
|
||||||||||||
|
Basic weighted-average common shares outstanding
|
11,290
|
|
11,151
|
|
11,047
|
|
||||||
|
Dilutive potential common shares
|
268
|
|
148
|
|
—
|
|
||||||
|
Diluted weighted-average common shares outstanding
|
11,558
|
|
11,299
|
|
11,047
|
|
||||||
|
Earnings (loss) per share
|
||||||||||||
|
Basic
|
$
|
1.78
|
|
$
|
2.27
|
|
$
|
(6.78
|
)
|
|||
|
Diluted
|
$
|
1.74
|
|
$
|
2.24
|
|
$
|
(6.78
|
)
|
|||
Potentially dilutive stock options and stock units to purchase common stock, as shown below, were excluded from the computation of diluted earnings per share because their inclusion would have been anti-dilutive. However, these shares may be potentially dilutive common shares in the future.
|
(In thousands)
Years Ended December 31,
|
|||||||||
|
|
2017
|
2016
|
2015
|
||||||
|
Stock options and stock units
|
126
|
|
553
|
|
778
|
|
|||
Recent Accounting Pronouncements
New Accounting Guidance Adopted in 2017
In December 2016, the FASB issued ASU 2016-19, “Technical Corrections and Improvements” (“2016-19”), which cover a variety of Topics in the Codification. The amendments in ASU 2016-19 represent changes to make corrections or improvements to the Codification that are not expected to have a significant effect on current accounting practice or create a significant administrative cost to most entities. The new guidance was effective for us beginning January 1, 2017. The adoption of this standard did not have a significant impact on our condensed consolidated financial statements.
In March 2016, the FASB issued ASU 2016-09, “Compensation - Stock Compensation (Topic 718): Improvements to Employee Share-Based Payment Accounting” (“ASU 2016-09”), which is intended to improve the accounting for employee share-based payments. The new guidance was effective for us beginning January 1, 2017. The adoption of this standard did not have a significant dollar impact on our condensed consolidated financial statements.
In March 2016, the FASB issued ASU 2016-05, “Derivatives and Hedging (Topic 815): Effect of Derivative Contract Novations on Existing Hedge Accounting Relationships” (“ASU 2016-05”), which clarifies that a change in the counter party to a derivative instrument designated as a hedging instrument does not require dedesignation of that hedging relationship, provided that all other hedge accounting criteria are met. The new guidance was effective for us beginning January 1, 2017. The adoption of this standard did not have a significant impact on our condensed consolidated financial statements.
In July 2015, the FASB issued ASU 2015-11, “Inventory (Topic 330)” (“ASU 2015-11”), which requires inventory within the scope of ASU 2015-11 to be measured at the lower of cost or net realizable value. Subsequent measurement is unchanged for inventory measured using last-in, first-out (“LIFO”) or the retail inventory value. The new guidance was effective for us beginning January 1, 2017. The adoption of this standard did not have a significant impact on our condensed consolidated
58
financial statements.
Recently Issued Accounting Standards
In August 2017, the FASB issued ASU 2017-12, “Derivatives and Hedging (Topic 815): Targeted Improvements to Accounting for Hedging” (“ASU 2017-12”), which intends to improve and simplify accounting rules around hedge accounting. ASU 2017-12 refines and expands hedge accounting for both financial (i.e., interest rate) and commodity risks. In addition, it creates more transparency around how economic results are presented, both on the face of the financial statements and in the footnotes. The new guidance is effective for annual periods beginning after December 15, 2018, including interim periods within those annual periods, which will be our interim period beginning January 1, 2019. Early adoption is permitted, including adoption in any interim period after the issuance of ASU 2017-12. We are evaluating the impact of this standard.
In May 2017, the FASB issued ASU 2017-09, “Compensation - Stock Compensation (Topic 718): Scope of Modification Accounting” (“ASU 2017-09”), which provides clarity on determining which changes to the terms and conditions of share-based payment awards require an entity to apply modification accounting under Topic 718. The new guidance is effective for annual periods beginning after December 15, 2017, including interim periods within those annual periods, which will be our interim period beginning January 1, 2018. Early adoption is permitted, including adoption in any interim period. The amendments should be applied prospectively to an award modified on or after the adoption date. We are evaluating the impact of this standard.
In March 2017, the FASB issued ASU 2017-07, “Compensation - Retirement Benefits (Topic 715): Improving the Presentation of Net Periodic Pension Cost and Net Periodic Postretirement Benefit Costs” (“ASU 2017-07”), which require an employer to report the service cost component in the same line item or items as other compensation costs arising from services rendered by the pertinent employees during the period. The other components of net benefit cost are required to be presented in the income statement separately from the service cost component and outside a subtotal of income from operations, if one is presented. If a separate line item or items are used to present the other components of net benefit cost, that line item or items must be appropriately described. If a separate line item or items are not used, the line item or items used in the income statement to present the other components of net benefit cost must be disclosed. The amendments also allow only the service cost component to be eligible for capitalization when applicable. The new guidance is effective for annual periods beginning after December 15, 2017, including interim periods within those annual periods, which will be our interim period beginning January 1, 2018. We are evaluating the impact of this standard.
In January 2017, the FASB issued ASU 2017-04, “Intangibles - Goodwill and Other (Topic 350): Simplifying the Test for Goodwill Impairment” (“ASU 2017-04”), which simplifies the subsequent measurement of goodwill, the amendments eliminate Step Two from the goodwill impairment test. The annual, or interim, goodwill impairment test is performed by comparing the fair value of a reporting unit with its carrying amount. An impairment charge should be recognized for the amount by which the carrying amount exceeds the reporting unit’s fair value; however, the loss recognized should not exceed the total amount of goodwill allocated to that reporting unit. In addition, income tax effects from any tax deductible goodwill on the carrying amount of the reporting unit should be considered when measuring the goodwill impairment loss, if applicable. The amendments also eliminate the requirements for any reporting unit with a zero or negative carrying amount to perform a qualitative assessment and, if it fails that qualitative test, to perform Step Two of the goodwill impairment test. An entity still has the option to perform the qualitative assessment for a reporting unit to determine if the quantitative impairment test is necessary. The new guidance is effective for annual or interim goodwill impairment tests in fiscal years beginning after December 15, 2019. Early adoption is permitted for interim or annual goodwill impairment tests performed on testing dates after January 1, 2017. We are evaluating the impact of this standard.
In January 2017, the FASB issued ASU 2017-01, “Business Combinations (Topic 805): Clarifying the Definition of a Business” (“ASU 2017-01”), which clarify the definition of a business with the objective of adding guidance to assist entities with evaluating whether transactions should be accounted for as acquisitions (or disposals) of businesses. The new guidance is effective for annual periods beginning after December 15, 2017, including interim periods within those annual periods, which will be our interim period beginning January 1, 2018. We are evaluating the impact of this standard.
In August 2016, the FASB issued ASU 2016-15, “Statement of Cash Flows (Topic 230): Classification of Certain Cash Receipts and Cash Payments” (“ASU 2016-15”), which addresses the following eight specific cash flow issues: Debt prepayment or debt extinguishment costs; settlement of zero-coupon debt instruments or other debt instruments with coupon interest rates that are insignificant in relation to the effective interest rate of the borrowing; contingent consideration payments made after a business combination; proceeds from the settlement of insurance claims; proceeds from the settlement of corporate-owned life insurance policies (“COLIs”) (including bank-owned life insurance policies [“BOLIs”]); distributions received from equity method investees; beneficial interests in securitization transactions; and separately identifiable cash flows and application of the predominance principle. The new guidance is effective for annual periods beginning after December 15, 2017, including interim periods within those annual periods, which will be our interim period beginning January 1, 2018. We are evaluating the impact of this standard.
59
In February 2016, the FASB issued ASU 2016-02, “Leases (Topic 842)” (“ASU 2016-02”), which requires lessees to present right-of-use assets and lease liabilities on the balance sheet. Lessees are required to apply a modified retrospective transition approach for leases existing at, or entered into after, the beginning of the earliest comparative period presented in the financial statements. The new guidance is effective for fiscal years beginning after December 15, 2018, including interim periods within those fiscal years, which will be our interim period beginning January 1, 2019. We are evaluating the impact of this standard and currently anticipate it will impact our condensed consolidated financial statements.
In May 2014, the FASB issued ASU 2014-09, “Revenue from Contracts with Customers (Topic 606)” (“ASU 2014-09”), which outlines a new, single comprehensive model for entities to use in accounting for revenue arising from contracts with customers and supersedes most current revenue recognition guidance, including industry-specific guidance. This new revenue recognition model provides a five-step analysis in determining when and how revenue is recognized. It depicts the transfer of promised goods or services to customers in an amount that reflects the consideration an entity expects to receive in exchange for those goods or services. Companies have the option of applying the provisions of ASU 2014-09 either retrospectively to each prior reporting period presented or retrospectively with the cumulative effect of initially applying this guidance recognized at the date of initial application. Additional guidance was issued subsequently as follows:
|
•
|
December 2016, the FASB issued ASU 2016-20, “Technical Corrections and Improvements to Topic 606, Revenue from Contracts with Customers” (“ASU 2016-20”);
|
|
•
|
May 2016, the FASB issued ASU 2016-12, “Revenue from Contracts with Customers (Topic 606): Narrow-Scope Improvements and Practical Expedients” (“ASU 2016-12”);
|
|
•
|
May 2016, the FASB issued ASU 2016-11, “Revenue Recognition (Topic 605) and Derivatives and Hedging (Topic 815): Rescission of SEC Guidance Because of Accounting Standards Updates 2014-09 and 2014-06 Pursuant to Staff Announcements at the March 3, 2016 EITF Meeting” (“ASU 2016-11”);
|
|
•
|
April 2016, the FASB issued ASU 2016-10, “Revenue from Contracts with Customers (Topic 606): Identifying Performance Obligations and Licensing” (“ASU 2016-10”); and
|
|
•
|
August 2015, the FASB issued ASU 2015-14, “Revenue From Contracts With Customers (Topic 606)” (“ASU 2015-14”).
|
All of this new guidance is effective for fiscal years beginning after December 15, 2017, including interim periods within those fiscal years, which will be our interim period beginning January 1, 2018.
We are in the process of completing the implementation phase of the project. We have noted that under ASU 2014-09, the percentage of completion, unit of delivery method of recognizing revenue will no longer be an acceptable method for us and production costs will generally not be deferred. Instead, revenue will be recognized as the customer obtains control of the goods and services promised in the contract (i.e., performance obligations). Given the nature of our products and terms and conditions in the majority of our contracts, our customer obtains control as we perform work under the contract. As such, the majority of our revenues will be recognized sooner as a result of changing to an over time method (i.e., cost-to-cost plus margin) from a point-in-time method, which is our current method for recognizing revenue. This will result in eliminating the majority of our work-in-process and finished goods inventory and a significant increase in unbilled accounts receivables (i.e., contract assets). This change will also impact our information technology systems, systems of internal controls over financial reporting, and certain accounting policies, requiring the usage of more judgment in determining our revenue recognition. We have selected a software solution and are in the process of implementing the software solution to comply with this new accounting standard. The new accounting standard will be adopted using the modified retrospective method, whereby the cumulative effect of applying the new guidance is recognized as an adjustment to certain captions on the balance sheet, including the opening balance of retained earnings in the first quarter of 2018. We have periodically briefed our Audit Committee of the Board of Directors on the progress made towards the adoption of this revenue recognition accounting standard. Since we have not completed the implementation of the software solution, we currently are unable to determine the exact impact to our consolidated financial statements. However, we expect the impact to be significant on certain captions on our January 1, 2018 opening balance sheet.
On September 11, 2017, we acquired
100.0%
of the outstanding equity interests of Lightning Diversion Systems, LLC (“LDS”), a privately-held, worldwide leader in lightning protection systems serving the aerospace and defense industries, located in Huntington Beach, California. The acquisition of LDS is part of our strategy to enhance revenue growth by focusing on advanced proprietary technology on various aerospace and defense platforms.
The purchase price for LDS was
$60.0 million
, net of cash acquired, all payable in cash. Upon the closing of the transaction, we paid
$61.4 million
with the remaining
$0.6 million
paid in October 2017. We allocated the gross purchase price of
$62.0
60
million
to the assets acquired and liabilities assumed at estimated fair values. The excess of the purchase price over the aggregate fair values was recorded as goodwill.
The following table summarizes the estimated fair value of the assets acquired and liabilities assumed at the date of acquisition (in thousands):
|
Estimated
Fair Value
|
||||
|
Cash
|
$
|
2,223
|
|
|
|
Accounts receivable
|
918
|
|
||
|
Inventories
|
1,732
|
|
||
|
Other current assets
|
54
|
|
||
|
Property and equipment
|
138
|
|
||
|
Intangible assets
|
22,400
|
|
||
|
Goodwill
|
34,881
|
|
||
|
Total assets acquired
|
62,346
|
|
||
|
Current liabilities
|
(325
|
)
|
||
|
Total liabilities assumed
|
(325
|
)
|
||
|
Total purchase price allocation
|
$
|
62,021
|
|
|
|
Useful Life
(In years)
|
Estimated
Fair Value
(In thousands)
|
|||||
|
Intangible assets:
|
||||||
|
Customer relationships
|
15
|
$
|
21,100
|
|
||
|
Trade name
|
15
|
1,300
|
|
|||
|
$
|
22,400
|
|
||||
The intangible assets acquired of
$22.4 million
were determined based on the estimated fair values using valuation techniques consistent with the income approach to measure fair value. The useful lives were estimated based on the underlying agreements or the future economic benefit expected to be received from the assets. The fair values of the identifiable intangible assets were estimated using several valuation methodologies, which represented Level 3 fair value measurements. The value for customer relationships was estimated based on a multi-period excess earnings approach, while the value for the trade name was assessed using the relief from royalty methodology. Further, we analyzed the technology acquired and concluded no fair value should be assigned to it.
The goodwill of
$34.9 million
arising from the acquisition is attributable to the benefits we expect to derive from expected synergies from the transaction, including complementary products that will enhance our overall product portfolio, opportunities within new markets, and an acquired assembled workforce. All the goodwill was assigned to the Electronic Systems segment. Since the LDS acquisition, for tax purposes, was deemed an asset acquisition, the goodwill recognized is deductible for income tax purposes.
Acquisition related transaction costs are not included as components of consideration transferred but have been expensed as incurred. Total acquisition-related transaction costs incurred by us were
$0.3 million
during 2017 and charged to selling, general and administrative expenses.
LDS’ results of operations have been included in our consolidated statements of operations since the date of acquisition as part of the Electronic Systems segment. Pro forma results of operations of the LDS acquisition have not been presented as the effect of the LDS acquisition was not material to our financial results.
Summary of 2017 Restructuring Plan
In November 2017, management approved and commenced a restructuring plan that is expected to increase operating efficiencies. We currently estimate this initiative will result in
$19.0 million
to
$22.0 million
in total pre-tax restructuring charges through 2018, with
$8.8 million
recorded during 2017. We are currently evaluating a number of possible scenarios to execute the second phase of the restructuring plan, which will result in additional restructuring charges during 2018. We anticipate the additional charges will include cash payments for employee separation and non-cash charges for asset
61
impairments, depending on the specific plan we develop. On an annualized basis, beginning in 2019, we estimate these restructuring actions will result in total savings of
$14.0 million
.
In the Electronic Systems segment, we have recorded expenses of
$1.2 million
for severance and benefits which was charged to restructuring charges.
In the Structural Systems segment, we have recorded expenses of
$1.7 million
for severance and benefits which was charged to restructuring charges. In addition, we recorded non-cash expenses of
$3.6 million
for property and equipment impairment which was charged to restructuring charges. Further, we recorded non-cash expenses of
$0.5 million
for inventory write down which was charged to cost of sales.
In Corporate, we have recorded expenses of
$0.4 million
for severance and benefits and non-cash expenses of
$1.4 million
for stock-based compensation awards which were modified, all of which was charged to restructuring charges.
As of December 31, 2017, we have accrued
$1.0 million
,
$1.3 million
, and
$0.4 million
for severance and benefits and loss on early exit from lease in the Electronic Systems segment, Structural Systems segment, and Corporate, respectively.
Summary of 2016 Restructuring Plan
In May 2016, management approved and commenced implementation of the closure of
one
of our Tulsa facilities that was completed in June 2016, and is part of our overall strategy to streamline operations. We have recorded cumulative expenses of
$0.2 million
for severance and benefits and loss on early exit from a lease, all of which were charged to restructuring charges in 2016. We do not expect to record additional expenses related to this restructuring plan.
As of December 31, 2017, we have accrued less than
$0.1 million
for loss on early exit from lease in the Electronic Systems segment.
Summary of 2015 Restructuring Plans
In September 2015, management approved and commenced implementation of several restructuring actions, including organizational re-alignment, consolidation and relocation of the New York facilities that was completed in December 2015, closure of the Houston facility that was completed in December 2015, and closure of the St. Louis facility that was completed in April 2016, all of which are part of our overall strategy to streamline operations. We have recorded cumulative expenses of
$2.2 million
for severance and benefits and loss on early exit from leases, all of which were charged to restructuring charges in 2015. We do not expect to record additional expenses related to these restructuring plans.
As of December 31, 2017, all payments have been made on early exit from lease in the Structural Systems segment.
Our restructuring activities for 2017 and 2016 were as follows (in thousands):
|
December 31, 2016
|
2017
|
December 31, 2017
|
||||||||||||||||||||||
|
Balance
|
Charges
|
Cash Payments
|
Non-Cash Payments
|
Change in Estimates
|
Balance
|
|||||||||||||||||||
|
Severance and benefits
|
$
|
—
|
|
$
|
3,337
|
|
$
|
(678
|
)
|
$
|
—
|
|
$
|
—
|
|
$
|
2,659
|
|
||||||
|
Modification of stock-based compensation awards
|
—
|
|
1,334
|
|
—
|
|
(1,334
|
)
|
—
|
|
—
|
|
||||||||||||
|
Lease termination
|
654
|
|
18
|
|
(670
|
)
|
—
|
|
64
|
|
66
|
|
||||||||||||
|
Property and equipment impairment due to restructuring
|
—
|
|
3,607
|
|
—
|
|
(3,607
|
)
|
—
|
|
—
|
|
||||||||||||
|
Inventory write down
|
—
|
|
478
|
|
—
|
|
(478
|
)
|
—
|
|
—
|
|
||||||||||||
|
Ending balance
|
$
|
654
|
|
$
|
8,774
|
|
$
|
(1,348
|
)
|
$
|
(5,419
|
)
|
$
|
64
|
|
$
|
2,725
|
|
||||||
Fair value is defined as the price that would be received for an asset or the price that would be paid to transfer a liability (an exit price) in the principal or most advantageous market in an orderly transaction between market participants on the measurement date. The accounting standard provides a framework for measuring fair value using a fair value hierarchy that prioritizes the inputs to valuation techniques used to measure fair value. This hierarchy requires us to maximize the use of observable inputs and minimize the use of unobservable inputs when measuring fair value. Three levels of inputs that may be used to measure fair value are as follows:
Level 1
- Quoted prices (unadjusted) in active markets for identical assets or liabilities;
62
Level 2
- Observable inputs other than Level 1 prices, such as quoted prices for similar assets or liabilities; quoted prices in markets that are not active; or other inputs that are observable or can be corroborated by observable market data for substantially the full term of the assets or liabilities; and
Level 3
- Unobservable inputs that are supported by little or no market activity and that are significant to the fair value of the assets or liabilities.
Our financial instruments consist primarily of cash and cash equivalents and interest rate cap derivatives designated as cash flow hedging instruments. Assets and liabilities measured at fair value on a recurring basis were as follows (in thousands):
|
As of December 31, 2017
|
As of December 31, 2016
|
|||||||||||||||||||||||||||||||
|
Fair Value Measurements Using
|
Fair Value Measurements Using
|
|||||||||||||||||||||||||||||||
|
Level 1
|
Level 2
|
Level 3
|
Total Balance
|
Level 1
|
Level 2
|
Level 3
|
Total Balance
|
|||||||||||||||||||||||||
|
Assets
|
||||||||||||||||||||||||||||||||
|
Money market funds
(1)
|
$
|
26
|
|
$
|
—
|
|
$
|
—
|
|
$
|
26
|
|
$
|
3,751
|
|
$
|
—
|
|
$
|
—
|
|
$
|
3,751
|
|
||||||||
|
Interest rate cap hedges
(2)
|
—
|
|
165
|
|
—
|
|
165
|
|
—
|
|
553
|
|
—
|
|
553
|
|
||||||||||||||||
|
Total Assets
|
$
|
26
|
|
$
|
165
|
|
$
|
—
|
|
$
|
191
|
|
$
|
3,751
|
|
$
|
553
|
|
$
|
—
|
|
$
|
4,304
|
|
||||||||
(1) Included as cash and cash equivalents.
(2) Interest rate cap hedge premium included as other current assets and other assets.
The fair value of the interest rate cap hedge agreements is determined using pricing models that use observable market inputs as of the balance sheet date, a Level 2 measurement.
There were no transfers between Level 1, Level 2, or Level 3 financial instruments in either 2017 or 2016.
Derivative Instruments and Hedging Activities
We periodically enter into cash flow derivative transactions, such as interest rate cap agreements, to hedge exposure to various risks related to interest rates. We assess the effectiveness of the interest rate cap hedges at inception of the hedge. We recognize all derivatives at their fair value. For cash flow designated hedges, the effective portion of the changes in fair value of the derivative contract are recorded in accumulated other comprehensive income (loss), net of taxes, and are recognized in net earnings at the time earnings are affected by the hedged transaction. Adjustments to record changes in fair values of the derivative contracts that are attributable to the ineffective portion of the hedges, if any, are recognized in earnings. We present derivative instruments in our consolidated statements of cash flows’ operating, investing, or financing activities consistent with the cash flows of the hedged item.
Our interest rate cap hedges were designated as cash flow hedges and deemed highly effective at the inception of the hedges. These interest rate cap hedges mature concurrently with the term loan in June 2020. In 2017, the interest rate cap hedges continued to be highly effective and
$0.2 million
, net of tax, was recognized in other comprehensive income.
No
amount was recorded in the consolidated statements of operations in 2017. See Note 10.
The recorded fair value of the derivative financial instruments in the consolidated balance sheets were as follows:
|
(In thousands)
December 31, 2017
|
(In thousands)
December 31, 2016 |
|||||||||||||||
|
Other Current Assets
|
Other Long Term Assets
|
Other Current Assets
|
Other Long Term Assets
|
|||||||||||||
|
Derivatives Designated as Hedging Instruments
|
||||||||||||||||
|
Cash Flow Hedges:
|
||||||||||||||||
|
Interest rate cap premiums
|
$
|
—
|
|
$
|
165
|
|
$
|
—
|
|
$
|
553
|
|
||||
|
Total Derivatives
|
$
|
—
|
|
$
|
165
|
|
$
|
—
|
|
$
|
553
|
|
||||
63
Inventories consisted of the following:
|
(In thousands)
December 31,
|
||||||||
|
2017
|
2016
|
|||||||
|
Raw materials and supplies
|
$
|
65,221
|
|
$
|
64,650
|
|
||
|
Work in process
|
62,584
|
|
56,806
|
|
||||
|
Finished goods
|
10,665
|
|
9,180
|
|
||||
|
138,470
|
|
130,636
|
|
|||||
|
Less progress payments
|
16,309
|
|
10,740
|
|
||||
|
Total
|
$
|
122,161
|
|
$
|
119,896
|
|
||
We net progress payments from customers related to inventory purchases against inventories on the consolidated balance sheets.
Property and equipment, net consisted of the following:
|
(In thousands)
December 31,
|
Range of
Estimated
|
|||||||||
|
2017
|
2016
|
Useful Lives
|
||||||||
|
Land
|
$
|
15,662
|
|
$
|
15,662
|
|
||||
|
Buildings and improvements
|
57,024
|
|
49,870
|
|
5 - 40 Years
|
|||||
|
Machinery and equipment
|
146,175
|
|
137,555
|
|
2 - 20 Years
|
|||||
|
Furniture and equipment
|
21,127
|
|
21,749
|
|
2 - 10 Years
|
|||||
|
Construction in progress
|
13,480
|
|
12,238
|
|
||||||
|
253,468
|
|
237,074
|
|
|||||||
|
Less accumulated depreciation
|
143,216
|
|
135,484
|
|
||||||
|
Total
|
$
|
110,252
|
|
$
|
101,590
|
|
||||
Depreciation expense was
$13.2 million
,
$13.3 million
and
$15.7 million
, for the years ended
December 31, 2017
,
2016
and
2015
, respectively.
Goodwill
The carrying amounts of goodwill, all in our Electronic Systems segment, for the years ended
December 31, 2017
and
2016
were as follows:
|
|
(In thousands)
|
|||
|
Gross goodwill
|
$
|
164,276
|
|
|
|
Accumulated goodwill impairment
|
(81,722
|
)
|
||
|
Balance at December 31, 2016
|
82,554
|
|
||
|
Goodwill from acquisition during the period
|
34,881
|
|
||
|
Balance at December 31, 2017
|
$
|
117,435
|
|
|
Goodwill is evaluated for impairment on a annual basis on the first day of the fourth fiscal quarter or more frequently if events or changes in circumstances indicate that the asset may be impaired. Our impairment evaluation of goodwill consists of a qualitative assessment to determine if it is more likely than not that the fair value of a reporting unit is less than its carrying amount. The qualitative evaluation is an assessment of factors, including reporting unit specific operating results as well as industry, market, and economic conditions, to determine whether it is more likely than not that the fair value of a reporting unit is less than its carrying amount, including goodwill. If our qualitative assessment indicates it is more likely than not that the
64
estimated fair value of a reporting unit exceeds its carrying value, no further analysis is required and goodwill is not impaired. Otherwise, we will follow a two-step quantitative goodwill impairment test to determine if goodwill is impaired.
In the fourth quarter of 2017, the carrying amount of goodwill at the date of the most recent annual impairment evaluation was
$117.4 million
, all of which was in our Electronic Systems operating segment. As of the date of our 2017 annual evaluation for goodwill impairment, we used a qualitative assessment noting it was not more likely than not that the fair value of a reporting unit is less than its carrying amount and thus, goodwill was not deemed impaired. Our most recent step-one goodwill impairment analysis was in the prior year fourth quarter of 2016 and the fair value of the Electronic Systems internal reporting unit exceeded its carrying value at that time by
32%
and thus, was not deemed impaired.
In September 2017, we acquired
100.0%
of the outstanding equity interests of LDS for a purchase price of
$60.0 million
, net of cash acquired. We allocated the gross purchase price of
$62.0 million
to the assets acquired and liabilities assumed at estimated fair values. The excess of the purchase over the aggregate fair values was recorded as goodwill. See Note 2.
Other intangible assets are related to acquisitions, including LDS, and recorded at fair value at the time of the acquisition. Other intangible assets with finite lives are generally amortized on the straight-line method over periods ranging from
fourteen
to
eighteen
years. Intangible assets are as follows:
|
(In thousands)
|
|||||||||||||||||||||||||
|
December 31, 2017
|
December 31, 2016
|
||||||||||||||||||||||||
|
Wtd. Avg Life (Yrs)
|
Gross
Carrying
Amount
|
Accumulated
Amortization
|
Net
Carrying
Amount
|
Gross
Carrying
Amount
|
Accumulated
Amortization
|
Net
Carrying
Amount
|
|||||||||||||||||||
|
Finite-lived assets
|
|||||||||||||||||||||||||
|
Customer relationships
|
17
|
$
|
180,300
|
|
$
|
67,449
|
|
$
|
112,851
|
|
$
|
159,200
|
|
$
|
58,352
|
|
$
|
100,848
|
|
||||||
|
Trade names
|
15
|
1,300
|
|
26
|
|
1,274
|
|
—
|
|
—
|
|
—
|
|
||||||||||||
|
Contract renewal
|
14
|
1,845
|
|
1,493
|
|
352
|
|
1,845
|
|
1,362
|
|
483
|
|
||||||||||||
|
Technology
|
15
|
400
|
|
184
|
|
216
|
|
400
|
|
158
|
|
242
|
|
||||||||||||
|
Total
|
$
|
183,845
|
|
$
|
69,152
|
|
$
|
114,693
|
|
$
|
161,445
|
|
$
|
59,872
|
|
$
|
101,573
|
|
|||||||
The carrying amount of other intangible assets by operating segment as of
December 31, 2017
and
2016
was as follows:
|
(In thousands)
|
||||||||||||||||||||||||
|
December 31, 2017
|
December 31, 2016
|
|||||||||||||||||||||||
|
Gross
|
Accumulated
Amortization
|
Net
Carrying
Value
|
Gross
|
Accumulated
Amortization
|
Net
Carrying
Value
|
|||||||||||||||||||
|
Other intangible assets
|
||||||||||||||||||||||||
|
Structural Systems
|
$
|
19,300
|
|
$
|
16,464
|
|
$
|
2,836
|
|
$
|
19,300
|
|
$
|
15,555
|
|
$
|
3,745
|
|
||||||
|
Electronic Systems
|
164,545
|
|
52,688
|
|
111,857
|
|
142,145
|
|
44,317
|
|
97,828
|
|
||||||||||||
|
Total
|
$
|
183,845
|
|
$
|
69,152
|
|
$
|
114,693
|
|
$
|
161,445
|
|
$
|
59,872
|
|
$
|
101,573
|
|
||||||
65
Amortization expense of other intangible assets was
$9.3 million
,
$9.0 million
and
$10.0 million
for the years ended
December 31, 2017
,
2016
and
2015
, respectively. Future amortization expense by operating segment is expected to be as follows:
|
(In thousands)
|
||||||||||||
|
Structural
Systems
|
Electronic
Systems
|
Consolidated
Ducommun
|
||||||||||
|
2018
|
$
|
737
|
|
$
|
9,420
|
|
$
|
10,157
|
|
|||
|
2019
|
591
|
|
9,419
|
|
10,010
|
|
||||||
|
2020
|
490
|
|
9,348
|
|
9,838
|
|
||||||
|
2021
|
381
|
|
9,287
|
|
9,668
|
|
||||||
|
2022
|
320
|
|
9,288
|
|
9,608
|
|
||||||
|
Thereafter
|
317
|
|
65,095
|
|
65,412
|
|
||||||
|
$
|
2,836
|
|
$
|
111,857
|
|
$
|
114,693
|
|
||||
The components of accrued liabilities consisted of the following:
|
(In thousands)
December 31,
|
||||||||
|
2017
|
2016
|
|||||||
|
Accrued compensation
|
$
|
18,925
|
|
$
|
15,455
|
|
||
|
Accrued income tax and sales tax
|
71
|
|
332
|
|
||||
|
Customer deposits
|
3,970
|
|
3,204
|
|
||||
|
Provision for forward loss reserves
|
1,226
|
|
4,780
|
|
||||
|
Other
|
4,137
|
|
5,508
|
|
||||
|
Total
|
$
|
28,329
|
|
$
|
29,279
|
|
||
Long-term debt and the current period interest rates were as follows:
|
(In thousands)
December 31,
|
||||||||
|
2017
|
2016
|
|||||||
|
Term loan
|
$
|
160,000
|
|
$
|
170,000
|
|
||
|
Revolving credit facility
|
58,100
|
|
—
|
|
||||
|
Other debt (fixed 5.41%)
|
—
|
|
3
|
|
||||
|
Total debt
|
218,100
|
|
170,003
|
|
||||
|
Less current portion
|
—
|
|
3
|
|
||||
|
Total long-term debt
|
218,100
|
|
170,000
|
|
||||
|
Less debt issuance costs
|
2,045
|
|
3,104
|
|
||||
|
Total long-term debt, net of debt issuance costs
|
$
|
216,055
|
|
$
|
166,896
|
|
||
|
Weighted-average interest rate
|
3.73
|
%
|
3.25
|
%
|
||||
66
Future long-term debt payments at
December 31, 2017
were as follows:
|
(In thousands)
|
|||
|
2018
|
$
|
—
|
|
|
2019
|
—
|
|
|
|
2020
|
218,100
|
|
|
|
2021
|
—
|
|
|
|
2022
|
—
|
|
|
|
Total
|
$
|
218,100
|
|
Our credit facility consists of a
$275.0 million
senior secured term loan, which matures on June 26, 2020 (“Term Loan”), and a
$200.0 million
senior secured revolving credit facility (“Revolving Credit Facility”), which matures on June 26, 2020 (collectively, the “Credit Facilities”). The Credit Facilities bear interest, at our option, at a rate equal to either (i) the Eurodollar Rate (defined as LIBOR) plus an applicable margin ranging from
1.50%
to
2.75%
per year or (ii) the Base Rate (defined as the highest of [a] Federal Funds Rate plus
0.50%
, [b] Bank of America’s prime rate, and [c] the Eurodollar Rate plus
1.00%
) plus an applicable margin ranging from
0.50%
to
1.75%
per year, in each case based upon the consolidated total net adjusted leverage ratio. The undrawn portions of the commitments of the Credit Facilities are subject to a commitment fee ranging from
0.175%
to
0.300%
, based upon the consolidated total net adjusted leverage ratio.
Further, we are required to make mandatory prepayments of amounts outstanding under the Term Loan. The mandatory prepayments will be made quarterly, equal to
5.0%
per year of the original aggregate principal amount during the first two years and increase to
7.5%
per year during the third year, and increase to
10.0%
per year during the fourth year and fifth years, with the remaining balance payable on June 26, 2020. The loans under the Revolving Credit Facility are due on June 26, 2020. As of December 31, 2017, we were in compliance with all covenants required under the Credit Facilities.
In addition, we incurred
$4.8 million
of debt issuance costs related to the Credit Facilities and those costs were capitalized and are being amortized over the
five
year life of the Credit Facilities.
In September 2017, we acquired LDS for a purchase price of
$60.0 million
, net of cash acquired, all payable in cash. Upon the closing of the transaction, we paid
$61.4 million
in cash by drawing down on the Revolving Credit Facility. The remaining
$0.6 million
was paid in October 2017 in cash, also by drawing down on the Revolving Credit Facility. See Note 2.
In July 2017, we entered into a technical amendment to the Credit Facilities (“First Amendment”) which provided more flexibility to close certain qualified acquisitions permitted under the Credit Facilities.
We made voluntary principal prepayments of
$10.0 million
under the Term Loan during 2017.
As of December 31, 2017, we had
$141.6 million
of unused borrowing capacity under the Revolving Credit Facility, after deducting
$58.1 million
for draw down on the Revolving Credit Facility and
$0.3 million
for standby letters of credit.
The Existing Notes were issued by us (“Parent Company”) and guaranteed by all of our subsidiaries, other than one subsidiary that was considered minor (“Subsidiary Guarantors”). The Subsidiary Guarantors jointly and severally guarantee the Existing Notes and Credit Facilities. The Parent Company has no independent assets or operations and therefore, no consolidating financial information for the Parent Company and its subsidiaries are presented.
In October 2015, we entered into interest rate cap hedges designated as cash flow hedges with maturity dates of June 2020, and in aggregate, totaling
$135.0 million
of our debt. We paid a total of
$1.0 million
in connection with the interest rate cap hedges. See Note 5 for further information.
In December 2017 and 2016, we entered into agreements to purchase
$14.2 million
and
$9.9 million
of industrial revenue bonds (“IRBs”) issued by the city of Parsons, Kansas (“Parsons”) and concurrently, sold
$14.2 million
and
$9.9 million
of property and equipment (“Property”) to Parsons as well as entered into a lease agreement to lease the Property from Parsons (“Lease”) with lease payments totaling
$14.2 million
and
$9.9 million
over the lease term, respectively. The sale of the Property and concurrent lease back of the Property in December 2017 and 2016 did not meet the sale-leaseback accounting requirements as a result of our continuous involvement with the Property and thus, the
$14.2 million
and
$9.9 million
in cash received from Parsons was not recorded as a sale but as a financing obligation, respectively. Further, the Lease included a right of offset so long as we continue to own the IRBs and thus, the financing obligation of
$14.2 million
and
$9.9 million
was offset against the
$14.2 million
and
$9.9 million
, respectively, of IRBs assets and are presented net on the consolidated balance sheets with no impact to the consolidated statements of operations or consolidated cash flow statements.
67
We are authorized to issue
five million
shares of preferred stock. At
December 31, 2017
and
2016
, no preferred shares were issued or outstanding.
Stock Incentive Compensation Plans
We have
two
stock incentive plans: the 2007 Stock Incentive Plan (the “2007 Plan”), as amended effective March 20, 2007, and the 2013 Stock Incentive Plan (the “2013 Plan”), collectively referred to as (the “Stock Incentive Plans”). The Stock Incentive Plans permit awards of stock options, restricted stock units, performance stock units and other stock-based awards to our officers, key employees and non-employee directors on terms determined by the Compensation Committee of the Board of Directors (the “Committee”). The aggregate number of shares available for issuance under the 2007 Plan and 2013 Plan is
1,200,000
and
1,040,000
, respectively. Under the 2007 Plan, no more than an aggregate of
400,000
shares are available for issue of stock-based awards other than stock options and stock appreciation rights. As of
December 31, 2017
, shares available for future grant under the 2007 Plan and 2013 Plan are
zero
and
77,693
, respectively. Prior the adoption of the 2007 Plan, we granted stock-based awards to purchase shares of our common stock to officers, key employees and non-employee directors under certain predecessor plans. No further awards can be granted under the 2007 Plan or these predecessor plans.
Stock Options
In the years ended
December 31, 2017
, 2016, and 2015, we granted stock options to our officers, key employees and non-employee directors of
129,400
,
123,500
, and
73,000
, respectively, with weighted-average grant date fair values of
$11.88
,
$6.53
, and
$10.63
, respectively. Stock options have been granted with an exercise price equal to the fair market value of our stock on the date of grant and expire not more than
seven
years from the date of grant. The stock options typically vest over a period of
four
years from the date of grant. The option price and number of shares are subject to adjustment under certain dilutive circumstances. If an employee terminates employment, the non-vested portion of the stock options will not vest and all rights to the non-vested portion will terminate completely.
Stock option activity for the year ended
December 31, 2017
were as follows:
|
Number
of Stock Options
|
Weighted-
Average
Exercise
Price Per Share
|
Weighted-Average Remaining Contractual Life (Years)
|
Aggregate Intrinsic Value (in thousands)
|
||||||||||
|
Outstanding at January 1, 2017
|
439,550
|
|
$
|
20.07
|
|
||||||||
|
Granted
|
129,400
|
|
$
|
29.19
|
|
||||||||
|
Exercised
|
(212,775
|
)
|
$
|
20.38
|
|
||||||||
|
Expired
|
(5,800
|
)
|
$
|
21.12
|
|
||||||||
|
Forfeited
|
(44,150
|
)
|
$
|
22.19
|
|
||||||||
|
Outstanding at December 31, 2017
|
306,225
|
|
$
|
23.38
|
|
5.2
|
$
|
1,654
|
|
||||
|
Exerciseable at December 31, 2017
|
86,425
|
|
$
|
20.78
|
|
2.9
|
$
|
663
|
|
||||
Changes in nonvested stock options for the year ended
December 31, 2017
were as follows:
|
Number of Stock Options
|
Weighted-
Average
Grant
Date Fair Value
|
||||||
|
Nonvested at January 1, 2017
|
225,175
|
|
$
|
8.77
|
|
||
|
Granted
|
129,400
|
|
$
|
11.88
|
|
||
|
Vested
|
(90,625
|
)
|
$
|
8.87
|
|
||
|
Forfeited
|
(44,150
|
)
|
$
|
7.93
|
|
||
|
Nonvested at December 31, 2017
|
219,800
|
|
$
|
11.07
|
|
||
68
The aggregate intrinsic value of stock options represents the amount by which the market price of our common stock exceeds the exercise price of the stock option. The aggregate intrinsic value of stock options exercised for the years ended
December 31, 2017
,
2016
and
2015
was
$2.5 million
,
$1.3 million
, and
$2.3 million
, respectively. Cash received from stock options exercised for the years ended
December 31, 2017
,
2016
and
2015
was
$4.3 million
,
$2.1 million
, and
$3.1 million
, respectively, with related tax benefits of
$0.9 million
,
$0.5 million
, and
$0.9 million
, respectively. The total amount of stock options vested and expected to vest in the future is
306,225
shares with a weighted-average exercise price of
$23.38
and an aggregate intrinsic value of
$1.7 million
. These stock options have a weighted-average remaining contractual term of
5.2
years.
The share-based compensation cost expensed for stock options for the years ended
December 31, 2017
,
2016
, and
2015
(before tax benefits) was
$0.7 million
,
$0.8 million
, and
$1.2 million
, respectively, and is included in selling, general and administrative expenses on the consolidated income statements. At
December 31, 2017
, total unrecognized compensation cost (before tax benefits) related to stock options of
$1.5 million
is expected to be recognized over a weighted-average period of
3.1
years. The total fair value of stock options vested during the years ended
December 31, 2017
,
2016
, and
2015
was
$0.8 million
,
$0.9 million
, and
$1.3 million
, respectively.
We apply fair value accounting for stock-based compensation based on the grant date fair value estimated using a Black-Scholes-Merton (“Black-Scholes”) valuation model. The assumptions used to compute the fair value of stock option grants under the Stock Incentive Plans for years ended December 31, 2017, 2016, and 2015 were as follows:
|
Years Ended December 31,
|
|||||||||
|
2017
|
2016
|
2015
|
|||||||
|
Risk-free interest rate
|
1.75
|
%
|
1.20
|
%
|
1.13
|
%
|
|||
|
Expected volatility
|
50.37
|
%
|
51.79
|
%
|
53.72
|
%
|
|||
|
Expected dividends
|
—
|
|
—
|
|
—
|
|
|||
|
Expected term (in months)
|
48
|
|
48
|
|
47
|
|
|||
We recognize compensation expense, net of an estimated forfeiture rate, on a straight-line basis over the requisite service period of the award. We have one award population with an option vesting term of
four
years. We estimate the forfeiture rate based on our historic experience, attempting to determine any discernible activity patterns. The expected life computation is based on historic exercise patterns and post-vesting termination behavior. The risk-free interest rate for periods within the contractual life of the award is based on the U.S. Treasury yield curve in effect at the time of grant. The expected volatility is derived from historical volatility of our common stock. We suspended payments of dividends after the first quarter of 2011.
Restricted Stock Units
We granted restricted stock units (“RSUs”) to certain officers, key employees and non-employee directors of
135,350
,
139,450
, and
108,500
RSUs during the years ended
December 31, 2017
,
2016
, and
2015
, respectively, with weighted-average grant date fair values (equal to the fair market value of our stock on the date of grant) of
$28.97
,
$15.97
, and
$25.15
per share, respectively. RSUs represent a right to receive a share of stock at future vesting dates with no cash payment required from the holder. The RSUs typically have a
three
year vesting term of
33%
,
33%
and
34%
on the first, second and third anniversaries of the date of grant, respectively. If an employee terminates employment, their non-vested portion of the RSUs will not vest and all rights to the non-vested portion will terminate.
Restricted stock unit activity for the year ended
December 31, 2017
was as follows:
|
Number of Restricted Stock Units
|
Weighted-
Average
Grant
Date Fair Value
|
||||||
|
Outstanding at January 1, 2017
|
193,382
|
|
$
|
18.88
|
|
||
|
Granted
|
135,350
|
|
$
|
28.97
|
|
||
|
Vested
|
(101,930
|
)
|
$
|
19.66
|
|
||
|
Forfeited
|
(41,458
|
)
|
$
|
21.93
|
|
||
|
Outstanding at December 31, 2017
|
185,344
|
|
$
|
25.14
|
|
||
The share-based compensation cost expensed for RSUs for the years ended
December 31, 2017
,
2016
, and
2015
(before tax benefits) was
$2.0 million
,
$1.8 million
, and
$1.8 million
respectively, and is included in selling, general and administrative expenses on the consolidated income statements. At
December 31, 2017
, total unrecognized compensation cost (before tax benefits) related to RSUs of
$3.0 million
is expected to be recognized over a weighted average period of
2.0
years. The total
69
fair value of RSUs vested for the years ended
December 31, 2017
,
2016
, and
2015
was
$3.0 million
,
$1.3 million
, and
$1.8 million
, respectively. The tax benefit realized from vested RSUs for the years ended
December 31, 2017
,
2016
, and
2015
was
$1.1 million
,
$0.7 million
, and
$0.7 million
, respectively.
Performance Stock Units
We granted performance stock awards (“PSUs”) to certain key employees of
126,000
,
62,500
, and
64,000
PSUs during the years ended
December 31, 2017
,
2016
, and
2015
, respectively, with weighted-average grant date fair values of
$26.31
,
$15.92
, and
$25.51
per share, respectively. PSU awards are subject to the attainment of performance goals established by the Committee, the periods during which performance is to be measured, and all other limitations and conditions applicable to the awarded shares. Performance goals are based on a pre-established objective formula that specifies the manner of determining the number of performance stock awards that will be granted if performance goals are attained. If an employee terminates employment, their non-vested portion of the PSUs will not vest and all rights to the non-vested portion will terminate.
Performance stock activity for the year ended
December 31, 2017
was as follows:
|
Number of Performance Stock Units
|
Weighted-
Average
Grant
Date Fair Value
|
||||||
|
Outstanding at January 1, 2017
|
121,637
|
|
$
|
20.39
|
|
||
|
Granted
|
126,000
|
|
$
|
26.31
|
|
||
|
Adjustment for target performance
|
37,350
|
|
$
|
25.48
|
|
||
|
Vested
|
(43,487
|
)
|
$
|
24.98
|
|
||
|
Forfeited
|
(20,000
|
)
|
$
|
22.63
|
|
||
|
Outstanding at December 31, 2017
|
221,500
|
|
$
|
23.52
|
|
||
The share-based compensation cost expensed for PSUs for the years ended
December 31, 2017
,
2016
, and
2015
(before tax benefits) was
$2.0 million
,
$0.4 million
and
$0.5 million
, respectively, and is included in selling, general and administrative expenses on the consolidated income statements. At
December 31, 2017
, total unrecognized compensation cost (before tax benefits) related to PSUs of
$2.4 million
is expected to be recognized over a weighted-average period of
1.7
years. The total fair value of PSUs vested during the years ended
December 31, 2017
,
2016
, and
2015
, was
$1.2 million
,
$1.1 million
, and
$0.9 million
, respectively. The tax benefit realized from PSUs for the years ended
December 31, 2017
,
2016
, and
2015
were
$0.5 million
,
$0.2 million
, and
$0.3 million
, respectively.
Supplemental Retirement Plans
We have
three
unfunded supplemental retirement plans. The first plan was
suspended in 1986
, but continues to cover certain former executives. The second plan was
suspended in 1997
, but continues to cover certain current and retired directors. The third plan covers certain current and retired employees and further employee contributions to this plan were
suspended on August 5, 2011
. The liability for the third plan and interest thereon is included in accrued employee compensation and long-term liabilities and was
$0.1 million
and
$0.7 million
, respectively, at
December 31, 2017
and
$0.6 million
and
$0.8 million
, respectively, at
December 31, 2016
. The accumulated benefit obligations of the first
two
plans at
December 31, 2017
and
December 31, 2016
were
$0.6 million
and
$0.7 million
, respectively, and are included in accrued liabilities.
Defined Contribution 401(K) Plans
We sponsor
a
401(k) defined contribution plan for all our employees. The plan allows the employees to make annual voluntary contributions not to exceed the lesser of an amount equal to
25%
of their compensation or limits established by the Internal Revenue Code. Under this plan, we generally provide a match equal to
50%
of the employee’s contributions up to the first
6%
of compensation, except for union employees who are not eligible to receive the match. Our provision for matching and profit sharing contributions for the three years ended
December 31, 2017
,
2016
, and
2015
was
$2.7 million
,
$2.7 million
, and
$3.2 million
, respectively.
Other Plans
We have a defined benefit pension plan covering certain hourly employees of a subsidiary (the “Pension Plan”). Pension Plan benefits are generally determined on the basis of the retiree’s age and length of service. Assets of the Pension Plan are
70
composed primarily of fixed income and equity securities. We also have a retirement plan covering certain current and retired employees (the “LaBarge Retirement Plan”).
The components of net periodic pension cost for both plans are as follows:
|
(In thousands)
Years Ended December 31,
|
||||||||||||
|
2017
|
2016
|
2015
|
||||||||||
|
Service cost
|
$
|
531
|
|
$
|
531
|
|
$
|
785
|
|
|||
|
Interest cost
|
1,329
|
|
1,367
|
|
1,350
|
|
||||||
|
Expected return on plan assets
|
(1,530
|
)
|
(1,482
|
)
|
(1,495
|
)
|
||||||
|
Amortization of actuarial losses
|
810
|
|
762
|
|
887
|
|
||||||
|
Net periodic pension cost
|
$
|
1,140
|
|
$
|
1,178
|
|
$
|
1,527
|
|
|||
The components of the reclassifications of net actuarial losses from accumulated other comprehensive loss to net income for 2017 were as follows:
|
(In thousands)
Year Ended December 31,
|
||||
|
2017
|
||||
|
Amortization of actuarial loss - total before tax
(1)
|
$
|
810
|
|
|
|
Tax benefit
|
(302
|
)
|
||
|
Net of tax
|
$
|
508
|
|
|
|
(1)
|
The amortization expense is included in the computation of periodic pension cost and is a decrease to net income upon reclassification from accumulated other comprehensive loss.
|
The estimated net actuarial loss for both plans that will be amortized from accumulated other comprehensive loss into net periodic cost during
2018
is
$0.7 million
.
71
The obligations, fair value of plan assets, and funded status of both plans are as follows:
|
(In thousands)
December 31,
|
||||||||
|
2017
|
2016
|
|||||||
|
Change in benefit obligation
(1)
|
||||||||
|
Beginning benefit obligation (January 1)
|
$
|
33,154
|
|
$
|
31,510
|
|
||
|
Service cost
|
531
|
|
531
|
|
||||
|
Interest cost
|
1,329
|
|
1,367
|
|
||||
|
Actuarial loss
|
2,449
|
|
1,132
|
|
||||
|
Benefits paid
|
(1,461
|
)
|
(1,386
|
)
|
||||
|
Ending benefit obligation (December 31)
|
$
|
36,002
|
|
$
|
33,154
|
|
||
|
Change in plan assets
|
||||||||
|
Beginning fair value of plan assets (January 1)
|
$
|
22,015
|
|
$
|
19,933
|
|
||
|
Return on assets
|
3,481
|
|
1,551
|
|
||||
|
Employer contribution
|
1,611
|
|
1,917
|
|
||||
|
Benefits paid
|
(1,461
|
)
|
(1,386
|
)
|
||||
|
Ending fair value of plan assets (December 31)
|
$
|
25,646
|
|
$
|
22,015
|
|
||
|
Funded status (underfunded)
|
$
|
(10,356
|
)
|
$
|
(11,139
|
)
|
||
|
Amounts recognized in the consolidated balance sheet
|
||||||||
|
Current liabilities
|
$
|
560
|
|
$
|
544
|
|
||
|
Non-current liabilities
|
$
|
9,796
|
|
$
|
10,595
|
|
||
|
Unrecognized loss included in accumulated other comprehensive loss
|
||||||||
|
Beginning unrecognized loss, before tax (January 1)
|
$
|
9,220
|
|
$
|
8,919
|
|
||
|
Amortization
|
(810
|
)
|
(762
|
)
|
||||
|
Liability loss
|
2,449
|
|
1,132
|
|
||||
|
Asset gain
|
(1,951
|
)
|
(69
|
)
|
||||
|
Ending unrecognized loss, before tax (December 31)
|
8,908
|
|
9,220
|
|
||||
|
Tax impact
|
(3,309
|
)
|
(3,425
|
)
|
||||
|
Unrecognized loss included in accumulated other comprehensive loss, net of tax
|
$
|
5,599
|
|
$
|
5,795
|
|
||
|
(1)
|
Projected benefit obligation equals the accumulated benefit obligation for the plans.
|
On
December 31, 2017
, our annual measurement date, the accumulated benefit obligation exceeded the fair value of the plans assets by
$10.4 million
. Such excess is referred to as an unfunded accumulated benefit obligation. We recorded unrecognized loss included in accumulated other comprehensive loss, net of tax at
December 31, 2017
and
2016
of
$5.6 million
and
$5.8 million
, respectively, which decreased shareholders’ equity. This charge to shareholders’ equity represents a net loss not yet recognized as pension expense. This charge did not affect reported earnings, and would be decreased or be eliminated if either interest rates increase or market performance and plan returns improve which will cause the Pension Plan to return to fully funded status.
Our Pension Plan asset allocations at
December 31, 2017
and
2016
, by asset category, were as follows:
|
December 31,
|
||||||
|
2017
|
2016
|
|||||
|
Equity securities
|
70
|
%
|
65
|
%
|
||
|
Cash and equivalents
|
1
|
%
|
2
|
%
|
||
|
Debt securities
|
29
|
%
|
33
|
%
|
||
|
Total
(1)
|
100
|
%
|
100
|
%
|
||
|
(1)
|
Our overall investment strategy is to achieve an asset allocation within the following ranges to achieve an appropriate rate of return relative to risk.
|
72
|
Cash
|
0-5%
|
|
Fixed income securities
|
15-75%
|
|
Equities
|
30-80%
|
Pension Plan assets consist primarily of listed stocks and bonds and do not include any of the Company’s securities. The return on assets assumption reflects the average rate of return expected on funds invested or to be invested to provide for the benefits included in the projected benefit obligation. We select the return on asset assumption by considering our current and target asset allocation. We consider information from various external investment managers, forward-looking information regarding expected returns by asset class and our own judgment when determining the expected returns.
|
(In thousands)
Year Ended December 31, 2017
|
||||||||||||||||
|
Level 1
|
Level 2
|
Level 3
|
Total
|
|||||||||||||
|
Cash and cash equivalents
|
$
|
135
|
|
$
|
—
|
|
$
|
—
|
|
$
|
135
|
|
||||
|
Fixed income securities
|
3,494
|
|
—
|
|
—
|
|
3,494
|
|
||||||||
|
Equities
(1)
|
1,625
|
|
—
|
|
—
|
|
1,625
|
|
||||||||
|
Other investments
|
910
|
|
—
|
|
—
|
|
910
|
|
||||||||
|
Total plan assets at fair value
|
$
|
6,164
|
|
$
|
—
|
|
$
|
—
|
|
6,164
|
|
|||||
|
Pooled funds
|
19,482
|
|
||||||||||||||
|
Total fair value of plan assets
|
|
|
|
|
|
|
$
|
25,646
|
|
|||||||
|
(In thousands)
Year Ended December 31, 2016
|
||||||||||||||||
|
Level 1
|
Level 2
|
Level 3
|
Total
|
|||||||||||||
|
Cash and cash equivalents
|
$
|
366
|
|
$
|
—
|
|
$
|
—
|
|
$
|
366
|
|
||||
|
Fixed income securities
|
3,468
|
|
—
|
|
—
|
|
3,468
|
|
||||||||
|
Equities
(1)
|
1,611
|
|
—
|
|
—
|
|
1,611
|
|
||||||||
|
Other investments
|
760
|
|
—
|
|
—
|
|
760
|
|
||||||||
|
Total plan assets at fair value
|
$
|
6,205
|
|
$
|
—
|
|
$
|
—
|
|
6,205
|
|
|||||
|
Pooled funds
|
15,810
|
|
||||||||||||||
|
Total fair value of plan assets
|
|
|
|
|
|
|
$
|
22,015
|
|
|||||||
|
(1)
|
Represents mutual funds and commingled accounts which invest primarily in equities, but may also hold fixed income securities, cash and other investments. Commingled funds with publicly quoted prices and actively traded are classified as Level 1 investments.
|
Pooled funds are measured using the net asset value (“NAV”) as a practical expedient for fair value as permissible under the accounting standard for fair value measurements and have not been categorized in the fair value hierarchy in accordance with ASU 2015-07, “Fair Value Measurement (Topic 820): Disclosures for Investments in Certain Entities That Calculate Net Asset Value per Share (or Its Equivalent).” Pooled fund NAVs are provided by the trustee and are determined by reference to the fair value of the underlying securities of the trust, less its liabilities, which are valued primarily through the use of directly or indirectly observable inputs. Depending on the pooled fund, underlying securities may include marketable equity securities or fixed income securities.
The assumptions used to determine the benefit obligations and expense for our two plans are presented in the tables below. The expected long-term return on assets, noted below, represents an estimate of long-term returns on investment portfolios consisting of a mixture of fixed income and equity securities. The estimated cash flows from the plans for all future years are determined based on the plans’ population at the measurement date. We used the expected benefit payouts from the plans for each year into the future and discounted them back to the present using the Wells Fargo yield curve rate for that duration.
73
The weighted-average assumptions used to determine the net periodic benefit costs under the two plans were as follows:
|
Years Ended December 31,
|
|||||||||
|
2017
|
2016
|
2015
|
|||||||
|
Discount rate used to determine pension expense
|
|||||||||
|
Pension Plan
|
4.18
|
%
|
4.55
|
%
|
4.25
|
%
|
|||
|
LaBarge Retirement Plan
|
3.75
|
%
|
4.00
|
%
|
3.70
|
%
|
|||
The weighted-average assumptions used to determine the benefit obligations under the two plans were as follows:
|
December 31,
|
|||||||||
|
2017
|
2016
|
2015
|
|||||||
|
Discount rate used to determine value of obligations
|
|||||||||
|
Pension Plan
|
3.64
|
%
|
4.18
|
%
|
4.55
|
%
|
|||
|
LaBarge Retirement Plan
|
3.40
|
%
|
3.75
|
%
|
4.00
|
%
|
|||
|
Long-term rate of return - Pension Plan only
|
7.00
|
%
|
7.50
|
%
|
7.50
|
%
|
|||
The following benefit payments under both plans, which reflect expected future service, as appropriate, are expected to be paid:
|
(In thousands)
|
||||||||
|
Pension Plan
|
LaBarge
Retirement
Plan
|
|||||||
|
2018
|
$
|
1,178
|
|
$
|
561
|
|
||
|
2019
|
1,212
|
|
546
|
|
||||
|
2020
|
1,288
|
|
528
|
|
||||
|
2021
|
1,365
|
|
506
|
|
||||
|
2022
|
1,453
|
|
482
|
|
||||
|
2023 - 2027
|
8,246
|
|
2,022
|
|
||||
Our funding policy is to contribute cash to our plans so that the minimum contribution requirements established by government funding and taxing authorities are met. We expect to make contributions of
$0.9 million
to the plans in
2018
.
We have made guarantees and indemnities under which we may be required to make payments to a guaranteed or indemnified party, in relation to certain transactions, including revenue transactions in the ordinary course of business. In connection with certain facility leases, we have indemnified our lessors for certain claims arising from the facility or the lease. We indemnify our directors and officers to the maximum extent permitted under the laws of the State of Delaware.
However, we have a directors and officers insurance policy that may reduce our exposure in certain circumstances and may enable us to recover a portion of future amounts that may be payable, if any. The duration of the guarantees and indemnities varies and, in many cases is indefinite but subject to statute of limitations. The majority of guarantees and indemnities do not provide any limitations of the maximum potential future payments we could be obligated to make. Historically, payments related to these guarantees and indemnities have been immaterial. We estimate the fair value of our indemnification obligations as insignificant based on this history and insurance coverage and have, therefore, not recorded any liability for these guarantees and indemnities in the accompanying consolidated balance sheets.
We lease certain facilities and equipment for periods ranging from
one
to
ten
years. The leases generally are renewable and provide for the payment of property taxes, insurance and other costs relative to the property. Rental expense in
2017
,
2016
, and
2015
was
$5.0 million
,
$4.9 million
, and
$8.5 million
, respectively. Future minimum rental payments under operating leases having initial or remaining non-cancelable terms in excess of one year at
December 31, 2017
were as follows:
74
|
(In thousands)
|
|||
|
2018
|
$
|
3,586
|
|
|
2019
|
2,793
|
|
|
|
2020
|
2,554
|
|
|
|
2021
|
1,927
|
|
|
|
2022
|
947
|
|
|
|
Thereafter
|
553
|
|
|
|
Total
|
$
|
12,360
|
|
Our pre-tax income attributable to foreign operations was not material. The provision for income tax (benefit) expense consisted of the following:
|
(In thousands)
Years Ended December 31,
|
||||||||||||
|
2017
|
2016
|
2015
|
||||||||||
|
Current tax expense (benefit)
|
||||||||||||
|
Federal
|
$
|
2,387
|
|
$
|
5,953
|
|
$
|
(1,511
|
)
|
|||
|
State
|
525
|
|
2,982
|
|
(418
|
)
|
||||||
|
2,912
|
|
8,935
|
|
(1,929
|
)
|
|||||||
|
Deferred tax (benefit) expense
|
||||||||||||
|
Federal
|
(15,515
|
)
|
3,876
|
|
(28,011
|
)
|
||||||
|
State
|
135
|
|
41
|
|
(1,771
|
)
|
||||||
|
(15,380
|
)
|
3,917
|
|
(29,782
|
)
|
|||||||
|
Income tax (benefit) expense
|
$
|
(12,468
|
)
|
$
|
12,852
|
|
$
|
(31,711
|
)
|
|||
On December 22, 2017, the President of the United States signed into law the Tax Cuts and Jobs Act (the “2017 Tax Act”) which, among a broad range of tax reform measures, reduced the U.S. corporate tax rate from 35.0% to 21.0% effective January 1, 2018. The reduction in the corporate tax rate required the federal portion of our deferred tax assets and liabilities at December 31, 2017 to be re-measured at the enacted tax rate expected to apply when the temporary differences are to be realized or settled using 21.0%. As a result, we recorded a provisional deferred income tax benefit of
$13.0 million
related to the re-measurement for the year ended December 31, 2017. SEC Staff Accounting Bulletin No. 118, “Income Tax Accounting Implications of the Tax Cuts and Jobs Act” (“SAB 118”), allows us to record provisional amounts during a measurement period not to extend beyond one year of the enactment date. Since the 2017 Tax Act was passed late in the fourth quarter of 2017, and ongoing guidance and accounting interpretation are expected over the next 12 months, we consider the accounting of the deferred tax re-measurement and other items to be incomplete due to the forthcoming guidance and our ongoing analysis of final year-end data and tax positions. We expect to complete our analysis within the measurement period in accordance with SAB 118.
ASU 2016-09, “Compensation - Stock Compensation (Topic 718): Improvements to Employee Share-Based Payment Accounting” (“ASU 2016-09”), became effective beginning January 1, 2017 and required all the tax effects related to share-based payments be recorded through the income statement. We recognized net income tax benefits from deductions of share-based payments in excess of compensation cost recognized for financial reporting purposes of
$0.6 million
for the year ended December 31, 2017. Prior to January 1, 2017, the current income tax expense (benefit) excluded net (tax shortfalls) excess tax benefits which were previously recorded directly to additional paid-in-capital in the amounts of
$(0.1) million
, and
$0.6 million
for the years ended December 31, 2016 and 2015, respectively.
75
Deferred tax (liabilities) assets were comprised of the following:
|
(In thousands)
December 31,
|
||||||||
|
2017
|
2016
|
|||||||
|
Deferred tax assets:
|
||||||||
|
Accrued expenses
|
$
|
313
|
|
$
|
760
|
|
||
|
Allowance for doubtful accounts
|
208
|
|
184
|
|
||||
|
Contract overrun reserves
|
294
|
|
1,776
|
|
||||
|
Deferred compensation
|
177
|
|
507
|
|
||||
|
Employment-related accruals
|
2,091
|
|
2,888
|
|
||||
|
Environmental reserves
|
501
|
|
769
|
|
||||
|
Federal tax credit carryforwards
|
5,613
|
|
4,234
|
|
||||
|
Inventory reserves
|
1,315
|
|
2,313
|
|
||||
|
Pension obligation
|
2,398
|
|
4,002
|
|
||||
|
State net operating loss carryforwards
|
86
|
|
63
|
|
||||
|
State tax credit carryforwards
|
9,051
|
|
6,585
|
|
||||
|
Stock-based compensation
|
1,480
|
|
1,950
|
|
||||
|
Workers’ compensation
|
75
|
|
122
|
|
||||
|
Other
|
1,492
|
|
2,098
|
|
||||
|
Total gross deferred tax assets
|
25,094
|
|
28,251
|
|
||||
|
Valuation allowance
|
(9,013
|
)
|
(6,607
|
)
|
||||
|
Total gross deferred tax assets, net of valuation allowance
|
16,081
|
|
21,644
|
|
||||
|
Deferred tax liabilities:
|
||||||||
|
Depreciation
|
(7,976
|
)
|
(13,167
|
)
|
||||
|
Goodwill
|
(2,902
|
)
|
(3,909
|
)
|
||||
|
Intangibles
|
(20,611
|
)
|
(35,071
|
)
|
||||
|
Prepaid insurance
|
(312
|
)
|
(626
|
)
|
||||
|
Unbilled receivables
|
—
|
|
(2
|
)
|
||||
|
Total gross deferred tax liabilities
|
(31,801
|
)
|
(52,775
|
)
|
||||
|
Net deferred tax liabilities
|
$
|
(15,720
|
)
|
$
|
(31,131
|
)
|
||
We have net operating losses in various states of
$1.8 million
as of December 31, 2017. The state net operating loss carryforwards include
$1.3 million
that is not expected to be realized under ASC Subtopic 740-10 and has been reduced by a valuation allowance. If not realized, the state net operating loss carryforwards will begin to expire in
2030
.
We have federal and state tax credit carryforwards of
$6.6 million
and
$12.8 million
, respectively, as of December 31, 2017. A valuation allowance of
$11.3 million
has been provided on state tax credit carryforwards that are not expected to be realized under ASC Subtopic 740-10. If not realized, the federal and state tax credit carryforwards will expire between
2018
and
2037
.
We believe it is more likely than not that we will generate sufficient taxable income to realize the benefit of the remaining deferred tax assets.
76
The principal reasons for the variation between the statutory and effective tax rates were as follows:
|
|
Years Ended December 31,
|
|||||
|
|
2017
|
2016
|
2015
|
|||
|
Statutory federal income tax (benefit) rate
|
35.0%
|
35.0%
|
(35.0)%
|
|||
|
State income taxes (net of federal benefit)
|
2.5
|
5.7
|
(1.2)
|
|||
|
Qualified domestic production activities
|
(2.6)
|
(2.0)
|
0.5
|
|||
|
Stock-based compensation expense
|
(8.2)
|
—
|
—
|
|||
|
Research and development tax credits
|
(50.6)
|
(8.6)
|
(2.9)
|
|||
|
Other tax credits
|
(7.5)
|
—
|
—
|
|||
|
Goodwill impairment
|
—
|
—
|
8.1
|
|||
|
Changes in valuation allowance
|
10.6
|
0.9
|
0.6
|
|||
|
Non-deductible book expenses
|
1.1
|
0.2
|
0.2
|
|||
|
Changes in deferred tax assets
|
15.4
|
1.5
|
0.1
|
|||
|
Re-measurement of deferred taxes for 2017 Tax Act
|
(171.3)
|
—
|
—
|
|||
|
Changes in tax reserves
|
11.4
|
—
|
0.1
|
|||
|
Other
|
0.4
|
1.0
|
(0.2)
|
|||
|
Effective income tax (benefit) rate
|
(163.8)%
|
33.7%
|
(29.7)%
|
|||
The deduction for qualified domestic production activities is treated as a “special deduction” which has no effect on deferred tax assets and liabilities. Instead, the impact of this deduction is reported in our rate reconciliation. No deduction for qualified domestic production has been recognized in 2015 due to a taxable loss. As part of the 2017 Tax Act, the qualified domestic production deduction is repealed for tax years beginning after December 31, 2017.
We recorded a goodwill impairment charge related to the Structural Systems operating segment in 2015. A portion of this goodwill impairment charge was nondeductible for tax purposes and was a permanent impact to our income tax provision of
$8.7 million
.
Our total amount of unrecognized tax benefits was
$5.3 million
,
$3.0 million
, and
$3.0 million
at
December 31, 2017
,
2016
, and 2015, respectively. We record interest and penalty charge, if any, related to uncertain tax positions as a component of tax expense and unrecognized tax benefits. The amounts accrued for interest and penalty charges as of December 31, 2017, 2016, and 2015 were not significant. If recognized,
$3.4 million
would affect the effective income tax rate. We do not reasonably expect significant increases or decreases to our unrecognized tax benefits in the next twelve months.
A reconciliation of the beginning and ending amount of unrecognized tax benefits was as follows:
|
(In thousands)
Years Ended December 31,
|
||||||||||||
|
2017
|
2016
|
2015
|
||||||||||
|
Balance at January 1,
|
$
|
3,036
|
|
$
|
2,963
|
|
$
|
2,803
|
|
|||
|
Additions for tax positions related to the current year
|
422
|
|
476
|
|
702
|
|
||||||
|
Additions for tax positions related to prior years
|
1,953
|
|
385
|
|
—
|
|
||||||
|
Reductions for tax positions related to prior years
|
(99
|
)
|
(567
|
)
|
(48
|
)
|
||||||
|
Reductions for lapse of statute of limitations
|
(41
|
)
|
(221
|
)
|
(494
|
)
|
||||||
|
Balance at December 31,
|
$
|
5,271
|
|
$
|
3,036
|
|
$
|
2,963
|
|
|||
We file U.S. Federal and state income tax returns. During the fourth quarter of 2017, the Internal Revenue Service (“IRS”) completed the audit of tax years 2013, 2014, and 2015. Consequently, Federal income tax returns after 2015 are subject to examination. California franchise (income) tax returns after 2012 and other state income tax returns after 2012 are subject to examination. While we are no longer subject to examination prior to those periods, carryforwards generated prior to those periods may still be adjusted upon examination by the IRS or state taxing authority if they either have been or will be used in a subsequent period. We believe we have adequately accrued for tax deficiencies or reductions in tax benefits, if any, that could result from the examination and all open audit years.
77
Structural Systems has been directed by California environmental agencies to investigate and take corrective action for groundwater contamination at its facilities located in El Mirage and Monrovia, California. Based on currently available information, Ducommun has established an accrual for its estimated liability for such investigation and corrective action of
$1.5 million
at
December 31, 2017
, which is reflected in other long-term liabilities on its consolidated balance sheet.
Structural Systems also faces liability as a potentially responsible party for hazardous waste disposed at landfills located in Casmalia and West Covina, California. Structural Systems and other companies and government entities have entered into consent decrees with respect to these landfills with the United States Environmental Protection Agency and/or California environmental agencies under which certain investigation, remediation and maintenance activities are being performed. Based on currently available information, Ducommun preliminarily estimates that the range of its future liabilities in connection with the landfill located in West Covina, California is between
$0.4 million
and
$3.1 million
. Ducommun has established an accrual for its estimated liability in connection with the West Covina landfill of
$0.4 million
at
December 31, 2017
, which is reflected in other long-term liabilities on its consolidated balance sheet. Ducommun’s ultimate liability in connection with these matters will depend upon a number of factors, including changes in existing laws and regulations, the design and cost of construction, operation and maintenance activities, and the allocation of liability among potentially responsible parties.
In the normal course of business, Ducommun and its subsidiaries are defendants in certain other litigation, claims and inquiries, including matters relating to environmental laws. In addition, Ducommun makes various commitments and incurs contingent liabilities. While it is not feasible to predict the outcome of these matters, Ducommun does not presently expect that any sum it may be required to pay in connection with these matters would have a material adverse effect on its consolidated financial position, results of operations or cash flows.
We provide proprietary products and services to the Department of Defense and various United States Government agencies, and most of the aerospace and aircraft manufacturers who receive contracts directly from the U.S. Government as an original equipment manufacturer (“prime manufacturers”). In addition, we also service technology-driven markets in the industrial, medical and other end-use markets. As a result, we have significant net revenues from certain customers. Accounts receivable were diversified over a number of different commercial, military and space programs and were made by both operating segments. Net revenues from our top ten customers, including The Boeing Company (“Boeing”), Lockheed Martin Corporation (“Lockheed Martin”), Raytheon Company (“Raytheon”), Spirit AeroSystems Holdings, Inc. (“Spirit”), and United Technologies Corporation (“United Technologies”), represented the following percentages of total net sales:
|
Years Ended December 31,
|
|||||||||
|
2017
|
2016
|
2015
|
|||||||
|
Boeing
|
16.4
|
%
|
17.3
|
%
|
16.0
|
%
|
|||
|
Lockheed Martin
|
5.5
|
%
|
5.6
|
%
|
1.2
|
%
|
|||
|
Raytheon
|
13.5
|
%
|
8.4
|
%
|
8.7
|
%
|
|||
|
Spirit
|
8.2
|
%
|
8.2
|
%
|
7.4
|
%
|
|||
|
United Technologies
|
4.7
|
%
|
5.3
|
%
|
6.1
|
%
|
|||
|
Top ten customers
(1)
|
62.5
|
%
|
58.6
|
%
|
55.7
|
%
|
|||
(1) Includes Boeing, Raytheon, Spirit, and United Technologies for 2017, 2016, and 2015 and Lockheed Martin for 2017 and 2016.
Boeing, Lockheed Martin, Raytheon, Spirit, and United Technologies represented the following percentages of total accounts receivable:
|
December 31,
|
||||||
|
|
2017
|
2016
|
||||
|
Boeing
|
7.8
|
%
|
7.8
|
%
|
||
|
Lockheed Martin
|
5.9
|
%
|
2.9
|
%
|
||
|
Raytheon
|
1.4
|
%
|
10.9
|
%
|
||
|
Spirit
|
13.5
|
%
|
9.0
|
%
|
||
|
United Technologies
|
2.3
|
%
|
7.8
|
%
|
||
78
In
2017
,
2016
and
2015
, net revenues from foreign customers based on the location of the customer were
$57.2 million
,
$56.4 million
and
$60.2 million
, respectively. No net revenues from a foreign country were greater than
3.0%
of total net revenues in
2017
,
2016
, and
2015
. We have manufacturing facilities in Thailand and Mexico. Our net revenues, profitability and identifiable long-lived assets attributable to foreign revenues activity were not material compared to our net revenues, profitability and identifiable long-lived assets attributable to our domestic operations during
2017
,
2016
, and
2015
. We are not subject to any significant foreign currency risks as all our sales are made in United States dollars.
We supply products and services primarily to the aerospace and defense industries. Our subsidiaries are organized into
two
strategic businesses, Structural Systems and Electronic Systems, each of which is an operating segment as well as a reportable segment.
Financial information by reportable segment was as follows:
|
(In thousands)
Years Ended December 31,
|
||||||||||||
|
|
2017
|
2016
|
2015
|
|||||||||
|
Net Revenues
|
||||||||||||
|
Structural Systems
|
$
|
241,460
|
|
$
|
246,465
|
|
$
|
273,319
|
|
|||
|
Electronic Systems
|
316,723
|
|
304,177
|
|
392,692
|
|
||||||
|
Total Net Revenues
|
$
|
558,183
|
|
$
|
550,642
|
|
$
|
666,011
|
|
|||
|
Segment Operating Income (Loss)
(1)(2)
|
||||||||||||
|
Structural Systems
|
$
|
5,477
|
|
$
|
16,497
|
|
$
|
(53,010
|
)
|
|||
|
Electronic Systems
|
30,940
|
|
28,983
|
|
(4,472
|
)
|
||||||
|
36,417
|
|
45,480
|
|
(57,482
|
)
|
|||||||
|
Corporate General and Administrative Expenses
(1)(2)
|
(21,392
|
)
|
(16,912
|
)
|
(17,827
|
)
|
||||||
|
Operating Income (Loss)
|
$
|
15,025
|
|
$
|
28,568
|
|
$
|
(75,309
|
)
|
|||
|
Depreciation and Amortization Expenses
|
||||||||||||
|
Structural Systems
|
$
|
8,860
|
|
$
|
8,688
|
|
$
|
9,417
|
|
|||
|
Electronic Systems
|
13,888
|
|
14,087
|
|
17,267
|
|
||||||
|
Corporate Administration
|
97
|
|
85
|
|
162
|
|
||||||
|
Total Depreciation and Amortization Expenses
|
$
|
22,845
|
|
$
|
22,860
|
|
$
|
26,846
|
|
|||
|
Capital Expenditures
|
||||||||||||
|
Structural Systems
|
$
|
20,679
|
|
$
|
15,661
|
|
$
|
11,559
|
|
|||
|
Electronic Systems
|
5,019
|
|
3,032
|
|
4,419
|
|
||||||
|
Corporate Administration
|
775
|
|
—
|
|
10
|
|
||||||
|
Total Capital Expenditures
|
$
|
26,473
|
|
$
|
18,693
|
|
$
|
15,988
|
|
|||
|
(1)
|
Includes cost not allocated to either the Structural Systems or Electronic Systems operating segments.
|
|
(2)
|
The results for 2017 includes LDS’ results of operations which have been included in our consolidated statements of operations since the date of acquisition as part of the Electronic Systems segment. See Note 2.
|
Segment assets include assets directly identifiable with each segment. Corporate assets include assets not specifically identified with a business segment, including cash. The following table summarizes our segment assets for
2017
and
2016
:
79
|
(In thousands)
December 31,
|
||||||||
|
|
2017
|
2016
|
||||||
|
Total Assets
|
||||||||
|
Structural Systems
|
$
|
193,600
|
|
$
|
175,580
|
|
||
|
Electronic Systems
|
362,831
|
|
325,780
|
|
||||
|
Corporate Administration
|
10,322
|
|
14,069
|
|
||||
|
Total Assets
|
$
|
566,753
|
|
$
|
515,429
|
|
||
|
Goodwill and Intangibles
|
||||||||
|
Structural Systems
|
$
|
2,836
|
|
$
|
3,745
|
|
||
|
Electronic Systems
|
229,292
|
|
180,382
|
|
||||
|
Total Goodwill and Intangibles
|
$
|
232,128
|
|
$
|
184,127
|
|
||
In September 2017, we acquired
100.0%
of the outstanding equity interests of LDS for a purchase price of
$60.0 million
, net of cash acquired. We allocated the gross purchase price of
$62.0 million
to the assets acquired and liabilities assumed at estimated fair values. The excess of the purchase over the aggregate fair values was recorded as goodwill. See Note 2.
In the first quarter of 2016, we entered into and completed the sale of our Pittsburgh, Pennsylvania and Miltec operations, both of which were part of our Electronic Systems operating segment.
|
(In thousands, except per share amounts)
|
||||||||||||||||||||||||||||||||
|
Three Months Ended
2017
|
Three Months Ended
2016
|
|||||||||||||||||||||||||||||||
|
Dec 31
|
Sep 30
|
Jul 1
|
Apr 1
|
Dec 31
|
Oct 1
|
Jul 2
|
Apr 2
|
|||||||||||||||||||||||||
|
Net Revenues
|
$
|
142,258
|
|
$
|
138,690
|
|
$
|
140,938
|
|
$
|
136,297
|
|
$
|
142,486
|
|
$
|
132,571
|
|
$
|
133,437
|
|
$
|
142,148
|
|
||||||||
|
Gross Profit
|
25,693
|
|
26,009
|
|
26,191
|
|
24,927
|
|
27,786
|
|
25,223
|
|
26,215
|
|
26,969
|
|
||||||||||||||||
|
(Loss) Income Before Taxes
|
(5,057
|
)
|
5,595
|
|
4,564
|
|
2,507
|
|
5,825
|
|
6,248
|
|
5,331
|
|
20,709
|
|
||||||||||||||||
|
Income Tax (Benefit) Expense
|
(14,541
|
)
|
940
|
|
741
|
|
392
|
|
2,989
|
|
1,234
|
|
1,470
|
|
7,159
|
|
||||||||||||||||
|
Net Income
|
$
|
9,484
|
|
$
|
4,655
|
|
$
|
3,823
|
|
$
|
2,115
|
|
$
|
2,836
|
|
$
|
5,014
|
|
$
|
3,861
|
|
$
|
13,550
|
|
||||||||
|
Earnings Per Share
|
||||||||||||||||||||||||||||||||
|
Basic earnings per share
|
$
|
0.84
|
|
$
|
0.41
|
|
$
|
0.34
|
|
$
|
0.19
|
|
$
|
0.25
|
|
$
|
0.45
|
|
$
|
0.35
|
|
$
|
1.22
|
|
||||||||
|
Diluted earnings per share
|
$
|
0.82
|
|
$
|
0.41
|
|
$
|
0.33
|
|
$
|
0.18
|
|
$
|
0.25
|
|
$
|
0.44
|
|
$
|
0.34
|
|
$
|
1.21
|
|
||||||||
In the fourth quarter of 2017, we adopted the Tax Cuts and Jobs Act and as a result, recorded a provisional deferred income tax benefit of
$13.0 million
related to the re-measurement for the year ended December 31, 2017. See Note 16. In addition, we commenced a restructuring plan and recorded restructuring charges of
$8.8 million
(with
$0.5 million
recorded as costs of sales). See Note 3.
In the third quarter of 2017, we acquired
100.0%
of the outstanding equity interests of LDS and LDS’ results of operations have been included in our consolidated statements of operations since the date of acquisition as part of the Electronic Systems segment. See Note 2.
In the first quarter of 2016, we entered into and completed the sale of our Pittsburgh, Pennsylvania and Miltec operations, both of which were part of our Electronic Systems operating segment. We recorded a preliminary pre-tax gain of
$18.8 million
.
80
DUCOMMUN INCORPORATED AND SUBSIDIARIES
CONSOLIDATED VALUATION AND QUALIFYING ACCOUNTS
YEARS ENDED DECEMBER 31, 2017, 2016, AND 2015
(in thousands)
SCHEDULE II
|
Description
|
Balance at
Beginning
of Period
|
Charged to
Costs and
Expenses (1)
|
Deductions/(Recoveries)
|
Balance at End
of Period
|
||||||||||||
|
2017
|
||||||||||||||||
|
Allowance for Doubtful Accounts
|
$
|
495
|
|
$
|
334
|
|
$
|
(39
|
)
|
$
|
868
|
|
||||
|
Valuation Allowance on Deferred Tax Assets
|
6,607
|
|
2,406
|
|
—
|
|
9,013
|
|
||||||||
|
2016
|
||||||||||||||||
|
Allowance for Doubtful Accounts
|
$
|
359
|
|
$
|
233
|
|
$
|
97
|
|
$
|
495
|
|
||||
|
Valuation Allowance on Deferred Tax Assets
|
7,477
|
|
(870
|
)
|
—
|
|
6,607
|
|
||||||||
|
2015
|
||||||||||||||||
|
Allowance for Doubtful Accounts
(1)
|
$
|
252
|
|
$
|
235
|
|
$
|
128
|
|
$
|
359
|
|
||||
|
Valuation Allowance on Deferred Tax Assets
|
6,882
|
|
595
|
|
—
|
|
7,477
|
|
||||||||
|
(1)
|
Included amount that was part of assets held for sale.
|
81
EXHIBIT INDEX
Exhibit
No.
Description
3.1 Restated Certificate of Incorporation filed with the Delaware Secretary of State on May 29, 1990. Incorporated by reference to Exhibit 3.1 to Form 10-K for the year ended December 31, 1990.
82
Exhibit
No.
Description
|
*10.14
|
Form of Indemnity Agreement entered with all directors and officers of Ducommun. Incorporated by reference to Exhibit 10.8 to Form 10-K for the year ended December 31, 1990. All of the Indemnity Agreements are identical except for the name of the director or officer and the date of the Agreement:
|
|
Director/Officer
|
Date of Agreement
|
|||
|
Richard A. Baldridge
|
March 19, 2013
|
|||
|
Gregory S. Churchill
|
March 19, 2013
|
|||
|
Robert C. Ducommun
|
December 31, 1985
|
|||
|
Dean M. Flatt
|
November 5, 2009
|
|||
|
Douglas L. Groves
|
February 12, 2013
|
|||
|
Jay L. Haberland
|
February 2, 2009
|
|||
|
Stephen G. Oswald
|
January 23, 2017
|
|||
|
Amy M. Paul
|
January 23, 2017
|
|||
|
Robert D. Paulson
|
March 25, 2003
|
|||
|
Anthony J. Reardon
|
January 8, 2008
|
|||
|
Jerry L. Redondo
|
October 1, 2015
|
|||
|
Rosalie F. Rogers
|
July 24, 2008
|
|||
|
Christopher D. Wampler
|
January 1, 2016
|
|||
|
Person
|
Date of Agreement
|
|||
|
Douglas L. Groves
|
January 23, 2017
|
|||
|
Amy M. Paul
|
January 23, 2017
|
|||
|
Anthony J. Reardon
|
January 23, 2017
|
|||
|
Jerry L. Redondo
|
January 23, 2017
|
|||
|
Rosalie F. Rogers
|
January 23, 2017
|
|||
|
Christopher D. Wampler
|
January 23, 2017
|
|||
83
Exhibit
No.
Description
|
101.INS
|
XBRL Instance Document
|
101.SCH XBRL Taxonomy Extension Schema
101.CAL XBRL Taxonomy Extension Calculation Linkbase
101.DEF XBRL Taxonomy Extension Definition Linkbase
101.LAB XBRL Taxonomy Extension Label Linkbase
101.PRE XBRL Taxonomy Extension Presentation Linkbase
___________________
* Indicates an executive compensation plan or arrangement.
84
Not applicable.
SIGNATURES
Pursuant to the requirements of Section 13 or 15(d) of the Securities and Exchange Act of 1934, the registrant has duly caused this report to be signed on its behalf by the undersigned, thereunto duly authorized.
|
|
DUCOMMUN INCORPORATED
|
||
|
Date: February 28, 2018
|
By:
|
|
/s/ Stephen G. Oswald
|
|
|
Stephen G. Oswald
|
||
|
|
President and Chief Executive Officer
|
||
Pursuant to the requirements of the Securities and Exchange Act of 1934, this report has been duly signed below by the following persons on behalf of the registrant and in the capacities indicated on
February 28, 2018
.
|
Signature
|
Title
|
||
|
/s/ Stephen G. Oswald
|
President and Chief Executive Officer
|
||
|
Stephen G. Oswald
|
(Principal Executive Officer)
|
||
|
/s/ Douglas L. Groves
|
Vice President, Chief Financial Officer and Treasurer
|
||
|
Douglas L. Groves
|
(Principal Financial Officer)
|
||
|
/s/ Christopher D. Wampler
|
Vice President, Controller and Chief Accounting Officer
|
||
|
Christopher D. Wampler
|
(Principal Accounting Officer)
|
||
|
/s/ Anthony J. Reardon
|
Chairman of the Board
|
||
|
Anthony J. Reardon
|
|||
|
/s/ Richard A. Baldridge
|
Director
|
||
|
Richard A. Baldridge
|
|||
|
/s/ Gregory S. Churchill
|
Director
|
||
|
Gregory S. Churchill
|
|||
|
/s/ Robert C. Ducommun
|
Director
|
||
|
Robert C. Ducommun
|
|||
|
/s/ Dean M. Flatt
|
Director
|
||
|
Dean M. Flatt
|
|||
|
/s/ Jay L. Haberland
|
Director
|
||
|
Jay L. Haberland
|
|||
|
/s/ Robert D. Paulson
|
Director
|
||
|
Robert D. Paulson
|
|||
85
TABLE OF CONTENTS
Part IItem 1. BusinessItem 1A. Risk FactorsItem 1B. Unresolved Staff CommentsItem 2. PropertiesItem 3. Legal ProceedingsItem 4. Mine Safety DisclosuresPart IIItem 5. Market For The Registrant S Common Equity, Related Stockholder Matters and Issuer Purchases Of Equity SecuritiesItem 6. Selected Financial DataItem 7. Management S Discussion and Analysis Of Financial Condition and Results Of OperationsItem 7A. Quantitative and Qualitative Disclosures About Market RiskItem 8. Financial Statements and Supplementary DataItem 9. Changes in and Disagreements with Accountants on Accounting and Financial DisclosureItem 9A. Controls and ProceduresItem 9B. Other InformationPart IIIItem 10. Directors, Executive Officers and Corporate GovernanceItem 11. Executive CompensationItem 12. Security Ownership Of Certain Beneficial Owners and Management and Related Stockholder MattersItem 13. Certain Relationships and Related Transactions, and Director IndependenceItem 14. Principal Accountant Fees and ServicesPart IVItem 15. Exhibits and Financial Statement SchedulesItem 16. Form 10-k SummaryNote 1. Summary Of Significant Accounting PoliciesNote 2. Business CombinationNote 3. Restructuring ActivitiesNote 4. Fair Value MeasurementsNote 5. Financial InstrumentsNote 6. InventoriesNote 7. Property and Equipment, NetNote 8. Goodwill and Other Intangible AssetsNote 9. Accrued LiabilitiesNote 10. Long-term DebtNote 11. Shareholders EquityNote 12. Stock-based CompensationNote 13. Employee Benefit PlansNote 14. IndemnificationsNote 15. LeasesNote 16. Income TaxesNote 17. ContingenciesNote 18. Major Customers and Concentrations Of Credit RiskNote 19. Business Segment InformationNote 20. Supplemental Quarterly Financial Data (unaudited)