DUPONT DE NEMOURS, INC.
UNITED STATES
SECURITIES AND EXCHANGE COMMISSION
Washington, D.C. 20549
FORM 10-K
þ
ANNUAL REPORT PURSUANT TO SECTION 13 OR 15(d) OF THE SECU
RITIES EXHANGE ACT OF 1934
For the fiscal year ended
December 31, 2017
or
¨
TRANSITION REPORT PURSUANT TO SECTION 13 OR 15(d) OF THE SECURITIES EXCHANGE ACT OF 1934
For the transition period from _______ to ________
Commission file number
:
001-38196
DOWDUPONT INC.
(Exact name of registrant as specified in its charter)
|
Delaware
|
81-1224539
|
|
State or other jurisdiction of incorporation or organization
|
(I.R.S. Employer Identification No.)
|
|
c/o The Dow Chemical Company
|
c/o E. I. du Pont de Nemours and Company
|
|
|
2030 Dow Center, Midland, MI 48674
|
974 Centre Road, Wilmington, DE 19805
|
|
|
(989) 636-1000
|
(302) 774-1000
|
|
(Address of principal executive offices) (Zip Code)
Registrant's telephone number, including area code
Securities registered pursuant to Section 12(b) of the Act:
|
Title of each class
|
Name of each exchange on which registered
|
|
|
Common Stock, par value $0.01 per share
|
New York Stock Exchange
|
|
Indicate by check mark if the registrant is a well-known seasoned issuer, as defined in Rule 405 of the Securities Act.
¨
Yes
þ
No
Indicate by check mark if the registrant is not required to file reports pursuant to Section 13 or Section 15(d) of the Act.
¨
Yes
þ
No
Indicate by check mark whether the registrant (1) has filed all reports required to be filed by Section 13 or 15(d) of the Securities Exchange Act of 1934 during the preceding 12 months (or for such shorter period that the registrant was required to file such reports), and (2) has been subject to such filing requirements for the past 90 days.
þ
Yes
¨
No
Indicate by check mark whether the registrant has submitted electronically and posted on its corporate Web site, if any, every Interactive Data File required to be submitted and posted pursuant to Rule 405 of Regulation
S-T (§2
32.405 of this chapter) during the preceding 12 months (or for such shorter period that the registrant was required to submit and post such files).
þ
Yes
¨
No
Indicate by check mark if disclosure of delinquent filers pursuant to Item 405 of Regulation S
-K (§229
.405 of this chapter) is not contained herein, and will not be contained, to the best of the registrant's knowledge, in definitive proxy or information statements incorporated by reference in Part III of this Form 10-K or any amendment to this Form 10-K.
¨
Indicate by check mark whether the registrant is a large accelerated filer, an accelerated filer, a non-accelerated filer, smaller reporting company, or an emerging growth company. See the definitions of “large accelerated filer,” “accelerated filer,” “smaller reporting company,” and "emerging growth company" in Rule 12b-2 of the Exchange Act.
|
Large accelerated filer
|
þ
|
Accelerated filer
|
¨
|
||||
|
Non-accelerated filer
|
¨
|
(Do not check if a smaller reporting company)
|
Smaller reporting company
|
¨
|
|||
|
Emerging growth company
|
¨
|
||||||
If an emerging growth company, indicate by check mark if the registrant has elected not to use the extended transition period for complying with any new or revised financial accounting standards provided pursuant to Section 13(a) of the Exchange Act.
¨
Indicate by check mark whether the registrant is a shell company (as defined in Rule 12b-2 of the Act).
¨
Yes
þ
No
The aggregate market value of the common equity held by non-affiliates of the registrant as of June 30, 2017, (the last day of the registrant's most recently completed second fiscal quarter), was approximately $76.9 billion based on the last reported closing price of $63.07 per share of Dow common stock, as reported on the New York Stock Exchange on such date. For purposes of this computation, it is assumed that the shares of voting stock held by Directors and Officers would be deemed to be stock held by affiliates. Non-affiliated common stock outstanding at June 30, 2017, was 1,219,870,092 shares. As of September 1, 2017, Dow common stock was not publicly traded.
Total DowDuPont common stock outstanding at January 31, 2018 was 2,329,023,478 shares.
DOCUMENTS INCORPORATED BY REFERENCE
Part III: Proxy Statement for the Annual Meeting of Stockholders to be held on
April 25, 2018
.
DowDuPont Inc.
ANNUAL REPORT ON FORM 10-K
For the fiscal year ended
December 31, 2017
TABLE OF CONTENTS
|
PAGE
|
|||
2
|
DowDuPont Inc. and Subsidiaries
|
Throughout this Annual Report on Form 10-K, except as otherwise noted by the context, the terms "Company" or "DowDuPont" used herein mean DowDuPont Inc. and its consolidated subsidiaries.
FORWARD-LOOKING STATEMENTS
This communication contains “forward-looking statements” within the meaning of the federal securities laws, including Section 27A of the Securities Act of 1933, as amended, and Section 21E of the Securities Exchange Act of 1934, as amended. In this context, forward-looking statements often address expected future business and financial performance and financial condition, and often contain words such as “expect,” “anticipate,” “intend,” “plan,” “believe,” “seek,” “see,” “will,” “would,” “target,” and similar expressions and variations or negatives of these words.
On December 11, 2015, The Dow Chemical Company (“Dow”) and E. I. du Pont de Nemours and Company (“DuPont”) entered into an Agreement and Plan of Merger, as amended on March 31, 2017, (the “Merger Agreement”) under which the companies would combine in an all-stock merger of equals transaction (the “Merger”). Effective August 31, 2017, the Merger was completed and each of Dow and DuPont became subsidiaries of DowDuPont (Dow and DuPont, and their respective subsidiaries, collectively referred to as the "Subsidiaries").
Forward-looking statements by their nature address matters that are, to varying degrees, uncertain, including the intended separation, subject to approval of the Company’s Board of Directors, of DowDuPont’s agriculture, materials science and specialty products businesses in one or more tax efficient transactions on anticipated terms (the “Intended Business Separations”). Forward-looking statements are not guarantees of future performance and are based on certain assumptions and expectations of future events which may not be realized. Forward-looking statements also involve risks and uncertainties, many of which are beyond the Company’s control. Some of the important factors that could cause DowDuPont’s, Dow’s or DuPont’s actual results to differ materially from those projected in any such forward-looking statements include, but are not limited to: (i) costs to achieve and achieving the successful integration of the respective agriculture, materials science and specialty products businesses of Dow and DuPont, anticipated tax treatment, unforeseen liabilities, future capital expenditures, revenues, expenses, earnings, productivity actions, economic performance, indebtedness, financial condition, losses, future prospects, business and management strategies for the management, expansion and growth of the combined operations; (ii) costs to achieve and achievement of the anticipated synergies by the combined agriculture, materials science and specialty products businesses; (iii) risks associated with the Intended Business Separations, including conditions which could delay, prevent or otherwise adversely affect the proposed transactions, including possible issues or delays in obtaining required regulatory approvals or clearances related to the Intended Business Separations, associated costs, disruptions in the financial markets or other potential barriers; (iv) disruptions or business uncertainty, including from the Intended Business Separations, could adversely impact DowDuPont’s business (either directly or as conducted by and through Dow or DuPont), or financial performance and its ability to retain and hire key personnel; (v) uncertainty as to the long-term value of DowDuPont common stock; and (vi) risks to DowDuPont’s, Dow’s and DuPont’s business, operations and results of operations from: the availability of and fluctuations in the cost of energy and feedstocks; balance of supply and demand and the impact of balance on prices; failure to develop and market new products and optimally manage product life cycles; ability, cost and impact on business operations, including the supply chain, of responding to changes in market acceptance, rules, regulations and policies and failure to respond to such changes; outcome of significant litigation, environmental matters and other commitments and contingencies; failure to appropriately manage process safety and product stewardship issues; global economic and capital market conditions, including the continued availability of capital and financing, as well as inflation, interest and currency exchange rates; changes in political conditions, business or supply disruptions; security threats, such as acts of sabotage, terrorism or war, natural disasters and weather events and patterns which could result in a significant operational event for the Company, adversely impact demand or production; ability to discover, develop and protect new technologies and to protect and enforce the Company’s intellectual property rights; failure to effectively manage acquisitions, divestitures, alliances, joint ventures and other portfolio changes; unpredictability and severity of catastrophic events, including, but not limited to, acts of terrorism or outbreak of war or hostilities, as well as management’s response to any of the aforementioned factors. While the list of factors presented here is, considered representative, no such list should be considered to be a complete statement of all potential risks and uncertainties. Unlisted factors may present significant additional obstacles to the realization of forward-looking statements. Consequences of material differences in results as compared with those anticipated in the forward-looking statements could include, among other things, business disruption, operational problems, financial loss, legal liability to third parties and similar risks, any of which could have a material adverse effect on DowDuPont’s, Dow’s or DuPont’s consolidated financial condition, results of operations, credit rating or liquidity. None of DowDuPont, Dow or DuPont assumes any obligation to publicly provide revisions or updates to any forward-looking statements whether as a result of new information, future developments or otherwise, should circumstances change, except as otherwise required by securities and other applicable laws. A detailed discussion of some of the significant risks and uncertainties which may cause results and events to differ materially from such forward-looking statements is included in the section titled “Risk Factors” (Part I, Item 1A of this Form 10-K).
3
|
DowDuPont Inc.
|
||
|
|
||
THE COMPANY
DowDuPont is a holding company comprised of The Dow Chemical Company ("Dow") and E. I. du Pont de Nemours and Company ("DuPont") with the intent to form strong, independent, publicly traded companies in the agriculture, materials science and specialty products sectors that will lead their respective industries through productive, science-based innovation to meet the needs of customers and help solve global challenges. DowDuPont is a Delaware corporation formed on December 9, 2015, for the purpose of effecting an all-stock merger of equals transactions between Dow and DuPont. Pursuant to the Agreement and Plan of Merger, dated December 11, 2015, as amended on March 31, 2017, Dow and DuPont each merged with subsidiaries of DowDuPont and, as a result, became subsidiaries of DowDuPont.
The Company's principal executive offices are located at:
c/o The Dow Chemical Company
2030 Dow Center
Midland, Michigan 48674
c/o E. I. du Pont de Nemours and Company
974 Centre Road
Wilmington, Delaware 19805
Available Information
The Company's annual report on Form 10-K, quarterly reports on Form 10-Q and current reports on Form 8-K, and amendments to those reports filed or furnished pursuant to Section 13(a) or 15(d) of the Securities Exchange Act of 1934, are available free of charge through the Investor Relations section of the Company's website (www.dow-dupont.com/investors), as soon as reasonably practicable after the reports are electronically filed or furnished with the U.S. Securities and Exchange Commission (“SEC”). The SEC maintains a website that contains these reports as well as proxy statements and other information regarding issuers that file electronically. The SEC's website is at www.sec.gov. The Company's website and its content are not deemed incorporated by reference into this report.
BUSINESS SEGMENTS AND PRODUCTS
DowDuPont’s worldwide operations are managed through global businesses, which are reported in eight reportable segments: Agriculture; Performance Materials & Coatings; Industrial Intermediates & Infrastructure; Packaging & Specialty Plastics; Electronics & Imaging; Nutrition & Biosciences; Transportation & Advanced Polymers; and, Safety & Construction. Corporate contains the reconciliation between the totals for the reportable segments and the Company’s totals. See Part II, Item 7, Management’s Discussion and Analysis of Financial Condition and Results of Operations and Note
24
to the Consolidated Financial Statements for additional information concerning the Company’s operating segments.
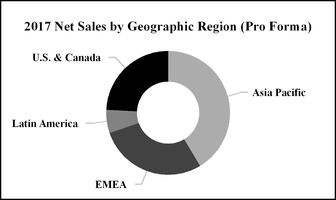
In the following business descriptions, unaudited pro forma net sales by segment has been included. Pro forma adjustments used in the calculation of pro forma net sales were determined in accordance with Article 11 of Regulation S-X and were based on the historical consolidated financial statements of Dow and DuPont, adjusted to give effect to the Merger as if it had been consummated on January 1, 2016. For additional information on the pro forma adjustments made, see Supplemental Unaudited Pro Forma Combined Financial Information in Part II, Item 7, Management’s Discussion and Analysis of Financial Condition and Results of Operations.
AGRICULTURE
The Agriculture segment leverages the Company’s technology, customer relationships and industry knowledge to improve the quantity, quality and safety of the global food supply and the global agriculture industry. Land available for worldwide agricultural production is increasingly limited so production growth will need to be achieved principally through improving crop yields and productivity. The segment’s two global businesses, Seed and Crop Protection, deliver a broad portfolio of products and services that are specifically targeted to achieve gains in crop yields and productivity, including well-established brands of seed products, crop chemicals, seed treatment, agronomy and digital services. Research and development ("R&D") focuses on leveraging germplasm and plant science technology to increase farmer productivity and to enhance the value of grains and oilseeds through improved seed traits, superior seed germplasm and effective use of crop protection solutions.
4
Seed
Seed is a global leader in developing and supplying advanced plant genetic products and technologies. The Seed business is a global leader in developing, producing and marketing hybrid corn seed and soybean seed varieties, primarily under the PIONEER
®
brand name, which improve the productivity and profitability of its customers. Additionally, the Seed business develops, produces and markets canola, cotton, sunflower, sorghum, wheat and rice seed, as well as silage inoculants.
Crop Protection
Crop Protection serves the global agriculture industry with crop protection products for field crops such as wheat, corn, soybean and rice, and specialty crops such as fruit, nut, vine and vegetables. Principle crop protection products are weed control, disease control and insect control offerings for foliar or soil application or as a seed treatment.
Merger Remedies - Dow and DuPont
As a condition of regulatory approval for the Merger, in addition to other requirements, Dow was required to divest a portion of Dow AgroSciences’ Brazil Corn Seed business and DuPont was required to divest certain assets related to its crop protection business and R&D organization, as discussed below.
Dow Merger Remedy - Divestiture of a Portion of Dow AgroSciences' Brazil Corn Seed Business
On July 11, 2017, Dow announced it had entered into a definitive agreement with CITIC Agri Fund to sell a select portion of Dow AgroSciences' corn seed business in Brazil, including
four
corn seed production sites and
four
research centers, a copy of Dow AgroSciences' Brazilian corn germplasm bank, certain commercial and pipeline hybrids, the MORGAN™ trademark and a license to the DOW SEMENTES™ trademark for
12
months (the "DAS Divested Ag Business"). On November 30, 2017, the sale was completed. See Note 4 to the Consolidated Financial Statements for further information regarding the divestiture.
DuPont Merger Remedy - Divested Agriculture Business
DuPont was required to divest certain assets related to its Crop Protection business and R&D organization. On March 31, 2017, DuPont entered into a definitive agreement (the "FMC Transaction Agreement") with FMC Corporation ("FMC"), under which and effective upon the closing of the transaction on November 1, 2017, FMC acquired DuPont’s Cereal Broadleaf Herbicides and Chewing Insecticides portfolios, including RYNAXYPYR®, CYAZYPYR®, and Indoxacarb as well as the Crop Protection R&D pipeline and organization, excluding seed treatment, nematicides, and late-stage R&D programs (the "Divested Ag Business"), and DuPont acquired certain assets relating to FMC’s Health and Nutrition segment, excluding its Omega-3 products (the "H&N Business") (collectively, the "FMC Transactions"). See Notes 3 and 4 to the Consolidated Financial Statements for further information regarding the acquisition and divestiture, respectively. The sale of the Divested Ag Business meets the criteria for discontinued operations and as such, earnings are included within income from discontinued operations after income taxes in the Consolidated Statements of Income for all periods subsequent to the Merger.
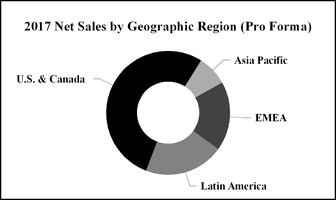
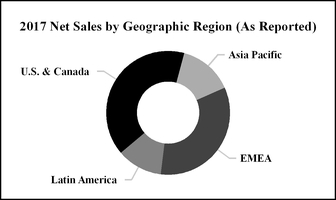
Details on Agriculture's 2017 net sales, by geographic region, are as follows:

|
*
|
Europe, Middle East and Africa.
|
5
Products
Key product lines, including crop application, are listed below:
|
Crop Application
|
||||||||||
|
Key Product Lines
|
Canola
|
Cereals
|
Corn
|
Cotton
|
Range and Pasture
|
Rice
|
Soybeans
|
Sunflower
|
Trees, Fruits and Vegetables
|
Others
|
|
Seeds
|
x
|
x
|
x
|
x
|
x
|
x
|
x
|
x
|
||
|
Insecticides
|
x
|
x
|
x
|
x
|
x
|
x
|
x
|
x
|
x
|
|
|
Fungicides
|
x
|
x
|
x
|
x
|
x
|
x
|
||||
|
Herbicides
|
x
|
x
|
x
|
x
|
x
|
x
|
x
|
x
|
x
|
x
|
|
Other
|
x
|
x
|
x
|
|||||||
Major brands and technologies, by key product line, are listed below:
|
Key Product Lines
|
Brands and Technologies
|
|
Seed Brands
|
AGROMEN™
1
; DOW™ Seeds; MYCOGEN™ Seeds; NEXERA™; Omega-9 Healthier Oils; OPTIMUM®AQUAMAX® hybrids; PHYTOGEN™; PIONEER® brand corn hybrids; Pioneer Premium Seed Treatment; PIONEER® brand T Series soybeans; PIONEER® brand soybeans with the PLENISH® high oleic trait; PIONEER® brand sunflowers with DUPONT™ EXPRESSSUN® trait; Pioneer PROTECTOR® resistance trait for canola and sunflower; Pioneer MAXIMUS® rapeseed hybrids; and PROPOUND™
|
|
Seed Traits and Technologies
|
ENCIRCA™ Services; ENLIST™; ENLIST DUO™; EXZACT™ Precision Technology; HERCULEX® Insect Protection; GRANULAR®; ACREVALUE™; LEPTRA® hybrids; POWERCORE™ Insect Trait Technology 2; OPTIMUM® ACREMAX™ Family of products; REFUGE ADVANCED™ powered by SMARTSTAX® 2; and SMARTSTAX® Insect Trait Technology
2
|
|
Insecticides
|
ISOCLAST™; LORSBAN™; OPTIMUM® INTRASECT® insect protection products RADIANT™; SENTRICON™; and TRACER™
|
|
Fungicides
|
DITHANE™; INATREQ™; Penthiopyrad family of disease control products - FONTELIS®, VERTISAN®, TREORIS®, FRELIZON®, AYLORA®, INTELLIS®, ORLIAN™, REFINZAR™; and ZORVEC®
|
|
Herbicides
|
ARIGO®; ARYLEX™; BROADWAY™; CLINCHER™; DURANGO™; FENCER™; GARLON™; INSTIGATE®; LONTREL™; MILESTONE™; PANZER™; PRIMUS™; RESICORE™; RINSKOR™; SPIDER™; STARANE™; SURESTART™; and TORDON™
|
|
Other
|
INSTINCT®; LUMIGEN™ Seed Sense family of seed treatment products - LUMIDERM™ and LUMIVIA™; N-SERVE™ Nitrogen Stabilizer; and TELONE™
|
|
1.
|
AGROMEN™ trademark used under license from Agromen Sementes Agricolas Ltda.
|
|
2.
|
SMARTSTAX® and POWERCORE
™
multi-event technology developed by Dow AgroSciences LLC and Monsanto Technology LLC. SMARTSTAX®
,
the SMARTSTAX® logo, POWERCORE
™
and the POWERCORE
™
logo are trademarks of Monsanto Technology LLC.
|
U.S. federal regulatory approvals have been obtained for the commercialization of ENLIST™ Corn, Soybeans and Cotton, including the U.S. Environmental Protection Agency's registration of ENLIST DUO™ and ENLIST ONE™ for use with ENLIST™ Corn, Soybeans and Cotton in 34 states. The Company has also secured approvals of ENLIST E3™ Soybeans, ENLIST™ Soybean Seeds and ENLIST™ Corn Seeds in Brazil and Canada and registration of ENLIST E3™ Soybeans in Argentina and Uruguay. The Company received import approval for ENLIST™ Corn from China, and is proceeding with the full launch of ENLIST™ Corn in the U.S. and Canada in 2018. A successful full system launch of ENLIST™ Cotton occurred in the U.S. in 2017 with an increase in adoption taking place in 2018. ENLIST™ Corn, ENLIST™ Soybeans and ENLIST E3™ Soybeans are all approved for import into the European Union. Regulatory approvals for ENLIST™ products in certain other countries are still pending.
Distribution
The Agriculture segment has a diverse worldwide network which markets and distributes the Company's brands to customers globally. This network consists of the Company's sales and marketing organization partnering with distributors, independent retailers and farmers, cooperatives and agents throughout the world.
Key Raw Materials
The major commodities, raw materials and supplies for the Agriculture segment include: benzene derivatives, other aromatics and carbamic acid related intermediates, corn and soybean seeds, insect control products, natural gas and seed treatments.
6
Patents, Trademarks and Licenses
The Agriculture segment has significant technology driven growth, propelled by seed/plant biotechnology and crop protection products and technologies, urban pest management solutions and healthy oils. As a result, the Company uses patents, trademarks, licenses and registrations to protect its investment in germplasm, traits and proprietary chemistries and formulations. The Company also licenses plant biotechnology traits from third parties and engages in research collaborations.
Seasonality
The Company's ability to produce seeds can be materially impacted by weather conditions, local political conditions and the availability of reliable contract farmers. Sales and Operating EBITDA are strongest in the first half of the year, aligning with the planting and growing season in the northern hemisphere. Accounts receivable tends to be higher during the first half of the year, consistent with the peak sales period in the northern hemisphere.
Competition
The Agriculture segment competes with producers of seed/plant biotechnology and crop protection products on a global basis. The Company competes on the basis of technology and trait leadership, price, quality and cost competitiveness. Key competitors include BASF, Bayer, FMC, Monsanto and Syngenta, as well as companies trading in generic crop protection chemicals and regional seed companies.
PERFORMANCE MATERIALS & COATINGS
The Performance Materials & Coatings segment consists of two global businesses - Coatings & Performance Monomers and Consumer Solutions. Using silicones, acrylics and cellulosics-based technology platforms, these businesses serve the needs of the coatings, home care, personal care, appliance and industrial end-markets. The segment has broad geographic reach with R&D and manufacturing facilities located in key geographic regions.
Coatings & Performance Monomers
Coatings & Performance Monomers consists of two businesses: Coating Materials and Performance Monomers. The Coating Materials business leads innovation in technologies that help advance the performance of paints and coatings. Its water-based acrylic emulsion technology revolutionized the global paint industry. The business offers innovative and sustainable product solutions to accelerate paint and coatings performance across diverse market segments, including architectural paints and coatings, as well as industrial coatings applications used in paper, leather, wood, metal packaging, traffic markings, maintenance and protective industries. The Performance Monomers business manufactures critical building blocks needed for the production of coatings, textiles, and home and personal care products. Included in this portfolio is the Plastics Additives business, a worldwide supplier of additives used in a large variety of applications ranging from packaging to consumer appliances and office equipment.
Consumer Solutions
Consumer Solutions consists of three businesses: Home & Personal Care; Silicone Feedstocks & Intermediates; and Performance Silicones. The Home & Personal Care business collaborates closely with global and regional brand owners to deliver innovative solutions for creating new and unrivaled consumer benefits and experiences. Silicone Feedstocks & Intermediates provides standalone silicone and acrylic-based materials that are used in a wide range of applications including adhesion promoters, coupling agents, crosslinking agents, dispersing agents and surface modifiers. Performance Silicones uses innovative, versatile silicone-based technology to provide solutions and ingredients to customers in personal care, consumer goods, silicone elastomers and the pressure sensitive industry.
Ownership Restructure of Dow Corning Corporation
On June 1, 2016, Dow Corning Corporation ("Dow Corning"), previously a 50:50 joint venture with Corning Incorporated ("Corning"), became a wholly owned subsidiary of Dow as a result of an ownership restructure. Dow and Corning continue to maintain their historical proportional equity interest in the HSC Group. See Note
3
to the Consolidated Financial Statements for additional information.
7
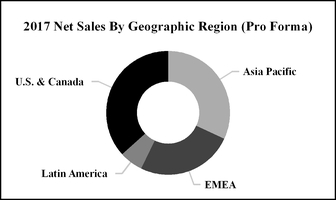
Details on Performance Materials & Coatings' 2017 net sales, by geographic region, are as follows:

Products
Major applications/market segments and products are listed below by business:
|
Business
|
Applications/Market Segments
|
Major Products/Technologies
|
|
Coatings & Performance Monomers
|
Acrylic binders for architectural paints and coatings, industrial coatings and paper; acrylic sheets; adhesives; coatings; dispersants; flocculants and detergents; impact modifiers; inks and paints; molding compounds; opacifiers and surfactants for both architectural and industrial applications; plastics additives; processing aids; protective and functional coatings; rheology modifiers; super absorbents; and textiles
|
ACOUSTICRYL™ liquid-applied sound damping technology; acrylates; ACRYSOL™ Rheology Modifiers; AVANSE™ acrylic binders; EVOQUE™ Pre-Composite Polymer; foam cell promoters; FORMASHIELD™ acrylic binder; high-quality impact modifiers; MAINCOTE™ acrylic epoxy hybrid; methacrylates; PARALOID™ Edge ISO-free technology; processing aids; RHOPLEX™ acrylic resin; TAMOL™ Dispersants; vinyl acetate monomers; and weatherable acrylic capstock compounds for
thermoplastic and thermosetting materials
|
|
Consumer Solutions
|
Personal care, color cosmetics, baby care, home care and specialty applications with a key focus on hair care, skin care, sun care, cleansing, as well as fabric, dish, floor, hard surface and air care applications; commercial glazing; electrical and high-voltage insulation; lamp and luminaire modules assembly; oil and gas; paints and inks; release liners, specialty films and tapes; sporting goods; and 3D printing
|
Adhesives and sealants; antifoams and surfactants; coatings and controlled release; coupling agents and crosslinkers; EVOLV3D™ printing technology; fluids, emulsions and dispersions; formulating and processing aids; granulation and binders; oils; polymers and emollients; opacifiers; reagents; resins, gels and powders; rheology modifiers; rubber; silicone elastomers; silicon-based materials; solubility enhancers; aerospace composites; surfactants and solvents; XIAMETER® silicones; and DOWSIL™ high-performance silicone-based building products
|
Key Raw Materials
The major commodities, raw materials and supplies for the Performance Materials & Coatings segment include: acetone, butyl acrylate, aqueous hydrochloric acid, chlorine, methanol, methyl methacrylate, propylene, silica, silicon metal and styrene.
Competition
Performance Materials & Coatings experiences competition in each business within the segment. Competitors include large multinational chemical firms as well as a number of regional and local competitors. Key competitors include Ashland, BASF, Bayer, Owens-Corning, Oxea, Shin-Etsu, Momentive and Wacker.
Joint Ventures
The Performance Materials & Coatings segment includes the Company's share of the results of the HSC Group, a U.S.-based group of companies that manufacture and sell polycrystalline silicon products.
8
INDUSTRIAL INTERMEDIATES & INFRASTRUCTURE
The Industrial Intermediates & Infrastructure segment consists of four global businesses: Construction Chemicals, Energy Solutions, Industrial Solutions, and Polyurethanes & CAV. These customer-centric global businesses develop and market customized materials using advanced technology and unique chemistries. These businesses serve the needs of market segments as diverse as appliance, infrastructure and oil and gas. The segment has broad geographic reach with R&D and manufacturing facilities located in key geographic regions.
Construction Chemicals
Construction Chemicals combines its deep application know-how, materials science and formulation competence to offer manufacturers key building blocks for formulating efficient and differentiated building and construction materials. With a broad range of technologies - including cellulose ethers, redispersible latex powders, silicones and acrylic emulsions - the business is a leading supplier to customers around the world and addresses the specific requirements of the industry across many market segments and applications, from roofing to flooring, and gypsum-, cement-, concrete- or dispersion-based building materials. Construction Chemicals' chemistries are designed to help advance the performance, durability and aesthetics of buildings and infrastructure.
Energy Solutions
Energy Solutions supplies smart, innovative and customized solutions to enhance productivity and efficiency in the oil, gas and mining markets. This business is aligned with all markets of the oil and gas industry - including exploration, production (including enhanced oil recovery), refining, gas processing and gas transmission.
Industrial Solutions
The Industrial Solutions business provides a broad portfolio of sustainable solutions that address world needs by enabling and improving the manufacture of consumer and industrial goods and services. Business solutions include products and innovations that minimize friction and heat in mechanical processes, manage the oil and water interface, deliver active ingredients for maximum effectiveness, facilitate dissolvability, enable product identification and provide the foundational building blocks for the development of chemical technologies. The business supports manufacturers associated with a large variety of end-markets, notably better crop protection offerings in agriculture, coatings, detergents and cleaners, solvents for electronics processing, inks and textiles. Industrial Solutions is also the world’s largest producer of purified ethylene oxide.
Polyurethanes & CAV
The Polyurethanes & CAV business group consists of two businesses: Polyurethanes and Chlor-Alkali & Vinyl ("CAV"). The Polyurethanes business is the world’s largest producer of propylene oxide and propylene glycol, a leading producer of polyether polyols and aromatic isocyanates that serve energy efficiency, consumer comfort and industrial market sectors, and an industry leader in the development of fully formulated polyurethane systems. Propylene oxide is produced using the chlorohydrin process as well as hydrogen peroxide to propylene oxide manufacturing technology
1
. The CAV business provides cost advantaged chlorine and caustic soda supply and markets caustic soda, a valuable co-product of the chlor-alkali manufacturing process, and ethylene dichloride and vinyl chloride monomer.
Divestitures
On January 30, 2015, Dow sold its global Sodium Borohydride business to Vertellus Performance Chemicals LLC; on February 2, 2015, Dow sold ANGUS Chemical Company to Golden Gate Capital; and, on October 5, 2015, Dow completed the split-off of its U.S. Gulf Coast Chlor-Alkali and Vinyl, Global Chlorinated Organics and Global Epoxy businesses to Olin Corporation in a tax-efficient Reverse Morris Trust transaction. See Notes
4
and
6
to the Consolidated Financial Statements for additional information.
|
1.
|
Hydrogen peroxide to propylene oxide manufacturing technology is utilized by MTP HPPO Manufacturing Company Limited, a Thailand-based consolidated variable interest entity ultimately owned 50 percent by the Company and 50 percent by SCG Chemicals Co. Ltd.; and BASF DOW HPPO Production B.V.B.A., a Belgium-based joint venture ultimately owned 100 percent by HPPO Holding & Finance C.V., which is owned 50 percent by the Company and 50 percent by BASF.
|
9
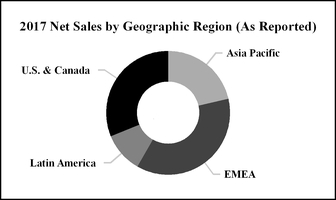
Details on Industrial Intermediates & Infrastructure's 2017 net sales, by geographic region, are as follows:
Products
Major applications/market segments and products are listed below by business:
|
Business
|
Applications/Market Segments
|
Major Products/Technologies
|
|
Construction Chemicals
|
Caulks and sealants, cement-based tile adhesives, concrete solutions, elastomeric roof coatings, exterior insulation and finish systems, industrial non-wovens, plasters and renders, roof tiles and siding, sport grounds and tape joint compounds
|
AQUASET™ acrylic thermosetting resins,
DOW™ latex powder, LIQUID ARMOR™ flashing and sealant, RHOPLEX™ and PRIMAL™ acrylic emulsion polymers, WALOCEL™ cellulose ethers, WEATHERMATE™ house wrap
|
|
Energy Solutions
|
Helping customers in exploration, production, transmission, refining, mining and gas processing to optimize supply, improve efficiencies and manage emissions
|
Demulsifiers, drilling and completion fluids, heat transfer fluids, rheology modifiers, scale inhibitors, shale inhibitors, specialty amine solvents, surfactants, water clarifiers, frothing separating agents
|
|
Industrial Solutions
|
Broad range of products for specialty applications, including agriculture crop protection offerings, aircraft deicing, coatings, heat transfer fluids for concentrated solar power, construction, solvents for electronics processing, food preservation, fuel markers, home and personal care, infrastructure, lubricant additives, paper, transportation and utilities
|
Acetone derivatives, butyl glycol ethers, VERSENE™ Chelants, UCAR™ Deicing Fluids, ethanolamines, ethylene oxide, ethyleneamines, UCON™ Fluids, glycol ethers, UCARTHERM™ Heat Transfer Fluids, higher glycols, isopropanolamines, low-VOC solvents, methoxypolyethylene glycol, methyl isobutyl, polyalkylene glycol, CARBOWAX™ SENTRY™ Polyethylene Glycol, TERGITOL™ and TRITON™ Surfactants
|
|
Polyurethanes & CAV
|
Aircraft deicing fluids, alumina, pulp and paper, appliances, automotive, bedding, building and construction, flooring, footwear, heat transfer fluids, hydraulic and brake fluids, infrastructure, packaging, textiles and transportation
|
Aniline, caustic soda, ethylene dichloride, methylene diphenyl diisocyanate (“MDI”), polyether polyols, propylene glycol, propylene oxide, polyurethane systems, toluene diisocyanate (“TDI”), vinyl chloride monomer
|
Key Raw Materials
The major commodities, raw materials and supplies for the Industrial Intermediates & Infrastructure segment include: acetone, aniline, aqueous hydrochloric acid, chlorine, electric power, ethylene, methanol, natural gas, propylene, styrene and hydrogen peroxide, which is produced internally and procured through a consolidated variable interest entity and a joint venture.
Competition
Competitors of the Industrial Intermediates & Infrastructure segment include many large multinational chemical firms, chemical divisions of major national and international oil companies, and regional and local competitors. The segment's products have unique performance characteristics that are required by customers who demand a high level of customer service and expertise from our sales force and scientists. Key competitors include Arkema, Ashland, BASF, Bayer, Eastman, Elementis, Huntsman, Hexion, INEOS, Olin, Owens-Corning and Oxea.
10
Joint Ventures
The Industrial Intermediates & Infrastructure segment includes a portion of the Company's share of the results of the following joint ventures:
|
•
|
EQUATE Petrochemical Company K.S.C. ("EQUATE") - a Kuwait-based company that manufactures ethylene, polyethylene and ethylene glycol, and manufactures and markets monoethylene glycol, diethylene glycol and polyethylene terephthalate resins; owned 42.5 percent by the Company.
|
|
•
|
The Kuwait Olefins Company K.S.C. ("TKOC") - a Kuwait-based company that manufactures ethylene and ethylene glycol; owned 42.5 percent by the Company.
|
|
•
|
Map Ta Phut Olefins Company Limited - effective ownership is 32.77 percent of which the Company directly owns 20.27 percent (aligned with Industrial Intermediates & Infrastructure) and indirectly owns 12.5 percent through its equity interest in Siam Polyethylene Company Limited and Siam Synthetic Latex Company Limited (both part of The SCG-Dow Group and aligned with Packaging & Specialty Plastics). This Thailand-based company manufactures propylene and ethylene.
|
|
•
|
Sadara Chemical Company ("Sadara") - a Saudi Arabian company that manufactures chlorine, ethylene, propylene and aromatics for internal consumption and manufactures and sells polyethylene, ethylene oxide and propylene oxide derivative products, and isocyanates; owned 35 percent by the Company.
|
Dow is responsible for marketing a majority of Sadara products outside of the Middle East zone through Dow’s established sales channels. As part of this arrangement, Dow purchases and sells Sadara products for a marketing fee.
PACKAGING & SPECIALTY PLASTICS
The Packaging & Specialty Plastics segment is a market-oriented portfolio composed of two global businesses: Hydrocarbons & Energy and Packaging and Specialty Plastics. The segment is advantaged through its low cost position into key feedstocks and broad geographic reach, with manufacturing facilities located in all geographic regions. It also benefits from R&D expertise to deliver leading-edge technology that provides a competitive benefit to customers in food packaging and other high-growth end-use markets like transportation and consumer durables. Taken together, the businesses in this segment represent the world's leading plastics franchise.
Hydrocarbons & Energy
The Hydrocarbons & Energy business is one of the largest global producers of ethylene, an internal feedstock that is consumed primarily within the Packaging & Specialty Plastics segment. In addition to ethylene, the business is a leading producer of propylene and aromatics products that are used to manufacture materials that consumers use every day. It also produces and procures the power used by the Company's manufacturing sites. The business leverages its global scale, operational discipline and feedstock flexibility to create a cost-advantaged foundation for the Company’s downstream, market-driven businesses. In the U.S. & Canada, the increased supplies of natural gas and natural gas liquids (“NGLs”) remain a key cost-competitive advantage for the Company's ethane- and propane-based production. The Company's U.S. and European ethylene production facilities have the flexibility to use different feedstocks in response to price conditions.
Packaging and Specialty Plastics
Packaging and Specialty Plastics serves high-growth, high-value sectors using world-class technology and a rich innovation pipeline that creates competitive advantages for customers and the entire value chain. The business is also a leader in polyolefin elastomers and ethylene propylene diene monomer elastomers. Market growth is expected to be driven by major shifts in population demographics; improving socioeconomic status in emerging geographies; consumer and brand owner demand for increased functionality; global efforts to reduce food waste; growth in telecommunications networks; global development of electrical transmission and distribution infrastructure; and renewable energy applications.
Acquisition and Divestiture
On September 1, 2017, Dow sold its global Ethylene Acrylic Acid copolymers and ionomers business to SK Global Chemical Co., Ltd. On May 5, 2015, Univation Technologies, LLC, previously a 50:50 joint venture between Dow and ExxonMobil Chemical Company, became a wholly owned subsidiary of Dow. See Notes 3 and 4 to the Consolidated Financial Statements for further information.
11
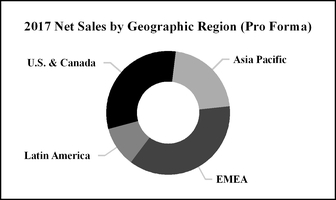
Details on Packaging & Specialty Plastics' 2017 net sales, by geographic region, are as follows:
Products
Major applications/market segments and products are listed below by business:
|
Business
|
Applications/Market Segments
|
Major Products
|
|
Hydrocarbons & Energy
|
Purchaser of feedstocks; production of cost competitive hydrocarbon monomers utilized by derivative businesses; and energy, principally for use in the Company's global operations
|
Ethylene, propylene, benzene, butadiene, octene, aromatics co-products, power, steam, other utilities
Advantaged feedstock positions in the United States, Canada, Argentina and the Middle East
|
|
Packaging and Specialty Plastics
|
Adhesives, construction, cosmetics, electrical transmission and distribution, food and supply chain packaging, footwear, housewares, health and hygiene, industrial specialties, irrigation pipe, photovoltaic, sporting goods, telecommunications infrastructure, and toys and infant products
|
Acrylics, bio-based plasticizers, elastomers, ethylene copolymer resins, ethylene propylene diene monomer elastomers ("EPDMs"), ethylene vinyl acetate copolymer, methacrylic acid copolymer resins, polyethylene, high-density polyethylene, low-density polyethylene, linear low-density polyethylene, polyolefin plastomers, resin additives and modifiers, semiconductive and jacketing compound solutions and wire and cable insulation
|
Key Raw Materials
The major commodities, raw materials and supplies for the Packaging & Specialty Plastics segment include: benzene, butane, condensate, electric power, ethane, ethylene, hexene, naphtha, octene, propane, propylene and pygas.
Competition
Competition for the Packaging & Specialty Plastics segment includes chemical divisions of major national and international oil companies, which compete in the United States and abroad. The Company competes worldwide on the basis of product quality, product supply, technology, price and customer service. Packaging & Specialty Plastics will continue to benefit from an advantaged feedstock position, including favorable shale gas dynamics in the United States, which will further strengthen the Company's low-cost position and enhance global cost competitiveness. Key competitors include BASF, Borealis, Braskem, CP Chem, ExxonMobil, INEOS, LyondellBasell, Mitsui, SABIC, Solvay and Westlake.
Joint Ventures
Joint ventures play an integral role within the Packaging & Specialty Plastics segment by dampening earnings cyclicality and improving earnings growth. Principal joint ventures impacting the Packaging & Specialty Plastics segment are noted in the following section:
Aligned 100 percent with Packaging & Specialty Plastics:
|
•
|
The Kuwait Styrene Company K.S.C. - a Kuwait-based company that manufactures styrene monomer; owned 42.5 percent by the Company.
|
|
•
|
The SCG-Dow Group consists of Siam Polyethylene Company Limited; Siam Polystyrene Company Limited; Siam Styrene Monomer Co., Ltd.; and Siam Synthetic Latex Company Limited. These Thailand-based companies manufacture polyethylene, polystyrene, styrene and latex; owned 50 percent by the Company.
|
12
Packaging & Specialty Plastics includes a portion of the results of:
|
•
|
EQUATE - a Kuwait-based company that manufactures ethylene, polyethylene and ethylene glycol; and manufactures and markets monoethylene glycol, diethylene glycol and polyethylene terephthalate resins; owned 42.5 percent by the Company.
|
|
•
|
TKOC - a Kuwait-based company that manufactures ethylene and ethylene glycol; owned 42.5 percent by the Company.
|
|
•
|
Map Ta Phut Olefins Company Limited - effective ownership is 32.77 percent of which the Company directly owns 20.27 percent (aligned with Industrial Intermediates & Infrastructure) and indirectly owns 12.5 percent through its equity interest in Siam Polyethylene Company Limited and Siam Synthetic Latex Company Limited (both part of The SCG-Dow Group and aligned with Packaging & Specialty Plastics). This Thailand-based company manufactures propylene and ethylene.
|
|
•
|
Sadara - a Saudi Arabian company that manufactures chlorine, ethylene, propylene and aromatics for internal consumption and manufactures and sells polyethylene, ethylene oxide and propylene oxide derivative products, and isocyanates; owned 35 percent by the Company.
|
Dow is responsible for marketing a majority of Sadara products outside of the Middle East zone through Dow’s established sales channels. As part of this arrangement, Dow purchases and sells Sadara products for a marketing fee.
Current and Future Investments
Dow announced a number of investments in the U.S. Gulf Coast to take advantage of increasing supplies of low-cost natural gas and NGLs derived from shale gas including: the restart of the St. Charles Operations ("SCO-2") ethylene production facility in December 2012; construction of a new on-purpose propylene production facility, which commenced operations in December 2015; an expansion in December 2016 of an ethylene production facility in Plaquemine, Louisiana, by up to 250 kilotonnes per annum ("KTA") and modifications to enable full ethane cracking flexibility; and, construction of a new world-scale ethylene production facility in Freeport, Texas, which commenced operations in the third quarter of 2017, and a capacity expansion project which will bring the facility's total ethylene capacity to 2,000 KTA. As a result of these investments, the Company’s exposure to purchased ethylene and propylene is expected to decline, offset by increased exposure to ethane- and propane-based feedstocks. The Company's global ethylene production capabilities are expected to increase by more than 25 percent relative to the 2012 baseline.
In 2016, Dow completed an expansion of a gas-phase polyethylene production facility in Seadrift, Texas. Expansion projects are currently underway at Dow’s gas-phase polyethylene units in St. Charles, Louisiana, with expected start-up in mid-2018. In May 2017, Dow announced the construction of a world-scale 600 KTA polyethylene production facility in the U.S. Gulf Coast and a series of incremental debottleneck projects which will result in 350 KTA of additional polyethylene, the majority of which will be in the U.S. & Canada; and construction of a new world-scale 450 KTA polyolefins production facility in Europe. Dow is also building four new production facilities on the U.S. Gulf Coast to leverage an advantaged feedstock position to support profitable growth of the Company’s high value performance plastics franchise, which include: an ELITE™ Polymer production facility, which commenced operations in 2017 in coordination with the new ethylene production facility; a Low Density Polyethylene ("LDPE") production facility and a NORDEL™ Metallocene EPDM production facility, which are expected to start-up in early 2018; and a High Melt Index ("HMI") specialty and conventional Polyolefin Elastomers production facility, which is expected to start-up in late 2018.
ELECTRONICS & IMAGING
Electronics & Imaging is a leading global supplier of differentiated materials and systems for a broad range of consumer electronics including mobile devices, television monitors, personal computers and electronics used in a variety of industries. The segment is a leading supplier of key materials for the manufacturing of photovoltaics ("PV"), solar cells and of materials and printing systems to the advanced printing industry and of materials and solutions for the fabrication of semiconductors and integrated circuits addressing both front-end and back-end of the manufacturing process. By providing chemical mechanical planarization ("CMP") pads and slurries, photoresists and advanced coatings for lithography, removers and cleaners, dielectric and metallization solutions for back-end-of-line advanced chip packaging, along with silicones for light emitting diode ("LED") packaging and semiconductor applications, the segment offers the broadest portfolio of semiconductor and advanced packaging materials in the market. Electronics & Imaging also provides permanent and process chemistries for the fabrication of printed circuit boards to include laminates and substrates, electroless and electrolytic metallization solutions, as well as patterning solutions and materials and innovative metallization processes for metal finishing, decorative, and industrial applications. Electronics & Imaging is a leading global supplier of innovative metallization pastes and back sheet materials for the production of solar cells and solar modules for the PV industry (solar modules, which are made up of solar cells and other materials, are installed to generate power) and in the packaging graphics industry providing flexographic printing inks, photopolymer plates, and platemaking systems used in digital printing applications for textile, commercial and home-office use. In addition, the segment provides cutting-edge materials for the manufacturing of rigid and flexible displays for liquid crystal displays ("LCD"), advanced-matrix organic light emitting diode ("AMOLED"), and quantum dot ("QD") applications. Electronics & Imaging addresses all of these markets by leveraging a strong science and technology base to provide the critical materials and solutions for creating a more connected and digital world.
13
Divestitures
On June 30, 2017, Dow sold its ownership interest in the SKC Haas Display Films group of companies ("SKC Haas Display Films") and in January 2017 DuPont divested its Authentications business.
Ownership Restructure of Dow Corning Corporation
On June 1, 2016, Dow Corning, previously a 50:50 joint venture with Corning, became a wholly owned subsidiary of Dow as a result of an ownership restructure. See Note
3
to the Consolidated Financial Statements for additional information.
Details on Electronics & Imaging's 2017 net sales, by geographic region, are as follows:

Products
Major applications/market segments and technologies are listed below by major product line:
|
Major Product Line
|
Applications/Market Segments
|
Technologies
|
|
Semiconductor Technologies
|
Integrated circuit fabrication for memory and logic and semiconductor fabrication
|
CMP consumables, photolithography materials, semiconductor fabrication materials, fabrication cleaners and removers, advanced chip packaging materials and thermal management materials
|
|
Circuit & Industrial Technologies
|
Printed circuit board, electronic and industrial finishing
|
Circuit packaging materials, Interconnect metallization and imaging process chemistries, dry film laminates, and flexible circuit materials
|
|
Photovoltaic and Advanced Materials
|
Photovoltaics, aerospace/aircraft, automotive, military and consumer electronics
|
Metallization pastes, thick film pastes, polyvinyl fluoromaterials, silicone encapsulants and silane precursors
|
|
Advanced Printing
|
Flexographic printing and inkjet printing
|
Flexographic printing plates and materials and digital inks
|
|
Display Technologies
|
Display materials
|
OLED materials, Cd-free quantum dots, diplay process chemistries, LED encapsulants and display enhancement solutions
|
Key Raw Materials
The major commodities, raw materials and supplies for the Electronics & Imaging segment include: acrylic monomers, acetoxystyrene monomer, black and color pigments, styrenic block copolymers, color dyes, copper, difluoroethane, diglycolamine, dimethylacetamide ("DMAC"), hydrogen chloride, hydroxylamine, nickel, oxydianiline, photoactive compounds, polyester and other polymer films, precious metals, polyurethane resins, pyromellitic dianhydride, silicon metal, solvents and tin.
14
Competition
Electronics & Imaging's competitors include many large multinational firms as well as a number of regional and local competitors. The segment's products have unique performance characteristics that are required by customers who demand a high-level of customer service and technical expertise from the Company's sales force and scientists; therefore, the Company is well positioned to withstand competitive threats. Key competitors include Cabot Microsystems, JSR Micro, Platform Specialty Products, EMerck, Huntsman, LONGi Green Energy, ShinEtsu and 3M.
NUTRITION & BIOSCIENCES
Nutrition & Biosciences is an innovation-driven and customer-focused segment that provides solutions for the global food and beverage, pharma, personal care, energy and animal nutrition markets. It consists of two operating segments: Nutrition & Health and Industrial Biosciences.
Industrial Biosciences
The Industrial Biosciences business is an industry pioneer and innovator that works with customers to improve the performance, productivity and sustainability of their products and processes through biotechnology and engineering solutions including enzymes, biomaterials, biocides and antimicrobial solutions and process technology. Industrial Biosciences offers better, cleaner and safer solutions to a wide range of industries including animal nutrition, biofuels, apparel and textiles, food and beverages, cleaning, personal care, fertilizers, and oil and gas.
Nutrition & Health
The Nutrition & Health business is one of the world’s largest producers of specialty food ingredients, developing and manufacturing solutions for the global food and beverage market. Its innovative and broad portfolio of natural-based ingredients marketed under the DuPont DANISCO® brand serves to improve health and nutrition as well as taste and texture in a wide range of dairy, beverage, bakery and dietary supplement applications. Its probiotics portfolio, including the HOWARU® brand, is world famous for its extensively documented strains that deliver consumers benefits in digestive and immune health. In addition to serving the global food and beverage market, the Nutrition & Health business is one of the world's largest producers of cellulosic- and alginates-based pharma excipients, used to improve the functionality and delivery of pharmaceuticals, and enabling the development of more effective pharma solutions.
Divestiture
In February 2017, DuPont completed the sale of its global food safety diagnostic business, a part of the Nutrition & Health business, to Hygiena LLC.
Acquisition of Health and Nutrition Business
On March 31, 2017, DuPont entered into the FMC Transaction Agreement with FMC, under which and effective upon the closing of the transaction on November 1, 2017, FMC acquired the Divested Ag Business as required in order to obtain European Commission ("EC") approval of the Merger and DuPont agreed to acquire certain assets relating to FMC’s Health and Nutrition segment, excluding its Omega-3 products (the "H&N Business") (collectively, the "FMC Transactions"). The H&N Business will be integrated into the Nutrition & Biosciences segment to enhance the Company’s position as a leading provider of sustainable, bio-based food ingredients and allow for expanded capabilities in the pharma excipients space. See further discussion of this acquisition in Note 3 to the Consolidated Financial Statements.
Details on Nutrition & Biosciences' 2017 net sales, by geographic region, are as follows:

15
Products
Major applications and products are listed below by business:
|
Business
|
Applications
|
Major Products
|
|
Industrial Biosciences
|
Animal nutrition, detergents, biofuels production, food and beverage, carpet and apparel fiber, sulfuric acid, oil refining, phosphate fertilizer and providing expertise and localized solutions for microbial control for well souring, industrial cooling water, fabric odor elimination and in-can preservation and dry film protection
|
Enzymes, BIO-PDO™ propanediol, SORONA® PTT polymer, yeast, betaine, direct-fed microbials, MECS® sulfuric acid technology, BELCO® clean air technologies, STRATCO® alkylation technology, ISOTHERMING® hydroprocessing, SILVADUR™ antimicrobial, glutaraldehyde
|
|
Nutrition & Health
|
Food and beverage, dietary supplements, child nutrition, sports nutrition and oral dosage pharmaceuticals excipients
|
Cellulosic and other technologies help bring new classes of medicines to market and enable foods that are healthier (gluten-free, reduced oil/fat content). Notable technologies include excipients and active pharmaceutical ingredients, solubility enhancers, reagents, granulation and binders, as well as coatings and controlled release.
Other major products include probiotics, soy protein, fibers, cultures, antioxidants, antimicrobials, emulsifiers, texturants, ingredient systems and sweeteners.
|
Key Raw Materials
The major commodities, raw materials and supplies for the Nutrition & Biosciences segment include: terephthalic acid, gelatin, glycols, cellulose processed grains (including dextrose and glucose), guar, organic oils, peels, saccharides, seaweed, soybeans, sugars and yeasts.
Competition
Nutrition & Biosciences' competitors include many large multinational nutrition and biosciences companies as well as a number of regional and local competitors. The segment's products have unique performance characteristics that are required by customers who demand a high-level of customer service and technical expertise from the Company's sales force and scientists; therefore, the Company is well positioned to withstand competitive threats. Key competitors include Novozymes A/S, Royal DSM, Chr. Hansen and BASF.
Current and Future Investments
In November 2016, DuPont announced an investment to expand probiotics production capacity in the United States. The investment is the second phase of a broader probiotics expansion project due to the rapidly growing global demand for probiotics. Phase one, supporting current growth, in Madison, Wisconsin, and Rochester, New York, is complete as of the end of 2017. The second phase, scheduled to span two-years, represents an investment of approximately $100 million, and increases DuPont's probiotics production capacity by an additional 70 percent. Construction is underway in 2017, and production will be optimized with the installation of new, high-volume fermenters and other processing equipment.
TRANSPORTATION & ADVANCED POLYMERS
Transportation & Advanced Polymers provides high-performance engineering resins, adhesives, lubricants and parts to engineers and designers in the transportation, electronics, medical, industrial and consumer end-markets to enable systems solutions for demanding applications and environments.
The segment delivers a broad range of polymer-based high-performance materials in its product portfolio, including elastomers and thermoplastic and thermoset engineering polymers which are used by customers to fabricate components for mechanical, chemical and electrical systems. The segment produces innovative and differentiated adhesive technologies to meet customer specifications for durability, crash performance and healthcare applications. Transportation & Advanced Polymers also targets the performance plastics and fluid solutions markets by developing technologies that differentiate customers’ products with improved performance characteristics.
16
Pending Divestiture
On October 10, 2017, DuPont, along with Teijin Limited, entered into an agreement to sell DuPont Teijin Films to Indorama Ventures Public Company Limited, a global chemical producer. The transaction is expected to be completed in the first half of 2018, subject to regulatory approvals.
Ownership Restructure of Dow Corning Corporation
On June 1, 2016, Dow Corning, previously a 50:50 joint venture with Corning, became a wholly owned subsidiary of Dow as a result of an ownership restructure. See Note
3
to the Consolidated Financial Statements for additional information.
Details on Transportation & Advanced Polymers' 2017 net sales, by geographic region, are as follows:

Products
Major applications and products are listed below by major product line, all which serve the transportation industry and electronics, medical, industrial and consumer end-markets.
|
Major Product Line
|
Major Products
|
|
Performance Resins
|
HYTREL® polyester thermoplastic elastomer resins, DELRIN® acetal resins, VAMAC® ethylene acrylic elastomer, and MULTIBASE™ TPSiV™ silicones for thermoplastics
|
|
Nylon & Polyesters
|
DUPONT™ ZYTEL® nylon resins, CRASTIN® PBT thermoplastic polyester resin, RYNITE® PET polyester resin and TYNEX® filaments
|
|
Performance Solutions
|
KALREZ® perfluoroelastomer, VESPEL® parts and shapes, MOLYKOTE® lubricants, DOW CORNING® silicone solutions for healthcare, BETASEAL™, BETAMATE™ and BETAFORCE™ structural and elastic adhesives
|
Key Raw Materials
The major commodities, raw materials and supplies for the Transportation & Advanced Polymers segment include: Adipic acid, butanediol, carbon black, dimethyl terephthalate, epoxy resins, fiberglass, flame retardants, hexamethylene diamine, methanol, polyethylene terephthalate, purified terephthalic acid and silicones.
Competition
Transportation & Advanced Polymers' competitors include many large multinational chemical firms as well as a number of regional and local competitors. The segment's products have unique performance characteristics that are required by customers who demand a high-level of customer service and technical expertise from the Company's sales force and scientists; therefore, the Company is well positioned to withstand competitive threats. Key competitors include BASF, Celanese, Royal DSM N.V., EMS, Henkel, Kluber, Mitsubishi, Sika and Wacker.
SAFETY & CONSTRUCTION
Safety & Construction is the global leader in providing innovative engineered products and integrated systems for a number of industries including construction, worker safety, energy, oil and gas, transportation, medical devices and water purification and separation. Safety & Construction addresses the growing global needs of businesses, governments and consumers for solutions that make life safer, healthier and better.
17
Innovation is the business imperative. By uniting market-driven science with the strength of highly regarded brands including DUPONT™ KEVLAR® high-strength material, NOMEX® thermal-resistant material, CORIAN® solid surfaces, TYVEK® selective barriers, Dow FILMTEC™ reverse osmosis elements, Dow STYROFOAM™ insulation and Dow GREAT STUFF™ do it yourself products, the segment strives to bring new products and solutions to solve customers' needs faster, better and more cost effectively. Safety & Construction is investing in future growth initiatives such as the protection of perishable and temperature-sensitive foods and pharmaceutical products, new roofing products, flame resistant cargo containers, protective clothing with much higher levels of arc protection for utilities, more comfortable and higher particulate protection hoods for firefighters and high recovery reverse osmosis elements. Through the sustainable solutions product line, the segment is a leader in safety consulting, selling training products as well as consulting services, to improve the safety, productivity and sustainability of organizations across a range of industries.
Details on Safety & Construction's 2017 net sales, by geographic region, are as follows:

Products
Major applications and products are listed below by major product line:
|
Major Product Line
|
Applications / Market Segments
|
Major Products / Technologies
|
|
Protection Solutions
|
Industrial personnel protection, military and emergency response, medical devices, automotive, aerospace, oil and gas and solid surfaces
|
DUPONT™ KEVLAR® fiber; DUPONT™ NOMEX® fiber and paper; DUPONT™ TYVEK® protective materials; DUPONT™ TYCHEM® protective suits; DUPONT™ CORIAN® solid and quartz surfaces
|
|
Building Solutions
|
Rigid and spray foam insulation, weatherization, waterproofing and air sealing, caulks and sealants and roof coatings
|
DUPONT™ TYVEK® weatherization products, STYROFOAM™ brand insulation products, THERMAX™ exterior insulation, WALOCEL™ cellulose ethers, WEATHERMATE™ house wrap, XENERGY™ high performance insulation, LIQUIDARMOR™ flashing and sealant, GREAT STUFF™ insulating foam sealants and adhesives
|
|
Water Solutions
|
Water filtration and purification technology for residential and industrial use. Key industries include municipal, power, electronics, pharmaceuticals, food and beverage, mining and oil and gas applications
|
DOWEX™ and AMBERLITE™ ion exchange resins, DOW FILMTEC™ reverse osmosis and nanofiltration elements, INTEGRAFLUX™ ultrafiltration modules and FORTILIFE™ challenging water reverse osmosis membranes
|
Key Raw Materials
The major commodities, raw materials and supplies for the Safety & Construction segment include: alumina trihydrate, aniline, benzene, calcium chloride, carbon monoxide, chlorine, divinyl benzene monomers, high-density polyethylene, isophthalic acid, metaphenylenediamine, methyl methacrylate, methylpentanediol, polyester resin, polypropylene, polystyrene, sulfuric acid and terephthalic acid.
Competition
Safety & Construction's competitors include many large multinational chemical firms as well as a number of regional and local competitors. The segment's products have unique performance characteristics that are required by customers who demand a high level of customer service and expertise from its sales force and scientists; therefore, the Company is well positioned to withstand
18
competitive threats. Key competitors include 3M, Honeywell, Toray, Teijin, DSM, Kingspan, Owens-Corning, Hydranautics, Lanxess and Purolite.
CORPORATE
Corporate includes certain enterprise and governance activities (including insurance operations, environmental operations, geographic management, etc.); business incubation platforms; non-business aligned joint ventures; gains and losses on the sales of financial assets; severance costs; non-business aligned litigation expenses; discontinued or non-aligned businesses and pre-commercial activities.
Divestiture
On July 31, 2015, Dow sold its AgroFresh business to Boulevard Acquisition Corp., which was subsequently renamed AgroFresh Solutions, Inc. (“AFSI”).
RAW MATERIALS
The Company operates in an integrated manufacturing environment. Basic raw materials are processed through many stages to produce a number of products that are sold as finished goods at various points in those processes. The major raw material stream that feeds the production of the Company’s finished goods, primarily in its materials science businesses, is hydrocarbon-based raw materials. The Company purchases hydrocarbon raw materials including ethane, propane, butane, naphtha and condensate as feedstocks. These raw materials are used in the production of both saleable products and energy. The Company also purchases certain monomers, primarily ethylene and propylene, to supplement internal production. The Company purchases natural gas, primarily to generate electricity, and purchases electric power to supplement internal generation. The Company also produces a portion of its electricity needs in Delaware, Louisiana, New Jersey, Texas and Virginia; Alberta, Canada; the Netherlands; and Germany.
The Company had adequate supplies of raw materials during 2017, and expects to continue to have adequate supplies of raw materials in 2018.
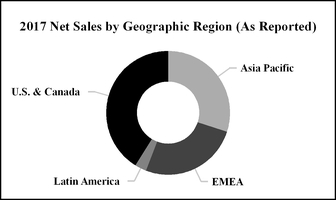
INDUSTRY SEGMENTS AND GEOGRAPHIC REGION RESULTS
See Note
24
to the Consolidated Financial Statements for information regarding total net sales, pro forma net sales, pro forma Operating EBITDA and total assets by segment, as well as sales and total assets by geographic region.
SIGNIFICANT CUSTOMERS AND PRODUCTS
All products and services are marketed primarily through the Company’s sales force, although in some instances more emphasis is placed on sales through distributors. In 2017, no significant portion of the Company's sales was dependent upon a single customer.
RESEARCH AND DEVELOPMENT
The Company is engaged in a continuous program of basic and applied research to develop new products and processes, to improve and refine existing products and processes and to develop new applications for existing products. Research and development expenses were
$2,110 million
in
2017
,
$1,584 million
in
2016
and
$1,598 million
in
2015
.
PATENTS, LICENSES AND TRADEMARKS
The Company continually applies for and obtains U.S. and foreign patents and has a substantial number of pending patent applications throughout the world. At December 31, 2017, the Company owned approximately
12,600
active U.S. patents and
39,000
active foreign patents as follows:
|
Patents Owned at Dec 31, 2017
|
United States
|
Foreign
|
||
|
Dow
|
6,100
|
|
29,100
|
|
|
DuPont
|
6,500
|
|
9,900
|
|
|
Total
|
12,600
|
|
39,000
|
|
19
|
Remaining Life of Patents Owned at Dec 31, 2017
|
United States
|
Foreign
|
||
|
Within 5 years
|
3,100
|
|
8,200
|
|
|
6 to 10 years
|
3,200
|
|
13,600
|
|
|
11 to 15 years
|
5,100
|
|
15,900
|
|
|
16 to 20 years
|
1,200
|
|
1,300
|
|
|
Total
|
12,600
|
|
39,000
|
|
As a science and technology based company, DowDuPont believes that securing intellectual property is an important part of protecting its research. Some DowDuPont businesses operate in environments in which the availability and protection of intellectual property rights affect competition. The Company, through its consolidated subsidiaries, is party to a substantial number of patent licenses and other technology agreements. The Company also owns or licenses a substantial number of trademarks in the United States and in other countries. Although the Company considers that its patents, licenses and trademarks in the aggregate constitute a valuable asset, it does not regard its business as being materially dependent on any single or group of related patents, licenses or trademarks.
PRINCIPAL PARTLY OWNED COMPANIES
DowDuPont’s principal nonconsolidated affiliates at December 31,
2017
, including direct or indirect ownership interest for each, are listed below:
|
Principal Nonconsolidated Affiliate
|
Ownership Interest
|
Business Description
|
|
|
EQUATE Petrochemical Company K.S.C.
|
42.50
|
%
|
A Kuwait-based company that manufactures ethylene, polyethylene and ethylene glycol, and manufactures and markets monoethylene glycol, diethylene glycol and polyethylene terephthalate resins
|
|
The HSC Group:
|
|||
|
DC HSC Holdings LLC
1
|
50.00
|
%
|
A U.S.-based group of companies that manufactures polycrystalline silicon products
|
|
Hemlock Semiconductor L.L.C.
|
50.10
|
%
|
A U.S. company that sells polycrystalline silicon products
|
|
The Kuwait Olefins Company K.S.C.
|
42.50
|
%
|
A Kuwait-based company that manufactures ethylene and ethylene glycol
|
|
The Kuwait Styrene Company K.S.C.
|
42.50
|
%
|
A Kuwait-based company that manufactures styrene monomer
|
|
Map Ta Phut Olefins Company Limited
2
|
32.77
|
%
|
A Thailand-based company that manufactures propylene and ethylene
|
|
Sadara Chemical Company
3
|
35.00
|
%
|
A Saudi Arabian company that manufactures chlorine, ethylene, propylene and aromatics for internal consumption and manufactures and sells polyethylene, ethylene oxide and propylene oxide derivative products, and isocyanates
|
|
The SCG-Dow Group:
|
|||
|
Siam Polyethylene Company Limited
|
50.00
|
%
|
A Thailand-based company that manufactures polyethylene
|
|
Siam Polystyrene Company Limited
|
50.00
|
%
|
A Thailand-based company that manufactures polystyrene
|
|
Siam Styrene Monomer Co., Ltd.
|
50.00
|
%
|
A Thailand-based company that manufactures styrene
|
|
Siam Synthetic Latex Company Limited
|
50.00
|
%
|
A Thailand-based company that manufactures latex
|
|
1.
|
DC HSC Holdings LLC holds an 80.5 percent indirect ownership interest in Hemlock Semiconductor Operations LLC.
|
|
2.
|
Dow's effective ownership of Map Ta Phut Olefins Company Limited is 32.77 percent, of which Dow directly owns 20.27 percent and indirectly owns 12.5 percent through its equity interest in Siam Polyethylene Company Limited and Siam Synthetic Latex Company Limited.
|
|
3.
|
Dow is responsible for marketing the majority of Sadara products outside of the Middle East zone through Dow's established sales channels. Under this arrangement, Dow purchases and sells Sadara products for a marketing fee.
|
See Note
12
to the Consolidated Financial Statements for additional information regarding nonconsolidated affiliates.
20
FINANCIAL INFORMATION ABOUT FOREIGN AND DOMESTIC OPERATIONS AND EXPORT SALES
In
2017
, the Company derived
66 percent
of its net sales and had
36 percent
of its property investment outside the United States. While the Company’s international operations may be subject to a number of additional risks, such as changes in foreign currency exchange rates and geopolitical risks in emerging geographies, the Company does not regard its foreign operations, on the whole, as carrying any greater risk than its operations in the United States. Information on sales and long-lived assets by geographic region for each of the last three years appears in Note
24
to the Consolidated Financial Statements, and discussions of the Company’s risk management program for foreign currency exchange and interest rate risk management appear in Part I, Item 1A. Risk Factors; Part II, Item 7A. Quantitative and Qualitative Disclosures About Market Risk; and Note
21
to the Consolidated Financial Statements.
PROTECTION OF THE ENVIRONMENT
Matters pertaining to the environment are discussed in Part I, Item 1A. Risk Factors; Part II, Item 7. Management's Discussion and Analysis of Financial Condition and Results of Operations; and Notes
1
and
16
to the Consolidated Financial Statements.
EMPLOYEES
At December 31, 2017, the Company permanently employed approximately
98,000
people on a full-time basis.
OTHER ACTIVITIES
Dow engages in the property and casualty insurance and reinsurance business primarily through its Liana Limited subsidiaries.
21
EXECUTIVE OFFICERS OF THE REGISTRANT
Set forth below is information related to the Company's executive officers as of February 15, 2018:
|
Name - Age
|
Present Position with Registrant
|
Year Elected to be an Officer
|
Other Business Experience since January 1, 2013
|
|
Edward D. Breen, 61
|
Chief Executive Officer
|
2017
|
DuPont: Board of Directors February 2015 to date; Interim Chair of the Board and CEO October 2015 to date; Immediately prior to joining DuPont, member of Comcast Corporation: Board of Directors February 2014 to date; New Mountain Capital LLC: Advisory Board Member.
|
|
James C. Collins, Jr., 55
|
Chief Operating Officer for the Agriculture Division
|
2017
|
DuPont: Executive Vice President Agriculture business January 2016 to date; Executive Vice President Electronics & Communications, Industrial Biosciences and Performance Materials businesses December 2014 to January 2016; Senior Vice President Performance Materials and Industrial Biosciences September 2013 to December 2014; President Industrial Biosciences and Vice President Acquisitions January 2011 to September 2013.
|
|
Jeanmarie F. Desmond, 51
|
Co-Controller
|
2017
|
DuPont: Vice President & Controller August 2015 to date; General Auditor and Chief Ethics & Compliance Leader September 2014 to July 2015; Director, Corporate Accounting and Reporting 2013 to 2014.
|
|
C. Marc Doyle, 48
|
Chief Operating Officer for the Specialty Products Division
|
2017
|
DuPont: Executive Vice President Electronics & Communications, Protection Solutions, Sustainable Solutions, Industrial Biosciences, Nutrition & Health, and Performance Materials businesses January 2016 to date; Senior Vice President Safety & Protection businesses July 2015 to December 2015; President of DuPont Protection Technologies June 2013 to June 2015.
|
|
Ronald C. Edmonds, 60
|
Co-Controller
|
2017
|
Dow: Controller and Vice President of Controllers and Tax February 2016 to date; Vice President and Controller 2009 to 2016.
|
|
James R. Fitterling, 56
|
Chief Operating Officer for the Materials Science Division
|
2017
|
Dow: President and Chief Operating Officer February 2016 to date; Vice Chairman and Chief Operating Officer October 2015 to February 2016; Vice Chairman, Business Operations October 2014 to October 2015; Executive Vice President, Feedstocks, Performance Plastics and Supply Chain December 2013 to October 2014; Executive Vice President, Feedstocks, Performance Plastics, Asia and Latin America September 2012 to December 2013.
|
|
Stacy L. Fox, 64
|
General Counsel and Corporate Secretary
|
2017
|
DuPont: Senior Vice President and General Counsel October 2014 to date; Corporate Communications January 2016 to date; City of Detroit: Deputy Emergency Manager October 2013 to September 2014; Roxbury Group LLC: Principal March 2005 to date.
|
|
Charles J. Kalil, 66
|
Special Counsellor to the Executive Chairman, General Counsel for the Materials Science Division
|
2017
|
Dow: General Counsel 2004 to date; Executive Vice President 2008 to date; Corporate Secretary 2005 to February 2015.
|
|
Andrew N. Liveris, 63
|
Executive Chairman
|
2017
|
Dow: Chief Executive Officer 2004 to date; Chairman 2006 to date; President 2004 to February 2016.
|
|
Howard I. Ungerleider, 49
|
Chief Financial Officer
|
2017
|
Dow: Vice Chairman and Chief Financial Officer October 2015 to date; Chief Financial Officer and Executive Vice President October 2014 to October 2015; Executive Vice President, Advanced Materials September 2012 to October 2014.
|
22
The factors described below represent the Company's principal risks.
DowDuPont may fail to realize the anticipated benefits of the Merger. Combining the businesses of DuPont and Dow may be more difficult, costly or time-consuming than expected, which may adversely affect DowDuPont's results and negatively affect the value of DowDuPont common stock.
The success of the Merger depends on, among other things, DowDuPont's ability to combine the DuPont and Dow businesses in a manner that facilitates the intended separation of the Company's agriculture, materials science and specialty products businesses through one or more tax-efficient transactions (the "Intended Business Separations"), resulting in three independent, publicly traded companies, and realizes anticipated synergies.
DowDuPont expects to benefit from significant cost synergies at both the business and corporate levels through the DowDuPont Cost Synergy Program (the "Synergy Program") which is designed to integrate and optimize the organization following the Merger and in preparation for the Intended Business Separations, including through the achievement of production cost efficiencies, enhancement of the agricultural supply chain, elimination of duplicative agricultural research and development programs, optimization of the combined Company’s global footprint across manufacturing, sales and research and development, optimizing manufacturing processes in the electronics space, the reduction of corporate and leveraged services costs, and the realization of significant procurement synergies. In connection with the Synergy Program, DowDuPont expects to record total pretax restructuring charges of approximately
$2 billion
, comprised of approximately
$845 million
to
$935 million
of severance and related benefit costs;
$400 million
to
$540 million
of asset write-downs and write-offs and
$400 million
to
$450 million
of costs associated with exit and disposal activities.
Management also expects the combined Company will achieve growth synergies and other meaningful savings and benefits as a result of the Intended Business Separations.
Combining DuPont and Dow's independent businesses and preparing for the Intended Business Separations are complex, costly and time-consuming processes and the management of DowDuPont may face significant implementation challenges, many of which may be beyond the control of management, including, without limitation:
|
•
|
ongoing diversion of the attention of management from the operation of the combined Company’s business as a result of the Intended Business Separations;
|
|
•
|
impact of portfolio changes between materials science and specialty products on integration and separation preparation activities;
|
|
•
|
difficulties in achieving anticipated cost savings, synergies, business opportunities and growth prospects;
|
|
•
|
the possibility of faulty assumptions underlying expectations regarding the integration or separation process, including with respect to the intended tax efficient transactions;
|
|
•
|
unanticipated issues in integrating, replicating or separating information technology, communications programs, financial procedures and operations, and other systems, procedures and policies;
|
|
•
|
difficulties in managing a larger combined company, addressing differences in business culture and retaining key personnel;
|
|
•
|
unanticipated changes in applicable laws and regulations;
|
|
•
|
managing tax costs or inefficiencies associated with integrating the operations of the combined Company and the intended tax efficient separation transactions; and
|
|
•
|
coordinating geographically separate organizations.
|
Some of these factors will be outside of the control of DowDuPont and any one of them could result in increased costs and diversion of management’s time and energy, as well as decreases in the amount of expected revenue which could materially impact DowDuPont's business, financial condition and results of operations. The integration and Intended Businesses Separation processes and other disruptions, including those from divestitures and acquisitions undertaken in connection with securing regulatory approval for the Merger, as well as those from the portfolio changes between the materials science and specialty products businesses, may also adversely affect the combined Company’s relationships with employees, suppliers, customers, distributors, licensors and others with whom DuPont and Dow have business or other dealings, and difficulties in integrating the businesses or regulatory functions of DuPont and Dow could harm the reputation of DowDuPont.
If DowDuPont is not able to successfully combine the businesses of DuPont and Dow in an efficient, cost-effective and timely manner, the anticipated benefits and cost savings, including from the Synergy Program, of the Merger (including the Intended Business Separations) may not be realized fully, or at all, or may take longer to realize than expected, and the value of DowDuPont common stock, the revenues, levels of expenses and results of operations may be affected adversely. A variety of factors may
23
adversely affect the Company's ability to realize the currently expected synergies, savings and other benefits of the Merger, including failure to successfully optimize the combined Company's facilities footprint, the failure to take advantage of the combined Company's global supply chain, the failure to identify and eliminate duplicative programs, and the failure to otherwise integrate DuPont's or Dow's respective businesses, including their technology platforms.
The determination to proceed with the Intended Business Separations is a decision of the DowDuPont Board of Directors and the expected benefits of such transactions, if they occur, will be uncertain.
In the event that the DowDuPont board determines to proceed with the Intended Business Separations, it is currently anticipated that any such Intended Business Separation transaction would be effectuated through two pro-rata spin-off transactions, in which DowDuPont stockholders, at such time, would receive shares of capital stock in the resulting spin-off companies, resulting in three independent, public companies. The DowDuPont board may ultimately determine to abandon one or more of the Intended Business Separation transactions, and such determination could have an adverse impact on DowDuPont. There are many factors that could, prior to the determination by the DowDuPont board to proceed with the Intended Business Separations, impact the structure or timing of, the anticipated benefits from, or determination to ultimately proceed with, the Intended Business Separations, including, among others, global economic conditions, instability in credit markets, declining consumer and business confidence, fluctuating commodity prices and interest rates, volatile foreign currency exchange rates, tax considerations, and other challenges that could affect the global economy, specific market conditions in one or more of the industries of the businesses proposed to be separated, and changes in the regulatory or legal environment. Such changes could adversely impact the value of one or more of the Intended Business Separation transactions to the combined Company’s stockholders. Additionally, to the extent the DowDuPont board determines to proceed with the Intended Business Separations, the consummation of such transactions is a complex, costly and time-consuming process, and there can be no guarantee that the intended benefits of such transactions will be achieved. An inability to realize the full extent of the anticipated benefits of the Intended Business Separations, as well as any delays encountered in the process, could have an adverse effect upon the revenues, level of expenses and operating results of the agriculture business, the specialty products business, the materials science business and/or the combined Company.
DowDuPont will incur significant costs in connection with the integration of DuPont and Dow and the Intended Business Separations.
There are a large number of processes, policies, procedures, operations, technologies and systems that must be integrated in connection with the Merger and replicated, transferred or separated in connection with the Intended Business Separations. While DowDuPont has assumed a certain level of expenses, including in connection with the Synergy Program, would be incurred in connection with the Merger and the Intended Business Separations, there are many factors beyond the combined Company’s control that could affect the total amount of, or the timing of, anticipated expenses with respect to the integration and implementation of the combined businesses.
There may also be additional unanticipated significant costs in connection with the Merger and the Intended Business Separations that DowDuPont may not recoup. These costs and expenses could reduce the benefits and additional income DowDuPont expects to achieve from the Merger. Although DowDuPont expects that these benefits will offset the transaction expenses and implementation costs over time, this net benefit may not be achieved in the near term or at all.
Inability to access the debt capital markets could impair DowDuPont's liquidity, business or financial condition.
DowDuPont’s primary sources of liquidity are through DuPont and Dow and their respective consolidated subsidiaries, (collectively, the “Subsidiaries”). Each of DuPont and Dow has relied and continues to rely on access to the debt capital markets to finance their day-to-day and long-term operations. In connection with the Merger, DowDuPont has not incurred debt obligations or guaranteed the debt obligations of DuPont or Dow. Any limitation on the part of either DuPont’s or Dow’s ability to raise money in the debt markets could have a substantial negative effect on their respective liquidity and the liquidity of DowDuPont. Access to the debt capital markets in amounts adequate to finance each Subsidiary’s activities could be impaired as a result of the existence of material nonpublic information about the Intended Business Separations and other potential factors, including factors that are not specific to the Subsidiaries, such as a severe disruption of the financial markets and interest rate fluctuations.
Prior to the Intended Business Separations, if pursued, the level and quality of the respective earnings, operations, business and management, among other things, of each of DuPont and Dow will impact their respective credit ratings, costs and availability of financing and those of the combined Company. A decrease in the ratings assigned to DuPont or Dow by the ratings agencies may negatively impact their access to the debt capital markets and increase the combined Company’s cost of borrowing. There can be no assurance that DuPont and Dow will maintain their current credit worthiness or prospective credit ratings. Any actual or anticipated changes or downgrades in such credit ratings may have a negative impact on the liquidity, capital position or access to capital markets of DuPont and Dow and, therefore, DowDuPont.
24
DowDuPont will be exposed to the risks related to international sales and operations.
DuPont and Dow each derive a large portion of their total sales and revenues from operations outside of the United States. Therefore, DowDuPont will have exposure to risks of operating in many foreign countries, including:
|
•
|
difficulties and costs associated with complying with a wide variety of complex laws, treaties and regulations;
|
|
•
|
unexpected changes in political or regulatory environments;
|
|
•
|
labor compliance and costs associated with a global workforce;
|
|
•
|
earnings and cash flows that may be subject to tax withholding requirements or the imposition of tariffs;
|
|
•
|
exchange controls or other restrictions;
|
|
•
|
restrictions on, or difficulties and costs associated with, the repatriation of cash from foreign countries to the United States;
|
|
•
|
political and economic instability;
|
|
•
|
import and export restrictions and other trade barriers;
|
|
•
|
difficulties in maintaining overseas subsidiaries and international operations;
|
|
•
|
difficulties in obtaining approval for significant transactions;
|
|
•
|
government limitations on foreign ownership;
|
|
•
|
government takeover or nationalization of business;
|
|
•
|
government mandated price controls; and
|
|
•
|
fluctuations in foreign currency exchange rates.
|
Any one or more of the above factors could adversely affect the international operations of the combined Company and could significantly affect the combined Company’s results of operations, financial condition and cash flows.
Availability of purchased feedstocks and energy, and the volatility of these costs, impact the Company's operating costs and add variability to earnings.
Primarily in support of its materials science businesses, the Company purchases hydrocarbon raw materials including ethane, propane, butane, naphtha and condensate as feedstocks. The Company also purchases certain monomers, primarily ethylene and propylene, to supplement internal production, as well as other raw materials. The Company purchases natural gas, primarily to generate electricity, and purchases electric power to supplement internal generation.
Feedstock and energy costs generally follow price trends in crude oil and natural gas, which are sometimes volatile. While the Company uses its feedstock flexibility and financial and physical hedging programs to help mitigate feedstock cost increases, the Company is not always able to immediately raise selling prices. Ultimately, the ability to pass on underlying cost increases is dependent on market conditions. Conversely, when feedstock and energy costs decline, selling prices generally decline as well. As a result, volatility in these costs could impact the Company’s results of operations.
The Company has a number of investments in the U.S. Gulf Coast to take advantage of increasing supplies of low-cost natural gas and NGLs derived from shale gas including: the restart of the SCO-2 ethylene production facility in December 2012; construction of a new on-purpose propylene production facility, which commenced operations in December 2015; completion of a major maintenance turnaround in December 2016 at an ethylene production facility in Plaquemine, Louisiana, which included expanding the facility’s ethylene production capacity by up to 250 KTA and modifications to enable full ethane cracking flexibility; and, construction of a new world-scale ethylene production facility in Freeport, Texas, which commenced operations in the third quarter of 2017, and a capacity expansion project which will bring the facility's total ethylene capacity to 2,000 KTA. As a result of these investments, the Company's exposure to purchased ethylene and propylene is expected to decline, offset by increased exposure to ethane- and propane-based feedstocks.
While the Company expects abundant and cost-advantaged supplies of NGLs in the United States to persist for the foreseeable future, if NGLs were to become significantly less advantaged than crude oil-based feedstocks, it could have a negative impact on the Company’s results of operations and future investments. Also, if the Company’s key suppliers of feedstocks and energy are unable to provide the raw materials required for production, it could have a negative impact on the Company's results of operations.
Earnings generated by the Company's products vary based in part on the balance of supply relative to demand within the industry.
The balance of supply relative to demand within the industry may be significantly impacted by the addition of new capacity, especially for basic commodities where capacity is generally added in large increments as world-scale facilities are built. This may disrupt industry balances and result in downward pressure on prices due to the increase in supply, which could negatively impact the Company's results of operations.
25
The costs of complying with evolving regulatory requirements could negatively impact the Company's financial results. Actual or alleged violations of environmental laws or permit requirements could result in restrictions or prohibitions on plant operations, substantial civil or criminal sanctions, as well as the assessment of strict liability and/or joint and several liability.
The Company is subject to extensive federal, state, local and foreign laws, regulations, rules and ordinances relating to pollution, protection of the environment, greenhouse gas emissions, and the generation, storage, handling, transportation, treatment, disposal and remediation of hazardous substances and waste materials. Costs and capital expenditures relating to environmental, health or safety matters are subject to evolving regulatory requirements and depend on the timing of the promulgation and enforcement of specific standards which impose the requirements. Moreover, changes in environmental regulations could inhibit or interrupt the Company's operations, or require modifications to its facilities. Accordingly, environmental, health or safety regulatory matters could result in significant unanticipated costs or liabilities.
Increased concerns regarding the safe use of seeds with biotechnology traits, crop protection products, and chemicals in commerce and their potential impact on the environment as well as perceived impacts of biotechnology on health and the environment, have resulted in more restrictive regulations and could lead to new regulations.
Concerns and claims regarding the safe use of seeds with biotechnology traits, crop protection products, and chemicals, their potential impact on health and the environment, and the perceived impacts of biotechnology on health and the environment reflect a growing trend in societal demands for increasing levels of product safety and environmental protection. These concerns and claims include those that increased use of crop protection products, related drift and volatilization, and of biotechnology traits to address resistance of weeds and pests to control by crop protection products, could increase such resistance and otherwise negatively impact health and the environment. These concerns could manifest themselves in stockholder proposals, preferred purchasing, delays or failures in obtaining or retaining regulatory approvals, delayed product launches, lack of market acceptance, product discontinuation, continued pressure for and adoption of more stringent regulatory intervention and litigation. These concerns could also influence public perceptions, the viability or continued sales of certain of the Company's products, the Company's reputation and the cost to comply with regulations. These concerns could have a negative impact on the Company's results of operations.
In most jurisdictions, the Company must test the safety, efficacy and environmental impact of its agricultural products to satisfy regulatory requirements and obtain the necessary approvals. In certain jurisdictions, the Company must periodically renew its approvals which may require it to demonstrate compliance with then-current standards. The regulatory environment is lengthy, complex and in some markets unpredictable, with requirements that can vary by product, technology, industry and country. The regulatory environment may be impacted by the activities of non-governmental organizations and special interest groups and stakeholder reaction to actual or perceived impacts of new technology, products or processes on safety, health and the environment. Obtaining and maintaining regulatory approvals requires submitting a significant amount of information and data, which may require participation from technology providers. Regulatory standards and trial procedures are continuously changing. The pace of change together with the lack of regulatory harmony could result in unintended noncompliance.
Responding to these changes and meeting existing and new requirements may involve significant costs or capital expenditures or require changes in business practice that could result in reduced profitability. The failure to receive necessary permits or approvals could have near- and long-term effects on the Company’s ability to produce and sell some current and future products.
To maintain its right to produce or sell existing products or to commercialize new products containing biotechnology traits, particularly seed products, the Company must be able to demonstrate its ability to satisfy the requirements of regulatory agencies. Sales into and use of seeds with biotechnology traits in jurisdictions where cultivation has been approved could be impacted if key import markets have not approved the import of grains, food and food ingredients and other products derived from those seeds. If import of grains, food and food ingredients and other products derived from those seeds containing such biotechnology traits occurs in these markets, it could lead to disruption in trade and potential liability for the Company.
In addition, the Company’s regulatory compliance could be affected by the detection of low level presence of biotechnology traits in conventional seed or products produced from such seed. Furthermore, the detection of biotechnology traits not approved in the country of cultivation may affect the Company’s ability to supply product and could affect exports of products produced from such seeds and even result in crop destruction or product recalls.
A significant operational event could negatively impact the Company's results of operations.
The Company's operations, the transportation of products, cyber-attacks, or severe weather conditions and other natural phenomena (such as drought, hurricanes, earthquakes, tsunamis, floods, etc.) could result in an unplanned event that could be significant in scale and could negatively impact operations, neighbors or the public at large, which could have a negative impact on the Company's results of operations.
26
Major hurricanes have caused significant disruption in the Company's operations on the U.S. Gulf Coast, logistics across the region, and the supply of certain raw materials, which had an adverse impact on volume and cost for some of the Company's products. Due to the Company's substantial presence on the U.S. Gulf Coast, similar severe weather conditions or other natural phenomena in the future could negatively impact the Company's results of operations.
In addition, terrorist attacks and natural disasters have increased concerns about the security and safety of chemical production and distribution. Local, state, federal and foreign governments continue to propose new regulations related to the security of chemical plant locations and the transportation of hazardous chemicals, which could result in higher operating costs.
The risk of loss of the Company’s intellectual property, trade secrets or other sensitive business information or disruption of operations could negatively impact the Company’s financial results.
Cyber-attacks or security breaches could compromise confidential, business critical information, cause a disruption in the Company’s operations or harm the Company's reputation. The Company has attractive information assets, including intellectual property, trade secrets and other sensitive, business critical information. While the Company has a comprehensive cyber security program that is continuously reviewed, maintained and upgraded, a significant cyber-attack could result in the loss of critical business information and/or could negatively impact operations, which could have a negative impact on the Company’s financial results.
Implementing certain elements of the Company's strategy could negatively impact the Company's financial results.
The Company currently has manufacturing operations, sales and marketing activities, joint ventures, as well as proposed and existing projects of varying size in emerging geographies. Activities in these geographic regions are accompanied by uncertainty and risks including: navigating different government regulatory environments; relationships with new, local partners; project funding commitments and guarantees; expropriation, military actions, war, terrorism and political instability; sabotage; uninsurable risks; suppliers not performing as expected, resulting in increased risk of extended project timelines; and determining raw material supply and other details regarding product movement. If the manufacturing operations, sales and marketing activities, and/or implementation of these projects is not successful, it could adversely affect the Company's financial condition, cash flows and results of operations.
An impairment of goodwill or intangible assets could negatively impact the Company's financial results.
At least annually, the Company assesses both goodwill and indefinite-lived intangible assets for impairment. Intangible assets with finite lives are tested for impairment when events or changes in circumstances indicate the carrying value may not be recoverable. If testing indicates that goodwill or intangible assets are impaired, the carrying values are written down based on fair values with a charge against earnings. Where the Company utilizes discounted cash flow methodologies in determining fair values, continued weak demand for a specific product line or business could result in an impairment. Accordingly, any determination requiring the write-off of a significant portion of goodwill or intangible assets could negatively impact the Company's results of operations.
As a result of the Merger and the related acquisition method of accounting, which resulted in DuPont's assets and liabilities being measured at fair value, the Company's goodwill increased by
$45.1 billion
and the Company's intangible assets increased by
$27.2 billion
. Future impairments of either could be recorded in results of operations due to changes in assumptions, estimates or circumstances and there can be no assurance that such impairments would be immaterial to the Company, DuPont or Dow.
Increased obligations and expenses related to DuPont's and Dow's defined benefit pension plans and other postretirement benefit plans could negatively impact DowDuPont's financial condition and results of operations.
DuPont and Dow have defined benefit pension plans and other postretirement benefit plans ("OPEB") (collectively, the “plans”) in the United States and a number of other countries. The assets of the DuPont and Dow funded plans are primarily invested in fixed income and equity securities of U.S. and foreign issuers. Changes in the market value of plan assets, investment returns, discount rates, mortality rates, regulations and the rate of increase in compensation levels may affect the funded status of the plans and could cause volatility in the net periodic benefit cost, future funding requirements of the plans and the funded status of the plans. A significant increase in DuPont's and Dow's obligations or future funding requirements could have a negative impact on the Company's results of operations and cash flows for a particular period and on the Company's financial condition.
Unpredictable seasonal and weather factors could impact sales and earnings from the Company’s Agriculture segment.
The agriculture industry is subject to seasonal and weather factors, which can vary unpredictably from period to period. Weather factors can affect the presence of disease and pests on a regional basis and, accordingly, can positively or adversely affect the demand for crop protection products, including the mix of products used. The weather also can affect the quality, volume and cost of seed produced for sale as well as demand and product mix. Seed yields can be higher or lower than planned, which could lead to higher inventory and related write-offs and affect the ability to supply.
27
Inability to discover, develop and protect new technologies and enforce the Company's intellectual property rights, and to respond to new technologies, could adversely affect the Company's financial results.
The Company competes with major global companies that have strong intellectual property rights, including rights supporting the use of biotechnology to enhance products, particularly agricultural and bio-based products. Speed in discovering, developing, protecting, and responding to new technologies, including new technology-based distribution channels that could impede the Company's ability to engage with customers and end user, and bringing related products to market is a significant competitive advantage. Failure to predict and respond effectively could cause the Company's existing or candidate products to become less competitive, adversely affecting sales. Competitors are increasingly challenging intellectual property positions and the outcomes can be highly uncertain. If challenges are resolved adversely, it could negatively impact the Company's ability to obtain licenses on competitive terms, commercialize new products and generate sales from existing products.
Intellectual property rights, including patents, plant variety protection, trade secrets, confidential information, trademarks, tradenames and other forms of trade dress, are important to the Company's business. The Company endeavors to protect its intellectual property rights in jurisdictions in which its products are produced or used and in jurisdictions into which its products are imported. However, the Company may be unable to obtain protection for its intellectual property in key jurisdictions. Further, changes in government policies and regulations, including changes made in reaction to pressure from non-governmental organizations, could impact the extent of intellectual property protection afforded by such jurisdictions.
The majority of the Company’s corn hybrids and soybean varieties sold to customers contain biotechnology traits that are licensed from third parties under long-term licenses. If the Company loses its rights under such licenses, it could negatively impact the Company's ability to obtain future licenses on competitive terms, commercialize new products and generate sales from existing products.
The Company has designed and implemented internal controls to restrict access to and distribution of its intellectual property. Despite these precautions, the Company's intellectual property is vulnerable to unauthorized access through employee error or actions, theft and cybersecurity incidents, and other security breaches. When unauthorized access and use or counterfeit products are discovered, the Company reports such situations to governmental authorities for investigation, as appropriate, and takes measures to mitigate any potential impact. Protecting intellectual property related to biotechnology is particularly challenging because theft is difficult to detect and biotechnology can be self-replicating. Accordingly, the impact of such theft can be significant.
Failure to effectively manage acquisitions, divestitures, alliances and other portfolio actions could adversely impact DowDuPont's future results.
The Company made certain divestitures, primarily related to its Agriculture segment, in connection with obtaining regulatory approval for the Merger. In addition, the Company from time to time evaluates acquisition candidates that may strategically fit its business and/or growth objectives. If the Company is unable to successfully integrate and develop acquired businesses, the Company could fail to achieve anticipated synergies and cost savings, including any expected increases in revenues and operating results, which could have a material adverse effect on the Company’s financial results. The Company continually reviews its portfolio of assets for contributions to the Company’s objectives and alignment with its growth strategy. However, the Company may not be successful in separating underperforming or non-strategic assets, and gains or losses on the divestiture of, or lost operating income from, such assets may affect the Company’s earnings. Moreover, the Company might incur asset impairment charges related to acquisitions or divestitures that reduce its earnings. In addition, if the execution or implementation of acquisitions, divestitures, alliances, joint ventures and other portfolio actions is not successful, it could adversely impact the Company’s financial condition, cash flows and results of operations.
DowDuPont’s results of operations could be adversely affected by litigation and other commitments and contingencies.
The Company faces risks arising from various unasserted and asserted litigation matters, including, but not limited to, asbestos-related suits, product liability, patent infringement, antitrust claims, governmental regulations, contract and commercial litigation, claims for third party property damage or personal injury stemming from alleged environmental torts, and other actions. The Company has noted a nationwide trend in purported class actions against chemical manufacturers generally seeking relief such as medical monitoring, property damages, off-site remediation and punitive damages arising from alleged environmental torts without claiming present personal injuries. The Company also has noted a trend in public and private suits being filed on behalf of states, counties, cities and utilities alleging harm to the general public and the environment, including waterways and watersheds. An adverse outcome in any one or more of these matters could be material to the Company's financial results.
See Note 16 to the Consolidated Financial Statements for additional information on litigation and other commitments and contingencies faced by the Company.
In the ordinary course of business, the Company may make certain commitments, including representations, warranties and indemnities relating to current and past operations, including those related to divested businesses and issue guarantees of third
28
party obligations. If the Company were required to make payments as a result, they could exceed the amounts accrued, thereby adversely affecting the Company's results of operations.
None.
The Company's corporate headquarters are co-located in Midland, Michigan and Wilmington, Delaware. The Company's manufacturing, processing, marketing and research and development facilities, as well as regional purchasing offices and distribution centers are located throughout the world.
The Company has investments in property, plant and equipment related to global manufacturing operations. Collectively, the Company operates
465
manufacturing sites. The following table includes the number of manufacturing sites by reportable segment and geographic region, including consolidated variable interest entities:
|
Number of Manufacturing Sites at Dec 31, 2017
|
||||||||||||||||||
|
Geographic Region
|
Agri-culture
|
Perf. Materials & Coatings
|
Ind. Interm. & Infrast.
|
Pack. & Spec. Plastics
|
Elect. & Imaging
|
Nutrition & Biosciences
|
Transp. & Adv. Polymers
|
Safety & Const.
|
Total
1
|
|||||||||
|
U.S. & Canada
|
74
|
|
22
|
|
13
|
|
16
|
|
17
|
|
32
|
|
16
|
|
14
|
|
204
|
|
|
EMEA
|
31
|
|
16
|
|
18
|
|
8
|
|
5
|
|
47
|
|
8
|
|
13
|
|
146
|
|
|
Asia Pacific
|
23
|
|
20
|
|
8
|
|
5
|
|
17
|
|
18
|
|
13
|
|
13
|
|
117
|
|
|
Latin America
|
29
|
|
8
|
|
6
|
|
4
|
|
1
|
|
14
|
|
2
|
|
3
|
|
67
|
|
|
Total
|
157
|
|
66
|
|
45
|
|
33
|
|
40
|
|
111
|
|
39
|
|
43
|
|
534
|
|
|
1.
|
Sites that are used by multiple segments are included more than once in the figures above.
|
Properties of DowDuPont include facilities which, in the opinion of management, are suitable and adequate for their use and have sufficient capacity for the Company's current needs and expected near-term growth. All of the Company's plants are owned or leased, subject to certain easements of other persons which, in the opinion of management, do not substantially interfere with the continued use of such properties or materially affect their value. No title examination of the properties has been made for the purpose of this report. Additional information with respect to the Company's property, plant and equipment and leases is contained in Notes
11
and
16
to the Consolidated Financial Statements.
Dow
Asbestos-Related Matters of Union Carbide Corporation
Union Carbide Corporation ("Union Carbide"), a wholly owned subsidiary of Dow, is and has been involved in a large number of asbestos-related suits filed primarily in state courts during the past four decades. These suits principally allege personal injury resulting from exposure to asbestos-containing products and frequently seek both actual and punitive damages. The alleged claims primarily relate to products that Union Carbide sold in the past, alleged exposure to asbestos-containing products located on Union Carbide's premises, and Union Carbide's responsibility for asbestos suits filed against a former Union Carbide subsidiary, Amchem Products, Inc.
For additional information, see Part II, Item 7. Other Matters, Asbestos-Related Matters of Union Carbide Corporation in Management's Discussion and Analysis of Financial Condition and Results of Operations, and Note
16
to the Consolidated Financial Statements.
DuPont
PFOA: Environmental and Litigation Proceedings
For purposes of this report, the term PFOA means collectively perfluorooctanoic acid and its salts, including the ammonium salt and does not distinguish between the two forms. Information related to this matter is included in Note
16
to the Consolidated Financial Statements under the heading PFOA.
29
Fayetteville Works Facility, Fayetteville, North Carolina
In August 2017, the U.S. Attorney’s Office for the Eastern District of North Carolina served DuPont with a subpoena for testimony and the production of documents to a grand jury. In the fourth quarter of 2017, DuPont was served with additional subpoenas relating to the same issue. Information related to this matter is included in Note
16
to the Consolidated Financial Statements under the heading "Fayetteville Works Facility, North Carolina
."
La Porte Plant, La Porte, Texas - Crop Protection - Release Incident Investigations
On November 15, 2014, there was a release of methyl mercaptan at DuPont’s La Porte facility. The release occurred at the site’s Crop Protection unit resulting in four employee fatalities inside the unit. DuPont continues to cooperate with governmental agencies, including the U.S. Environmental Protection Agency ("EPA"), the Chemical Safety Board and the Department of Justice ("DOJ"), still conducting investigations. These investigations could result in sanctions and civil or criminal penalties against DuPont.
Environmental Proceedings
The Company believes it is remote that the following matters will have a material impact on its financial position, liquidity or results of operations. The descriptions are included per Regulation S-K, Item 103(5)(c) of the Securities Exchange Act of 1934.
Dow
Dow Corning Midland Matter
Dow Corning Corporation ("Dow Corning"), a wholly owned subsidiary of Dow, has received the following notifications from the EPA, Region 5 related to Dow Corning’s Midland, Michigan manufacturing facility (the “Facility”): 1) a Notice of Violation and Finding of Violation (received in April 2012) which alleges a number of violations in connection with the detection, monitoring and control of certain organic hazardous air pollutants at the Facility and various recordkeeping and reporting violations under the Clean Air Act and 2) a Notice of Violation (received in May 2015) alleging a number of violations relating to the management of hazardous wastes at the Facility pursuant to the Resource Conservation and Recovery Act. Discussions between the EPA, the DOJ and Dow Corning are ongoing.
FilmTec Edina, Minnesota Matter
On March 14, 2017, FilmTec Corporation ("FilmTec"), a wholly owned subsidiary of Dow, received notification from the EPA, Region 5 and the DOJ of a proposed penalty for alleged violations of the Clean Air Act at FilmTec’s Edina, Minnesota, manufacturing facility. Discussions between the EPA, the DOJ and FilmTec are ongoing.
DuPont
La Porte Plant, La Porte, Texas - EPA Multimedia Inspection
The EPA conducted a multimedia inspection at DuPont's La Porte facility in January 2008. DuPont, EPA and DOJ began discussions in the Fall 2011 relating to the management of certain materials in the facility's waste water treatment system, hazardous waste management, flare and air emissions. These discussions continue.
Sabine Plant, Orange, Texas - EPA Multimedia Inspection
In June 2012, DuPont began discussions with the EPA and DOJ related to a multimedia inspection that the EPA conducted at the Sabine facility in March 2009 and December 2015. The discussions involve the management of materials in the facility's waste water treatment system, hazardous waste management, flare and air emissions, including leak detection and repair. These discussions continue.
Not applicable.
30
|
DowDuPont Inc.
|
||
|
|
||
On December 11, 2015, The Dow Chemical Company ("Dow") and E. I. du Pont de Nemours and Company (“DuPont”) entered into an Agreement and Plan of Merger, as amended on March 31, 2017 (the "Merger Agreement") to effect an all-stock, merger of equals strategic combination resulting in a newly formed corporation named DowDuPont Inc. ("DowDuPont"). On August 31, 2017, pursuant to the terms of the Merger Agreement, Dow and DuPont each merged with subsidiaries of DowDuPont (the "Mergers") and, as a result of the Mergers, became subsidiaries of DowDuPont (collectively, the "Merger"). See Note
3
to the Consolidated Financial Statements for additional information on the Merger.
On August 31, 2017, Dow's common stock, par value
$2.50
per share, and DuPont's common stock, par value
$0.30
per share, were voluntarily delisted from the New York Stock Exchange ("NYSE") in connection with the Merger and were suspended from trading on the NYSE prior to the open of trading on September 1, 2017. DowDuPont's common stock, par value
$0.01
per share, commenced trading on the NYSE (the principal Market for the Company's common stock) under ticker symbol DWDP on September 1, 2017.
Quarterly market price of common stock and dividend information can be found in Note
25
to the Consolidated Financial Statements.
At December 31, 2017, there were 82,913 stockholders of record. At January 31, 2018, there were 84,402 stockholders of record.
While it is not a guarantee of future conduct, Dow and DuPont continuously paid quarterly dividends from 1912 and 1904, respectively, to the period of the Merger. On November 2, 2017, DowDuPont announced that its Board declared a fourth quarter dividend of $0.38 per share, paid on December 15, 2017, to shareholders of record on November 15, 2017.
See Part III, Item 11. Executive Compensation for information relating to the Company’s equity compensation plans.
Issuer Purchases of Equity Securities
The following table provides information regarding purchases of the Company’s common stock by the Company during the three months ended December 31, 2017:
|
Issuer Purchases of Equity Securities
|
Average price paid per share
|
Total number of shares purchased as part of the Company's publicly announced share repurchase
program
1
|
Approximate dollar value of shares that may yet be purchased under the Company's publicly announced share repurchase program
1
(In millions)
|
|||||||
|
Period
|
Total number of shares purchased
|
|||||||||
|
October 2017
|
—
|
|
$
|
—
|
|
—
|
|
$
|
—
|
|
|
November 2017
|
7,518,052
|
|
$
|
70.29
|
|
7,518,052
|
|
$
|
3,472
|
|
|
December 2017
|
6,604,997
|
|
$
|
71.40
|
|
6,604,997
|
|
$
|
3,000
|
|
|
Fourth quarter 2017
|
14,123,049
|
|
$
|
70.81
|
|
14,123,049
|
|
$
|
3,000
|
|
|
1.
|
On November 2, 2017, the Company announced the DowDuPont Board of Directors authorized an initial $4 billion share repurchase program, which has no expiration date.
|
31
|
Selected Financial Data
|
|||||||||||||||
|
In millions, except as noted (Unaudited)
|
2017
1
|
2016
|
2015
|
2014
|
2013
|
||||||||||
|
Summary of Operations
|
|||||||||||||||
|
Net sales
|
$
|
62,484
|
|
$
|
48,158
|
|
$
|
48,778
|
|
$
|
58,167
|
|
$
|
57,080
|
|
|
Income from continuing operations, net of tax
2
|
$
|
1,669
|
|
$
|
4,404
|
|
$
|
7,783
|
|
$
|
3,839
|
|
$
|
4,816
|
|
|
Loss from discontinued operations, net of tax
|
$
|
(77
|
)
|
$
|
—
|
|
$
|
—
|
|
$
|
—
|
|
$
|
—
|
|
|
Per share of common stock (in dollars):
|
|||||||||||||||
|
Earnings per common share from continuing operations - basic
2
|
$
|
0.97
|
|
$
|
3.57
|
|
$
|
6.45
|
|
$
|
2.91
|
|
$
|
3.72
|
|
|
Earnings per common share from continuing operations - diluted
2
|
$
|
0.95
|
|
$
|
3.52
|
|
$
|
6.15
|
|
$
|
2.87
|
|
$
|
3.68
|
|
|
Loss per common share from discontinued operations - basic
|
$
|
(0.05
|
)
|
$
|
—
|
|
$
|
—
|
|
$
|
—
|
|
$
|
—
|
|
|
Loss per common share from discontinued operations - diluted
|
$
|
(0.04
|
)
|
$
|
—
|
|
$
|
—
|
|
$
|
—
|
|
$
|
—
|
|
|
Cash dividends declared per share of common stock
|
$
|
1.76
|
|
$
|
1.84
|
|
$
|
1.72
|
|
$
|
1.53
|
|
$
|
1.28
|
|
|
Book value per share of common stock
|
$
|
43.30
|
|
$
|
21.70
|
|
$
|
23.06
|
|
$
|
19.71
|
|
$
|
22.59
|
|
|
Year-end Financial Position
|
|||||||||||||||
|
Total assets
|
$
|
192,164
|
|
$
|
79,511
|
|
$
|
67,938
|
|
$
|
68,639
|
|
$
|
69,380
|
|
|
Long-term debt
|
$
|
30,056
|
|
$
|
20,456
|
|
$
|
16,215
|
|
$
|
18,741
|
|
$
|
16,732
|
|
|
Financial Ratios
|
|
|
|
|
|
|
|
|
|
|
|||||
|
Research and development expenses as percent of net sales
|
3.4
|
%
|
3.3
|
%
|
3.3
|
%
|
2.8
|
%
|
3.1
|
%
|
|||||
|
Income from continuing operations before income taxes as percent of net sales
2
|
1.9
|
%
|
9.2
|
%
|
20.4
|
%
|
9.1
|
%
|
11.9
|
%
|
|||||
|
Return on stockholders' equity
2
|
1.5
|
%
|
15.3
|
%
|
34.4
|
%
|
18.6
|
%
|
19.4
|
%
|
|||||
|
Debt as a percent of total capitalization
|
25.1
|
%
|
44.0
|
%
|
39.7
|
%
|
45.5
|
%
|
38.9
|
%
|
|||||
|
1.
|
The year ended December 31, 2017, reflects the results of Dow for the entire year and the results of DuPont for the period beginning on and after September 1, 2017. The historical periods solely reflect the results of Dow.
|
|
2.
|
See Notes
1
,
3
,
5
,
7
,
8
,
13
,
16
and
19
to the Consolidated Financial Statements for additional information on items materially impacting the results for the years ended December 31, 2017, 2016 and 2015, including the effects of the U.S. Tax Cuts and Jobs Act, enacted on December 22, 2017; Merger-related amortization of the fair value step-up of inventories; gains on divestitures; charges related to restructuring programs; goodwill impairment and other asset related charges; a charge related to payment of plan obligations to certain participants of a Dow U.S. non-qualified pension plan; and, the impact of a change in accounting policy for asbestos-related defense and processing costs. Results for the year ended December 31, 2013, reflect a $1.6 billion after-tax gain related to the K‑Dow arbitration matter.
|
32
On December 11, 2015, The Dow Chemical Company ("Dow") and E. I. du Pont de Nemours and Company ("DuPont") entered into an Agreement and Plan of Merger ("Merger Agreement"), as amended on March 31, 2017, to effect an all-stock merger of equals strategic combination resulting in a newly formed corporation named DowDuPont Inc. ("DowDuPont" or the "Company"). On August 31, 2017, pursuant to the Merger Agreement, Dow and DuPont each merged with wholly owned subsidiaries of DowDuPont ("Mergers") and, as a result of the Mergers, Dow and DuPont became subsidiaries of DowDuPont (collectively, the "Merger"). Prior to the Merger, DowDuPont did not conduct any business activities other than those required for its formation and matters contemplated by the Merger Agreement. Dow was determined to be the accounting acquirer in the Merger. As a result, the historical financial statements of Dow for the periods prior to the Merger are considered to be the historical financial statements of DowDuPont. The results of DuPont are included in DowDuPont's consolidated results from the Merger date forward. See Note
3
to the Consolidated Financial Statements for additional information.
Except as otherwise indicated by the context, the term "Union Carbide" means Union Carbide Corporation, a wholly owned subsidiary of Dow; and, "Dow Corning" means Dow Corning Corporation, a wholly owned subsidiary of Dow.
Items Affecting Comparability of Financial Results
Due to the size of Dow and DuPont's businesses prior to the Merger, in this section certain supplemental unaudited pro forma financial information is provided that assumes the Merger had been consummated on January 1, 2016. For all periods presented in the unaudited pro forma financial information, adjustments have been made for (1) the preliminary purchase accounting impact, (2) accounting policy alignment, (3) the elimination of the effects of events that are directly attributable to the Merger Agreement (e.g., one-time transaction costs), (4) the elimination of the impact of transactions between Dow and DuPont, and (5) the elimination of the effect of consummated divestitures required as a condition of regulatory approval for the Merger. Events that are not expected to have a continuing impact on the combined results (e.g., inventory step-up costs) are excluded. These adjustments impacted the consolidated results as well as the reportable segments. For additional information, see the Supplemental Unaudited Pro Forma Combined Financial Information in this section.
|
Table of Contents
|
Page
|
33
ABOUT DOWDUPONT INC.
DowDuPont is a holding company comprised of Dow and DuPont with the intent to form strong, independent, publicly traded companies in the agriculture, materials science and specialty products sectors (the "Intended Business Separations") that will lead their respective industries through productive, science-based innovation to meet the needs of customers and help solve global challenges.
In 2017, 37 percent of the Company’s net sales were to customers in the U.S. & Canada; 29 percent were in Europe, Middle East and Africa ("EMEA"); 22 percent were in Asia Pacific; and 12 percent were in Latin America. On a pro forma basis, 39 percent of the Company’s net sales were to customers in the U.S. & Canada; 28 percent were in EMEA; 22 percent were in Asia Pacific; and 11 percent were in Latin America.
In 2017, the Company and its consolidated subsidiaries did not operate in countries subject to U.S. economic sanctions and export controls as imposed by the U.S. State Department or in countries designated by the U.S. State Department as state sponsors of terrorism, including Iran, Sudan and Syria. The Company has policies and procedures in place designed to ensure that it and its consolidated subsidiaries remain in compliance with applicable U.S. laws and regulations.
OVERVIEW
The following is a summary of the results from continuing operations for the year ended December 31, 2017:
|
•
|
The Company reported net sales for 2017 of $62.5 billion, up 30 percent from $48.2 billion in 2016, reflecting broad-based sales growth with increases across all segments and geographic regions. Portfolio actions contributed to 19 percent of the sales increase, including 15 percent from the Merger, impacting all segments except Industrial Intermediates & Infrastructure.
|
|
•
|
Local price was up 6 percent compared with last year, driven primarily by broad-based pricing actions as well as higher feedstock and raw material costs. Local price was mixed by segment as gains in Industrial Intermediates & Infrastructure (up 10 percent) and Performance Materials & Coatings and Packaging & Specialty Plastics (both up 8 percent) more than offset declines in Agriculture and Electronics & Imaging (both down 1 percent). Local price remained flat in Nutrition & Biosciences, Transportation & Advanced Polymers and Safety & Construction. Local price increased in all geographic regions, including a double-digit increase in EMEA (up 10 percent). Currency remained flat with the same period last year.
|
|
•
|
Volume increased 5 percent compared with the same period last year, with increases in all segments except Agriculture, which declined 2 percent. Volume increased in all geographic regions, except Latin America (down 1 percent).
|
|
•
|
Research and development ("R&D") expenses totaled $2,110 million in 2017, up 33 percent from $1,584 million in 2016, primarily due to the Merger.
|
|
•
|
Selling, general and administrative ("SG&A") expenses were $4,021 million in 2017, up 36 percent from $2,956 million in 2016, primarily due to the Merger.
|
|
•
|
Restructuring, goodwill impairment and asset related charges - net was $3,280 in 2017, reflecting post-merger restructuring actions under the DowDuPont Cost Synergy Program which is designed to integrate and optimize the organization following the Merger and in preparation for the Intended Business Separations; a goodwill impairment charge of
$1,491 million
related to the Coatings & Performance Monomers reporting unit and $939 million of pretax impairment charges related to a manufacturing facility in Brazil, other manufacturing assets, surplus facilities and an equity method investment.
|
|
•
|
Integration and separation costs were $1,101 million in 2017, up from $349 million in 2016. Integration and separation costs include costs related to the Merger, post-Merger integration and Intended Business Separation activities and costs related to the ownership restructure of Dow Corning.
|
|
•
|
In the fourth quarter of 2017, the Company recorded a net tax benefit of $1,086 million related to the recognition of the effects of new U.S. tax legislation.
|
|
•
|
On November 2, 2017, DowDuPont announced its Board of Directors declared a fourth quarter dividend of $0.38 per share, which was paid on December 15, 2017, and authorized an initial $4.0 billion share repurchase program. At December 31, 2017, $3.0 billion of the authorization remained available for repurchases. Although there is no timeline to complete the share repurchase program, DowDuPont intends to repurchase approximately $1.0 billion of the Company's stock in the first quarter of 2018.
|
34
Other notable events subsequent to December 31, 2017:
|
•
|
On February 1, 2018, the Company announced it has updated the timing and sequence of the Intended Business Separations: materials science is expected to separate by the end of the first quarter of 2019, and agriculture and specialty products are expected to separate by June 1, 2019.
|
|
•
|
On February 1, 2018, the Company announced it is increasing its cost synergy commitment from $3 billion to $3.3 billion.
|
RESULTS OF OPERATIONS
|
Summary of Sales Results
|
|
||||||||
|
In millions
|
2017
|
2016
|
2015
|
||||||
|
Net sales
|
$
|
62,484
|
|
$
|
48,158
|
|
$
|
48,778
|
|
|
Pro forma net sales
|
$
|
79,535
|
|
$
|
70,894
|
|
|
|
|
|
Sales Variances by Segment and Geographic Region - As Reported
|
||||||||||||||||||||
|
2017
|
2016
|
|||||||||||||||||||
|
Percentage change from prior year
|
Local Price & Product Mix
|
Currency
|
Volume
|
Portfolio & Other
1
|
Total
|
Local Price & Product Mix
|
Currency
|
Volume
|
Portfolio & Other
2
|
Total
|
||||||||||
|
Agriculture
|
(1
|
)%
|
—
|
%
|
(2
|
)%
|
25
|
%
|
22
|
%
|
1
|
%
|
(1
|
)%
|
(2
|
)%
|
—
|
%
|
(2
|
)%
|
|
Performance Materials & Coatings
|
8
|
|
—
|
|
2
|
|
27
|
|
37
|
|
(8
|
)
|
(1
|
)
|
(2
|
)
|
53
|
|
42
|
|
|
Industrial Intermediates & Infrastructure
|
10
|
|
—
|
|
7
|
|
—
|
|
17
|
|
(8
|
)
|
(1
|
)
|
1
|
|
(13
|
)
|
(21
|
)
|
|
Packaging & Specialty Plastics
|
8
|
|
1
|
|
5
|
|
3
|
|
17
|
|
(8
|
)
|
—
|
|
9
|
|
(1
|
)
|
—
|
|
|
Electronics & Imaging
|
(1
|
)
|
—
|
|
9
|
|
37
|
|
45
|
|
(3
|
)
|
—
|
|
3
|
|
16
|
|
16
|
|
|
Nutrition & Biosciences
|
—
|
|
—
|
|
10
|
|
178
|
|
188
|
|
(3
|
)
|
—
|
|
(2
|
)
|
—
|
|
(5
|
)
|
|
Transportation & Advanced Polymers
|
—
|
|
—
|
|
6
|
|
175
|
|
181
|
|
(1
|
)
|
(1
|
)
|
7
|
|
49
|
|
54
|
|
|
Safety & Construction
|
—
|
|
—
|
|
3
|
|
57
|
|
60
|
|
(1
|
)
|
—
|
|
(2
|
)
|
—
|
|
(3
|
)
|
|
Total
|
6
|
%
|
—
|
%
|
5
|
%
|
19
|
%
|
30
|
%
|
(6
|
)%
|
—
|
%
|
3
|
%
|
2
|
%
|
(1
|
)%
|
|
U.S. & Canada
|
6
|
%
|
—
|
%
|
4
|
%
|
16
|
%
|
26
|
%
|
(7
|
)%
|
—
|
%
|
3
|
%
|
2
|
%
|
(2
|
)%
|
|
EMEA
|
10
|
|
1
|
|
5
|
|
16
|
|
32
|
|
(6
|
)
|
(1
|
)
|
4
|
|
(1
|
)
|
(4
|
)
|
|
Asia Pacific
|
4
|
|
—
|
|
7
|
|
27
|
|
38
|
|
(6
|
)
|
—
|
|
6
|
|
9
|
|
9
|
|
|
Latin America
|
2
|
|
—
|
|
(1
|
)
|
18
|
|
19
|
|
(6
|
)
|
—
|
|
—
|
|
(1
|
)
|
(7
|
)
|
|
Total
|
6
|
%
|
—
|
%
|
5
|
%
|
19
|
%
|
30
|
%
|
(6
|
)%
|
—
|
%
|
3
|
%
|
2
|
%
|
(1
|
)%
|
|
1.
|
Portfolio & Other reflects sales related to the Merger (impacts all segments, except Performance Materials & Coatings and Industrial Intermediates & Infrastructure), the acquisition of FMC's Health and Nutrition Business (the "H&N Business"), acquired on November 1, 2017 (impacting Nutrition & Biosciences) and the ownership restructure of Dow Corning announced on June 1, 2016 (impacts Performance Materials & Coatings, Electronics & Imaging and Transportation & Advanced Polymers). Portfolio & Other also reflects the following divestitures: a portion of Dow AgroSciences' Brazil corn seed business ("DAS Divested Ag Business"), divested on November 30, 2017 (impacting Agriculture), global Ethylene Acrylic Acid copolymers and ionomers business ("EAA Business"), divested on September 1, 2017 (impacting Packaging & Specialty Plastics) and SKC Haas Display Films group of companies, divested June 30, 2017 (impacting Electronics & Imaging).
|
|
2.
|
Portfolio & Other reflects sales related to the ownership restructure of Dow Corning and sales from January 1, 2016 through April 30, 2016 for the step acquisition of Univation, acquired on May 5, 2015 (Packaging & Specialty Plastics). Portfolio & Other also reflects the following divestitures: the chlorine value chain, divested on October 5, 2015 (Industrial Intermediates & Infrastructure and Packaging & Specialty Plastics), ANGUS Chemical Company, divested on February 2, 2015 and the global Sodium Borohydride business, divested on January 30, 2015 (both included in Industrial Intermediates & Infrastructure).
|
35
|
Sales Variances by Segment and Geographic Region - As Reported
|
||||||||||
|
2015
|
||||||||||
|
Percentage change from prior year
|
Local Price & Product Mix
|
Currency
|
Volume
|
Portfolio & Other
1
|
Total
|
|||||
|
Agriculture
|
(5
|
)%
|
(4
|
)%
|
(2
|
)%
|
—
|
%
|
(11
|
)%
|
|
Performance Materials & Coatings
|
(14
|
)
|
(5
|
)
|
3
|
|
—
|
|
(16
|
)
|
|
Industrial Intermediates & Infrastructure
|
(10
|
)
|
(5
|
)
|
2
|
|
(6
|
)
|
(19
|
)
|
|
Packaging & Specialty Plastics
|
(18
|
)
|
(5
|
)
|
5
|
|
—
|
|
(18
|
)
|
|
Electronics & Imaging
|
(2
|
)
|
(2
|
)
|
(1
|
)
|
—
|
|
(5
|
)
|
|
Nutrition & Biosciences
|
(1
|
)
|
(5
|
)
|
(4
|
)
|
—
|
|
(10
|
)
|
|
Transportation & Advanced Polymers
|
—
|
|
(7
|
)
|
5
|
|
—
|
|
(2
|
)
|
|
Safety & Construction
|
—
|
|
(5
|
)
|
2
|
|
—
|
|
(3
|
)
|
|
Total
|
(12
|
)%
|
(5
|
)%
|
2
|
%
|
(1
|
)%
|
(16
|
)%
|
|
U.S. & Canada
|
(13
|
)%
|
(1
|
)%
|
2
|
%
|
(2
|
)%
|
(14
|
)%
|
|
EMEA
|
(10
|
)
|
(13
|
)
|
2
|
|
(2
|
)
|
(23
|
)
|
|
Asia Pacific
|
(9
|
)
|
(3
|
)
|
5
|
|
(2
|
)
|
(9
|
)
|
|
Latin America
|
(15
|
)
|
—
|
|
1
|
|
(1
|
)
|
(15
|
)
|
|
Total
|
(12
|
)%
|
(5
|
)%
|
2
|
%
|
(1
|
)%
|
(16
|
)%
|
|
1.
|
Portfolio & Other reflects sales related to the step acquisition of Univation (Packaging & Specialty Plastics) and Cooperativa Central de Pesquisa Agrícola's, acquired on February 1, 2015 (Agriculture). Portfolio & Other also reflects the following divestitures: the chlorine value chain (Industrial Intermediates & Infrastructure and Packaging & Specialty Plastics), ANGUS Chemical Company and the global Sodium Borohydride business (both included in Industrial Intermediates & Infrastructure).
|
2017 versus 2016
The Company reported net sales for 2017 of $62.5 billion, up 30 percent from $48.2 billion for 2016, primarily reflecting the Merger, the addition of Dow Corning’s silicones business, increased selling prices and demand growth. Sales growth was broad-based with increases in all segments and geographic regions. Portfolio & Other changes contributed 19 percent of the sales increase and impacted all segments, except Industrial Intermediates & Infrastructure, which was flat. Local price was up 6 percent compared with the same period last year, with increases in all geographic regions, including a double-digit increase in EMEA (up 10 percent), driven by broad-based pricing actions as well as higher feedstock and raw material prices. Local price increased in Industrial Intermediates & Infrastructure (up 10 percent) and Packaging & Specialty Plastics and Performance Materials & Coatings (both up 8 percent) and declined in Agriculture and Electronics & Imaging (both down 1 percent). Local price was flat in Nutrition & Biosciences, Transportation & Advanced Polymers and Safety & Construction. Volume increased 5 percent compared with the same period last year, with increases in all segments, except Agriculture (down 2 percent), including a double-digit increase in Nutrition & Biosciences (up 10 percent). Volume increased in all geographic regions, except Latin America (down 1 percent). Currency was flat compared with the same period last year.
2016 versus 2015
The Company reported net sales for 2016 of $48.2 billion, down 1 percent from $48.8 billion for 2015. Local price decreased 6 percent compared with the same period last year, with decreases in all segments, except Agriculture (up 1 percent), and all geographic regions, due to lower feedstock and raw material prices and competitive pricing pressures. Volume increased 3 percent compared with the same period last year, as increases in Packaging & Specialty Plastics (up 9 percent), Transportation & Advanced Polymers (up 7 percent), Electronics & Imaging (up 3 percent) and Industrial Intermediates & Infrastructure (up 1 percent) more than offset decreases in Agriculture, Performance Materials & Coatings, Nutrition & Biosciences and Safety & Construction (all down 2 percent). Volume increased in all geographic regions, except Latin America, which remained flat. Portfolio & Other changes contributed 2 percent of the sales increase, primarily reflecting the addition of Dow Corning’s silicones business. See Sales Variances by Segment and Geographic Region table on the previous page for additional information on portfolio changes. Currency was flat compared with the same period last year.
36
|
Sales Variances by Segment and Geographic Region - Pro Forma Basis
|
||||||||||
|
2017
|
||||||||||
|
Percentage change from prior year
|
Local Price & Product Mix
|
Currency
|
Volume
|
Portfolio & Other
1
|
Total
|
|||||
|
Agriculture
|
—
|
%
|
—
|
%
|
1
|
%
|
1
|
%
|
2
|
%
|
|
Performance Materials & Coatings
|
8
|
|
—
|
|
2
|
|
27
|
|
37
|
|
|
Industrial Intermediates & Infrastructure
|
10
|
|
—
|
|
7
|
|
—
|
|
17
|
|
|
Packaging & Specialty Plastics
|
8
|
|
—
|
|
5
|
|
—
|
|
13
|
|
|
Electronics & Imaging
|
(1
|
)
|
—
|
|
11
|
|
2
|
|
12
|
|
|
Nutrition & Biosciences
|
—
|
|
—
|
|
3
|
|
1
|
|
4
|
|
|
Transportation & Advanced Polymers
|
2
|
|
—
|
|
7
|
|
5
|
|
14
|
|
|
Safety & Construction
|
(1
|
)
|
—
|
|
4
|
|
—
|
|
3
|
|
|
Total
|
4
|
%
|
—
|
%
|
5
|
%
|
3
|
%
|
12
|
%
|
|
U.S. & Canada
|
4
|
%
|
—
|
%
|
3
|
%
|
3
|
%
|
10
|
%
|
|
EMEA
|
8
|
|
1
|
|
5
|
|
3
|
|
17
|
|
|
Asia Pacific
|
2
|
|
—
|
|
8
|
|
5
|
|
15
|
|
|
Latin America
|
1
|
|
1
|
|
—
|
|
3
|
|
5
|
|
|
Total
|
4
|
%
|
—
|
%
|
5
|
%
|
3
|
%
|
12
|
%
|
|
1.
|
Pro forma net sales for Agriculture excludes sales related to the November 30, 2017, DAS Divested Ag Business for the period January 1, 2016 through August 31, 2017; sales from September 1, 2017 through November 30, 2017, are included in Portfolio & Other. Pro forma net sales also excludes sales related to the September 1, 2017, divestiture of the EAA Business for the period January 1, 2016 through August 31, 2017. Portfolio & Other includes sales for the acquisition of the H&N Business acquired on November 1, 2017, impacting Nutrition & Biosciences. Portfolio & Other also reflects sales from January 1, 2017 through May 31, 2017, related to the ownership restructure of Dow Corning on June 1, 2016 (impacts Performance Materials & Coatings, Electronics & Imaging and Transportation & Advanced Polymers); the divestitures of SKC Haas Display Films group of companies (divested June 30, 2017) and the authentication business (divested on January 6, 2017), both impacting Electronics & Imaging; and, the divestiture of the global food safety diagnostic business (divested February 28, 2017), impacting Nutrition & Biosciences.
|
2017 versus 2016
The Company reported pro forma net sales for 2017 of $79.5 billion, up 12 percent from $70.9 billion for 2016, primarily reflecting demand growth, increased selling prices and the addition of Dow Corning’s silicones business. Pro forma net sales increased across all segments and geographic regions. Volume increased 5 percent compared with the same period last year, with increases in all segments, including a double-digit increase in Electronics & Imaging (up 11 percent). Volume increased in all geographic regions, except Latin America, which was flat. Local price was up 4 percent compared with the same period last year, with increases in all geographic regions, driven by broad-based pricing actions as well as higher feedstock and raw material prices. Local price increases in Industrial Intermediates & Infrastructure (up 10 percent), Performance Materials & Coatings and Packaging & Specialty Plastics (both up 8 percent) and Transportation & Advanced Polymers (up 2 percent) more than offset declines in Electronics & Imaging and Safety & Construction (both down 1 percent). Local price was flat in Agriculture and Nutrition & Biosciences. Currency was flat compared with the same period last year.
Cost of Sales
Cost of sales was
$50.4 billion
in 2017, up from
$37.6 billion
in 2016. Cost of sales in 2017 was negatively impacted by a $1,469 million charge for the fair value step-up of inventories assumed in the Merger and the acquisition of the H&N Business, related to Agriculture ($424 million), Packaging & Specialty Plastics ($120 million), Electronics & Imaging ($138 million), Nutrition & Biosciences ($403 million), Transportation & Advanced Polymers ($211 million) and Safety & Construction ($173 million); a charge of $888 million related to the payment of plan obligations to certain participants of a Dow U.S. non-qualified pension plan as a result of the Merger (related to Corporate); and $49 million of transaction costs and productivity actions (related to Corporate). Excluding these significant items, cost of sales increased primarily due to the Merger, increased sales volume, higher feedstock, energy and other raw material costs, higher commissioning expenses related to Dow's U.S. Gulf Coast growth projects and the addition of Dow Corning's silicones business. Cost of sales as a percentage of sales was 80.7 percent compared with 78.2 percent in 2016. See Notes
3
and
19
to the Consolidated Financial Statements for additional information.
37
Cost of sales was
$37.6 billion
in 2016, down slightly from
$37.7 billion
in 2015. Cost of sales was negatively impacted by a $317 million charge associated with the fair value step-up of inventories assumed in the ownership restructure of Dow Corning's silicones business, related to Performance Materials & Coatings ($213 million), Electronics & Imaging ($69 million) and Transportation & Advanced Polymers ($35 million); a $295 million charge for environmental matters, related to Agriculture ($2 million), Industrial Intermediates & Infrastructure ($1 million), Packaging & Specialty Plastics ($2 million) and Corporate ($290 million); $123 million of transaction costs and productivity actions (related to Corporate); and a $117 million charge for the termination of a terminal use agreement (related to Packaging & Specialty Plastics). Excluding these significant items, cost of sales decreased compared with 2015 as lower feedstock, energy and other raw material costs and cost cutting and productivity initiatives more than offset increased sales volume and the addition of Dow Corning's silicones business. Cost of sales in 2015 was impacted by $12 million loss for the fair value step-up of inventories assumed in the step acquisition of UnivationTechnologies, LLC ("Univation") (related to Packaging & Specialty Plastics). Cost of sales as a percentage of sales was 78.2 percent in 2016 compared with 77.4 percent in 2015. See Notes
3
and
16
to the Consolidated Financial Statements for additional information.
Research and Development Expenses
Research and development expenses were
$2,110 million
in
2017
, compared with
$1,584 million
in
2016
and
$1,598 million
in
2015
. In 2017, R&D expenses increased compared with 2016, primarily due to the Merger. In 2016, R&D expenses decreased slightly compared with 2015, as increased costs from the addition of Dow Corning's silicones business were more than offset by decreased spending due to divestitures and cost reduction initiatives as well as lower performance-based compensation costs. R&D expenses as a percentage of net sales were 3.4 percent, 3.3 percent and 3.3 percent for 2017, 2016 and 2015, respectively.
Selling, General and Administrative Expenses
Selling, general and administrative expenses were
$4,021 million
in
2017
, compared with
$2,956 million
in
2016
and
$2,948 million
in
2015
. SG&A expenses in 2017 increased compared with 2016, primarily due to the Merger.
SG&A expenses were essentially flat in 2016 compared with 2015, as increased costs from the addition of Dow Corning's silicones business were nearly offset by decreased spending due to divestitures and cost reduction initiatives as well as lower performance-based compensation costs. SG&A expenses as a percentage of net sales were 6.4 percent, 6.1 percent and 6.0 percent for 2017, 2016 and 2015, respectively.
Amortization of Intangibles
Amortization of intangibles was
$1,013 million
in
2017
,
$544 million
in
2016
and
$419 million
in
2015
. The increase in amortization in 2017 was primarily due to an increase in intangible assets as a result of the Merger and the addition of Dow Corning's silicones business. The increase in amortization in 2016 was primarily due to an increase in intangible assets as a result of the addition of Dow Corning's silicones business. See Notes
3
and
13
to the Consolidated Financial Statements for additional information on intangible assets.
Restructuring, Goodwill Impairment and Asset Related Charges - net
DowDuPont Cost Synergy Program
In September and November 2017, DowDuPont approved post-merger restructuring actions under the DowDuPont Cost Synergy Program (the “Synergy Program”), adopted by the DowDuPont Board of Directors. The plan is designed to integrate and optimize the organization following the Merger and in preparation for the Intended Business Separations. Based on all actions approved to date under the Synergy Program, the Company expects to record total pretax restructuring charges of approximately
$2 billion
, comprised of approximately
$845 million
to
$935 million
of severance and related benefit costs;
$400 million
to
$540 million
of asset write-downs and write-offs, and
$400 million
to
$450 million
of costs associated with exit and disposal activities. The Synergy Program includes certain asset actions, including strategic decisions regarding the cellulosic biofuel unit reflected in the preliminary fair value measurement of DuPont’s assets as of the merger date. Current estimated total pretax restructuring charges could be impacted by future adjustments to the preliminary fair value of DuPont’s assets.
As a result of these actions, the Company recorded pretax restructuring charges of
$874 million
in 2017, consisting of severance and related benefit costs of
$510 million
, asset write-downs and write-offs of
$290 million
and costs associated with exit and disposal activities of
$74 million
. The restructuring charges by segment are as follows: $134 million in Agriculture, $11 million in Performance Materials & Coatings, $12 million in Industrial Intermediates & Infrastructure, $36 million in Packaging & Specialty Plastics, $86 million in Electronics & Imaging, $1 million in Nutrition & Biosciences, $2 million in Transportation & Advanced Polymers, $21 million in Safety & Construction and $571 million in Corporate. The Company expects to record the remaining restructuring charges over the next two years and expects the Synergy Program to be substantially completed by the end of 2019.
Dow 2016 Restructuring Plan
On June 27, 2016, Dow's Board of Directors ("Board") approved a restructuring plan that incorporated actions related to the ownership restructure of Dow Corning. These actions, aligned with Dow's value growth and synergy targets, will result in a global workforce reduction of approximately
2,500
positions, with most of these positions resulting from synergies related to the
38
ownership restructure of Dow Corning. These actions are expected to be substantially completed by June 30, 2018. As a result of these actions, Dow recorded pretax restructuring charges of
$449 million
in the second quarter of 2016, consisting of severance and related benefit costs of
$268 million
, asset write-downs and write-offs of
$153 million
and costs associated with exit and disposal activities of
$28 million
and related to the Company's segment results as follows: $42 million in Performance Materials & Coatings, $83 million in Industrial Intermediates & Infrastructure, $10 million in Packaging & Specialty Plastics and $314 million in Corporate.
In 2017, Dow recorded a favorable adjustment to the 2016 restructuring charge related to costs associated with exit and disposal activities of $7 million, related to Performance Materials & Coatings.
Dow 2015 Restructuring Plan
On April 29, 2015, Dow's Board approved actions to further streamline the organization and optimize Dow’s footprint as a result of the separation of a significant portion of Dow’s chlorine value chain. These actions, which further accelerated Dow’s value growth and productivity targets, resulted in a reduction of approximately
1,750
positions across a number of businesses and functions and adjustments to Dow's asset footprint to enhance competitiveness. As a result of these actions, Dow recorded pretax restructuring charges of
$375 million
in the second quarter of 2015 consisting of severance and related benefit costs of
$196 million
, asset write-downs and write-offs of
$169 million
and costs associated with exit and disposal activities of
$10 million
. In the fourth quarter of 2015, Dow recorded restructuring charge adjustments of
$40 million
, including severance and related benefit costs of
$39 million
for the separation of approximately
500
additional positions as part of Dow's efforts to further streamline the organization, and
$1 million
of costs associated with exit and disposal activities. The impact of these charges were related to the Company's segment results as follows: $15 million in Agriculture, $10 million in Performance Materials & Coatings, $12 million in Packaging & Specialty Plastics, $51 million in Electronics & Imaging, $16 million in Nutrition & Biosciences, $17 million in Safety & Construction and $294 million in Corporate. These actions were substantially completed at June 30, 2017.
In 2016, Dow recorded an unfavorable adjustment to the 2015 restructuring charge for additional accruals for costs associated with exit and disposal activities of $6 million and a favorable adjustment of $3 million for asset write-downs and write-offs. The net charge was included in in the Company's segment results as follows: Agriculture ($5 million charge), Nutrition & Biosciences ($1 million charge) and Safety & Construction ($3 million gain).
In 2017, the Company recorded favorable adjustments to the 2015 restructuring charge of $9 million for severance and related benefit costs, impacting Corporate, and $1 million for costs associated with exit and disposal activities related to Agriculture. See Note
5
to the Consolidated Financial Statements for details on the Company's restructuring activities.
Goodwill Impairment
Upon completion of the goodwill impairment testing in the fourth quarter of 2017, the Company determined the fair value of the Coatings & Performance Monomers reporting unit was lower than its carrying amount. As a result, the Company recorded an impairment charge of
$1,491 million
in the fourth quarter of 2017, related to Performance Materials & Coatings. See Note
13
to the Consolidated Financial Statements for additional information on the impairment charge.
Asset Related Charges
2017 Charges
In 2017, the Company recognized a
$622 million
pretax impairment charge related to a biopolymers manufacturing facility in Santa Vitoria, Minas Gerais, Brazil. Dow determined it will not pursue an expansion of the facility’s ethanol mill into downstream derivative products, primarily as a result of cheaper ethane-based production as well as Dow’s new assets coming online in the U.S. Gulf Coast which can be used to meet growing market demands in Brazil. As a result of this decision, cash flow analysis indicated the carrying amount of the impacted assets was not recoverable. The impairment charge was related to Packaging & Specialty Plastics.
The Company also recognized other pretax impairment charges of
$317 million
in the fourth quarter of 2017, including charges related to manufacturing assets of
$230 million
, an equity method investment of
$81 million
and other assets of
$6 million
. The impairment charges were related to Performance Materials & Coatings (
$82 million
), Industrial Intermediates & Infrastructure (
$6 million
), Packaging & Specialty Plastics (
$57 million
), Electronics & Imaging (
$39 million
), Safety & Construction (
$32 million
) and Corporate (
$101 million
). See Notes
5
,
22
and
23
to the Consolidated Financial Statements for additional information.
2016 Charges
In 2016, Dow recognized a
$143 million
pretax impairment charge related to its equity interest in AgroFresh Solutions, Inc. ("AFSI") due to a decline in the market value of AFSI. The impairment charge impacted Corporate. See Notes
4
,
5
,
12
,
22
and
23
to the Consolidated Financial Statements for additional information.
39
2015 Charges
As a result of Dow’s continued actions to optimize its footprint, Dow recognized an impairment charge of
$144 million
in 2015, related to manufacturing assets and facilities and an equity method investment. The impairment charge related to Performance Materials & Coatings (
$71 million
), Packaging & Specialty Plastics (
$57 million
) and Safety & Construction (
$16 million
). See Notes
5
and
22
to the Consolidated Financial Statements for additional information.
Integration and Separation Costs
Integration and separation costs, which reflect costs related to the Merger, post-Merger integration and Intended Business Separation activities and costs related to the ownership restructure of Dow Corning, were
$1,101 million
in
2017
,
$349 million
in
2016
and
$23 million
in
2015
, and were related to Corporate.
Asbestos-Related Charge
In 2016, Dow and Union Carbide Corporation elected to change the method of accounting for asbestos-related defense and processing costs from expensing as incurred to estimating and accruing a liability. As a result of this accounting policy change, Union Carbide recorded a pretax charge of
$1,009 million
for asbestos-related defense costs through the terminal year of 2049. Union Carbide also recorded a pretax charge of
$104 million
to increase the asbestos-related liability for pending and future claims through the terminal year of 2049. These charges were related to Corporate. See Notes
1
and
16
to the Consolidated Financial Statements for additional information on asbestos-related matters.
Equity in Earnings of Nonconsolidated Affiliates
DowDuPont’s share of the earnings of nonconsolidated affiliates in 2017 was
$764 million
, compared with
$442 million
in 2016 and
$674 million
in 2015. In 2017, equity earnings increased as lower equity losses from Sadara Chemical Company ("Sadara") and higher equity earnings from The Kuwait Olefins Company K.S.C. ("TKOC"), EQUATE Petrochemical Company K.S.C. ("EQUATE") and the HSC Group, which included settlements with a customer related to long-term polysilicon sales agreements, were partially offset by the impact of the Dow Corning ownership restructure and lower equity earnings from The SCG-Dow Group and Map Ta Phut Olefins Company Limited.
In 2016, equity earnings declined due to higher equity losses from Sadara related to start-up expenses, lower equity earnings from the Kuwait joint ventures due to lower monoethylene glycol prices and a reduction in the ownership of MEGlobal (now part of EQUATE), and the impact of the Dow Corning ownership restructure. Equity earnings also declined due to a charge of $22 million for a loss on early redemption of debt incurred by Dow Corning and related to Performance Materials & Coatings ($15 million), Electronics & Imaging ($5 million) and Transportation & Advanced Polymers ($2 million).
These declines were partia
lly offset by higher earnings from the HSC Group, The SCG-Dow Group a
nd Map Ta Phut Olefins Company Limited.
Equity earnings in 2015 were impacted by a $29 million charge related to AFSI's fair value step-up of its inventories and start-up costs (related to Corporate); a loss recognized by Sadara related to the write-off of design engineering work for an epoxy plant, of which the Company's share was $27 million (related to Corporate); and a pretax gain of $20 million related to a reduction in Dow Corning's implant liability (related to Performance Materials & Coatings). See Note
12
to the Consolidated Financial Statements for additional information on nonconsolidated affiliates.
Sundry Income (Expense) - Net
Sundry income (expense) – net includes a variety of income and expense items such as the gain or loss on foreign currency exchange, interest income, dividends from investments, gains and losses on sales of investments and assets and litigation. Sundry income (expense) - net for 2017 was income of
$966 million
, compared with income of
$1,452 million
in 2016 and income of
$4,716 million
in 2015.
In 2017, sundry income (expense) - net included a $635 million gain on the divestiture of the DAS Divested Ag Business (related to Agriculture), a $227 million gain on the divestiture of Dow's EAA Business (related to Packaging & Specialty Plastics), a $137 million gain related to Dow's patent infringement matter with Nova Chemical Corporation (related to Packaging & Specialty Plastics), a $7 million gain for post-closing adjustments on the split-off of Dow's chlorine value chain (related to Corporate), gains on sales of other assets and investments and interest income. These gains more than offset a loss of $469 million related to Dow AgroSciences' arbitration matter with Bayer CropScience (related to Agriculture) and foreign currency exchange losses. See Notes
4
,
6
,
7
and
16
to the Consolidated Financial Statements for additional information.
In 2016, sundry income (expense) - net included a $2,445 million gain on the Dow Corning ownership restructure (related to Performance Materials & Coatings ($1,617 million), Electronics & Imaging ($512 million) and Transportation & Advanced Polymers ($316 million)), a $6 million gain for post-closing adjustments on the split-off of Dow's chlorine value chain (related to Industrial Intermediates &Infrastructure), gains on sales of assets and investments, and interest income. These gains more than offset a $1,235 million loss related to Dow's settlement of the urethane matters class action lawsuit and the opt-out cases litigation (related to Industrial Intermediates & Infrastructure), $41 million of transaction costs and productivity actions (related to Corporate),
40
losses on divestitures and foreign currency exchange losses. See Notes
3
,
4
,
6
,
7
,
12
and
16
to the Consolidated Financial Statements for additional information.
In 2015, sundry income (expense) - net included a $2,233 million gain on the split-off of Dow's chlorine value chain (related to Industrial Intermediates & Infrastructure (gain of $1,984 million), Packaging & Specialty Plastics (gain of $317 million) and Corporate (loss of $68 million)), a $723 million gain on the sale of Dow's ownership interest in MEGlobal (related to Industrial Intermediates & Infrastructure), a $682 million gain on the divestiture of ANGUS Chemical Company (related to Industrial Intermediates & Infrastructure), a $20 million gain on the divestiture of Dow's global Sodium Borohydride business (related to Industrial Intermediates & Infrastructure), a $618 million gain on the divestiture of Dow's AgroFresh business (net of an $8 million loss for mark-to-market adjustments on the fair value of warrants receivable and related to Corporate), a $361 million gain on the Univation step acquisition (related to Packaging & Specialty Plastics), gains on sales of assets and investments and interest income. These gains more than offset foreign currency exchange losses, including a $98 million loss related to the impact of the Argentine peso devaluation (related to Corporate), and $119 million of transaction costs and productivity actions (related to Corporate). See Notes
3
,
4
,
6
,
7
,
12
,
15
and
22
to the Consolidated Financial Statements for additional information.
Interest expense and amortization of debt discount was
$1,082 million
in 2017,
$858 million
in 2016 and
$946 million
in 2015. The increase in 2017 was primarily related to the Merger and the effect of the long-term debt assumed in the Dow Corning ownership restructure. The decrease in 2016 was primarily due to the impact of approximately $2.5 billion of debt retired in 2015. See Liquidity and Capital Resources in Management's Discussion and Analysis of Financial Condition and Results of Operations and Note
15
to the Consolidated Financial Statements for additional information related to debt financing activity.
Provision (Credit) for Income Taxes on Continuing Operations
The Company's effective tax rate fluctuates based on, among other factors, where income is earned, reinvestment assertions regarding foreign income and the level of income relative to tax credits available. The Company's tax rate is also influenced by the level of equity earnings, since most of the earnings from the Company's equity method investments are taxed at the joint venture level. The underlying factors affecting the Company's overall tax rate are summarized in Note
8
to the Consolidated Financial Statements.
On December 22, 2017, the Tax Cuts and Jobs Act (“The Act”) was enacted. The Act reduces the U.S. federal corporate income tax rate from 35 percent to 21 percent, requires companies to pay a one-time transition tax on earnings of foreign subsidiaries that were previously deferred, creates new provisions related to foreign sourced earnings, eliminates the domestic manufacturing deduction and moves to a territorial system. At December 31, 2017, the Company had not completed its accounting for the tax effects of The Act; however, the Company made a reasonable estimate of the effects on its existing deferred tax balances, which resulted in a provisional benefit of $2,666 million to "Provision (Credit) for income taxes on continuing operations," and the one-time transition tax, which resulted in a provisional charge of $1,580 million to "Provision (Credit) for income taxes on continuing operations." The Company expects that it will have sufficient foreign tax credits available to offset the tax liability associated with the one-time transition tax. See Note
8
to the Consolidated Financial Statements for additional information.
The "Provision (Credit) for income taxes on continuing operations" was a benefit of $476 million in 2017, and a charge of $9 million in 2016 and $2,147 million in 2015. The tax rate for 2017 was favorably impacted by a provisional net benefit of $1,086 million that the Company recognized due to the enactment of The Act, as well as the geographic mix of earnings. In addition, the tax rate was favorably impacted by the adoption of Accounting Standards Update ("ASU") 2016-09, "Compensation - Stock Compensation (Topic 718): Improvements to Employee Share-Based Payment Accounting," which resulted in the recognition of excess tax benefits related to equity compensation in the provision for income taxes. These impacts were partially offset by a goodwill impairment recognized in the fourth quarter for which there was no corresponding tax deduction, amortization of the fair value step-up of DuPont’s inventories as a result of the Merger and certain net foreign currency exchange losses recognized on the remeasurement of the net monetary asset positions which were not tax deductible in their local jurisdictions. These factors resulted in a negative tax rate of 39.9 percent for 2017.
The tax rate for Dow in
2016
was favorably impacted by the non-taxable gain on the ownership restructure of Dow Corning's silicones business and a tax benefit on the reassessment of a deferred tax liability related to the basis difference in Dow’s investment in Dow Corning. The tax rate was also favorably impacted by the geographic mix of earnings, the availability of foreign tax credits and the deductibility of the urethane matters class action lawsuit and opt-out cases settlements and the asbestos-related charge. A reduction in equity earnings and non-deductible transaction costs and productivity actions unfavorably impacted the tax rate. These factors resulted in an effective tax rate of
0.2 percent
for
2016
.
The tax rate for Dow in
2015
was favorably impacted by portfolio actions, specifically the tax-efficient split-off of Dow's chlorine value chain, the non-taxable gain from the Univation step acquisition, and the sale of Dow's ownership interest in MEGlobal. The
41
geographic mix of earnings favorably impacted the tax rate with the gain from the ANGUS Chemical Company divestiture and continued profitability improvement in Europe and Asia Pacific providing most of the benefit. The tax rate was unfavorably impacted by foreign subsidiaries repatriating cash to the United States which was primarily derived from divestiture proceeds. Reduced equity earnings and continued increases in statutory income in Latin America and Canada due to local currency devaluations also unfavorably impacted the tax rate. These factors resulted in an effective tax rate of
21.6 percent
for
2015
.
Loss from Discontinued Operations, Net of Tax
Loss from discontinued operations, net of tax was $77 million in
2017
and is related to certain DuPont assets divested as a condition of the regulatory approval of the Merger. See Note
4
to the Consolidated Financial Statements for additional information.
Net Income Attributable to Noncontrolling Interests
Net income attributable to noncontrolling interests was
$132 million
in 2017,
$86 million
in 2016 and
$98 million
in 2015. Net income attributable to noncontrolling interests increased in 2017 compared with 2016, primarily due to higher earnings from Dow Corning's consolidated joint ventures and improved results from a cogeneration facility in Brazil. Net income attributable to noncontrolling interests decreased in 2016 compared with 2015, primarily due to losses incurred by a cogeneration facility in Brazil, which more than offset the addition of earnings from Dow Corning's consolidated joint ventures. In addition, 2015 was also impacted by noncontrolling interests' portion of the 2015 restructuring charge. See Notes
5
,
18
and
23
to the Consolidated Financial Statements for additional information.
Dow Cumulative Convertible Preferred Stock Dividends
On December 30, 2016, Dow converted all outstanding shares of its Cumulative Convertible Perpetual Preferred Stock, Series A ("Dow Preferred Stock") into shares of Dow's common stock. As a result of this conversion, no shares of Dow Preferred Stock are issued or outstanding. On January 6, 2017, Dow filed an amendment to its Restated Certificate of Incorporation by way of a certificate of elimination with the Secretary of State of Delaware eliminating this series of preferred stock. Dow Preferred Stock dividends of $340 million were recognized in 2016 and 2015. See Note
17
to the Consolidated Financial Statements for additional information.
Net Income Available for DowDuPont Inc. Common Stockholders
Net income available for common stockholders was
$1,460 million
(
$0.91
per share) in 2017, compared with
$3,978 million
(
$3.52
per share) in 2016 and
$7,345 million
(
$6.15
per share) in 2015. See Note
9
to the Consolidated Financial Statements for details on the Company's earnings per share calculations.
SUPPLEMENTAL UNAUDITED PRO FORMA COMBINED FINANCIAL INFORMATION
The following supplemental unaudited pro forma combined statements of income (the "unaudited pro forma income statements") for DowDuPont are presented to illustrate the estimated effects of the Merger, assuming that the Merger had been consummated on January 1, 2016. For the periods presented below, activity prior to August 31, 2017 (the “Merger Date”) was prepared on a pro forma basis (the “unaudited pro forma information”) and activity after the Merger Date was prepared on a combined basis under accounting principles generally accepted in the United States of America (“U.S. GAAP”). The unaudited pro forma information was prepared in accordance with Article 11 of Regulation S-X. Pro forma adjustments have been made for (1) the preliminary purchase accounting impact, (2) accounting policy alignment, (3) the elimination of the effect of events that are directly attributable to the Merger Agreement (e.g., one-time transaction costs), (4) the elimination of the impact of transactions between Dow and DuPont, and (5) the elimination of the effect of consummated divestitures agreed to with certain regulatory agencies as a condition of approval for the Merger. Events that are not expected to have a continuing impact on the combined results (e.g., inventory step‑up costs) are excluded from the unaudited pro forma information. The unaudited pro forma information for activity prior to the Merger date does not reflect restructuring or integration activities or other costs following the Merger that may be incurred to achieve cost or growth synergies of DowDuPont. The unaudited pro forma income statements provide shareholders with summary financial information and historical data that is on a basis consistent with how DowDuPont reports current financial information.
The Merger was accounted for under Accounting Standards Codification ("ASC") Topic 805, "Business Combinations" ("ASC 805"), under which Dow was designated as the accounting acquirer in the Merger for accounting purposes. Under ASC 805, Dow accounted for the transaction by using Dow historical financial information and accounting policies and adding the assets and liabilities of DuPont as of the Merger Date at their respective fair values. The assets and liabilities of DuPont were measured based on various preliminary estimates at the Merger Date using assumptions that DowDuPont believes are reasonable based on information that was currently available. The fair value estimates reflected in the unaudited pro forma information are based on those used in the Current Report on Form 8-K/A filed with the SEC on October 26, 2017, and subsequent measurement period adjustments are not reflected. DowDuPont intends to complete and finalize the allocation of consideration as soon as practicable within the measurement period in accordance with ASC 805, but no later than one year following the closing date of the Merger.
42
Differences between these preliminary estimates and the final acquisition accounting may occur and these differences could have a material impact on the accompanying unaudited pro forma income statements and DowDuPont’s future results of operations.
The unaudited pro forma information was prepared in accordance with Article 11 of Regulation S-X which is a different basis than the unaudited pro forma information presented in Note
3
to the Consolidated Financial Statements, which was prepared in accordance with the requirements of ASC 805.
The unaudited pro forma income statements have been presented for informational purposes only and are not necessarily indicative of what DowDuPont’s results of operations actually would have been had the Merger been completed on January 1, 2016. In addition, the unaudited pro forma income statements do not purport to project the future operating results of the Company. The unaudited pro forma income statements were based on and should be read in conjunction with the separate historical financial statements and accompanying notes contained in each of the Dow and DuPont Annual Reports on Form 10-K for the applicable periods. See Notes
1
and
3
to the Consolidated Financial Statements for additional information.
|
Unaudited Pro Forma Combined Statements of Income
|
Year Ended
|
|||||
|
In millions, except per share amounts
|
Dec 31, 2017
|
Dec 31, 2016
|
||||
|
Net sales
|
$
|
79,535
|
|
$
|
70,894
|
|
|
Cost of sales
|
60,960
|
|
51,996
|
|
||
|
Research and development expenses
|
3,157
|
|
3,061
|
|
||
|
Selling, general and administrative expenses
|
6,776
|
|
6,701
|
|
||
|
Amortization of intangibles
|
1,743
|
|
1,624
|
|
||
|
Restructuring, goodwill impairment and asset related charges - net
|
3,593
|
|
1,151
|
|
||
|
Integration and separation costs
|
1,499
|
|
476
|
|
||
|
Asbestos-related charge
|
—
|
|
1,113
|
|
||
|
Equity in earnings of nonconsolidated affiliates
|
804
|
|
516
|
|
||
|
Sundry income (expense) - net
|
955
|
|
1,903
|
|
||
|
Interest expense and amortization of debt discount
|
1,256
|
|
1,108
|
|
||
|
Income from continuing operations before income taxes
|
2,310
|
|
6,083
|
|
||
|
Provision (Credit) for income taxes on continuing operations
|
(602
|
)
|
288
|
|
||
|
Income from continuing operations, net of tax
|
2,912
|
|
5,795
|
|
||
|
Net income attributable to noncontrolling interests
|
159
|
|
108
|
|
||
|
Net income from continuing operations attributable to DowDuPont Inc.
|
2,753
|
|
5,687
|
|
||
|
Preferred stock dividends
|
—
|
|
340
|
|
||
|
Net income from continuing operations available for DowDuPont Inc. common stockholders
|
$
|
2,753
|
|
$
|
5,347
|
|
|
Per common share data:
|
||||||
|
Earnings per common share from continuing operations - basic
|
$
|
1.18
|
|
$
|
2.40
|
|
|
Earnings per common share from continuing operations - diluted
|
$
|
1.17
|
|
$
|
2.37
|
|
|
Weighted-average common shares outstanding - basic
|
2,323.9
|
|
2,221.3
|
|
||
|
Weighted-average common shares outstanding - diluted
|
2,346.1
|
|
2,242.1
|
|
||
43
|
Unaudited Pro Forma Combined
Statement of Income
|
Year Ended Dec 31, 2017
|
|||||||||||||||||
|
Adjustments
|
||||||||||||||||||
|
In millions, except per share amounts
|
DWDP
1
|
Historical DuPont
2
|
Reclass
3
|
Divestitures
4
|
Pro Forma
5
|
Pro Forma
|
||||||||||||
|
Net sales
|
$
|
62,484
|
|
$
|
18,349
|
|
$
|
84
|
|
$
|
(1,219
|
)
|
$
|
(163
|
)
|
$
|
79,535
|
|
|
Cost of sales
|
50,414
|
|
10,617
|
|
387
|
|
(523
|
)
|
65
|
|
60,960
|
|
||||||
|
Other operating charges
|
—
|
|
521
|
|
(521
|
)
|
—
|
|
—
|
|
—
|
|
||||||
|
Research and development expenses
|
2,110
|
|
1,159
|
|
(27
|
)
|
(104
|
)
|
19
|
|
3,157
|
|
||||||
|
Selling, general and administrative expenses
|
4,021
|
|
3,452
|
|
(583
|
)
|
(143
|
)
|
29
|
|
6,776
|
|
||||||
|
Other (loss) income, net
|
—
|
|
173
|
|
(173
|
)
|
—
|
|
—
|
|
—
|
|
||||||
|
Amortization of intangibles
|
1,013
|
|
—
|
|
139
|
|
—
|
|
591
|
|
1,743
|
|
||||||
|
Restructuring, goodwill impairment and asset related charges - net
|
3,280
|
|
323
|
|
—
|
|
—
|
|
(10
|
)
|
3,593
|
|
||||||
|
Integration and separation costs
|
1,101
|
|
—
|
|
605
|
|
(24
|
)
|
(183
|
)
|
1,499
|
|
||||||
|
Equity in earnings of nonconsolidated affiliates
|
764
|
|
—
|
|
55
|
|
—
|
|
(15
|
)
|
804
|
|
||||||
|
Sundry income (expense) - net
|
966
|
|
—
|
|
1
|
|
(12
|
)
|
—
|
|
955
|
|
||||||
|
Interest expense and amortization of debt discount
|
1,082
|
|
254
|
|
—
|
|
—
|
|
(80
|
)
|
1,256
|
|
||||||
|
Income from continuing operations before income taxes
|
1,193
|
|
2,196
|
|
(33
|
)
|
(437
|
)
|
(609
|
)
|
2,310
|
|
||||||
|
Provision (Credit) for income taxes on continuing operations
|
(476
|
)
|
228
|
|
(33
|
)
|
(88
|
)
|
(233
|
)
|
(602
|
)
|
||||||
|
Income from continuing operations, net of tax
|
1,669
|
|
1,968
|
|
—
|
|
(349
|
)
|
(376
|
)
|
2,912
|
|
||||||
|
Net income attributable to noncontrolling interests
|
132
|
|
20
|
|
—
|
|
—
|
|
7
|
|
159
|
|
||||||
|
Net income from continuing operations attributable to DowDuPont Inc.
|
1,537
|
|
1,948
|
|
—
|
|
(349
|
)
|
(383
|
)
|
2,753
|
|
||||||
|
Preferred stock dividends
|
—
|
|
7
|
|
—
|
|
—
|
|
(7
|
)
|
—
|
|
||||||
|
Net income from continuing operations available for DowDuPont Inc. common stockholders
|
$
|
1,537
|
|
$
|
1,941
|
|
$
|
—
|
|
$
|
(349
|
)
|
$
|
(376
|
)
|
$
|
2,753
|
|
|
Per common share data:
|
||||||||||||||||||
|
Earnings per common share from continuing operations - basic
|
$
|
1.18
|
|
|||||||||||||||
|
Earnings per common share from continuing operations - diluted
|
$
|
1.17
|
|
|||||||||||||||
|
Weighted-average common shares outstanding - basic
|
2,323.9
|
|
||||||||||||||||
|
Weighted-average common shares outstanding - diluted
|
2,346.1
|
|
||||||||||||||||
|
1.
|
See the U.S. GAAP consolidated statements of income.
|
|
2.
|
Reflects DuPont activity for the period from January 1, 2017 to August 31, 2017.
|
|
3.
|
Certain reclassifications were made to conform with the presentation used for DowDuPont.
|
|
4.
|
Includes the following divestitures agreed to with certain regulatory agencies as a condition of approval for the Merger: Dow’s EAA Business (for the period of January 1, 2017 through the September 1, 2017 divestiture); the DAS Divested Ag Business (for the period of January 1, 2017 through August 31, 2017); and DuPont’s cereal broadleaf herbicides and chewing insecticides portfolio as well as its crop protection research and development pipeline and organization (for the period of January 1, 2017 through August 31, 2017; activity from September 1, 2017 through the November 1, 2017 divestiture was treated as discontinued operations).
|
|
5.
|
Certain pro forma adjustments were made to illustrate the estimated effects of the Merger, assuming that the Merger had been consummated on January 1, 2016. Refer to
Summary of Pro Forma Adjustments
at the end of this section for additional details.
|
44
|
Unaudited Pro Forma Combined
Statement of Income
|
Year Ended Dec 31, 2016
|
|||||||||||||||||
|
Adjustments
|
||||||||||||||||||
|
In millions, except per share amounts
|
Historical Dow
1
|
Historical DuPont
2
|
Reclass
3
|
Divestitures
4
|
Pro Forma
5
|
Pro Forma
|
||||||||||||
|
Net sales
|
$
|
48,158
|
|
$
|
24,594
|
|
$
|
170
|
|
$
|
(1,812
|
)
|
$
|
(216
|
)
|
$
|
70,894
|
|
|
Cost of sales
|
37,641
|
|
14,469
|
|
559
|
|
(783
|
)
|
110
|
|
51,996
|
|
||||||
|
Other operating charges
|
—
|
|
686
|
|
(686
|
)
|
—
|
|
—
|
|
—
|
|
||||||
|
Research and development expenses
|
1,584
|
|
1,641
|
|
(40
|
)
|
(153
|
)
|
29
|
|
3,061
|
|
||||||
|
Selling, general and administrative expenses
|
3,304
|
|
4,319
|
|
(762
|
)
|
(203
|
)
|
43
|
|
6,701
|
|
||||||
|
Other (loss) income, net
|
—
|
|
708
|
|
(708
|
)
|
—
|
|
—
|
|
—
|
|
||||||
|
Amortization of intangibles
|
544
|
|
—
|
|
194
|
|
—
|
|
886
|
|
1,624
|
|
||||||
|
Restructuring, goodwill impairment and asset related charges - net
|
452
|
|
552
|
|
143
|
|
4
|
|
—
|
|
1,151
|
|
||||||
|
Integration and separation costs
|
—
|
|
—
|
|
735
|
|
—
|
|
(259
|
)
|
476
|
|
||||||
|
Asbestos-related charge
|
1,113
|
|
—
|
|
—
|
|
—
|
|
—
|
|
1,113
|
|
||||||
|
Equity in earnings of nonconsolidated affiliates
|
442
|
|
—
|
|
99
|
|
—
|
|
(25
|
)
|
516
|
|
||||||
|
Sundry income (expense) - net
|
1,202
|
|
—
|
|
711
|
|
(10
|
)
|
—
|
|
1,903
|
|
||||||
|
Interest income
|
107
|
|
—
|
|
(107
|
)
|
—
|
|
—
|
|
—
|
|
||||||
|
Interest expense and amortization of debt discount
|
858
|
|
370
|
|
—
|
|
—
|
|
(120
|
)
|
1,108
|
|
||||||
|
Income from continuing operations before income taxes
|
4,413
|
|
3,265
|
|
22
|
|
(687
|
)
|
(930
|
)
|
6,083
|
|
||||||
|
Provision for income taxes on continuing operations
|
9
|
|
744
|
|
22
|
|
(160
|
)
|
(327
|
)
|
288
|
|
||||||
|
Income from continuing operations, net of tax
|
4,404
|
|
2,521
|
|
—
|
|
(527
|
)
|
(603
|
)
|
5,795
|
|
||||||
|
Net income attributable to noncontrolling interests
|
86
|
|
12
|
|
—
|
|
—
|
|
10
|
|
108
|
|
||||||
|
Net income attributable to DowDuPont Inc.
|
4,318
|
|
2,509
|
|
—
|
|
(527
|
)
|
(613
|
)
|
5,687
|
|
||||||
|
Preferred stock dividends
|
340
|
|
10
|
|
—
|
|
—
|
|
(10
|
)
|
340
|
|
||||||
|
Net income available for DowDuPont Inc. common stockholders
|
$
|
3,978
|
|
$
|
2,499
|
|
$
|
—
|
|
$
|
(527
|
)
|
$
|
(603
|
)
|
$
|
5,347
|
|
|
Per common share data:
|
||||||||||||||||||
|
Earnings per common share from continuing operations - basic
|
$
|
2.40
|
|
|||||||||||||||
|
Earnings per common share from continuing operations - diluted
|
$
|
2.37
|
|
|||||||||||||||
|
Weighted-average common shares outstanding - basic
|
2,221.3
|
|
||||||||||||||||
|
Weighted-average common shares outstanding - diluted
|
2,242.1
|
|
||||||||||||||||
|
1.
|
See the consolidated statements of income included in Dow's Annual Report on Form 10-K for the year ended December 31, 2016.
|
|
2.
|
See the consolidated statements of income included in DuPont's Annual Report on Form 10-K for the year ended December 31, 2016.
|
|
3.
|
Certain reclassifications were made to conform with the presentation used for DowDuPont. The reclassifications are consistent with those identified and disclosed in the Current Report on Form 8-K/A filed with the SEC on October 26, 2017. Additionally, in the fourth quarter of 2017, to improve comparability and conform to the current period presentation, the Company reclassified $143 million of asset impairment charges from "Sundry income (expense) - net" to "Restructuring, goodwill impairment and asset related charges - net."
|
|
4.
|
Includes the following divestitures agreed to with certain regulatory agencies as a condition of approval for the Merger: Dow’s EAA Business; the DAS Divested Ag Business; and DuPont’s cereal broadleaf herbicides and chewing insecticides portfolio as well as its crop protection research and development pipeline and organization.
|
|
5.
|
Certain pro forma adjustments were made to illustrate the estimated effects of the Merger, assuming that the Merger had been consummated on January 1, 2016. Refer to
Summary of Pro Forma Adjustments
at the end of this section for additional details.
|
45
|
Summary of Pro Forma Adjustments
|
Year Ended
|
|||||
|
In millions (Unaudited)
|
Dec 31, 2017
|
Dec 31, 2016
|
||||
|
Net sales
|
||||||
|
Intercompany transactions
1
|
$
|
(163
|
)
|
$
|
(216
|
)
|
|
Cost of sales
|
||||||
|
Intercompany transactions
1
|
$
|
(163
|
)
|
$
|
(216
|
)
|
|
Policy harmonization
2
|
11
|
|
—
|
|
||
|
Depreciation expense
3
|
217
|
|
326
|
|
||
|
Total cost of sales
|
$
|
65
|
|
$
|
110
|
|
|
Research and development expenses
|
||||||
|
Depreciation expense
3
|
$
|
19
|
|
$
|
29
|
|
|
Selling, general and administrative expenses
|
||||||
|
Depreciation expense
3
|
$
|
29
|
|
$
|
43
|
|
|
Amortization of intangibles
|
||||||
|
Amortization expense
4
|
$
|
591
|
|
$
|
886
|
|
|
Restructuring, goodwill impairment and asset related charges - net
|
||||||
|
Transaction costs
5
|
$
|
(10
|
)
|
$
|
—
|
|
|
Integration and separation costs
|
||||||
|
Transaction costs
5
|
$
|
(183
|
)
|
$
|
(259
|
)
|
|
Equity in earnings of nonconsolidated affiliates
|
||||||
|
Fair value of nonconsolidated affiliates
6
|
$
|
(15
|
)
|
$
|
(25
|
)
|
|
Interest expense and amortization of debt discount
|
||||||
|
Amortization of debt discount
7
|
$
|
(80
|
)
|
$
|
(120
|
)
|
|
Total pro forma adjustments to income from continuing operations before income taxes
|
$
|
(609
|
)
|
$
|
(930
|
)
|
|
Provision for income taxes on continuing operations
8
|
||||||
|
Policy harmonization
2
|
$
|
(4
|
)
|
$
|
—
|
|
|
Depreciation expense
3
|
(91
|
)
|
(132
|
)
|
||
|
Amortization expense
4
|
(184
|
)
|
(280
|
)
|
||
|
Transaction costs
5
|
22
|
|
49
|
|
||
|
Fair value of nonconsolidated affiliates
6
|
(5
|
)
|
(8
|
)
|
||
|
Amortization of debt discount
7
|
29
|
|
44
|
|
||
|
Total provision for income taxes on continuing operations
|
$
|
(233
|
)
|
$
|
(327
|
)
|
|
Total pro forma adjustments to income from continuing operations, net of tax
|
$
|
(376
|
)
|
$
|
(603
|
)
|
|
Net income attributable to noncontrolling interests
|
||||||
|
Reclass historical dividends
9
|
$
|
7
|
|
$
|
10
|
|
|
Net income from continuing operations attributable to DowDuPont Inc.
|
$
|
(383
|
)
|
$
|
(613
|
)
|
|
Preferred stock dividends
|
||||||
|
Reclass historical dividends
9
|
$
|
(7
|
)
|
$
|
(10
|
)
|
|
Net income from continuing operations available for DowDuPont Inc. common stockholders
|
$
|
(376
|
)
|
$
|
(603
|
)
|
|
1.
|
Elimination of intercompany transactions between Dow and DuPont.
|
|
2.
|
Adjustment to conform DuPont's accounting policy of deferring and amortizing expense for planned major maintenance activities with Dow's accounting policy of directly expensing the costs as incurred.
|
|
3.
|
Increase in depreciation expense for the fair value step-up of DuPont's property, plant and equipment.
|
|
4.
|
Increase in amortization expense for the fair value step-up of DuPont's finite-lived intangibles.
|
|
5.
|
Elimination of one-time transaction costs directly attributable to the Merger.
|
|
6.
|
Decrease in equity in earnings of nonconsolidated affiliates for the fair value adjustment to DuPont's investment in nonconsolidated affiliates.
|
|
7.
|
Decrease in interest expense related to amortization of the fair value adjustment to DuPont's long-term debt.
|
|
8.
|
Represents the income tax effect of the pro forma adjustments related to the Merger calculated using a blended statutory income tax rate, inclusive of state taxes. Management believes the blended statutory income tax rate resulting from this calculation provides a reasonable basis for the pro forma adjustments, however the effective tax rate of DowDuPont could be significantly different depending on the mix of activities.
|
|
9.
|
Reclassify historical dividends for DuPont preferred stock from "Preferred stock dividends" to "Net income attributable to noncontrolling interests."
|
46
SEGMENT RESULTS
Effective August 31, 2017, Dow and DuPont completed the previously announced merger of equals transaction pursuant to the Merger Agreement resulting in a newly formed corporation named DowDuPont. See Note
3
to the Consolidated Financial Statements for additional information on the Merger. As a result of the Merger, new operating segments were created which are used by management to allocate Company resources and assess performance. The new segments are aligned with the market verticals they serve, while maintaining integration and innovation strengths within strategic value chains. DowDuPont is comprised of nine operating segments, which are aggregated into eight reportable segments: Agriculture; Performance Materials & Coatings; Industrial Intermediates & Infrastructure; Packaging & Specialty Plastics; Electronics & Imaging; Nutrition & Biosciences; Transportation & Advanced Polymers; and Safety & Construction. Corporate contains the reconciliation between the totals for the reportable segments and the Company’s totals. The Company’s Nutrition & Biosciences reportable segment consists of two operating segments, Nutrition & Health and Industrial Biosciences, which individually did not meet the quantitative thresholds.
DowDuPont reported geographic information for the following regions: U.S. & Canada, Asia Pacific, Latin America, and EMEA. As a result of the Merger, Dow changed the geographic alignment for the country of India to be reflected in Asia Pacific (previously reported in EMEA) and aligned Puerto Rico to U.S. & Canada (previously reported in Latin America).
The Company’s measure of profit/loss for segment reporting purposes is Operating EBITDA (for the period of September 1, 2017 through December 31, 2017 and the twelve months ended December 31, 2015) and pro forma Operating EBITDA (for the period of January 1, 2017 through August 31, 2017 and the twelve months ended December 31, 2016) as this is the manner in which the Company’s chief operating decision maker (“CODM”) assesses performance and allocates resources. The Company defines Operating EBITDA as earnings (i.e., "Income from continuing operations before income taxes”) before interest, depreciation, amortization and foreign exchange gains (losses), excluding the impact of significant items. Pro forma Operating EBITDA is defined as pro forma earnings (i.e. Pro forma Income from continuing operations before income taxes) before interest, depreciation, amortization and foreign exchange gains (losses), excluding the impact of adjusted significant items. Reconciliations of these measures can be found in Note
24
to the Consolidated Financial Statements. The Company also presents pro forma net sales for 2017 and 2016 as it is included in management’s measure of segment performance and is regularly reviewed by the CODM.
Pro forma adjustments used in the calculation of pro forma net sales and pro forma Operating EBITDA were determined in accordance with Article 11 of Regulation S-X and were based on the historical consolidated financial statements of Dow and DuPont, adjusted to give effect to the Merger as if it had been consummated on January 1, 2016. For additional information on the pro forma adjustments made, see Supplemental Unaudited Pro Forma Combined Financial Information in the preceding section.
AGRICULTURE
The Agriculture segment leverages the Company’s technology, customer relationships and industry knowledge to improve the quantity, quality and safety of the global food supply and the global production agriculture industry. Land available for worldwide agricultural production is increasingly limited so production growth will need to be achieved principally through improving crop yields and productivity. The segment’s two global businesses, Seed and Crop Protection, deliver a broad portfolio of products and services that are specifically targeted to achieve gains in crop yields and productivity, including well-established brands of seed products, crop chemicals, seed treatment, agronomy and digital services. R&D focuses on leveraging germplasm and plant science technology to increase farmer productivity and to enhance the value of grains and oilseeds through improved seed traits, superior seed germplasm and effective use of crop protection solutions.
|
Agriculture
|
|||||||||
|
In millions
|
2017
|
2016
|
2015
|
||||||
|
Net sales
|
$
|
7,516
|
|
$
|
6,173
|
|
$
|
6,327
|
|
|
Pro forma net sales
|
$
|
14,342
|
|
$
|
14,060
|
|
|||
|
Operating EBITDA
|
$
|
971
|
|
$
|
833
|
|
|||
|
Pro forma Operating EBITDA
|
$
|
2,611
|
|
$
|
2,322
|
|
|||
|
Equity earnings
|
$
|
3
|
|
$
|
5
|
|
$
|
3
|
|
47
|
Agriculture
|
||||||
|
Percentage change from prior year
|
2017
|
2016
|
2015
|
|||
|
Change in Net Sales from Prior Period due to:
|
||||||
|
Local price & product mix
|
(1
|
)%
|
1
|
%
|
(5
|
)%
|
|
Currency
|
—
|
|
(1
|
)
|
(4
|
)
|
|
Volume
|
(2
|
)
|
(2
|
)
|
(2
|
)
|
|
Portfolio & other
|
25
|
|
—
|
|
—
|
|
|
Total
|
22
|
%
|
(2
|
)%
|
(11
|
)%
|
|
Change in Pro Forma Net Sales from Prior Period due to:
|
||||||
|
Local price & product mix
|
—
|
%
|
||||
|
Currency
|
—
|
|
||||
|
Volume
|
1
|
|
||||
|
Portfolio & other
|
1
|
|
||||
|
Total
|
2
|
%
|
||||
2017 Versus 2016
Agriculture net sales were
$7,516 million
in 2017, up from
$6,173 million
in 2016. Pro forma net sales were
$14,342 million
in 2017, up from
$14,060 million
in 2016. Pro forma net sales growth of
2 percent
was led by volume gains of
1 percent
and a
1
percent benefit from portfolio actions. Seed net sales grew 5 percent, driven by volume and price improvement, and Crop Protection net sales decreased 1 percent as increases in volume were more than offset by lower local price. Seed and Crop Protection volume growth was driven by an increase in sunflower and corn seed sales in Europe, increased soybean sales in U.S. & Canada, continued penetration of new crop protection products VESSARYA® and ZORVEC
TM
fungicides and continued demand for ARYLEX
TM
herbicide, ISOCLAST®
insecticide, and novel seed treatment solutions. These volume increases were partially offset by higher Crop Protection inventory levels in China and a reduction in global corn planted area. Increases in local prices for Seeds, driven by continued penetration of LEPTRA® corn hybrids, were offset by a decrease in local prices for Crop Protection, driven by competitive pressures in Latin America.
The benefit from portfolio actions for 2017 as compared with 2016, is due to the DAS Divested Ag Business, which is excluded from pro forma results for periods prior to the Merger, but included in reported results after the Merger and through the close of the sale of this business on November 30, 2017.
Pro forma Operating EBITDA was
$2,611 million
in 2017, up 12 percent from
$2,322 million
in 2016. Pro forma Operating EBITDA increased on improved volume, cost savings, lower pension/OPEB costs, currency and portfolio benefits. Increases were partially offset by lower local price due to competitive crop protection pricing pressure and higher product costs, including higher soybean royalties.
2016 Versus 2015
Agriculture net sales were $6,173 million in 2016, down 2 percent from $6,327 million in 2015. Compared with 2015, volume decreased 2 percent, currency declined 1 percent and local price and product mix was up 1 percent. Net sales declined in all geographic regions, except Latin America, as low crop commodity prices continued to drive a slow-growth agricultural industry. Crop Protection net sales decreased compared with 2015, driven primarily by reduced demand for insecticides and herbicides, primarily glyphosate, and currency headwinds. Seed net sales increased compared with 2015, as strong demand and price increases for corn seed in Latin America more than offset the impact of product lines divested in 2015 and lower demand for sunflower and cotton seed.
Operating EBITDA for 2016 was $971 million, up from $833 million in 2015. Operating EBITDA increased as benefits from lower operating costs driven by productivity initiatives and increased corn seed sales more than offset lower sales of herbicides and insecticides and the absence of earnings from product lines divested in 2015.
Agriculture Outlook for 2018
Agriculture's full year 2018 Operating EBITDA is expected to increase meaningfully, as compared with 2017 pro forma Operating EBITDA driven by favorable impacts on net sales from new product introductions and favorable impacts from cost synergies. The Company anticipates net sales for the first six months of 2018 to be about equal with the first six months of 2017, which is consistent with the estimated corn area planted in North America in 2018, and reflective of the challenging price environment. The Company anticipates an increase in the favorable impacts of cost synergies in the last six months of 2018 and expects new product introductions to be fully ramped and contributing to net sales and Operating EBITDA growth in the last six months of 2018. Additionally, the Company anticipates lower pension/OPEB costs to contribute to increases in Operating EBITDA.
48
PERFORMANCE MATERIALS & COATINGS
The Performance Materials & Coatings segment consists of two global businesses - Coatings & Performance Monomers and Consumer Solutions. Using silicones, acrylics and cellulosics-based technology platforms, these businesses serve the needs of the coatings, home care, personal care, appliance and industrial end-markets. The segment has broad geographic reach with R&D and manufacturing facilities located in key geographic regions. This segment also includes the results of the HSC Group joint ventures.
|
Performance Materials & Coatings
|
|||||||||
|
In millions
|
2017
|
2016
|
2015
|
||||||
|
Net sales
|
$
|
8,783
|
|
$
|
6,412
|
|
$
|
4,517
|
|
|
Pro forma net sales
|
$
|
8,740
|
|
$
|
6,362
|
|
|||
|
Operating EBITDA
|
$
|
1,229
|
|
$
|
606
|
|
|||
|
Pro forma Operating EBITDA
|
$
|
2,121
|
|
$
|
1,228
|
|
|||
|
Equity earnings
|
$
|
394
|
|
$
|
303
|
|
$
|
205
|
|
|
Performance Materials & Coatings
|
||||||
|
Percentage change from prior year
|
2017
|
2016
|
2015
|
|||
|
Change in Net Sales from Prior Period due to:
|
||||||
|
Local price & product mix
|
8
|
%
|
(8
|
)%
|
(14
|
)%
|
|
Currency
|
—
|
|
(1
|
)
|
(5
|
)
|
|
Volume
|
2
|
|
(2
|
)
|
3
|
|
|
Portfolio & other
|
27
|
|
53
|
|
—
|
|
|
Total
|
37
|
%
|
42
|
%
|
(16
|
)%
|
|
Change in Pro Forma Net Sales from Prior Period due to:
|
||||||
|
Local price & product mix
|
8
|
%
|
||||
|
Currency
|
—
|
|
||||
|
Volume
|
2
|
|
||||
|
Portfolio & other
|
27
|
|
||||
|
Total
|
37
|
%
|
||||
2017 Versus 2016
Performance Materials & Coatings net sales were $8,783 million in 2017, up from $6,412 million in 2016. Pro forma net sales were $8,740 in 2017, up from $6,362 in 2016. Pro forma net sales increased 37 percent compared with 2016, primarily due to portfolio actions, which contributed to 27 percent of the increase, reflecting the favorable impact of the addition of Dow Corning’s silicones business. Local price increased 8 percent and volume increased 2 percent. Local price increased in both businesses and all geographic regions. Local price increased in Coatings & Performance Monomers in response to higher raw material costs, tight supply and demand fundamentals for acrylates and methacrylates and pricing actions for architectural coatings. Consumer Solutions local price increased primarily due to pricing initiatives for silicone intermediates in Asia Pacific and EMEA. Volume increased in both businesses and all geographic regions, except Latin America and EMEA, which were flat. Consumer Solutions experienced volume growth in all geographic regions, except EMEA, which was flat, driven by strong demand in pressure sensitive packaging, construction and personal care end-markets. Volume growth in Coatings & Performance Monomers was driven by opportunistic merchant sales of acrylates and methacrylates and strong growth in specialty monomers, particularly in the U.S. & Canada.
Pro forma Operating EBITDA was $2,121 million in 2017, up from $1,228 in 2016. Pro forma Operating EBITDA improved compared with 2016 as the favorable impact of earnings from Dow Corning’s silicones business, higher selling prices and increased equity earnings from the HSC Group more than offset higher feedstock, energy and other raw material costs.
2016 Versus 2015
Performance Materials & Coatings net sales were $6,412 million in 2016, up from $4,517 million in 2015. Net sales increased 42 percent from 2015, primarily due to a 53 percent increase in portfolio and other, reflecting the favorable impact from the addition of Dow Corning’s silicones business. Local price was down 8 percent, with declines in all geographic regions and both businesses, primarily in response to lower raw material costs and competitive pricing pressures. Volume decreased 2 percent compared with 2015, driven by declines in Coatings & Performance Monomers which more than offset demand gains in Consumer Solutions. Coatings & Performance Monomers volume decreased due to a strategic reduction in merchant sales of acrylic acid and increased internal consumption of acrylates which more than offset demand growth for architectural and industrial coatings driven by a strong innovation pipeline and expansion into new end markets. Consumer Solutions volume increased in all geographic regions
49
reflecting demand for silicone-based products and increased market share and innovation gains in the home and personal care market sectors in U.S. & Canada and EMEA.
Operating EBITDA for 2016 was $1,229 million, up from $606 million in 2015. Operating EBITDA increased compared with 2015 as the favorable impact from the addition of Dow Corning’s silicones business, lower feedstock, energy and other raw material costs and higher equity earnings more than offset lower local selling prices.
Performance Materials & Coatings Outlook for 2018
Performance Materials & Coatings' 2018 Operating EBITDA is expected to be essentially flat compared with 2017 pro forma Operating EBITDA, as sales gains and the favorable impact of cost synergies is expected to be offset by decreased equity earnings and increased planned maintenance turnaround spending. Modest sales growth is expected for the segment, driven by volume and local price gains in Consumer Solutions resulting from continued pricing momentum for silicone intermediates, particularly in Asia Pacific, and strong market demand in home and personal care, pressure sensitive packaging and construction end-markets. Coatings & Performance Monomers anticipates sales to be flat as overall market share growth, combined with innovative product offerings, is expected to be offset by local price declines and balanced market conditions.
INDUSTRIAL INTERMEDIATES & INFRASTRUCTURE
The Industrial Intermediates & Infrastructure segment consists of four global businesses: Construction Chemicals, Energy Solutions, Industrial Solutions, and Polyurethanes & CAV. These customer-centric global businesses develop and market customized materials using advanced technology and unique chemistries. These businesses serve the needs of market segments as diverse as: appliance; coatings; infrastructure; and oil and gas. The segment has broad geographic reach and R&D and manufacturing facilities located in key geographic regions. This segment also includes a portion of the results of EQUATE, TKOC, Map Ta Phut Olefins Company Limited and Sadara, all joint ventures of the Company.
Dow is responsible for marketing Sadara products outside of the Middle East zone through Dow’s established sales channels. As part of this arrangement, Dow purchases and sells Sadara products for a marketing fee.
|
Industrial Intermediates & Infrastructure
|
|||||||||
|
In millions
|
2017
|
2016
|
2015
|
||||||
|
Net sales
|
$
|
12,647
|
|
$
|
10,832
|
|
$
|
13,691
|
|
|
Pro forma net sales
|
$
|
12,640
|
|
$
|
10,820
|
|
|||
|
Operating EBITDA
|
$
|
1,672
|
|
$
|
2,425
|
|
|||
|
Pro forma Operating EBITDA
|
$
|
2,282
|
|
$
|
1,672
|
|
|||
|
Equity earnings (losses)
|
$
|
172
|
|
$
|
(18
|
)
|
$
|
226
|
|
|
Industrial Intermediates & Infrastructure
|
||||||
|
Percentage change from prior year
|
2017
|
2016
|
2015
|
|||
|
Change in Net Sales from Prior Period due to:
|
||||||
|
Local price & product mix
|
10
|
%
|
(8
|
)%
|
(10
|
)%
|
|
Currency
|
—
|
|
(1
|
)
|
(5
|
)
|
|
Volume
|
7
|
|
1
|
|
2
|
|
|
Portfolio & other
|
—
|
|
(13
|
)
|
(6
|
)
|
|
Total
|
17
|
%
|
(21
|
)%
|
(19
|
)%
|
|
Change in Pro Forma Net Sales from Prior Period due to:
|
||||||
|
Local price & product mix
|
10
|
%
|
||||
|
Currency
|
—
|
|
||||
|
Volume
|
7
|
|
||||
|
Portfolio & other
|
—
|
|
||||
|
Total
|
17
|
%
|
||||
2017 Versus 2016
Industrial Intermediates & Infrastructure net sales were $12,647 million in 2017, up 17 percent from $10,832 million in 2016. Pro forma net sales were $12,640 million in 2017, up from $10,820 million in 2016. Pro forma net sales increased 17 percent in 2017, with local price up 10 percent and volume up 7 percent. Local price was up in all geographic regions and all businesses driven by higher raw material costs, pricing initiatives and tight market conditions due to supply disruptions in the industry. Polyurethanes &
50
CAV volume increased in all geographic regions due to strong demand for downstream, higher margin systems applications, new production from Sadara and increased demand for caustic soda and vinyl chloride monomer in EMEA resulting from tighter supply/demand fundamentals. Industrial Solutions reported volume gains in all geographic regions driven by new production from Sadara, increased demand for products used in crop protection offerings and solvents used in electronics processing, and higher catalyst sales in Asia Pacific. Construction Chemicals volume increased driven by growing demand for acrylics-based products in the U.S. & Canada and methyl cellulosics-based products in EMEA. Volume decreased in Energy Solutions due to reduced project activity in energy market sectors.
Pro forma Operating EBITDA was $2,282 million in 2017, up from $1,672 million in 2016. Compared with last year, pro forma Operating EBITDA increased as higher selling prices, increased sales volume, higher equity earnings from the Kuwait joint ventures, lower equity losses from Sadara and lower SG&A and R&D spending more than offset higher feedstock, energy and other raw material costs.
2016 Versus 2015
Industrial Intermediates & Infrastructure net sales were $10,832 million in 2016, down 21 percent from $13,691 million in 2015. Compared with 2015, net sales declined 13 percent due to portfolio and other actions, primarily reflecting the split-off of the chlorine value chain, and local price declined 8 percent. Local price decreased across all geographic regions and all businesses in response to lower raw material costs. Volume increased 1 percent with results mixed by business. Polyurethanes & CAV reported volume growth driven by demand for higher-margin system house applications used in energy, industrial and consumer end markets, increased demand for polyols in Asia Pacific due to an expanding customer base and favorable supply and demand fundamentals for chlor-alkali and vinyl products in EMEA. Construction Chemicals volume increased in all geographic regions, except U.S. & Canada, on strong demand for cellulosics- and acrylics-based products. Energy Solutions volume declined as a result of weakness in the energy sector. Industrial Solutions volume was flat as demand in crop defense, electronics and textile market sectors was offset by reduced demand for deicer fluids, industrial lubricants and long market conditions for ethylene oxide/ethylene glycol.
Operating EBITDA for 2016 was $1,672 million, compared with $2,425 million in 2015. Compared with 2015, Operating EBITDA declined due to lower selling prices, the absence of earnings from divested businesses, reduced equity earnings from the Kuwait joint ventures and higher equity losses from Sadara related to start-up expenses. These declines were partially offset by lower feedstock and raw material costs, lower R&D and SG&A spending and higher equity earnings from Map Ta Phut Olefins Company Limited.
Industrial Intermediates & Infrastructure Outlook for 2018
Industrial Intermediates & Infrastructure's 2018 Operating EBITDA is expected to increase moderately compared with 2017 pro forma Operating EBITDA, driven by the favorable impact of cost synergies, sales volume growth and higher equity earnings which are expected to more than offset the unfavorable impact of competitive pricing pressure and increased feedstock and other raw materials costs. Local price will primarily follow feedstock and energy prices but will also be influenced by supply and demand fundamentals, particularly in Polyurethanes & CAV and Industrial Solutions. Polyurethanes & CAV volume is expected to grow in excess of GDP, driven by strong demand for products used in energy efficiency applications as well as consumer-driven demand in emerging geographies and additional capacity from Sadara. Industrial Solutions volume is expected to increase as a result of Sadara capacity that came on-line in 2017, with growth also expected for amines, lubricant additives and other chemical intermediate products. Construction Chemicals volume is expected to increase across all geographic regions primarily driven by product innovation and growth in cellulosics, latex powders and acrylics-based products. Energy Solutions expects volume growth driven by the exploration and production end-markets.
PACKAGING & SPECIALTY PLASTICS
The Packaging & Specialty Plastics segment is a market-oriented portfolio composed of two global businesses: Hydrocarbons & Energy and Packaging and Specialty Plastics. The segment is advantaged through its low cost position into key feedstocks and broad geographic reach, with manufacturing facilities located in all geographic regions. It also benefits from R&D expertise to deliver leading-edge technology that provides a competitive benefit to customers in food packaging and other high-growth end‑use markets like transportation and consumer durables. Taken together, the businesses in this segment represent the world's leading plastics franchise. This segment also includes the results of The Kuwait Styrene Company K.S.C. ("TKSC") and The SCG-Dow Group, as well as a portion of the results of EQUATE, TKOC, Map Ta Phut Olefins Company Limited and Sadara, all joint ventures of the Company.
51
Dow is responsible for marketing a majority of Sadara products outside of the Middle East zone through Dow’s established sales channels. As part of this arrangement, Dow purchases and sells Sadara products for a marketing fee.
|
Packaging & Specialty Plastics
|
|||||||||
|
In millions
|
2017
|
2016
|
2015
|
||||||
|
Net sales
|
$
|
21,456
|
|
$
|
18,404
|
|
$
|
18,357
|
|
|
Pro forma net sales
|
$
|
22,392
|
|
$
|
19,848
|
|
|||
|
Operating EBITDA
|
$
|
4,633
|
|
$
|
4,812
|
|
|||
|
Pro forma Operating EBITDA
|
$
|
4,698
|
|
$
|
5,129
|
|
|||
|
Equity earnings
|
$
|
189
|
|
$
|
137
|
|
$
|
220
|
|
|
Packaging & Specialty Plastics
|
||||||
|
Percentage change from prior year
|
2017
|
2016
|
2015
|
|||
|
Change in Net Sales from Prior Period due to:
|
||||||
|
Local price & product mix
|
8
|
%
|
(8
|
)%
|
(18
|
)%
|
|
Currency
|
1
|
|
—
|
|
(5
|
)
|
|
Volume
|
5
|
|
9
|
|
5
|
|
|
Portfolio & other
|
3
|
|
(1
|
)
|
—
|
|
|
Total
|
17
|
%
|
—
|
%
|
(18
|
)%
|
|
Change in Pro Forma Net Sales from Prior Period due to:
|
||||||
|
Local price & product mix
|
8
|
%
|
||||
|
Currency
|
—
|
|
||||
|
Volume
|
5
|
|
||||
|
Portfolio & other
|
—
|
|
||||
|
Total
|
13
|
%
|
||||
2017 Versus 2016
Packaging & Specialty Plastics net sales were $21,456 million in 2017, up 17 percent from $18,404 million in 2016. Pro forma net sales were $22,392 million in 2017, up from $19,848 million in 2016. Pro forma net sales increased 13 percent from 2016 with local price up 8 percent and volume up 5 percent. Local price increased in all geographic regions and both businesses in response to higher feedstock, energy and other raw material costs. Double-digit price increases were reported in Hydrocarbons & Energy as a result of higher Brent crude oil prices, which increased approximately 22 percent compared with 2016. Local price also increased in the U.S. & Canada as a result of tight supply conditions due to hurricane-related disruptions. Volume increased in both businesses and across all geographic regions, except Latin America. Packaging and Specialty Plastics volume growth was driven by continued consumer-led demand in health and hygiene end-markets in the Americas, strong demand for food and specialty packaging solutions, particularly in Asia Pacific, and increased use of elastomers in packaging and footwear applications. Volume decreased for wire and cable applications as a result of hurricane-related supply disruptions. Volume growth in EMEA and Asia Pacific was enabled by an increase in production volume at Sadara. Hydrocarbons & Energy volume increased in all geographic regions, except Asia Pacific, primarily due to higher sales of ethylene and ethylene by-products enabled by the start-up of a world‑scale ethylene production facility in Texas in September 2017.
Pro forma Operating EBITDA for 2017 was $4,698 million, down from $5,129 million in 2016. Pro forma Operating EBITDA decreased in 2017 as the impact of higher feedstock and energy costs, planned maintenance turnaround spending, increased U.S. Gulf Coast start-up and commissioning costs and hurricane-related expenses more than offset increased selling prices and higher equity earnings.
2016 Versus 2015
Packaging & Specialty Plastics net sales for 2016 were $18,404 million, essentially flat from $18,357 million in 2015. Volume increased 9 percent, local price decreased 8 percent and portfolio and other decreased 1 percent. Volume increased across all geographic regions and both businesses. Volume increased in Hydrocarbons & Energy due to third party supply agreements. Packaging and Specialty Plastics volume increased due to demand growth in industrial and consumer packaging and health and hygiene market sectors; increased use of elastomers in transportation, consumer goods and footwear market sectors; and continued demand for power cable installations and fiber optics. Volume growth in Asia Pacific was also enabled by new production from Sadara. Local price decreased across all geographic regions and both businesses in response to lower feedstock, energy and other raw material prices and competitive pricing pressures. Double-digit price declines were reported in Hydrocarbons & Energy as a
52
result of lower Brent crude oil prices, which declined approximately 16 percent compared with 2015. Portfolio actions decreased net sales by 1 percent, primarily reflecting the split-off of the chlorine value chain.
Operating EBITDA for 2016 was $4,633 million, down from $4,812 million in 2015. Operating EBITDA decreased in 2016 as the impact of higher sales volume, lower feedstock, energy and other raw material costs and higher equity earnings from The SCG-Dow Group were more than offset by lower selling prices, lower equity earnings from EQUATE and increased equity losses from Sadara related to start-up expenses.
Packaging & Specialty Plastics Outlook for 2018
Packaging & Specialty Plastics' 2018 Operating EBITDA is expected to increase meaningfully compared with 2017 pro forma Operating EBITDA, driven by the favorable impact of cost synergies and contributions from new capacity that will more than offset increased commissioning costs and increased feedstock and energy costs. In 2018, the Company expects crude oil prices, on average, to be higher than 2017. As a result, feedstock and energy costs are expected to be higher than 2017 levels. Global ethylene margins are expected to remain healthy in 2018, supported by demand growth as well as delays in new industry ethylene production capacity in the U.S. & Canada. Ethylene margins could vary materially from these expectations depending on global GDP rates, global operating rates and changes in global oil prices. Sales for the segment are expected to be flat compared with 2017 as increased sales in Packaging and Specialty Plastics are expected to offset declines in Hydrocarbons & Energy. Packaging and Specialty Plastics sales are expected to increase over the prior year driven by volume growth - reflecting a full year of Sadara volume, as all production facilities have commenced operations, and new capacity from Dow's U.S. Gulf Coast assets. Hydrocarbons & Energy sales are expected to decline as a result of higher crude oil and naphtha prices which will cause a shift to lighter cracker feedslates, resulting in lower production of ethylene by-products. Sales of ethylene are also expected to decline due to increased internal consumption as a result of the start-up of new Dow assets on the U.S. Gulf Coast. Price in both businesses is expected to be influenced by changes in feedstock costs.
Current and Future Investments
On September 21, 2017, Dow announced the startup of its new integrated, world-scale ethylene production facility and its new ELITE™ enhanced polyethylene production facility, both located in Freeport, Texas. These two key milestones enable the Company to capture benefits from increasing supplies of U.S. shale gas to deliver differentiated downstream solutions in its core market verticals. Dow is also building three new production facilities on the U.S. Gulf Coast which includes a Low Density Polyethylene (LDPE) production facility and a NORDEL™ Metallocene EPDM production which are expected to start up in early 2018, and a High Melt Index (HMI) AFFINITY™ Polymer production facility which is expected to startup in the second half of 2018.
ELECTRONICS & IMAGING
Electronics & Imaging is a leading global supplier of differentiated materials and systems for a broad range of consumer electronics including mobile devices, television monitors, personal computers and electronics used in a variety of industries. The segment is a leading provider of materials and solutions for the fabrication of semiconductors and integrated circuits and also provides innovative metallization processes for metal finishing, decorative, and industrial applications. Electronics & Imaging is a leading global supplier of key materials for the manufacturing of photovoltaics ("PV") and solar cells, including innovative metallization pastes and back sheet materials for the production of solar cells and solar modules and in the advanced printing and packaging graphics industry providing flexographic printing inks, photopolymer plates, and platemaking systems used in digital printing applications for textile, commercial and home-office use. In addition, the segment provides cutting-edge materials for the manufacturing of rigid and flexible displays for liquid crystal displays ("LCD"), advanced-matrix organic light emitting diode ("AMOLED"), and quantum dot ("QD") applications.
|
Electronics & Imaging
|
|||||||||
|
In millions
|
2017
|
2016
|
2015
|
||||||
|
Net sales
|
$
|
3,356
|
|
$
|
2,307
|
|
$
|
1,987
|
|
|
Pro forma net sales
|
$
|
4,775
|
|
$
|
4,266
|
|
|||
|
Operating EBITDA
|
$
|
759
|
|
$
|
583
|
|
|||
|
Pro forma Operating EBITDA
|
$
|
1,486
|
|
$
|
1,173
|
|
|||
|
Equity earnings
|
$
|
3
|
|
$
|
24
|
|
$
|
62
|
|
53
|
Electronics & Imaging
|
||||||
|
Percentage change from prior year
|
2017
|
2016
|
2015
|
|||
|
Change in Net Sales from Prior Period due to:
|
||||||
|
Local price & product mix
|
(1
|
)%
|
(3
|
)%
|
(2
|
)%
|
|
Currency
|
—
|
|
—
|
|
(2
|
)
|
|
Volume
|
9
|
|
3
|
|
(1
|
)
|
|
Portfolio & other
|
37
|
|
16
|
|
—
|
|
|
Total
|
45
|
%
|
16
|
%
|
(5
|
)%
|
|
Change in Pro Forma Net Sales from Prior Period due to:
|
||||||
|
Local price & product mix
|
(1
|
)%
|
||||
|
Currency
|
—
|
|
||||
|
Volume
|
11
|
|
||||
|
Portfolio & other
|
2
|
|
||||
|
Total
|
12
|
%
|
||||
2017 Versus 2016
Electronics & Imaging net sales were
$3,356 million
in 2017, up from
$2,307 million
in 2016. Pro forma net sales were
$4,775 million
in 2017, up from
$4,266 million
in 2016. Pro forma net sales growth of 12 percent was led by volume gains of 11 percent and a net 2 percent favorable impact from portfolio actions, slightly offset by a 1 percent decline in local price. Volume growth, primarily in Asia Pacific, was due to increased demand in semiconductor, consumer electronics, photovoltaic, display and industrial markets. Increased semiconductor content in end-use applications drove strong demand in both memory and logic market segments. Continued demand for mobile phones and other consumer electronics, as well as industrial applications drove sales gains. Demand for TEDLAR® film in photovoltaics was partially offset by continued declines in SOLAMET® paste. The net favorable impact of portfolio actions related primarily to the addition of Dow Corning's silicones business in June 2016, partially offset by the divestitures of SKC Haas Display Films and the Authentications business in the first half of 2017. Local price declines were driven primarily by local price declines in semiconductor markets and competitive pressure in advanced printing applications.
Pro forma Operating EBITDA was
$1,486 million
in 2017, up 27 percent from
$1,173 million
in 2016. Pro forma Operating EBITDA increased as volume growth, favorable portfolio impacts from the addition of Dow Corning’s silicones business, cost savings and lower pension/OPEB costs were partially offset by higher raw material costs and lower local price.
2016 Versus 2015
Electronics & Imaging net sales were $2,307 million in 2016, up from $1,987 million in 2015. Net sales increased 16 percent from 2015 with portfolio and other up 16 percent, reflecting the favorable impact of the addition of Dow Corning's silicones business. Volume was up 3 percent, driven by chemical mechanical planarization pads used in semiconductor manufacturing along with new demand for organic light-emitting diodes used in mobile phone displays. Local price and product mix declined 3 percent, most notably in Asia Pacific, due to competitive pricing pressures.
Operating EBITDA for 2016 was $759 million, up from $583 million in 2015. Operating EBITDA increased in 2016 as the favorable impact from the addition of Dow Corning's silicones business, higher sales volume, lower raw material costs and lower operating expenses more than offset local selling price declines.
Electronics & Imaging Outlook for 2018
Electronics & Imaging's 2018 Operating EBITDA is expected to increase moderately as compared with 2017 pro forma Operating EBITDA, driven by increased volumes, lower pension/OPEB costs and the favorable impacts of cost synergies, partially offset by the negative impacts from portfolio actions and lower local prices driven by continued pressure in advanced printing and photovoltaic applications. Demand in semiconductors, consumer electronics and industrial markets is expected to continue to remain strong, as electronic content in end devices continues to grow. The portfolio impact relates to the 2017 divestitures of the SKC Haas Display Films and Authentications business.
NUTRITION & BIOSCIENCES
Nutrition & Biosciences is an innovation-driven and customer-focused segment that provides solutions for the global food and beverage, pharma, personal care, energy and animal nutrition markets. It consists of two operating segments: Nutrition & Health and Industrial Biosciences. The Nutrition & Health business is one of the world’s largest producers of specialty food ingredients, developing and manufacturing solutions for the global food and beverage market. The Nutrition & Health business is also one of the world's largest producers of cellulosic- and alginates-based pharma excipients. The Industrial Biosciences business is an industry pioneer and innovator that works with customers to improve the performance, productivity and sustainability of their
54
products and processes through biotechnology and engineering solutions including enzymes, biomaterials, biocides and antimicrobial solutions and process technology.
|
Nutrition & Biosciences
|
|||||||||
|
In millions
|
2017
|
2016
|
2015
|
||||||
|
Net sales
|
$
|
2,812
|
|
$
|
975
|
|
$
|
1,029
|
|
|
Pro forma net sales
|
$
|
5,980
|
|
$
|
5,763
|
|
|||
|
Operating EBITDA
|
$
|
141
|
|
$
|
130
|
|
|||
|
Pro forma Operating EBITDA
|
$
|
1,302
|
|
$
|
1,227
|
|
|||
|
Equity earnings
|
$
|
13
|
|
$
|
10
|
|
$
|
6
|
|
|
Nutrition & Biosciences
|
||||||
|
Percentage change from prior year
|
2017
|
2016
|
2015
|
|||
|
Change in Net Sales from Prior Period due to:
|
||||||
|
Local price & product mix
|
—
|
%
|
(3
|
)%
|
(1
|
)%
|
|
Currency
|
—
|
|
—
|
|
(5
|
)
|
|
Volume
|
10
|
|
(2
|
)
|
(4
|
)
|
|
Portfolio & other
|
178
|
|
—
|
|
—
|
|
|
Total
|
188
|
%
|
(5
|
)%
|
(10
|
)%
|
|
Change in Pro Forma Net Sales from Prior Period due to:
|
||||||
|
Local price & product mix
|
—
|
%
|
||||
|
Currency
|
—
|
|
||||
|
Volume
|
3
|
|
||||
|
Portfolio & other
|
1
|
|
||||
|
Total
|
4
|
%
|
||||
2017 Versus 2016
Nutrition & Biosciences net sales were
$2,812 million
in 2017, up from
$975 million
in 2016. Pro forma net sales were
$5,980 million
in 2017, up from
$5,763 million
in 2016. Pro forma net sales increased
4 percent
, driven by volume growth of
3
percent and a favorable impact of
1 percent
from portfolio actions. Volume growth was led by Industrial Biosciences, driven by strong demand for microbial control solutions in energy markets, continued growth in biomaterials in apparel and carpet markets and growth in bioactives, primarily in the grain processing market. Volume in Nutrition & Health was flat as growth in probiotics and pharmaceuticals was offset by declines in protein solutions and systems and texturants due to weakness in packaged food markets and specific actions taken to exit low-margin market segments. The favorable impact from portfolio actions was driven by the acquisition of the FMC H&N Business.
Pro forma Operating EBITDA was
$1,302 million
in 2017, up 6 percent from
$1,227 million
in 2016. The increase in pro forma Operating EBITDA was driven by cost savings, volume growth, lower pension/OPEB costs and favorable impacts of portfolio actions. Increases in pro forma Operating EBITDA were partially offset by the absence of a $27 million gain from a prior-year asset sale.
2016 Versus 2015
Nutrition & Biosciences net sales were $975 million in 2016, down from $1,029 million in 2015. Net sales decreased 5 percent compared with 2015, with local price and product mix down 3 percent and volume down 2 percent. Local price declined in Industrial Biosciences across all geographic regions due to weakness in the energy sector, primarily in U.S. & Canada. Local price was also down in Nutrition & Health across all geographic regions, except Latin America. Volume was flat in Industrial Biosciences and down in Nutrition & Health. Nutrition & Health volume declined due to customer de-stocking of cellulosics used in pharmaceutical applications, primarily in U.S. & Canada, and from the shutdown of a cellulosics facility in Institute, West Virginia, in the fourth quarter of 2015.
Operating EBITDA was $141 million in 2016, compared with $130 million in 2015. Operating EBITDA increased in 2016 as lower operating expenses, lower R&D and SG&A spending, and higher equity earnings more than offset the impact of lower selling prices.
55
Nutrition & Biosciences Outlook for 2018
Nutrition & Biosciences' 2018 Operating EBITDA is expected to increase notably, as compared with 2017 pro forma Operating EBITDA driven by a favorable portfolio impact of the acquisition of the H&N Business, volume growth, lower pension/OPEB costs, the favorable impacts of cost synergies and higher local prices. The Company anticipates a continued competitive market environment with lower food ingredient demand in select US markets, some global price pressure originating from cost focused customers, growth in the pharmaceutical global oral solid dosage excipient market, and expects the enzymes market to grow on pace with gross domestic product (“GDP”). Additionally, the Company expects higher oil prices to continue, driving higher demand of microbial control products, and continued high growth in the apparel markets.
TRANSPORTATION & ADVANCED POLYMERS
Transportation & Advanced Polymers provides high-performance engineering resins, adhesives, lubricants and parts to engineers and designers in the transportation, electronics, medical, industrial and consumer end-markets to enable systems solutions for demanding applications and environments. The segment delivers a broad range of polymer-based high-performance materials in its product portfolio, including elastomers and thermoplastic and thermoset engineering polymers which are used by customers to fabricate components for mechanical, chemical and electrical systems. In addition, the segment produces innovative and differentiated adhesive technologies to meet customer specifications for durability, crash performance, and healthcare applications. Transportation & Advanced Polymers also targets the performance plastics and fluid solutions markets by developing technologies that differentiate customers’ products with improved performance characteristics.
|
Transportation & Advanced Polymers
|
|||||||||
|
In millions
|
2017
|
2016
|
2015
|
||||||
|
Net sales
|
$
|
2,521
|
|
$
|
897
|
|
$
|
583
|
|
|
Pro forma net sales
|
$
|
5,131
|
|
$
|
4,497
|
|
|||
|
Operating EBITDA
|
$
|
287
|
|
$
|
156
|
|
|||
|
Pro forma Operating EBITDA
|
$
|
1,319
|
|
$
|
1,045
|
|
|||
|
Equity earnings (losses)
|
$
|
(1
|
)
|
$
|
8
|
|
$
|
20
|
|
|
Transportation & Advanced Polymers
|
||||||
|
Percentage change from prior year
|
2017
|
2016
|
2015
|
|||
|
Change in Net Sales from Prior Period due to:
|
||||||
|
Local price & product mix
|
—
|
%
|
(1
|
)%
|
—
|
%
|
|
Currency
|
—
|
|
(1
|
)
|
(7
|
)
|
|
Volume
|
6
|
|
7
|
|
5
|
|
|
Portfolio & other
|
175
|
|
49
|
|
—
|
|
|
Total
|
181
|
%
|
54
|
%
|
(2
|
)%
|
|
Change in Pro Forma Net Sales from Prior Period due to:
|
||||||
|
Local price & product mix
|
2
|
%
|
||||
|
Currency
|
—
|
|
||||
|
Volume
|
7
|
|
||||
|
Portfolio & other
|
5
|
|
||||
|
Total
|
14
|
%
|
||||
2017 Versus 2016
Transportation & Advanced Polymers net sales were
$2,521 million
in 2017, up from
$897 million
in 2016. Pro forma net sales were
$5,131 million
in 2017, up from
$4,497 million
in 2016. Pro forma net sales growth of
14
percent, with gains across all geographies, was led by increased volume of
7 percent
, a favorable impact from portfolio actions of
5 percent
and a
2 percent
increase in local price. Broad based volume growth was driven by increased demand for polymers in automotive, electronics and industrial markets leading to growth from KALREZ® and VESPEL® high-performance parts. Volume growth was led by Asia Pacific followed by EMEA, U.S. & Canada and Latin America. The increase in local price was driven by price gains in polymers in automotive markets. The favorable impact from portfolio actions relates to the addition of Dow Corning's silicones business in June 2016.
Pro forma Operating EBITDA was
$1,319 million
in 2017, up 26 percent from
$1,045 million
in 2016. The increase in Operating EBITDA was driven by increased volume growth, the favorable impact of earnings from Dow Corning's silicones business, higher local selling prices, cost savings and lower pension/OPEB costs, partially offset by higher raw material costs.
56
2016 Versus 2015
Transportation & Advanced Polymers net sales in 2016 were $897 million, up from $583 million in 2015. Net sales increased 54 percent from 2015, primarily due to a 49 percent increase in portfolio and other, reflecting the favorable impact of the addition of Dow Corning's silicones business. Volume increased 7 percent and local price and product mix and currency both decreased 1 percent. Volume increased across all geographic regions, particularly in Asia Pacific, led by strong demand for structural and elastic adhesives used in automotive applications. Local price and product mix declined across all geographic regions in response to lower raw material costs. Currency had an unfavorable impact to sales, driven by EMEA.
Operating EBITDA in 2016 was $287 million, up from $156 million in 2015. Operating EBITDA increased as the favorable impact from the Dow Corning silicones business, lower feedstock, energy and other raw material costs and higher sales volume more than offset lower selling prices.
Transportation & Advanced Polymers Outlook for 2018
Transportation & Advanced Polymers' 2018 Operating EBITDA is expected to increase meaningfully as compared with 2017 pro forma Operating EBITDA, driven by lower pension/OPEB costs, the favorable impacts of cost synergies, improved volumes and an increase in local price, partially offset by a negative impact from portfolio actions. It is anticipated that global automotive production, according to IHS, will continue to grow at 2 percent along with modest growth in the semiconductor and medical markets. The portfolio impact relates to the expected sale of DuPont Teijin Films, subject to regulatory approval.
SAFETY & CONSTRUCTION
The Safety & Construction segment is a leading provider of engineered products and integrated systems for a number of industries including construction, worker safety, energy, oil and gas, transportation, medical devices and water purification and separation. The segment satisfies the growing global needs of businesses, governments, and consumers for solutions that make life safer, healthier, and better. By uniting market-driven science with the strength of highly regarded brands, the segment strives to bring new products and solutions to solve customers' needs faster, better and more cost effectively. The segment is a leader in safety consulting, selling training products as well as consulting services, to improve the safety, productivity, and sustainability of organizations across a range of industries.
|
Safety & Construction
|
|||||||||
|
In millions
|
2017
|
2016
|
2015
|
||||||
|
Net sales
|
$
|
3,006
|
|
$
|
1,877
|
|
$
|
1,938
|
|
|
Pro forma net sales
|
$
|
5,142
|
|
$
|
4,984
|
|
|||
|
Operating EBITDA
|
$
|
415
|
|
$
|
400
|
|
|||
|
Pro forma Operating EBITDA
|
$
|
1,190
|
|
$
|
1,130
|
|
|||
|
Equity earnings
|
$
|
2
|
|
$
|
1
|
|
$
|
1
|
|
|
Safety & Construction
|
||||||
|
Percentage change from prior year
|
2017
|
2016
|
2015
|
|||
|
Change in Net Sales from Prior Period due to:
|
||||||
|
Local price & product mix
|
—
|
%
|
(1
|
)%
|
—
|
%
|
|
Currency
|
—
|
|
—
|
|
(5
|
)
|
|
Volume
|
3
|
|
(2
|
)
|
2
|
|
|
Portfolio & other
|
57
|
|
—
|
|
—
|
|
|
Total
|
60
|
%
|
(3
|
)%
|
(3
|
)%
|
|
Change in Pro Forma Net Sales from Prior Period due to:
|
||||||
|
Local price & product mix
|
(1
|
)%
|
||||
|
Currency
|
—
|
|
||||
|
Volume
|
4
|
|
||||
|
Portfolio & other
|
—
|
|
||||
|
Total
|
3
|
%
|
||||
2017 Versus 2016
Safety & Construction net sales were
$3,006 million
in 2017, up from
$1,877 million
in the 2016. Pro forma net sales were
$5,142 million
in 2017, up
3 percent
from
$4,984 million
in 2016. Pro forma net sales growth was led by volume gains of
4 percent
, slightly offset by a 1 percent decline in local price. Continued demand from industrial markets contributed to gains in NOMEX®
57
thermal-resistant garments, KEVLAR® high-strength materials and water filtration. Growth in TYVEK® protective materials reflected increased demand in industrial markets, construction and medical packaging. Declines in local price and product mix, primarily in aramids, were partially offset by pricing gains in building solutions. Regionally, volume gains were driven by Asia Pacific and EMEA followed by U.S. & Canada and Latin America. Drivers included TYVEK® for graphics and house wrap in EMEA, and gains from KEVLAR® in Asia Pacific.
Pro forma Operating EBITDA was
$1,190 million
in 2017, up 5 percent from
$1,130 million
in 2016. Pro forma Operating EBITDA increased as volume growth, lower pension/OPEB costs and cost savings were partially offset by the impact of lower local selling price and higher raw material costs.
2016 Versus 2015
Safety & Construction net sales were $1,877 million in 2016, down from $1,938 million in 2015. Net sales decreased 3 percent compared with 2015, with volume down 2 percent and local price and product mix down 1 percent. Volume decreased in all geographic regions, except Latin America, primarily in response to soft demand for reverse osmosis membranes used in industrial applications. Price was down in all geographic regions, primarily in response to lower raw material costs.
Operating EBITDA was $415 million in 2016, compared with $400 million in 2015. Operating EBITDA increased in 2016 as lower operating expenses more than offset the impact of lower selling prices and decreased sales volume.
Safety & Construction Outlook for 2018
Safety & Construction's 2018 Operating EBITDA is expected to increase notably as compared with 2017 pro forma Operating EBITDA, driven by lower pension/OPEB costs, improved plant performance, the favorable impacts of cost synergies and improved volumes. For 2018, the Company anticipates increased demand across all regions in industrial, construction and water filtration markets with demand for aramids and thermal apparel remaining strong. These market increases are expected to contribute to improved volumes, primarily in TYVEK® protective materials, building solutions and water filtration.
CORPORATE
Corporate includes certain enterprise and governance activities (including insurance operations, environmental operations, geographic management, etc.); business incubation platforms; non-business aligned joint ventures; gains and losses on the sales of financial assets; severance costs; non-business aligned litigation expenses; discontinued or non-aligned businesses and pre‑commercial activities.
|
Corporate
|
|||||||||
|
In millions
|
2017
|
2016
|
2015
|
||||||
|
Net sales
|
$
|
387
|
|
$
|
281
|
|
$
|
349
|
|
|
Pro forma net sales
|
$
|
393
|
|
$
|
294
|
|
|||
|
Operating EBITDA
|
$
|
(173
|
)
|
$
|
(257
|
)
|
|||
|
Pro forma Operating EBITDA
|
$
|
(843
|
)
|
$
|
(812
|
)
|
|||
|
Equity losses
|
$
|
(11
|
)
|
$
|
(28
|
)
|
$
|
(69
|
)
|
2017 Versus 2016
Net sales for Corporate, which primarily relate to insurance operations, were $387 million in 2017, up from $281 million in 2016. Pro forma net sales for 2017 were $393 million, up from $294 million in 2016.
Pro forma Operating EBITDA in 2017 was a loss of $843 million, compared with a loss of $812 million in 2016. Compared with 2016, pro forma Operating EBITDA decreased, primarily due to lower gains on asset sales and higher discontinued business costs, which were partially offset by lower pre-commercial expenses.
2016 Versus 2015
Net sales for Corporate were $281 million in 2016, down from $349 million in 2015. Net sales declined in 2016, primarily due to the divestiture of the AgroFresh business in the third quarter of 2015.
Operating EBITDA in 2016 was a loss of $173 million, compared with a loss of $257 million in 2015. Operating EBITDA improved in 2016 as lower asbestos-related defense costs resulting from a change in accounting policy and lower performance-based compensation costs more than offset the absence of earnings from the divestiture of the AgroFresh business.
58
LIQUIDITY AND CAPITAL RESOURCES
The Company had cash and cash equivalents and marketable securities of
$14,394 million
at
December 31, 2017
and
$6,607 million
at
December 31, 2016
, of which $12,177 million at
December 31, 2017
and $4,890 million at
December 31, 2016
, was held by subsidiaries in foreign countries, including United States territories. For each of its foreign subsidiaries, the Company makes an assertion regarding the amount of earnings intended for permanent reinvestment, with the balance available to be repatriated to the United States.
The Tax Cuts and Jobs Act (“The Act”) requires companies to pay a one-time transition tax on the earnings of foreign subsidiaries, a portion of which were previously considered permanently reinvested by the Company (see Note
8
to the Consolidated Financial Statements for additional details on The Act). The cash held by foreign subsidiaries for permanent reinvestment is generally used to finance the Subsidiaries' operational activities and future foreign investments. The Company is currently evaluating the impact of The Act on its permanent reinvestment assertion. In addition to the one-time transition tax, a deferred tax liability for withholding taxes has been accrued on a portion of unrepatriated earnings at December 31, 2017. At December 31, 2017, management believed that sufficient liquidity was available in the United States. In the event that additional foreign funds are needed in the United States, the Company has the ability to repatriate additional funds. The repatriation could result in an adjustment to the tax liability due to contributing factors such as withholding taxes, income taxes and the impact of foreign currency movements. As such, it is not practicable to calculate the unrecognized deferred tax liability on undistributed foreign earnings.
The Company’s cash flows from operating, investing and financing activities, as reflected in the consolidated statements of cash flows, are summarized in the following table:
|
Cash Flow Summary
|
|||||||||
|
In millions
|
2017
|
2016
|
2015
|
||||||
|
Cash provided by (used for):
|
|||||||||
|
Operating activities
|
$
|
8,695
|
|
$
|
5,600
|
|
$
|
7,607
|
|
|
Investing activities
|
4,274
|
|
(3,479
|
)
|
(1,350
|
)
|
|||
|
Financing activities
|
(6,523
|
)
|
(4,014
|
)
|
(3,132
|
)
|
|||
|
Effect of exchange rate changes on cash
|
297
|
|
(77
|
)
|
(202
|
)
|
|||
|
Cash reclassified as held for sale
|
88
|
|
—
|
|
—
|
|
|||
|
Summary
|
|||||||||
|
Increase (decrease) in cash and cash equivalents
|
$
|
6,831
|
|
$
|
(1,970
|
)
|
$
|
2,923
|
|
|
Cash and cash equivalents at beginning of year
|
6,607
|
|
8,577
|
|
5,654
|
|
|||
|
Cash and cash equivalents at end of year
|
$
|
13,438
|
|
$
|
6,607
|
|
$
|
8,577
|
|
Cash Flows from Operating Activities
Cash provided by operating activities increased in
2017
compared with
2016
, primarily driven by higher cash earnings, advance payments from customers in the Agriculture segment and customers with long-term ethylene supply agreements, a tax refund related to a voluntary pension contribution, and a one-time cash receipt related to the Nova patent infringement award. These items were partially offset by a reduction in balances in accounts receivable securitization facilities, increased pension contributions resulting from a change in control provision in a Dow non-qualified U.S. pension plan, higher integration and separation costs and a cash payment related to the Bayer CropScience arbitration matter. Cash provided by operating activities decreased in
2016
compared with
2015
, primarily due to cash payments related to the settlement of the urethane matters class action lawsuit and opt‑out cases, increased integration and separation costs, a cash payment related to the settlement of an uncertain tax position and a one-time payment related to the termination of a terminal use agreement.
|
Net Working Capital at Dec 31
|
||||||
|
In millions
|
2017
|
2016
|
||||
|
Current assets
|
$
|
49,893
|
|
$
|
23,659
|
|
|
Current liabilities
|
26,128
|
|
12,604
|
|
||
|
Net working capital
|
$
|
23,765
|
|
$
|
11,055
|
|
|
Current ratio
|
1.91:1
|
|
1.88:1
|
|
||
Net working capital increased from December 31, 2016 to December 31, 2017, primarily related to the impact of the Merger. See Note
3
to the Consolidated Financial Statements for additional information on the Merger.
59
Cash Flows from Investing Activities
Cash provided by investing activities in
2017
was primarily from cash acquired in the Merger, proceeds from sales and maturities of investments and divestitures, including the divestitures of the DAS Divested Ag Business, the EAA Business and certain assets related to DuPont's crop protection business and R&D organization. These items were partially offset by capital expenditures, purchases of investments, payments to a trust related to certain non-qualified benefit and deferred compensation plans as a result of the Merger and loans to nonconsolidated affiliates, primarily with Sadara. Cash used for investing activities in
2016
was primarily for capital expenditures as well as investments in and loans to nonconsolidated affiliates, primarily with Sadara, which were partially offset by net cash acquired in the Dow Corning ownership restructure. Cash used for investing activities in
2015
was primarily for capital expenditures; purchases of investments, including the repayment of outstanding loans issued under company-owned life insurance policies; and investments in and loans made to nonconsolidated affiliates, primarily with Sadara. This was partially offset by proceeds received from divestitures, including the divestitures of ANGUS Chemical Company and the AgroFresh business, proceeds from the sale of Dow's interest in MEGlobal and proceeds from sales and maturities of investments.
In 2017, Dow loaned $735 million to Sadara and converted $718 million to equity. Dow had a note receivable from Sadara of $275 million at December 31, 2017. Dow loaned $1,015 million to Sadara and converted $1,230 million to equity during 2016, and had a note receivable from Sadara of $258 million at December 31, 2016. All or a portion of the outstanding loan to Sadara could potentially be converted to equity in future periods. Dow expects to loan between zero and $200 million to Sadara in 2018. See Note 12 to the Consolidated Financial Statements for additional information.
On August 28, 2017, Dow and Saudi Aramco announced a non-binding Memorandum of Understanding that sets forth a process for Dow to acquire an additional 15 percent ownership interest in Sadara from Saudi Aramco. The current equity ownership split is 65 percent Saudi Aramco and 35 percent Dow. If the potential transaction is concluded as presently proposed, Dow and Saudi Aramco would each hold a 50 percent equity stake in Sadara.
The Company's capital expenditures, including capital expenditures of consolidated variable interest entities, were $3,570 million in 2017, $3,804 million in 2016 and $3,703 million in 2015. The Company expects capital spending in
2018
to be approximately $4.2 billion to $4.4 billion. In addition, the Company expects approximately $600 million of additional capital spending for targeted cost synergy and business separation projects.
Cash Flows from Financing Activities
Cash used for financing activities in
2017
included dividends paid to stockholders, repurchases of DowDuPont common stock and payments of notes payable and long-term debt. Cash used for financing activities in
2016
included dividends paid to stockholders (including the accelerated payment of the fourth quarter preferred dividend), repurchases of Dow common stock and payments of long-term debt. Cash used for financing activities in
2015
included dividends paid to stockholders, repurchases of Dow common stock and payments of long-term debt, including the early redemption of International Notes ("InterNotes") which was partially offset by proceeds from the issuance of long-term debt, including debt related to the split-off of the chlorine value chain. See Notes
15
and
17
to the Consolidated Financial Statements for additional information related to the issuance or retirement of debt and the share repurchase program, respectively, and Note
6
for information on the split-off of the chlorine value chain.
Free Cash Flow
The Company defines free cash flow as cash provided by operating activities less capital expenditures. Under this definition, free cash flow represents the cash that remains available to the Company, after investing in its asset base, to fund obligations using the Company's primary source of incremental liquidity - cash provided by operating activities. Free cash flow is an integral financial measure used in the Company's financial planning process. This financial measure is not recognized in accordance with U.S. GAAP and should not be viewed as an alternative to U.S. GAAP financial measures of performance. All companies do not calculate non-GAAP financial measures in the same manner and, accordingly, the Company's free cash flow definition may not be consistent with the methodologies used by other companies.
For further information relating to the change in cash provided by operating activities, see the discussion above under the section entitled "Cash Flows from Operating Activities."
|
Reconciliation of "Cash Provided by Operating Activities" to Free Cash Flow
|
|||||||||
|
In millions
|
2017
|
2016
|
2015
|
||||||
|
Cash provided by operating activities
|
$
|
8,695
|
|
$
|
5,600
|
|
$
|
7,607
|
|
|
Capital expenditures
|
(3,570
|
)
|
(3,804
|
)
|
(3,703
|
)
|
|||
|
Free Cash Flow
|
$
|
5,125
|
|
$
|
1,796
|
|
$
|
3,904
|
|
60
Liquidity & Financial Flexibility
The Company’s primary source of incremental liquidity is cash provided by operating activities. The generation of cash from operations and each of Dow's and DuPont's (the "Subsidiaries") ability to access the commercial paper market, the long-term debt market, syndicated credit lines, bilateral credit lines and bank financing, including committed repurchase facilities, are expected to meet the Company’s cash requirements for working capital, capital expenditures, debt maturities, dividend payments, share repurchases, contributions to pension plans and other needs. The Company’s primary liquidity sources are through the Subsidiaries as discussed below. Management expects that the Company and each of the Subsidiaries will continue to have sufficient liquidity and financial flexibility to meet respective business obligations as they come due.
Dow's Liquidity Sources
Credit Ratings
At January 31, 2018, Dow's credit ratings were as follows:
|
Credit Ratings
|
Long-Term Rating
|
Short-Term Rating
|
Outlook
|
|
Standard & Poor’s
|
BBB
|
A-2
|
Stable
|
|
Moody’s Investors Service
|
Baa2
|
P-2
|
Stable
|
|
Fitch Ratings
|
BBB
|
F2
|
Watch Positive
|
Downgrades in Dow's credit ratings would increase borrowing costs on certain indentures and could impact its ability to access credit markets.
Commercial Paper - Dow
Dow issues promissory notes under U.S. and Euromarket commercial paper programs. At December 31, 2017, Dow had
$231 million
of commercial paper outstanding (zero at December 31, 2016). Dow maintains access to the commercial paper market at competitive rates. Amounts outstanding under Dow's commercial paper programs during the period may be greater, or less, than the amount reported at the end of the period. Subsequent to December 31, 2017, Dow issued approximately
$700 million
of commercial paper that remains outstanding at February 15, 2018.
Committed Credit Facilities - Dow
In the event the Company has short-term liquidity needs, it can access liquidity through Dow's committed and available credit facilities. At December 31, 2017, Dow had total committed credit facilities of
$10.9 billion
and available credit facilities of
$6.4 billion
. See Note
15
to the Consolidated Financial Statements for additional information on committed and available credit facilities.
In connection with the Dow Corning ownership restructure, on May 31, 2016, Dow Corning incurred $4.5 billion of indebtedness under a certain third party credit agreement ("DCC Term Loan Facility"). Dow subsequently guaranteed the obligations of Dow Corning under the DCC Term Loan Facility and, as a result, the covenants and events of default applicable to the DCC Term Loan Facility are substantially similar to the covenants and events of default set forth in Dow's Five Year Competitive Advance and Revolving Credit Facility. In the second quarter of 2017, Dow Corning exercised a 364-day extension option making amounts borrowed under the DCC Term Loan Facility repayable on May 29, 2018, and amended the DCC Term Loan Facility to include an additional 19-month extension option, at Dow Corning's election, upon satisfaction of certain customary conditions precedent. On February 8, 2018, Dow Corning delivered a notice of intent to exercise the 19-month extension option on the DCC Term Loan Facility.
Uncommitted Credit Facilities and Outstanding Letters of Credit - Dow
Dow had uncommitted credit facilities in the form of unused bank credit lines of approximately
$2,853 million
at
December 31, 2017
. These lines can be used to support short-term liquidity needs and general purposes, including letters of credit. Dow had outstanding letters of credit of
$433 million
at
December 31, 2017
. These letters of credit support commitments made in the ordinary course of business.
Accounts Receivable Securitization Facilities - Dow
Dow has access to committed accounts receivable securitization facilities in the United States and Europe, from which amounts available for funding are based upon available and eligible accounts receivable within each of the facilities. Dow renewed the United States facility in June 2015 for a term that extends to June 2018. The Europe facility was renewed in July 2015 for a term that extends to July 2018.
61
In the fourth quarter of 2017, Dow suspended further sales of trade accounts receivable through these facilities and began reducing outstanding balances under these facilities through collections of trade accounts receivable previously sold to such conduits. Dow has the ability to resume such sales to the conduits, subject to certain prior notice requirements, at the discretion of Dow. See Note
14
to the Consolidated Financial Statements for further information.
DuPont's Liquidity Sources
Credit Ratings
At January 31, 2018, DuPont's credit ratings were as follows:
|
Credit Ratings
|
Long-Term Rating
|
Short-Term Rating
|
Outlook
|
|
Standard & Poor’s
|
A-
|
A-2
|
Stable
|
|
Moody’s Investors Service
|
A3
|
P-2
|
Negative
|
|
Fitch Ratings
|
A
|
F1
|
Watch Negative
|
Downgrades in DuPont's credit ratings would increase borrowing costs on certain indentures and could impact its ability to access debt capital markets.
Commercial Paper - DuPont
DuPont issues promissory notes under U.S. commercial paper programs. At
December 31, 2017
, DuPont had
$1,436 million
of commercial paper outstanding. DuPont maintains access to the commercial paper market at competitive rates.
Committed Credit Facilities - DuPont
In the event the Company has short-term liquidity needs, it can access liquidity through DuPont's committed and available credit facilities. At
December 31, 2017
, DuPont had total committed credit facilities of $7.5 billion under its Term Loan Facility and amended revolving credit facility (the "RCF") with remaining available credit facilities of $6.0 billion. See Note
15
to the Consolidated Financial Statements for additional information.
Term Loan Facility - DuPont
In March 2016, DuPont entered into a credit agreement that provides for a three-year, senior unsecured term loan facility in the aggregate principal amount of $4.5 billion (the "Term Loan Facility") under which DuPont may make up to seven term loan borrowings and amounts repaid or prepaid are not available for subsequent borrowings. The facility was amended in 2017 to extend the date on which the commitment to lend terminates to July 27, 2018. The proceeds from the borrowings under the Term Loan Facility will be used for DuPont's general corporate purposes including debt repayment, working capital and funding a portion of DowDuPont's costs and expenses. The Term Loan Facility matures in March 2019, unless extended by mutual agreement, at which time all outstanding borrowings, including accrued but unpaid interest, become immediately due and payable. At December 31, 2017, DuPont had made three term loan borrowings in an aggregate principal amount of $1.5 billion and had unused commitments of $3 billion under the Term Loan Facility.
Uncommitted Credit Facilities and Outstanding Letters of Credit - DuPont
DuPont had uncommitted credit facilities in the form of unused bank credit lines of approximately
$731 million
at
December 31, 2017
. These lines can be used to support short-term liquidity needs and general corporate purposes, including letters of credit. DuPont had outstanding letters of credit of
$177 million
at
December 31, 2017
. These letters of credit support commitments made in the ordinary course of business.
Debt
The Company’s public debt instruments and primary, private credit agreements (collectively "Debt Instruments") reside with the Subsidiaries. See Note
15
to the Consolidated Financial Statements for information related to the Subsidiaries' notes payable and long-term debt activity, including debt retired and issued. The following table reflects the debt of the Subsidiaries:
|
Total Debt
|
Dec 31, 2017
|
Dec 31, 2016
|
||||||||||
|
In millions
|
Dow
|
DuPont
|
Total
|
|||||||||
|
Notes payable
|
$
|
484
|
|
$
|
1,464
|
|
$
|
1,948
|
|
$
|
272
|
|
|
Long-term debt due within one year
|
752
|
|
1,315
|
|
2,067
|
|
635
|
|
||||
|
Long-term debt
|
19,765
|
|
10,291
|
|
30,056
|
|
20,456
|
|
||||
|
Total debt
|
$
|
21,001
|
|
$
|
13,070
|
|
$
|
34,071
|
|
$
|
21,363
|
|
62
The Debt Instruments of the Subsidiaries contain, among other provisions, certain customary restrictive covenant and default provisions. Dow’s Five Year Competitive Advance and Revolving Credit Facility contains a financial covenant that Dow must maintain its ratio of consolidated indebtedness to its consolidated capitalization at no greater than 0.65 to 1.00 at any time the aggregate outstanding amount of loans under the Five Year Competitive Advance and Revolving Credit Facility equals or exceeds $500 million. The ratio of Dow’s consolidated indebtedness to its consolidated capitalization was 0.43 to 1.00 at
December 31, 2017
. DuPont’s Term Loan Facility and RCF contain a financial covenant requiring that the ratio of total indebtedness to total capitalization for DuPont and its consolidated subsidiaries not exceed 0.6667 to 1.00. At
December 31, 2017
, management believes each of the Subsidiaries were in compliance with all of their respective covenants and default provisions. For information on the Subsidiaries' covenants and default provisions, see Note
15
to the Consolidated Financial Statements.
Dividends
The following table provides dividends paid to common and preferred shareholders for the years ended
December 31, 2017
,
2016
and
2015
:
|
Dividends Paid for the years ended Dec 31
|
|||||||||
|
In millions, except per share amounts
|
2017
|
2016
|
2015
|
||||||
|
Dividends paid, per common share
1
|
$
|
2.22
|
|
$
|
1.84
|
|
$
|
1.68
|
|
|
Dividends paid to common stockholders
2
|
$
|
3,394
|
|
$
|
2,037
|
|
$
|
1,913
|
|
|
Dividends paid to preferred shareholders
3
|
$
|
—
|
|
$
|
425
|
|
$
|
340
|
|
|
1.
|
The 2017 dividend is comprised of $0.38 per share of DowDuPont dividends declared and paid in the fourth quarter of 2017 and the remaining amount relates to payments of Dow dividends declared prior to the Merger.
|
|
2.
|
The 2017 dividend consists of $885 million paid to DowDuPont common stockholders for dividends declared after the Merger, as well as $2,179 million paid to Dow common stockholders for dividends declared prior to the Merger, and $330 million paid to DuPont common stockholders after the Merger for dividends declared prior to the Merger.
|
3. Dividends paid to Dow preferred shareholders in 2016 includes payment of the fourth quarter 2016 declared dividend. On December 30, 2016, Dow converted all outstanding shares of its Dow Preferred Stock into shares of Dow's common stock. As a result of this conversion, no shares of Dow Preferred Stock are issued or outstanding.
Share Repurchase Program
On November 2, 2017, the Company announced the Board authorized an initial $4 billion share repurchase program, which has no expiration date. At December 31, 2017, the Company had spent
$1 billion
on repurchases of DowDuPont common stock under the program. Although there is no timeline to complete the share repurchase program, DowDuPont intends to repurchase approximately $1.0 billion of the Company's stock in the first quarter of 2018.
In connection with the Merger, Dow's $9.5 billion share repurchase program was canceled. At the time of cancellation, Dow had spent $8.1 billion on repurchases of Dow common stock under the share buyback program.
For additional information related to the share repurchase program, see Part II. Item 5. Market for Registrant's Common Equity, Related Stockholder Matters and Issuer Purchases of Equity Securities and Note
17
to the Consolidated Financial Statements.
Rabbi Trust
DuPont entered into a trust agreement in 2013 (as amended and restated in 2017) that established and requires DuPont to fund a trust (the "Trust") for cash obligations under certain non-qualified benefit and deferred compensation plans upon a change in control event as defined in the Trust agreement. Under the Trust agreement, the consummation of the Merger was a change in control event. As a result, in November 2017, DuPont contributed $571 million to the Trust. In the fourth quarter of 2017, $13 million was distributed to DuPont according to the Trust agreement and at December 31, 2017, the balance in the Trust was $558 million.
Pension Plans
Dow and DuPont did not merge their pension plans and other postretirement benefit plans as a result of the Merger. Dow and DuPont have defined benefit pension plans in the United States and a number of other countries. Dow and DuPont’s funding policies are to contribute to defined benefit pension plans in the United States and a number of other countries based on pension funding laws and local country requirements. Contributions exceeding funding requirements may and have been made at Dow and DuPont’s discretion. In
2017
,
2016
and
2015
, Dow contributed approximately $1,676 million, $629 million and $844 million to its pension plans, respectively, including contributions to fund benefit payments for its non-qualified pension plans. DuPont contributed $68 million post-Merger to its pension plans, including contributions to fund benefit payments for its non-qualified pension plans. Dow expects to contribute approximately $500 million to its pension plans and DuPont expects to contribute approximately $200 million to its pension plans in
2018
. See Note
19
to the Consolidated Financial Statements for additional information concerning the Company’s pension plans.
63
Dow
The provisions of a U.S. non-qualified pension plan for Dow require the payment of plan obligations to certain participants upon a change in control of Dow, which occurred at the time of the Merger. Certain participants could elect to receive a lump-sum payment or direct Dow to purchase an annuity on their behalf using the after-tax proceeds of the lump sum. In the fourth quarter of 2017, Dow paid $940 million to plan participants and $230 million to an insurance company for the purchase of annuities, which were included in "Pension contributions" in the consolidated statements of cash flows. Dow also paid $205 million for income and payroll taxes for participants electing the annuity option. Dow recorded a settlement charge of $687 million associated with the payout in the fourth quarter of 2017.
DuPont
Prior to the Merger, DuPont made total contributions of $2.9 billion to its principal U.S pension plan in 2017, reflecting discretionary contributions. The $2.9 billion contribution was taken as a deduction on DuPont’s 2016 federal tax return and resulted in a net operating loss for tax purposes. This loss generated an overpayment of taxes of approximately $800 million. A portion of the overpayment will be applied against the current year tax liability. The remainder of the loss generated a refund of approximately $700 million, which was received during the fourth quarter of 2017.
Restructuring, Goodwill Impairment and Asset Related Charges - Net
DowDuPont Cost Synergy Program
The activities related to the DowDuPont Cost Synergy Program ("Synergy Program") are expected to result in additional cash expenditures of approximately
$1,175 million
to
$1,315 million
, primarily by the end of 2019, consisting of severance and related benefit costs and costs associated with exit and disposal activities, including environmental remediation (see Note
5
to the Consolidated Financial Statements). The Synergy Program includes certain asset actions, including strategic decisions regarding the cellulosic biofuel business reflected in the preliminary fair value measurement of DuPont’s assets as of the Merger date. Current estimated total pretax restructuring charges could be impacted by future adjustments to the preliminary fair value of DuPont’s assets. The Company expects to incur additional costs in the future related to its restructuring activities. Future costs are expected to include demolition costs related to closed facilities and restructuring plan implementation costs; these costs will be recognized as incurred. The Company also expects to incur additional employee-related costs, including involuntary termination benefits, related to its other optimization activities. These costs cannot be reasonably estimated at this time.
Restructuring Plans Initiated Prior to Merger
The activities related to Dow's 2016 restructuring plan are expected to result in additional cash expenditures of approximately $70 million, primarily through June 30, 2018, consisting of severance and related benefit costs and costs associated with exit and disposal activities, including environmental remediation (see Note
5
to the Consolidated Financial Statements).
64
Contractual Obligations
The following table summarizes the Subsidiaries' contractual obligations, commercial commitments and expected cash requirements for interest at
December 31, 2017
. Additional information related to these obligations can be found in Notes
15
,
16
and
19
to the Consolidated Financial Statements.
|
Contractual Obligations
|
Payments Due In
|
||||||||||||||
|
In millions
|
2018
|
2019-2020
|
2021-2022
|
2023 & Beyond
|
Total
|
||||||||||
|
Long-term debt obligations
1
|
$
|
2,038
|
|
$
|
13,776
|
|
$
|
4,577
|
|
$
|
11,585
|
|
$
|
31,976
|
|
|
Expected cash requirements for interest
2
|
1,387
|
|
2,055
|
|
1,404
|
|
7,622
|
|
12,468
|
|
|||||
|
Pension and other postretirement benefits
|
1,082
|
|
1,740
|
|
2,534
|
|
13,728
|
|
19,084
|
|
|||||
|
Operating leases
|
614
|
|
903
|
|
630
|
|
1,186
|
|
3,333
|
|
|||||
|
Purchase obligations
3
|
3,790
|
|
5,394
|
|
4,284
|
|
7,120
|
|
20,588
|
|
|||||
|
Other noncurrent obligations
4
|
471
|
|
1,931
|
|
1,086
|
|
2,443
|
|
5,931
|
|
|||||
|
Total contractual obligations
|
$
|
9,382
|
|
$
|
25,799
|
|
$
|
14,515
|
|
$
|
43,684
|
|
$
|
93,380
|
|
|
1.
|
Excludes unamortized debt discount and issuance costs of
$346 million
and unamortized debt step-up premium of
$492 million
. Includes capital lease obligations of
$287 million
. Assumes the option to extend the DCC Term Loan facility will be exercised.
|
|
2.
|
Cash requirements for interest on long-term debt was calculated using current interest rates at
December 31, 2017
and includes
$5,163 million
of various floating rate notes.
|
|
3.
|
Includes take-or-pay and throughput obligations, outstanding purchase orders and other commitments greater than $1 million obtained through a survey conducted by the Subsidiaries.
|
|
4.
|
Includes liabilities related to asbestos litigation, environmental remediation, legal settlements and other noncurrent liabilities. The table also includes future payments under DuPont Pioneer license agreements of
$1,173 million
on an undiscounted basis (
$1,079 million
on a discounted basis). The table excludes uncertain tax positions due to uncertainties in the timing of the effective settlement of tax positions with the respective taxing authorities and deferred tax liabilities as it is impractical to determine whether there will be a cash impact related to these liabilities. The table also excludes deferred revenue as it does not represent future cash requirements arising from contractual payment obligations.
|
The Subsidiaries expect to meet their contractual obligations through their normal sources of liquidity and believe they have the financial resources to satisfy these contractual obligations.
Off-balance Sheet Arrangements
Off-balance sheet arrangements are obligations the Company has with nonconsolidated entities related to transactions, agreements or other contractual arrangements. The Company holds variable interests in joint ventures accounted for under the equity method of accounting. The Company is not the primary beneficiary of these joint ventures and therefore is not required to consolidate the entities (see Note
23
to the Consolidated Financial Statements). In addition, see Note
14
to the Consolidated Financial Statements for information regarding the transfer of financial assets.
Guarantees arise during the ordinary course of business from relationships with customers and nonconsolidated affiliates when the Subsidiaries undertake an obligation to guarantee the performance of others if specific triggering events occur. The Subsidiaries had combined outstanding guarantees at December 31, 2017 of
$5,960 million
, compared with
$6,043 million
of outstanding guarantees of Dow at December 31, 2016. Additional information related to the guarantees of the Subsidiaries can be found in the “Guarantees” section of Note
16
to the Consolidated Financial Statements.
Fair Value Measurements
See Note
19
to the Consolidated Financial Statements for information related to fair value measurements of pension and other postretirement benefit plan assets; see Note
21
for information related to other-than-temporary impairments; and, see Note
22
for additional information concerning fair value measurements, including the Company’s interests held in trade receivable conduits.
OUTLOOK
The trajectory of global economic expansion has gained momentum - driven by robust fundamentals in consumer and business confidence, employment and wage growth and manufacturing and infrastructure investment activity. In developed economies in particular, such as the United States, Germany, France, Canada and the U.K., DowDuPont continues to see strong leading indicators of broad-based growth. Furthermore, early signs from the business community point to U.S. tax reform as a catalyst for further domestic capital investments, which will take advantage of enhanced competitiveness and pro-business incentives. Adding to this, the emerging middle class in developing economies, most notably in India and China, but also in Africa and the Middle East, continues to support sustainable growth.
All of this bodes well for the products and technologies within DowDuPont’s portfolio, which are well positioned to meet growing needs in the Materials Science, Agriculture and Specialty Product sectors. Looking ahead, DowDuPont's levers of value creation
65
are clear: continuing to further unlock the cost and growth synergies of this merger transaction; capitalizing on the Company's early success and achieving the enhanced cost synergy commitment; delivering new products from the Company's in-flight growth investments and powerful innovation pipeline; and quickly standing and separating into three industry-leading companies.
OTHER MATTERS
Critical Accounting Estimates
The preparation of financial statements and related disclosures in conformity with U.S. GAAP requires management to make judgments, assumptions and estimates that affect the amounts reported in the consolidated financial statements and accompanying notes. Note 1 to the Consolidated Financial Statements describes the significant accounting policies and methods used in the preparation of the consolidated financial statements. DowDuPont’s accounting policies that are impacted by judgments, assumptions and estimates are described below.
Litigation
The Company and its subsidiaries are subject to legal proceedings and claims arising out of the normal course of business including product liability, patent infringement, governmental regulation, contract and commercial litigation, and other actions. The Company routinely assesses the legal and factual circumstances of each matter, the likelihood of any adverse outcomes to these matters, as well as ranges of probable losses. A determination of the amount of the reserves required, if any, for these contingencies is made after thoughtful analysis of each known claim. The Company has an active risk management program consisting of numerous insurance policies secured from many carriers covering various timeframes. These policies may provide coverage that could be utilized to minimize the financial impact, if any, of certain contingencies. The required reserves may change in the future due to new developments in each matter. For further discussion see Note
16
to the Consolidated Financial Statements.
Asbestos-Related Matters of Union Carbide Corporation
Union Carbide is and has been involved in a large number of asbestos-related suits filed primarily in state courts during the past four decades. These suits principally allege personal injury resulting from exposure to asbestos-containing products and frequently seek both actual and punitive damages. The alleged claims primarily relate to products that Union Carbide sold in the past, alleged exposure to asbestos-containing products located on Union Carbide’s premises, and Union Carbide’s responsibility for asbestos suits filed against a former Union Carbide subsidiary, Amchem Products, Inc. ("Amchem"). Each year, Ankura Consulting Group, LLC ("Ankura") performs a review for Union Carbide based upon historical asbestos claims, resolution and historical defense spending. Union Carbide compares current asbestos claim, resolution and defense spending activity with the results of the most recent Ankura study at each balance sheet date to determine whether the asbestos-related liability continues to be appropriate.
In 2016, Dow and Union Carbide elected to change their method of accounting for Union Carbide's asbestos-related defense and processing costs from expensing as incurred to estimating and accruing a liability. In addition to performing their annual review of pending and future asbestos claim resolution activity, Ankura also performed a review of Union Carbide's asbestos-related defense and processing costs to determine a reasonable estimate of future defense and processing costs to be included in the asbestos-related liability, through the terminal year of 2049.
For additional information, see Part I, Item 3. Legal Proceedings; Asbestos-Related Matters of Union Carbide Corporation in Management's Discussion and Analysis of Financial Condition and Results of Operations; and Notes
1
and
16
to the Consolidated Financial Statements.
Environmental Matters
Accruals for environmental matters are recorded when it is probable that a liability has been incurred and the amount of the liability can be reasonably estimated. At December 31, 2017, the Company had accrued obligations of
$1,311 million
for probable environmental remediation and restoration costs, including
$219 million
for the remediation of Superfund sites. As remediation activities vary substantially in duration and cost from site to site, it is difficult to develop precise estimates of future site remediation costs. The Company's estimates are based on a number of factors, including the complexity of the geology, the nature and extent of contamination, the type of remedy, the outcome of discussions with regulatory agencies and other Potentially Responsible Parties ("PRPs") at multi-party sites and the number of and financial viability of other PRPs. Therefore, considerable uncertainty exists with respect to environmental remediation and costs, and under adverse changes in circumstances, it is reasonably possible that the ultimate cost with respect to these particular matters could range up to
two and a half
times above that amount. Consequently, it is reasonably possible that environmental remediation and restoration costs in excess of amounts accrued could have a material impact on the Company’s results of operations, financial condition and cash flows. It is the opinion of the Company’s management, however, that the possibility is remote that costs in excess of the range disclosed will have a material impact on the Company’s results of operations, financial condition or cash flows. For further discussion, see Environmental Matters in Management’s Discussion and Analysis of Financial Condition and Results of Operations and Notes
1
and
16
to the Consolidated Financial Statements.
66
Goodwill
In the fourth quarter of 2017, the Company early adopted ASU 2017-04, "Intangibles - Goodwill and Other (Topic 350): Simplifying the Test for Goodwill Impairment," as part of the annual goodwill impairment testing. See Note
2
to the Consolidated Financial Statements for additional information.
The Company performs goodwill impairment testing at the reporting unit level which is defined as the operating segment or one level below the operating segment. One level below the operating segment, or component, is a business in which discrete financial information is available and regularly reviewed by segment management. The Company aggregates certain components into reporting units based on economic similarities. The operating segment is the reporting unit for Agriculture, Electronics & Imaging, Nutrition & Health, and Transportation & Advanced Polymers operating segments. The Company tests goodwill for impairment annually (during the fourth quarter), or more frequently when events or changes in circumstances indicate it is more likely than not that the fair value of a reporting unit has declined below its carrying value. Goodwill is evaluated for impairment using qualitative and/or quantitative testing procedures. At December 31, 2017, the Company has defined 9 operating segments and 18 reporting units; goodwill is carried by 17 of these reporting units.
The Company has the option to first perform qualitative testing to determine whether it is more likely than not that the fair value of a reporting unit is less than its carrying value. Qualitative factors assessed at the Company level include, but are not limited to, GDP growth rates, long-term hydrocarbon and energy prices, equity and credit market activity, discount rates, foreign exchange rates and overall financial performance. Qualitative factors assessed at the reporting unit level include, but are not limited to, changes in industry and market structure, competitive environments, planned capacity and new product launches, cost factors such as raw material prices, and financial performance of the reporting unit. If the Company chooses not to complete a qualitative assessment for a given reporting unit or if the initial assessment indicates that it is more likely than not that the estimated fair value of a reporting unit is less than its carrying value, additional quantitative testing is required.
Quantitative testing requires the fair value of the reporting unit to be compared with its carrying value. If the reporting unit's carrying value exceeds its fair value, an impairment charge is recognized for the difference. The Company utilizes a discounted cash flow methodology to calculate the fair value of its reporting units. This valuation technique has been selected by management as the most meaningful valuation method due to the limited number of market comparables for the Company's reporting units. However, where market comparables are available, the Company includes EBIT/EBITDA multiples as part of the reporting unit valuation analysis. The discounted cash flow valuations are completed using the following key assumptions (including certain ranges used for the 2017 testing): projected revenue growth rates, or compounded annual growth rates, over a five to ten-year cash flow forecast period, which ranged from 0.1 percent to 6.4 percent and varied by reporting unit based on underlying business fundamentals and future expectations; discount rates, which ranged from 7.2 percent to 9.3 percent; tax rates; terminal values, differentiated based on the cash flow projection of each reporting unit and the projected net operating profit after tax ("NOPAT") growth rate, which ranged from 0.5 percent to 3.0 percent; currency exchange rates; and forecasted long-term hydrocarbon and energy prices, by geographic region and by year, which included the Company's key feedstocks as well as natural gas and crude oil (due to its correlation to naphtha). These key assumptions are determined through evaluation of the Company as a whole and underlying business fundamentals and industry risk.
The Company also monitors and evaluates its market capitalization relative to book value. When the market capitalization of the Company falls below book value, management undertakes a process to evaluate whether a change in circumstances has occurred that would indicate it is more likely than not that the fair value of any of its reporting units has declined below carrying value. This evaluation process includes the use of third-party market-based valuations and internal discounted cash flow analysis. As part of the annual goodwill impairment test, the Company also compares market capitalization with the most recent total estimated fair value of its reporting units to ensure that significant differences are understood. At December 31, 2017, the Company's market capitalization exceeded book value.
2017 Goodwill Impairment Testing
Effective with the Merger, the Company updated its reporting units to align with the level at which discrete financial information is available for review by management. In connection with the Merger, the Company recorded
$45,105 million
of goodwill, representing the preliminary fair value as of the effective date of the Merger. Goodwill resulting from the Merger was assigned to reporting units based on the acquisition method of accounting and is considered preliminary. For the remaining goodwill balance, a relative fair value method was used to reallocate goodwill for reporting units of which the composition had changed. No impairment indicators were identified as a result of the updated reporting unit alignment and reallocation of goodwill. In the f
ourth
quarter of 2017, quantitative testing was performed on twelve reporting units and a qualitative assessment was performed on the remaining reporting units that carry goodwill.
67
For the qualitative assessments, management considered the factors at both the Company level and the reporting unit level. Based on the qualitative assessment, management concluded it is not more likely than not that the fair value of the reporting unit is less than the carrying value of the reporting unit.
Upon completion of quantitative testing in the fourth quarter of 2017, the Company determined the Coatings & Performance Monomers reporting unit was impaired. Throughout 2017, the Coatings & Performance Monomers reporting unit did not consistently meet expected financial performance targets, primarily due to increasing commoditization in coatings markets and competition, as well as customer consolidation in end markets which have reduced growth opportunities. As a result, the Coatings & Performance Monomers reporting unit lowered future revenue and profitability expectations. The fair value of the Coatings & Performance Monomers reporting unit was determined using a discounted cash flow methodology that reflected reductions in projected revenue growth rates, primarily driven by modified sales volume and pricing assumptions, as well as revised expectations for future growth rates. These discounted cash flows did not support the carrying value of the Coatings & Performance Monomers reporting unit. As a result, the Company recorded a goodwill impairment charge for the Coatings & Performance Monomers reporting unit of $1,491 million in the fourth quarter of 2017, included in “Restructuring, goodwill impairment and asset related charges - net” in the consolidated statements of income and related to the Performance Materials & Coatings segment. At December 31, 2017, the Coatings & Performance Monomers reporting unit carried
$1,071 million
of goodwill.
The fair values of the remaining reporting units exceeded their carrying values and no other goodwill impairments were identified as a result of the 2017 testing.
Pension and Other Postretirement Benefits
The amounts recognized in the consolidated financial statements related to pension and other postretirement benefits are determined from actuarial valuations. Inherent in these valuations are assumptions including expected return on plan assets, discount rates at which the liabilities could have been settled, rate of increase in future compensation levels, mortality rates and health care cost trend rates. These assumptions are updated annually. In accordance with U.S. GAAP, actual results that differ from the assumptions are accumulated and amortized over future periods and, therefore, affect expense recognized and obligations recorded in future periods. The U.S. pension plans represent the majority of Dow and DuPont’s pension plan assets and pension obligations.
Effective January 1, 2016, Dow adopted the spot rate approach to determine the discount rate utilized to measure the service cost and interest cost components of net periodic pension and other postretirement benefit costs for the U.S. and other selected countries. DuPont also adopted the spot rate approach for its U.S. plans. Under the spot rate approach, Dow and DuPont calculate service costs and interest costs by applying individual spot rates from a yield curve (based on high-quality corporate bond yields) for each selected country to the separate expected cash flow components of service cost and interest cost. Service cost and interest cost for all other plans are determined on the basis of the single equivalent discount rates derived in determining those plan obligations. Dow and DuPont changed to the new method to provide a more precise measure of interest and service costs for certain plans by improving the correlation between projected benefit cash flows and the discrete spot yield curves. The change in accounting estimate was applied prospectively starting in 2016.
The following information relates to Dow and DuPont's U.S. plans only; a similar approach is used for Dow and DuPont's non-U.S. plans. Dow and DuPont determine the expected long-term rate of return on assets by performing a detailed analysis of historical and expected returns based on the strategic asset allocation and the underlying return fundamentals of each asset class. The historical experience of the pension fund asset performance is also considered. The expected return of each asset class is derived from a forecasted future return confirmed by historical experience. The expected long-term rate of return is an assumption and not what is expected to be earned in any one particular year. The weighted-average long-term rate of return assumption used for determining net periodic pension expense for 2017 was
7.46
percent. The assumption used for determining 2018 net periodic pension expense is 7.08 percent. Future actual pension expense will depend on future investment performance, changes in future discount rates and various other factors related to the population of participants in the Company’s pension plans.
The discount rates utilized to measure the pension and other postretirement obligations of the U.S. plans are based on the yield on high-quality corporate fixed income investments at the measurement date. Future expected actuarially determined cash flows are individually discounted at spot rates under the Willis Towers Watson U.S. RATE:Link 60-90 corporate yield curve for Dow's plans and under the Aon Hewitt AA_Above Median yield curve for DuPont's plans to arrive at the plan's obligations as of the measurement date. The weighted average discount rate utilized to measure pension obligations decreased to
3.66
percent at December 31, 2017, from
4.11
percent at December 31, 2016.
The assumption for the long-term rate of increase in compensation levels for the U.S. plans was
4.25
percent. Dow and DuPont use generational mortality tables to value their U.S. pension and other postretirement obligations.
68
The following discussion relates to Dow's significant pension plans and DuPont's U.S. qualified plan. Dow and DuPont base the determination of pension expense on a market-related valuation of plan assets that reduces year-to-year volatility. For Dow, this market-related valuation recognizes investment gains or losses over a five-year period from the year in which they occur. For DuPont, the market-related value of assets is calculated by averaging market returns over 36 months. As a result, changes in the fair value of assets are not immediately reflected in the Company’s calculation of net periodic pension cost. Over the life of the plans, both gains and losses have been recognized and amortized. At December 31, 2017, net gains of
$393 million
remain to be recognized in the calculation of the market-related value of plan assets. These net gains will result in decreases in future pension expense as they are recognized in the market-related value of assets.
The net increase in the market-related value of assets due to the recognition of prior gains (losses) is presented in the following table:
|
Net Increase in Market-Related Asset Value Due to Recognition of Prior Gains (Losses)
|
|||
|
In millions
|
|||
|
2018
|
$
|
92
|
|
|
2019
|
(30
|
)
|
|
|
2020
|
155
|
|
|
|
2021
|
176
|
|
|
|
Total
|
$
|
393
|
|
The Company expects pension expense to decrease in 2018 by approximately $900 million. Excluding Dow's settlement charge resulting from a change in control provision which occurred at the time of the Merger, pension expense is expected to decrease approximately $210 million in 2018, primarily due to the expected full year net credit for DuPont’s plans. As a result of the elimination of the net losses and prior service benefits recognized in DuPont’s accumulated other comprehensive loss in connection with purchase accounting, instead of benefit cost, a net credit for DuPont’s plans was recognized in 2017 post-Merger and is anticipated for the full year of 2018.
A 25 basis point increase or decrease in the long-term return on assets assumption would change the Company’s total pension expense for 2018 by $106 million. A 25 basis point increase in the discount rate assumption would lower the Company's total pension expense for 2018 by $34 million. A 25 basis point decrease in the discount rate assumption would increase the Company's total pension expense for 2018 by $33 million. A 25 basis point change in the long-term return and discount rate assumptions would have an immaterial impact on the other postretirement benefit expense for 2018.
Income Taxes
Deferred tax assets and liabilities are determined based on temporary differences between the financial reporting and tax bases of assets and liabilities, applying enacted tax rates expected to be in effect for the year in which the differences are expected to reverse. Based on the evaluation of available evidence, both positive and negative, the Company recognizes future tax benefits, such as net operating loss carryforwards and tax credit carryforwards, to the extent that realizing these benefits is considered to be more likely than not.
At December 31, 2017, the Company had a net deferred tax liability balance of
$4,397 million
, after valuation allowances of
$2,749 million
.
In evaluating the ability to realize the deferred tax assets, the Company relies on, in order of increasing subjectivity, taxable income in prior carryback years, the future reversals of existing taxable temporary differences, tax planning strategies and forecasted taxable income using historical and projected future operating results.
At December 31, 2017, the Company had deferred tax assets for tax loss and tax credit carryforwards of
$3,425 million
,
$337 million
of which is subject to expiration in the years 2018 through 2022.
The Company recognizes the financial statement effects of an uncertain income tax position when it is more likely than not, based on technical merits, that the position will be sustained upon examination. At December 31, 2017, the Company had uncertain tax positions for both domestic and foreign issues of
$712 million
.
On December 22, 2017, the Tax Cuts and Jobs Act (“The Act”) was enacted, making significant changes to the U.S. tax law. The SEC staff issued Staff Accounting Bulletin No. 118 (“SAB 118”), which provides guidance on accounting for the tax effects of The Act for which the accounting under ASC 740, "Income Taxes" (“ASC 740”) is incomplete. To the extent that a company's
69
accounting for certain income tax effects of The Act is incomplete but it is able to determine a reasonable estimate, it must record a provisional estimate in the financial statements. The provisional amounts, and adjustments identified in the measurement period, are recorded to the provision for income taxes on continuing operations in the period the amounts are determined. In accordance with SAB 118, income tax effects of The Act may be refined upon obtaining, preparing, or analyzing additional information during the measurement period and such changes could be material. SAB 118 provides that the measurement period is complete when a company's accounting is complete and in no circumstances should the measurement period extend beyond one year from the enactment date. If a company cannot determine a provisional estimate to be included in the financial statements, it should continue to apply ASC 740 on the basis of the provisions of the tax laws that were in effect immediately before enactment of The Act. For additional information, see Notes
1
and
8
to the Consolidated Financial Statements.
Indemnification Assets
On July 1, 2015, DuPont completed the separation of its Performance Chemicals segment through the spin-off of all of the issued and outstanding stock of The Chemours Company (the "Separation"). In connection with the Separation, DuPont and The Chemours Company ("Chemours") entered into a Separation Agreement (the "Separation Agreement"). Pursuant to the Separation Agreement, as amended and discussed in Note
16
to the Consolidated Financial Statements, DuPont is indemnified by Chemours against certain litigation, environmental, workers' compensation and other liabilities that arose prior to the Separation. The term of this indemnification is indefinite and includes defense costs and expenses, as well as monetary and non-monetary settlements and judgments. In connection with the recognition of liabilities related to these indemnified matters, DuPont records an indemnification asset when recovery is deemed probable. In assessing the probability of recovery, DuPont considers the contractual rights under the Separation Agreement and any potential credit risk. Future events, such as potential disputes related to recovery as well as the solvency of Chemours, could cause the indemnification assets to have a lower value than anticipated and recorded. The Company evaluates the recovery of the indemnification assets recorded when events or changes in circumstances indicate the carrying values may not be fully recoverable.
Purchase Accounting
Due to the Merger and the related accounting determination, DuPont’s assets and liabilities were measured at fair value as of the date of the Merger. Estimates of fair value require a complex series of judgments about future events and uncertainties. In determining the fair value, DowDuPont utilized various forms of the income, cost and market approaches depending on the asset or liability being fair valued. The estimation of fair value required significant judgments related to future net cash flows (including net sales, cost of products sold, selling and marketing costs, and working capital/contributory asset charges), discount rates reflecting the risk inherent in each cash flow stream, competitive trends, market comparables and other factors. Inputs were generally determined by taking into account historical data, supplemented by current and anticipated market conditions, and growth rates.The estimates and assumptions used to determine the preliminary estimated fair value assigned to each class of assets and liabilities, as well as asset lives, have a material impact to the Company's Consolidated Financial Statements, and are based upon assumptions believed to be reasonable but that are inherently uncertain. Third party valuation specialists were engaged to assist in the valuation of certain of these assets and liabilities.
Environmental Matters
Environmental Policies - Dow
To meet Dow’s public commitments, as well as the stringent laws and government regulations related to environmental protection and remediation to which its global operations are subject, Dow has well-defined policies, requirements and management systems. Dow’s EH&S Management System (“EMS”) defines the “who, what, when and how” needed for the businesses to achieve Dow’s policies, requirements, performance objectives, leadership expectations and public commitments. To ensure effective utilization, the EMS is integrated into a company-wide management system for EH&S, Operations, Quality and Human Resources.
It is Dow’s policy to adhere to a waste management hierarchy that minimizes the impact of wastes and emissions on the environment. First, Dow works to eliminate or minimize the generation of waste and emissions at the source through research, process design, plant operations and maintenance. Second, Dow finds ways to reuse and recycle materials. Finally, unusable or non-recyclable hazardous waste is treated before disposal to eliminate or reduce the hazardous nature and volume of the waste. Treatment may include destruction by chemical, physical, biological or thermal means. Disposal of waste materials in landfills is considered only after all other options have been thoroughly evaluated. Dow has specific requirements for waste that is transferred to non-Dow facilities, including the periodic auditing of these facilities.
Dow believes third-party verification and transparent public reporting are cornerstones of world-class EH&S performance and building public trust. Numerous Dow sites in Europe, Latin America, Asia Pacific and the U.S. & Canada have received third‑party verification of Dow’s compliance with RESPONSIBLE CARE® and with outside specifications such as ISO-14001. Dow continues to be a global champion of RESPONSIBLE CARE® and has worked to broaden the application and impact of RESPONSIBLE CARE® around the world through engagement with suppliers, customers and joint venture partners.
70
Dow’s EH&S policies helped achieve improvements in many aspects of EH&S performance in 2017. Dow’s process safety performance was excellent in 2017 and improvements were made in injury/illness rates. Safety remains a priority for Dow. Further improvement in these areas, as well as environmental compliance, remains a top management priority, with initiatives underway to further improve performance and compliance in 2018 as Dow continues to implement its 2025 Sustainability Goals.
Detailed information on Dow’s performance regarding environmental matters and goals can be found online on Dow’s Science & Sustainability webpage at www.dow.com. Dow's website and its content are not deemed incorporated by reference into this report.
Environmental Policies - DuPont
DuPont operates global manufacturing, product handling and distribution facilities that are subject to a broad array of environmental laws and regulations. Such rules are subject to change by the implementing governmental agency, and DuPont monitors these changes closely. DuPont's policy requires that all operations fully meet or exceed legal and regulatory requirements. In addition, DuPont implements voluntary programs to reduce air emissions, minimize the generation of hazardous waste, decrease the volume of water use and discharges, increase the efficiency of energy use and reduce the generation of persistent, bioaccumulative and toxic materials. Management has noted a global upward trend in the amount and complexity of proposed chemicals regulation. The costs to comply with complex environmental laws and regulations, as well as internal voluntary programs and goals, are significant and will continue to be significant for the foreseeable future.
Climate Change - Dow
Climate change matters for Dow are likely to be driven by changes in regulations, public policy and physical climate parameters.
Regulatory Matters
Regulatory matters include cap and trade schemes; increased greenhouse gas (“GHG”) limits; and taxes on GHG emissions, fuel and energy. The potential implications of each of these matters are all very similar, including increased costs of purchased energy, additional capital costs for installation or modification of GHG emitting equipment, and additional costs associated directly with GHG emissions (such as cap and trade systems or carbon taxes), which are primarily related to energy use. It is difficult to estimate the potential impact of these regulatory matters on energy prices.
Reducing Dow's overall energy usage and GHG emissions through new and unfolding projects will decrease the potential impact of these regulatory matters. Dow also has a dedicated commercial group to handle energy contracts and purchases, including managing emissions trading. Dow has not experienced any material impact related to regulated GHG emissions and continues to evaluate and monitor this area for future developments.
Physical Climate Parameters
Many scientific academies throughout the world have concluded that it is very likely that human activities are contributing to global warming. At this point, it is difficult to predict and assess the probability and opportunity of a global warming trend on Dow specifically. Preparedness plans are developed that detail actions needed in the event of severe weather. These measures have historically been in place and these activities and associated costs are driven by normal operational preparedness. Dow continues to study the long-term implications of changing climate parameters on water availability, plant siting issues, and impacts and opportunities for products.
Dow’s Energy business and Public Affairs and Sustainability functions are tasked with developing and implementing a comprehensive strategy that addresses the potential challenges of energy security and GHG emissions. Dow continues to elevate its internal focus and external positions - to focus on the root causes of GHG emissions - including the unsustainable use of energy. Dow's energy plan provides the roadmap:
|
•
|
Conserve - aggressively pursue energy efficiency and conservation
|
|
•
|
Optimize - increase and diversify energy resources
|
|
•
|
Accelerate - develop cost-effective, clean, renewable and alternative energy sources
|
|
•
|
Transition - to a sustainable energy future
|
Through corporate energy efficiency programs and focused GHG management efforts, Dow has and is continuing to reduce its GHG emissions footprint. Dow’s manufacturing intensity, measured in Btu per pound of product, has improved by more than 40 percent since 1990. As part of its 2025 Sustainability Goals, Dow will maintain GHG emissions below 2006 levels on an absolute basis for all GHGs.
Dow intends to implement the recommendations of the Financial Stability Board's Task Force on Climate-Related Disclosures ("Task Force") over the next three to five years, which is aligned with the recommendations of the Task Force.
71
Climate Change - DuPont
DuPont believes that climate change is an important global issue that presents risks and opportunities. Expanding upon significant global GHG emissions and other environmental footprint reductions made in the period 1990-2010, in 2015, DuPont announced its 2020 Sustainability Goals, including a goal to achieve a 7 percent reduction in GHG emissions intensity (2015 baseline) and a 10 percent improvement in energy intensity (2010 baseline). As of 2016, DuPont achieved reductions of 1.3 percent in GHG emissions intensity against the goal baseline of 2015, and 8 percent since 2010. In addition, DuPont has achieved a 10.8 percent improvement in energy intensity since 2010. DuPont continuously evaluates opportunities for existing and new product and service offerings in light of the anticipated demands of a low-carbon economy.
DuPont is actively engaged in efforts to develop constructive public policies to reduce GHG emissions and encourage lower carbon forms of energy. Such policies may bring higher operating costs as well as greater revenue and margin opportunities. Legislative efforts to control or limit GHG emissions could affect DuPont's energy source and supply choices as well as increase the cost of energy and raw materials derived from fossil fuels. Such efforts are also anticipated to provide the business community with greater certainty for the regulatory future, help guide investment decisions and drive growth in demand for low-carbon and energy-efficient products, technologies and services. Similarly, demand is expected to grow for products that facilitate adaptation to a changing climate. However, the current unsettled policy environment in the U.S., where many DuPont facilities are located, adds an element of uncertainty to business decisions, particularly those relating to long-term capital investments.
In addition, significant differences in regional or national approaches could present challenges in a global marketplace. An effective global climate policy framework will help drive the market changes that are needed to stimulate and efficiently deploy new innovations in science and technology, while maintaining open and competitive global markets.
DowDuPont Environmental Remediation
Environmental Capital Expenditures
Capital expenditures for environmental projects, either required by law or necessary to meet the Company’s internal environmental goals, were
$97 million
in 2017.
Environmental Operating Costs and Remediation
As a result of the Dow and DuPont operations, DowDuPont incurs environmental operating costs for pollution abatement activities including waste collection and disposal, installation and maintenance of air pollution controls and wastewater treatment, emissions testing and monitoring and obtaining permits. The Company also incurs environmental operating costs related to environmental related research and development activities including environmental field and treatment studies as well as toxicity and degradation testing to evaluate the environmental impact of products and raw materials.
Pretax environmental expenses charged to income from continuing operations are summarized below:
|
Environmental Expenses Charged to Income
|
|||||||||
|
In millions
|
2017
1
|
2016
|
2015
|
||||||
|
Environmental operating costs
|
$
|
725
|
|
$
|
623
|
|
$
|
613
|
|
|
Environmental remediation costs
|
179
|
|
504
|
|
218
|
|
|||
|
Total
|
$
|
904
|
|
$
|
1,127
|
|
$
|
831
|
|
|
1.
|
Includes DuPont costs for the period September 1, 2017 through December 31, 2017.
|
Based on existing facts and circumstances, management does not believe that year over year changes in environmental expenses charged to current operations will have a material impact on the Company's financial position, liquidity or results of operations. Annual expenditures in the near term are not expected to vary significantly from the range of such expenditures experienced in the past few years. Longer term, expenditures are subject to considerable uncertainty and may fluctuate significantly.
72
Changes in the remediation accrual balance are summarized below:
|
Accrued Obligations for Environmental Matters
|
||||||
|
In millions
|
2017
|
2016
|
||||
|
Balance at Jan 1
|
$
|
909
|
|
$
|
670
|
|
|
Liabilities assumed
1
|
483
|
|
—
|
|
||
|
Accrual adjustment
|
180
|
|
479
|
|
||
|
Payments against reserve
|
(260
|
)
|
(246
|
)
|
||
|
Foreign currency impact
|
17
|
|
6
|
|
||
|
Net change, indemnification
2
|
(18
|
)
|
—
|
|
||
|
Balance at Dec 31
|
$
|
1,311
|
|
$
|
909
|
|
|
1.
|
Remediation obligations assumed upon completion of the Merger.
|
|
2.
|
Net change in indemnified remediation obligations. Pursuant to the Separation Agreement, as discussed below and in Note 16 to the Consolidated Financial Statements, DuPont is indemnified by Chemours for certain environmental matters.
|
Considerable uncertainty exists with respect to environmental remediation and costs, and under adverse changes in circumstances, it is reasonably possible that the ultimate cost with respect to these particular matters could range up to
two and a half
times above the amount accrued. Consequently, it is reasonably possible that environmental remediation and restoration costs in excess of amounts accrued could have a material impact on the Company’s results of operations, financial condition and cash flows. It is the opinion of the Company’s management, however, that the possibility is remote that costs in excess of the range disclosed will have a material impact on the Company’s results of operations, financial condition or cash flows. For further discussion, see Environmental Matters in Management’s Discussion and Analysis of Financial Condition and Results of Operations and Notes 1 and 16 to the Consolidated Financial Statements.
Information regarding environmental sites is provided below:
|
Environmental Sites
1
|
DuPont
|
Dow
|
||||||||||
|
Sites
2
|
Superfund Sites
3, 4
|
Sites
5
|
Superfund Sites
3
|
|||||||||
|
|
2017
|
2017
|
2017
|
2016
|
2017
|
2016
|
||||||
|
Number of sites at Jan 1
|
—
|
|
—
|
|
189
|
|
180
|
|
131
|
|
124
|
|
|
Sites added during year
6
|
99
|
|
62
|
|
60
|
|
16
|
|
2
|
|
10
|
|
|
Sites closed during year
|
—
|
|
—
|
|
(5
|
)
|
(7
|
)
|
(2
|
)
|
(3
|
)
|
|
Number of sites at Dec 31
|
99
|
|
62
|
|
244
|
|
189
|
|
131
|
|
131
|
|
|
1.
|
Active sites.
|
|
2.
|
Sites currently or formerly owned by DuPont. Remediation obligations are imposed by the Resource Conservation and Recovery Act or similar state law in the United States and by similar federal, state, provincial or local law in non-U.S. locations. At December 31, 2017, Chemours is indemnifying DuPont for activities at
36
of these sites. See discussion below and Note 16 to the Consolidated Financial Statements for additional information.
|
|
3.
|
Superfund sites are sites, including sites not owned by DuPont or Dow, where remediation obligations may be imposed on either company under federal or state Superfund laws or similar laws in non-U.S. locations. The total includes approximately 40 sites that have been counted twice as DuPont and Dow are separately named.
|
|
4.
|
At December 31, 2017, Chemours is indemnifying DuPont for activities at
28
of these Superfund sites. See discussion below and Note 16 to the Consolidated Financial Statements for additional information.
|
|
5.
|
Sites currently or formerly owned by Dow. Remediation obligations are imposed by the Resource Conservation and Recovery Act or similar state law in the United States and by similar federal, state, provincial or local law in non-U.S. locations. At December 31, 2017,
35
of these sites (38 sites at December 31, 2016) were formerly owned by Dowell Schlumberger, Inc., a group of companies in which Dow previously owned a 50 percent interest. Dow sold its interest in Dowell Schlumberger in 1992.
|
|
6.
|
Includes DuPont remediation obligations transferred as a result of the Merger.
|
Additional information is provided below for Dow’s Midland, Michigan, manufacturing site and Midland off-site locations (collectively, the "Midland sites"), as well as a Superfund site in Wood-Ridge, New Jersey, the locations for Dow that have the largest potential environmental liabilities.
In the early days of operations at the Dow Midland manufacturing site, wastes were usually disposed of on-site, resulting in soil and groundwater contamination, which has been contained and managed on-site under a series of Resource Conservation and Recovery Act permits and regulatory agreements. The Hazardous Waste Operating License for the Midland manufacturing site, issued in 2003, and renewed and replaced in September 2015, also included provisions for Dow to conduct an investigation to determine the nature and extent of off-site contamination from historic Midland manufacturing site operations. In January 2010, Dow, the EPA and the State of Michigan ("State") entered into an Administrative Order on Consent that requires Dow to conduct
73
a remedial investigation, a feasibility study and a remedial design for the Tittabawassee River, the Saginaw River and the Saginaw Bay, and pay the oversight costs of the EPA and the State under the authority of the federal Comprehensive Environmental Response, Compensation and Liability Act. See Note
16
to the Consolidated Financial Statements for additional information. At December 31, 2017, Dow had an accrual of
$131 million
(
$137 million
at December 31, 2016) for environmental remediation and investigation associated with the Midland sites. In 2017, Dow spent
$24 million
(
$36 million
in 2016) for environmental remediation at the Midland sites.
Rohm and Haas, a wholly owned subsidiary of Dow, is a PRP at the Wood-Ridge, New Jersey Ventron/Velsicol Superfund Site, and the adjacent Berry’s Creek Study Area ("BCSA") (collectively, the "Wood-Ridge sites"). Rohm and Haas is a successor in interest to a company that owned and operated a mercury processing facility, where wastewater and waste handling resulted in contamination of soils and adjacent creek sediments. The Berry’s Creek Study Area PRP group completed a multi-stage Remedial Investigation ("RI") pursuant to an Administrative Order on Consent with U.S. EPA Region 2 to identify contamination in surface water, sediment and biota related to numerous contaminated sites in the Berry's Creek watershed, and submitted the report to the EPA in June 2016. That same month, the EPA concluded that an "iterative or adaptive approach" was appropriate for cleaning up the BCSA. Thus, each phase of remediation will be followed by a period of monitoring to assess its effectiveness and determine if there is a need for more work. The Feasibility Study ("FS") for the first phase of work will be submitted in the second half of 2018. The EPA will then review the remedial options presented in the FS, select the remedy and issue an interim Record of Decision ("ROD"). The PRP group will then attempt to negotiate agreements among the PRP's to fund the selected remedy and with the EPA to perform the remediation. Although there is currently much uncertainty as to what will ultimately be required to remediate the BCSA and Rohm and Haas's share of these costs has yet to be determined, the range of activities that will be required in the interim ROD is known in general terms. Based on the first phase of the RI and agreement with the EPA, the overall remediation accrual for the Wood-Ridge sites was increased by
$80 million
in the fourth quarter of 2016. At December 31, 2017, the Company had an accrual of
$88 million
(
$91 million
at December 31, 2016) for environmental remediation at the Wood-Ridge sites. In 2017, Dow spent
$7 million
(
$6 million
in 2016) on environmental remediation at the Wood-Ridge sites.
In the fourth quarter of 2016, Dow recorded a pretax charge of
$295 million
for environmental remediation at a number of historical locations, including the Midland manufacturing site/off-site matters and the Wood-Ridge sites, primarily resulting from the culmination of negotiations with regulators and/or final agency approval. This charge was included in "Cost of sales" in the consolidated statements of income. In total, the Company’s accrued liability for probable environmental remediation and restoration costs was
$1,311 million
at December 31, 2017, compared with
$909 million
at December 31, 2016. This is management’s best estimate of the costs for remediation and restoration with respect to environmental matters for which the Company has accrued liabilities, although it is reasonably possible that the ultimate cost with respect to these particular matters could range up to approximately two and a half times that amount. Consequently, it is reasonably possible that environmental remediation and restoration costs in excess of amounts accrued could have a material impact on the Company’s results of operations, financial condition and cash flows. It is the opinion of the Company’s management, however, that the possibility is remote that costs in excess of the range disclosed will have a material impact on the Company’s results of operations, financial condition and cash flows.
Separation of DuPont's Performance Chemicals Segment
Pursuant to the Separation Agreement discussed in Note
16
to the Consolidated Financial Statements, DuPont is indemnified by Chemours for certain environmental matters, included in the liability of
$1,311 million
, that had an estimated liability of $242 million at December 31, 2017, and a potential exposure that ranges up to approximately $430 million above the current accrual. As such, DuPont has recorded an indemnification asset of $242 million corresponding to DuPont's accrual balance related to these matters at December 31, 2017.
Asbestos-Related Matters of Union Carbide Corporation
Union Carbide is and has been involved in a large number of asbestos-related suits filed primarily in state courts during the past four decades. These suits principally allege personal injury resulting from exposure to asbestos-containing products and frequently seek both actual and punitive damages. The alleged claims primarily relate to products that Union Carbide sold in the past, alleged exposure to asbestos-containing products located on Union Carbide’s premises, and Union Carbide’s responsibility for asbestos suits filed against a former Union Carbide subsidiary, Amchem. In many cases, plaintiffs are unable to demonstrate that they have suffered any compensable loss as a result of such exposure, or that injuries incurred in fact resulted from exposure to Union Carbide’s products.
74
The table below provides information regarding asbestos-related claims pending against Union Carbide and Amchem based on criteria developed by Union Carbide and its external consultants. Union Carbide had a significant increase in the number of claims settled, dismissed or otherwise resolved in 2015 resulting from a detailed review of the status of individual claims and an update to criteria used to classify claims.
|
Asbestos-Related Claim Activity
|
2017
|
2016
|
2015
|
|||
|
Claims unresolved at Jan 1
|
16,141
|
|
18,778
|
|
26,116
|
|
|
Claims filed
|
7,010
|
|
7,813
|
|
7,544
|
|
|
Claims settled, dismissed or otherwise resolved
|
(7,724
|
)
|
(10,450
|
)
|
(14,882
|
)
|
|
Claims unresolved at Dec 31
|
15,427
|
|
16,141
|
|
18,778
|
|
|
Claimants with claims against both Union Carbide and Amchem
|
(5,530
|
)
|
(5,741
|
)
|
(6,804
|
)
|
|
Individual claimants at Dec 31
|
9,897
|
|
10,400
|
|
11,974
|
|
Plaintiffs’ lawyers often sue numerous defendants in individual lawsuits or on behalf of numerous claimants. As a result, the damages alleged are not expressly identified as to Union Carbide, Amchem or any other particular defendant, even when specific damages are alleged with respect to a specific disease or injury. In fact, there are no personal injury cases in which only Union Carbide and/or Amchem are the sole named defendants. For these reasons and based upon Union Carbide’s litigation and settlement experience, Union Carbide does not consider the damages alleged against Union Carbide and Amchem to be a meaningful factor in its determination of any potential asbestos-related liability.
For additional information, see Part I, Item 3. Legal Proceedings and Asbestos-Related Matters of Union Carbide Corporation and Note
16
to the Consolidated Financial Statements.
DowDuPont's risk management programs are managed separately by Dow and DuPont. Dow and DuPont have historically utilized different methods to report their quantitative information about market risk. Dow uses a value-at-risk ("VAR") approach while DuPont uses sensitivity analysis. Both methods are acceptable under Regulation S-K and are viewed as equally effective from a risk monitoring perspective. As the risk management programs for Dow and DuPont will continue to be managed separately, the quantitative and qualitative disclosures about market risk will be provided for each subsidiary, as discussed below.
Dow
Dow’s business operations give rise to market risk exposure due to changes in foreign exchange rates, interest rates, commodity prices and other market factors such as equity prices. To manage such risks effectively, Dow enters into hedging transactions, pursuant to established guidelines and policies that enable it to mitigate the adverse effects of financial market risk. Derivatives used for this purpose are designated as hedges per the accounting guidance related to derivatives and hedging activities, where appropriate. A secondary objective is to add value by creating additional non-specific exposure within established limits and policies; derivatives used for this purpose are not designated as hedges. The potential impact of creating such additional exposures is not material to Dow’s results.
The global nature of Dow’s business requires active participation in the foreign exchange markets. As a result of investments, production facilities and other operations on a global basis, Dow has assets, liabilities and cash flows in currencies other than the U.S. dollar. The primary objective of Dow’s foreign exchange risk management is to optimize the U.S. dollar value of net assets and cash flows, keeping the adverse impact of currency movements to a minimum. To achieve this objective, Dow hedges on a net exposure basis using foreign currency forward contracts, over-the-counter option contracts, cross-currency swaps and nonderivative instruments in foreign currencies. Exposures primarily relate to assets, liabilities and bonds denominated in foreign currencies, as well as economic exposure, which is derived from the risk that currency fluctuations could affect the dollar value of future cash flows related to operating activities. The largest exposures are denominated in European currencies, the Japanese yen and the Chinese yuan, although exposures also exist in other currencies of Asia Pacific, Canada, Latin America, Middle East, Africa and India.
The main objective of interest rate risk management is to reduce the total funding cost to Dow and to alter the interest rate exposure to the desired risk profile. Dow uses interest rate swaps, “swaptions,” and exchange-traded instruments to accomplish this objective. Dow’s primary exposure is to the U.S. dollar yield curve.
Dow has a portfolio of equity securities derived primarily from the investment activities of its insurance subsidiaries. This exposure is managed in a manner consistent with Dow’s market risk policies and procedures.
75
Inherent in Dow’s business is exposure to price changes for several commodities. Some exposures can be hedged effectively through liquid tradable financial instruments. Natural gas and crude oil, along with feedstocks for ethylene and propylene production, constitute the main commodity exposures. Over-the-counter and exchange traded instruments are used to hedge these risks, when feasible.
Dow uses VAR, stress testing and scenario analysis for risk measurement and control purposes. VAR estimates the maximum potential loss in fair market values, given a certain move in prices over a certain period of time, using specified confidence levels. The VAR methodology used by Dow is a variance/covariance model. This model uses a 97.5 percent confidence level and includes at least one year of historical data. The 2017 and 2016 year-end and average daily VAR for the aggregate of all positions are shown below. These amounts are immaterial relative to the total equity of Dow.
|
Total Daily VAR by Exposure Type at Dec 31
|
2017
|
2016
|
||||||||||
|
In millions
|
Year-end
|
Average
|
Year-end
|
Average
|
||||||||
|
Commodities
|
$
|
32
|
|
$
|
35
|
|
$
|
24
|
|
$
|
23
|
|
|
Equity securities
|
4
|
|
9
|
|
17
|
|
16
|
|
||||
|
Foreign exchange
|
26
|
|
38
|
|
28
|
|
9
|
|
||||
|
Interest rate
|
70
|
|
76
|
|
82
|
|
90
|
|
||||
|
Composite
|
$
|
132
|
|
$
|
158
|
|
$
|
151
|
|
$
|
138
|
|
Dow’s daily VAR for the aggregate of all positions decreased from a composite VAR of $151 million at
December 31, 2016
, to a composite VAR of $132 million at
December 31, 2017
. The commodities VAR increased due to an increase in long-term managed exposures. The equity securities VAR decreased due to a reduction in managed exposures and a decline in equity volatility. The interest rate VAR decreased due to a drop in yield volatility. See Note
21
to the Consolidated Financial Statements for further disclosure regarding market risk.
DuPont
DuPont’s global operations are exposed to financial market risks relating to fluctuations in foreign currency exchange rates, commodity prices and interest rates. DuPont has established a variety of programs including the use of derivative instruments and other financial instruments to manage the exposure to financial market risks as to minimize volatility of financial results. In the ordinary course of business, DuPont enters into derivative instruments to hedge its exposure to foreign currency, interest rate and commodity price risks under established procedures and controls. Decisions regarding whether or not to hedge a given commitment are made on a case-by-case basis, taking into consideration the amount and duration of the exposure, market volatility and economic trends.
Foreign Currency Exchange Rate Risks
DuPont has significant international operations resulting in a large number of currency transactions that result from international sales, purchases, investments and borrowings. The primary currencies for which DuPont has an exchange rate exposure are the European euro, Chinese yuan, Brazilian real and Japanese yen. DuPont uses forward exchange contracts to offset its net exposures, by currency, related to the foreign currency denominated monetary assets and liabilities of its operations. In addition to the contracts disclosed in Note
21
to the Consolidated Financial Statements, from time to time, DuPont will enter into foreign currency exchange contracts to establish with certainty the U.S. dollar amount of future firm commitments denominated in a foreign currency.
The following table illustrates the fair values of outstanding foreign currency contracts at December 31, 2017, and the effect on fair values of a hypothetical adverse change in the foreign exchange rates that existed at December 31, 2017. The sensitivities for foreign currency contracts are based on a 10 percent adverse change in foreign exchange rates.
|
Foreign Currency Contracts at Dec 31, 2017
|
Fair Value
Liability
|
Fair Value
Sensitivity
|
||||
|
In millions
|
||||||
|
Foreign currency contracts
|
$
|
(33
|
)
|
$
|
(863
|
)
|
Since DuPont's risk management programs are highly effective, the potential loss in value for each risk management portfolio described above would be largely offset by changes in the value of the underlying exposure.
76
Concentration of Credit Risk
DuPont maintains cash and cash equivalents, marketable securities, derivatives and certain other financial instruments with various financial institutions. These financial institutions are generally highly rated and geographically dispersed and DuPont has a policy to limit the dollar amount of credit exposure with any one institution.
As part of DuPont's financial risk management processes, it continuously evaluates the relative credit standing of all of the financial institutions that service DuPont and monitors actual exposures versus established limits. DuPont has not sustained credit losses from instruments held at financial institutions.
77
REPORT OF INDEPENDENT REGISTERED PUBLIC ACCOUNTING FIRM
To the Stockholders and the Board of Directors of DowDuPont Inc.
Opinion on the Financial Statements
We have audited the accompanying consolidated balance sheets of DowDuPont Inc. and subsidiaries (the "Company") as of December 31, 2017 and 2016, the related consolidated statements of income, comprehensive income, equity, and cash flows, for each of the three years in the period ended December 31, 2017, and the related notes and the schedule listed in the Index at Item 15a(2) (collectively referred to as the "financial statements"). In our opinion, based on our audits and the report of the other auditors, the financial statements present fairly, in all material respects, the financial position of the Company as of December 31, 2017 and 2016, and the results of its operations and its cash flows for each of the three years in the period ended December 31, 2017, in conformity with accounting principles generally accepted in the United States of America.
We did not audit the consolidated financial statements of E. I. du Pont de Nemours and Company (“DuPont”), a wholly-owned subsidiary of the Company, which consolidated financial statements reflect total assets of $112,964 million as of December 31, 2017 and total revenues of $7,053 million for the period from August 31, 2017 (date of the merger) to December 31, 2017. Those statements were audited by other auditors whose report has been furnished to us, and our opinion, insofar as it relates to the amounts included for DuPont as of December 31, 2017 and for the period from August 31, 2017 (date of the merger) to December 31, 2017, is based solely on the report of the other auditors.
We have also audited, in accordance with the standards of the Public Company Accounting Oversight Board (United States) (“PCAOB”), the Company's internal control over financial reporting as of December 31, 2017, based on the criteria established in
Internal Control - Integrated Framework (2013)
issued by the Committee of Sponsoring Organizations of the Treadway Commission and our report dated February 15, 2018 expressed an unqualified opinion on the Company's internal control over financial reporting based on our audit and the report of the other auditors.
Change in Accounting Principle
As discussed in Note 16 to the financial statements, in the fourth quarter of 2016, the Company changed its accounting policy from expensing asbestos-related defense and processing costs as incurred to the accrual of asbestos-related defense and processing costs when probable of occurring and estimable.
Merger
As discussed in Notes 1 and 3 to the financial statements, the Company was formed for the purpose of effecting the merger of The Dow Chemical Company and DuPont. On August 31, 2017, the merger was completed.
Basis for Opinion
These financial statements are the responsibility of the Company's management. Our responsibility is to express an opinion on the Company's financial statements based on our audits. We are a public accounting firm registered with the PCAOB and are required to be independent with respect to the Company in accordance with the U.S. federal securities laws and the applicable rules and regulations of the Securities and Exchange Commission and the PCAOB.
We conducted our audits in accordance with the standards of the PCAOB. Those standards require that we plan and perform the audit to obtain reasonable assurance about whether the financial statements are free of material misstatement, whether due to error or fraud. Our audits included performing procedures to assess the risks of material misstatement of the financial statements, whether due to error or fraud, and performing procedures that respond to those risks. Such procedures included examining, on a test basis, evidence regarding the amounts and disclosures in the financial statements. Our audits also included evaluating the accounting principles used and significant estimates made by management, as well as evaluating the overall presentation of the financial statements. We believe that our audits and the report of the other auditors provide a reasonable basis for our opinion.
|
/s/ DELOITTE & TOUCHE
LLP
|
|
Deloitte & Touche
LLP
|
|
Midland, Michigan
|
|
February 15, 2018
|
We have served as the Company's auditor since 1905.
78
REPORT OF INDEPENDENT REGISTERED PUBLIC ACCOUNTING FIRM
To the
Stockholders and Board of Directors of E.I. du Pont de Nemours and Company
Opinions on the Financial Statements and Internal Control over Financial Reporting
We have audited the consolidated balance sheet of E.I. du Pont de Nemours and Company
and its subsidiaries (Successor)
(the “Company”)
as of December 31, 2017,
and the related consolidated statements of operations, comprehensive income, equity and cash flows for the period September 1, 2017 through December 31, 2017, including the related notes and financial statement schedule (collectively referred to as the “consolidated financial statements”) (not presented herein). We also have audited the Company's internal control over financial reporting as of December 31, 2017, based on criteria established in
Internal Control - Integrated Framework
(2013)
issued by the Committee of Sponsoring Organizations of the Treadway Commission (COSO).
In our opinion, the consolidated
financial statements referred to above present fairly, in all material respects, the financial position of the Company as of December 31, 2017, and the results of their
operations and their
cash flows for the period September 1, 2017 through December 31, 2017 in conformity with accounting principles generally accepted in the United States of America. Also in our opinion, the Company maintained, in all material respects, effective internal control over financial reporting as of December 31, 2017, based on criteria established in
Internal Control - Integrated Framework
(2013)
issued by the COSO.
Basis for Opinions
The Company's management is responsible for these consolidated financial statements, for maintaining effective internal control over financial reporting, and for its assessment of the effectiveness of internal control over financial reporting, included in
Management's Report on Internal Control over Financial Reporting (not presented herein). Our responsibility is to express opinions on the Company’s consolidated financial statements and on the Company's internal control over financial reporting based on our audit. We are a public accounting firm registered with the Public Company Accounting Oversight Board (United States) ("PCAOB") and are required to be independent with respect to the Company in accordance with the U.S. federal securities laws and the applicable rules and regulations of the Securities and Exchange Commission and the PCAOB.
We conducted our audit in accordance with the standards of the PCAOB. Those standards require that we plan and perform the audit to obtain reasonable assurance about whether the consolidated
financial statements are free of material misstatement, whether due to error or fraud, and whether effective internal control over financial reporting was maintained in all material respects.
Our audit of the consolidated financial statements included performing procedures to assess the risks of material misstatement of the consolidated financial statements, whether due to error or fraud, and performing procedures that respond to those risks. Such procedures included examining, on a test basis, evidence regarding the amounts and disclosures in the consolidated financial statements. Our audit also included evaluating the accounting principles used and significant estimates made by management, as well as evaluating the overall presentation of the consolidated
financial statements. Our audit of internal control over financial reporting included obtaining an understanding of internal control over financial reporting, assessing the risk that a material weakness exists, and testing and evaluating the design and operating effectiveness of internal control based on the assessed risk. Our audit also included performing such other procedures as we considered necessary in the circumstances. We believe that our audit provides a reasonable basis for our opinions.
As described in Management’s Report on Internal Control over Financial Reporting (not presented herein), management has excluded the H&N Business from its assessment of internal control over financial reporting as of December 31, 2017 because it was acquired by the Company in a purchase business combination during 2017. We have also excluded the H&N Business from our audit of internal control over financial reporting. The H&N Business is a wholly-owned subsidiary whose total assets and total revenues excluded from management’s assessment and our audit of internal control over financial reporting represent less than two percent each of the related consolidated financial statement amounts as of December 31, 2017 and for the period September 1, 2017 through December 31, 2017.
Definition and Limitations of Internal Control over Financial Reporting
A company’s internal control over financial reporting is a process designed to provide reasonable assurance regarding the reliability of financial reporting and the preparation of financial statements for external purposes in accordance with generally accepted accounting principles. A company’s internal control over financial reporting includes those policies and procedures that (i) pertain to the maintenance of records that, in reasonable detail, accurately and fairly reflect the transactions and dispositions of the assets of the company; (ii) provide reasonable assurance that transactions are recorded as necessary to permit preparation of financial statements in accordance with generally accepted accounting principles, and that receipts and expenditures of the company are being made only in accordance with authorizations of management and directors of the company; and (iii) provide reasonable assurance regarding prevention or timely detection of unauthorized acquisition, use, or disposition of the company’s assets that could have a material effect on the financial statements.
79
Because of its inherent limitations, internal control over financial reporting may not prevent or detect misstatements. Also, projections of any evaluation of effectiveness to future periods are subject to the risk that controls may become inadequate because of changes in conditions, or that the degree of compliance with the policies or procedures may deteriorate.
|
/s/ PRICEWATERHOUSECOOPERS LLP
|
|
PricewaterhouseCoopers LLP
|
|
Philadelphia, Pennsylvania
|
|
February 15, 2018
|
We have served as the Company’s auditor since 1954.
80
DowDuPont Inc.
|
(In millions, except per share amounts) For the years ended Dec 31,
|
2017
|
2016
|
2015
|
||||||
|
Net sales
|
$
|
62,484
|
|
$
|
48,158
|
|
$
|
48,778
|
|
|
Cost of sales
|
50,414
|
|
37,640
|
|
37,745
|
|
|||
|
Research and development expenses
|
2,110
|
|
1,584
|
|
1,598
|
|
|||
|
Selling, general and administrative expenses
|
4,021
|
|
2,956
|
|
2,948
|
|
|||
|
Amortization of intangibles
|
1,013
|
|
544
|
|
419
|
|
|||
|
Restructuring, goodwill impairment and asset related charges - net
|
3,280
|
|
595
|
|
559
|
|
|||
|
Integration and separation costs
|
1,101
|
|
349
|
|
23
|
|
|||
|
Asbestos-related charge
|
—
|
|
1,113
|
|
—
|
|
|||
|
Equity in earnings of nonconsolidated affiliates
|
764
|
|
442
|
|
674
|
|
|||
|
Sundry income (expense) - net
|
966
|
|
1,452
|
|
4,716
|
|
|||
|
Interest expense and amortization of debt discount
|
1,082
|
|
858
|
|
946
|
|
|||
|
Income from continuing operations before income taxes
|
1,193
|
|
4,413
|
|
9,930
|
|
|||
|
Provision (Credit) for income taxes on continuing operations
|
(476
|
)
|
9
|
|
2,147
|
|
|||
|
Income from continuing operations, net of tax
|
1,669
|
|
4,404
|
|
7,783
|
|
|||
|
Loss from discontinued operations, net of tax
|
(77
|
)
|
—
|
|
—
|
|
|||
|
Net income
|
1,592
|
|
4,404
|
|
7,783
|
|
|||
|
Net income attributable to noncontrolling interests
|
132
|
|
86
|
|
98
|
|
|||
|
Net income attributable to DowDuPont Inc.
|
1,460
|
|
4,318
|
|
7,685
|
|
|||
|
Preferred stock dividends
|
—
|
|
340
|
|
340
|
|
|||
|
Net income available for DowDuPont Inc. common stockholders
|
$
|
1,460
|
|
$
|
3,978
|
|
$
|
7,345
|
|
|
Per common share data:
|
|||||||||
|
Earnings per common share from continuing operations - basic
|
$
|
0.97
|
|
$
|
3.57
|
|
$
|
6.45
|
|
|
Loss per common share from discontinued operations - basic
|
(0.05
|
)
|
—
|
|
—
|
|
|||
|
Earnings per common share - basic
|
$
|
0.92
|
|
$
|
3.57
|
|
$
|
6.45
|
|
|
Earnings per common share from continuing operations - diluted
|
$
|
0.95
|
|
$
|
3.52
|
|
$
|
6.15
|
|
|
Loss per common share from discontinued operations - diluted
|
(0.04
|
)
|
—
|
|
—
|
|
|||
|
Earnings per common share - diluted
|
$
|
0.91
|
|
$
|
3.52
|
|
$
|
6.15
|
|
|
Dividends declared per share of common stock
|
$
|
1.76
|
|
$
|
1.84
|
|
$
|
1.72
|
|
|
Weighted-average common shares outstanding - basic
|
1,579.8
|
|
1,108.1
|
|
1,130.1
|
|
|||
|
Weighted-average common shares outstanding - diluted
|
1,598.1
|
|
1,123.2
|
|
1,241.4
|
|
|||
See Notes to the Consolidated Financial Statements.
81
DowDuPont Inc.
Consolidated Statements of Comprehensive Income
|
(In millions) For the years ended Dec 31,
|
2017
|
2016
|
2015
|
||||||
|
Net Income
|
$
|
1,592
|
|
$
|
4,404
|
|
$
|
7,783
|
|
|
Other comprehensive income (loss), net of tax
|
|||||||||
|
Unrealized losses on investments
|
(46
|
)
|
(4
|
)
|
(94
|
)
|
|||
|
Cumulative translation adjustments
|
446
|
|
(644
|
)
|
(986
|
)
|
|||
|
Pension and other postretirement benefit plans
|
466
|
|
(620
|
)
|
552
|
|
|||
|
Derivative instruments
|
(16
|
)
|
113
|
|
(122
|
)
|
|||
|
Total other comprehensive income (loss)
|
850
|
|
(1,155
|
)
|
(650
|
)
|
|||
|
Comprehensive Income
|
2,442
|
|
3,249
|
|
7,133
|
|
|||
|
Comprehensive income attributable to noncontrolling interests, net of tax
|
174
|
|
83
|
|
65
|
|
|||
|
Comprehensive Income Attributable to DowDuPont Inc.
|
$
|
2,268
|
|
$
|
3,166
|
|
$
|
7,068
|
|
See Notes to the Consolidated Financial Statements.
82
DowDuPont Inc.
|
(In millions, except share amounts) At Dec 31,
|
2017
|
2016
|
||||
|
Assets
|
||||||
|
Current Assets
|
||||||
|
Cash and cash equivalents (variable interest entities restricted - 2017: $107; 2016: $75)
|
$
|
13,438
|
|
$
|
6,607
|
|
|
Marketable securities
|
956
|
|
—
|
|
||
|
Accounts and notes receivable:
|
||||||
|
Trade (net of allowance for doubtful receivables - 2017: $127; 2016: $110)
|
11,314
|
|
4,666
|
|
||
|
Other
|
5,579
|
|
4,312
|
|
||
|
Inventories
|
16,992
|
|
7,363
|
|
||
|
Other current assets
|
1,614
|
|
711
|
|
||
|
Total current assets
|
49,893
|
|
23,659
|
|
||
|
Investments
|
||||||
|
Investment in nonconsolidated affiliates
|
5,336
|
|
3,747
|
|
||
|
Other investments (investments carried at fair value - 2017: $1,512; 2016: $1,959)
|
2,564
|
|
2,969
|
|
||
|
Noncurrent receivables
|
680
|
|
708
|
|
||
|
Total investments
|
8,580
|
|
7,424
|
|
||
|
Property
|
||||||
|
Property
|
73,304
|
|
57,438
|
|
||
|
Less accumulated depreciation
|
37,057
|
|
33,952
|
|
||
|
Net property (variable interest entities restricted - 2017: $907; 2016: $961)
|
36,247
|
|
23,486
|
|
||
|
Other Assets
|
||||||
|
Goodwill
|
59,527
|
|
15,272
|
|
||
|
Other intangible assets (net of accumulated amortization - 2017: $5,550; 2016: $4,295)
|
33,274
|
|
6,026
|
|
||
|
Deferred income tax assets
|
1,869
|
|
3,079
|
|
||
|
Deferred charges and other assets
|
2,774
|
|
565
|
|
||
|
Total other assets
|
97,444
|
|
24,942
|
|
||
|
Total Assets
|
$
|
192,164
|
|
$
|
79,511
|
|
|
Liabilities and Equity
|
||||||
|
Current Liabilities
|
||||||
|
Notes payable
|
$
|
1,948
|
|
$
|
272
|
|
|
Long-term debt due within one year
|
2,067
|
|
635
|
|
||
|
Accounts payable:
|
||||||
|
Trade
|
9,134
|
|
4,519
|
|
||
|
Other
|
3,727
|
|
2,097
|
|
||
|
Income taxes payable
|
843
|
|
600
|
|
||
|
Accrued and other current liabilities
|
8,409
|
|
4,481
|
|
||
|
Total current liabilities
|
26,128
|
|
12,604
|
|
||
|
Long-Term Debt (variable interest entities nonrecourse - 2017: $249; 2016: $330)
|
30,056
|
|
20,456
|
|
||
|
Other Noncurrent Liabilities
|
||||||
|
Deferred income tax liabilities
|
6,266
|
|
923
|
|
||
|
Pension and other postretirement benefits - noncurrent
|
18,581
|
|
11,375
|
|
||
|
Asbestos-related liabilities - noncurrent
|
1,237
|
|
1,364
|
|
||
|
Other noncurrent obligations
|
7,969
|
|
5,560
|
|
||
|
Total other noncurrent liabilities
|
34,053
|
|
19,222
|
|
||
|
Stockholders' Equity
|
||||||
|
Common stock (2017: authorized 5,000,000,000 shares of $0.01 par value each, issued 2,341,455,518 shares; 2016: authorized 1,500,000,000 shares of $2.50 par value each, issued 1,242,794,836)
|
23
|
|
3,107
|
|
||
|
Additional paid-in capital
|
81,257
|
|
4,262
|
|
||
|
Retained earnings
|
29,211
|
|
30,338
|
|
||
|
Accumulated other comprehensive loss
|
(8,972
|
)
|
(9,822
|
)
|
||
|
Unearned ESOP shares
|
(189
|
)
|
(239
|
)
|
||
|
Treasury stock at cost (2017: 14,123,049 shares; 2016: 31,661,501 shares)
|
(1,000
|
)
|
(1,659
|
)
|
||
|
DowDuPont's stockholders' equity
|
100,330
|
|
25,987
|
|
||
|
Noncontrolling interests
|
1,597
|
|
1,242
|
|
||
|
Total equity
|
101,927
|
|
27,229
|
|
||
|
Total Liabilities and Equity
|
$
|
192,164
|
|
$
|
79,511
|
|
83
DowDuPont Inc.
|
(In millions) For the years ended Dec 31,
|
2017
|
2016
|
2015
|
||||||
|
Operating activities
|
|||||||||
|
Net income
|
$
|
1,592
|
|
$
|
4,404
|
|
$
|
7,783
|
|
|
Adjustments to reconcile net income to net cash provided by operating activities:
|
|||||||||
|
Depreciation and amortization
|
3,969
|
|
2,862
|
|
2,521
|
|
|||
|
Provision (Credit) for deferred income tax
|
(2,083
|
)
|
(1,259
|
)
|
305
|
|
|||
|
Earnings of nonconsolidated affiliates less than dividends received
|
128
|
|
243
|
|
142
|
|
|||
|
Net periodic pension benefit cost
|
1,026
|
|
389
|
|
755
|
|
|||
|
Pension contributions
|
(1,744
|
)
|
(629
|
)
|
(844
|
)
|
|||
|
Net gain on sales of assets, businesses and investments
|
(1,172
|
)
|
(214
|
)
|
(4,655
|
)
|
|||
|
Net gain on step acquisition of nonconsolidated affiliates
|
—
|
|
(2,445
|
)
|
(361
|
)
|
|||
|
Restructuring, goodwill impairment and asset related charges - net
|
3,280
|
|
595
|
|
559
|
|
|||
|
Amortization of Merger-related inventory step-up
|
1,573
|
|
—
|
|
—
|
|
|||
|
Asbestos-related charge
|
—
|
|
1,113
|
|
—
|
|
|||
|
Other net loss
|
470
|
|
361
|
|
437
|
|
|||
|
Changes in assets and liabilities, net of effects of acquired and divested companies:
|
|
|
|
||||||
|
Accounts and notes receivable
|
(2,589
|
)
|
(1,539
|
)
|
(84
|
)
|
|||
|
Proceeds from interests in trade accounts receivable conduits
|
2,269
|
|
1,257
|
|
1,034
|
|
|||
|
Inventories
|
(2,218
|
)
|
610
|
|
780
|
|
|||
|
Accounts payable
|
2,631
|
|
569
|
|
(717
|
)
|
|||
|
Other assets and liabilities, net
|
1,563
|
|
(717
|
)
|
(48
|
)
|
|||
|
Cash provided by operating activities
|
8,695
|
|
5,600
|
|
7,607
|
|
|||
|
Investing activities
|
|
||||||||
|
Capital expenditures
|
(3,570
|
)
|
(3,804
|
)
|
(3,703
|
)
|
|||
|
Investment in gas field developments
|
(121
|
)
|
(113
|
)
|
—
|
|
|||
|
Construction of assets pending sale / leaseback
|
—
|
|
(63
|
)
|
—
|
|
|||
|
Proceeds from sale / leaseback of assets
|
—
|
|
87
|
|
3
|
|
|||
|
Purchases of previously leased assets
|
(187
|
)
|
—
|
|
(46
|
)
|
|||
|
Payment into escrow / trust accounts
|
(701
|
)
|
(835
|
)
|
—
|
|
|||
|
Distribution from escrow / trust accounts
|
143
|
|
835
|
|
—
|
|
|||
|
Proceeds from sales of property and businesses, net of cash divested
|
2,959
|
|
284
|
|
2,383
|
|
|||
|
Acquisitions of property and businesses, net of cash acquired
|
19
|
|
(187
|
)
|
(123
|
)
|
|||
|
Cash acquired in Merger transaction
|
4,005
|
|
—
|
|
—
|
|
|||
|
Cash acquired in step acquisition of nonconsolidated affiliate
|
—
|
|
1,050
|
|
—
|
|
|||
|
Investments in and loans to nonconsolidated affiliates
|
(754
|
)
|
(1,020
|
)
|
(803
|
)
|
|||
|
Distributions and loan repayments from nonconsolidated affiliates
|
106
|
|
109
|
|
17
|
|
|||
|
Proceeds from sales of ownership interests in nonconsolidated affiliates
|
64
|
|
22
|
|
1,528
|
|
|||
|
Purchases of investments
|
(1,690
|
)
|
(577
|
)
|
(1,246
|
)
|
|||
|
Proceeds from sales and maturities of investments
|
4,101
|
|
733
|
|
640
|
|
|||
|
Other investing activities, net
|
(100
|
)
|
—
|
|
—
|
|
|||
|
Cash provided by (used for) investing activities
|
4,274
|
|
(3,479
|
)
|
(1,350
|
)
|
|||
|
Financing activities
|
|||||||||
|
Changes in short-term notes payable
|
(2,248
|
)
|
(33
|
)
|
(82
|
)
|
|||
|
Proceeds from issuance of long-term debt
|
499
|
|
32
|
|
1,383
|
|
|||
|
Payments on long-term debt
|
(663
|
)
|
(588
|
)
|
(1,114
|
)
|
|||
|
Purchases of treasury stock
|
(1,000
|
)
|
(916
|
)
|
(1,166
|
)
|
|||
|
Proceeds from issuance of company stock
|
66
|
|
—
|
|
—
|
|
|||
|
Proceeds from sales of common stock
|
453
|
|
398
|
|
508
|
|
|||
|
Employee taxes paid for share-based payment arrangements
|
(99
|
)
|
(65
|
)
|
(50
|
)
|
|||
|
Distributions to noncontrolling interests
|
(136
|
)
|
(176
|
)
|
(112
|
)
|
|||
|
Purchases of noncontrolling interests
|
—
|
|
(202
|
)
|
(175
|
)
|
|||
|
Contributions from noncontrolling interests
|
—
|
|
—
|
|
17
|
|
|||
|
Dividends paid to stockholders
|
(3,394
|
)
|
(2,462
|
)
|
(2,253
|
)
|
|||
|
Other financing activities, net
|
(1
|
)
|
(2
|
)
|
(88
|
)
|
|||
|
Cash used for financing activities
|
(6,523
|
)
|
(4,014
|
)
|
(3,132
|
)
|
|||
|
Effect of exchange rate changes on cash
|
297
|
|
(77
|
)
|
(202
|
)
|
|||
|
Cash reclassified as held for sale
|
88
|
|
—
|
|
—
|
|
|||
|
Summary
|
|||||||||
|
Increase (decrease) in cash and cash equivalents
|
6,831
|
|
(1,970
|
)
|
2,923
|
|
|||
|
Cash and cash equivalents at beginning of year
|
6,607
|
|
8,577
|
|
5,654
|
|
|||
|
Cash and cash equivalents at end of year
|
$
|
13,438
|
|
$
|
6,607
|
|
$
|
8,577
|
|
|
Supplemental cash flow information
|
|||||||||
|
Cash paid during the year for:
|
|||||||||
|
Interest, net of amounts capitalized
|
$
|
1,254
|
|
$
|
1,192
|
|
$
|
1,137
|
|
|
Income taxes
|
$
|
1,368
|
|
$
|
1,592
|
|
$
|
1,405
|
|
84
DowDuPont Inc.
Consolidated Statements of Equity
|
(In millions, except per share amounts)
|
Preferred Stock
|
Common Stock
|
Add'l Paid in Capital
|
Retained Earnings
|
Accum Other Comp Loss
|
Unearned ESOP
|
Treasury Stock
|
Non-controlling Interests
|
Total Equity
|
||||||||||||||||||
|
2015
|
|||||||||||||||||||||||||||
|
Balance at Jan 1, 2015
|
$
|
4,000
|
|
$
|
3,107
|
|
$
|
4,846
|
|
$
|
23,045
|
|
$
|
(8,017
|
)
|
$
|
(325
|
)
|
$
|
(4,233
|
)
|
$
|
931
|
|
$
|
23,354
|
|
|
Net income available for DowDuPont Inc. common stockholders
|
—
|
|
—
|
|
—
|
|
7,345
|
|
—
|
|
—
|
|
—
|
|
—
|
|
7,345
|
|
|||||||||
|
Other comprehensive loss
|
—
|
|
—
|
|
—
|
|
—
|
|
(650
|
)
|
—
|
|
—
|
|
—
|
|
(650
|
)
|
|||||||||
|
Dividends ($1.72 per common share)
|
—
|
|
—
|
|
—
|
|
(1,942
|
)
|
—
|
|
—
|
|
—
|
|
—
|
|
(1,942
|
)
|
|||||||||
|
Common stock issued/sold
|
—
|
|
—
|
|
508
|
|
—
|
|
—
|
|
—
|
|
766
|
|
—
|
|
1,274
|
|
|||||||||
|
Stock-based compensation and allocation of ESOP shares
|
—
|
|
—
|
|
(429
|
)
|
—
|
|
—
|
|
53
|
|
—
|
|
—
|
|
(376
|
)
|
|||||||||
|
Impact of noncontrolling interests
|
—
|
|
—
|
|
—
|
|
—
|
|
—
|
|
—
|
|
—
|
|
(122
|
)
|
(122
|
)
|
|||||||||
|
Treasury stock purchases
|
—
|
|
—
|
|
—
|
|
—
|
|
—
|
|
—
|
|
(2,688
|
)
|
—
|
|
(2,688
|
)
|
|||||||||
|
Other
|
—
|
|
—
|
|
11
|
|
(23
|
)
|
—
|
|
—
|
|
—
|
|
—
|
|
(12
|
)
|
|||||||||
|
Balance at Dec 31, 2015
|
$
|
4,000
|
|
$
|
3,107
|
|
$
|
4,936
|
|
$
|
28,425
|
|
$
|
(8,667
|
)
|
$
|
(272
|
)
|
$
|
(6,155
|
)
|
$
|
809
|
|
$
|
26,183
|
|
|
2016
|
|||||||||||||||||||||||||||
|
Net income available for DowDuPont Inc. common stockholders
|
—
|
|
—
|
|
—
|
|
3,978
|
|
—
|
|
—
|
|
—
|
|
—
|
|
3,978
|
|
|||||||||
|
Other comprehensive loss
|
—
|
|
—
|
|
—
|
|
—
|
|
(1,155
|
)
|
—
|
|
—
|
|
—
|
|
(1,155
|
)
|
|||||||||
|
Dividends ($1.84 per common share)
|
—
|
|
—
|
|
—
|
|
(2,037
|
)
|
—
|
|
—
|
|
—
|
|
—
|
|
(2,037
|
)
|
|||||||||
|
Common stock issued/sold
|
—
|
|
—
|
|
398
|
|
—
|
|
—
|
|
—
|
|
717
|
|
—
|
|
1,115
|
|
|||||||||
|
Stock-based compensation and allocation of ESOP shares
|
—
|
|
—
|
|
(376
|
)
|
—
|
|
—
|
|
51
|
|
—
|
|
—
|
|
(325
|
)
|
|||||||||
|
ESOP shares acquired
|
—
|
|
—
|
|
—
|
|
—
|
|
—
|
|
(18
|
)
|
—
|
|
—
|
|
(18
|
)
|
|||||||||
|
Impact of noncontrolling interests
|
—
|
|
—
|
|
—
|
|
—
|
|
—
|
|
—
|
|
—
|
|
433
|
|
433
|
|
|||||||||
|
Treasury stock purchases
|
—
|
|
—
|
|
—
|
|
—
|
|
—
|
|
—
|
|
(916
|
)
|
—
|
|
(916
|
)
|
|||||||||
|
Preferred stock converted to common stock
|
(4,000
|
)
|
—
|
|
(695
|
)
|
—
|
|
—
|
|
—
|
|
4,695
|
|
—
|
|
—
|
|
|||||||||
|
Other
|
—
|
|
—
|
|
(1
|
)
|
(28
|
)
|
—
|
|
—
|
|
—
|
|
—
|
|
(29
|
)
|
|||||||||
|
Balance at Dec 31, 2016
|
$
|
—
|
|
$
|
3,107
|
|
$
|
4,262
|
|
$
|
30,338
|
|
$
|
(9,822
|
)
|
$
|
(239
|
)
|
$
|
(1,659
|
)
|
$
|
1,242
|
|
$
|
27,229
|
|
|
2017
|
|||||||||||||||||||||||||||
|
Net income available for DowDuPont Inc. common stockholders
|
—
|
|
—
|
|
—
|
|
1,460
|
|
—
|
|
—
|
|
—
|
|
—
|
|
1,460
|
|
|||||||||
|
Other comprehensive income
|
—
|
|
—
|
|
—
|
|
—
|
|
850
|
|
—
|
|
—
|
|
—
|
|
850
|
|
|||||||||
|
Dividends (
$1.76 p
er common share)
|
—
|
|
—
|
|
—
|
|
(2,558
|
)
|
—
|
|
—
|
|
—
|
|
—
|
|
(2,558
|
)
|
|||||||||
|
Common stock issued/sold
|
—
|
|
—
|
|
519
|
|
—
|
|
—
|
|
—
|
|
724
|
|
—
|
|
1,243
|
|
|||||||||
|
Stock-based compensation and allocation of ESOP shares
|
—
|
|
—
|
|
(332
|
)
|
—
|
|
—
|
|
50
|
|
—
|
|
—
|
|
(282
|
)
|
|||||||||
|
Impact of noncontrolling interests
|
—
|
|
—
|
|
—
|
|
—
|
|
—
|
|
—
|
|
—
|
|
355
|
|
355
|
|
|||||||||
|
Treasury stock purchases
|
—
|
|
—
|
|
—
|
|
—
|
|
—
|
|
—
|
|
(1,000
|
)
|
—
|
|
(1,000
|
)
|
|||||||||
|
Merger impact
|
—
|
|
(3,084
|
)
|
76,829
|
|
—
|
|
—
|
|
—
|
|
935
|
|
—
|
|
74,680
|
|
|||||||||
|
Other
|
—
|
|
—
|
|
(21
|
)
|
(29
|
)
|
—
|
|
—
|
|
—
|
|
—
|
|
(50
|
)
|
|||||||||
|
Balance at Dec 31, 2017
|
$
|
—
|
|
$
|
23
|
|
$
|
81,257
|
|
$
|
29,211
|
|
$
|
(8,972
|
)
|
$
|
(189
|
)
|
$
|
(1,000
|
)
|
$
|
1,597
|
|
$
|
101,927
|
|
See Notes to the Consolidated Financial Statements.
85
|
DowDuPont Inc.
|
||
|
Notes to the Consolidated Financial Statements
|
||
Table of Contents
|
Note
|
Page
|
|
|
1
|
||
|
2
|
||
|
3
|
||
|
4
|
||
|
5
|
||
|
6
|
||
|
7
|
||
|
8
|
||
|
9
|
||
|
10
|
||
|
11
|
||
|
12
|
||
|
13
|
||
|
14
|
||
|
15
|
||
|
16
|
||
|
17
|
||
|
18
|
||
|
19
|
||
|
20
|
||
|
21
|
||
|
22
|
||
|
23
|
||
|
24
|
||
|
25
|
||
|
26
|
||
NOTE
1
- SUMMARY OF SIGNIFICANT ACCOUNTING POLICIES
Basis of Presentation
Effective August 31, 2017, pursuant to the merger of equals transactions contemplated by the Agreement and Plan of Merger, dated as of December 11, 2015, as amended on March 31, 2017 ("Merger Agreement"), The Dow Chemical Company ("Dow") and E. I. du Pont de Nemours and Company ("DuPont") each merged with subsidiaries of DowDuPont Inc. ("DowDuPont" or the "Company") and, as a result, Dow and DuPont became subsidiaries of DowDuPont (the "Merger"). Prior to the Merger, DowDuPont did not conduct any business activities other than those required for its formation and matters contemplated by the Merger Agreement. Dow was determined to be the accounting acquirer in the Merger. As a result, the historical financial statements of Dow for periods prior to the Merger are considered to be the historical financial statements of DowDuPont.
On August 31, 2017, Dow's common stock, par value
$2.50
per share, and DuPont's common stock, par value
$0.30
per share, were voluntarily delisted from the New York Stock Exchange ("NYSE") in connection with the Merger and were suspended from trading on the NYSE prior to the open of trading on September 1, 2017. DowDuPont's common stock, par value
$0.01
per share, commenced trading on the NYSE under ticker symbol DWDP on September 1, 2017.
86
The consolidated financial statements of DowDuPont and its subsidiaries were prepared in accordance with accounting principles generally accepted in the United States of America (“U.S. GAAP”) and include the assets, liabilities, revenues and expenses of all majority-owned subsidiaries over which the Company exercises control and, when applicable, entities for which the Company has a controlling financial interest or is the primary beneficiary. Intercompany transactions and balances are eliminated in consolidation. Investments in nonconsolidated affiliates (20-50 percent owned companies or less than 20 percent owned companies over which significant influence is exercised) are accounted for using the equity method.
Except as otherwise indicated by the context, the term "Dow" means The Dow Chemical Company and its consolidated subsidiaries; "DuPont" means E. I. du Pont de Nemours and Company and its consolidated subsidiaries; "Union Carbide" means Union Carbide Corporation, a wholly owned subsidiary of Dow; and, "Dow Corning" means Dow Corning Corporation, a wholly owned subsidiary of Dow.
Use of Estimates in Financial Statement Preparation
The preparation of financial statements in accordance with U.S. GAAP requires the use of estimates and assumptions that affect the reported amounts of assets and liabilities, the disclosure of contingent assets and liabilities at the date of the financial statements, and the reported amounts of revenues and expenses during the reporting period. The Company’s consolidated financial statements include amounts that are based on management’s best estimates and judgments. Actual results could differ from those estimates.
Significant Accounting Policies
Asbestos-Related Matters
Accruals for asbestos-related matters, including defense and processing costs of Union Carbide, are recorded based on an analysis of claim and resolution activity, defense spending, and pending and future claims. These accruals are assessed at each balance sheet date to determine if the asbestos-related liability remains appropriate. Accruals for asbestos-related matters are included in the consolidated balance sheets in “Accrued and other current liabilities” and “Asbestos-related liabilities - noncurrent.”
Legal Costs
The Company expenses legal costs as incurred, with the exception of Union Carbide's defense and processing costs associated with asbestos-related matters.
Foreign Currency Translation
The Company’s worldwide operations utilize the local currency or the U.S. dollar ("USD") as the functional currency, where applicable. For foreign entities where the local currency is the functional currency, assets and liabilities denominated in local currencies are translated into USD at end-of-period exchange rates and the resultant translation adjustments are reported, net of their related tax effects, as a component of “Accumulated other comprehensive loss” ("AOCL") in the equity section of the consolidated balance sheets. Income and expenses are translated at average exchange rates in effect during the period.
For certain subsidiaries, USD is used as the functional currency. This occurs when the subsidiary is considered an extension of the parent, or when the foreign subsidiary operates in a hyper-inflationary environment. Where USD is used as the functional currency, all foreign currency-denominated asset and liability amounts are re-measured into USD at end-of-period exchange rates, except for inventories, prepaid expenses, property, plant and equipment, goodwill and other intangible assets, which are re-measured at historical rates. Foreign currency income and expenses are re-measured at average exchange rates in effect during the year, except for expenses related to balance sheet amounts re-measured at historical exchange rates. Exchange gains and losses arising from re-measurement of foreign currency-denominated monetary assets and liabilities are included in income in the period in which they occur.
Environmental Matters
Accruals for environmental matters are recorded when it is probable that a liability has been incurred and the amount of the liability can be reasonably estimated based on current law and existing technologies. These accruals are adjusted periodically as assessment and remediation efforts progress or as additional technical or legal information becomes available. Accruals for environmental liabilities are included in the consolidated balance sheets in “Accrued and other current liabilities” and “Other noncurrent obligations” at undiscounted amounts. Accruals for related insurance or other third-party recoveries for environmental liabilities are recorded when it is probable that a recovery will be realized and are included in the consolidated balance sheets in “Accounts and notes receivable - Other.”
Environmental costs are capitalized if the costs extend the life of the property, increase its capacity and/or mitigate or prevent contamination from future operations. Environmental costs are also capitalized in recognition of legal asset retirement obligations resulting from the acquisition, construction and/or normal operation of a long-lived asset. Costs related to environmental contamination treatment and cleanup are charged to expense. Estimated future incremental operations, maintenance and management costs directly related to remediation are accrued when such costs are probable and reasonably estimable.
87
Cash and Cash Equivalents
Cash and cash equivalents include time deposits and investments with maturities of three months or less at the time of purchase.
Financial Instruments
The Company calculates the fair value of financial instruments using quoted market prices when available. When quoted market prices are not available for financial instruments, the Company uses standard pricing models with market-based inputs that take into account the present value of estimated future cash flows.
The Company utilizes derivatives to manage exposures to foreign currency exchange rates, commodity prices and interest rate risk. The fair values of all derivatives are recognized as assets or liabilities at the balance sheet date. Changes in the fair values of these instruments are reported in income or AOCL, depending on the use of the derivative and whether the Company has elected hedge accounting treatment.
Gains and losses on derivatives that are designated and qualify as cash flow hedging instruments are recorded in AOCL, to the extent the hedges are effective, until the underlying transactions are recognized in income. To the extent effective, gains and losses on derivative and nonderivative instruments used as hedges of the Company’s net investment in foreign operations are recorded in AOCL as part of the cumulative translation adjustment. The ineffective portions of cash flow hedges and hedges of net investment in foreign operations, if any, are recognized in income immediately.
Gains and losses on derivatives designated and qualifying as fair value hedging instruments, as well as the offsetting losses and gains on the hedged items, are reported in income in the same accounting period. Derivatives not designated as hedging instruments are marked-to-market at the end of each accounting period with the results included in income.
Inventories
Inventories are stated at the lower of cost or net realizable value. The method of determining cost for each subsidiary varies among last-in, first-out (“LIFO”); first-in, first-out (“FIFO”); and average cost, and is used consistently from year to year. At
December 31, 2017
, approximately
18 percent
,
63 percent
and
19 percent
of the Company's inventories were accounted for under the LIFO, FIFO and average cost methods, respectively. At
December 31, 2016
, approximately
28 percent
,
62 percent
and
10 percent
of the Company's inventories were accounted for under the LIFO, FIFO and average cost methods, respectively.
The Company routinely exchanges and swaps raw materials and finished goods with other companies to reduce delivery time, freight and other transportation costs. These transactions are treated as non-monetary exchanges and are valued at cost.
Property
Land, buildings and equipment, including property under capital lease agreements, are carried at cost less accumulated depreciation. Depreciation is based on the estimated service lives of depreciable assets and is calculated primarily using the straight-line method. Fully depreciated assets are retained in property and accumulated depreciation accounts until they are removed from service. In the case of disposals, assets and related accumulated depreciation are removed from the accounts, and the net amounts, less proceeds from disposal, are included in income.
Impairment and Disposal of Long-Lived Assets
The Company evaluates long-lived assets and certain identifiable intangible assets for impairment whenever events or changes in circumstances indicate that the carrying amount of an asset may not be recoverable. When undiscounted future cash flows are not expected to be sufficient to recover an asset’s carrying amount, the asset is written down to its fair value based on bids received from third parties, prices of similar assets or other valuation methodologies, including a discounted cash flow analysis based on market participant assumptions.
Long-lived assets to be disposed of by sale, if material, are classified as held for sale and reported at the lower of carrying amount or fair value less cost to sell, and depreciation is ceased. Long-lived assets to be disposed of other than by sale are classified as held and used until they are disposed of and reported at the lower of carrying amount or fair value, and depreciation is recognized over the remaining useful life of the assets.
Goodwill and Other Intangible Assets
The Company records goodwill when the purchase price of a business combination exceeds the estimated fair value of net identified tangible and intangible assets acquired. Goodwill is tested for impairment at the reporting unit level annually during the fourth quarter, or more frequently when events or changes in circumstances indicate that the fair value of a reporting unit has more likely than not declined below its carrying value. When testing goodwill for impairment, the Company may first assess qualitative factors. If an initial qualitative assessment identifies that it is more likely than not that the fair value of a reporting unit is less than its carrying value, additional quantitative testing is performed. The Company may also elect to skip the qualitative testing and proceed
88
directly to the quantitative testing. If the quantitative testing indicates that goodwill is impaired, an impairment charge is recognized based on the difference between the reporting unit's carrying value and its fair value. The Company primarily utilizes a discounted cash flow methodology to calculate the fair value of its reporting units.
Finite-lived intangible assets such as purchased customer lists, developed technology, patents, trademarks and software, are amortized over their estimated useful lives, generally on a straight-line basis for periods ranging primarily from
three
to
twenty
years, or amortized based on units of production. Indefinite-lived intangible assets are reviewed for impairment or obsolescence annually, or more frequently when events or changes in circumstances indicate that the carrying amount of an intangible asset may not be recoverable. If impaired, intangible assets are written down to fair value based on discounted cash flows.
Investments
Investments in debt and marketable equity securities (including warrants) are classified as trading, available-for-sale or held-to-maturity. Investments classified as trading are reported at fair value with unrealized gains and losses related to mark-to-market adjustments included in income. Those classified as available-for-sale are reported at fair value with unrealized gains and losses recorded in AOCL. Those classified as held-to-maturity are recorded at amortized cost. The cost of investments sold is determined by FIFO or specific identification. The Company routinely reviews available-for-sale and held-to-maturity securities for other-than-temporary declines in fair value below the cost basis. When events or changes in circumstances indicate the carrying value of an asset may not be recoverable, the security is written down to fair value, establishing a new cost basis.
Revenue
Sales are recognized when the revenue is realized or realizable, and the earnings process is complete. Approximately
98 percent
of the Company’s sales in
2017
related to sales of product (
99 percent
in
2016
and
99 percent
in
2015
). The remaining
2 percent
in
2017
primarily related to Dow’s insurance operations and licensing of patents and technology (
1 percent
in
2016
and
1
percent in
2015
). Revenue for product sales is recognized as risk and title to the product transfer to the customer, which usually occurs at the time shipment is made. As such, title to the product passes when the product is delivered to the freight carrier. The Company's standard terms of delivery are included in its contracts of sale, order confirmation documents and invoices. Freight costs and any directly related costs of transporting finished product to customers are recorded as “Cost of sales” in the consolidated statements of income.
Revenue related to Dow's insurance operations includes third-party insurance premiums, which are earned over the terms of the related insurance policies and reinsurance contracts. Revenue related to the initial licensing of patents and technology is recognized when earned; revenue related to running royalties is recognized according to licensee production levels.
The Company periodically enters into prepayment contracts with customers in the Agriculture segment and receives advance payments for product to be delivered in future periods. These advance payments are recorded as deferred revenue (classified as "Accrued and other current liabilities" in the consolidated balance sheets) or debt, depending on the nature of the program. Revenue associated with advance payments is recognized as shipments are made and title, ownership and risk of loss pass to the customer.
Royalty Expense
The Company’s Agriculture segment currently has certain third party biotechnology trait license agreements, which require upfront and variable payments subject to the licensor meeting certain conditions. These payments are reflected as "Other current assets" and "Deferred charges and other assets" in the consolidated balance sheets and are amortized to "Cost of sales" in the consolidated statements of income as seeds containing the respective trait technology are utilized over the life of the license. The Company evaluates the carrying value of the prepaid royalties when events or changes in circumstances indicate the carrying value may not be recoverable.
Severance Costs
The Company routinely reviews its operations around the world in an effort to ensure competitiveness across its businesses and geographic regions. When the reviews result in a workforce reduction related to the shutdown of facilities or other optimization activities, severance benefits are provided to employees primarily under Dow and DuPont's ongoing benefit arrangements. These severance costs are accrued once management commits to a plan of termination and it becomes probable that employees will be entitled to benefits at amounts that can be reasonably estimated.
Integration and Separation Costs
The Company classifies expenses related to the Merger and the ownership restructure of Dow Corning as "Integration and separation costs" in the consolidated statements of income. Merger-related costs include: costs incurred to prepare for and close the Merger, post-Merger integration expenses and costs incurred to prepare for the intended separation of the Company’s agriculture, materials science and specialty products businesses. The Dow Corning related-costs include: costs incurred to prepare for and close the
89
ownership restructure as well as integration expenses. These costs primarily consist of financial advisory, information technology, legal, accounting, consulting and other professional advisory fees associated with preparation and execution of these activities.
Income Taxes
The Company accounts for income taxes using the asset and liability method. Under this method, deferred tax assets and liabilities are recognized for the future tax consequences of temporary differences between the carrying amounts and tax bases of assets and liabilities using enacted tax rates. The effect of a change in tax rates on deferred tax assets or liabilities is recognized in income in the period that includes the enactment date.
The Company recognizes the financial statement effects of an uncertain income tax position when it is more likely than not, based on the technical merits, that the position will be sustained upon examination. The Company accrues for other tax contingencies when it is probable that a liability to a taxing authority has been incurred and the amount of the contingency can be reasonably estimated. The current portion of uncertain income tax positions is included in “Income taxes payable” and the long-term portion is included in “Other noncurrent obligations” in the consolidated balance sheets.
Provision is made for taxes on undistributed earnings of foreign subsidiaries and related companies to the extent that such earnings are not deemed to be permanently invested.
See Note
8
for further information relating to the enactment of the Tax Cuts and Jobs Act.
Earnings per Common Share
The calculation of earnings per common share is based on the weighted-average number of the Company’s common shares outstanding for the applicable period. The calculation of diluted earnings per common share reflects the effect of all potential common shares that were outstanding during the respective periods, unless the effect of doing so is antidilutive.
Adoption of Accounting Standards Update ("ASU") 2016-09, "Compensation - Stock Compensation (Topic 718): Improvements to Employee Share-Based Payment Accounting"
In the first quarter of 2017, the Company adopted ASU 2016-09 and elected to apply changes on a retrospective basis to the consolidated statements of cash flows related to the classification of excess tax benefits and employee taxes paid for share-based payment arrangements. See Note
2
for additional information. The following table summarizes the changes made to the consolidated statements of cash flows for the years ended December 31, 2016 and 2015:
|
Summary of Changes to the Consolidated Statements of Cash Flows
|
2016
|
2015
|
||||||||||
|
In millions
|
As Filed
|
Updated
|
As Filed
|
Updated
|
||||||||
|
Operating Activities
|
||||||||||||
|
Excess tax benefits from share-based payment arrangements
|
$
|
(57
|
)
|
$
|
—
|
|
$
|
(41
|
)
|
$
|
—
|
|
|
Other assets and liabilities, net
|
$
|
(34
|
)
|
$
|
31
|
|
$
|
878
|
|
$
|
928
|
|
|
Cash provided by operating activities
|
$
|
5,478
|
|
$
|
5,600
|
|
$
|
7,516
|
|
$
|
7,607
|
|
|
Financing Activities
|
||||||||||||
|
Excess tax benefits from share-based payment arrangements
|
$
|
57
|
|
$
|
—
|
|
$
|
41
|
|
$
|
—
|
|
|
Employee taxes paid for share-based payment arrangements
|
$
|
—
|
|
$
|
(65
|
)
|
$
|
—
|
|
$
|
(50
|
)
|
|
Cash used for financing activities
|
$
|
(3,892
|
)
|
$
|
(4,014
|
)
|
$
|
(3,041
|
)
|
$
|
(3,132
|
)
|
Changes in Financial Statement Presentation
As a result of the Merger, certain reclassifications of prior period amounts were made to improve comparability and conform with the current period presentation. Presentation changes were made to the consolidated statements of income, consolidated balance sheets, consolidated statements of cash flows and consolidated statements of equity. In addition, certain reclassifications of prior period data were made in the Notes to the Consolidated Financial Statements to conform with the current period presentation.
90
The changes to the financial statements are summarized as follows:
Consolidated Statements of Income
Asset impairment charges were reclassified from "Cost of sales" and "Sundry income (expense) - net" to "Restructuring, goodwill impairment and asset related charges - net." Costs associated with integration and separation activities are now separately reported as “Integration and separation costs” and were reclassified from “Cost of sales” and “Selling, general and administrative expenses.” In addition, “Interest income” was reclassified to “Sundry income (expense) - net.” The following table summarizes the changes made to the consolidated statements of income for the years ended December 31, 2016 and 2015:
|
Summary of Changes to the Consolidated Statements of Income
|
2016
|
2015
|
||||||||||
|
In millions
|
As Filed
|
Updated
|
As Filed
|
Updated
|
||||||||
|
Cost of sales
|
$
|
37,641
|
|
$
|
37,640
|
|
$
|
37,836
|
|
$
|
37,745
|
|
|
Selling, general and administrative expenses
|
$
|
3,304
|
|
$
|
2,956
|
|
$
|
2,971
|
|
$
|
2,948
|
|
|
Restructuring, goodwill impairment and asset related charges - net
|
$
|
452
|
|
$
|
595
|
|
$
|
415
|
|
$
|
559
|
|
|
Integration and separation costs
|
$
|
—
|
|
$
|
349
|
|
$
|
—
|
|
$
|
23
|
|
|
Sundry income (expense) - net
|
$
|
1,202
|
|
$
|
1,452
|
|
$
|
4,592
|
|
$
|
4,716
|
|
|
Interest income
|
$
|
107
|
|
$
|
—
|
|
$
|
71
|
|
$
|
—
|
|
Consolidated Balance Sheets
The Company reclassified “Dividends payable” to “Accrued and other current liabilities” and the current portion of deferred revenue was reclassified from “Accounts payable - Other” to “Accrued and other current liabilities.” In addition, certain derivative assets were reclassified from “Accounts and notes receivable - Other” to “Other current assets” and certain derivative liabilities were reclassified from “Accounts payable - Other” to “Accrued and other current liabilities.” A summary of the changes made to the consolidated balance sheets is as follows:
|
Summary of Changes to the Consolidated Balance Sheets
|
Dec 31, 2016
|
|||||
|
In millions
|
As Filed
|
Updated
|
||||
|
Accounts and notes receivable - Other
|
$
|
4,358
|
|
$
|
4,312
|
|
|
Other current assets
|
$
|
665
|
|
$
|
711
|
|
|
Accounts payable - Other
|
$
|
2,401
|
|
$
|
2,097
|
|
|
Dividends payable
|
$
|
508
|
|
$
|
—
|
|
|
Accrued and other current liabilities
|
$
|
3,669
|
|
$
|
4,481
|
|
91
Consolidated Statements of Cash Flows
The following table summarizes the changes made to the consolidated statements of cash flows for the years ended December 31, 2016 and 2015:
|
Summary of Changes to the Consolidated Statements of Cash Flows
|
2016
|
2015
|
||||||||||
|
In millions
|
As Filed
|
Updated
|
As Filed
|
Updated
|
||||||||
|
Operating Activities
|
||||||||||||
|
Net periodic pension benefit cost
|
$
|
—
|
|
$
|
389
|
|
$
|
—
|
|
$
|
755
|
|
|
Net gain on sales of assets, businesses and investments
|
$
|
—
|
|
$
|
(214
|
)
|
$
|
—
|
|
$
|
(4,655
|
)
|
|
Net gain on sales of investments
|
$
|
(116
|
)
|
$
|
—
|
|
$
|
(95
|
)
|
$
|
—
|
|
|
Net gain on sales of property, businesses and consolidated companies
|
$
|
(88
|
)
|
$
|
—
|
|
$
|
(3,811
|
)
|
$
|
—
|
|
|
Net gain on sales of ownership interests in nonconsolidated affiliates
|
$
|
(10
|
)
|
$
|
—
|
|
$
|
(749
|
)
|
$
|
—
|
|
|
Asset impairments and related costs
|
$
|
143
|
|
$
|
—
|
|
$
|
144
|
|
$
|
—
|
|
|
Restructuring, goodwill impairment and asset related charges - net
|
$
|
452
|
|
$
|
595
|
|
$
|
415
|
|
$
|
559
|
|
|
Loss on early extinguishment of debt
|
$
|
—
|
|
$
|
—
|
|
$
|
8
|
|
$
|
—
|
|
|
Other net loss
|
$
|
113
|
|
$
|
361
|
|
$
|
172
|
|
$
|
437
|
|
|
Accounts payable
|
$
|
458
|
|
$
|
569
|
|
$
|
(681
|
)
|
$
|
(717
|
)
|
|
Other assets and liabilities, net
1
|
$
|
31
|
|
$
|
(717
|
)
|
$
|
928
|
|
$
|
(48
|
)
|
|
Financing Activities
|
||||||||||||
|
Transaction financing, debt issuance and other costs
|
$
|
(2
|
)
|
$
|
—
|
|
$
|
(88
|
)
|
$
|
—
|
|
|
Other financing activities, net
|
$
|
—
|
|
$
|
(2
|
)
|
$
|
—
|
|
$
|
(88
|
)
|
|
1.
|
As updated for ASU 2016-09.
|
Consolidated Statements of Equity
The following table summarizes the changes made to "Retained Earnings" in the consolidated statements of equity for the years ended December 31, 2016 and 2015:
|
Summary of Changes to the Consolidated Statements of Equity
|
2016
|
2015
|
||||||||||
|
In millions
|
As Filed
|
Updated
|
As Filed
|
Updated
|
||||||||
|
Dividend equivalents on participating securities
|
$
|
(28
|
)
|
$
|
—
|
|
$
|
(23
|
)
|
$
|
—
|
|
|
Other
|
$
|
—
|
|
$
|
(28
|
)
|
$
|
—
|
|
$
|
(23
|
)
|
NOTE
2
- RECENT ACCOUNTING GUIDANCE
Recently Adopted Accounting Guidance
In the first quarter of 2017, the Company adopted ASU 2016-09, "Compensation - Stock Compensation (Topic 718): Improvements to Employee Share-Based Payment Accounting," which simplifies several aspects of the accounting for share-based payment awards to employees, including the accounting for income taxes, forfeitures, statutory tax withholding requirements and classification in the statement of cash flows. The new standard was effective for fiscal years, and interim periods within those fiscal years, beginning after December 15, 2016. Under the new guidance, excess tax benefits related to equity compensation are now recognized in "Provision (Credit) for income taxes on continuing operations" in the consolidated statements of income rather than in "Additional paid-in capital" in the consolidated balance sheets and this change was applied on a prospective basis. Changes to the consolidated statements of cash flows related to the classification of excess tax benefits and employee taxes paid for share‑based payment arrangements were implemented on a retrospective basis. See Note
1
for additional information.
In the fourth quarter of 2017, the Company early adopted ASU 2017-04, "Intangibles - Goodwill and Other (Topic 350): Simplifying the Test for Goodwill Impairment." The new guidance eliminates the requirement to determine the fair value of individual assets and liabilities of a reporting unit to measure goodwill impairment. Under the amendments in the new guidance, goodwill impairment testing is performed by comparing the fair value of the reporting unit with its carrying amount and recognizing an impairment charge for the amount by which the carrying amount exceeds the reporting unit's fair value. The new standard is effective for annual and interim goodwill impairment tests in fiscal years beginning after December 15, 2019, and should be applied on a prospective basis. Early adoption was permitted for annual or interim goodwill impairment testing performed after January 1, 2017. The Company adopted the new guidance for goodwill impairment tests performed in the fourth quarter of 2017. See Note
13
for additional information.
92
Accounting Guidance Issued But Not Adopted at
December 31, 2017
In May 2014, the Financial Accounting Standards Board ("FASB") issued ASU 2014-09, "Revenue from Contracts with Customers (Topic 606)," which is the new comprehensive revenue recognition standard that will supersede all existing revenue recognition guidance under U.S. GAAP. The standard's core principle is that a company will recognize revenue when it transfers promised goods or services to a customer in an amount that reflects the consideration to which the company expects to be entitled in exchange for those goods or services. ASU 2015-14, "Revenue from Contracts with Customers (Topic 606): Deferral of the Effective Date," which was issued in August 2015, revised the effective date for this ASU to annual and interim periods beginning on or after December 15, 2017, with early adoption permitted, but not earlier than the original effective date of annual and interim periods beginning on or after December 15, 2016, for public entities. Entities will have the option of using either a full retrospective approach or a modified approach to adopt the guidance in ASU 2014-09.
In May 2014, the FASB and International Accounting Standards Board formed The Joint Transition Resource Group for Revenue Recognition ("TRG"), consisting of financial statement preparers, auditors and users, to seek feedback on potential issues related to the implementation of the new revenue standard. As a result of feedback from the TRG, the FASB issued additional guidance to provide clarification, implementation guidance and practical expedients to address some of the challenges of implementation. In March 2016, the FASB issued ASU 2016-08, "Revenue from Contracts with Customers (Topic 606): Principal versus Agent Considerations (Reporting Revenue Gross versus Net)," which is an amendment on assessing whether an entity is a principal or an agent in a revenue transaction. This amendment addresses issues to clarify the principal versus agent assessment and lead to more consistent application. In April 2016, the FASB issued ASU 2016-10, "Revenue from Contracts with Customers (Topic 606): Identifying Performance Obligations and Licensing," which contains amendments to the new revenue recognition standard on identifying performance obligations and accounting for licenses of intellectual property. The amendments related to identifying performance obligations clarify when a promised good or service is separately identifiable and allows entities to disregard items that are immaterial in the context of a contract. The licensing implementation amendments clarify how an entity should evaluate the nature of its promise in granting a license of intellectual property, which will determine whether revenue is recognized over time or at a point in time. In May 2016, the FASB issued ASU 2016-12, "Revenue from Contracts with Customers (Topic 606): Narrow-Scope Improvements and Practical Expedients," which provides clarity and implementation guidance on assessing collectibility, presentation of sales taxes, noncash consideration, and completed contracts and contract modifications at transition. The new standards have the same effective date and transition requirements as ASU 2014-09.
The Company analyzed the impact of ASU 2014-09, and the related ASU's, across all revenue streams to evaluate the impact of the new standard on revenue contracts. This included reviewing current accounting policies and practices to identify potential differences that would result from applying the requirements under the new standard. The Company completed contract reviews and validated the results of applying the new revenue guidance. The Company finalized its accounting policies, the evaluation of the impact of the accounting and disclosure requirements on its business processes, controls and systems, and is drafting new disclosures required post-implementation in 2018. The Company will adopt the new standard using the modified retrospective approach, under which the cumulative effect of initially applying the new guidance will be recognized as an adjustment to the opening balance of retained earnings in the first quarter of 2018. Based on the completed analysis, the Company has determined the adjustment will not have a material impact on the consolidated financial statements.
In January 2016, the FASB issued ASU 2016-01, "Financial Instruments - Overall (Subtopic 825-10): Recognition and Measurement of Financial Assets and Financial Liabilities," which amends the guidance under U.S. GAAP on the classification and measurement of financial instruments. Changes to the current guidance primarily affects the accounting for equity investments, financial liabilities under the fair value option, and the presentation and disclosure requirements for financial instruments. In addition, the ASU clarifies guidance related to the valuation allowance assessment when recognizing deferred tax assets resulting from unrealized losses on available-for-sale debt securities. The new standard is effective for fiscal years and interim periods beginning after December 15, 2017, and upon adoption, an entity should apply the amendments by means of a cumulative-effect adjustment to the balance sheet at the beginning of the first reporting period in which the guidance is effective. Early adoption is not permitted except for the provision to record fair value changes for financial liabilities under the fair value option resulting from instrument‑specific credit risk in other comprehensive income. The Company will adopt the new guidance in the first quarter of 2018 and the adoption of this guidance will not have a material impact on the consolidated financial statements.
In February 2016, the FASB issued ASU 2016-02, "Leases (Topic 842)," which requires organizations that lease assets to recognize on the balance sheet the assets and liabilities for the rights and obligations created by those leases. The new guidance requires that a lessee recognize assets and liabilities for leases with lease terms of more than twelve months and recognition, presentation and measurement in the financial statements will depend on its classification as a finance or operating lease. In addition, the new guidance will require disclosures to help investors and other financial statement users better understand the amount, timing and uncertainty of cash flows arising from leases. Lessor accounting remains largely unchanged from current U.S. GAAP but does contain some targeted improvements to align with the new revenue recognition guidance issued in 2014. The new standard is effective for fiscal years, and interim periods within those fiscal years, beginning after December 15, 2018, using a modified
93
retrospective approach, and early adoption is permitted. The Company has a team in place to evaluate the new guidance and is in the process of implementing software solutions to facilitate the development of business processes and controls around leases to meet the new accounting and disclosure requirements upon adoption in the first quarter of 2019.
In August 2016, the FASB issued ASU 2016-15, "Statement of Cash Flows (Topic 230): Classification of Certain Cash Receipts and Cash Payments," which addresses diversity in practice in how certain cash receipts and cash payments are presented and classified in the statement of cash flows with respect to eight specific cash flow issues. The new standard is effective for fiscal years, and interim periods within those fiscal years, beginning after December 15, 2017. The amendments should be applied using a retrospective transition method to each period presented, if practicable. Early adoption is permitted, including in an interim period, and any adjustments should be reflected as of the beginning of the year that includes the interim period. All amendments must be adopted in the same period. A key provision in the new guidance will impact the presentation of proceeds from interests in trade accounts receivable conduits which will be retrospectively reclassified from "Operating Activities" to "Investing Activities" in the consolidated statements of cash flows when the Company adopts the new guidance in the first quarter of 2018.
In October 2016, the FASB issued ASU 2016-16, "Income Taxes (Topic 740): Intra-Entity Transfers of Assets Other Than Inventory," which requires an entity to recognize the income tax consequences of an intra-entity transfer of an asset other than inventory when the transfer occurs. The amendments are effective for fiscal years, and interim periods within those fiscal years, beginning after December 15, 2017, and should be applied on a modified retrospective basis through a cumulative-effect adjustment directly to retained earnings at the beginning period of adoption. Early adoption is permitted in the first interim period of an annual reporting period for which financial statements have not been issued. The Company will adopt the new guidance in the first quarter of 2018 and the adoption of this guidance will not have a material impact on the consolidated financial statements.
In November 2016, the FASB issued ASU 2016-18, "Statement of Cash Flows (Topic 230): Restricted Cash (a consensus of the FASB Emerging Issues Task Force)," which clarifies how entities should present restricted cash and restricted cash equivalents in the statement of cash flows, and, as a result, entities will no longer present transfers between cash and cash equivalents and restricted cash and restricted cash equivalents in the statement of cash flows. An entity with a material balance of restricted cash and restricted cash equivalents must disclose information about the nature of the restrictions. The new standard is effective for fiscal years, and interim periods within those fiscal years, beginning after December 15, 2017. Early adoption is permitted and the new guidance must be applied retrospectively to all periods presented. The new guidance will change the presentation of restricted cash in the consolidated statements of cash flows and will be applied retrospectively in the first quarter of 2018.
In January 2017, the FASB issued ASU 2017-01, "Business Combinations (Topic 805): Clarifying the Definition of a Business," which narrows the existing definition of a business and provides a framework for evaluating whether a transaction should be accounted for as an acquisition (or disposal) of assets or a business. The guidance requires an entity to evaluate if substantially all of the fair value of gross assets acquired is concentrated in a single identifiable asset or a group of similar identifiable assets; if so, the set of transferred assets and activities (collectively the "set") is not a business. To be considered a business, the set would need to include an input and a substantive process that together significantly contribute to the ability to create outputs, as defined by the ASU. The new standard is effective for fiscal years beginning after December 15, 2017, and interim periods within those fiscal years, and should be applied prospectively. Early adoption is permitted. The Company adopted the new guidance on January 1, 2018, and will apply it to all applicable transactions after the adoption date.
In February 2017, the FASB issued ASU 2017-05, "Other Income - Gains and Losses from the Derecognition of Nonfinancial Assets (Subtopic 610-20): Clarifying the Scope of Asset Derecognition Guidance and Accounting for Partial Sales of Nonfinancial Assets," which clarifies the scope of guidance on nonfinancial asset derecognition in Accounting Standards Codification ("ASC") 610-20 and the accounting for partial sales of nonfinancial assets. The new guidance also conforms the derecognition guidance for nonfinancial assets with the model in the new revenue standard (ASU 2014-09). The new standard is effective for annual reporting periods, and interim periods within those fiscal years, beginning after December 15, 2017, and an entity is required to apply the amendments at the same time that it applies the amendments in ASU 2014-09. The Company will apply the new guidance with the implementation of the new revenue standard in the first quarter of 2018.
In March 2017, the FASB issued ASU 2017-07, "Compensation - Retirement Benefits (Topic 715): Improving the Presentation of Net Periodic Pension Cost and Net Periodic Postretirement Benefit Cost," which amends the requirements related to the income statement presentation of the components of net periodic benefit cost for employer sponsored defined benefit pension and other postretirement benefit plans. Under the new guidance, an entity must disaggregate and present the service cost component of net periodic benefit cost in the same income statement line item(s) as other employee compensation costs arising from services rendered during the period, and only the service cost component will be eligible for capitalization. Other components of net periodic benefit cost will be presented separately from the line item(s) that includes the service cost. The new standard is effective for fiscal years, and interim periods within those fiscal years, beginning after December 15, 2017. Early adoption is permitted at the beginning of an annual period in which the financial statements have not been issued. Entities must use a retrospective transition method to
94
adopt the requirement for separate presentation of the income statement service cost and other components, and a prospective transition method to adopt the requirement to limit the capitalization of benefit cost to the service cost component. The Company will adopt the new guidance in the first quarter of 2018, using a retrospective transition method to reclassify net periodic benefit cost, other than the service cost component, from "Cost of sales," "Research and development expenses" and "Selling, general and administrative expenses" to "Sundry income (expense) - net" in the consolidated statements of income.
In August 2017, the FASB issued ASU 2017-12, "Derivatives and Hedging (Topic 815): Targeted Improvements to Accounting for Hedging Activities," which amends the hedge accounting recognition and presentation defined under ASC 815, with the objectives of improving the financial reporting of hedging relationships to better portray the economic results of an entity's risk management activities and simplifying the application of hedge accounting by preparers. The new standard expands the strategies eligible for hedge accounting, relaxes the timing requirements of hedge documentation and effectiveness assessments, and permits, in certain cases, the use of qualitative assessments on an ongoing basis to assess hedge effectiveness. The new guidance also requires new disclosures and presentation. The new standard is effective for fiscal years, and interim periods within those fiscal years, beginning after December 15, 2018. Early adoption is permitted in any interim or annual period after issuance of the ASU. Entities must adopt the new guidance by applying a modified retrospective approach to hedging relationships existing as of the adoption date. The Company is currently evaluating the impact of adopting this guidance.
NOTE
3
- BUSINESS COMBINATIONS
Merger of Equals of Dow and DuPont
At the effective time of the Merger, each share of common stock, par value
$2.50
per share, of Dow ("Dow Common Stock") (excluding any shares of Dow Common Stock that were held in treasury immediately prior to the effective time of the Merger, which were automatically canceled and retired for no consideration) was converted into the right to receive one fully paid and non-assessable share of common stock, par value
$0.01
per share, of DowDuPont ("DowDuPont Common Stock"). Upon completion of the Merger, (i) each share of common stock, par value
$0.30
per share, of DuPont (“DuPont Common Stock”) (excluding any shares of DuPont Common Stock that were held in treasury immediately prior to the effective time of the Merger, which were automatically canceled and retired for no consideration) was converted into the right to receive
1.2820
fully paid and non-assessable shares of DowDuPont Common Stock, in addition to cash in lieu of any fractional shares of DowDuPont Common Stock, and (ii) each share of DuPont Preferred Stock
$4.50
Series and DuPont Preferred Stock
$3.50
Series (collectively, the “DuPont Preferred Stock”) issued and outstanding immediately prior to the effective time of the Merger remains issued and outstanding and was unaffected by the Merger.
As provided in the Merger Agreement, at the effective time of the Merger, Dow stock options and other equity awards were generally automatically converted into stock options and equity awards with respect to DowDuPont Common Stock and DuPont stock options and other equity awards, after giving effect to the exchange ratio, were converted into stock options and equity awards with respect to DowDuPont Common Stock, and otherwise generally on the same terms and conditions under the applicable plans and award agreements immediately prior to the effective time of the Merger. See Notes
17
and
20
for additional information.
DowDuPont intends to pursue, subject to the receipt of approval by the Board of Directors of DowDuPont, the separation of the combined Company's agriculture, materials science and specialty products businesses through one or more tax-efficient transactions ("Intended Business Separations").
Preliminary Allocation of Purchase Price
Based on an evaluation of the provisions of ASC 805, "Business Combinations" ("ASC 805"), Dow was determined to be the accounting acquirer in the Merger. DowDuPont has applied the acquisition method of accounting with respect to the assets and liabilities of DuPont, which have been measured at fair value as of the date of the Merger.
DuPont's assets and liabilities were measured at estimated fair values at August 31, 2017, primarily using Level 3 inputs. Estimates of fair value represent management's best estimate and require a complex series of judgments about future events and uncertainties. Third-party valuation specialists were engaged to assist in the valuation of these assets and liabilities.
The total fair value of consideration transferred for the Merger was
$74,680 million
. Total consideration is comprised of the equity value of the DowDuPont shares at August 31, 2017, that were issued in exchange for DuPont shares, the cash value for fractional shares, and the portion of DuPont's share awards and share options earned at August 31, 2017. Share awards and share options converted to DowDuPont equity instruments, but not vested, were
$144 million
at August 31, 2017, which will be expensed over the remaining future vesting period.
95
The following table summarizes the fair value of consideration exchanged as a result of the Merger:
|
Merger Consideration
|
|||
|
In millions (except exchange ratio)
|
|||
|
DuPont Common Stock outstanding at Aug 31, 2017
|
868.3
|
|
|
|
DuPont exchange ratio
|
1.2820
|
||
|
DowDuPont Common Stock issued in exchange for DuPont Common Stock
|
1,113.2
|
|
|
|
Fair value of DowDuPont Common Stock issued
1
|
$
|
74,195
|
|
|
Fair value of DowDuPont equity awards issued in exchange for outstanding DuPont equity awards
2
|
485
|
|
|
|
Total consideration
|
$
|
74,680
|
|
|
1.
|
Amount was determined based on the price per share of Dow Common Stock of
$66.65
on August 31, 2017.
|
|
2.
|
Represents the fair value of replacement awards issued for DuPont's equity awards outstanding immediately before the Merger and attributable to the service periods prior to the Merger. The previous DuPont equity awards were converted into the right to receive
1.2820
shares of DowDuPont Common Stock.
|
The acquisition method of accounting requires, among other things, that identifiable assets acquired and liabilities assumed be recognized on the balance sheet at fair value as of the acquisition date. In determining the fair value, DowDuPont utilized various forms of the income, cost and market approaches depending on the asset or liability being fair valued. The estimation of fair value required significant judgments related to future net cash flows (including net sales, cost of products sold, selling and marketing costs, and working capital/contributory asset charges), discount rates reflecting the risk inherent in each cash flow stream, competitive trends, market comparables and other factors. Inputs were generally determined by taking into account historical data, supplemented by current and anticipated market conditions, and growth rates.
96
The table below presents the preliminary fair value that was allocated to DuPont's assets and liabilities based upon fair values as determined by DowDuPont. The valuation process to determine the fair values is not yet complete. The Company estimated the preliminary fair value of acquired assets and liabilities as of the date of acquisition based on information currently available and continues to adjust those estimates upon refinement of market participant assumptions for integrating businesses, finalization of tax returns in the pre-merger period and application of push-down accounting at the subsidiary level. The preliminary fair values are substantially complete with the exception of identifiable intangible assets, property, plant and equipment, income taxes and goodwill. As the Company finalizes the fair value of assets acquired and liabilities assumed, additional purchase price adjustments may be recorded during the measurement period, but no later than one year from the date of the acquisition. The Company will reflect measurement period adjustments, if any, in the period in which the adjustments are recognized. Final determination of the fair values may result in further adjustments to the values presented in the following table:
|
DuPont Assets Acquired and Liabilities Assumed on Aug 31, 2017
|
Estimated
fair value as previously reported
1
|
Measurement period adjustments
2
|
Estimated fair value adjusted
|
||||||
|
In millions
|
|||||||||
|
Fair Value of Assets Acquired
|
|||||||||
|
Cash and cash equivalents
|
$
|
4,005
|
|
$
|
—
|
|
$
|
4,005
|
|
|
Marketable securities
|
2,849
|
|
—
|
|
2,849
|
|
|||
|
Accounts and notes receivable - Trade
|
6,199
|
|
—
|
|
6,199
|
|
|||
|
Accounts and notes receivable - Other
|
1,652
|
|
—
|
|
1,652
|
|
|||
|
Inventories
|
8,886
|
|
(79
|
)
|
8,807
|
|
|||
|
Other current assets
|
360
|
|
—
|
|
360
|
|
|||
|
Assets held for sale
|
3,184
|
|
564
|
|
3,748
|
|
|||
|
Investment in nonconsolidated affiliates
|
1,685
|
|
(31
|
)
|
1,654
|
|
|||
|
Other investments
|
50
|
|
—
|
|
50
|
|
|||
|
Noncurrent receivables
|
84
|
|
—
|
|
84
|
|
|||
|
Property
|
12,122
|
|
(181
|
)
|
11,941
|
|
|||
|
Goodwill
3
|
45,501
|
|
(396
|
)
|
45,105
|
|
|||
|
Other intangible assets
3
|
27,844
|
|
(623
|
)
|
27,221
|
|
|||
|
Deferred income tax assets
|
487
|
|
(203
|
)
|
284
|
|
|||
|
Deferred charges and other assets
|
1,942
|
|
—
|
|
1,942
|
|
|||
|
Total Assets
|
$
|
116,850
|
|
$
|
(949
|
)
|
$
|
115,901
|
|
|
Fair Value of Liabilities Assumed
|
|
|
|
||||||
|
Notes payable
|
$
|
4,046
|
|
$
|
—
|
|
$
|
4,046
|
|
|
Long-term debt due within one year
|
1,273
|
|
—
|
|
1,273
|
|
|||
|
Accounts payable - Trade
|
2,344
|
|
—
|
|
2,344
|
|
|||
|
Accounts payable - Other
|
939
|
|
—
|
|
939
|
|
|||
|
Income taxes payable
|
140
|
|
—
|
|
140
|
|
|||
|
Accrued and other current liabilities
|
3,517
|
|
—
|
|
3,517
|
|
|||
|
Liabilities held for sale
|
104
|
|
11
|
|
115
|
|
|||
|
Long-Term Debt
|
9,878
|
|
—
|
|
9,878
|
|
|||
|
Deferred income tax liabilities
|
9,408
|
|
(940
|
)
|
8,468
|
|
|||
|
Pension and other postretirement benefits - noncurrent
|
8,092
|
|
(36
|
)
|
8,056
|
|
|||
|
Other noncurrent obligations
|
2,028
|
|
—
|
|
2,028
|
|
|||
|
Total Liabilities
|
$
|
41,769
|
|
$
|
(965
|
)
|
$
|
40,804
|
|
|
Noncontrolling interests
|
401
|
|
16
|
|
417
|
|
|||
|
Net Assets (Consideration for the Merger)
|
$
|
74,680
|
|
$
|
—
|
|
$
|
74,680
|
|
|
1.
|
As previously reported in the Company’s Quarterly Report on Form 10-Q for the period ended September 30, 2017.
|
|
2.
|
The Company recorded measurement period adjustments in the fourth quarter of 2017 to reflect facts and circumstances in existence as of the Merger. These measurement period adjustments primarily related to changes in preliminary valuation assumptions, including market participant estimates of cash flows and estimates of asset useful lives, as well as other initial estimates. All measurement period adjustments were offset against goodwill.
|
|
3.
|
See Note
13
for additional information.
|
97
The significant fair value adjustments included in the preliminary allocation of purchase price are discussed below.
Inventories
Acquired inventory is comprised of finished goods of
$4,929 million
, work in process of
$3,055 million
and raw materials and supplies of
$823 million
. The fair value of finished goods was calculated as the estimated selling price, adjusted for costs of the selling effort and a reasonable profit allowance relating to the selling effort. The fair value of work in process inventory was primarily calculated as the estimated selling price, adjusted for estimated costs to complete the manufacturing, estimated costs of the selling effort, as well as a reasonable profit margin on the remaining manufacturing and selling effort. The fair value of raw materials and supplies was determined to approximate the historical carrying value. For inventory accounted for under the FIFO method and average cost method, the preliminary fair value step-up of inventories will be recognized in "Cost of sales" as the inventory is sold. For inventory accounted for under the LIFO method, the acquired inventory becomes the LIFO base layer inventory. The pretax amount of inventory step-up recognized for the period ended December 31, 2017, was
$1,538 million
, of which
$1,434 million
was reflected in "Cost of sales" within "Income from continuing operations before income taxes" and
$104 million
was reflected in "Loss from discontinued operations, net of tax" in the consolidated statements of income.
Property
Property, plant and equipment is comprised of machinery and equipment of
$7,466 million
, buildings of
$2,583 million
, construction in progress of
$980 million
and land and land improvements of
$912 million
. The preliminary estimated fair value was primarily determined using a market approach for land and certain types of equipment, and a replacement cost approach for property, plant and equipment. The market approach for certain types of equipment represents a sales comparison that measures the value of an asset through an analysis of sales and offerings of comparable assets. The replacement cost approach used for all other depreciable property, plant and equipment measures the value of an asset by estimating the cost to acquire or construct comparable assets and adjusts for age and condition of the asset.
Goodwill
The excess of the consideration for the Merger over the preliminary net fair value of assets and liabilities acquired was recorded as goodwill. The Merger resulted in the recognition of
$45,105 million
of goodwill, which is not deductible for tax purposes. Goodwill largely consists of expected cost synergies resulting from the Merger and the Intended Business Separations, the assembled workforce of DuPont and future technology and customers.
Other Intangible Assets
Other intangible assets primarily consist of acquired customer-related assets, developed technology, trademarks/tradenames and germplasm. The preliminary customer-related value was determined using the excess earnings method while the preliminary developed technology, trademarks/tradenames and germplasm values were primarily determined utilizing the relief from royalty method. Both the excess earnings and relief from royalty methods are forms of the income approach. Refer to Note
13
for further information on other intangible assets.
Deferred Income Tax Assets and Liabilities
The deferred income tax assets and liabilities include the expected future federal, state and foreign tax consequences associated with temporary differences between the preliminary fair values of the assets acquired and liabilities assumed and the respective tax bases. Tax rates utilized in calculating deferred income taxes generally represent the enacted statutory tax rates at the effective date of the Merger in the jurisdictions in which legal title of the underlying asset or liability resides. Refer to Note 8 for further information related to the remeasurement of deferred income tax assets and liabilities as a result of the enactment of the U.S. Tax Cuts and Jobs Act in December 2017.
The preliminary fair value of “Deferred income tax assets” includes a
$172 million
adjustment to derecognize certain historical net operating losses that will not be fully realized as a result of the Merger. Included in the fair value adjustment related to “Deferred income tax liabilities” is a
$546 million
adjustment reflecting a change in determination as to the reinvestment strategy of certain foreign operations of DuPont.
Pension and Other Postretirement Liabilities
DowDuPont recognized a pretax net liability of
$8,413 million
,
representing the unfunded portion of DuPont’s defined-benefit pension and other postretirement benefit ("OPEB") plans. Dow and DuPont did not merge their pension and OPEB plans as a result of the Merger. Refer to Note
19
for further information on pension and OPEB.
98
Other Assets Acquired and Liabilities Assumed
DowDuPont utilized the carrying values net of allowances to value accounts and notes receivable and accounts payable as well as other current assets and liabilities as it was determined that carrying values represented the fair value of those items at the Merger date.
The following table provides "Net sales" and "Loss from continuing operations before income taxes" of DuPont included in the Company's results since the Merger. Included in the results from DuPont was
$180 million
of "Restructuring, goodwill impairment and asset related charges - net" (see Note
5
for additional information),
$1,434 million
that was recognized in "Cost of sales" as inventory was sold related to the fair value step-up of inventories and
$314 million
of "Integration and separation costs" in the consolidated statements of income.
|
DuPont Results of Operations
|
Sep 1 -
|
||
|
In millions
|
Dec 31, 2017
|
||
|
Net sales
|
$
|
7,033
|
|
|
Loss from continuing operations before income taxes
|
$
|
(1,578
|
)
|
Unaudited Supplemental Pro Forma Information
The DowDuPont unaudited pro forma results presented below were prepared pursuant to the requirements of ASC 805 and give effect to the Merger as if it had been consummated on January 1, 2016. The pro forma results have been prepared for comparative purposes only and do not necessarily represent what the revenue or results of operations would have been had the Merger been completed on January 1, 2016. In addition, these results are not intended to be a projection of future operating results and do not reflect synergies that might be achieved from DowDuPont.
The pro forma results include adjustments for the preliminary purchase accounting impact (including, but not limited to, depreciation and amortization associated with the acquired tangible and intangible assets, amortization of the fair value adjustment to investment in nonconsolidated affiliates, and reduction of interest expense related to the fair value adjustment to long-term debt, along with the related tax impacts), the alignment of accounting policies, and the elimination of transactions between Dow and DuPont. Other adjustments were reflected in the pro forma results as follows:
|
•
|
From January 1, 2016 through December 31, 2017, Dow and DuPont collectively incurred
$455 million
of after tax costs (
$553 million
pretax) to prepare for and close the Merger. These Merger costs were reflected within the results of operations in the pro forma results presented below as if they were incurred on January 1, 2016. The costs incurred related to integration and to prepare for the Intended Business Separations were reflected in the pro forma results in the period in which they were incurred.
|
|
•
|
The Company incurred an after tax charge of
$931 million
(
$1,113 million
pretax) in 2017 related to the fair value step‑up of inventories acquired and sold, excluding the acquired inventory related to DuPont's Seed business. The 2017 pro forma results were adjusted to exclude this charge. The pro forma results for 2016 were adjusted to include this charge, as well as estimated charges of
$60 million
after tax (
$69 million
pretax) related to the remaining fair value step-up of inventories to be sold, excluding acquired inventory related to DuPont's Seed business.
|
|
•
|
To align with seasonality, charges related to the fair value step-up of acquired inventory related to DuPont’s Seed business were reflected in the pro forma results based on actual quantity of units sold during those periods as if the fair value step‑up of inventories had occurred on January 1, 2016. Accordingly,
$300 million
of after tax charges (
$431 million
pretax) for the year ended December 31, 2017 and
$1,222 million
of after tax charges (
$1,667 million
pretax) for the year ended December 31, 2016, were reflected in the pro forma results.
|
|
•
|
The pro forma results for the year ended December 31, 2016 were adjusted to include charges related to change in control provisions within a U.S. non-qualified pension plan for Dow and within other certain employee agreements as if they were incurred on January 1, 2016. The majority of which related to charges for the payment of pension plan obligations of
$594 million
after tax (
$892 million
pretax) recorded in the fourth quarter of 2017. See Note
19
for further information.
|
|
•
|
The 2017 pro forma results were adjusted to exclude a
$170 million
after tax charge incurred in September 2017 related to the impact of changes in tax attributes. The pro forma results for the year ended December 31, 2016, were adjusted to include this charge as if it were incurred on January 1, 2016.
|
99
The unaudited pro forma results for all periods presented below exclude the results of operations of the DuPont Divested Ag Business, as defined in the "Acquisition of Health and Nutrition Business" section below, as this divestiture was reflected as discontinued operations. The Dow global Ethylene Acrylic Acid copolymers and ionomers business ("EAA Business"), through August 31, 2017, and a portion of Dow Agrosciences’ Brazil corn seed business ("DAS Divested Ag Business") divestitures are included in the results from continuing operations in the unaudited pro forma results presented below, for all periods presented, as these divestitures do not qualify for discontinued operations.
|
DowDuPont Pro Forma Results of Operations
|
2017
|
2016
|
||||
|
In millions (except share amounts)
|
||||||
|
Net sales
|
$
|
79,686
|
|
$
|
71,321
|
|
|
Income from continuing operations, net of tax
|
$
|
4,677
|
|
$
|
2,341
|
|
|
Earnings per common share from continuing operations - basic
|
$
|
1.94
|
|
$
|
0.84
|
|
|
Earnings per common share from continuing operations - diluted
|
$
|
1.92
|
|
$
|
0.83
|
|
Integration and Separation Costs
"Integration and separation costs" have been and are expected to be significant. The Company incurred "Integration and separation costs," reflected in "Income from continuing operations before income taxes" in the consolidated statements of income, of
$1,101 million
and
$349 million
for the years ended December 31, 2017 and 2016, respectively. These costs to date primarily consisted of financial advisory, information technology, legal, accounting, consulting, and other professional advisory fees associated with the preparation and execution of activities related to the Merger, post-merger integration and separation, and the ownership restructure of Dow Corning. While the Company assumed that a certain level of expenses would be incurred, there are many factors that could affect the total amount or the timing of these expenses, and many of the expenses that will be incurred are, by their nature, difficult to estimate.
Acquisition of H&N Business
On March 31, 2017, DuPont entered into a definitive agreement (the "FMC Transaction Agreement") with FMC Corporation ("FMC") for FMC to acquire the assets related to DuPont's crop protection business and research and development ("R&D") organization (the "Divested Ag Business") that DuPont was required to divest in order to obtain European Commission ("EC") approval of the Merger Transaction. In addition, under the FMC Transaction Agreement, DuPont agreed to acquire certain assets relating to FMC’s Health and Nutrition segment, excluding its Omega-3 products (the "H&N Business") (the sale of the Divested Ag Business and acquisition of the H&N Business referred to collectively as the "FMC Transactions"). See Note 4 for further discussion of the Divested Ag Business.
On November 1, 2017, DuPont completed the FMC Transactions through the acquisition of the H&N Business and the divestiture of the Divested Ag Business. The acquisition will be integrated into Nutrition & Biosciences to enhance the Company’s position as a leading provider of sustainable, bio-based food ingredients and allow for expanded capabilities in the pharma excipients space. DuPont accounted for the acquisition in accordance with ASC 805, which requires the assets acquired and liabilities assumed to be recognized on the balance sheet at their fair values as of the acquisition date.
The following table summarizes the fair value of consideration exchanged as a result of the FMC Transactions:
|
Consideration Exchanged in FMC Transactions
|
|||
|
In millions
|
|||
|
Fair Value of Divested Ag Business
1
|
$
|
3,665
|
|
|
Less: Cash received
2
|
1,200
|
|
|
|
Less: Favorable contracts
3
|
495
|
|
|
|
Fair Value of the H&N Business
|
$
|
1,970
|
|
|
1.
|
Refer to Note
4
for additional information.
|
|
2.
|
The FMC Transactions include a cash consideration payment to DuPont of approximately
$1,200 million
, which reflects the difference in value between the Divested Ag Business and the H&N Business, subject to certain customary inventory and net working capital adjustments.
|
|
3.
|
Upon closing and pursuant to the terms of the FMC Transaction Agreement, DuPont entered into favorable supply contracts with FMC. DuPont recorded these contracts as intangible assets recognized at the fair value of off-market contracts. See Notes
4
and
13
for additional information.
|
100
The table below presents the preliminary fair value that was allocated to the assets acquired and liabilities assumed. The purchase accounting and purchase price allocation for the H&N Business are substantially complete. However, the Company continues to refine the preliminary valuation of certain acquired assets, such as inventories, other intangible assets, deferred income taxes and property, which could impact the amount of residual goodwill recorded. The Company will finalize the amounts recognized as it obtains the information necessary to complete the analysis, but no later than one year from the date of the acquisition. Final determination of the fair values may result in further adjustments to the values presented in the following table:
|
H&N Business Assets Acquired and Liabilities Assumed on Nov 1, 2017
|
|||
|
(In millions)
|
|||
|
Fair Value of Assets Acquired
|
|||
|
Cash and cash equivalents
|
$
|
16
|
|
|
Accounts and notes receivable - Trade and other
|
144
|
|
|
|
Inventories
|
314
|
|
|
|
Property
|
505
|
|
|
|
Goodwill
|
718
|
|
|
|
Other intangible assets
|
435
|
|
|
|
Other current assets, deferred charges and other non-current assets
|
16
|
|
|
|
Total Assets
|
$
|
2,148
|
|
|
Fair Value of Liabilities Assumed
|
|||
|
Accounts payable, accrued and other current liabilities
|
70
|
|
|
|
Deferred income tax liabilities
|
108
|
|
|
|
Total Liabilities
|
$
|
178
|
|
|
Net Assets (Consideration for the H&N Business)
|
$
|
1,970
|
|
The significant fair value adjustments included in the preliminary allocation of purchase price are discussed below.
Inventories
Acquired inventory is comprised of finished goods of
$153 million
, work in process of
$85 million
, raw materials and supplies of
$76 million
. Fair value of inventory was calculated using a net realizable value approach for finished goods and work in process and a replacement cost approach for raw materials and supplies. For inventory accounted for under the FIFO method and average cost method, the preliminary fair value step-up of inventory will be recognized in "Costs of sales" as the inventory is sold. The preliminary fair value step-up of inventory of
$100 million
will b
e recognized in "Cost of sales" as the inventory is sold. The pretax amount recognized for the period November 1 through December 31, 2017, was
$35 million
, which was reflected in "Cost of sales" in the consolidated statements of income.
Property
Property, plant and equipment is comprised of machinery and equipment of
$363 million
, buildings of
$63 million
, land and land improvements of
$39 million
, construction in progress of
$31 million
and other property of
$9 million
. The preliminary estimated fair values were determined using a combination of a market approach and replacement cost approach.
Goodwill
The excess of the consideration for the H&N Business over the preliminary net fair value of assets acquired and liabilities assumed resulted in the recognition of
$718 million
of goodwill, of which
$208 million
is tax-deductible. Goodwill is attributable to the H&N Business’s workforce and expected cost synergies in procurement, production and market access.
Other Intangible Assets
Other intangible assets includes acquired customer-related intangible assets of
$268 million
, developed technology of
$130 million
and trademarks/tradenames of
$37 million
. The preliminary customer-related fair value was determined using the excess earnings method while the preliminary developed technology and trademarks/tradenames fair values were primarily determined utilizing the relief from royalty method.
DowDuPont evaluated the disclosure requirements under ASC 805 and determined the H&N Business was not considered a material business combination for purposes of disclosing the revenue and earnings of the H&N Business since the date of acquisition or supplemental pro forma information.
101
Ownership Restructure of Dow Corning
On June 1, 2016, Dow announced the closing of the transaction with Corning Incorporated ("Corning"), Dow Corning and HS Upstate Inc., (“Splitco”), pursuant to which Corning exchanged with Dow Corning its
50 percent
equity interest in Dow Corning for
100 percent
of the stock of Splitco which held Corning's historical proportional interest in the Hemlock Semiconductor Group ("HSC Group") and approximately
$4.8 billion
in cash (the “DCC Transaction”). As a result of the DCC Transaction, Dow Corning, previously a
50
:50 joint venture between Dow and Corning, became a wholly owned subsidiary of Dow. In connection with the DCC Transaction, on May 31, 2016, Dow Corning incurred
$4.5 billion
of indebtedness in order to fund the contribution of cash to Splitco. See Notes
12
,
13
,
15
and
23
for additional information.
At June 1, 2016, Dow's equity interest in Dow Corning, excluding the HSC Group, was
$1,968 million
. This equity interest was remeasured to fair value. As a result, Dow recognized a non-taxable gain of
$2,445 million
in the second quarter of 2016, net of closing costs and other comprehensive loss related to Dow's interest in Dow Corning. The gain was included in "Sundry income (expense) - net" in the consolidated statements of income and related to Performance Materials & Coatings (
$1,617 million
), Electronics & Imaging (
$512 million
) and Transportation & Advanced Polymers (
$316 million
). Dow recognized a tax benefit of
$141 million
on the DCC Transaction in the second quarter of 2016, primarily due to the reassessment of a previously recognized deferred tax liability on the basis difference in Dow’s investment in Dow Corning.
Dow utilized an income approach with a discounted cash flow model to determine the fair value of Dow Corning. The valuation process resulted in a fair value of
$9,636 million
. The following table summarizes the fair values of Dow Corning's assets and liabilities, excluding the HSC Group, which are now fully consolidated by Dow. The valuation process was complete at December 31, 2016.
|
Dow Corning Assets Acquired and Liabilities Assumed on Jun 1, 2016
|
|||
|
In millions
|
|||
|
Fair Value of Previously Held Equity Investment, excluding the HSC Group
|
$
|
4,818
|
|
|
Fair Value of Assets Acquired
|
|||
|
Cash and cash equivalents
|
$
|
1,050
|
|
|
Accounts and notes receivable - Trade
|
647
|
|
|
|
Accounts and notes receivable - Other
|
223
|
|
|
|
Inventories
|
1,147
|
|
|
|
Other current assets
|
51
|
|
|
|
Investment in nonconsolidated affiliates
|
110
|
|
|
|
Noncurrent receivables
|
112
|
|
|
|
Net property
|
3,996
|
|
|
|
Other intangible assets
1
|
2,987
|
|
|
|
Deferred income tax assets
|
999
|
|
|
|
Other assets
|
98
|
|
|
|
Total Assets Acquired
|
$
|
11,420
|
|
|
Fair Value of Liabilities Assumed
|
|||
|
Accounts payable - Trade
|
$
|
374
|
|
|
Income taxes payable
|
260
|
|
|
|
Accrued and other current liabilities
|
404
|
|
|
|
Other current liabilities
|
112
|
|
|
|
Long-Term Debt
|
4,672
|
|
|
|
Deferred income tax liabilities
|
1,858
|
|
|
|
Pension and other postretirement benefits - noncurrent
2
|
1,241
|
|
|
|
Other noncurrent obligations
|
437
|
|
|
|
Total Liabilities Assumed
|
$
|
9,358
|
|
|
Noncontrolling interests
|
$
|
473
|
|
|
Goodwill
|
$
|
3,229
|
|
|
1.
|
Includes
$30 million
of trademarks/tradenames,
$1,200 million
of developed technology,
$2 million
of software and
$1,755 million
of customer-related intangibles. See Note
13
for additional information.
|
|
2.
|
Includes pension and other postretirement benefits as well as long-term disability obligations.
|
The DCC Transaction resulted in the recognition of
$3,229 million
of goodwill which is not deductible for tax purposes. Goodwill largely consisted of expected synergies resulting from the DCC Transaction. Cost synergies will be achieved through a combination
102
of workforce consolidation and savings from actions such as harmonizing energy contracts at large sites, optimizing warehouse and logistics footprints, implementing materials and maintenance best practices, combining information technology service structures and leveraging existing research and development knowledge management systems. See Note
13
for additional information on goodwill, including the allocation by segment.
The fair value of "Accounts and notes receivables - Trade" acquired was
$647 million
, with gross contractual amounts receivable of
$654 million
. The fair value step-up of "Inventories" acquired was an increase of
$317 million
, which was expensed to "Cost of sales" over a three-month period beginning on June 1, 2016, and related to Performance Materials & Coatings (
$213 million
), Electronics & Imaging (
$69 million
) and Transportation & Advanced Polymers (
$35 million
). Liabilities assumed from Dow Corning on June 1, 2016, included certain contingent liabilities relating to breast implant and other product liability claims which were valued at
$290 million
and included in "Other noncurrent obligations" and commercial creditor issues which were valued at
$105 million
and included in “Accrued and other current liabilities” in the consolidated balance sheets. See Note
16
for additional information on these contingent liabilities. Gross operating loss carryforwards of
$568 million
were assumed from Dow Corning on June 1, 2016. The operating loss carryforwards expire either in years beyond
2020
or have an indefinite carryforward period.
Dow evaluated the disclosure requirements under ASC 805 and determined the DCC Transaction was not considered a material business combination for purposes of disclosing the revenue and earnings of Dow Corning since the date of the ownership restructure as well as supplemental pro forma information.
Beginning in June 2016, the results of Dow Corning, excluding the HSC Group, were fully consolidated in Dow’s consolidated statements of income. Prior to June 2016, Dow’s
50 percent
share of Dow Corning’s results of operations was reported in “Equity in earnings of nonconsolidated affiliates” in the consolidated statements of income. The results of the HSC Group continue to be treated as an equity method investment and reported as “Equity in earnings of nonconsolidated affiliates” in the consolidated statements of income.
Step Acquisition of Univation Technologies, LLC
On May 5, 2015, Univation Technologies, LLC ("Univation"), previously a
50
:50 joint venture between Dow and ExxonMobil Chemical Company ("ExxonMobil"), became a wholly owned subsidiary of Dow as a result of ExxonMobil redeeming its entire equity interest in Univation in exchange for certain assets and liabilities of Univation. Dow's equity interest in Univation of
$159 million
, previously classified as "Investment in nonconsolidated affiliates" in the consolidated balance sheets, was remeasured to fair value which resulted in a non-taxable gain of
$361 million
recognized in the second quarter of 2015, included in "Sundry income (expense) - net" in the consolidated statements of income and related to Packaging & Specialty Plastics.
Beginning in May 2015, Univation's results of operations were fully consolidated in Dow's consolidated statements of income. Prior to May 2015, Dow's
50 percent
share of Univation's results of operations was reported in "Equity in earnings of nonconsolidated affiliates" in the consolidated statements of income.
NOTE
4
- DIVESTITURES
Merger Related Divestitures
As a condition of the European Commission ("EC"), Chinese Ministry of Commerce, Brazilian Administrative Council for Economic Defense and the U.S. Department of Justice ("DOJ") approval of the Merger, Dow and DuPont were required to divest the following:
Dow Merger Remedy - Divestiture of the Global Ethylene Acrylic Acid Copolymers and Ionomers Business
On February 2, 2017, Dow announced it would divest the EAA Business to SK Global Chemical Co., Ltd. The divestiture included production assets located in Freeport, Texas, and Tarragona, Spain, along with associated intellectual property and product trademarks. Under terms of the purchase agreement, SK Global Chemical Co., Ltd will honor certain customer and supplier contracts and other agreements. On September 1, 2017, the sale was completed for
$296 million
, net of working capital adjustments, costs to sell and other adjustments, with proceeds subject to customary post-closing adjustments.
103
In 2017, the Company recognized a pretax gain of
$227 million
on the sale, included in "Sundry income (expense) - net" in the consolidated statements of income and related to the Packaging & Specialty Plastics segment.
|
EAA Business Assets Divested on Sep 1, 2017
|
|||
|
In millions
|
|||
|
Current assets
|
$
|
34
|
|
|
Net property
|
12
|
|
|
|
Goodwill
|
23
|
|
|
|
Total assets divested
|
$
|
69
|
|
Dow Merger Remedy - Divestiture of a Portion of Dow AgroSciences' Brazil Corn Seed Business
On July 11, 2017, Dow announced it had entered into a definitive agreement with CITIC Agri Fund to sell the DAS Divested Ag Business, including
four
corn seed production sites and
four
research centers, a copy of Dow AgroSciences' Brazilian corn germplasm bank, certain commercial and pipeline hybrids, the MORGAN™ trademark and a license to the DOW SEMENTES™ trademark for
12
months. On November 30, 2017, the sale was completed for
$1,093 million
, net of working capital adjustments, costs to sell and other adjustments, with proceeds subject to customary post-closing adjustments.
In 2017, the Company recognized a pretax gain of
$635 million
on the sale, included in "Sundry income (expense) - net" in the consolidated statements of income and related to the Agriculture segment.
|
DAS Divested Ag Business Assets and Liabilities Divested on Nov 30, 2017
|
|||
|
In millions
|
|||
|
Cash and cash equivalents
|
$
|
22
|
|
|
Accounts and notes receivable - trade and other
|
59
|
|
|
|
Inventories
|
139
|
|
|
|
Net property
|
70
|
|
|
|
Goodwill
|
128
|
|
|
|
Noncurrent receivables, deferred charges and other assets
|
102
|
|
|
|
Total assets divested
|
$
|
520
|
|
|
Current liabilities
|
$
|
39
|
|
|
Long-Term Debt and other noncurrent liabilities
|
23
|
|
|
|
Total liabilities divested
|
$
|
62
|
|
|
Net carrying value divested
|
$
|
458
|
|
The Company evaluated the divestiture of the EAA Business and determined it did not represent a strategic shift that had a major effect on the Company’s operations and financial results and did not qualify as an individually significant component of the Company. The divestiture of the DAS Divested Ag Business did not qualify as a component of the Company. As a result, these divestitures were not reported as discontinued operations.
DuPont Merger Remedy - Divested Ag Business
DuPont was required to sell its Divested Ag Business, specifically DuPont’s Cereal Broadleaf Herbicides and Chewing Insecticides portfolios, including RYNAXYPYR®, CYAZYPYR®, and Indoxacarb as well as the crop protection R&D pipeline and organization, excluding seed treatment, nematicides, and late-stage R&D programs. On March 31, 2017, DuPont and FMC entered into the FMC Transaction Agreement under which FMC agreed to acquire the Divested Ag Business; in addition, DuPont agreed to acquire the H&N Business. The sale of the Divested Ag Business meets the criteria for discontinued operations and as such, earnings are included within Loss from discontinued operations, net of tax for periods subsequent to the Merger.
On November 1, 2017, DuPont completed the FMC Transactions through the disposition of the Divested Ag Business and the acquisition of the H&N Business. The preliminary fair value as determined by DuPont of the H&N Business is
$1,970 million
. The FMC Transactions include a cash consideration payment to DuPont of approximately
$1,200 million
, which reflects the difference in value between the Divested Ag Business and the H&N Business, as well as favorable contracts with FMC of
$495 million
, subject to adjustments for inventory of the Divested Ag Business and net working capital of the H&N Business. Due to the proximity of the Merger and the closing of the sale, the carrying value of the Divested Ag Business approximated the fair value of the consideration received, thus no resulting gain or loss was recognized on the sale. Refer to Note 3 for further information on the H&N Business.
104
The results of operations of DuPont's Divested Ag Business are presented as discontinued operations as summarized below, representing activity subsequent to the Merger:
|
Results of Operations of DuPont's Divested Ag Business
|
Period Ended
|
||
|
In millions
|
Sep 1 - Oct 31, 2017
1
|
||
|
Net sales
|
$
|
199
|
|
|
Cost of sales
|
194
|
|
|
|
Research and development expenses
|
30
|
|
|
|
Selling, general and administrative expenses
2
|
102
|
|
|
|
Restructuring, goodwill impairment and asset related charges - net
|
(1
|
)
|
|
|
Sundry income (expense) - net
|
(1
|
)
|
|
|
Loss from discontinued operations before income taxes
|
$
|
(127
|
)
|
|
Benefit from income taxes
|
(50
|
)
|
|
|
Loss from discontinued operations, net of tax
|
$
|
(77
|
)
|
|
1.
|
The Divested Ag Business was disposed of on November 1, 2017.
|
|
2.
|
Includes
$44 million
of transaction costs associated with the disposal of the Divested Ag Business.
|
Upon closing and pursuant to the terms of the FMC Transaction Agreement, DuPont and FMC entered into favorable supply agreements and certain ancillary agreements, including manufacturing service agreements and transition service agreements. Under the terms of the favorable supply agreements, FMC will supply product to DuPont at cost for a period of up to
five years
and, as a result, DuPont recorded an intangible asset of
$495 million
upon closing that will amortize over a period of
five years
.
Divestitures Prior to the Merger
Divestiture of the Global Sodium Borohydride Business
On January 30, 2015, Dow sold its global Sodium Borohydride business ("SBH"), part of the Industrial Intermediates & Infrastructure segment, to Vertellus Performance Chemicals LLC. The divestiture included a manufacturing facility located in Elma, Washington, as well as the associated business, inventory, customer contracts and lists, process technology, business know‑how and certain intellectual property. The sale was completed for
$184 million
, net of working capital adjustments and costs to sell, with proceeds subject to customary post-closing adjustments.
Post-closing adjustments were finalized in the fourth quarter of 2015. In 2015, Dow recognized a pretax gain of
$20 million
on the sale, including post-closing adjustments of
$2 million
. The gain was included in "Sundry income (expense) - net" in the consolidated statements of income and related to the Industrial Intermediates & Infrastructure segment. Dow recognized an after‑tax loss of
$10 million
on the sale, primarily due to non-deductible goodwill included with this transaction.
Divestiture of ANGUS Chemical Company
On February 2, 2015, Dow sold ANGUS Chemical Company (“ANGUS”), part of the Industrial Intermediates & Infrastructure
segment, to Golden Gate Capital. The divestiture included the business headquarters and research and development facility in Buffalo Grove, Illinois; manufacturing facilities located in Sterlington, Louisiana, and Ibbenbueren, Germany; a packaging facility in Niagara Falls, New York; as well as the associated business, inventory, customer contracts, process technology, business know‑how and certain intellectual property. The sale was completed for
$1,151 million
, net of working capital adjustments, costs to sell and other transaction expenses, with proceeds subject to customary post-closing adjustments. The proceeds included a
$10 million
note receivable included in "Noncurrent receivables" in the consolidated balance sheets.
Post-closing adjustments were finalized in the fourth quarter of 2015. In 2015, Dow recognized a pretax gain of
$682 million
on the sale, including post-closing adjustments of
$12 million
. The gain was included in "Sundry income (expense) - net" in the consolidated statements of income and related to the Industrial Intermediates & Infrastructure segment.
Divestiture of the AgroFresh Business
On July 31, 2015, Dow sold its AgroFresh business, part of the Corporate segment, to Boulevard Acquisition Corp., which was subsequently renamed AgroFresh Solutions, Inc. (“AFSI”). The divestiture included trade receivables, inventory, property, customer lists, trademarks and certain intellectual property. The sale was completed for
$859 million
, net of working capital adjustments, costs to sell and other transaction expenses, with proceeds subject to customary post-closing adjustments. The proceeds included a
$635 million
cash payment;
17.5 million
common shares of AFSI, which represented a
35 percent
equity interest, valued
105
at
$210 million
based on the closing stock price on July 31, 2015, and included in “Investment in nonconsolidated affiliates” in the consolidated balance sheets; and, a receivable for
six million
warrants to purchase common shares of AFSI, which was valued at
$14 million
and classified as “Accounts and notes receivable - Other” in the consolidated balance sheets. In addition, Dow has an ongoing tax receivable agreement with AFSI, where AFSI is obligated to share with Dow tax savings associated with the purchase of the AgroFresh business. Dow did not recognize the tax receivable agreement as proceeds.
In 2015, Dow recognized a pretax gain of
$626 million
on the sale (including post-closing adjustments of
$2 million
), of which
$128 million
related to Dow's retained equity interest in AFSI. The pretax gain was included in "Sundry income (expense) - net" in the consolidated statements of income and related to Corporate.
In the fourth quarter of 2016, as a result of a decline in the market value of AFSI, Dow recognized a
$143 million
pretax impairment charge related to its equity interest in AFSI. The impairment charge was included in "Restructuring, goodwill impairment and asset related charges - net" in the consolidated statements of income and related to Corporate. Dow also recognized a pretax loss of
$20 million
for post-closing adjustments related to non-cash consideration. The post-closing adjustments were included in "Sundry income (expense) - net" in the consolidated statements of income and related to Corporate.
On April 4, 2017, Dow and AFSI revised certain agreements related to the divestiture of the AgroFresh business, including termination of an agreement related to the
six million
warrants, which was valued at
$1 million
at December 31, 2016. Dow also entered into an agreement to purchase up to
5,070,358
shares of AFSI's common stock, which represented approximately
10
percent of AFSI's common stock outstanding at signing of the agreement, subject to certain terms and conditions. See Notes
5
,
12
,
22
and
23
for further information on Dow’s equity interest and variable interests in AFSI.
Dow evaluated the divestitures of SBH, ANGUS and AgroFresh and determined they did not represent a strategic shift that had a major effect on Dow’s operations and financial results and did not qualify as individually significant components of Dow. As a result, these divestitures were not reported as discontinued operations.
Divestiture of Investment in MEGlobal
On December 23, 2015, Dow completed the sale of its ownership interest in MEGlobal, a nonconsolidated affiliate, to EQUATE Petrochemical Company K.S.C. ("EQUATE"). Pretax proceeds of
$1,472 million
, net of costs to sell and other transaction expenses were received. Dow eliminated
42.5 percent
of the gain on the sale (equivalent to Dow's ownership interest in EQUATE), or
$555 million
. A pretax gain of
$723 million
was recorded on the sale, which is included in “Sundry income (expense) - net” in the consolidated statements of income and related to the Industrial Intermediates & Infrastructure segment. An after-tax gain of
$589 million
was recognized on the sale. See Note
12
for further information on Dow's equity interest in EQUATE.
NOTE
5
- RESTRUCTURING, GOODWILL IMPAIRMENT AND ASSET RELATED CHARGES - NET
The "Restructuring, goodwill impairment and asset related charges - net" line in the consolidated statements of income is used to record charges for restructuring programs, goodwill impairment, and other asset related charges, which includes other asset impairments.
Restructuring Plans
DowDuPont Cost Synergy Program
In September and November 2017, DowDuPont approved post-merger restructuring actions under the DowDuPont Cost Synergy Program (the “Synergy Program”), adopted by the DowDuPont Board of Directors. The plan is designed to integrate and optimize the organization following the Merger and in preparation for the Intended Business Separations. Based on all actions approved to date under the Synergy Program, the Company expects to record total pretax restructuring charges of approximately
$2 billion
, comprised of approximately
$845 million
to
$935 million
of severance and related benefit costs;
$400 million
to
$540 million
of asset write-downs and write-offs, and
$400 million
to
$450 million
of costs associated with exit and disposal activities. The Synergy Program includes certain asset actions, including strategic decisions regarding the cellulosic biofuel unit reflected in the preliminary fair value measurement of DuPont’s assets as of the Merger date. Current estimated total pretax restructuring charges could be impacted by future adjustments to the preliminary fair value of DuPont’s assets.
As a result of these actions, the Company recorded pretax restructuring charges of
$874 million
in 2017, consisting of severance and related benefit costs of
$510 million
, asset write-downs and write-offs of
$290 million
and costs associated with exit and disposal activities of
$74 million
. The impact of these charges is shown as "Restructuring, goodwill impairment and asset related charges - net" in the consolidated statements of income. The Company expects to record the remaining restructuring charges over the next two years and expects the Synergy Program to be substantially completed by the end of 2019.
106
The following table summarizes the activities related to the Synergy Program, of which
$377 million
was included in "Accrued and other current liabilities" and
$133 million
was included in "Other noncurrent obligations" in the consolidated balance sheets.
|
DowDuPont Synergy Program
|
Severance and Related Benefit Costs
|
Asset Write-downs and Write-offs
|
Costs Associated with Exit and Disposal Activities
|
Total
|
||||||||
|
In millions
|
||||||||||||
|
Agriculture
|
$
|
—
|
|
$
|
94
|
|
$
|
40
|
|
$
|
134
|
|
|
Performance Materials & Coatings
|
—
|
|
9
|
|
2
|
|
11
|
|
||||
|
Industrial Intermediates & Infrastructure
|
—
|
|
12
|
|
—
|
|
12
|
|
||||
|
Packing & Specialty Plastics
|
—
|
|
33
|
|
3
|
|
36
|
|
||||
|
Electronics & Imaging
|
—
|
|
86
|
|
—
|
|
86
|
|
||||
|
Nutrition & Biosciences
|
—
|
|
1
|
|
—
|
|
1
|
|
||||
|
Transportation & Advanced Polymers
|
—
|
|
1
|
|
1
|
|
2
|
|
||||
|
Safety & Construction
|
—
|
|
21
|
|
—
|
|
21
|
|
||||
|
Corporate
|
510
|
|
33
|
|
28
|
|
571
|
|
||||
|
2017 restructuring charges
|
$
|
510
|
|
$
|
290
|
|
$
|
74
|
|
$
|
874
|
|
|
Charges against the reserve
|
—
|
|
(290
|
)
|
—
|
|
(290
|
)
|
||||
|
Non-cash compensation
|
(7
|
)
|
—
|
|
—
|
|
(7
|
)
|
||||
|
Cash payments
|
(64
|
)
|
—
|
|
(3
|
)
|
(67
|
)
|
||||
|
Reserve balance at Dec 31, 2017
|
$
|
439
|
|
$
|
—
|
|
$
|
71
|
|
$
|
510
|
|
Asset Write-downs and Write-offs
The restructuring charges related to the write-down and write-off of assets in 2017 totaled
$290 million
. Details regarding the write-downs and write-offs are as follows:
|
•
|
The Company will close or consolidate several manufacturing, R&D and administrative facilities around the world aligned with the Seed and Crop Protection businesses, including the write-down of other non-manufacturing assets. As a result, the Company recorded a charge of
$94 million
, related to Agriculture. These facilities will be shut down or consolidated by the end of the fourth quarter of 2019.
|
|
•
|
The Company recorded a charge of
$86 million
for asset write-downs and write-offs in Electronics & Imaging, including the shutdown of a metalorganic manufacturing facility in Cheonan, South Korea, the write-off of in-process research and development and other intangible assets and the consolidation of certain R&D facilities. The Korean facility will be shut down by the second quarter of 2018.
|
|
•
|
The Company recorded a charge of
$22 million
for asset write-downs and write-offs aligned with an energy project, including the write-off of capital projects and other non-manufacturing assets in Packaging & Specialty Plastics.
|
|
•
|
The Company wrote-off
$21 million
of assets in Safety & Construction, including intangible assets as a result of the Clean Filtration Technologies plant shutdown in the fourth quarter of 2017.
|
|
•
|
The Company recorded a charge of
$67 million
for other miscellaneous asset write-downs and write-offs, including the shutdown of several small manufacturing facilities and the write-off of non-manufacturing assets, certain corporate facilities and data centers. The charge related to Performance Materials & Coatings (
$9 million
), Industrial Intermediates & Infrastructure (
$12 million
), Packaging & Specialty Plastics (
$11 million
), Nutrition & Biosciences (
$1 million
), Transportation & Advanced Polymers (
$1 million
) and Corporate (
$33 million
). These manufacturing facilities will be shut down over the next two years.
|
Costs Associated with Exit and Disposal Activities
The restructuring charges for costs associated with exit and disposal activities, including contract cancellation penalties and environmental remediation liabilities, totaled
$74 million
in 2017.
The Company expects to incur additional costs in the future related to its restructuring activities. Future costs are expected to include demolition costs related to closed facilities and restructuring plan implementation costs; these costs will be recognized as
107
incurred. The Company also expects to incur additional employee-related costs, including involuntary termination benefits, related to its other optimization activities. These costs cannot be reasonably estimated at this time.
Restructuring Plans Initiated Prior to Merger
Dow 2016 Restructuring Plan
On June 27, 2016, Dow's Board of Directors ("Board") approved a restructuring plan that incorporated actions related to the ownership restructure of Dow Corning. These actions, aligned with Dow's value growth and synergy targets, will result in a global workforce reduction of approximately
2,500
positions, with most of these positions resulting from synergies related to the ownership restructure of Dow Corning. These actions are expected to be substantially completed by June 30, 2018.
As a result of these actions, Dow recorded pretax restructuring charges of
$449 million
in the second quarter of 2016, consisting of severance and related benefit costs of
$268 million
, asset write-downs and write-offs of
$153 million
and costs associated with exit and disposal activities of
$28 million
. The impact of these charges is shown as "Restructuring, goodwill impairment and asset related charges - net" in the consolidated statements of income and reflected in the segment results in the table that follows. The table also summarizes the activities related to Dow's 2016 restructuring reserve, which was primarily included in "Accrued and other current liabilities" in the consolidated balance sheets:
|
2016 Restructuring Charges
|
Severance and Related Benefit Costs
|
Asset Write-downs and Write-offs
|
Costs Associated with Exit and Disposal Activities
|
Total
|
||||||||
|
In millions
|
||||||||||||
|
Performance Materials & Coatings
|
$
|
—
|
|
$
|
27
|
|
$
|
15
|
|
$
|
42
|
|
|
Industrial Intermediates & Infrastructure
|
—
|
|
70
|
|
13
|
|
83
|
|
||||
|
Packaging & Specialty Plastics
|
—
|
|
10
|
|
—
|
|
10
|
|
||||
|
Corporate
|
268
|
|
46
|
|
—
|
|
314
|
|
||||
|
2016 restructuring charges
|
$
|
268
|
|
$
|
153
|
|
$
|
28
|
|
$
|
449
|
|
|
Charges against the reserve
|
—
|
|
(153
|
)
|
—
|
|
(153
|
)
|
||||
|
Cash payments
|
(67
|
)
|
—
|
|
(1
|
)
|
(68
|
)
|
||||
|
Reserve balance at Dec 31, 2016
|
$
|
201
|
|
$
|
—
|
|
$
|
27
|
|
$
|
228
|
|
|
Adjustments to the reserve
1
|
—
|
|
—
|
|
(7
|
)
|
(7
|
)
|
||||
|
Cash payments
|
(150
|
)
|
—
|
|
(3
|
)
|
(153
|
)
|
||||
|
Reserve balance at Dec 31, 2017
|
$
|
51
|
|
$
|
—
|
|
$
|
17
|
|
$
|
68
|
|
|
1.
|
Included in "Restructuring, goodwill impairment and asset related charges - net" in the consolidated statements of income and related to Performance Materials & Coatings.
|
Asset Write-downs and Write-offs
The restructuring charges related to the write-down and write-off of assets in the second quarter of 2016 totaled
$153 million
. Details regarding the write-downs and write-offs are as follows:
|
•
|
Dow recorded a charge of
$70 million
for asset write-downs and write-offs including the shutdown of a solar manufacturing facility in Midland, Michigan; the write-down of a solar facility in Milpitas, California; and, the write-off of capital projects and in-process research and development. The charge was related to Industrial Intermediates & Infrastructure. The Midland facility was shut down in the third quarter of 2016.
|
|
•
|
To enhance competitiveness and streamline costs associated with the ownership restructure of Dow Corning, a silicones manufacturing facility in Yamakita, Japan, will be shut down by the end of 2018. In addition, an idled facility was shut down in the second quarter of 2016. As a result, Dow recorded a charge of
$25 million
related to Performance Materials & Coatings.
|
|
•
|
Dow will close and/or consolidate certain corporate facilities and data centers. Write-downs of
$25 million
were related to Corporate. These facilities will be shut down no later than the end of the second quarter of 2018.
|
|
•
|
A decision was made to shut down a small manufacturing facility and to write-down other non-manufacturing assets, including a cost method investment and certain aircraft. Write-downs of
$33 million
were recorded, related to Performance Materials & Coatings (
$2 million
), Packaging & Specialty Plastics (
$10 million
) and Corporate (
$21 million
). The manufacturing facility was shut down in the second quarter of 2016.
|
108
Costs Associated with Exit and Disposal Activities
The restructuring charges for costs associated with exit and disposal activities, including contract cancellation penalties, environmental remediation and warranty liabilities, were
$28 million
in 2016.
Dow 2015 Restructuring Plan
On April 29, 2015, Dow's Board approved actions to further streamline the organization and optimize Dow’s footprint as a result of the separation of a significant portion of Dow’s chlorine value chain. These actions, which further accelerated Dow’s value growth and productivity targets, resulted in a reduction of approximately
1,750
positions across a number of businesses and functions and adjustments to Dow's asset footprint to enhance competitiveness. These actions were substantially completed at June 30, 2017.
As a result of these actions, Dow recorded pretax restructuring charges of
$375 million
in the second quarter of 2015 consisting of severance and related benefit costs of
$196 million
, asset write-downs and write-offs of
$169 million
and costs associated with exit and disposal activities of
$10 million
. In the fourth quarter of 2015, Dow recorded restructuring charge adjustments of
$40 million
, including severance and related benefit costs of
$39 million
for the separation of approximately
500
additional positions as part of Dow's efforts to further streamline the organization, and
$1 million
of costs associated with exit and disposal activities. The impact of these charges is shown as "Restructuring, goodwill impairment and asset related charges - net" in the consolidated statements of income and reflected in Dow's segment results in the table that follows. The table also summarizes the activities related to Dow's 2015 restructuring reserve.
|
2015 Restructuring Charges
|
Severance and Related Benefit Costs
|
Asset Write-downs and Write-offs
|
Costs Associated with Exit and Disposal Activities
|
Total
|
||||||||
|
In millions
|
||||||||||||
|
Agriculture
|
$
|
—
|
|
$
|
8
|
|
$
|
6
|
|
$
|
14
|
|
|
Performance Materials & Coatings
|
—
|
|
10
|
|
—
|
|
10
|
|
||||
|
Packaging & Specialty Plastics
|
—
|
|
12
|
|
—
|
|
12
|
|
||||
|
Electronics & Imaging
|
—
|
|
51
|
|
—
|
|
51
|
|
||||
|
Nutrition & Biosciences
|
—
|
|
14
|
|
2
|
|
16
|
|
||||
|
Safety & Construction
|
—
|
|
15
|
|
2
|
|
17
|
|
||||
|
Corporate
|
196
|
|
59
|
|
—
|
|
255
|
|
||||
|
2015 restructuring charges
|
$
|
196
|
|
$
|
169
|
|
$
|
10
|
|
$
|
375
|
|
|
Charges against the reserve
|
—
|
|
(169
|
)
|
—
|
|
(169
|
)
|
||||
|
Adjustments to the reserve
1
|
39
|
|
—
|
|
1
|
|
40
|
|
||||
|
Impact of currency
|
—
|
|
—
|
|
(1
|
)
|
(1
|
)
|
||||
|
Cash payments
|
(92
|
)
|
—
|
|
—
|
|
(92
|
)
|
||||
|
Reserve balance at Dec 31, 2015
|
$
|
143
|
|
$
|
—
|
|
$
|
10
|
|
$
|
153
|
|
|
Charges against the reserve
|
—
|
|
3
|
|
—
|
|
3
|
|
||||
|
Adjustments to the reserve
2
|
—
|
|
(3
|
)
|
6
|
|
3
|
|
||||
|
Cash payments
|
(98
|
)
|
—
|
|
(8
|
)
|
(106
|
)
|
||||
|
Reserve balance at Dec 31, 2016
|
$
|
45
|
|
$
|
—
|
|
$
|
8
|
|
$
|
53
|
|
|
Adjustments to the reserve
3
|
(9
|
)
|
—
|
|
(1
|
)
|
(10
|
)
|
||||
|
Cash payments
|
(33
|
)
|
—
|
|
—
|
|
(33
|
)
|
||||
|
Reserve balance at Jun 30, 2017
|
$
|
3
|
|
$
|
—
|
|
$
|
7
|
|
$
|
10
|
|
|
1.
|
Included in "Restructuring, goodwill impairment and asset related charges - net" in the consolidated statements of income. The unfavorable adjustments to severance and related benefit costs were related to Corporate and costs associated with exit and disposal activities were related to Agriculture.
|
|
2.
|
Included in "Restructuring, goodwill impairment and asset related charges - net" in the consolidated statements of income. The favorable adjustment to asset write-downs and write-offs was related to Safety & Construction. The unfavorable adjustment to costs associated with exit and disposal activities was related to Agriculture (
$5 million
) and Nutrition & Biosciences (
$1 million
).
|
|
3.
|
Included in "Restructuring, goodwill impairment and asset related charges - net" in the consolidated statements of income. The favorable adjustments to severance and related benefit costs were related to Corporate and costs associated with exit and disposal activities were related to Agriculture.
|
Dow also recorded
$14 million
of restructuring charges to "Net income attributable to noncontrolling interests" in the consolidated statements of income in the second quarter of 2015 for the noncontrolling interests' portion of the charge.
The 2015 restructuring activities were substantially completed at June 30, 2017, with remaining liabilities for severance and related benefit costs and costs associated with exit and disposal activities to be settled over time.
109
Asset Write-downs and Write-offs
Asset write-downs and write-offs in the second quarter of 2015 totaled
$169 million
. Details regarding the write-downs and write-offs are as follows:
|
•
|
As a result of changing market dynamics in certain end-use markets, select manufacturing facilities and non-core assets aligned with the Electronics & Imaging business were shut down in 2016. The assets impacted included certain display films and metalorganic precursors, including a metalorganic materials manufacturing site in North Andover, Massachusetts, and related operations in Taoyuan, Taiwan, as well as certain display films’ manufacturing assets aligned with SKC Haas Display Films Co., Ltd., a former majority-owned joint venture located in Cheonan, South Korea. Dow recorded a
$51 million
charge for these asset write-downs and write-offs, related to the Electronics & Imaging segment.
|
|
•
|
Dow shut down and/or consolidated manufacturing capacity in the Safety & Construction segment during 2016. As a result, Dow recorded a charge of
$15 million
for asset write-offs.
|
|
•
|
A Nutrition & Health manufacturing facility in Institute, West Virginia, was shut down in the fourth quarter of 2015. As a result, an asset write-down of
$14 million
was recorded against the Nutrition & Biosciences segment.
|
|
•
|
A Packaging and Specialty Plastics plant in Schkopau, Germany, was permanently shut down in the second quarter of 2015, resulting in an asset write-off of
$12 million
, related to the Packaging & Specialty Plastics segment.
|
|
•
|
Select operations in the Agriculture segment were shut down, closed or idled in the second half of 2015, resulting in a pretax charge of
$8 million
for the write-down of assets.
|
|
•
|
A decision was made to shut down two small manufacturing facilities and an administrative facility to optimize Dow's asset footprint. Write-downs of
$14 million
were recorded, related to Performance Materials & Coatings (
$10 million
) and Corporate (
$4 million
). The manufacturing facilities were shut down in 2015 and the administrative facility was shut down in 2017.
|
|
•
|
Due to a change in Dow's strategy to monetize and exit certain Venture Capital portfolio investments, a write-down of
$55 million
was recorded, related to Corporate.
|
Costs Associated with Exit and Disposal Activities
The restructuring charges for costs associated with exit and disposal activities, primarily environmental remediation and contract cancellation penalties, totaled
$10 million
in the second quarter of 2015.
Goodwill Impairment
Upon completion of the goodwill impairment testing in the fourth quarter of 2017, the Company determined the fair value of the Coatings & Performance Monomers reporting unit was lower than its carrying amount. As a result, the Company recorded an impairment charge of
$1,491 million
in the fourth quarter of 2017, included in “Restructuring, goodwill impairment and asset related charges - net” in the consolidated statements of income and related to Performance Materials & Coatings. See Note
13
for additional information on the impairment charge.
Asset Related Charges
2017 Charges
In the fourth quarter of 2017, the Company recognized a
$622 million
pretax impairment charge related to a biopolymers manufacturing facility in Santa Vitoria, Minas Gerais, Brazil. Dow determined it will not pursue an expansion of the facility’s ethanol mill into downstream derivative products, primarily as a result of cheaper ethane-based production as well as Dow’s new assets coming online in the U.S. Gulf Coast which can be used to meet growing market demands in Brazil. As a result of this decision, cash flow analysis indicated the carrying amount of the impacted assets was not recoverable. The impairment charge was included in “Restructuring, goodwill impairment and asset related charges - net” in the consolidated statements of income and related to Packaging & Specialty Plastics. See Notes
22
and
23
for additional information.
The Company also recognized other pretax impairment charges of
$317 million
in the fourth quarter of 2017, including charges related to manufacturing assets of
$230 million
, an equity method investment of
$81 million
and other assets of
$6 million
. The impairment charges were included in "Restructuring, goodwill impairment and asset related charges - net" in the consolidated statements of income and related to Performance Materials & Coatings (
$82 million
), Industrial Intermediates & Infrastructure (
$6 million
), Packaging & Specialty Plastics (
$57 million
), Electronics & Imaging (
$39 million
), Safety & Construction (
$32 million
) and Corporate (
$101 million
). See Note
22
for additional information.
110
2016 Charges
In the fourth quarter of 2016, Dow recognized a
$143 million
pretax impairment charge related to its equity interest in AFSI due to a decline in the market value of AFSI. The impairment charge was included in "Restructuring, goodwill impairment and asset related charges - net" in the consolidated statements of income and related to Corporate. See Notes
4
,
12
,
22
and
23
for additional information.
2015 Charges
As a result of Dow’s continued actions to optimize its footprint, Dow recognized an impairment charge of
$144 million
in the fourth quarter of 2015, related to manufacturing assets and facilities and an equity method investment. The impairment charge was included in "Restructuring, goodwill impairment and asset related charges - net" in the consolidated statements of income and related to Performance Materials & Coatings (
$71 million
), Packaging & Specialty Plastics (
$57 million
) and Safety & Construction (
$16 million
). See Note
22
for additional information.
NOTE
6
- REVERSE MORRIS TRUST TRANSACTION
On October 5, 2015, (i) Dow completed the transfer of its U.S. Gulf Coast Chlor-Alkali and Vinyl, Global Chlorinated Organics and Global Epoxy businesses ("chlorine value chain") into a new company ("Splitco"), (ii) participating Dow shareholders tendered, and Dow accepted, Dow shares for Splitco shares in a public exchange offer, and (iii) Splitco merged with a wholly owned subsidiary of Olin Corporation ("Olin") in a tax-efficient Reverse Morris Trust transaction (collectively, the “Transaction”). The Transaction was subject to Olin shareholder approval, customary regulatory approvals, tax authority rulings including a favorable private letter ruling from the U.S. Internal Revenue Service which confirms the Transaction to be substantially free of U.S. federal income tax, and expiration of the public exchange offer. Dow does not have an ownership interest in Olin as a result of the Transaction.
Under the terms of a debt exchange offer, Dow received
$1,220 million
principal amount of new debt instruments from Splitco, which were subsequently transferred to certain investment banks in a non-cash fair value exchange for
$1,154 million
principal amount of Dow’s outstanding debt instruments owned by such investment banks. As a result of this debt exchange offer and related transactions, Dow retired
$1,161 million
of certain notes and recognized a
$68 million
loss on the early extinguishment of debt, included in "Sundry income (expense) - net" in the consolidated statements of income and included as a component of the pretax gain on the Transaction and related to Corporate. See Note
15
for additional information on the early extinguishment of debt.
Dow shareholders who elected to participate in the public exchange offer tendered
34.1 million
shares of Dow common stock in exchange for
100 million
shares of Splitco. Following the merger of Splitco with Olin, each share of Splitco common stock was automatically converted to the right to receive
0.87482759
shares of Olin common stock, or
87.5 million
shares, which represented approximately
52.7 percent
of Olin’s common stock outstanding. As a result of this non-cash share exchange offer, Dow recorded an increase of
$1,523 million
in “Treasury Stock” in the consolidated statements of equity, which is valued based on Dow’s opening stock price on October 5, 2015. Dow's outstanding shares were reduced by
3 percent
as a result of the Transaction.
Under the terms of the Transaction, Dow received cash proceeds of
$875 million
in the form of a one-time special payment from Splitco from proceeds received from a term loan and included in "Proceeds from issuance of long-term debt" in the consolidated statements of cash flows. Dow also received a
$434 million
advance payment from Olin, included in "Other assets and liabilities, net" in the consolidated statements of cash flows, related to a long-term ethylene supply agreement, of which
$16 million
was classified as "Accrued and other current liabilities" and
$418 million
was classified as "Other noncurrent obligations" in the consolidated balance sheets at the time of receipt. The Transaction also resulted in numerous long-term supply, service and purchase agreements between Dow and Olin.
In connection with the Transaction, Dow purchased Mitsui & Co. Texas Chlor-Alkali Inc.’s (“Mitsui”)
50 percent
equity interest in a membrane chlor-alkali joint venture (“JV Entity”), which resulted in Dow becoming the sole equity owner of the JV Entity. Dow purchased Mitsui's equity interest for
$133 million
, which resulted in a loss of
$25 million
included in "Sundry income (expense) - net" in the consolidated statements of income and included as component of the pretax gain on the Transaction. The JV Entity was included in the transfer of the chlorine value chain to Splitco. See Note
23
for further information on the acquisition of Mitsui’s equity interest in the JV Entity.
Dow also transferred
$439 million
of net unfunded defined pension and other postretirement benefit obligations in the United States and Germany to Olin. See Note
19
for further details.
In the fourth quarter of 2015, Dow completed the split-off of the chlorine value chain for
$3,510 million
, net of working capital adjustments and costs to sell, with proceeds subject to post-closing adjustments. The proceeds included cash received from Splitco
111
in the form of a one-time special payment from proceeds received from a term loan, the principal amount of the Splitco debt included in the debt exchange offer and the market value of the Dow common shares tendered in the public exchange offer. A pretax gain of
$2,233 million
was recognized on the Transaction, which is the excess of the sum of the net proceeds received over the chlorine value chain's net book value, a loss on the early extinguishment of debt and a loss on the acquisition of Mitsui's noncontrolling interest. The pretax gain was included in "Sundry income (expense) - net" in the consolidated statements of income and related to the following operating segments: Industrial Intermediates & Infrastructure (gain of
$1,984 million
), Packaging & Specialty Plastics (gain of
$317 million
) and Corporate (loss of
$68 million
). Dow recognized an after-tax gain of
$2,215 million
, primarily due to the tax-efficient nature of the Transaction.
In 2016, Dow recognized a pretax gain of
$6 million
for post-closing adjustments, including a
$5 million
reduction to the net unfunded defined pension and other postretirement benefit obligation. The gain was included in "Sundry income (expense) - net" in the consolidated statements of income and related to the Industrial Intermediates & Infrastructure segment. See Note
19
for further details.
In 2017, Dow recognized a pretax gain of
$7 million
for post-closing adjustments. The gain was included in "Sundry income (expense) - net" in the consolidated statements of income and related to Corporate.
Dow did not report the historical results of the chlorine value chain as discontinued operations in the financial statements, as the divestiture of these businesses did not represent a strategic shift that had a major effect on Dow's operations and financial results. However, the chlorine value chain was considered an individually significant component and select income statement information is presented below:
|
Dow Chlorine Value Chain Income Statement Information
|
|||
|
In millions
|
2015
1
|
||
|
Income from continuing operations before income taxes
2
|
$
|
139
|
|
|
Loss before income taxes attributable to noncontrolling interests
|
11
|
|
|
|
Income from continuing operations before income taxes attributable to DowDuPont Inc.
2
|
$
|
150
|
|
|
1.
|
Income statement information for 2015 includes results through September 30, 2015.
|
|
2.
|
Excludes transaction costs associated with the separation of the chlorine value chain, which are reported below.
|
In 2015, Dow incurred pretax charges of
$119 million
for nonrecurring transaction costs associated with the separation of the chlorine value chain, consisting primarily of financial and professional advisory fees, legal fees and information systems infrastructure costs. These charges, which are part of transaction costs and productivity actions, were included in "Sundry income (expense) - net" in the consolidated statements of income and related to Corporate.
112
NOTE
7
- SUPPLEMENTARY INFORMATION
|
Sundry Income (Expense) - Net
|
|||||||||
|
In millions
|
2017
|
2016
|
2015
|
||||||
|
Gain on sales of other assets and investments
|
$
|
198
|
|
$
|
170
|
|
$
|
237
|
|
|
Interest income
|
147
|
|
107
|
|
71
|
|
|||
|
Foreign exchange losses
|
(63
|
)
|
(126
|
)
|
(190
|
)
|
|||
|
Gain on DAS Divested Ag Business
1
|
635
|
|
—
|
|
—
|
|
|||
|
Gain on divestiture of Dow's EAA Business
1
|
227
|
|
—
|
|
—
|
|
|||
|
Gain related to Dow's Nova patent infringement award
2
|
137
|
|
—
|
|
—
|
|
|||
|
Impact of split-off of Dow's chlorine value chain
3
|
7
|
|
6
|
|
2,233
|
|
|||
|
Loss related to Dow's Bayer CropScience arbitration matter
2
|
(469
|
)
|
—
|
|
—
|
|
|||
|
Gain on Dow's ownership restructure of Dow Corning
4
|
—
|
|
2,445
|
|
—
|
|
|||
|
Settlement of Dow's urethane matters class action lawsuit and opt-out cases
2
|
—
|
|
(1,235
|
)
|
—
|
|
|||
|
Gain (Loss) on divestitures
1
|
—
|
|
(26
|
)
|
2,043
|
|
|||
|
Gain on Dow's Univation step acquisition
4
|
—
|
|
—
|
|
361
|
|
|||
|
Costs associated with Dow's portfolio and productivity actions
5
|
—
|
|
(41
|
)
|
(119
|
)
|
|||
|
Other - net
|
147
|
|
152
|
|
80
|
|
|||
|
Total sundry income (expense) - net
|
$
|
966
|
|
$
|
1,452
|
|
$
|
4,716
|
|
1. See Note
4
for additional information.
2. See Note
16
for additional information.
3. See Note
6
for additional information.
4. See Note
3
for additional information.
5. Transaction costs primarily associated with the separation of Dow's chlorine value chain.
Accrued and Other Current Liabilities
“Accrued and other current liabilities” were
$8,409 million
at
December 31, 2017
and
$4,481 million
at
December 31, 2016
. Components of "Accrued and other current liabilities" that were more than 5 percent of total current liabilities were:
|
Accrued and Other Current Liabilities at Dec 31
|
2017
|
2016
|
||||
|
In millions
|
||||||
|
Accrued payroll
|
$
|
1,931
|
|
$
|
1,105
|
|
|
Deferred revenue
|
$
|
2,606
|
|
$
|
274
|
|
Other Investments
Dow has investments in company-owned life insurance policies, which are recorded at their cash surrender value as of each balance sheet date. In 2015, Dow repaid
$697 million
of principal outstanding loan amounts plus accrued interest, which was reflected in "Purchases of investments" in the consolidated statements of cash flows.
113
NOTE
8
- INCOME TAXES
On December 22, 2017, the Tax Cuts and Jobs Act (“The Act”) was enacted. The Act reduces the U.S. federal corporate income tax rate from
35 percent
to
21 percent
, requires companies to pay a one-time transition tax on earnings of foreign subsidiaries that were previously deferred, creates new provisions related to foreign sourced earnings, eliminates the domestic manufacturing deduction and moves to a territorial system. At December 31, 2017, the Company has not completed its accounting for the tax effects of The Act; however, as described below, the Company has made a reasonable estimate of the effects on its existing deferred tax balances and the one-time transition tax. In accordance with Staff Accounting Bulletin 118 ("SAB 118"), income tax effects of The Act may be refined upon obtaining, preparing, or analyzing additional information during the measurement period and such changes could be material. During the measurement period, provisional amounts may also be adjusted for the effects, if any, of interpretative guidance issued after December 31, 2017, by U.S. regulatory and standard-setting bodies.
|
•
|
As a result of The Act, the Company remeasured its U.S. federal deferred tax assets and liabilities based on the rates at which they are expected to reverse in the future, which is generally
21 percent
. However, the Company is still analyzing certain aspects of The Act and refining its calculations, which could potentially affect the measurement of these balances or potentially give rise to new deferred tax amounts. The provisional amount recorded related to the remeasurement of the Company’s deferred tax balance was
$2,666 million
, recorded as a benefit to “Provision (Credit) for income taxes on continuing operations.”
|
|
•
|
The Act requires a mandatory deemed repatriation of post-1986 undistributed foreign earnings and profits (“E&P”), which results in a one-time transition tax. As a result, the Company recorded a provisional amount for the transition tax liability for its foreign subsidiaries of
$1,580 million
, recorded as a charge to “Provision (Credit) for income taxes on continuing operations.” The Company has not yet completed its calculation of the total post-1986 foreign E&P for its foreign subsidiaries as E&P will not be finalized until the federal income tax return is filed. Further, the transition tax is based in part on the amount of those earnings held in cash and other specified assets, which is a defined term under The Act.
|
|
•
|
For tax years beginning after December 31, 2017, The Act introduces new provisions for U.S. taxation of certain global intangible low-taxed income (“GILTI”). Due to its complexity and a current lack of guidance as to how to calculate the tax, the Company is not yet able to determine a reasonable estimate for the impact of the incremental tax liability. When additional guidance is available, the Company will make a policy election on whether the additional liability will be recorded in the period in which it is incurred or recognized for the basis differences that would be expected to reverse in future years.
|
114
|
Geographic Allocation of Income and Provision (Credit) for Income Taxes
|
|||||||||
|
In millions
|
2017
|
2016
|
2015
|
||||||
|
Income (Loss) from continuing operations before income taxes
|
|||||||||
|
Domestic
1, 2, 3
|
$
|
(2,804
|
)
|
$
|
485
|
|
$
|
5,313
|
|
|
Foreign
|
3,997
|
|
3,928
|
|
4,617
|
|
|||
|
Income from continuing operations before income taxes
|
$
|
1,193
|
|
$
|
4,413
|
|
$
|
9,930
|
|
|
Current tax expense (benefit)
|
|||||||||
|
Federal
|
$
|
(98
|
)
|
$
|
91
|
|
$
|
583
|
|
|
State and local
|
22
|
|
21
|
|
38
|
|
|||
|
Foreign
|
1,766
|
|
1,156
|
|
1,221
|
|
|||
|
Total current tax expense
|
$
|
1,690
|
|
$
|
1,268
|
|
$
|
1,842
|
|
|
Deferred tax (benefit) expense
|
|||||||||
|
Federal
4
|
$
|
(1,764
|
)
|
$
|
(1,255
|
)
|
$
|
358
|
|
|
State and local
|
8
|
|
(10
|
)
|
(8
|
)
|
|||
|
Foreign
|
(410
|
)
|
6
|
|
(45
|
)
|
|||
|
Total deferred tax (benefit) expense
|
$
|
(2,166
|
)
|
$
|
(1,259
|
)
|
$
|
305
|
|
|
Provision (Credit) for income taxes on continuing operations
|
$
|
(476
|
)
|
$
|
9
|
|
$
|
2,147
|
|
|
Income from continuing operations, net of tax
|
$
|
1,669
|
|
$
|
4,404
|
|
$
|
7,783
|
|
|
1.
|
In 2017, the domestic component of "Income (Loss) from continuing operations before income taxes" included a
$1.5 billion
charge recognized in "Cost of sales" related to the fair value step-up of inventories assumed in the Merger and the acquisition of the H&N Business, a
$1.5 billion
goodwill impairment charge,
$874 million
of restructuring charges related to the Synergy Program and
$308 million
of income from portfolio actions, primarily related to the Merger remedy actions. See Notes
3
and
4
for additional information.
|
|
2.
|
In 2016, the domestic component of "Income (Loss) from continuing operations before income taxes" included approximately
$2.1 billion
(
$3.5 billion
in 2015) and the foreign component contained
zero
(
$1.1 billion
in 2015) of income from portfolio actions, primarily related to the DCC Transaction. See Notes
3
,
4
and
6
for additional information.
|
3. In 2016, the domestic component of "Income (Loss) from continuing operations before income taxes" included approximately
$2.6 billion
of expenses related to the urethane matters class action lawsuit and opt-out cases settlements, asbestos-related charge and charges for environmental matters. See Note
16
for additional information.
|
4.
|
The 2016 amount reflects the tax impact of accrued one-time items and reduced domestic income which limited the utilization of tax credits.
|
|
Reconciliation to U.S. Statutory Rate
|
2017
|
2016
|
2015
|
|||
|
Statutory U.S. federal income tax rate
|
35.0
|
%
|
35.0
|
%
|
35.0
|
%
|
|
Equity earnings effect
|
(11.0
|
)
|
(1.2
|
)
|
(1.8
|
)
|
|
Foreign income taxed at rates other than 35%
1
|
(26.7
|
)
|
(7.0
|
)
|
(4.0
|
)
|
|
U.S. tax effect of foreign earnings and dividends
|
(2.5
|
)
|
(4.6
|
)
|
1.3
|
|
|
Unrecognized tax benefits
|
2.9
|
|
(0.8
|
)
|
0.8
|
|
|
Acquisitions, divestitures and ownership restructuring activities
2, 3
|
6.5
|
|
(21.2
|
)
|
(9.5
|
)
|
|
Exchange gains (losses), net
|
2.4
|
|
—
|
|
—
|
|
|
Impact of U.S. Tax Reform
|
(90.9
|
)
|
—
|
|
—
|
|
|
State and local income taxes
|
6.1
|
|
0.2
|
|
0.6
|
|
|
Goodwill impairment
|
44.9
|
|
—
|
|
—
|
|
|
Excess tax benefits from stock-based compensation
4
|
(8.5
|
)
|
—
|
|
—
|
|
|
Other - net
|
1.9
|
|
(0.2
|
)
|
(0.8
|
)
|
|
Effective tax rate
|
(39.9
|
)%
|
0.2
|
%
|
21.6
|
%
|
|
1.
|
Includes the impact of valuation allowances in foreign jurisdictions.
|
|
2.
|
See Notes
3
,
4
and
6
for additional information.
|
|
3.
|
Includes a net tax benefit of
$261 million
related to an internal entity restructuring associated with the Intended Business Separations.
|
|
4.
|
Reflects the impact of the adoption of ASU 2016-09, which resulted in the recognition of excess tax benefits related to stock-based compensation in the "Provision (Credit) for income taxes on continuing operations." See Note
1
for additional information.
|
115
|
Deferred Tax Balances at Dec 31
|
2017
|
2016
|
||||||||||
|
In millions
|
Assets
|
Liabilities
|
Assets
|
Liabilities
|
||||||||
|
Property
|
$
|
508
|
|
$
|
3,634
|
|
$
|
307
|
|
$
|
2,860
|
|
|
Tax loss and credit carryforwards
|
3,425
|
|
—
|
|
2,450
|
|
—
|
|
||||
|
Postretirement benefit obligations
|
4,227
|
|
199
|
|
3,715
|
|
75
|
|
||||
|
Other accruals and reserves
|
1,661
|
|
190
|
|
1,964
|
|
883
|
|
||||
|
Intangibles
|
460
|
|
7,296
|
|
128
|
|
1,536
|
|
||||
|
Inventory
|
165
|
|
768
|
|
50
|
|
197
|
|
||||
|
Long-term debt
|
109
|
|
—
|
|
—
|
|
—
|
|
||||
|
Investments
|
295
|
|
611
|
|
179
|
|
119
|
|
||||
|
Unrealized exchange gains (losses), net
|
—
|
|
71
|
|
—
|
|
—
|
|
||||
|
Other – net
|
806
|
|
535
|
|
737
|
|
643
|
|
||||
|
Subtotal
|
$
|
11,656
|
|
$
|
13,304
|
|
$
|
9,530
|
|
$
|
6,313
|
|
|
Valuation allowances
1
|
(2,749
|
)
|
—
|
|
(1,061
|
)
|
—
|
|
||||
|
Total
|
$
|
8,907
|
|
$
|
13,304
|
|
$
|
8,469
|
|
$
|
6,313
|
|
|
Net Deferred Tax (Liability) Asset
|
$
|
(4,397
|
)
|
$
|
2,156
|
|
||||||
|
1.
|
Primarily related to the realization of recorded tax benefits on tax loss carryforwards from operations in the United States, Brazil, Luxembourg and Asia Pacific.
|
As a result of the Merger and subsequent change in ownership, certain net operating loss carryforwards available for Dow's consolidated German tax group were derecognized. In addition, the sale of stock between two Dow consolidated subsidiaries in 2014 created a gain that was initially deferred for tax purposes. This deferred gain became taxable as a result of activities executed in anticipation of the Intended Business Separations. As a result, in 2017, the Company decreased “Deferred income tax assets” in the consolidated balance sheets and recorded a charge to “Provision (Credit) for income taxes on continuing operations” in the consolidated statements of income of
$267 million
.
|
Operating Loss and Tax Credit Carryforwards
|
Deferred Tax Asset
|
|||||
|
In millions
|
2017
|
2016
|
||||
|
Operating loss carryforwards
|
||||||
|
Expire within 5 years
1
|
$
|
288
|
|
$
|
176
|
|
|
Expire after 5 years or indefinite expiration
1
|
2,788
|
|
1,346
|
|
||
|
Total operating loss carryforwards
|
$
|
3,076
|
|
$
|
1,522
|
|
|
Tax credit carryforwards
|
||||||
|
Expire within 5 years
|
$
|
49
|
|
$
|
28
|
|
|
Expire after 5 years or indefinite expiration
|
300
|
|
900
|
|
||
|
Total tax credit carryforwards
|
$
|
349
|
|
$
|
928
|
|
|
Total Operating Loss and Tax Credit Carryforwards
|
$
|
3,425
|
|
$
|
2,450
|
|
|
1.
|
Prior year was adjusted to conform with the current year presentation.
|
Undistributed earnings of foreign subsidiaries and related companies that are deemed to be permanently invested amounted to
$22,460 million
at
December 31, 2017
and
$18,668 million
at
December 31, 2016
. The Act imposed U.S. tax on all foreign unrepatriated earnings. These undistributed earnings are still subject to certain taxes upon repatriation, primarily where foreign withholding taxes apply. It is not practicable to calculate the unrecognized deferred tax liability on undistributed earnings.
116
The following table provides a reconciliation of the Company's unrecognized tax benefits:
|
Total Gross Unrecognized Tax Benefits
|
|||||||||
|
In millions
|
2017
|
2016
|
2015
|
||||||
|
Total unrecognized tax benefits at Jan 1
|
$
|
231
|
|
$
|
280
|
|
$
|
240
|
|
|
Decreases related to positions taken on items from prior years
|
(6
|
)
|
(12
|
)
|
(6
|
)
|
|||
|
Increases related to positions taken on items from prior years
1
|
46
|
|
153
|
|
92
|
|
|||
|
Increases related to positions taken in the current year
2
|
465
|
|
135
|
|
10
|
|
|||
|
Settlement of uncertain tax positions with tax authorities
1
|
(11
|
)
|
(325
|
)
|
(56
|
)
|
|||
|
Decreases due to expiration of statutes of limitations
|
(14
|
)
|
—
|
|
—
|
|
|||
|
Exchange loss
|
1
|
|
—
|
|
—
|
|
|||
|
Total unrecognized tax benefits at Dec 31
|
$
|
712
|
|
$
|
231
|
|
$
|
280
|
|
|
Total unrecognized tax benefits that, if recognized, would impact the effective tax rate
|
$
|
319
|
|
$
|
223
|
|
$
|
206
|
|
|
Total amount of interest and penalties (benefit) recognized in "Provision (Credit) for income taxes on continuing operations"
|
$
|
3
|
|
$
|
(55
|
)
|
$
|
80
|
|
|
Total accrual for interest and penalties associated with unrecognized tax benefits
|
$
|
135
|
|
$
|
89
|
|
$
|
178
|
|
|
1.
|
The 2016 balance includes the impact of a settlement agreement related to a historical change in the legal ownership structure of a nonconsolidated affiliate discussed below.
|
|
2.
|
The 2017 balance includes
$436 million
assumed in the Merger. The 2016 balance includes
$126 million
assumed in the DCC Transaction.
|
On January 9, 2017, the U.S. Supreme Court denied
certiorari
in Dow’s tax treatment of partnerships and transactions associated with Chemtech, a wholly owned subsidiary of Dow. Dow has fully accrued the position and does not expect a future impact to
“Provision (Credit) for income taxes on continuing operations” in the consolidated statements of income as a result of the ruling.
In the fourth quarter of 2016, a settlement of
$206 million
was reached on a tax matter associated with a historical change in the legal ownership structure of a nonconsolidated affiliate of Dow. As a result of the settlement, Dow recorded a net decrease in uncertain tax positions of
$67 million
, included in “Other noncurrent obligations” in the consolidated balance sheets, and an unfavorable impact of
$13 million
to “Provision (Credit) for income taxes on continuing operations” in the consolidated statements of income.
Each year Dow, DuPont and/or the Company file tax returns in the various national, state and local income taxing jurisdictions in which it operates. These tax returns are subject to examination and possible challenge by the tax authorities. Positions challenged by the tax authorities may be settled or appealed by the Company. As a result, there is an uncertainty in income taxes recognized in the Company’s financial statements in accordance with accounting for income taxes and accounting for uncertainty in income taxes. The impact on the Company’s results of operations is not expected to be material.
Tax years that remain subject to examination for the Company’s major tax jurisdictions are shown below:
|
Tax Years Subject to Examination by Major Tax Jurisdiction at Dec 31, 2017
|
Earliest Open Year
|
|
Jurisdiction
|
|
|
Argentina
|
2010
|
|
Brazil
|
2007
|
|
Canada
|
2011
|
|
China
|
2007
|
|
Denmark
|
2003
|
|
Germany
|
2006
|
|
India
|
2001
|
|
Italy
|
2012
|
|
The Netherlands
|
2014
|
|
Switzerland
|
2012
|
|
United States:
|
|
|
Federal income tax
|
2004
|
|
State and local income tax
|
2004
|
117
NOTE
9
- EARNINGS PER SHARE CALCULATIONS
The following tables provide earnings per share calculations for the years ended
December 31, 2017
,
2016
, and
2015
:
|
Net Income for Earnings Per Share Calculations - Basic
|
2017
|
2016
|
2015
|
||||||
|
In millions
|
|||||||||
|
Income from continuing operations, net of tax
|
$
|
1,669
|
|
$
|
4,404
|
|
$
|
7,783
|
|
|
Net income attributable to noncontrolling interests
|
(132
|
)
|
(86
|
)
|
(98
|
)
|
|||
|
Preferred stock dividends
1
|
—
|
|
(340
|
)
|
(340
|
)
|
|||
|
Net income attributable to participating securities
2
|
(13
|
)
|
(22
|
)
|
(51
|
)
|
|||
|
Income from continuing operations attributable to common stockholders
|
$
|
1,524
|
|
$
|
3,956
|
|
$
|
7,294
|
|
|
Loss from discontinued operations, net of tax
|
(77
|
)
|
—
|
|
—
|
|
|||
|
Net income attributable to common stockholders
|
$
|
1,447
|
|
$
|
3,956
|
|
$
|
7,294
|
|
|
Earnings Per Share Calculations - Basic
|
2017
|
2016
|
2015
|
||||||
|
Dollars per share
|
|||||||||
|
Income from continuing operations attributable to common stockholders
|
$
|
0.97
|
|
$
|
3.57
|
|
$
|
6.45
|
|
|
Loss from discontinued operations, net of tax
|
(0.05
|
)
|
—
|
|
—
|
|
|||
|
Net income attributable to common stockholders
|
$
|
0.92
|
|
$
|
3.57
|
|
$
|
6.45
|
|
|
Net Income for Earnings Per Share Calculations - Diluted
|
2017
|
2016
|
2015
|
||||||
|
In millions
|
|||||||||
|
Income from continuing operations, net of tax
|
$
|
1,669
|
|
$
|
4,404
|
|
$
|
7,783
|
|
|
Net income attributable to noncontrolling interests
|
(132
|
)
|
(86
|
)
|
(98
|
)
|
|||
|
Preferred stock dividends
1, 3
|
—
|
|
(340
|
)
|
—
|
|
|||
|
Net income attributable to participating securities
2
|
(13
|
)
|
(22
|
)
|
(51
|
)
|
|||
|
Income from continuing operations attributable to common stockholders
|
$
|
1,524
|
|
$
|
3,956
|
|
$
|
7,634
|
|
|
Loss from discontinued operations, net of tax
|
(77
|
)
|
—
|
|
—
|
|
|||
|
Net income attributable to common stockholders
|
$
|
1,447
|
|
$
|
3,956
|
|
$
|
7,634
|
|
|
Earnings Per Share Calculations - Diluted
|
2017
|
2016
|
2015
|
||||||
|
Dollars per share
|
|||||||||
|
Income from continuing operations attributable to common stockholders
|
$
|
0.95
|
|
$
|
3.52
|
|
$
|
6.15
|
|
|
Loss from discontinued operations, net of tax
|
(0.04
|
)
|
—
|
|
—
|
|
|||
|
Net income attributable to common stockholders
|
$
|
0.91
|
|
$
|
3.52
|
|
$
|
6.15
|
|
|
Share Count Information
|
2017
|
2016
|
2015
|
|||
|
Shares in millions
|
||||||
|
Weighted-average common shares - basic
4, 5
|
1,579.8
|
|
1,108.1
|
|
1,130.1
|
|
|
Plus dilutive effect of equity compensation plans
4
|
18.3
|
|
15.1
|
|
14.5
|
|
|
Plus dilutive effect of assumed conversion of preferred stock
1, 6
|
—
|
|
—
|
|
96.8
|
|
|
Weighted-average common shares - diluted
4
|
1,598.1
|
|
1,123.2
|
|
1,241.4
|
|
|
Stock options and deferred stock awards excluded from EPS calculations
7
|
1.4
|
|
1.9
|
|
4.6
|
|
|
1.
|
On December 30, 2016, Dow converted all shares of its Cumulative Convertible Perpetual Preferred Stock, Series A ("Preferred Stock") into shares of Dow's common stock. As a result of this conversion, no shares of Dow Preferred Stock are issued or outstanding. See Note
17
for additional information.
|
|
2.
|
Deferred stock awards are considered participating securities due to the Company's practice of paying dividend equivalents on unvested shares.
|
|
3.
|
Preferred Stock dividends were not added back in the calculation of diluted earnings per share for the period ended December 31, 2016, because the effect of an assumed conversion of Dow's Preferred Stock would have been antidilutive.
|
|
4.
|
As a result of the Merger, share amounts for the year ended December 31, 2017, reflect a weighted averaging effect of Dow shares outstanding prior to August 31, 2017 and DowDuPont shares outstanding on and after August 31, 2017.
|
|
5.
|
On December 30, 2016, Dow converted
4 million
shares of Dow Preferred Stock into
96.8 million
shares of Dow's common stock. As a result of this conversion,
0.5 million
shares of Dow common stock are included in "Weighted-average common shares - basic" for the year ended December 31, 2016.
|
|
6.
|
The calculation of diluted earnings per share for the year ended December 31, 2016, excludes
96.3 million
shares of Dow common stock because the effect of an assumed conversion of Dow Preferred Stock for the full period would have been antidilutive.
|
|
7.
|
These outstanding options to purchase shares of common stock and deferred stock awards were excluded from the calculation of diluted earnings per share because the effect of including them would have been antidilutive.
|
118
NOTE
10
- INVENTORIES
The following table provides a breakdown of inventories:
|
Inventories at Dec 31
|
2017
|
2016
|
||||
|
In millions
|
||||||
|
Finished goods
|
$
|
9,701
|
|
$
|
4,230
|
|
|
Work in process
|
4,512
|
|
1,510
|
|
||
|
Raw materials
|
1,267
|
|
853
|
|
||
|
Supplies
|
1,296
|
|
823
|
|
||
|
Total
|
$
|
16,776
|
|
$
|
7,416
|
|
|
Adjustment of inventories to a LIFO basis
|
216
|
|
(53
|
)
|
||
|
Total inventories
|
$
|
16,992
|
|
$
|
7,363
|
|
Total inventories increased
$9,629 million
from
December 31, 2016
, primarily due to the Merger. See Note
3
for additional information.
NOTE
11
- PROPERTY
The following table provides a breakdown of property:
|
Property at Dec 31
1
|
Estimated Useful Lives (Years)
|
2017
|
2016
|
|||||
|
In millions
|
||||||||
|
Land and land improvements
|
0-25
|
|
$
|
3,448
|
|
$
|
2,524
|
|
|
Buildings
|
1-50
|
|
8,667
|
|
5,935
|
|
||
|
Machinery and equipment
|
1-25
|
|
51,312
|
|
38,499
|
|
||
|
Other property
|
3-50
|
|
5,277
|
|
4,380
|
|
||
|
Construction in progress
|
—
|
|
4,600
|
|
6,100
|
|
||
|
Total property
|
|
$
|
73,304
|
|
$
|
57,438
|
|
|
|
1.
|
Prior year data has been updated to conform with the current year presentation.
|
|
In millions
|
2017
|
2016
|
2015
|
||||||
|
Depreciation expense
|
$
|
2,755
|
|
$
|
2,130
|
|
$
|
1,908
|
|
|
Capitalized interest
|
$
|
247
|
|
$
|
243
|
|
$
|
218
|
|
The increase in property is primarily due to the Merger. In connection with the Merger, the Company recorded
$11,941 million
of property representing the preliminary fair value at the Merger date. See Note
3
for further information on this transaction.
119
NOTE
12
- NONCONSOLIDATED AFFILIATES AND RELATED COMPANY TRANSACTIONS
The Company’s investments in companies accounted for using the equity method (“nonconsolidated affiliates”), by classification in the consolidated balance sheets, and dividends received from nonconsolidated affiliates are shown in the following tables:
|
Investments in Nonconsolidated Affiliates at Dec 31
|
||||||
|
In millions
|
2017
1
|
2016
1
|
||||
|
Investment in nonconsolidated affiliates
|
$
|
5,336
|
|
$
|
3,747
|
|
|
Accrued and other current liabilities
|
(46
|
)
|
—
|
|
||
|
Other noncurrent obligations
|
(752
|
)
|
(1,030
|
)
|
||
|
Net investment in nonconsolidated affiliates
|
$
|
4,538
|
|
$
|
2,717
|
|
|
1.
|
The carrying amount of the Company’s investments in nonconsolidated affiliates at December 31, 2017, was
$32 million
less than its share of the investees’ net assets, exclusive of additional differences relating to the Merger, EQUATE and AFSI, which are discussed separately in the disclosures that follow. At December 31, 2016, the carrying amount of the Company’s investments in nonconsolidated affiliates was
$62 million
more than its share of the investees’ net assets, exclusive of additional differences relating to EQUATE and AFSI.
|
|
Dividends Received from Nonconsolidated Affiliates
|
|||||||||
|
In millions
|
2017
1
|
2016
|
2015
|
||||||
|
Dividends from nonconsolidated affiliates
|
$
|
900
|
|
$
|
685
|
|
$
|
816
|
|
1. Includes a non-cash dividend of
$8 million
.
Except for AFSI, the nonconsolidated affiliates in which the Company has investments are privately held companies; therefore, quoted market prices are not available.
Merger with DuPont
In connection with the Merger, the net investment in nonconsolidated affiliates increased by
$1,609 million
(consisting of
$1,654 million
in "Investment in nonconsolidated affiliates" and
$45 million
in "Accrued and other current liabilities"), which represented the fair value of investments acquired at August 31, 2017. At December 31, 2017, the carrying value of investments acquired in the Merger was
$930 million
more than the Company's proportionate share of underlying net assets of the investees. An aggregate basis difference of
$290 million
at December 31, 2017, is being amortized over a period of
12 years
and the remainder is considered a permanent difference.
Dow Corning and the HSC Group
As a result of the DCC Transaction, Dow Corning, previously a
50
:50 joint venture between Dow and Corning, became a wholly owned subsidiary of Dow as of June 1, 2016. Dow's equity interest in Dow Corning, which was previously classified as "Investment in nonconsolidated affiliates" in the consolidated balance sheets, was remeasured to fair value. See Note
3
for additional information on the DCC Transaction, including details on the fair value of assets acquired and liabilities assumed. Dow Corning continues to maintain equity interests in the HSC Group, which includes Hemlock Semiconductor L.L.C. and DC HSC Holdings LLC. The negative investment balance in Hemlock Semiconductor L.L.C. was
$752 million
at
December 31, 2017
(
$902 million
at
December 31, 2016
).
EQUATE
At
December 31, 2017
, the Company had an investment balance in EQUATE of
$42 million
, which is classified as "Investment in nonconsolidated affiliates" in the consolidated balance sheets (negative
$128 million
at
December 31, 2016
, classified as "Other noncurrent obligations" in the consolidated balance sheets). The Company's investment in EQUATE was
$516 million
less than the Company's proportionate share of EQUATE's underlying net assets at
December 31, 2017
(
$536 million
less at
December 31, 2016
), which represents the difference between the fair values of certain MEGlobal assets acquired by EQUATE and the Company's related valuation on a U.S. GAAP basis. A basis difference of
$200 million
at
December 31, 2017
(
$216 million
at
December 31, 2016
) is being amortized over the remaining useful lives of the assets and the remainder is considered a permanent difference.
120
AFSI
On July 31, 2015, Dow sold its AgroFresh business to AFSI. Proceeds received on the divestiture of AgroFresh included
17.5 million
common shares of AFSI, which were valued at
$210 million
and represented an approximate
35 percent
ownership interest in AFSI. Based on the December 31, 2016 closing stock price of AFSI, the value of this investment would have been lower than the carrying value by
$143 million
. In the fourth quarter of 2016, Dow determined the decline in market value of AFSI was other‑than‑temporary and recognized a
$143 million
pretax impairment charge related to its equity interest in AFSI. The impairment charge was included in "Restructuring, goodwill impairment and asset related charges - net" in the consolidated statements of income and related to the Corporate segment. At
December 31, 2017
, the Company's investment in AFSI was
$92 million
less than the Company's proportionate share of AFSI's underlying net assets (
$96 million
less at
December 31, 2016
). This amount primarily relates to the other-than-temporary decline in the Company's investment in AFSI.
On April 4, 2017, Dow and AFSI revised certain agreements related to the divestiture of the AgroFresh business and Dow entered into an agreement to purchase up to
5,070,358
shares of AFSI's common stock, which represented approximately
10 percent
of AFSI's common stock outstanding at signing of the agreement, subject to certain terms and conditions. At
December 31, 2017
, Dow held an approximate
36 percent
ownership interest in AFSI (
35 percent
at
December 31, 2016
). See Notes
4
,
22
and
23
for further information on this investment.
Sadara
Dow and Saudi Arabian Oil Company formed Sadara Chemical Company ("Sadara") to build and operate a world-scale, fully integrated chemicals complex in Jubail Industrial City, Kingdom of Saudi Arabia. Sadara achieved its first polyethylene production in December 2015 and announced the start-up of its mixed feed cracker and a third polyethylene train (which added to the two polyethylene trains already in operation) in August 2016. Sadara achieved successful startup of its remaining production facilities in 2017. At
December 31, 2017
, Dow had a
$275 million
note receivable with Sadara, included in "Noncurrent receivables" in the consolidated balance sheets (
$258 million
at
December 31, 2016
). In 2017, Dow loaned
$735 million
to Sadara and
$718 million
was converted to equity (
$1,015 million
loaned and
$1,230 million
converted to equity in 2016).
Transactions with Nonconsolidated Affiliates
Dow has service agreements with certain nonconsolidated affiliates, including contracts to manage the operations of manufacturing sites and the construction of new facilities; licensing and technology agreements; and marketing, sales, purchase, lease and sublease agreements.
Dow sells excess ethylene glycol produced at Dow's manufacturing facilities in the United States and Europe to MEGlobal, an EQUATE subsidiary. Dow also sells ethylene to MEGlobal as a raw material for its ethylene glycol plants in Canada. Sales of these products to MEGlobal represented
1 percent
of total net sales in
2017
(
1 percent
of total net sales in
2016
and
1
percent of total net sales in
2015
). Sales of ethylene glycol to MEGlobal are reflected in the Industrial Intermediates & Infrastructure segment and represented
2 percent
of the segment's sales in
2017
(
2 percent
in
2016
and
2 percent
in
2015
). Sales of ethylene to MEGlobal are reflected in the Packaging & Specialty Plastics segment and represented
1 percent
of the segment's sales in
2017
(
1 percent
in
2016
and
1 percent
in
2015
).
Dow Corning supplies trichlorosilane, a raw material used in the production of polycrystalline silicon, to the HSC Group. Sales of this material to the HSC Group represented less than
1 percent
of total net sales in
2017
(
11 percent
of the Electronics & Imaging segment sales). Sales of this material to the HSC Group for the period of June 1, 2016 through December 31, 2016, represented less than
1 percent
of total net sales in
2016
(
9 percent
of the Electronics & Imaging segment sales).
Dow is responsible for marketing the majority of Sadara products outside of the Middle East zone through Dow’s established sales channels. Under this arrangement, Dow purchases and sells Sadara products for a marketing fee. Purchases of Sadara products represented
3 percent
of "Cost of sales" in
2017
. Purchases of Sadara products were not material in prior periods.
Dow purchases products from The SCG-Dow Group, primarily for marketing and distribution in the Asia Pacific region. Purchases of The SCG-Dow Group products represented
2 percent
of "Cost of sales" in
2017
(
3 percent
in
2016
and
3 percent
in
2015
).
Sales to and purchases from other nonconsolidated affiliates were not material to the consolidated financial statements.
121
Balances due to or due from nonconsolidated affiliates at
December 31, 2017
and
2016
are as follows:
|
Balances Due To or Due From Nonconsolidated Affiliates at Dec 31
|
|
|
||||
|
In millions
|
2017
|
2016
|
||||
|
Accounts and notes receivable - Other
|
$
|
496
|
|
$
|
388
|
|
|
Noncurrent receivables
|
283
|
|
267
|
|
||
|
Total assets
|
$
|
779
|
|
$
|
655
|
|
|
Notes payable
|
$
|
40
|
|
$
|
44
|
|
|
Accounts payable - Other
1
|
1,260
|
|
400
|
|
||
|
Total current liabilities
|
$
|
1,300
|
|
$
|
444
|
|
|
1.
|
Increase in "Accounts payable - Other" at December 31, 2017, compared with December 31, 2016, is primarily due to higher purchases from Sadara.
|
Principal Nonconsolidated Affiliates
The Company had an ownership interest in
82
nonconsolidated affiliates at
December 31, 2017
(
59
at
December 31, 2016
). The Company's principal nonconsolidated affiliates and its ownership interest (direct and indirect) for each at
December 31, 2017
,
2016
and
2015
are as follows:
|
Principal Nonconsolidated Affiliates at Dec 31
|
Ownership Interest
|
|||||
|
|
2017
|
2016
|
2015
|
|||
|
Dow Corning Corporation
1
|
N/A
|
|
N/A
|
|
50
|
%
|
|
EQUATE Petrochemical Company K.S.C.
|
42.5
|
%
|
42.5
|
%
|
42.5
|
%
|
|
The HSC Group:
2
|
||||||
|
DC HSC Holdings LLC
|
50
|
%
|
50
|
%
|
N/A
|
|
|
Hemlock Semiconductor L.L.C.
|
50.1
|
%
|
50.1
|
%
|
N/A
|
|
|
The Kuwait Olefins Company K.S.C.
|
42.5
|
%
|
42.5
|
%
|
42.5
|
%
|
|
The Kuwait Styrene Company K.S.C.
|
42.5
|
%
|
42.5
|
%
|
42.5
|
%
|
|
Map Ta Phut Olefins Company Limited
3
|
32.77
|
%
|
32.77
|
%
|
32.77
|
%
|
|
Sadara Chemical Company
|
35
|
%
|
35
|
%
|
35
|
%
|
|
The SCG-Dow Group:
|
|
|
|
|
|
|
|
Siam Polyethylene Company Limited
|
50
|
%
|
50
|
%
|
50
|
%
|
|
Siam Polystyrene Company Limited
|
50
|
%
|
50
|
%
|
50
|
%
|
|
Siam Styrene Monomer Co., Ltd.
|
50
|
%
|
50
|
%
|
50
|
%
|
|
Siam Synthetic Latex Company Limited
|
50
|
%
|
50
|
%
|
50
|
%
|
|
1.
|
On June 1, 2016, Dow became the
100 percent
owner of Dow Corning. See Note
3
for additional information.
|
|
2.
|
The HSC Group was previously part of the Dow Corning equity method investment and was added as principal nonconsolidated affiliates in the fourth quarter of 2016.
|
|
3.
|
Dow's effective ownership of Map Ta Phut Olefins Company Limited is
32.77 percent
, of which Dow directly owns
20.27 percent
and indirectly owns
12.5
percent through its equity interest in Siam Polyethylene Company Limited and Siam Synthetic Latex Company Limited.
|
The Company's investment in and equity earnings from its principal nonconsolidated affiliates are shown in the tables below:
|
Investment in Principal Nonconsolidated Affiliates at Dec 31
|
||||||
|
In millions
|
2017
|
2016
|
||||
|
Investment in principal nonconsolidated affiliates
|
$
|
3,323
|
|
$
|
3,029
|
|
|
Other noncurrent obligations
|
(752
|
)
|
(1,030
|
)
|
||
|
Net investment in principal nonconsolidated affiliates
|
$
|
2,571
|
|
$
|
1,999
|
|
|
Equity Earnings from Principal Nonconsolidated Affiliates
|
|||||||||
|
In millions
|
2017
|
2016
1
|
2015
2
|
||||||
|
Equity in earnings of principal nonconsolidated affiliates
|
$
|
701
|
|
$
|
449
|
|
$
|
704
|
|
|
1.
|
Equity in earnings of principal nonconsolidated affiliates for 2016 includes the results of Dow Corning through May 31, 2016.
|
|
2.
|
Equity in earnings of principal nonconsolidated affiliates for 2015 includes the results of Univation through April 30, 2015.
|
122
The summarized financial information that follows represents the combined accounts (at
100 percent
) of the principal nonconsolidated affiliates:
|
Summarized Balance Sheet Information at Dec 31
|
|
|
||||
|
In millions
|
2017
|
2016
1
|
||||
|
Current assets
|
$
|
8,039
|
|
$
|
6,092
|
|
|
Noncurrent assets
|
28,300
|
|
28,588
|
|
||
|
Total assets
|
$
|
36,339
|
|
$
|
34,680
|
|
|
Current liabilities
|
$
|
5,164
|
|
$
|
3,953
|
|
|
Noncurrent liabilities
|
22,240
|
|
23,223
|
|
||
|
Total liabilities
|
$
|
27,404
|
|
$
|
27,176
|
|
|
Noncontrolling interests
|
$
|
304
|
|
$
|
300
|
|
|
1.
|
The summarized balance sheet information for 2016 does not include Dow Corning.
|
|
Summarized Income Statement Information
1
|
|||||||||
|
In millions
|
2017
|
2016
2
|
2015
3
|
||||||
|
Sales
|
$
|
13,345
|
|
$
|
12,003
|
|
$
|
15,468
|
|
|
Gross profit
|
$
|
2,461
|
|
$
|
2,518
|
|
$
|
3,206
|
|
|
Net income
|
$
|
1,401
|
|
$
|
831
|
|
$
|
1,343
|
|
|
1.
|
The results in this table reflect purchase and sale activity between certain principal nonconsolidated affiliates and Dow, as previously discussed in the "Transactions with Nonconsolidated Affiliates" section.
|
|
2.
|
The summarized income statement information for 2016 includes the results of Dow Corning through May 31, 2016.
|
|
3.
|
The summarized income statement information for 2015 includes the results of Univation through April 30, 2015 and MEGlobal through November 30, 2015.
|
123
NOTE
13
- GOODWILL AND OTHER INTANGIBLE ASSETS
The Company changed its reportable segments as a result of the Merger to reflect the manner in which the Company's chief operating decision maker assesses performance and allocates resources. Effective with the Merger, the Company also updated its reporting units to align with the level at which discrete financial information is available for review by management. In connection with the Merger, the Company recorded
$45,105 million
of goodwill, representing the preliminary fair value as of the effective date of the Merger. Goodwill resulting from the Merger was assigned to reporting units based on the acquisition method of accounting and is considered preliminary. For the remaining goodwill balance, a relative fair value method was used to reallocate goodwill for reporting units of which the composition had changed. The following table reflects the carrying amounts of goodwill by reportable segment. Prior year data has been updated to conform with the current year presentation.
|
Goodwill
|
Agri-culture
|
Perf. Materials & Coatings
|
Ind. Interm. & Infrast.
|
Pack. & Spec. Plastics
|
Elect. & Imaging
|
Nutrition & Biosciences
|
Transp. & Adv. Polymers
|
Safety & Const.
|
Total
|
||||||||||||||||||
|
In millions
|
|||||||||||||||||||||||||||
|
Balance at Jan 1, 2016
|
$
|
1,472
|
|
$
|
2,781
|
|
$
|
1,054
|
|
$
|
1,534
|
|
$
|
3,631
|
|
$
|
344
|
|
$
|
150
|
|
$
|
1,188
|
|
$
|
12,154
|
|
|
Acquisition of an aniline plant
|
—
|
|
—
|
|
37
|
|
—
|
|
—
|
|
—
|
|
—
|
|
—
|
|
37
|
|
|||||||||
|
Sale of product lines
|
—
|
|
(10
|
)
|
—
|
|
(5
|
)
|
—
|
|
—
|
|
—
|
|
—
|
|
(15
|
)
|
|||||||||
|
Goodwill related to the DCC Transaction
1
|
—
|
|
2,251
|
|
—
|
|
—
|
|
528
|
|
—
|
|
450
|
|
—
|
|
3,229
|
|
|||||||||
|
Foreign currency impact
|
—
|
|
(104
|
)
|
(6
|
)
|
(11
|
)
|
(4
|
)
|
(4
|
)
|
1
|
|
(5
|
)
|
(133
|
)
|
|||||||||
|
Balance at Dec 31, 2016
|
$
|
1,472
|
|
$
|
4,918
|
|
$
|
1,085
|
|
$
|
1,518
|
|
$
|
4,155
|
|
$
|
340
|
|
$
|
601
|
|
$
|
1,183
|
|
$
|
15,272
|
|
|
Goodwill recognized from Merger
1, 2
|
13,644
|
|
—
|
|
—
|
|
3,521
|
|
4,040
|
|
12,201
|
|
6,283
|
|
5,416
|
|
45,105
|
|
|||||||||
|
Goodwill impairment
|
—
|
|
(1,491
|
)
|
—
|
|
—
|
|
—
|
|
—
|
|
—
|
|
—
|
|
(1,491
|
)
|
|||||||||
|
Sale of SKC Haas Display Films
3
|
—
|
|
—
|
|
—
|
|
—
|
|
(34
|
)
|
—
|
|
—
|
|
—
|
|
(34
|
)
|
|||||||||
|
Divestiture of EAA Business
4
|
—
|
|
—
|
|
—
|
|
(23
|
)
|
—
|
|
—
|
|
—
|
|
—
|
|
(23
|
)
|
|||||||||
|
Goodwill recognized from H&N acquisition
5
|
—
|
|
—
|
|
—
|
|
—
|
|
—
|
|
718
|
|
—
|
|
—
|
|
718
|
|
|||||||||
|
Divestiture of DAS Divested Ag Business
6
|
(128
|
)
|
—
|
|
—
|
|
—
|
|
—
|
|
—
|
|
—
|
|
—
|
|
(128
|
)
|
|||||||||
|
Dissolution of joint venture
7
|
—
|
|
48
|
|
—
|
|
—
|
|
—
|
|
—
|
|
—
|
|
—
|
|
48
|
|
|||||||||
|
Other
|
—
|
|
—
|
|
—
|
|
(5
|
)
|
—
|
|
—
|
|
—
|
|
—
|
|
(5
|
)
|
|||||||||
|
Foreign currency impact
|
(115
|
)
|
194
|
|
16
|
|
33
|
|
14
|
|
(59
|
)
|
(14
|
)
|
(4
|
)
|
65
|
|
|||||||||
|
Balance at Dec 31, 2017
|
$
|
14,873
|
|
$
|
3,669
|
|
$
|
1,101
|
|
$
|
5,044
|
|
$
|
8,175
|
|
$
|
13,200
|
|
$
|
6,870
|
|
$
|
6,595
|
|
$
|
59,527
|
|
|
1.
|
See Note
3
for further information on goodwill recognized from business combinations.
|
|
2.
|
Final determination of the goodwill value assignment may result in adjustments to the preliminary value recorded.
|
|
3.
|
On June 30, 2017, Dow sold its ownership interest in the SKC Haas Display Films group of companies. See Note
18
for additional information.
|
|
4.
|
On September 1, 2017, Dow divested its EAA Business to SK Global Chemical Co., Ltd. See Note
4
for additional information.
|
|
5.
|
On November 1, 2017, DuPont acquired FMC's H&N Business. See Note
3
for additional information.
|
|
6.
|
On November 30, 2017, Dow divested the DAS Divested Ag Business. See Note
4
for additional information.
|
|
7.
|
On December 31, 2017, Dow dissolved a crude acrylic acid joint venture. See Note
23
for additional information.
|
Goodwill Impairments
The carrying amounts for all periods presented were net of accumulated impairments of
$120 million
in Transportation & Advanced Polymers and
$309 million
in Industrial Intermediates & Infrastructure. In addition, the carrying amount of goodwill at December 31, 2017, was net of accumulated impairments of
$1,491 million
in Performance Materials & Coatings as discussed below.
Goodwill Impairment Testing
The Company performs an impairment test of goodwill annually in the fourth quarter. In the fourth quarter of 2017, the Company early adopted ASU 2017-04. See Note
2
for additional information.
In 2017, the Company performed quantitative testing for
12
reporting units (
3
in 2016 and
3
in 2015) and a qualitative assessment was performed for the remaining
5
reporting units that carry goodwill. The qualitative assessment indicated that it was not more likely than not that fair value was less than the carrying value for those reporting units included in the qualitative test.
Upon completion of quantitative testing in the fourth quarter of 2017, the Company determined the Coatings & Performance Monomers reporting unit was impaired. Throughout 2017, the Coatings & Performance Monomers reporting unit did not consistently meet expected financial performance targets, primarily due to increasing commoditization in coatings markets and
124
competition, as well as customer consolidation in end markets which reduced growth opportunities. As a result, the Coatings & Performance Monomers reporting unit lowered future revenue and profitability expectations. The fair value of the Coatings & Performance Monomers reporting unit was determined using a discounted cash flow methodology that reflected reductions in projected revenue growth rates, primarily driven by modified sales volume and pricing assumptions, as well as revised expectations for future growth rates. These discounted cash flows did not support the carrying value of the Coatings & Performance Monomers reporting unit. As a result, the Company recorded a goodwill impairment charge for the Coatings & Performance Monomers reporting unit of
$1,491 million
in the fourth quarter of 2017, included in “Restructuring, goodwill impairment and asset related charges - net” in the consolidated statements of income and related to Performance Materials & Coatings. The Coatings & Performance Monomers reporting unit carried
$1,071 million
of goodwill at December 31, 2017.
No other goodwill impairments were identified as a result of the 2017 testing. Impairment tests conducted in 2016 and 2015 concluded that
no
goodwill impairments existed.
Other Intangible Assets
The following table provides information regarding the Company's other intangible assets:
|
Other Intangible Assets
1
|
Dec 31, 2017
|
Dec 31, 2016
|
||||||||||||||||
|
In millions
|
Gross
Carrying
Amount
|
Accum
Amort
|
Net
|
Gross Carrying Amount
|
Accum
Amort
|
Net
|
||||||||||||
|
Intangible assets with finite lives:
|
||||||||||||||||||
|
Developed technology
|
$
|
7,627
|
|
$
|
(1,834
|
)
|
$
|
5,793
|
|
$
|
3,254
|
|
$
|
(1,383
|
)
|
$
|
1,871
|
|
|
Software
|
1,420
|
|
(780
|
)
|
640
|
|
1,336
|
|
(696
|
)
|
640
|
|
||||||
|
Trademarks/tradenames
|
1,814
|
|
(596
|
)
|
1,218
|
|
696
|
|
(503
|
)
|
193
|
|
||||||
|
Customer-related
|
14,537
|
|
(2,151
|
)
|
12,386
|
|
4,806
|
|
(1,567
|
)
|
3,239
|
|
||||||
|
Microbial cell factories
2
|
397
|
|
(6
|
)
|
391
|
|
—
|
|
—
|
|
—
|
|
||||||
|
Favorable supply contracts
3
|
495
|
|
(17
|
)
|
478
|
|
—
|
|
—
|
|
—
|
|
||||||
|
Other
4
|
703
|
|
(166
|
)
|
537
|
|
168
|
|
(146
|
)
|
22
|
|
||||||
|
Total other intangible assets with finite lives
|
$
|
26,993
|
|
$
|
(5,550
|
)
|
$
|
21,443
|
|
$
|
10,260
|
|
$
|
(4,295
|
)
|
$
|
5,965
|
|
|
Intangible assets with indefinite lives:
|
||||||||||||||||||
|
In-process research and development ("IPR&D")
|
710
|
|
—
|
|
710
|
|
61
|
|
—
|
|
61
|
|
||||||
|
Germplasm
5
|
6,265
|
|
—
|
|
6,265
|
|
—
|
|
—
|
|
—
|
|
||||||
|
Trademarks/tradenames
|
4,856
|
|
—
|
|
4,856
|
|
—
|
|
—
|
|
—
|
|
||||||
|
Total other intangible assets
|
$
|
38,824
|
|
$
|
(5,550
|
)
|
$
|
33,274
|
|
$
|
10,321
|
|
$
|
(4,295
|
)
|
$
|
6,026
|
|
|
1.
|
Prior year data has been updated to conform with the current year presentation.
|
|
2.
|
Microbial cell factories, derived from natural microbes, are used to sustainably produce enzymes, peptides and chemicals using natural metabolic processes. The Company recognized the microbial cell factories as an intangible asset upon the Merger.
|
|
3.
|
Upon closing and pursuant to the terms of the FMC Agreement, DuPont entered into favorable supply contracts with FMC. DuPont recorded these contracts as intangible assets at the fair value of off-market contracts. Refer to Notes
3
and
4
for additional information.
|
|
4.
|
Primarily consists of sales and farmer networks, marketing and manufacturing alliances and noncompetition agreements.
|
|
5.
|
Germplasm is the pool of genetic source material and body of knowledge gained from the development and delivery stage of plant breeding. The Company recognized germplasm as an intangible asset upon the Merger. This intangible asset is expected to contribute to cash flows beyond the foreseeable future and there are no legal, regulatory, contractual or other factors which limit its useful life.
|
125
In connection with the Merger, the Company recorded
$27,221 million
of intangible assets, as shown in the table below, representing the preliminary fair values at the Merger date. See Note
3
for additional information on the Merger.
|
Merger Intangible Assets
|
Gross Carrying Amount
|
Weighted-average Amort Period
|
||
|
In millions
|
||||
|
Intangible assets with finite lives:
|
||||
|
Developed technology
|
$
|
4,239
|
|
12 years
|
|
Trademarks/tradenames
|
1,080
|
|
15 years
|
|
|
Customer-related
|
9,264
|
|
17 years
|
|
|
Microbial cell factories
|
400
|
|
23 years
|
|
|
Other
|
453
|
|
17 years
|
|
|
Total other intangible assets with finite lives
|
$
|
15,436
|
|
|
|
Intangible assets with indefinite lives:
|
||||
|
IPR&D
|
660
|
|
||
|
Germplasm
|
6,263
|
|
||
|
Trademarks/tradenames
|
4,862
|
|
||
|
Total other intangible assets
|
$
|
27,221
|
|
|
The following table provides information regarding amortization expense related to intangible assets:
|
Amortization Expense
|
|||||||||
|
In millions
|
2017
|
2016
|
2015
|
||||||
|
Other intangible assets, excluding software
|
$
|
1,013
|
|
$
|
544
|
|
$
|
419
|
|
|
Software, included in "Cost of sales"
|
$
|
87
|
|
$
|
73
|
|
$
|
72
|
|
In the fourth quarter of 2017, Dow wrote off
$69 million
of intangible assets (including
$11 million
of IPR&D) as part of the Synergy Program. In 2016, Dow wrote off
$11 million
of IPR&D as part of the 2016 restructuring charge. See Note
5
for additional information.
Total estimated amortization expense for the next five fiscal years is as follows:
|
Estimated Amortization Expense for Next Five Years
|
|||
|
In millions
|
|||
|
2018
|
$
|
2,003
|
|
|
2019
|
$
|
1,919
|
|
|
2020
|
$
|
1,872
|
|
|
2021
|
$
|
1,823
|
|
|
2022
|
$
|
1,744
|
|
NOTE
14
- TRANSFERS OF FINANCIAL ASSETS
Dow sells trade accounts receivable of select North American entities and qualifying trade accounts receivable of select European entities on a revolving basis to certain multi-seller commercial paper conduit entities ("conduits"). The proceeds received are comprised of cash and interests in specified assets of the conduits (the receivables sold by Dow) that entitle Dow to the residual cash flows of such specified assets in the conduits after the commercial paper has been repaid. Neither the conduits nor the investors in those entities have recourse to other assets of Dow in the event of nonpayment by the debtors.
In the fourth quarter of 2017, Dow suspended further sales of trade accounts receivable through these facilities and began reducing outstanding balances under these facilities through collections of trade accounts receivable previously sold to such conduits. Dow has the ability to resume such sales to the conduits, subject to certain prior notice requirements, at the discretion of the Company.
126
For the year ended
December 31, 2017
, Dow recognized a loss of
$25 million
on the sale of these receivables (
$20 million
loss for the year ended
December 31, 2016
and
$15 million
loss for the year ended
December 31, 2015
), which is included in “Interest expense and amortization of debt discount” in the consolidated statements of income.
Dow's interests in the conduits are carried at fair value and included in “Accounts and notes receivable - Other” in the consolidated balance sheets. Fair value of the interests is determined by calculating the expected amount of cash to be received and is based on unobservable inputs (a Level 3 measurement). The key input in the valuation is the percentage of anticipated credit losses in the portfolio of receivables sold that have not yet been collected. Given the short-term nature of the underlying receivables, discount rates and prepayments are not factors in determining the fair value of the interests.
The following table summarizes the carrying value of interests held, which represents Dow's maximum exposure to loss related to the receivables sold, and the percentage of anticipated credit losses related to the trade accounts receivable sold. Also provided is the sensitivity of the fair value of the interests held to hypothetical adverse changes in the anticipated credit losses; amounts shown below are the corresponding hypothetical decreases in the carrying value of interests.
|
Interests Held at Dec 31
|
||||||
|
In millions
|
2017
|
2016
|
||||
|
Carrying value of interests held
|
$
|
677
|
|
$
|
1,237
|
|
|
Percentage of anticipated credit losses
|
2.64
|
%
|
0.36
|
%
|
||
|
Impact to carrying value - 10% adverse change
|
$
|
—
|
|
$
|
1
|
|
|
Impact to carrying value - 20% adverse change
|
$
|
1
|
|
$
|
1
|
|
Credit losses, net of any recoveries, were
insignificant
for the year ended
December 31, 2017
(
insignificant
for the year ended
December 31, 2016
, and
$1 million
for the year ended
December 31, 2015
).
Following is an analysis of certain cash flows between Dow and the conduits:
|
Cash Proceeds
|
|||||||||
|
In millions
|
2017
|
2016
|
2015
|
||||||
|
Sale of receivables
|
$
|
1
|
|
$
|
1
|
|
$
|
18
|
|
|
Collections reinvested in revolving receivables
|
$
|
21,293
|
|
$
|
21,652
|
|
$
|
22,951
|
|
|
Interests in conduits
1
|
$
|
2,269
|
|
$
|
1,257
|
|
$
|
1,034
|
|
|
1.
|
Presented in "Operating Activities" in the consolidated statements of cash flows.
|
Following is additional information related to the sale of receivables under these facilities:
|
Trade Accounts Receivable Sold at Dec 31
|
||||||
|
In millions
|
2017
|
2016
|
||||
|
Delinquencies on sold receivables still outstanding
|
$
|
82
|
|
$
|
86
|
|
|
Trade accounts receivable outstanding and derecognized
|
$
|
612
|
|
$
|
2,257
|
|
In
2017
, Dow repurchased
$5 million
of previously sold receivables (
$4 million
in
2016
).
127
NOTE
15
- NOTES PAYABLE, LONG-TERM DEBT AND AVAILABLE CREDIT FACILITIES
The Company’s outstanding long-term debt resides with its subsidiaries, Dow and DuPont (the "Subsidiaries"). The Company does not guarantee any of the debt obligations of the Subsidiaries. The following tables summarize the consolidated notes payable and long-term debt of the Subsidiaries:
|
Notes Payable
|
Dec 31, 2017
|
Dec 31, 2016
|
||||||||||
|
In millions
|
Dow
|
DuPont
|
Total
|
|||||||||
|
Commercial paper
|
$
|
231
|
|
$
|
1,436
|
|
$
|
1,667
|
|
$
|
—
|
|
|
Notes payable to banks and other lenders
|
253
|
|
28
|
|
281
|
|
225
|
|
||||
|
Notes payable to related companies
|
—
|
|
—
|
|
—
|
|
44
|
|
||||
|
Notes payable trade
|
—
|
|
—
|
|
—
|
|
3
|
|
||||
|
Total notes payable
|
$
|
484
|
|
$
|
1,464
|
|
$
|
1,948
|
|
$
|
272
|
|
|
Period-end average interest rates
|
4.42
|
%
|
1.95
|
%
|
4.60
|
%
|
||||||
|
Long-Term Debt
|
Dec 31, 2017
|
2016 Weighted Average Rate
|
Dec 31, 2016
|
||||||||||||||||
|
In millions
|
Dow Weighted Average Rate
|
Dow
|
DuPont Weighted Average Rate
|
DuPont
|
Total
|
||||||||||||||
|
Promissory notes and debentures:
|
|||||||||||||||||||
|
Final maturity 2017
|
—
|
%
|
$
|
—
|
|
|
|
$
|
—
|
|
$
|
—
|
|
6.06
|
%
|
$
|
442
|
|
|
|
Final maturity 2018
|
5.78
|
%
|
339
|
|
1.59
|
%
|
1,280
|
|
1,619
|
|
5.78
|
%
|
339
|
|
|||||
|
Final maturity 2019
|
8.55
|
%
|
2,122
|
|
2.23
|
%
|
521
|
|
2,643
|
|
8.55
|
%
|
2,122
|
|
|||||
|
Final maturity 2020
|
4.46
|
%
|
1,547
|
|
1.79
|
%
|
3,070
|
|
4,617
|
|
4.46
|
%
|
1,547
|
|
|||||
|
Final maturity 2021
|
4.71
|
%
|
1,424
|
|
2.07
|
%
|
1,580
|
|
3,004
|
|
4.72
|
%
|
1,424
|
|
|||||
|
Final maturity 2022
1
|
3.50
|
%
|
1,373
|
|
—
|
%
|
—
|
|
1,373
|
|
3.50
|
%
|
1,371
|
|
|||||
|
Final maturity 2023 and thereafter
|
6.00
|
%
|
7,182
|
|
3.32
|
%
|
3,492
|
|
10,674
|
|
5.98
|
%
|
7,199
|
|
|||||
|
Other facilities:
|
|||||||||||||||||||
|
U.S. dollar loans, various rates and maturities
|
2.44
|
%
|
4,564
|
|
2.37
|
%
|
1,518
|
|
6,082
|
|
1.60
|
%
|
4,595
|
|
|||||
|
Foreign currency loans, various rates and maturities
|
3.00
|
%
|
814
|
|
2.85
|
%
|
30
|
|
844
|
|
3.42
|
%
|
882
|
|
|||||
|
Medium-term notes, varying maturities through 2043
1
|
3.20
|
%
|
873
|
|
1.22
|
%
|
110
|
|
983
|
|
3.18
|
%
|
905
|
|
|||||
|
Tax-exempt bonds, varying maturities through 2038
|
5.66
|
%
|
343
|
|
—
|
%
|
—
|
|
343
|
|
5.66
|
%
|
343
|
|
|||||
|
Capital lease obligations
|
282
|
|
5
|
|
287
|
|
295
|
|
|||||||||||
|
Unamortized debt discount and issuance costs
|
(346
|
)
|
—
|
|
(346
|
)
|
(373
|
)
|
|||||||||||
|
Long-term debt due within one year
2
|
(752
|
)
|
(1,315
|
)
|
(2,067
|
)
|
(635
|
)
|
|||||||||||
|
Long-term debt
|
$
|
19,765
|
|
$
|
10,291
|
|
$
|
30,056
|
|
$
|
20,456
|
|
|||||||
|
1.
|
Prior year data has been updated to conform with the current year presentation.
|
|
2.
|
Presented net of current portion of unamortized debt issuance costs.
|
|
Maturities of Long-Term Debt for Next Five Years at Dec 31, 2017
|
Dow
1
|
DuPont
2
|
Total
|
||||||
|
In millions
|
|||||||||
|
2018
|
$
|
752
|
|
$
|
1,286
|
|
$
|
2,038
|
|
|
2019
|
$
|
6,935
|
|
$
|
2,005
|
|
$
|
8,940
|
|
|
2020
|
$
|
1,831
|
|
$
|
3,005
|
|
$
|
4,836
|
|
|
2021
|
$
|
1,573
|
|
$
|
1,505
|
|
$
|
3,078
|
|
|
2022
|
$
|
1,497
|
|
$
|
2
|
|
$
|
1,499
|
|
|
1.
|
Assumes the option to extend a term loan facility related to the DCC Transaction will be exercised.
|
|
2.
|
Excludes unamortized debt step-up premium.
|
128
2017 Activity
In
2017
, Dow redeemed
$436 million
of
6.0 percent
notes that matured on September 15, 2017, and
$32 million
aggregate principal amount of International Notes ("InterNotes") at maturity. In addition, approximately
$119 million
of Dow's long-term debt was repaid by consolidated variable interest entities.
In connection with the Merger, the fair value of debt assumed was
$15,197 million
and was reflected in the preceding Notes Payable and Long-Term Debt tables. See Note
3
for additional information.
2016 Activity
In 2016, Dow redeemed
$349 million
of
2.5 percent
notes that matured on February 15, 2016, and
$52 million
principal amount of InterNotes at maturity. In addition, approximately
$128 million
of Dow's long-term debt (net of
$28 million
of additional borrowings) was repaid by consolidated variable interest entities.
As part of the DCC Transaction, the fair value of debt assumed by Dow was
$4,672 million
. See Note
3
for additional information.
2015 Activity
In the fourth quarter of 2015, Dow redeemed
$724 million
aggregate principal amount of InterNotes of various interest rates and maturities between 2016 and 2024. As a result of this redemption, Dow realized an
$8 million
pretax loss related to the early extinguishment of debt, included in "Sundry income (expense) - net" in the consolidated statements of income and related to Corporate.
On October 5, 2015, (i) Dow completed the transfer of its U.S. Gulf Coast Chlor-Alkali and Vinyl, Global Chlorinated Organics and Global Epoxy businesses into Splitco, (ii) participating Dow shareholders tendered, and Dow accepted, Dow shares for Splitco shares in a public exchange offer, and (iii) Splitco merged with a wholly owned subsidiary of Olin in a tax-efficient Reverse Morris Trust transaction. Under the terms of a debt exchange offer, Dow received
$1,220 million
principal amount of new debt instruments from Splitco, which were subsequently transferred to certain investment banks in a non-cash fair value exchange for
$1,154 million
principal amount of Dow's outstanding debt instruments owned by such investment banks. As a result of this debt exchange offer and related transactions, Dow retired
$1,161 million
of certain notes, including
$401 million
of
2.50 percent
notes due 2016,
$182 million
of
5.70 percent
notes due 2018,
$278 million
of
4.25 percent
notes due 2020 and a
$300 million
Term Loan Facility with a maturity date of 2016. Dow recognized a loss on the early extinguishment of debt of
$68 million
, included in "Sundry income (expense) - net" in the consolidated statements of income as a component of the pretax gain on the Transaction and related to Corporate. In connection with the Transaction, a membrane chlor-alkali joint venture was included as part of the assets and liabilities divested. This resulted in an additional reduction of
$569 million
principal amount of debt. See Notes
6
and
23
for further information.
In 2015, Dow issued
$346 million
aggregate principal amount of InterNotes and approximately
$163 million
of long-term debt (net of
$8 million
of additional borrowings) was repaid by consolidated variable interest entities.
129
Available Credit Facilities
The following table summarizes the Company's credit facilities:
|
Committed and Available Credit Facilities at Dec 31, 2017
|
||||||||||
|
In millions
|
Subsidiary
|
Effective Date
|
Committed Credit
|
Credit Available
|
Maturity Date
|
Interest
|
||||
|
Five Year Competitive Advance and Revolving Credit Facility
|
Dow
|
March 2015
|
$
|
5,000
|
|
$
|
5,000
|
|
March 2020
|
Floating Rate
|
|
Bilateral Revolving Credit Facility
|
Dow
|
August 2015
|
100
|
|
100
|
|
March 2018
|
Floating Rate
|
||
|
Bilateral Revolving Credit Facility
|
Dow
|
August 2015
|
100
|
|
100
|
|
March 2020
|
Floating Rate
|
||
|
Bilateral Revolving Credit Facility
|
Dow
|
August 2015
|
280
|
|
280
|
|
March 2020
|
Floating Rate
|
||
|
Bilateral Revolving Credit Facility
|
Dow
|
August 2015
|
100
|
|
100
|
|
March 2020
|
Floating Rate
|
||
|
Bilateral Revolving Credit Facility
|
Dow
|
August 2015
|
100
|
|
100
|
|
March 2020
|
Floating Rate
|
||
|
Bilateral Revolving Credit Facility
|
Dow
|
August 2015
|
200
|
|
200
|
|
March 2020
|
Floating Rate
|
||
|
Bilateral Revolving Credit Facility
|
Dow
|
May 2016
|
200
|
|
200
|
|
May 2018
|
Floating Rate
|
||
|
Bilateral Revolving Credit Facility
|
Dow
|
July 2016
|
200
|
|
200
|
|
July 2018
|
Floating Rate
|
||
|
Bilateral Revolving Credit Facility
|
Dow
|
August 2016
|
100
|
|
100
|
|
August 2018
|
Floating Rate
|
||
|
DCC Term Loan Facility
|
Dow
|
February 2016
|
4,500
|
|
—
|
|
December 2019
|
Floating Rate
|
||
|
Revolving Credit Facility
|
DuPont
|
March 2016
|
3,000
|
|
2,950
|
|
May 2019
|
Floating Rate
|
||
|
Term Loan Facility
|
DuPont
|
March 2016
|
4,500
|
|
3,000
|
|
March 2019
|
Floating Rate
|
||
|
Total Committed and Available Credit Facilities
|
$
|
18,380
|
|
$
|
12,330
|
|
||||
DCC Term Loan Facility
In connection with the DCC Transaction, on May 31, 2016, Dow Corning incurred
$4.5 billion
of indebtedness under a certain third party credit agreement ("DCC Term Loan Facility") in order to fund the contribution of cash to Splitco. Dow subsequently guaranteed the obligations of Dow Corning under the DCC Term Loan Facility and, as a result, the covenants and events of default applicable to the DCC Term Loan Facility are substantially similar to the covenants and events of default set forth in Dow's
Five
Year Competitive Advance and Revolving Credit Facility. In the second quarter of 2017, Dow Corning exercised a
364
-day extension option making amounts borrowed under the DCC Term Loan Facility repayable on May 29, 2018, and amended the DCC Term Loan Facility to include an additional
19
-month extension option, at Dow Corning’s election, upon satisfaction of certain customary conditions precedent. On February 8, 2018, Dow Corning delivered a notice of intent to exercise the 19-month extension option on the DCC Term Loan Facility. See Note
3
for additional information on the DCC Transaction.
Term Loan Facility
In March 2016, DuPont entered into a credit agreement that provides for a
three
-year, senior unsecured term loan facility in the aggregate principal amount of
$4.5 billion
("Term Loan Facility") under which DuPont may make up to
seven
term loan borrowings and amounts repaid or prepaid are not available for subsequent borrowings. The facility was amended in 2017 to extend the date on which the commitment to lend terminates to July 27, 2018. The proceeds from the borrowings under the Term Loan Facility will be used for Dupont's general corporate purposes including debt repayment, working capital and funding a portion of the Company's costs and expenses. The Term Loan Facility matures in March 2019 at which time all outstanding borrowings, including accrued but unpaid interest, become immediately due and payable. At
December 31, 2017
, DuPont had made three term loan borrowings in an aggregate principal amount of
$1.5 billion
and had unused commitments of
$3.0 billion
under the Term Loan Facility.
Uncommitted Credit Facilities and Outstanding Letters of Credit
The Subsidiaries had uncommitted credit facilities in the form of unused bank credit lines of
$2,853 million
for Dow and
$731 million
for DuPont at
December 31, 2017
. These lines can be used to support short-term liquidity needs and general corporate purposes, including letters of credit. Outstanding letters of credit were
$433 million
for Dow and
$177 million
for DuPont at
December 31, 2017
. These letters of credit support commitments made in the ordinary course of business.
Debt Covenants and Default Provisions
The Subsidiaries outstanding long-term debt obligations have been issued primarily under indentures which contain, among other provisions, certain customary restrictive covenants with which each of the Subsidiaries must comply while the underlying notes are outstanding. Failure of either Dow or DuPont to comply with any of its respective covenants, could result in a default under the applicable indenture and allow the note holders to accelerate the due date of the outstanding principal and accrued interest on the underlying notes.
130
Dow Debt Covenants and Default Provisions
Dow's indenture covenants include obligations to not allow liens on principal U.S. manufacturing facilities, enter into sale and lease-back transactions with respect to principal U.S. manufacturing facilities, merge or consolidate with any other corporation, or sell, lease or convey, directly or indirectly, all or substantially all of Dow's assets. The outstanding debt also contains customary default provisions.
Dow’s primary, private credit agreements also contain certain customary restrictive covenant and default provisions in addition to the covenants set forth above with respect to Dow's debt. Significant other restrictive covenants and default provisions related to these agreements include:
|
(a)
|
the obligation to maintain the ratio of Dow’s consolidated indebtedness to consolidated capitalization at no greater than
0.65
to
1.00
at any time the aggregate outstanding amount of loans under the
Five
Year Competitive Advance and Revolving Credit Facility Agreement dated March 24, 2015 equals or exceeds
$500 million
,
|
|
(b)
|
a default if Dow or an applicable subsidiary fails to make any payment, including principal, premium or interest, under the applicable agreement on other indebtedness of, or guaranteed by, Dow or such applicable subsidiary in an aggregate amount of
$100 million
or more when due, or any other default or other event under the applicable agreement with respect to such indebtedness occurs which permits or results in the acceleration of
$400 million
or more in the aggregate of principal, and
|
|
(c)
|
a default if Dow or any applicable subsidiary fails to discharge or stay within
60
days after the entry of a final judgment against Dow or such applicable subsidiary of more than
$400 million
.
|
Failure of Dow to comply with any of the covenants or default provisions could result in a default under the applicable credit agreement which would allow the lenders to not fund future loan requests and to accelerate the due date of the outstanding principal and accrued interest on any outstanding Dow indebtedness.
DuPont Debt Covenants and Default Provisions
DuPont's indenture covenants include customary limitations on liens, sale and leaseback transactions, and mergers and consolidations affecting manufacturing plants, mineral producing properties or research facilities located in the U.S. and the consolidated subsidiaries owning such plants, properties and facilities subject to certain limitations. The outstanding long-term debt also contains customary default provisions. In addition, in May 2017, DuPont issued
$1,250 million
of
2.20 percent
notes due 2020 and
$750 million
of floating rate notes due 2020 that must be redeemed upon the announcement of the record date for the separation of DuPont's agriculture line or specialty products line of business or the entry into an agreement to sell all or substantially all of the assets of either line of business to a third party.
The DuPont Term Loan Facility and the amended DuPont Revolving Credit Facility contain customary representations and warranties, affirmative and negative covenants, and events of default that are typical for companies with similar credit ratings and generally consistent with DuPont’s indenture covenants. The DuPont Term Loan Facility and the amended DuPont Revolving Credit Facility also contain a financial covenant requiring that the ratio of total indebtedness to total capitalization for DuPont and its consolidated subsidiaries not exceed
0.6667
to
1.00
.
The DuPont Term Loan Facility and the amended DuPont Revolving Credit Facility impose additional affirmative and negative covenants on DuPont and its subsidiaries after the closing of the Merger, subject to certain limitations, including to:
(a) not sell, lease or otherwise convey to DowDuPont, its shareholders or its non-DuPont subsidiaries, any assets or properties of DuPont or its subsidiaries unless the aggregate amount of revenues attributable to all such assets and properties so conveyed after the Merger does not exceed
30 percent
of the consolidated revenues of DuPont and its subsidiaries as of December 31, 2015, and
(b) not guarantee any indebtedness or other obligations of DowDuPont, Dow or their respective subsidiaries (other than of DuPont and its subsidiaries).
The DuPont Term Loan Facility and the amended DuPont Revolving Credit Facility will terminate, and the loans and other amounts thereunder will become due and payable, upon the sale, transfer, lease or other disposition of all or substantially all of the assets of DuPont's agriculture line of business to DowDuPont, its shareholders or any of its non-DuPont subsidiaries.
131
NOTE
16
- COMMITMENTS AND CONTINGENT LIABILITIES
Litigation
Asbestos-Related Matters of Union Carbide Corporation
Introduction
Union Carbide Corporation is and has been involved in a large number of asbestos-related suits filed primarily in state courts during the past four decades. These suits principally allege personal injury resulting from exposure to asbestos-containing products and frequently seek both actual and punitive damages. The alleged claims primarily relate to products that Union Carbide sold in the past, alleged exposure to asbestos-containing products located on Union Carbide’s premises, and Union Carbide’s responsibility for asbestos suits filed against a former Union Carbide subsidiary, Amchem Products, Inc. (“Amchem”). In many cases, plaintiffs are unable to demonstrate that they have suffered any compensable loss as a result of such exposure, or that injuries incurred in fact resulted from exposure to Union Carbide’s products.
Union Carbide expects more asbestos-related suits to be filed against Union Carbide and Amchem in the future, and will aggressively defend or reasonably resolve, as appropriate, both pending and future claims.
Estimating the Liability for Asbestos-Related Pending and Future Claims
Based on a study completed in January of 2003 by Ankura Consulting Group, LLC ("Ankura"), Union Carbide increased its December 31, 2002 asbestos-related liability for pending and future claims for a
15
-year period ending in 2017 to
$2.2 billion
, excluding future defense and processing costs. Since then, Union Carbide has compared current asbestos claim and resolution activity with the results of the most recent Ankura study at each balance sheet date to determine whether the accrual continues to be appropriate. In addition, Union Carbide has requested Ankura to review Union Carbide’s historical asbestos claim and resolution activity each year since 2004 to determine the appropriateness of updating the most recent Ankura study.
In October 2016, Union Carbide requested Ankura to review its historical asbestos claim and resolution activity and determine the appropriateness of updating its December 2014 study. In response to that request, Ankura reviewed and analyzed asbestos‑related claim and resolution data through September 30, 2016. The resulting study, completed by Ankura in December 2016, provided estimates for the undiscounted cost of disposing of pending and future claims against Union Carbide and Amchem, excluding future defense and processing costs, for both a
15
-year period and through the terminal year of 2049.
Based on the study completed in December 2016 by Ankura, and Union Carbide's own review of the asbestos claim and resolution activity, it was determined that an adjustment to the accrual was necessary. Union Carbide determined that using the estimate through the terminal year of 2049 was more appropriate due to increasing knowledge and data about the costs to resolve claims and diminished volatility in filing rates. Using the range in the Ankura December 2016 study, which was estimated to be between
$502 million
and
$565 million
for the undiscounted cost of disposing of pending and future claims, Union Carbide increased its asbestos-related liability for pending and future claims through the terminal year of 2049 by
$104 million
, included in "Asbestos‑related charge" in the consolidated statements of income. At December 31, 2016, Union Carbide's asbestos-related liability for pending and future claims was
$486 million
, and approximately
14 percent
of the recorded liability related to pending claims and approximately
86 percent
related to future claims.
Estimating the Asbestos-Related Liability for Defense and Processing Costs
In September 2014, Union Carbide began to implement a strategy designed to reduce and to ultimately stabilize and forecast defense costs associated with asbestos-related matters. The strategy included a number of important changes including: invoicing protocols including capturing costs by plaintiff; review of existing counsel roles, work processes and workflow; and the utilization of enterprise legal management software, which enabled claim-specific tracking of asbestos-related defense and processing costs. Union Carbide reviewed the information generated from this new strategy and determined that it now had the ability to reasonably estimate asbestos-related defense and processing costs for the same periods that it estimates its asbestos-related liability for pending and future claims. Union Carbide believes that including estimates of the liability for asbestos-related defense and processing costs provides a more complete assessment and measure of the liability associated with resolving asbestos-related matters, which Union Carbide and Dow believe is preferable in these circumstances.
In October 2016, in addition to the study for asbestos claim and resolution activity, Union Carbide requested Ankura to review asbestos-related defense and processing costs and provide an estimate of defense and processing costs associated with resolving pending and future asbestos-related claims facing Union Carbide and Amchem for the same periods of time that Union Carbide uses for estimating resolution costs. In December 2016, Ankura conducted the study and provided Union Carbide with an estimate of future defense and processing costs for both a
15
-year period and through the terminal year of 2049. The resulting study estimated asbestos-related defense and processing costs for pending and future asbestos claims to be between
$1,009 million
and
$1,081 million
through the terminal year of 2049.
132
In the fourth quarter of 2016, Union Carbide and Dow elected to change their method of accounting for asbestos-related defense and processing costs from expensing as incurred to estimating and accruing a liability. This change is believed to be preferable as asbestos-related defense and processing costs represent expenditures related to legacy activities that do not contribute to current or future revenue generating activities of Union Carbide or Dow. The change is also reflective of the manner in which Union Carbide manages its asbestos-related exposure, including careful monitoring of the correlation between defense spending and resolution costs. Together, these two sources of cost more accurately represent the “total cost” of resolving asbestos-related claims now and in the future.
This accounting policy change was reflected as a change in accounting estimate effected by a change in accounting principle. As a result of this accounting policy change and based on the December 2016 Ankura study of asbestos-related defense and processing costs and Union Carbide's own review of the data, Union Carbide recorded a pretax charge for asbestos-related defense and processing costs of
$1,009 million
in the fourth quarter of 2016, included in “Asbestos-related charge” in the consolidated statements of income. Union Carbide’s total asbestos-related liability, including defense and processing costs, was
$1,490 million
at December 31, 2016, and was included in “Accrued and other current liabilities” and “Asbestos-related liabilities - noncurrent” in the consolidated balance sheets.
Asbestos-Related Liability at December 31, 2017
In October 2017, Union Carbide requested Ankura to review its historical asbestos claim and resolution activity (including asbestos‑related defense and processing costs) and determine the appropriateness of updating its December 2016 study. In response to that request, Ankura reviewed and analyzed data through September 30, 2017. In December 2017, Ankura stated that an update of its December 2016 study would not provide a more likely estimate of future events than the estimate reflected in the study and, therefore, the estimate in that study remained applicable. Based on Union Carbide's own review of the asbestos claim and resolution activity (including asbestos-related defense and processing costs) and Ankura's response, Union Carbide determined that no change to the accrual was required. At December 31, 2017, the asbestos-related liability for pending and future claims against Union Carbide and Amchem, including future asbestos-related defense and processing costs, was
$1,369 million
, and approximately
16
percent of the recorded liability related to pending claims and approximately
84 percent
related to future claims.
Summary
The Company’s management believes the amounts recorded by Union Carbide for the asbestos-related liability (including defense and processing costs) reflect reasonable and probable estimates of the liability based upon current, known facts. However, future events, such as the number of new claims to be filed and/or received each year and the average cost of defending and disposing of each such claim, as well as the numerous uncertainties surrounding asbestos litigation in the United States over a significant period of time, could cause the actual costs for Union Carbide to be higher or lower than those projected or those recorded. Any such events could result in an increase or decrease in the recorded liability.
Because of the uncertainties described above, Union Carbide cannot estimate the full range of the cost of resolving pending and future asbestos-related claims facing Union Carbide and Amchem. As a result, it is reasonably possible that an additional cost of disposing of Union Carbide's asbestos-related claims, including future defense and processing costs, could have a material impact on the Company's results of operations and cash flows for a particular period and on the consolidated financial position.
Urethane Matters
Class Action Lawsuit
On February 16, 2006, Dow, among others, received a subpoena from the DOJ as part of a previously announced antitrust investigation of manufacturers of polyurethane chemicals, including methylene diphenyl diisocyanate, toluene diisocyanate, polyether polyols and system house products. Dow cooperated with the DOJ and, following an extensive investigation, on December 10, 2007, Dow received notice from the DOJ that it had closed its investigation of potential antitrust violations involving these products without indictments or pleas.
In 2005, Dow, among others, was named as a defendant in multiple civil class action lawsuits alleging a conspiracy to fix the price of various urethane chemical products, namely the products that were the subject of the above described DOJ antitrust investigation. On July 29, 2008, a Kansas City federal district court (the "district court") certified a class of purchasers of the products for the
six
-year period from 1999 through 2004 ("plaintiff class"). In January 2013, the class action lawsuit went to trial with Dow as the sole remaining defendant, the other defendants having previously settled. On February 20, 2013, the federal jury returned a damages verdict of approximately
$400 million
against Dow, which ultimately was trebled under applicable antitrust laws, less offsets from other settling defendants, resulting in a judgment entered in July 2013 in the amount of
$1.06 billion
. Dow appealed this judgment to the U.S. Tenth Circuit Court of Appeals ("Court of Appeals"), and on September 29, 2014, the Court of Appeals issued an opinion affirming the district court judgment.
133
On March 9, 2015, Dow filed a petition for
writ of certiorari
("Writ Petition") with the United Sates Supreme Court, seeking judicial review and requesting that it correct fundamental errors in the Court of Appeals decision. In the first quarter of 2016, Dow changed its risk assessment on this matter as a result of growing political uncertainties due to events within the Supreme Court, including Justice Scalia's death, and the increased likelihood for unfavorable outcomes for businesses involved in class action lawsuits. On February 26, 2016, Dow announced a proposed settlement under which it would pay the plaintiff class
$835 million
, which included damages, class attorney fees and post-judgment interest. On May 11, 2016, Dow moved the
$835 million
settlement amount into an escrow account. On July 29, 2016, the U.S. District Court for the District of Kansas granted final approval of the settlement and the funds were released from escrow on August 30, 2016. The settlement resolves the
$1.06 billion
judgment and any subsequent claim for attorneys' fees, costs and post-judgment interest against Dow. As a result, in the first quarter of 2016, Dow recorded a loss of
$835 million
, included in "Sundry income (expense) - net" in the consolidated statements of income and related to the Industrial Intermediates & Infrastructure segment. Dow continues to believe that it was not part of any conspiracy and the judgment was fundamentally flawed as a matter of class action law. The case is now concluded.
Opt-Out Cases
Shortly after the July 2008 class certification ruling, a series of "opt-out" cases were filed by a number of large volume purchasers who elected not to be class members in the district court case. These opt-out cases were substantively identical to the class action lawsuit, but expanded the period of time to include 1994 through 1998. A consolidated jury trial of the opt-out cases began on March 8, 2016. Prior to a jury verdict, on April 5, 2016, Dow entered into a binding settlement for the opt-out cases under which Dow would pay the named plaintiffs
$400 million
, inclusive of damages and attorney fees. Payment of this settlement occurred on May 4, 2016. Dow changed its risk assessment on this matter as a result of the class settlement and the uncertainty of a jury trial outcome along with the automatic trebling of an adverse verdict. As a result, Dow recorded a loss of
$400 million
in the first quarter of 2016, included in "Sundry income (expense) - net" in the consolidated statements of income and related to the Industrial Intermediates & Infrastructure segment. As with the class action case, Dow continues to deny allegations of price fixing and maintains that it was not part of any conspiracy. The case is now concluded.
Bayer CropScience v. Dow AgroSciences ICC Arbitration
On August 13, 2012, Bayer CropScience AG and Bayer CropScience NV (together, “Bayer”) filed a request for arbitration with the International Chamber of Commerce ("ICC") International Court of Arbitration against Dow AgroSciences LLC, a wholly owned subsidiary of Dow, and other subsidiaries of Dow (collectively, “DAS”) under a 1992 license agreement executed by predecessors of the parties (the “License Agreement”). In its request for arbitration, Bayer alleged that (i) DAS breached the License Agreement, (ii) the License Agreement was properly terminated with no ongoing rights to DAS, (iii) DAS has infringed and continues to infringe its patent rights related to the use of the pat gene in certain soybean and cotton seed products, and (iv) Bayer is entitled to monetary damages and injunctive relief. DAS denied that it breached the License Agreement and asserted that the License Agreement remained in effect because it was not properly terminated. DAS also asserted that all of Bayer’s patents at issue are invalid and/or not infringed, and, therefore, for these reasons (and others), a license was not required. During the pendency of the arbitration proceeding, DAS filed
six
re-examination petitions with the United States Patent & Trademark Office (“USPTO”) against the Bayer patents, asserting that each patent is invalid based on the doctrine against double-patenting and/or prior art. The USPTO granted all
six
petitions, and, on February 26, 2015, the USPTO issued an office action rejecting the patentability of the sole Bayer patent claim in the only asserted Bayer patent that has not expired and that forms the basis for the vast majority of the damages in the arbitral award discussed below.
A
three
-member arbitration tribunal presided over the arbitration proceeding (the “tribunal”). In a decision dated October 9, 2015, the tribunal determined that (i) DAS breached the License Agreement, (ii) Bayer properly terminated the License Agreement, (iii) all of the patents remaining in the proceeding are valid and infringed, and (iv) that Bayer is entitled to monetary damages in the amount of
$455 million
inclusive of pre-judgment interest and costs (the “arbitral award”). One of the arbitrators, however, issued a partial dissent finding that all of the patents are invalid based on the double-patenting doctrine. The tribunal also denied Bayer’s request for injunctive relief.
On October 16, 2015, Bayer filed a motion in U.S. District Court for the Eastern District of Virginia ("Federal District Court") seeking to confirm the arbitral award. DAS opposed the motion and filed separate motions to vacate the award, or in the alternative, to stay enforcement of the award until the USPTO issues final office actions with respect to the re-examination proceedings. On January 15, 2016, the Federal District Court denied DAS's motions and confirmed the award. DAS appealed the Federal District Court's decision. On March 1, 2017, the U.S. Court of Appeals for the Federal Circuit ("Federal Circuit") affirmed the arbitral award. As a result of this action, in the first quarter of 2017, DAS recorded a loss of
$469 million
, inclusive of the arbitral award and post-judgment interest, which was included in "Sundry income (expense) - net" in the consolidated statements of income and related to the Agriculture segment. On May 19, 2017, the Federal Circuit issued a mandate denying DAS's request to stay the arbitral award pending judicial review by the United States Supreme Court. On May 26, 2017, DAS paid the
$469 million
arbitral award to Bayer as a result of that decision. On September 11, 2017, DAS filed a petition for
writ of certiorari
with the United States Supreme Court to review the case, but the Court denied DAS’s petition.
134
The litigation is now concluded with no risk of further liability. Dow continues to believe that the arbitral award is fundamentally flawed because, among other things, it allowed for the enforcement of invalid patents. The arbitral award and subsequent related judicial decisions will not impact DAS’s commercialization of its soybean and cotton seed products, including those containing the ENLIST™ technologies.
Rocky Flats Matter
Dow and Rockwell International Corporation ("Rockwell") (collectively, the "defendants") were defendants in a class action lawsuit filed in 1990 on behalf of property owners ("plaintiffs") in Rocky Flats, Colorado, who asserted claims for nuisance and trespass based on alleged property damage caused by plutonium releases from a nuclear weapons facility owned by the U.S. Department of Energy ("DOE") (the "facility"). Dow and Rockwell were both DOE contractors that operated the facility - Dow from 1952 to 1975 and Rockwell from 1975 to 1989. The facility was permanently shut down in 1989.
In 1993, the United States District Court for the District of Colorado ("District Court") certified the class of property owners. The plaintiffs tried their case as a public liability action under the Price Anderson Act ("PAA"). In 2005, the jury returned a damages verdict of
$926 million
. Dow and Rockwell appealed the jury award to the U.S. Tenth Circuit Court of Appeals ("Court of Appeals") which concluded the PAA had its own injury requirements, on which the jury had not been instructed, and also vacated the District Court's class certification ruling, reversed and remanded the case, and vacated the District Court's judgment. The plaintiffs argued on remand to the District Court that they were entitled to reinstate the judgment as a state law nuisance claim, independent of the PAA. The District Court rejected that argument and entered judgment in favor of the defendants. The plaintiffs appealed to the Court of Appeals, which reversed the District Court's ruling, holding that the PAA did not preempt the plaintiffs' nuisance claim under Colorado law and that the plaintiffs could seek reinstatement of the prior nuisance verdict under Colorado law.
Dow and Rockwell continued to litigate this matter in the District Court and in the United States Supreme Court following the appellate court decision. On May 18, 2016, Dow, Rockwell and the plaintiffs entered into a settlement agreement for
$375 million
, of which
$131 million
was paid by Dow. The DOE authorized the settlement pursuant to the PAA and the nuclear hazards indemnity provisions contained in Dow's and Rockwell's contracts. The District Court granted preliminary approval to the class settlement on August 5, 2016. On April 28, 2017, the District Court conducted a fairness hearing and granted final judgment approving the class settlement and dismissed class claims against the defendants ("final judgment order").
On December 13, 2016, the United States Civil Board of Contract Appeals unanimously ordered the United States government to pay the amounts stipulated in the Settlement Agreement. On January 17, 2017, Dow received a full indemnity payment of
$131 million
from the United States government for Dow's share of the class settlement. On January 26, 2017, Dow placed
$130 million
in an escrow account for the settlement payment owed to the plaintiffs. The funds were subsequently released from escrow as a result of the final judgment order. At
December 31, 2017
, there are
no
outstanding balances in the consolidated balance sheets related to this matter (
$131 million
included in "Accounts and notes receivable - Other" and
$130 million
included in "Accrued and other current liabilities" at
December 31, 2016
). The litigation is now concluded.
Dow Corning Chapter 11 Related Matters
Introduction
In 1995, Dow Corning, then a
50
:50 joint venture between Dow and Corning, voluntarily filed for protection under Chapter 11 of the U.S. Bankruptcy Code in order to resolve Dow Corning’s breast implant liabilities and related matters (the “Chapter 11 Proceeding”). Dow Corning emerged from the Chapter 11 Proceeding on June 1, 2004 (the “Effective Date”) and is implementing the Joint Plan of Reorganization (the “Plan”). The Plan provides funding for the resolution of breast implant and other product liability litigation covered by the Chapter 11 Proceeding and provides a process for the satisfaction of commercial creditor claims in the Chapter 11 Proceeding. As of June 1, 2016, Dow Corning is a wholly owned subsidiary of Dow.
Breast Implant and Other Product Liability Claims
Under the Plan, a product liability settlement program administered by an independent claims office (the “Settlement Facility”) was created to resolve breast implant and other product liability claims. Product liability claimants rejecting the settlement program in favor of pursuing litigation must bring suit against a litigation facility (the “Litigation Facility”). Under the Plan, total payments committed by Dow Corning to resolving product liability claims are capped at a maximum
$2,350 million
net present value (“NPV”) determined as of the Effective Date using a discount rate of
seven percent
(approximately
$3,746 million
undiscounted at
December 31, 2017
). Of this amount, no more than
$400 million
NPV determined as of the Effective Date can be used to fund the Litigation Facility.
Dow Corning has an obligation to fund the Settlement Facility and the Litigation Facility over a
16
-year period, commencing at the Effective Date. At
December 31, 2017
, Dow Corning and its insurers have made life-to-date payments of
$1,762 million
to the Settlement Facility and the Settlement Facility reported an unexpended balance of
$135 million
.
135
On June 1, 2016, as part of the ownership restructure of Dow Corning and in accordance with ASC 450 "Accounting for Contingencies," Dow recorded a liability of
$290 million
for breast implant and other product liability claims (“Implant Liability”), which reflected the estimated impact of the settlement of future claims primarily based on reported claim filing levels in the Revised Settlement Program (the “RSP”) and on the resolution of almost all cases pending against the Litigation Facility. The RSP was a program sponsored by certain other breast implant manufacturers in the context of multi-district, coordinated federal breast implant cases and was open from 1995 through 2010. The RSP was also a revised successor to an earlier settlement plan involving Dow Corning (prior to its bankruptcy filing). While Dow Corning withdrew from the RSP, many of the benefit categories and payment levels in Dow Corning’s settlement program were drawn from the RSP. Based on the comparability in design and actual claim experience of both plans, management concluded that claim information from the RSP provides a reasonable basis to estimate future claim filing levels for the Settlement Facility.
In the fourth quarter of 2016, with the assistance of a third party consultant ("consultant"), Dow Corning updated its estimate of its Implant Liability to
$263 million
, primarily reflecting a decrease in Class 7 costs (claimants who have breast implants made by certain other manufacturers using primarily Dow Corning silicone gel), a decrease resulting from the passage of time, decreased claim filing activity and administrative costs compared with the previous estimate, and an increase in investment income resulting from insurance proceeds. Based on the consultant's updated estimate and Dow Corning's own review of claim filing activity, Dow Corning determined that an adjustment to the Implant Liability was required. Accordingly, Dow Corning decreased its Implant Liability in the fourth quarter of 2016 by
$27 million
, which was included in "Sundry income (expense) - net" in the consolidated statements of income. At
December 31, 2017
, the Implant Liability was
$263 million
(
$263 million
at
December 31, 2016
) and included in "Other noncurrent obligations" in the consolidated balance sheets.
Dow Corning is not aware of circumstances that would change the factors used in estimating the Implant Liability and believes the recorded liability reflects the best estimate of the remaining funding obligations under the Plan; however, the estimate relies upon a number of significant assumptions, including: future claim filing levels in the Settlement Facility will be similar to those in the revised settlement program, which management uses to estimate future claim filing levels for the Settlement Facility; future acceptance rates, disease mix, and payment values will be materially consistent with historical experience; no material negative outcomes in future controversies or disputes over Plan interpretation will occur; and the Plan will not be modified. If actual outcomes related to any of these assumptions prove to be materially different, the future liability to fund the Plan may be materially different than the amount estimated. If Dow Corning was ultimately required to fund the full liability up to the maximum capped value, the liability would be
$1,985 million
at
December 31, 2017
.
Commercial Creditor Issues
The Plan provides that each of Dow Corning’s commercial creditors (the “Commercial Creditors”) would receive in cash the sum of (a) an amount equal to the principal amount of their claims and (b) interest on such claims. The actual amount of interest that will ultimately be paid to these Commercial Creditors is uncertain due to pending litigation between Dow Corning and the Commercial Creditors regarding the appropriate interest rates to be applied to outstanding obligations from the 1995 bankruptcy filing date through the Effective Date, as well as the presence of any recoverable fees, costs, and expenses. Upon the Plan becoming effective, Dow Corning paid approximately
$1,500 million
to the Commercial Creditors, representing principal and an amount of interest that Dow Corning considers undisputed.
In 2006, the U.S. Court of Appeals for the Sixth Circuit concluded that there is a general presumption that contractually specified default interest should be paid by a solvent debtor to unsecured creditors (the “Interest Rate Presumption”) and permitting Dow Corning’s Commercial Creditors to recover fees, costs, and expenses where allowed by relevant loan agreements. The matter was remanded to the U.S. District Court for the Eastern District of Michigan ("District Court") for further proceedings, including rulings on the facts surrounding specific claims and consideration of any equitable factors that would preclude the application of the Interest Rate Presumption. On May 10, 2017, the District Court entered a stipulated order resolving pending discovery motions and established a discovery schedule for the Commercial Creditors matter. As a result, Dow Corning and its third party consultants conducted further analysis of the Commercial Creditors claims and defenses. This analysis indicated the estimated remaining liability to Commercial Creditors to be within a range of
$77 million
to
$260 million
. No single amount within the range appears to be a better estimate than any other amount within the range. Therefore, Dow Corning recorded the minimum liability within the range, which resulted in a decrease to the Commercial Creditor liability of
$33 million
in the second quarter of 2017, which was included in "Sundry income (expense) - net" in the consolidated statements of income. At
December 31, 2017
, the liability related to Dow Corning’s potential obligation to pay additional interest to its Commercial Creditors in the Chapter 11 Proceeding was
$78 million
(
$108 million
at
December 31, 2016
) and included in "Accrued and other current liabilities" in the consolidated balance sheets. The actual amount of interest that will be paid to these creditors is uncertain and will ultimately be resolved through continued proceedings in the District Court.
136
Indemnifications
In connection with the June 1, 2016 ownership restructure of Dow Corning, Dow is indemnified by Corning for
50 percent
of future losses associated with certain pre-closing liabilities, including the Implant Liability and Commercial Creditors matters described above, subject to certain conditions and limits. The maximum amount of indemnified losses which may be recovered are subject to a cap that declines over time. Indemnified losses are capped at (1)
$1.5 billion
until May 31, 2018, (2)
$1 billion
between May 31, 2018 and May 31, 2023, and (3)
no
recoveries are permitted after May 31, 2023.
No
indemnification assets were recorded at
December 31, 2017
or
2016
.
Summary
The amounts recorded by Dow Corning for the Chapter 11 related matters described above were based upon current, known facts, which management believes reflect reasonable and probable estimates of the liability. However, future events could cause the actual costs for Dow Corning to be higher or lower than those projected or those recorded. Any such events could result in an increase or decrease in the recorded liability.
Separation of DuPont's Performance Chemicals Segment
On July 1, 2015, DuPont completed the separation of its Performance Chemicals segment through the spin-off of all of the issued and outstanding stock of The Chemours Company (the "Separation"). In connection with the Separation, DuPont and The Chemours Company (“Chemours”) entered into a Separation agreement (the "Separation Agreement"). Pursuant to the Separation Agreement and the amendment to the Separation Agreement, Chemours indemnifies DuPont against certain litigation, environmental, workers' compensation and other liabilities that arose prior to the Separation. The term of this indemnification is indefinite and includes defense costs and expenses, as well as settlements and judgments. In connection with the recognition of liabilities related to these matters, DuPont records an indemnification asset when recovery is deemed probable. At December 31, 2017, the indemnified assets were
$80 million
included in "Accounts and notes receivable - Other" and
$340 million
included in "Noncurrent receivables" along with the corresponding liabilities of
$80 million
recorded in "Accrued and other current liabilities" and
$340 million
included in "Other noncurrent obligations" in the consolidated balance sheets.
PFOA
DuPont used PFOA (collectively, perfluorooctanoic acids and its salts, including the ammonium salt), as a processing aid to manufacture some fluoropolymer resins at various sites around the world including its Washington Works' plant in West Virginia. Pursuant to the Separation Agreement discussed above, DuPont is indemnified by Chemours for the PFOA matters discussed below and has recorded a total indemnification asset of
$15 million
.
U.S. Environmental Protection Agency (“EPA") and New Jersey department of Environmental Protection (“NJDEP”)
DuPont is obligated under agreements with the EPA, including a 2009 consent decree to which Chemours was added in 2017, and has made voluntary commitments to the NJDEP. These obligations and voluntary commitments include surveying, sampling and testing drinking water in and around certain DuPont sites and offering treatment or an alternative supply of drinking water if tests indicate the presence of PFOA in drinking water at or greater than the national health advisory level established from time to time by the EPA. At December 31, 2017, DuPont had an accrual of
$15 million
related to these obligations and voluntary commitments. DuPont recorded an indemnification asset corresponding to the accrual balance at December 31, 2017.
Leach v. DuPont
In August 2001, a class action, captioned Leach v. DuPont, was filed in West Virginia state court alleging that residents living near the Washington Works facility had suffered, or may suffer, deleterious health effects from exposure to PFOA in drinking water. A settlement was reached in 2004 that binds approximately
80,000
residents, (the "Leach Settlement"). In addition to paying
$23 million
to plaintiff’s attorneys for fees and expenses and
$70 million
to fund a community health project, DuPont is obligated to fund up to
$235 million
for a medical monitoring program for eligible class members and to pay administrative costs and fees associated with the program. In January 2012, DuPont put
$1 million
into an escrow account to fund medical monitoring as required by the settlement agreement. As of
December 31, 2017
, less than
$1 million
has been disbursed from the account. DuPont also must continue to provide water treatment designed to reduce the level of PFOA in water to
six
area water districts, including the Little Hocking Water Association, and private well users. While it is probable that DuPont will incur liabilities related to funding the medical monitoring program and providing water treatment, DuPont does not expect any such liabilities to be material.
Under the Leach Settlement, DuPont funded a series of health studies which were completed in October 2012 by an independent science panel of experts (the "C8 Science Panel"). The C8 Science Panel found probable links, as defined in the Leach Settlement, between exposure to PFOA and pregnancy-induced hypertension, including preeclampsia; kidney cancer; testicular cancer; thyroid disease; ulcerative colitis; and diagnosed high cholesterol.
137
Multi-District Litigation
Leach class members may pursue personal injury claims against DuPont only for the
six
human diseases for which the C8 Science Panel determined a probable link exists. Following the Leach Settlement, approximately
3,550
lawsuits alleging personal injury claims were filed in various federal and state courts in Ohio and West Virginia. These lawsuits are consolidated in multi-district litigation ("MDL") in the U.S. District Court for the Southern District of Ohio.
In the first quarter of 2017, the MDL was settled for
$671 million
in cash (the "MDL Settlement"), half of which was to be paid by Chemours and half paid by DuPont. At December 31, 2017, all payments under the settlement agreement have been made by both companies. DuPont’s payment is not subject to indemnification or reimbursement by Chemours. In exchange for that payment, DuPont and Chemours receive releases of all claims by the settling plaintiffs. The MDL Settlement was entered into solely by way of compromise and settlement and is not in any way an admission of liability or fault by DuPont or Chemours. All of the MDL plaintiffs participated and resolved their claims within the MDL Settlement.
New Items
At December 31, 2017,
five
lawsuits had been filed against DuPont in West Virginia and
four
in Ohio alleging personal injury from exposure to PFOA in drinking water.
In addition,
three
lawsuits are pending in federal court in New York on behalf of
five
individuals who are residents of Hoosick Falls, New York. The plaintiffs claim personal injuries, including kidney cancer, thyroid disease and ulcerative colitis, from alleged exposure to PFOA discharged into the air and water from nearby manufacturing facilities owned and operated by defendant third parties. Plaintiffs claim that PFOA used at the facilities was purchased from or manufactured by DuPont and co-defendant, 3M Company. An action is pending in Alabama state court filed by a municipal water utility. The plaintiff alleges contamination from wastewater from defendant carpet manufacturers’ operations using perfluorinated chemicals and compounds, including PFOA, (“PFCs”). Plaintiff alleges that the PFCs used in defendant manufacturers’ operations were supplied by DuPont and co-defendant, 3M Company.
While it is reasonably possible that DuPont could incur liabilities related to these actions, it does not expect any such liabilities would be material. Chemours is defending and indemnifying DuPont in these matters in accordance with the amendment to the Separation Agreement discussed below.
Amendment to Separation Agreement
Concurrent with the MDL Settlement, DuPont and Chemours amended the Separation Agreement to provide for a limited sharing of potential future PFOA liabilities (i.e., indemnifiable losses, as defined in the Separation Agreement) for a period of
five
years beginning July 6, 2017. During that
five
-year period, Chemours will annually pay future PFOA liabilities up to
$25 million
and, if such amount is exceeded, DuPont would pay any excess amount up to the next
$25 million
(which payment will not be subject to indemnification by Chemours), with Chemours annually bearing any further excess liabilities. After the
five
-year period, this limited sharing agreement will expire, and Chemours’ indemnification obligations under the Separation Agreement would continue unchanged. There have been
no
charges incurred by DuPont under this arrangement through December 31, 2017. Chemours has also agreed that it will not contest its liability to DuPont under the Separation Agreement for PFOA liabilities on the basis of ostensible defenses generally applicable to the indemnification provisions under the Separation Agreement, including defenses relating to punitive damages, fines or penalties or attorneys’ fees, and waives any such defenses with respect to PFOA liabilities. Chemours has, however, retained defenses as to whether any particular PFOA claim is within the scope of the indemnification provisions of the Separation Agreement.
It is possible that new lawsuits could be filed against DuPont related to PFOA that may not be within the scope of the MDL Settlement. Any such new litigation would be subject to indemnification by Chemours under the Separation Agreement, as amended.
Fayetteville Works Facility, North Carolina
Prior to the separation of Chemours, DuPont introduced GenX as a polymerization processing aid and a replacement for PFOA at the Fayetteville Works facility. The facility is now owned and operated by Chemours which continues to manufacture and use GenX. Chemours is responding to ongoing inquiries and investigations from federal, state and local investigators, regulators and other governmental authorities as well as inquiries from the media and local community stakeholders. These inquiries and investigations involve the discharge of GenX and certain similar compounds from the Chemours’ facility at Fayetteville Works into the Cape Fear River in Bladen County, North Carolina.
In August 2017, the U.S. Attorney’s Office for the Eastern District of North Carolina served DuPont with a subpoena for testimony and the production of documents to a grand jury. In the fourth quarter 2017, DuPont was served with additional subpoenas relating to the same issue. The subpoenas seek documents and testimony related to alleged discharges of PFOA and/or GenX, from the Fayetteville Works facility into the Cape Fear River. It is possible that these ongoing inquiries and investigations, including the
138
grand jury subpoena, could result in penalties or sanctions, or that additional litigation will be instituted against Chemours and/or DuPont.
At December 31, 2017, several actions, filed on behalf of putative classes of property owners and residents in areas near or who draw drinking water from the Cape Fear River, are pending in federal court against Chemours, DuPont and one also names DowDuPont. These actions relate to the alleged discharge of certain perflourinated chemicals into the river from the operations and wastewater treatment at the Fayetteville Works facility. The
three
purported class actions, filed in the fourth quarter 2017 and now consolidated into a single purported class action, seek various relief including medical monitoring, property damages and injunctive relief. Separate actions pending at December 31, 2017 were filed by the Cape Fear Public Utility Authority and Brunswick County, NC seeking actual and punitive damages as well as injunctive relief. These actions have since been consolidated and
two
additional North Carolina water authorities have joined the action. Management believes the probability of loss with respect to these actions is remote.
DuPont has an indemnification claim against Chemours with respect to current and future inquiries and claims, including lawsuits, related to the foregoing. At December 31, 2017, Chemours is defending and indemnifying DuPont in the pending civil actions.
Other Litigation Matters
In addition to the specific matters described above, Dow and DuPont are parties to a number of other claims and lawsuits arising out of the normal course of business with respect to product liability, patent infringement, governmental regulation, contract and commercial litigation, and other actions. Certain of these actions purport to be class actions and seek damages in very large amounts. All such claims are being contested. Dow and DuPont have active risk management programs consisting of numerous insurance policies secured from many carriers at various times. These policies may provide coverage that could be utilized to minimize the financial impact, if any, of certain contingencies described above. It is the opinion of the Company’s management that the possibility is remote that the aggregate of all such other claims and lawsuits will have a material adverse impact on the results of operations, financial condition and cash flows of the Company.
Gain Contingency - Dow v. Nova Chemicals Corporation Patent Infringement Matter
On December 9, 2010, Dow filed suit in the Federal Court in Ontario, Canada ("Federal Court") alleging that Nova Chemicals Corporation ("Nova") was infringing Dow's Canadian polyethylene patent 2,106,705 (the "'705 Patent"). Nova counterclaimed on the grounds of invalidity and non-infringement. In accordance with Canadian practice, the suit was bifurcated into a merits phase, followed by a damages phase. Following trial in the merits phase, in May 2014 the Federal Court ruled that Dow's '705 Patent was valid and infringed by Nova. Nova appealed to the Canadian Federal Court of Appeal, which affirmed the Federal Court decision in August 2016. Nova then sought leave to appeal its loss to the Supreme Court of Canada, which dismissed Nova’s petition in April 2017. As a result, Nova has exhausted all appeal rights on the merits, and it is undisputed that Nova owes Dow the profits it earned from its infringing sales as determined in the trial for the damages phase.
On April 19, 2017, the Federal Court issued a Public Judgment in the damages phase, which detailed its conclusions on how to calculate the profits to be awarded to Dow. Dow and Nova submitted their respective calculations of the damages to the Federal Court in May 2017. On June 29, 2017, the Federal Court issued a Confidential Supplemental Judgment, concluding that Nova must pay
$645 million
Canadian dollars (equivalent to
$495 million
U.S. dollars) to Dow, plus pre- and post-judgment interest, for which Dow received payment of
$501 million
from Nova on July 6, 2017. Although Nova is appealing portions of the damages judgment, certain portions of it are indisputable and will be owed to Dow regardless of the outcome of any further appeals by Nova. As a result of these actions and in accordance with ASC 450-30 "Gain Contingencies
,"
Dow recorded a
$160 million
pretax gain in the second quarter of 2017, related to the Packaging & Specialty Plastics segment, of which
$137 million
is included in "Sundry income (expense) - net" and
$23 million
is included in "Selling, general and administrative expenses" in the consolidated statements of income. At
December 31, 2017
, Dow had
$341 million
included in "Other noncurrent obligations" related to the disputed portion of the damages judgment. Dow is confident of its chances of defending the entire judgment on appeal, particularly the trial court's determinations on important factual issues, which will be accorded deferential review on appeal.
139
Guarantees
The following table provides a summary of the final expiration, maximum future payments and recorded liability reflected in the consolidated balance sheets for each type of guarantee:
|
Guarantees
|
Dec 31, 2017
|
Dec 31, 2016
|
|||||||||||||
|
In millions
|
Final Expiration
|
Maximum Future Payments
|
Recorded Liability
|
Final Expiration
|
Maximum Future Payments
|
Recorded Liability
|
|||||||||
|
Dow guarantees
|
2023
|
$
|
4,774
|
|
$
|
49
|
|
2021
|
$
|
5,096
|
|
$
|
86
|
|
|
|
Dow residual value guarantees
|
2027
|
889
|
|
135
|
|
2027
|
947
|
|
134
|
|
|||||
|
Total Dow guarantees
|
|
$
|
5,663
|
|
$
|
184
|
|
|
$
|
6,043
|
|
$
|
220
|
|
|
|
DuPont guarantees
|
2022
|
$
|
260
|
|
$
|
—
|
|
||||||||
|
DuPont residual value guarantees
|
2029
|
37
|
|
—
|
|
||||||||||
|
Total DuPont guarantees
|
|
$
|
297
|
|
$
|
—
|
|
||||||||
|
Total guarantees
|
|
$
|
5,960
|
|
$
|
184
|
|
|
$
|
6,043
|
|
$
|
220
|
|
|
Guarantees
The Subsidiaries have entered into guarantee agreements arising during the ordinary course of business from relationships with customers and nonconsolidated affiliates when the Subsidiaries undertake an obligation to guarantee the performance of others (via delivery of cash or other assets) if specified triggering events occur. With guarantees, such as commercial or financial contracts, non-performance by the guaranteed party triggers the obligation of the Subsidiaries to make payments to the beneficiary of the guarantee. The majority of these guarantees relate to debt of nonconsolidated affiliates, which have expiration dates ranging from less than
one
year to
six
years, and trade financing transactions in Latin America, which typically expire within
one
year of inception. The Subsidiaries' current expectation is that future payment or performance related to the non-performance of others is considered remote.
Dow entered into guarantee agreements (“Guarantees”) related to project financing for Sadara. The total of an Islamic bond and additional project financing (collectively “Total Project Financing”) obtained by Sadara is approximately
$12.5 billion
. Sadara had
$12.4 billion
of Total Project Financing outstanding at
December 31, 2017
(
$12.4 billion
at
December 31, 2016
). Dow's guarantee of the Total Project Financing is in proportion to Dow's
35 percent
ownership interest in Sadara, or up to approximately
$4.4 billion
when the project financing is fully drawn. The Guarantees will be released upon completion of construction of the Sadara complex and satisfactory fulfillment of certain other conditions, including passage of an extensive operational testing program, which is currently anticipated by the end of 2018 and must occur no later than December 2020.
Residual Value Guarantees
The Subsidiaries provide guarantees related to leased assets specifying the residual value that will be available to the lessor at lease termination through sale of the assets to the lessee or third parties.
Operating Leases
Dow and DuPont routinely lease premises for use as sales and administrative offices, warehouses and tanks for product storage, motor vehicles, railcars, computers, office machines and equipment. In addition, Dow and DuPont lease aircraft in the United States. The terms for these leased assets vary depending on the lease agreement. Some leases contain renewal provisions, purchase options and escalation clauses.
140
Rental expense under operating leases, net of sublease rental income, was
$862 million
in
2017
,
$661 million
in
2016
and
$600 million
in
2015
. Future minimum payments under leases with remaining non-cancelable terms in excess of one year are as follows:
|
Minimum Lease Commitments
|
Dec 31, 2017
|
||||||||
|
In millions
|
Dow
|
DuPont
|
Total
|
||||||
|
2018
|
$
|
350
|
|
$
|
264
|
|
$
|
614
|
|
|
2019
|
304
|
|
190
|
|
494
|
|
|||
|
2020
|
272
|
|
137
|
|
409
|
|
|||
|
2021
|
237
|
|
104
|
|
341
|
|
|||
|
2022
|
208
|
|
81
|
|
289
|
|
|||
|
2023 and thereafter
|
918
|
|
268
|
|
1,186
|
|
|||
|
Total
|
$
|
2,289
|
|
$
|
1,044
|
|
$
|
3,333
|
|
Environmental Matters
Accruals for environmental matters are recorded when it is probable that a liability has been incurred and the amount of the liability can be reasonably estimated based on current law and existing technologies. See Note
1
for further information regarding the Company's accounting policy for environmental matters. At
December 31, 2017
, the Company had accrued obligations of
$1,311 million
for probable environmental remediation and restoration costs, including
$219 million
for the remediation of Superfund sites. These obligations are included in "Accrued and other current liabilities" and "Other noncurrent obligations" in the consolidated balance sheets. This is management’s best estimate of the costs for remediation and restoration with respect to environmental matters for which the Company has accrued liabilities, although it is reasonably possible that the ultimate cost with respect to these particular matters could range up to approximately
two and a half times
that amount. Consequently, it is reasonably possible that environmental remediation and restoration costs in excess of amounts accrued could have a material impact on the Company’s results of operations, financial condition and cash flows. It is the opinion of the Company’s management, however, that the possibility is remote that costs in excess of the range disclosed will have a material impact on the Company’s results of operations, financial condition or cash flows. Inherent uncertainties exist in these estimates primarily due to unknown conditions, changing governmental regulations and legal standards regarding liability, and emerging remediation technologies for handling site remediation and restoration. At
December 31, 2016
, the Company had accrued obligations of
$909 million
for probable environmental remediation and restoration costs, including
$151 million
for the remediation of Superfund sites.
In the fourth quarter of 2016, Dow recorded a pretax charge of
$295 million
for environmental remediation at a number of historical locations, including the Midland manufacturing site/off-site matters and the Wood-Ridge sites, primarily resulting from the culmination of negotiations with regulators and/or final agency approval. These charges were included in "Cost of sales" in the consolidated statements of income and were included in the total obligation of
$909 million
at
December 31, 2016
.
Pursuant to the DuPont and Chemours Separation Agreement, DuPont is indemnified by Chemours for certain environmental matters, included in the liability of
$1,311 million
, which have an estimated liability of
$242 million
as of
December 31, 2017
. As such, DuPont has recorded an indemnification asset of
$242 million
corresponding to its accrual balance related to these matters at
December 31, 2017
, including
$47 million
related to the Superfund sites.
Midland Off-Site Environmental Matters
On June 12, 2003, the Michigan Department of Environmental Quality ("MDEQ") issued a Hazardous Waste Operating License (the "License") to Dow's Midland, Michigan, manufacturing site (the “Midland site”), which was renewed and replaced by the MDEQ on September 25, 2015, and included provisions requiring Dow to conduct an investigation to determine the nature and extent of off-site contamination in the City of Midland soils, the Tittabawassee River and Saginaw River sediment and floodplain soils, and the Saginaw Bay, and, if necessary, undertake remedial action.
City of Midland
On March 6, 2012, Dow submitted an Interim Response Activity Plan Designed to Meet Criteria ("Work Plan") to the MDEQ that involved the sampling of soil at residential properties near the Midland site for the presence of dioxins to determine where clean-up may be required and then conducting remediation for properties that sampled above the remediation criteria. The MDEQ approved the Work Plan on June 1, 2012 and implementation of the Work Plan began on June 4, 2012. Dow also submitted and had approved by the MDEQ, amendments to the Work Plan. At December 31, 2014, remediation was completed on all
132
properties that tested above the remediation criteria, and this completion is noted in the License. On July 21, 2016, the MDEQ approved a Corrective Action report, including a Remedial Action Plan ("RAP"), for the City of Midland. This is
141
the final regulatory approval required for the City of Midland. Dow is implementing the monitoring and maintenance requirements of the RAP.
Tittabawassee and Saginaw Rivers, Saginaw Bay
Dow, the EPA and the State of Michigan ("State") entered into an administrative order on consent (“AOC”), effective January 21, 2010, that requires Dow to conduct a remedial investigation, a feasibility study and a remedial design for the Tittabawassee River, the Saginaw River and the Saginaw Bay, and pay the oversight costs of the EPA and the State under the authority of the Comprehensive Environmental Response, Compensation, and Liability Act. These actions, to be conducted under the lead oversight of the EPA, will build upon the investigative work completed under the State Resource Conservation Recovery Act program from 2005 through 2009.
The Tittabawassee River, beginning at the Midland Site and extending down to the first six miles of the Saginaw River, are designated as the first Operable Unit for purposes of conducting the remedial investigation, feasibility study and remedial design work. This work will be performed in a largely upriver to downriver sequence for eight geographic segments of the Tittabawassee and upper Saginaw Rivers. In the first quarter of 2012, the EPA requested Dow address the Tittabawassee River floodplain ("Floodplain") as an additional segment. In January 2015, Dow and the EPA entered into an order to address remediation of the Floodplain. The remedial work is expected to take place over the next
five years
. The remainder of the Saginaw River and the Saginaw Bay are designated as a second Operable Unit and the work associated with that unit may also be geographically segmented. The AOC does not obligate Dow to perform removal or remedial action; that action can only be required by a separate order. Dow and the EPA have been negotiating orders separate from the AOC that obligate Dow to perform remedial actions under the scope of work of the AOC. Dow and the EPA have entered into
four
separate orders to perform limited remedial actions in
five
of the
eight
geographic segments in the first Operable Unit, and the order to address the Floodplain.
Alternative Dispute Resolution Process
Dow, the EPA, the U.S. Department of Justice, and the natural resource damage trustees (which include the Michigan Office of the Attorney General, the MDEQ, the U.S. Fish and Wildlife Service, the U.S. Bureau of Indian Affairs and the Saginaw‑Chippewa tribe) have been engaged in negotiations to seek to resolve potential governmental claims against Dow related to historical off-site contamination associated with the City of Midland, the Tittabawassee and Saginaw Rivers and the Saginaw Bay. Dow and the governmental parties started meeting in the fall of 2005 and entered into a Confidentiality Agreement in December 2005. Dow continues to conduct negotiations under the Federal Alternative Dispute Resolution Act with all of the governmental parties, except the EPA which withdrew from the alternative dispute resolution process on September 12, 2007.
On September 28, 2007, Dow and the natural resource damage trustees entered into a Funding and Participation Agreement that addressed Dow’s payment of past costs incurred by the natural resource damage trustees, payment of the costs of a trustee coordinator and a process to review additional cooperative studies that Dow might agree to fund or conduct with the natural resource damage trustees. On March 18, 2008, Dow and the natural resource damage trustees entered into a Memorandum of Understanding ("MOU") to provide a mechanism for Dow to fund cooperative studies related to the assessment of natural resource damages. This MOU was amended and funding of cooperative studies was extended until March 2014. All cooperative studies have been completed. On April 7, 2008, the natural resource damage trustees released their “Natural Resource Damage Assessment Plan for the Tittabawassee River System Assessment Area.”
At December 31, 2017, the accrual for these off-site matters was
$83 million
(included in the total accrued obligation of
$1,311 million
). At December 31, 2016, Dow had an accrual for these off-site matters of
$93 million
(included in the total accrued obligation of
$909 million
).
Purchase Commitments
Dow and DuPont have outstanding purchase commitments and various commitments for take-or-pay or throughput agreements. The Company was not aware of any purchase commitments that were negotiated as part of a financing arrangement for the facilities that will provide the contracted goods or services or for the costs related to those goods or services at December 31, 2017 and 2016.
142
NOTE
17
- STOCKHOLDERS' EQUITY
Merger of Equals of Dow and DuPont
In the third quarter of 2017, the conversion of Dow Common Stock and DuPont Common Stock into shares of DowDuPont Common Stock resulted in a
$3,084 million
decrease to "Common stock" with a corresponding increase to "Additional paid-in capital" in stockholders' equity. Each share of Dow Common Stock held in treasury immediately prior to the Merger was canceled, as set forth in the Merger Agreement. The elimination of Dow's historical treasury stock at cost resulted in a
$935 million
decrease in "Treasury stock" and "Additional paid-in capital" in stockholders' equity. The total fair value of consideration transferred for the Merger was
$74,680 million
, resulting in an increase to "Additional paid-in capital" in stockholders' equity (see Note
3
for additional information).
Cumulative Convertible Perpetual Preferred Stock, Series A
Equity securities in the form of Cumulative Convertible Perpetual Preferred Stock, Series A (“Dow Series A”) were issued by Dow on April 1, 2009 to Berkshire Hathaway Inc. in the amount of
$3 billion
(
3 million
shares) and the Kuwait Investment Authority in the amount of
$1 billion
(
1 million
shares). Shareholders of Dow Series A could convert all or any portion of their shares, at their option, at any time, into shares of Dow Common Stock at an initial conversion ratio of
24.2010
shares of Dow Common Stock for each share of Dow Series A. On or after the fifth anniversary of the issuance date, if the Dow Common Stock price exceeded
$53.72
per share for any
20
trading days in a consecutive
30
-day window, Dow had the option, at any time, in whole or in part, to convert the Dow Series A into Dow Common Stock at the then applicable conversion rate.
On December 15, 2016, the trading price of Dow's common stock closed at
$58.35
, marking the
20
th trading day in the previous
30
trading days that the common stock closed above
$53.72
, triggering the right of Dow to exercise its conversion right. On December 16, 2016, Dow sent a Notice of Conversion at the Option of the Company (the "Notice") to all holders of its Dow Series A. Pursuant to the Notice, on December 30, 2016 (the "Conversion Date") all
4 million
outstanding shares of Dow Series A (with a carrying value of
$4,000 million
) were converted into shares of Dow Common Stock at a conversion ratio of
24.2010
shares of Dow Common Stock for each share of Dow Series A, resulting in the issuance of
96.8 million
shares of Dow Common Stock from treasury stock. The treasury stock issued was carried at an aggregate historical cost of
$4,695 million
, resulting in a reduction to "Additional paid-in capital" in stockholders' equity of
$695 million
. From and after the Conversion Date, no shares of the Dow Series A are issued or outstanding and all rights of the holders of the Dow Series A have terminated. On January 6, 2017, Dow filed an amendment to its Restated Certificate of Incorporation by way of a certificate of elimination (the “Certificate of Elimination”) with the Secretary of State of the State of Delaware which had the effect of: (a) eliminating the previously designated
4 million
shares of Dow Series A,
none
of which were outstanding at the time of the filing; (b) upon such elimination, causing such Dow Series A to resume the status of authorized and unissued shares of preferred stock, par value
$1.00
per share, of Dow, without designation as to series; and (c) eliminating from Dow's Restated Certificate of Incorporation all references to, and all matters set forth in, the certificates of designations for the Dow Series A.
Dow paid cumulative dividends on Dow Series A shares at a rate of
8.5 percent
per annum, or
$85 million
per quarter. The final dividend for the Dow Series A was declared on December 15, 2016 and payable on the earlier of the Conversion Date (if applicable) or January 3, 2017, to shareholders of record at December 15, 2016. The dividend was paid in full on the Conversion Date.
Common Stock
In connection with the Merger, Dow Common Stock and DuPont Common Stock were converted into shares of DowDuPont Common Stock. At the effective time of the Merger, Dow Common Stock and DuPont Common Stock were voluntarily delisted from the NYSE, and their respective common stock were deregistered under the Securities Exchange Act of 1934, as amended. The shares of DowDuPont common stock commenced trading on the NYSE on September 1, 2017.
143
The following table provides a summary of the common stock activity resulting from the Merger:
|
Merger Impact on Dow, DuPont and DowDuPont Common Stock
|
Prior to Merger
1
|
Effect of Merger
2
|
||||
|
In thousands, except per share values
|
||||||
|
Dow
|
||||||
|
Common Stock, par value per share
|
$
|
2.50
|
|
N/A
|
|
|
|
Common Stock, shares authorized
|
1,500,000
|
|
—
|
|
||
|
Common Stock, shares issued and outstanding
|
1,225,328
|
|
—
|
|
||
|
DuPont
|
||||||
|
Common Stock, par value per share
|
$
|
0.30
|
|
N/A
|
|
|
|
Common Stock, shares authorized
|
1,800,000
|
|
—
|
|
||
|
Common Stock, shares issued and outstanding
|
868,338
|
|
—
|
|
||
|
DowDuPont
|
||||||
|
Common Stock, par value per share
|
$
|
—
|
|
$
|
0.01
|
|
|
Common Stock, shares authorized
|
—
|
|
5,000,000
|
|
||
|
Common Stock, shares issued for Dow shares converted
|
—
|
|
1,225,328
|
|
||
|
Common Stock, shares issued for DuPont shares converted (Ratio of 1.2820 to 1)
|
—
|
|
1,113,209
|
|
||
|
1.
|
Immediately prior to the effective time of the Merger.
|
|
2.
|
At the effective time of the Merger.
|
Prior to the Merger, Dow could issue common stock shares out of treasury stock or as new common stock shares for purchases under the Dow 2012 Employee Stock Purchase Plan, for options exercised and for the release of deferred, performance deferred and restricted stock. The number of new common stock shares issued to employees and non-employee directors prior to the Merger was
zero
in
2017
(
zero
in
2016
and approximately
32,000
in
2015
).
DowDuPont may issue new common stock shares for options exercised and for the release of deferred, performance deferred and restricted stock, restricted stock units ("RSUs") and performance-based restricted stock units ("PSUs"). The number of new common stock shares issued by DowDuPont to employees and non-employee directors was approximately
2,919,000
in 2017.
Retained Earnings
There are no significant restrictions limiting the Company’s ability to pay dividends. Dividends declared and paid to common stockholders during the years ended
December 31, 2017
,
2016
and
2015
are summarized in the following table:
|
Dividends Declared and Paid
|
|||||||||
|
In millions
|
2017
1
|
2016
|
2015
|
||||||
|
Dividends declared to common stockholders
|
$
|
2,558
|
|
$
|
2,037
|
|
$
|
1,942
|
|
|
Dividends paid to common stockholders
|
$
|
3,394
|
|
$
|
2,037
|
|
$
|
1,913
|
|
|
1.
|
Dividends declared consists of
$1,673 million
declared to Dow common stockholders prior to the Merger and
$885 million
declared to DowDuPont common stockholders after the Merger. Dividends paid consists of
$2,179 million
paid to Dow common stockholders and
$330 million
paid to DuPont common stockholders for dividends declared prior to the Merger, and
$885 million
paid to DowDuPont common stockholders for dividends declared after the Merger.
|
Undistributed earnings of nonconsolidated affiliates included in retained earnings were
$1,731 million
at
December 31, 2017
and
$1,196 million
at
December 31, 2016
.
Employee Stock Ownership Plan
The Dow Employee Stock Ownership Plan (the “ESOP”) is an integral part of The Dow Chemical Company Employees’ Savings Plan (the “Plan”). A significant majority of full-time employees in the United States are eligible to participate in the Plan. Dow uses the ESOP to provide Dow’s matching contribution in the form of stock to Plan participants. Prior to the Merger, contributions were in the form of Dow Common Stock. Effective with the Merger, shares of Dow stock held by the ESOP were converted into shares of DowDuPont Common Stock at a ratio of
1
:1.
In connection with the acquisition of Rohm and Haas on April 1, 2009, the Rohm and Haas Employee Stock Ownership Plan (the "Rohm and Haas ESOP") was merged into the Plan, and Dow assumed the
$78 million
balance of debt at
9.8 percent
interest with final maturity in 2020 that was used to finance share purchases by the Rohm and Haas ESOP in 1990. The outstanding balance of the debt was
$17 million
at
December 31, 2017
and
$24 million
at
December 31, 2016
.
144
Dividends on unallocated shares held by the ESOP are used by the ESOP to make debt service payments and to purchase additional shares if dividends exceed the debt service payments. Dividends on allocated shares are used by the ESOP to make debt service payments to the extent needed; otherwise, they are paid to the Plan participants. Shares are released for allocation to participants based on the ratio of the current year’s debt service to the sum of the principal and interest payments over the life of the loan. The shares are allocated to Plan participants in accordance with the terms of the Plan.
Compensation expense for allocated shares is recorded at the fair value of the shares on the date of allocation. ESOP shares that have not been released or committed to be released are not considered outstanding for purposes of computing basic and diluted earnings per share. Compensation expense for ESOP shares was
$248 million
in
2017
,
$192 million
in
2016
and
$174 million
in
2015
. At
December 31, 2017
,
15.5 million
shares out of a total
25.6 million
shares held by the ESOP had been allocated to participants’ accounts;
2.2 million
shares were released but unallocated; and
7.9 million
shares, at a fair value of
$566 million
, were considered unearned.
Treasury Stock
On November 2, 2017, the DowDuPont Board of Directors authorized an initial
$4.0 billion
share repurchase program. At
December 31, 2017
,
$3.0 billion
of the authorization remained available for repurchases.
In 2013, Dow's Board approved a share buy-back program. As a result of subsequent authorizations approved by Dow's Board, the total authorized amount of the Dow share repurchase program was
$9.5 billion
. Effective with the Merger, the share repurchase program was canceled. Over the duration of the program, a total of
$8.1 billion
was spent on the repurchase of Dow Common Stock.
Dow historically issued shares for purchases under the Employee Stock Purchase Plan, for options exercised as well as for the release of deferred, performance deferred and restricted stock out of treasury stock or as new common stock shares. The number of treasury shares issued to employees and non-employee directors under Dow’s stock-based compensation programs are summarized in the following table.
|
Dow Treasury Shares Issued Under Dow Stock-Based Compensation Programs
|
||||||
|
In thousands
|
2017
|
2016
|
2015
|
|||
|
To employees and non-employee directors
|
14,195
|
|
14,494
|
|
16,490
|
|
The following table provides a reconciliation of Dow Common Stock activity for the years ended
December 31, 2017
,
2016
and
2015
:
|
Shares of Dow Common Stock
|
Issued
|
Held in Treasury
|
||
|
In thousands
|
||||
|
Balance at Jan 1, 2015
|
1,242,763
|
|
85,169
|
|
|
Issued
1
|
32
|
|
(16,490
|
)
|
|
Repurchased
2
|
—
|
|
57,174
|
|
|
Balance at Dec 31, 2015
|
1,242,795
|
|
125,853
|
|
|
Issued
1
|
—
|
|
(14,494
|
)
|
|
Repurchased
|
—
|
|
17,107
|
|
|
Preferred stock converted to common stock
|
—
|
|
(96,804
|
)
|
|
Balance at Dec 31, 2016
|
1,242,795
|
|
31,662
|
|
|
Issued
1
|
—
|
|
(14,195
|
)
|
|
Converted to DowDuPont shares or canceled on Aug 31, 2017
3
|
(1,242,795
|
)
|
(17,467
|
)
|
|
Balance at Aug 31, 2017
|
—
|
|
—
|
|
|
1.
|
Shares issued to employees and non-employee directors under Dow's equity compensation plans.
|
|
2.
|
Includes
34.1 million
treasury shares as part of the Reverse Morris Trust transaction with Olin, which were tendered as part of a non-cash, public exchange offer. See Note
6
for additional information.
|
|
3.
|
Each share of Dow Common Stock issued and outstanding immediately prior to the Merger was converted into
one
share of DowDuPont Common Stock; Treasury shares were canceled as a result of the Merger.
|
145
The following table provides a reconciliation of DowDuPont Common Stock activity for the year ended
December 31, 2017
:
|
Shares of DowDuPont Common Stock
|
Issued
|
Held in Treasury
|
||
|
In thousands
|
||||
|
Balance at Sep 1, 2017
|
2,338,537
|
|
—
|
|
|
Issued
|
2,919
|
|
—
|
|
|
Repurchased
|
—
|
|
14,123
|
|
|
Balance at Dec 31, 2017
|
2,341,456
|
|
14,123
|
|
Accumulated Other Comprehensive Loss
The following table summarizes the changes and after-tax balances of each component of accumulated other comprehensive loss for the years ended
December 31, 2017
,
2016
, and
2015
:
|
Accumulated Other Comprehensive Loss
1
|
Unrealized Gains (Losses) on Investments
|
Cumulative Translation Adj
|
Pension and Other Postretire Benefits
|
Derivative Instruments
|
Accum Other Comp Loss
|
||||||||||
|
In millions
|
|||||||||||||||
|
2015
|
|||||||||||||||
|
Balance at Jan 1, 2015
|
$
|
141
|
|
$
|
(751
|
)
|
$
|
(7,321
|
)
|
$
|
(86
|
)
|
$
|
(8,017
|
)
|
|
Other comprehensive income (loss) before reclassifications
|
(40
|
)
|
(990
|
)
|
105
|
|
(136
|
)
|
(1,061
|
)
|
|||||
|
Amounts reclassified from accumulated other comprehensive income (loss)
|
(54
|
)
|
4
|
|
447
|
|
14
|
|
411
|
|
|||||
|
Net other comprehensive income (loss)
|
$
|
(94
|
)
|
$
|
(986
|
)
|
$
|
552
|
|
$
|
(122
|
)
|
$
|
(650
|
)
|
|
Balance at Dec 31, 2015
|
$
|
47
|
|
$
|
(1,737
|
)
|
$
|
(6,769
|
)
|
$
|
(208
|
)
|
$
|
(8,667
|
)
|
|
2016
|
|
|
|
|
|
||||||||||
|
Other comprehensive income (loss) before reclassifications
|
32
|
|
(644
|
)
|
(1,354
|
)
|
84
|
|
(1,882
|
)
|
|||||
|
Amounts reclassified from accumulated other comprehensive income (loss)
|
(36
|
)
|
—
|
|
734
|
|
29
|
|
727
|
|
|||||
|
Net other comprehensive income (loss)
|
$
|
(4
|
)
|
$
|
(644
|
)
|
$
|
(620
|
)
|
$
|
113
|
|
$
|
(1,155
|
)
|
|
Balance at Dec 31, 2016
|
$
|
43
|
|
$
|
(2,381
|
)
|
$
|
(7,389
|
)
|
$
|
(95
|
)
|
$
|
(9,822
|
)
|
|
2017
|
|
|
|
|
|
||||||||||
|
Other comprehensive income (loss) before reclassifications
|
25
|
|
454
|
|
52
|
|
(1
|
)
|
530
|
|
|||||
|
Amounts reclassified from accumulated other comprehensive income (loss)
|
(71
|
)
|
(8
|
)
|
414
|
|
(15
|
)
|
320
|
|
|||||
|
Net other comprehensive income (loss)
|
$
|
(46
|
)
|
$
|
446
|
|
$
|
466
|
|
$
|
(16
|
)
|
$
|
850
|
|
|
Balance at Dec 31, 2017
|
$
|
(3
|
)
|
$
|
(1,935
|
)
|
$
|
(6,923
|
)
|
$
|
(111
|
)
|
$
|
(8,972
|
)
|
|
1.
|
Prior year amounts have been updated to conform with the current year presentation.
|
The tax effects on the net activity related to each component of other comprehensive income (loss) for the years ended
December 31, 2017
,
2016
, and
2015
were as follows:
|
Tax Benefit (Expense)
|
|||||||||
|
In millions
|
2017
|
2016
|
2015
|
||||||
|
Unrealized gains (losses) on investments
|
$
|
(26
|
)
|
$
|
2
|
|
$
|
(52
|
)
|
|
Cumulative translation adjustments
|
98
|
|
171
|
|
(84
|
)
|
|||
|
Pension and other postretirement benefit plans
|
191
|
|
(438
|
)
|
252
|
|
|||
|
Derivative instruments
|
4
|
|
32
|
|
(70
|
)
|
|||
|
Tax benefit (expense) from income taxes related to other comprehensive income (loss) items
|
$
|
267
|
|
$
|
(233
|
)
|
$
|
46
|
|
146
A summary of the reclassifications out of accumulated other comprehensive loss for the years ended
December 31, 2017
,
2016
, and
2015
is provided as follows:
|
Reclassifications Out of Accumulated Other Comprehensive Loss
|
2017
|
2016
|
2015
|
Consolidated Statements of Income Classification
|
|||||||
|
In millions
|
|||||||||||
|
Unrealized gains on investments
|
$
|
(110
|
)
|
$
|
(56
|
)
|
$
|
(84
|
)
|
See (1) below
|
|
|
Tax expense
|
39
|
|
20
|
|
30
|
|
See (2) below
|
||||
|
After tax
|
$
|
(71
|
)
|
$
|
(36
|
)
|
$
|
(54
|
)
|
||
|
Cumulative translation adjustments
|
$
|
(8
|
)
|
$
|
—
|
|
$
|
4
|
|
See (3) below
|
|
|
Pension and other postretirement benefit plans
|
$
|
607
|
|
$
|
913
|
|
$
|
665
|
|
See (4) below
|
|
|
Tax benefit
|
(193
|
)
|
(179
|
)
|
(218
|
)
|
See (2) below
|
||||
|
After tax
|
$
|
414
|
|
$
|
734
|
|
$
|
447
|
|
||
|
Derivative Instruments
|
$
|
(13
|
)
|
$
|
34
|
|
$
|
23
|
|
See (5) below
|
|
|
Tax benefit
|
(2
|
)
|
(5
|
)
|
(9
|
)
|
See (2) below
|
||||
|
After tax
|
$
|
(15
|
)
|
$
|
29
|
|
$
|
14
|
|
||
|
Total reclassifications for the period, after tax
|
$
|
320
|
|
$
|
727
|
|
$
|
411
|
|
||
|
1.
|
"Net sales" and "Sundry income (expense) - net."
|
|
2.
|
"Provision (Credit) for income taxes on continuing operations."
|
|
3.
|
"Sundry income (expense) - net."
|
|
4.
|
These accumulated other comprehensive loss components are included in the computation of net periodic benefit cost of the Company's pension and other postretirement plans. See Note
19
for additional information. In the year ended December 31, 2016,
$360 million
was included in "Sundry income (expense) - net" (
zero
impact on "Provision (Credit) for income taxes on continuing operations") related to the DCC transaction. See Note
3
for additional information.
|
|
5.
|
"Cost of sales" and "Sundry income (expense) - net."
|
NOTE
18
- NONCONTROLLING INTERESTS
Ownership interests in the Company's subsidiaries held by parties other than the Company are presented separately from the Company's equity in the consolidated balance sheets as "Noncontrolling interests." The amount of consolidated net income attributable to the Company and the noncontrolling interests are both presented on the face of the consolidated statements of income.
The following table summarizes the activity for equity attributable to noncontrolling interests in the years ended
December 31, 2017
,
2016
and
2015
:
|
Noncontrolling Interests
|
|||||||||
|
In millions
|
2017
|
2016
|
2015
|
||||||
|
Balance at Jan 1
|
$
|
1,242
|
|
$
|
809
|
|
$
|
931
|
|
|
Net income attributable to noncontrolling interests
|
132
|
|
86
|
|
98
|
|
|||
|
Distributions to noncontrolling interests
1
|
(116
|
)
|
(123
|
)
|
(76
|
)
|
|||
|
Capital contributions
2
|
—
|
|
—
|
|
38
|
|
|||
|
Purchases of noncontrolling interests
3
|
—
|
|
—
|
|
(42
|
)
|
|||
|
Transfers of redeemable noncontrolling interest
4
|
—
|
|
—
|
|
(108
|
)
|
|||
|
Acquisition of noncontrolling interests
5
|
3
|
|
473
|
|
—
|
|
|||
|
Noncontrolling interests from Merger
6
|
417
|
|
—
|
|
—
|
|
|||
|
Deconsolidation of noncontrolling interests
7
|
(123
|
)
|
—
|
|
—
|
|
|||
|
Cumulative translation adjustments
|
41
|
|
(4
|
)
|
(34
|
)
|
|||
|
Other
|
1
|
|
1
|
|
2
|
|
|||
|
Balance at Dec 31
|
$
|
1,597
|
|
$
|
1,242
|
|
$
|
809
|
|
|
1.
|
Distributions to noncontrolling interests is net of
$20 million
in
2017
(
$53 million
in
2016
and
$36 million
in
2015
) in dividends paid to a joint venture, which were reclassified to "Equity in earnings of nonconsolidated affiliates" in the consolidated statements of income.
|
|
2.
|
Includes non-cash capital contributions of
$21 million
in 2015.
|
|
3.
|
The 2016 value excludes a
$202 million
cash payment as the noncontrolling interest was classified as "Accrued and other current liabilities" in the consolidated balance sheets. The 2015 value excludes a
$133 million
cash payment for the purchase of a Redeemable Noncontrolling Interest. See Notes
6
and
23
for additional information.
|
|
4.
|
See Notes
6
and
23
for additional information.
|
|
5.
|
The 2016 value reflects the amount assumed in the DCC Transaction. See Note
3
for additional information.
|
|
6.
|
See Note
3
for additional information.
|
|
7.
|
At June 30, 2017, Dow sold its ownership interest in the SKC Haas Display Films group of companies. See Note
13
for additional information.
|
147
DuPont Preferred Stock
Each share of DuPont Preferred Stock -
$4.50
Series and DuPont Preferred Stock -
$3.50
Series issued and outstanding at the effective date of the Merger remains issued and outstanding as to DuPont and was unaffected by the Merger.
Below is a summary of the DuPont Preferred Stock at
December 31, 2017
, which was classified as "Noncontrolling Interests" in the consolidated balance sheets:
|
DuPont Preferred Stock
|
Number of Shares
|
|
|
Shares in thousands
|
||
|
Authorized
|
23,000
|
|
|
$4.50 Series, callable at $120
|
1,673
|
|
|
$3.50 Series, callable at $102
|
700
|
|
NOTE
19
- PENSION PLANS AND OTHER POSTRETIREMENT BENEFITS
Dow and DuPont did not merge their defined benefit pension and OPEB plans as a result of the Merger. See Note
3
for additional information on the Merger. The significant defined benefit pension and OPEB plans of Dow and DuPont are summarized below. Information provided for DuPont represents activity subsequent to the effective date of the Merger.
Defined Benefit Pension Plans
Dow
Dow has both funded and unfunded defined benefit pension plans that cover employees in the United States and a number of other countries. The U.S. qualified plan covering the parent company is the largest plan. Benefits for employees hired before January 1, 2008, are based on length of service and the employee’s three highest consecutive years of compensation. Employees hired after January 1, 2008, earn benefits that are based on a set percentage of annual pay, plus interest.
Dow's funding policy is to contribute to the plans when pension laws and/or economics either require or encourage funding. In 2017, Dow contributed
$1,676 million
to its pension plans, including contributions to fund benefit payments for its non-qualified pension plans. Dow expects to contribute approximately
$500 million
to its pension plans in 2018.
The provisions of a U.S. non-qualified pension plan for Dow require the payment of plan obligations to certain participants upon a change in control of Dow, which occurred at the time of the Merger. Certain participants could elect to receive a lump-sum payment or direct Dow to purchase an annuity on their behalf using the after-tax proceeds of the lump sum. In the fourth quarter of 2017, Dow paid
$940 million
to plan participants and
$230 million
to an insurance company for the purchase of annuities, which were included in "Pension contributions" in the consolidated statements of cash flows. Dow also paid
$205 million
for income and payroll taxes for participants electing the annuity option, of which
$201 million
was included in "Cost of sales" and
$4 million
was included in "Selling, general and administrative expenses" in the consolidated statements of income and related to Corporate. Dow recorded a settlement charge of
$687 million
associated with the payout in the fourth quarter of 2017, which was included in "Cost of sales" in the consolidated statements of income and related to Corporate.
DuPont
DuPont has both funded and unfunded noncontributory defined benefit pension plans covering a majority of the U.S. employees. The U.S. qualified plan is the largest pension plan held by DuPont. Most employees hired on or after January 1, 2007, are not eligible to participate in the U.S. defined benefit pension plans. The benefits under these plans are based primarily on years of service and employees' pay near retirement. DuPont will freeze the pay and service amounts used to calculate pension benefits for active employees who participate in the U.S. pension plans as of November 30, 2018. Therefore, as of November 30, 2018, active employees participating in the U.S. pension plans will not accrue additional benefits for future service and eligible compensation received.
DuPont's funding policy is consistent with the funding requirements of federal laws and regulations. Pension coverage for employees of DuPont's non-U.S. consolidated subsidiaries is provided, to the extent deemed appropriate, through separate plans. Obligations under such plans are funded by depositing funds with trustees, covered by insurance contracts, or remain unfunded. In 2017, DuPont contributed
$68 million
post-Merger to its pension plans, including contributions to fund benefit payments for its pension plans where funding is not customary. DuPont expects to contribute approximately
$200 million
to its pension plans in 2018.
In the fourth quarter of 2017, approximately
$140 million
of lump-sum payments were made from the U.S. qualified pension plan trust fund to a group of separated, vested plan participants who were extended a limited-time opportunity and voluntarily elected
148
to receive their pension benefits in a single lump-sum payment. Since DuPont recognizes pension settlements only when the lump‑sum payments exceed the sum of the plan's service and interest cost components of net periodic pension cost for the year, these lump-sum payments did not result in the recognition of a pension settlement charge.
The weighted-average assumptions used to determine pension plan obligations and net periodic benefit costs for all plans are summarized in the table below:
|
Weighted-Average Assumptions for All Pension Plans
|
Benefit Obligations
at Dec 31
|
Net Periodic Costs
for the Year Ended
|
||||||||
|
|
2017
|
2016
|
2017
1
|
2016
|
2015
|
|||||
|
Discount rate
|
3.26
|
%
|
3.52
|
%
|
3.50
|
%
|
3.85
|
%
|
3.60
|
%
|
|
Rate of compensation increase
|
3.95
|
%
|
3.90
|
%
|
3.88
|
%
|
4.04
|
%
|
4.13
|
%
|
|
Expected return on plan assets
|
—
|
|
—
|
|
6.94
|
%
|
7.22
|
%
|
7.35
|
%
|
|
1.
|
Includes DuPont plans subsequent to the Merger date.
|
The weighted-average assumptions used to determine pension plan obligations and net periodic benefit costs for U.S. plans are summarized in the table below:
|
Weighted-Average Assumptions for U.S. Pension Plans
|
Benefit Obligations
at Dec 31
|
Net Periodic Costs
for the Year Ended
|
||||||||
|
2017
|
2016
|
2017
1
|
2016
|
2015
|
||||||
|
Discount rate
|
3.66
|
%
|
4.11
|
%
|
4.02
|
%
|
4.40
|
%
|
4.04
|
%
|
|
Rate of compensation increase
|
4.25
|
%
|
4.25
|
%
|
4.18
|
%
|
4.50
|
%
|
4.50
|
%
|
|
Expected return on plan assets
|
—
|
|
—
|
|
7.46
|
%
|
7.77
|
%
|
7.85
|
%
|
|
1.
|
Includes DuPont plans subsequent to the Merger date.
|
Other Postretirement Benefit Plans
Dow
Dow provides certain health care and life insurance benefits to retired employees and survivors. Dow’s plans outside of the United States are not significant; therefore, this discussion relates to the U.S. plans only. The plans provide health care benefits, including hospital, physicians’ services, drug and major medical expense coverage, and life insurance benefits. In general, for employees hired before January 1, 1993, the plans provide benefits supplemental to Medicare when retirees are eligible for these benefits. Dow and the retiree share the cost of these benefits, with the Dow portion increasing as the retiree has increased years of credited service, although there is a cap on the Dow portion. Dow has the ability to change these benefits at any time. Employees hired after January 1, 2008, are not covered under the plans.
Dow funds most of the cost of these health care and life insurance benefits as incurred. In 2017, Dow did not make any contributions to its other postretirement benefit plan trusts. The trusts did not hold assets at December 31, 2017. Dow does not expect to contribute assets to its other postretirement benefit plan trusts in 2018.
DuPont
DuPont provides medical, dental and life insurance benefits to pensioners and survivors. The associated plans for retiree benefits are unfunded and the cost of the approved claims is paid from DuPont company funds. Essentially all of the cost and liabilities for these retiree benefit plans are attributable to the U.S. benefit plans. The non-Medicare eligible retiree medical plan is contributory with pensioners and survivors' contributions adjusted annually to achieve a
50/50
target for sharing of cost increases between DuPont and pensioners and survivors. In addition, limits are applied to DuPont's portion of the retiree medical cost coverage. For Medicare eligible pensioners and survivors, DuPont provides a DuPont-funded Health Reimbursement Arrangement ("HRA"). In November 2016, DuPont announced that OPEB eligible employees who will be under the age of
50
as of November 30, 2018, as defined above, will not receive postretirement medical, dental and life insurance benefits. Beginning January 1, 2015, eligible employees who retire on and after that date will receive the same life insurance benefit payment, regardless of the employee's age or pay. The majority of U.S. employees hired on or after January 1, 2007, are not eligible to participate in the postretirement medical, dental and life insurance plans.
149
The weighted-average assumptions used to determine other postretirement benefit obligations and net periodic benefit costs for the U.S. plans are provided below:
|
Weighted-Average Assumptions for U.S. Other Postretirement Benefits Plans
|
Benefit Obligations
at Dec 31
|
Net Periodic Costs
for the Year Ended
|
||||||||
|
2017
|
2016
|
2017
1
|
2016
|
2015
|
||||||
|
Discount rate
|
3.54
|
%
|
3.83
|
%
|
3.76
|
%
|
3.96
|
%
|
3.68
|
%
|
|
Health care cost trend rate assumed for next year
|
6.52
|
%
|
7.00
|
%
|
7.00
|
%
|
7.25
|
%
|
7.06
|
%
|
|
Rate to which the cost trend rate is assumed to decline (the ultimate health cost care trend rate)
|
5.00
|
%
|
5.00
|
%
|
5.00
|
%
|
5.00
|
%
|
5.00
|
%
|
|
Year that the rate reaches the ultimate health care cost trend rate:
|
||||||||||
|
Dow plans
|
2025
|
|
2025
|
|
2025
|
|
2025
|
|
2020
|
|
|
DuPont plans
|
2023
|
|
2023
|
|
||||||
|
1.
|
Includes DuPont plans subsequent to the Merger date.
|
Assumed health care cost trend rates have a modest effect on the amounts reported for the health care plans. A one percentage point change in assumed health care cost trend rates would have an immaterial impact on service and interest cost and the postretirement benefit obligation.
Assumptions
Dow and DuPont determine the expected long-term rate of return on plan assets by performing a detailed analysis of key economic and market factors driving historical returns for each asset class and formulating a projected return based on factors in the current environment. Factors considered include, but are not limited to, inflation, real economic growth, interest rate yield, interest rate spreads, and other valuation measures and market metrics. The expected long-term rate of return for each asset class is then weighted based on the strategic asset allocation approved by the governing body for each plan. Dow and DuPont historical experience with the pension fund asset performance is also considered.
Effective January 1, 2016, Dow adopted the spot rate approach to determine the discount rate utilized to measure the service cost and interest cost components of net periodic pension and other postretirement benefit costs for the U.S. and other selected countries. DuPont also adopted the spot rate approach for its U.S. plans. Under the spot rate approach, Dow and DuPont calculate service costs and interest costs by applying individual spot rates from a yield curve (based on high-quality corporate bond yields) for each selected country to the separate expected cash flow components of service cost and interest cost. Service cost and interest cost for all other plans are determined on the basis of the single equivalent discount rates derived in determining those plan obligations. Dow and DuPont changed to the new method to provide a more precise measure of interest and service costs for certain plans by improving the correlation between projected benefit cash flows and the discrete spot yield curves. The change in accounting estimate was applied prospectively starting in 2016.
The discount rates utilized to measure the pension and other postretirement obligations of the U.S. plans are based on the yield on high-quality corporate fixed income investments at the measurement date. Future expected actuarially determined cash flows are individually discounted at spot rates under the Willis Towers Watson U.S. RATE:Link 60-90 corporate yield curve for Dow's plans and under the Aon Hewitt AA_Above Median yield curve for DuPont's plans to arrive at the plan's obligations as of the measurement date.
Dow utilizes the Society of Actuaries’ ("SOA") mortality tables released in 2014 and a modified version of the generational mortality improvement scale released in 2014 for purposes of measuring the U.S. pension and other postretirement obligations, based on an evaluation of the mortality experience of its pension plans. DuPont adopted the mortality tables released by SOA in 2014 and the most recent available SOA mortality improvement scale in measuring its U.S. pension and other postretirement obligations.
150
Summarized information on the Company's pension and other postretirement benefit plans is as follows:
|
Change in Projected Benefit Obligations, Plan Assets and Funded Status of All Significant Plans
|
Defined Benefit Pension Plans
|
Other Postretirement Benefits
|
||||||||||
|
In millions
|
2017
1
|
2016
|
2017
1
|
2016
|
||||||||
|
Change in projected benefit obligations:
|
||||||||||||
|
Benefit obligations at beginning of year
|
$
|
30,280
|
|
$
|
25,652
|
|
$
|
1,835
|
|
$
|
1,597
|
|
|
Merger impact
2
|
26,036
|
|
—
|
|
2,772
|
|
—
|
|
||||
|
Service cost
|
555
|
|
463
|
|
17
|
|
13
|
|
||||
|
Interest cost
|
1,130
|
|
846
|
|
80
|
|
52
|
|
||||
|
Plan participants' contributions
|
20
|
|
19
|
|
—
|
|
—
|
|
||||
|
Actuarial changes in assumptions and experience
|
1,781
|
|
1,967
|
|
(130
|
)
|
13
|
|
||||
|
Benefits paid
3
|
(2,170
|
)
|
(1,324
|
)
|
(210
|
)
|
(154
|
)
|
||||
|
Plan amendments
|
14
|
|
—
|
|
—
|
|
—
|
|
||||
|
Acquisitions/divestitures/other
4
|
72
|
|
3,201
|
|
—
|
|
313
|
|
||||
|
Effect of foreign exchange rates
|
875
|
|
(506
|
)
|
13
|
|
1
|
|
||||
|
Termination benefits/curtailment cost/settlements
5
|
(1,192
|
)
|
(38
|
)
|
—
|
|
—
|
|
||||
|
Benefit obligations at end of year
|
$
|
57,401
|
|
$
|
30,280
|
|
$
|
4,377
|
|
$
|
1,835
|
|
|
Change in plan assets:
|
||||||||||||
|
Fair value of plan assets at beginning of year
|
$
|
21,208
|
|
$
|
18,774
|
|
$
|
—
|
|
$
|
—
|
|
|
Merger impact
2
|
20,395
|
|
—
|
|
—
|
|
—
|
|
||||
|
Actual return on plan assets
|
3,049
|
|
1,437
|
|
—
|
|
—
|
|
||||
|
Employer contributions
|
1,744
|
|
629
|
|
—
|
|
—
|
|
||||
|
Plan participants' contributions
|
20
|
|
19
|
|
—
|
|
—
|
|
||||
|
Benefits paid
3
|
(2,170
|
)
|
(1,324
|
)
|
—
|
|
—
|
|
||||
|
Acquisitions/divestitures/other
6
|
14
|
|
2,077
|
|
—
|
|
—
|
|
||||
|
Effect of foreign exchange rates
|
613
|
|
(404
|
)
|
—
|
|
—
|
|
||||
|
Settlements
7
|
(1,188
|
)
|
—
|
|
—
|
|
—
|
|
||||
|
Fair value of plan assets at end of year
|
$
|
43,685
|
|
$
|
21,208
|
|
$
|
—
|
|
$
|
—
|
|
|
Funded status:
|
||||||||||||
|
U.S. plans with plan assets
8
|
$
|
(8,991
|
)
|
$
|
(5,122
|
)
|
$
|
—
|
|
$
|
—
|
|
|
Non-U.S. plans with plan assets
8
|
(2,780
|
)
|
(2,474
|
)
|
—
|
|
—
|
|
||||
|
All other plans
8, 9
|
(1,945
|
)
|
(1,476
|
)
|
(4,377
|
)
|
(1,835
|
)
|
||||
|
Funded status at end of year
|
$
|
(13,716
|
)
|
$
|
(9,072
|
)
|
$
|
(4,377
|
)
|
$
|
(1,835
|
)
|
|
1.
|
Includes DuPont activity subsequent to the Merger Date.
|
|
2.
|
Plan assets and liabilities assumed in the Merger. Represents remeasurement of the projected benefit obligation and fair value of plan assets for DuPont's plans as of the Merger date.
|
|
3.
|
In the fourth quarter 2017, approximately
$140 million
of lump-sum payments were made from DuPont's U.S. qualified pension plan trust fund to a group of separated, vested plan participants who were extended a limited-time opportunity and voluntarily elected to receive their pension benefits in a single lump-sum payment.
|
|
4.
|
The 2017 impact includes the reclassification of a China pension liability of
$69 million
from "Other noncurrent obligations" to "Pension and other postretirement benefits - noncurrent" and the divestiture of a Korean company with pension benefit obligations of
$25 million
. The 2016 impact includes pension benefit obligations of
$3,252 million
and other postretirement benefit obligations of
$313 million
assumed with the ownership restructure of Dow Corning. The 2016 impact also includes the transfer of benefit obligations of
$53 million
in the U.S. through the purchase of annuity contracts from an insurance company. See Note
3
for additional information.
|
|
5.
|
The 2017 impact includes the settlement of certain plan obligations for a Dow U.S. non-qualified pension plan of
$1,170 million
required due to a change in control provision. The 2017 impact also includes the conversion of a Korean pension plan of
$22 million
to a defined contribution plan. The 2016 impact primarily relates to the curtailment of benefits for certain participants of a U.S. Dow Corning plan of
$36 million
.
|
|
6.
|
The 2017 impact relates to the divestiture of a Korean company. The 2016 impact includes plan assets assumed with the ownership restructure of Dow Corning of
$2,327 million
. The 2016 impact also includes the purchase of annuity contracts of
$55 million
in the U.S. associated with the transfer of benefit obligations to an insurance company and the transfer of plan assets associated with the Reverse Morris Trust transaction with Olin of
$184 million
. See Notes
3
and
6
for additional information.
|
|
7.
|
The 2017 impact includes payments made of
$1,170 million
to settle certain plan obligations of a Dow U.S. non-qualified pension plan required due to a change in control provision. The 2017 impact also includes payments made of
$18 million
to convert a Korean pension plan to a defined contribution plan.
|
|
8.
|
Updated to conform with the current year presentation.
|
|
9.
|
As of December 31, 2017,
$389 million
of the benefit obligations are supported by funding under the Trust agreement, defined in the "Trust Assets" section below.
|
151
The following tables summarize the amounts recognized in the consolidated balance sheets for all significant plans:
|
Amounts Recognized in the Consolidated Balance Sheets for All Significant Plans
|
Defined Benefit Pension Plans
|
Other Postretirement Benefits
|
||||||||||
|
In millions
|
2017
1
|
2016
|
2017
1
|
2016
|
||||||||
|
Amounts recognized in the consolidated balance sheets at Dec 31:
|
||||||||||||
|
Deferred charges and other assets
|
$
|
595
|
|
$
|
292
|
|
$
|
—
|
|
$
|
—
|
|
|
Accrued and other current liabilities
|
(134
|
)
|
(74
|
)
|
(375
|
)
|
(158
|
)
|
||||
|
Pension and other postretirement benefits - noncurrent
|
(14,177
|
)
|
(9,290
|
)
|
(4,002
|
)
|
(1,677
|
)
|
||||
|
Net amount recognized
|
$
|
(13,716
|
)
|
$
|
(9,072
|
)
|
$
|
(4,377
|
)
|
$
|
(1,835
|
)
|
|
Pretax amounts recognized in accumulated other comprehensive (income) loss at Dec 31:
|
||||||||||||
|
Net loss (gain)
|
$
|
10,734
|
|
$
|
11,379
|
|
$
|
(258
|
)
|
$
|
(133
|
)
|
|
Prior service credit
|
(265
|
)
|
(304
|
)
|
—
|
|
—
|
|
||||
|
Pretax balance in accumulated other comprehensive (income) loss at end of year
|
$
|
10,469
|
|
$
|
11,075
|
|
$
|
(258
|
)
|
$
|
(133
|
)
|
|
1.
|
Includes DuPont activity subsequent to the Merger Date.
|
The accumulated benefit obligation for all pension plans was
$55.5 billion
and
$28.8 billion
at December 31, 2017 and 2016, respectively.
|
Pension Plans with Accumulated Benefit Obligations in Excess of Plan Assets at Dec 31
|
2017
|
2016
|
||||
|
In millions
|
||||||
|
Projected benefit obligations
|
$
|
53,133
|
|
$
|
27,877
|
|
|
Accumulated benefit obligations
|
$
|
51,563
|
|
$
|
26,590
|
|
|
Fair value of plan assets
|
$
|
38,850
|
|
$
|
18,523
|
|
|
Pension Plans with Projected Benefit Obligations in Excess of Plan Assets at Dec 31
|
2017
|
2016
|
||||
|
In millions
|
||||||
|
Projected benefit obligations
|
$
|
53,830
|
|
$
|
28,025
|
|
|
Accumulated benefit obligations
|
$
|
52,171
|
|
$
|
26,702
|
|
|
Fair value of plan assets
|
$
|
39,519
|
|
$
|
18,662
|
|
152
|
Net Periodic Benefit Costs for All Significant Plans for the Year Ended Dec 31
|
Defined Benefit Pension Plans
|
Other Postretirement Benefits
|
||||||||||||||||
|
In millions
|
2017
|
2016
|
2015
|
2017
|
2016
|
2015
|
||||||||||||
|
Net Periodic Benefit Costs:
|
||||||||||||||||||
|
Service cost
|
$
|
555
|
|
$
|
463
|
|
$
|
484
|
|
$
|
17
|
|
$
|
13
|
|
$
|
14
|
|
|
Interest cost
|
1,130
|
|
846
|
|
975
|
|
80
|
|
52
|
|
59
|
|
||||||
|
Expected return on plan assets
|
(1,955
|
)
|
(1,447
|
)
|
(1,382
|
)
|
—
|
|
—
|
|
—
|
|
||||||
|
Amortization of prior service credit
|
(25
|
)
|
(24
|
)
|
(28
|
)
|
—
|
|
(3
|
)
|
(2
|
)
|
||||||
|
Amortization of unrecognized (gain) loss
|
638
|
|
587
|
|
706
|
|
(6
|
)
|
(7
|
)
|
(11
|
)
|
||||||
|
Curtailment/settlement/other
1
|
683
|
|
(36
|
)
|
—
|
|
—
|
|
—
|
|
—
|
|
||||||
|
Net periodic benefit costs - Total
|
$
|
1,026
|
|
$
|
389
|
|
$
|
755
|
|
$
|
91
|
|
$
|
55
|
|
$
|
60
|
|
|
Less: Discontinued operations
|
1
|
|
—
|
|
—
|
|
—
|
|
—
|
|
—
|
|
||||||
|
Net periodic benefit costs - Continuing operations
|
$
|
1,025
|
|
$
|
389
|
|
$
|
755
|
|
$
|
91
|
|
$
|
55
|
|
$
|
60
|
|
|
Changes in plan assets and benefit obligations recognized in other comprehensive (income) loss:
|
||||||||||||||||||
|
Net (gain) loss
|
$
|
680
|
|
$
|
1,954
|
|
$
|
(127
|
)
|
$
|
(131
|
)
|
$
|
14
|
|
$
|
11
|
|
|
Prior service cost
|
14
|
|
—
|
|
63
|
|
—
|
|
—
|
|
—
|
|
||||||
|
Amortization of prior service credit
|
25
|
|
24
|
|
28
|
|
—
|
|
3
|
|
2
|
|
||||||
|
Amortization of unrecognized gain (loss)
|
(638
|
)
|
(587
|
)
|
(706
|
)
|
6
|
|
7
|
|
11
|
|
||||||
|
Settlement loss
2
|
(687
|
)
|
—
|
|
—
|
|
—
|
|
—
|
|
—
|
|
||||||
|
Total recognized in other comprehensive (income) loss
|
$
|
(606
|
)
|
$
|
1,391
|
|
$
|
(742
|
)
|
$
|
(125
|
)
|
$
|
24
|
|
$
|
24
|
|
|
Total recognized in net periodic benefit cost and other comprehensive (income) loss
|
$
|
420
|
|
$
|
1,780
|
|
$
|
13
|
|
$
|
(34
|
)
|
$
|
79
|
|
$
|
84
|
|
|
1.
|
The 2017 impact relates to the settlement of a Dow U.S. non-qualified plan triggered by a change in control provision. The 2016 impact relates to the curtailment of benefits for certain participants of a Dow Corning plan in the U.S.
|
|
2.
|
The 2017 impact relates to the settlement of a Dow U.S. non-qualified plan triggered by a change in control provision.
|
The estimated pretax net (gain) loss and prior service credit for defined benefit pension and OPEB plans that will be amortized from accumulated other comprehensive loss into net periodic benefit cost during 2018 are summarized below:
|
Estimated Pretax Amortization of Net (Gain) Loss and Prior Service Credit for the Year Ended Dec 31
|
2018
|
||
|
In millions
|
|||
|
Defined Benefit Pension Plans:
|
|||
|
Net loss
|
$
|
678
|
|
|
Prior service credit
|
$
|
(25
|
)
|
|
Other Postretirement Benefit Plans:
|
|||
|
Net gain
|
$
|
(24
|
)
|
Estimated Future Benefit Payments
The estimated future benefit payments, reflecting expected future service, as appropriate, are presented in the following table:
|
Estimated Future Benefit Payments at Dec 31, 2017
|
Defined Benefit Pension Plans
|
Other Postretirement Benefits
|
||||
|
In millions
|
||||||
|
2018
|
$
|
3,107
|
|
$
|
376
|
|
|
2019
|
3,116
|
|
360
|
|
||
|
2020
|
3,133
|
|
354
|
|
||
|
2021
|
3,158
|
|
344
|
|
||
|
2022
|
3,180
|
|
333
|
|
||
|
2023-2027
|
16,050
|
|
1,433
|
|
||
|
Total
|
$
|
31,744
|
|
$
|
3,200
|
|
153
Plan Assets
Dow
Plan assets consist primarily of equity and fixed income securities of U.S. and foreign issuers, and include alternative investments such as real estate, private equity and absolute return strategies. At
December 31, 2017
, plan assets totaled
$23.4 billion
and included
no
directly held common stock of DowDuPont. At
December 31, 2016
, plan assets totaled
$21.2 billion
and included
no
directly held common stock of Dow.
Dow's investment strategy for the plan assets is to manage the assets in relation to the liability in order to pay retirement benefits to plan participants over the life of the plans. This is accomplished by identifying and managing the exposure to various market risks, diversifying investments across various asset classes and earning an acceptable long-term rate of return consistent with an acceptable amount of risk, while considering the liquidity needs of the plans.
The plans are permitted to use derivative instruments for investment purposes, as well as for hedging the underlying asset and liability exposure and rebalancing the asset allocation. The plans use value-at-risk, stress testing, scenario analysis and Monte Carlo simulations to monitor and manage both the risk within the portfolios and the surplus risk of the plans.
Equity securities primarily include investments in large- and small-cap companies located in both developed and emerging markets around the world. Fixed income securities include investment and non-investment grade corporate bonds of companies diversified across industries, U.S. treasuries, non-U.S. developed market securities, U.S. agency mortgage-backed securities, emerging market securities and fixed income related funds. Alternative investments primarily include investments in real estate, private equity limited partnerships and absolute return strategies. Other significant investment types include various insurance contracts; and interest rate, equity, commodity and foreign exchange derivative investments and hedges.
Dow mitigates the credit risk of investments by establishing guidelines with investment managers that limit investment in any single issue or issuer to an amount that is not material to the portfolio being managed. These guidelines are monitored for compliance both by Dow and external managers. Credit risk related to derivative activity is mitigated by utilizing multiple counterparties, collateral support agreements and centralized clearing, where appropriate.
The Northern Trust Collective Government Short Term Investment money market fund is utilized as the sweep vehicle for the U.S. plans, which from time to time can represent a significant investment. For one U.S. plan, approximately
35 percent
of the liability is covered by a participating group annuity issued by Prudential Insurance Company.
DuPont
Plan assets consist primarily of equity and fixed income securities of U.S. and foreign issuers, and include alternative investments such as real estate and private market securities. At December 31, 2017, plan assets totaled
$20.3 billion
and included directly held common stock of DowDuPont of
$910 million
.
All pension plan assets in the U.S. are invested through a single master trust fund. The strategic asset allocation for this trust fund is approved by management. The general principles guiding U.S. pension asset investment policies are those embodied in the Employee Retirement Income Security Act of 1974 ("ERISA"). These principles include discharging DuPont's investment responsibilities for the exclusive benefit of plan participants and in accordance with the "prudent expert" standard and other ERISA rules and regulations. DuPont establishes strategic asset allocation percentage targets and appropriate benchmarks for significant asset classes with the aim of achieving a prudent balance between return and risk. Strategic asset allocations in other countries are selected in accordance with the laws and practices of those countries. Where appropriate, asset liability studies are utilized in this process. U.S. plan assets and a portion of non-U.S. plan assets are managed by investment professionals employed by DuPont. The remaining assets are managed by professional investment firms unrelated to DuPont. DuPont's pension investment professionals have discretion to manage the assets within established asset allocation ranges approved by management. Additionally, pension trust funds are permitted to enter into certain contractual arrangements generally described as derivative instruments. Derivatives are primarily used to reduce specific market risks, hedge currency and adjust portfolio duration and asset allocation in a cost-effective manner.
Global equity securities include varying market capitalization levels. U.S. equity investments are primarily large-cap companies. Global fixed income investments include corporate-issued, government-issued and asset-backed securities. Corporate debt investments include a range of credit risk and industry diversification. U.S. fixed income investments are weighted heavier than non-U.S fixed income securities. Other investments include cash and cash equivalents, hedge funds, real estate and private market securities such as interests in private equity and venture capital partnerships.
154
DowDuPont
The weighted-average target allocation for plan assets of Dow and DuPont's pension plans is summarized as follows:
|
Target Allocation for Plan Assets at Dec 31, 2017
|
Dow
|
DuPont
|
||
|
Asset Category
|
||||
|
Equity securities
|
36
|
%
|
35
|
%
|
|
Fixed income securities
|
35
|
|
50
|
|
|
Alternative investments
|
28
|
|
13
|
|
|
Other investments
|
1
|
|
2
|
|
|
Total
|
100
|
%
|
100
|
%
|
Fair value calculations may not be indicative of net realizable value or reflective of future fair values. Furthermore, although the Company believes its valuation methods are appropriate and consistent with other market participants, the use of different methodologies or assumptions to determine the fair value of certain financial instruments could result in a different fair value measurement at the reporting date.
For pension plan assets classified as Level 1 measurements (measured using quoted prices in active markets), total fair value is either the price of the most recent trade at the time of the market close or the official close price, as defined by the exchange on which the asset is most actively traded on the last trading day of the period, multiplied by the number of units held without consideration of transaction costs.
For pension plan assets classified as Level 2 measurements, where the security is frequently traded in less active markets, fair value is based on the closing price at the end of the period; where the security is less frequently traded, fair value is based on the price a dealer would pay for the security or similar securities, adjusted for any terms specific to that asset or liability. Market inputs are obtained from well-established and recognized vendors of market data and subjected to tolerance and quality checks. For derivative assets and liabilities, standard industry models are used to calculate the fair value of the various financial instruments based on significant observable market inputs, such as foreign exchange rates, commodity prices, swap rates, interest rates and implied volatilities obtained from various market sources. For other pension plan assets for which observable inputs are used, fair value is derived through the use of fair value models, such as a discounted cash flow model or other standard pricing models.
For pension plan assets classified as Level 3 measurements, total fair value is based on significant unobservable inputs including assumptions where there is little, if any, market activity for the investment. Investment managers or fund managers provide valuations of the investment on a monthly or quarterly basis. These valuations are reviewed for reasonableness based on applicable sector, benchmark and company performance. Adjustments to valuations are made where appropriate. Where available, audited financial statements are obtained and reviewed for the investments as support for the manager’s investment valuation. Some pension plan assets are held in funds where fair value is based on an estimated net asset value per share (or its equivalent) as of the most recently available fund financial statements, and adjusted for estimated earnings and investment activity. These funds are classified as Level 3 due to the significant unobservable inputs inherent in the fair value measurement.
155
The following table summarizes the bases used to measure the Company’s pension plan assets at fair value for the years ended
December 31, 2017
and
2016
:
|
Basis of Fair Value Measurements
|
Dec 31, 2017
|
Dec 31, 2016
1
|
||||||||||||||||||||||
|
In millions
|
Total
|
Level 1
|
Level 2
|
Level 3
|
Total
|
Level 1
|
Level 2
|
Level 3
|
||||||||||||||||
|
Cash and cash equivalents
|
$
|
3,829
|
|
$
|
3,728
|
|
$
|
101
|
|
$
|
—
|
|
$
|
879
|
|
$
|
867
|
|
$
|
12
|
|
$
|
—
|
|
|
Equity securities:
|
||||||||||||||||||||||||
|
U.S. equity securities
2
|
$
|
7,798
|
|
$
|
7,428
|
|
$
|
353
|
|
$
|
17
|
|
$
|
3,645
|
|
$
|
3,208
|
|
$
|
436
|
|
$
|
1
|
|
|
Non - U.S. equity securities
|
8,615
|
|
7,399
|
|
1,173
|
|
43
|
|
4,288
|
|
3,564
|
|
692
|
|
32
|
|
||||||||
|
Total equity securities
|
$
|
16,413
|
|
$
|
14,827
|
|
$
|
1,526
|
|
$
|
60
|
|
$
|
7,933
|
|
$
|
6,772
|
|
$
|
1,128
|
|
$
|
33
|
|
|
Fixed income securities:
|
||||||||||||||||||||||||
|
Debt - government-issued
|
$
|
7,859
|
|
$
|
655
|
|
$
|
7,203
|
|
$
|
1
|
|
$
|
3,970
|
|
$
|
136
|
|
$
|
3,834
|
|
$
|
—
|
|
|
Debt - corporate-issued
|
6,481
|
|
621
|
|
5,819
|
|
41
|
|
3,187
|
|
306
|
|
2,866
|
|
15
|
|
||||||||
|
Debt - asset-backed
|
807
|
|
17
|
|
787
|
|
3
|
|
97
|
|
—
|
|
95
|
|
2
|
|
||||||||
|
Total fixed income securities
|
$
|
15,147
|
|
$
|
1,293
|
|
$
|
13,809
|
|
$
|
45
|
|
$
|
7,254
|
|
$
|
442
|
|
$
|
6,795
|
|
$
|
17
|
|
|
Alternative investments:
|
||||||||||||||||||||||||
|
Hedge funds
|
$
|
1,678
|
|
$
|
—
|
|
$
|
746
|
|
$
|
932
|
|
$
|
1,670
|
|
$
|
92
|
|
$
|
631
|
|
$
|
947
|
|
|
Private market securities
|
1,404
|
|
—
|
|
—
|
|
1,404
|
|
1,128
|
|
—
|
|
—
|
|
1,128
|
|
||||||||
|
Real estate
|
2,563
|
|
260
|
|
7
|
|
2,296
|
|
2,087
|
|
21
|
|
24
|
|
2,042
|
|
||||||||
|
Derivatives - asset position
|
285
|
|
5
|
|
280
|
|
—
|
|
367
|
|
2
|
|
365
|
|
—
|
|
||||||||
|
Derivatives - liability position
|
(321
|
)
|
(2
|
)
|
(319
|
)
|
—
|
|
(374
|
)
|
(2
|
)
|
(372
|
)
|
—
|
|
||||||||
|
Total alternative investments
|
$
|
5,609
|
|
$
|
263
|
|
$
|
714
|
|
$
|
4,632
|
|
$
|
4,878
|
|
$
|
113
|
|
$
|
648
|
|
$
|
4,117
|
|
|
Other investments
|
$
|
277
|
|
$
|
37
|
|
$
|
238
|
|
$
|
2
|
|
$
|
351
|
|
$
|
30
|
|
$
|
226
|
|
$
|
95
|
|
|
Subtotal
|
$
|
41,275
|
|
$
|
20,148
|
|
$
|
16,388
|
|
$
|
4,739
|
|
$
|
21,295
|
|
$
|
8,224
|
|
$
|
8,809
|
|
$
|
4,262
|
|
|
Investments measured at net asset value:
|
||||||||||||||||||||||||
|
Hedge funds
|
$
|
747
|
|
$
|
—
|
|
||||||||||||||||||
|
Private market securities
|
1,383
|
|
—
|
|
||||||||||||||||||||
|
Real estate
|
437
|
|
—
|
|
||||||||||||||||||||
|
Total investments measured at net asset value
|
$
|
2,567
|
|
$
|
—
|
|
||||||||||||||||||
|
Items to reconcile to fair value of plan assets:
|
||||||||||||||||||||||||
|
Pension trust receivables
3
|
$
|
154
|
|
|
|
|
|
|
|
$
|
38
|
|
|
|
|
|
|
|
||||||
|
Pension trust payables
4
|
(311
|
)
|
|
|
|
|
|
|
(125
|
)
|
||||||||||||||
|
Total
|
$
|
43,685
|
|
|
|
|
|
|
|
$
|
21,208
|
|
|
|
|
|
|
|
||||||
|
1.
|
As a result of the Merger, certain asset categories and classifications of prior period amounts were revised to improve comparability and conform with the current period presentation, including reclassifying cash and cash equivalents of
$794 million
, equity securities of
$1,646 million
, fixed income securities of
$442 million
, alternative investments of
$92 million
and other investments of
$30 million
from Level 2 to Level 1. Further, pension trust receivables and pension trust payables previously presented as Level 2 investments are now separately presented.
|
|
2.
|
DuPont's pension plans directly held
$910 million
(
2 percent
of total plan assets) of DowDuPont common stock at
December 31, 2017
.
|
|
3.
|
Primarily receivables for investment securities sold.
|
|
4.
|
Primarily payables for investment securities purchased.
|
156
The following table summarizes the changes in the fair value of Level 3 pension plan assets for the years ended
December 31, 2017
and
2016
:
|
Fair Value Measurement of Level 3 Pension Plan Assets
1
|
Equity Securities
|
Fixed Income Securities
|
Alternative Investments
|
Other Investments
|
Total
|
||||||||||
|
In millions
|
|||||||||||||||
|
Balance at Jan 1, 2016
|
$
|
28
|
|
$
|
17
|
|
$
|
3,797
|
|
$
|
38
|
|
$
|
3,880
|
|
|
Actual return on assets:
|
|
||||||||||||||
|
Relating to assets sold during 2016
|
—
|
|
2
|
|
163
|
|
(7
|
)
|
158
|
|
|||||
|
Relating to assets held at Dec 31, 2016
|
7
|
|
(1
|
)
|
(15
|
)
|
11
|
|
2
|
|
|||||
|
Purchases, sales and settlements, net
|
—
|
|
(4
|
)
|
172
|
|
53
|
|
221
|
|
|||||
|
Transfers out of Level 3, net
|
(2
|
)
|
3
|
|
—
|
|
—
|
|
1
|
|
|||||
|
Balance at Dec 31, 2016
|
$
|
33
|
|
$
|
17
|
|
$
|
4,117
|
|
$
|
95
|
|
$
|
4,262
|
|
|
Assumed in Merger
|
18
|
|
48
|
|
115
|
|
—
|
|
181
|
|
|||||
|
Actual return on assets:
|
|||||||||||||||
|
Relating to assets sold during 2017
|
(1
|
)
|
(3
|
)
|
163
|
|
6
|
|
165
|
|
|||||
|
Relating to assets held at Dec 31, 2017
|
5
|
|
6
|
|
78
|
|
(5
|
)
|
84
|
|
|||||
|
Purchases, sales and settlements, net
|
5
|
|
(23
|
)
|
159
|
|
(94
|
)
|
47
|
|
|||||
|
Balance at Dec 31, 2017
|
$
|
60
|
|
$
|
45
|
|
$
|
4,632
|
|
$
|
2
|
|
$
|
4,739
|
|
|
1.
|
As a result of the Merger, certain classifications of prior period amounts have been revised to improve comparability with the current period presentation, including the reclassification of
$1 million
at December 31, 2016 of assets from equity securities to alternative investments and
$481 million
at December 31, 2016 (
$276 million
at January 1, 2016) of assets from fixed income securities to alternative investments.
|
The following table presents additional information about the pension plan assets for DuPont using net asset value as a practical expedient:
|
Net Asset Value as a Practical Expedient
|
2017
|
|||||||
|
In millions
|
Fair Value
|
Unfunded Commitments
|
Redemption Frequency
|
Redemption Notice Period Range
|
||||
|
Hedge funds
1
|
$
|
747
|
|
$
|
—
|
|
Monthly, Quarterly
|
Ranges from 15-45 days monthly, 10-185 days quarterly
|
|
Private market securities
2
|
1,383
|
|
797
|
|
Not applicable
|
Not applicable
|
||
|
Real Estate
2
|
437
|
|
371
|
|
Not applicable
|
Not applicable
|
||
|
Total
|
$
|
2,567
|
|
$
|
1,168
|
|
||
|
1.
|
Less than
5 percent
of hedge funds have gates in place at the investor level for year-end redemptions. Hedge funds also contain either no lock up or a lock up period of less than
one
year.
|
2. The remaining life of private market securities and real estate funds is an average of
15
years per investment.
Trust Assets
DuPont entered into a trust agreement in 2013 (as amended and restated in 2017) that established and requires DuPont to fund a trust (the "Trust") for cash obligations under certain non-qualified benefit and deferred compensation plans upon a change in control event as defined in the Trust agreement. Under the Trust agreement, the consummation of the Merger was a change in control event. As a result, in November 2017, DuPont contributed
$571 million
to the Trust. In the fourth quarter of 2017,
$13 million
was distributed to DuPont according to the Trust agreement and at December 31, 2017, the balance in the Trust was
$558 million
.
Defined Contribution Plans
Dow
U.S. employees may participate in defined contribution plans (Employee Savings Plans or 401(k) plans) by contributing a portion of their compensation, which is partially matched by Dow. Defined contribution plans also cover employees in some subsidiaries in other countries, including Australia, Brazil, Canada, Italy, Spain and the United Kingdom. Expense recognized for all defined contribution plans was
$367 million
in
2017
,
$283 million
in
2016
and
$235 million
in
2015
.
157
DuPont
DuPont provides defined contribution benefits to its employees. The most significant is the U.S. Retirement Savings Plan ("the Plan"), which covers all U.S. full-service employees. This Plan includes a non-leveraged Employee Stock Ownership Plan ("ESOP"). Employees are not required to participate in the ESOP and those who do are free to diversify out of the ESOP. The purpose of the Plan is to provide retirement savings benefits for employees and to provide employees an opportunity to become stockholders of the Company. The Plan is a tax qualified contributory profit sharing plan, with cash or deferred arrangement and any eligible employee of DuPont may participate. Currently, DuPont contributes
100 percent
of the first
6 percent
of the employee's contribution election and also contributes
3 percent
of each eligible employee's eligible compensation regardless of the employee's contribution.
DuPont's post-Merger contributions to the Plan were
$53 million
in 2017. DuPont's matching contributions vest immediately upon contribution. The
3 percent
nonmatching employer contribution vests after employees complete
three
years of service. In addition, DuPont made post-Merger contributions to other defined contribution plans of
$17 million
for the year ended
December 31, 2017
. Included in DuPont's contributions are amounts related to discontinued operations of
$1 million
for the year ended
December 31, 2017
.
NOTE
20
- STOCK-BASED COMPENSATION
Through the Dow and DuPont equity incentive plans, the Company grants stock-based compensation to employees and non‑employee directors. Effective with the Merger, on August 31, 2017, DowDuPont assumed all Dow and DuPont equity incentive compensation awards outstanding immediately prior to the Merger. The previous DuPont equity awards were converted into the right to receive
1.2820
shares of DowDuPont Common Stock and had a fair value of approximately
$629 million
at the Merger closing date. The converted DuPont equity awards were measured at their fair value and included
$485 million
as consideration exchanged and
$144 million
which is being amortized to stock compensation expense over the remaining vesting period of the awards. The fair values of the converted awards were based on valuation assumptions developed by management and other information including, but not limited to, historical volatility and exercise trends of Dow and DuPont. All outstanding Dow stock options and deferred stock awards were converted into stock options and deferred stock awards with respect to DowDuPont Common Stock. All outstanding and nonvested Dow performance deferred stock awards were converted into deferred stock awards with respect to DowDuPont Common Stock at the greater of the applicable performance target or the actual performance as of the effective time of the Merger.
In addition, the Company also assumed sponsorship of each equity incentive compensation plan of Dow and DuPont. Dow and DuPont did not merge their equity incentive plans as a result of the Merger. The plans continue in place with the ability to grant and issue DowDuPont common stock. A description of Dow and DuPont stock-based compensation is discussed below.
The total stock-based compensation expense included in continuing operations in the consolidated statements of income was
$392 million
,
$261 million
and
$352 million
in
2017
,
2016
and
2015
, respectively. The income tax benefits related to stock-based compensation arrangements were
$144 million
,
$97 million
and
$129 million
in
2017
,
2016
and
2015
, respectively.
Accounting for Stock-Based Compensation
The Company grants stock-based compensation awards that vest over a specified period or upon employees meeting certain performance and/or retirement eligibility criteria. The fair value of equity instruments issued to employees is measured on the grant date. The fair value of liability instruments issued to employees is measured at the end of each quarter. The fair value of equity and liability instruments is expensed over the vesting period or, in the case of retirement, from the grant date to the date on which retirement eligibility provisions have been met and additional service is no longer required. The Company estimates expected forfeitures.
Dow Plans
Dow grants stock-based compensation to employees and non-employee directors in the form of stock incentive plans, which include stock options, deferred stock and restricted stock. Dow also provides stock-based compensation in the form of performance deferred stock and the Employee Stock Purchase Plan ("ESPP"), which grants eligible employees the right to purchase shares of Dow Common Stock at a discounted price.
158
Dow Valuation Methods and Assumptions
Dow historically used a lattice-based option valuation model to estimate the fair value of stock options and used a Monte Carlo simulation for the market portion of performance deferred stock awards. Dow used the Black-Scholes option valuation model for subscriptions to purchase shares under the ESPP. The weighted-average assumptions used to calculate total stock-based compensation are included in the following table:
|
Dow Weighted-Average Assumptions
|
2017
|
2016
|
2015
|
|||
|
Dividend yield
|
3.01
|
%
|
4.13
|
%
|
3.54
|
%
|
|
Expected volatility
|
23.71
|
%
|
31.60
|
%
|
27.84
|
%
|
|
Risk-free interest rate
|
1.28
|
%
|
1.12
|
%
|
1.02
|
%
|
|
Expected life of stock options granted during period (years)
|
7.5
|
|
7.8
|
|
7.7
|
|
|
Life of Employee Stock Purchase Plan (months)
|
3
|
|
4
|
|
6
|
|
The dividend yield assumption was equal to the dividend yield on the grant date, which reflected the most recent quarterly dividend payment of
$0.46
per share in
2017
(
$0.46
per share in
2016
and
$0.42
per share in
2015
). The expected volatility assumptions for stock options and ESPP were based on an equal weighting of the historical daily volatility for the term of the awards and current implied volatility from exchange-traded options. The expected volatility assumption for the market portion of the performance deferred stock awards was based on historical daily volatility for the term of the award. The risk-free interest rate was based on the weighted-average of U.S. Treasury strip rates over the contractual term of the options. The expected life of stock options granted was based on an analysis of historical exercise patterns.
Dow Stock Incentive Plan
Dow historically granted equity awards under various plans (the "Prior Plans"). On February 9, 2012, Dow's Board authorized The Dow Chemical Company 2012 Stock Incentive Plan (the "2012 Plan"), which was approved by stockholders at Dow's annual meeting on May 10, 2012 ("Original Effective Date") and became effective on that date. On February 13, 2014, Dow's Board adopted The Dow Chemical Company Amended and Restated 2012 Stock Incentive Plan (the "2012 Restated Plan"). The 2012 Restated Plan was approved by stockholders at Dow's annual meeting on May 15, 2014, and became effective on that date. The Prior Plans were superseded by the 2012 Plan and the 2012 Restated Plan (collectively, the "2012 Plan"). Under the 2012 Plan, Dow may grant options, deferred stock, performance deferred stock, restricted stock, stock appreciation rights and stock units to employees and non-employee directors until the tenth anniversary of the Original Effective Date, subject to an aggregate limit and annual individual limits. The terms of the grants are fixed at the grant date. Dow's stock-based compensation programs were assumed by DowDuPont and continue in place with the ability to grant and issue DowDuPont common stock. At December 31, 2017, there were
29 million
shares of DowDuPont common stock available for grant under the 2012 Plan.
In connection with the Merger, on August 31, 2017 ("Conversion Date") all outstanding Dow stock options and deferred stock awards were converted into stock options and deferred stock awards with respect to DowDuPont Common Stock. The stock options and deferred stock awards have the same terms and conditions under the applicable plans and award agreements prior to the Merger. All outstanding and nonvested performance deferred stock awards were converted into deferred stock awards with respect to DowDuPont Common Stock at the greater of the applicable performance target or the actual performance as of the effective time of the Merger. Changes in the fair value of liability instruments are recognized as compensation expense each quarter.
Dow Stock Options
Dow grants stock options to certain employees, subject to certain annual and individual limits, with terms of the grants fixed at the grant date. The exercise price of each stock option equals the market price of Dow’s stock on the grant date. Options vest from
one
to
three
years, and have a maximum term of
10
years.
159
The following table summarizes stock option activity for
2017
:
|
Dow Stock Options
|
2017
|
|||||
|
Shares in thousands
|
Shares
|
Exercise Price
1
|
||||
|
Outstanding at Jan 1, 2017
|
34,770
|
|
$
|
36.20
|
|
|
|
Granted
|
2,221
|
|
$
|
61.19
|
|
|
|
Exercised
|
(10,194
|
)
|
$
|
36.02
|
|
|
|
Forfeited/Expired
|
(169
|
)
|
$
|
43.75
|
|
|
|
Outstanding at Dec 31, 2017
|
26,628
|
|
$
|
38.30
|
|
|
|
Remaining contractual life in years
|
|
5.10
|
|
|||
|
Aggregate intrinsic value in millions
|
$
|
877
|
|
|
||
|
Exercisable at Dec 31, 2017
|
22,019
|
|
$
|
35.16
|
|
|
|
Remaining contractual life in years
|
|
4.43
|
|
|||
|
Aggregate intrinsic value in millions
|
$
|
794
|
|
|
||
1. Weighted-average per share.
|
Additional Information about Dow Stock Options
|
|||||||||
|
In millions, except per share amounts
|
2017
|
2016
|
2015
|
||||||
|
Weighted-average fair value per share of options granted
|
$
|
14.44
|
|
$
|
10.95
|
|
$
|
11.61
|
|
|
Total compensation expense for stock options plans
|
$
|
37
|
|
$
|
32
|
|
$
|
55
|
|
|
Related tax benefit
|
$
|
14
|
|
$
|
12
|
|
$
|
20
|
|
|
Total amount of cash received from the exercise of options
|
$
|
310
|
|
$
|
312
|
|
$
|
377
|
|
|
Total intrinsic value of options exercised
1
|
$
|
286
|
|
$
|
153
|
|
$
|
175
|
|
|
Related tax benefit
|
$
|
106
|
|
$
|
57
|
|
$
|
65
|
|
1. Difference between the market price at exercise and the price paid by the employee to exercise the options.
Total unrecognized pretax compensation cost related to nonvested stock option awards of
$15 million
at
December 31, 2017
, is expected to be recognized over a weighted-average period of
1.65 years
.
Dow Deferred Stock
Dow grants deferred stock to certain employees. The grants vest after a designated period of time, generally
one
to
three
years. The following table shows changes in nonvested deferred stock, including the conversion of nonvested performance deferred stock awards into deferred stock awards as a result of the Merger:
|
Dow Deferred Stock
|
2017
|
||||
|
Shares in thousands
|
Shares
|
Grant Date Fair Value
1
|
|||
|
Nonvested at Jan 1, 2017
|
6,382
|
|
$
|
47.49
|
|
|
Granted
|
1,709
|
|
$
|
61.29
|
|
|
Vested
|
(2,804
|
)
|
$
|
47.60
|
|
|
Canceled
|
(112
|
)
|
$
|
50.14
|
|
|
Conversion of performance deferred stock awards at Conversion Date
|
8,171
|
|
$
|
49.94
|
|
|
Nonvested at Dec 31, 2017
|
13,346
|
|
$
|
50.71
|
|
1. Weighted-average per share.
160
|
Additional Information about Dow Deferred Stock
|
|||||||||
|
In millions, except per share amounts
|
2017
|
2016
|
2015
|
||||||
|
Weighted-average fair value per share of deferred stock granted
|
$
|
61.29
|
|
$
|
46.25
|
|
$
|
49.42
|
|
|
Total fair value of deferred stock vested
|
$
|
179
|
|
$
|
166
|
|
$
|
162
|
|
|
Related tax benefit
|
$
|
66
|
|
$
|
61
|
|
$
|
60
|
|
|
Total compensation expense for deferred stock awards
|
$
|
178
|
|
$
|
97
|
|
$
|
110
|
|
|
Related tax benefit
|
$
|
66
|
|
$
|
36
|
|
$
|
41
|
|
Total unrecognized pretax compensation cost related to deferred stock awards of
$165 million
at
December 31, 2017
, is expected to be recognized over a weighted-average period of
1.64
years. At
December 31, 2017
, approximately
20,000
deferred shares with a grant date weighted-average fair value per share of
$35.99
had previously vested, but were not issued. These shares are scheduled to be issued to employees within
one
to
three
years or upon retirement.
Total incremental pretax compensation expense resulting from the conversion of performance deferred stock awards into deferred stock awards was
$25 million
(
$20 million
was recognized in the second half of 2017 and
$5 million
to be recognized over the remaining service period). Approximately
5,000
employees were impacted by the conversion.
Dow Performance Deferred Stock
Dow grants performance deferred stock to certain employees. The grants vest when specified performance targets are attained, such as return on capital and relative total shareholder return, over a predetermined period, generally
one
to
three
years. In November 2017, DowDuPont granted performance deferred stock to senior leadership measured on the realization of cost savings in connection with cost synergy commitments, as well as the Company’s ability to complete the Intended Business Separations. Performance and payouts are determined independently for each metric. Compensation expense related to performance deferred stock awards is recognized over the lesser of the service or performance period. Changes in the fair value of liability instruments are recognized as compensation expense each quarter.
The following table shows the performance deferred stock awards granted:
|
Dow Performance Deferred Stock Awards
|
Target Shares Granted
1
|
Grant Date Fair Value
2
|
||||
|
Shares in thousands
|
||||||
|
Year
|
Performance Period
|
|||||
|
2017
|
Sep 1, 2017 - Aug 31, 2019
|
232
|
|
$
|
71.16
|
|
|
2017
3
|
Jan 1, 2017 - Dec 31, 2019
|
1,728
|
|
$
|
81.99
|
|
|
2016
3
|
Jan 1, 2016 - Dec 31, 2018
|
2,283
|
|
$
|
52.68
|
|
|
2015
3
|
Jan 1, 2015 - Dec 31, 2017
|
2,258
|
|
$
|
59.08
|
|
1. At the end of the performance period, the actual number of shares issued can range from
zero
to
200
percent of the target shares granted.
2. Weighted-average per share.
3. Converted to deferred stock awards at Conversion Date.
The following table shows changes in nonvested performance deferred stock, including the conversion of nonvested performance deferred stock awards into deferred stock awards as a result of the Merger:
|
Dow Performance Deferred Stock
|
2017
|
||||
|
Shares in thousands
|
Target Shares Granted
|
Grant Date Fair Value
1
|
|||
|
Nonvested at Jan 1, 2017
|
4,454
|
|
$
|
55.85
|
|
|
Granted
|
1,960
|
|
$
|
80.71
|
|
|
Canceled
|
(131
|
)
|
$
|
58.91
|
|
|
Converted to deferred stock awards
|
(6,051
|
)
|
$
|
63.24
|
|
|
Nonvested at Dec 31, 2017
|
232
|
|
$
|
71.16
|
|
1. Weighted-average per share.
161
|
Additional Information about Dow Performance Deferred Stock
|
|||||||||
|
In millions, except share amounts
|
2017
|
2016
|
2015
|
||||||
|
Total fair value of performance deferred stock vested and delivered
1
|
$
|
202
|
|
$
|
103
|
|
$
|
37
|
|
|
Related tax benefit
|
$
|
75
|
|
$
|
38
|
|
$
|
14
|
|
|
Total compensation expense for performance deferred stock awards
|
$
|
106
|
|
$
|
125
|
|
$
|
172
|
|
|
Related tax benefit
|
$
|
39
|
|
$
|
46
|
|
$
|
63
|
|
|
Shares of performance deferred stock settled in cash (in thousands)
2
|
616
|
861
|
327
|
||||||
|
Total cash paid to settle performance deferred stock awards
3
|
$
|
38
|
|
$
|
40
|
|
$
|
16
|
|
1. Includes the fair value of shares vested in prior years and delivered in the reporting year.
2. Performance deferred stock awards vested in prior years and delivered in the reporting year.
3. Cash paid to certain executive employees for performance deferred stock awards vested in prior periods and delivered in the reporting year, equal to the value of the stock award on the date of delivery.
Total unrecognized pretax compensation cost related to performance deferred stock awards of
$15 million
at
December 31, 2017
, is expected to be recognized over a weighted-average period of
1.66 years
.
Dow Restricted Stock
Under the 2012 Plan, Dow may grant shares (including options, stock appreciation rights, stock units and restricted stock) to non‑employee directors over the
10
-year duration of the program, subject to the plan's aggregate limit as well as annual individual limits. The restricted stock issued under this plan cannot be sold, assigned, pledged or otherwise transferred by the non-employee director, until retirement or termination of service to Dow. The following table shows the restricted stock issued under this plan:
|
Dow Restricted Stock
|
Shares Issued (in thousands)
|
Weighted-Average Fair Value
|
|||
|
Year
|
|||||
|
2017
|
33
|
|
$
|
62.04
|
|
|
2016
|
32
|
|
$
|
50.55
|
|
|
2015
|
32
|
|
$
|
51.51
|
|
Dow Employee Stock Purchase Plan
On February 9, 2012, Dow's Board authorized The Dow Chemical Company 2012 Employee Stock Purchase Plan (the "2012 ESPP") which was approved by stockholders at Dow’s annual meeting on May 10, 2012. Under the 2017 annual offering, most employees were eligible to purchase shares of common stock of Dow valued at up to
10 percent
of their annual base salary. The value is determined using the plan price multiplied by the number of shares subscribed to by the employee. The plan price of the stock is set at an amount equal to at least
85 percent
of the fair market value (closing price) of the common stock on a date during the fourth quarter of the year prior to the offering, or the average fair market value (closing price) of the common stock over a period during the fourth quarter of the year prior to the offering, in each case, specified by Dow's Executive Vice President of Human Resources. The most recent offering of Dow's 2012 ESPP closed on July 15, 2017, and no current offerings remain outstanding.
|
Dow Employee Stock Purchase Plan
|
2017
|
||||
|
Shares in thousands
|
Shares
|
Exercise Price
1
|
|||
|
Outstanding and exercisable at Jan 1, 2017
|
—
|
|
$
|
—
|
|
|
Granted
|
3,578
|
|
$
|
50.22
|
|
|
Exercised
|
(3,560
|
)
|
$
|
50.22
|
|
|
Forfeited/Expired
|
(18
|
)
|
$
|
50.22
|
|
|
Outstanding and exercisable at Dec 31, 2017
|
—
|
|
$
|
—
|
|
1. Weighted-average price per share.
162
|
Additional Information about Dow Employee Stock Purchase Plan
|
|||||||||
|
In millions, except per share amounts
|
2017
|
2016
|
2015
|
||||||
|
Weighted-average fair value per share of purchase rights granted
|
$
|
10.70
|
|
$
|
3.40
|
|
$
|
4.62
|
|
|
Total compensation expense for ESPP
|
$
|
38
|
|
$
|
7
|
|
$
|
15
|
|
|
Related tax benefit
|
$
|
14
|
|
$
|
3
|
|
$
|
5
|
|
|
Total amount of cash received from the exercise of purchase rights
|
$
|
179
|
|
$
|
86
|
|
$
|
131
|
|
|
Total intrinsic value of purchase rights exercised
1
|
$
|
48
|
|
$
|
23
|
|
$
|
25
|
|
|
Related tax benefit
|
$
|
18
|
|
$
|
9
|
|
$
|
9
|
|
1. Difference between the market price at exercise and the price paid by the employee to exercise the purchase rights.
DuPont Plans
Prior to the Merger, DuPont provided share-based compensation to its employees through grants of stock options, RSUs and PSUs. Most of these awards have been granted annually in the first quarter of each calendar year. Subsequent to the Merger, DowDuPont assumed sponsorship of the equity incentive compensation plan of DuPont.
DuPont Equity Incentive Plan
DuPont's Equity Incentive Plan ("DuPont EIP"), as amended and restated effective August 31, 2017, provides for equity-based and cash incentive awards to certain employees, directors and consultants. Under the DuPont EIP, the maximum number of shares reserved for the grant or settlement of awards is
110 million
shares, provided that each share in excess of
30 million
that is issued with respect to any award that is not an option or stock appreciation right will be counted against the
110 million
share limit as four and one-half shares. DuPont will satisfy stock option exercises and vesting of RSUs and PSUs with newly issued shares of DowDuPont Common Stock. At
December 31, 2017
, approximately
34 million
shares were authorized for future grants under the EIP.
DuPont Stock Options
The exercise price of shares subject to option is equal to the market price of DuPont's stock on the date of grant. When converted into the right to receive
1.2820
shares of DowDuPont Common Stock, the exercise price was also adjusted by the
1.2820
conversion factor. All options vest serially over a
three
-year period. Stock option awards granted between 2010 and 2015 expire
seven
years after the grant date and options granted in 2016 and 2017 expire
ten
years after the grant date. The plan allows retirement-eligible employees of DuPont to retain any granted awards upon retirement provided the employee has rendered at least
six
months of service following grant date. The awards have the same terms and conditions as were applicable to such equity awards immediately prior to the Merger closing date.
DuPont uses the Black-Scholes option pricing model to determine the fair value of stock option awards and the assumptions set forth in the table below. The weighted-average grant-date fair value of options granted in the period September 1, 2017 through December 31, 2017 was
$28.56
.
|
DuPont Weighted-Average Assumptions
|
2017
|
|
|
Dividend yield
|
2.2
|
%
|
|
Expected volatility
|
23.59
|
%
|
|
Risk-free interest rate
|
2.1
|
%
|
|
Expected life of stock options granted during period (years)
|
7.2
|
|
DuPont determines the dividend yield by dividing the annualized dividend on DowDuPont's Common Stock by the option exercise price. A historical daily measurement of volatility (using DowDuPont stock information after the Merger date and a weighted average of Dow and DuPont prior to Merger date) is determined based on the expected life of the option granted. The risk-free interest rate is determined by reference to the yield on an outstanding U.S. Treasury note with a term equal to the expected life of the option granted. Expected life is determined by reference to DuPont's historical experience, adjusted for expected exercise patterns of in-the-money options.
163
The following table summarizes stock option activity for 2017 under DuPont's EIP:
|
DuPont Stock Options
|
2017
|
|||||
|
Shares in thousands
|
Shares
|
Exercise Price
1
|
||||
|
Outstanding at Sep 1, 2017
|
16,447
|
|
$
|
48.24
|
|
|
|
Granted
|
174
|
|
$
|
45.29
|
|
|
|
Exercised
|
(702
|
)
|
$
|
43.07
|
|
|
|
Forfeited/Expired
|
(30
|
)
|
$
|
54.83
|
|
|
|
Outstanding at Dec 31, 2017
|
15,889
|
|
$
|
48.43
|
|
|
|
Remaining contractual life in years
|
|
|
3.74
|
|
||
|
Aggregate intrinsic value in millions
|
$
|
362
|
|
|
|
|
|
Exercisable at Dec 31, 2017
|
10,881
|
|
$
|
45.75
|
|
|
|
Remaining contractual life in years
|
|
|
3.06
|
|
||
|
Aggregate intrinsic value in millions
|
$
|
277
|
|
|
|
|
1. Weighted-average per share.
The aggregate intrinsic values in the table above represent the total pretax intrinsic value (the difference between the closing stock price on the last trading day of 2017 and the exercise price, multiplied by the number of in-the-money options) that would have been received by the option holders had all option holders exercised their in-the-money options at year end.
At
December 31, 2017
,
$24 million
of total unrecognized pretax compensation cost related to stock options is expected to be recognized over a weighted average period of
1.86
years. Total intrinsic value of options exercised for the period September 1 through December 31, 2017, was
$19 million
, and DuPont realized tax benefits from options exercised of
$6 million
.
DuPont RSUs and PSUs
DuPont issues non-vested RSUs that serially vest over a
three
-year period and, upon vesting, convert
one
-for-one to DowDuPont Common Stock. A retirement eligible employee retains any granted awards upon retirement provided the employee has rendered at least
six
months of service following the grant date. Additional RSUs are also granted periodically to key senior management employees. These RSUs generally vest over periods ranging from
two
to
five
years. The fair value of all stock-settled RSUs is based upon the market price of the underlying common stock as of the grant date. The awards have the same terms and conditions as were applicable to such equity awards immediately prior to the Merger closing date.
DuPont grants PSUs to senior leadership. Upon a change in control, DuPont's EIP provisions required PSUs to be converted into RSUs based on the number of PSUs that would vest by assuming that target levels of performance are achieved. Service requirements for vesting in the RSUs replicate those inherent in the exchanged PSUs.
Vesting for PSUs granted in 2016 and 2017 is based upon total shareholder return ("TSR") relative to peer companies. Vesting for PSUs granted in 2015 is equally based upon change in operating net income relative to target and TSR relative to peer companies. Operating net income is net income attributable to DuPont excluding income from discontinued operations after taxes, significant after-tax benefits (charges), and non-operating pension and other postretirement benefit costs. Performance and payouts are determined independently for each metric. The actual award, delivered as DowDuPont Common Stock, can range from
zero percent
to
200 percent
of the original grant. The weighted-average grant-date fair value of the PSUs granted in 2017, subject to the TSR metric, was
$91.56
, and estimated using a Monte Carlo simulation. The weighted-average grant-date fair value of the PSUs, subject to the revenue metric, was based upon the market price of the underlying common stock as of the grant date.
In accordance with the Merger Agreement, PSUs converted to RSU awards based on an assessment of the underlying market conditions in the PSUs at the greater of target or actual performance levels as of the closing date. As the actual performance levels were not in excess of target as of the closing date, all PSUs converted to RSUs based on target and there was no incremental benefit from the Merger Agreement when compared with DuPont’s EIP.
In November 2017, DowDuPont granted PSUs to senior leadership that vest partially based on the realization of cost savings in connection with cost synergy commitments, as well as DowDuPont’s ability to complete the Intended Business Separations. Performance and payouts are determined independently for each metric. The actual award, delivered in DowDuPont Common Stock, can range from
zero percent
to
200 percent
of the original grant. The weighted-average grant date fair value of the PSUs granted in November 2017 of
$71.16
was based upon the market price of the underlying common stock as of the grant date.
164
At
December 31, 2017
,
$113 million
of total unrecognized pretax compensation cost related to RSUs and PSUs is expected to be recognized over a weighted average period of
1.73
years.
Nonvested awards of RSUs and PSUs are shown below.
|
DuPont RSUs and PSUs
|
2017
|
||||
|
Shares in thousands
|
Shares
|
Weighted Average Grant Date Fair Value
|
|||
|
Nonvested at Sep 1, 2017
|
3,948
|
|
$
|
67.06
|
|
|
Granted
|
412
|
|
$
|
70.02
|
|
|
Vested
|
(139
|
)
|
$
|
67.67
|
|
|
Canceled
|
(23
|
)
|
$
|
66.65
|
|
|
Nonvested at Dec 31, 2017
|
4,198
|
|
$
|
68.28
|
|
The total fair value of RSUs and PSUs vested from September 1 through December 31, 2017 was
$9 million
. The weighted average grant-date fair value of stock units granted during 2017 was
$70.02
.
NOTE
21
- FINANCIAL INSTRUMENTS
The following table summarizes the fair value of financial instruments at
December 31, 2017
and
2016
:
|
Fair Value of Financial Instruments at Dec 31
|
2017
|
2016
|
||||||||||||||||||||||
|
In millions
|
Cost
|
Gain
|
Loss
|
Fair Value
|
Cost
|
Gain
|
Loss
|
Fair Value
|
||||||||||||||||
|
Marketable securities
1
|
$
|
4
|
|
$
|
—
|
|
$
|
—
|
|
$
|
4
|
|
$
|
—
|
|
$
|
—
|
|
$
|
—
|
|
$
|
—
|
|
|
Other investments:
|
||||||||||||||||||||||||
|
Debt securities:
|
||||||||||||||||||||||||
|
Government debt
2
|
$
|
637
|
|
$
|
13
|
|
$
|
(11
|
)
|
$
|
639
|
|
$
|
607
|
|
$
|
13
|
|
$
|
(12
|
)
|
$
|
608
|
|
|
Corporate bonds
|
704
|
|
32
|
|
(3
|
)
|
733
|
|
623
|
|
27
|
|
(5
|
)
|
645
|
|
||||||||
|
Total debt securities
|
$
|
1,341
|
|
$
|
45
|
|
$
|
(14
|
)
|
$
|
1,372
|
|
$
|
1,230
|
|
$
|
40
|
|
$
|
(17
|
)
|
$
|
1,253
|
|
|
Equity securities
|
164
|
|
2
|
|
(26
|
)
|
140
|
|
658
|
|
98
|
|
(50
|
)
|
706
|
|
||||||||
|
Total marketable securities and other investments
|
$
|
1,509
|
|
$
|
47
|
|
$
|
(40
|
)
|
$
|
1,516
|
|
$
|
1,888
|
|
$
|
138
|
|
$
|
(67
|
)
|
$
|
1,959
|
|
|
Long-term debt including debt due within one year
3
|
$
|
(32,123
|
)
|
$
|
69
|
|
$
|
(2,121
|
)
|
$
|
(34,175
|
)
|
$
|
(21,091
|
)
|
$
|
129
|
|
$
|
(1,845
|
)
|
$
|
(22,807
|
)
|
|
Derivatives relating to:
|
||||||||||||||||||||||||
|
Interest rates
|
$
|
—
|
|
$
|
—
|
|
$
|
(4
|
)
|
$
|
(4
|
)
|
$
|
—
|
|
$
|
—
|
|
$
|
(5
|
)
|
$
|
(5
|
)
|
|
Commodities
4
|
$
|
—
|
|
$
|
130
|
|
$
|
(256
|
)
|
$
|
(126
|
)
|
$
|
—
|
|
$
|
56
|
|
$
|
(213
|
)
|
$
|
(157
|
)
|
|
Foreign currency
|
$
|
—
|
|
$
|
31
|
|
$
|
(159
|
)
|
$
|
(128
|
)
|
$
|
—
|
|
$
|
84
|
|
$
|
(30
|
)
|
$
|
54
|
|
1. Debt securities with maturities of less than one year at the time of acquisition.
2. U.S. Treasury obligations, U.S. agency obligations, agency mortgage-backed securities and other municipalities' obligations.
3. Cost includes fair value adjustments of
$511 million
at December 31, 2017 and
$18 million
at December 31, 2016.
4. Presented net of cash collateral.
Cost approximates fair value for all other financial instruments.
165
Investments
The following table provides the investing results from available-for-sale securities for the years ended
December 31, 2017
,
2016
and
2015
.
|
Investing Results
|
|||||||||
|
In millions
|
2017
|
2016
|
2015
|
||||||
|
Proceeds from sales of available-for-sale securities
|
$
|
1,078
|
|
$
|
535
|
|
$
|
565
|
|
|
Gross realized gains
|
$
|
120
|
|
$
|
58
|
|
$
|
96
|
|
|
Gross realized losses
|
$
|
(10
|
)
|
$
|
(2
|
)
|
$
|
(14
|
)
|
The following table summarizes the contractual maturities of the Company’s investments in debt securities:
|
Contractual Maturities of Debt Securities at Dec 31, 2017
|
Amortized Cost
|
Fair Value
|
||||
|
In millions
|
||||||
|
Within one year
|
$
|
7
|
|
$
|
7
|
|
|
One to five years
|
370
|
|
378
|
|
||
|
Six to ten years
|
680
|
|
682
|
|
||
|
After ten years
|
284
|
|
305
|
|
||
|
Total
|
$
|
1,341
|
|
$
|
1,372
|
|
At
December 31, 2017
, the Company had
$6,418 million
(
$3,934 million
at
December 31, 2016
) of held-to-maturity securities (primarily treasury bills and time deposits) classified as cash equivalents, as these securities had maturities of three months or less at the time of purchase. The Company’s investments in held-to-maturity securities are held at amortized cost, which approximates fair value. At
December 31, 2017
, the Company had investments in money market funds of
$509 million
classified as cash equivalents (
$239 million
at
December 31, 2016
) and
$558 million
classified as "Other current assets" in the consolidated balance sheets (
zero
at
December 31, 2016
) due to the restricted nature of its use. See Note
19
for additional information.
At December 31, 2017, the Company had
$952 million
of held-to-maturity securities (primarily time deposits) classified as "Marketable securities" in the consolidated balance sheets as these securities had maturities of more than three months to less than one year at the time of purchase (
zero
at
December 31, 2016
). In 2017,
$2,938 million
of these marketable securities matured.
The following tables provide the fair value and gross unrealized losses of the Company’s investments that were deemed to be temporarily impaired at
December 31, 2017
and
2016
, aggregated by investment category:
|
Temporarily Impaired Securities at
Dec 31, 2017
|
Less than 12 months
|
12 months or more
|
Total
|
|||||||||||||||
|
Fair Value
|
Unrealized losses
|
Fair Value
|
Unrealized losses
|
Fair Value
|
Unrealized losses
|
|||||||||||||
|
In millions
|
||||||||||||||||||
|
Government debt
1
|
$
|
295
|
|
$
|
(4
|
)
|
$
|
151
|
|
$
|
(7
|
)
|
$
|
446
|
|
$
|
(11
|
)
|
|
Corporate bonds
|
163
|
|
(2
|
)
|
19
|
|
(1
|
)
|
182
|
|
(3
|
)
|
||||||
|
Equity securities
|
7
|
|
(2
|
)
|
63
|
|
(24
|
)
|
70
|
|
(26
|
)
|
||||||
|
Total temporarily impaired securities
|
$
|
465
|
|
$
|
(8
|
)
|
$
|
233
|
|
$
|
(32
|
)
|
$
|
698
|
|
$
|
(40
|
)
|
1. U.S. Treasury obligations, U.S. agency obligations, agency mortgage-backed securities and other municipalities' obligations.
|
Temporarily Impaired Securities at
Dec 31, 2016
|
Less than 12 months
|
12 months or more
|
Total
|
|||||||||||||||
|
Fair Value
|
Unrealized losses
|
Fair Value
|
Unrealized losses
|
Fair Value
|
Unrealized losses
|
|||||||||||||
|
In millions
|
||||||||||||||||||
|
Government debt
1
|
$
|
351
|
|
$
|
(12
|
)
|
$
|
—
|
|
$
|
—
|
|
$
|
351
|
|
$
|
(12
|
)
|
|
Corporate bonds
|
193
|
|
(4
|
)
|
16
|
|
(1
|
)
|
209
|
|
(5
|
)
|
||||||
|
Equity securities
|
48
|
|
(6
|
)
|
163
|
|
(44
|
)
|
211
|
|
(50
|
)
|
||||||
|
Total temporarily impaired securities
|
$
|
592
|
|
$
|
(22
|
)
|
$
|
179
|
|
$
|
(45
|
)
|
$
|
771
|
|
$
|
(67
|
)
|
1. U.S. Treasury obligations, U.S. agency obligations, agency mortgage-backed securities and other municipalities' obligations.
The aggregate cost of the Company's cost method investments totaled
$175 million
at
December 31, 2017
(
$120 million
at
December 31, 2016
). Due to the nature of these investments, either the cost basis approximates fair value or fair value is not readily
166
determinable. These investments are reviewed quarterly for impairment indicators. In 2016, a write-down of
$4 million
was recorded as part of the 2016 restructuring charge. See Note
5
for additional information on Dow's restructuring activities. The Company's impairment analysis resulted in
no
reduction in the cost basis of these investments for the year ended
December 31, 2017
(
no
reduction, other than the restructuring charge, for the year ended
December 31, 2016
).
Portfolio managers regularly review the Company’s holdings to determine if any investments are other-than-temporarily impaired. The analysis includes reviewing the amount of the impairment, as well as the length of time it has been impaired. In addition, specific guidelines for each instrument type are followed to determine if an other-than-temporary impairment has occurred.
For debt securities, the credit rating of the issuer, current credit rating trends, the trends of the issuer’s overall sector, the ability of the issuer to pay expected cash flows and the length of time the security has been in a loss position are considered in determining whether unrealized losses represent an other-than-temporary impairment. The Company did not have any credit-related losses in
2017
,
2016
or
2015
.
For equity securities, the Company’s investments are primarily in Standard & Poor’s (“S&P”) 500 companies; however, the Company’s policies allow investments in companies outside of the S&P 500. The largest holdings are Exchange Traded Funds that represent the S&P 500 index or an S&P 500 sector or subset; the Company also has holdings in Exchange Traded Funds that represent emerging markets. The Company considers the evidence to support the recovery of the cost basis of a security including volatility of the stock, the length of time the security has been in a loss position, value and growth expectations, and overall market and sector fundamentals, as well as technical analysis, in determining whether unrealized losses represent an other-than-temporary impairment. In
2017
and
2016
, there were
no
other-than-temporary impairment write-downs on investments still held by the Company.
Repurchase and Reverse Repurchase Agreement Transactions
Dow enters into repurchase and reverse repurchase agreements. These transactions are accounted for as collateralized borrowings and lending transactions bearing a specified rate of interest and are short-term in nature with original maturities of 30 days or less. The underlying collateral is typically treasury bills with longer maturities than the repurchase agreement. The impact of these transactions are not material to Dow’s results. There were
no
repurchase or reverse repurchase agreements outstanding at
December 31, 2017
and
2016
.
Risk Management
The Company’s business operations give rise to market risk exposure due to changes in interest rates, foreign currency exchange rates, commodity prices and other market factors such as equity prices. To manage such risks effectively, Dow and DuPont enter into a variety of contractual arrangements, pursuant to established guidelines and policies, which enable it to mitigate the adverse effects of financial market risk. Derivatives used for this purpose are designated as cash flow, fair value or net foreign investment hedges where appropriate. Accounting guidance requires companies to recognize all derivative instruments as either assets or liabilities at fair value.
The Company’s risk management program for interest rate, foreign currency and commodity risks is based on fundamental, mathematical and technical models that take into account the implicit cost of hedging. Risks created by derivative instruments and the mark-to-market valuations of positions are strictly monitored. Counterparty credit risk arising from these contracts is not significant because the Company minimizes counterparty concentration, deals primarily with major financial institutions of solid credit quality and the majority of its hedging transactions mature in less than three months. In addition, the Company minimizes concentrations of credit risk through its global orientation by transacting with large, internationally diversified financial counterparties.
The Company revises its strategies as market conditions dictate and management reviews its overall financial strategies and the impacts from using derivatives in its risk management program with the Company’s senior leadership who also reviews those strategies with the DowDuPont Board of Directors and/or relevant committees thereof.
167
The notional amounts of the Company's derivative instruments at
December 31, 2017
and
2016
, were as follows:
|
Notional Amounts
|
Dec 31, 2017
|
Dec 31, 2016
|
||||
|
In millions
|
||||||
|
Derivatives designated as hedging instruments:
|
||||||
|
Interest rate swaps
|
$
|
185
|
|
$
|
245
|
|
|
Foreign currency contracts
|
$
|
8,414
|
|
$
|
4,053
|
|
|
Derivatives not designated as hedging instruments:
|
||||||
|
Foreign currency contracts
|
$
|
24,685
|
|
$
|
12,388
|
|
The notional amounts of the Company's commodity derivatives at
December 31, 2017
and
2016
, were as follows:
|
Commodity Gross Aggregate Notional Amounts
|
Dec 31, 2017
|
Dec 31, 2016
|
Notional Volume Unit
|
||
|
Derivatives designated as hedging instruments:
|
|||||
|
Corn
|
64.3
|
|
0.4
|
|
million bushels
|
|
Crude Oil
|
4.2
|
|
0.6
|
|
million barrels
|
|
Ethane
|
10.4
|
|
3.6
|
|
million barrels
|
|
Natural Gas
|
363.3
|
|
78.6
|
|
million British thermal units
|
|
Propane
|
8.9
|
|
1.5
|
|
million barrels
|
|
Soybeans
|
36.6
|
|
—
|
|
million bushels
|
|
Derivatives not designated as hedging instruments:
|
|||||
|
Ethane
|
1.9
|
|
2.6
|
|
million barrels
|
|
Gasoline
|
—
|
|
30
|
kilotons
|
|
|
Naphtha Price Spread
|
60
|
50
|
kilotons
|
||
|
Normal Butane
|
0.2
|
|
—
|
|
million barrels
|
|
Propane
|
1.8
|
|
2.7
|
million barrels
|
|
|
Soybeans
|
0.3
|
—
|
|
million bushels
|
|
|
Soybean Oil
|
2.5
|
—
|
|
million pounds
|
|
|
Soybean Meal
|
8.2
|
—
|
|
kilotons
|
|
Interest Rate Risk Management
Dow and DuPont enter into various interest rate contracts with the objective of lowering funding costs or altering interest rate exposures related to fixed and variable rate obligations. In these contracts, Dow and DuPont agree with other parties to exchange, at specified intervals, the difference between fixed and floating interest amounts calculated on an agreed-upon notional principal amount. At
December 31, 2017
, the Company had open interest rate swaps with maturity dates that extend to 2021.
Foreign Currency Risk Management
Dow
Dow's global operations require active participation in foreign exchange markets. Dow enters into foreign currency contracts to hedge various currency exposures or create desired exposures. Exposures primarily relate to assets, liabilities and bonds denominated in foreign currencies, as well as economic exposure, which is derived from the risk that currency fluctuations could affect the dollar value of future cash flows related to operating activities. The primary business objective of the activity is to optimize the USD value of Dow’s assets, liabilities and future cash flows with respect to exchange rate fluctuations. Assets and liabilities denominated in the same foreign currency are netted, and only the net exposure is hedged. At
December 31, 2017
, Dow had foreign currency contracts with various expiration dates, through the fourth quarter of 2019.
DuPont
DuPont's objective in managing exposure to foreign currency fluctuations is to reduce earnings and cash flow volatility associated with foreign currency rate changes. Accordingly, DuPont enters into various contracts that change in value as foreign exchange rates change to protect the value of its existing foreign currency-denominated assets, liabilities, commitments and cash flows.
DuPont routinely uses foreign currency contracts to offset its net exposures, by currency, related to the foreign currency‑denominated monetary assets and liabilities of its operations. The primary business objective of this hedging program is to maintain an approximately balanced position in foreign currencies so that exchange gains and losses resulting from exchange
168
rate changes, net of related tax effects, are minimized. DuPont also uses foreign currency exchange contracts to offset a portion of DuPont's exposure to certain foreign currency-denominated revenues so that gains and losses on these contracts offset changes in the USD value of the related foreign currency-denominated revenues. The objective of the hedge program is to reduce earnings and cash flow volatility related to changes in foreign currency exchange rates. At
December 31, 2017
, DuPont had foreign currency contracts with various expiration dates, through the fourth quarter of 2019.
Commodity Risk Management
Dow and DuPont have exposure to the prices of commodities in its procurement of certain raw materials. The primary purpose of commodity hedging activities is to manage the price volatility associated with these forecasted inventory purchases. Dow and DuPont enter into over-the-counter and exchange-traded derivative commodity instruments to hedge the commodity price risk. At
December 31, 2017
, Dow and DuPont had futures contracts, options and swaps to buy, sell or exchange commodities. These agreements had various expiration dates through the fourth quarter of 2022.
Derivatives Not Designated in Hedging Relationships
Foreign Currency Contracts
Dow
Dow also uses foreign currency contracts that are not designated as hedging instruments primarily to manage foreign currency exposure.
DuPont
DuPont routinely uses foreign currency contracts to reduce its net exposure, by currency, related to foreign currency-denominated monetary assets and liabilities of its operations so that exchange gains and losses resulting from exchange rate changes are minimized. The netting of such exposures precludes the use of hedge accounting; however, the required revaluation of the forward contracts and the associated foreign currency-denominated monetary assets and liabilities intends to achieve a minimal earnings impact, after taxes. DuPont also uses foreign currency exchange contracts to offset a portion of the exposure to certain foreign currency-denominated revenues so gains and losses on the contracts offset changes in the USD value of the related foreign currency-denominated revenues.
Commodity Contracts
Dow and DuPont utilize futures, options and swap instruments that are effective as economic hedges of commodity price exposures, but do not meet hedge accounting criteria for derivatives and hedging, to reduce exposure to commodity price fluctuations on purchases of raw materials and inventory.
Accounting for Derivative Instruments and Hedging Activities
Cash Flow Hedges
Dow
For derivatives that are designated and qualify as cash flow hedging instruments, the effective portion of the gain or loss on the derivative is recorded in AOCL; it is reclassified to income in the same period or periods that the hedged transaction affects income. The unrealized amounts in AOCL fluctuate based on changes in the fair value of open contracts at the end of each reporting period. Dow anticipates volatility in AOCL and net income from its cash flow hedges. The amount of volatility varies with the level of derivative activities and market conditions during any period. Gains and losses on the derivatives representing either hedge ineffectiveness or hedge components excluded from the assessment of effectiveness are recognized in current period income.
Dow had open interest rate derivatives designated as cash flow hedges at
December 31, 2017
, with a net loss of
$3 million
after tax (net loss of
$4 million
after tax at
December 31, 2016
).
Dow had open foreign currency contracts designated as cash flow hedges of the currency risk associated with forecasted feedstock transactions not extending beyond 2019. The effective portion of the mark-to-market effects of the foreign currency contracts is recorded in AOCL; it is reclassified to income in the same period or periods that the underlying feedstock purchase affects income. The net loss from the foreign currency hedges included in AOCL at
December 31, 2017
, was
$19 million
after tax (
$22 million
after-tax net gain at
December 31, 2016
). In
2017
,
2016
and
2015
, there was no material impact on the consolidated financial statements due to foreign currency hedge ineffectiveness.
Commodity swaps, futures and option contracts with maturities of not more than
60
months are utilized and designated as cash flow hedges of forecasted commodity purchases. Current open contracts hedge forecasted transactions until December 2022. The effective portion of the mark-to-market effect of the cash flow hedge instrument is recorded in AOCL; it is reclassified to income in the same period or periods that the underlying commodity purchase affects income. The net loss from commodity hedges included in AOCL at
December 31, 2017
, was
$73 million
after tax (
$99 million
after-tax net loss at
December 31, 2016
).
169
In
2017
,
2016
and
2015
, there was no material impact on the consolidated financial statements due to commodity hedge ineffectiveness.
Fair Value Hedges
Dow
For interest rate swap instruments that are designated and qualify as fair value hedges, the gain or loss on the derivative as well as the offsetting loss or gain on the hedged item attributable to the hedged risk are recognized in current period income and reflected as “Interest expense and amortization of debt discount” in the consolidated statements of income. The short-cut method is used when the criteria are met. In 2017, Dow entered into and subsequently terminated interest rate swaps designated as fair value hedges of underlying fixed rate debt obligations with maturity dates extending through 2024. The fair value adjustment resulting from these swaps was a loss on the derivative of
$2 million
. At
December 31, 2017
and
2016
, the Company had no open interest rate swaps designated as fair value hedges of underlying fixed rate debt obligations.
Net Foreign Investment Hedges
Dow
For derivative instruments that are designated and qualify as net foreign investment hedges, the effective portion of the gain or loss on the derivative is included in “Cumulative Translation Adjustments” in AOCL. Dow had outstanding foreign currency‑denominated debt designated as a hedge of net foreign investment of
$177 million
at
December 31, 2017
(
$172 million
at
December 31, 2016
). The results of hedges of Dow’s net investment in foreign operations included in “Cumulative Translation Adjustments” in AOCL was a net loss of
$76 million
after tax for the year ended
December 31, 2017
(net gain of
$1 million
after tax for the year ended
December 31, 2016
). In
2017
,
2016
and
2015
there was no material impact on the consolidated financial statements due to hedge ineffectiveness.
The net after-tax amounts to be reclassified from AOCL to income within the next
12
months are a
$23 million
loss for commodity contracts, a
$19 million
loss for foreign currency contracts and a
$2 million
loss for interest rate contracts.
170
The following tables provide the fair value and gross balance sheet classification of derivative instruments at
December 31, 2017
and
2016
:
|
Fair Value of Derivative Instruments
|
Dec 31, 2017
|
|||||||||
|
In millions
|
Balance Sheet Classification
|
Gross
|
Counterparty and Cash Collateral Netting
1
|
Net Amounts Included in the Consolidated Balance Sheet
|
||||||
|
Asset derivatives:
|
||||||||||
|
Derivatives designated as hedging instruments
|
||||||||||
|
Foreign currency contracts
|
Other current assets
|
$
|
51
|
|
$
|
(46
|
)
|
$
|
5
|
|
|
Commodity contracts
|
Other current assets
|
20
|
|
(4
|
)
|
16
|
|
|||
|
Commodity contracts
|
Deferred charges and other assets
|
70
|
|
(5
|
)
|
65
|
|
|||
|
Total
|
$
|
141
|
|
$
|
(55
|
)
|
$
|
86
|
|
|
|
Derivatives not designated as hedging instruments
|
||||||||||
|
Foreign currency contracts
|
Other current assets
|
$
|
121
|
|
$
|
(95
|
)
|
$
|
26
|
|
|
Commodity contracts
|
Other current assets
|
50
|
|
(5
|
)
|
45
|
|
|||
|
Commodity contracts
|
Deferred charges and other assets
|
7
|
|
(3
|
)
|
4
|
|
|||
|
Total
|
$
|
178
|
|
$
|
(103
|
)
|
$
|
75
|
|
|
|
Total asset derivatives
|
$
|
319
|
|
$
|
(158
|
)
|
$
|
161
|
|
|
|
Liability derivatives:
|
||||||||||
|
Derivatives designated as hedging instruments
|
||||||||||
|
Interest rate swaps
|
Other noncurrent obligations
|
$
|
4
|
|
$
|
—
|
|
$
|
4
|
|
|
Foreign currency contracts
|
Accrued and other current liabilities
|
109
|
|
(46
|
)
|
63
|
|
|||
|
Commodity contracts
|
Accrued and other current liabilities
|
96
|
|
(15
|
)
|
81
|
|
|||
|
Commodity contracts
|
Other noncurrent obligations
|
143
|
|
(12
|
)
|
131
|
|
|||
|
Total
|
$
|
352
|
|
$
|
(73
|
)
|
$
|
279
|
|
|
|
Derivatives not designated as hedging instruments
|
||||||||||
|
Foreign currency contracts
|
Accrued and other current liabilities
|
$
|
186
|
|
$
|
(90
|
)
|
$
|
96
|
|
|
Commodity contracts
|
Accrued and other current liabilities
|
45
|
|
(6
|
)
|
39
|
|
|||
|
Commodity contracts
|
Other noncurrent obligations
|
8
|
|
(3
|
)
|
5
|
|
|||
|
Total
|
$
|
239
|
|
$
|
(99
|
)
|
$
|
140
|
|
|
|
Total liability derivatives
|
$
|
591
|
|
$
|
(172
|
)
|
$
|
419
|
|
|
|
1.
|
Counterparty and cash collateral amounts represent the estimated net settlement amount when applying netting and set-off rights included in master netting arrangements between Dow and DuPont and its counterparties and the payable or receivable for cash collateral held or placed with the same counterparty.
|
171
|
Fair Value of Derivative Instruments
|
Dec 31, 2016
|
|||||||||
|
In millions
|
Balance Sheet Classification
1
|
Gross
|
Counterparty and Cash Collateral Netting
2
|
Net Amounts Included in the Consolidated Balance Sheet
|
||||||
|
Asset derivatives:
|
||||||||||
|
Derivatives designated as hedging instruments
|
||||||||||
|
Foreign currency contracts
|
Other current assets
|
$
|
90
|
|
$
|
(47
|
)
|
$
|
43
|
|
|
Commodity contracts
|
Other current assets
|
42
|
|
(14
|
)
|
28
|
|
|||
|
Commodity contracts
|
Deferred charges and other assets
|
10
|
|
(3
|
)
|
7
|
|
|||
|
Total
|
$
|
142
|
|
$
|
(64
|
)
|
$
|
78
|
|
|
|
Derivatives not designated as hedging instruments
|
||||||||||
|
Foreign currency contracts
|
Other current assets
|
$
|
103
|
|
$
|
(62
|
)
|
$
|
41
|
|
|
Commodity contracts
|
Other current assets
|
13
|
|
(2
|
)
|
11
|
|
|||
|
Commodity contracts
|
Deferred charges and other assets
|
12
|
|
(2
|
)
|
10
|
|
|||
|
Total
|
$
|
128
|
|
$
|
(66
|
)
|
$
|
62
|
|
|
|
Total asset derivatives
|
$
|
270
|
|
$
|
(130
|
)
|
$
|
140
|
|
|
|
Liability derivatives:
|
||||||||||
|
Derivatives designated as hedging instruments
|
||||||||||
|
Interest rate swaps
|
Accrued and other current liabilities
|
$
|
3
|
|
$
|
—
|
|
$
|
3
|
|
|
Interest rate swaps
|
Other noncurrent obligations
|
2
|
|
—
|
|
2
|
|
|||
|
Foreign currency contracts
|
Accrued and other current liabilities
|
55
|
|
(47
|
)
|
8
|
|
|||
|
Commodity contracts
|
Accrued and other current liabilities
|
32
|
|
(14
|
)
|
18
|
|
|||
|
Commodity contracts
|
Other noncurrent obligations
|
196
|
|
(3
|
)
|
193
|
|
|||
|
Total
|
$
|
288
|
|
$
|
(64
|
)
|
$
|
224
|
|
|
|
Derivatives not designated as hedging instruments
|
||||||||||
|
Foreign currency contracts
|
Accrued and other current liabilities
|
$
|
84
|
|
$
|
(62
|
)
|
$
|
22
|
|
|
Commodity contracts
|
Accrued and other current liabilities
|
4
|
|
(2
|
)
|
2
|
|
|||
|
Commodity contracts
|
Other noncurrent obligations
|
2
|
|
(2
|
)
|
—
|
|
|||
|
Total
|
$
|
90
|
|
$
|
(66
|
)
|
$
|
24
|
|
|
|
Total liability derivatives
|
$
|
378
|
|
$
|
(130
|
)
|
$
|
248
|
|
|
|
1.
|
Updated to conform with the current year presentation.
|
|
2.
|
Counterparty and cash collateral amounts represent the estimated net settlement amount when applying netting and set-off rights included in master netting arrangements between Dow and its counterparties and the payable or receivable for cash collateral held or placed with the same counterparty.
|
Assets and liabilities related to forward contracts, interest rate swaps, currency swaps, options and other conditional or exchange contracts executed with the same counterparty under a master netting arrangement are netted. Collateral accounts are netted with corresponding liabilities. The Company posted cash collateral of
$26 million
at
December 31, 2017
(less than
$1 million
of cash collateral at
December 31, 2016
).
172
|
Effect of Derivative Instruments
|
Amount of gain (loss) recognized in OCI
1
(Effective portion)
|
Amount of gain (loss) recognized in income
2, 3
|
Income Statement Classification
|
||||||||||||||||
|
In millions
|
2017
|
2016
|
2015
|
2017
|
2016
|
2015
|
|||||||||||||
|
Derivatives designated as hedging instruments:
|
|||||||||||||||||||
|
Fair value hedges:
|
|||||||||||||||||||
|
Interest rate swaps
|
$
|
—
|
|
$
|
—
|
|
$
|
—
|
|
$
|
(2
|
)
|
$
|
—
|
|
$
|
—
|
|
Interest expense and amortization of debt discount
4
|
|
Cash flow hedges:
|
|||||||||||||||||||
|
Interest rate swaps
|
2
|
|
2
|
|
2
|
|
4
|
|
6
|
|
9
|
|
Interest expense and amortization of debt discount
4
|
||||||
|
Foreign currency contracts
|
(30
|
)
|
8
|
|
123
|
|
7
|
|
(5
|
)
|
68
|
|
Cost of sales
|
||||||
|
Foreign currency contracts
|
(5
|
)
|
25
|
|
—
|
|
(17
|
)
|
(13
|
)
|
—
|
|
Sundry income (expense) - net
|
||||||
|
Commodity contracts
|
38
|
|
55
|
|
(247
|
)
|
7
|
|
(28
|
)
|
(91
|
)
|
Cost of sales
|
||||||
|
Net investment hedges:
|
|||||||||||||||||||
|
Foreign currency contracts
|
(73
|
)
|
5
|
|
—
|
|
—
|
|
—
|
|
—
|
|
|||||||
|
Total derivatives designated as hedging instruments
|
$
|
(68
|
)
|
$
|
95
|
|
$
|
(122
|
)
|
$
|
(1
|
)
|
$
|
(40
|
)
|
$
|
(14
|
)
|
|
|
Derivatives not designated as hedging instruments:
|
|||||||||||||||||||
|
Foreign currency contracts
|
$
|
—
|
|
$
|
—
|
|
$
|
—
|
|
$
|
(198
|
)
|
$
|
(180
|
)
|
$
|
(318
|
)
|
Sundry income (expense) - net
|
|
Commodity contracts
|
—
|
|
—
|
|
—
|
|
(9
|
)
|
6
|
|
4
|
|
Cost of sales
|
||||||
|
Total derivatives not designated as hedging instruments
|
$
|
—
|
|
$
|
—
|
|
$
|
—
|
|
$
|
(207
|
)
|
$
|
(174
|
)
|
$
|
(314
|
)
|
|
|
Total derivatives
|
$
|
(68
|
)
|
$
|
95
|
|
$
|
(122
|
)
|
$
|
(208
|
)
|
$
|
(214
|
)
|
$
|
(328
|
)
|
|
|
1.
|
OCI is defined as "Other comprehensive income (loss)."
|
|
2.
|
For cash flow hedges, this represents the effective portion of the gain (loss) reclassified from AOCL into income during the period. For the years ended
December 31, 2017
,
2016
and
2015
, there was no material ineffectiveness with regard to the Company's cash flow hedges.
|
|
3.
|
Pretax amounts.
|
|
4.
|
Gain recognized in income of derivative is offset to
zero
by gain (loss) recognized in income of the hedged item.
|
173
NOTE
22
- FAIR VALUE MEASUREMENTS
Fair Value Measurements on a Recurring Basis
The following table summarizes the bases used to measure certain assets and liabilities at fair value on a recurring basis:
|
Basis of Fair Value Measurements on a Recurring Basis
|
Dec 31, 2017
|
Dec 31, 2016
|
||||||||||||||||||||||
|
In millions
|
Level 1
|
Level 2
|
Level 3
|
Total
|
Level 1
|
Level 2
|
Level 3
|
Total
|
||||||||||||||||
|
Assets at fair value:
|
||||||||||||||||||||||||
|
Cash equivalents
1
|
$
|
—
|
|
$
|
7,485
|
|
$
|
—
|
|
$
|
7,485
|
|
$
|
—
|
|
$
|
4,173
|
|
$
|
—
|
|
$
|
4,173
|
|
|
Marketable securities
2
|
—
|
|
956
|
|
—
|
|
956
|
|
—
|
|
—
|
|
—
|
|
—
|
|
||||||||
|
Interests in trade accounts receivable conduits
3
|
—
|
|
—
|
|
677
|
|
677
|
|
—
|
|
—
|
|
1,237
|
|
1,237
|
|
||||||||
|
Equity securities
4
|
88
|
|
52
|
|
—
|
|
140
|
|
619
|
|
87
|
|
—
|
|
706
|
|
||||||||
|
Debt securities:
4
|
||||||||||||||||||||||||
|
Government debt
5
|
—
|
|
639
|
|
—
|
|
639
|
|
—
|
|
608
|
|
—
|
|
608
|
|
||||||||
|
Corporate bonds
|
—
|
|
733
|
|
—
|
|
733
|
|
—
|
|
645
|
|
—
|
|
645
|
|
||||||||
|
Derivatives relating to:
6
|
||||||||||||||||||||||||
|
Commodities
|
47
|
|
100
|
|
—
|
|
147
|
|
48
|
|
29
|
|
—
|
|
77
|
|
||||||||
|
Foreign currency
|
—
|
|
172
|
|
—
|
|
172
|
|
—
|
|
193
|
|
—
|
|
193
|
|
||||||||
|
Total assets at fair value
|
$
|
135
|
|
$
|
10,137
|
|
$
|
677
|
|
$
|
10,949
|
|
$
|
667
|
|
$
|
5,735
|
|
$
|
1,237
|
|
$
|
7,639
|
|
|
Liabilities at fair value:
|
||||||||||||||||||||||||
|
Long-term debt
7
|
$
|
—
|
|
$
|
34,175
|
|
$
|
—
|
|
$
|
34,175
|
|
$
|
—
|
|
$
|
22,807
|
|
$
|
—
|
|
$
|
22,807
|
|
|
Derivatives relating to:
6
|
||||||||||||||||||||||||
|
Interest rates
|
—
|
|
4
|
|
—
|
|
4
|
|
—
|
|
5
|
|
—
|
|
5
|
|
||||||||
|
Commodities
|
31
|
|
261
|
|
—
|
|
292
|
|
20
|
|
214
|
|
—
|
|
234
|
|
||||||||
|
Foreign currency
|
—
|
|
295
|
|
—
|
|
295
|
|
—
|
|
139
|
|
—
|
|
139
|
|
||||||||
|
Total liabilities at fair value
|
$
|
31
|
|
$
|
34,735
|
|
$
|
—
|
|
$
|
34,766
|
|
$
|
20
|
|
$
|
23,165
|
|
$
|
—
|
|
$
|
23,185
|
|
|
1.
|
Treasury bills, time deposits, and money market funds included in "Cash and cash equivalents" and money market funds included in "Other currents assets" in the consolidated balance sheets are held at amortized cost, which approximates fair value.
|
|
2.
|
Primarily time deposits with maturities of greater than three months at time of acquisition.
|
|
3.
|
Included in "Accounts and notes receivable - Other" in the consolidated balance sheets. See Note
14
for additional information on transfers of financial assets.
|
|
4.
|
The Company’s investments in equity and debt securities are primarily classified as available-for-sale and are included in “Other investments” in the consolidated balance sheets.
|
|
5.
|
U.S. Treasury obligations, U.S. agency obligations, agency mortgage-backed securities and other municipalities’ obligations.
|
|
6.
|
See Note
21
for the classification of derivatives in the consolidated balance sheets.
|
|
7.
|
See Note
21
for information on fair value measurements of long-term debt.
|
For assets and liabilities classified as Level 1 measurements (measured using quoted prices in active markets), total fair value is either the price of the most recent trade at the time of the market close or the official close price, as defined by the exchange on which the asset is most actively traded on the last trading day of the period, multiplied by the number of units held without consideration of transaction costs.
For assets and liabilities classified as Level 2 measurements, where the security is frequently traded in less active markets, fair value is based on the closing price at the end of the period; where the security is less frequently traded, fair value is based on the price a dealer would pay for the security or similar securities, adjusted for any terms specific to that asset or liability, or by using observable market data points of similar, more liquid securities to imply the price. For time deposits classified as held-to-maturity investments and reported at amortized cost, fair value is based on an observable interest rate for similar securities. Market inputs are obtained from well-established and recognized vendors of market data and subjected to tolerance and quality checks.
For derivative assets and liabilities, standard industry models are used to calculate the fair value of the various financial instruments based on significant observable market inputs, such as foreign exchange rates, commodity prices, swap rates, interest rates and implied volatilities obtained from various market sources. Market inputs are obtained from well-established and recognized vendors of market data and subjected to tolerance/quality checks.
For all other assets and liabilities for which observable inputs are used, fair value is derived through the use of fair value models, such as a discounted cash flow model or other standard pricing models. See Note
21
for further information on the types of instruments used by the Company for risk management.
174
There were no transfers between Levels 1 and 2 during the years ended
December 31, 2017
and 2016.
For assets classified as Level 3 measurements, the fair value is based on significant unobservable inputs including assumptions where there is little, if any, market activity. The fair value of the Company’s interests held in trade receivable conduits is determined by calculating the expected amount of cash to be received using the key input of anticipated credit losses in the portfolio of receivables sold that have not yet been collected. Given the short-term nature of the underlying receivables, discount rate and prepayments are not factors in determining the fair value of the interests. See Note
14
for further information on assets classified as Level 3 measurements.
The following table summarizes the changes in fair value measurements using Level 3 inputs for the years ended December 31, 2017 and 2016:
|
Fair Value Measurements Using Level 3 Inputs for Interests Held in Trade Receivable Conduits
1
|
||||||
|
In millions
|
2017
|
2016
|
||||
|
Balance at Jan 1
|
$
|
1,237
|
|
$
|
943
|
|
|
Loss included in earnings
2
|
(8
|
)
|
(1
|
)
|
||
|
Purchases
|
1,717
|
|
1,552
|
|
||
|
Settlements
|
(2,269
|
)
|
(1,257
|
)
|
||
|
Balance at Dec 31
|
$
|
677
|
|
$
|
1,237
|
|
|
1.
|
Included in "Accounts and notes receivable - Other" in the consolidated balance sheets.
|
|
2.
|
Included in "Selling, general and administrative expenses" in the consolidated statements of income.
|
Fair Value Measurements on a Nonrecurring Basis
The following table summarizes the bases used to measure certain assets at fair value on a nonrecurring basis in the consolidated balance sheets in 2017, 2016 and 2015:
|
Basis of Fair Value Measurements on a Nonrecurring Basis at Dec 31
|
Quoted Prices in Active Markets for Identical Items (Level 1)
|
Significant Other Unobservable Inputs
(Level 3)
|
Total Losses
|
||||||
|
In millions
|
|||||||||
|
2017
|
|||||||||
|
Assets at fair value:
|
|||||||||
|
Long-lived assets, intangible assets, other assets and equity method investments
|
$
|
—
|
|
$
|
61
|
|
$
|
(1,226
|
)
|
|
Goodwill
|
$
|
—
|
|
$
|
—
|
|
$
|
(1,491
|
)
|
|
2016
|
|||||||||
|
Assets at fair value:
|
|||||||||
|
Long-lived assets, other assets and equity method investments
|
$
|
46
|
|
$
|
—
|
|
$
|
(296
|
)
|
|
2015
|
|||||||||
|
Assets at fair value:
|
|||||||||
|
Long-lived assets, equity method investments, investments and other assets
|
$
|
—
|
|
$
|
24
|
|
$
|
(313
|
)
|
2017 Fair Value Measurements on a Nonrecurring Basis
As part of the Synergy Program, the Company has or will shut down a number of manufacturing, R&D and corporate facilities around the world. The manufacturing facilities and related assets (including intangible assets), corporate facilities and data centers associated with this plan were written down to
zero
in the fourth quarter of 2017. The impairment charges related to the Synergy Program, totaling
$287 million
, were included in "Restructuring, goodwill impairment and asset related charges - net" in the consolidated statements of income. See Note
5
for additional information on the Company's restructuring activities.
175
In the fourth quarter of 2017, the Company recognized a
$622 million
pretax impairment charge related to a biopolymers manufacturing facility in Santa Vitoria, Minas Gerais, Brazil. The Company determined it will not pursue an expansion of the facility’s ethanol mill into downstream derivative products, primarily as a result of cheaper ethane-based production as well as the Company’s new assets coming online in the U.S. Gulf Coast which can be used to meet growing market demands in Brazil. As a result of this decision, cash flow analysis indicated the carrying amount of the impacted assets was not recoverable and the assets were written down to
zero
in the fourth quarter of 2017. The impairment charge was included in “Restructuring, goodwill impairment and asset related charges - net” in the consolidated statements of income. See Notes
5
and
23
for additional information.
The Company also recognized other pretax impairment charges of
$317 million
in the fourth quarter of 2017, including charges related to manufacturing assets of
$230 million
, an equity method investment of
$81 million
and other assets of
$6 million
. The assets, classified as Level 3 measurements, were valued at
$61 million
using unobservable inputs, including assumptions a market participant would use to measure the fair value of the group of assets, which included projected cash flows. The impairment charges were included in "Restructuring, goodwill impairment and asset related charges - net" in the consolidated statements of income. See Notes
5
and
23
for additional information.
In the fourth quarter of 2017, the Company performed its annual goodwill impairment testing utilizing a discounted cash flow methodology as its valuation technique. As a result, the Company determined the fair value of the Coatings & Performance Monomers reporting unit was lower than its carrying amount and recorded an impairment charge of
$1,491 million
, included in “Restructuring, goodwill impairment and asset related charges - net” in the consolidated statements of income and related to Performance Materials & Coatings. See Note
13
for additional information on the impairment charge.
2016 Fair Value Measurements on a Nonrecurring Basis
As part of the 2016 restructuring plan, Dow has or will shut down a number of manufacturing and corporate facilities. The manufacturing facilities and related assets, corporate facilities and data centers associated with this plan were written down to
zero
in the second quarter of 2016. Dow also rationalized its aircraft fleet in the second quarter of 2016. Certain aircraft, classified as a Level 3 measurement, were considered held for sale and written down to fair value, using unobservable inputs, including assumptions a market participant would use to measure the fair value of the aircraft. The aircraft were subsequently sold during the second half of 2016. The impairment charges related to the 2016 restructuring plan, totaling
$153 million
, were included in "Restructuring, goodwill impairment and asset related charges - net" in the consolidated statements of income. See Note
5
for additional information on Dow's 2016 restructuring program.
Dow recognized an impairment charge of
$143 million
in the fourth quarter of 2016, related to its equity interest in AFSI. This investment, classified as a Level 1 measurement, was written down to
$46 million
using quoted prices in an active market. The impairment charge was included in “Restructuring, goodwill impairment and asset related charges - net" in the consolidated statements of income and related to Corporate. See Notes
4
,
5
and
12
for additional information.
2015 Fair Value Measurements on a Nonrecurring Basis
As part of the 2015 restructuring plan that was approved on April 29, 2015, Dow shut down a number of manufacturing facilities. The manufacturing assets and facilities associated with this plan, classified as Level 3 measurements, were written down to
$7 million
using unobservable inputs, including assumptions a market participant would use to measure the fair value of the group of assets. In addition, a change in Dow's strategy to monetize and exit certain Venture Capital portfolio investments resulted in the write-down of certain investments. These investments, also classified as Level 3 measurements, were valued at
$17 million
using unobservable inputs, including assumptions a market participant would use to measure the fair value of the investment. These impairment charges, totaling
$169 million
, were included in "Restructuring, goodwill impairment and asset related charges ‑ net" in the consolidated statements of income. See Note
5
for additional information on Dow's 2015 restructuring program.
As a result of Dow’s continued actions to optimize its footprint, Dow recognized an impairment charge of
$144 million
in the fourth quarter of 2015, related to manufacturing assets and facilities and an equity method investment. These assets, classified as Level 3 measurements, were written down to
zero
. The impairment charge was included in "Restructuring, goodwill impairment and asset related charges - net" in the consolidated statements of income. See Note
5
for additional information.
176
NOTE
23
- VARIABLE INTEREST ENTITIES
DuPont did not hold a variable interest in any joint ventures at December 31, 2017 for which it is the primary beneficiary. In addition, the maximum exposure to loss related to the nonconsolidated variable interest entities ("VIEs") for which DuPont did hold a variable interest at December 31, 2017 is not considered material to the consolidated financial statements. The following discussion addresses variable interests held by Dow.
Dow Consolidated VIEs
Dow holds a variable interest in the following joint ventures or entities for which it is the primary beneficiary.
Asia Pacific joint ventures
Dow has variable interests in
three
joint ventures that own and operate manufacturing and logistics facilities, which produce chemicals and provide services in Asia Pacific. Dow's variable interests in these joint ventures relate to arrangements between the joint ventures and Dow, involving the majority of the output on take-or-pay terms with pricing ensuring a guaranteed return to the joint ventures.
Polishing materials joint venture
Dow has variable interests in a joint venture that manufactures products in Japan for the semiconductor industry. Each joint venture partner holds several equivalent variable interests, with the exception of a royalty agreement held exclusively between the joint venture and Dow. In addition, the entire output of the joint venture is sold to Dow for resale to third-party customers.
Ethylene storage joint venture
Dow has variable interests in a joint venture that provides ethylene storage in Alberta, Canada. Dow's variable interests relate to arrangements involving a majority of the joint venture's storage capacity on take-or-pay terms with pricing ensuring a guaranteed return to the joint venture; and favorably priced leases provided to the joint venture. Dow provides the joint venture with operation and maintenance services and utilities.
Ethanol production and cogeneration in Brazil
Dow held variable interests in a joint venture located in Brazil that produces ethanol from sugarcane. In August 2015, the partner exercised an equity option which required Dow to purchase their equity interest. On March 31, 2016, the partner's equity investment transferred to Dow. On July 11, 2016, Dow paid
$202 million
to the former partner, which was classified as "Purchases of noncontrolling interests" in the consolidated statements of cash flows. This former joint venture is now
100 percent
owned by Dow. Dow continues to hold variable interests in a related entity that owns a cogeneration facility. Dow's variable interests are the result of a tolling arrangement where it provides fuel to the entity and purchases a majority of the cogeneration facility’s output on terms that ensure a return to the entity’s equity holders.
Chlor-alkali manufacturing joint venture
Dow previously held an equity interest in a joint venture that owns and operates a membrane chlor-alkali manufacturing facility. Dow’s variable interests in this joint venture related to equity options between the partners and a cost-plus off-take arrangement between the joint venture and Dow, involving proportional purchase commitments on take-or-pay terms and ensuring a guaranteed return to the joint venture. In the second quarter of 2015, Mitsui (a
50 percent
equity owner in this joint venture), provided notice of its intention to transfer its equity interest to Dow as part of the Transaction with Olin. On October 5, 2015, Dow purchased Mitsui's equity interest in the membrane chlor-alkali joint venture for
$133 million
, which resulted in a loss of
$25 million
included in "Sundry income (expense) - net" in the consolidated statements of income and included as a component of the pretax gain on the Transaction. The loss was related to Industrial Intermediates & Infrastructure. See Note
6
for additional information on this Transaction.
U.S. Seed production joint venture
Dow previously held a
49 percent
equity interest in a joint venture that managed the growth, harvest and conditioning of soybean seed and grain, corn and wheat in the United States. Dow's variable interest in this joint venture related to an equity option between the partners. Terms of the equity option required Dow to purchase the partner's equity investment at a price based on a specified formula, after a specified period of time, and satisfaction of certain conditions, if the partner elected to sell its equity investment. On August 10, 2015, the equity option was determined to be exercisable and the partner provided notice to Dow of its intent to exercise the equity option, which resulted in an after-tax loss of
$22 million
, included in "Net income attributable to noncontrolling interests" in the consolidated statements of income. Dow purchased the partner's equity investment on September 18, 2015, which resulted in the joint venture becoming a wholly owned subsidiary of Dow. Subsequent to the purchase of the partner's equity investment, Dow sold its entire ownership interest in the subsidiary to a third party and recognized a pretax gain of
$44 million
on the sale in the third quarter of 2015, included in "Sundry income (expense) - net" in the consolidated statements of income and related to Agriculture.
177
Assets and Liabilities of Consolidated VIEs
The Company's consolidated financial statements include the assets, liabilities and results of operations of VIEs for which the Company is the primary beneficiary. The other equity holders’ interests are reflected in "Net income attributable to noncontrolling interests" in the consolidated statements of income and "Noncontrolling interests" in the consolidated balance sheets. The following table summarizes the carrying amounts of these entities’ assets and liabilities included in the Company’s consolidated balance sheets at
December 31, 2017
and
2016
:
|
Assets and Liabilities of Consolidated VIEs at Dec 31
|
2017
|
2016
|
||||
|
In millions
|
||||||
|
Cash and cash equivalents
|
$
|
107
|
|
$
|
75
|
|
|
Other current assets
|
131
|
|
95
|
|
||
|
Net property
|
907
|
|
961
|
|
||
|
Other noncurrent assets
|
50
|
|
55
|
|
||
|
Total assets
1
|
$
|
1,195
|
|
$
|
1,186
|
|
|
Current liabilities
|
$
|
303
|
|
$
|
286
|
|
|
Long-term debt
|
249
|
|
330
|
|
||
|
Other noncurrent obligations
|
41
|
|
47
|
|
||
|
Total liabilities
2
|
$
|
593
|
|
$
|
663
|
|
|
1.
|
All assets were restricted at
December 31, 2017
and
December 31, 2016
.
|
|
2.
|
All liabilities were nonrecourse at
December 31, 2017
and
December 31, 2016
|
In addition, Dow holds a variable interest in an entity created to monetize accounts receivable of select European entities. Dow is the primary beneficiary of this entity as a result of holding subordinated notes while maintaining servicing responsibilities for the accounts receivable. The carrying amounts of assets and liabilities included in the Company’s consolidated balance sheets pertaining to this entity were current assets of
$671 million
(
zero
restricted) at
December 31, 2017
(
$477 million
,
zero
restricted, at
December 31, 2016
) and current liabilities of less than
$1 million
(
zero
nonrecourse) at
December 31, 2017
(less than
$1 million
,
zero
nonrecourse, at
December 31, 2016
).
Amounts presented in the consolidated balance sheets and the table above as restricted assets or nonrecourse obligations relating to consolidated VIEs at
December 31, 2017
and
2016
are adjusted for intercompany eliminations and parental guarantees.
Dow Nonconsolidated VIEs
Dow holds a variable interest in the following joint ventures or entities for which Dow is not the primary beneficiary.
Polysilicon joint venture
As a result of the DCC Transaction, Dow holds variable interests in Hemlock Semiconductor L.L.C. The variable interests relate to an equity interest held by Dow and arrangements between Dow and the joint venture to provide services. Dow is not the primary beneficiary, as it does not direct the activities that most significantly impact the economic performance of this entity; therefore, the entity is accounted for under the equity method of accounting. At
December 31, 2017
, the Company had a negative investment basis of
$752 million
in this joint venture (negative
$902 million
at
December 31, 2016
), classified as "Other noncurrent obligations" in the consolidated balance sheets. The Company's maximum exposure to loss was
zero
at
December 31, 2017
(
zero
at
December 31, 2016
). See Note
12
for additional information on this joint venture.
Silicon joint ventures
Also as a result of the DCC Transaction, Dow holds minority voting interests in certain joint ventures that produce silicon inputs for Dow Corning. These joint ventures operate under supply agreements that sell inventory to the equity owners using pricing mechanisms that guarantee a return, therefore shielding the joint ventures from the obligation to absorb expected losses. As a result of the pricing mechanisms of these agreements, these entities are determined to be VIEs. Dow is not the primary beneficiary, as it does not hold the power to direct the activities that most significantly impact the economic performance of these entities; therefore, the entities are accounted for under the equity method of accounting. The Company's maximum exposure to loss as a result of its involvement with these variable interest entities is determined to be the carrying value of the investment in these entities. At
December 31, 2017
, the Company's investment in these joint ventures was
$103 million
(
$96 million
at
December 31, 2016
), classified as "Investment in nonconsolidated affiliates" in the consolidated balance sheets, representing the Company's maximum exposure to loss.
178
AFSI
Dow holds variable interests in AFSI, a company that produces and sells proprietary technologies for the horticultural market. The variable interests in AFSI relate to a sublease agreement between Dow and AFSI, and a tax receivable agreement that entitles Dow to additional consideration in the form of tax savings, which is contingent on the operations and earnings of AFSI. Dow is not the primary beneficiary, as it is a minority shareholder in AFSI and AFSI is governed by a board of directors, the composition of which is mandated by AFSI's corporate governance requirements that a majority of the directors be independent. The Company's investment in AFSI was
$51 million
at
December 31, 2017
(
$46 million
at
December 31, 2016
), classified as "Investment in nonconsolidated affiliates" in the consolidated balance sheets. In the fourth quarter of 2016, as a result of a decline in the market value of AFSI, Dow recognized a
$143 million
pretax impairment charge related to its equity interest in AFSI (see Notes
12
and
22
for further information).
On April 4, 2017, Dow and AFSI revised certain agreements related to the divestiture of the AgroFresh business, including termination of an agreement related to a receivable for
six million
warrants, which was valued at
$1 million
at December 31, 2016. Dow also entered into an agreement to purchase up to
5,070,358
shares of AFSI's common stock, which represented approximately
10
percent of AFSI's common stock outstanding at signing of the agreement, subject to certain terms and conditions. At
December 31, 2017
, the Company had a receivable with AFSI related to the tax receivable agreement of
$4 million
(
$12 million
at
December 31, 2016
), classified as "Accounts and notes receivable - Other" in the consolidated balance sheets. The Company's maximum exposure to loss was
$55 million
at
December 31, 2017
(
$59 million
at
December 31, 2016
).
Crude acrylic acid joint venture
Dow held a variable interest in a joint venture that manufactured crude acrylic acid in the United States and Germany on behalf of Dow and the other joint venture partner. The variable interest related to a cost-plus arrangement between the joint venture and each joint venture partner. Dow was not the primary beneficiary, as a majority of the joint venture’s output was committed to the other joint venture partner; therefore, the entity was accounted for under the equity method of accounting.
In the fourth quarter of 2017, the joint venture was dissolved by mutual agreement with return of the originally contributed assets to the partners. The carrying value of Dow's investment prior to the dissolution was
$168 million
, which was also determined to be fair value, therefore, no gain or loss was recognized as a result of the transaction. The fair value of assets recognized included
$47 million
of cash,
$67 million
of other assets and
$48 million
of goodwill (net of
$6 million
settlement of an affiliate’s pre‑existing obligation). At
December 31, 2016
, Dow’s investment in the joint venture was
$171 million
, classified as “Investment in nonconsolidated affiliates” in the consolidated balance sheets.
NOTE
24
- SEGMENTS AND GEOGRAPHIC REGIONS
Effective August 31, 2017, Dow and DuPont completed the previously announced merger of equals transaction pursuant to the Merger Agreement, resulting in a newly formed corporation named DowDuPont. See Note
3
for additional information on the Merger. As a result of the Merger, new operating segments were created which are used by management to allocate Company resources and assess performance. The new segments are aligned with the market verticals they serve, while maintaining integration and innovation strengths within strategic value chains. DowDuPont is comprised of
nine
operating segments, which are aggregated into
eight
reportable segments: Agriculture; Performance Materials & Coatings; Industrial Intermediates & Infrastructure; Packaging & Specialty Plastics; Electronics & Imaging; Nutrition & Biosciences; Transportation & Advanced Polymers and Safety & Construction. Corporate contains the reconciliation between the totals for the reportable segments and the Company’s totals. The Company’s Nutrition & Biosciences reportable segment consists of
two
operating segments, Nutrition & Health and Industrial Biosciences, which individually did not meet the quantitative thresholds.
DowDuPont reported geographic information for the following regions: U.S. & Canada, Asia Pacific, Latin America, and Europe, Middle East, and Africa ("EMEA"). As a result of the Merger, Dow changed the geographic alignment for the country of India to be reflected in Asia Pacific (previously reported in EMEA) and aligned Puerto Rico to U.S. & Canada (previously reported in Latin America).
The segment and geographic region reporting changes were retrospectively applied to all periods presented.
The Company’s measure of profit/loss for segment reporting purposes is Operating EBITDA (for the period of September 1, 2017 through December 31, 2017 and the twelve months ended December 31, 2015) and pro forma Operating EBITDA (for the period of January 1, 2017 through August 31, 2017 and the twelve months ended December 31, 2016) as this is the manner in which the Company’s chief operating decision maker (“CODM”) assesses performance and allocates resources. The Company defines Operating EBITDA as earnings (i.e., "Income from continuing operations before income taxes”) before interest, depreciation, amortization and foreign exchange gains (losses), excluding the impact of significant items. Pro forma Operating EBITDA is defined as pro forma earnings (i.e. Pro forma Income from continuing operations before income taxes) before interest, depreciation,
179
amortization and foreign exchange gains (losses), excluding the impact of adjusted significant items. Reconciliations of these measures are provided at the end of this footnote. The Company also presents pro forma net sales for 2017 and 2016 in this footnote as it is included in management’s measure of segment performance and is regularly reviewed by the CODM.
Pro forma adjustments used in the calculation of pro forma net sales and pro forma Operating EBITDA were determined in accordance with Article 11 of Regulation S-X. Pro forma financial information is based on the historical consolidated financial statements of Dow and DuPont, adjusted to give effect to the Merger as if it had been consummated on January 1, 2016. Pro forma adjustments have been made for (1) the preliminary purchase accounting impact, (2) accounting policy alignment, (3) the elimination of the effect of events that are directly attributable to the Merger Agreement (e.g., one-time transaction costs), (4) the elimination of the impact of transactions between Dow and DuPont, and (5) the elimination of the effect of consummated or probable and identifiable divestitures agreed to with certain regulatory agencies as a condition of approval for the Merger. Events that are not expected to have a continuing impact on the combined results (e.g., inventory step-up costs) are excluded from the pro forma adjustments.
Corporate Profile
The Company conducts its worldwide operations through global businesses which are reflected in the following reportable segments:
AGRICULTURE
The Agriculture segment leverages the Company’s technology, customer relationships and industry knowledge to improve the quantity, quality and safety of the global food supply and the global production agriculture industry. Land available for worldwide agricultural production is increasingly limited so production growth will need to be achieved principally through improving crop yields and productivity. The segment’s
two
global businesses, Seed and Crop Protection, deliver a broad portfolio of products and services that are specifically targeted to achieve gains in crop yields and productivity, including well-established brands of seed products, crop chemicals, seed treatment, agronomy and digital services. R&D focuses on leveraging germplasm and plant science technology to increase farmer productivity and to enhance the value of grains and oilseeds through improved seed traits, superior seed germplasm and effective use of crop protection solutions.
Seed
Seed is a global leader in developing and supplying advanced plant genetic products and technologies. The Seed business is a world leader in developing, producing and marketing hybrid corn seed and soybean seed varieties, primarily under the PIONEER® brand name, which improve the productivity and profitability of its customers. Additionally, the Seed business develops, produces and markets canola, cotton, sunflower, sorghum, wheat and rice seed, as well as silage inoculants.
Crop Protection
Crop Protection serves the global production agriculture industry with crop protection products for field crops such as wheat, corn, soybean and rice, and specialty crops such as fruit, nut, vine and vegetables. Principle crop protection products are weed control, disease control and insect control offerings for foliar or soil application or as a seed treatment.
PERFORMANCE MATERIALS & COATINGS
The Performance Materials & Coatings segment consists of
two
global businesses - Coatings & Performance Monomers and Consumer Solutions. Using silicones, acrylics and cellulosics-based technology platforms, these businesses serve the needs of the coatings, home care, personal care, appliance and industrial end-markets. The segment has broad geographic reach with R&D and manufacturing facilities located in key geographic regions.
Coatings & Performance Monomers
Coatings & Performance Monomers consists of
two
businesses: Coating Materials and Performance Monomers. The Coating Materials business leads innovation in technologies that help advance the performance of paints and coatings. Its water-based acrylic emulsion technology revolutionized the global paint industry. The business offers innovative and sustainable product solutions to accelerate paint and coating performance across diverse market segments, including architectural paints and coatings, as well as industrial coatings applications used in paper, leather, wood, metal packaging, traffic markings, maintenance and protective industries. The Performance Monomers business manufactures critical building blocks needed for the production of coatings, textiles, and home and personal care products. Included in this portfolio is the Plastics Additives business, a worldwide supplier of additives used in a large variety of applications ranging from packaging to consumer appliances and office equipment.
Consumer Solutions
Consumer Solutions consists of
three
businesses: Home & Personal Care; Silicone Feedstocks & Intermediates and Performance Silicones. The Home & Personal Care business collaborates closely with global and regional brand owners to deliver innovative solutions for creating new and unrivaled consumer benefits and experiences. Silicone Feedstocks & Intermediates provides
180
standalone silicone and acrylic-based materials that are used in a wide range of applications including adhesion promoters, coupling agents, crosslinking agents, dispersing agents and surface modifiers. Performance Silicones uses innovative, versatile silicone‑based technology to provide solutions and ingredients to customers in personal care, consumer goods, silicone elastomers and the pressure sensitive industry.
Joint Ventures
The Performance Materials & Coatings segment includes the Company's share of the results of The HSC Group, a U.S.-based group of companies that manufacture and sell polycrystalline silicon products.
INDUSTRIAL INTERMEDIATES & INFRASTRUCTURE
The Industrial Intermediates & Infrastructure segment consists of
four
global businesses: Construction Chemicals, Energy Solutions, Industrial Solutions, and Polyurethanes & CAV. These customer-centric global businesses develop and market customized materials using advanced technology and unique chemistries. These businesses serve the needs of market segments as diverse as: appliance; infrastructure; and oil and gas. The segment has broad geographic reach with R&D and manufacturing facilities located in key geographic regions.
Construction Chemicals
Construction Chemicals combines its deep application know-how, materials science and formulation competence to offer manufacturers key building blocks for formulating efficient and differentiated building and construction materials. With a broad range of technologies - including cellulose ethers, redispersible latex powders, silicones and acrylic emulsions - the business is a leading supplier to customers around the world and addresses the specific requirements of the industry across many market segments and applications, from roofing to flooring, and gypsum-, cement-, concrete- or dispersion-based building materials. Construction Chemicals' chemistries are designed to help advance the performance, durability and aesthetics of buildings and infrastructure.
Energy Solutions
Energy Solutions supplies smart, innovative and customized solutions to enhance productivity and efficiency in the oil, gas and mining markets. This business is aligned with all markets of the oil and gas industry - including exploration, production (including enhanced oil recovery), refining, gas processing and gas transmission.
Industrial Solutions
The Industrial Solutions business provides a broad portfolio of sustainable solutions that address world needs by enabling and improving the manufacture of consumer and industrial goods and services. Business solutions include products and innovations that minimize friction and heat in mechanical processes, manage the oil and water interface, deliver active ingredients for maximum effectiveness, facilitate dissolvability, enable product identification and provide the foundational building blocks for the development of chemical technologies. The business supports manufacturers associated with a large variety of end-markets, notably better crop protection offerings in agriculture, coatings, detergents and cleaners, solvents for electronics processing, inks and textiles. Industrial Solutions is also the world’s largest producer of purified ethylene oxide.
Polyurethanes & CAV
The Polyurethanes & CAV business group consists of
two
businesses: Polyurethanes and Chlor-Alkali & Vinyl ("CAV"). The Polyurethanes business is the world’s largest producer of propylene oxide and propylene glycol, a leading producer of polyether polyols and aromatic isocyanates that serve energy efficiency, consumer comfort and industrial market sectors, and an industry leader in the development of fully formulated polyurethane systems. Propylene oxide is produced by using the chlorohydrin process as well as by hydrogen peroxide to propylene oxide manufacturing technology. The CAV business provides cost advantaged chlorine and caustic soda supply and markets caustic soda, a valuable co-product of the chlor-alkali manufacturing process, and ethylene dichloride and vinyl chloride monomer.
Joint Ventures
The Industrial Intermediates & Infrastructure segment includes a portion of the Company's share of the results of the following joint ventures:
|
•
|
EQUATE - a Kuwait-based company that manufactures ethylene, polyethylene and ethylene glycol; and manufactures and markets monoethylene glycol, diethylene glycol and polyethylene terephthalate resins; owned
42.5
percent by the Company.
|
|
•
|
The Kuwait Olefins Company K.S.C. ("TKOC") - a Kuwait-based company that manufactures ethylene and ethylene glycol; owned
42.5
percent by the Company.
|
|
•
|
Map Ta Phut Olefins Company Limited - effective ownership is
32.77 percent
of which the Company directly owns
20.27
percent (aligned with Industrial Intermediates & Infrastructure) and indirectly owns
12.5 percent
through its equity interest in Siam Polyethylene Company Limited and Siam Synthetic Latex Company Limited (both part of The SCG-Dow Group and aligned with Packaging & Specialty Plastics). This Thailand-based company manufactures propylene and ethylene
.
|
181
|
•
|
Sadara - a Saudi Arabian company that manufactures chlorine, ethylene, propylene and aromatics for internal consumption and manufactures and sells polyethylene, ethylene oxide and propylene oxide derivative products, and isocyanates; owned
35 percent
by the Company.
|
PACKAGING & SPECIALTY PLASTICS
The Packaging & Specialty Plastics segment is a market-oriented portfolio composed of
two
global businesses: Hydrocarbons & Energy and Packaging and Specialty Plastics. The segment is advantaged through its low cost position into key feedstocks and broad geographic reach, with manufacturing facilities located in all geographic regions. It also benefits from R&D expertise to deliver leading-edge technology that provides a competitive benefit to customers in food packaging and other high-growth end‑use markets like transportation and consumer durables. Taken together, the businesses in this segment represent the world's leading plastics franchise.
Hydrocarbons & Energy
The Hydrocarbons & Energy business is one of the largest global producers of ethylene, an internal feedstock that is consumed primarily within the Packaging & Specialty Plastics segment. In addition to ethylene, the business is a leading producer of propylene and aromatics products that are used to manufacture materials that consumers use every day. It also produces and procures the power used by the Company's manufacturing sites. The business leverages its global scale, operational discipline and feedstock flexibility to create a cost-advantaged foundation for the Company’s downstream, market-driven businesses. In the U.S. & Canada, the increased supplies of natural gas and natural gas liquids (“NGLs”) remain a key cost-competitive advantage for the Company's ethane- and propane-based production. The Company's U.S. and European ethylene production facilities have the flexibility to use different feedstocks in response to price conditions.
Packaging and Specialty Plastics
Packaging and Specialty Plastics serves high-growth, high-value sectors using world-class technology and a rich innovation pipeline that creates competitive advantages for customers and the entire value chain. The business is also a leader in polyolefin elastomers and ethylene propylene diene monomer elastomers. Market growth is expected to be driven by major shifts in population demographics; improving socioeconomic status in emerging geographies; consumer and brand owner demand for increased functionality; global efforts to reduce food waste; growth in telecommunications networks; global development of electrical transmission and distribution infrastructure; and renewable energy applications.
Joint Ventures
Joint ventures play an integral role within the Packaging & Specialty Plastics segment by dampening earnings cyclicality and improving earnings growth. Principal joint ventures impacting the Packaging & Specialty Plastics segment are noted in the following section:
Aligned 100 percent with Packaging & Specialty Plastics:
|
•
|
The Kuwait Styrene Company K.S.C. - a Kuwait-based company that manufactures styrene monomer; owned
42.5 percent
by the Company.
|
|
•
|
The SCG-Dow Group consists of Siam Polyethylene Company Limited; Siam Polystyrene Company Limited; Siam Styrene Monomer Co., Ltd.; and Siam Synthetic Latex Company Limited. These Thailand-based companies manufacture polyethylene, polystyrene, styrene and latex; owned
50 percent
by the Company.
|
Packaging & Specialty Plastics includes a portion of the results of:
|
•
|
EQUATE - a Kuwait-based company that manufactures ethylene, polyethylene and ethylene glycol; and manufactures and markets monoethylene glycol, diethylene glycol and polyethylene terephthalate resins; owned
42.5 percent
by the Company.
|
|
•
|
TKOC - a Kuwait-based company that manufactures ethylene and ethylene glycol; owned
42.5
percent by the Company.
|
|
•
|
Map Ta Phut Olefins Company Limited - effective ownership is
32.77 percent
of which the Company directly owns
20.27
percent (aligned with Industrial Intermediates & Infrastructure) and indirectly owns
12.5 percent
through its equity interest in Siam Polyethylene Company Limited and Siam Synthetic Latex Company Limited (both part of The SCG-Dow Group and aligned with Packaging & Specialty Plastics). This Thailand-based company manufactures propylene and ethylene
.
|
|
•
|
Sadara - a Saudi Arabian company that manufactures chlorine, ethylene, propylene and aromatics for internal consumption and manufactures and sells polyethylene, ethylene oxide and propylene oxide derivative products, and isocyanates; owned
35 percent
by the Company.
|
ELECTRONICS & IMAGING
Electronics & Imaging is a leading global supplier of differentiated materials and systems for a broad range of consumer electronics including mobile devices, television monitors, personal computers and electronics used in a variety of industries. The segment is a leading provider of materials and solutions for the fabrication of semiconductors and integrated circuits and also provides innovative metallization processes for metal finishing, decorative, and industrial applications. Electronics & Imaging is a leading
182
global supplier of key materials for the manufacturing of photovoltaics ("PV") and solar cells, including innovative metallization pastes and back sheet materials for the production of solar cells and solar modules and in the advanced printing and packaging graphics industry providing flexographic printing inks, photopolymer plates, and platemaking systems used in digital printing applications for textile, commercial and home-office use. In addition, the segment provides cutting-edge materials for the manufacturing of rigid and flexible displays for liquid crystal displays ("LCD"), advanced-matrix organic light emitting diode ("AMOLED"), and quantum dot ("QD") applications.
NUTRITION & BIOSCIENCES
Nutrition & Biosciences is an innovation-driven and customer-focused segment that provides solutions for the global food and beverage, pharma, personal care, energy and animal nutrition markets. It consists of
two
operating segments: Nutrition & Health and Industrial Biosciences.
Nutrition & Health
The Nutrition & Health business is one of the world’s largest producers of specialty food ingredients, developing and manufacturing solutions for the global food and beverage market. Its innovative and broad portfolio of natural-based ingredients marketed under the DuPont DANISCO® brand serves to improve health and nutrition as well as taste and texture in a wide range of dairy, beverage, bakery, and dietary supplement applications. Its probiotics portfolio, including the HOWARU® brand, is world famous for its extensively documented strains that deliver consumers benefits in digestive and immune health. In addition to serving the global food and beverage market, the Nutrition & Health business is one of the world's largest producers of cellulosic- and alginates‑based pharma excipients, used to improve the functionality and delivery of pharmaceuticals, and enabling the development of more effective pharma solutions.
Industrial Biosciences
The Industrial Biosciences business is an industry pioneer and innovator that works with customers to improve the performance, productivity and sustainability of their products and processes through biotechnology and engineering solutions including enzymes, biomaterials, biocides and antimicrobial solutions and process technology. Industrial Biosciences offers better, cleaner and safer solutions to a wide range of industries including animal nutrition, biofuels, apparel and textiles, food and beverages, cleaning, personal care, fertilizers, and oil and gas.
TRANSPORTATION & ADVANCED POLYMERS
Transportation & Advanced Polymers provides high-performance engineering resins, adhesives, lubricants and parts to engineers and designers in the transportation, electronics, medical, industrial and consumer end-markets to enable systems solutions for demanding applications and environments.
The segment delivers a broad range of polymer-based high-performance materials in its product portfolio, including elastomers and thermoplastic and thermoset engineering polymers which are used by customers to fabricate components for mechanical, chemical and electrical systems. The main products include: DUPONT™ ZYTEL® nylon resins, DELRIN® acetal resins, HYTREL® polyester thermoplastic elastomer resins, TYNEX® filaments, VESPEL® parts and shapes, VAMAC® ethylene acrylic elastomer, KALREZ® perfluoroelastomer, CRASTIN® PBT thermoplastic polyester resin, RYNITE® PET polyester resin, MOLYKOTE® lubricants, DOW CORNING® silicone solutions for healthcare, MULTIBASE™ TPSiV™ silicones for thermoplastics and BETASEAL™, BETAMATE™ and BETAFORCE™ structural and elastic adhesives. The segment produces innovative and differentiated adhesive technologies to meet customer specifications for durability, crash performance, and healthcare applications. Transportation & Advanced Polymers also targets the performance plastics and fluid solutions markets by developing technologies that differentiate customers’ products with improved performance characteristics.
SAFETY & CONSTRUCTION
Safety & Construction is the global leader in providing innovative engineered products and integrated systems for a number of industries including construction, worker safety, energy, oil and gas, transportation, medical devices and water purification and separation. Safety & Construction addresses the growing global needs of businesses, governments and consumers for solutions that make life safer, healthier and better.
Innovation is the business imperative. By uniting market-driven science with the strength of highly regarded brands including DUPONT™ KEVLAR® high-strength material, NOMEX® thermal-resistant material, CORIAN® solid surfaces, TYVEK® selective barriers, Dow FILMTEC™ reverse osmosis elements, Dow STYROFOAM™ insulation and Dow GREAT STUFF™ do it yourself products, the segment strives to bring new products and solutions to solve customers' needs faster, better and more cost effectively. Safety & Construction is investing in future growth initiatives such as the protection of perishable and temperature‑sensitive foods and pharmaceutical products, new roofing products, flame resistant cargo containers, protective clothing with much higher levels of arc protection for utilities, more comfortable and higher particulate protection hoods for firefighters and high recovery reverse osmosis elements. Through the sustainable solutions product line, the segment is a leader
183
in safety consulting, selling training products as well as consulting services, to improve the safety, productivity and sustainability of organizations across a range of industries.
CORPORATE
Corporate includes certain enterprise and governance activities (including insurance operations, environmental operations, geographic management, etc.); business incubation platforms; non-business aligned joint ventures; gains and losses on the sales of financial assets; severance costs; non-business aligned litigation expenses; discontinued or non-aligned businesses and pre‑commercial activities.
Product transfers to Agriculture from other operating segments are generally valued at market-based prices. Other transfers of products between operating segments are generally valued at cost.
Sales are attributed to geographic regions based on customer location; long-lived assets are attributed to geographic regions based on asset location.
|
Geographic Region Information
|
United States
|
EMEA
|
Rest of World
|
Total
|
||||||||
|
In millions
|
||||||||||||
|
2017
|
||||||||||||
|
Sales to external customers
|
$
|
21,210
|
|
$
|
18,069
|
|
$
|
23,205
|
|
$
|
62,484
|
|
|
Long-lived assets
|
$
|
23,274
|
|
$
|
6,252
|
|
$
|
6,721
|
|
$
|
36,247
|
|
|
2016
|
||||||||||||
|
Sales to external customers
|
$
|
16,681
|
|
$
|
13,633
|
|
$
|
17,844
|
|
$
|
48,158
|
|
|
Long-lived assets
|
$
|
14,812
|
|
$
|
2,708
|
|
$
|
5,966
|
|
$
|
23,486
|
|
|
2015
|
||||||||||||
|
Sales to external customers
|
$
|
16,865
|
|
$
|
14,288
|
|
$
|
17,625
|
|
$
|
48,778
|
|
|
Long-lived assets
|
$
|
11,062
|
|
$
|
2,137
|
|
$
|
4,655
|
|
$
|
17,854
|
|
184
|
Segment Information
|
Agri-culture
|
Perf. Materials & Coatings
|
Ind. Interm. & Infrast.
|
Pack. & Spec. Plastics
|
Elect. & Imaging
|
Nutrition & Biosciences
|
Transp. & Adv. Polymers
|
Safety & Const.
|
Corp.
|
Total
|
||||||||||||||||||||
|
In millions
|
||||||||||||||||||||||||||||||
|
2017
|
||||||||||||||||||||||||||||||
|
Net sales
|
$
|
7,516
|
|
$
|
8,783
|
|
$
|
12,647
|
|
$
|
21,456
|
|
$
|
3,356
|
|
$
|
2,812
|
|
$
|
2,521
|
|
$
|
3,006
|
|
$
|
387
|
|
$
|
62,484
|
|
|
Pro forma net sales
|
14,342
|
|
8,740
|
|
12,640
|
|
22,392
|
|
4,775
|
|
5,980
|
|
5,131
|
|
5,142
|
|
393
|
|
79,535
|
|
||||||||||
|
Restructuring, goodwill impairment and asset related charges - net
1
|
134
|
|
1,578
|
|
17
|
|
716
|
|
125
|
|
1
|
|
2
|
|
53
|
|
654
|
|
3,280
|
|
||||||||||
|
Equity in earnings (losses) of nonconsolidated affiliates
|
3
|
|
394
|
|
172
|
|
189
|
|
3
|
|
13
|
|
(1
|
)
|
2
|
|
(11
|
)
|
764
|
|
||||||||||
|
Pro forma Operating EBITDA
2
|
2,611
|
|
2,121
|
|
2,282
|
|
4,698
|
|
1,486
|
|
1,302
|
|
1,319
|
|
1,190
|
|
(843
|
)
|
16,166
|
|
||||||||||
|
Depreciation and amortization
|
427
|
|
903
|
|
604
|
|
911
|
|
297
|
|
248
|
|
183
|
|
266
|
|
130
|
|
3,969
|
|
||||||||||
|
Total assets
|
45,569
|
|
15,532
|
|
12,113
|
|
25,809
|
|
14,400
|
|
25,357
|
|
14,712
|
|
15,452
|
|
23,220
|
|
192,164
|
|
||||||||||
|
Investment in nonconsolidated affiliates
|
333
|
|
769
|
|
1,699
|
|
1,184
|
|
530
|
|
203
|
|
76
|
|
359
|
|
183
|
|
5,336
|
|
||||||||||
|
Capital expenditures
|
310
|
|
448
|
|
295
|
|
1,965
|
|
135
|
|
157
|
|
74
|
|
186
|
|
—
|
|
3,570
|
|
||||||||||
|
2016
|
||||||||||||||||||||||||||||||
|
Net sales
|
$
|
6,173
|
|
$
|
6,412
|
|
$
|
10,832
|
|
$
|
18,404
|
|
$
|
2,307
|
|
$
|
975
|
|
$
|
897
|
|
$
|
1,877
|
|
$
|
281
|
|
$
|
48,158
|
|
|
Pro forma net sales
|
14,060
|
|
6,362
|
|
10,820
|
|
19,848
|
|
4,266
|
|
5,763
|
|
4,497
|
|
4,984
|
|
294
|
|
70,894
|
|
||||||||||
|
Restructuring, goodwill impairment and asset related charges - net
1
|
5
|
|
42
|
|
83
|
|
10
|
|
—
|
|
1
|
|
—
|
|
(3
|
)
|
457
|
|
595
|
|
||||||||||
|
Asbestos-related charge
3
|
—
|
|
—
|
|
—
|
|
—
|
|
—
|
|
—
|
|
—
|
|
—
|
|
1,113
|
|
1,113
|
|
||||||||||
|
Equity in earnings (losses) of nonconsolidated affiliates
|
5
|
|
303
|
|
(18
|
)
|
137
|
|
24
|
|
10
|
|
8
|
|
1
|
|
(28
|
)
|
442
|
|
||||||||||
|
Pro forma Operating EBITDA
2
|
2,322
|
|
1,228
|
|
1,672
|
|
5,129
|
|
1,173
|
|
1,227
|
|
1,045
|
|
1,130
|
|
(812
|
)
|
14,114
|
|
||||||||||
|
Depreciation and amortization
|
186
|
|
685
|
|
649
|
|
770
|
|
217
|
|
64
|
|
49
|
|
121
|
|
121
|
|
2,862
|
|
||||||||||
|
Total assets
4
|
6,960
|
|
16,871
|
|
11,649
|
|
17,837
|
|
6,932
|
|
1,246
|
|
1,807
|
|
2,833
|
|
13,376
|
|
79,511
|
|
||||||||||
|
Investment in nonconsolidated affiliates
4
|
84
|
|
939
|
|
1,588
|
|
881
|
|
—
|
|
30
|
|
—
|
|
7
|
|
218
|
|
3,747
|
|
||||||||||
|
Capital expenditures
|
222
|
|
405
|
|
232
|
|
2,731
|
|
79
|
|
31
|
|
16
|
|
88
|
|
—
|
|
3,804
|
|
||||||||||
|
2015
|
||||||||||||||||||||||||||||||
|
Net sales
|
$
|
6,327
|
|
$
|
4,517
|
|
$
|
13,691
|
|
$
|
18,357
|
|
$
|
1,987
|
|
$
|
1,029
|
|
$
|
583
|
|
$
|
1,938
|
|
$
|
349
|
|
$
|
48,778
|
|
|
Restructuring, goodwill impairment and asset related charges - net
1
|
16
|
|
80
|
|
—
|
|
69
|
|
51
|
|
16
|
|
—
|
|
33
|
|
294
|
|
559
|
|
||||||||||
|
Equity in earnings (losses) of nonconsolidated affiliates
|
3
|
|
205
|
|
226
|
|
220
|
|
62
|
|
6
|
|
20
|
|
1
|
|
(69
|
)
|
674
|
|
||||||||||
|
Operating EBITDA
5
|
833
|
|
606
|
|
2,425
|
|
4,812
|
|
583
|
|
130
|
|
156
|
|
400
|
|
(257
|
)
|
9,688
|
|
||||||||||
|
Depreciation and amortization
|
180
|
|
308
|
|
752
|
|
747
|
|
213
|
|
68
|
|
25
|
|
119
|
|
109
|
|
2,521
|
|
||||||||||
|
Total assets
4, 6
|
6,123
|
|
8,899
|
|
9,829
|
|
14,310
|
|
5,993
|
|
1,382
|
|
544
|
|
2,467
|
|
18,391
|
|
67,938
|
|
||||||||||
|
Investment in nonconsolidated affiliates
4
|
85
|
|
1,677
|
|
155
|
|
304
|
|
—
|
|
34
|
|
—
|
|
7
|
|
1,696
|
|
3,958
|
|
||||||||||
|
Capital expenditures
|
307
|
|
188
|
|
254
|
|
2,683
|
|
78
|
|
32
|
|
11
|
|
150
|
|
—
|
|
3,703
|
|
||||||||||
|
1.
|
See Note
5
for information regarding the Company's restructuring programs and other asset related charges.
|
|
2.
|
A reconciliation of "Income from continuing operations, net of tax" to pro forma Operating EBITDA is provided in the table on the following page.
|
|
3.
|
See Note
16
for information regarding the asbestos-related charge.
|
|
4.
|
Equity contributions to Sadara were reflected in Corporate in 2015, and were reallocated to Industrial Intermediates & Infrastructure and Packaging & Specialty Plastics in 2016.
|
|
5.
|
A reconciliation of "Income from continuing operations, net of tax" to Operating EBITDA is provided in the table on the following page.
|
|
6.
|
Presented in accordance with ASU 2015-17.
|
185
|
Reconciliation of "Income from continuing operations, net of tax" to Pro Forma Operating EBITDA
|
2017
|
2016
|
||||
|
In millions
|
||||||
|
Income from continuing operations, net of tax
|
$
|
1,669
|
|
$
|
4,404
|
|
|
+ Provision (Credit) for income taxes on continuing operations
|
(476
|
)
|
9
|
|
||
|
Income from continuing operations before income taxes
|
$
|
1,193
|
|
$
|
4,413
|
|
|
+ Depreciation and amortization
|
3,969
|
|
2,862
|
|
||
|
- Interest income
1
|
147
|
|
107
|
|
||
|
+ Interest expense and amortization of debt discount
|
1,082
|
|
858
|
|
||
|
- Foreign exchange gains (losses), net
1
|
(63
|
)
|
(126
|
)
|
||
|
+ Pro forma adjustments
|
3,179
|
|
4,298
|
|
||
|
Pro forma EBITDA
|
$
|
9,339
|
|
$
|
12,450
|
|
|
- Adjusted significant items
2
|
(6,827
|
)
|
(1,664
|
)
|
||
|
Pro forma Operating EBITDA
|
$
|
16,166
|
|
$
|
14,114
|
|
|
1.
|
Included in "Sundry income (expense) - net."
|
|
2.
|
Significant items, excluding the impact of one-time transaction costs directly attributable to the Merger and reflected in the pro forma adjustments.
|
|
Reconciliation of "Income from continuing operations, net of tax" to Operating EBITDA
|
2015
|
||
|
In millions
|
|||
|
Income from continuing operations, net of tax
|
$
|
7,783
|
|
|
+ Provision for income taxes on continuing operations
|
2,147
|
|
|
|
Income from continuing operations before income taxes
|
$
|
9,930
|
|
|
+ Depreciation and amortization
|
2,521
|
|
|
|
- Interest income
1
|
71
|
|
|
|
+ Interest expense and amortization of debt discount
|
946
|
|
|
|
- Foreign exchange losses, net
1
|
(190
|
)
|
|
|
EBITDA
|
$
|
13,516
|
|
|
- Significant items
|
3,828
|
|
|
|
Operating EBITDA
|
$
|
9,688
|
|
|
1.
|
Included in "Sundry income (expense) - net."
|
186
The adjusted significant items for 2017 and 2016 are presented on a pro forma basis. The 2015 significant items represent historical Dow only. The following tables summarize the pretax impact of adjusted significant items and significant items by segment that are excluded from pro forma Operating EBITDA and Operating EBITDA above:
|
Adjusted Significant Items by Segment for 2017
|
Agri-culture
|
Perf. Materials & Coatings
|
Ind. Interm. & Infrast.
|
Pack. & Spec. Plastics
|
Elect. & Imaging
|
Nutrition & Biosciences
|
Transp. & Adv. Polymers
|
Safety & Const.
|
Corp.
|
Total
|
||||||||||||||||||||
|
In millions
|
||||||||||||||||||||||||||||||
|
Gains on sales of businesses/entities
1
|
$
|
635
|
|
$
|
—
|
|
$
|
—
|
|
$
|
227
|
|
$
|
—
|
|
$
|
162
|
|
$
|
—
|
|
$
|
—
|
|
$
|
7
|
|
$
|
1,031
|
|
|
Integration and separation costs
2
|
—
|
|
—
|
|
—
|
|
—
|
|
—
|
|
—
|
|
—
|
|
—
|
|
(1,499
|
)
|
(1,499
|
)
|
||||||||||
|
Merger-related inventory step-up amortization
3
|
(425
|
)
|
—
|
|
—
|
|
(120
|
)
|
(144
|
)
|
(404
|
)
|
(212
|
)
|
(178
|
)
|
—
|
|
(1,483
|
)
|
||||||||||
|
Litigation related charges, awards and adjustments
4
|
(469
|
)
|
—
|
|
—
|
|
137
|
|
—
|
|
—
|
|
—
|
|
—
|
|
—
|
|
(332
|
)
|
||||||||||
|
Restructuring, goodwill impairment and asset related charges - net
5
|
(134
|
)
|
(1,578
|
)
|
(17
|
)
|
(716
|
)
|
(128
|
)
|
(7
|
)
|
(6
|
)
|
(318
|
)
|
(690
|
)
|
(3,594
|
)
|
||||||||||
|
Settlement and curtailment items
6
|
—
|
|
—
|
|
—
|
|
—
|
|
—
|
|
—
|
|
—
|
|
—
|
|
(892
|
)
|
(892
|
)
|
||||||||||
|
Transaction costs and productivity actions
7
|
—
|
|
—
|
|
—
|
|
—
|
|
—
|
|
—
|
|
—
|
|
—
|
|
(58
|
)
|
(58
|
)
|
||||||||||
|
Total
|
$
|
(393
|
)
|
$
|
(1,578
|
)
|
$
|
(17
|
)
|
$
|
(472
|
)
|
$
|
(272
|
)
|
$
|
(249
|
)
|
$
|
(218
|
)
|
$
|
(496
|
)
|
$
|
(3,132
|
)
|
$
|
(6,827
|
)
|
|
1.
|
Includes the sale of the DAS Divested Ag Business (
$635 million
), the sale of Dow's EAA Business (
$227 million
), the sale of DuPont's global food safety diagnostic business (
$162 million
) and post-closing adjustments on the split-off of Dow's chlorine value chain (
$7 million
). See Notes
4
and
6
for additional information.
|
|
2.
|
Integration and separation costs related to the Merger, post-Merger integration and Intended Business Separation activities, and costs related to the ownership restructure of Dow Corning.
|
|
3.
|
Includes the fair value step-up of DuPont's inventories as a result of the Merger and the acquisition of the H&N Business of
$1,469 million
and the amortization of a basis difference related to the fair value step-up of inventories of
$14 million
. See Note
3
for additional information.
|
|
4.
|
Includes an arbitration matter with Bayer CropScience (
$469 million
charge) and a patent infringement matter with Nova Chemicals Corporation (
$137 million
gain). See Note
16
for additional information.
|
|
5.
|
Includes Board approved restructuring plans, goodwill impairment, and asset related charges, which includes other asset impairments. See Note
5
for additional information.
|
|
6.
|
Includes a settlement charge related to the payment of plan obligations to certain participants of a Dow U.S. non-qualified pension plan as a result of the Merger. See Note
19
for additional information.
|
|
7.
|
Includes implementation costs associated with Dow's restructuring programs and other productivity actions.
|
187
|
Adjusted Significant Items by Segment for 2016
|
Agri-culture
|
Perf. Materials & Coatings
|
Ind. Interm. & Infrast.
|
Pack. & Spec. Plastics
|
Elect. & Imaging
|
Nutrition & Biosciences
|
Transp. & Adv. Polymers
|
Safety & Const.
|
Corp.
|
Total
|
||||||||||||||||||||
|
In millions
|
||||||||||||||||||||||||||||||
|
Asbestos-related charge
1
|
$
|
—
|
|
$
|
—
|
|
$
|
—
|
|
$
|
—
|
|
$
|
—
|
|
$
|
—
|
|
$
|
—
|
|
$
|
—
|
|
$
|
(1,113
|
)
|
$
|
(1,113
|
)
|
|
Charge for the termination of a terminal use agreement
2
|
—
|
|
—
|
|
—
|
|
(117
|
)
|
—
|
|
—
|
|
—
|
|
—
|
|
—
|
|
(117
|
)
|
||||||||||
|
Settlement and curtailment items
3
|
—
|
|
—
|
|
—
|
|
—
|
|
—
|
|
—
|
|
—
|
|
—
|
|
382
|
|
382
|
|
||||||||||
|
Customer claims adjustment/
recovery
4
|
53
|
|
—
|
|
—
|
|
—
|
|
—
|
|
—
|
|
—
|
|
—
|
|
—
|
|
53
|
|
||||||||||
|
Environmental charges
5
|
(2
|
)
|
—
|
|
(1
|
)
|
(2
|
)
|
—
|
|
—
|
|
—
|
|
—
|
|
(290
|
)
|
(295
|
)
|
||||||||||
|
Gains on sales of businesses/entities
6
|
—
|
|
—
|
|
6
|
|
—
|
|
—
|
|
—
|
|
—
|
|
—
|
|
369
|
|
375
|
|
||||||||||
|
Impact of Dow Corning ownership restructure
7
|
—
|
|
1,389
|
|
—
|
|
—
|
|
438
|
|
—
|
|
279
|
|
—
|
|
—
|
|
2,106
|
|
||||||||||
|
Integration and separation costs
8
|
—
|
|
—
|
|
—
|
|
—
|
|
—
|
|
—
|
|
—
|
|
—
|
|
(476
|
)
|
(476
|
)
|
||||||||||
|
Litigation related charges, awards and adjustments
9
|
—
|
|
16
|
|
(1,235
|
)
|
—
|
|
4
|
|
—
|
|
7
|
|
—
|
|
—
|
|
(1,208
|
)
|
||||||||||
|
Restructuring, goodwill impairment and asset related charges - net
10
|
(96
|
)
|
(42
|
)
|
(83
|
)
|
(10
|
)
|
(2
|
)
|
(162
|
)
|
(7
|
)
|
—
|
|
(774
|
)
|
(1,176
|
)
|
||||||||||
|
Transaction costs and productivity actions
11
|
—
|
|
—
|
|
—
|
|
—
|
|
—
|
|
—
|
|
—
|
|
—
|
|
(195
|
)
|
(195
|
)
|
||||||||||
|
Total
|
$
|
(45
|
)
|
$
|
1,363
|
|
$
|
(1,313
|
)
|
$
|
(129
|
)
|
$
|
440
|
|
$
|
(162
|
)
|
$
|
279
|
|
$
|
—
|
|
$
|
(2,097
|
)
|
$
|
(1,664
|
)
|
|
1.
|
Pretax charge related to Dow's election to change its method of accounting for asbestos-related defense costs from expensing as incurred to estimating and accruing a liability. As a result of this accounting policy change, Dow recorded a pretax charge of
$1,009 million
for asbestos-related defense costs through the terminal date of 2049. Dow also recorded a pretax charge of
$104 million
to increase the asbestos-related liability for pending and future claims through the terminal date of 2049. See Note
16
for additional information.
|
|
2.
|
Pretax charge related to Dow's termination of a terminal use agreement.
|
|
3.
|
Pretax curtailment gain related to changes to DuPont's U.S. pension plan and U.S. other postretirement benefits plan.
|
|
4.
|
Includes a reduction in customer claims accrual (
$23 million
) and insurance recoveries for recovery of costs for customer claims (
$30 million
) related to the use of DuPont's IMPRELIS® herbicide.
|
|
5.
|
Pretax charge for environmental remediation activities at a number of historical Dow locations, primarily resulting from the culmination of negotiations with regulators and/or final agency approval. See Note
16
for additional information.
|
|
6.
|
Includes a gain for post-closing adjustments on the split-off of the chlorine value chain (
$6 million
) and the sale of the DuPont (Shenzhen) Manufacturing Limited entity (
$369 million
).
|
|
7.
|
Includes a non-taxable gain of
$2,445 million
related to the Dow Corning ownership restructure; a
$317 million
charge for the fair value step-up of inventories; and, a pretax loss of
$22 million
related to the early redemption of debt incurred by Dow Corning. See Note
3
for additional information.
|
|
8.
|
Integration and separation costs related to the Merger and the ownership restructure of Dow Corning.
|
|
9.
|
Includes a loss of
$1,235 million
related to Dow's settlement of the urethane matters class action lawsuit and the opt-out cases litigation and a gain of
$27 million
related to a decrease in Dow Corning's implant liability. See Note
16
for additional information.
|
|
10.
|
Includes Dow and DuPont restructuring activities. See Note
5
for additional information. Also includes a pretax charge related to AgroFresh, including a partial impairment of Dow’s investment in AFSI (
$143 million
) and post-closing adjustments related to non-cash consideration (
$20 million
); a pretax charge for the write-down of DuPont's indefinite lived intangible assets (
$158 million
) related to the realignment of brand marketing strategies and a determination to phase out the use of certain acquired tradenames; and, a pretax charge related to the write-down of DuPont's uncompleted enterprise resource planning system (
$435 million
).
|
|
11.
|
Includes implementation costs associated with Dow's restructuring programs and other productivity actions of
$162 million
and a charge of
$33 million
for a retained litigation matter related to the chlorine value chain.
|
188
|
Significant Items by Segment for 2015
|
Agri-culture
|
Perf. Materials & Coatings
|
Ind. Interm. & Infrast.
|
Pack. & Spec. Plastics
|
Elect. & Imaging
|
Nutrition & Biosciences
|
Transp. & Adv. Polymers
|
Safety & Const.
|
Corp.
|
Total
|
||||||||||||||||||||
|
In millions
|
||||||||||||||||||||||||||||||
|
Gains on sales of businesses/entities
1
|
$
|
—
|
|
$
|
—
|
|
$
|
3,409
|
|
$
|
317
|
|
$
|
—
|
|
$
|
—
|
|
$
|
—
|
|
$
|
—
|
|
$
|
550
|
|
$
|
4,276
|
|
|
Gain on Univation step acquisition
2
|
—
|
|
—
|
|
—
|
|
349
|
|
—
|
|
—
|
|
—
|
|
—
|
|
—
|
|
349
|
|
||||||||||
|
Integration and separation costs
3
|
—
|
|
—
|
|
—
|
|
—
|
|
—
|
|
—
|
|
—
|
|
—
|
|
(23
|
)
|
(23
|
)
|
||||||||||
|
Joint venture actions
4
|
—
|
|
20
|
|
—
|
|
—
|
|
—
|
|
—
|
|
—
|
|
—
|
|
(56
|
)
|
(36
|
)
|
||||||||||
|
Loss on early extinguishment of
debt
5
|
—
|
|
—
|
|
—
|
|
—
|
|
—
|
|
—
|
|
—
|
|
—
|
|
(8
|
)
|
(8
|
)
|
||||||||||
|
Restructuring, goodwill impairment and asset related charges - net
6
|
(16
|
)
|
(80
|
)
|
—
|
|
(69
|
)
|
(51
|
)
|
(16
|
)
|
—
|
|
(33
|
)
|
(294
|
)
|
(559
|
)
|
||||||||||
|
Transaction costs and productivity actions
7
|
—
|
|
—
|
|
—
|
|
—
|
|
—
|
|
—
|
|
—
|
|
—
|
|
(171
|
)
|
(171
|
)
|
||||||||||
|
Total
|
$
|
(16
|
)
|
$
|
(60
|
)
|
$
|
3,409
|
|
$
|
597
|
|
$
|
(51
|
)
|
$
|
(16
|
)
|
$
|
—
|
|
$
|
(33
|
)
|
$
|
(2
|
)
|
$
|
3,828
|
|
|
1.
|
Includes a pretax gain of
$2,233 million
on the October 5, 2015, split-off of Dow's chlorine value chain to Olin. See Note
6
for additional information. Also includes pretax gains from the sale of Dow's equity interest in MEGlobal to EQUATE (
$723 million
) and the divestitures of ANGUS (
$682 million
), AgroFresh (
$618 million
) and SBH (
$20 million
). See Note
4
for additional information.
|
|
2.
|
Includes a pretax gain related to the step acquisition of Univation, previously a
50
:50 joint venture (
$361 million
) and a pretax loss related to the fair value step-up of inventories assumed in the step acquisition (
$12 million
). See Note
3
for additional information.
|
|
3.
|
Integration and separation costs related to the Merger and the ownership restructure of Dow Corning.
|
|
4.
|
Includes actions taken by Dow's joint ventures including: a
$20 million
pretax gain related to Dow Corning's adjustment of its implant liability, a
$29 million
charge related to AgroFresh Solutions' fair value step-up of its inventories and start-up costs, and a
$27 million
charge related to Sadara's write-off of design engineering work for an Epoxy plant.
|
|
5.
|
Includes a pretax loss on the early extinguishment of debt.
|
|
6.
|
Includes Dow restructuring activities. See Note
5
for additional information. Also includes pretax charges for asset impairments and related costs, including the shutdown of manufacturing assets and facilities in the Safety & Construction and Packaging & Specialty Plastics businesses; the abandonment of certain capital projects in the Safety & Construction and Coatings & Performance Monomers businesses; and, the impairment of an equity method investment aligned with the Coatings & Performance Monomers business.
|
|
7.
|
Includes implementation costs associated with Dow's restructuring programs and other productivity actions.
|
189
NOTE
25
- SELECTED QUARTERLY FINANCIAL DATA
|
Selected Quarterly Financial Data
|
2017
1
|
||||||||||||||
|
In millions, except per share amounts (Unaudited)
|
First
|
Second
|
Third
|
Fourth
|
Year
|
||||||||||
|
Net Sales
|
$
|
13,230
|
|
$
|
13,834
|
|
$
|
15,354
|
|
$
|
20,066
|
|
$
|
62,484
|
|
|
Gross margin
2
|
$
|
3,033
|
|
$
|
3,071
|
|
$
|
3,184
|
|
$
|
2,782
|
|
$
|
12,070
|
|
|
Restructuring, goodwill impairment and asset related charges, net
3
|
$
|
(1
|
)
|
$
|
(12
|
)
|
$
|
179
|
|
$
|
3,114
|
|
$
|
3,280
|
|
|
Integration and separation costs
|
$
|
109
|
|
$
|
136
|
|
$
|
354
|
|
$
|
502
|
|
$
|
1,101
|
|
|
Income (loss) from continuing operations, net of tax
4
|
$
|
915
|
|
$
|
1,359
|
|
$
|
554
|
|
$
|
(1,159
|
)
|
$
|
1,669
|
|
|
Net income (loss) attributable to DowDuPont Inc.
|
$
|
888
|
|
$
|
1,321
|
|
$
|
514
|
|
$
|
(1,263
|
)
|
$
|
1,460
|
|
|
Earnings (loss) per common share from continuing operations - basic
5
|
$
|
0.74
|
|
$
|
1.08
|
|
$
|
0.33
|
|
$
|
(0.52
|
)
|
$
|
0.97
|
|
|
Earnings (loss) per common share from continuing operations - diluted
5, 6
|
$
|
0.72
|
|
$
|
1.07
|
|
$
|
0.33
|
|
$
|
(0.52
|
)
|
$
|
0.95
|
|
|
Dividends declared per share of common stock
|
$
|
0.46
|
|
$
|
0.46
|
|
$
|
0.46
|
|
$
|
0.38
|
|
$
|
1.76
|
|
|
Market price range of common stock:
|
|||||||||||||||
|
High
|
$
|
65.00
|
|
$
|
65.26
|
|
$
|
70.41
|
|
$
|
73.32
|
|
$
|
73.32
|
|
|
Low
|
$
|
57.09
|
|
$
|
60.20
|
|
$
|
63.11
|
|
$
|
68.57
|
|
$
|
57.09
|
|
|
2016
1
|
|||||||||||||||
|
In millions, except per share amounts (Unaudited)
|
First
|
Second
|
Third
|
Fourth
|
Year
|
||||||||||
|
Net Sales
|
$
|
10,703
|
|
$
|
11,952
|
|
$
|
12,483
|
|
$
|
13,020
|
|
$
|
48,158
|
|
|
Gross margin
2
|
$
|
2,752
|
|
$
|
2,677
|
|
$
|
2,643
|
|
$
|
2,446
|
|
$
|
10,518
|
|
|
Restructuring, goodwill impairment and asset related charges, net
3
|
$
|
(2
|
)
|
$
|
454
|
|
$
|
—
|
|
$
|
143
|
|
$
|
595
|
|
|
Integration and separation costs
|
$
|
34
|
|
$
|
67
|
|
$
|
127
|
|
$
|
121
|
|
$
|
349
|
|
|
Asbestos-related charge
|
$
|
—
|
|
$
|
—
|
|
$
|
—
|
|
$
|
1,113
|
|
$
|
1,113
|
|
|
Income from continuing operations, net of tax
7
|
$
|
275
|
|
$
|
3,227
|
|
$
|
818
|
|
$
|
84
|
|
$
|
4,404
|
|
|
Net income attributable to DowDuPont Inc.
|
$
|
254
|
|
$
|
3,208
|
|
$
|
804
|
|
$
|
52
|
|
$
|
4,318
|
|
|
Earnings (loss) per common share from continuing operations - basic
5, 8
|
$
|
0.15
|
|
$
|
2.79
|
|
$
|
0.64
|
|
$
|
(0.03
|
)
|
$
|
3.57
|
|
|
Earnings (loss) per common share from continuing operations - diluted
5, 6, 9
|
$
|
0.15
|
|
$
|
2.61
|
|
$
|
0.63
|
|
$
|
(0.03
|
)
|
$
|
3.52
|
|
|
Dividends declared per share of common stock
|
$
|
0.46
|
|
$
|
0.46
|
|
$
|
0.46
|
|
$
|
0.46
|
|
$
|
1.84
|
|
|
Market price range of common stock:
|
|||||||||||||||
|
High
|
$
|
52.23
|
|
$
|
53.98
|
|
$
|
54.59
|
|
$
|
59.33
|
|
$
|
59.33
|
|
|
Low
|
$
|
40.26
|
|
$
|
47.75
|
|
$
|
47.51
|
|
$
|
51.60
|
|
$
|
40.26
|
|
|
1.
|
The Merger closed on August 31, 2017. Financial information for 2017 reflects the results of Dow for all periods presented and the results of DuPont beginning on and after September 1, 2017.
|
|
2.
|
Previously reported amounts have been updated for reclassifications made to "Integration and separation costs."
|
|
3.
|
See Note
5
for additional information.
|
|
4.
|
See Notes
3
,
7
,
8
,
13
,
16
and
19
for additional information on items materially impacting "Income (loss) from continuing operations, net of tax." The fourth quarter of 2017 included: the effects of The Act, enacted on December 22, 2017; Merger-related amortization of the fair value step-up of inventories; a gain related to the DAS Divested Ag Business; and a charge related to payment of plan obligations to certain participants of a Dow U.S. non-qualified pension plan. The third quarter of 2017 included a gain related to the sale of Dow's EAA Business and Merger-related amortization of the fair value step-up of inventories. The second quarter of 2017 included a gain related to the Nova patent infringement award. The first quarter of 2017 included a loss related to the Bayer CropScience arbitration matter.
|
|
5.
|
Due to quarterly changes in the share count and the allocation of income to participating securities, the sum of the four quarters does not equal the earnings per share amount calculated for the year.
|
|
6.
|
"Earnings (loss) per common share - diluted" for the three-month periods ended December 31, 2017 and 2016, was calculated using "Weighted average common shares outstanding - basic" due to a net loss reported in the period.
|
|
7.
|
The second quarter of 2016 was impacted by the gain related to the Dow Corning ownership restructure. See Note
3
for further information.
|
|
8.
|
On December 30, 2016, Dow converted
4 million
shares of Cumulative Convertible Perpetual Preferred Stock, Series A ("Preferred Stock") into
96.8 million
shares of Dow's common stock. As a result, the basic share count reflects a two-day averaging effect for the three- and twelve-month periods ended December 31, 2016.
|
|
9.
|
For the quarter ended June 30, 2016, an assumed conversion of Dow's Preferred Stock into shares of Dow's common stock was included in the calculation of earnings per common share - diluted. The assumed conversion of Dow's Preferred Stock was considered antidilutive for all other periods. See Note
9
for additional information.
|
190
NOTE
26
- SUBSEQUENT EVENTS
DuPont Repurchase Facility
In February 2018, DuPont entered into a new committed receivable repurchase facility of up to
$1,300 million
(the "2018 Repurchase Facility") which expires in December 2018. Under the 2018 Repurchase Facility, DuPont may sell a portfolio of available and eligible outstanding customer notes receivables within the Agriculture segment to participating institutions and simultaneously agree to repurchase at a future date. The 2018 Repurchase Facility is considered a secured borrowing with the customer notes receivables, inclusive of those that are sold and repurchased, equal to
105 percent
of the outstanding amounts borrowed utilized as collateral. Borrowings under the 2018 Repurchase Facility will have an interest rate of LIBOR plus
0.75 percent
.
Not applicable.
191
Evaluation of Disclosure Controls and Procedures
As of the end of the period covered by this Annual Report on Form 10-K, the Company carried out an evaluation, under the supervision and with the participation of the Company’s Disclosure Committee and the Company’s management, including the Chief Executive Officer and the Chief Financial Officer, of the effectiveness of the design and operation of the Company’s disclosure controls and procedures pursuant to paragraph (b) of Exchange Act Rules 13a-15 and 15d-15. Based upon that evaluation, the Chief Executive Officer and the Chief Financial Officer concluded that the Company’s disclosure controls and procedures were effective.
Changes in Internal Control Over Financial Reporting
There were no changes in the Company's internal control over financial reporting identified in connection with the evaluation required by paragraph (d) of Exchange Act Rules 13a-15 and 15d-15 that was conducted during the last fiscal quarter that have materially affected, or are reasonably likely to materially affect, the Company's internal control over financial reporting.
Management’s Report on Internal Control Over Financial Reporting
Management is responsible for establishing and maintaining adequate internal control over financial reporting. The Company’s internal control framework and processes are designed to provide reasonable assurance to management and the Board of Directors regarding the reliability of financial reporting and the preparation of the Company’s consolidated financial statements in accordance with accounting principles generally accepted in the United States of America.
The Company’s internal control over financial reporting includes those policies and procedures that:
|
•
|
pertain to the maintenance of records that, in reasonable detail, accurately and fairly reflect the transactions and dispositions of the assets of the Company;
|
|
•
|
provide reasonable assurance that transactions are recorded as necessary to permit preparation of financial statements in accordance with generally accepted accounting principles, and that receipts and expenditures of the Company are being made only in accordance with authorizations of management and Directors of the Company; and
|
|
•
|
provide reasonable assurance regarding prevention or timely detection of unauthorized acquisition, use or disposition of the Company’s assets that could have a material effect on the consolidated financial statements.
|
Because of its inherent limitations, any system of internal control over financial reporting can provide only reasonable assurance and may not prevent or detect misstatements.
Management assessed the effectiveness of the Company’s internal control over financial reporting and concluded that, as of
December 31, 2017
, such internal control is effective. In making this assessment, management used the criteria set forth by the Committee of Sponsoring Organizations of the Treadway Commission (“COSO”) in
Internal Control—Integrated Framework (2013).
The Company’s independent auditors, Deloitte & Touche
LLP
, with direct access to the Company’s Board of Directors through its Audit Committee, have audited the consolidated financial statements prepared by the Company. Their report on the consolidated financial statements is included in Part II, Item 8. Financial Statements and Supplementary Data. Deloitte & Touche
LLP’s
report on the Company’s internal control over financial reporting is referenced therein and included herein. As described in their report, the effectiveness of E. I. du Pont de Nemours and Company's internal control over financial reporting was audited by other auditors whose report has been furnished to Deloitte & Touche
LLP
, and their opinion, insofar as it relates to the effectiveness of DuPont's internal control over financial reporting, is based solely on the report of the other auditors.
February 15, 2018
|
/s/ EDWARD D. BREEN
|
|
|
/s/ HOWARD I. UNGERLEIDER
|
|
|
Edward D. Breen
|
|
|
Howard I. Ungerleider
|
|
|
Chief Executive Officer
|
|
|
Chief Financial Officer
|
|
|
/s/ JEANMARIE F. DESMOND
|
|
|
/s/ RONALD C. EDMONDS
|
|
|
Jeanmarie F. Desmond
|
|
|
Ronald C. Edmonds
|
|
|
Co-Controller, Wilmington, Delaware
|
|
|
Co-Controller, Midland, Michigan
|
|
192
REPORT OF INDEPENDENT REGISTERED PUBLIC ACCOUNTING FIRM
To the Stockholders and the Board of Directors of DowDuPont Inc.
Opinion on Internal Control over Financial Reporting
We have audited the internal control over financial reporting of DowDuPont Inc. and subsidiaries (the "Company") as of December 31, 2017, based on criteria established in
Internal Control - Integrated Framework (2013)
issued by the Committee of Sponsoring Organizations of the Treadway Commission (COSO). In our opinion, based on our audit and the report of the other auditors, the Company maintained, in all material respects, effective internal control over financial reporting as of December 31, 2017, based on criteria established in
Internal Control - Integrated Framework (2013)
issued by COSO.
We did not audit the effectiveness of internal control over financial reporting of E. I. du Pont de Nemours and Company (“DuPont”), a wholly owned subsidiary of the Company, whose financial statements reflect total assets of $112,964 million as of December 31, 2017 and total revenues of $7,053 million for the period from August 31, 2017 (date of the merger) to December 31, 2017. The effectiveness of DuPont’s internal control over financial reporting was audited by other auditors whose report has been furnished to us, and our opinion, insofar as it relates to the effectiveness of DuPont’s internal control over financial reporting, is based solely on the report of the other auditors.
We have also audited, in accordance with the standards of the Public Company Accounting Oversight Board (United States) (PCAOB), the consolidated financial statements as of and for the year ended December 31, 2017 of the Company and the financial statement schedule listed in the Index at Item 15(a)2 and our report dated February 15, 2018, expressed an unqualified opinion on those financial statements and financial statement schedule based on our audit and the report of the other auditors and included an explanatory paragraph regarding a change in accounting policy related to asbestos-related defense and processing costs and an emphasis of a matter paragraph regarding the merger of The Dow Chemical Company and DuPont.
Basis for Opinion
The Company’s management is responsible for maintaining effective internal control over financial reporting and for its assessment of the effectiveness of internal control over financial reporting, included in the accompanying
Management’s Report on Internal Control over Financial Reporting
. Our responsibility is to express an opinion on the Company’s internal control over financial reporting based on our audit. We are a public accounting firm registered with the PCAOB and are required to be independent with respect to the Company in accordance with the U.S. federal securities laws and the applicable rules and regulations of the Securities and Exchange Commission and the PCAOB.
We conducted our audit in accordance with the standards of the PCAOB. Those standards require that we plan and perform the audit to obtain reasonable assurance about whether effective internal control over financial reporting was maintained in all material respects. Our audit included obtaining an understanding of internal control over financial reporting, assessing the risk that a material weakness exists, testing and evaluating the design and operating effectiveness of internal control based on the assessed risk, and performing such other procedures as we considered necessary in the circumstances. We believe that our audit and the audit of the other auditors provide a reasonable basis for our opinion.
Definition and Limitations of Internal Control over Financial Reporting
A company’s internal control over financial reporting is a process designed to provide reasonable assurance regarding the reliability of financial reporting and the preparation of financial statements for external purposes in accordance with generally accepted accounting principles. A company’s internal control over financial reporting includes those policies and procedures that (1) pertain to the maintenance of records that, in reasonable detail, accurately and fairly reflect the transactions and dispositions of the assets of the company; (2) provide reasonable assurance that transactions are recorded as necessary to permit preparation of financial statements in accordance with generally accepted accounting principles, and that receipts and expenditures of the company are being made only in accordance with authorizations of management and directors of the company; and (3) provide reasonable assurance regarding prevention or timely detection of unauthorized acquisition, use, or disposition of the company’s assets that could have a material effect on the financial statements.
Because of its inherent limitations, internal control over financial reporting may not prevent or detect misstatements. Also, projections of any evaluation of effectiveness to future periods are subject to the risk that controls may become inadequate because of changes in conditions, or that the degree of compliance with the policies or procedures may deteriorate.
|
/s/ DELOITTE & TOUCHE
LLP
|
|
Deloitte & Touche
LLP
|
|
Midland, Michigan
|
|
February 15, 2018
|
193
None.
194
|
DowDuPont Inc.
|
|
|
Information related to Directors, certain executive officers and certain corporate governance matters (including identification of Audit Committee members and financial expert(s)) is contained in the definitive Proxy Statement for the 2018 Annual Meeting of Stockholders of DowDuPont Inc. and is incorporated herein by reference. See also the information regarding executive officers of the registrant set forth in Part I, Item 1. Business under the caption "Executive Officers of the Registrant" in reliance on General Instruction G to Form 10-K.
On September 1, 2017, the Board of Directors of the Company adopted a code of ethics that applies to its principal executive officer, principal financial officer and principal accounting officer. A copy of the code can be obtained via the Internet through the Investor Relations section of the Company's website under Corporate Governance (www.dow-dupont.com/investors/corporate-governance).
Information related to executive compensation and the Company's equity compensation plans is contained in the definitive Proxy Statement for the 2018 Annual Meeting of Stockholders of DowDuPont Inc. and is incorporated herein by reference.
Information with respect to beneficial ownership of DowDuPont Inc. common stock by each Director and all Directors and executive officers of the Company as a group is contained in the definitive Proxy Statement for the 2018 Annual Meeting of Stockholders of DowDuPont Inc. and is incorporated herein by reference.
Information relating to any person who beneficially owns in excess of 5 percent of the total outstanding shares of DowDuPont Inc. common stock is contained in the definitive Proxy Statement for the 2018 Annual Meeting of Stockholders of DowDuPont Inc. and is incorporated herein by reference.
Information with respect to compensation plans under which equity securities are authorized for issuance is contained in the definitive Proxy Statement for the 2018 Annual Meeting of Stockholders of DowDuPont Inc. and is incorporated herein by reference.
Reportable relationships and related transactions, if any, as well as information relating to director independence are contained in the definitive Proxy Statement for the 2018 Annual Meeting of Stockholders of DowDuPont Inc. and are incorporated herein by reference.
Information with respect to fees and services related to the Company’s independent auditors, Deloitte & Touche LLP, and the disclosure of the Audit Committee’s pre-approval policies and procedures are contained in the definitive Proxy Statement for the 2018 Annual Meeting of Stockholders of DowDuPont Inc. and are incorporated herein by reference.
195
|
DowDuPont Inc.
|
|
|
|
(a)
|
The following documents are filed as part of this report:
|
|
(1)
|
The Company’s
2017
Consolidated Financial Statements are included in Part II, Item 8. Financial Statements and Supplementary Data.
|
|
(2)
|
Financial Statement Schedules – The following Financial Statement Schedule should be read in conjunction with the Consolidated Financial Statements and Report of Independent Registered Public Accounting Firm included in Part II, Item 8. Financial Statements and Supplementary Data:
|
Schedule II Valuation and Qualifying Accounts
Schedules other than the one listed above are omitted due to the absence of conditions under which they are required or because the information called for is included in the Consolidated Financial Statements or the Notes to the Consolidated Financial Statements.
|
(3)
|
Exhibits – See the Exhibit Index for the exhibits filed with this Annual Report on Form 10-K or incorporated by reference. The following exhibits are filed with this Annual Report on Form 10-K:
|
|
Exhibit No.
|
Description of Exhibit
|
|
2.1
|
|
2.1.1
|
|
3.1
|
|
3.2
|
|
10.1
|
|
10.2
|
|
10.3
|
|
10.4
|
196
|
10.5
|
|
10.5.1
|
|
10.5.2
|
|
10.5.3
|
|
10.6
|
|
10.6.1
|
|
10.7
|
|
10.8
|
|
10.9
|
|
10.10
|
|
10.11
|
|
10.12
|
|
10.13
|
|
10.14
|
197
|
21*
|
|
23.1*
|
|
23.2*
|
|
23.3*
|
|
31.1*
|
|
31.2*
|
|
32.1*
|
|
32.2*
|
|
101.INS
|
XBRL Instance Document.
|
|
101.SCH
|
XBRL Taxonomy Extension Schema Document.
|
|
101.CAL
|
XBRL Taxonomy Extension Calculation Linkbase Document.
|
|
101.DEF
|
XBRL Taxonomy Extension Definition Linkbase Document.
|
|
101.LAB
|
XBRL Taxonomy Extension Label Linkbase Document.
|
|
101.PRE
|
XBRL Taxonomy Extension Presentation Linkbase Document.
|
*Filed herewith
A copy of any exhibit can be obtained via the Internet through the Investor Relations section of the Company's website (www.dow-dupont.com/investors), or the Company will provide a copy of any exhibit upon receipt of a written request for the particular exhibit or exhibits desired. All requests should be addressed to a Co-Controller of the Company at the addresses listed for the Company’s principal executive offices. The referenced website and its content are not deemed incorporated by reference into this report.
Not applicable.
198
|
DowDuPont Inc.
|
Schedule II
|
|
|
Valuation and Qualifying Accounts
|
||
|
(In millions) For the year ended Dec 31,
|
2017
|
2016
|
2015
|
||||||
|
Accounts Receivable - Allowance for Doubtful Receivables
|
|||||||||
|
Balance at beginning of period
|
$
|
110
|
|
$
|
94
|
|
$
|
110
|
|
|
Additions charged to expenses
|
43
|
|
31
|
|
24
|
|
|||
|
Additions charged to other accounts
1
|
3
|
|
—
|
|
2
|
|
|||
|
Deductions from reserves
2
|
(29
|
)
|
(15
|
)
|
(42
|
)
|
|||
|
Balance at end of period
|
$
|
127
|
|
$
|
110
|
|
$
|
94
|
|
|
Inventory - Obsolescence Reserve
|
|
|
|||||||
|
Balance at beginning of period
|
$
|
123
|
|
$
|
152
|
|
$
|
135
|
|
|
Additions charged to expenses
|
129
|
|
29
|
|
63
|
|
|||
|
Deductions from reserves
3
|
(82
|
)
|
(58
|
)
|
(46
|
)
|
|||
|
Balance at end of period
|
$
|
170
|
|
$
|
123
|
|
$
|
152
|
|
|
Reserves for Other Investments and Noncurrent Receivables
|
|
|
|||||||
|
Balance at beginning of period
|
$
|
358
|
|
$
|
494
|
|
$
|
477
|
|
|
Additions charged to expenses
4
|
83
|
|
153
|
|
108
|
|
|||
|
Deductions from reserves
5
|
(4
|
)
|
(289
|
)
|
(91
|
)
|
|||
|
Balance at end of period
|
$
|
437
|
|
$
|
358
|
|
$
|
494
|
|
|
Deferred Tax Assets - Valuation Allowance
|
|
|
|||||||
|
Balance at beginning of period
|
$
|
1,061
|
|
$
|
1,000
|
|
$
|
1,106
|
|
|
Merger impact
|
1,323
|
|
|||||||
|
Additions charged to expenses
|
454
|
|
155
|
|
67
|
|
|||
|
Deductions from reserves
|
(89
|
)
|
(94
|
)
|
(173
|
)
|
|||
|
Balance at end of period
|
$
|
2,749
|
|
$
|
1,061
|
|
$
|
1,000
|
|
|
1.
|
Additions to reserves for doubtful receivables charged to other accounts were classified as "Accounts and notes receivable - Other" in the consolidated balance sheets. These reserves relate to Dow's sale of trade accounts receivable. Anticipated credit losses in the portfolio of receivables sold are used to fair value Dow's interests held in trade accounts receivable conduits. See Notes
14
and
22
to the Consolidated Financial Statements for further information.
|
|
2.
|
Deductions include write-offs, recoveries, currency translation adjustment and other miscellaneous items.
|
|
3.
|
Deductions include disposals and currency translation adjustments.
|
|
4.
|
In 2016, additions to reserves for "Other investments and noncurrent receivables" charged to costs and expenses include
$143 million
related to the Company's investment in AgroFresh Solutions, Inc. See Note
5
to the Consolidated Financial Statements for further information.
|
|
5.
|
In 2016, deductions from reserves for "Other investments and noncurrent receivables" include
$237 million
related to the DCC Transaction. See Note
3
to the Consolidated Financial Statements for further information.
|
199
|
DowDuPont Inc.
|
|
Signatures
|
Pursuant to the requirements of Section 13 or 15(d) of the Securities Exchange Act of 1934, the registrant has duly caused this report to be signed on its behalf by the undersigned, thereunto duly authorized.
DOWDUPONT INC.
|
/s/ JEANMARIE F. DESMOND
|
/s/ RONALD C. EDMONDS
|
|
|
Jeanmarie F. Desmond
|
Ronald C. Edmonds
|
|
|
Co-Controller, Wilmington, Delaware
|
Co-Controller, Midland, Michigan
|
|
|
February 15, 2018
|
February 15, 2018
|
|
Pursuant to the requirements of the Securities Exchange Act of 1934, this report has been signed below by the following persons on behalf of the registrant and in the capacities and on the dates indicated.
|
/s/ LAMBERTO ANDREOTTI
|
/s/ RAYMOND J. MILCHOVICH
|
|
|
Lamberto Andreotti, Director
|
Raymond J. Milchovich, Director
|
|
|
February 15, 2018
|
February 15, 2018
|
|
|
/s/ JAMES A. BELL
|
/s/ PAUL POLMAN
|
|
|
James A. Bell, Director
|
Paul Polman, Director
|
|
|
February 15, 2018
|
February 15, 2018
|
|
|
/s/ EDWARD D. BREEN
|
/s/ DENNIS H. REILLEY
|
|
|
Edward D. Breen, Director, Chief Executive Officer
|
Dennis H. Reilley, Director
|
|
|
February 15, 2018
|
February 15, 2018
|
|
|
/s/ ROBERT A. BROWN
|
/s/ JAMES M. RINGLER
|
|
|
Robert A. Brown, Director
|
James M. Ringler, Director
|
|
|
February 15, 2018
|
February 15, 2018
|
|
|
/s/ ALEXANDER M. CUTLER
|
/s/ RUTH G. SHAW
|
|
|
Alexander M. Cutler, Co-Lead Independent Director
|
Ruth G. Shaw, Director
|
|
|
February 15, 2018
|
February 15, 2018
|
|
|
/s/ JEFF M. FETTIG
|
/s/ LEE M. THOMAS
|
|
|
Jeff M. Fettig, Co-Lead Independent Director
|
Lee M. Thomas, Director
|
|
|
February 15, 2018
|
February 15, 2018
|
|
|
/s/ MARILLYN A. HEWSON
|
/s/ HOWARD I. UNGERLEIDER
|
|
|
Marillyn A. Hewson, Director
|
Howard I. Ungerleider, Chief Financial Officer
|
|
|
February 15, 2018
|
February 15, 2018
|
|
|
/s/ LOIS D. JULIBER
|
/s/ PATRICK J. WARD
|
|
|
Lois D. Juliber, Director
|
Patrick J. Ward, Director
|
|
|
February 15, 2018
|
February 15, 2018
|
|
|
/s/ ANDREW N. LIVERIS
|
||
|
Andrew N. Liveris, Executive Chairman of the Board
|
||
|
February 15, 2018
|
||
200
|
DowDuPont Inc.
|
|
Trademark Listing
|
®™ ACOUSTICRYL, ACREMAX, ACRYSOL, AFFINITY, AMBERLITE, AQUAMAX, AQUASET, ARIGO, ARYLEX, AVANSE, AYLORA, BELCO, BETAFORCE, BETAMATE, BETASEAL, BIO-PDO, BROADWAY, CARBOWAX, CLINCHER, CORIAN, CRASTIN, CYAZYPYR, DANISCO, DELRIN, DITHANE, DOW, DOW CORNING, DOWDUPONT, DOWEX, DOW SEMENTES, DOWSIL, DUPONT, DURANGO, ELITE, ENCIRCA, ENLIST, ENLIST DUO, ENLIST E3, EVOLV3D, EVOQUE, EXPRESSSUN, EXZACT, FENCER, FILMTEC, FONTELIS, FORMASHIELD, FORTILIFE, FRELIZON, GARLON, GREAT STUFF, HERCULEX, HOWARU, HYTREL, IMPRELIS, INATREQ, INSTIGATE, INSTINCT, INTEGRAFLUX, INTELLIS, INTRASECT, ISOCLAST, ISOTHERMING, KALREZ, KEVLAR, LEPTRA, LIQUID ARMOR, LONTREL, LORSBAN, LUMIDERM, LUMIGEN, LUMIVIA, MAINCOTE, MAXIMUS, MECS, MILESTONE, MOLYKOTE, MORGAN, MULTIBASE, MYCOGEN, NEXERA, NOMEX, NORDEL, N-SERVE, OPTIMUM, ORLIAN, PANZER, PARALOID, PHYTOGEN, PIONEER, PLENISH, POWERCORE, PRIMAL, PRIMUS, PROPOUND, PROTECTOR, RADIANT, REFINZAR, REFUGE ADVANCED, RESICORE, RHOPLEX, RINSKOR, RYNAXYPYR, RYNITE, SEMENTES, SENTRICON, SENTRY, SILVADUR, SOLAMET, SORONA, SPIDER, STARANE, STRATCO, STYROFOAM, SURESTART, TAMOL, TEDLAR, TELONE, TERGITOL, THERMAX, TORDON, TPSiV, TRACER, TREORIS, TRITON, TYCHEM, TYNEX, TYVEK, UCAR, UCARTHERM, UCON, VAMAC, VERSENE, VERTISAN, VESPEL, VESSARYA, WALOCEL, WEATHERMATE, XENERGY, XIAMETER, ZORVEC, ZYTEL are trademarks of The Dow Chemical Company ("Dow") or E.I. du Pont de Nemours and Company ("DuPont") or affiliated companies of Dow or DuPont.
The following trademark of Agromen Sementes Agricolas Ltda appears in this report: AGROMEN
The following registered trademarks of Monsanto Technology LLC appear in this report: SMARTSTAX®, POWERCORE™. SMARTSTAX®
and POWERCORE™ multi-event technology developed by Dow Agrosciences LLC and Monsanto Technology LLC. ENLIST E3™ soybeans are developed by Dow AgroSciences and MS Technologies.
The following registered service mark of American Chemistry Council appears in this report: RESPONSIBLE CARE®
201
TABLE OF CONTENTS
Part IItem 1. BusinessItem 1A. Risk FactorsItem 1B. Unresolved Staff CommentsItem 2. PropertiesItem 3. Legal ProceedingsItem 4. Mine Safety DisclosuresPart IIItem 5. Market For Registrant's Common Equity, Related Stockholder Matters and Issuer Purchases Of Equity SecuritiesItem 6. Selected Financial DataItem 7. Management's Discussion and Analysis Of Financial Condition and Results Of OperationsItem 7A. Quantitative and Qualitative Disclosures About Market RiskItem 8. Financial Statements and Supplementary DataNote 1 - Summary Of Significant Accounting PoliciesNote 2 - Recent Accounting GuidanceNote 3 - Business CombinationsNote 4 - DivestituresNote 5 - Restructuring, Goodwill Impairment and Asset Related Charges - NetNote 6 - Reverse Morris Trust TransactionNote 7 - Supplementary InformationNote 8 - Income TaxesNote 9 - Earnings Per Share CalculationsNote 10 - InventoriesNote 11 - PropertyNote 12 - Nonconsolidated Affiliates and Related Company TransactionsNote 13 - Goodwill and Other Intangible AssetsNote 14 - Transfers Of Financial AssetsNote 15 - Notes Payable, Long-term Debt and Available Credit FacilitiesNote 16 - Commitments and Contingent LiabilitiesNote 17 - Stockholders' EquityNote 18 - Noncontrolling InterestsNote 19 - Pension Plans and Other Postretirement BenefitsNote 20 - Stock-based CompensationNote 21 - Financial InstrumentsNote 22 - Fair Value MeasurementsNote 23 - Variable Interest EntitiesNote 24 - Segments and Geographic RegionsNote 25 - Selected Quarterly Financial DataNote 26 - Subsequent EventsItem 9. Changes in and Disagreements with Accountants on Accounting and Financial DisclosureItem 9A. Controls and ProceduresItem 9B. Other InformationPart IIIItem 10. Directors, Executive Officers and Corporate GovernanceItem 11. Executive CompensationItem 12. Security Ownership Of Certain Beneficial Owners and Management and Related Stockholder MattersItem 13. Certain Relationships and Related Transactions, and Director IndependenceItem 14. Principal Accounting Fees and ServicesPart IVItem 15. Exhibits, Financial Statement SchedulesItem 16. Form 10-k Summary