|
|
|
|
|
|
|
|
|
|
|
|
|
|
|
|
|
|
|
|
|
|
|
|
|
|
|
|
|
|
|
|
|
|
|
|
|
|
|
|
|
|
|
|
|
|
|
|
|
|
|
|
|
|
|
|
|
|
|
|
|
|
|
|
|
Use these links to rapidly review the document
Table of Contents
INDEX OF FINANCIAL STATEMENTS DILLARD'S, INC. AND SUBSIDIARIES Year Ended January 28, 2012
UNITED STATES
SECURITIES AND EXCHANGE COMMISSION
Washington, D.C. 20549
FORM 10-K
| (Mark one) | ||
|
ý |
|
ANNUAL REPORT PURSUANT TO SECTION 13 OR 15(d) OF THE SECURITIES EXCHANGE ACT OF 1934 |
|
For the fiscal year ended January 28, 2012 |
||
|
or |
||
|
o |
|
TRANSITION REPORT PURSUANT TO SECTION 13 OR 15(d) OF THE SECURITIES EXCHANGE ACT OF 1934 |
|
For the transition period from to . |
||
Commission file number 1-6140
DILLARD'S, INC.
(Exact name of registrant as specified in its charter)
|
DELAWARE
State or other jurisdiction of incorporation or organization |
71-0388071
(IRS Employer Identification No.) |
|
|
1600 CANTRELL ROAD, LITTLE ROCK, ARKANSAS (Address of principal executive offices) |
|
72201 (Zip Code) |
Registrant's telephone number, including area code (501) 376-5200
Securities registered pursuant to Section 12(b) of the Act:
| Title of each class | Name of each exchange on which registered | |
|---|---|---|
| Class A Common Stock | New York Stock Exchange |
Securities
registered pursuant to Section 12(g) of the Act:
None
Indicate by check mark if the registrant is a well-known seasoned issuer, as defined in Rule 405 of the Securities Act. ý Yes o No
Indicate by check mark if the registrant is not required to file reports pursuant to Section 13 or Section 15(d) of the Act. o Yes ý No
Indicate by check mark whether the registrant (1) has filed all reports required to be filed by Section 13 or 15(d) of the Securities Exchange Act of 1934 during the preceding 12 months (or for such shorter period that the registrant was required to file such reports), and (2) has been subject to such filing requirements for the past 90 days. ý Yes o No
Indicate by check mark whether the registrant has submitted electronically and posted on its corporate Web site, if any, every Interactive Data File required to be submitted and posted pursuant to Rule 405 of Regulation S-T (§232.405 of this chapter) during the preceding 12 months (or for such shorter period that the registrant was required to submit and post such files). ý Yes o No
Indicate by check mark if disclosure of delinquent filers pursuant to Item 405 of Regulation S-K (§ 229.405 of this chapter) is not contained herein, and will not be contained, to the best of registrant's knowledge, in definitive proxy or information statements incorporated by reference in Part III of this Form 10-K or any amendment to this Form 10-K. ý
Indicate by check mark whether the registrant is a large accelerated filer, an accelerated filer, a non-accelerated filer, or a smaller reporting company. See the definitions of "large accelerated filer," "accelerated filer" and "smaller reporting company" in Rule 12b-2 of the Exchange Act.
| Large Accelerated Filer ý | Accelerated Filer o |
Non-Accelerated Filer
o
(Do not check if a smaller reporting company) |
Smaller Reporting Company o |
Indicate by check mark whether the registrant is a shell company (as defined in Rule 12b-2 of the Exchange Act). Yes o No ý
State the aggregate market value of the voting and non-voting common equity held by non-affiliates of the registrant as of July 30, 2011: $2,606,181,433.
Indicate the number of shares outstanding of each of the registrant's classes of common stock as of February 25, 2012:
CLASS A COMMON STOCK, $0.01 par value 45,430,606
CLASS B COMMON STOCK, $0.01 par value 4,010,929
DOCUMENTS INCORPORATED BY REFERENCE
Portions of the Proxy Statement for the Annual Meeting of Stockholders to be held May 19, 2012 (the "Proxy Statement") are incorporated by reference into Part III of this Form 10-K.
Dillard's, Inc. ("Dillard's", the "Company", "we", "us", "our" or "Registrant") ranks among the nation's largest fashion apparel, cosmetics and home furnishing retailers. The Company, originally founded in 1938 by William T. Dillard, was incorporated in Delaware in 1964. As of January 28, 2012, we operated 304 Dillard's stores, including 16 clearance centers, and an Internet store offering a wide selection of merchandise including fashion apparel for women, men and children, accessories, cosmetics, home furnishings and other consumer goods. The Company also operates a general contracting construction company, CDI Contractors, LLC and CDI Contractors, Inc. ("CDI"), whose business includes constructing and remodeling stores for the Company.
The following table summarizes the percentage of net sales by segment and major product line:
|
|
Percentage of Net Sales | |||||||||
|---|---|---|---|---|---|---|---|---|---|---|
|
|
Fiscal
2011 |
Fiscal
2010 |
Fiscal
2009 |
|||||||
|
Retail operations segment: |
||||||||||
|
Cosmetics |
15 | % | 15 | % | 15 | % | ||||
|
Ladies' apparel and accessories |
37 | 37 | 36 | |||||||
|
Juniors' and children's apparel |
8 | 8 | 8 | |||||||
|
Men's apparel and accessories |
17 | 17 | 17 | |||||||
|
Shoes |
16 | 15 | 14 | |||||||
|
Home and furniture |
6 | 6 | 7 | |||||||
|
|
99 | 98 | 97 | |||||||
|
Construction segment |
1 | 2 | 3 | |||||||
|
Total |
100 | % | 100 | % | 100 | % | ||||
Additional information regarding our business, results of operations and financial condition, including information pertaining to our reporting segments, can be found in Management's Discussion and Analysis of Financial Condition and Results of Operations in Item 7 hereof and in Note 2 of "Notes to Consolidated Financial Statements" in Item 8 hereof.
Most of our stores are located in suburban shopping malls and open-air centers. Our customers may also purchase merchandise on-line at our website, www.dillards.com, which features on-line gift registries and a variety of other services. We operate retail department stores located primarily in the southwest, southeast and midwest regions of the United States. Our stores are located in 29 states.
We conduct our retail merchandise business under highly competitive conditions. Although we are a large regional department store, we have numerous competitors at the national and local level that compete with our individual stores, including specialty, off-price, discount and Internet retailers. Competition is characterized by many factors including location, reputation, assortment, advertising, price, quality, service and credit availability. We believe that our stores are in a strong competitive position with regard to each of these factors. Other retailers may compete for customers on some or all of these factors, or on other factors, and may be perceived by some potential customers as being better aligned with their particular preferences.
Our merchandise selections include, but are not limited to, Dillard's lines of exclusive brand merchandise such as Antonio Melani, Gianni Bini, Roundtree & Yorke and Daniel Cremieux. Dillard's exclusive brands/private label merchandise program provides benefits for Dillard's and our customers. Our customers receive fashionable, higher quality product often at a savings compared to national
1
brands. Dillard's private label merchandise program allows us to ensure Dillard's high standards are achieved, while minimizing costs and differentiating our merchandise offerings from other retailers.
We have made a significant investment in our trademark and license portfolio, in terms of design function, advertising, quality control, manufacturing process and quick response to market trends in a quality manufacturing environment. Dillard's trademark registrations are maintained for as long as Dillard's holds the exclusive right to use the trademarks on the listed products.
Our merchandising, sales promotion and store operating support functions are conducted primarily at our corporate headquarters. Our back office sales support functions, such as accounting, product development, store planning and information technology, are also centralized.
We have developed a knowledge of each of our trade areas and customer bases for our stores. This knowledge is enhanced through regular store visits by senior management and merchandising personnel and through the use of on-line merchandise information and is supported by our regional merchandising offices. We will continue to use existing technology and research to edit assortments by store to meet the specific preference, taste and size requirements of each local operating area.
Certain departments in our stores are licensed to independent companies in order to provide high quality service and merchandise where specialization, focus and expertise are critical. The licensed departments vary by store to complement our own merchandising departments. The principal licensed department is an upscale women's apparel vendor in certain stores. The terms of the license agreements typically range between three and five years with one year renewals and require the licensee to pay for fixtures and to provide their own employees. We regularly evaluate the performance of the licensed departments and require compliance with established customer service guidelines. The licensee for the fine jewelry department ceased operation of all licensed outlets during fiscal 2009.
GE Consumer Finance ("GE") owns and manages Dillard's proprietary credit cards ("proprietary cards") under a long-term marketing and servicing alliance ("Alliance") that expires in fiscal 2014. GE establishes and owns proprietary card accounts for our customers, retains the benefits and risks associated with the ownership of the accounts, provides key customer service functions, including new account openings, transaction authorization, billing adjustments and customer inquiries, receives the finance charge income and incurs the bad debts associated with those accounts. Pursuant to the Alliance, we receive on-going cash compensation from GE based upon the portfolio's earnings. The compensation earned on the portfolio is determined monthly and has no recourse provisions. Furthermore, pursuant to this agreement, we have no continuing involvement other than to honor the proprietary cards in our stores. Although not obligated to a specific level of marketing commitment, we participate in the marketing of the proprietary cards and accept payments on the proprietary cards in our stores as a convenience to customers who prefer to pay in person rather than by paying online or mailing their payments to GE.
We seek to expand the number and use of the proprietary cards by, among other things, providing incentives to sales associates to open new credit accounts, which generally can be opened while a customer is visiting one of our stores. Customers who open accounts are rewarded with discounts on future purchases. Proprietary card customers are sometimes offered private shopping nights, direct mail catalogs, special discounts and advance notice of sale events. GE has created various loyalty programs that reward customers for frequency and volume of proprietary card usage.
Our earnings depend to a significant extent on the results of operations for the last quarter of our fiscal year. Due to holiday buying patterns, sales for that period average approximately one-third of annual sales.
As of January 28, 2012, we employed approximately 38,900 full-time and part-time associates, of which approximately 23% were part-time. The number of associates varies during the year, especially during peak seasonal selling periods.
2
We purchase merchandise from many sources and do not believe that we are dependent on any one supplier. We have no long-term purchase commitments or arrangements with any of our suppliers and consider our relationships to be strong and mutually beneficial.
Our fiscal year ends on the Saturday nearest January 31 of each year. Fiscal years 2011, 2010, and 2009 ended on January 28, 2012, January 29, 2011 and January 30, 2010, respectively, and each included 52 weeks.
The information contained on our website is not incorporated by reference into this Form 10-K and should not be considered to be a part of this Form 10-K. Our annual report on Form 10-K, quarterly reports on Form 10-Q, current reports on Form 8-K, statements of changes in beneficial ownership of securities on Form 4 and amendments to those reports filed or furnished pursuant to Section 13(a) or 15(d) of the Exchange Act are available free of charge (as soon as reasonably practicable after we electronically file such material with, or furnish it to, the SEC) on the Dillard's, Inc. website: www.dillards.com.
We have adopted a Code of Business Conduct and Corporate Governance Guidelines, as required by the listing standards of the New York Stock Exchange and the rules of the SEC. We have posted on our website our Code of Conduct, Corporate Governance Guidelines, Social Accountability Policy and committee charters for the Audit Committee of the Board of Directors and the Stock Option and Executive Compensation Committee.
Our corporate offices are located at 1600 Cantrell Road, Little Rock, Arkansas 72201, telephone: 501-376-5200.
The risks described in this Item 1A, Risk Factors, of this Annual Report on Form 10-K for the year ended January 28, 2012, could materially and adversely affect our business, financial condition and results of operations.
The Company cautions that forward-looking statements, as such term is defined in the Private Securities Litigation Reform Act of 1995, contained in this Annual Report on Form 10-K are based on estimates, projections, beliefs and assumptions of management at the time of such statements and are not guarantees of future performance. The Company disclaims any obligation to update or revise any forward-looking statements based on the occurrence of future events, the receipt of new information, or otherwise. Forward-looking statements of the Company involve risks and uncertainties and are subject to change based on various important factors. Actual future performance, outcomes and results may differ materially from those expressed in forward-looking statements made by the Company and its management as a result of a number of risks, uncertainties and assumptions.
The retail merchandise business is highly competitive, and that competition could lower revenues, margins and market share.
We conduct our retail merchandise business under highly competitive conditions. Although we are a large regional department store, we have numerous competitors at the national and local level that compete with our individual stores, including specialty, off-price, discount, Internet and mail-order retailers. Competition is characterized by many factors including location, reputation, fashion, merchandise assortment, advertising, price, quality, service and credit availability. We anticipate that intense competition will continue. If we are unable to maintain our competitive position, we could experience downward pressure on prices, lower demand for products, reduced margins, the inability to take advantage of new business opportunities and the loss of market share.
3
Changes in economic, market and other conditions could adversely affect our operating results.
The retail merchandise business is affected by changes in international, national, regional, and local economic conditions, consumer preferences and spending patterns, demographic trends, consumer confidence, consumer credit availability, weather, traffic patterns, the type, number and location of competing stores, and the effects of war or terrorist activities and any governmental responses thereto. Factors such as inflation, apparel costs, labor and benefit costs, legal claims, and the availability of management and hourly employees also affect store operations and administrative expenses. Our ability to finance new store development, improvements and additions to existing stores, and the acquisition of stores from competitors is affected by economic conditions, including interest rates and other government policies impacting land and construction costs and the availability of borrowed funds.
Current store locations may become less desirable, and desirable new locations may not be available for a reasonable price, if at all, either of which could adversely affect our results of operations.
The success of any store depends substantially upon its location. There can be no assurance that current locations will continue to be desirable as demographic patterns change. Neighborhood or economic conditions where stores are located could decline in the future, thus resulting in potentially reduced sales in those locations. If we cannot obtain desirable locations at reasonable prices, our cost structure will increase and our revenues will be adversely affected.
Ownership and leasing of significant amounts of real estate exposes us to possible liabilities and losses.
We own the land and building, or lease the land and/or the building, for all of our stores. Accordingly, we are subject to all of the risks associated with owning and leasing real estate. In particular, the value of the assets could decrease, and their operating costs could increase, because of changes in the investment climate for real estate, demographic trends and supply or demand for the use of the store, which may result from competition from similar stores in the area, as well as liability for environmental conditions. If an existing owned store is not profitable, and we decide to close it, we may be required to record an impairment charge and/or exit costs associated with the disposal of the store. We generally cannot cancel our leases. If an existing or future store is not profitable, and we decide to close it, we may be committed to perform certain obligations under the applicable lease including, among other things, paying the base rent for the balance of the lease term. In addition, as each of the leases expires, we may be unable to negotiate renewals, either on commercially acceptable terms or at all, which could cause us to close stores in desirable locations. We may not be able to close an unprofitable owned store due to an existing operating covenant which may cause us to operate the location at a loss and prevent us from finding a more desirable location. We have approximately 75 stores along the Gulf and Atlantic coasts that are covered by third party insurance but are self-insured for property and merchandise losses related to "named storms"; therefore, repair and replacement costs will be borne by us for damage to any of these stores from "named storms".
We rely on third party suppliers to obtain materials and provide production facilities from which we source our merchandise.
We may experience supply problems such as unfavorable pricing or untimely delivery of merchandise. The price and availability of materials from suppliers can be adversely affected by factors outside of our control, such as increased worldwide demand. Further, our suppliers may experience financial difficulties due to a downturn in the industry or in other macroeconomic environments, such as credit markets, stifling their ability to obtain borrowed funds necessary to finance their operations. These supplier risks may have a material adverse effect on our business and results of operations.
4
We may evaluate acquisitions, joint ventures and other strategic initiatives, any of which could distract management or otherwise have a negative effect on revenues, costs and stock price.
Our future success may depend on opportunities to buy or obtain rights to other businesses or technologies that could complement, enhance or expand our current business or products or that might otherwise offer growth opportunities. In particular, we intend to evaluate potential mergers, acquisitions, joint venture investments, strategic initiatives, alliances, vertical integration opportunities and divestitures. Our attempt to engage in these transactions may expose us to various inherent risks, including:
- •
-
assessing the value, future growth potential, strengths, weaknesses, contingent and other liabilities and potential
profitability of acquisition candidates;
- •
-
the potential loss of key personnel of an acquired business;
- •
-
the ability to achieve projected economic and operating synergies;
- •
-
difficulties successfully integrating, operating, maintaining and managing newly acquired operations or employees;
- •
-
difficulties maintaining uniform standards, controls, procedures and policies;
- •
-
unanticipated changes in business and economic conditions affecting an acquired business;
- •
-
the possibility of impairment charges if an acquired business performs below expectations; and
- •
- the diversion of management's attention from the existing business to integrate the operations and personnel of the acquired or combined business or to implement the strategic initiative.
Our annual and quarterly financial results may fluctuate depending on various factors, many of which are beyond our control, and if we fail to meet the expectations of securities analysts or investors, our share price may decline.
Our sales and operating results can vary from quarter to quarter and year to year depending on various factors, many of which are beyond our control. Certain events and factors may directly and immediately decrease demand for our products or increase operating costs. If customer demand decreased or if operating costs increased rapidly, our results of operations would also decline precipitously. The recent passage of health care legislation will cause the Company's operating costs to rise in fiscal 2014 and beyond. The Company is currently in the process of assessing the extent of the effect of the legislation on its operating costs. Other events and factors include:
- •
-
changes in competitive and economic conditions generally;
- •
-
variations in the timing and volume of our sales;
- •
-
sales promotions by us or our competitors;
- •
-
changes in average same-store sales and customer visits;
- •
-
changes in legislation, affecting such matters as credit card income;
- •
-
variations in the price (including purchase discounts), availability and shipping costs of merchandise;
- •
-
seasonal effects on demand for our products;
- •
-
changes in the cost or availability of material or labor; and
- •
- weather and acts of God.
5
Litigation with customers, employees and others could harm our reputation and impact operating results.
Lawsuits have been filed, and may continue to be filed, by customers and employees alleging discrimination. We are also susceptible to claims filed by customers alleging responsibility for injury suffered during a visit to a store. Further, we may be subject to other claims in the future based on, among other things, employee discrimination, harassment, wrongful termination and wage issues, including those relating to overtime compensation. These types of claims, as well as other types of lawsuits to which we are subject from time to time, can distract management's attention from core business operations and/or negatively impact operating results.
Catastrophic events may disrupt our business.
Unforeseen events, including war, terrorism and other international conflicts, public health issues, and natural disasters such as earthquakes, hurricanes or other adverse weather and climate conditions, whether occurring in the United States or abroad, could disrupt our operations, disrupt international trade and supply chain efficiencies, suppliers or customers, or result in political or economic instability. These events could result in property losses, reduce demand for our products or make it difficult or impossible to receive products from suppliers.
Variations in the amount of vendor allowances received could adversely impact our operating results.
We receive vendor allowances for advertising, payroll and margin maintenance that are a strategic part of our operations. A reduction in the amount of cooperative advertising allowances would likely cause us to consider other methods of advertising as well as the volume and frequency of our product advertising, which could increase/decrease our expenditures and/or revenue. Decreased payroll reimbursements would either cause payroll costs to rise, negatively impacting operating income, or cause us to reduce the number of employees, which may cause a decline in sales. A decline in the amount of margin maintenance allowances would either increase cost of sales, which would negatively impact gross margin and operating income, or cause us to reduce merchandise purchases, which may cause a decline in sales.
A privacy breach could adversely affect our business, reputation and financial condition.
The protection of customer, employee and Company data is critical to us. The regulatory environment surrounding information security and privacy is increasingly demanding, with the frequent imposition of new and constantly changing requirements. We receive certain personal information about our customers and employees. In addition, our online operations at www.dillards.com depend upon the secure transmission of confidential information over public networks, including information permitting cashless payments. A compromise of our security systems that results in personal information being obtained by unauthorized persons could adversely affect our reputation with our customers, employees and others, as well as our operations, results of operations, financial condition and liquidity, and could result in litigation against us or the imposition of penalties. In addition, a security breach could require that we expend significant additional resources related to our information security systems and could result in a disruption of our operations, particularly our online sales operations.
Reductions in the income and cash flow from our long-term marketing and servicing alliance related to our proprietary credit cards could impact operating results and cash flows.
GE owns and manages our proprietary credit cards under the Alliance that expires in fiscal 2014. The Alliance provides for certain payments to be made by GE to the Company, including a revenue sharing and marketing reimbursement. The income and cash flow that the Company receives from the Alliance is dependent upon a number of factors including the level of sales on GE accounts, the level of balances carried on the GE accounts by GE customers, payment rates on GE accounts, finance
6
charge rates and other fees on GE accounts, the level of credit losses for the GE accounts, GE's ability to extend credit to our customers as well as GE's funding costs, all of which can vary based on changes in federal and state banking and consumer protection laws and from a variety of economic, legal, social and other factors that we cannot control. If the income or cash flow that the Company receives from the Alliance decreases, our operating results and cash flows could be adversely affected.
The percentage-of-completion method of accounting for contract revenues may result in material adjustments, which could result in a charge against our earnings.
Our construction segment recognizes contract revenues using the percentage-of-completion method. Under this method, estimated contract revenues are recognized by applying the percentage of completion of the project for the period to the total estimated revenues for the contract. Estimated contract losses are recognized in full when determined. Total contract revenues and cost estimates are reviewed and revised at a minimum on a quarterly basis as the work progresses and as change orders are approved. Adjustments based upon the percentage of completion are reflected in contract revenues in the period when these estimates are revised. To the extent that these adjustments result in an increase, a reduction or an elimination of previously reported contract profit, we recognize a credit or a charge against current earnings, which could be material.
None.
7
All of our stores are owned by us or leased from third parties. At January 28, 2012, we operated 304 stores in 29 states totaling approximately 52.7 million square feet of which we owned approximately 46.2 million square feet. Our third-party store leases typically provide for rental payments based on a percentage of net sales with a guaranteed minimum annual rent. In general, the Company pays the cost of insurance, maintenance and real estate taxes related to the leases.
The following table summarizes by state of operation the number of retail stores we operate and the corresponding owned and leased footprint at January 28, 2012:
|
Location
|
Number
of stores |
Owned
Stores |
Leased
Stores |
Owned
Building on Leased Land |
Partially
Owned and Partially Leased |
|||||||||||
|---|---|---|---|---|---|---|---|---|---|---|---|---|---|---|---|---|
|
Alabama |
10 | 10 | — | — | — | |||||||||||
|
Arkansas |
8 | 7 | — | — | 1 | |||||||||||
|
Arizona |
17 | 16 | — | 1 | — | |||||||||||
|
California |
3 | 3 | — | — | — | |||||||||||
|
Colorado |
8 | 8 | — | — | — | |||||||||||
|
Florida |
42 | 39 | — | 3 | — | |||||||||||
|
Georgia |
12 | 7 | 3 | 2 | — | |||||||||||
|
Iowa |
5 | 5 | — | — | — | |||||||||||
|
Idaho |
2 | 1 | 1 | — | — | |||||||||||
|
Illinois |
3 | 3 | — | — | — | |||||||||||
|
Indiana |
3 | 3 | — | — | — | |||||||||||
|
Kansas |
7 | 3 | 2 | 2 | — | |||||||||||
|
Kentucky |
6 | 5 | 1 | — | — | |||||||||||
|
Louisiana |
14 | 13 | 1 | — | — | |||||||||||
|
Missouri |
10 | 7 | 1 | 2 | — | |||||||||||
|
Mississippi |
6 | 4 | 1 | 1 | — | |||||||||||
|
Montana |
2 | 2 | — | — | — | |||||||||||
|
North Carolina |
16 | 14 | 1 | 1 | — | |||||||||||
|
Nebraska |
3 | 2 | 1 | — | — | |||||||||||
|
New Mexico |
6 | 3 | 3 | — | — | |||||||||||
|
Nevada |
4 | 4 | — | — | — | |||||||||||
|
Ohio |
15 | 10 | 5 | — | — | |||||||||||
|
Oklahoma |
10 | 6 | 4 | — | — | |||||||||||
|
South Carolina |
8 | 8 | — | — | — | |||||||||||
|
Tennessee |
10 | 8 | 1 | — | 1 | |||||||||||
|
Texas |
60 | 43 | 10 | 2 | 5 | |||||||||||
|
Utah |
6 | 4 | 2 | — | — | |||||||||||
|
Virginia |
7 | 5 | 1 | 1 | — | |||||||||||
|
Wyoming |
1 | 1 | — | — | — | |||||||||||
|
Total |
304 | 244 | 38 | 15 | 7 | |||||||||||
8
At January 28, 2012, we operated the following additional facilities:
|
Facility
|
Location | Square Feet |
Owned /
Leased |
||||
|---|---|---|---|---|---|---|---|
|
Distribution Centers: |
Mabelvale, AR | 400,000 | Owned | ||||
|
|
Gilbert, AZ | 295,000 | Owned | ||||
|
|
Valdosta, GA | 370,000 | Owned | ||||
|
|
Olathe, KS | 500,000 | Owned | ||||
|
|
Salisbury, NC | 355,000 | Owned | ||||
|
|
Ft. Worth, TX | 700,000 | Owned | ||||
|
Internet Fulfillment Center |
Nashville, TN | 285,000 | Leased | ||||
|
Dillard's Executive Offices |
Little Rock, AR | 333,000 | Owned | ||||
|
CDI Contractors, LLC Executive Office |
Little Rock, AR | 25,000 | Owned | ||||
|
CDI Storage Facilities |
Maumelle, AR | 66,000 | Owned | ||||
|
Total |
3,329,000 | ||||||
The Company's new 850,000 square foot internet fulfillment center located in Maumelle, Arkansas is expected to be fully operational by the end of the first fiscal quarter of 2012. Additional property information is contained in Notes 1, 12 and 13 of "Notes to Consolidated Financial Statements," in Item 8 hereof.
From time to time, the Company is involved in litigation relating to claims arising out of the Company's operations in the normal course of business. This may include litigation with customers, employment related lawsuits, class action lawsuits, purported class action lawsuits and actions brought by governmental authorities. As of March 22, 2012, the Company is not a party to any legal proceedings that, individually or in the aggregate, are reasonably expected to have a material adverse effect on the Company's business, results of operations, financial condition or cash flows.
Not applicable.
9
EXECUTIVE OFFICERS OF THE REGISTRANT
The following table lists the names and ages of all executive officers of the Registrant, the nature of any family relationship between them and all positions and offices with the Registrant presently held by each person named. Each is elected to serve a one-year term. There are no other persons chosen to become executive officers.
|
Name
|
Age | Position & Office |
Held
Present Office Since |
Family Relationship to CEO | ||||||
|---|---|---|---|---|---|---|---|---|---|---|
|
William Dillard, II |
67 |
Director; Chief Executive Officer |
1998 |
Not applicable |
||||||
|
Alex Dillard |
62 |
Director; President |
1998 |
Brother of William Dillard, II |
||||||
|
Mike Dillard |
60 |
Director; Executive Vice President |
1984 |
Brother of William Dillard, II |
||||||
|
Drue Matheny |
65 |
Director; Executive Vice President |
1998 |
Sister of William Dillard, II |
||||||
|
James I. Freeman |
62 |
Director; Senior Vice President; Chief Financial Officer |
1988 |
None |
||||||
|
Steven K. Nelson |
54 |
Vice President |
1988 |
None |
||||||
|
Robin Sanderford |
65 |
Vice President |
1998 |
None |
||||||
|
Paul J. Schroeder, Jr. |
64 |
Vice President; General Counsel |
1998 |
None |
||||||
|
Burt Squires |
62 |
Vice President |
1984 |
None |
||||||
|
Julie A. Taylor |
60 |
Vice President |
1998 |
None |
||||||
|
Richard B. Willey* |
61 |
Vice President |
2010 |
None |
||||||
- *
- Mr. Willey joined the Company in 1987. He served as Regional Vice President of Stores from 1987 to 2001. From 2001 to 2010, he served as Vice President of Store Planning and Construction. In 2010, he was promoted to Corporate Vice President of Stores.
10
Market and Dividend Information for Common Stock
The Company's Class A Common Stock trades on the New York Stock Exchange under the Ticker Symbol "DDS". No public market currently exists for the Class B Common Stock.
The high and low sales prices of the Company's Class A Common Stock, and dividends declared on each class of common stock, for each quarter of fiscal 2011 and 2010 are presented in the table below:
|
|
2011 | 2010 |
Dividends
per Share |
||||||||||||||||
|---|---|---|---|---|---|---|---|---|---|---|---|---|---|---|---|---|---|---|---|
|
|
High | Low | High | Low | 2011 | 2010 | |||||||||||||
|
First |
$ | 48.57 | $ | 37.87 | $ | 31.22 | $ | 14.94 | $ | 0.04 | $ | 0.04 | |||||||
|
Second |
61.08 | 45.27 | 29.88 | 19.91 | 0.05 | 0.04 | |||||||||||||
|
Third |
57.58 | 38.99 | 27.80 | 19.26 | 0.05 | 0.04 | |||||||||||||
|
Fourth |
56.30 | 42.54 | 44.50 | 25.31 | 0.05 | 0.04 | |||||||||||||
While the Company expects to continue paying quarterly cash dividends during fiscal 2012, all dividends will be reviewed quarterly and declared by the Board of Directors.
Stockholders
As of February 25, 2012, there were 3,270 holders of record of the Company's Class A Common Stock and 8 holders of record of the Company's Class B Common Stock.
Repurchase of Common Stock
Issuer Purchases of Equity Securities
|
Period
|
(a) Total
Number of Shares Purchased |
(b) Average
Price Paid per Share |
(c)Total Number of
Shares Purchased as Part of Publicly Announced Plans or Programs |
(d) Approximate
Dollar Value of Shares that May Yet Be Purchased Under the Plans or Programs |
|||||||||
|---|---|---|---|---|---|---|---|---|---|---|---|---|---|
|
October 30, 2011 through November 26, 2011 |
1,264,663 | $ | 49.26 | 1,264,663 | $ | 63,986,630 | |||||||
|
November 27, 2011 through December 31, 2011 |
299,800 | 47.88 | 299,800 | 49,632,387 | |||||||||
|
January 1, 2012 through January 28, 2012 |
487,318 | 45.39 | 487,318 | 27,511,684 | |||||||||
|
Total |
2,051,781 | $ | 48.14 | 2,051,781 | $ | 27,511,684 | |||||||
In May 2011, the Company announced that the Board of Directors authorized the repurchase of up to $250 million of its Class A Common Stock. This authorization permits the Company to repurchase its Class A Common Stock in the open market, pursuant to preset trading plans meeting the requirements of Rule 10b5-1 under the Securities Exchange Act of 1934 or through privately negotiated transactions. The plan has no expiration date, and remaining availability pursuant to the Company's share repurchase program was $27.5 million as of January 28, 2012.
In February 2012, the Company announced that the Board of Directors authorized the repurchase of up to $250 million of its Class A Common Stock. This additional authorization permits the Company
11
to repurchase its Class A Common Stock in the open market, pursuant to preset trading plans meeting the requirements of Rule 10b5-1 under the Securities Exchange Act of 1934 or through privately negotiated transactions. The plan has no expiration date.
Securities Authorized for Issuance under Equity Compensation Plans
The information concerning the Company's equity compensation plans is incorporated by reference here to Item 12 of this Annual Report on Form 10-K under the heading "Equity Compensation Plan Information".
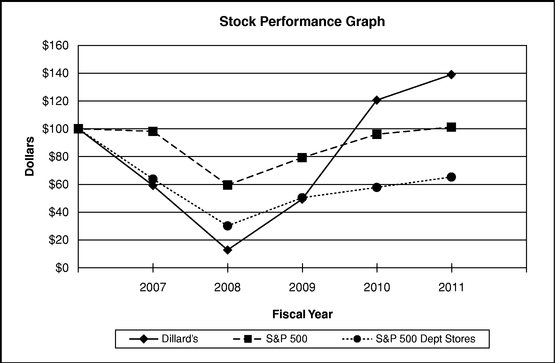
Company Performance
For each of the last five fiscal years, the graph below compares the cumulative total returns on the Company's Class A Common Stock, the Standard & Poor's 500 Index and the Standard & Poor's 500 Department Stores Index. The cumulative total return on the Company's Class A Common Stock assumes $100 invested in such stock on February 4, 2007 and assumes reinvestment of dividends.
|
|
2007 | 2008 | 2009 | 2010 | 2011 | |||||||||||
|---|---|---|---|---|---|---|---|---|---|---|---|---|---|---|---|---|
|
Dillard's, Inc. |
$ | 59.15 | $ | 12.77 | $ | 49.37 | $ | 120.62 | $ | 138.99 | ||||||
|
S&P 500 |
98.17 | 59.52 | 79.24 | 96.08 | 101.20 | |||||||||||
|
S&P 500 Department Stores |
63.85 | 30.16 | 50.42 | 57.83 | 65.29 | |||||||||||
12
The selected financial data set forth below should be read in conjunction with our "Management's Discussion and Analysis of Financial Condition and Results of Operations", our consolidated audited financial statements and notes thereto and the other information contained elsewhere in this report.
(Dollars in thousands of dollars, except per share data)
|
|
2011 | 2010 | 2009 | 2008 | 2007 | |||||||||||
|---|---|---|---|---|---|---|---|---|---|---|---|---|---|---|---|---|
|
Net sales |
$ | 6,263,600 | $ | 6,120,961 | $ | 6,094,948 | $ | 6,830,543 | $ | 7,207,417 | ||||||
|
Percent change |
2 | % | 0 | % | -11 | % | -5 | % | -6 | % | ||||||
|
Cost of sales |
4,041,550 | 3,976,063 | 4,102,892 | 4,827,769 | 4,786,655 | |||||||||||
|
Percent of sales |
64.5 | % | 65.0 | % | 67.3 | % | 70.7 | % | 66.4 | % | ||||||
|
Interest and debt expense, net |
72,059 | 73,792 | 74,003 | 88,821 | 91,556 | |||||||||||
|
Income (loss) before income taxes and income on (equity in losses of) joint ventures |
396,669 | 268,716 | 84,525 | (380,005 | ) | 60,518 | ||||||||||
|
Income taxes (benefit) |
(62,518 | ) | 84,450 | 12,690 | (140,520 | ) | 13,010 | |||||||||
|
Income on (equity in losses of) joint ventures |
4,722 | (4,646 | ) | (3,304 | ) | (1,580 | ) | 6,253 | ||||||||
|
Net income (loss) |
463,909 | 179,620 | 68,531 | (241,065 | ) | 53,761 | ||||||||||
|
Net income (loss) per diluted common share |
8.52 | 2.67 | 0.93 | (3.25 | ) | 0.68 | ||||||||||
|
Dividends per common share |
0.19 | 0.16 | 0.16 | 0.16 | 0.16 | |||||||||||
|
Book value per common share |
41.50 | 34.79 | 31.21 | 30.65 | 33.45 | |||||||||||
|
Average number of diluted shares outstanding |
54,448,065 | 67,174,163 | 73,783,960 | 74,278,461 | 79,103,423 | |||||||||||
|
Accounts receivable(1) |
28,708 | 25,950 | 63,222 | 87,998 | 10,880 | |||||||||||
|
Merchandise inventories |
1,304,124 | 1,290,147 | 1,300,680 | 1,374,394 | 1,779,279 | |||||||||||
|
Property and equipment, net |
2,440,266 | 2,595,514 | 2,780,837 | 2,973,151 | 3,190,444 | |||||||||||
|
Total assets |
4,306,137 | 4,374,166 | 4,606,327 | 4,745,844 | 5,338,129 | |||||||||||
|
Long-term debt |
614,785 | 697,246 | 747,587 | 757,689 | 760,165 | |||||||||||
|
Capital lease obligations |
9,153 | 11,383 | 22,422 | 24,116 | 25,739 | |||||||||||
|
Other liabilities |
245,218 | 205,916 | 213,471 | 220,911 | 217,403 | |||||||||||
|
Deferred income taxes |
314,598 | 341,689 | 349,722 | 378,348 | 436,541 | |||||||||||
|
Subordinated debentures |
200,000 | 200,000 | 200,000 | 200,000 | 200,000 | |||||||||||
|
Total stockholders' equity |
2,052,019 | 2,086,720 | 2,304,103 | 2,251,115 | 2,514,111 | |||||||||||
|
Number of stores |
||||||||||||||||
|
Opened(2) |
0 | 2 | 0 | 10 | 9 | |||||||||||
|
Closed |
4 | 3 | 6 | 21 | 11 | |||||||||||
|
Total—end of year |
304 | 308 | 309 | 315 | 326 | |||||||||||
- (1)
-
In
August 2008, the Company purchased the remaining interest in CDI, a former 50% equity method joint venture investment of the Company.
- (2)
- One store in Biloxi, Mississippi, not in operation during fiscal 2007 due to the hurricanes of 2005, was re-opened in early fiscal 2008.
13
The items below are included in the Selected Financial Data.
2011
The items below amount to a net $50.9 million pretax gain ($234.5 million after tax gain or $4.31 per share).
- •
-
a $201.6 million income tax benefit ($3.70 per share) due to a reversal of a valuation allowance related to the
amount of the capital loss carryforward used to offset the capital gain income recognized on the taxable transfer of properties to our REIT (see Note 6 of Notes to Consolidated Financial
Statements).
- •
-
a $44.5 million pretax gain ($28.7 million after tax or $0.53 per share), net of settlement related
expenses, related to the settlement of a lawsuit with JDA Software Group for $57.0 million.
- •
-
a $4.2 million pretax gain ($2.7 million after tax or $0.05 per share) related to a distribution from a mall
joint venture (see Note 1 of Notes to Consolidated Financial Statements).
- •
-
a $2.1 million pretax gain ($1.4 million after tax or $0.03 per share) related to the sale of an interest in
a mall joint venture (see Note 1 of Notes to Consolidated Financial Statements).
- •
-
a $1.3 million pretax gain ($0.9 million after tax or $0.02 per share) related to the sale of two former
retail store locations.
- •
- a $1.2 million pretax charge ($0.8 million after tax or $0.01 per share) for asset impairment and store closing charges related to the write-down of one property held for sale (see Note 13 of the Notes to Consolidated Financial Statements).
2010
The items below amount to a net $10.4 million pretax gain ($16.4 million after tax gain or $0.24 per share).
- •
-
a $2.2 million pretax charge ($1.4 million after tax or $0.02 per share) for asset impairment and store
closing charges related to the write-down of one property held for sale (see Note 13 of the Notes to Consolidated Financial Statements).
- •
-
a $7.5 million pretax gain ($4.8 million after tax or $0.07 per share) on proceeds received for final
payment related to hurricane losses.
- •
-
a $5.1 million pretax gain ($3.3 million after tax or $0.05 per share) related to the sale of five retail
store locations.
- •
- a $9.7 million income tax benefit ($0.14 per share) primarily related to net decreases in unrecognized tax benefits, interest and penalties due to resolutions of federal and state examinations; decreases in state net operating loss valuation allowances; and a decrease in a capital loss valuation allowance.
2009
The items below amount to a net $6.6 million pretax gain ($14.7 million after tax gain or $0.19 per share).
- •
- a $3.1 million pretax charge ($2.0 million after tax or $0.03 per share) for asset impairment and store closing charges related to certain stores (see Note 13 of the Notes to Consolidated Financial Statements).
14
- •
-
a $5.7 million pretax gain ($3.6 million after tax or $0.05 per share) related to proceeds received from
settlement of the Visa Check/Mastermoney Antitrust litigation.
- •
-
a $10.6 million income tax benefit ($0.14 per share) primarily due to state administrative settlement and a
decrease in a capital loss valuation allowance.
- •
-
a $1.7 million pretax gain ($1.0 million after tax or $0.01 per share) on the early extinguishment of debt
related to the repurchase of certain unsecured notes (see Note 4 of the Notes to Consolidated Financial Statements).
- •
- a $2.3 million pretax gain ($1.5 million after tax or $0.02 per share) related to the sale of a vacant store location in Kansas City, Missouri.
2008
The items below amount to a net $180.4 million pretax charge ($125.5 million after tax charge or $1.69 per share).
- •
-
a $197.9 million pretax charge ($136.5 million after tax or $1.84 per share) for asset impairment and store
closing charges related to certain stores.
- •
-
a $7.3 million pretax charge ($4.6 million after tax or $0.06 per share) related to hurricane losses and
remediation expenses incurred during the 2008 hurricane season.
- •
- a $24.8 million pretax gain ($15.6 million after tax or $0.21 per share) related to the sale of an aircraft and the sale of a store located in San Antonio, Texas.
2007
The items below amount to a net $2.3 million pretax charge ($10.7 million after tax gain or $0.13 per share).
- •
-
a $20.5 million pretax charge ($12.8 million after tax or $0.16 per share) for asset impairment and store
closing charges related to certain stores.
- •
-
an $18.2 million pretax gain ($11.5 million after tax or $0.14 per share) related to reimbursement for
inventory and property damages incurred during the 2005 hurricane season.
- •
- a $12.0 million income tax benefit ($0.15 per share) primarily due to state administrative settlement, federal credits and the change in a capital loss valuation allowance.
15
EXECUTIVE OVERVIEW
Dillard's, Inc. operates 304 retail department stores spanning 29 states and an Internet store. Our retail stores are located in fashion-oriented shopping malls and open-air centers and offer a broad selection of fashion apparel, cosmetics and home furnishings. We offer an appealing and attractive assortment of merchandise to our customers at a fair price, including national brand merchandise as well as our exclusive brand merchandise. We seek to enhance our income by maximizing the sale of this merchandise to our customers by promoting and advertising our merchandise and by making our stores an attractive and convenient place for our customers to shop.
The Company also operates CDI, a general contractor whose business includes constructing and remodeling stores for the Company, which is a reportable segment separate from our retail operations.
In accordance with the National Retail Federation fiscal reporting calendar, the fiscal 2011, 2010 and 2009 reporting periods presented and discussed below ended January 28, 2012, January 29, 2011 and January 30, 2010, respectively, and each contained 52 weeks.
Fiscal 2011
Our operating results improved during fiscal 2011 with continued consumer confidence. Retail sales were up over last year, with comparable store sales increases recognized in all four quarters of the year. Gross margin improved slightly over last year, mainly from improvement in the first half of the year, and operating expenses were leveraged. We repurchased 11.4 million shares of our Class A Common Stock during the year, helping to reduce our total outstanding shares by almost 18% from last year. Net income increased to $463.9 million, or $8.52 per share during fiscal 2011—our highest historical fiscal year earnings per share—compared to $179.6 million, or $2.67 per share, during fiscal 2010.
Included in net income for fiscal 2011 are:
- •
-
a $201.6 million income tax benefit ($3.70 per share) due to a reversal of a valuation allowance related to the
amount of the capital loss carryforward used to offset the capital gain income recognized on the taxable transfer of properties to our REIT.
- •
-
a $44.5 million pretax gain ($28.7 million after tax or $0.53 per share), net of settlement related
expenses, related to the settlement of a lawsuit with JDA Software Group for $57.0 million.
- •
-
a $4.2 million pretax gain ($2.7 million after tax or $0.05 per share) related to a distribution from a mall
joint venture.
- •
-
a $2.1 million pretax gain ($1.4 million after tax or $0.03 per share) related to the sale of an interest in
a mall joint venture.
- •
-
a $1.3 million pretax gain ($0.9 million after tax or $0.02 per share) related to the sale of two former
retail store locations.
- •
- a $1.2 million pretax charge ($0.8 million after tax or $0.01 per share) for asset impairment and store closing charges related to the write-down of one property held for sale.
Included in net income for fiscal 2010 are:
- •
-
a $2.2 million pretax charge ($1.4 million after tax or $0.02 per share) for asset impairment and store
closing charges related to the write-down of one property held for sale;
- •
- a $7.5 million pretax gain ($4.8 million after tax or $0.07 per share) on proceeds received for final payment related to hurricane losses;
16
- •
-
a $5.1 million pretax gain ($3.3 million after tax or $0.05 per share) related to the sale of five retail
store locations; and
- •
- a $9.7 million income tax benefit ($0.14 per share) primarily related to net decreases in unrecognized tax benefits, interest and penalties due to resolutions of federal and state examinations; decreases in state net operating loss valuation allowances; and a decrease in a capital loss valuation allowance.
Highlights of fiscal 2011 as compared to fiscal 2010 are:
- •
-
Record earnings per share of $8.52 compared to $2.67 for the prior year. Net income was $463.9 million for fiscal
2011 compared to $179.6 million for fiscal 2010;
- •
-
A comparable store sales increase of 4% over the prior year;
- •
-
Operating expense leverage of 60 basis points of sales. Operating expenses as a percent of sales were 26.0% and 26.6% for
fiscal 2011 and fiscal 2010, respectively; and
- •
- Cash flow from operations of $501.1 million allowed the repurchase of approximately $491.2 million (11.4 million shares) of Class A Common Stock under the Company's share repurchase programs. Total shares outstanding at January 28, 2012 were 49.4 million shares compared to 60.0 million shares at January 29, 2011.
As of January 28, 2012, we had working capital of $721.4 million, cash and cash equivalents of $224.3 million and $891.6 million of total debt outstanding. We operated 304 total stores as of January 28, 2012, a decrease of four stores from the same period last year.
Key Performance Indicators
We use a number of key indicators of financial condition and operating performance to evaluate the performance of our business, including the following:
|
|
Fiscal Year Ended | |||||||||
|---|---|---|---|---|---|---|---|---|---|---|
|
(retail segment only, excluding cash flow data)
|
January 28,
2012 |
January 29,
2011 |
January 30,
2010 |
|||||||
|
Net sales (in millions) |
$ | 6,193.9 | $ | 6,020.0 | $ | 5,890.0 | ||||
|
Gross profit (in millions) |
$ | 2,221.0 | $ | 2,142.9 | $ | 1,982.9 | ||||
|
Gross profit as a percentage of net sales |
35.9 | % | 35.6 | % | 33.7 | % | ||||
|
Cash flow from operations (in millions) |
$ | 501.1 | $ | 512.9 | $ | 554.0 | ||||
|
Total store count at end of period |
304 | 308 | 309 | |||||||
|
Sales per square foot |
$ | 118 | $ | 113 | $ | 110 | ||||
|
Net sales trend |
3 | % | 2 | % | (13 | )% | ||||
|
Comparable store sales trend |
4 | % | 3 | % | (10 | )% | ||||
|
Comparable store inventory trend |
3 | % | (2 | )% | (5 | )% | ||||
|
Merchandise inventory turnover |
2.8 | 2.8 | 2.6 | |||||||
Trends and Uncertainties
Fluctuations in the following key trends and uncertainties may have a material effect on our operating results.
- •
-
Cash flow—Cash from operating activities is a primary source of liquidity that is adversely affected when the
industry faces economic challenges. Furthermore, operating cash flow can be negatively affected when new and existing competitors seek areas of growth to expand their businesses.
- •
- Pricing—If our customers do not purchase our merchandise offerings in sufficient quantities, we respond by taking markdowns. If we have to reduce our retail selling prices, the cost of sales on
17
- •
-
Success of brand—The success of our exclusive brand merchandise as well as merchandise we source from national
vendors is dependent upon customer fashion preferences and how well we can predict and anticipate trends.
- •
-
Sourcing—Our store merchandise selection is dependent upon our ability to acquire appealing products from a
number of sources. Our ability to attract and retain compelling vendors as well as in-house design talent, the adequacy and stable availability of materials and production facilities from
which we source our merchandise and the speed at which we can respond to customer trends and preferences all have a significant impact on our merchandise mix and, thus, our ability to sell merchandise
at profitable prices.
- •
- Store growth—Although store growth is presently not a near-term goal, such growth is dependent upon a number of factors which could impede our ability to open new stores, such as the identification of suitable markets and locations and the availability of shopping developments, especially in a weak economic environment.
our consolidated statement of income will correspondingly rise, thus reducing our income and cash flow.
Seasonality and Inflation
Our business, like many other retailers, is subject to seasonal influences, with a significant portion of sales and income typically realized during the last quarter of our fiscal year due to the holiday season. Because of the seasonality of our business, results from any quarter are not necessarily indicative of the results that may be achieved for a full fiscal year.
We do not believe that inflation has had a material effect on our results during the periods presented; however, our business could be affected by such in the future. In response to economic volatility in Asia and to increased fabric prices (including cotton) and overseas wages, during fiscal 2011 we sought solutions to help minimize the effects of these events on our operations by (1) negotiating efficiencies through our longstanding relationships with our current suppliers, (2) considering alternative manufacturing sources, (3) redesigning our garments and incorporating other types of fibers where appropriate and (4) adjusting price points as necessary. With the help of these mitigating steps, the effects of the negative economic events did not have a material negative impact on our fiscal 2011 gross margins, and we believe they will not have a material negative impact on our fiscal 2012 gross margins as these same pressures have moderated since last year.
2012 Guidance
A summary of estimates on key financial measures for fiscal 2012 is shown below.
|
(in millions of dollars)
|
Fiscal 2012 Estimated | Fiscal 2011 Actual | |||||
|---|---|---|---|---|---|---|---|
|
Depreciation and amortization |
$ | 256 | $ | 258 | |||
|
Rentals |
34 | 48 | |||||
|
Interest and debt expense, net |
71 | 72 | |||||
|
Capital expenditures |
175 | 116 | |||||
General
Net sales. Net sales include merchandise sales of comparable and non-comparable stores and revenue recognized on contracts of CDI, the Company's general contracting construction company. Comparable store sales include sales for those stores which were in operation for a full period in both the current month and the corresponding month for the prior year. Non-comparable store sales include: sales in the current fiscal year from stores opened during the previous fiscal year before they are considered comparable stores; sales from new stores opened during the current fiscal year; sales in
18
the previous fiscal year for stores closed during the current or previous fiscal year that are no longer considered comparable stores; and sales in clearance centers.
Service charges and other income. Service charges and other income include income generated through the Alliance with GE. Other income includes rental income, shipping and handling fees and lease income on leased departments.
Cost of sales. Cost of sales includes the cost of merchandise sold (net of purchase discounts), bankcard fees, freight to the distribution centers, employee and promotional discounts, non-specific margin maintenance allowances and direct payroll for salon personnel. Cost of sales also includes CDI contract costs, which comprise all direct material and labor costs, subcontract costs and those indirect costs related to contract performance, such as indirect labor, employee benefits and insurance program costs.
Advertising, selling, administrative and general expenses. Advertising, selling, administrative and general expenses include buying, occupancy, selling, distribution, warehousing, store and corporate expenses (including payroll and employee benefits), insurance, employment taxes, advertising, management information systems, legal and other corporate level expenses. Buying expenses consist of payroll, employee benefits and travel for design, buying and merchandising personnel.
Depreciation and amortization. Depreciation and amortization expenses include depreciation and amortization on property and equipment.
Rentals. Rentals include expenses for store leases, including contingent rent, and data processing and other equipment rentals.
Interest and debt expense, net. Interest and debt expense includes interest, net of interest income, relating to the Company's unsecured notes, mortgage notes, term note, subordinated debentures and borrowings under the Company's credit facility. Interest and debt expense also includes gains and losses on note repurchases, amortization of financing costs and interest on capital lease obligations.
Gain on litigation settlement. Gain on litigation settlement includes the proceeds received, net of related expenses, from the settlement of a lawsuit with JDA Software Group.
Gain on disposal of assets. Gain on disposal of assets includes the net gain or loss on the sale or disposal of property and equipment and the gain on the sale of an interest in a mall joint venture.
Asset impairment and store closing charges. Asset impairment and store closing charges consist of write-downs to fair value of under-performing or held for sale properties and exit costs associated with the closure of certain stores. Exit costs include future rent, taxes and common area maintenance expenses from the time the stores are closed.
Income on (equity in losses of) joint ventures. Income on (equity in losses of) joint ventures includes the Company's portion of the income or loss of the Company's unconsolidated joint ventures as well as a distribution of excess cash from one of the Company's mall joint ventures.
Critical Accounting Policies and Estimates
The Company's accounting policies are also described in Note 1 of Notes to Consolidated Financial Statements. As disclosed in this note, the preparation of financial statements in conformity with accounting principles generally accepted in the United States of America ("GAAP") requires management to make estimates and assumptions about future events that affect the amounts reported in the consolidated financial statements and accompanying notes. The Company evaluates its estimates and judgments on an ongoing basis and predicates those estimates and judgments on historical experience and on various other factors that are believed to be reasonable under the circumstances.
19
Since future events and their effects cannot be determined with absolute certainty, actual results will differ from those estimates.
Management of the Company believes the following critical accounting policies, among others, affect its more significant judgments and estimates used in preparation of the Consolidated Financial Statements.
Merchandise inventory. Approximately 97% of the inventories are valued at the lower of cost or market using the last-in, first-out retail inventory method ("LIFO RIM"). Under LIFO RIM, the valuation of inventories at cost and the resulting gross margins are calculated by applying a calculated cost to retail ratio to the retail value of inventories. LIFO RIM is an averaging method that is widely used in the retail industry due to its practicality. Inherent in the LIFO RIM calculation are certain significant management judgments including, among others, merchandise markon, markups, and markdowns, which significantly impact the ending inventory valuation at cost as well as the resulting gross margins. During periods of deflation, current replacement cost could result in inventory values on the first-in, first-out ("FIFO") retail inventory method being lower than the LIFO method. At January 28, 2012 and January 29, 2011, the LIFO method, after a lower of cost or market adjustment, approximated the cost of inventories using the FIFO method. The application of LIFO did not impact cost of sales during fiscal 2011, 2010 or 2009. The remaining 3% of the inventories are valued at the lower of cost or market using the average cost or specific identified cost methods. A 1% change in the dollar amount of markdowns would have impacted net income by approximately $9 million for fiscal 2011.
The Company regularly records a provision for estimated shrinkage, thereby reducing the carrying value of merchandise inventory. Complete physical inventories of all of the Company's stores and warehouses are performed no less frequently than annually, with the recorded amount of merchandise inventory being adjusted to coincide with these physical counts. The differences between the estimated amounts of shrinkage and the actual amounts realized during the past three years have not been material.
Revenue recognition. The Company's retail operations segment recognizes revenue upon the sale of merchandise to its customers, net of anticipated returns of merchandise. The provision for sales returns is based on historical evidence of our return rate. We recorded an allowance for sales returns of $9.0 million and $7.3 million as of January 28, 2012 and January 29, 2011, respectively. Adjustments to earnings resulting from revisions to estimates on our sales return provision were not material for the years ended January 28, 2012, January 29, 2011 and January 30, 2010.
The Company's share of income earned under the Alliance with GE involving the Dillard's branded proprietary credit cards is included as a component of service charges and other income. The Company received income of approximately $96 million, $85 million and $89 million from GE in fiscal 2011, 2010 and 2009, respectively. Pursuant to this Alliance, the Company has no continuing involvement other than to honor the proprietary cards in its stores. Although not obligated to a specific level of marketing commitment, the Company participates in the marketing of the proprietary credit cards and accepts payments on the proprietary credit cards in its stores as a convenience to customers who prefer to pay in person rather than by paying online or mailing their payments to GE.
Revenues from CDI construction contracts are generally recognized by applying percentages of completion for each period to the total estimated revenue for the respective contracts. The length of each contract varies but is typically nine to eighteen months. The percentages of completion are determined by relating the actual costs of work performed to date to the current estimated total costs of the respective contracts. Any anticipated losses on completed contracts are recognized as soon as they are determined.
20
Vendor allowances. The Company receives concessions from vendors through a variety of programs and arrangements, including co-operative advertising, payroll reimbursements and margin maintenance programs.
Cooperative advertising allowances are reported as a reduction of advertising expense in the period in which the advertising occurred. If vendor advertising allowances were substantially reduced or eliminated, the Company would likely consider other methods of advertising as well as the volume and frequency of our product advertising, which could increase or decrease our expenditures. Similarly, we are not able to assess the impact of vendor advertising allowances on creating additional revenues, as such allowances do not directly generate revenues for our stores.
Payroll reimbursements are reported as a reduction of payroll expense in the period in which the reimbursement occurred.
Amounts of margin maintenance allowances are recorded only when an agreement has been reached with the vendor and the collection of the concession is deemed probable. All such merchandise margin maintenance allowances are recognized as a reduction of cost purchases. Under LIFO RIM, a portion of these allowances reduces cost of goods sold and a portion reduces the carrying value of merchandise inventory.
Insurance accruals. The Company's consolidated balance sheets include liabilities with respect to claims for self-insured workers' compensation (with a self-insured retention of $4 million per claim) and general liability (with a self-insured retention of $1 million per claim and a one-time $1 million corridor). The Company's retentions are insured through a wholly-owned captive insurance subsidiary. The Company estimates the required liability of such claims, utilizing an actuarial method, based upon various assumptions, which include, but are not limited to, our historical loss experience, projected loss development factors, actual payroll and other data. The required liability is also subject to adjustment in the future based upon the changes in claims experience, including changes in the number of incidents (frequency) and changes in the ultimate cost per incident (severity). As of January 28, 2012 and January 29, 2011, insurance accruals of $50.3 million and $52.9 million, respectively, were recorded in trade accounts payable and accrued expenses and other liabilities. Adjustments resulting from changes in historical loss trends have helped control expenses during fiscal 2011 and 2010, partially due to Company programs that have helped decrease both the number and cost of claims. Further, we do not anticipate any significant change in loss trends, settlements or other costs that would cause a significant change in our earnings. A 10% change in our self-insurance reserve would have affected net earnings by $3.2 million for fiscal 2011.
Long-lived assets. The Company's judgment regarding the existence of impairment indicators is based on market and operational performance. We assess the impairment of long-lived assets, primarily fixed assets, whenever events or changes in circumstances indicate that the carrying value may not be recoverable. Factors we consider important which could trigger an impairment review include the following:
- •
-
Significant changes in the manner of our use of assets or the strategy for the overall business;
- •
-
Significant negative industry or economic trends;
- •
-
A current-period operating or cash flow loss combined with a history of operating or cash flow losses; or
- •
- Store closings.
The Company performs an analysis of the anticipated undiscounted future net cash flows of the related finite-lived assets. If the carrying value of the related asset exceeds the undiscounted cash flows, the carrying value is reduced to its fair value. Various factors including future sales growth and profit
21
margins are included in this analysis. To the extent these future projections or the Company's strategies change, the conclusion regarding impairment may differ from the current estimates.
Income taxes. Temporary differences arising from differing treatment of income and expense items for tax and financial reporting purposes result in deferred tax assets and liabilities that are recorded on the balance sheet. These balances, as well as income tax expense, are determined through management's estimations, interpretation of tax law for multiple jurisdictions and tax planning. If the Company's actual results differ from estimated results due to changes in tax laws, changes in store locations or tax planning, the Company's effective tax rate and tax balances could be affected. As such, these estimates may require adjustment in the future as additional facts become known or as circumstances change.
The total amount of unrecognized tax benefits as of January 28, 2012 and January 29, 2011 was $8.5 million and $9.1 million, respectively, of which $5.8 million and $6.3 million, respectively, would, if recognized, affect the effective tax rate. The Company classifies accrued interest expense and penalties relating to income tax in the consolidated financial statements as income tax expense. The total interest and penalties recognized in the consolidated statements of income as of January 28, 2012, January 29, 2011 and January 30, 2010 was $(0.2) million, $(2.3) million, and $(2.0) million, respectively. The total accrued interest and penalties in the consolidated balance sheets as of January 28, 2012 and January 29, 2011 was $3.4 million and $3.7 million, respectively.
During fiscal 2011, the Internal Revenue Service ("IRS") concluded its examination of the Company's federal income tax returns for the fiscal tax years 2008 and 2009, and no significant changes occurred in these tax years as a result of such examination. The Company is currently under examination by various state and local taxing jurisdictions for various fiscal years. The tax years that remain subject to examination for major tax jurisdictions are fiscal tax years 2008 and forward, with the exception of fiscal 2003 through 2007 amended state and local tax returns related to the reporting of federal audit adjustments. At this time, the Company does not expect the results from any income tax audit to have a material impact on the Company's consolidated financial statements.
The Company has taken positions in certain taxing jurisdictions for which it is reasonably possible that the total amounts of unrecognized tax benefits may decrease within the next twelve months. The possible decrease could result from the finalization of the Company's various state income tax audits and lapse of statutes of limitation. The Company's federal income tax audit uncertainties primarily relate to research and development credits, while various state income tax audit uncertainties primarily relate to income from intangible assets. The estimated range of the reasonably possible uncertain tax benefit decrease in the next twelve months is between $0.5 million and $2.0 million. Changes in the Company's assumptions and judgments can materially affect amounts recognized in the consolidated balance sheets and statements of income.
Pension obligations. The discount rate that the Company utilizes for determining future pension obligations is based on the Citigroup Above Median Pension Index Curve on its annual measurement date and is matched to the future expected cash flows of the benefit plans by annual periods. The discount rate decreased to 4.3% as of January 28, 2012 from 5.5% as of January 29, 2011. We believe that these assumptions have been appropriate and that, based on these assumptions, the pension liability of $174 million is appropriately stated as of January 28, 2012; however, actual results may differ materially from those estimated and could have a material impact on our consolidated financial statements. A further 50 basis point change in the discount rate would increase or decrease the pension liability by approximately $10.4 million. The Company expects to make a contribution to the pension plan of approximately $7.9 million in fiscal 2012. The Company expects pension expense to be approximately $16.3 million in fiscal 2012 with a liability of $182.5 million at February 2, 2013.
22
RESULTS OF OPERATIONS
The following table sets forth the results of operations and percentage of net sales, for the periods indicated:
|
|
For the years ended | ||||||||||||||||||
|---|---|---|---|---|---|---|---|---|---|---|---|---|---|---|---|---|---|---|---|
|
|
January 28, 2012 | January 29, 2011 | January 30, 2010 | ||||||||||||||||
|
(in thousands of dollars)
|
Amount |
% of
Net Sales |
Amount |
% of
Net Sales |
Amount |
% of
Net Sales |
|||||||||||||
|
Net sales |
$ | 6,263,600 | 100.0 | % | $ | 6,120,961 | 100.0 | % | $ | 6,094,948 | 100.0 | % | |||||||
|
Service charges and other income |
136,165 | 2.2 | 132,574 | 2.2 | 131,680 | 2.2 | |||||||||||||
|
|
6,399,765 | 102.2 | 6,253,535 | 102.2 | 6,226,628 | 102.2 | |||||||||||||
|
Cost of sales |
4,041,550 | 64.5 | 3,976,063 | 65.0 | 4,102,892 | 67.3 | |||||||||||||
|
Advertising, selling, administrative and general expenses |
1,630,907 | 26.0 | 1,625,793 | 26.6 | 1,644,091 | 27.0 | |||||||||||||
|
Depreciation and amortization |
257,685 | 4.1 | 261,550 | 4.3 | 262,877 | 4.3 | |||||||||||||
|
Rentals |
48,110 | 0.8 | 51,045 | 0.8 | 58,363 | 1.0 | |||||||||||||
|
Interest and debt expense, net |
72,059 | 1.2 | 73,792 | 1.2 | 74,003 | 1.2 | |||||||||||||
|
Gain on litigation settlement |
(44,460 | ) | (0.7 | ) | — | 0.0 | — | 0.0 | |||||||||||
|
Gain on disposal of assets |
(3,955 | ) | 0.0 | (5,632 | ) | (0.1 | ) | (3,207 | ) | (0.1 | ) | ||||||||
|
Asset impairment and store closing charges |
1,200 | 0.0 | 2,208 | 0.0 | 3,084 | 0.1 | |||||||||||||
|
Income before income taxes and income on (equity in losses of) joint ventures |
396,669 | 6.3 | 268,716 | 4.4 | 84,525 | 1.4 | |||||||||||||
|
Income taxes (benefit) |
(62,518 | ) | (1.0 | ) | 84,450 | 1.4 | 12,690 | 0.2 | |||||||||||
|
Income on (equity in losses of) joint ventures |
4,722 | 0.1 | (4,646 | ) | (0.1 | ) | (3,304 | ) | (0.1 | ) | |||||||||
|
Net income |
$ | 463,909 | 7.4 | % | $ | 179,620 | 2.9 | % | $ | 68,531 | 1.1 | % | |||||||
23
Sales
|
(in thousands of dollars)
|
Fiscal 2011 | Fiscal 2010 | Fiscal 2009 | |||||||
|---|---|---|---|---|---|---|---|---|---|---|
|
Net sales: |
||||||||||
|
Retail operations segment |
$ | 6,193,903 | $ | 6,020,043 | $ | 5,889,961 | ||||
|
Construction segment |
69,697 | 100,918 | 204,987 | |||||||
|
Total net sales |
$ | 6,263,600 | $ | 6,120,961 | $ | 6,094,948 | ||||
The percent change by category in the Company's retail operations segment sales for the past two years is as follows:
|
|
Percent Change | ||||||
|---|---|---|---|---|---|---|---|
|
|
Fiscal
2011 - 2010 |
Fiscal
2010 - 2009 |
|||||
|
Cosmetics |
4.7 | % | (0.1 | )% | |||
|
Ladies' apparel and accessories |
2.1 | 2.4 | |||||
|
Juniors' and children's apparel |
3.7 | 1.6 | |||||
|
Men's apparel and accessories |
2.8 | 1.8 | |||||
|
Shoes |
5.6 | 7.3 | |||||
|
Home and furniture |
(2.8 | ) | (3.6 | ) | |||
2011 Compared to 2010
Net sales from the retail operations segment increased $173.9 million or 3% during fiscal 2011 as compared to fiscal 2010 while sales in comparable stores improved 4%. Sales of shoes and cosmetics were up significantly while sales of juniors' and children's apparel, men's apparel and accessories and ladies' apparel and accessories increased moderately. Sales in the home and furniture category were down moderately.
The number of sales transactions decreased 2% over the prior year while the average dollars per sales transaction increased significantly.
We believe that we may continue to see some sales growth in the retail operations segment during the coming months; however, there is no guarantee of improved sales performance.
Net sales from the construction segment decreased $31.2 million or 31% during fiscal 2011 as compared to fiscal 2010. This decrease is primarily attributable to the negative impact that the weak United States economy had in previous periods on our construction project backlog. During fiscal 2011, we were awarded approximately $165 million in new contracts. Consequently, we believe we may see some sales growth in the construction segment during the coming months; however, there is no guarantee of improved sales performance.
2010 Compared to 2009
Net sales from the retail operations segment increased $130.1 million or 2% during fiscal 2010 as compared to fiscal 2009 while sales in comparable stores improved 3%. Sales of shoes were up significantly, and sales of ladies' apparel and accessories, men's apparel and accessories and juniors' and children's apparel were up moderately. Sales of cosmetics were flat while sales in the home and furniture category were down moderately.
The number of sales transactions increased 1% over the prior year, and the average dollars per sales transaction increased slightly.
24
Net sales from the construction segment decreased $104.1 million or 51% during fiscal 2010 as compared to fiscal 2009 primarily because of the negative impact the weak recovery of the United States economy had on demand for construction projects in private industry.
Exclusive Brand Merchandise
Sales penetration of exclusive brand merchandise for fiscal years 2011, 2010 and 2009 was 21.8%, 22.7% and 23.8% of total net sales, respectively.
Service Charges and Other Income
|
|
|
|
|
Dollar Change | Percent Change | |||||||||||||||||
|---|---|---|---|---|---|---|---|---|---|---|---|---|---|---|---|---|---|---|---|---|---|---|
|
(in millions of dollars)
|
Fiscal
2011 |
Fiscal
2010 |
Fiscal
2009 |
2011 - 2010 | 2010 - 2009 | 2011 - 2010 | 2010 - 2009 | |||||||||||||||
|
Service charges and other income: |
||||||||||||||||||||||
|
Retail operations segment |
||||||||||||||||||||||
|
Income from GE marketing and servicing alliance |
$ | 95.8 | $ | 84.7 | $ | 88.7 | $ | 11.1 | $ | (4.0 | ) | 13.1 | % | (4.5 | )% | |||||||
|
Leased department income |
10.1 | 10.0 | 10.8 | 0.1 | (0.8 | ) | 1.0 | (7.4 | ) | |||||||||||||
|
Shipping and handling income |
18.4 | 17.2 | 15.4 | 1.2 | 1.8 | 7.0 | 11.7 | |||||||||||||||
|
Visa Check/Mastermoney Antitrust settlement proceeds |
— | 0.4 | 5.7 | (0.4 | ) | (5.3 | ) | (100.0 | ) | (93.0 | ) | |||||||||||
|
Hurricane settlement |
— | 7.5 | — | (7.5 | ) | 7.5 | (100.0 | ) | +100.0 | |||||||||||||
|
Other |
11.2 | 11.1 | 10.7 | 0.1 | 0.4 | 0.9 | 3.7 | |||||||||||||||
|
|
135.5 | 130.9 | 131.3 | 4.6 | (0.4 | ) | 3.5 | (0.3 | ) | |||||||||||||
|
Construction segment |
0.7 | 1.7 | 0.4 | (1.0 | ) | 1.3 | (58.8 | ) | +100.0 | |||||||||||||
|
Total |
$ | 136.2 | $ | 132.6 | $ | 131.7 | $ | 3.6 | $ | 0.9 | 2.7 | % | 0.7 | % | ||||||||
2011 Compared to 2010
Service charges and other income is composed primarily of income from the Alliance with GE. Income from the Alliance increased $11.1 million in fiscal 2011 compared to fiscal 2010 due to decreased credit losses partially offset by reduced finance charge and late charge fee income.
2010 Compared to 2009
Income from the Alliance decreased $4.0 million in fiscal 2010 compared to fiscal 2009 due to reduced finance charge and late charge fee income related to recent credit regulation legislation partially offset by decreased credit losses.
We were a member of a class of a settled lawsuit against Visa U.S.A. Inc. ("Visa") and MasterCard International Incorporated ("MasterCard"). The Visa Check/MasterMoney Antitrust litigation settlement became final on June 1, 2005. The settlement provided $3.05 billion in compensatory relief by Visa and MasterCard to be funded over a fixed period of time to respective Settlement Funds. We received and recorded $0.4 million and $5.7 million as part of our share of the proceeds from the settlement during fiscal 2010 and 2009 respectively. This amount was recorded in service charges and other income.
Also included in service charges and other income were proceeds of $7.5 million received during fiscal 2010 as final payment related to hurricane losses.
25
Gross Profit
|
(in thousands of dollars)
|
Fiscal 2011 | Fiscal 2010 | Fiscal 2009 | |||||||
|---|---|---|---|---|---|---|---|---|---|---|
|
Gross profit: |
||||||||||
|
Retail operations segment |
$ | 2,220,951 | $ | 2,142,913 | $ | 1,982,858 | ||||
|
Construction segment |
1,099 | 1,985 | 9,198 | |||||||
|
Total gross profit |
$ | 2,222,050 | $ | 2,144,898 | $ | 1,992,056 | ||||
|
Gross profit as a percentage of segment net sales: |
||||||||||
|
Retail operations segment |
35.9 | % | 35.6 | % | 33.7 | % | ||||
|
Construction segment |
1.6 | 2.0 | 4.5 | |||||||
|
Total gross profit as a percentage of net sales |
35.5 | 35.0 | 32.7 | |||||||
2011 Compared to 2010
Gross profit improved 50 basis points of sales during fiscal 2011 compared to fiscal 2010. Gross profit from retail operations improved 30 basis points of sales during the same periods as a result of increased markups partially offset by increased markdowns. Inventory in comparable stores increased 3% as of January 28, 2012 compared to January 29, 2011.
During fiscal 2011, gross margin improved moderately in the home and furniture category and improved slightly in shoes. Men's apparel and accessories experienced a slight decline in gross margin while all other merchandise categories were flat.
We believe that gross margin from retail operations will improve slightly in the coming months; however, there is no guarantee of improved gross margin performance.
Gross profit from the construction segment declined 40 basis points of sales during fiscal 2011 compared to fiscal 2010. This decline from the prior year was a result of fewer projects caused by the reduction in demand for construction services combined with pricing pressures in an already competitive marketplace. This decline was also due to a $1.2 million loss recorded during the year on an electrical contract partially offset by a $2.5 million loss recorded in the prior year on certain electrical contracts stemming from job delays related to bad weather and job underperformance.
2010 Compared to 2009
Gross profit improved 230 basis points of sales during fiscal 2010 compared to fiscal 2009. Gross profit from retail operations improved 190 basis points of sales during the same periods as a result of inventory management measures leading to reduced markdown activity. These inventory management measures included considerable adjustment to receipt cadence to shorten the period of time from receipt to sale, to reduce markdown risk and to keep customers engaged with a more continuous flow of fresh merchandise selections throughout the season. Inventory in comparable stores declined 2% as of January 29, 2011 compared to January 30, 2010.
Most merchandise categories experienced moderate improvements in gross margin during fiscal 2010 compared to fiscal 2009, while cosmetics and home and furniture improved only slightly.
Gross profit from the construction segment declined 250 basis points of sales during fiscal 2010 compared to fiscal 2009. This decrease was the result of the decline in demand for construction services that has created pricing pressures in an already competitive marketplace. This decrease was also due to job delays from bad weather and job underperformance resulting in the recognition of a $2.5 million loss during fiscal 2010 on certain electrical contracts.
26
Advertising, Selling, Administrative and General Expenses ("SG&A")
|
(in thousands of dollars)
|
Fiscal 2011 | Fiscal 2010 | Fiscal 2009 | |||||||
|---|---|---|---|---|---|---|---|---|---|---|
|
SG&A: |
||||||||||
|
Retail operations segment |
$ | 1,626,142 | $ | 1,621,190 | $ | 1,638,538 | ||||
|
Construction segment |
4,765 | 4,603 | 5,553 | |||||||
|
Total SG&A |
$ | 1,630,907 | $ | 1,625,793 | $ | 1,644,091 | ||||
|
SG&A as a percentage of segment net sales: |
||||||||||
|
Retail operations segment |
26.3 | % | 26.9 | % | 27.8 | % | ||||
|
Construction segment |
6.8 | 4.6 | 2.7 | |||||||
|
Total SG&A as a percentage of net sales |
26.0 | 26.6 | 27.0 | |||||||
2011 Compared to 2010
SG&A improved 60 basis points of sales during fiscal 2011 compared to fiscal 2010 while total SG&A dollars increased $5.1 million. The dollar increase was most noted in payroll and payroll related taxes ($14.2 million), primarily of selling payroll, services purchased ($7.3 million) and supplies ($6.6 million) partially offset by decreased net advertising expenditures ($14.3 million) and utilities ($6.7 million).
We believe that SG&A will improve slightly as a percentage of sales in the coming months; however, there is no guarantee of improved SG&A performance.
2010 Compared to 2009
SG&A decreased $18.3 million during fiscal 2010 compared to fiscal 2009 primarily as a result of the Company's expense savings measures combined with store closures. The decline was most noted in advertising ($28.7 million), payroll and related payroll taxes ($9.3 million) and property taxes ($7.2 million) partially offset by increases in services purchased ($14.4 million) and supplies ($6.4 million) and insurance ($5.6 million).
Depreciation and Amortization
|
(in thousands of dollars)
|
Fiscal 2011 | Fiscal 2010 | Fiscal 2009 | |||||||
|---|---|---|---|---|---|---|---|---|---|---|
|
Depreciation and amortization: |
||||||||||
|
Retail operations segment |
$ | 257,504 | $ | 261,368 | $ | 262,709 | ||||
|
Construction segment |
181 | 182 | 168 | |||||||
|
Total depreciation and amortization |
$ | 257,685 | $ | 261,550 | $ | 262,877 | ||||
2011 Compared to 2010
Depreciation and amortization expense decreased $3.9 million during fiscal 2011 compared to fiscal 2010 primarily as a result of reduced capital expenditures and store closures.
2010 Compared to 2009
Depreciation and amortization expense decreased $1.3 million during fiscal 2010 compared to fiscal 2009 primarily as a result of store closures and the Company's continuing efforts to reduce capital expenditures.
27
Rentals
|
(in thousands of dollars)
|
Fiscal 2011 | Fiscal 2010 | Fiscal 2009 | |||||||
|---|---|---|---|---|---|---|---|---|---|---|
|
Rentals: |
||||||||||
|
Retail operations segment |
$ | 48,058 | $ | 50,967 | $ | 58,273 | ||||
|
Construction segment |
52 | 78 | 90 | |||||||
|
Total rentals |
$ | 48,110 | $ | 51,045 | $ | 58,363 | ||||
2011 Compared to 2010
Rental expense declined $2.9 million or 5.7% in fiscal 2011 compared to fiscal 2010 primarily due to a decrease in the amount of equipment leased by the Company.
We believe that rental expense will decline significantly during fiscal 2012, with a current projected reduction of $14 million from fiscal 2011, primarily as a result of the expiration of certain equipment leases.
2010 Compared to 2009
Rental expense declined $7.3 million or 12.5% in fiscal 2010 compared to fiscal 2009 primarily due to a decrease in the amount of equipment leased by the Company.
Interest and Debt Expense, Net
|
(in thousands of dollars)
|
Fiscal 2011 | Fiscal 2010 | Fiscal 2009 | |||||||
|---|---|---|---|---|---|---|---|---|---|---|
|
Interest and debt expense (income), net: |
||||||||||
|
Retail operations segment |
$ | 72,218 | $ | 74,009 | $ | 74,256 | ||||
|
Construction segment |
(159 | ) | (217 | ) | (253 | ) | ||||
|
Total interest and debt expense, net |
$ | 72,059 | $ | 73,792 | $ | 74,003 | ||||
2011 Compared to 2010
Net interest and debt expense declined $1.7 million in fiscal 2011 compared to fiscal 2010 primarily due to matured and repurchased outstanding notes partially offset by increased short-term borrowing costs. Total weighted average debt outstanding during fiscal 2011 increased approximately $33.3 million compared to fiscal 2010.
2010 Compared to 2009
Net interest and debt expense declined $0.2 million in fiscal 2010 compared to fiscal 2009 primarily due to lower average debt levels and earned interest on invested cash partially offset by the elimination of capitalized interest and gain on prior year debt repurchases. Total weighted average debt outstanding during fiscal 2010 decreased approximately $63.4 million compared to fiscal 2009.
Gain on Litigation Settlement
|
(in thousands of dollars)
|
Fiscal 2011 | Fiscal 2010 | Fiscal 2009 | |||||||
|---|---|---|---|---|---|---|---|---|---|---|
|
Gain on litigation settlement: |
||||||||||
|
Retail operations segment |
$ | 44,460 | $ | — | $ | — | ||||
|
Construction segment |
— | — | — | |||||||
|
Total gain on litigation settlement |
$ | 44,460 | $ | — | $ | — | ||||
28
The Company reached an agreement effective November 30, 2011 with i2 Technologies, Inc. ("i2"), a subsidiary of JDA Software Group, Inc. ("JDA"), to settle a lawsuit filed by Dillard's against i2 over software sold to Dillard's by i2 in 2000, prior to JDA's acquisition of i2 in 2010. Pursuant to the agreement, i2 paid Dillard's $57.0 million during fiscal 2011. After providing for settlement related expenses, the Company recorded $44.5 million in gain on litigation settlement.
Gain on Disposal of Assets
|
(in thousands of dollars)
|
Fiscal 2011 | Fiscal 2010 | Fiscal 2009 | |||||||
|---|---|---|---|---|---|---|---|---|---|---|
|
Gain (loss) on disposal of assets: |
||||||||||
|
Retail operations segment |
$ | 4,019 | $ | 5,620 | $ | 3,203 | ||||
|
Construction segment |
(64 | ) | 12 | 4 | ||||||
|
Total gain on disposal of assets |
$ | 3,955 | $ | 5,632 | $ | 3,207 | ||||
Fiscal 2011
During fiscal 2011, the Company received proceeds of $10.3 million from the sale of two former retail store locations located in West Palm Beach, Florida and Las Vegas, Nevada, resulting in gains totaling $1.3 million. Additionally, the Company received proceeds of $11.0 million from the sale of an interest in a mall joint venture, resulting in a gain of $2.1 million.
Fiscal 2010
During fiscal 2010, the Company sold three vacant retail store properties located in Austin, Texas, Macon, Georgia and Chesapeake, Virginia for $7.3 million, resulting in a $3.1 million net gain. The Company also sold two retail store properties located in Coral Springs, Florida and Miami, Florida for $10.0 million, resulting in a $2.0 million gain.
Fiscal 2009
During fiscal 2009, the Company sold a vacant retail store location in Kansas City, Missouri resulting in a $2.3 million gain.
Asset Impairment and Store Closing Charges
|
(in thousands of dollars)
|
Fiscal 2011 | Fiscal 2010 | Fiscal 2009 | |||||||
|---|---|---|---|---|---|---|---|---|---|---|
|
Asset impairment and store closing charges: |
||||||||||
|
Retail operations segment |
$ | 1,200 | $ | 2,208 | $ | 3,084 | ||||
|
Construction segment |
— | — | — | |||||||
|
Total asset impairment and store closing charges |
$ | 1,200 | $ | 2,208 | $ | 3,084 | ||||
Fiscal 2011
Asset impairment and store closing charges for fiscal 2011 consisted of the write-down of a property held for sale.
Fiscal 2010
Asset impairment and store closing charges for fiscal 2010 consisted of the write-down of one property held for sale.
29
Fiscal 2009
Asset impairment and store closing charges for fiscal 2009 consisted of the write-down of property of $3.9 million on two stores closed in fiscal 2008. This amount was partially offset by the renegotiation of a lease that resulted in the reduction of a future rent accrual of $0.8 million on a store closed in fiscal 2008.
Income Taxes
The Company's estimated federal and state income tax rate, inclusive of income on (equity in losses of) joint ventures, was (15.6)% in fiscal 2011, 32.0% in fiscal 2010 and 15.6% in fiscal 2009.
Fiscal 2011
In January 2011, the Company formed a wholly-owned subsidiary intended to operate as a real estate investment trust ("REIT") and transferred certain properties to this subsidiary. The Company entered into this transaction in order to enhance its financial flexibility by providing additional sources of liquidity. At the time, the Company believed that a tax election might be available to the Company that would result in a taxable gain on the transfer of these properties to the REIT. In May 2011, the Company requested that the IRS review the transaction and the potential tax election available to the Company, through the IRS's voluntary Pre-Filing Agreement Program ("PFA"). Through the PFA, in September 2011, the Company and the IRS entered into a Closing Agreement on Final Determination Covering Specific Matters under which the IRS agreed with the Company regarding the tax treatment of the transfer of the properties to the REIT and the availability of the tax election to the Company. Based on the agreement with the IRS reached during fiscal 2011, the Company determined to make the tax election in its tax return for the fiscal year ended January 29, 2011 (fiscal 2010). This tax election increased the tax basis of the properties transferred to the REIT to their fair values at the date of the transfer. The income tax that would otherwise be payable because of the gain recognized by this election was largely reduced by the utilization of a capital loss carryforward, that would otherwise have expired as of January 29, 2011, against a portion of the recognized gain. Because of the Company's past uncertainty regarding the incurrence of capital gain income, the deferred tax asset associated with that capital loss carryforward had been offset by a full valuation allowance since its recognition in fiscal 2005. During fiscal 2011, income taxes included the recognition of approximately $201.6 million in tax benefit due to the reversal of the valuation allowance related to the amount of the capital loss carryforward used to offset the capital gain income recognized on the taxable transfer of the properties to the REIT ("REIT Transaction"). Approximately $134.4 million of the tax benefit relates to increased basis in depreciable property while approximately $67.2 million of the benefit relates to increased basis in land. Due to the increased tax basis of the depreciable properties transferred to the REIT, the Company will recognize increased tax depreciation deductions in the future which are expected to yield cash tax benefits of approximately $5.0 million annually in years one through twenty and approximately $2.0 million annually in years twenty-one through forty beginning with the current year. Due to the uncertainty surrounding whether the REIT will dispose of any of its land assets in the future, the Company cannot estimate when or if the cash tax benefits related to the increased basis in land will be received.
During fiscal 2011, income taxes included the recognition of tax benefits of approximately $201.6 million due to the valuation allowance reversal related to the REIT Transaction, $3.7 million related to federal tax credits, $1.0 million for the increase in the cash surrender value of life insurance policies, $0.6 million due to net decreases in unrecognized tax benefits, interest and penalties, and $0.6 million related to decreases in net deferred tax liabilities resulting from legislatively-enacted state tax rate reductions. These tax benefits were partially offset by the recognition of tax expense of approximately $2.3 million due to increases in net operating loss valuation allowances. Additionally, during fiscal 2011, the IRS concluded its examination of the Company's federal income tax returns for
30
the fiscal tax years 2008 through 2009, and no significant changes occurred in these tax years as a result of such examination. The Company is currently under examination by various state and local taxing jurisdictions for various fiscal years. At this time, the Company does not expect the results from any income tax audit to have a material impact on the Company's financial statements.
Fiscal 2010
During fiscal 2010, income taxes included approximately $1.4 million for an increase in deferred liabilities due to an increase in the state effective tax rate, and included the recognition of tax benefits of approximately $6.1 million for the net decrease in unrecognized tax benefits, interest, and penalties, $2.9 million for the decrease in net operating loss valuation allowances, $0.7 million for the decrease in the capital loss valuation allowance resulting from capital gain income, $1.2 million for the increase in the cash surrender value of life insurance policies, and $2.5 million due to federal tax credits. During fiscal 2010, the IRS completed its examination of the Company's federal income tax returns for the fiscal tax years 2006 and 2007, and no significant changes occurred in these tax years as a result of such examination. During fiscal 2010, the Company reached settlements with federal and state taxing jurisdictions which resulted in reductions in the liability for unrecognized tax benefits.
Fiscal 2009
During fiscal 2009, income taxes included the recognition of tax benefits of approximately $6.3 million for the net decrease in unrecognized tax benefits, interest, and penalties, $1.3 million for a decrease in deferred liabilities due to a decrease in the state effective tax rate, $4.4 million for a decrease in a capital loss valuation allowance resulting from capital gain income, and $2.4 million due to federal tax credits. During fiscal 2009, the Company reached a settlement with a state taxing jurisdiction which resulted in a reduction in unrecognized tax benefits, interest, and penalties.
LIQUIDITY AND CAPITAL RESOURCES
Financial Position Summary
|
(in thousands of dollars)
|
January 28,
2012 |
January 29,
2011 |
Dollar
Change |
Percent
Change |
|||||||||
|---|---|---|---|---|---|---|---|---|---|---|---|---|---|
|
Cash and cash equivalents |
$ | 224,272 | $ | 343,291 | $ | (119,019 | ) | (34.7 | )% | ||||
|
Long-term debt, including current portion |
691,574 | 746,412 | (54,838 | ) | (7.3 | ) | |||||||
|
Subordinated debentures |
200,000 | 200,000 | — | — | |||||||||
|
Stockholders' equity |
2,052,019 | 2,086,720 | (34,701 | ) | (1.7 | ) | |||||||
|
Current ratio |
1.83 |
2.05 |
|||||||||||
|
Debt to capitalization |
30.3 | % | 31.2 | % | |||||||||
The Company's current non-operating priorities for its use of cash are stock repurchases, debt reduction, strategic investments to enhance the value of existing properties and dividend payments to shareholders.
At present, there are numerous general business and economic factors affecting the retail industry. These factors include: (1) consumer confidence; (2) competitive conditions; (3) the recent recession in the U.S. and numerous economies around the globe; (4) high levels of unemployment in various sectors; (5) rising gas prices; and (6) other factors that are both separate from, and outgrowths of, the above. These conditions may impact our comparable store sales which may result in reduced cash flows if we are not appropriately managing our inventory levels or expenses. Further, if one or more of these conditions continue or worsen, we may experience a further adverse effect on our business, financial condition and results of operations, including our ability to access capital.
31
Cash flows for the three fiscal years ended were as follows:
|
|
|
|
|
Percent Change | ||||||||||||
|---|---|---|---|---|---|---|---|---|---|---|---|---|---|---|---|---|
|
(in thousands of dollars)
|
Fiscal 2011 | Fiscal 2010 | Fiscal 2009 | 2011 - 2010 | 2010 - 2009 | |||||||||||
|
Operating Activities |
$ | 501,140 | $ | 512,922 | $ | 554,007 | (2.3 | )% | (7.4 | )% | ||||||
|
Investing Activities |
(83,224 | ) | (89,615 | ) | (63,453 | ) | 7.1 | (41.2 | ) | |||||||
|
Financing Activities |
(536,935 | ) | (421,709 | ) | (245,684 | ) | (27.3 | ) | (71.7 | ) | ||||||
|
Total Cash (Used) Provided |
$ | (119,019 | ) | $ | 1,598 | $ | 244,870 | |||||||||
Operating Activities
The primary source of the Company's liquidity is cash flows from operations. Due to the seasonality of the Company's business, we have historically realized a significant portion of the cash flows from operating activities during the second half of the fiscal year. Retail operations sales are the key operating cash component, providing 96.8% and 96.3% of total revenues in fiscal 2011 and 2010, respectively.
Operating cash inflows also include revenue and reimbursements from the Alliance with GE, which owns and manages the Company's private label credit card business under the Alliance, and cash distributions from joint ventures. Operating cash outflows include payments to vendors for inventory, services and supplies, payments to employees and payments of interest and taxes.
The Alliance provides for certain payments to be made by GE to the Company, including a revenue sharing and marketing reimbursement. The Company received income of approximately $96 million and $85 million from GE in fiscal 2011 and 2010, respectively. While future cash flows under this Alliance are difficult to predict, the Company expects income from the Alliance to improve moderately during fiscal 2012 compared to fiscal 2011. The amount the Company receives is dependent on the level of sales on GE accounts, the level of balances carried on the GE accounts by GE customers, payment rates on GE accounts, finance charge rates and other fees on GE accounts, the level of credit losses for the GE accounts as well as GE's funding costs. The Alliance expires in fiscal 2014.
Net cash flows from operations decreased $11.8 million during fiscal 2011 compared to fiscal 2010. This decrease is primarily attributable to a decrease of $56.4 million related to changes in working capital items, primarily of changes in trade accounts payable and accrued expenses. This decrease was partially offset by higher net income, as adjusted for non-cash items, of $44.6 million for fiscal 2011 compared to fiscal 2010.
Included in net income for fiscal 2011 was a $44.5 million pretax gain ($28.7 million after tax or $0.53 per share), net of settlement related expenses, related to the settlement of a lawsuit with JDA Software Group for $57.0 million.
Included in net income for fiscal 2010 was a $7.5 million pretax gain ($4.8 million after tax or $0.07 per share) on proceeds received for final payment related to hurricane losses.
Investing Activities
Cash inflows from investing activities generally include proceeds from sales of property and equipment. Investment cash outflows generally include payments for capital expenditures such as property and equipment.
Capital expenditures increased $17.5 million for fiscal 2011 compared to fiscal 2010. The fiscal 2011 expenditures of $115.7 million consisted primarily of the remodeling of existing stores and equipment upgrades, including installation of the Company's new internet fulfillment center located in
32
Maumelle, Arkansas which is expected to be fully operational by the end of the first fiscal quarter of 2012.
Store closures during fiscal 2011 were:
|
Closed Locations—Fiscal 2011
|
City | Square Feet | ||||
|---|---|---|---|---|---|---|
|
Highland Mall |
Austin, Texas | 190,000 | ||||
|
Decatur Mall |
Decatur, Alabama | 128,000 | ||||
|
Westminster Mall |
Westminster, Colorado | 159,000 | ||||
|
Virginia Center Commons |
Glenn Allen, Virginia | 96,000 | ||||
|
Total closed square footage |
573,000 | |||||
We have also announced the upcoming closure of our Hutchinson Mall location in Hutchinson, Kansas (70,000 square feet). The store is expected to close during the second quarter of fiscal 2012 with minimal closing costs.
Capital expenditures for fiscal 2012 are expected to be approximately $175 million. These expenditures are primarily for the remodeling of stores, purchase of equipment, including the buyout of certain leased equipment, and completion of the new internet fulfillment center. There are no planned store openings for fiscal 2012.
During fiscal 2011, 2010 and 2009, we received proceeds from the sale of property and equipment of $18.9 million, $17.6 million and $11.6 million, respectively, and recorded related gains of $1.8 million, $5.6 million and $3.2 million, respectively.
During fiscal 2010, the Company invested an additional $9.0 million in its Denver, Colorado mall joint venture. During fiscal 2011, the Company sold its interest in this joint venture for $11.0 million, resulting in a gain of $2.1 million that was recorded in gain on disposal of assets.
During fiscal 2011, the Company received a distribution of excess cash from a mall joint venture of $6.7 million and recorded a related gain of $4.2 million in income on (equity in losses of) joint ventures.
Financing Activities
Our primary source of cash inflows from financing activities is generally our $1.0 billion revolving credit facility. Financing cash outflows generally include the repayment of borrowings under the revolving credit facility, the repayment of mortgage notes or long-term debt, the payment of dividends and the purchase of treasury stock.
Cash used in financing activities increased to $536.9 million in fiscal 2011 from $421.7 million in fiscal 2010. This decrease in cash flow of $115.2 million was primarily due to the purchase of treasury stock and debt payments.
Stock Repurchase. In May 2011, the Company's Board of Directors authorized the Company to repurchase up to $250 million of the Company's Class A Common Stock under an open-ended plan ("May 2011 Stock Plan"). This authorization permits the Company to repurchase its Class A Common Stock in the open market, pursuant to preset trading plans meeting the requirements of Rule 10b5-1 under the Securities Exchange Act of 1934 ("Exchange Act") or through privately negotiated transactions. During fiscal 2011, the Company repurchased 5.0 million shares for $222.5 million at an average price of $44.77 per share. At January 28, 2012, $27.5 million in share repurchase authorization remained under the May 2011 Stock Plan.
In February 2011, the Company's Board of Directors authorized the Company to repurchase up to $250 million of the Company's Class A Common Stock ("February 2011 Stock Plan"). This
33
authorization permitted the Company to repurchase its Class A Common Stock in the open market, pursuant to preset trading plans meeting the requirements of Rule 10b5-1 under the Exchange Act or through privately negotiated transactions. During fiscal 2011, the Company repurchased 6.0 million shares for $250.0 million at an average price of $41.93 per share, which completed the authorization under the February 2011 Stock Plan.
In August 2010, the Company's Board of Directors authorized the Company to repurchase up to $250 million of the Company's Class A Common Stock ("2010 Stock Plan"). During fiscal 2010, the Company repurchased 7.5 million shares for $231.3 million at an average price of $31.04 per share. During fiscal 2011, the Company repurchased 0.4 million shares for $18.7 million at an average price of $42.19 per share, which completed the remaining authorization under the 2010 Stock Plan.
In November 2007, the Company's Board of Directors approved the repurchase of up to $200 million of the Company's Class A Common Stock ("2007 Stock Plan"). Availability under the 2007 Stock Plan at the beginning of fiscal 2009 was $182.6 million. No repurchases were made during fiscal 2009. During fiscal 2010, the Company repurchased 7.2 million shares of stock for approximately $182.6 million at an average price of $25.39 per share, which completed the remaining authorization under the 2007 Stock Plan.
In February 2012, the Company announced that the Board of Directors authorized the repurchase of up to $250 million of the Company's Class A Common Stock under an additional stock plan ("2012 Stock Plan"). This authorization permits the Company to repurchase its Class A Common Stock in the open market, pursuant to preset trading plans meeting the requirements of Rule 10b5-1 under the Exchange Act or through privately negotiated transactions. The 2012 Stock Plan has no expiration date.
Revolving Credit Agreement. At January 28, 2012, the Company maintained a $1.0 billion revolving credit facility ("credit agreement") with JPMorgan Chase Bank ("JPMorgan") as agent for various banks, secured by the inventory of Dillard's, Inc. operating subsidiaries. Borrowings under the credit agreement accrue interest at either JPMorgan's Base Rate minus 0.5% or LIBOR plus 1.0% (1.27% at January 28, 2012) subject to certain availability thresholds as defined in the credit agreement.
Limited to 85% of the inventory of certain Company subsidiaries, availability for borrowings and letter of credit obligations under the credit agreement was $836.5 million at January 28, 2012. No borrowings were outstanding at January 28, 2012. Letters of credit totaling $83.7 million were issued under this credit agreement leaving unutilized availability under the facility of approximately $753 million at January 28, 2012. There are no financial covenant requirements under the credit agreement provided that availability for borrowings and letters of credit exceeds $100 million. The Company pays an annual commitment fee to the banks of 0.25% of the committed amount less outstanding borrowings and letters of credit. The Company had weighted-average borrowings of $72.6 million and $8.7 million during fiscal 2011 and 2010, respectively.
The Company's credit agreement expires December 12, 2012. The Company is currently in the process of amending and extending this credit agreement, which is expected to close during the first quarter of fiscal 2012.
The Company reduced its net level of outstanding debt and capital leases during fiscal 2011 by $56.8 million compared to a reduction of $17.5 million in fiscal 2010. In addition to paying the regularly scheduled maturities of the unsecured notes, term note and mortgage principal during fiscal 2011, the Company repurchased $5.7 million face amount of 6.625% notes with an original maturity on
34
January 15, 2018, resulting in a pretax gain of approximately $0.2 million which was recorded in net interest and debt expense.
The debt and capital lease decline in fiscal 2010 was due to (1) regularly scheduled payments on the Company's term note and mortgage principal, (2) the pay off of $13 million in capital lease obligations for two corporate aircraft and (3) the repurchase of $1.2 million face amount of 7.13% notes with an original maturity on August 1, 2018.
The debt and capital lease decline in fiscal 2009 was primarily due to regular maturities of outstanding notes and scheduled payments of mortgage principal. During fiscal 2009, the Company also repurchased $8.4 million face amount of 9.125% notes with an original maturity on August 1, 2011. This repurchase resulted in a pretax gain of approximately $1.7 million which was recorded in net interest and debt expense.
As of January 28, 2012, maturities of long-term debt over the next five years (starting with year one) are $77 million, $0, $0, $0 and $0.
Subordinated Debentures. As of January 28, 2012, the Company had $200 million outstanding of its 7.5% subordinated debentures due August 1, 2038. All of these subordinated debentures were held by Dillard's Capital Trust I, a 100% owned, unconsolidated finance subsidiary of the Company. The Company has the right to defer the payment of interest on the subordinated debentures at any time for a period not to exceed 20 consecutive quarters; however, the Company has no present intention of exercising this right to defer interest payments.
Fiscal 2012
During fiscal 2012, the Company expects to finance its capital expenditures and its working capital requirements, including required debt repayments and stock repurchases, from cash on hand, cash flows generated from operations and utilization of the credit facility. Peak borrowings under the credit facilities were approximately $298 million during fiscal 2011. Net borrowings (borrowings less cash and cash equivalents) were approximately $202 million at the peak during fiscal 2011. Peak borrowings during fiscal 2012 are expected to be at similar levels as fiscal 2011. Depending on conditions in the capital markets and other factors, the Company will from time to time consider possible financing transactions, the proceeds of which could be used to refinance current indebtedness or for other corporate purposes.
OFF-BALANCE-SHEET ARRANGEMENTS
The Company has not created, and is not party to, any special-purpose or off-balance-sheet entities for the purpose of raising capital, incurring debt or operating the Company's business. The Company does not have any off-balance-sheet arrangements or relationships that are reasonably likely to materially affect the Company's financial condition, changes in financial condition, revenues or expenses, results of operations, liquidity, capital expenditures or the availability of capital resources.
35
CONTRACTUAL OBLIGATIONS AND COMMERCIAL COMMITMENTS
To facilitate an understanding of the Company's contractual obligations and commercial commitments, the following data is provided:
|
(in thousands of dollars)
Contractual Obligations |
Total |
Less than
1 year |
1 - 3 years | 3 - 5 years |
More than
5 years |
|||||||||||
|---|---|---|---|---|---|---|---|---|---|---|---|---|---|---|---|---|
|
Long-term debt |
$ | 691,574 | $ | 76,789 | $ | — | $ | — | $ | 614,785 | ||||||
|
Interest on long-term debt |
525,661 | 49,191 | 89,014 | 89,014 | 298,442 | |||||||||||
|
Subordinated debentures |
200,000 | — | — | — | 200,000 | |||||||||||
|
Interest on subordinated debentures |
404,178 | 15,247 | 29,918 | 29,918 | 329,095 | |||||||||||
|
Capital lease obligations, including interest |
16,050 | 3,191 | 3,916 | 2,856 | 6,087 | |||||||||||
|
Defined benefit plan participant payments |
179,247 | 8,600 | 16,865 | 21,722 | 132,060 | |||||||||||
|
Other liabilities |
251 | 251 | — | — | — | |||||||||||
|
Purchase obligations(1) |
1,274,974 | 1,273,591 | 1,383 | — | — | |||||||||||
|
Operating leases(2) |
99,644 | 29,537 | 28,121 | 22,110 | 19,876 | |||||||||||
|
Total contractual cash obligations(3)(4) |
$ | 3,391,579 | $ | 1,456,397 | $ | 169,217 | $ | 165,620 | $ | 1,600,345 | ||||||
- (1)
-
The
Company's purchase obligations principally consist of purchase orders for merchandise and store construction commitments. Amounts committed under open
purchase orders for merchandise inventory represent $1,197.2 million of the purchase obligations, of which a significant portion are cancelable without penalty prior to a date that precedes the
vendor's scheduled shipment date.
- (2)
-
The
operating leases included in the above table do not include contingent rent based upon sales volume, which represented approximately 9% of minimum lease
obligations in fiscal 2011.
- (3)
-
The
total liability for unrecognized tax benefits is $11.9 million, including tax, penalty, and interest (refer to Note 6 to the consolidated
financial statements). The Company is not able to reasonably estimate the timing of future cash flows and has excluded these liabilities from the table above; however, at this time, the Company
believes the estimated range of the reasonably possible uncertain tax benefit decrease in the next twelve months is between $0.5 million and $2.0 million.
- (4)
- The Company is unable to reasonably estimate the timing of future cash flows of workers' compensation and general liability insurance reserves of $33.1 million, gift card liabilities of $15.3 million and other liabilities of $2.9 million and have excluded these from the table above.
AMOUNT OF COMMITMENT EXPIRATION PER PERIOD
|
(in thousands of dollars)
Other Commercial Commitments |
Total Amounts Committed | Within 1 year | 2 - 3 years | 4 - 5 years |
After
5 years |
|||||||||||
|---|---|---|---|---|---|---|---|---|---|---|---|---|---|---|---|---|
|
$1.0 billion line of credit, none outstanding(1) |
$ | — | $ | — | $ | — | $ | — | $ | — | ||||||
|
Standby letters of credit |
78,249 | 77,399 | 850 | — | — | |||||||||||
|
Import letters of credit |
5,496 | 5,496 | — | — | — | |||||||||||
|
Total commercial commitments |
$ | 83,745 | $ | 82,895 | $ | 850 | $ | — | $ | — | ||||||
- (1)
- Availability under the credit facility is limited to 85% of the inventory of certain Company subsidiaries (approximately $836 million at January 28, 2012). At January 28, 2012, letters of credit totaling $83.7 million were issued under the credit facility.
36
NEW ACCOUNTING PRONOUNCEMENTS
Fair Value Measurements and Disclosure
In May 2011, the Financial Accounting Standards Board ("FASB") issued Accounting Standards Update ("ASU") No. 2011-04, Fair Value Measurement (Topic 820)—Amendments to Achieve Common Fair Value Measurement and Disclosure Requirements in U.S. GAAP and IFRSs . The amendments in this update change the wording used to describe the requirements in U.S. GAAP for measuring fair value and for disclosing information about fair value measurements to ensure consistency between U.S. GAAP and IFRS. This update is effective for interim and annual periods beginning after December 15, 2011 and is to be applied prospectively. The Company does not expect the adoption of ASU No. 2011-04 to have a material impact on the Company's financial statements.
Presentation of Comprehensive Income
In June 2011, the FASB issued ASU No. 2011-05, Comprehensive Income (Topic 220)—Presentation of Comprehensive Income , to make the presentation of items within other comprehensive income ("OCI") more prominent. The new standard will require companies to present items of net income, items of OCI and total comprehensive income in one continuous statement or two separate consecutive statements, and companies will no longer be allowed to present items of OCI in the statement of stockholders' equity. This new update is effective for interim and annual periods beginning after December 15, 2011 and is to be applied retrospectively. The adoption of this new standard may change the order in which certain financial statements are presented and will provide additional detail in those financial statements when applicable, but will not have any other impact on the Company's financial statements.
In December 2011, the FASB issued ASU 2011-12, " Deferral of the Effective Date for Amendments to the Presentation of Reclassifications of Items Out of Accumulated Other Comprehensive Income in ASU 2011-5" which deferred the requirement from the June 2011 guidance that related to the presentation of reclassification adjustments. The amendment will allow the FASB time to redeliberate whether to present on the face of the financial statements the effects of reclassifications out of accumulated other comprehensive income on the components of net income and other comprehensive income for all periods presented.
FORWARD-LOOKING INFORMATION
This report contains certain forward-looking statements. The following are or may constitute forward looking statements within the meaning of the Private Securities Litigation Reform Act of 1995: (a) statements including words such as "may," "will," "could," "believe," "expect," "future," "potential," "anticipate," "intend," "plan," "estimate," "continue," or the negative or other variations thereof; (b) statements regarding matters that are not historical facts; and (c) statements about the Company's future occurrences, plans and objectives, including statements regarding management's expectations and forecasts for fiscal 2012. The Company cautions that forward-looking statements contained in this report are based on estimates, projections, beliefs and assumptions of management and information available to management at the time of such statements and are not guarantees of future performance. The Company disclaims any obligation to update or revise any forward-looking statements based on the occurrence of future events, the receipt of new information, or otherwise. Forward-looking statements of the Company involve risks and uncertainties and are subject to change based on various important factors. Actual future performance, outcomes and results may differ materially from those expressed in forward-looking statements made by the Company and its management as a result of a number of risks, uncertainties and assumptions. Representative examples of those factors include (without limitation) general retail industry conditions and macro-economic conditions; economic and weather conditions for regions in which the Company's stores are located and
37
the effect of these factors on the buying patterns of the Company's customers, including the effect of changes in prices and availability of oil and natural gas; the availability of consumer credit; the impact of competitive pressures in the department store industry and other retail channels including specialty, off-price, discount and Internet retailers; changes in consumer spending patterns, debt levels and their ability to meet credit obligations; changes in legislation, affecting such matters as the cost of employee benefits or credit card income; adequate and stable availability of materials, production facilities and labor from which the Company sources its merchandise at acceptable pricing; changes in operating expenses, including employee wages, commission structures and related benefits; system failures or data security breaches; possible future acquisitions of store properties from other department store operators; the continued availability of financing in amounts and at the terms necessary to support the Company's future business; fluctuations in LIBOR and other base borrowing rates; potential disruption from terrorist activity and the effect on ongoing consumer confidence; epidemic, pandemic or other public health issues; potential disruption of international trade and supply chain efficiencies; world conflict and the possible impact on consumer spending patterns and other economic and demographic changes of similar or dissimilar nature.
The table below provides information about the Company's obligations that are sensitive to changes in interest rates. The table presents maturities of the Company's long-term debt and subordinated debentures along with the related weighted-average interest rates by expected maturity dates.
|
(in thousands of dollars)
Expected Maturity Date (fiscal year) |
2012 | 2013 | 2014 | 2015 | 2016 | Thereafter | Total | Fair Value | |||||||||||||||||
|---|---|---|---|---|---|---|---|---|---|---|---|---|---|---|---|---|---|---|---|---|---|---|---|---|---|
|
Long-term debt |
$ | 76,789 | $ | — | $ | — | $ | — | $ | — | $ | 614,785 | $ | 691,574 | $ | 691,216 | |||||||||
|
Average fixed interest rate |
7.4 | % | — | — | — | — | 7.3 | % | 7.3 | % | |||||||||||||||
|
Subordinated debentures |
$ | — | $ | — | $ | — | $ | — | $ | — | $ | 200,000 | $ | 200,000 | $ | 198,240 | |||||||||
|
Average interest rate |
— | % | — | % | — | % | — | % | — | % | 7.5 | % | 7.5 | % | |||||||||||
The Company is exposed to market risk from changes in the interest rates under its $1.0 billion revolving credit facility. Outstanding balances under this facility bear interest at a variable rate based on JPMorgan's Base Rate minus 0.5% or LIBOR plus 1.0%. The Company had weighted average borrowings of $72.6 million during fiscal 2011. Based on the average amount outstanding during fiscal 2011, a 100 basis point change in interest rates would result in an approximate $0.7 million annual change to interest expense.
The consolidated financial statements of the Company and notes thereto are included in this report beginning on page F-1.
As disclosed in the Company's current report on Form 8-K filed with the SEC on October 12, 2011, the Company changed its independent registered public accountants effective for the fiscal year ended January 28, 2012.
38
Evaluation of Disclosure Controls and Procedures
The Company has established and maintains disclosure controls and procedures (as defined in Rule 13a-15(e) under the Exchange Act). The Company's management, with the participation of our CEO and CFO, has evaluated the effectiveness of the Company's disclosure controls and procedures as of the end of the fiscal year covered by this annual report, and based on that evaluation, the Company's CEO and CFO have concluded that these disclosure controls and procedures were effective.
Management's Report on Internal Control over Financial Reporting
Our management is responsible for establishing and maintaining adequate internal control over financial reporting, as such term is defined in Exchange Act Rule 13a-15(f). Under the supervision and with the participation of our management, including our CEO and CFO, we conducted an evaluation of the effectiveness of our internal control over financial reporting based on the framework in Internal Control—Integrated Framework issued by the Committee of Sponsoring Organizations of the Treadway Commission. Based on our evaluation under the framework in Internal Control—Integrated Framework , our management concluded that our internal control over financial reporting was effective as of January 28, 2012.
Our independent registered public accounting firm, KPMG LLP ("KPMG"), has audited our Consolidated Financial Statements included in this Annual Report on Form 10-K and has issued a report on the effectiveness of our internal control over financial reporting as of January 28, 2012. Please refer to KPMG's "Report of Independent Registered Public Accounting Firm" on page F-2 of this Annual Report on Form 10-K, which is incorporated herein by reference.
Changes in Internal Controls
There were no changes in our internal control over financial reporting that occurred during the fiscal quarter ended January 28, 2012 that have materially affected, or are reasonably likely to materially affect, our internal control over financial reporting.
None.
39
- A.
- Directors of the Registrant
The information called for by this item regarding directors of the Registrant is incorporated herein by reference from the information under the headings "Election of Directors", "Audit Committee Report", "Information Regarding the Board and Its Committees" and "Section 16(a) Beneficial Ownership Reporting Compliance" in the Proxy Statement.
- B.
- Executive Officers of the Registrant
Information regarding executive officers of the Registrant is included in Part I of this report under the heading "Executive Officers of the Registrant." Reference additionally is made to the information under the heading "Section 16(a) Beneficial Ownership Reporting Compliance" in the Proxy Statement, which information is incorporated herein by reference.
The Company's Board of Directors ("Board") has adopted a Code of Conduct that applies to all Company employees, including the Company's executive officers, and, when appropriate, the members of the Board. As stated in the Code of Conduct, there are certain limited situations in which the Company may waive application of the Code of Conduct to employees or members of the Board. For example, since non-employee members of the Board rarely, if ever, deal financially with vendors and other suppliers of the Company on the Company's behalf, it may not be appropriate to seek to apply the Code of Conduct to their dealings with these vendors and suppliers on behalf of other organizations which have no relationship to the Company. To the extent that any such waiver applies to an executive officer or a member of the Board, the waiver requires the express approval of the Board, and the Company will promptly disclose to its shareholders that a waiver has been granted. The current version of the Code of Conduct is available free of charge on the Company's website, www.dillards.com, and is available in print to any shareholder who requests copies by contacting Julie J. Bull, Director of Investor Relations, at the Company's principal executive offices set forth above.
The information called for by this item is incorporated herein by reference from the information under the headings "2011 Director Compensation", "Compensation Discussion and Analysis", "Compensation Committee Report" and "Executive Compensation" in the Proxy Statement.
40
Equity Compensation Plan Information
|
|
Number of securities to be
issued upon exercise of outstanding options |
Weighted average
exercise prices of outstanding options |
Number of securities
available for future issuance under equity compensation plans(2) |
|||||||
|---|---|---|---|---|---|---|---|---|---|---|
|
Equity compensation plans approved by shareholders(1) |
2,245,000 | $ | 25.74 | 7,547,451 | ||||||
|
Total |
2,245,000 | $ | 25.74 | 7,547,451 | ||||||
- (1)
-
Included
in this category are the following equity compensation plans, which have been approved by the Company's
shareholders:
- •
-
1998 Incentive and Nonqualified Stock Option Plan
- •
- 2000 Incentive and Nonqualified Stock Option Plan
There are no non-shareholder approved plans. Balances presented in the table above are as of January 28, 2012.
- (2)
- This column excludes shares reflected under the column "Number of securities to be issued upon exercise of outstanding options".
Additional information called for by this item is incorporated herein by reference from the information under the headings "Principal Holders of Voting Securities" and "Security Ownership of Management" in the Proxy Statement.
The information called for by this item is incorporated herein by reference from the information under the headings "Certain Relationships and Transactions" and "Information Regarding the Board and its Committees" in the Proxy Statement.
The information called for by this item is incorporated herein by reference from the information under the heading "Independent Accountant Fees" in the Proxy Statement.
41
(a)(1) and (2) Financial Statements
An "Index of Financial Statements" has been filed as a part of this Report beginning on page F-1 hereof.
(a)(3) Exhibits and Management Compensatory Plans
An "Exhibit Index" has been filed as a part of this Report beginning on page E-1 hereof and is incorporated herein by reference.
42
Pursuant to the requirements of Section 13 or 15(d) of the Securities Exchange Act of 1934, the Registrant has duly caused this report to be signed on its behalf by the undersigned, thereunto duly authorized.
|
Dillard's, Inc.
Registrant |
||
|
|
|
/s/ JAMES I. FREEMAN James I. Freeman, Senior Vice President and Chief Financial Officer |
Date: March 22, 2012
Pursuant to the requirements of the Securities Exchange Act of 1934, this report has been signed below by the following persons on behalf of the Registrant and in the capacities and on the date indicated.
|
/s/ WILLIAM DILLARD, II
William Dillard, II Chairman of the Board and Chief Executive Officer (Principal Executive Officer) |
/s/ JAMES I. FREEMAN
James I. Freeman Senior Vice President and Chief Financial Officer and Director (Principal Financial and Accounting Officer) |
|
|
/s/ ALEX DILLARD Alex Dillard President and Director |
|
/s/ DRUE MATHENY Drue Matheny Executive Vice President and Director |
|
/s/ MIKE DILLARD Mike Dillard Executive Vice President and Director |
|
/s/ ROBERT C. CONNOR Robert C. Connor Director |
|
/s/ H. LEE HASTINGS H. Lee Hastings Director |
|
/s/ R. BRAD MARTIN R. Brad Martin Director |
|
/s/ FRANK R. MORI Frank R. Mori Director |
|
/s/ WARREN A. STEPHENS Warren A. Stephens Director |
|
/s/ J. C. WATTS, JR. J. C. Watts, Jr. Director |
|
/s/ NICK WHITE Nick White Director |
Date: March 22, 2012
43
INDEX OF FINANCIAL STATEMENTS
DILLARD'S, INC. AND SUBSIDIARIES
Year Ended January 28, 2012
F-1
REPORT OF INDEPENDENT REGISTERED PUBLIC ACCOUNTING FIRM
The
Board of Directors and Stockholders
Dillard's, Inc.:
We have audited Dillard's, Inc.'s (the Company) internal control over financial reporting as of January 28, 2012, based on criteria established in Internal Control—Integrated Framework issued by the Committee of Sponsoring Organizations of the Treadway Commission (COSO). The Company's management is responsible for maintaining effective internal control over financial reporting and for its assessment of the effectiveness of internal control over financial reporting, included in the accompanying Management's Annual Report on Internal Control over Financial Reporting. Our responsibility is to express an opinion on the Company's internal control over financial reporting based on our audit.
We conducted our audit in accordance with the standards of the Public Company Accounting Oversight Board (United States). Those standards require that we plan and perform the audit to obtain reasonable assurance about whether effective internal control over financial reporting was maintained in all material respects. Our audit included obtaining an understanding of internal control over financial reporting, assessing the risk that a material weakness exists, and testing and evaluating the design and operating effectiveness of internal control based on the assessed risk. Our audit also included performing such other procedures as we considered necessary in the circumstances. We believe that our audit provides a reasonable basis for our opinion.
A company's internal control over financial reporting is a process designed to provide reasonable assurance regarding the reliability of financial reporting and the preparation of financial statements for external purposes in accordance with generally accepted accounting principles. A company's internal control over financial reporting includes those policies and procedures that (1) pertain to the maintenance of records that, in reasonable detail, accurately and fairly reflect the transactions and dispositions of the assets of the company; (2) provide reasonable assurance that transactions are recorded as necessary to permit preparation of financial statements in accordance with generally accepted accounting principles, and that receipts and expenditures of the company are being made only in accordance with authorizations of management and directors of the company; and (3) provide reasonable assurance regarding prevention or timely detection of unauthorized acquisition, use, or disposition of the company's assets that could have a material effect on the financial statements.
Because of its inherent limitations, internal control over financial reporting may not prevent or detect misstatements. Also, projections of any evaluation of effectiveness to future periods are subject to the risk that controls may become inadequate because of changes in conditions, or that the degree of compliance with the policies or procedures may deteriorate.
In our opinion, Dillard's, Inc. maintained, in all material respects, effective internal control over financial reporting as of January 28, 2012, based on criteria established in Internal Control—Integrated Framework issued by the Committee of Sponsoring Organizations of the Treadway Commission.
We also have audited, in accordance with the standards of the Public Company Accounting Oversight Board (United States), the consolidated balance sheet of Dillard's, Inc. and subsidiaries as of January 28, 2012, the related consolidated statements of income, stockholders' equity and comprehensive income, and cash flows for the fiscal year then ended, and our report dated March 21, 2012 expressed an unqualified opinion on those consolidated financial statements.
/s/ KPMG LLP
Dallas,
Texas
March 21, 2012
F-2
REPORT OF INDEPENDENT REGISTERED PUBLIC ACCOUNTING FIRM
The
Board of Directors and Stockholders
Dillard's, Inc.:
We have audited the accompanying consolidated balance sheet of Dillard's, Inc. and subsidiaries (the Company) as of January 28, 2012, and the related consolidated statements of income, stockholders' equity and comprehensive income, and cash flows for the fiscal year then ended. These consolidated financial statements are the responsibility of the Company's management. Our responsibility is to express an opinion on these consolidated financial statements based on our audit.
We conducted our audit in accordance with the standards of the Public Company Accounting Oversight Board (United States). Those standards require that we plan and perform the audit to obtain reasonable assurance about whether the financial statements are free of material misstatement. An audit includes examining, on a test basis, evidence supporting the amounts and disclosures in the financial statements. An audit also includes assessing the accounting principles used and significant estimates made by management, as well as evaluating the overall financial statement presentation. We believe that our audit provides a reasonable basis for our opinion.
In our opinion, the consolidated financial statements referred to above present fairly, in all material respects, the financial position of Dillard's, Inc. and subsidiaries as of January 28, 2012, and the results of their operations and their cash flows for the fiscal year then ended, in conformity with U.S. generally accepted accounting principles.
We also have audited, in accordance with the standards of the Public Company Accounting Oversight Board (United States), the Company's internal control over financial reporting as of January 28, 2012, based on criteria established in Internal Control—Integrated Framework issued by the Committee of Sponsoring Organizations of the Treadway Commission (COSO), and our report dated March 21, 2012 expressed an unqualified opinion on the effectiveness of the Company's internal control over financial reporting.
/s/ KPMG LLP
Dallas,
Texas
March 21, 2012
F-3
REPORT OF INDEPENDENT REGISTERED PUBLIC ACCOUNTING FIRM
To The Board of Directors and Stockholders of Dillard's, Inc.:
In our opinion, the consolidated balance sheet as of January 29, 2011 and the related consolidated statements of income, stockholder's equity and comprehensive income and cash flows for each of the two years in the period ended January 29, 2011 present fairly, in all material respects, the financial position of Dillard's, Inc. and its subsidiaries at January 29, 2011, and the results of their operations and their cash flows for each of the two years in the period ended January 29, 2011, in conformity with accounting principles generally accepted in the United States of America. These financial statements are the responsibility of the Company's management. Our responsibility is to express an opinion on these financial statements based on our audits. We conducted our audits of these statements in accordance with the standards of the Public Company Accounting Oversight Board (United States). Those standards require that we plan and perform the audit to obtain reasonable assurance about whether the financial statements are free of material misstatement. An audit includes examining, on a test basis, evidence supporting the amounts and disclosures in the financial statements, assessing the accounting principles used and significant estimates made by management, and evaluating the overall financial statement presentation. We believe that our audits provide a reasonable basis for our opinion.
/s/ PricewaterhouseCoopers LLP
Dallas,
Texas
March 23, 2011
F-4
Consolidated Balance Sheets
Dollars in Thousands
|
|
January 28, 2012 | January 29, 2011 | |||||
|---|---|---|---|---|---|---|---|
|
Assets |
|||||||
|
Current assets: |
|||||||
|
Cash and cash equivalents |
$ | 224,272 | $ | 343,291 | |||
|
Accounts receivable |
28,708 | 25,950 | |||||
|
Merchandise inventories |
1,304,124 | 1,290,147 | |||||
|
Other current assets |
34,625 | 42,538 | |||||
|
Total current assets |
1,591,729 | 1,701,926 | |||||
|
Property and equipment: |
|||||||
|
Land and land improvements |
69,088 | 73,844 | |||||
|
Buildings and leasehold improvements |
3,091,063 | 3,110,053 | |||||
|
Furniture, fixtures and equipment |
1,468,010 | 1,599,948 | |||||
|
Buildings under construction |
29,193 | 4,747 | |||||
|
Buildings and equipment under capital leases |
18,522 | 18,522 | |||||
|
Less accumulated depreciation and amortization |
(2,235,610 | ) | (2,211,600 | ) | |||
|
|
2,440,266 | 2,595,514 | |||||
|
Other assets |
274,142 | 76,726 | |||||
|
Total assets |
$ | 4,306,137 | $ | 4,374,166 | |||
|
Liabilities and stockholders' equity |
|||||||
|
Current liabilities: |
|||||||
|
Trade accounts payable and accrued expenses |
$ | 655,653 | $ | 689,281 | |||
|
Current portion of long-term debt |
76,789 | 49,166 | |||||
|
Current portion of capital lease obligations |
2,312 | 2,184 | |||||
|
Federal and state income taxes including current deferred taxes |
135,610 | 90,581 | |||||
|
Total current liabilities |
870,364 | 831,212 | |||||
|
Long-term debt |
614,785 | 697,246 | |||||
|
Capital lease obligations |
9,153 | 11,383 | |||||
|
Other liabilities |
245,218 | 205,916 | |||||
|
Deferred income taxes |
314,598 | 341,689 | |||||
|
Subordinated debentures |
200,000 | 200,000 | |||||
|
Commitments and Contingencies |
|||||||
|
Stockholders' equity: |
|||||||
|
Common stock, Class A—118,529,925 and 117,706,523 shares issued; 45,430,606 and 55,966,084 shares outstanding |
1,185 | 1,177 | |||||
|
Common stock, Class B (convertible)—4,010,929 shares issued and outstanding |
40 | 40 | |||||
|
Additional paid-in capital |
828,796 | 805,422 | |||||
|
Accumulated other comprehensive loss |
(39,034 | ) | (17,830 | ) | |||
|
Retained earnings |
3,107,344 | 2,653,437 | |||||
|
Less treasury stock, at cost, Class A—73,099,319 and 61,740,439 shares |
(1,846,312 | ) | (1,355,526 | ) | |||
|
Total stockholders' equity |
2,052,019 | 2,086,720 | |||||
|
Total liabilities and stockholders' equity |
$ | 4,306,137 | $ | 4,374,166 | |||
See notes to consolidated financial statements.
F-5
Consolidated Statements of Income
Dollars in Thousands, Except Per Share Data
|
|
Years Ended | |||||||||
|---|---|---|---|---|---|---|---|---|---|---|
|
|
January 28, 2012 | January 29, 2011 | January 30, 2010 | |||||||
|
Net sales |
$ | 6,263,600 | $ | 6,120,961 | $ | 6,094,948 | ||||
|
Service charges and other income |
136,165 | 132,574 | 131,680 | |||||||
|
|
6,399,765 | 6,253,535 | 6,226,628 | |||||||
|
Cost of sales |
4,041,550 | 3,976,063 | 4,102,892 | |||||||
|
Advertising, selling, administrative and general expenses |
1,630,907 | 1,625,793 | 1,644,091 | |||||||
|
Depreciation and amortization |
257,685 | 261,550 | 262,877 | |||||||
|
Rentals |
48,110 | 51,045 | 58,363 | |||||||
|
Interest and debt expense, net |
72,059 | 73,792 | 74,003 | |||||||
|
Gain on litigation settlement |
(44,460 | ) | — | — | ||||||
|
Gain on disposal of assets |
(3,955 | ) | (5,632 | ) | (3,207 | ) | ||||
|
Asset impairment and store closing charges |
1,200 | 2,208 | 3,084 | |||||||
|
Income before income taxes and income on (equity in losses of) joint ventures |
396,669 | 268,716 | 84,525 | |||||||
|
Income taxes (benefit) |
(62,518 | ) | 84,450 | 12,690 | ||||||
|
Income on (equity in losses of) joint ventures |
4,722 | (4,646 | ) | (3,304 | ) | |||||
|
Net income |
$ | 463,909 | $ | 179,620 | $ | 68,531 | ||||
|
Earnings per common share: |
||||||||||
|
Basic |
$ | 8.67 | $ | 2.68 | $ | 0.93 | ||||
|
Diluted |
8.52 | 2.67 | 0.93 | |||||||
See notes to consolidated financial statements.
F-6
Consolidated Statements of Stockholders' Equity and Comprehensive Income
Dollars in Thousands, Except Per Share Data
|
|
Common Stock |
|
Accumulated
Other Comprehensive Loss |
|
|
|
||||||||||||||||
|---|---|---|---|---|---|---|---|---|---|---|---|---|---|---|---|---|---|---|---|---|---|---|
|
|
Additional
Paid-in Capital |
Retained
Earnings |
Treasury
Stock |
|
||||||||||||||||||
|
|
Class A | Class B | Total | |||||||||||||||||||
|
Balance, January 31, 2009 |
$ | 1,166 | $ | 40 | $ | 781,055 | $ | (16,872 | ) | $ | 2,427,727 | $ | (942,001 | ) | $ | 2,251,115 | ||||||
|
Net income |
— | — | — | — | 68,531 | — | 68,531 | |||||||||||||||
|
Amortization of retirement plan and other retiree benefit adjustments, net of tax of $3,132 |
— | — | — | (5,426 | ) | — | — | (5,426 | ) | |||||||||||||
|
Total comprehensive income |
63,105 | |||||||||||||||||||||
|
Issuance of 377,461 shares under stock bonus plans |
3 | — | 1,691 | — | — | — | 1,694 | |||||||||||||||
|
Cash dividends declared: |
||||||||||||||||||||||
|
Common stock, $0.16 per share |
— | — | — | — | (11,811 | ) | — | (11,811 | ) | |||||||||||||
|
Balance, January 30, 2010 |
1,169 | 40 | 782,746 | (22,298 | ) | 2,484,447 | (942,001 | ) | 2,304,103 | |||||||||||||
|
Net income |
— | — | — | — | 179,620 | — | 179,620 | |||||||||||||||
|
Amortization of retirement plan and other retiree benefit adjustments, net of tax of $2,579 |
— | — | — | 4,468 | — | — | 4,468 | |||||||||||||||
|
Total comprehensive income |
184,088 | |||||||||||||||||||||
|
Issuance of 786,768 shares under stock option and stock bonus plans |
8 | — | 22,676 | — | — | 364 | 23,048 | |||||||||||||||
|
Purchase of 14,641,705 shares of treasury stock |
— | — | — | — | — | (413,889 | ) | (413,889 | ) | |||||||||||||
|
Cash dividends declared: |
||||||||||||||||||||||
|
Common stock, $0.16 per share |
— | — | — | — | (10,630 | ) | — | (10,630 | ) | |||||||||||||
|
Balance, January 29, 2011 |
1,177 | 40 | 805,422 | (17,830 | ) | 2,653,437 | (1,355,526 | ) | 2,086,720 | |||||||||||||
|
Net income |
— | — | — | — | 463,909 | — | 463,909 | |||||||||||||||
|
Amortization of retirement plan and other retiree benefit adjustments, net of tax of $11,903 |
— | — | — | (21,204 | ) | — | — | (21,204 | ) | |||||||||||||
|
Total comprehensive income |
442,705 | |||||||||||||||||||||
|
Issuance of 839,374 shares under stock option and stock bonus plans |
8 | — | 23,374 | — | — | 371 | 23,753 | |||||||||||||||
|
Purchase of 11,374,852 shares of treasury stock |
— | — | — | — | — | (491,157 | ) | (491,157 | ) | |||||||||||||
|
Cash dividends declared: |
||||||||||||||||||||||
|
Common stock, $0.19 per share |
— | — | — | — | (10,002 | ) | — | (10,002 | ) | |||||||||||||
|
Balance, January 28, 2012 |
$ | 1,185 | $ | 40 | $ | 828,796 | $ | (39,034 | ) | $ | 3,107,344 | $ | (1,846,312 | ) | $ | 2,052,019 | ||||||
See notes to consolidated financial statements.
F-7
Consolidated Statements of Cash Flows
Dollars in Thousands
|
|
Years Ended | |||||||||
|---|---|---|---|---|---|---|---|---|---|---|
|
|
January 28, 2012 | January 29, 2011 | January 30, 2010 | |||||||
|
Operating activities: |
||||||||||
|
Net income |
$ | 463,909 | $ | 179,620 | $ | 68,531 | ||||
|
Adjustments to reconcile net income to net cash provided by operating activities: |
||||||||||
|
Depreciation and amortization of property and deferred financing cost |
259,467 | 263,395 | 264,763 | |||||||
|
Deferred income taxes |
(9,494 | ) | 18,439 | (35,350 | ) | |||||
|
Gain on disposal of assets |
(3,955 | ) | (5,632 | ) | (3,207 | ) | ||||
|
Asset impairment and store closing charges |
1,200 | 2,208 | 3,084 | |||||||
|
Excess tax benefits from share-based compensation |
(10,171 | ) | (3,446 | ) | — | |||||
|
Gain on repurchase of debt |
(173 | ) | (21 | ) | (1,653 | ) | ||||
|
Changes in operating assets and liabilities: |
||||||||||
|
(Increase) decrease in accounts receivable |
(2,758 | ) | 37,272 | 24,776 | ||||||
|
(Increase) decrease in merchandise inventories |
(13,977 | ) | 10,533 | 73,714 | ||||||
|
Decrease in federal income tax receivable |
— | 217 | 74,198 | |||||||
|
Decrease in other current assets |
7,913 | 626 | 9,408 | |||||||
|
(Increase) decrease in other assets |
(210,443 | ) | 6,536 | 8,224 | ||||||
|
(Decrease) increase in trade accounts payable and accrued expenses and other liabilities |
(17,981 | ) | 24,647 | 15,254 | ||||||
|
Increase (decrease) in income taxes payable |
37,603 | (21,472 | ) | 52,265 | ||||||
|
Net cash provided by operating activities |
501,140 | 512,922 | 554,007 | |||||||
|
Investing activities: |
||||||||||
|
Purchase of property and equipment |
(115,651 | ) | (98,184 | ) | (75,089 | ) | ||||
|
Proceeds from disposal of assets |
29,946 | 17,569 | 11,636 | |||||||
|
Distribution from joint venture |
2,481 | — | — | |||||||
|
Investment in joint venture |
— | (9,000 | ) | — | ||||||
|
Net cash used in investing activities |
(83,224 | ) | (89,615 | ) | (63,453 | ) | ||||
|
Financing activities: |
||||||||||
|
Principal payments on long-term debt and capital lease obligations |
(56,767 | ) | (17,466 | ) | (33,888 | ) | ||||
|
Cash dividends paid |
(10,002 | ) | (11,110 | ) | (11,796 | ) | ||||
|
Purchase of treasury stock |
(491,157 | ) | (413,889 | ) | — | |||||
|
Proceeds from issuance of common stock |
10,820 | 17,310 | — | |||||||
|
Excess tax benefits from share-based compensation |
10,171 | 3,446 | — | |||||||
|
Decrease in short-term borrowings |
— | — | (200,000 | ) | ||||||
|
Net cash used in financing activities |
(536,935 | ) | (421,709 | ) | (245,684 | ) | ||||
|
(Decrease) increase in cash and cash equivalents |
(119,019 | ) | 1,598 | 244,870 | ||||||
|
Cash and cash equivalents, beginning of year |
343,291 | 341,693 | 96,823 | |||||||
|
Cash and cash equivalents, end of year |
$ | 224,272 | $ | 343,291 | $ | 341,693 | ||||
|
Non-cash transactions: |
||||||||||
|
Accrued capital expenditures |
$ | 7,089 | $ | 1,553 | $ | 6,592 | ||||
|
Stock awards |
2,762 | 2,292 | 1,694 | |||||||
|
Capital lease transactions |
— | 3,966 | — | |||||||
See notes to consolidated financial statements.
F-8
Notes to Consolidated Financial Statements
1. Description of Business and Summary of Significant Accounting Policies
Description of Business —Dillard's, Inc. ("Dillard's" or the "Company") operates retail department stores, located primarily in the Southeastern, Southwestern and Midwestern areas of the United States, and a general contracting construction company based in Little Rock, Arkansas. The Company's fiscal year ends on the Saturday nearest January 31 of each year. Fiscal years 2011, 2010 and 2009 ended on January 28, 2012, January 29, 2011 and January 30, 2010, respectively. Fiscal years 2011, 2010 and 2009 included 52 weeks.
Consolidation —The accompanying consolidated financial statements include the accounts of Dillard's, Inc. and its wholly owned subsidiaries. Intercompany accounts and transactions are eliminated in consolidation. Investments in and advances to joint ventures are accounted for by the equity method where the Company does not have control.
Use of Estimates —The preparation of financial statements in conformity with accounting principles generally accepted in the United States of America requires management to make estimates and assumptions that affect the reported amounts of assets and liabilities and disclosure of contingent assets and liabilities at the date of the financial statements and the reported amounts of revenues and expenses during the reporting period. Significant estimates include inventories, sales return, self-insured accruals, future cash flows for impairment analysis, pension discount rate and taxes. Actual results could differ from those estimates.
Seasonality —The Company's business is highly seasonal, and historically the Company has realized a significant portion of its sales, net income and cash flow in the second half of the fiscal year, attributable to the impact of the back-to-school selling season in the third quarter and the holiday selling season in the fourth quarter. Additionally, working capital requirements fluctuate during the year, increasing in the third quarter in anticipation of the holiday season.
Cash Equivalents —The Company considers all highly liquid investments with an original maturity of three months or less when purchased or which can be redeemed by forfeiting three months of earned interest to be cash equivalents. The Company considers receivables from charge card companies as cash equivalents because they settle the balances within two to three days.
Accounts Receivable —Accounts receivable primarily consists of construction receivables of CDI and the monthly settlement with GE for Dillard's share of revenue from the long-term marketing and servicing alliance. Construction receivables are based on amounts billed to customers. The Company provides any allowance for doubtful accounts considered necessary based upon a review of outstanding receivables, historical collection information and existing economic conditions. Accounts receivable are ordinarily due 30 days after the issuance of the invoice. Contract retentions are due 30 days after completion of the project and acceptance by the owner. Accounts that are past due more than 120 days are considered delinquent. Delinquent receivables are written off based on individual credit evaluation and specific circumstances of the customer.
Merchandise Inventories —Approximately 97% of the inventories are valued at the lower of cost or market using the last-in, first-out retail inventory method ("LIFO RIM"). Under LIFO RIM, the valuation of inventories at cost and the resulting gross margins are calculated by applying a calculated cost to retail ratio to the retail value of inventories. LIFO RIM is an averaging method that is widely used in the retail industry due to its practicality. Inherent in the LIFO RIM calculation are certain significant management judgments including, among others, merchandise markon, markups, and markdowns, which significantly impact the ending inventory valuation at cost as well as the resulting
F-9
Notes to Consolidated Financial Statements (Continued)
1. Description of Business and Summary of Significant Accounting Policies (Continued)
gross margins. During periods of deflation, current replacement cost could result in inventory values on the first-in, first-out ("FIFO") retail inventory method being lower than the LIFO method. At January 28, 2012 and January 29, 2011, the LIFO method, after a lower of cost or market adjustment, approximated the cost of inventories using the FIFO method. The application of LIFO did not impact cost of sales during fiscal 2011, 2010 or 2009. The remaining 3% of the inventories are valued at the lower of cost or market using the average cost or specific identified cost methods.
The Company regularly records a provision for estimated shrinkage, thereby reducing the carrying value of merchandise inventory. Complete physical inventories of all of the Company's stores and warehouses are performed no less frequently than annually, with the recorded amount of merchandise inventory being adjusted to coincide with these physical counts.
Property and Equipment —Property and equipment owned by the Company is stated at cost, which includes related interest costs incurred during periods of construction, less accumulated depreciation and amortization. Interest capitalized during fiscal 2011 and 2010 was immaterial. Capitalized interest was $1.5 million in fiscal 2009. For financial reporting purposes, depreciation is computed by the straight-line method over estimated useful lives:
|
Buildings and leasehold improvements |
20 - 40 years | |||
|
Furniture, fixtures and equipment |
3 - 10 years |
Properties leased by the Company under lease agreements which are determined to be capital leases are stated at an amount equal to the present value of the minimum lease payments during the lease term, less accumulated amortization. The properties under capital leases and leasehold improvements under operating leases are amortized on the straight-line method over the shorter of their useful lives or the related lease terms. The provision for amortization of leased properties is included in depreciation and amortization expense.
Included in property and equipment as of January 28, 2012 are assets held for sale in the amount of $17.3 million. During fiscal 2011, 2010 and 2009, the Company realized gains on the disposal of property and equipment of $1.8 million, $5.6 million and $3.2 million, respectively.
Depreciation expense on property and equipment was $258 million, $262 million and $263 million for fiscal 2011, 2010 and 2009, respectively.
Long-Lived Assets —Impairment losses are required to be recorded on long-lived assets used in operations when indicators of impairment are present and the undiscounted cash flows estimated to be generated by those assets are less than the assets' carrying amount. In the evaluation of the fair value and future benefits of long-lived assets, the Company performs an analysis of the anticipated undiscounted future net cash flows of the related long-lived assets. This analysis is performed at the store unit level. If the carrying value of the related asset exceeds the undiscounted cash flows, the carrying value is reduced to its fair value. Various factors including future sales growth and profit margins are included in this analysis. Management believes at this time that the carrying value and useful lives continue to be appropriate, after recognizing the impairment charges recorded in fiscal 2011, 2010 and 2009, as disclosed in Note 13.
Other Assets —Other assets include investments in joint ventures accounted for by the equity method. The carrying values of these investments were approximately $5.2 million and $18 million at January 28, 2012 and January 29, 2011, respectively. These joint ventures originally consisted of two
F-10
Notes to Consolidated Financial Statements (Continued)
1. Description of Business and Summary of Significant Accounting Policies (Continued)
shopping malls located in Denver, Colorado and Bonita Springs, Florida and one property located in Toledo, Ohio. During fiscal 2011, the Company sold its interest in the Denver, Colorado mall joint venture for $11.0 million, resulting in a gain of $2.1 million that was recorded in gain on disposal of assets.
During fiscal 2011, the Company received a distribution of excess cash from a mall joint venture of $6.7 million and recorded a related gain of $4.2 million in income on (equity in losses of) joint ventures.
At January 28, 2012, other assets also included the deferred charge related to the REIT Transaction of $207.2 million.
Vendor Allowances —The Company receives concessions from its vendors through a variety of programs and arrangements, including cooperative advertising and margin maintenance programs. The Company has agreements in place with each vendor setting forth the specific conditions for each allowance or payment. These agreements range in periods from a few days to up to a year. If the payment is a reimbursement for costs incurred, it is offset against those related costs; otherwise, it is treated as a reduction to the cost of the merchandise. Amounts of vendor concessions are recorded only when an agreement has been reached with the vendor and the collection of the concession is deemed probable.
For cooperative advertising programs, the Company generally offsets the allowances against the related advertising expense when incurred. Many of these programs require proof-of-advertising to be provided to the vendor to support the reimbursement of the incurred cost. Programs that do not require proof-of-advertising are monitored to ensure that the allowance provided by each vendor is a reimbursement of costs incurred to advertise for that particular vendor. If the allowance exceeds the advertising costs incurred on a vendor-specific basis, then the excess allowance from the vendor is recorded as a reduction of merchandise cost for that vendor.
Margin maintenance allowances are credited directly to cost of purchased merchandise in the period earned according to the agreement with the vendor. Under the retail method of accounting for inventory, a portion of these allowances reduces cost of goods sold and a portion reduces the carrying value of merchandise inventory.
Insurance Accruals —The Company's consolidated balance sheets include liabilities with respect to self-insured workers' compensation and general liability claims. The Company's self-insured retention is insured through a wholly-owned captive insurance subsidiary. The Company estimates the required liability of such claims, utilizing an actuarial method, based upon various assumptions, which include, but are not limited to, the Company's historical loss experience, projected loss development factors, actual payroll and other data. The required liability is also subject to adjustment in the future based upon the changes in claims experience, including changes in the number of incidents (frequency) and changes in the ultimate cost per incident (severity). These insurance accruals are recorded in trade accounts payable and accrued expenses and other liabilities on the consolidated balance sheets.
Operating Leases —The Company leases retail stores, office space and equipment under operating leases. Many store leases contain construction allowance reimbursements by landlords, rent holidays, rent escalation clauses and/or contingent rent provisions. The Company recognizes the related rental expense on a straight-line basis over the lease term and records the difference between the amounts charged to expense and the rent paid as a deferred rent liability.
F-11
Notes to Consolidated Financial Statements (Continued)
1. Description of Business and Summary of Significant Accounting Policies (Continued)
To account for construction allowance reimbursements from landlords and rent holidays, the Company records a deferred rent liability in trade accounts payable and accrued expenses and other liabilities on the consolidated balance sheets and amortizes the deferred rent over the lease term, as a reduction to rent expense on the consolidated income statements. For leases containing rent escalation clauses, the Company records minimum rent expense on a straight-line basis over the lease term on the consolidated income statement. The lease term used for lease evaluation includes renewal option periods only in instances in which the exercise of the option period can be reasonably assured and failure to exercise such options would result in an economic penalty.
Revenue Recognition —The Company's retail operations segment recognizes merchandise revenue at the "point of sale." Allowance for sales returns are recorded as a component of net sales in the period in which the related sales are recorded. Sales taxes collected from customers are excluded from revenue and are recorded in trade accounts payable and accrued expenses until remitted to the taxing authorities.
GE owns and manages Dillard's branded proprietary cards under the Alliance that expires in fiscal 2014. The Company's share of income earned under the Alliance is included as a component of service charges and other income. The Company received income of approximately $96 million, $85 million and $89 million from GE in fiscal 2011, 2010 and 2009, respectively. Further pursuant to this Alliance, the Company has no continuing involvement other than to honor the proprietary cards in its stores. Although not obligated to a specific level of marketing commitment, the Company participates in the marketing of the proprietary cards and accepts payments on the proprietary cards in its stores as a convenience to customers who prefer to pay in person rather than by mailing their payments to GE. Amounts received for providing these services are included in the amounts disclosed above.
Revenue from CDI construction contracts is generally recognized by applying percentages of completion for each period to the total estimated revenue for the respective contracts. The length of each contract varies but is typically nine to eighteen months. The percentages of completion are determined by relating the actual costs of work performed to date to the current estimated total costs of the respective contracts. Any anticipated losses on completed contracts are recognized as soon as they are determined.
Gift Card Revenue Recognition —The Company establishes a liability upon the sale of a gift card. The liability is relieved and revenue is recognized when gift cards are redeemed for merchandise. Gift card breakage income is determined based upon historical redemption patterns. The Company uses a homogeneous pool to recognize gift card breakage and will recognize income over the period when the likelihood of the gift card being redeemed is remote and the Company determines that it does not have a legal obligation to remit the value of unredeemed gift cards to the relevant jurisdiction as abandoned property. At that time, the Company will recognize breakage income over the performance period for those gift cards (i.e. 60 months) as a reduction of cost of sales. As of January 28, 2012 and January 29, 2011, gift card liabilities of $57.5 million and $57.4 million, respectively, were included in trade accounts payable and accrued expenses and other liabilities.
Advertising —Advertising and promotional costs, which include newspaper, magazine, Internet, broadcast and other media advertising, are expensed as incurred and were approximately $91 million, $106 million and $134 million, net of cooperative advertising reimbursements of $41.1 million, $42.9 million and $41.8 million for fiscal years 2011, 2010 and 2009, respectively.
F-12
Notes to Consolidated Financial Statements (Continued)
1. Description of Business and Summary of Significant Accounting Policies (Continued)
Income Taxes —Income taxes are recognized for the amount of taxes payable for the current year and deferred tax assets and liabilities for the future tax consequence of events that have been recognized differently in the financial statements than for tax purposes. Deferred tax assets and liabilities are established using statutory tax rates and are adjusted for tax rate changes. Tax positions are analyzed to determine whether it is "more likely than not" that a tax position will be sustained upon examination by the appropriate taxing authorities before any part of the benefit can be recorded in the financial statements. For those tax positions where it is not "more likely than not" that a tax benefit will be sustained, no tax benefit is recognized. Where applicable, associated interest and penalties are also recorded.
Shipping and Handling —The Company records shipping and handling reimbursements in service charges and other income. The Company records shipping and handling costs in cost of sales.
Retirement Benefit Plans —The Company's retirement benefit plan costs are accounted for using actuarial valuations. The Company recognizes the funded status of its defined pension plans on the balance sheet and recognizes changes in the funded status that arise during the period but that are not recognized as components of net periodic benefit cost, within other comprehensive income, net of income taxes.
Income on (Equity in Losses of) Joint Ventures —Income on (equity in losses of) joint ventures includes the Company's portion of the income or loss of the Company's unconsolidated joint ventures as well as a distribution of excess cash from one of the Company's mall joint ventures.
Comprehensive Income —Comprehensive income is defined as the change in equity (net assets) of a business enterprise during a period from transactions and other events and circumstances from non-owner sources. It consists of the net income or loss and other gains and losses affecting stockholders' equity that, under GAAP, are excluded from net income or loss. One such exclusion is the amortization of retirement plan and other retiree benefit adjustments, which is the only item impacting our accumulated other comprehensive loss.
Supply Concentration —The Company purchases merchandise from many sources and does not believe that the Company was dependent on any one supplier during fiscal 2011.
Reclassifications —Certain items have been reclassified from their prior year classifications to conform to the current year presentation. These reclassifications had no effect on net income or stockholders' equity as previously reported.
New Accounting Pronouncements
Fair Value Measurements and Disclosure
In May 2011, the Financial Accounting Standards Board ("FASB") issued Accounting Standards Update ("ASU") No. 2011-04, Fair Value Measurement (Topic 820)—Amendments to Achieve Common Fair Value Measurement and Disclosure Requirements in U.S. GAAP and IFRSs . The amendments in this update change the wording used to describe the requirements in U.S. GAAP for measuring fair value and for disclosing information about fair value measurements to ensure consistency between U.S. GAAP and IFRS. This update is effective for interim and annual periods beginning after December 15, 2011 and is to be applied prospectively. The Company does not expect the adoption of ASU No. 2011-04 to have a material impact on the Company's financial statements.
F-13
Notes to Consolidated Financial Statements (Continued)
1. Description of Business and Summary of Significant Accounting Policies (Continued)
Presentation of Comprehensive Income
In June 2011, the FASB issued ASU No. 2011-05, Comprehensive Income (Topic 220)—Presentation of Comprehensive Income , to make the presentation of items within other comprehensive income ("OCI") more prominent. The new standard will require companies to present items of net income, items of OCI and total comprehensive income in one continuous statement or two separate consecutive statements, and companies will no longer be allowed to present items of OCI in the statement of stockholders' equity. This new update is effective for interim and annual periods beginning after December 15, 2011 and is to be applied retrospectively. The adoption of this new standard may change the order in which certain financial statements are presented and will provide additional detail in those financial statements when applicable, but will not have any other impact on the Company's financial statements.
In December 2011, the FASB issued ASU 2011-12, " Deferral of the Effective Date for Amendments to the Presentation of Reclassifications of Items Out of Accumulated Other Comprehensive Income in ASU 2011-5" which deferred the requirement from the June 2011 guidance that related to the presentation of reclassification adjustments. The amendment will allow the FASB time to redeliberate whether to present on the face of the financial statements the effects of reclassifications out of accumulated other comprehensive income on the components of net income and other comprehensive income for all periods presented.
2. Business Segments
The Company operates in two reportable segments: the operation of retail department stores and a general contracting construction company.
For the Company's retail operations reportable segment, the Company determined its operating segments on a store by store basis. Each store's operating performance has been aggregated into one reportable segment. The Company's operating segments are aggregated for financial reporting purposes because they are similar in each of the following areas: economic characteristics, class of consumer, nature of products and distribution methods. Revenues from external customers are derived from merchandise sales, and the Company does not rely on any major customers as a source of revenue. Across all stores, the Company operates one store format under the Dillard's name where each store offers the same general mix of merchandise with similar categories and similar customers. The Company believes that disaggregating its operating segments would not provide meaningful additional information.
F-14
Notes to Consolidated Financial Statements (Continued)
2. Business Segments (Continued)
The following table summarizes the percentage of net sales by segment and major product line:
|
|
Percentage of Net Sales | |||||||||
|---|---|---|---|---|---|---|---|---|---|---|
|
|
Fiscal
2011 |
Fiscal
2010 |
Fiscal
2009 |
|||||||
|
Retail operations segment: |
||||||||||
|
Cosmetics |
15 | % | 15 | % | 15 | % | ||||
|
Ladies' apparel and accessories |
37 | 37 | 36 | |||||||
|
Juniors' and children's apparel |
8 | 8 | 8 | |||||||
|
Men's apparel and accessories |
17 | 17 | 17 | |||||||
|
Shoes |
16 | 15 | 14 | |||||||
|
Home and furniture |
6 | 6 | 7 | |||||||
|
|
99 | 98 | 97 | |||||||
|
Construction segment |
1 | 2 | 3 | |||||||
|
Total |
100 | % | 100 | % | 100 | % | ||||
The following tables summarize certain segment information, including the reconciliation of those items to the Company's consolidated operations.
|
(in thousands of dollars)
|
Retail Operations |
Fiscal 2011
Construction |
Consolidated | |||||||
|---|---|---|---|---|---|---|---|---|---|---|
|
Net sales from external customers |
$ | 6,193,903 | $ | 69,697 | $ | 6,263,600 | ||||
|
Gross profit |
2,220,951 | 1,099 | 2,222,050 | |||||||
|
Depreciation and amortization |
257,504 | 181 | 257,685 | |||||||
|
Interest and debt expense (income), net |
72,218 | (159 | ) | 72,059 | ||||||
|
Income (loss) before income taxes and income on (equity in losses of) joint ventures |
399,813 | (3,144 | ) | 396,669 | ||||||
|
Income on (equity in losses of) joint ventures |
4,722 | — | 4,722 | |||||||
|
Total assets |
4,266,511 | 39,626 | 4,306,137 | |||||||
|
(in thousands of dollars)
|
Retail Operations |
Fiscal 2010
Construction |
Consolidated | |||||||
|---|---|---|---|---|---|---|---|---|---|---|
|
Net sales from external customers |
$ | 6,020,043 | $ | 100,918 | $ | 6,120,961 | ||||
|
Gross profit |
2,142,913 | 1,985 | 2,144,898 | |||||||
|
Depreciation and amortization |
261,368 | 182 | 261,550 | |||||||
|
Interest and debt expense (income), net |
74,009 | (217 | ) | 73,792 | ||||||
|
Income (loss) before income taxes and income on (equity in losses of) joint ventures |
269,644 | (928 | ) | 268,716 | ||||||
|
Income on (equity in losses of) joint ventures |
(4,646 | ) | — | (4,646 | ) | |||||
|
Total assets |
4,332,262 | 41,904 | 4,374,166 | |||||||
F-15
Notes to Consolidated Financial Statements (Continued)
2. Business Segments (Continued)
|
(in thousands of dollars)
|
Retail Operations |
Fiscal 2009
Construction |
Consolidated | |||||||
|---|---|---|---|---|---|---|---|---|---|---|
|
Net sales from external customers |
$ | 5,889,961 | $ | 204,987 | $ | 6,094,948 | ||||
|
Gross profit |
1,982,858 | 9,198 | 1,992,056 | |||||||
|
Depreciation and amortization |
262,709 | 168 | 262,877 | |||||||
|
Interest and debt expense (income), net |
74,256 | (253 | ) | 74,003 | ||||||
|
Income before income taxes and income on (equity in losses of) joint ventures |
80,472 | 4,053 | 84,525 | |||||||
|
Income on (equity in losses of) joint ventures |
(3,304 | ) | — | (3,304 | ) | |||||
|
Total assets |
4,524,694 | 81,633 | 4,606,327 | |||||||
Intersegment construction revenues of $37.3 million, $28.8 million and $51.9 million were eliminated during consolidation and have been excluded from net sales for the years ended January 28, 2012, January 29, 2011 and January 30, 2010, respectively.
3. Revolving Credit Agreement
At January 28, 2012, the Company maintained a $1.0 billion revolving credit facility ("credit agreement") with JPMorgan Chase Bank ("JPMorgan") as the lead agent for various banks, secured by the inventory of Dillard's, Inc. operating subsidiaries. The credit agreement expires December 12, 2012. Borrowings under the credit agreement accrue interest at either JPMorgan's Base Rate minus 0.5% or LIBOR plus 1.0% (1.27% at January 28, 2012) subject to certain availability thresholds as defined in the credit agreement.
Limited to 85% of the inventory of certain Company subsidiaries, availability for borrowings and letter of credit obligations under the credit agreement was $836.5 million at January 28, 2012. No borrowings were outstanding at January 28, 2012. Letters of credit totaling $83.7 million were issued under this credit agreement leaving unutilized availability under the facility of approximately $753 million at January 28, 2012. No borrowings were outstanding as of January 29, 2011. There are no financial covenant requirements under the credit agreement provided that availability for borrowings and letters of credit exceeds $100 million. The Company pays an annual commitment fee to the banks of 0.25% of the committed amount less outstanding borrowings and letters of credit. The Company had weighted-average borrowings of $72.6 million and $8.7 million during fiscal 2011 and 2010, respectively.
F-16
Notes to Consolidated Financial Statements (Continued)
4. Long-Term Debt
Long-term debt consists of the following:
|
(in thousands of dollars)
|
January 28, 2012 | January 29, 2011 | |||||
|---|---|---|---|---|---|---|---|
|
Unsecured notes, at rates ranging from 6.63% to 7.88%, due fiscal 2012 through fiscal 2028 |
$ | 670,155 | $ | 723,194 | |||
|
Term note, payable monthly through fiscal 2012 and bearing interest at a rate of 5.93% |
20,413 | 21,295 | |||||
|
Mortgage note, payable monthly through fiscal 2012 and bearing interest at a rate of 9.25% |
1,006 | 1,923 | |||||
|
|
691,574 | 746,412 | |||||
|
Current portion |
(76,789 | ) | (49,166 | ) | |||
|
|
$ | 614,785 | $ | 697,246 | |||
During fiscal 2011, the Company repurchased $5.7 million face amount of 6.625% notes with an original maturity on January 15, 2018. This repurchase resulted in a pretax gain of approximately $0.2 million which was recorded in net interest and debt expense.
During fiscal 2010, the Company repurchased $1.2 million face amount of 7.13% notes with an original maturity on August 1, 2018. This repurchase resulted in a pretax gain of approximately $21 thousand which was recorded in net interest and debt expense.
During fiscal 2009, the Company repurchased $8.4 million face amount of 9.125% notes with an original maturity on August 1, 2011. This repurchase resulted in a pretax gain of approximately $1.7 million which was recorded in net interest and debt expense.
There are no financial covenants under any of the debt agreements. Building, land, and land improvements with a carrying value of $4.2 million at January 28, 2012 were pledged as collateral on the mortgage note. Maturities of long-term debt over the next five years are approximately $77 million, $0, $0, $0 and $0.
Net interest and debt expense consists of the following:
|
(in thousands of dollars)
|
Fiscal
2011 |
Fiscal
2010 |
Fiscal
2009 |
|||||||
|---|---|---|---|---|---|---|---|---|---|---|
|
Long-term debt: |
||||||||||
|
Interest |
$ | 67,915 | $ | 70,325 | $ | 70,749 | ||||
|
Gain on early retirement of long-term debt |
(173 | ) | (21 | ) | (1,653 | ) | ||||
|
Amortization of debt expense |
1,732 | 1,714 | 1,753 | |||||||
|
|
69,474 | 72,018 | 70,849 | |||||||
|
Interest on capital lease obligations |
1,089 |
1,398 |
2,005 |
|||||||
|
Revolving credit facility expenses |
3,154 | 2,769 | 3,693 | |||||||
|
Investment interest income |
(1,658 | ) | (2,393 | ) | (2,544 | ) | ||||
|
|
$ | 72,059 | $ | 73,792 | $ | 74,003 | ||||
Interest paid during fiscal 2011, 2010 and 2009 was approximately $80.8 million, $76.4 million and $80.3 million, respectively.
F-17
Notes to Consolidated Financial Statements (Continued)
5. Trade Accounts Payable and Accrued Expenses
Trade accounts payable and accrued expenses consist of the following:
|
(in thousands of dollars)
|
January 28, 2012 | January 29, 2011 | |||||
|---|---|---|---|---|---|---|---|
|
Trade accounts payable |
$ | 452,408 | $ | 491,536 | |||
|
Accrued expenses: |
|||||||
|
Taxes, other than income |
67,822 | 61,119 | |||||
|
Salaries, wages and employee benefits |
64,544 | 63,823 | |||||
|
Liability to customers |
42,173 | 42,029 | |||||
|
Interest |
14,408 | 16,720 | |||||
|
Rent |
3,382 | 3,194 | |||||
|
Other |
10,916 | 10,860 | |||||
|
|
$ | 655,653 | $ | 689,281 | |||
6. Income Taxes
The provision for federal and state income taxes is summarized as follows:
|
(in thousands of dollars)
|
Fiscal
2011 |
Fiscal
2010 |
Fiscal
2009 |
|||||||
|---|---|---|---|---|---|---|---|---|---|---|
|
Current: |
||||||||||
|
Federal |
$ | 141,473 | $ | 65,911 | $ | 51,679 | ||||
|
State |
6,878 | 100 | (3,639 | ) | ||||||
|
|
148,351 | 66,011 | 48,040 | |||||||
|
Deferred: |
||||||||||
|
Federal |
(208,847 | ) | 18,126 | (31,396 | ) | |||||
|
State |
(2,022 | ) | 313 | (3,954 | ) | |||||
|
|
(210,869 | ) | 18,439 | (35,350 | ) | |||||
|
|
$ | (62,518 | ) | $ | 84,450 | $ | 12,690 | |||
A reconciliation between the Company's income tax provision and income taxes using the federal statutory income tax rate is presented below:
|
(in thousands of dollars)
|
Fiscal
2011 |
Fiscal
2010 |
Fiscal
2009 |
|||||||
|---|---|---|---|---|---|---|---|---|---|---|
|
Income tax at the statutory federal rate (inclusive of income on (equity in losses of) joint ventures) |
$ | 140,487 | $ | 92,424 | $ | 28,427 | ||||
|
State income taxes, net of federal benefit (inclusive of income on (equity in losses of) joint ventures) |
2,261 | 4,846 | (89 | ) | ||||||
|
Net changes in unrecognized tax benefits, interest, and penalties /reserves |
(565 | ) | (6,062 | ) | (6,334 | ) | ||||
|
Tax benefit of federal credits |
(3,702 | ) | (2,473 | ) | (2,405 | ) | ||||
|
Changes in cash surrender value of life insurance policies |
(982 | ) | (1,218 | ) | (795 | ) | ||||
|
Changes in valuation allowance |
(199,299 | ) | (3,642 | ) | (4,024 | ) | ||||
|
Changes in tax rate |
(557 | ) | 1,403 | (1,317 | ) | |||||
|
Other |
(161 | ) | (828 | ) | (773 | ) | ||||
|
|
$ | (62,518 | ) | $ | 84,450 | $ | 12,690 | |||
F-18
Notes to Consolidated Financial Statements (Continued)
6. Income Taxes (Continued)
In January 2011, the Company formed a wholly-owned subsidiary intended to operate as a real estate investment trust ("REIT") and transferred certain properties to this subsidiary. The Company made a tax election in its tax return for the fiscal year ended January 29, 2011 which increased the tax basis of the properties transferred to the REIT to their fair values at the date of the transfer. The income tax that would otherwise be payable because of the gain recognized by this election was largely reduced by the utilization of a capital loss carryforward, that would otherwise have expired as of January 29, 2011, against a portion of the recognized gain.
During fiscal 2011, income taxes included the recognition of tax benefits of approximately $201.6 million due to the valuation allowance reversal related to the REIT Transaction, $3.7 million related to federal tax credits, $1.0 million for the increase in the cash surrender value of life insurance policies, $0.6 million due to net decreases in unrecognized tax benefits, interest and penalties, and $0.6 million related to decreases in net deferred tax liabilities resulting from legislatively-enacted state tax rate reductions. These tax benefits were partially offset by the recognition of tax expense of approximately $2.3 million due to increases in net operating loss valuation allowances related to state net operating loss carryforwards.
During fiscal 2010, income taxes included approximately $1.4 million for an increase in deferred liabilities due to an increase in the state effective tax rate, and included the recognition of tax benefits of approximately $6.1 million for the net decrease in unrecognized tax benefits, interest, and penalties, $2.9 million for the decrease in net operating loss valuation allowances, $0.7 million for the decrease in the capital loss valuation allowance resulting from capital gain income, $1.2 million for the increase in the cash surrender value of life insurance policies, and $2.5 million due to federal tax credits. During fiscal 2010, the Company reached settlement s with federal and state taxing jurisdiction s which resulted in reduction s in the liability for unrecognized tax benefits.
During fiscal 2009, income taxes included the recognition of tax benefits of approximately $6.3 million for the net decrease in unrecognized tax benefits, interest, and penalties, $1.3 million for a decrease in deferred liabilities due to a decrease in the state effective tax rate, $4.4 million for a decrease in a capital loss valuation allowance resulting from capital gain income, and $2.4 million due to federal tax credits. During fiscal 2009, the Company reached a settlement with a state taxing jurisdiction which resulted in a reduction in unrecognized tax benefits, interest, and penalties.
Deferred income taxes reflect the net tax effects of temporary differences between the carrying amounts of assets and liabilities for financial reporting purposes and the amounts used for income tax
F-19
Notes to Consolidated Financial Statements (Continued)
6. Income Taxes (Continued)
purposes. Significant components of the Company's deferred tax assets and liabilities as of January 28, 2012 and January 29, 2011 are as follows:
|
(in thousands of dollars)
|
January 28,
2012 |
January 29,
2011 |
|||||
|---|---|---|---|---|---|---|---|
|
Property and equipment bases and depreciation differences |
$ | 408,003 | $ | 426,276 | |||
|
Prepaid expenses |
22,675 | 18,432 | |||||
|
Joint venture bases differences |
11,312 | 7,374 | |||||
|
Differences between book and tax bases of inventory |
62,794 | 61,975 | |||||
|
Other |
1,970 | 1,722 | |||||
|
Total deferred tax liabilities |
506,754 | 515,779 | |||||
|
Accruals not currently deductible |
(95,440 | ) | (80,701 | ) | |||
|
Net operating loss carryforwards |
(95,763 | ) | (94,429 | ) | |||
|
State income taxes |
(3,889 | ) | (3,986 | ) | |||
|
Other |
(442 | ) | (453 | ) | |||
|
Total deferred tax assets |
(195,534 | ) | (179,569 | ) | |||
|
Net operating loss valuation allowance |
64,870 | 61,279 | |||||
|
Net deferred tax assets |
(130,664 | ) | (118,290 | ) | |||
|
Net deferred tax liabilities |
$ | 376,090 | $ | 397,489 | |||
At January 28, 2012, the Company had a deferred tax asset related to state net operating loss carryforwards of approximately $96 million that could be utilized to reduce the tax liabilities of future years. These carryforwards will expire between fiscal 2012 and 2032. A portion of the deferred asset attributable to state net operating loss carryforwards was reduced by a valuation allowance of approximately $65 million for the losses of various members of the affiliated group in states for which the Company determined that it is "more likely than not" that the benefit of the net operating losses will not be realized.
Deferred tax assets and liabilities are presented as follows in the accompanying consolidated balance sheets:
|
(in thousands of dollars)
|
January 28,
2012 |
January 29,
2011 |
|||||
|---|---|---|---|---|---|---|---|
|
Net deferred tax liabilities-noncurrent |
$ | 314,598 | $ | 341,689 | |||
|
Net deferred tax liabilities-current |
61,492 | 55,800 | |||||
|
Net deferred tax liabilities |
$ | 376,090 | $ | 397,489 | |||
The total amount of unrecognized tax benefits as of January 28, 2012 and January 29, 2011 was $8.5 million and $9.1 million, respectively, of which $5.8 million and $6.3 million, respectively, would, if recognized, affect the effective tax rate. The Company classifies accrued interest expense and penalties relating to income tax in the consolidated financial statements as income tax expense. The total interest and penalties recognized in the consolidated statements of income as of January 28, 2012, January 29, 2011 and January 30, 2010 was $(0.2) million, $(2.3) million, and $(2.0) million, respectively. The total accrued interest and penalties in the consolidated balance sheets as of January 28, 2012 and January 29, 2011 was $3.4 million and $3.7 million, respectively.
F-20
Notes to Consolidated Financial Statements (Continued)
6. Income Taxes (Continued)
A reconciliation of the beginning and ending amount of unrecognized tax benefits is as follows:
|
(in thousands of dollars)
|
Fiscal
2011 |
Fiscal
2010 |
Fiscal
2009 |
|||||||
|---|---|---|---|---|---|---|---|---|---|---|
|
Unrecognized tax benefits at beginning of period |
$ | 9,106 | $ | 18,233 | $ | 27,276 | ||||
|
Gross increases—tax positions in prior period |
— | — | 329 | |||||||
|
Gross decreases—tax positions in prior period |
(955 | ) | (6,461 | ) | (9,188 | ) | ||||
|
Gross increases—current period tax positions |
1,314 | 861 | 1,073 | |||||||
|
Settlements |
(525 | ) | (3,527 | ) | (1,247 | ) | ||||
|
Lapse of statutes of limitation |
(459 | ) | — | (10 | ) | |||||
|
Unrecognized tax benefits at end of period |
$ | 8,481 | $ | 9,106 | $ | 18,233 | ||||
During fiscal 2011, the IRS concluded its examination of the Company's federal income tax returns for the fiscal tax years 2008 through 2009, and no significant changes occurred in these tax years as a result of such examination. The Company is currently under examination by various state and local taxing jurisdictions for various fiscal years. The tax years that remain subject to examination for major tax jurisdictions are fiscal tax years 2008 and forward, with the exception of fiscal 2003 through 2007 amended state and local tax returns related to the reporting of federal audit adjustments. At this time, the Company does not expect the results from any income tax audit to have a material impact on the Company's consolidated financial statements.
The Company has taken positions in certain taxing jurisdictions for which it is reasonably possible that the total amounts of unrecognized tax benefits may decrease within the next twelve months. The possible decrease could result from the finalization of the Company's various state income tax audits and lapse of statutes of limitation. The Company's federal income tax audit uncertainties primarily relate to research and development credits, while various state income tax audit uncertainties primarily relate to income from intangible assets. The estimated range of the reasonably possible uncertain tax benefit decrease in the next twelve months is between $0.5 million and $2.0 million. Changes in the Company's assumptions and judgments can materially affect amounts recognized in the consolidated balance sheets and statements of income.
Income taxes paid, net of income tax refunds received, during fiscal 2011, 2010 and 2009 were approximately $104.7 million, $57.7 million and $6.4 million, respectively.
7. Subordinated Debentures
At January 28, 2012, the Company had $200 million outstanding of its 7.5% subordinated debentures due August 1, 2038. All of these subordinated debentures were held by Dillard's Capital Trust I ("Trust"), a 100% owned unconsolidated finance subsidiary of the Company. The subordinated debentures are the sole asset of the Trust. The Company has the right to defer the payment of interest on the subordinated debentures at any time for a period not to exceed 20 consecutive quarters.
At January 28, 2012, the Trust has outstanding $200 million liquidation amount of 7.5% Capital Securities, due August 1, 2038 (the "Capital Securities"). Holders of the Capital Securities are entitled to receive cumulative cash distributions, payable quarterly, at the annual rate of 7.5% of the liquidation amount of $25 per Capital Security. The Capital Securities are subject to mandatory redemption upon repayment of the Company's subordinated debentures. The Company's obligations under the
F-21
Notes to Consolidated Financial Statements (Continued)
7. Subordinated Debentures (Continued)
subordinated debentures and related agreements, taken together, provide a full and unconditional guarantee of payments due on the Capital Securities.
The Trust is a variable interest entity and is not consolidated into the Company's financial statements, since the Company is not the primary beneficiary of the Trust.
8. Benefit Plans
The Company has a retirement plan with a 401(k)-salary deferral feature for eligible employees. Under the terms of the plan, eligible employees could contribute up to the lesser of $16,500 ($22,000 if at least 50 years of age) or 75% of eligible pay. Eligible employees with one year of service, who elect to participate in the plan or are auto-enrolled, receive a Company matching contribution. Company matching contributions are calculated on the eligible employee's first 6% of elective deferrals with the first 1% being matched 100% and the next 5% being matched 50%. The Company matching contributions are used to purchase Class A Common Stock of the Company for the benefit of the employee. The terms of the plan provide a two-year vesting schedule for the Company matching contribution portion of the plan. The Company incurred benefit plan expense of $16 million, $15 million and $13 million for fiscal 2011, 2010 and 2009, respectively.
The Company has an unfunded, nonqualified defined benefit plan ("Pension Plan") for its officers. The Pension Plan is noncontributory and provides benefits based on years of service and compensation during employment. Pension expense is determined using various actuarial cost methods to estimate the total benefits ultimately payable to officers and allocates this cost to service periods. The actuarial assumptions used to calculate pension costs are reviewed annually.
F-22
Notes to Consolidated Financial Statements (Continued)
8. Benefit Plans (Continued)
The accumulated benefit obligations, change in projected benefit obligation, change in Pension Plan assets, funded status, and reconciliation to amounts recognized in the consolidated balance sheets are as follows:
|
(in thousands of dollars)
|
January 28,
2012 |
January 29,
2011 |
|||||
|---|---|---|---|---|---|---|---|
|
Change in benefit obligation: |
|||||||
|
Benefit obligation at beginning of year |
$ | 132,293 | $ | 130,465 | |||
|
Service cost |
3,326 | 2,886 | |||||
|
Interest cost |
7,200 | 7,269 | |||||
|
Actuarial loss/(gain) |
35,700 | (4,045 | ) | ||||
|
Benefits paid |
(4,390 | ) | (4,282 | ) | |||
|
Benefit obligation at end of year |
$ | 174,129 | $ | 132,293 | |||
|
Change in Pension Plan assets: |
|||||||
|
Fair value of Pension Plan assets at beginning of year |
$ | — | $ | — | |||
|
Employer contribution |
4,390 | 4,282 | |||||
|
Benefits paid |
(4,390 | ) | (4,282 | ) | |||
|
Fair value of Pension Plan assets at end of year |
$ | — | $ | — | |||
|
Funded status (benefit obligation less Pension Plan assets) |
$ | (174,129 | ) | $ | (132,293 | ) | |
|
Unamortized prior service costs |
— | — | |||||
|
Unrecognized net actuarial loss |
— | — | |||||
|
Intangible asset |
— | — | |||||
|
Unrecognized net loss |
— | — | |||||
|
Accrued benefit cost |
$ | (174,129 | ) | $ | (132,293 | ) | |
|
Benefit obligation in excess of Pension Plan assets |
$ | (174,129 | ) | $ | (132,293 | ) | |
|
Amounts recognized in the balance sheets: |
|||||||
|
Accrued benefit liability |
$ | (174,129 | ) | $ | (132,293 | ) | |
|
Net amount recognized |
$ | (174,129 | ) | $ | (132,293 | ) | |
|
Accumulated benefit obligation at end of year |
$ | (167,148 | ) | $ | (126,932 | ) | |
Pretax amounts recognized in accumulated other comprehensive loss for fiscal 2011 consisted of net actuarial losses and prior service cost of $60.3 million and $0.7 million, respectively. Pretax amounts recognized in accumulated other comprehensive loss for fiscal 2010 consisted of net actuarial losses and prior service cost of $26.6 million and $1.3 million, respectively. Pretax amounts recognized in accumulated other comprehensive loss for fiscal 2009 consisted of net actuarial losses and prior service cost of $33.0 million and $2.0 million, respectively.
The accrued benefit liability is included in other liabilities.
The estimated actuarial loss and prior service cost for the nonqualified defined benefit plans that will be amortized from accumulated other comprehensive loss into net periodic benefit cost over the next fiscal year approximate $5.1 million and $0.6 million, respectively.
F-23
Notes to Consolidated Financial Statements (Continued)
8. Benefit Plans (Continued)
The discount rate that the Company utilizes for determining future pension obligations is based on the Citigroup Above Median Pension Index Curve on its annual measurement date as of the end of each fiscal year and is matched to the future expected cash flows of the benefit plans by annual periods. The discount rate had decreased to 4.3% as of January 28, 2012 from 5.5% as of January 29, 2011. Weighted average assumptions are as follows:
|
|
Fiscal 2011 | Fiscal 2010 | Fiscal 2009 | |||||||
|---|---|---|---|---|---|---|---|---|---|---|
|
Discount rate-net periodic pension cost |
5.5 | % | 5.7 | % | 6.6 | % | ||||
|
Discount rate-benefit obligations |
4.3 | % | 5.5 | % | 5.7 | % | ||||
|
Rate of compensation increases |
3.0 | % | 3.0 | % | 4.0 | % | ||||
The components of net periodic benefit costs are as follows:
|
(in thousands of dollars)
|
Fiscal 2011 | Fiscal 2010 | Fiscal 2009 | |||||||
|---|---|---|---|---|---|---|---|---|---|---|
|
Components of net periodic benefit costs: |
||||||||||
|
Service cost |
$ | 3,326 | $ | 2,886 | $ | 3,084 | ||||
|
Interest cost |
7,200 | 7,269 | 7,303 | |||||||
|
Net actuarial loss |
1,967 | 2,376 | 1,474 | |||||||
|
Amortization of prior service cost |
626 | 626 | 626 | |||||||
|
Net periodic benefit costs |
$ | 13,119 | $ | 13,157 | $ | 12,487 | ||||
The estimated future benefits payments for the nonqualified benefit plan are as follows:
|
(in thousands of dollars)
|
|
|||
|---|---|---|---|---|
|
Fiscal Year |
||||
|
2012 |
$ | 7,904 | ||
|
2013 |
7,749 | |||
|
2014 |
7,810 | |||
|
2015 |
10,153 | |||
|
2016 |
10,434 | |||
|
2017 - 2021 |
56,301 | |||
|
Total payments for next ten fiscal years |
$ | 100,351 | ||
9. Stockholders' Equity
Capital stock is comprised of the following:
|
Type
|
Par
Value |
Shares
Authorized |
|||||
|---|---|---|---|---|---|---|---|
|
Preferred (5% cumulative) |
$ | 100.00 | 5,000 | ||||
|
Additional preferred |
$ | 0.01 | 10,000,000 | ||||
|
Class A, common |
$ | 0.01 | 289,000,000 | ||||
|
Class B, common |
$ | 0.01 | 11,000,000 | ||||
Holders of Class A are empowered as a class to elect one-third of the members of the Board of Directors, and the holders of Class B are empowered as a class to elect two-thirds of the members of
F-24
Notes to Consolidated Financial Statements (Continued)
9. Stockholders' Equity (Continued)
the Board of Directors. Shares of Class B are convertible at the option of any holder thereof into shares of Class A at the rate of one share of Class B for one share of Class A.
Stock Repurchase Programs
May 2011 Stock Plan
In May 2011, the Company's Board of Directors authorized the Company to repurchase up to $250 million of the Company's Class A Common Stock under an open-ended plan ("May 2011 Stock Plan"). This authorization permits the Company to repurchase its Class A Common Stock in the open market, pursuant to preset trading plans meeting the requirements of Rule 10b5-1 under the Securities Exchange Act of 1934 ("Exchange Act") or through privately negotiated transactions. During fiscal 2011, the Company repurchased 5.0 million shares for $222.5 million at an average price of $44.77 per share. At January 28, 2012, remaining availability under the May 2011 Stock Plan was $27.5 million.
February 2011 Stock Plan
In February 2011, the Company's Board of Directors authorized the Company to repurchase up to $250 million of the Company's Class A Common Stock under an open-ended plan ("February 2011 Stock Plan"). This authorization permitted the Company to repurchase its Class A Common Stock in the open market, pursuant to preset trading plans meeting the requirements of Rule 10b5-1 under the Exchange Act or through privately negotiated transactions. During fiscal 2011, the Company repurchased 6.0 million shares for $250.0 million at an average price of $41.93 per share, which completed the authorization under the February 2011 Stock Plan.
2010 Stock Plan
In August 2010, the Company's Board of Directors authorized the Company to repurchase up to $250 million of the Company's Class A Common Stock under an open-ended plan ("2010 Stock Plan"). During fiscal 2010, the Company repurchased 7.5 million shares for $231.3 million at an average price of $31.04 per share. During fiscal 2011, the Company repurchased 0.4 million shares for $18.7 million at an average price of $42.19 per share, which completed the remaining authorization under the 2010 Stock Plan.
2007 Stock Plan
In November 2007, the Company's Board of Directors authorized the Company to repurchase up to $200 million of the Company's Class A Common Stock under an open-ended plan ("2007 Stock Plan"). Availability under the 2007 Stock Plan at the beginning of fiscal 2009 was $182.6 million. No repurchases were made during fiscal 2009. During fiscal 2010, the Company repurchased 7.2 million shares of stock for approximately $182.6 million at an average price of $25.39 per share, which completed the remaining authorization under the 2007 Stock Plan.
F-25
Notes to Consolidated Financial Statements (Continued)
10. Earnings per Share
Basic earnings per share has been computed based upon the weighted average of Class A and Class B common shares outstanding. Diluted earnings per share gives effect to outstanding stock options.
Earnings per common share has been computed as follows:
|
|
Fiscal 2011 | Fiscal 2010 | Fiscal 2009 | ||||||||||||||||
|---|---|---|---|---|---|---|---|---|---|---|---|---|---|---|---|---|---|---|---|
|
(in thousands, except per share data)
|
Basic | Diluted | Basic | Diluted | Basic | Diluted | |||||||||||||
|
Net earnings available for per-share calculation |
$ | 463,909 | $ | 463,909 | $ | 179,620 | $ | 179,620 | $ | 68,531 | $ | 68,531 | |||||||
|
Average shares of common stock outstanding |
53,515 | 53,515 | 66,922 | 66,922 | 73,784 | 73,784 | |||||||||||||
|
Dilutive effect of stock-based compensation |
— | 933 | — | 252 | — | — | |||||||||||||
|
Total average equivalent shares |
53,515 | 54,448 | 66,922 | 67,174 | 73,784 | 73,784 | |||||||||||||
|
Per share of common stock: |
|||||||||||||||||||
|
Net income |
$ | 8.67 | $ | 8.52 | $ | 2.68 | $ | 2.67 | $ | 0.93 | $ | 0.93 | |||||||
Total stock options outstanding were 2,245,000, 3,351,869 and 4,044,369 at January 28, 2012, January 29, 2011 and January 30, 2010, respectively. Of these, options to purchase 4,044,369 shares of Class A Common Stock at prices ranging from $24.73 to $26.57 were outstanding at January 30, 2010 but were not included in the computations of diluted earnings per share because the effect of their inclusion would have been antidilutive.
11. Stock-Based Compensation
The Company has various stock option plans that provide for the granting of options to purchase shares of Class A Common Stock to certain key employees of the Company. Exercise and vesting terms for options granted under the plans are determined at each grant date. All options were granted at not less than fair market value at dates of grant. As of January 28, 2012, 7,547,451 shares were available for grant under the plans and 9,792,451 shares of Class A Common Stock were reserved for issuance under the stock option plans. There were no stock options granted during fiscal 2011, 2010 and 2009.
Stock option transactions are summarized as follows:
|
|
Fiscal 2011 | ||||||
|---|---|---|---|---|---|---|---|
|
Stock Options
|
Shares |
Weighted
Average Exercise Price |
|||||
|
Outstanding, beginning of year |
3,351,869 | $ | 25.80 | ||||
|
Granted |
— | — | |||||
|
Exercised |
(1,106,869 | ) | 25.91 | ||||
|
Expired |
— | — | |||||
|
Outstanding, end of year |
2,245,000 | $ | 25.74 | ||||
|
Options exercisable at year-end |
2,245,000 | $ | 25.74 | ||||
F-26
Notes to Consolidated Financial Statements (Continued)
11. Stock-Based Compensation (Continued)
The following table summarizes information about stock options outstanding at January 28, 2012:
|
|
Options Outstanding | Options Exercisable | ||||||||||||||
|---|---|---|---|---|---|---|---|---|---|---|---|---|---|---|---|---|
|
Range of Exercise Prices
|
Options
Outstanding |
Weighted-Average
Remaining Contractual Life (Yrs.) |
Weighted-Average
Exercise Price |
Options
Exercisable |
Weighted-Average
Exercise Price |
|||||||||||
|
$25.74 - $25.74 |
2,245,000 | 3.99 | $ | 25.74 | 2,245,000 | $ | 25.74 | |||||||||
The intrinsic value of stock options exercised during fiscal 2011 and fiscal 2010 was approximately $28.2 million and $8.5 million, respectively. No stock options were exercised during fiscal 2009. At January 28, 2012, the intrinsic value of outstanding stock options and exercisable stock options was $45.8 million.
12. Commitments and Contingencies
Rental expense consists of the following:
|
(in thousands of dollars)
|
Fiscal
2011 |
Fiscal
2010 |
Fiscal
2009 |
|||||||
|---|---|---|---|---|---|---|---|---|---|---|
|
Operating leases: |
||||||||||
|
Buildings: |
||||||||||
|
Minimum rentals |
$ | 19,509 | $ | 20,137 | $ | 21,876 | ||||
|
Contingent rentals |
4,491 | 3,884 | 2,772 | |||||||
|
Equipment |
24,110 | 27,024 | 33,715 | |||||||
|
|
$ | 48,110 | $ | 51,045 | $ | 58,363 | ||||
Contingent rentals on certain leases are based on a percentage of annual sales in excess of specified amounts. Other contingent rentals are based entirely on a percentage of sales.
The future minimum rental commitments as of January 28, 2012 for all non-cancelable leases for buildings and equipment are as follows:
|
(in thousands of dollars)
Fiscal Year |
Operating
Leases |
Capital
Leases |
|||||
|---|---|---|---|---|---|---|---|
|
2012 |
29,537 | 3,191 | |||||
|
2013 |
14,950 | 2,488 | |||||
|
2014 |
13,171 | 1,428 | |||||
|
2015 |
11,457 | 1,428 | |||||
|
2016 |
10,653 | 1,428 | |||||
|
After 2016 |
19,876 | 6,087 | |||||
|
Total minimum lease payments |
$ | 99,644 | 16,050 | ||||
|
Less amount representing interest |
(4,585 | ) | |||||
|
Present value of net minimum lease payments (of which $2,312 is currently payable) |
$ | 11,465 | |||||
Renewal options from three to 25 years exist on the majority of leased properties.
F-27
Notes to Consolidated Financial Statements (Continued)
12. Commitments and Contingencies (Continued)
At January 28, 2012, the Company is committed to incur costs of approximately $70 million to acquire, complete and furnish certain stores and equipment.
At January 28, 2012, letters of credit totaling $83.7 million were issued under the Company's $1.0 billion revolving credit facility.
Various legal proceedings, in the form of lawsuits and claims, which occur in the normal course of business, are pending against the Company and its subsidiaries. In the opinion of management, disposition of these matters is not expected to materially affect the Company's financial position, cash flows or results of operations.
13. Asset Impairment and Store Closing Charges
During fiscal 2011, the Company recorded a pretax charge of $1.2 million for asset impairment and store closing costs. The charge was for the write-down of a property held for sale.
During fiscal 2010, the Company recorded a pretax charge of $2.2 million for asset impairment and store closing costs. The charge was for the write-down of a property held for sale.
During fiscal 2009, the Company recorded a pretax charge of $3.1 million for asset impairment and store closing costs. The charge consists of the write-down of property of $3.9 million on two stores closed in a prior year partially offset by the renegotiation of a future rent accrual of $0.8 million on a store closed in a prior year.
The following is a summary of the activity in the reserve established for store closing charges:
|
(in thousands of dollars)
|
Balance,
Beginning of Year |
Adjustments
and Charges* |
Cash Payments |
Balance,
End of Year |
|||||||||
|---|---|---|---|---|---|---|---|---|---|---|---|---|---|
|
Fiscal 2011 |
|||||||||||||
|
Rent, property taxes and utilities |
$ | 1,360 | $ | 1,035 | $ | 1,657 | $ | 738 | |||||
|
Fiscal 2010 |
|||||||||||||
|
Rent, property taxes and utilities |
2,498 | 680 | 1,818 | 1,360 | |||||||||
|
Fiscal 2009 |
|||||||||||||
|
Rent, property taxes and utilities |
5,240 | 691 | 3,433 | 2,498 | |||||||||
- *
- included in rentals
Reserve amounts are recorded in trade accounts payable and accrued expenses and other liabilities.
14. Fair Value Disclosures
The estimated fair values of financial instruments which are presented herein have been determined by the Company using available market information and appropriate valuation methodologies. However, considerable judgment is required in interpreting market data to develop estimates of fair value. Accordingly, the estimates presented herein are not necessarily indicative of amounts the Company could realize in a current market exchange.
The fair value of the Company's long-term debt and subordinated debentures is based on market prices or dealer quotes (for publicly traded unsecured notes) and on discounted future cash flows using current interest rates for financial instruments with similar characteristics and maturities (for bank notes and mortgage notes).
F-28
Notes to Consolidated Financial Statements (Continued)
14. Fair Value Disclosures (Continued)
The fair value of the Company's cash and cash equivalents and trade accounts receivable approximates their carrying values at January 28, 2012 and January 29, 2011 due to the short-term maturities of these instruments. The fair values of the Company's long-term debt at January 28, 2012 and January 29, 2011 were approximately $691 million and $725 million, respectively. The carrying value of the Company's long-term debt at January 28, 2012 and January 29, 2011 was approximately $692 million and $746 million, respectively. The fair value of the subordinated debentures at January 28, 2012 and January 29, 2011 was approximately $198 million and $190 million, respectively. The carrying value of the subordinated debentures at January 28, 2012 and January 29, 2011 was $200 million.
Assets and Liabilities Measured at Fair Value on a Nonrecurring Basis
The FASB's accounting guidance utilizes a fair value hierarchy that prioritizes the inputs to the valuation techniques used to measure fair value into three broad levels:
- •
-
Level 1: Observable inputs such as quoted prices (unadjusted) in active markets for identical assets
or liabilities
- •
-
Level 2: Inputs, other than quoted prices, that are observable for the asset or liability, either
directly or indirectly; these include quoted prices for similar assets or liabilities in active markets and quoted prices for identical or similar assets or liabilities in markets that are not active
- •
- Level 3: Unobservable inputs that reflect the reporting entity's own assumptions
|
|
|
Basis of Fair Value Measurements | |||||||||||
|---|---|---|---|---|---|---|---|---|---|---|---|---|---|
|
(in thousands)
|
Fair Value
of Assets |
Quoted Prices
In Active Markets for Identical Items (Level 1) |
Significant
Other Observable Inputs (Level 2) |
Significant
Unobservable Inputs (Level 3) |
|||||||||
|
Long-lived assets held for sale |
|||||||||||||
|
As of January 28, 2012 |
$ | 17,348 | $ | — | $ | — | $ | 17,348 | |||||
|
As of January 29, 2011 |
27,548 | — | — | 27,548 | |||||||||
|
As of January 30, 2010 |
33,956 | — | — | 33,956 | |||||||||
During fiscal 2011, the Company sold two former retail store locations with carrying values totaling $9.0 million. During fiscal 2011, long-lived assets held for sale were written down to their fair value of $17.3 million, resulting in an impairment charge of $1.2 million, which was included in earnings for the period.
During fiscal 2010, the Company sold three vacant retail store properties with carrying values of $4.2 million. During fiscal 2010, long-lived assets held for sale were written down to their fair value of $27.5 million, resulting in an impairment charge of $2.2 million, which was included in earnings for the period.
During fiscal 2009, long-lived assets held for sale with a carrying value of $37.9 million were written down to their fair value of $34.0 million, resulting in an impairment charge of $3.9 million, which was included in earnings for the period.
The inputs used to calculate the fair value of these long-lived assets in all periods included selling prices from commercial real estate transactions for similar assets in similar markets that we estimated would be used by a market participant in valuing these assets.
F-29
Notes to Consolidated Financial Statements (Continued)
15. Quarterly Results of Operations (unaudited)
|
|
Fiscal 2011, Three Months Ended | ||||||||||||
|---|---|---|---|---|---|---|---|---|---|---|---|---|---|
|
(in thousands of dollars, except per share data)
|
April 30 | July 30 | October 29 | January 28 | |||||||||
|
Net sales |
$ | 1,469,198 | $ | 1,441,747 | $ | 1,382,612 | $ | 1,970,043 | |||||
|
Gross profit |
570,312 | 479,348 | 502,615 | 669,775 | |||||||||
|
Net income |
76,677 | 17,565 | 228,171 | 141,496 | |||||||||
|
Diluted earnings per share: |
|||||||||||||
|
Net income |
$ | 1.31 | $ | 0.32 | $ | 4.31 | $ | 2.77 | |||||
|
|
Fiscal 2010, Three Months Ended | ||||||||||||
|---|---|---|---|---|---|---|---|---|---|---|---|---|---|
|
(in thousands of dollars, except per share data)
|
May 1 | July 31 | October 30 | January 29 | |||||||||
|
Net sales |
$ | 1,453,596 | $ | 1,388,910 | $ | 1,344,118 | $ | 1,934,337 | |||||
|
Gross profit |
539,335 | 458,474 | 486,644 | 660,445 | |||||||||
|
Net income |
48,834 | 6,828 | 14,381 | 109,577 | |||||||||
|
Diluted earnings per share: |
|||||||||||||
|
Net income |
$ | 0.68 | $ | 0.10 | $ | 0.22 | $ | 1.75 | |||||
Total of quarterly earnings per common share may not equal the annual amount because net income per common share is calculated independently for each quarter.
Quarterly information for fiscal 2011 and fiscal 2010 includes the following items:
First Quarter
2011
- •
-
a $4.2 million pretax gain ($2.7 million after tax or $0.05 per share) related to a distribution from a mall
joint venture.
- •
- a $1.2 million pretax charge ($0.8 million after tax or $0.01 per share) for asset impairment and store closing charges related to the write-down of one property held for sale.
2010
- •
- a $2.2 million pretax charge ($1.4 million after tax or $0.02 per share) for asset impairment and store closing charges related to the write-down of one property held for sale.
Second Quarter
2011
- •
- a $2.1 million pretax gain ($1.4 million after tax or $0.02 per share) related to the sale of an interest in a mall joint venture.
2010
- •
-
a $4.0 million pretax gain ($2.6 million after tax or $0.04 per share) related to the sale of a retail store
location.
- •
- a $2.0 million income tax benefit ($0.03 per share) related to a state administrative settlement.
F-30
Notes to Consolidated Financial Statements (Continued)
15. Quarterly Results of Operations (unaudited) (Continued)
Third Quarter
2011
- •
-
a $201.6 million income tax benefit ($3.81 per share) due to a reversal of a valuation allowance related to the
amount of the capital loss carryforward used to offset the capital gain income recognized on the taxable transfer of properties to our REIT.
- •
- a $1.3 million pretax gain ($0.9 million after tax or $0.02 per share) related to the sale of two former retail store locations.
2010
- •
-
a $1.1 million pretax loss ($0.7 million after tax or $0.02 per share) related to the sale of a closed
store.
- •
- a $1.2 million income tax benefit ($0.02 per share) for a decrease in a capital loss valuation allowance.
Fourth Quarter
2011
- •
- a $44.5 million pretax gain ($28.7 million after tax or $0.56 per share), net of settlement related expenses, related to the settlement of a lawsuit with JDA Software Group for $57.0 million.
2010
- •
-
a $7.5 million pretax gain ($4.8 million after tax or $0.08 per share) on proceeds received for final
payment related to hurricane losses.
- •
-
a $2.2 million pretax gain ($1.4 million after tax or $0.02 per share) related to the sale of three closed
stores.
- •
- a $6.5 million income tax benefit ($0.10 per share) primarily related to net decreases in unrecognized tax benefits, interest and penalties due to resolutions of federal and state examinations; decreases in state net operating loss valuation allowances; and a decrease in a capital loss valuation allowance.
F-31
| Number | Description | ||
|---|---|---|---|
| *3 | (a) | Restated Certificate of Incorporation (Exhibit 3 to Form 10-Q for the quarter ended August 1, 1992 in 1-6140), as amended (Exhibit 3 to Form 10-Q for the quarter ended May 3, 1997 in 1-6140). | |
| *3 | (b) | Amended and Restated By-Laws as currently in effect (Exhibit 4.2 to Form S-8 filed November 27, 2007 in 333-147636). | |
|
|
*4 |
|
Indenture between Registrant and Chemical Bank, Trustee, dated as of May 15, 1988, as supplemented (Exhibit 4 in 33-21671, Exhibit 4.2 in 33-25114, Exhibit 4(c) to Current Report on Form 8-K dated September 26, 1990 in 1-6140 and Exhibit 4-q in 333-59183). |
| **10 | (a) | 1998 Incentive and Nonqualified Stock Option Plan (Exhibit 10(b) to Form 10-K for the fiscal year ended January 30, 1999 in 1-6140). | |
| **10 | (b) | Amended and Restated Corporate Officers Non-Qualified Pension Plan (Exhibit 10.1 to Form 8-K dated as of November 17, 2007 in 1-6140). | |
| **10 | (c) | Senior Management Cash Bonus Plan (Exhibit 10(d) to Form 10-K for the fiscal year ended January 28, 1995 in 1-6140). | |
| **10 | (d) | 2000 Incentive and Nonqualified Stock Option Plan (Exhibit 10(e) to Form 10-K for the fiscal year ended February 3, 2001 in 1-6140). | |
| *10 | (e) | Amended and Restated Credit Agreement dated December 12, 2003 (Exhibit 10 to Form 10-Q dated December 16, 2003 in 1-6140). | |
| *10 | (f) | First Amendment to Amended and Restated Credit Agreement among Dillard's, Inc. and JPMorgan Chase Bank and Fleet Retail Group Inc. (Exhibit 10 to Form 10-Q dated June 2, 2004 in 1-6140). | |
| *10 | (g) | Second Amendment to Amended and Restated Credit Agreement among Dillard's, Inc. and JPMorgan Chase Bank (Exhibit 10 to Form 8-K dated June 3, 2005 in 1-6140). | |
| *10 | (h) | Purchase, Sale and Servicing Transfer Agreement among GE Capital Consumer Card Co., General Electric Capital Corporation, Dillard's, Inc. and Dillard National Bank (Exhibit 2.1 to Form 8-K dated as of August 12, 2004 in 1-6140). | |
| *10 | (i) | Private Label Credit Card Program Agreement between Dillard's, Inc. and GE Capital Consumer Card Co. (Exhibit 10.1 to Form 8-K dated as of August 12, 2004 in 1-6140). | |
| *10 | (j) | Third Amendment to Amended and Restated Credit Agreement between Dillard's, Inc. and JPMorgan Chase Bank, N.A. as agent for a syndicate of lenders (Exhibit 10.1 to Form 8-K dated June 12, 2006 in File No. 1-6140). | |
| *10 | (k) | Fourth Amendment to Amended and Restated Credit Agreement between Dillard's, Inc. and JPMorgan Chase Bank, N.A. as agent for a syndicate of lenders (Exhibit 10.2 to Form 8-K dated June 12, 2006 in File No. 1-6140). | |
| *10 | (l) | Fifth Amendment to Amended and Restated Credit Agreement between Dillard's, Inc. and JPMorgan Chase Bank, N.A. as agent for a syndicate of lenders (Exhibit 10.1 to Form 8-K dated May 4, 2007 in File No. 1-6140). | |
|
|
|||
E-1
| Number | Description | ||
|---|---|---|---|
| *10 | (m) | Sixth Amendment to Amended and Restated Credit Agreement between Dillard's, Inc. and JPMorgan Chase Bank, N.A. as agent for a syndicate of lenders (Exhibit 10 to Form 10-Q dated August 28, 2009 in File No. 1-6140). | |
|
|
21 |
|
Subsidiaries of Registrant. |
| 23 | (a) | Consent of Independent Registered Public Accounting Firm. | |
| 23 | (b) | Consent of Independent Registered Public Accounting Firm. | |
| 31 | (a) | Certification of Chief Executive Officer Pursuant to Section 302 of the Sarbanes-Oxley Act of 2002. | |
| 31 | (b) | Certification of Chief Financial Officer Pursuant to Section 302 of the Sarbanes-Oxley Act of 2002. | |
| 32 | (a) | Certification of Chief Executive Officer Pursuant to Section 906 of the Sarbanes-Oxley Act of 2002 (18 U.S.C. 1350). | |
| 32 | (b) | Certification of Chief Financial Officer Pursuant to Section 906 of the Sarbanes-Oxley Act of 2002 (18 U.S.C. 1350). | |
|
|
***101.INS |
|
XBRL Instance Document |
|
|
***101.SCH |
|
XBRL Taxonomy Extension Schema Document |
|
|
***101.CAL |
|
XBRL Taxonomy Extension Calculation Linkbase Document |
|
|
***101.DEF |
|
XBRL Taxonomy Extension Definition Linkbase Document |
|
|
***101.LAB |
|
XBRL Taxonomy Extension Label Linkbase Document |
|
|
***101.PRE |
|
XBRL Taxonomy Extension Presentation Linkbase Document |
- *
-
Incorporated
by reference as indicated.
- **
-
A
management contract or compensatory plan or arrangement required to be filed as an exhibit to this report pursuant to Item 14(c) of
Form 10-K.
- ***
- Pursuant to Rule 406T of Regulation S-T, the Interactive Data Files on Exhibit 101 hereto are deemed not filed or part of a registration statement or prospectus for purposes of Sections 11 or 12 of the Securities Act of 1933, as amended, are deemed not filed for purposes of Section 18 of the Securities and Exchange Act of 1934, as amended, and otherwise are not subject to liability under those sections.
E-2