DILLARD'S, INC.
10-Ks and 10-Qs
|
|
|
|
|
|
|
|
|
|
|
|
|
|
|
|
|
|
|
|
|
|
|
|
|
|
|
|
|
|
|
|
|
|
|
|
|
|
|
|
|
|
|
|
|
|
|
|
|
|
|
|
|
|
|
|
|
|
|
|
|
|
|
|
|
UNITED STATES
SECURITIES AND EXCHANGE COMMISSION
Washington, D.C. 20549
FORM 10-K
|
(Mark one)
|
|
|
|
ý
|
|
ANNUAL REPORT PURSUANT TO SECTION 13 OR 15(d) OF THE SECURITIES EXCHANGE ACT OF 1934
|
|
For the fiscal year ended January 28, 2017
|
||
|
or
|
||
|
o
|
|
TRANSITION REPORT PURSUANT TO SECTION 13 OR 15(d) OF THE SECURITIES EXCHANGE ACT OF 1934
|
|
For the transition period from to .
|
||
Commission file number 1-6140
DILLARD'S, INC.
(Exact name of registrant as specified in its charter)
|
DELAWARE
State or other jurisdiction
of incorporation or organization
|
|
71-0388071
(IRS Employer
Identification No.)
|
|
1600 CANTRELL ROAD, LITTLE ROCK, ARKANSAS
(Address of principal executive offices)
|
|
72201
(Zip Code)
|
Registrant's telephone number, including area code
(501) 376-5200
Securities registered pursuant to Section 12(b) of the Act:
|
Title of each class
|
|
Name of each exchange on which registered
|
|
Class A Common Stock
|
|
New York Stock Exchange
|
Securities registered pursuant to Section 12(g) of the Act:
None
Indicate by check mark if the registrant is a well-known seasoned issuer, as defined in Rule 405 of the Securities Act.
ý
Yes
o
No
Indicate by check mark if the registrant is not required to file reports pursuant to Section 13 or Section 15(d) of the Act.
o
Yes
ý
No
Indicate by check mark whether the registrant (1) has filed all reports required to be filed by Section 13 or 15(d) of the Securities Exchange Act of 1934 during the preceding 12 months (or for such shorter period that the registrant was required to file such reports), and (2) has been subject to such filing requirements for the past 90 days.
ý
Yes
o
No
Indicate by check mark whether the registrant has submitted electronically and posted on its corporate Web site, if any, every Interactive Data File required to be submitted and posted pursuant to Rule 405 of Regulation S-T (§232.405 of this chapter) during the preceding 12 months (or for such shorter period that the registrant was required to submit and post such files).
ý
Yes
o
No
Indicate by check mark if disclosure of delinquent filers pursuant to Item 405 of Regulation S-K (§ 229.405 of this chapter) is not contained herein, and will not be contained, to the best of registrant's knowledge, in definitive proxy or information statements incorporated by reference in Part III of this Form 10-K or any amendment to this Form 10-K.
ý
Indicate by check mark whether the registrant is a large accelerated filer, an accelerated filer, a non-accelerated filer, or a smaller reporting company. See the definitions of "large accelerated filer," "accelerated filer" and "smaller reporting company" in Rule 12b-2 of the Exchange Act.
|
Large Accelerated Filer
ý
|
|
Accelerated Filer
o
|
|
Non-Accelerated Filer
o
(Do not check if a
smaller reporting company)
|
|
Smaller Reporting Company
o
|
Indicate by check mark whether the registrant is a shell company (as defined in Rule 12b-2 of the Exchange Act). Yes
o
No
ý
State the aggregate market value of the voting and non-voting common equity held by non-affiliates of the registrant as of
July 30, 2016
:
$1,732,820,687
.
Indicate the number of shares outstanding of each of the registrant's classes of common stock as of
February 25, 2017
:
|
CLASS A COMMON STOCK, $0.01 par value
|
27,479,187
|
|
|
CLASS B COMMON STOCK, $0.01 par value
|
4,010,401
|
|
DOCUMENTS INCORPORATED BY REFERENCE
Portions of the Proxy Statement for the Annual Meeting of Stockholders to be held
May 20, 2017
(the "Proxy Statement") are incorporated by reference into Part III of this Form 10-K.
Table of Contents
|
Item No.
|
|
Page No.
|
|
|
||
|
|
||
|
|
||
|
16.
|
Form 10-K Summary
|
|
Dillard's, Inc. ("Dillard's", the "Company", "we", "us", "our" or "Registrant") ranks among the nation's largest fashion apparel, cosmetics and home furnishing retailers. The Company, originally founded in 1938 by William T. Dillard, was incorporated in Delaware in 1964. As of
January 28, 2017
, we operated 293 Dillard's stores, including 25 clearance centers, and an Internet store offering a wide selection of merchandise including fashion apparel for women, men and children, accessories, cosmetics, home furnishings and other consumer goods. The Company also operates a general contracting construction company, CDI Contractors, LLC ("CDI"), a portion of whose business includes constructing and remodeling stores for the Company.
The following table summarizes the percentage of net sales by segment and major product line:
|
|
Percentage of Net Sales
|
|||||||
|
|
Fiscal 2016
|
Fiscal 2015
|
Fiscal 2014
|
|||||
|
Retail operations segment:
|
|
|
|
|||||
|
Cosmetics
|
14
|
%
|
14
|
%
|
14
|
%
|
||
|
Ladies' apparel
|
22
|
|
22
|
|
22
|
|
||
|
Ladies' accessories and lingerie
|
16
|
|
16
|
|
16
|
|
||
|
Juniors' and children's apparel
|
8
|
|
8
|
|
9
|
|
||
|
Men's apparel and accessories
|
17
|
|
17
|
|
17
|
|
||
|
Shoes
|
16
|
|
16
|
|
16
|
|
||
|
Home and furniture
|
4
|
|
4
|
|
4
|
|
||
|
97
|
|
97
|
|
98
|
|
|||
|
Construction segment
|
3
|
|
3
|
|
2
|
|
||
|
Total
|
100
|
%
|
100
|
%
|
100
|
%
|
||
Additional information regarding our business, results of operations and financial condition, including information pertaining to our reporting segments, can be found in Management's Discussion and Analysis of Financial Condition and Results of Operations in Item 7 hereof and in Note 2 in the "Notes to Consolidated Financial Statements" in Item 8 hereof.
We operate retail department stores in 29 states, primarily in the southwest, southeast and midwest regions of the United States. Most of our stores are located in suburban shopping malls and open-air centers. Customers may also purchase our merchandise online at our website, www.dillards.com, which features online gift registries and a variety of other services.
Our retail merchandise business is conducted under highly competitive conditions. Although we are a large regional department store, we have numerous competitors at the national and local level that compete with our individual stores, including specialty, off-price, discount and Internet retailers. Competition is characterized by many factors including location, reputation, merchandise assortment, advertising, price, quality, operating efficiency, service and credit availability. We believe that our stores are in a strong competitive position with regard to each of these factors. Other retailers may compete for customers on some or all of these factors, or on other factors, and may be perceived by some potential customers as being better aligned with their particular preferences.
Our merchandise selections include, but are not limited to, our lines of exclusive brand merchandise such as Antonio Melani, Gianni Bini, GB, Roundtree & Yorke and Daniel Cremieux. Our exclusive brands/private label merchandise program provides benefits for Dillard's and our customers. Our customers receive fashionable, higher quality product often at a savings compared to national brands. Our private label merchandise program allows us to ensure the Company's high standards are achieved, while minimizing costs and differentiating our merchandise offerings from other retailers.
We have made a significant investment in our trademark and license portfolio, in terms of design function, advertising, quality control and quick response to market trends in a quality manufacturing environment. Dillard's trademark registrations are maintained for as long as Dillard's holds the exclusive right to use the trademarks on the listed products.
Our merchandising, sales promotion and store operating support functions are conducted primarily at our corporate headquarters. Our back office sales support functions, such as accounting, product development, store planning and information technology, are also centralized.
1
We have developed a knowledge of each of our trade areas and customer bases for our stores. This knowledge is enhanced through regular store visits by senior management and merchandising personnel and through the use of online merchandise information and is supported by our regional merchandising offices. We will continue to use existing technology and research to edit merchandise assortments by store to meet the specific preference, taste and size requirements of each local operating area.
Certain departments in our stores are licensed to independent companies in order to provide high quality service and merchandise where specialization, focus and expertise are critical. The licensed departments vary by store to complement our own merchandising departments. The principal licensed department is an upscale women's apparel vendor in certain stores. The terms of the license agreements typically range between three and five years with one year renewals and require the licensee to pay for fixtures and to provide their own employees. We regularly evaluate the performance of the licensed departments and require compliance with established customer service guidelines.
Synchrony Financial ("Synchrony"; formerly GE Consumer Finance) owned and managed Dillard's private label credit cards, including credit cards co-branded with American Express (collectively "private label cards"), under a long-term marketing and servicing alliance ("Synchrony Alliance") that expired in November 2014. Following this scheduled expiration, Wells Fargo Bank, N.A. ("Wells Fargo") purchased the Dillard's private label card portfolio from Synchrony and began managing Dillard's private label cards under a new 10-year agreement ("Wells Fargo Alliance"). Under the Wells Fargo Alliance, Wells Fargo establishes and owns private label card accounts for our customers, retains the benefits and risks associated with the ownership of the accounts, provides key customer service functions, including new account openings, transaction authorization, billing adjustments and customer inquiries, receives the finance charge income and incurs the bad debts associated with those accounts. Pursuant to the Wells Fargo Alliance, we receive on-going cash compensation from Wells Fargo based upon the portfolio's earnings. The compensation earned on the portfolio is determined monthly and has no recourse provisions. We participate in the marketing of the private label cards and accept payments on the private label cards in our stores as a convenience to customers who prefer to pay in person rather than by paying online or mailing their payments to Wells Fargo. The Wells Fargo Alliance expires in fiscal 2024.
We seek to expand the number and use of the private label cards by, among other things, providing incentives to sales associates to open new credit accounts, which generally can be opened while a customer is visiting one of our stores. Customers who open accounts are rewarded with discounts on future purchases. Private label card customers are sometimes offered private shopping nights, direct mail catalogs, special discounts and advance notice of sale events. Wells Fargo administers the loyalty program that rewards customers for private label card usage.
Our earnings depend to a significant extent on the results of operations for the last quarter of our fiscal year. Due to holiday buying patterns, sales for that period average approximately one-third of annual sales.
As of
January 28, 2017
, we employed approximately 40,000 full-time and part-time associates, of which approximately 46% were part-time. The number of associates varies during the year, with increases occurring during peak seasonal selling periods.
We purchase merchandise from many sources and do not believe that we are dependent on any one supplier. We have no long-term purchase commitments or arrangements with any of our suppliers, but we consider our relationships to be strong and mutually beneficial.
Our fiscal year ends on the Saturday nearest January 31 of each year. Fiscal years 2016, 2015 and 2014 ended January 28, 2017, January 30, 2016 and January 31, 2015, respectively, and each contained 52 weeks.
The information contained on our website is not incorporated by reference into this Annual Report on Form 10-K (this "Annual Report") and should not be considered to be a part of this Annual Report. Our Annual Report, quarterly reports on Form 10-Q, current reports on Form 8-K, statements of changes in beneficial ownership of securities on Form 4 and Form 5 and amendments to those reports filed or furnished pursuant to Section 13(a), 15(d) or 16 of the Securities Exchange Act of 1934, as amended (the "Exchange Act"), as applicable, are available free of charge (as soon as reasonably practicable after we electronically file such material with, or furnish it to, the SEC) on the Dillard's, Inc. website: www.dillards.com.
We have adopted a Code of Conduct and Corporate Governance Guidelines, as required by the listing standards of the New York Stock Exchange and the rules of the SEC. We have posted on our website our Code of Conduct, Corporate Governance Guidelines, Social Accountability Policy, our most recent Social Accountability Report and committee charters for the Audit Committee of the Board of Directors and the Stock Option and Executive Compensation Committee of the Board of Directors.
Our corporate offices are located at 1600 Cantrell Road, Little Rock, Arkansas 72201, telephone: 501-376-5200.
2
The risks described in this Item 1A, Risk Factors, of this Annual Report could materially and adversely affect our business, financial condition and results of operations.
The Company cautions that forward-looking statements, as such term is defined in the Private Securities Litigation Reform Act of 1995, contained in this Annual Report on Form 10-K are based on estimates, projections, beliefs and assumptions of management at the time of such statements and are not guarantees of future performance. The Company disclaims any obligation to update or revise any forward-looking statements based on the occurrence of future events, the receipt of new information, or otherwise. Forward-looking statements of the Company involve risks and uncertainties and are subject to change based on various important factors. Actual future performance, outcomes and results may differ materially from those expressed in forward-looking statements made by the Company and its management as a result of a number of risks, uncertainties and assumptions.
The retail merchandise business is highly competitive, and that competition could lower our revenues, margins and market share.
We conduct our retail merchandise business under highly competitive conditions. Competition is characterized by many factors including location, reputation, fashion, merchandise assortment, advertising, operating efficiency, price, quality, customer service and credit availability. We have numerous competitors nationally, locally and on the Internet, including conventional department stores, specialty retailers, off-price and discount stores, boutiques, mass merchants, and Internet and mail-order retailers. Although we are a large regional department store, some of our competitors are larger than us with greater financial resources and, as a result, may be able to devote greater resources to sourcing, promoting and selling their products. Additionally, we compete in certain markets with a substantial number of retailers that specialize in one or more types of merchandise that we sell. In recent years, competition has intensified as a result of reduced discretionary consumer spending, increased promotional activity, deep price discounting, and few barriers to entry. Also, online retail shopping continues to rapidly evolve, and we continue to expect competition in the e-commerce market to intensify in the future as the Internet facilitates competitive entry and comparison shopping. We anticipate that intense competition will continue from both existing competitors and new entrants. If we are unable to maintain our competitive position, we could experience downward pressure on prices, lower demand for products, reduced margins, the inability to take advantage of new business opportunities and the loss of market share.
Changes in economic, financial and political conditions, and the resulting impact on consumer confidence and consumer spending, could have an adverse effect on our business and results of operations.
The retail merchandise business is highly sensitive to changes in overall economic and political conditions that impact consumer confidence and spending. Various economic conditions affect the level of disposable income consumers have available to spend on the merchandise we offer, including unemployment rates, interest rates, taxation, energy costs, the availability of consumer credit, the price of gasoline, consumer confidence in future economic conditions and general business conditions. Due to the Company's concentration of stores in energy producing regions, recent declining conditions in these regions could adversely affect the Company's sales. Consumer purchases of discretionary items and other retail products generally decline during recessionary periods, and also may decline at other times when changes in consumer spending patterns affect us unfavorably. In addition, any significant decreases in shopping mall traffic could also have an adverse effect on our results of operations.
Our business is dependent upon our ability to accurately predict rapidly changing fashion trends, customer preferences, and other fashion-related factors.
Our sales and operating results depend in part on our ability to effectively predict and quickly respond to changes in fashion trends and customer preferences. We continuously assess emerging styles and trends and focus on developing a merchandise assortment to meet customer preferences at competitive prices. Even with these efforts, we cannot be certain that we will be able to successfully meet constantly changing fashion trends and customer preferences. If we are unable to successfully predict or respond to changing styles or preferences, we may be faced with lower sales, increased inventories, additional markdowns or promotional sales to dispose of excess or slow-moving inventory, and lower gross margins, all of which would have an adverse effect on our business, financial condition, and results of operations.
3
Our failure to protect our reputation could have an adverse effect on our business.
We offer our customers quality products at competitive prices and a high level of customer service, resulting in a well-recognized brand and customer loyalty. Among other things, failure to respond rapidly to changing trends could diminish brand and customer loyalty and impact our reputation with customers.
Any significant damage to our brand or reputation could negatively impact sales, diminish customer trust and generate negative sentiment, any of which would harm our business and results of operation.
Fluctuations in the price of merchandise, raw materials, fuel and labor or their reduced availability could increase our cost of goods and negatively impact our financial results.
Fluctuations in the price and availability of fuel, labor and raw materials, combined with the inability to mitigate or to pass cost increases on to our customers or to change our merchandise mix as a result of such cost increases, could have an adverse impact on our profitability. Attempts to pass such costs along to our customers, however, might cause a decline in our sales volume. Additionally, any decrease in the availability of raw materials could impair our ability to meet our purchasing requirements in a timely manner. Both the increased cost and lower availability of merchandise, raw materials, fuel and labor may also have an adverse impact on our cash and working capital needs.
Third party suppliers on whom we rely to obtain materials and provide production facilities may experience financial difficulties due to current and future economic conditions.
Our suppliers may experience financial difficulties due to a downturn in the industry or in other macroeconomic environments. Our suppliers' cash and working capital needs can be adversely impacted by the increased cost and lower availability of merchandise, raw materials, fuel and labor. Current and future economic conditions may prevent our suppliers from obtaining financing on favorable terms, which could impact their ability to supply us with merchandise on a timely basis.
We source many of our products from foreign countries, which exposes us to certain risks that include political and economic conditions.
Political discourse has recently focused on ways to discourage corporations in the United States from outsourcing manufacturing and production activities to foreign jurisdictions. Proposals to address this concern include the possibility of imposing tariffs, border adjustments or other penalties on goods manufactured outside the United States to attempt to discourage these practices. It has also been suggested that the United States may materially modify or withdraw from some of its existing trade agreements. Any of these actions, if ultimately enacted, could negatively impact our ability to source products from foreign jurisdictions and could lead to an increase in the cost of goods and adversely affect our profitability.
Moreover, our third-party suppliers in foreign jurisdictions are subject to political and economic uncertainty. We are subject to risks and uncertainties associated with changing economic and political conditions in foreign countries where our suppliers are located, including increased import duties, tariffs, trade restrictions and quotas, work stoppages, economic uncertainties, adverse foreign government regulations, wars, fears of war, terrorist attacks and organizing activities, adverse fluctuations of foreign currencies and political unrest. We cannot predict when, or the extent to which, the countries in which our products are manufactured will experience any of the foregoing events. Any event causing a disruption or delay of imports from foreign locations would likely increase the cost or reduce the supply of merchandise available to us and would adversely affect our operating results. In addition, trade restrictions, including increased tariffs or quotas, embargoes, safeguards, and customs restrictions against apparel items, as well as United States or foreign labor strikes, work stoppages, or boycotts, could increase the cost or reduce the supply of merchandise available to us or may require us to modify our current business practices, any of which could adversely affect our profitability.
Failure by third party suppliers to comply with our supplier compliance programs or applicable laws could have a material adverse effect on our business.
All of our suppliers must comply with our supplier compliance programs and applicable laws, including consumer and product safety laws, but we do not control our vendors or their labor and business practices. The violation of labor or other laws by one of our vendors could have an adverse effect on our business. Additionally, although we diversify our sourcing and production, the failure of any supplier to produce and deliver our goods on time, to meet our quality standards and adhere to our product safety requirements or to meet the requirements of our supplier compliance program or applicable laws, could impact our ability to flow merchandise to our stores or directly to consumers in the right quantities at the right time, which could adversely affect our profitability and could result in damage to our reputation and translate into sales losses.
4
A decrease in cash flows from our operations and constraints to accessing other financing sources could limit our ability to fund our operations, capital projects, interest and debt repayments, stock repurchases and dividends.
Our business depends upon our operations to generate strong cash flow and to some extent upon the availability of financing sources to supply capital to fund our general operating activities, capital projects, interest and debt repayments, stock repurchases and dividends. Our inability to continue to generate sufficient cash flows to support these activities or the lack of available financing in adequate amounts and on appropriate terms when needed could adversely affect our financial performance including our earnings per share.
Reductions in the income and cash flow from our long-term marketing and servicing alliance related to our private label credit cards could impact operating results and cash flows.
Wells Fargo owns and manages our private label credit cards under the Wells Fargo Alliance. The Wells Fargo Alliance provides for certain payments to be made by Wells Fargo to the Company, including the Company's share of revenues under this alliance. The income and cash flow that the Company receives from the Wells Fargo Alliance is dependent upon a number of factors including the level of sales on Wells Fargo accounts, the level of balances carried on the Wells Fargo accounts by Wells Fargo customers, payment rates on Wells Fargo accounts, finance charge rates and other fees on Wells Fargo accounts, the level of credit losses for the Wells Fargo accounts, Wells Fargo's ability to extend credit to our customers as well as the cost of customer rewards programs, all of which can vary based on changes in federal and state banking and consumer protection laws and from a variety of economic, legal, social and other factors that we cannot control. If the income or cash flow that the Company receives from the Wells Fargo Alliance decreases, our operating results and cash flows could be adversely affected.
Credit card operations are subject to numerous federal and state laws that impose disclosure and other requirements upon the origination, servicing, and enforcement of credit accounts, and limitations on the amount of finance charges and fees that may be charged by a credit card provider. Wells Fargo may be subject to regulations that may adversely impact its operation of our private label credit card. To the extent that such limitations or regulations materially limit the availability of credit or increase the cost of credit to our cardholders or negatively impact provisions which affect our revenue streams associated with our private label credit card, our results of operations could be adversely affected. In addition, changes in credit card use, payment patterns, or default rates could be affected by a variety of economic, legal, social, or other factors over which we have no control and cannot predict with certainty. Such changes could also negatively impact our ability to facilitate consumer credit or increase the cost of credit to our cardholders.
Our business is seasonal, and fluctuations in our revenues during the last quarter of our fiscal year can have a disproportionate effect on our results of operations.
Our business, like many other retailers, is subject to seasonal influences, with a significant portion of sales and income typically realized during the last quarter of our fiscal year due to the holiday season. Our fiscal fourth-quarter results may fluctuate significantly, based on many factors, including holiday spending patterns and weather conditions, and any such fluctuation could have a disproportionate effect on our results of operations for the entire fiscal year. Because of the seasonality of our business, our operating results vary considerably from quarter to quarter, and results from any quarter are not necessarily indicative of the results that may be achieved for a full fiscal year.
A shutdown of, or disruption in, any of the Company's distribution or fulfillment centers would have an adverse effect on the Company's business and operations.
Our business depends on the orderly operation of the process of receiving and distributing merchandise, which relies on adherence to shipping schedules and effective management of distribution centers. Although we believe that our receiving and distribution process is efficient and that we have appropriate contingency plans, unforeseen disruptions in operations due to fire, severe weather conditions, natural disasters, or other catastrophic events, labor disagreements, or other shipping problems may result in the loss of inventory and/or delays in the delivery of merchandise to our stores and customers.
Current store locations may become less desirable, and desirable new locations may not be available for a reasonable price, if at all, either of which could adversely affect our results of operations.
In order to generate customer traffic and for convenience of our customers, we attempt to locate our stores in desirable locations within shopping malls and open air centers. Our stores benefit from the abilities that our Company, other anchor tenants and other area attractions have to generate consumer traffic. Adverse changes in the development of new shopping malls in the United States, the availability or cost of appropriate locations within existing or new shopping malls, competition with other retailers for prominent locations, the success of individual shopping malls and the success or failure of other anchor tenants, or the continued popularity of shopping malls may impact our ability to maintain or grow our sales in our existing stores, as well as our ability to open new stores, which could have an adverse effect on our financial condition or results of operations.
5
Ownership and leasing of significant amounts of real estate exposes us to possible liabilities and losses.
We own the land and building, or lease the land and/or the building, for all of our stores. Accordingly, we are subject to all of the risks associated with owning and leasing real estate. In particular, the value of our real estate assets could decrease, and their operating costs could increase, because of changes in the investment climate for real estate, demographic trends and supply or demand for the use of the store, which may result from competition from similar stores in the area. Additionally, we are subject to potential liability for environmental conditions on the property that we own or lease. If an existing owned store is not profitable, and we decide to close it, we may be required to record an impairment charge and/or exit costs associated with the disposal of the store. We generally cannot cancel our leases. If an existing or future store is not profitable, and we decide to close it, we may be committed to perform certain obligations under the applicable lease including, among other things, paying the base rent for the balance of the lease term. In addition, as each of the leases expires, we may be unable to negotiate renewals, either on commercially acceptable terms or at all, which could cause us to close stores in desirable locations. We may not be able to close an unprofitable owned store due to an existing operating covenant which may cause us to operate the location at a loss and prevent us from finding a more desirable location. We have approximately 75 stores along the Gulf and Atlantic coasts that are covered by third-party insurance but are self-insured for property and merchandise losses related to "named storms." As a result, the repair and replacement costs will be borne by us for damage to any of these stores from "named storms," which could have an adverse effect on our financial condition or results of operations.
A privacy breach could adversely affect our business, reputation and financial condition.
We receive certain personal information about our employees and our customers, including information permitting cashless payments, both in our stores and through our online operations at www.dillards.com. In addition, our online operations depend upon the secure transmission of confidential information over public networks.
We have a longstanding Information Security Program committed to regular risk assessment practices surrounding the protection of confidential data. This program includes network segmentation and access controls around the computer resources that house confidential data. We continue to evaluate the security environment surrounding the handling and control of our critical data, especially the private data we receive from our customers, and we institute additional measures to help protect us from a privacy breach.
Despite our security measures, it is possible that unauthorized persons (through cyberattacks, which are evolving and becoming increasingly sophisticated, physical breach or other means) might defeat our security measures, those of Wells Fargo or of our other third party service providers or vendors, and obtain personal information of customers, employees or others. We have purchased Network Security and Cyber Liability insurance to provide some financial protection should a privacy breach occur; however, such a compromise, whether in our information security system or our third party service providers or vendors, resulting in personal information being obtained by unauthorized persons could adversely affect our reputation with our customers, employees and others, as well as our operations, results of operations, financial condition and liquidity, and could result in litigation against us or the imposition of penalties. In addition, a security breach could require that we expend significant additional resources related to our information security systems and could result in a disruption of our operations, particularly our online sales operations.
Litigation with customers, employees and others could harm our reputation and impact operating results.
In the ordinary course of business, we may be involved in lawsuits and regulatory actions. We are impacted by trends in litigation, including, but not limited to, class-action allegations brought under various consumer protection, employment, and privacy and information security laws. Additionally, we may be subject to employment-related claims alleging discrimination, harassment, wrongful termination and wage issues, including those relating to overtime compensation. We are susceptible to claims filed by customers alleging responsibility for injury suffered during a visit to a store or from product defects, and we are also subject to lawsuits filed by patent holders alleging patent infringement. These types of claims, as well as other types of lawsuits to which we are subject from time to time, can distract management's attention from core business operations and impact operating results, particularly if a lawsuit results in an unfavorable outcome.
6
Our profitability may be adversely impacted by weather conditions.
Our merchandise assortments reflect assumptions regarding expected weather patterns and our profitability depends on our ability to timely deliver seasonally appropriate inventory. Unexpected or unseasonable weather conditions could render a portion of our inventory incompatible with consumer needs. For example, extended periods of unseasonably warm temperatures during the winter season or cool weather during the summer season could render a portion of the Company's inventory incompatible with those unseasonable conditions. Additionally, extreme weather or natural disasters, particularly in the areas in which our stores are located, could also severely hinder our ability to timely deliver seasonally appropriate merchandise. For example, frequent or unusually heavy snowfall, ice storms, rainstorms or other extreme weather conditions over a prolonged period could make it difficult for the Company's customers to travel to its stores and thereby reduce the Company's sales and profitability. A reduction in the demand for or supply of our seasonal merchandise or reduced sales due to reduced customer traffic in our stores could have an adverse effect on our inventory levels, gross margins and results of operations.
Natural disasters, war, acts of terrorism, other armed conflicts, and public health issues may adversely impact our business.
The occurrence of, or threat of, a natural disaster, war, acts of terrorism, other armed conflicts, and public health issues could disrupt our operations, disrupt international trade and supply chain efficiencies, suppliers or customers, or result in political or economic instability. If commercial transportation is curtailed or substantially delayed our business may be adversely impacted, as we may have difficulty shipping merchandise to our distribution centers, fulfillment centers, stores, or directly to customers. As a result of the occurrence of, or threat of, a natural disaster or acts of terrorism in the United States, we may be required to suspend operations in some or all of our stores, which could have a material adverse impact on our business, financial condition, and results of operations.
Increases in the cost of employee benefits could impact the Company's financial results and cash flows.
The Company's expenses relating to employee health benefits are significant. Unfavorable changes in the cost of such benefits could impact the Company's financial results and cash flows. Healthcare costs have risen significantly in recent years, and recent legislative and private sector initiatives regarding healthcare reform could result in significant changes to the U.S. healthcare system. Many of our employees who currently choose not to participate in our healthcare plans may find it more advantageous to do so as a result of recent changes to healthcare laws in the United States. Such changes include potential penalties on persons for not obtaining healthcare coverage. Additionally, employees may be ineligible for certain healthcare subsidies if such employee is eligible and offered qualifying and affordable healthcare coverage under an employer's plan. If a large portion of eligible employees who currently choose not to participate in our plans choose to enroll as a result of the law change, it may significantly increase our healthcare coverage costs, or we may not be able to offer competitive health care benefits to attract and retain employees; either of which could have an adverse effect on our reputation and have a negative impact on our financial results.
The Company depends on its ability to attract and retain quality employees, and failure to do so could adversely affect our ability to execute our business strategy and our operating results.
The Company's business is dependent upon attracting and retaining quality employees. The Company has a large number of employees, many of whom are in entry level or part-time positions with historically high rates of turnover. The Company's ability to meet its labor needs while controlling the costs associated with hiring and training new employees is subject to external factors such as unemployment levels, changing demographics, prevailing wage rates, and current or future minimum wage and health care reform legislation. In addition, as a complex enterprise operating in a highly competitive and challenging business environment, the Company is highly dependent upon management personnel to develop and effectively execute successful business strategies and tactics. Any circumstances that adversely impact the Company's ability to attract, train, develop and retain quality employees throughout the organization could adversely affect the Company's business and results of operations.
Variations in the amount of vendor allowances received could adversely impact our operating results.
We receive vendor allowances for advertising, payroll and margin maintenance that are a strategic part of our operations. A reduction in the amount of cooperative advertising allowances would likely cause us to consider other methods of advertising as well as the volume and frequency of our product advertising, which could increase/decrease our expenditures and/or revenue. Decreased payroll reimbursements would either cause payroll costs to rise, negatively impacting operating income, or cause us to reduce the number of employees, which may cause a decline in sales. A decline in the amount of margin maintenance allowances would either increase cost of sales, which would negatively impact gross margin and operating income, or cause us to reduce merchandise purchases, which may cause a decline in sales.
7
Our operations are dependent on information technology systems, and disruptions in those systems could have an adverse impact on our results of operations.
Our operations are dependent upon the integrity, security and consistent operation of various systems and data centers, including the point-of-sale systems in the stores, our Internet website, data centers that process transactions, communication systems and various software applications used throughout our Company to track inventory flow, process transactions and generate performance and financial reports. The Company's computer systems are subject to damage or interruption from power outages, computer and telecommunications failures, computer viruses, cyberattack or other security breaches, catastrophic events such as fires, floods, earthquakes, tornadoes, hurricanes, acts of war or terrorism, and usage errors by the Company's employees. If the Company's computer systems are damaged or cease to function properly, the Company may have to make a significant investment to repair or replace them, and the Company may suffer loss of critical data and interruptions or delays in its operations in the interim. Any material interruption in the Company's computer systems could adversely affect its business or results of operations. Additionally, to keep pace with changing technology, we must continuously provide for the design and implementation of new information technology systems and enhancements of our existing systems. We could encounter difficulties in developing new systems or maintaining and upgrading existing systems. Such difficulties could lead to significant expenses or to losses due to disruption in business operations.
The percentage-of-completion method of accounting that we use to recognize contract revenues for our construction segment may result in material adjustments, which could result in a charge against our earnings.
Our construction segment recognizes contract revenues using the percentage-of-completion method. Under this method, estimated contract revenues are recognized by applying the percentage of completion of the project for the period to the total estimated revenues for the contract. Estimated contract losses are recognized in full when determined. Total contract revenues and cost estimates are reviewed and revised at a minimum on a quarterly basis as the work progresses and as change orders are approved. Adjustments based upon the percentage of completion are reflected in contract revenues in the period when these estimates are revised. To the extent that these adjustments result in an increase, a reduction or an elimination of previously reported contract profit, we are required to recognize a credit or a charge against current earnings, which could be material.
8
None.
All of our stores are owned by us or leased from third parties. At
January 28, 2017
, we operated 293 stores in 29 states totaling approximately 49.2 million square feet of which we owned approximately 44.1 million square feet. Our third-party store leases typically provide for rental payments based on a percentage of net sales with a guaranteed minimum annual rent. In general, the Company pays the cost of insurance, maintenance and real estate taxes related to the leases.
The following table summarizes by state of operation the number of retail stores we operate and the corresponding owned and leased footprint at
January 28, 2017
:
|
Location
|
Number
of stores
|
Owned
Stores
|
Leased
Stores
|
Owned
Building
on Leased
Land
|
Partially
Owned
and
Partially
Leased
|
|||||||||
|
Alabama
|
9
|
|
9
|
|
—
|
|
—
|
|
—
|
|
||||
|
Arkansas
|
8
|
|
7
|
|
—
|
|
—
|
|
1
|
|
||||
|
Arizona
|
17
|
|
16
|
|
—
|
|
1
|
|
—
|
|
||||
|
California
|
3
|
|
3
|
|
—
|
|
—
|
|
—
|
|
||||
|
Colorado
|
7
|
|
7
|
|
—
|
|
—
|
|
—
|
|
||||
|
Florida
|
42
|
|
39
|
|
1
|
|
2
|
|
—
|
|
||||
|
Georgia
|
12
|
|
8
|
|
3
|
|
1
|
|
—
|
|
||||
|
Iowa
|
5
|
|
5
|
|
—
|
|
—
|
|
—
|
|
||||
|
Idaho
|
2
|
|
2
|
|
—
|
|
—
|
|
—
|
|
||||
|
Illinois
|
3
|
|
3
|
|
—
|
|
—
|
|
—
|
|
||||
|
Indiana
|
3
|
|
3
|
|
—
|
|
—
|
|
—
|
|
||||
|
Kansas
|
6
|
|
3
|
|
1
|
|
2
|
|
—
|
|
||||
|
Kentucky
|
6
|
|
5
|
|
1
|
|
—
|
|
—
|
|
||||
|
Louisiana
|
15
|
|
14
|
|
1
|
|
—
|
|
—
|
|
||||
|
Missouri
|
9
|
|
6
|
|
1
|
|
2
|
|
—
|
|
||||
|
Mississippi
|
6
|
|
4
|
|
1
|
|
1
|
|
—
|
|
||||
|
Montana
|
2
|
|
2
|
|
—
|
|
—
|
|
—
|
|
||||
|
North Carolina
|
14
|
|
14
|
|
—
|
|
—
|
|
—
|
|
||||
|
Nebraska
|
3
|
|
2
|
|
1
|
|
—
|
|
—
|
|
||||
|
New Mexico
|
6
|
|
3
|
|
3
|
|
—
|
|
—
|
|
||||
|
Nevada
|
5
|
|
5
|
|
—
|
|
—
|
|
—
|
|
||||
|
Ohio
|
14
|
|
11
|
|
3
|
|
—
|
|
—
|
|
||||
|
Oklahoma
|
10
|
|
6
|
|
4
|
|
—
|
|
—
|
|
||||
|
South Carolina
|
7
|
|
7
|
|
—
|
|
—
|
|
—
|
|
||||
|
Tennessee
|
10
|
|
8
|
|
1
|
|
—
|
|
1
|
|
||||
|
Texas
|
58
|
|
43
|
|
8
|
|
1
|
|
6
|
|
||||
|
Utah
|
4
|
|
4
|
|
—
|
|
—
|
|
—
|
|
||||
|
Virginia
|
6
|
|
5
|
|
—
|
|
1
|
|
—
|
|
||||
|
Wyoming
|
1
|
|
1
|
|
—
|
|
—
|
|
—
|
|
||||
|
Total
|
293
|
|
245
|
|
29
|
|
11
|
|
8
|
|
||||
9
At
January 28, 2017
, we operated the following additional facilities:
|
Facility
|
Location
|
Square Feet
|
Owned /
Leased
|
|||
|
Distribution Centers:
|
Mabelvale, Arkansas
|
400,000
|
|
Owned
|
||
|
Gilbert, Arizona
|
295,000
|
|
Owned
|
|||
|
Valdosta, Georgia
|
370,000
|
|
Owned
|
|||
|
Olathe, Kansas
|
500,000
|
|
Owned
|
|||
|
Salisbury, North Carolina
|
355,000
|
|
Owned
|
|||
|
Ft. Worth, Texas
|
700,000
|
|
Owned
|
|||
|
Internet Fulfillment Center
|
Maumelle, Arkansas
|
850,000
|
|
Owned
|
||
|
Dillard's Executive Offices
|
Little Rock, Arkansas
|
333,000
|
|
Owned
|
||
|
CDI Contractors, LLC Executive Office
|
Little Rock, Arkansas
|
25,000
|
|
Owned
|
||
|
CDI Storage Facilities
|
Maumelle, Arkansas
|
66,000
|
|
Owned
|
||
|
Total
|
|
3,894,000
|
|
|
||
Additional property information is contained in Notes 1, 12 and 13 in the "Notes to Consolidated Financial Statements," in Item 8 hereof.
From time to time, the Company is involved in litigation relating to claims arising out of the Company's operations in the normal course of business. This may include litigation with customers, employment related lawsuits, class action lawsuits, purported class action lawsuits and actions brought by governmental authorities. As of
March 24, 2017
, neither the Company nor any of its subsidiaries is a party to, nor is any of their property the subject of, any material legal proceedings.
Not applicable.
10
EXECUTIVE OFFICERS OF THE COMPANY
The following table lists the names and ages of all executive officers of the Company, the nature of any family relationship between them and the Company's CEO and all positions and offices with the Company presently held by each person named. Each is elected to serve a one-year term. There are no other persons chosen to become executive officers.
|
Name
|
Age
|
Position & Office
|
Held Present
Office Since
|
Family Relationship to CEO
|
|||||
|
William Dillard, II
|
72
|
|
Director; Chief Executive Officer
|
1998
|
Not applicable
|
||||
|
Alex Dillard
|
67
|
|
Director; President
|
1998
|
Brother of William Dillard, II
|
||||
|
Mike Dillard
|
65
|
|
Director; Executive Vice President
|
1984
|
Brother of William Dillard, II
|
||||
|
Drue Matheny
|
70
|
|
Director; Executive Vice President
|
1998
|
Sister of William Dillard, II
|
||||
|
Chris B. Johnson (1)
|
45
|
|
Senior Vice President; Co-Principal Financial Officer
|
2015
|
None
|
||||
|
Phillip R. Watts (2)
|
54
|
|
Senior Vice President; Co-Principal Financial Officer and Principal Accounting Officer
|
2015
|
None
|
||||
|
William Dillard, III (3)
|
46
|
|
Senior Vice President
|
2015
|
Son of William Dillard, II
|
||||
|
Denise Mahaffy (4)
|
58
|
|
Senior Vice President
|
2015
|
Sister of William Dillard, II
|
||||
|
Dean L. Worley (5)
|
51
|
|
Vice President; General Counsel
|
2012
|
None
|
||||
|
Mike McNiff
|
64
|
|
Vice President
|
1995
|
None
|
||||
|
Brant Musgrave (6)
|
44
|
|
Vice President
|
2014
|
None
|
||||
|
Mike Litchford (7)
|
51
|
|
Vice President
|
2016
|
None
|
||||
|
Tom Bolin (8)
|
54
|
|
Vice President
|
2016
|
None
|
||||
_______________________________________________________________________________
|
(1)
|
Mr. Johnson served as Vice President of Accounting from 2006 to 2012 and served as Vice President of Real Estate from 2012 to 2015. In 2015, he was promoted to Senior Vice President and Co-Principal Financial Officer. Since 2008, Mr. Johnson has also served as Chief Financial Officer of CDI, the Company's wholly-owned general contracting construction subsidiary.
|
|
(2)
|
Mr. Watts served as Vice President of Tax from 2002 to 2015. In 2015, he was promoted to Senior Vice President, Co-Principal Financial Officer and Principal Accounting Officer.
|
|
(3)
|
Mr. Dillard served as Vice President of Corporate Merchandising and Product Development from 2001 to 2015. In 2015, he was promoted to Senior Vice President.
|
|
(4)
|
Mrs. Mahaffy served as Corporate Vice President of Advertising from 2000 to 2015. In 2015, she was promoted to Senior Vice President.
|
|
(5)
|
Mr. Worley served as Assistant General Counsel from 1996 to 2012. In 2012, he was promoted to Vice President and General Counsel.
|
|
(6)
|
Mr. Musgrave served as a Regional Vice President of Stores from 2007 to 2014. In 2014, he was promoted to Corporate Vice President of Stores.
|
|
(7)
|
Mr. Litchford served as a Regional Vice President of Stores from 2005 to 2016. In 2016, he was promoted to Corporate Vice President of Stores.
|
|
(8)
|
Mr. Bolin served as a Regional Vice President of Stores from 2000 to 2016. In 2016, he was promoted to Corporate Vice President of Stores.
|
11
|
ITEM 5.
|
MARKET FOR REGISTRANT'S COMMON EQUITY, RELATED STOCKHOLDER MATTERS AND ISSUER PURCHASES OF EQUITY SECURITIES.
|
Market and Dividend Information for Common Stock
The Company's Class A Common Stock trades on the New York Stock Exchange under the Ticker Symbol "DDS". No public market currently exists for the Company's Class B Common Stock.
The high and low sales prices of the Company's Class A Common Stock, and dividends declared on each class of common stock, for each quarter of fiscal 2016 and 2015 are presented in the table below:
|
|
2016
|
2015
|
Dividends
per Share
|
|||||||||||||||||||||
|
Fiscal Quarter
|
High
|
Low
|
High
|
Low
|
2016
|
2015
|
||||||||||||||||||
|
First
|
$
|
88.58
|
|
$
|
65.24
|
|
$
|
144.21
|
|
$
|
111.55
|
|
$
|
0.07
|
|
$
|
0.06
|
|
||||||
|
Second
|
72.08
|
|
54.37
|
|
133.92
|
|
98.11
|
|
0.07
|
|
0.06
|
|
||||||||||||
|
Third
|
77.70
|
|
56.05
|
|
103.09
|
|
85.61
|
|
0.07
|
|
0.07
|
|
||||||||||||
|
Fourth
|
75.54
|
|
54.42
|
|
91.22
|
|
60.66
|
|
0.07
|
|
0.07
|
|
||||||||||||
While the Company expects to continue paying quarterly cash dividends during fiscal 2017, all prospective dividends are subject to and conditional upon the review and approval of and declaration by the Board of Directors.
Stockholders
As of
February 25, 2017
, there were 2,741 holders of record of the Company's Class A Common Stock and 8 holders of record of the Company's Class B Common Stock.
Repurchase of Common Stock
|
Issuer Purchases of Equity Securities
|
||||||||||||||
|
Period
|
(a) Total Number of Shares Purchased
|
|
(b) Average Price Paid per Share
|
|
(c) Total Number of Shares Purchased as Part of Publicly Announced Plans or Programs
|
|
(d) Approximate Dollar Value of Shares that May Yet Be Purchased Under the Plans or Programs
|
|
||||||
|
October 30, 2016 through November 26, 2016
|
71,896
|
|
$
|
60.89
|
|
71,896
|
|
$
|
330,005,062
|
|
||||
|
November 27, 2016 through December 31, 2016
|
465,345
|
|
64.86
|
|
465,345
|
|
299,823,501
|
|
||||||
|
January 1, 2017 through January 28, 2017
|
806,018
|
|
57.07
|
|
806,018
|
|
253,827,299
|
|
||||||
|
Total
|
1,343,259
|
|
$
|
59.97
|
|
1,343,259
|
|
$
|
253,827,299
|
|
||||
In February 2016, the Company’s Board of Directors authorized the repurchase of up to $500 million of the Company’s Class A Common Stock under an open-ended stock plan ("February 2016 Stock Plan"). This authorization permited the Company to repurchase its Class A Common Stock in the open market, pursuant to preset trading plans meeting the requirements of Rule 10b5-1 under the Securities Exchange Act of 1934 or through privately negotiated transactions. The authorization had no expiration date. There was $253.8 million in remaining availability pursuant to the February 2016 Stock Plan as of January 28, 2017.
Reference is made to the discussion in Note 9 in the "Notes to Consolidated Financial Statements" in Item 8 of this Annual Report, which information is incorporated by reference herein.
12
Securities Authorized for Issuance under Equity Compensation Plans
The information concerning the Company's equity compensation plans is incorporated herein by reference to Item 12 of this Annual Report under the heading "Equity Compensation Plan Information".
13
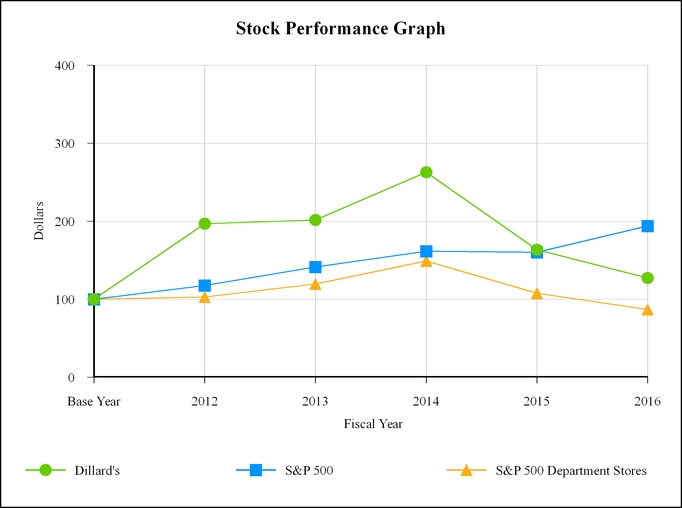
Company Performance
The graph below compares the cumulative total returns on the Company's Class A Common Stock, the Standard & Poor's 500 Index and the Standard & Poor's 500 Department Stores Index for each of the last five fiscal years. The cumulative total return assumes $100 invested in the Company's Class A Common Stock and each of the indices at market close on January 27, 2012 (the last trading day prior to the start of fiscal 2012) and assumes reinvestment of dividends.
The table below shows the dollar value of the respective $100 investments, with the assumptions noted above, in each of the Company's Class A Common Stock, the Standard & Poor's 500 Index and the Standard & Poor's 500 Department Stores Index as of the last day of each of the Company's last five fiscal years.
|
2012
|
2013
|
2014
|
2015
|
2016
|
|||||||||||||||
|
Dillard's, Inc.
|
$
|
196.81
|
|
$
|
201.69
|
|
$
|
263.02
|
|
$
|
163.49
|
|
$
|
127.44
|
|
||||
|
S&P 500
|
117.61
|
|
141.48
|
|
161.60
|
|
160.52
|
|
194.02
|
|
|||||||||
|
S&P 500 Department Stores
|
103.09
|
|
119.64
|
|
149.27
|
|
107.64
|
|
86.82
|
|
|||||||||
14
The selected financial data set forth below should be read in conjunction with our "Management's Discussion and Analysis of Financial Condition and Results of Operations", our consolidated audited financial statements and notes thereto and the other information contained elsewhere in this report.
|
(Dollars in thousands, except per share data)
|
2016
|
2015
|
2014
|
2013
|
2012*
|
||||||||||||||
|
Net sales
|
$
|
6,256,971
|
|
$
|
6,595,626
|
|
$
|
6,621,054
|
|
$
|
6,531,647
|
|
$
|
6,593,169
|
|
||||
|
Percent change
|
(5
|
)%
|
—
|
%
|
1
|
%
|
(1
|
)%
|
5
|
%
|
|||||||||
|
Cost of sales
|
4,166,411
|
|
4,350,805
|
|
4,272,605
|
|
4,223,715
|
|
4,247,108
|
|
|||||||||
|
Percent of sales
|
66.6
|
%
|
66.0
|
%
|
64.5
|
%
|
64.7
|
%
|
64.4
|
%
|
|||||||||
|
Interest and debt expense, net
|
63,059
|
|
60,923
|
|
61,306
|
|
64,505
|
|
69,596
|
|
|||||||||
|
Income before income taxes and income on and equity in losses of joint ventures
|
257,675
|
|
408,784
|
|
510,768
|
|
496,224
|
|
479,750
|
|
|||||||||
|
Income taxes
|
88,500
|
|
140,770
|
|
179,480
|
|
173,400
|
|
145,060
|
|
|||||||||
|
Income on and equity in losses of joint ventures
|
45
|
|
1,356
|
|
565
|
|
847
|
|
1,272
|
|
|||||||||
|
Net income
|
169,220
|
|
269,370
|
|
331,853
|
|
323,671
|
|
335,962
|
|
|||||||||
|
Net income per diluted common share
|
4.93
|
|
6.91
|
|
7.79
|
|
7.10
|
|
6.87
|
|
|||||||||
|
Dividends per common share
|
0.28
|
|
0.26
|
|
0.24
|
|
0.22
|
|
5.20
|
|
|||||||||
|
Book value per common share
|
53.41
|
|
49.98
|
|
49.02
|
|
45.33
|
|
41.24
|
|
|||||||||
|
Average number of diluted shares outstanding
|
34,308,211
|
|
39,004,500
|
|
42,603,236
|
|
45,586,087
|
|
48,910,946
|
|
|||||||||
|
Accounts receivable
|
48,230
|
|
47,138
|
|
56,510
|
|
30,840
|
|
31,519
|
|
|||||||||
|
Merchandise inventories
|
1,406,403
|
|
1,374,505
|
|
1,374,481
|
|
1,345,321
|
|
1,294,581
|
|
|||||||||
|
Property and equipment, net
|
1,790,267
|
|
1,939,832
|
|
2,029,171
|
|
2,134,200
|
|
2,287,015
|
|
|||||||||
|
Total assets
|
3,888,136
|
|
3,863,901
|
|
4,168,101
|
|
4,048,523
|
|
4,046,075
|
|
|||||||||
|
Long-term debt
|
526,106
|
|
613,061
|
|
612,815
|
|
612,569
|
|
612,116
|
|
|||||||||
|
Capital lease obligations
|
3,988
|
|
7,269
|
|
5,919
|
|
6,759
|
|
7,524
|
|
|||||||||
|
Other liabilities
|
238,424
|
|
238,980
|
|
250,455
|
|
228,439
|
|
233,492
|
|
|||||||||
|
Deferred income taxes
|
225,684
|
|
258,070
|
|
278,999
|
|
314,162
|
|
317,038
|
|
|||||||||
|
Subordinated debentures
|
200,000
|
|
200,000
|
|
200,000
|
|
200,000
|
|
200,000
|
|
|||||||||
|
Total stockholders' equity
|
1,717,417
|
|
1,795,305
|
|
2,019,270
|
|
1,992,197
|
|
1,970,175
|
|
|||||||||
|
Number of stores
|
|
|
|
|
|
||||||||||||||
|
Opened
|
—
|
|
3
|
|
2
|
|
—
|
|
—
|
|
|||||||||
|
Closed**
|
4
|
|
3
|
|
1
|
|
6
|
|
2
|
|
|||||||||
|
Total—end of year
|
293
|
|
297
|
|
297
|
|
296
|
|
302
|
|
|||||||||
___________________________________
|
*
|
Fiscal 2012 contains 53 weeks.
|
** Closed stores include a retail store that is currently closed due to water damage.
The items below are included in the Selected Financial Data.
2016
A $6.5 million pretax charge ($4.2 million after tax or $0.12 per share) for asset impairment related to the write-down of a cost method investment (See Note 13 in the "Notes to Consolidated Financial Statements" in Item 8 hereof).
2015
A $12.6 million pretax gain ($8.1 million after tax or $0.21 per share) primarily related to the sale of four retail store locations.
15
2014
A $5.9 million pretax gain ($3.8 million after tax or $0.09 per share) related to the sale of a retail store location.
2013
The items below amount to a net $7.9 million pretax gain ($5.1 million after tax gain or $0.11 per share).
|
•
|
an $11.7 million pretax gain ($7.6 million after tax or $0.17 per share) related to the sale of an investment.
|
|
•
|
a $5.4 million pretax charge ($3.5 million after tax or $0.08 per share) for asset impairment and store closing charges related to the write-down of certain cost method investments.
|
|
•
|
a $1.5 million pretax gain ($1.0 million after tax or $0.02 per share) related to a pension adjustment.
|
2012
The items below amount to a net $9.8 million pretax gain ($26.2 million after tax gain or $0.54 per share).
|
•
|
an $11.4 million pretax gain ($7.4 million after tax or $0.15 per share) related to the sale of three former retail store locations.
|
|
•
|
a $1.6 million pretax charge ($1.0 million after tax or $0.02 per share) for asset impairment and store closing charges related to the write-down of a property held for sale and of an operating property.
|
|
•
|
a $1.7 million income tax benefit ($0.03 per share) due to a reversal of a valuation allowance related to a deferred tax asset consisting of a capital loss carryforward.
|
|
•
|
an $18.1 million income tax benefit ($0.37 per share) due to a one-time deduction related to dividends paid to the Dillard's, Inc. Investment and Employee Stock Ownership Plan.
|
16
|
ITEM 7.
|
MANAGEMENT'S DISCUSSION AND ANALYSIS OF FINANCIAL CONDITION AND RESULTS OF OPERATIONS.
|
Dillard's, Inc. operates 293 retail department stores spanning 29 states and an Internet store. The Company also operates a general contractor, CDI, a portion of whose business includes constructing and remodeling stores for the Company, which is a reportable segment separate from our retail operations.
In accordance with the National Retail Federation fiscal reporting calendar and our bylaws, the fiscal 2016, 2015 and 2014 reporting periods presented and discussed below ended January 28, 2017, January 30, 2016 and January 31, 2015, respectively, and each contained 52 weeks.
EXECUTIVE OVERVIEW
Fiscal 2016
The Company's performance during fiscal 2016 reflected mall traffic declines from continued retail industry challenges, as our sales decline weighed heavily on our profitability. Comparable retail sales decreased 5% over last year, and gross profit from retail operations decreased 73 basis points of net retail sales as a result of increased markdowns. Consolidated selling, general and administrative ("SG&A") expenses increased 114 basis points of net sales while SG&A decreased $14.3 million.
During the fiscal year, savings in several expense categories, notably advertising, utilities and supplies, were partially offset by increased payroll and employee-related insurance expense. Net income decreased to
$169.2 million
, or $4.93 per share, during fiscal 2016 from
$269.4 million
, or $6.91 per share, in the prior year.
Included in net income for fiscal 2016 is a pre-tax charge of $6.5 million ($4.2 million after tax or $0.12 per share) for asset impairment related to the write-down of a cost method investment.
Included in net income for fiscal 2015 is a pre-tax gain of $12.6 million ($8.1 million after tax or $0.21 per share) related to the sale of four retail store locations.
During fiscal 2016, the Company repurchased $246.2 million, or 3.8 million shares, of Class A Common Stock under the February 2016 Stock Plan, with $253.8 million in authorization remaining at January 28, 2017.
As of
January 28, 2017
, we had working capital of
$861.4 million
(including cash and cash equivalents of
$347.0 million
) and
$813.3 million
of total debt outstanding, excluding capital lease obligations, with $87.2 million in scheduled maturities in late fiscal 2017. We operated 268 Dillard's locations, 25 clearance centers and one Internet store as of
January 28, 2017
.
17
Key Performance Indicators
We use a number of key indicators of financial condition and operating performance to evaluate the performance of our business, including the following:
|
Fiscal 2016
|
Fiscal 2015
|
Fiscal 2014
|
||||||||||
|
Net sales (in millions)
|
$
|
6,257.0
|
|
|
$
|
6,595.6
|
|
|
$
|
6,621.1
|
|
|
|
Gross profit (in millions)
|
$
|
2,090.6
|
|
|
$
|
2,244.8
|
|
|
$
|
2,348.4
|
|
|
|
Gross profit as a percentage of net sales
|
33.4
|
%
|
34.0
|
%
|
35.5
|
%
|
||||||
|
Retail gross profit as a percentage of retail net sales
|
34.3
|
%
|
35.0
|
%
|
36.1
|
%
|
||||||
|
Selling, general and administrative expenses as a percentage of net sales
|
26.5
|
%
|
25.3
|
%
|
25.1
|
%
|
||||||
|
Cash flow from operations (in millions)
|
$
|
517.0
|
|
|
$
|
450.2
|
|
|
$
|
611.6
|
|
|
|
Total retail store count at end of period
|
293
|
|
|
297
|
|
|
297
|
|
||||
|
Retail sales per square foot
|
$
|
126
|
|
|
$
|
130
|
|
|
$
|
131
|
|
|
|
Retail stores sales trend
|
(5
|
)%
|
(2
|
)%
|
1
|
%
|
||||||
|
Comparable retail store sales trend
|
(5
|
)%
|
(2
|
)%
|
1
|
%
|
||||||
|
Retail store inventory trend
|
2
|
%
|
—
|
%
|
2
|
%
|
||||||
|
Retail merchandise inventory turnover
|
2.5
|
|
|
2.7
|
|
|
2.8
|
|
||||
Trends and Uncertainties
Fluctuations in the following key trends and uncertainties may have a material effect on our operating results.
|
•
|
Cash flow—Cash from operating activities is a primary source of our liquidity that is adversely affected when the retail industry faces economic challenges. Furthermore, operating cash flow can be negatively affected by competitive factors.
|
|
•
|
Pricing—If our customers do not purchase our merchandise offerings in sufficient quantities, we respond by taking markdowns. If we have to reduce our retail selling prices, the cost of sales on our consolidated statement of income will correspondingly rise, thus reducing our net income and cash flow.
|
|
•
|
Success of brand—The success of our exclusive brand merchandise as well as merchandise we source from national vendors is dependent upon customer fashion preferences and how well we can predict and anticipate trends.
|
|
•
|
Sourcing—Our store merchandise selection is dependent upon our ability to acquire appealing products from a number of sources. Our ability to attract and retain compelling vendors as well as in-house design talent, the adequacy and stable availability of materials and production facilities from which we source our merchandise and the speed at which we can respond to customer trends and preferences all have a significant impact on our merchandise mix and, thus, our ability to sell merchandise at profitable prices.
|
|
•
|
Store growth—Our ability to open new stores is dependent upon a number of factors, such as the identification of suitable markets and locations and the availability of shopping developments, especially in a weak economic environment. Store growth can be further hindered by mall attrition and subsequent closure of underperforming properties.
|
Seasonality and Inflation
Our business, like many other retailers, is subject to seasonal influences, with a significant portion of sales and income typically realized during the last quarter of our fiscal year due to the holiday season. Because of the seasonality of our business, results from any quarter are not necessarily indicative of the results that may be achieved for a full fiscal year.
We do not believe that inflation has had a material effect on our results during the periods presented; however, our business could be affected by such in the future.
18
2017 Guidance
A summary of management's estimates of certain financial measures for fiscal 2017 is shown below.
|
(in millions of dollars)
|
Fiscal 2017
Estimated
|
Fiscal 2016
Actual
|
|||||
|
Depreciation and amortization
|
$
|
240
|
|
$
|
244
|
|
|
|
Rentals
|
25
|
|
26
|
|
|||
|
Interest and debt expense, net
|
63
|
|
63
|
|
|||
|
Capital expenditures
|
125
|
|
105
|
|
|||
General
Net sales.
Net sales include merchandise sales of comparable and non-comparable stores and revenue recognized on contracts of CDI, the Company's general contracting construction company. Comparable store sales include sales for those stores which were in operation for a full period in both the current quarter and the corresponding quarter for the prior year. Comparable store sales exclude changes in the allowance for sales returns. Non-comparable store sales include: sales in the current fiscal year from stores opened during the previous fiscal year before they are considered comparable stores; sales from new stores opened during the current fiscal year; sales in the current or previous fiscal year for stores closed during the current or previous fiscal year that are no longer considered comparable stores; sales in clearance centers; and changes in the allowance for sales returns.
Service charges and other income.
Service charges and other income include income generated through the Wells Fargo Alliance and former Synchrony Alliance. Other income includes rental income, shipping and handling fees, gift card breakage and lease income on leased departments.
Cost of sales.
Cost of sales includes the cost of merchandise sold (net of purchase discounts, non-specific margin maintenance allowances and merchandise margin maintenance allowances), bankcard fees, freight to the distribution centers, employee and promotional discounts, shipping to customers and direct payroll for salon personnel. Cost of sales also includes CDI contract costs, which comprise all direct material and labor costs, subcontract costs and those indirect costs related to contract performance, such as indirect labor, employee benefits and insurance program costs.
Selling, general and administrative expenses.
Selling, general and administrative expenses include buying, occupancy, selling, distribution, warehousing, store and corporate expenses (including payroll and employee benefits), insurance, employment taxes, advertising, management information systems, legal and other corporate level expenses. Buying expenses consist of payroll, employee benefits and travel for design, buying and merchandising personnel.
Depreciation and amortization.
Depreciation and amortization expenses include depreciation and amortization on property and equipment.
Rentals.
Rentals include expenses for store leases, including contingent rent, and data processing and other equipment rentals.
Interest and debt expense, net.
Interest and debt expense includes interest, net of interest income, relating to the Company's unsecured notes, subordinated debentures and borrowings under the Company's credit facility. Interest and debt expense also includes gains and losses on note repurchases, if any, amortization of financing costs and interest on capital lease obligations.
Gain on disposal of assets.
Gain on disposal of assets includes the net gain or loss on the sale or disposal of property and equipment and the net gain or loss on the sale or disposal of investments.
Asset impairment and store closing charges.
Asset impairment and store closing charges consist of (a) write-downs to fair value of under-performing or held for sale properties and of cost method investments and (b) exit costs associated with the closure of certain stores. Exit costs include future rent, taxes and common area maintenance expenses from the time the stores are closed.
Income on and equity in losses of joint ventures.
Income on and equity in losses of joint ventures includes the Company's portion of the income or loss of the Company's unconsolidated joint ventures as well as the distribution of excess cash (excluding returns of investments) from a mall joint venture.
19
Critical Accounting Policies and Estimates
The Company's significant accounting policies are also described in Note 1 in the "Notes to Consolidated Financial Statements" in Item 8 hereof. As disclosed in that note, the preparation of financial statements in conformity with accounting principles generally accepted in the United States of America ("GAAP") requires management to make estimates and assumptions about future events that affect the amounts reported in the consolidated financial statements and accompanying notes. The Company evaluates its estimates and judgments on an ongoing basis and predicates those estimates and judgments on historical experience and on various other factors that are believed to be reasonable under the circumstances. Since future events and their effects cannot be determined with absolute certainty, actual results could differ from those estimates.
Management of the Company believes the following critical accounting policies, among others, affect its more significant judgments and estimates used in preparation of the Company's consolidated financial statements.
Merchandise inventory.
All of the Company’s inventories are valued at the lower of cost or market using the last-in, first-out (“LIFO”) inventory method. Approximately
96%
of the Company's inventories are valued using the LIFO retail inventory method. Under the retail inventory method, the valuation of inventories at cost and the resulting gross margins are calculated by applying a calculated cost to retail ratio to the retail value of inventories. The retail inventory method is an averaging method that is widely used in the retail industry due to its practicality. Inherent in the retail inventory method calculation are certain significant management judgments including, among others, merchandise markon, markups, and markdowns, which significantly impact the ending inventory valuation at cost as well as the resulting gross margins. During periods of deflation, inventory values on the first-in, first-out ("FIFO") retail inventory method may be lower than the LIFO retail inventory method. Additionally, inventory values at LIFO cost may be in excess of net realizable value. At January 28, 2017 and January 30, 2016, merchandise inventories valued at LIFO, including adjustments as necessary to record inventory at the lower of cost or market, approximated the cost of such inventories using the FIFO retail inventory method. The application of the LIFO retail inventory method did not result in the recognition of any LIFO charges or credits affecting cost of sales for fiscal 2016, 2015 or 2014. A 1% change in the dollar amount of markdowns would have impacted net income by approximately $10 million for fiscal 2016.
The Company regularly records a provision for estimated shrinkage, thereby reducing the carrying value of merchandise inventory. Complete physical inventories of the Company's stores and warehouses are performed no less frequently than annually, with the recorded amount of merchandise inventory being adjusted to coincide with these physical counts. The differences between the estimated amounts of shrinkage and the actual amounts realized during the past three years have not been material.
Revenue recognition.
The Company's retail operations segment recognizes revenue upon the sale of merchandise to its customers, net of anticipated returns of merchandise. The provision for sales returns is based on historical evidence of our return rate. We recorded an allowance for sales returns of $5.1 million and $4.9 million as of January 28, 2017 and January 30, 2016, respectively. Adjustments to earnings resulting from revisions to estimates on our sales return provision were not material for fiscal years 2016, 2015 or 2014.
The Company's share of income earned under the Wells Fargo Alliance and former Synchrony Alliance involving the Dillard's branded private label credit cards is included as a component of service charges and other income. The Company received income of approximately
$104 million
,
$105 million
and
$112 million
from the alliances in fiscal 2016, 2015 and 2014, respectively. The Company participates in the marketing of the private label credit cards and accepts payments on the private label credit cards in its stores as a convenience to customers who prefer to pay in person rather than by paying online or mailing their payments to Wells Fargo.
Revenues from CDI construction contracts are generally recognized by applying percentages of completion for each period to the total estimated revenue for the respective contracts. The length of each contract varies but is typically nine to eighteen months. The percentages of completion are determined by relating the actual costs of work performed to date to the current estimated total costs of the respective contracts. Any anticipated losses on completed contracts are recognized as soon as they are determined.
Vendor allowances.
The Company receives concessions from vendors through a variety of programs and arrangements, including co-operative advertising, payroll reimbursements and margin maintenance programs.
Cooperative advertising allowances are reported as a reduction of advertising expense in the period in which the advertising occurred. If vendor advertising allowances were substantially reduced or eliminated, the Company would likely consider other methods of advertising as well as the volume and frequency of our product advertising, which could increase or decrease our expenditures. Similarly, we are not able to assess the impact of vendor advertising allowances on creating additional revenues, as such allowances do not directly generate revenues for our stores.
20
Payroll reimbursements are reported as a reduction of payroll expense in the period in which the reimbursement occurred.
Amounts of margin maintenance allowances are recorded only when an agreement has been reached with the vendor and the collection of the concession is deemed probable. All such merchandise margin maintenance allowances are recognized as a reduction of cost purchases. Under the retail inventory method, a portion of these allowances reduces cost of goods sold and a portion reduces the carrying value of merchandise inventory.
Insurance accruals.
The Company's consolidated balance sheets include liabilities with respect to claims for self-insured workers' compensation (with a self-insured retention of $4 million per claim) and general liability (with a self-insured retention of $1 million per claim and a one-time $1 million corridor). The Company's retentions are insured through a wholly-owned captive insurance subsidiary. The Company estimates the required liability of such claims, utilizing an actuarial method, based upon various assumptions, which include, but are not limited to, our historical loss experience, projected loss development factors, actual payroll and other data. The required liability is also subject to adjustment in the future based upon the changes in claims experience, including changes in the number of incidents (frequency) and changes in the ultimate cost per incident (severity). As of January 28, 2017 and January 30, 2016, insurance accruals of $43.1 million and $44.4 million, respectively, were recorded in trade accounts payable and accrued expenses and other liabilities. Adjustments resulting from changes in historical loss trends have helped control expenses during fiscal 2016 and 2015, partially due to Company programs that have helped decrease both the number and cost of claims. Further, we do not anticipate any significant change in loss trends, settlements or other costs that would cause a significant change in our earnings. A 10% change in our self-insurance reserve would have affected net income by $3.0 million for fiscal 2016.
Long-lived assets.
The Company's judgment regarding the existence of impairment indicators is based on market and operational performance. We assess the impairment of long-lived assets, primarily fixed assets, whenever events or changes in circumstances indicate that the carrying value may not be recoverable. Factors we consider important which could trigger an impairment review include the following:
|
•
|
Significant changes in the manner of our use of assets or the strategy for the overall business;
|
|
•
|
Significant negative industry or economic trends;
|
|
•
|
A current-period operating or cash flow loss combined with a history of operating or cash flow losses; and
|
|
•
|
Store closings.
|
The Company performs an analysis of the anticipated undiscounted future net cash flows of the related long-lived assets. If the carrying value of the related asset exceeds the undiscounted cash flows, the carrying value is reduced to its fair value. Various factors including future sales growth and profit margins are included in this analysis. To the extent these future projections or the Company's strategies change, the conclusion regarding impairment may differ from the current estimates.
Income taxes.
Temporary differences arising from differing treatment of income and expense items for tax and financial reporting purposes result in deferred tax assets and liabilities that are recorded on the balance sheet. These balances, as well as income tax expense, are determined through management's estimations, interpretation of tax law for multiple jurisdictions and tax planning. If the Company's actual results differ from estimated results due to changes in tax laws, changes in store locations, settlements of tax audits or tax planning, the Company's effective tax rate and tax balances could be affected. As such, these estimates may require adjustment in the future as additional facts become known or as circumstances change. Changes in the Company's assumptions and judgments can materially affect amounts recognized in the consolidated balance sheets and statements of income.
The total amount of unrecognized tax benefits as of January 28, 2017 was $4.0 million, of which $2.5 million would, if recognized, affect the Company’s effective tax rate. The total amount of unrecognized tax benefits as of January 30, 2016 was $4.3 million, of which $2.5 million would, if recognized, affect the Company's effective tax rate. The Company does not expect a significant change in unrecognized tax benefits in the next twelve months. The Company classifies accrued interest expense and penalties relating to income tax in the consolidated financial statements as income tax expense. The total amounts of interest and penalties were not material.
The fiscal tax years that remain subject to examination for the federal tax jurisdiction and major state tax jurisdictions are 2013 and forward. At this time, the Company does not expect the results from any income tax audit to have a material impact on the Company's consolidated financial statements.
21
Pension obligations.
The discount rate that the Company utilizes for determining future pension obligations is based on the Citigroup Above Median Pension Index Curve on its annual measurement date and is matched to the future expected cash flows of the benefit plans by annual periods. The discount rate decreased to 4.0% as of January 28, 2017 from 4.2% as of January 30, 2016. We believe that these assumptions have been appropriate and that, based on these assumptions, the pension liability of $183.6 million is appropriately stated as of January 28, 2017; however, actual results may differ materially from those estimated and could have a material impact on our consolidated financial statements. A further 50 basis point change in the discount rate would increase or decrease the pension liability by approximately $11.7 million. The Company expects to make a contribution to the pension plan of approximately $4.9 million in fiscal 2017. The Company expects pension expense to be approximately $10.7 million in fiscal 2017 with a liability of $189.4 million at February 3, 2018.
RESULTS OF OPERATIONS
The following table sets forth the results of operations and percentage of net sales, for the periods indicated:
|
|
For the years ended
|
|||||||||||||||||||
|
|
January 28, 2017
|
January 30, 2016
|
January 31, 2015
|
|||||||||||||||||
|
(in thousands of dollars)
|
Amount
|
% of
Net
Sales
|
Amount
|
% of
Net
Sales
|
Amount
|
% of
Net
Sales
|
||||||||||||||
|
Net sales
|
$
|
6,256,971
|
|
100.0
|
%
|
$
|
6,595,626
|
|
100.0
|
%
|
$
|
6,621,054
|
|
100.0
|
%
|
|||||
|
Service charges and other income
|
161,038
|
|
2.6
|
|
158,919
|
|
2.4
|
|
159,075
|
|
2.4
|
|
||||||||
|
6,418,009
|
|
102.6
|
|
6,754,545
|
|
102.4
|
|
6,780,129
|
|
102.4
|
|
|||||||||
|
Cost of sales
|
4,166,411
|
|
66.6
|
|
4,350,805
|
|
66.0
|
|
4,272,605
|
|
64.5
|
|
||||||||
|
Selling, general and administrative expenses
|
1,655,658
|
|
26.5
|
|
1,669,916
|
|
25.3
|
|
1,663,859
|
|
25.1
|
|
||||||||
|
Depreciation and amortization
|
243,657
|
|
3.9
|
|
250,011
|
|
3.8
|
|
250,683
|
|
3.8
|
|
||||||||
|
Rentals
|
25,954
|
|
0.4
|
|
26,732
|
|
0.4
|
|
26,977
|
|
0.4
|
|
||||||||
|
Interest and debt expense, net
|
63,059
|
|
1.0
|
|
60,923
|
|
0.9
|
|
61,306
|
|
0.9
|
|
||||||||
|
Gain on disposal of assets
|
(905
|
)
|
—
|
|
(12,626
|
)
|
(0.2
|
)
|
(6,069
|
)
|
(0.1
|
)
|
||||||||
|
Asset impairment and store closing charges
|
6,500
|
|
0.1
|
|
—
|
|
0.0
|
|
—
|
|
—
|
|
||||||||
|
Income before income taxes and income on and equity in losses of joint ventures
|
257,675
|
|
4.1
|
|
408,784
|
|
6.2
|
|
510,768
|
|
7.7
|
|
||||||||
|
Income taxes
|
88,500
|
|
1.4
|
|
140,770
|
|
2.1
|
|
179,480
|
|
2.7
|
|
||||||||
|
Income on and equity in losses of joint ventures
|
45
|
|
—
|
|
1,356
|
|
—
|
|
565
|
|
—
|
|
||||||||
|
Net income
|
$
|
169,220
|
|
2.7
|
%
|
$
|
269,370
|
|
4.1
|
%
|
$
|
331,853
|
|
5.0
|
%
|
|||||
22
Sales
|
(in thousands of dollars)
|
Fiscal 2016
|
Fiscal 2015
|
Fiscal 2014
|
||||||||
|
Net sales:
|
|
|
|
||||||||
|
Retail operations segment
|
$
|
6,071,404
|
|
$
|
6,388,769
|
|
$
|
6,490,387
|
|
||
|
Construction segment
|
185,567
|
|
206,857
|
|
130,667
|
|
|||||
|
Total net sales
|
$
|
6,256,971
|
|
$
|
6,595,626
|
|
$
|
6,621,054
|
|
||
The percent change by segment and product category in the Company's sales for the past two years is as follows:
|
|
Percent Change
|
|||||
|
|
Fiscal
2016 - 2015 |
Fiscal
2015 - 2014 |
||||
|
Retail operations segment
|
|
|
||||
|
Cosmetics
|
(5.3
|
)%
|
(0.9
|
)%
|
||
|
Ladies' apparel
|
(3.6
|
)
|
(1.3
|
)
|
||
|
Ladies' accessories and lingerie
|
(6.7
|
)
|
(1.2
|
)
|
||
|
Juniors' and children's apparel
|
(5.1
|
)
|
(1.0
|
)
|
||
|
Men's apparel and accessories
|
(3.9
|
)
|
(2.4
|
)
|
||
|
Shoes
|
(5.3
|
)
|
(0.5
|
)
|
||
|
Home and furniture
|
(7.3
|
)
|
(7.4
|
)
|
||
|
Construction segment
|
(10.3
|
)
|
58.3
|
|
||
2016 Compared to 2015
Net sales from the retail operations segment decreased $317.4 million during fiscal 2016 as compared to fiscal 2015, decreasing 5% in both total and comparable stores. During fiscal 2016, sales of ladies' apparel and men's apparel and accessories decreased moderately from the prior year. Sales of ladies' accessories and lingerie, shoes, juniors' and children's apparel, cosmetics and home and furniture decreased significantly from the prior year.
The number of sales transactions during fiscal 2016 decreased 7% over fiscal 2015 while the average dollars per sales transaction increased 2%.
Net sales from the construction segment decreased $21.3 million or 10.3% during fiscal 2016 as compared to fiscal 2015 due to a decrease in construction projects. The backlog of awarded construction contracts at January 28, 2017 totaled $235.8 million, increasing approximately 41% from January 30, 2016.
2015 Compared to 2014
Net sales from the retail operations segment decreased $101.6 million during fiscal 2015 as compared to fiscal 2014, decreasing 2% in both total and comparable stores. During fiscal 2015, sales of ladies' apparel, ladies' accessories and lingerie, shoes, juniors' and children's apparel and cosmetics decreased slightly from the prior year. Sales of men's apparel and accessories decreased moderately over the prior year. Sales of home and furniture declined significantly from the prior year.
The number of sales transactions during fiscal 2015 decreased 5% over fiscal 2014 while the average dollars per sales transaction increased 3%.
Net sales from the construction segment increased $76.2 million or 58% during fiscal 2015 as compared to fiscal 2014 due to an increase in construction projects. The backlog of awarded construction contracts at January 30, 2016 totaled
$167.3 million, decreasing approximately 45% from January 31, 2015.
23
Exclusive Brand Merchandise
Sales penetration of exclusive brand merchandise for fiscal years 2016, 2015 and 2014 was 21.7%, 21.7% and 21.6% of total net sales, respectively.
Service Charges and Other Income
|
|
|
|
|
Dollar Change
|
Percent Change
|
||||||||||||||||||||
|
(in millions of dollars)
|
Fiscal
2016 |
Fiscal
2015 |
Fiscal
2014 |
2016 - 2015
|
2015 - 2014
|
2016 - 2015
|
2015- 2014
|
||||||||||||||||||
|
Service charges and other income:
|
|
|
|
|
|
|
|
||||||||||||||||||
|
Retail operations segment
|
|
|
|
|
|
|
|
||||||||||||||||||
|
Income from Wells Fargo Alliance and former Synchrony Alliance
|
$
|
103.6
|
|
$
|
105.4
|
|
$
|
111.6
|
|
$
|
(1.8
|
)
|
$
|
(6.2
|
)
|
(1.7
|
)%
|
(5.6
|
)%
|
||||||
|
Leased department income
|
7.3
|
|
7.2
|
|
8.7
|
|
0.1
|
|
(1.5
|
)
|
1.4
|
|
(17.2
|
)
|
|||||||||||
|
Shipping and handling income
|
29.2
|
|
26.1
|
|
22.3
|
|
3.1
|
|
3.8
|
|
11.9
|
|
17.0
|
|
|||||||||||
|
Other
|
19.3
|
|
17.7
|
|
15.6
|
|
1.6
|
|
2.1
|
|
9.0
|
|
13.5
|
|
|||||||||||
|
159.4
|
|
156.4
|
|
158.2
|
|
3.0
|
|
(1.8
|
)
|
1.9
|
|
(1.1
|
)
|
||||||||||||
|
Construction segment
|
1.6
|
|
2.5
|
|
0.9
|
|
(0.9
|
)
|
1.6
|
|
(36.0
|
)
|
177.8
|
|
|||||||||||
|
Total
|
$
|
161.0
|
|
$
|
158.9
|
|
$
|
159.1
|
|
$
|
2.1
|
|
$
|
(0.2
|
)
|
1.3
|
%
|
(0.1
|
)%
|
||||||
2016 Compared to 2015
Service charges and other income is composed primarily of income from the Wells Fargo Alliance and former Synchrony Alliance. Income from the alliances decreased $1.8 million in fiscal 2016 compared to fiscal 2015 primarily due to a decrease in income from the former Synchrony Alliance.
Leased department income is primarily earned from an upscale women's apparel vendor in certain stores. The vendor has recently filed bankruptcy, and it is unclear how or if this event will impact our future business with this vendor.
2015 Compared to 2014
Income from the alliances decreased $6.2 million in fiscal 2015 compared to fiscal 2014 primarily due to increased credit losses partially resulting from the portfolio transition.
Gross Profit
|
(in thousands of dollars)
|
Fiscal 2016
|
Fiscal 2015
|
Fiscal 2014
|
||||||||
|
Gross profit:
|
|
|
|
||||||||
|
Retail operations segment
|
$
|
2,081,769
|
|
$
|
2,237,077
|
|
$
|
2,342,109
|
|
||
|
Construction segment
|
8,791
|
|
7,744
|
|
6,340
|
|
|||||
|
Total gross profit
|
$
|
2,090,560
|
|
$
|
2,244,821
|
|
$
|
2,348,449
|
|
||
|
Gross profit as a percentage of segment net sales:
|
|
|
|
||||||||
|
Retail operations segment
|
34.3
|
%
|
35.0
|
%
|
36.1
|
%
|
|||||
|
Construction segment
|
4.7
|
|
3.7
|
|
4.9
|
|
|||||
|
Total gross profit as a percentage of net sales
|
33.4
|
|
34.0
|
|
35.5
|
|
|||||
2016 Compared to 2015
Gross profit as a percentage of net sales declined 62 basis points of sales during fiscal 2016 compared to fiscal 2015. Gross profit from retail operations declined 73 basis points of segment net sales during the same periods primarily due to increased markdowns.
During fiscal 2016, gross margin declined slightly in cosmetics, men's apparel and accessories and juniors' and children's apparel. Gross margin declined moderately in ladies' accessories and lingerie. Gross margin was essentially flat in ladies' apparel, shoes and home and furniture.
24
Gross profit from the construction segment increased $1.0 million and increased, on a percentage basis, by 100 basis points of segment net sales. The increase was due to an increase in fees for external contracts.
Retail store inventory increased 2% at January 28, 2017 compared to January 30, 2016.
2015 Compared to 2014
Gross profit as a percentage of net sales declined 144 basis points of sales during fiscal 2015 compared to fiscal 2014. Gross profit from retail operations declined 107 basis points of segment net sales during the same periods primarily due to increased markdowns.
During fiscal 2015, gross margin declined slightly in juniors' and children's apparel and in men's apparel and accessories. Gross margin declined moderately in ladies' accessories and lingerie and home and furniture. Gross margin was essentially flat in cosmetics, ladies' apparel and shoes.
Gross profit from the construction segment increased $1.4 million but declined, on a percentage basis, by 111 basis points of segment net sales. The decrease as a percentage of sales was due to lower fee percentages on new larger contracts.
Retail store inventory remained flat at January 30, 2016 compared to January 31, 2015.
Selling, General and Administrative Expenses ("SG&A")
|
(in thousands of dollars)
|
Fiscal 2016
|
Fiscal 2015
|
Fiscal 2014
|
||||||||
|
SG&A:
|
|
|
|
||||||||
|
Retail operations segment
|
$
|
1,649,654
|
|
$
|
1,664,301
|
|
$
|
1,658,994
|
|
||
|
Construction segment
|
6,004
|
|
5,615
|
|
4,865
|
|
|||||
|
Total SG&A
|
$
|
1,655,658
|
|
$
|
1,669,916
|
|
$
|
1,663,859
|
|
||
|
SG&A as a percentage of segment net sales:
|
|
|
|
||||||||
|
Retail operations segment
|
27.2
|
%
|
26.1
|
%
|
25.6
|
%
|
|||||
|
Construction segment
|
3.2
|
|
2.7
|
|
3.7
|
|
|||||
|
Total SG&A as a percentage of net sales
|
26.5
|
|
25.3
|
|
25.1
|
|
|||||
2016 Compared to 2015
SG&A decreased $14.3 million and increased
114
basis points of sales during fiscal 2016 compared to fiscal 2015. The decrease in expense was primarily driven by decreased advertising ($7.0 million), supplies ($7.3 million) and utilities ($4.3 million) expenses partially offset by an increase in payroll ($3.8 million) and employee-related insurance expense ($4.3 million).
2015 Compared to 2014
SG&A increased $6.1 million or 19 basis points of sales during fiscal 2015 compared to fiscal 2014. The increase was primarily driven by increased selling payroll expense ($15.1 million) partially offset by decreased advertising expense ($6.2 million).
Depreciation and Amortization
|
(in thousands of dollars)
|
Fiscal 2016
|
Fiscal 2015
|
Fiscal 2014
|
||||||||
|
Depreciation and amortization:
|
|
|
|
||||||||
|
Retail operations segment
|
$
|
242,981
|
|
$
|
249,508
|
|
$
|
250,371
|
|
||
|
Construction segment
|
676
|
|
503
|
|
312
|
|
|||||
|
Total depreciation and amortization
|
$
|
243,657
|
|
$
|
250,011
|
|
$
|
250,683
|
|
||
2016 Compared to 2015
Depreciation and amortization expense decreased $6.4 million during fiscal 2016 compared to fiscal 2015, primarily due to the timing and composition of capital expenditures.
25
Interest and Debt Expense, Net
|
(in thousands of dollars)
|
Fiscal 2016
|
Fiscal 2015
|
Fiscal 2014
|
||||||||
|
Interest and debt expense (income), net:
|
|
|
|
||||||||
|
Retail operations segment
|
$
|
63,127
|
|
$
|
60,989
|
|
$
|
61,352
|
|
||
|
Construction segment
|
(68
|
)
|
(66
|
)
|
(46
|
)
|
|||||
|
Total interest and debt expense, net
|
$
|
63,059
|
|
$
|
60,923
|
|
$
|
61,306
|
|
||
2016 Compared to 2015
Net interest and debt expense increased $2.1 million in fiscal 2016 compared to fiscal 2015 primarily due to a decrease in capitalized interest and investment income. Total weighted average debt outstanding during fiscal 2016 decreased approximately $21.5 million compared to fiscal 2015, due to a decrease in average outstanding short term borrowings under the credit facility.
2015 Compared to 2014
Net interest and debt expense declined $0.4 million in fiscal 2015 compared to fiscal 2014 primarily due to an increase in capitalized interest and a decrease in credit facility commitment fees, partially offset by an increase in short term borrowings. Total weighted average debt outstanding during fiscal 2015 increased approximately $28.2 million compared to fiscal 2014, due to an increase in average outstanding short term borrowings of the credit facility.
Gain on Disposal of Assets
|
(in thousands of dollars)
|
Fiscal 2016
|
Fiscal 2015
|
Fiscal 2014
|
||||||||
|
Gain on disposal of assets:
|
|
|
|
||||||||
|
Retail operations segment
|
$
|
(886
|
)
|
$
|
(12,619
|
)
|
$
|
(6,068
|
)
|
||
|
Construction segment
|
(19
|
)
|
(7
|
)
|
(1
|
)
|
|||||
|
Total gain on disposal of assets
|
$
|
(905
|
)
|
$
|
(12,626
|
)
|
$
|
(6,069
|
)
|
||
Fiscal 2015
During fiscal 2015, the Company received proceeds of $25.5 million primarily from the sales of four retail store locations in Huntsville, Alabama, Sandy, Utah, Tampa, Florida and Arlington, Texas, resulting in a gain of $12.6 million that was recorded in gain on disposal of assets.
Fiscal 2014
During fiscal 2014, the Company received proceeds of $14.5 million from the sales of a retail store location in Longmont, Colorado, that was held for sale due to eminent domain, and an operating store location in Sarasota, Florida, resulting in a gain of $6.3 million that was recorded in gain on disposal of assets.
During fiscal 2014, the Company also received a final distribution of $1.1 million from its investment in a property located in Toledo, Ohio, resulting in a loss of $0.3 million that was recorded in gain on disposal of assets.
Asset Impairment and Store Closing Charges
|
(in thousands of dollars)
|
Fiscal 2016
|
Fiscal 2015
|
Fiscal 2014
|
||||||||
|
Asset impairment and store closing charges:
|
|
|
|
||||||||
|
Retail operations segment
|
$
|
6,500
|
|
$
|
—
|
|
$
|
—
|
|
||
|
Construction segment
|
—
|
|
—
|
|
—
|
|
|||||
|
Total asset impairment and store closing charges
|
$
|
6,500
|
|
$
|
—
|
|
$
|
—
|
|
||
Fiscal 2016
Asset impairment for fiscal 2016 consisted of the write-down of a cost method investment.
26
Income Taxes
The Company's estimated federal and state effective income tax rate, inclusive of income on and equity in losses of joint ventures, was 34.3% in fiscal
2016
, 34.3% in fiscal
2015
, and 35.1% in fiscal
2014
. The Company expects the fiscal
2017
federal and state effective income tax rate to approximate 35%.
Fiscal 2016
During fiscal 2016, income taxes included the recognition of tax benefits of approximately $2.4 million related to federal tax credits. These tax benefits were partially offset by tax expense of approximately $1.9 million due to net increases in valuation allowances related to state net operating loss carryforwards.
Fiscal 2015
During fiscal 2015, income taxes included the recognition of tax benefits of approximately $2.0 million related to federal tax credits and $1.5 million due to net decreases in valuation allowances related to state net operating loss carryforwards.
Fiscal 2014
During fiscal 2014, income taxes included the recognition of tax benefits of approximately $2.8 million related to federal tax credits and $1.4 million due to net decreases in unrecognized tax benefits, interest and penalties. These tax benefits were partially offset by tax expense of approximately $1.5 million due to net increases in valuation allowances related to state net operating loss carryforwards. In addition, during fiscal 2014, the IRS concluded its examination of the Company's federal income tax returns for fiscal tax years 2011 and 2012, with no material changes in these tax years as a result of such examination.
LIQUIDITY AND CAPITAL RESOURCES
The Company's current non-operating priorities for its use of cash are stock repurchases, strategic investments to enhance the value of existing properties and dividend payments to stockholders.
Cash flows for the Company's most recent three fiscal years were as follows:
|
|
|
|
|
Percent Change
|
|||||||||||||
|
(in thousands of dollars)
|
Fiscal 2016
|
Fiscal 2015
|
Fiscal 2014
|
2016 - 2015
|
2015 - 2014
|
||||||||||||
|
Operating Activities
|
$
|
517,007
|
|
$
|
450,226
|
|
$
|
611,589
|
|
14.8
|
%
|
(26.4
|
)%
|
||||
|
Investing Activities
|
(119,649
|
)
|
(132,939
|
)
|
(143,412
|
)
|
10.0
|
|
7.3
|
|
|||||||
|
Financing Activities
|
(253,242
|
)
|
(518,170
|
)
|
(301,559
|
)
|
51.1
|
|
(71.8
|
)
|
|||||||
|
Total Cash Provided (Used)
|
$
|
144,116
|
|
$
|
(200,883
|
)
|
$
|
166,618
|
|
|
|
|
|
||||
Operating Activities
The primary source of the Company's liquidity is cash flows from operations. Due to the seasonality of the Company's business, we have historically realized a significant portion of the cash flows from operating activities during the second half of the fiscal year. Retail operations sales are the key operating cash component, providing 94.6%, 94.6% and 95.7% of total revenues in fiscal 2016, 2015 and 2014, respectively.
Operating cash inflows also include revenue and reimbursements from the Wells Fargo Alliance and former Synchrony Alliance and cash distributions from joint ventures (excluding returns of investments). Operating cash outflows include payments to vendors for inventory, services and supplies, payments to employees and payments of interest and taxes.
Synchrony owned and managed Dillard’s private label credit cards under the Synchrony Alliance that expired in November 2014. Following that scheduled expiration, Wells Fargo purchased the Dillard's private label card portfolio from Synchrony and began managing Dillard's private label cards under the Wells Fargo Alliance. Under the Wells Fargo Alliance, Wells Fargo establishes and owns private label card accounts for our customers, retains the benefits and risks associated with the ownership of the accounts, provides key customer service functions, including new account openings, transaction authorization, billing adjustments and customer inquiries, receives the finance charge income and incurs the bad debts associated with those accounts.
27
Pursuant to the Wells Fargo Alliance, we receive on-going cash compensation from Wells Fargo based upon the portfolio's earnings. The compensation earned on the portfolio is determined monthly and has no recourse provisions. The amount the Company receives is dependent on the level of sales on Wells Fargo accounts, the level of balances carried on Wells Fargo accounts by Wells Fargo customers, payment rates on Wells Fargo accounts, finance charge rates and other fees on Wells Fargo accounts, the level of credit losses for the Wells Fargo accounts as well as Wells Fargo's ability to extend credit to our customers. We participate in the marketing of the private label cards, which includes the cost of customer reward programs. We accept payments on the private label cards in our stores as a convenience to customers who prefer to pay in person rather than by paying online or mailing their payments to Wells Fargo. The Wells Fargo Alliance expires in fiscal 2024.
The Company received income of approximately $104 million, $105 million and $112 million from the Wells Fargo Alliance and former Synchrony Alliance during fiscal 2016, 2015 and 2014, respectively.
Net cash flows from operations increased $66.8 million during fiscal 2016 compared to fiscal 2015. This increase was primarily attributable to an increase of $153.1 million related to changes in working capital items, primarily increases in trade accounts payable and accrued expenses. These increases were partially offset by decreases in gross profit.
Net cash flows from operations decreased $161.4 million during fiscal 2015 compared to fiscal 2014. This decrease was primarily attributable to a decrease of $87.1 million related to changes in working capital items, primarily of decreases in trade accounts payable and accrued expenses and income taxes payable and a decrease in gross profit.
Investing Activities
Cash inflows from investing activities generally include proceeds from sales of property and equipment. Investment cash outflows generally include payments for capital expenditures such as property and equipment.
Capital expenditures decreased $61.0 million for fiscal 2016 compared to fiscal 2015. The decline in capital expenditures was primarily related to the construction of new stores during the comparable prior year period. The fiscal 2016 expenditures of
$104.8 million were primarily for the remodeling of our Four Seasons store in Greensboro, North Carolina (200,000 square feet replacing 214,000 square feet) and other existing stores.
Capital expenditures increased $13.9 million for fiscal 2015 compared to fiscal 2014. The fiscal 2015 expenditures of
$165.8 million were primarily for the remodeling of existing stores and for the construction of our three new stores: Fashion Place in Murray, Utah (200,000 square feet replacing 190,000 square feet), Fremaux Town Center in Slidell, Louisiana (126,000 square feet) and Liberty Center in Cincinnati, Ohio (155,000 square feet), all of which opened during the third quarter of fiscal 2015.
Capital expenditures for fiscal 2017 are expected to be approximately
$125 million
. These expenditures are primarily for the construction and remodeling of stores.
During fiscal 2016, we closed the Aiken store in Aiken, South Carolina (105,000 square feet), the South Towne clearance center in Sandy, Utah (100,000 square feet) and the Six Flags clearance center in Arlington, Texas (85,000 square feet). We remain committed to closing under-performing stores where appropriate and may incur future closing costs related to these stores when they close.
During fiscal 2016, we closed a full-line store due to water damage. Property and merchandise losses are covered by insurance, and we received $1.5 million and $3.2 million in insurance proceeds for the property and merchandise losses, respectively. The Company is evaluating its alternatives for this location.
During fiscal 2016, 2015 and 2014, we received proceeds from the sale of property and equipment of $1.2 million, $25.5 million and $14.8 million, respectively, and recorded related gains of
$0.9 million
,
$12.6 million
and
$6.4 million
, respectively. At January 31, 2015, $7.3 million of the fiscal 2014 proceeds were being held in escrow for the acquisition of replacement property under like-kind exchange agreements. The escrow accounts were administered by an intermediary. Pursuant to the like-kind exchange agreements, the cash was restricted for a maximum of 180 days from the date of the property sale pending the acquisition of replacement property. Changes in restricted cash balances are reflected as an investment activity in the accompanying Consolidated Statements of Cash Flows. During fiscal 2015, payments of $7.3 million were made from restricted cash for like-kind property.
During fiscal 2016, the Company invested $20.0 million in an existing open air center joint venture located in Bonita Springs, Florida. The investment was funded using cash on hand. The joint venture used these funds in the refinancing of its debt. The Company received a distribution of $2.5 million from this investment.
During fiscal 2014, the Company received a final distribution of $1.1 million from its investment in a property located in Toledo, Ohio, resulting in a loss of $0.3 million that was recorded in gain (loss) on disposal of assets.
28
Financing Activities
Our primary source of cash inflows from financing activities is generally our $1.0 billion senior unsecured revolving credit facility. Financing cash outflows generally include the repayment of borrowings under the revolving credit facility, the repayment of long-term debt, capital lease obligations, the payment of dividends and the purchase of treasury stock.
Cash used in financing activities decreased to $253.2 million in fiscal 2016 from $518.2 million in fiscal 2015. This decrease in cash used of $264.9 million was primarily due to a decrease in stock repurchases.
Cash used in financing activities increased to $518.2 million in fiscal 2015 from $301.6 million in fiscal 2014. This increase in cash used of $216.6 million was primarily due to an increase in stock repurchases.
Stock Repurchase.
In February 2016, the Company's Board of Directors authorized the Company to repurchase up to
$500 million
of the Company's Class A Common Stock under an open-ended plan ("February 2016 Stock Plan"). During fiscal 2016, the Company repurchased 3.8 million shares for $246.2 million (including the accrual of $6.0 million of share repurchases that had not settled as of January 28, 2017) at an average price of $64.61 per share. As of January 28, 2017,
$253.8
million authorization remained under the February 2016 Stock Plan.
In November 2014, the Company's Board of Directors authorized the Company to repurchase up to $500 million of the Company's Class A Common Stock under an open-ended plan ("November 2014 Stock Plan"). During fiscal 2015, the Company repurchased 5.3 million shares for $500.0 million at an average price of $94.22 per share, which completed the authorization under the November 2014 Stock Plan.
In March 2013, the Company's Board of Directors authorized the Company to repurchase up to $250 million of the Company's Class A Common Stock under an open-ended plan ("March 2013 Stock Plan"). During fiscal 2014, the Company repurchased 0.5 million shares for $40.4 million at an average price of $89.04 per share, which completed the authorization under the March 2013 Stock Plan.
In November 2013, the Company's Board of Directors authorized the Company to repurchase up to
$250 million
of the Company's Class A Common Stock under an open-ended plan ("November 2013 Stock Plan"). During fiscal 2014, the Company repurchased
2.3 million
shares for
$250.0 million
at an average price of
$107.44
per share, which completed the authorization under the November 2013 Stock Plan.
The ultimate disposition of the repurchased stock has not been determined.
Revolving Credit Agreement.
In May 2015, the Company entered into a $1.0 billion senior unsecured revolving credit facility ("credit agreement"), replacing the Company's prior secured credit facility. The credit agreement expires May 13, 2020 and is available to the Company for working capital needs and general corporate purposes including, among other uses, working capital financing, the issuance of letters of credit, capital expenditures and, subject to certain restrictions, the repayment of existing indebtedness and share repurchases.
The Company pays a variable rate of interest on borrowings under the credit agreement and a commitment fee to the participating banks based on the Company's debt rating. The rate of interest on borrowings is LIBOR plus 1.375%, and the commitment fee for unused borrowings is 0.20% per annum.
No
borrowings were outstanding at
January 28, 2017
. Letters of credit totaling
$26.5 million
were issued under this credit agreement leaving unutilized availability under the facility of approximately
$974 million
at
January 28, 2017
. The Company had weighted-average borrowings of
$19.8 million
,
$41.3 million
and $13.1 million during fiscal 2016, 2015 and 2014, respectively.
Peak borrowings under the credit facility were
$110 million
during fiscal 2016.
To be in compliance with the financial covenants of the credit agreement, the Company's total leverage ratio cannot exceed 4.0 to 1.0 and the coverage ratio cannot be less than 2.5 to 1.0, as defined in the credit agreement. At January 28, 2017, the Company was in compliance with all financial covenants related to the credit agreement.
29
Long-term debt maturities over the next five years are (in millions):
|
Fiscal Year
|
Long-Term Debt Maturities
|
||
|
2017
|
$
|
87.2
|
|
|
2018
|
161.0
|
|
|
|
2019
|
—
|
|
|
|
2020
|
—
|
|
|
|
2021
|
—
|
|
|
During fiscal 2016, the Company decreased its net level of outstanding debt and capital leases by $3.0 million, specifically related to capital leases, compared to an increase of $3.8 million in fiscal 2015. No debt matured during fiscal 2016, 2015 or 2014.
Subordinated Debentures.
As of
January 28, 2017
, the Company had $200 million outstanding of its 7.5% subordinated debentures due August 1, 2038. All of these subordinated debentures were held by Dillard's Capital Trust I, a 100% owned, unconsolidated finance subsidiary of the Company. The Company has the right to defer the payment of interest on the subordinated debentures at any time for a period not to exceed 20 consecutive quarters; however, the Company has no present intention of exercising this right to defer interest payments.
Fiscal 2017 Outlook
During fiscal 2017, the Company expects to finance its capital expenditures and its working capital requirements, as well as stock repurchases and the payment of dividends from cash on hand, cash flows generated from operations and utilization of the credit facility. At present, there are numerous general business and economic factors impacting the retail industry that could affect the Company's liquidity. These factors include: consumer confidence; economic instability around the globe; and other factors that are both separate from, and outgrowths of, these factors. These conditions could impact our net sales which may result in reduced cash flows if we are unable to appropriately manage our inventory levels and expenses. Depending upon our actual and anticipated sources and uses of liquidity, the Company will from time to time consider possible financing transactions, the proceeds of which could be used to refinance current indebtedness or for other corporate purposes.
OFF-BALANCE-SHEET ARRANGEMENTS
The Company has not created, and is not party to, any special-purpose entities or off-balance-sheet arrangements for the purpose of raising capital, incurring debt or operating the Company's business. The Company does not have any off-balance-sheet arrangements or relationships that are reasonably likely to materially affect the Company's financial condition, changes in financial condition, revenues or expenses, results of operations, liquidity, capital expenditures or the availability of capital resources.
30
CONTRACTUAL OBLIGATIONS AND COMMERCIAL COMMITMENTS
To facilitate an understanding of the Company's contractual obligations and commercial commitments, the following data is provided:
PAYMENTS DUE BY PERIOD
|
(in thousands of dollars)
Contractual Obligations
|
Total
|
Less than
1 year
|
1 - 3 years
|
3 - 5 years
|
More than
5 years
|
||||||||||||||
|
Long-term debt
|
$
|
614,785
|
|
$
|
87,201
|
|
$
|
160,959
|
|
$
|
—
|
|
$
|
366,625
|
|
||||
|
Interest on long-term debt
|
298,890
|
|
45,046
|
|
60,198
|
|
54,601
|
|
139,045
|
|
|||||||||
|
Subordinated debentures
|
200,000
|
|
—
|
|
—
|
|
—
|
|
200,000
|
|
|||||||||
|
Interest on subordinated debentures
|
322,767
|
|
15,246
|
|
29,918
|
|
29,918
|
|
247,685
|
|
|||||||||
|
Capital lease obligations, including interest
|
8,358
|
|
3,699
|
|
2,856
|
|
1,803
|
|
—
|
|
|||||||||
|
Benefit plan participant payments
|
186,203
|
|
5,321
|
|
13,255
|
|
19,147
|
|
148,480
|
|
|||||||||
|
Purchase obligations(1)
|
1,299,750
|
|
1,288,250
|
|
11,500
|
|
—
|
|
—
|
|
|||||||||
|
Operating leases(2)
|
54,727
|
|
19,640
|
|
24,299
|
|
9,081
|
|
1,707
|
|
|||||||||
|
Total contractual cash obligations(3)(4)
|
$
|
2,985,480
|
|
$
|
1,464,403
|
|
$
|
302,985
|
|
$
|
114,550
|
|
$
|
1,103,542
|
|
||||
___________________________________
|
(1)
|
The Company's purchase obligations principally consist of purchase orders for merchandise and store construction commitments. Amounts committed under open purchase orders for merchandise inventory represent $1,241.0 million of the purchase obligations, of which a significant portion are cancelable without penalty prior to a date that precedes the vendor's scheduled shipment date.
|
|
(2)
|
The operating leases included in the above table do not include contingent rent based upon sales volume, which represented approximately
17%
of minimum lease obligations in fiscal 2016.
|
|
(3)
|
The total liability for unrecognized tax benefits is $3.0 million, including tax, penalty, and interest. The Company is not able to reasonably estimate the timing of future cash flows and has excluded these liabilities from the table above; however, at this time, the Company does not expect a significant change in unrecognized tax benefits in the next twelve months.
|
|
(4)
|
The Company is unable to reasonably estimate the timing of future cash flows of workers' compensation and general liability insurance reserves of $25.6 million and gift card liabilities of $21.5 million and have excluded these from the table above.
|
AMOUNT OF COMMITMENT EXPIRATION PER PERIOD
|
(in thousands of dollars)
Other Commercial Commitments
|
Total Amounts
Committed
|
Within 1 year
|
2 - 3 years
|
4 - 5 years
|
After
5 years
|
||||||||||||||
|
$1.0 billion line of credit, none outstanding(1)
|
$
|
—
|
|
$
|
—
|
|
$
|
—
|
|
$
|
—
|
|
$
|
—
|
|
||||
|
Standby letters of credit
|
26,430
|
|
26,430
|
|
—
|
|
—
|
|
—
|
|
|||||||||
|
Import letters of credit
|
96
|
|
96
|
|
—
|
|
—
|
|
—
|
|
|||||||||
|
Total commercial commitments
|
$
|
26,526
|
|
$
|
26,526
|
|
$
|
—
|
|
$
|
—
|
|
$
|
—
|
|
||||
___________________________________
|
(1)
|
At
January 28, 2017
, letters of credit totaling
$26.5 million
were issued under the credit agreement.
|
NEW ACCOUNTING PRONOUNCEMENTS
For information with respect to new accounting pronouncements and the impact of these pronouncements on our consolidated financial statements, see Note 1 in the "Notes to Consolidated Financial Statements" in Item 8 hereof.
31
FORWARD-LOOKING INFORMATION
This report contains certain forward-looking statements. The following are or may constitute forward looking statements within the meaning of the Private Securities Litigation Reform Act of 1995: (a) statements including words such as "may," "will," "could," "believe," "expect," "future," "potential," "anticipate," "intend," "plan," "estimate," "continue," or the negative or other variations thereof; (b) statements regarding matters that are not historical facts; and (c) statements about the Company's future occurrences, plans and objectives, including those statements included under the headings "2017 Guidance" and "Fiscal 2017 Outlook" included in this Management's Discussion and Analysis and other statements regarding management's expectations and forecasts for fiscal 2017, statements concerning the opening of new stores or the closing of existing stores, statements concerning capital expenditures and sources of liquidity, statements concerning pension contributions and statements concerning estimated taxes. The Company cautions that forward-looking statements contained in this report are based on estimates, projections, beliefs and assumptions of management and information available to management at the time of such statements and are not guarantees of future performance. The Company disclaims any obligation to update or revise any forward-looking statements based on the occurrence of future events, the receipt of new information, or otherwise. Forward-looking statements of the Company involve risks and uncertainties and are subject to change based on various important factors. Actual future performance, outcomes and results may differ materially from those expressed in forward-looking statements made by the Company and its management as a result of a number of risks, uncertainties and assumptions. Representative examples of those factors include (without limitation) general retail industry conditions and macro-economic conditions; economic and weather conditions for regions in which the Company's stores are located and the effect of these factors on the buying patterns of the Company's customers, including the effect of changes in prices and availability of oil and natural gas; the availability of consumer credit; the impact of competitive pressures in the department store industry and other retail channels including specialty, off-price, discount and Internet retailers; changes in consumer confidence, spending patterns, debt levels and their ability to meet credit obligations; high levels of unemployment; changes in tax legislation; changes in legislation, affecting such matters as the cost of employee benefits or credit card income; adequate and stable availability of materials, production facilities and labor from which the Company sources its merchandise at acceptable pricing; changes in operating expenses, including employee wages, commission structures and related benefits; system failures or data security breaches; possible future acquisitions of store properties from other department store operators; the continued availability of financing in amounts and at the terms necessary to support the Company's future business; fluctuations in LIBOR and other base borrowing rates; potential disruption from terrorist activity and the effect on ongoing consumer confidence; epidemic, pandemic or other public health issues; potential disruption of international trade and supply chain efficiencies; world conflict and the possible impact on consumer spending patterns and other economic and demographic changes of similar or dissimilar nature, and other risks and uncertainties, including those detailed from time to time in our periodic reports filed with the SEC, particularly those set forth under the caption "Item 1A, Risk Factors" in this Annual Report.
The table below provides information about the Company's obligations that are sensitive to changes in interest rates. The table presents maturities of the Company's long-term debt and subordinated debentures along with the related weighted-average interest rates by expected maturity dates.
|
Expected Maturity Date
(fiscal year)
|
|||||||||||||||||||||||||||||||
|
(in thousands of dollars)
|
2017
|
2018
|
2019
|
2020
|
2021
|
Thereafter
|
Total
|
Fair Value
|
|||||||||||||||||||||||
|
Long-term debt
|
$
|
87,201
|
|
$
|
160,959
|
|
$
|
—
|
|
$
|
—
|
|
$
|
—
|
|
$
|
366,625
|
|
$
|
614,785
|
|
$
|
686,620
|
|
|||||||
|
Average fixed interest rate
|
6.6
|
%
|
7.1
|
%
|
—
|
%
|
—
|
%
|
—
|
%
|
7.5
|
%
|
7.3
|
%
|
|
|
|||||||||||||||
|
Subordinated debentures
|
$
|
—
|
|
$
|
—
|
|
$
|
—
|
|
$
|
—
|
|
$
|
—
|
|
$
|
200,000
|
|
$
|
200,000
|
|
$
|
208,320
|
|
|||||||
|
Average interest rate
|
—
|
|
—
|
|
—
|
|
—
|
|
—
|
|
7.5
|
%
|
7.5
|
%
|
|
|
|||||||||||||||
The Company is exposed to market risk from changes in the interest rates under its $1.0 billion senior unsecured revolving credit facility. Outstanding balances under this facility bear interest at a variable rate of LIBOR plus 1.375%. The Company had weighted average borrowings of
$19.8 million
during fiscal 2016. Based on the average amount outstanding during fiscal 2016, a 100 basis point change in interest rates would result in an approximate $0.2 million annual change to interest expense.
The consolidated financial statements of the Company and notes thereto are included in this report beginning on page F-1.
32
|
ITEM 9.
|
CHANGES IN AND DISAGREEMENTS WITH ACCOUNTANTS ON ACCOUNTING AND FINANCIAL DISCLOSURE.
|
None.
Evaluation of Disclosure Controls and Procedures
The Company has established and maintains disclosure controls and procedures (as defined in Rule 13a-15(e) under the Exchange Act). The Company's management, with the participation of our Principal Executive Officer and Co-Principal Financial Officers, has evaluated the effectiveness of the Company's disclosure controls and procedures as of the end of the fiscal year covered by this annual report, and based on that evaluation, the Company's Principal Executive Officer and Co-Principal Financial Officers have concluded that these disclosure controls and procedures were effective.
Management's Report on Internal Control over Financial Reporting
Our management is responsible for establishing and maintaining adequate internal control over financial reporting, as such term is defined in Exchange Act Rule 13a-15(f). Under the supervision and with the participation of our management, including our Principal Executive Officer and Co-Principal Financial Officers, we conducted an evaluation of the effectiveness of our internal control over financial reporting based on the framework in
2013 Internal Control - Integrated Framework
issued by the Committee of Sponsoring Organizations of the Treadway Commission. Based on our evaluation under the framework in
2013 Internal Control - Integrated Framework
, our management concluded that our internal control over financial reporting was effective as of
January 28, 2017
.
Our independent registered public accounting firm, KPMG LLP ("KPMG"), has audited our consolidated financial statements included in this Annual Report and has issued a report on the effectiveness of our internal control over financial reporting as of
January 28, 2017
. Please refer to KPMG's "Report of Independent Registered Public Accounting Firm" on page F-2 of this Annual Report.
Changes in Internal Controls
There were no changes in our internal control over financial reporting that occurred during the fiscal quarter ended
January 28, 2017
that have materially affected, or are reasonably likely to materially affect, our internal control over financial reporting.
None.
33
A. Directors of the Company
The information called for by this item regarding directors of the Company is incorporated herein by reference from the information under the headings "Election of Directors", "Audit Committee Report", "Information Regarding the Board and Its Committees" and "Section 16(a) Beneficial Ownership Reporting Compliance" in the Proxy Statement.
B. Executive Officers of the Company
Information regarding executive officers of the Company is included in Part I of this report under the heading "Executive Officers of the Company." Reference additionally is made to the information under the heading "Section 16(a) Beneficial Ownership Reporting Compliance" in the Proxy Statement, which information is incorporated herein by reference.
The Company's Board of Directors ("Board") has adopted a Code of Conduct that applies to all Company employees, including the Company's executive officers, and, when appropriate, the members of the Board. As stated in the Code of Conduct, there are certain limited situations in which the Company may waive application of the Code of Conduct to employees or members of the Board. For example, since non-employee members of the Board rarely, if ever, deal financially with vendors and other suppliers of the Company on the Company's behalf, it may not be appropriate to seek to apply the Code of Conduct to their dealings with these vendors and suppliers on behalf of other organizations which have no relationship to the Company. To the extent that any such waiver applies to an executive officer or a member of the Board, the waiver requires the express approval of the Board, and the Company intends to satisfy the disclosure requirements of Form 8-K regarding any such waiver from, or an amendment to, any provision of the Code of Conduct, by posting such waiver or amendment on the Company's website. The current version of the Code of Conduct is available free of charge on the Company's website, www.dillards.com, and is available in print to any stockholder who requests copies by contacting Julie J. Bull, Director of Investor Relations, at the Company's corporate executive offices at 1600 Cantrell Rd, Little Rock, AR 72201.
The information called for by this item is incorporated herein by reference from the information under the headings "2016 Director Compensation", "Compensation Discussion and Analysis", "Compensation Committee Report" and "Executive Compensation" in the Proxy Statement.
|
ITEM 12.
|
SECURITY OWNERSHIP OF CERTAIN BENEFICIAL OWNERS AND MANAGEMENT AND RELATED STOCKHOLDER MATTERS.
|
Equity Compensation Plan Information
|
Number of securities to be
issued upon exercise of
outstanding options
|
Weighted average
exercise prices of
outstanding options
|
Number of securities
available for future
issuance under equity
compensation plans
|
|||||||
|
Equity compensation plans approved by stockholders*
|
—
|
|
$
|
—
|
|
8,682,161
|
|
||
|
Total
|
—
|
|
$
|
—
|
|
8,682,161
|
|
||
___________________________________
|
*
|
Included in this category are the following equity compensation plans, which have been approved by the Company's stockholders:
|
|
•
|
1990 Incentive and Nonqualified Stock Option Plan
|
|
•
|
1998 Incentive and Nonqualified Stock Option Plan
|
|
•
|
2000 Incentive and Nonqualified Stock Option Plan
|
|
•
|
Dillard's, Inc. Stock Bonus Plan
|
|
•
|
Dillard's, Inc. Stock Purchase Plan
|
|
•
|
Dillard's, Inc. 2005 Non-Employee Director Restricted Stock Plan
|
There are no non-stockholder approved plans. Balances presented in the table above are as of
January 28, 2017
.
34
Additional information called for by this item is incorporated herein by reference from the information under the headings "Security Ownership of Certain Beneficial Holders" and "Security Ownership of Management" in the Proxy Statement.
The information called for by this item is incorporated herein by reference from the information under the headings "Certain Relationships and Transactions" and "Information Regarding the Board and its Committees" in the Proxy Statement.
The information called for by this item is incorporated herein by reference from the information under the heading "Independent Accountant Fees" in the Proxy Statement.
35
(a)(1) and (2)
Financial Statements
An "Index of Financial Statements" has been filed as a part of this report beginning on page F-1 hereof.
(a)(3)
Exhibits and Management Compensatory Plans
An "Exhibit Index" has been filed as a part of this Report beginning on page E-1 hereof and is incorporated herein by reference.
None.
36
SIGNATURES
Pursuant to the requirements of Section 13 or 15(d) of the Securities Exchange Act of 1934, the Registrant has duly caused this report to be signed on its behalf by the undersigned, thereunto duly authorized.
|
|
|
|
|
By:
|
/s/ PHILLIP R. WATTS
|
|
|
Phillip R. Watts
|
||
|
Senior Vice President, Co-Principal Financial Officer
and Principal Accounting Officer
|
||
|
By:
|
/s/ CHRIS B. JOHNSON
|
|
|
Chris B. Johnson
|
||
|
Senior Vice President and Co-Principal Financial
Officer
|
||
Date:
March 24, 2017
Pursuant to the requirements of the Securities Exchange Act of 1934, this report has been signed below by the following persons on behalf of the Registrant and in the capacities and on the date indicated.
|
/s/ WILLIAM DILLARD, II
|
/s/ CHRIS B. JOHNSON
|
|
|
William Dillard, II
Chairman of the Board and Chief Executive Officer
(Principal Executive Officer)
|
Chris B. Johnson
Senior Vice President and Co-Principal Financial
Officer
|
|
|
/s/ ALEX DILLARD
|
/s/ PHILLIP R. WATTS
|
|
|
Alex Dillard
President and Director
|
Phillip R. Watts
Senior Vice President, Co-Principal Financial Officer
and Principal Accounting Officer
|
|
|
/s/ MIKE DILLARD
|
/s/ DRUE MATHENY
|
|
|
Mike Dillard
Executive Vice President and Director
|
Drue Matheny
Executive Vice President and Director
|
|
|
/s/ ROBERT C. CONNOR
|
/s/ JAMES I. FREEMAN
|
|
|
Robert C. Connor
Director
|
James I. Freeman
Director
|
|
|
/s/ H. LEE HASTINGS
|
/s/ FRANK R. MORI
|
|
|
H. Lee Hastings
Director
|
|
Frank R. Mori
Director
|
|
/s/ REYNIE RUTLEDGE
|
/s/ WARREN A. STEPHENS
|
|
|
Reynie Rutledge
Director
|
|
Warren A. Stephens
Director
|
|
/s/ J.C. WATTS, JR.
|
/s/ NICK WHITE
|
|
|
J. C. Watts, Jr.
Director
|
|
Nick White
Director
|
Date:
March 24, 2017
37
INDEX OF FINANCIAL STATEMENTS
DILLARD'S, INC. AND SUBSIDIARIES
Year Ended
January 28, 2017
|
Page
|
|
|
Consolidated Balance Sheets—January
28, 2017 and January 30, 2016
|
|
|
Consolidated Statements of Income—Fiscal years ended January
28, 2017, January 30, 2016 and January 31, 2015
|
|
|
Consolidated Statements of Comprehensive Income—Fiscal years ended January
28, 2017, January 30, 2016 and January 31, 2015
|
|
|
Consolidated Statements of Stockholders' Equity—Fiscal years ended January
28, 2017, January 30, 2016 and January 31, 2015
|
|
|
Consolidated Statements of Cash Flows—Fiscal years ended January
28, 2017, January 30, 2016 and January 31, 2015
|
|
|
Notes to Consolidated Financial Statements—Fiscal years ended January
28, 2017, January 30, 2016 and January 31, 2015
|
|
F-1
REPORT OF INDEPENDENT REGISTERED PUBLIC ACCOUNTING FIRM
The Board of Directors and Stockholders
Dillard’s, Inc.:
We have audited Dillard’s, Inc.’s (the Company) internal control over financial reporting as of January 28, 2017, based on criteria established in
Internal Control - Integrated Framework (2013)
issued by the Committee of Sponsoring Organizations of the Treadway Commission (COSO). The Company’s management is responsible for maintaining effective internal control over financial reporting and for its assessment of the effectiveness of internal control over financial reporting, included in the accompanying Management’s Report on Internal Control over Financial Reporting. Our responsibility is to express an opinion on the Company’s internal control over financial reporting based on our audit.
We conducted our audit in accordance with the standards of the Public Company Accounting Oversight Board (United States). Those standards require that we plan and perform the audit to obtain reasonable assurance about whether effective internal control over financial reporting was maintained in all material respects. Our audit included obtaining an understanding of internal control over financial reporting, assessing the risk that a material weakness exists, and testing and evaluating the design and operating effectiveness of internal control based on the assessed risk. Our audit also included performing such other procedures as we considered necessary in the circumstances. We believe that our audit provides a reasonable basis for our opinion.
A company’s internal control over financial reporting is a process designed to provide reasonable assurance regarding the reliability of financial reporting and the preparation of financial statements for external purposes in accordance with generally accepted accounting principles. A company’s internal control over financial reporting includes those policies and procedures that (1) pertain to the maintenance of records that, in reasonable detail, accurately and fairly reflect the transactions and dispositions of the assets of the company; (2) provide reasonable assurance that transactions are recorded as necessary to permit preparation of financial statements in accordance with generally accepted accounting principles, and that receipts and expenditures of the company are being made only in accordance with authorizations of management and directors of the company; and (3) provide reasonable assurance regarding prevention or timely detection of unauthorized acquisition, use, or disposition of the company’s assets that could have a material effect on the financial statements.
Because of its inherent limitations, internal control over financial reporting may not prevent or detect misstatements. Also, projections of any evaluation of effectiveness to future periods are subject to the risk that controls may become inadequate because of changes in conditions, or that the degree of compliance with the policies or procedures may deteriorate.
In our opinion, Dillard’s, Inc. maintained, in all material respects, effective internal control over financial reporting as of January 28, 2017, based on criteria established in
Internal Control - Integrated Framework (2013)
issued by the Committee of Sponsoring Organizations of the Treadway Commission (COSO).
We also have audited, in accordance with the standards of the Public Company Accounting Oversight Board (United States), the consolidated balance sheets of Dillard’s, Inc. and subsidiaries as of January 28, 2017 and January 30, 2016, and the related consolidated statements of income, comprehensive income, stockholders’ equity, and cash flows for each of the years in the three-year period ended January 28, 2017, and our report dated March 24, 2017 expressed an unqualified opinion on those consolidated financial statements.
/s/ KPMG LLP
Dallas, Texas
March 24, 2017
F-2
REPORT OF INDEPENDENT REGISTERED PUBLIC ACCOUNTING FIRM
The Board of Directors and Stockholders
Dillard's, Inc.:
We have audited the accompanying consolidated balance sheets of Dillard’s, Inc. and subsidiaries (the Company) as of January 28, 2017 and January 30, 2016, and the related consolidated statements of income, comprehensive income, stockholders’ equity, and cash flows for each of the years in the three‑year period ended January 28, 2017. These consolidated financial statements are the responsibility of the Company’s management. Our responsibility is to express an opinion on these consolidated financial statements based on our audits.
We conducted our audits in accordance with the standards of the Public Company Accounting Oversight Board (United States). Those standards require that we plan and perform the audit to obtain reasonable assurance about whether the financial statements are free of material misstatement. An audit includes examining, on a test basis, evidence supporting the amounts and disclosures in the financial statements. An audit also includes assessing the accounting principles used and significant estimates made by management, as well as evaluating the overall financial statement presentation. We believe that our audits provide a reasonable basis for our opinion.
In our opinion, the consolidated financial statements referred to above present fairly, in all material respects, the financial position of Dillard’s, Inc. and subsidiaries as of January 28, 2017 and January 30, 2016, and the results of their operations and their cash flows for each of the years in the three‑year period ended January 28, 2017, in conformity with U.S. generally accepted accounting principles.
We also have audited, in accordance with the standards of the Public Company Accounting Oversight Board (United States), the Company’s internal control over financial reporting as of January 28, 2017, based on criteria established in
Internal Control - Integrated Framework (2013)
issued by the Committee of Sponsoring Organizations of the Treadway Commission (COSO), and our report dated March 24, 2017 expressed an unqualified opinion on the effectiveness of the Company’s internal control over financial reporting.
/s/ KPMG LLP
Dallas, Texas
March 24, 2017
F-3
Dollars in Thousands
|
January 28, 2017
|
January 30, 2016
|
||||||
|
Assets
|
|
|
|||||
|
Current assets:
|
|
|
|||||
|
Cash and cash equivalents
|
$
|
346,985
|
|
$
|
202,869
|
|
|
|
Accounts receivable
|
48,230
|
|
47,138
|
|
|||
|
Merchandise inventories
|
1,406,403
|
|
1,374,505
|
|
|||
|
Other current assets
|
36,303
|
|
44,371
|
|
|||
|
Total current assets
|
1,837,921
|
|
1,668,883
|
|
|||
|
Property and equipment:
|
|
|
|||||
|
Land and land improvements
|
64,313
|
|
64,313
|
|
|||
|
Buildings and leasehold improvements
|
3,106,481
|
|
3,106,014
|
|
|||
|
Furniture, fixtures and equipment
|
1,065,291
|
|
1,130,471
|
|
|||
|
Buildings under construction
|
9,024
|
|
398
|
|
|||
|
Buildings and equipment under capital leases
|
23,648
|
|
23,648
|
|
|||
|
Less accumulated depreciation and amortization
|
(2,478,490
|
)
|
(2,385,012
|
)
|
|||
|
1,790,267
|
|
1,939,832
|
|
||||
|
Other assets
|
259,948
|
|
255,186
|
|
|||
|
Total assets
|
$
|
3,888,136
|
|
$
|
3,863,901
|
|
|
|
Liabilities and stockholders' equity
|
|
|
|||||
|
Current liabilities:
|
|
|
|||||
|
Trade accounts payable and accrued expenses
|
$
|
839,305
|
|
$
|
691,310
|
|
|
|
Current portion of long-term debt
|
87,201
|
|
—
|
|
|||
|
Current portion of capital lease obligations
|
3,281
|
|
3,284
|
|
|||
|
Federal and state income taxes
|
46,730
|
|
56,622
|
|
|||
|
Total current liabilities
|
976,517
|
|
751,216
|
|
|||
|
Long-term debt
|
526,106
|
|
613,061
|
|
|||
|
Capital lease obligations
|
3,988
|
|
7,269
|
|
|||
|
Other liabilities
|
238,424
|
|
238,980
|
|
|||
|
Deferred income taxes
|
225,684
|
|
258,070
|
|
|||
|
Subordinated debentures
|
200,000
|
|
200,000
|
|
|||
|
Commitments and contingencies
|
|
|
|||||
|
Stockholders' equity:
|
|
|
|||||
|
Common stock, Class A—119,814,702 and 119,767,148 shares issued; 28,147,158 and 31,909,989 shares outstanding
|
1,198
|
|
1,198
|
|
|||
|
Common stock, Class B (convertible)—4,010,401 and 4,010,401 shares issued and outstanding
|
40
|
|
40
|
|
|||
|
Additional paid-in capital
|
943,467
|
|
940,796
|
|
|||
|
Accumulated other comprehensive loss
|
(11,137
|
)
|
(17,118
|
)
|
|||
|
Retained earnings
|
4,153,844
|
|
3,994,211
|
|
|||
|
Less treasury stock, at cost, Class A—91,667,544 and 87,857,159 shares
|
(3,369,995
|
)
|
(3,123,822
|
)
|
|||
|
Total stockholders' equity
|
1,717,417
|
|
1,795,305
|
|
|||
|
Total liabilities and stockholders' equity
|
$
|
3,888,136
|
|
$
|
3,863,901
|
|
|
See notes to consolidated financial statements.
F-4
Dollars in Thousands, Except Per Share Data
|
|
Years Ended
|
||||||||||
|
|
January 28, 2017
|
January 30, 2016
|
January 31, 2015
|
||||||||
|
Net sales
|
$
|
6,256,971
|
|
$
|
6,595,626
|
|
$
|
6,621,054
|
|
||
|
Service charges and other income
|
161,038
|
|
158,919
|
|
159,075
|
|
|||||
|
6,418,009
|
|
6,754,545
|
|
6,780,129
|
|
||||||
|
Cost of sales
|
4,166,411
|
|
4,350,805
|
|
4,272,605
|
|
|||||
|
Selling, general and administrative expenses
|
1,655,658
|
|
1,669,916
|
|
1,663,859
|
|
|||||
|
Depreciation and amortization
|
243,657
|
|
250,011
|
|
250,683
|
|
|||||
|
Rentals
|
25,954
|
|
26,732
|
|
26,977
|
|
|||||
|
Interest and debt expense, net
|
63,059
|
|
60,923
|
|
61,306
|
|
|||||
|
Gain on disposal of assets
|
(905
|
)
|
(12,626
|
)
|
(6,069
|
)
|
|||||
|
Asset impairment and store closing charges
|
6,500
|
|
—
|
|
—
|
|
|||||
|
Income before income taxes and income on and equity in losses of joint ventures
|
257,675
|
|
408,784
|
|
510,768
|
|
|||||
|
Income taxes
|
88,500
|
|
140,770
|
|
179,480
|
|
|||||
|
Income on and equity in losses of joint ventures
|
45
|
|
1,356
|
|
565
|
|
|||||
|
Net income
|
$
|
169,220
|
|
$
|
269,370
|
|
$
|
331,853
|
|
||
|
Earnings per common share:
|
|
|
|
||||||||
|
Basic
|
$
|
4.93
|
|
$
|
6.91
|
|
$
|
7.79
|
|
||
|
Diluted
|
4.93
|
|
6.91
|
|
7.79
|
|
|||||
See notes to consolidated financial statements.
F-5
Consolidated Statements of Comprehensive Income
Dollars in Thousands
|
|
Years Ended
|
||||||||||
|
|
January 28, 2017
|
January 30, 2016
|
January 31, 2015
|
||||||||
|
Net income
|
$
|
169,220
|
|
$
|
269,370
|
|
$
|
331,853
|
|
||
|
Other comprehensive income (loss):
|
|
|
|
||||||||
|
Amortization of retirement plan and other retiree benefit adjustments (net of tax of $3,686, $8,574 and $(4,235))
|
5,981
|
|
13,911
|
|
(6,955
|
)
|
|||||
|
Comprehensive income
|
$
|
175,201
|
|
$
|
283,281
|
|
$
|
324,898
|
|
||
See notes to consolidated financial statements.
F-6
Consolidated Statements of Stockholders' Equity
Dollars in Thousands, Except Share and Per Share Data
|
|
Common Stock
|
|
Accumulated
Other
Comprehensive
Loss
|
|
|
|
|||||||||||||||||||||
|
|
Additional
Paid-in
Capital
|
Retained
Earnings
|
Treasury
Stock
|
|
|||||||||||||||||||||||
|
|
Class A
|
Class B
|
Total
|
||||||||||||||||||||||||
|
Balance, February 1, 2014
|
$
|
1,197
|
|
$
|
40
|
|
$
|
935,208
|
|
$
|
(24,074
|
)
|
$
|
3,413,240
|
|
$
|
(2,333,414
|
)
|
$
|
1,992,197
|
|
||||||
|
Net income
|
—
|
|
—
|
|
—
|
|
—
|
|
331,853
|
|
—
|
|
331,853
|
|
|||||||||||||
|
Other comprehensive loss
|
—
|
|
—
|
|
—
|
|
(6,955
|
)
|
—
|
|
—
|
|
(6,955
|
)
|
|||||||||||||
|
Issuance of 24,864 shares under stock bonus plans
|
—
|
|
—
|
|
2,785
|
|
—
|
|
—
|
|
—
|
|
2,785
|
|
|||||||||||||
|
Purchase of 2,780,743 shares of treasury stock
|
|
|
|
|
|
|
|
|
|
|
(290,408
|
)
|
(290,408
|
)
|
|||||||||||||
|
Cash dividends declared:
|
|
|
|
|
|
|
|
||||||||||||||||||||
|
Common stock, $0.24 per share
|
—
|
|
—
|
|
—
|
|
—
|
|
(10,202
|
)
|
—
|
|
(10,202
|
)
|
|||||||||||||
|
Balance, January 31, 2015
|
1,197
|
|
40
|
|
937,993
|
|
(31,029
|
)
|
3,734,891
|
|
(2,623,822
|
)
|
2,019,270
|
|
|||||||||||||
|
Net income
|
—
|
|
—
|
|
—
|
|
—
|
|
269,370
|
|
—
|
|
269,370
|
|
|||||||||||||
|
Other comprehensive income
|
—
|
|
—
|
|
—
|
|
13,911
|
|
—
|
|
—
|
|
13,911
|
|
|||||||||||||
|
Issuance of 34,830 shares under stock bonus plans
|
1
|
|
—
|
|
2,803
|
|
—
|
|
—
|
|
—
|
|
2,804
|
|
|||||||||||||
|
Purchase of 5,306,737 shares of treasury stock
|
—
|
|
—
|
|
—
|
|
—
|
|
—
|
|
(500,000
|
)
|
(500,000
|
)
|
|||||||||||||
|
Cash dividends declared:
|
|
|
|
|
|
|
|
||||||||||||||||||||
|
Common stock, $0.26 per share
|
—
|
|
—
|
|
—
|
|
—
|
|
(10,050
|
)
|
—
|
|
(10,050
|
)
|
|||||||||||||
|
Balance, January 30, 2016
|
1,198
|
|
40
|
|
940,796
|
|
(17,118
|
)
|
3,994,211
|
|
(3,123,822
|
)
|
1,795,305
|
|
|||||||||||||
|
Net income
|
|
|
|
|
|
|
|
|
169,220
|
|
|
|
169,220
|
|
|||||||||||||
|
Other comprehensive income
|
|
|
|
|
|
|
5,981
|
|
|
|
|
|
5,981
|
|
|||||||||||||
|
Issuance of 47,554 shares under stock bonus plans
|
|
|
|
|
2,671
|
|
|
|
|
|
|
|
2,671
|
|
|||||||||||||
|
Purchase of 3,810,385 shares of treasury stock
|
|
|
|
|
|
|
|
|
|
|
(246,173
|
)
|
(246,173
|
)
|
|||||||||||||
|
Cash dividends declared:
|
|
|
|
|
|
|
|
||||||||||||||||||||
|
Common stock, $0.28 per share
|
|
|
|
|
|
|
|
|
(9,587
|
)
|
|
|
(9,587
|
)
|
|||||||||||||
|
Balance, January 28, 2017
|
$
|
1,198
|
|
$
|
40
|
|
$
|
943,467
|
|
$
|
(11,137
|
)
|
$
|
4,153,844
|
|
$
|
(3,369,995
|
)
|
$
|
1,717,417
|
|
||||||
See notes to consolidated financial statements.
F-7
Dollars in Thousands
|
|
Years Ended
|
||||||||||
|
|
January 28, 2017
|
January 30, 2016
|
January 31, 2015
|
||||||||
|
Operating activities:
|
|
|
|
||||||||
|
Net income
|
$
|
169,220
|
|
$
|
269,370
|
|
$
|
331,853
|
|
||
|
Adjustments to reconcile net income to net cash provided by operating activities:
|
|
|
|
||||||||
|
Depreciation and amortization of property and other deferred cost
|
245,923
|
|
252,147
|
|
252,334
|
|
|||||
|
Deferred income taxes
|
(35,703
|
)
|
(35,975
|
)
|
(30,927
|
)
|
|||||
|
Gain on disposal of assets
|
(905
|
)
|
(12,626
|
)
|
(6,069
|
)
|
|||||
|
Proceeds from insurance
|
3,173
|
|
—
|
|
—
|
|
|||||
|
Gain from insurance proceeds
|
(1,635
|
)
|
—
|
|
—
|
|
|||||
|
Asset impairment and store closing charges
|
6,500
|
|
—
|
|
—
|
|
|||||
|
Changes in operating assets and liabilities:
|
|
|
|
||||||||
|
(Increase) decrease in accounts receivable
|
(1,092
|
)
|
9,372
|
|
(25,670
|
)
|
|||||
|
Increase in merchandise inventories
|
(33,436
|
)
|
(24
|
)
|
(29,160
|
)
|
|||||
|
Decrease in other current assets
|
8,981
|
|
2,911
|
|
1,406
|
|
|||||
|
Decrease in other assets
|
5,844
|
|
2,939
|
|
1,031
|
|
|||||
|
Increase (decrease) in trade accounts payable and accrued expenses and other liabilities
|
156,342
|
|
(33,702
|
)
|
104,923
|
|
|||||
|
(Decrease) increase in income taxes payable
|
(6,205
|
)
|
(4,186
|
)
|
11,868
|
|
|||||
|
Net cash provided by operating activities
|
517,007
|
|
450,226
|
|
611,589
|
|
|||||
|
Investing activities:
|
|
|
|
||||||||
|
Purchase of property and equipment
|
(104,824
|
)
|
(165,788
|
)
|
(151,888
|
)
|
|||||
|
Proceeds from disposal of assets
|
1,150
|
|
25,503
|
|
14,767
|
|
|||||
|
Proceeds from insurance
|
1,525
|
|
—
|
|
—
|
|
|||||
|
Decrease (increase) in restricted cash
|
—
|
|
7,346
|
|
(7,346
|
)
|
|||||
|
Investment in joint venture
|
(20,000
|
)
|
—
|
|
—
|
|
|||||
|
Distribution from joint venture
|
2,500
|
|
—
|
|
1,055
|
|
|||||
|
Net cash used in investing activities
|
(119,649
|
)
|
(132,939
|
)
|
(143,412
|
)
|
|||||
|
Financing activities:
|
|
|
|
||||||||
|
Principal payments on long-term debt and capital lease obligations
|
(3,284
|
)
|
(5,299
|
)
|
(784
|
)
|
|||||
|
Cash dividends paid
|
(9,787
|
)
|
(10,008
|
)
|
(10,367
|
)
|
|||||
|
Purchase of treasury stock
|
(240,171
|
)
|
(500,000
|
)
|
(290,408
|
)
|
|||||
|
Issuance cost of line of credit
|
—
|
|
(2,863
|
)
|
—
|
|
|||||
|
Net cash used in financing activities
|
(253,242
|
)
|
(518,170
|
)
|
(301,559
|
)
|
|||||
|
Increase (decrease) in cash and cash equivalents
|
144,116
|
|
(200,883
|
)
|
166,618
|
|
|||||
|
Cash and cash equivalents, beginning of year
|
202,869
|
|
403,752
|
|
237,134
|
|
|||||
|
Cash and cash equivalents, end of year
|
$
|
346,985
|
|
$
|
202,869
|
|
$
|
403,752
|
|
||
|
Non-cash transactions:
|
|
|
|
||||||||
|
Accrued capital expenditures
|
$
|
3,453
|
|
$
|
10,909
|
|
$
|
12,051
|
|
||
|
Stock awards
|
2,671
|
|
2,803
|
|
2,785
|
|
|||||
|
Capital lease transactions
|
—
|
|
9,093
|
|
—
|
|
|||||
|
Accrued purchases of treasury stock
|
6,002
|
|
—
|
|
—
|
|
|||||
See notes to consolidated financial statements.
F-8
Notes to Consolidated Financial Statements
1. Description of Business and Summary of Significant Accounting Policies
Description of Business
—Dillard's, Inc. ("Dillard's" or the "Company") operates retail department stores, located primarily in the southeastern, southwestern and midwestern areas of the United States, and a general contracting construction company based in Little Rock, Arkansas. The Company's fiscal year ends on the Saturday nearest January 31 of each year. Fiscal years 2016, 2015 and 2014 ended on January 28, 2017, January 30, 2016 and January 31, 2015, respectively, and each included 52 weeks.
Consolidation
—The accompanying consolidated financial statements include the accounts of Dillard's, Inc. and its wholly owned subsidiaries. Intercompany accounts and transactions are eliminated in consolidation. Investments in and advances to joint ventures are accounted for by the equity method where the Company does not have control.
Use of Estimates
—The preparation of financial statements in conformity with accounting principles generally accepted in the United States of America requires management to make estimates and assumptions that affect the reported amounts of assets and liabilities and disclosure of contingent assets and liabilities at the date of the financial statements and the reported amounts of revenues and expenses during the reporting period. Significant estimates include inventories, sales return, self-insured accruals, future cash flows for impairment analysis, pension discount rate and taxes. Actual results could differ from those estimates.
Seasonality
—The Company's business is highly seasonal, and historically the Company has realized a significant portion of its sales, net income and cash flow in the second half of the fiscal year, attributable to the impact of the back-to-school selling season in the third quarter and the holiday selling season in the fourth quarter. Additionally, working capital requirements fluctuate during the year, increasing in the third quarter in anticipation of the holiday season.
Cash Equivalents
—The Company considers all highly liquid investments with an original maturity of
3 months
or less when purchased or certificates of deposit with no early withdrawal penalty to be cash equivalents. The Company considers receivables from charge card companies as cash equivalents because they settle the balances within
2
to
3
days.
Restricted Cash
—Restricted cash consists of cash proceeds from the sale of property held in escrow for the acquisition of replacement property under like-kind exchange agreements. The escrow accounts are administered by an intermediary. Pursuant to the like-kind exchange agreements, the cash remains restricted for a maximum of
180
days from the date of the property sale pending the acquisition of replacement property. Changes in restricted cash balances are reflected as an investing activity in the accompanying Consolidated Statements of Cash Flows.
Accounts Receivable
—Accounts receivable primarily consists of construction receivables of CDI and the monthly settlement with Wells Fargo for Dillard's share of revenue from the long-term marketing and servicing alliance. Construction receivables are based on amounts billed to customers. The Company provides any allowance for doubtful accounts considered necessary based upon a review of outstanding receivables, historical collection information and existing economic conditions. Accounts receivable are ordinarily due
30 days
after the issuance of the invoice. Contract retentions are due
30 days
after completion of the project and acceptance by the owner. Accounts that are past due more than
120 days
are considered delinquent. Delinquent receivables are written off based on individual credit evaluation and specific circumstances of the customer.
Merchandise Inventories
—All of the Company’s inventories are valued at the lower of cost or market using the last-in, first-out (“LIFO”) inventory method. Approximately
96%
of the Company's inventories are valued using the LIFO retail inventory method. Under the retail inventory method, the valuation of inventories at cost and the resulting gross margins are calculated by applying a calculated cost to retail ratio to the retail value of inventories. The retail inventory method is an averaging method that is widely used in the retail industry due to its practicality. Inherent in the retail inventory method calculation are certain significant management judgments including, among others, merchandise markon, markups, and markdowns, which significantly impact the ending inventory valuation at cost as well as the resulting gross margins. During periods of deflation, inventory values on the first-in, first-out ("FIFO") retail inventory method may be lower than the LIFO retail inventory method. Additionally, inventory values at LIFO cost may be in excess of net realizable value. At January 28, 2017 and January 30, 2016 , merchandise inventories valued at LIFO, including adjustments as necessary to record inventory at the lower of cost or market, approximated the cost of such inventories using the FIFO retail inventory method. The application of the LIFO retail inventory method did not result in the recognition of any LIFO charges or credits affecting cost of sales for fiscal 2016, 2015 or 2014.
F-9
The Company regularly records a provision for estimated shrinkage, thereby reducing the carrying value of merchandise inventory. Complete physical inventories of all of the Company's stores and warehouses are performed no less frequently than annually, with the recorded amount of merchandise inventory being adjusted to coincide with these physical counts.
Property and Equipment
—Property and equipment owned by the Company is stated at cost, which includes related interest costs incurred during periods of construction, less accumulated depreciation and amortization. Interest capitalized during fiscal 2016, 2015 and 2014 was
$0.1 million
,
$2.1 million
and
$1.7 million
, respectively. For financial reporting purposes, depreciation is computed by the straight-line method over estimated useful lives:
|
Buildings and leasehold improvements
|
20 - 40 years
|
|
Furniture, fixtures and equipment
|
3 - 10 years
|
Properties leased by the Company under lease agreements which are determined to be capital leases are stated at an amount equal to the present value of the minimum lease payments during the lease term, less accumulated amortization. The assets under capital leases and leasehold improvements under operating leases are amortized on the straight-line method over the shorter of their useful lives or the related lease terms. The provision for amortization of leased properties is included in depreciation and amortization expense.
Included in property and equipment as of January 28, 2017 are assets held for sale in the amount of
$4.0 million
. During fiscal 2016, 2015 and 2014, the Company realized gains on the disposal of property and equipment of
$0.9 million
,
$12.6 million
and
$6.4 million
, respectively.
Depreciation expense on property and equipment was
$244 million
,
$250 million
and
$251 million
for fiscal 2016, 2015 and 2014, respectively.
Long-Lived Assets
—Impairment losses are required to be recorded on long-lived assets used in operations when indicators of impairment are present and the undiscounted cash flows estimated to be generated by those assets are less than the assets' carrying amount. In the evaluation of the fair value and future benefits of long-lived assets, the Company performs an analysis of the anticipated undiscounted future net cash flows of the related long-lived assets. This analysis is performed at the store unit level. If the carrying value of the related asset exceeds the undiscounted cash flows, the carrying value is reduced to its fair value. Various factors including future sales growth and profit margins are included in this analysis. Management believes at this time that the carrying values and useful lives continue to be appropriate.
Other Assets
—Other assets include the deferred charge related to the REIT Transaction of
$179.8 million
and
$184.7 million
at January 28, 2017 and January 30, 2016, respectively. Other assets also include investments accounted for by the equity and cost methods.
During fiscal 2016, the Company invested
$20.0 million
in an existing open air center joint venture located in Bonita Springs, Florida. The investment was funded using cash on hand. The joint venture used these funds in the refinancing of its debt.
During fiscal 2016, the Company recorded an asset impairment of
$6.5 million
consisting of the write-down of a cost method investment.
Vendor Allowances
—The Company receives concessions from its vendors through a variety of programs and arrangements, including cooperative advertising and margin maintenance programs. The Company has agreements in place with each vendor setting forth the specific conditions for each allowance or payment. These agreements range in periods from a few days to up to a year. If the payment is a reimbursement for costs incurred, it is offset against those related costs; otherwise, it is treated as a reduction to the cost of the merchandise. Amounts of vendor concessions are recorded only when an agreement has been reached with the vendor and the collection of the concession is deemed probable.
For cooperative advertising programs, the Company generally offsets the allowances against the related advertising expense when incurred. Many of these programs require proof-of-advertising to be provided to the vendor to support the reimbursement of the incurred cost. Programs that do not require proof-of-advertising are monitored to ensure that the allowance provided by each vendor is a reimbursement of costs incurred to advertise for that particular vendor. If the allowance exceeds the advertising costs incurred on a vendor-specific basis, then the excess allowance from the vendor is recorded as a reduction of merchandise cost for that vendor.
Margin maintenance allowances are credited directly to cost of purchased merchandise in the period earned according to the agreement with the vendor. Under the retail method of accounting for inventory, a portion of these allowances reduces cost of goods sold and a portion reduces the carrying value of merchandise inventory.
F-10
Insurance Accruals
—The Company's consolidated balance sheets include liabilities with respect to self-insured workers' compensation and general liability claims. The Company's self-insured retention is insured through a wholly-owned captive insurance subsidiary. The Company estimates the required liability of such claims, utilizing an actuarial method, based upon various assumptions, which include, but are not limited to, the Company's historical loss experience, projected loss development factors, actual payroll and other data. The required liability is also subject to adjustment in the future based upon the changes in claims experience, including changes in the number of incidents (frequency) and changes in the ultimate cost per incident (severity). These insurance accruals are recorded in trade accounts payable and accrued expenses and other liabilities on the consolidated balance sheets.
Operating Leases
—The Company leases retail stores, office space and equipment under operating leases. Many store leases contain construction allowance reimbursements by landlords, rent holidays, rent escalation clauses and/or contingent rent provisions. The Company recognizes the related rental expense on a straight-line basis over the lease term and records the difference between the amounts charged to expense and the rent paid as a deferred rent liability.
To account for construction allowance reimbursements from landlords and rent holidays, the Company records a deferred rent liability in other liabilities on the consolidated balance sheets and amortizes the deferred rent over the lease term, as a reduction to rent expense on the consolidated income statements. For leases containing rent escalation clauses, the Company records minimum rent expense on a straight-line basis over the lease term on the consolidated income statement. The lease term used for lease evaluation includes renewal option periods only in instances in which the exercise of the option period can be reasonably assured and failure to exercise such options would result in an economic penalty.
Revenue Recognition
—The Company's retail operations segment recognizes merchandise revenue at the "point of sale." Allowance for sales returns are recorded as a component of net sales in the period in which the related sales are recorded. Sales taxes collected from customers are excluded from revenue and are recorded in trade accounts payable and accrued expenses until remitted to the taxing authorities.
Synchrony Financial ("Synchrony"; formerly GE Consumer Finance ) owned and managed Dillard's private label credit cards under a long-term marketing and servicing alliance ("Synchrony Alliance") that expired in November 2014. Following the scheduled expiration, Wells Fargo Bank, N.A. ("Wells Fargo") purchased the Dillard's private label credit card portfolio from Synchrony and began managing Dillard's private label cards under a new
10
-year agreement ("Wells Fargo Alliance"). The Company's share of income earned under the Wells Fargo Alliance and former Synchrony Alliance is included as a component of service charges and other income. The Company received income of approximately
$104 million
,
$105 million
and
$112 million
from the alliances in fiscal 2016, 2015 and 2014, respectively. The Company participates in the marketing of the private label cards and accepts payments on the private label cards in its stores as a convenience to customers who prefer to pay in person rather than by mailing their payments to Wells Fargo.
Revenue from CDI construction contracts is generally recognized by applying percentages of completion for each period to the total estimated profits for the respective contracts. The length of each contract varies but is typically
nine
to
eighteen
months. The percentages of completion are determined by relating the actual costs of work performed to date to the current estimated total costs of the respective contracts. When the estimate on a contract indicates a loss, the entire loss is recorded in the current period.
Gift Card Revenue Recognition
—The Company establishes a liability upon the sale of a gift card. The liability is relieved and revenue is recognized when gift cards are redeemed for merchandise. Gift card breakage income is determined based upon historical redemption patterns. The Company uses a homogeneous pool to recognize gift card breakage and will recognize income over the period when the likelihood of the gift card being redeemed is remote and the Company determines that it does not have a legal obligation to remit the value of unredeemed gift cards to the relevant jurisdiction as abandoned property. At that time, the Company will recognize breakage income over the performance period for those gift cards (i.e.
60 months
) and will record it in service charges and other income. As of January 28, 2017 and January 30, 2016, gift card liabilities of
$60.5 million
and
$60.0 million
, respectively, were included in trade accounts payable and accrued expenses and other liabilities.
Advertising
—Advertising and promotional costs, which include newspaper, magazine, Internet, broadcast and other media advertising, are expensed as incurred and were approximately
$43 million
,
$50 million
and
$56 million
, net of cooperative advertising reimbursements of
$27.5 million
,
$29.3 million
and
$31.6 million
for fiscal years 2016, 2015 and 2014, respectively. The Company records net advertising expenses in selling, general and administrative expenses.
Income Taxes
—Income taxes are recognized for the amount of taxes payable for the current year and deferred tax assets and liabilities for the future tax consequence of events that have been recognized differently in the financial statements than for tax purposes. Deferred tax assets and liabilities are established using statutory tax rates and are adjusted for tax rate changes. Tax positions are analyzed to determine whether it is "more likely than not" that a tax position will be sustained upon
F-11
examination by the appropriate taxing authorities before any part of the benefit can be recorded in the financial statements. For those tax positions where it is not "more likely than not" that a tax benefit will be sustained, no tax benefit is recognized. The Company classifies accrued interest expense and penalties relating to income tax in the consolidated financial statements as income tax expense.
Shipping and Handling
—The Company records shipping and handling reimbursements in service charges and other income. The Company records shipping and handling costs in cost of sales.
Defined Benefit Retirement Plans
—The Company's defined benefit retirement plan costs are accounted for using actuarial valuations. The Company recognizes the funded status of its defined benefit pension plans on the balance sheet and recognizes changes in the funded status that arise during the period but that are not recognized as components of net periodic benefit cost, within other comprehensive income, net of income taxes.
Income on and Equity in Losses of Joint Ventures
—Income on and equity in losses of joint ventures includes the Company's portion of the income or loss of the Company's unconsolidated joint ventures as well as distributions (excluding returns of investments) of excess cash from an open air center joint venture.
Comprehensive Income
—Comprehensive income is defined as the change in equity (net assets) of a business enterprise during a period from transactions and other events and circumstances from non-owner sources. It consists of the net income or loss and other gains and losses affecting stockholders' equity that, under GAAP, are excluded from net income or loss. One such exclusion is the amortization of retirement plan and other retiree benefit adjustments, which is the only item impacting our accumulated other comprehensive loss.
Supply Concentration
—The Company purchases merchandise from many sources and does not believe that the Company was dependent on any one supplier during fiscal 2016.
Reclassifications
—Certain items have been reclassified from their prior year classifications to conform to the current year presentation. These reclassifications had no effect on net income or stockholders' equity as previously reported.
New Accounting Pronouncements
Revenue from Contracts with Customers
In May 2014, the Financial Accounting Standards Board ("FASB") issued Accounting Standards Update ("ASU") No. 2014-09,
Revenue from Contracts with Customers (Topic 606)
, which stipulates that an entity should recognize revenue to depict the transfer of promised goods or services to customers in an amount that reflects the consideration to which the entity expects to be entitled in exchange for those goods or services. To achieve this core principle, an entity should apply the following steps: (1) identify the contract(s) with a customer, (2) identify the performance obligations in the contract, (3) determine the transaction price, (4) allocate the transaction price to the performance obligations in the contract and (5) recognize revenue when (or as) the entity satisfies a performance obligation.
This update was amended by ASU No. 2015-14,
Revenue from Contracts with Customers (Topic 606): Deferral of the Effective Date
, which deferred the effective date for the Company from the first quarter of fiscal 2017 to the first quarter of fiscal 2018 with early adoption permitted.
In March 2016, the FASB issued ASU No. 2016-08,
Revenue from Contracts with Customers (Topic 606): Principal versus Agent Considerations (Reporting Revenue Gross versus Net).
This ASU clarifies the implementation guidance on principal versus agent considerations, as it assists in the determination of whether the entity controls the good or service before it is transferred to the customer.
In April 2016, the FASB issued ASU No. 2016-10,
Revenue from Contracts with Customers (Topic 606): Identifying Performance Obligations and Licensing.
This ASU clarifies two aspects of Topic 606, including identifying performance obligations and the licensing implementation guidance, while retaining the principles for those areas.
In May 2016, the FASB issued ASU No. 2016-12,
Revenue from Contracts with Customers (Topic 606): Narrow-Scope Improvements and Practical Expedients
. This ASU clarifies three aspects of Topic 606, including the objective of the collectibility criterion, the measurement date for noncash consideration and the requirements for a completed contract. The ASU also includes a practical expedient for contract modifications. Additionally, the amendments allow an entity to exclude amounts collected from customers for all sales taxes from the transaction price.
F-12
The Company is currently evaluating the impact of these updates on its consolidated financial statements including a nearly completed in-depth assessment of all revenue streams to determine which processes will be affected by these updates and the transition methods for applying the updates. Based on the results of the assessment, the Company is focusing on the construction segment revenue that is recorded using the percentage of completion method and working to quantify the impact to the financial statements. While early adoption is permitted for these ASUs, the Company intends to adopt the standard during the first quarter of fiscal 2018.
Simplifying the Measurement of Inventory
In July 2015, the FASB issued ASU No. 2015-11,
Inventory (Topic 330): Simplifying the Measurement of Inventory
, to simplify the measurement of inventory using the first-in, first out (FIFO) or average cost methods. Under this amendment, inventory under the FIFO or average cost methods should be measured at the lower of cost and net realizable value. Net realizable value is the estimated selling prices in the ordinary course of business, less reasonably predictable costs of completion, disposal and transportation. This update will be effective for the Company beginning in the first quarter of fiscal 2017. All of the Company’s inventories are valued at the lower of cost or market using the last-in, first-out (“LIFO”) inventory method. ASU No. 2015-11 excludes inventories accounted for using LIFO. The Company has determined that the adoption of this ASU will have no impact on the Company’s consolidated financial statements.
Leases: Amendments to the FASB Accounting Standards Codification
In February 2016, the FASB issued ASU No. 2016-02,
Leases (Topic 842): Amendments to the FASB Accounting Standards Codification,
to increase transparency and comparability among organizations by recognizing lease assets and liabilities on the balance sheet and disclosing key information about leasing arrangements. Under these amendments, lessees are required to recognize lease assets and lease liabilities for leases classified as operating leases under ASC 840. ASU No. 2016-02 is effective for financial statements issued for fiscal years beginning after December 15, 2018, and early adoption is permitted. The Company's operating leases include building and equipment leases. As of January 28, 2017, the future minimum rental commitments for the operating leases totaled $54.7 million as detailed in Note 12 in these "Notes to Consolidated Financial Statements." The Company expects the majority of these current operating leases will be impacted by this ASU resulting in increases in assets and liabilities in the Company's consolidated financial statements. While early adoption is permitted for this ASU, the Company intends to adopt the standard during the first quarter of fiscal 2019.
Classification of Certain Cash Receipts and Cash Payments
In August 2016, the FASB issued ASU No. 2016-15,
Statement of Cash Flows (Topic 230): Classification of Certain Cash Receipts and Cash Payments,
to reduce the diversity in practice of how certain cash receipts and cash payments are presented and classified in the statement of cash flows. The amendments within ASU No. 2016-15 are effective for fiscal years beginning after December 15, 2017, including interim periods within those fiscal years, and early adoption is permitted. The Company is currently assessing the impact of this update on its consolidated financial statements.
Intra-Entity Transfers of Assets Other Than Inventory
In October 2016, the FASB issued ASU No. 2016-16,
Income Taxes (Topic 740): Intra-Entity Transfers of Assets Other Than Inventory,
as part of its initiative to reduce complexity in accounting standards. Under these amendments, an entity is required to recognize the income tax consequences of an intra-entity transfer of an asset other than inventory when the transfer occurs. The amendments within ASU No. 2016-16 are effective for financial statements issued for fiscal years beginning after December 15, 2017, including interim periods within those fiscal years, and early adoption is permitted. The Company is currently assessing the impact of this update on its consolidated financial statements.
Newly Adopted Standards
Presentation of Financial Statements - Going Concern
In August 2014, the FASB issued ASU No. 2014-15,
Presentation of Financial Statements - Going Concern (Subtopic 205-40)
, which requires management to evaluate, at each annual and interim reporting period, whether there are conditions or events that raise substantial doubt about the entity’s ability to continue as a going concern within one year after the date the financial statements are issued and provide related disclosures. This ASU is effective for reporting periods ending after December 15, 2016, and we adopted this ASU for the annual period ended on January 28, 2017. The adoption of this guidance had no impact on the Company's consolidated financial statements.
F-13
Simplifying the Presentation of Debt Issuance Costs
In April 2015, the FASB issued ASU No. 2015-03,
Interest-Imputation of Interest (Subtopic 835-30): Simplifying the Presentation of Debt Issuance Costs
, to amend Accounting Standards Codification ("ASC") Topic 835. The amendment adds the requirement for an entity to present debt issuance costs in the balance sheet as a direct deduction from the related debt liability rather than as an asset and to report amortization of the debt issuance costs as interest expense. ASU No. 2015-03 requires retrospective application and represents a change in accounting principle. The Company adopted ASU No. 2015-03 during the first quarter of fiscal 2016, using retrospective application as permitted. Prior period amounts in our condensed consolidated financial statements have been reclassified to conform with current presentation. As a result, the Company reclassified
$1.7 million
of debt issuance costs from other assets to reduce long-term debt on our condensed consolidated balance sheets at January 30, 2016.
Presentation and Subsequent Measurement of Debt Issuance Costs Associated with Line-of-Credit Arrangements
In August 2015, the FASB issued ASU No. 2015-15,
Interest-Imputation of Interest (Subtopic 835-30): Presentation and Subsequent Measurement of Debt Issuance Costs Associated with Line-of-Credit Arrangements,
to provide authoritative guidance related to line-of-credit arrangements, which were not addressed in ASU No. 2015-03. An entity may defer and present debt issuance costs related to line-of-credit arrangements as an asset. Subsequently, the debt issuance costs may be amortized as interest expense ratably over the term of the line-of-credit arrangement, regardless of whether there are any outstanding borrowings on the line-of-credit arrangement. The Company adopted ASU No. 2015-15 at the beginning of the first quarter of fiscal 2016. The adoption of this guidance had no impact on the Company's consolidated financial statements.
2. Business Segments
The Company operates in
two
reportable segments: the operation of retail department stores and a general contracting construction company.
For the Company's retail operations reportable segment, the Company determined its operating segments on a store by store basis. Each store's operating performance has been aggregated into one reportable segment. The Company's operating segments are aggregated for financial reporting purposes because they are similar in each of the following areas: economic characteristics, class of consumer, nature of products and distribution methods. Revenues from external customers are derived from merchandise sales, and the Company does not rely on any major customers as a source of revenue. Across all stores, the Company operates
one
store format under the Dillard's name where each store offers the same general mix of merchandise with similar categories and similar customers. The Company believes that disaggregating its operating segments would not provide meaningful additional information.
The following table summarizes the percentage of net sales by segment and major product line:
|
|
Percentage of Net Sales
|
|||||||
|
|
Fiscal 2016
|
Fiscal 2015
|
Fiscal 2014
|
|||||
|
Retail operations segment:
|
|
|
|
|||||
|
Cosmetics
|
14
|
%
|
14
|
%
|
14
|
%
|
||
|
Ladies' apparel
|
22
|
|
22
|
|
22
|
|
||
|
Ladies' accessories and lingerie
|
16
|
|
16
|
|
16
|
|
||
|
Juniors' and children's apparel
|
8
|
|
8
|
|
9
|
|
||
|
Men's apparel and accessories
|
17
|
|
17
|
|
17
|
|
||
|
Shoes
|
16
|
|
16
|
|
16
|
|
||
|
Home and furniture
|
4
|
|
4
|
|
4
|
|
||
|
97
|
|
97
|
|
98
|
|
|||
|
Construction segment
|
3
|
|
3
|
|
2
|
|
||
|
Total
|
100
|
%
|
100
|
%
|
100
|
%
|
||
F-14
The following tables summarize certain segment information, including the reconciliation of those items to the Company's consolidated operations.
|
(in thousands of dollars)
|
Retail Operations
|
Fiscal 2016
Construction
|
Consolidated
|
||||||||
|
Net sales from external customers
|
$
|
6,071,404
|
|
$
|
185,567
|
|
$
|
6,256,971
|
|
||
|
Gross profit
|
2,081,769
|
|
8,791
|
|
2,090,560
|
|
|||||
|
Depreciation and amortization
|
242,981
|
|
676
|
|
243,657
|
|
|||||
|
Interest and debt expense (income), net
|
63,127
|
|
(68
|
)
|
63,059
|
|
|||||
|
Income before income taxes and income on and equity in losses of joint ventures
|
253,887
|
|
3,788
|
|
257,675
|
|
|||||
|
Income on and equity in losses of joint ventures
|
45
|
|
—
|
|
45
|
|
|||||
|
Total assets
|
3,832,416
|
|
55,720
|
|
3,888,136
|
|
|||||
|
(in thousands of dollars)
|
Retail Operations
|
Fiscal 2015
Construction
|
Consolidated
|
||||||||
|
Net sales from external customers
|
$
|
6,388,769
|
|
$
|
206,857
|
|
$
|
6,595,626
|
|
||
|
Gross profit
|
2,237,077
|
|
7,744
|
|
2,244,821
|
|
|||||
|
Depreciation and amortization
|
249,508
|
|
503
|
|
250,011
|
|
|||||
|
Interest and debt expense (income), net
|
60,989
|
|
(66
|
)
|
60,923
|
|
|||||
|
Income before income taxes and income on and equity in losses of joint ventures
|
404,582
|
|
4,202
|
|
408,784
|
|
|||||
|
Income on and equity in losses of joint ventures
|
1,356
|
|
—
|
|
1,356
|
|
|||||
|
Total assets
|
3,802,994
|
|
60,907
|
|
3,863,901
|
|
|||||
|
(in thousands of dollars)
|
Retail Operations
|
Fiscal 2014
Construction
|
Consolidated
|
||||||||
|
Net sales from external customers
|
$
|
6,490,387
|
|
$
|
130,667
|
|
$
|
6,621,054
|
|
||
|
Gross profit
|
2,342,109
|
|
6,340
|
|
2,348,449
|
|
|||||
|
Depreciation and amortization
|
250,371
|
|
312
|
|
250,683
|
|
|||||
|
Interest and debt expense (income), net
|
61,352
|
|
(46
|
)
|
61,306
|
|
|||||
|
Income before income taxes and income on and equity in losses of joint ventures
|
508,730
|
|
2,038
|
|
510,768
|
|
|||||
|
Income on and equity in losses of joint ventures
|
565
|
|
—
|
|
565
|
|
|||||
|
Total assets
|
4,109,774
|
|
58,327
|
|
4,168,101
|
|
|||||
Intersegment construction revenues of
$75.5 million
,
$77.7 million
and
$82.5 million
were eliminated during consolidation and have been excluded from net sales for fiscal years 2016, 2015 and 2014, respectively.
3. Revolving Credit Agreement
In May 2015, the Company entered into a
$1.0 billion
senior unsecured revolving credit facility ("credit agreement"), replacing the prior secured credit facility with J. P. Morgan Securities LLC, Wells Fargo Securities, LLC, Regions Capital Markets and Citizens Bank, N.A. The unsecured facility expires May 13, 2020 and is available to the Company for working capital needs and general corporate purposes including, among other uses, working capital financing, the issuance of letters of credit, capital expenditures and, subject to certain restrictions, the repayment of existing indebtedness and share repurchases.
The Company pays a variable rate of interest on borrowings under the credit agreement and a commitment fee to the participating banks based on the Company's debt rating. The rate of interest on borrowings is
LIBOR
plus
1.375%
, and the commitment fee for unused borrowings is
0.20%
per annum.
F-15
No
borrowings were outstanding at
January 28, 2017
. Letters of credit totaling
$26.5 million
were issued under this credit agreement leaving unutilized availability under the facility of approximately
$974 million
at
January 28, 2017
. The Company had weighted-average borrowings of
$19.8 million
and
$41.3 million
during fiscal 2016 and 2015, respectively.
Peak borrowings under the credit facility were
$110 million
during fiscal 2016.
To be in compliance with the financial covenants of the new credit facility, the Company's total leverage ratio cannot exceed
4.0
to 1.0 and the coverage ratio cannot be less than
2.5
to 1.0, as defined in the credit facility agreement. At January 28, 2017, the Company was in compliance with all financial covenants related to the credit agreement.
4. Long-Term Debt
Long-term debt, including current portion, of
$613.3 million
and
$613.1 million
was outstanding at January 28, 2017 and January 30, 2016, respectively. This debt consisted of unsecured notes, bearing interest rates ranging from
6.625%
to
7.875%
and maturing during fiscal 2017 through fiscal 2028. There are no financial covenants under any of the debt agreements.
Long-term debt maturities over the next five years are (in millions):
|
Fiscal Year
|
Long-Term Debt Maturities
|
||
|
2017
|
$
|
87.2
|
|
|
2018
|
161.0
|
|
|
|
2019
|
—
|
|
|
|
2020
|
—
|
|
|
|
2021
|
—
|
|
|
Net interest and debt expense consists of the following:
|
(in thousands of dollars)
|
Fiscal 2016
|
Fiscal 2015
|
Fiscal 2014
|
||||||||
|
Long-term debt:
|
|
|
|
||||||||
|
Interest
|
$
|
59,268
|
|
$
|
57,346
|
|
$
|
57,739
|
|
||
|
Amortization of debt expense
|
1,594
|
|
1,555
|
|
1,438
|
|
|||||
|
60,862
|
|
58,901
|
|
59,177
|
|
||||||
|
Interest on capital lease obligations
|
507
|
|
588
|
|
644
|
|
|||||
|
Revolving credit facility expenses
|
2,349
|
|
2,739
|
|
2,719
|
|
|||||
|
Investment interest income
|
(663
|
)
|
(1,305
|
)
|
(1,234
|
)
|
|||||
|
Other interest
|
4
|
|
—
|
|
—
|
|
|||||
|
$
|
63,059
|
|
$
|
60,923
|
|
$
|
61,306
|
|
|||
Interest paid during fiscal 2016, 2015 and 2014 was approximately
$62.4 million
,
$62.9 million
and
$62.9 million
, respectively.
F-16
5. Trade Accounts Payable and Accrued Expenses
Trade accounts payable and accrued expenses consist of the following:
|
(in thousands of dollars)
|
January 28, 2017
|
January 30, 2016
|
|||||
|
Trade accounts payable
|
$
|
635,833
|
|
$
|
494,268
|
|
|
|
Accrued expenses:
|
|
|
|||||
|
Taxes, other than income
|
66,200
|
|
59,138
|
|
|||
|
Salaries, wages and employee benefits
|
56,022
|
|
57,240
|
|
|||
|
Liability to customers
|
59,279
|
|
56,397
|
|
|||
|
Interest
|
12,996
|
|
13,301
|
|
|||
|
Rent
|
2,666
|
|
3,631
|
|
|||
|
Other
|
6,309
|
|
7,335
|
|
|||
|
$
|
839,305
|
|
$
|
691,310
|
|
||
6. Income Taxes
The provision for federal and state income taxes is summarized as follows:
|
(in thousands of dollars)
|
Fiscal 2016
|
Fiscal 2015
|
Fiscal 2014
|
||||||||
|
Current:
|
|
|
|
||||||||
|
Federal
|
$
|
120,872
|
|
$
|
173,786
|
|
$
|
206,387
|
|
||
|
State
|
3,331
|
|
2,959
|
|
4,020
|
|
|||||
|
124,203
|
|
176,745
|
|
210,407
|
|
||||||
|
Deferred:
|
|
|
|
||||||||
|
Federal
|
(34,797
|
)
|
(33,708
|
)
|
(32,051
|
)
|
|||||
|
State
|
(906
|
)
|
(2,267
|
)
|
1,124
|
|
|||||
|
(35,703
|
)
|
(35,975
|
)
|
(30,927
|
)
|
||||||
|
$
|
88,500
|
|
$
|
140,770
|
|
$
|
179,480
|
|
|||
A reconciliation between the Company's income tax provision and income taxes using the federal statutory income tax rate is presented below:
|
(in thousands of dollars)
|
Fiscal 2016
|
Fiscal 2015
|
Fiscal 2014
|
||||||||
|
Income tax at the statutory federal rate (inclusive of income on and equity in losses of joint ventures)
|
$
|
90,202
|
|
$
|
143,549
|
|
$
|
178,967
|
|
||
|
State income taxes, net of federal benefit (inclusive of income on and equity in losses of joint ventures)
|
954
|
|
2,488
|
|
4,426
|
|
|||||
|
Net changes in unrecognized tax benefits, interest and penalties /reserves
|
(323
|
)
|
(367
|
)
|
(1,386
|
)
|
|||||
|
Tax benefit of federal credits
|
(2,434
|
)
|
(2,018
|
)
|
(2,810
|
)
|
|||||
|
Changes in cash surrender value of life insurance policies
|
(914
|
)
|
(705
|
)
|
(731
|
)
|
|||||
|
Changes in valuation allowance
|
1,857
|
|
(1,473
|
)
|
1,485
|
|
|||||
|
Tax benefit of dividends paid to ESOP
|
(785
|
)
|
(763
|
)
|
(802
|
)
|
|||||
|
Other
|
(57
|
)
|
59
|
|
331
|
|
|||||
|
$
|
88,500
|
|
$
|
140,770
|
|
$
|
179,480
|
|
|||
Deferred income taxes reflect the net tax effects of temporary differences between the carrying amounts of assets and liabilities for financial reporting purposes and the amounts used for income tax purposes. Significant components of the Company's deferred tax assets and liabilities as of January 28, 2017 and January 30, 2016 are as follows:
F-17
|
(in thousands of dollars)
|
January 28,
2017 |
January 30,
2016 |
|||||
|
Property and equipment bases and depreciation differences
|
$
|
213,658
|
|
$
|
245,404
|
|
|
|
Prepaid expenses
|
54,343
|
|
57,672
|
|
|||
|
Joint venture bases differences
|
11,994
|
|
12,985
|
|
|||
|
Differences between book and tax bases of inventory
|
40,489
|
|
43,116
|
|
|||
|
Other
|
7,114
|
|
6,551
|
|
|||
|
Total deferred tax liabilities
|
327,598
|
|
365,728
|
|
|||
|
Accruals not currently deductible
|
(87,066
|
)
|
(88,277
|
)
|
|||
|
Net operating loss carryforwards
|
(74,593
|
)
|
(74,094
|
)
|
|||
|
State income taxes
|
(968
|
)
|
(1,123
|
)
|
|||
|
Other
|
(1,165
|
)
|
(3,361
|
)
|
|||
|
Total deferred tax assets
|
(163,792
|
)
|
(166,855
|
)
|
|||
|
Net operating loss valuation allowance
|
55,774
|
|
52,724
|
|
|||
|
Net deferred tax assets
|
(108,018
|
)
|
(114,131
|
)
|
|||
|
Net deferred income taxes
|
$
|
219,580
|
|
$
|
251,597
|
|
|
At January 28, 2017, the Company had a deferred tax asset related to state net operating loss carryforwards of approximately
$74.6 million
that could be utilized to reduce the tax liabilities of future years. These carryforwards will expire between fiscal 2017 and 2037. A portion of the deferred tax asset attributable to state net operating loss carryforwards was reduced by a valuation allowance of approximately
$55.8 million
for the losses of various members of the affiliated group in states for which the Company determined that it is "more likely than not" that the benefit of the net operating losses will not be realized.
Deferred tax assets and liabilities are presented as follows in the accompanying consolidated balance sheets:
|
(in thousands of dollars)
|
January 28,
2017 |
January 30,
2016 |
|||||
|
Net deferred tax assets—other assets
|
$
|
(6,104
|
)
|
$
|
(6,473
|
)
|
|
|
Net deferred tax liabilities—deferred income taxes
|
225,684
|
|
258,070
|
|
|||
|
Net deferred income taxes
|
$
|
219,580
|
|
$
|
251,597
|
|
|
The total amount of unrecognized tax benefits as of January 28, 2017 was
$4.0 million
, of which
$2.5 million
would, if recognized, affect the Company's effective tax rate. The total amount of unrecognized tax benefits as of January 30, 2016 was
$4.3 million
, of which
$2.5 million
would, if recognized, affect the effective tax rate. The Company does not expect a significant change in unrecognized tax benefits in the next twelve months. Where applicable, associated interest and penalties are also recorded. The total amounts of interest and penalties were not material.
A reconciliation of the beginning and ending amount of unrecognized tax benefits is as follows:
|
(in thousands of dollars)
|
Fiscal 2016
|
Fiscal 2015
|
Fiscal 2014
|
||||||||
|
Unrecognized tax benefits at beginning of period
|
$
|
4,265
|
|
$
|
4,806
|
|
$
|
6,538
|
|
||
|
Gross increases—tax positions in prior period
|
43
|
|
—
|
|
55
|
|
|||||
|
Gross decreases—tax positions in prior period
|
(538
|
)
|
(734
|
)
|
(1,689
|
)
|
|||||
|
Gross increases—current period tax positions
|
386
|
|
317
|
|
665
|
|
|||||
|
Settlements
|
—
|
|
—
|
|
(545
|
)
|
|||||
|
Lapse of statutes of limitation
|
(143
|
)
|
(124
|
)
|
(218
|
)
|
|||||
|
Unrecognized tax benefits at end of period
|
$
|
4,013
|
|
$
|
4,265
|
|
$
|
4,806
|
|
||
The fiscal tax years that remain subject to examination for the federal tax jurisdiction and major state tax jurisdictions are 2013 and forward. At this time, the Company does not expect the results from any income tax audit to have a material impact on the Company's consolidated financial statements.
F-18
Income taxes paid, net of income tax refunds received, during fiscal 2016, 2015 and 2014 were approximately
$129.4 million
,
$183.6 million
and
$189.7 million
, respectively.
7. Subordinated Debentures
At
January 28, 2017
, the Company had
$200 million
outstanding of its
7.5%
subordinated debentures due August 1, 2038. All of these subordinated debentures were held by Dillard's Capital Trust I ("Trust"), a
100%
owned unconsolidated finance subsidiary of the Company. The subordinated debentures are the sole asset of the Trust. The Company has the right to defer the payment of interest on the subordinated debentures at any time for a period not to exceed 20 consecutive quarters.
At
January 28, 2017
, the Trust had outstanding
$200 million
liquidation amount of
7.5%
Capital Securities, due August 1, 2038 (the "Capital Securities"). Holders of the Capital Securities are entitled to receive cumulative cash distributions, payable quarterly, at the annual rate of
7.5%
of the liquidation amount of
$25
per Capital Security. The Capital Securities are subject to mandatory redemption upon repayment of the Company's subordinated debentures. The Company's obligations under the subordinated debentures and related agreements, taken together, provide a full and unconditional guarantee of payments due on the Capital Securities.
The Trust is a variable interest entity and is not consolidated into the Company's financial statements, since the Company is not the primary beneficiary of the Trust.
8. Benefit Plans
The Company has a retirement plan with a 401(k)-salary deferral feature for eligible employees. Under the terms of the plan, eligible employees could contribute up to the lesser of
$18,000
(
$24,000
if at least
50
years of age) or
75%
of eligible pay. Eligible employees with
1 year
of service, who elect to participate in the plan or are auto-enrolled, receive a Company matching contribution. Company matching contributions are calculated on the eligible employee's first
6%
of elective deferrals with the first
1%
being matched
100%
and the next
5%
being matched
50%
. The Company matching contributions are used to purchase Class A Common Stock of the Company for the benefit of the employee. This stock may be immediately diversified into any of the other funds within the plan at the election of the employee. The terms of the plan provide a
two
-year vesting schedule for the Company matching contribution portion of the plan.
The Company incurred benefit plan expense of approximately
$18 million
for each of fiscal 2016, 2015 and 2014.
The Company has an unfunded, nonqualified defined benefit plan ("Pension Plan") for its officers. The Pension Plan is noncontributory and provides benefits based on years of service and compensation during employment. Pension expense is determined using an actuarial cost method to estimate the total benefits ultimately payable to officers and allocates this cost to service periods. The actuarial assumptions used to calculate pension costs are reviewed annually. Net periodic benefit costs are included in selling, general and administrative expenses.
F-19
The accumulated benefit obligations, change in projected benefit obligation, change in Pension Plan assets, funded status, and reconciliation to amounts recognized in the consolidated balance sheets are as follows:
|
(in thousands of dollars)
|
January 28,
2017 |
January 30,
2016 |
|||||
|
Change in benefit obligation:
|
|
|
|||||
|
Benefit obligation at beginning of year
|
$
|
184,810
|
|
$
|
196,922
|
|
|
|
Service cost
|
3,934
|
|
3,932
|
|
|||
|
Interest cost
|
7,678
|
|
6,736
|
|
|||
|
Actuarial gain
|
(8,463
|
)
|
(18,788
|
)
|
|||
|
Benefits paid
|
(4,342
|
)
|
(3,992
|
)
|
|||
|
Benefit obligation at end of year
|
$
|
183,617
|
|
$
|
184,810
|
|
|
|
Change in Pension Plan assets:
|
|
|
|||||
|
Fair value of Pension Plan assets at beginning of year
|
$
|
—
|
|
$
|
—
|
|
|
|
Employer contribution
|
4,342
|
|
3,992
|
|
|||
|
Benefits paid
|
(4,342
|
)
|
(3,992
|
)
|
|||
|
Fair value of Pension Plan assets at end of year
|
$
|
—
|
|
$
|
—
|
|
|
|
Funded status (Pension Plan assets less benefit obligation)
|
$
|
(183,617
|
)
|
$
|
(184,810
|
)
|
|
|
Amounts recognized in the balance sheets:
|
|
|
|||||
|
Accrued benefit liability
|
$
|
(183,617
|
)
|
$
|
(184,810
|
)
|
|
|
Net amount recognized
|
$
|
(183,617
|
)
|
$
|
(184,810
|
)
|
|
|
Pretax amounts recognized in accumulated other comprehensive loss:
|
|||||||
|
Net actuarial loss
|
$
|
18,001
|
|
$
|
27,669
|
|
|
|
Prior service cost
|
—
|
|
—
|
|
|||
|
Net amount recognized
|
$
|
18,001
|
|
$
|
27,669
|
|
|
|
Accumulated benefit obligation at end of year
|
$
|
(182,071
|
)
|
$
|
(177,228
|
)
|
|
The accrued benefit liability is included in other liabilities.
The discount rate that the Company utilizes for determining future pension obligations is based on the Citigroup Above Median Pension Index Curve on its annual measurement date as of the end of each fiscal year and is matched to the future expected cash flows of the benefit plans by annual periods. The discount rate decreased to
4.0%
as of January 28, 2017 from
4.2%
as of January 30, 2016. Weighted average assumptions are as follows:
|
Fiscal 2016
|
Fiscal 2015
|
Fiscal 2014
|
||||||
|
Discount rate—net periodic pension cost
|
4.2
|
%
|
3.5
|
%
|
4.4
|
%
|
||
|
Discount rate—benefit obligations
|
4.0
|
%
|
4.2
|
%
|
3.5
|
%
|
||
|
Rate of compensation increases
|
3.0
|
%
|
3.0
|
%
|
3.0
|
%
|
||
F-20
The components of net periodic benefit costs are as follows:
|
(in thousands of dollars)
|
Fiscal 2016
|
Fiscal 2015
|
Fiscal 2014
|
||||||||
|
Components of net periodic benefit costs:
|
|
|
|
||||||||
|
Service cost
|
$
|
3,934
|
|
$
|
3,932
|
|
$
|
4,396
|
|
||
|
Interest cost
|
7,678
|
|
6,736
|
|
7,644
|
|
|||||
|
Net actuarial loss
|
1,204
|
|
3,697
|
|
2,660
|
|
|||||
|
Amortization of prior service cost
|
—
|
|
—
|
|
—
|
|
|||||
|
Plan curtailment gain
|
—
|
|
—
|
|
—
|
|
|||||
|
Net periodic benefit costs
|
$
|
12,816
|
|
$
|
14,365
|
|
$
|
14,700
|
|
||
|
Other changes in benefit obligations recognized in other comprehensive (income) loss:
|
|||||||||||
|
Net actuarial (gain) loss
|
$
|
(9,668
|
)
|
$
|
(22,485
|
)
|
$
|
11,190
|
|
||
|
Amortization of prior service cost
|
—
|
|
—
|
|
—
|
|
|||||
|
Total recognized in other comprehensive (income) loss
|
$
|
(9,668
|
)
|
$
|
(22,485
|
)
|
$
|
11,190
|
|
||
|
Total recognized in net periodic benefit costs and other comprehensive income or loss
|
$
|
3,148
|
|
$
|
(8,120
|
)
|
$
|
25,890
|
|
||
The estimated future benefits payments for the nonqualified benefit plan are as follows:
|
(in thousands of dollars)
|
|
|||
|
Fiscal Year
|
|
|||
|
2017
|
$
|
4,912
|
|
*
|
|
2018
|
6,199
|
|
||
|
2019
|
6,253
|
|
||
|
2020
|
9,106
|
|
||
|
2021
|
9,329
|
|
||
|
2022 - 2026
|
60,842
|
|
||
|
Total payments for next ten fiscal years
|
$
|
96,641
|
|
|
___________________________________
* The estimated benefit payment for fiscal 2017 also represents the amount the Company expects to contribute to the Pension Plan for fiscal 2017.
9. Stockholders' Equity
Capital stock is comprised of the following:
|
Type
|
Par
Value
|
Shares
Authorized
|
||||
|
Preferred (5% cumulative)
|
$
|
100.00
|
|
5,000
|
|
|
|
Additional preferred
|
$
|
0.01
|
|
10,000,000
|
|
|
|
Class A, common
|
$
|
0.01
|
|
289,000,000
|
|
|
|
Class B, common
|
$
|
0.01
|
|
11,000,000
|
|
|
Holders of Class A are empowered as a class to elect one-third of the members of the Board of Directors, and the holders of Class B are empowered as a class to elect two-thirds of the members of the Board of Directors. Shares of Class B are convertible at the option of any holder thereof into shares of Class A at the rate of
one
share of Class B for
one
share of Class A.
During fiscal 2015, the Company issued
528
shares of Class A Common Stock in exchange for
528
shares of Class B Common Stock tendered for conversion pursuant to the Certificate of Incorporation.
F-21
Stock Repurchase Programs
All repurchases of the Company's Class A Common Stock were made at the market price at the trade date and all amounts paid to reacquire these shares were allocated to Treasury Stock.
Stock Plans
The Company’s Board of Directors has authorized the Company to repurchase the Company’s Class A Common Stock under open-ended stock repurchase plans. The following is a summary of share repurchase activity for the periods indicated (in thousands, except per share data):
|
|
Fiscal 2016
|
Fiscal 2015
|
Fiscal 2014
|
|||||||||
|
Cost of shares repurchased
|
$
|
246,173
|
|
$
|
500,000
|
|
$
|
290,408
|
|
|||
|
Number of shares repurchased
|
3,810
|
|
5,307
|
|
2,781
|
|
||||||
|
Average price per share
|
$
|
64.61
|
|
$
|
94.22
|
|
$
|
104.44
|
|
|||
On February 25, 2016, the Company announced that the Company's Board of Directors approved a stock repurchase program authorizing the Company to repurchase up to $500 million of its Class A Common Stock. As of January 28, 2017,
$253.8
million authorization remained under this stock repurchase plan.
10. Accumulated Other Comprehensive Loss ("AOCL")
Reclassifications from AOCL
Reclassifications from AOCL are summarized as follows (in thousands):
|
|
Amount
Reclassified
from AOCL
|
Affected Line Item in the Statement Where Net Income Is Presented
|
|||||||
|
Details about AOCL Components
|
Fiscal 2016
|
Fiscal 2015
|
|||||||
|
Defined benefit pension plan items
|
|
|
|
||||||
|
Amortization of prior service cost
|
$
|
—
|
|
$
|
—
|
|
(1)
|
||
|
Amortization of actuarial losses
|
1,204
|
|
3,697
|
|
(1)
|
||||
|
|
1,204
|
|
3,697
|
|
Total before tax
|
||||
|
|
459
|
|
1,410
|
|
Income tax expense
|
||||
|
$
|
745
|
|
$
|
2,287
|
|
Total net of tax
|
|||
_______________________________
(1)
These items are included in the computation of net periodic benefit costs. See Note 8 for additional information.
Changes in AOCL
Changes in AOCL by component (net of tax) are summarized as follows (in thousands):
|
|
Defined Benefit
Pension Plan Items |
||||||
|
|
Fiscal 2016
|
Fiscal 2015
|
|||||
|
Beginning balance
|
$
|
17,118
|
|
$
|
31,029
|
|
|
|
Other comprehensive (income) loss before reclassifications
|
(5,236
|
)
|
(11,624
|
)
|
|||
|
Amounts reclassified from AOCL
|
(745
|
)
|
(2,287
|
)
|
|||
|
Net other comprehensive (income) loss
|
(5,981
|
)
|
(13,911
|
)
|
|||
|
Ending balance
|
$
|
11,137
|
|
$
|
17,118
|
|
|
F-22
11. Earnings per Share
Basic earnings per share has been computed based upon the weighted average of Class A and Class B common shares outstanding. As
no
stock options or other dilutive securities were outstanding during any of the respective periods, the calculation of basic and dilutive earnings per share are the same.
Earnings per common share has been computed as follows:
|
|
Fiscal 2016
|
Fiscal 2015
|
Fiscal 2014
|
||||||||||||||||||||
|
(in thousands, except per share data)
|
Basic
|
Diluted
|
Basic
|
Diluted
|
Basic
|
Diluted
|
|||||||||||||||||
|
Net earnings available for per-share calculation
|
$
|
169,220
|
|
$
|
169,220
|
|
$
|
269,370
|
|
$
|
269,370
|
|
$
|
331,853
|
|
$
|
331,853
|
|
|||||
|
Average shares of common stock outstanding
|
34,308
|
|
34,308
|
|
39,005
|
|
39,005
|
|
42,603
|
|
42,603
|
|
|||||||||||
|
Dilutive effect of stock-based compensation
|
—
|
|
—
|
|
—
|
|
—
|
|
—
|
|
—
|
|
|||||||||||
|
Total average equivalent shares
|
34,308
|
|
34,308
|
|
39,005
|
|
39,005
|
|
42,603
|
|
42,603
|
|
|||||||||||
|
Per share of common stock:
|
|
|
|
|
|
|
|||||||||||||||||
|
Net income
|
$
|
4.93
|
|
$
|
4.93
|
|
$
|
6.91
|
|
$
|
6.91
|
|
$
|
7.79
|
|
$
|
7.79
|
|
|||||
12. Commitments and Contingencies
Rental expense consists of the following:
|
(in thousands of dollars)
|
Fiscal 2016
|
Fiscal 2015
|
Fiscal 2014
|
||||||||
|
Operating leases:
|
|
|
|
||||||||
|
Buildings:
|
|
|
|
||||||||
|
Minimum rentals
|
$
|
15,379
|
|
$
|
15,546
|
|
$
|
15,699
|
|
||
|
Contingent rentals
|
3,745
|
|
4,914
|
|
4,959
|
|
|||||
|
Equipment
|
6,830
|
|
6,272
|
|
6,319
|
|
|||||
|
$
|
25,954
|
|
$
|
26,732
|
|
$
|
26,977
|
|
|||
Contingent rentals on certain leases are based on a percentage of annual sales in excess of specified amounts. Other contingent rentals are based entirely on a percentage of sales.
The future minimum rental commitments as of
January 28, 2017
for all non-cancelable leases for buildings and equipment are as follows:
|
(in thousands of dollars)
Fiscal Year
|
Operating
Leases
|
Capital
Leases
|
|||||
|
2017
|
$
|
19,640
|
|
$
|
3,699
|
|
|
|
2018
|
15,236
|
|
1,428
|
|
|||
|
2019
|
9,063
|
|
1,428
|
|
|||
|
2020
|
5,364
|
|
1,077
|
|
|||
|
2121
|
3,717
|
|
726
|
|
|||
|
After 2021
|
1,707
|
|
—
|
|
|||
|
Total minimum lease payments
|
$
|
54,727
|
|
8,358
|
|
||
|
Less amount representing interest
|
|
|
(1,089
|
)
|
|||
|
Present value of net minimum lease payments (of which $3,281 is currently payable)
|
|
|
$
|
7,269
|
|
||
Renewal options from
three
to
20
years exist on the majority of leased properties.
At
January 28, 2017
, the Company is committed to incur costs of approximately
$55.7 million
to acquire, complete and furnish certain stores and equipment.
F-23
At
January 28, 2017
, letters of credit totaling
$26.5 million
were issued under the Company's
$1.0 billion
revolving credit facility.
Various legal proceedings, in the form of lawsuits and claims, which occur in the normal course of business, are pending against the Company and its subsidiaries. In the opinion of management, disposition of these matters is not expected to materially affect the Company's financial position, cash flows or results of operations.
13. Asset Impairment and Store Closing Charges
During fiscal 2016, the Company recorded a pretax charge of
$6.5 million
for asset impairment. The charge was for the write-down of a certain cost method investment.
During fiscal 2015 and 2014,
no
asset impairment and store closing charges were recorded.
14. Fair Value Disclosures
The estimated fair values of financial instruments which are presented herein have been determined by the Company using available market information and appropriate valuation methodologies. However, considerable judgment is required in interpreting market data to develop estimates of fair value. Accordingly, the estimates presented herein are not necessarily indicative of amounts the Company could realize in a current market exchange.
The fair value of the Company's long-term debt and subordinated debentures is based on market prices.
The fair value of the Company's cash and cash equivalents, restricted cash and trade accounts receivable approximates their carrying values at
January 28, 2017
and
January 30, 2016
due to the short-term maturities of these instruments. The fair values of the Company's long-term debt at
January 28, 2017
and
January 30, 2016
was approximately
$687 million
and
$695 million
, respectively. The carrying value of the Company's long-term debt at
January 28, 2017
and
January 30, 2016
was approximately
$613 million
. The fair value of the subordinated debentures at
January 28, 2017
and
January 30, 2016
was approximately
$208 million
and
$204 million
, respectively. The carrying value of the subordinated debentures at
January 28, 2017
and
January 30, 2016
was
$200 million
.
During fiscal 2016, the Company recognized an impairment charge of
$6.5 million
on a cost method investment. The Company evaluated all factors and determined that an other-than-temporary impairment charge was necessary. Cost method investments are recorded in other assets on the consolidated balance sheets.
15. Quarterly Results of Operations (unaudited)
|
|
Fiscal 2016, Three Months Ended
|
||||||||||||||
|
(in thousands of dollars, except per share data)
|
April 30
|
July 30
|
October 29
|
January 28
|
|||||||||||
|
Net sales
|
$
|
1,503,242
|
|
$
|
1,452,445
|
|
$
|
1,365,609
|
|
$
|
1,935,675
|
|
|||
|
Gross profit
|
564,663
|
|
459,086
|
|
486,744
|
|
580,067
|
|
|||||||
|
Net income
|
77,431
|
|
12,083
|
|
22,798
|
|
56,908
|
|
|||||||
|
Diluted earnings per share:
|
|
|
|
|
|||||||||||
|
Net income
|
$
|
2.17
|
|
$
|
0.35
|
|
$
|
0.67
|
|
$
|
1.72
|
|
|||
|
|
Fiscal 2015, Three Months Ended
|
||||||||||||||
|
(in thousands of dollars, except per share data)
|
May 2
|
August 1
|
October 31
|
January 30
|
|||||||||||
|
Net sales
|
$
|
1,573,493
|
|
$
|
1,513,778
|
|
$
|
1,434,654
|
|
$
|
2,073,701
|
|
|||
|
Gross profit
|
613,074
|
|
493,447
|
|
521,734
|
|
616,566
|
|
|||||||
|
Net income
|
109,571
|
|
29,950
|
|
45,744
|
|
84,105
|
|
|||||||
|
Diluted earnings per share:
|
|
|
|
|
|||||||||||
|
Net income
|
$
|
2.66
|
|
$
|
0.75
|
|
$
|
1.19
|
|
$
|
2.31
|
|
|||
Total of quarterly earnings per common share may not equal the annual amount because net income per common share is calculated independently for each quarter.
Quarterly information for fiscal 2016 and fiscal 2015 includes the following items:
F-24
Fourth Quarter
2016
|
•
|
a pre-tax charge of
$6.5 million
(
$4.2 million
after tax or
$0.12
per share) for asset impairment related to the write-down of a cost method investment
|
2015
|
•
|
a
$3.1 million
pretax gain (
$2.0 million
after tax or
$0.06
per share) primarily related to the sale of one retail store location.
|
Third Quarter
2015
|
•
|
a
$9.4 million
pretax gain (
$6.0 million
after tax or
$0.16
per share) primarily related to the sale of three retail store locations.
|
F-25
Exhibit Index
|
Number
|
Description
|
||
|
*3(a)
|
|
Restated Certificate of Incorporation (Exhibit 3 to Form 10-Q for the quarter ended August 1, 1992, File No. 1-6140, as amended Exhibit 3 to Form 10-Q for the quarter ended May 3, 1997, File No. 1-6140).
|
|
|
|
|
||
|
*3(b)
|
|
By-Laws of Dillard's, Inc., as amended (Exhibit 3 to Form 8-K dated as of August 20, 2013, File No. 1-6140).
|
|
|
|
|
||
|
*4
|
|
Indenture between Registrant and Chemical Bank, Trustee, dated as of May 15, 1988, as supplemented (Exhibit 4 to Registration Statement File No. 33-21671, Exhibit 4.2 to Registration Statement File No. 33-25114, Exhibit 4(c) to Form 8-K dated September 26, 1990, File No. 1-6140 and Exhibit 4-q to Registration Statement File No. 333-59183).
|
|
|
|
|
||
|
*+10(a)
|
|
1990 Incentive and Nonqualified Stock Option Plan (Exhibit 10(b) to Form 10-K for the fiscal year ended January 30, 1993, File No. 1-6140).
|
|
|
|
|
||
|
*+10(b)
|
|
Senior Management Cash Bonus Plan (Exhibit 10(d) to Form 10-K for the fiscal year ended January 28, 1995, File No. 1-6140).
|
|
|
|
|||
|
*+10(c)
|
|
1998 Incentive and Nonqualified Stock Option Plan (Exhibit 10(b) to Form 10-K for the fiscal year ended January 30, 1999, File No. 1-6140).
|
|
|
|
|
||
|
*+10(d)
|
|
2000 Incentive and Nonqualified Stock Option Plan (Exhibit 10(e) to Form 10-K for the fiscal year ended February 3, 2001, File No. 1-6140).
|
|
|
|
|
||
|
*+10(e)
|
|
Dillard's, Inc. Stock Bonus Plan, as amended (Exhibit 10(e) to Form 10-K for the fiscal year ended January 30, 2016, File No. 1-6140).
|
|
|
|
|
||
|
*+10(f)
|
|
Dillard's, Inc. Stock Purchase Plan (Exhibit 10.2 to Form 10-Q for the quarter ended April 30, 2005, File No. 1-6140).
|
|
|
|
|
||
|
*+10(g)
|
|
Dillard's, Inc. 2005 Non-Employee Director Restricted Stock Plan, as amended (Exhibit 10(g) to Form 10-K for the fiscal year ended January 30, 2016, File No. 1-6140).
|
|
|
|
|
||
|
*+10(h)
|
|
Amended and Restated Corporate Officers Non-Qualified Pension Plan (Exhibit 10.1 to Form 8-K dated as of November 21, 2007, File No. 1-6140).
|
|
|
|
|
||
|
*10(i)
|
|
Credit Card Program Agreement by and among Dillard's, Inc., Wells Fargo Bank, N.A. and for the limited purposes stated therein, Dillard Investment Co., Inc. (Exhibit 10 to Form 10-Q for the quarter ended May 3, 2014, File No. 1-6140).
|
|
|
*10(j)
|
|
Five-Year Credit Agreement between Dillard's, Inc., Dillard Store Services, Inc. and JPMorgan Chase Bank, N.A. as agent for a syndicate of lenders (Exhibit 10.1 to Form 8-K filed on May 15, 2015, File No. 1-6140).
|
|
|
21
|
|
Subsidiaries of Registrant.
|
|
|
23
|
|
Consent of Independent Registered Public Accounting Firm.
|
|
|
|
|
||
|
31(a)
|
|
Certification of Chief Executive Officer Pursuant to Section 302 of the Sarbanes-Oxley Act of 2002.
|
|
|
|
|
||
|
31(b)
|
|
Certification of Co-Principal Financial Officer Pursuant to Section 302 of the Sarbanes-Oxley Act of 2002.
|
|
|
31(c)
|
|
Certification of Co-Principal Financial Officer Pursuant to Section 302 of the Sarbanes-Oxley Act of 2002.
|
|
|
32(a)
|
|
|
Certification of Chief Executive Officer Pursuant to Section 906 of the Sarbanes-Oxley Act of 2002 (18 U.S.C. 1350).
|
|
|
|
|
|
|
32(b)
|
|
|
Certification of Co-Principal Financial Officer Pursuant to Section 906 of the Sarbanes-Oxley Act of 2002 (18 U.S.C. 1350).
|
|
|
|
||
|
32(c)
|
|
|
Certification of Co-Principal Financial Officer Pursuant to Section 906 of the Sarbanes-Oxley Act of 2002 (18 U.S.C. 1350).
|
E-1
|
Number
|
|
Description
|
|
101.INS
|
|
XBRL Instance Document
|
|
|
|
|
|
101.SCH
|
|
XBRL Taxonomy Extension Schema Document
|
|
|
|
|
|
101.CAL
|
|
XBRL Taxonomy Extension Calculation Linkbase Document
|
|
|
|
|
|
101.DEF
|
|
XBRL Taxonomy Extension Definition Linkbase Document
|
|
|
|
|
|
101.LAB
|
|
XBRL Taxonomy Extension Label Linkbase Document
|
|
|
|
|
|
101.PRE
|
|
XBRL Taxonomy Extension Presentation Linkbase Document
|
___________________________________
* Incorporated by reference as indicated.
|
+
|
A management contract or compensatory plan or arrangement.
|
E-2
TABLE OF CONTENTS
Part IItem 1. BusinessItem 1A. Risk FactorsItem 1B. Unresolved Staff CommentsItem 2. PropertiesItem 3. Legal ProceedingsItem 4. Mine Safety DisclosuresPart IIItem 5. Market For Registrant's Common Equity, Related Stockholder Matters and Issuer Purchases Of Equity SecuritiesItem 6. Selected Financial DataItem 7. Management's Discussion and Analysis Of Financial Condition and Results Of OperationsItem 7A. Quantitative and Qualitative Disclosures About Market RiskItem 8. Financial Statements and Supplementary DataItem 9. Changes in and Disagreements with Accountants on Accounting and Financial DisclosureItem 9A. Controls and ProceduresItem 9B. Other InformationPart IIIItem 10. Directors, Executive Officers and Corporate GovernanceItem 11. Executive CompensationItem 12. Security Ownership Of Certain Beneficial Owners and Management and Related Stockholder MattersItem 13. Certain Relationships and Related Transactions, and Director IndependenceItem 14. Principal Accounting Fees and ServicesPart IVItem 15. Exhibits, Financial Statement SchedulesItem 16. Form 10-k Summary