DECKERS OUTDOOR CORP
10-Ks and 10-Qs
|
|
|
|
|
|
|
|
|
|
|
|
|
|
|
|
|
|
|
|
|
|
|
|
|
|
|
|
|
|
|
|
|
|
|
|
|
|
|
|
|
|
|
|
|
|
|
|
|
|
|
|
|
|
|
|
|
|
|
UNITED STATES
SECURITIES AND EXCHANGE COMMISSION
Washington, D.C. 20549
FORM 10-K
Annual Report Pursuant To Section 13 or 15(d)
of the Securities Exchange Act of 1934
For The Fiscal Year Ended
March 31, 2017
Commission File Number: 001-36436
DECKERS OUTDOOR CORPORATION
(Exact name of registrant as specified in its charter)
|
Delaware
|
95-3015862
|
|
(State of incorporation)
|
(I.R.S. Employer Identification No.)
|
250 Coromar Drive, Goleta, California 93117
(Address of principal executive offices)
(805) 967-7611
(Registrant’s telephone number, including area code)
Securities registered pursuant to Section 12(b) of the Act:
|
Title of each class
|
Name of each exchange on which registered
|
|
Common Stock, par value $0.01 per share
|
New York Stock Exchange
|
Indicate by check mark if the registrant is a well-known seasoned issuer, as defined in Rule 405 of the Securities Act.
Yes
ý
No
o
Indicate by check mark if the registrant is not required to file reports pursuant to Section 13 or 15(d) of the Exchange Act.
Yes
o
No
ý
Indicate by check mark whether the registrant: (1) has filed all reports required to be filed by Section 13 or 15(d) of the Securities Exchange Act of 1934 during the preceding 12 months (or for such shorter period that the registrant was required to file such reports) and (2) has been subject to such filing requirements for the past 90 days.
Yes
ý
No
o
Indicate by check mark whether the registrant has submitted electronically and posted on its corporate website, if any, every Interactive Data File required to be submitted and posted pursuant to Rule 405 of Regulation S-T (§232.405 of this chapter) during the preceding 12 months (or for such shorter period that the registrant was required to submit and post such files).
Yes
ý
No
o
Indicate by check mark if disclosure of delinquent filers pursuant to Item 405 of Regulation S-K (§ 229.405 of this chapter) is not contained herein, and will not be contained to the best of registrant's knowledge, in definitive proxy or information statements incorporated by reference in Part III of this Form 10-K or any amendment to this Form 10-K.
o
Indicate by check mark whether the registrant is a large accelerated filer, an accelerated filer, a non-accelerated filer, or a smaller reporting company. See the definitions of “large accelerated filer,” “accelerated filer,” and “smaller reporting company” in Rule 12b-2 of the Exchange Act. (Check one):
|
Large accelerated filer
x
|
Accelerated filer
o
|
|
Non-accelerated filer
o
|
(Do not check if a smaller reporting company)
|
|
Smaller reporting company
o
|
|
|
Emerging growth company
o
|
|
If an emerging growth company, indicate by check mark if the registrant has elected not to use the extended transition period for complying with any new or revised financial accounting standards provided pursuant to Section 13(a) of the Exchange Act.
o
Indicate by check mark whether the registrant is a shell company (as defined in Rule 12b-2 of the Exchange Act). Yes
o
No
ý
At
September 30, 2016
, the last business day of the registrant's most recently completed second fiscal quarter, the aggregate market value of the voting and non-voting stock held by the non-affiliates of the registrant was approximately
$1,897,849,329
, based on the number of shares held by non-affiliates of the registrant as of that date, and the last reported sale price of the registrant's common stock on the New York Stock Exchange on that date, which was
$59.55
. This calculation does not reflect a determination that persons are affiliates for any other purposes.
The number of shares of the registrant's Common Stock outstanding as of close of business on
May 12, 2017
was
31,990,065
.
DOCUMENTS INCORPORATED BY REFERENCE
Portions of the registrant's definitive Proxy Statement on Schedule 14A relating to the registrant's
2017
annual meeting of stockholders, to be filed with the Securities and Exchange Commission within 120 days after the end of the fiscal year covered by this Annual Report on Form 10-K, are incorporated by reference in Part III of this Annual Report on Form 10-K. With the exception of the portions of the Proxy Statement specifically incorporated herein by reference, the Proxy Statement and related proxy solicitation materials are not deemed to be filed as part of this Annual Report on Form 10-K.
DECKERS OUTDOOR CORPORATION AND SUBSIDIARIES
For The Fiscal Year Ended March 31, 2017
TABLE OF CONTENTS
|
Page
|
||
|
Item 1B.
|
Unresolved Staff Comments
|
*
|
|
Item 4.
|
Mine Safety Disclosures
|
*
|
|
Item 9.
|
Changes in and Disagreements with Accountants on Accounting and Financial Disclosure
|
*
|
|
Item 9B.
|
Other Information
|
*
|
*Not applicable.
1
CAUTIONARY NOTE REGARDING FORWARD-LOOKING STATEMENTS
This Annual Report on Form 10-K, filed with the Securities and Exchange Commission (SEC) on
May 30, 2017
(Annual Report on Form 10-K), and the information and documents incorporated by reference in this Annual Report on Form 10-K, contains “forward-looking statements” within the meaning of Section 27A of the Securities Act of 1933, as amended, and Section 21E of the Securities Exchange Act of 1934, as amended, which statements are subject to considerable risks and uncertainties. These forward-looking statements are intended to qualify for the safe harbor from liability established by the Private Securities Litigation Reform Act of 1995. Forward-looking statements include all statements other than statements of historical fact contained in, or incorporated by reference into, this Annual Report on Form 10-K, including statements regarding our future or assumed condition, results of operations, business plans and strategies, competitive position and market opportunities. We have attempted to identify forward-looking statements by using words such as “anticipate”, “believe”, “could”, “estimate”, “expect”, “intend”, “may”, “plan”, “predict”, “project”, “should”, “will”, or “would”, and similar expressions or the negative of these expressions. Specifically, this Annual Report on Form 10-K, and the information and documents incorporated by reference in this Annual Report on Form 10-K, contains forward-looking statements relating to, among other things:
|
•
|
the results of and costs associated with our Savings Plan (as defined herein) and ongoing restructuring plan, including our retail store fleet optimization and office consolidations;
|
|
•
|
our global business, growth, operating, investing, and financing strategies;
|
|
•
|
our product offerings, distribution channels, and geographic mix;
|
|
•
|
consumer preferences with respect to new brands and products;
|
|
•
|
the purchasing behavior and buying patterns of retail consumers;
|
|
•
|
the impact of seasonality and weather on our operations;
|
|
•
|
our review of a broad range of strategic alternatives;
|
|
•
|
expectations regarding our net sales and earnings growth and other financial metrics;
|
|
•
|
our development of worldwide distribution channels;
|
|
•
|
purchasing behavior of wholesale customers, including the timing of orders and management of inventory;
|
|
•
|
trends affecting our financial condition, results of operations, liquidity or cash flows;
|
|
•
|
our expectations for expansion of our Direct-to-Consumer capabilities, primarily in our E-Commerce business;
|
|
•
|
overall global economic trends, including foreign currency exchange rate fluctuations;
|
|
•
|
reliability of overseas factory production and storage;
|
|
•
|
the availability and cost of raw materials;
|
|
•
|
the value of goodwill and other intangible assets, and future write-downs or impairment charges;
|
|
•
|
changes impacting our tax liability and effective tax rates, including as a result of changes in tax laws or treaties, foreign income or loss, and the realization of net deferred tax assets;
|
|
•
|
potential impacts of our ongoing operational systems upgrades and costs associated with our business transformation project implementation;
|
|
•
|
commitments and contingencies, including purchase obligations for product and sheepskin; and
|
|
•
|
the impact of recent accounting pronouncements.
|
Forward-looking statements represent our management's current expectations and predictions about trends affecting our business and industry and are based on information available at the time such statements are made. Although we do not make forward-looking statements unless we believe we have a reasonable basis for doing so, we cannot guarantee their accuracy or completeness. Forward-looking statements involve numerous known and unknown risks, uncertainties and other factors that may cause our actual results, performance or achievements to be materially different from any future results, performance or achievements predicted, assumed or implied by the forward-looking statements. Some of the risks and uncertainties that may cause our actual results to materially differ from those expressed or implied by these forward-looking statements are described in Part I, Item 1A, "Risk Factors" and Part II, Item 7, "Management's Discussion and Analysis of Financial Condition and Results of Operations", in this Annual Report on Form 10-K, as well as in our other filings with the SEC. You should read this Annual Report on Form 10-K, including the information and documents incorporated by reference herein, in its entirety and with the understanding that our actual future results may be materially different from the results expressed or implied by these forward-looking statements. Moreover, we operate in an evolving environment. New risks and uncertainties emerge from time to time and it is not possible for our management to predict all risks and uncertainties, nor can we assess the impact of all factors on our business or the extent to which any factor, or combination of factors, may cause our actual future results to be materially different from any results expressed or implied by any forward-looking statements. Except as required by applicable law or the listing rules of the New York Stock Exchange, we expressly disclaim any intent or obligation
2
to update any forward-looking statements. We qualify all of our forward-looking statements with these cautionary statements.
3
References in this Annual Report on Form 10-K to "Deckers", "we", "our", "us", or the "Company" refer to Deckers Outdoor Corporation, together with its consolidated subsidiaries. UGG® (UGG), Teva® (Teva), Sanuk® (Sanuk), Hoka One One® (Hoka), Koolaburra® by UGG (Koolaburra), Ahnu® (Ahnu) and UGGpure
TM
(UGGpure) are some of our trademarks. Other trademarks or trade names appearing elsewhere in this report are the property of their respective owners.
Solely for convenience, the trademarks and trade names in this Annual Report on Form 10-K are referred to without the ® and™ symbols, but such references should not be construed as any indicator that their respective owners will not assert, to the fullest extent under applicable law, their rights thereto.
Unless otherwise specifically indicated, all amounts in Items 1, 1A, 2, and 3 herein are expressed in thousands, except for employees, store and country counts and share data. The defined periods for the fiscal years ended March 31, 2017, 2016, and 2015 are stated herein as "year ended" or "years ended".
General
Deckers Outdoor Corporation was incorporated in 1975 under the laws of the State of California and, in 1993, reincorporated under the laws of the State of Delaware. We are a global leader in designing, marketing and distributing innovative footwear, apparel and accessories developed for both everyday casual lifestyle use and high performance activities. We market our products primarily under five proprietary brands: UGG, Koolaburra, Hoka, Teva and Sanuk. We believe that our footwear is distinctive and appeals broadly to women, men and children. We sell our products through quality domestic and international retailers, international distributors, and directly to our end-user consumers both domestically and internationally through our Direct-to-Consumer (DTC) business, which is comprised of our retail stores and E-Commerce websites. We seek to differentiate our brands and products by offering diverse lines that emphasize authenticity, functionality, quality, and comfort, and products tailored to a variety of activities, seasons, and demographic groups. All of our products are currently manufactured by independent manufacturers primarily in Asia. Our growth will depend on our ability to diversify our product offerings, increase the appeal of our products to consumers, optimize domestic and international distribution, drive sales to consumers, and develop or acquire new brands.
Recent Developments
Restructuring.
In February 2016, we announced the implementation of a restructuring plan, which included a retail store fleet optimization and office consolidations, including the closure of facilities and relocation of employees to realign our brands across our Fashion Lifestyle and Performance Lifestyle groups. This restructuring plan is intended to streamline brand operations, reduce overhead costs, create operating efficiencies and improve collaboration.
In connection with these restructuring efforts, we incurred total restructuring charges of approximately
$29,100
and
$24,800
during fiscal year 2017 and 2016, respectively, with a total of
$29,100
and
$22,800
recognized in selling, general and administrative (SG&A) expenses and approximately
$0
and
$2,000
in cost of sales, respectively. Related to these charges, we closed
25
retail stores, including
five
retail stores during fiscal year 2016 and
20
retail stores during fiscal year 2017, and consolidated several offices
as of March 31, 2017
. In fiscal year 2016, we relocated our Sanuk brand operations in Irvine, California to our corporate headquarters in Goleta, California and closed our Ahnu brand operations in Richmond, California, as well as consolidated our European offices.
As part of our continuing evaluation of our retail store fleet, we identified additional stores for closure during
the year ended
March 31, 2017
. During fiscal year 2017, we recognized approximately
$3,600
in restructuring charges in SG&A expenses related to non-cash impairment charges for retail store assets for
12
of these stores. In May 2017, we announced that we expect to further reduce our global brick and mortar footprint by 30 to 40 stores compared to our store count at
March 31, 2017
, discussed below, which includes a combination of store closures and conversion of owned stores to partner retail stores. We are targeting a worldwide store count of approximately
125
stores by the end of fiscal year 2020.
Refer to Part II, Item 7, "Management's Discussion and Analysis of Financial Condition and Results of Operations", and Note 2, "Restructuring", to our consolidated financial statements in Part IV of this Annual Report on Form 10-K for further information on our restructuring efforts, and the impact to our results of operations and our reportable operating segments.
4
Savings Plan.
In February 2017, we announced a plan to implement significant cost savings, excluding reinvestment (Savings Plan). The Savings Plan includes a combination of both cost of sales improvements and SG&A expense savings. Cost of sales improvements are expected to come from reducing product development cycle times, optimizing material yields, consolidating our factory base and continuing to move production outside of China. SG&A expense savings are expected to come from further retail store consolidations, process improvement efficiencies and lower unallocated indirect spend. In May 2017, we provided an update that the goal of the Savings Plan is to drive approximately
$100,000
in operating profit improvement by the end of fiscal year 2020.
Review of Strategic Alternatives
.
In April 2017, we announced that our Board of Directors has initiated a process to review a broad range of strategic alternatives. This review process includes an exploration and evaluation of strategic alternatives to enhance stockholder value, which may include a sale or other transaction.
Products and Brands
We currently market our products primarily under five propriety brands, composed of our three primary brands and our other brands. Collectively, our brands compete across the fashion and casual lifestyle, outdoor, and running markets.
UGG.
The UGG brand is one of the most iconic and recognized brands in footwear and highlights our successful track record of building niche brands into lifestyle market leaders. With loyal consumers around the world, the UGG brand has proven to be a highly resilient line of premium footwear, with expanded product offerings and a growing global audience that attracts women, men and children. We intend to continue diversifying the UGG brand by developing more year-round product that includes spring and summer footwear, as well as growing men's products and non-footwear. The UGG brand is sold both domestically and internationally in key markets including the US, UK, Germany, China, Japan, and Canada, among others.
Teva.
Teva is a modern outdoor active lifestyle brand, born from the outdoors and rooted in adventure. As the originator of the sport sandal, the Teva brand's product line now includes sandals, shoes, and boots built for ultimate versatility.
Sanuk.
Sanuk is a surf lifestyle footwear brand rooted in Southern California culture. The Sanuk brand is best known for its SIDEWALK SURFERS shoe, Yoga Mat
and Beer Cozy sandal collections. The brand has a history of product invention, comfort, unexpected materials and clever branding.
Other Brands.
Other brands consist of: Hoka, a line of running footwear that offers maximal cushioning with minimal weight and is designed for runners of all capacities; Koolaburra, a line of fashion casual footwear using sheepskin and other plush materials; and Ahnu, a line of performance outdoor footwear, which we have discontinued operating and have begun to leverage under the Teva brand umbrella.
Sales and Distribution
US Distribution.
At the wholesale level, we distribute our products in the US through sales representatives, who are organized geographically and by brand. In addition to our wholesale business, we also sell products directly to end-user consumers through our DTC business.
Currently, our sales force is generally separated by brand, as each brand generally has certain specialty consumers. However, there is some overlap between the sales teams and customers, and we are aligning our brands' sales forces to position them for the future of the brands.
We distribute products sold in the US through our distribution centers in Camarillo and Moreno Valley, California. Our distribution centers feature a warehouse management system that enables us to efficiently pick and pack products for direct shipment to customers.
International Distribution.
Internationally, we distribute our products through independent distributors and wholly-owned subsidiaries in many countries, including Europe, Asia-Pacific, and Canada, among others. In addition, in certain countries we sell products through DTC. We also sell products internationally, particularly in China, through partner retail stores, which are branded stores that are wholly owned and operated by third parties. Sales through partner retail stores are primarily attributed to the UGG and Sanuk brand wholesale reportable operating segments.
5
For our wholesale and DTC businesses, we distribute our products through a number of distribution centers managed by third-party logistics providers (3PLs) in certain international locations.
UGG Wholesale.
We sell the UGG brand primarily through domestic higher-end department stores such as Nordstrom and Dillard's, as well as lifestyle retailers such as Journeys, and online retailers such as Amazon and Zappos.com. As the retail marketplace continues to evolve and change to reflect changing consumer habits, we continually review and evaluate our UGG wholesale distribution approach and segmentation.
Teva Wholesale.
We sell our Teva brand footwear primarily through specialty outdoor, sporting goods, department stores and family footwear, including retailers such as REI, Famous Footwear, DSW and online retailers such as Amazon and Zappos.com.
Sanuk Wholesale.
We sell our Sanuk brand footwear primarily through domestic independent action sports retailers, outdoor retailers, specialty footwear retailers and larger national retail chains, including Journeys, Dillard's, DSW, REI and online retailers such as Amazon and Zappos.com.
Other Brands Wholesale.
Our other brands are sold primarily at domestic specialty running stores, department stores, outdoor and independent specialty retailers, and with online retailers. Key accounts of the Hoka brand include Running Warehouse, Road Runner Sports, Running Specialty Group, REI and Zappos.com. Key accounts of the Koolaburra brand include Kohl's and Rack Room Shoes.
Direct-to-Consumer.
Our DTC business is comprised of our retail stores and E-Commerce websites. As a result of our evolving Omni-Channel strategy, we believe that our retail stores and websites are largely intertwined and dependent on one another. We believe that in many cases consumers interact with both our brick and mortar stores and our websites before making purchase decisions. For example, consumers may feel or try on products in our retail stores and then place an order online later. Conversely, they may initially research products online, and then view inventory availability by store location and make a purchase in store. Some examples that demonstrate the extent to which the sales channels are combined and help improve our inventory productivity include the following:
|
•
|
“UGG Rewards”: We have implemented a consumer loyalty program under which points and awards are earned across the DTC business.
|
|
•
|
“Infinite UGG”: We provide online shopping access inside retail stores for all SKUs available on our E-Commerce websites.
|
|
•
|
"Ship from Store": Inventory that is available in our stores, but is out of stock online can be shipped from our stores. Future advancements in the capability will use algorithms to select the optimal fulfillment source.
|
|
•
|
"UGG Closet": an online portal that functions similar to an outlet store in that it provides a way to closeout inventory directly to consumers.
|
|
•
|
“Buy online / return in-store”: Our consumers can buy online and return products to the store.
|
|
•
|
“Click and collect”: Our consumers can buy online and have products delivered to certain of our retail stores for pick-up.
|
|
•
|
“Retail inventory online”: Our consumers can view specific store location inventory online before visiting the store.
|
Our retail stores enable us to expose consumers to a greater breadth of product, directly impact our consumers' experiences, sell the products at retail prices and generate greater gross margins. Our retail stores are predominantly UGG brand concept and outlet stores. Through our outlet stores, depending on the location, we sell some of our discontinued styles from prior seasons, full price in-line products, as well as products made specifically for the outlet stores.
At March 31, 2017
, we had a total of
160
retail stores worldwide, which includes
96
concept stores and
64
outlet stores. During fiscal year 2017, we opened
17
new retail stores, reclassified
12
European concession stores as owned stores, converted
two
owned stores to partner retail stores, and closed
20
retail stores. Concession stores are considered concept stores that are operated by us within a department or other store, which we lease from the store
6
owner by paying a percentage of concession store sales. Refer to Part II, Item 7, “Management’s Discussion and Analysis of Financial Condition and Results of Operations”, for further disclosure and discussion.
Product Design and Development
The design and development functions for all of our brands are performed by a combination of internal design and development staff and outside freelance designers. Refer to Note 1, "The Company and Summary of Significant Accounting Policies", to our consolidated financial statements in Part IV of this Annual Report on Form 10-K for a discussion of the research and development costs we have incurred for the last three fiscal years.
In order to ensure quality, consistency, and efficiency in our design and product development process, we continually evaluate the availability and cost of raw materials, the capabilities and capacity of our independent manufacturers and the target retail price of new models and lines. The design and development staff works closely with brand management to develop new styles of footwear and accessories for our various product lines. Throughout the development process, we have multiple design and development reviews, which we then coordinate with our independent manufacturers.
Manufacturing and Supply Chain
We do not manufacture our products. We outsource the production of our brand footwear to independent manufacturers, primarily in Asia. We require our independent manufacturers and designated suppliers to adopt our Supplier Code of Conduct, which specifies that they comply with all local laws and regulations governing human rights, working conditions, and environmental compliance before we are willing to conduct business with them. We also require our manufacturing partners and licensees to comply with our Restricted Substances Policy, Anti-Corruption Policy and other compliance policies and procedures as a condition of doing business with us.
The production of footwear by our independent manufacturers is performed in accordance with our detailed specifications and is subject to our quality control standards. We maintain a buying office in Hong Kong and on-site supervisory offices in Pan Yu City, China and Hai Phong City, Vietnam, which together serve as a link to our independent manufacturers. We believe this regional presence provides predictability of material availability, product flow and adherence to final design specifications. The majority of the materials and components used in production of our products by these independent manufacturers are purchased from independent suppliers that we designate.
At our direction, our manufacturers currently purchase the majority of the sheepskin used in our products from two tanneries in China, which source their sheepskin for our products primarily from Australia and the UK. We maintain communication with the tanneries to monitor the available supply of sufficient high-quality sheepskin for our projected UGG brand production. To ensure adequate supplies for our manufacturers, we forecast our usage of sheepskin in advance at a forward price. We have also entered into purchase commitments with certain sheepskin suppliers. Refer to Note 7, "Commitments and Contingencies", to our consolidated financial statements in Part IV of this Annual Report on Form 10-K for further information on our minimum purchase commitments. We believe current supplies are sufficient to meet our current and anticipated demand, but we continue to investigate our options to accommodate our expected growth or unexpected supply chain issues.
Beginning in 2013, in an effort to partially reduce our dependency on sheepskin, we began using a proprietary new raw material, UGGpure™, which is a wool woven into a durable backing, in some of our UGG brand products. Excluding sheepskin and UGGpure™, we believe that substantially all the various raw materials and components used to manufacture our footwear, including wool, rubber, leather, and nylon webbing are generally available from multiple sources at competitive prices. We generally outsource our manufacturing requirements on the basis of individual purchase orders or short-term purchase commitments rather than maintaining long-term purchase commitments with our independent manufacturers.
We have instituted pre-production, in-line, and post-production inspections to meet or exceed the high quality demanded by us and consumers of our products. Our quality assurance program includes our own employee on-site inspectors at our independent manufacturers, who oversee the production process and perform quality assurance inspections. We also routinely inspect our products upon arrival at our distribution centers.
7
Patents and Trademarks
We utilize trademarks with virtually all of our products and believe that having distinctive marks that are readily identifiable is an important factor in creating a market for our products, promoting our brands, and distinguishing our products from the products of others. We currently hold trademark registrations for "UGG", "Teva", "Sanuk", "Hoka One One", "Koolaburra", "Ahnu", "UGGpure", and other marks in the US and for certain of the marks in many other countries, including Canada, China, the UK, various countries in the European Union, Japan, and Korea.
As of March 31, 2017
, we hold
176
designs and inventions with corresponding design or utility patent registrations, plus
14
designs and inventions which are currently pending registration. These patents expire at various times. We regard our proprietary rights as valuable assets and vigorously protect such rights against infringement by third parties.
Seasonality
Our business is seasonal, with the highest percentage of UGG brand net sales occurring in the quarters ending September 30th and December 31st and the highest percentage of Teva and Sanuk brand net sales occurring in the quarters ending March 31st and June 30th. Due to the size of the UGG brand relative to our other brands, our aggregate net sales in the quarters ending September 30th and December 31st have significantly exceeded net sales in the quarters ending March 31st and June 30th. For further discussion, including regarding the factors that may cause actual results to differ materially from our expectations, refer to Part I, Item 1A, "Risk Factors", and Part II, Item 7, "Management's Discussion and Analysis of Financial Condition and Results of Operations".
Inventory Management
We manage our inventory levels based on existing orders, anticipated sales and the rapid-delivery requirements of our customers. We have put in place systems and processes designed to improve our forecasting and supply planning capabilities. In addition, we believe that added discipline around the purchasing of product, production lead time reduction, and better planning and execution in selling of excess inventory through our outlet stores and other liquidation channels are key areas of focus that will enhance inventory performance.
Our practice, and the general practice in the footwear and accessory industries, is to offer retail customers the right to return defective or improperly shipped merchandise. As it relates to new product introductions, which can often require large initial launch shipments, we commence production before receiving orders for those products from time to time. This can affect our inventory levels as we build pre-launch quantities.
Backlog
Historically, we have encouraged our wholesale and distributor customers to place, and we have received, a significant portion of orders as pre-season orders, generally four to eight months prior to the anticipated shipment date. We work with our wholesale customers through pre-season programs to enable us to better plan our production schedule, and inventory and shipping needs. We refer to backlog as unfilled customer orders from our wholesale customers and distributors as of any date, which represent orders scheduled to be shipped at a future date, some of which can be cancelled prior to shipment. As such, these orders may not be indicative of actual future shipments. Therefore, we believe backlog is an imprecise indicator and is not material for understanding the business in its entirety, especially since backlog excludes sales in our DTC business.
As of
March 31, 2017
, our backlog was approximately $649,000. The backlog as of a particular date is affected by a number of factors, including seasonality, manufacturing schedule, and the timing of product shipments, as well as variations in when wholesale customers and distributors place orders. As a result, comparisons of the backlog from period-to-period may not provide an accurate indication of future results.
Competition
The footwear markets that we operate in are highly competitive. Our competitors include athletic and footwear companies, branded apparel companies and retailers with their own private labels. Although the footwear industry is fragmented to a certain degree, many of our competitors are larger and have substantially greater resources than us, including athletic shoe companies, several of which compete directly with some of our products. In addition, access to offshore manufacturing and the growth of E-Commerce has made it easier for new companies to enter the markets in which we compete, further increasing competition in the footwear and accessory industries. In particular, and in part due to the popularity of our UGG brand products, we face increasing competition from a significant number of domestic
8
and international competitors selling products designed to compete directly or indirectly with our UGG brand products. We believe that our ability to successfully compete depends on numerous factors, including responding to consumer preferences, producing appealing product, and pricing products competitively, among others. For a discussion on how we compete, refer to Part 1, Item 1A, "Risk Factors".
Employees
At
March 31, 2017
, we employed approximately 3,300 employees in the US, Europe, and Asia, none of whom were represented by a union. This figure includes approximately 1,800 employees in our retail stores worldwide, which includes part-time and seasonal employees.
Financial Information about Reportable Operating Segments and Geographic Areas
Our five reportable operating segments include the strategic business units responsible for the worldwide operations of our brands' (UGG, Teva, Sanuk and other brands) wholesale divisions, as well as our DTC business. The majority of our sales and long-lived assets are in the US. Refer to Note 12, "Reportable Operating Segments", to our consolidated financial statements in Part IV of this Annual Report on Form 10-K for further discussion of our reportable operating segments. Refer to Note 13, "Concentration of Business, Significant Customers and Credit Risk", to our consolidated financial statements in Part IV of this Annual Report on Form 10-K for financial information about geographic areas and concentration of related business risks.
Government Regulation
Compliance with federal, state, and local environmental regulations has not had, and it is not expected to have, any material effect on our capital expenditures, earnings, or competitive position based on information and circumstances known to us at this time.
Available Information
Our annual reports on Form 10-K, quarterly reports on Form 10-Q, current reports on Form 8-K, proxy statements, and any amendments to these reports filed or furnished pursuant to Section 13(a) or 15(d) of the Securities Exchange Act of 1934, as amended, are available free of charge on our website at www.deckers.com. Such documents are available as soon as reasonably practicable after they are filed with or furnished to the Securities and Exchange Commission (SEC). Our filings may also be read and copied at the SEC's Public Reference Room at 100 F Street, NE, Washington, DC 20549. Information on the operation of the Public Reference Room may be obtained by calling the SEC at 1-800-SEC-0330. The SEC also maintains a website at www.sec.gov that contains reports, proxy and information statements, and other information regarding issuers that file electronically with the SEC.
We also make available through our website the following corporate governance documents: Audit Committee Charter, Compensation Committee Charter, Corporate Governance Charter, Code of Ethics, Accounting and Finance Code of Conduct, Corporate Governance Guidelines, and Conflict Minerals Policy.
The information contained on or accessed through our website does not constitute part of this Annual Report on Form 10-K, and references to our website address in this Annual Report on Form 10-K are inactive textual references only.
9
Our short and long-term success is subject to numerous risks and uncertainties, many of which involve factors that are difficult to predict or beyond our control. Investing in our common stock involves substantial risk. Before making a decision to invest in, hold or sell our common stock, stockholders and potential stockholders should carefully consider the risks and uncertainties described below, in addition to the other information contained in or incorporated by reference into this Annual Report on Form 10-K, as well as the other information we file with the SEC. If any of the following risks are realized, our business, financial condition, results of operations and prospects could be materially and adversely affected. In that case, the value of our common stock could decline and stockholders may lose all or part of their investment. Furthermore, additional risks and uncertainties of which we are currently unaware, or which we currently consider to be immaterial, could have a material adverse effect on our business. Refer to the section entitled "Cautionary Note Regarding Forward-Looking Statements" on page 2 of this Annual Report on Form 10-K.
Many of our products are inherently seasonal, and the sales of our products are highly sensitive to weather conditions, which makes it difficult to anticipate consumer demand for our products, manage our expenses, and forecast our financial results.
Due to the nature of many of our product offerings, sales of our products are inherently seasonal. Historically, the highest percentage of UGG brand net sales have occurred in the fall and winter months (our second and third fiscal quarters), and the highest percentage of Teva and Sanuk brand net sales have occurred in the spring and summer months (our first and fourth fiscal quarters). Due to the size of the UGG brand relative to our other brands, this trend has resulted in our aggregate net sales for the second and third fiscal quarters significantly exceeding our net sales in the first and fourth fiscal quarters. While we have taken steps to diversify our product offerings, both by creating more year-round styles within our existing brands, and by acquiring and developing new brands, we expect this trend to continue for the foreseeable future. As a result of the relative concentration of our sales in certain months of the year, factors which specifically impact consumer spending patterns in those months, such as unexpected weather patterns, declines in consumer confidence or worsening economic conditions, will have a disproportionate impact on our business, and could result in our failure to achieve financial performance that is in line with our expectations.
In particular, sales of our products are highly sensitive to weather conditions, which are difficult to predict and beyond our control. For example, extended periods of unseasonably warm weather during the fall or winter months may significantly reduce demand for our UGG products. Unanticipated weather conditions may continue to have a material, negative impact on our financial condition and results of operations. In addition, the unpredictability of weather conditions makes it more difficult for us to accurately forecast our financial results and to meet the expectations of analysts and investors.
We use sheepskin to manufacture a significant portion of our products, and if we are unable to obtain a sufficient quantity of sheepskin that meets our quality expectations, it could have a material adverse impact on our business.
For the manufacturing of our products, we purchase certain raw materials that are affected by commodity prices, the most significant of which is sheepskin. The supply of sheepskin, which is used to manufacture a significant portion of our UGG products, is in high demand and there are a limited number of suppliers that are able to meet our expectations for the quantity and quality of sheepskin that we require. In addition, our unique product design and animal welfare standards require sheepskin that may only be found in limited geographic locations. We presently rely on only two tanneries to provide the majority of our sheepskin. If the sheepskin provided by these tanneries and the resulting products we deliver to consumers, do not conform to our quality specifications or fail to meet consumer expectations, we could experience a higher rate of customer returns, which would reduce our net sales and harm our reputation. Similarly, if the tanneries are not able to deliver sheepskin in the quantities required this would negatively impact our manufacturing process and lead to inventory shortages, which would result in a loss of sales and strain our relationships with our customers.
In addition, any factors that negatively impact the business of these tanneries, such as loss of customers, financial instability or bankruptcy, could prevent them from delivering sheepskin to us in the quantities expected or at all. Our sheepskin suppliers currently warehouse their inventory at a limited number of facilities in China. The loss, destruction, or disruption of work at any of these facilities would likely result in shortages in our supply of sheepskin. These events are unpredictable and not within our control. If any of these events were to occur, it would likely result in interruptions in our manufacturing process, the loss of sales and harm to our reputation.
10
In some, but not all recent years, there have been significant fluctuations in the price of sheepskin as the demand for this commodity from our customers and our competitors has changed. We believe the significant factors affecting the price of sheepskin include weather patterns, harvesting decisions, incidence of disease, the price of other commodities such as wool, the demand for our products and the products of our competitors, and global economic conditions. Most of these factors are not considered predictable or within our control. For example, if the price of wool increases, sheep herders may choose not to harvest their sheep and instead choose to shear their sheep for wool, thus decreasing the supply of sheepskin. Similarly, sheepskin is a by-product of the food industry, and the demand for sheep meat has generally been decreasing, thus leading to an overall reduction in the number of sheep available. Any factors that increase the demand for, or decrease the supply of, sheepskin could cause significant increases in the price of sheepskin, which would increase our manufacturing costs and reduce our gross margins.
Beginning in 2013, in an effort to partially reduce our dependency on sheepskin, we began using a proprietary raw material, UGGpure, which is a wool woven into a durable backing, in some of our UGG brand products. In addition, we use purchasing contracts and other pricing arrangements to attempt to reduce the impact of fluctuations in sheepskin prices. However, in the event of a prolonged increase in sheepskin prices such as what we experienced in the past, which at times has been significant, these strategies may not be sufficient to fully offset the impact on our financial results from the increased prices. In that event, it is unlikely we would be able to adjust our product prices sufficiently to eliminate the impact on our gross margins and our financial results may suffer.
The footwear and fashion industry is subject to rapid changes in consumer preferences, and if we do not accurately anticipate and promptly respond to consumer demand, including through effective marketing, we could lose sales, our relationships with customers could be harmed and our brand loyalty could be diminished.
The footwear and fashion industry is subject to rapid changes in consumer preferences and tastes, which make it difficult to anticipate demand for our products and forecast our financial results. We believe there are many factors that may affect the demand for our products, including:
|
•
|
seasonality, including the impact of anticipated and unanticipated weather conditions;
|
|
•
|
continued consumer acceptance of our existing products and acceptance of our new products;
|
|
•
|
consumer demand for products of our competitors;
|
|
•
|
consumer perception and preference for our brands;
|
|
•
|
the extent to which consumers view certain of our products as substitutes for other products we manufacture;
|
|
•
|
publicity, including social media, related to us, products, brands, and marketing campaigns;
|
|
•
|
the life cycle of our products and consumer replenishment behavior;
|
|
•
|
evolving fashion and lifestyle trends, and the extent to which our products reflect these trends;
|
|
•
|
brand loyalty;
|
|
•
|
changes in consumer confidence and buying patterns, and other factors that impact discretionary income and spending; and
|
|
•
|
changes in general economic and market conditions.
|
Consumer demand for our products depends in part on the continued strength of our brands, which in turn depends on our ability to anticipate, understand and promptly respond to the rapidly changing preferences and fashion tastes of footwear and apparel consumers. As our brands and product offerings continue to evolve, it is necessary for our products to appeal to an even broader range of consumers whose preferences cannot be predicted with certainty. For example, many UGG products include a fashion element and could go out of style at any time. Furthermore, we are dependent on consumer receptivity to our new products and to the marketing strategies we employ to promote those products. Consumers may not purchase new models and styles of footwear or accessories in the quantities projected or at all. If we fail to react appropriately to changes in consumer preferences and fashion trends, consumers may consider our brands and products to be outdated or associate our brands and products with styles that are no longer popular, which may adversely affect our overall financial performance.
Our success is driven to some extent by brand loyalty, and there can be no assurance that consumers will continue to prefer our brands. The value of our brands is largely based on evolving consumer perceptions, and one or more missteps with respect to factors such as product quality, product design or customer service, could result in negative perceptions and a corresponding loss of brand loyalty and value. In addition, negative claims or publicity regarding us, our products, our brands, our marketing campaigns or our celebrity endorsers, could adversely affect our reputation and sales regardless of whether such claims are accurate. Social media, which accelerates the dissemination of information, can increase the challenges of containing any such negative claims. If consumers begin to have negative
11
perceptions of our brands, whether or not warranted, our brand image would become tarnished and our products would become less desirable, which could have a material adverse effect on our business.
If we are unsuccessful in implementing our ongoing restructuring plan and our Savings Plan, we may incur significant charges and costs without any corresponding benefits to our business, in which case our financial condition and operating results may be adversely affected.
We are in the ongoing process of restructuring our business in order to streamline brand operations, reduce overhead costs, create operating efficiencies and improve collaboration. This includes a retail store fleet optimization and office consolidations, including the closure of facilities and relocation of employees to realign our brands across our Fashion Lifestyle and Performance Lifestyle groups. Key components to executing this plan include organizational changes, continued retail store closures, and conversion of owned stores to partner retail stores, among others.
As part of our ongoing restructuring plan, we have incurred, and expect to continue to incur, significant restructuring charges and other costs, which have and may continue to include SG&A expenses related to the write-off of retail store related assets, the early termination of retail store leases, employee severance costs, termination of various contracts, and the disposal of equipment and software impairments, among others. There can be no assurance that the benefits from these restructuring efforts, including from any potential reduction in overhead costs or improvement in operating efficiencies, will be sufficient to offset the restructuring charges and other costs that we have already incurred and that we expect to incur in the future. If we fail to realize the anticipated benefits from these measures, or if we incur charges or costs in amounts that are greater than our estimates, our financial condition and operating results may be adversely affected.
We have also begun implementing our Savings Plan with the goal of driving operating profit improvement through a combination of both cost of sales improvements and SG&A expense savings. However, there can be no assurance that we will be successful in realizing cost of sales improvements, especially if we fail to reduce product development cycle times, optimize material yields, consolidate our factory base, or move production outside of China. Further, if we fail to execute on our plans with respect to further retail store consolidations, process improvement efficiencies, and lower unallocated indirect spend, we may not achieve the SG&A expense savings which are a key component of the Savings Plan. If we are unable to realize cost of sales improvements and SG&A expense savings, then we may not be able to achieve the estimated profitability improvements or other expected benefits of the Savings Plan. Further, the implementation of our Savings Plan may require additional investments and divert management’s time and resources, which may impede our ability to achieve our goal of driving operating profit improvement.
It may be difficult to identify new retail store locations that meet our requirements, and any new retail stores may not realize returns on our investments.
While we expect to close or relocate a number of retail stores, we may identify opportunities to open new retail stores in the future. Global store openings involve substantial investments, including those relating to leasehold improvements, furniture and fixtures, equipment, information systems, inventory, and personnel. In addition, since a certain amount of our retail store costs are fixed, if we have insufficient sales, we may be unable to reduce expenses in order to avoid losses or negative cash flows. As we have experienced in the past, due to the high fixed cost structure associated with the retail business, the closure of a retail store can result in a significant negative financial impact, including write-offs of retail store assets and inventory, lease termination costs, and severance costs. As a result of our ongoing retail store fleet optimization plans, and in light of the significant costs and impairments that can be incurred upon the closure of a retail location, we expect to conduct a thorough diligence process and apply stringent financial parameters when assessing whether to open a new retail store location. However, there can be no assurance that any new retail location that we may identify will ultimately generate a positive return on our investment.
Furthermore, we license the right to operate retail stores for our brands to third parties through our partner retail program. We expect to increase both the number of third parties we engage within our partner retail program and the number of stores that they operate. We currently plan for most of the partner retail stores to be operated in international markets, with the largest increase anticipated to be in China. We provide training to support these stores, and set and monitor operational standards. However, the quality of these store operations may decline due to the failure of these third parties to operate the stores in a manner consistent with our standards or our failure to adequately monitor these third parties, which could result in reduced sales and cause our overall brand image to suffer.
12
We face intense competition from both established companies and newer entrants into the market, and our failure to compete effectively could cause our market share to decline, which would harm our financial condition and results of operations.
The footwear industry is highly competitive and we expect to continue to face intense competitive pressures. We believe that we compete on the basis of a number of factors, including our ability to:
|
•
|
predict and respond to changing consumer preferences and tastes in a timely manner;
|
|
•
|
produce products that appeal to consumers;
|
|
•
|
produce products that meet our requirements and consumer expectations for quality;
|
|
•
|
accurately predict and forecast consumer demand;
|
|
•
|
ensure product availability;
|
|
•
|
manage the impact of seasonality, including unexpected changes in weather conditions;
|
|
•
|
maintain brand loyalty and authenticity;
|
|
•
|
price our products in a competitive manner;
|
|
•
|
implement our Omni-Channel strategy, including providing a unique customer service experience; and
|
|
•
|
manage the impact of the rapidly changing retail environment on our business.
|
Our inability to compete effectively with respect to one or more of these factors could cause our market share to decline, which would harm our financial condition and results of operations.
Our competitors include athletic and footwear companies, branded apparel companies, and retailers with their own private labels. In addition, these competitors include both established companies, as well as newer entrants into the market. In particular, we believe that, as a result of the growth of the UGG brand, certain competitors have entered into the marketplace specifically in response to the success of our brands, and that other competitors may do so in the future. A number of our larger competitors have significantly greater financial, technological, engineering, manufacturing, marketing, and distribution resources than we do, as well as greater brand awareness in the footwear and apparel markets. Our competitors’ greater capabilities in these areas may enable them to more effectively compete on the basis of price and production, develop new products more quickly, identify or influence consumer preferences, and withstand periodic downturns in the footwear industry or in economic conditions generally. With respect to newer entrants into the market, we believe that access to offshore manufacturing and changes in technology will continue to make it easier and more cost effective for these companies to compete with us.
As a result of the competitive environment in which we operate, we have faced, and expect to continue to face, intense pricing pressure. For example, efforts by our competitors to dispose of their excess inventories may significantly reduce prices of competitive products, which may require us to reduce the pricing of our products in order to compete, or cause consumers to shift their purchasing decisions away from our products entirely. We have also faced, and expect to continue to face, intense pressure with respect to competition for key customer accounts and distribution channels. If we fail to compete effectively in the future, our sales could decline and our margins could be impacted, either of which could have a negative impact on our financial condition and results of operations.
If we are unsuccessful at improving our operational systems and our efforts do not result in the anticipated benefits to us or result in unanticipated disruption to our business, our financial condition and operating results could be adversely affected and our business may become less competitive.
We strive to improve, automate and streamline our operational systems, processes, infrastructure and management as part of our ongoing effort to improve the overall efficiency and competitiveness of our business. We recently completed our business transformation project implementation, which included upgrading our Enterprise Resource Planning (ERP) systems
,
and inventory management and control systems. While we believe that this and other improvements to our operational systems have the potential to reduce our expenses, increase our efficiency and enhance our ability to be competitive in the long term, we expect to continue to incur expenses to implement operational systems upgrades. Many of these expenditures have been, and may continue to be, incurred in advance of the realization of any direct benefits to our business. We cannot guarantee that we will be successful at improving our operational systems, or that our efforts will result in the anticipated benefits to us. If our operational systems upgrades are not successful, our financial condition and operating results could be adversely affected and our business may become less competitive.
In addition, our operational systems upgrades have the potential to be disruptive to our existing business operations as our managers and employees attempt to learn new software programs and control systems
,
and adapt to new
13
operating requirements, while continuing to manage and operate our business. If we are unable to successfully manage any disruption to our business caused by our operational systems upgrades, we could incur unanticipated expenses, loss of customers and harm to our reputation, any of which would harm our business.
If we are unsuccessful at managing production decisions, which are required to be made months in advance of the purchase of our products, we may inaccurately forecast our inventory requirements, which may adversely affect the image of our brands, and result in sales below our expectations.
Like other companies in the footwear industry, we have an extended design and manufacturing process, which involves the initial design of our products, the purchase of raw materials, the accumulation of inventories, the subsequent sale of the inventories, and the collection of the resulting accounts receivable. This production cycle requires us to incur significant expenses relating to the manufacturing and marketing of our products, including product development costs for new products, in advance of the realization of any revenue from the sale of our products, and results in significant liquidity requirements and working capital fluctuations throughout our fiscal year. Because the production cycle typically involves long lead times, which requires us to make manufacturing decisions several months in advance of a purchasing decision by the consumer, it may be challenging for us to estimate and manage our inventory requirements.
At the time manufacturing decisions are made, it is difficult for our management to predict and to timely adjust expenses in reaction to the following factors, which may result in order cancellations and weak consumer demand:
|
•
|
unfavorable weather patterns and their potential impacts on consumer spending patterns generally, and the demand for our products in particular;
|
|
•
|
changes in consumer preferences and fashion trends;
|
|
•
|
market acceptance of new products;
|
|
•
|
future sales and trends with our wholesale customers;
|
|
•
|
changing general economic conditions; and
|
|
•
|
the competitive environment, including pricing pressure resulting from reduced pricing of competitive products, which may cause consumers to shift their purchasing decisions away from our products.
|
The evolution of our product offerings has made these activities more challenging. If we overestimate demand for any products or styles, we may be forced to incur significant markdowns or sell excess inventories at reduced prices, which would result in lower revenues and reduced gross margins. On the other hand, if we underestimate demand for certain products or styles, or if our independent manufacturing facilities are unable to supply products in sufficient quantities, we may experience inventory shortages that may prevent us from fulfilling customer orders or result in us delaying shipments to customers. If that occurred, we could lose sales, our relationships with customers could be harmed, and our brand loyalty could be diminished.
Our financial success is influenced by the success of our customers, and the loss of a key customer could have a material adverse effect on our financial condition and results of operations.
Much of our financial success is directly related to the ability of our retailer and distributor partners to successfully market and sell our brands through to consumers. If a retailer fails to meet annual sales goals, it may be difficult to locate an acceptable substitute retailer. If a distributor fails to meet annual sales goals, it may be difficult and costly to either locate an acceptable substitute distributor or convert to a wholesale direct model. If we determine that it is necessary to make a change, we may experience increased costs, loss of customers, increased credit risk, and increased inventory risk. In addition, there is no guarantee that any replacement retailer or distributor will generate results that are more favorable than the terminated party.
We currently do not have long-term contracts with any of our retailers. We do have contracts with our distributors with terms ranging up to five years, however, while these contracts may have annual purchase minimums which must be met in order to retain the distribution rights, the distributors are not otherwise obligated to purchase our products. Sales to our retailers and distributors are generally on an order-by-order basis and are subject to rights of cancellation and rescheduling by our wholesale customers. We use the timing of delivery dates in our wholesale customer orders to forecast our sales and earnings for future periods. If any of our major customers, experience a significant downturn in business or fail to remain committed to our products or brands, these customers could postpone, reduce, or discontinue purchases from us. These risks have been exacerbated recently as our retail customers face a retail industry that continues to undergo significant structural changes fueled by technology that is altering consumer behavior.
14
As a result, we could experience a significant decline in sales, write-downs of excess inventory, or increased discounts to our customers, any of which could have a material adverse effect on our financial condition or results of operations.
Our five largest customers accounted for approximately
20.3%
of worldwide net sales for the
year ended March 31, 2017
and
21.9%
of worldwide net sales for the
year ended March 31, 2016
. Any loss of a key customer, the financial collapse or bankruptcy of a key customer, or a significant reduction in purchases from a key customer could have a material adverse effect on our financial condition and results of operations.
Failure to adequately protect our intellectual property rights, to prevent counterfeiting of our products, or to defend claims against us related to our intellectual property rights, could reduce sales and adversely affect the value of our brands.
Our business could be significantly harmed if we are not able to protect our intellectual property rights. We believe our competitive position is largely attributable to the value of our trademarks, patents, trade dress, trade names, trade secrets, copyrights and other intellectual property rights. Although we are aggressive in legal and other actions in pursuing those who infringe on our intellectual property rights, we cannot guarantee that the actions we have taken will be adequate to protect our brands in the future, especially because some countries’ laws do not protect intellectual property rights to the same extent as US laws. If we fail to adequately protect our intellectual property rights, it would allow our competitors to sell products that are similar to and directly competitive with our products, which could reduce sales of our products. In addition, any intellectual property lawsuits in which we are involved could cost a significant amount of time and money and distract management’s attention from operating our business, which may negatively impact our performance.
The success of our brands has also made us the target of counterfeiting and product imitation strategies. We continue to be vulnerable to such infringements despite our dedication of significant resources to the registration and protection of our intellectual property and to anti-counterfeiting efforts worldwide. If we fail to prevent counterfeiting or imitation of our products, we could lose opportunities to sell our products to consumers who may instead purchase a counterfeit or imitation product. In addition, if our products are associated with inferior products due to infringement by others of our intellectual property, it could adversely affect the value of our brands.
In addition to fighting intellectual property infringement, we may need to defend claims against us related to our intellectual property rights. We have faced claims that the word "ugg" is a generic term. Such a claim was successful in Australia, but similar claims have been rejected by courts in the US, China, Turkey and the Netherlands. We have also faced claims that “UGG Australia” is geographically deceptive. For example, in response to an infringement lawsuit that we filed in March 2016 against Australian Leather Pty Ltd. (Australian Leather), Australian Leather raised a number of affirmative defenses and counterclaims, including seeking declaratory judgment that the UGG brand trademark is invalid and unenforceable in the US, cancellation of certain of our US UGG brand trademark registrations, false designation of origin and declaratory judgment that certain of our US design patents are invalid and unenforceable. Any court decision or settlement of such matters that prevents trademark protection of our brands, that allows a third-party to continue to sell products similar to our products, or that allows a manufacturer or distributer to continue to sell counterfeit products, could lead to intensified competition and a material reduction in our sales.
We may not succeed in implementing our growth strategies, in which case we may not be able to take advantage of certain market opportunities and may become less competitive.
As part of our overall growth strategy, we are continually seeking out opportunities to enhance the positioning of our brands, diversify our product offerings, extend our brands into complementary product categories and markets, expand geographically, optimize our retail presence, and improve our financial performance and operational efficiency. For example, we are considering expanding our partner retail program in certain markets based on our analysis of the market opportunity and business efficiencies. In addition, as part of our international growth strategy, we may continue to transition from a third-party distribution model to a direct distribution model. Further, we are exploring relationships with third parties for the expansion of the UGG brand into different product categories, including licensee and sourcing agent arrangements. We anticipate that substantial further expansion will be required to realize our growth potential and take advantage of new market opportunities. Failure to effectively implement our growth strategy could negatively impact our revenues and rate of growth, and result in our business becoming less competitive. In addition, taking steps to implement our growth initiatives could have a number of negative effects, including increasing our working capital needs, causing us to incur costs without any corresponding benefits, and diverting management time and resources away from our existing business.
15
We face risks associated with pursuing strategic acquisitions, and our failure to successfully integrate any acquired business or products could have a material adverse effect on our results of operations and financial position.
As part of our overall strategy, we may periodically consider strategic acquisitions in order to extend our brands into complementary product categories and markets. For example, in April 2015 we acquired substantially all the assets related to the Koolaburra brand. Our ability to continue this practice depends on our ability to identify and successfully pursue suitable acquisition candidates. Acquisitions involve numerous risks, challenges and uncertainties, including the potential to:
|
•
|
expose us to risks inherent in entering a new market or geographic region;
|
|
•
|
lose significant customers or key personnel of the acquired business;
|
|
•
|
encounter difficulties managing geographically-remote operations;
|
|
•
|
divert management’s time and attention away from other aspects of our business operations;
|
|
•
|
issue equity securities to finance the acquisition, which would be dilutive to our existing stockholders;
|
|
•
|
incur indebtedness to finance the acquisition, which would result in debt service costs and potentially include covenants restricting our operations; and
|
|
•
|
incur costs relating to a potential acquisition that we fail to consummate, which we may not be able to recover.
|
Additionally, we may not be able to successfully integrate the operations of any acquired businesses into our operations, or to achieve the expected benefits of any acquisitions. Following an acquisition, we may also face cannibalization of existing product sales by our newly-acquired products, unless we adequately integrate new brands and products with our existing products, aggressively target different consumers for our newly-acquired products, and increase our overall market share. The failure to successfully integrate any acquired business or products in the future could have a material adverse effect on our results of operations and financial position.
We depend on qualified personnel and, if we are unable to retain or hire executive officers, key employees and skilled personnel, we may not be able to achieve our strategic objectives and our operating results may suffer.
To execute our growth plan, we must continue to attract and retain highly qualified personnel, including executive officers and key employees. Further, in order to continue to develop new products and successfully operate and grow our key business processes, it is important for us to continue hiring highly skilled footwear and accessory designers and information technology specialists.
Competition for executive officers, key employees and skilled personnel is intense within our industry and there continues to be upward pressure on the compensation paid to these professionals. Many of the companies with which we compete for experienced personnel have greater name recognition and financial resources than we have. If we hire employees from competitors or other companies, their former employers may attempt to assert that we or these employees have breached their legal obligations, resulting in a diversion of our time and resources. In addition, prospective and existing employees often consider the value of the stock-based compensation they receive in connection with their employment when deciding whether to take a job. If the perceived value of our stock-based compensation declines, or if the price of our stock experiences significant volatility, it may adversely affect our ability to recruit and retain qualified personnel. If we fail to attract new personnel or to retain and motivate our current personnel, our future growth prospects could be adversely affected and our business could be harmed. Further, our headquarters are located in Goleta, California, which is not generally recognized as a prominent commercial center, and it is difficult to attract qualified professionals due to our geographic location. As a result, we may have difficulty hiring and retaining qualified personnel with the skills to expand our business. If we are unable to attract and retain the personnel necessary to execute our growth plan, we may be unable to achieve our strategic objectives, our operating results may suffer and we may be unable to compete in the market.
The continued service of our executive officers and key employees is particularly important, and the hiring or departure of such personnel from time to time may disrupt our business. Our executive officers and other key employees are generally employed on an at-will basis, which means that such personnel could terminate their employment with us at any time. The loss of one or more of our executive officers or other key employees, and the often extensive process of identifying and hiring other personnel who will work effectively with our employees and lead our company to fill those key positions, could have a material adverse effect on our business.
16
Additionally, as part of our efforts to improve overall efficiency and competitiveness of our business, we have added new leadership both within our brands and to our Omni-Channel platform, including the President of Fashion Lifestyle and the President of Performance Lifestyle, as well as streamlining and restructuring our existing personnel and brand management. If we fail to effectively implement these management and personnel changes, we may be unable to achieve our strategic objectives and operating efficiencies.
Our corporate culture has contributed to our success and, if we cannot maintain this culture as we grow, we could lose the passion, creativity, teamwork, focus and innovation fostered by our culture.
We believe that our culture has been and will continue to be a key contributor to our success. If we do not continue to develop our corporate culture or maintain our culture and core values over time, we may be unable to foster the passion, creativity, teamwork, focus and innovation that we believe have contributed to the growth and success of our business. Any failure to preserve our culture could negatively affect our ability to recruit and retain personnel and to effectively focus on and pursue our strategic objectives. As we continue to pursue our goals and implement new strategies, we may find it difficult to maintain our corporate culture.
We rely upon a number of warehouse and distribution facilities to operate our business, and any damage to one of these facilities, or any disruptions caused by incorporating new facilities into our operations, could have a material adverse impact on our business.
We rely upon a broad network of warehouse and distribution facilities in order to store, sort, package and distribute our products both domestically and internationally. In the US, we distribute products through self-managed distribution centers in Camarillo and Moreno Valley, California. These distribution centers feature a complex warehouse management system that enables us to efficiently pack products for direct shipment to customers. However, we could face a significant disruption in our domestic distribution center operations if our warehouse management system does not perform as anticipated or ceases to function for an extended period of time, which could occur as a result of damage to the facility, failure of certain equipment, power outages or software problems. If our domestic distribution center operations are impeded for any reason, it could result in shipment delays or the inability to deliver product at all, which would result in lost sales, strain our relationships with customers, and cause harm to our reputation, any of which could have a material adverse impact on our business.
Internationally, we distribute our products through a number of distribution centers managed by 3PLs. We depend on these 3PLs to manage the operation of their distribution centers as necessary to meet our business needs. If the 3PLs fail to manage these responsibilities, our international distribution operations could face significant disruptions. For example, in the second quarter of fiscal year 2017, we experienced a delay in shipments from our European 3PL that impacted sales. The loss of, or disruption to the operations of, any one or more of these facilities, whether due to natural disasters, the outbreak of hostilities, work stoppages, or other adverse events, could materially adversely impact our sales, business performance and operating results.
We rely on independent manufacturers for most of our production needs, and the failure of these manufacturers to manage these responsibilities would prevent us filling customer orders, which would result in loss of sales and harm our relationships with customers.
We rely on independent manufacturers and their respective material suppliers for most of our production needs, although we do not have direct control over the manufacturers or their suppliers. We depend on these independent manufacturers for a number of functions that are critical to our operations, including financing the production of goods ordered, maintaining manufacturing capacity, complying with our restricted substances policy and storing finished goods in a safe location pending shipment. If the independent manufacturers fail to manage these responsibilities, we may be unable to obtain timely delivery of products in sufficient quantities that meet our quality standards. In that event, we may not be able to fill customer orders, which would result in lost sales and harm to our relationships with customers.
We do not currently have long-term contracts with these independent manufacturers, and so are not assured of a long-term, uninterrupted supply of acceptable quality and competitively-priced products from them. While we do have long-standing relationships with most of these independent manufacturers, any of them may unilaterally terminate their relationship with us at any time, seek to increase the prices they charge us, or extract other concessions from us. In the event of a termination of an existing relationship with a manufacturer, we may not be able to substitute alternative manufacturers that are capable of providing products or services of a comparable quality, at an acceptable price, or on a timely basis. If we must find alternative manufacturers, we would likely experience increased costs, as well as substantial disruption to our business, which could result in a loss of sales and earnings.
17
Interruptions in the supply of our products can also result from adverse events that impair the operations of our manufacturers. We keep proprietary materials that are required for the production of our products, such as shoe molds, knives, and raw materials, under the custody of our independent manufacturers. If these independent manufacturers were to experience loss or damage to these proprietary materials, whether as a result of natural disasters, outbreak of hostilities or other adverse events, we cannot be assured that the manufacturers would have adequate insurance to cover such loss or damage, and, in any event, the replacement of such materials would likely result in significant delays in the production of our products, which could result in a loss of sales and earnings.
Most of our independent manufacturers are located outside of the US, where we are subject to the risks associated with international commerce.
Most of our independent manufacturers are in Asia. Foreign manufacturing is subject to numerous risks and uncertainties, including the following:
|
•
|
tariffs, import and export controls, and other non-tariff barriers such as quotas and local content rules on raw materials and finished products;
|
|
•
|
increasing transportation costs and a limited supply of international shipping capacity;
|
|
•
|
delays during shipping, at the port of entry or at the port of departure;
|
|
•
|
increasing labor costs and labor disruptions;
|
|
•
|
poor infrastructure and shortages of equipment, which can disrupt transportation and utilities;
|
|
•
|
restrictions on the transfer of funds from foreign jurisdictions;
|
|
•
|
changing economic and market conditions;
|
|
•
|
changes in governmental policies and regulations including intellectual property, labor, safety, and environmental regulations;
|
|
•
|
refusal to adopt or comply with our Supplier Code of Conduct, Conflict Minerals Policy and Restricted Substances Policy;
|
|
•
|
customary business traditions in China and Vietnam such as local holidays, which are traditionally accompanied by high levels of turnover in the factories;
|
|
•
|
decreased scrutiny by custom officials for counterfeit products;
|
|
•
|
political instability, which can interrupt commerce, including acts of war and other external factors, over which we have no control;
|
|
•
|
heightened terrorism security concerns, which could subject imported or exported products to more frequent or more lengthy inspections;
|
|
•
|
use of unauthorized or prohibited materials or reclassification of materials;
|
|
•
|
disease epidemics and health-related concerns that could result in a reduced workforce or scarcity of raw materials;
|
|
•
|
disruptions at manufacturing or distribution facilities caused by natural or other disasters; and
|
|
•
|
adverse changes in consumer perception of goods, trade, or political relations with China or Vietnam.
|
These risks and uncertainties, or others of which we are currently unaware, could interfere with the manufacture or shipment of our products by our independent manufacturers. This could make it more difficult to obtain adequate supplies of quality products when we need them, which could negatively impact our sales and earnings.
While we require that our independent manufacturers adhere to environmental, labor, ethical, health, safety, and other standard business practices and applicable local laws, and while we periodically visit and audit their operations, we do not control their business practices. If we discovered non-compliant manufacturers or suppliers that cannot or will not become compliant, we would cease dealing with them, which could increase our costs and cause us to suffer an interruption in our product supply chain. In addition, the manufacturers’ violations of such standards and laws could result in negative publicity, which could damage our reputation and the value of our brands.
We conduct business outside the US, which exposes us to foreign currency exchange rate risk, and could have a negative impact on our financial results.
We operate on a global basis, with approximately
36.2%
of our net sales for the
year ended March 31, 2017
from operations outside the US. As we continue to increase our international operations, our sales and expenditures in foreign currencies become more material and subject to foreign currency exchange rate fluctuations. A significant portion of our international operating expenses are paid in local currencies. Also, our foreign distributors sell in local currency, which impacts the price to foreign consumers. Many of our subsidiaries operate with their local currency as
18
their functional currency. Future foreign currency exchange rate fluctuations and global credit markets may cause changes in the US dollar value of our purchases or sales and materially affect our sales, profit margins, or results of operations, when converted to US dollars. Changes in the value of the US dollar relative to other currencies could result in material foreign currency exchange rate fluctuations or the US dollar value of transactions and, as a result, our net earnings could be materially adversely affected.
We currently utilize foreign currency exchange rate contracts or other derivative instruments for the amounts we expect to purchase and sell in foreign currencies to mitigate exposure to foreign currency exchange rate fluctuations. As we continue to expand international operations and increase purchases and sales in foreign currencies, we will evaluate and may utilize additional derivative instruments, as needed, to hedge our foreign currency exchange rate risk. Our hedging strategies depend on our forecasts of sales, expenses, and cash flows, which are inherently subject to inaccuracies. Therefore, our hedging strategies may be ineffective. In addition, the failure of financial institutions that underwrite our foreign currency exchange rate contracts may negate our efforts to hedge our foreign currency exchange rate risk and result in material foreign currency exchange rate or hedge contract losses. Foreign currency exchange rate hedges, transactions, re-measurements or translations could materially impact our consolidated financial statements.
Labor disruptions could negatively impact our results of operations and financial position.
Our business depends on our ability to source and distribute products in a timely manner. Labor dispute
s
that affect the operations of our independent manufacturers, tanneries, transportation carriers, retail stores or distribution centers create significant risks for our business, particularly if these disputes result in work slowdowns, lockouts, strikes or similar disruptions. For example, in recent years, labor disputes at US shipping ports have impacted the delivery of our products. Any such disruptions may have a material adverse effect on our business by potentially resulting in cancelled orders by customers, unanticipated inventory accumulation, and increased transportation and labor costs, each of which may negatively impact our results of operations and financial position.
Our sales in international markets are subject to a variety of legal, regulatory, political, cultural and economic risks that may adversely impact our operating results in certain regions
.
Our ability to capitalize on growth in new international markets and to maintain the current level of operation in our existing international markets is subject to risks associated with international operations that could adversely affect our sales and operating results. These risks include:
|
•
|
foreign currency exchange rates fluctuations, which impact the prices at which products are sold to international consumers;
|
|
•
|
limitations on our ability to move currency out of international markets;
|
|
•
|
burdens of complying with a variety of foreign laws and regulations, which may change unexpectedly, and the interpretation and application of which are uncertain;
|
|
•
|
legal costs and penalties related to defending allegations of non-compliance with foreign government policies, laws and regulations;
|
|
•
|
inability to import products into a foreign country;
|
|
•
|
changes in US and foreign tax laws;
|
|
•
|
complications due to lack of familiarity with local customs;
|
|
•
|
difficulties associated with promoting and marketing products in unfamiliar cultures;
|
|
•
|
political instability;
|
|
•
|
changes in diplomatic and trade relationships between the US and other countries; and
|
|
•
|
general economic fluctuations in specific countries or markets.
|
International trade and import regulations may impose unexpected duty costs or other non-tariff barriers to markets while the increasing number of free trade agreements has the potential to stimulate increased competition; security procedures may cause significant delays
.
Products manufactured overseas and imported into the US and other countries are subject to import duties. While we have implemented internal measures to comply with applicable customs regulations and to properly calculate the import duties applicable to imported products, customs authorities may disagree with our claimed tariff treatment for certain products, resulting in unexpected costs that may not have been factored into the sales price of such products and our forecasted gross margins.
19
We cannot predict whether future domestic laws, regulations or trade remedy actions or international agreements may impose additional duties or other restrictions on the importation of products from one or more of our sourcing venues. Such changes could increase the cost of our products, require us to withdraw from certain restricted markets, or change our business methods and could make it difficult to obtain products of our customary quality at a competitive price. Meanwhile, the continued negotiation of bilateral and multilateral free trade agreements by the US and our other market countries with countries other than our principal sourcing venues may stimulate competition from manufacturers in these other sourcing venues, which now export, or may seek to export, footwear and accessories to our target markets at preferred rates of duty, which may have an effect on our sales and operations.
Additionally, the increased threat of terrorist activity, and law enforcement responses to this threat, have required greater levels of inspection of imported goods and have caused delays in bringing imported goods to market. Any tightening of security procedures, for example, in the aftermath of a terrorist incident, could worsen these delays and increase our costs.
Key business processes and supporting information systems could be interrupted and such interruption could adversely affect our business
.
Our future success and growth depend on the continued operation of our key business processes, including information systems, global communications, the internet, and key personnel. Hackers and computer viruses have disrupted operations at many major companies. We may be vulnerable to similar acts of sabotage. Key processes could also be interrupted by a failure due to weather, natural disaster, power loss, telecommunications failure, failure of our computer systems, sabotage, terrorism, or similar event such that:
|
•
|
critical business systems become inoperable or require significant costs to restore;
|
|
•
|
key personnel are unable to perform their duties, communicate, or access information systems;
|
|
•
|
significant quantities of merchandise are damaged or destroyed;
|
|
•
|
we are required to make unanticipated investment in state-of-the-art technologies and security measures;
|
|
•
|
key wholesale and distributor customers cannot place or receive orders;
|
|
•
|
E-Commerce customer orders may not be received or fulfilled;
|
|
•
|
confidential information about our customers may be misappropriated or lost damaging our reputation and customer relationships;
|
|
•
|
we are exposed to unanticipated liabilities; or
|
|
•
|
carriers cannot ship or unload shipments.
|
Interruptions to key business processes could have a material adverse effect on our business and operations and result in lost sales and reduced earnings.
Furthermore, we rely on certain information technology management and ERP systems to prepare sales forecasts, track our financial and operating results, and otherwise operate our business. As our business grows and we expand into additional distribution channels and geographic regions, these systems may require expansion or modification. We may experience difficulties expanding these information technology and resource planning systems or transitioning to new or upgraded systems, which may result in loss of data or unreliable data, decreases in productivity as our personnel become familiar with and adapt to the new systems, and increased costs for the implementation of the new or upgraded systems. If we are unable to modify our information technology or resource planning systems to respond to changes in our business needs, or if we experience a failure or interruption in these systems, our ability to accurately forecast sales, report our financial and operating results, or otherwise operate our business could be adversely affected.
20
The loss, theft or misuse of sensitive customer or our related information, could damage our relationships with customers, harm our reputation, expose us to litigation and adversely affect our business
.
Our business involves the storage and transmission of sensitive information, including the personal information of our customers, credit card information, employee information, data relating to customer preferences, and our proprietary financial and strategic data. The protection of our customer, employee and our data is vitally important to us as the loss, theft or misuse of such information could lead to significant reputation or competitive harm, litigation and potential liability. As a result, we believe that our future success and growth depends, in part, on the ability of our key business processes, including our information and global communication systems, to prevent the theft, loss or misuse of this sensitive information. However, as with many businesses, we are subject to numerous security and cybersecurity risks which may prevent us from maintaining the privacy of sensitive information and require us to expend significant resources attempting to secure such information.
As has been well documented in the media, hackers and computer viruses have disrupted operations at many major companies, and we may be vulnerable to similar security breaches. While we have expended, and will continue to expend, resources to protect our customers and ourselves against these breaches and to ensure an effective response to a security or cybersecurity breach, we cannot be certain that we will be able to adequately defend against any such breach. Techniques used to obtain unauthorized access to attack systems are constantly evolving and, in some cases, becoming more sophisticated and harder to detect. Despite our efforts, we may be unable to anticipate these techniques or implement adequate preventive measures in response, and any breaches that we do not detect may remain undetected for some period. In addition, measures that we do take to prevent risks of fraud and security breaches have the potential to harm relationships with our customers or suppliers, or decrease activity on our websites by making them more difficult to use or restricting the ability to meet our customers' expectations in terms of their online shopping experience.
Any failure to maintain the security of our customers’ sensitive information, or data belonging to our suppliers, could put us at a competitive disadvantage, result in deterioration of our customers’ confidence in our brands, and subject us to potential litigation, liability, fines and penalties. While we maintain insurance coverage that may, subject to policy terms and conditions, cover certain aspects of cyber risks, such insurance coverage may be insufficient to cover all losses and would not remedy damage to our reputation. In addition, employees may intentionally or inadvertently cause data or security breaches that result in unauthorized release of personal or confidential information. In such circumstances, we could be held liable to our customers, suppliers, employees or other parties, or be subject to regulatory or other actions for breaching privacy laws or failing to adequately protect such information or respond to a breach. This could result in costly investigations and litigation, civil or criminal penalties, operational changes and negative publicity that could adversely affect our reputation and our results of operations and financial condition.
We are also subject to payment card association rules and obligations under our contracts with payment card processors. Under these rules and obligations, if information is compromised, we could be liable to payment card issuers for associated expenses and penalties. In addition, if we fail to follow payment card industry security standards, even if customer information is never compromised, we could incur significant fines or experience a significant increase in payment card transaction costs.
Our revolving credit facility agreements expose us to certain risks.
From time to time, we have financed our liquidity needs in part from borrowings made under our revolving credit facilities. Our revolving credit facility agreements also contain a number of customary financial covenants and restrictions, which may restrict our ability to engage in transactions that would otherwise be in our best interests. Failure to comply with any of the covenants could result in a default. A default under any of our revolving credit facility agreements could cause the lenders party thereto to accelerate the timing of payments and exercise their liens on our assets, which would have a material adverse effect on our business, operations, financial condition and liquidity. In addition, we do not currently anticipate hedging against borrowings under the revolving credit facilities because the facilities bear interest at variable interest rates. Any increases in interest rates would increase our cost of borrowing, resulting in a decline in our net income and cash flow.
21
We have a revolving credit facility agreement with JPMorgan Chase Bank, National Association as the administrative agent, Comerica and HSBC as co-syndication agents, and the lenders party hereto (as amended, Domestic Credit Facility), which provides for a committed revolving line of credit of up to an aggregate of
$400,000
. Our obligations under our Domestic Credit Facility are guaranteed by our existing and future wholly-owned domestic subsidiaries (subject to certain exceptions) and are secured by a first-priority security interest in substantially all of our and those subsidiaries' assets, including all or a portion of the equity interests of certain of our domestic and first-tier foreign subsidiaries. As of
March 31, 2017
, we had no outstanding borrowings under our Domestic Credit Facility with debt capacity of
$378,000
out of
$400,000
, due to limitations on consolidated worldwide borrowings under the terms of the Domestic Credit Facility.
In addition, we have a revolving credit facility in China (as amended, China Credit Facility), which provides for an uncommitted revolving line of credit of up to an aggregate of CNY
300,000
, or approximately
$44,000
. As of
March 31, 2017
, we had no outstanding borrowings under our China Credit Facility.
In addition, we have a revolving credit facility in Japan (Japan Credit Facility), which provides for an uncommitted revolving line of credit of up to an aggregate of JPY
5,500,000
, or approximately
$49,000
. As of
March 31, 2017
, we had no outstanding borrowings under our Japan Credit Facility.
The tax laws applicable to our business are very complex and we may be subject to additional tax liabilities as a result of audits by various taxing authorities or changes in tax laws applicable to our business.
We conduct our operations through subsidiaries in several countries, including, but not limited to, the US, the UK, Japan, China, Hong Kong, Macau, the Netherlands, Bermuda, France, Germany, and Canada. As a result, we are subject to tax laws and regulations in each of those jurisdictions, and to tax treaties between the US and those countries. These tax laws are highly complex, and significant judgment and specialized expertise is required in evaluating and estimating our worldwide provision for income taxes.
We are subject to audits in each of the various jurisdictions where we conduct business, and any of these jurisdictions may assess additional taxes against us as a result of these audits. Although we believe our tax estimates are reasonable, and we undertake to prepare our tax filings in accordance with all applicable tax laws, the final determination with respect to any tax audits, and any related litigation, could be materially different from our estimates or from our historical tax provisions and accruals. The results of an audit or litigation could have a material adverse effect on our operating results or cash flows in the periods for which that determination is made, and may require a restatement of prior financial reports. In addition, future period earnings may be adversely impacted by litigation costs, settlement payments, or interest or penalty assessments.
We are also subject to constant changes in tax laws, regulations and treaties in and between the nations in which we operate. Our tax expense is based upon our interpretation of the tax laws in effect in various countries at the time that the expense was incurred. A change in these tax laws, treaties or regulations, or in the interpretation thereof, could result in a materially higher tax expense or a higher effective tax rate on our worldwide earnings. In addition, it is possible that tax proposals could result in changes to the existing US tax laws that affect us, although we are unable to predict whether any proposals will ultimately be enacted. Any changes in tax laws, treaties or regulations could increase our income tax liability and adversely affect our net income and long term effective tax rates.
We may incur disruption, expense, and potential liability associated with existing and future litigation.
We are involved in various claims, litigation and other legal and regulatory proceedings and governmental investigations that arise from time to time in the ordinary course of our business. Due to the inherent uncertainties of litigation and other such proceedings and investigations, we cannot predict with accuracy the ultimate outcome of any such matters. An unfavorable outcome could have a material adverse impact on our business, financial position, and results of operations. The amount of insurance coverage we maintain to address such matters may be inadequate to cover these or other claims. In addition, any significant litigation, investigation, or proceeding, regardless of its merits, could divert financial and management resources that would otherwise be used to benefit our operations or could negatively impact our reputation in the marketplace.
22
Regulations related to "conflict minerals" may cause us to incur additional expenses and could limit the supply and increase the cost of certain metals used in manufacturing our products.
The SEC has adopted a rule requiring disclosures by public companies of specified minerals, known as conflict minerals, that are necessary to the functionality or production of products manufactured or contracted to be manufactured. The rule requires companies to perform a reasonable country of origin inquiry, and to annually report to the SEC whether or not such minerals originate from the Democratic Republic of Congo or an adjoining country. The rule could affect sourcing at competitive prices and availability in sufficient quantities of certain minerals used in the manufacture of our products. The number of suppliers who provide conflict-free minerals may be limited. In addition, there may be material costs associated with complying with the disclosure requirements, such as costs related to determining the source of certain minerals used in our products, as well as costs of possible changes to products, processes, or sources of supply as a consequence of such verification activities. Within our supply chain, we may not be able to sufficiently verify the origins of the relevant minerals used in our products through the due diligence procedures that we implement, which may harm our reputation. We file a Form SD, Specialized Disclosure Report, on or about May 31st each year.
Our common stock price has been volatile, which could result in substantial losses for stockholders
.
Our common stock is traded on the New York Stock Exchange (NYSE) under the symbol “DECK”. The trading price of our common stock has been and may continue to be volatile. The closing prices of our common stock, as reported by the NYSE, have ranged from $44.99 to $68.57 for the 52-week period ended
May 12, 2017
. The trading price of our common stock could be affected by a number of factors, including, but not limited to the following:
|
•
|
changes in expectations of our future performance, whether realized or perceived;
|
|
•
|
changes in estimates by securities analysts or failure to meet such estimates;
|
|
•
|
changes in our stockholder base or public actions taken by investors;
|
|
•
|
announcements related to our review of a broad range of strategic alternatives;
|
|
•
|
published research and opinions by securities analysts and other market forecasters;
|
|
•
|
quarterly fluctuations in our sales, margins, expenses, and financial results;
|
|
•
|
the financial results and liquidity of our customers;
|
|
•
|
claims brought against us by a regulatory agency or our stockholders;
|
|
•
|
announcements to repurchase our common stock;
|
|
•
|
the declaration of stock or cash dividends;
|
|
•
|
general market and economic conditions;
|
|
•
|
consumer confidence;
|
|
•
|
broad market fluctuations in volume and price; and
|
|
•
|
a variety of risk factors, including the ones described elsewhere in this Annual Report on Form 10-K and in our other filings with the SEC.
|
In addition, the stock market in general has experienced extreme price and volume fluctuations that have often been unrelated or disproportionate to the operating performance of individual companies. Accordingly, the price of our common stock is volatile and any investment in our stock is subject to risk of loss. These broad market and industry factors and other general macroeconomic conditions unrelated to our financial performance may also affect our common stock price.
Changes in economic conditions may adversely affect our financial condition and results of operations.
Volatile economic conditions and general changes in the market have affected, and will likely continue to affect, consumer spending generally and the buying habits and preferences of consumers. A significant portion of the products we sell, especially those sold under the UGG brand, are considered to be luxury retail products. The purchase of these products by consumers is largely discretionary, and is therefore highly dependent upon the level of consumer spending, particularly among affluent consumers. Sales of these products may be adversely affected by factors such as uncertain or worsening economic conditions, increases in consumer debt levels, or a decline in consumer confidence. During an actual or perceived economic downturn, fewer consumers may shop for our products, and those who do shop may limit the amount of their purchases or substitute less costly products for our products. As a result, we could be required to reduce the price we can charge for our products or increase our marketing and promotional expenses to generate additional demand for our products. In either case, these changes could reduce our sales and gross margins, which could have a material adverse effect on our financial condition and results of operations.
23
We sell a large portion of our products through higher-end specialty and department store retailers. The businesses of these retailer customers may be impacted by factors such as changes in economic conditions, reduced customer demand for luxury products, and decreases in available credit. If these or other factors result in financial difficulties or insolvency for our retail customers, such pressures would have an adverse impact on our estimated allowances and reserves, and potentially result in us losing key customers.
Furthermore, economic factors such as increased transportation costs, inflation, higher costs of labor, and higher insurance and healthcare costs may increase our cost of sales and our operating expenses.
Anti-takeover provisions contained in our Amended and Restated Certificate of Incorporation and Amended and Restated Bylaws, as well as provisions of Delaware law, could impair a takeover attempt.
Our Amended and Restated Certificate of Incorporation and Amended and Restated Bylaws contain provisions that could have the effect of rendering more difficult hostile takeovers, change-in-control transactions or changes in our Board of Directors or management. Among other things, these provisions:
|
•
|
authorize the issuance of preferred stock with powers, preferences and rights that may be senior to our common stock, which can be created and issued by our Board of Directors without prior stockholder approval;
|
|
•
|
provide that the number of directors will be fixed by the affirmative vote of a majority of the whole Board of Directors;
|
|
•
|
provide that board vacancies can only be filled by directors;
|
|
•
|
prohibit stockholders from acting by written consent without holding a meeting of stockholders;
|
|
•
|
require the vote of holders of not less than 66 2/3% of the voting stock then outstanding to approve amendments to our Amended and Restated Certificate of Incorporation and Amended and Restated Bylaws; and
|
|
•
|
require advance written notice of stockholder proposals and director nominations.
|
As a Delaware corporation, we are also subject to provisions of Delaware law, including Section 203 of the Delaware General Corporation Law, which may delay, deter or prevent a change-in-control transaction. Section 203 imposes certain restrictions on mergers, business combinations and other transactions between us and holders of 15% or more of our common stock.
Any provision of Delaware law, our Amended and Restated Certificate of Incorporation, or our Amended and Restated Bylaws, that has the effect of rendering more difficult, delaying, deterring or preventing a change-in-control transaction could limit the opportunity for our stockholders to receive a premium for their shares of our common stock, and could also affect the price that some investors are willing to pay for our common stock.
We do not expect to declare any dividends in the foreseeable future.
We have never declared or paid any cash dividends on our existing common stock. We do not anticipate declaring or paying any cash dividends to holders of our common stock in the foreseeable future and intend to retain all future earnings for the growth of our business. Consequently, investors may need to rely on sales of our common stock after price appreciation, which may never occur, as the only way to realize any future gains on their investment. Investors should not purchase our common stock with the expectation of receiving cash dividends.
Our reported financial results may be adversely affected by changes in accounting principles generally accepted in the United States.
United States generally accepted accounting principles are subject to interpretation by the Financial Accounting Standards Board, the SEC and various bodies formed to promulgate and interpret appropriate accounting principles. A change in these principles or interpretations could have a significant impact on our reported financial results, and could affect the reporting of transactions completed before the announcement of a change.
24
Our corporate headquarters are located in Goleta, California. The construction of our 14-acre corporate headquarters in Goleta, California was substantially completed in January 2014. In April 2016, we completed the acquisition of 3.7 acres of land adjacent to our corporate headquarters to accommodate future expansion.
We have two US distribution centers in California. We began operating our distribution center in Moreno Valley in the fourth quarter of fiscal year 2015 and continue to operate our distribution center in Camarillo. Our international distribution centers, located in Canada, China, Hong Kong, Japan, the Netherlands and the UK are managed by 3PLs.
We also have offices in China, Hong Kong and Vietnam to oversee the quality and manufacturing standards of our products, an office in Macau to coordinate logistics, offices in China, Hong Kong and Japan to coordinate sales and marketing efforts, and offices in France, Germany, the Netherlands and the UK to oversee European sales, operations and administration.
At March 31, 2017
, we had 55 retail stores in the US ranging from approximately 1,000 to 9,000 square feet. Internationally, we had 105 retail stores in Austria, Belgium, Canada, China, France, Hong Kong, Germany, Japan, the Netherlands, Switzerland and the UK. Our E-Commerce operations are in the US, China, Japan, the UK and many other European countries. We have no manufacturing facilities, as all of our products are manufactured by independent third party contractors.
Other than our corporate headquarters, we lease our facilities from unrelated parties. With the exception of our DTC business facilities, our facilities are attributable to multiple reportable operating segments of our business and are not allocated to our reportable operating segments. We believe our space is adequate for our current needs and that suitable additional or substitute space will be available to accommodate the foreseeable expansion of our business and operations.
The following table provides details regarding our significant physical properties at
March 31, 2017
:
|
Facility Location
|
Description
|
Lease or Own
|
Facility Size (Square Footage)
|
|
|||
|
Moreno Valley, California
|
Warehouse Facility
|
Lease
|
794,000
|
|
|||
|
Camarillo, California
|
Warehouse Facility
|
Lease
|
723,000
|
|
|||
|
Goleta, California
|
Corporate Offices
|
Own
|
185,000
|
|
|||
25
As part of our policing program for our intellectual property rights, from time to time, we file lawsuits in the US and abroad asserting claims for alleged acts of trademark counterfeiting, trademark infringement, patent infringement, trade dress infringement and trademark dilution, under applicable laws. At any given point in time, we may have a number of such actions pending. These actions often result in seizure of counterfeit merchandise or out of court settlements with defendants or both. From time to time, we are subject to claims where opposing parties will raise, either as affirmative defenses or as counterclaims, the invalidity or unenforceability of certain of our intellectual property rights, including allegations that our UGG brand trademark registrations and design patents are invalid or unenforceable. We also are aware of many instances throughout the world in which a third-party is using our UGG trademarks within its internet domain name, and we have discovered and are investigating several manufacturers and distributors of counterfeit UGG brand products.
On March 28, 2016, we filed a lawsuit alleging trademark infringement, patent infringement, unfair competition and violation of deceptive trade practices in the United States District Court for the Northern District of Illinois Eastern Division against Australian Leather. In response, Australian Leather raised a number of affirmative defenses and counterclaims, including seeking declaratory judgment that the UGG brand trademark is invalid and unenforceable in the US, cancellation of certain of our US UGG brand trademark registrations, false designation of origin and declaratory judgment that certain of our US design patents are invalid and unenforceable. The counterclaims seek declaratory judgment, an injunction, cancellation of certain of our US trademark registrations, compensatory damages, attorneys' fees and other relief. We believe the counterclaims are without merit and intend to defend the counterclaims vigorously. While we believe there is no legal basis for liability, a judgment invalidating the UGG brand trademark would have a material adverse effect on our business. Further, due to uncertainty surrounding the litigation process, we are unable to reasonably estimate a range of loss, if any, at this time.
Although we are subject to other routine legal proceedings from time to time in the ordinary course of business, including employment, intellectual property and product liability claims, we believe that the outcome of all pending legal proceedings in the aggregate will not have a material adverse effect on our business or our consolidated financial statements.
26
References in this Annual Report on Form 10-K to "Deckers", "we", "our", "us", or the "Company" refer to Deckers Outdoor Corporation, together with its consolidated subsidiaries.
Certain reclassifications were made for all prior periods presented including the years ended March 31, 2016 and 2015, the quarter ended March 31, 2014 (transition period) and the years ended December 31, 2013 and 2012, to conform to the current period presentation.
Unless otherwise specifically indicated, all amounts in Items 5, 6, 7 and 7A herein are expressed in thousands, except for share data and store count. The defined periods for the fiscal years ended March 31, 2017, 2016 and 2015 are stated herein as "year ended" or "years ended".
Our common stock is traded on the New York Stock Exchange (NYSE) under the symbol "DECK". Prior to May 5, 2014, our common stock was traded on the NASDAQ Global Select Market under the symbol "DECK".
The following table shows the range of low and high closing sale prices per share of our common stock, based on the last daily sale, for the periods indicated.
|
Common Stock
Price Per Share
|
|||||||
|
Low
|
High
|
||||||
|
Year Ended March 31, 2017
|
|||||||
|
Fourth Quarter
|
$
|
44.99
|
|
$
|
60.98
|
|
|
|
Third Quarter
|
50.76
|
|
64.80
|
|
|||
|
Second Quarter
|
56.99
|
|
68.57
|
|
|||
|
First Quarter
|
48.89
|
|
59.25
|
|
|||
|
Year Ended March 31, 2016
|
|||||||
|
Fourth Quarter
|
$
|
42.27
|
|
$
|
60.55
|
|
|
|
Third Quarter
|
46.30
|
|
62.16
|
|
|||
|
Second Quarter
|
56.75
|
|
74.37
|
|
|||
|
First Quarter
|
68.15
|
|
76.58
|
|
|||
At
May 12, 2017
, we had approximately 48 stockholders of record based upon the records of our transfer agent, which does not include beneficial owners of our common stock whose shares are held in the names of various securities brokers, dealers and registered clearing agencies.
We did not sell any equity securities during the
year ended March 31, 2017
that were not registered under the Securities Act of 1933, as amended (Securities Act).
Stock
Performance Graph
Below is a graph comparing the percentage change in the cumulative total stockholder return on our common stock against the cumulative total return of the NYSE Composite Index, and the S&P 500 Apparel, Accessories & Luxury Goods Index for the five-year period commencing
December 31, 2011
and ending
March 31, 2017
, excluding the transition period for the quarter ended
March 31, 2014
. The data represented below assumes one hundred dollars invested in each share of our common stock, the NYSE Composite Index and the S&P 500 Apparel, Accessories & Luxury Goods Index on January 1, 2012.
The stock performance graph shall not be deemed incorporated by reference by any general statement incorporating by reference this Annual Report on Form 10-K into any filing under the Securities Act, or under the Securities Exchange Act of 1934, as amended (Exchange Act), except to the extent that we specifically incorporate this information by reference, and shall not otherwise be deemed filed under either of the Securities Act or Exchange
27
Act. Total return assumes reinvestment of dividends, of which we have not declared or paid any cash dividends on our common stock since our inception.
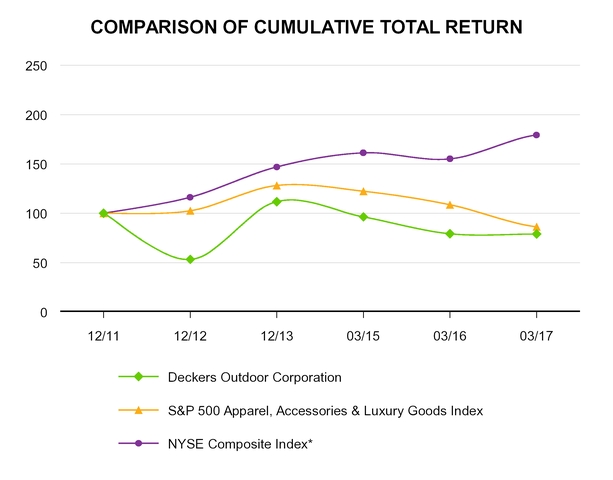
The following table assumes $100 invested on January 1, 2012 and assumes dividends are reinvested.
|
Years Ended December 31,
|
Years Ended March 31,
|
||||||||||||||||||||||
|
2011
|
2012
|
2013
|
2015
|
2016
|
2017
|
||||||||||||||||||
|
Deckers Outdoor Corporation
|
$
|
100.0
|
|
$
|
53.3
|
|
$
|
111.8
|
|
$
|
96.4
|
|
$
|
79.3
|
|
$
|
79.0
|
|
|||||
|
S&P 500 Apparel, Accessories & Luxury Goods Index
|
100.0
|
|
102.6
|
|
128.2
|
|
122.4
|
|
108.7
|
|
86.3
|
|
|||||||||||
|
The NYSE Composite Index*
|
100.0
|
|
116.3
|
|
147.0
|
|
161.3
|
|
155.2
|
|
179.4
|
|
|||||||||||
*The NYSE Composite Index is an index that measures the performance of all stocks listed on the NYSE.
Dividend Policy
We have not declared or paid any cash dividends on our common stock since our inception. We currently do not anticipate declaring or paying any cash dividends in the foreseeable future. Our current revolving credit agreements allows us to make cash dividends, provided that no event of default has occurred or is continuing, and provided that our total adjusted leverage ratio does not exceed
2.75
to
1.00
on a pro-forma basis.
At March 31, 2017
, we were in compliance with this provision and we remain in compliance as of
May 30, 2017
.
28
Stock Repurchase Program
In June 2012, we approved a stock repurchase program to repurchase up to
$200,000
of our common stock in the open market or in privately-negotiated transactions, subject to market conditions, applicable legal requirements, and other factors. The program did not obligate us to acquire any particular amount of common stock and the program may have been suspended at any time at our discretion. At February 28, 2015, we had repurchased the full
$200,000
amount authorized under the program through the repurchase of approximately
3,823,000
shares, at an average price of
$52.31
per share.
In January 2015, we approved a new stock repurchase program to repurchase up to
$200,000
of our common stock, which included the same stipulations as the purchase program approved in June 2012, as described above. Since inception through
March 31, 2017
, we had repurchased approximately
2,020,000
shares under this program for approximately
$134,706
, or an average price of
$66.69
per share, leaving the remaining approved amount at approximately
$65,294
. Refer to Note 8, "Stockholders' Equity", to our consolidated financial statements in Part IV of this Annual Report on Form 10-K for further information on repurchases of our common stock.
The following table summarizes the activity under our January 2015 stock repurchase program during the year ended
March 31, 2017
:
|
Total number
of shares purchased* (in thousands) |
Average price
paid per share |
Approximate dollar
value of shares
added/(purchased)
|
Approximate dollar
value of shares that may yet be purchased |
|||||||||||
|
November 1, 2016 — November 30, 2016
|
222
|
|
$
|
56.51
|
|
$
|
(12,572
|
)
|
$
|
65,294
|
|
|||
*All shares were repurchased as part of a publicly-announced program in open-market transactions. The shares repurchased in November 2016 were the only shares repurchased during fiscal year 2017.
We derived the following selected consolidated financial data from our consolidated financial statements.
The financial data are derived from, and qualified by reference to, the following audited consolidated financial statements not included in this Annual Report on Form 10-K:
|
•
|
Consolidated statements of comprehensive income (loss) for the
quarter ended March 31, 2014
(transition period), and the calendar
years ended December 31, 2013
and
2012
.
|
•
Consolidated balance sheets as of
March 31, 2015
and
March 31, 2014
(transition period).
The financial data are further derived from, and qualified by reference to, the following consolidated financial statements in Part IV of this Annual Report on Form 10-K:
|
•
|
Consolidated statements of comprehensive income (loss) for the
years ended March 31, 2017
,
2016
and
2015
.
|
•
Consolidated balance sheets
as of March 31, 2017
and
2016
.
Historical results are not necessarily indicative of the results to be expected in the future. You should read the following consolidated financial information together with our consolidated financial statements in Part IV of this Annual Report on Form 10-K and the accompanying notes thereto and Part II, Item 7, "Management's Discussion and Analysis of Financial Condition and Results of Operations".
29
Change in Fiscal Year
In February 2014, our Board of Directors approved a change in our fiscal year end from December 31st to March 31st. The change was intended to better align our planning, financial and reporting functions with the seasonality of our business. The 2017, 2016 and 2015 years presented relate to the fiscal years ended
March 31, 2017
,
2016
and
2015
, respectively. The 2014 transition period relates to the
quarter ended March 31, 2014
, to coincide with the change in our fiscal year end. The 2013 and 2012 years presented relate to the calendar
years ended December 31, 2013
and
2012
.
|
Years Ended March 31,
|
Quarter Ended March 31,(transition period)
|
Years Ended December 31,
|
|||||||||||||||||||||
|
2017
|
2016
|
2015
|
2014
|
2013
|
2012
|
||||||||||||||||||
|
Income Statement Data:
|
|||||||||||||||||||||||
|
Net sales:
|
|||||||||||||||||||||||
|
UGG brand wholesale
|
$
|
826,355
|
|
$
|
918,102
|
|
$
|
903,926
|
|
$
|
83,271
|
|
$
|
818,377
|
|
$
|
819,256
|
|
|||||
|
Teva brand wholesale
|
103,694
|
|
121,239
|
|
116,931
|
|
45,283
|
|
109,334
|
|
108,591
|
|
|||||||||||
|
Sanuk brand wholesale
|
77,552
|
|
90,719
|
|
102,690
|
|
28,793
|
|
94,420
|
|
89,804
|
|
|||||||||||
|
Other brands wholesale
|
116,206
|
|
100,820
|
|
76,152
|
|
18,662
|
|
38,276
|
|
20,194
|
|
|||||||||||
|
Direct-to-Consumer
|
666,340
|
|
644,317
|
|
617,358
|
|
118,707
|
|
496,211
|
|
376,553
|
|
|||||||||||
|
Total net sales
|
1,790,147
|
|
1,875,197
|
|
1,817,057
|
|
294,716
|
|
1,556,618
|
|
1,414,398
|
|
|||||||||||
|
Cost of sales
|
954,912
|
|
1,028,529
|
|
938,949
|
|
150,456
|
|
820,135
|
|
782,244
|
|
|||||||||||
|
Gross profit
|
835,235
|
|
846,668
|
|
878,108
|
|
144,260
|
|
736,483
|
|
632,154
|
|
|||||||||||
|
Selling, general and administrative expenses
|
837,154
|
|
684,541
|
|
653,689
|
|
144,668
|
|
528,586
|
|
445,206
|
|
|||||||||||
|
(Loss) income from operations
|
(1,919
|
)
|
162,127
|
|
224,419
|
|
(408
|
)
|
207,897
|
|
186,948
|
|
|||||||||||
|
Other expense, net
|
5,067
|
|
5,242
|
|
3,280
|
|
334
|
|
2,340
|
|
2,830
|
|
|||||||||||
|
(Loss) income before income taxes
|
(6,986
|
)
|
156,885
|
|
221,139
|
|
(742
|
)
|
205,557
|
|
184,118
|
|
|||||||||||
|
Income tax (benefit) expense
|
(12,696
|
)
|
34,620
|
|
59,359
|
|
1,943
|
|
59,868
|
|
55,104
|
|
|||||||||||
|
Net income (loss)
|
5,710
|
|
122,265
|
|
161,780
|
|
(2,685
|
)
|
145,689
|
|
129,014
|
|
|||||||||||
|
Total other comprehensive (loss) income
|
(5,894
|
)
|
(89
|
)
|
(18,425
|
)
|
600
|
|
(1,243
|
)
|
330
|
|
|||||||||||
|
Comprehensive (loss) income
|
$
|
(184
|
)
|
$
|
122,176
|
|
$
|
143,355
|
|
$
|
(2,085
|
)
|
$
|
144,446
|
|
$
|
129,344
|
|
|||||
|
Net income (loss) attributable to:
|
|||||||||||||||||||||||
|
Deckers Outdoor Corporation
|
$
|
5,710
|
|
$
|
122,265
|
|
$
|
161,780
|
|
$
|
(2,685
|
)
|
$
|
145,689
|
|
$
|
129,014
|
|
|||||
|
Non-controlling interest
|
—
|
|
—
|
|
—
|
|
—
|
|
—
|
|
(148
|
)
|
|||||||||||
|
Net income (loss), excluding non-controlling interest
|
$
|
5,710
|
|
$
|
122,265
|
|
$
|
161,780
|
|
$
|
(2,685
|
)
|
$
|
145,689
|
|
$
|
128,866
|
|
|||||
|
Net income (loss) per share attributable to Deckers Outdoor Corporation common stockholders:
|
|
|
|
|
|
||||||||||||||||||
|
Basic
|
$
|
0.18
|
|
$
|
3.76
|
|
$
|
4.70
|
|
$
|
(0.08
|
)
|
$
|
4.23
|
|
$
|
3.49
|
|
|||||
|
Diluted
|
$
|
0.18
|
|
$
|
3.70
|
|
$
|
4.66
|
|
$
|
(0.08
|
)
|
$
|
4.18
|
|
$
|
3.45
|
|
|||||
|
Weighted-average common shares outstanding:
|
|
||||||||||||||||||||||
|
Basic
|
32,000
|
|
32,556
|
|
34,433
|
|
34,621
|
|
34,473
|
|
36,879
|
|
|||||||||||
|
Diluted
|
32,355
|
|
33,039
|
|
34,733
|
|
34,621
|
|
34,829
|
|
37,334
|
|
|||||||||||
30
|
As of March 31,
|
As of March 31, (transition period)
|
As of December 31,
|
|||||||||||||||||||||
|
2017
|
2016
|
2015
|
2014
|
2013
|
2012
|
||||||||||||||||||
|
Balance Sheet Data:
|
|||||||||||||||||||||||
|
Cash and cash equivalents
|
$
|
291,764
|
|
$
|
245,956
|
|
$
|
225,143
|
|
$
|
245,088
|
|
$
|
237,125
|
|
$
|
110,247
|
|
|||||
|
Working capital
|
661,770
|
|
547,267
|
|
519,051
|
|
501,647
|
|
508,786
|
|
424,569
|
|
|||||||||||
|
Total assets
|
1,191,780
|
|
1,278,068
|
|
1,169,933
|
|
1,064,204
|
|
1,259,729
|
|
1,068,064
|
|
|||||||||||
|
Long-term liabilities
|
78,474
|
|
72,099
|
|
65,379
|
|
53,140
|
|
51,092
|
|
62,246
|
|
|||||||||||
|
Stockholders' equity
|
954,255
|
|
967,471
|
|
937,012
|
|
888,849
|
|
888,119
|
|
738,801
|
|
|||||||||||
The following discussion of our financial condition and results of operations should be read together with our consolidated financial statements and the accompanying notes thereto included in Part IV of this Annual Report on Form 10-K.
Overview
We are a global leader in designing, marketing and distributing innovative footwear, apparel and accessories developed for both everyday casual lifestyle use and high performance activities. We market our products primarily under five proprietary brands: UGG, Koolaburra, Hoka, Teva, and Sanuk.
We sell our products through quality domestic and international retailers, international distributors and directly to our end-user consumers both domestically and internationally through our Direct-to-Consumer (DTC) business, which is comprised of our retail stores and E-Commerce websites. Independent third parties manufacture all of our products.
Recent Developments
Restructuring.
In February 2016, we announced the implementation of a restructuring plan, which includes a retail store fleet optimization and office consolidations, including the closure of facilities and relocation of employees to realign our brands across our Fashion Lifestyle and Performance Lifestyle groups. This restructuring plan is intended to streamline brand operations, reduce overhead costs, create operating efficiencies and improve collaboration.
In connection with these restructuring efforts, we incurred total restructuring charges of approximately
$29,100
and
$24,800
during fiscal year 2017 and 2016, respectively, with a total of approximately
$29,100
and
$22,800
recognized in selling, general and administrative (SG&A) expenses and approximately
$0
and
$2,000
recognized in cost of sales, respectively. The following table summarizes these restructuring charges by category:
|
Years Ended March 31,
|
|||||||
|
2017
|
2016
|
||||||
|
Lease termination costs
|
$
|
9,000
|
|
$
|
8,900
|
|
|
|
Retail store fixed asset impairments
|
3,600
|
|
5,800
|
|
|||
|
Severance costs
|
5,800
|
|
4,000
|
|
|||
|
Software and office fixed asset impairments
|
3,200
|
|
3,800
|
|
|||
|
Termination of various contracts and other services
|
7,500
|
|
2,300
|
|
|||
|
Total restructuring charges
|
$
|
29,100
|
|
$
|
24,800
|
|
|
31
The following table summarizes these restructuring charges by reportable operating segment:
|
Years Ended March 31,
|
|||||||
|
2017
|
2016
|
||||||
|
UGG brand wholesale
|
$
|
2,100
|
|
$
|
—
|
|
|
|
Teva brand wholesale
|
—
|
|
—
|
|
|||
|
Sanuk brand wholesale
|
100
|
|
3,000
|
|
|||
|
Other brands wholesale
|
100
|
|
2,500
|
|
|||
|
Direct-to-Consumer
|
12,900
|
|
10,500
|
|
|||
|
Unallocated overhead costs
|
13,900
|
|
8,800
|
|
|||
|
Total restructuring charges
|
$
|
29,100
|
|
$
|
24,800
|
|
|
Of the total amount incurred in fiscal year 2017,
$11,100
is accrued
as of March 31, 2017
and is expected to be paid during fiscal year 2018. Refer to Note 2, "Restructuring", to our consolidated financial statements in Part IV of this Annual Report on Form 10-K for further information on the remaining liability related to these restructuring charges as of March 31, 2017.
Related to these charges, we closed
25
retail stores, including
five
stores during fiscal year 2016 and
20
stores during fiscal year 2017, and consolidated several offices
as of March 31, 2017
. We believe our retail stores remain an important component of our Omni-Channel strategy; however, in light of the recent and continuing changes in the retail environment, we also believe it is prudent to further reduce our global brick and mortar footprint. Accordingly, we anticipate generating future costs savings through further retail store closures and the conversion of owned stores to partner retail stores. We also realigned our brands across two groups as part of our Omni-Channel platform: Fashion Lifestyle and Performance Lifestyle. The Fashion Lifestyle group includes the UGG and Koolaburra brands. The Performance Lifestyle group includes the Teva, Sanuk and Hoka brands. As part of this realignment, during fiscal year 2016, we relocated our Sanuk brand operations in Irvine, California to our corporate headquarters in Goleta, California and closed our Ahnu brand operations office in Richmond, California, as well as consolidated our European offices.
As part of our continuing evaluation of our retail store fleet,
we identified additional s
tores for closure d
uring the year ended
March 31, 2017
. During fiscal year 2017, we recognized approximately
$3,600
in restructuring charges in SG&A expenses related to non-cash impairment charges for retail store assets for
12
of these stores. In May 2017, we announced that we expect to reduce our global owned brick and mortar footprint by 30 to 40 stores compared to our store count at
March 31, 2017
, discussed below, which includes a combination of store closures and conversion of owned stores to partner retail stores. We are targeting a worldwide store count of approximately
125
owned stores by the end of fiscal year 2020. It is anticipated that we will incur restructuring costs similar in nature to our historical activities in future fiscal years, primarily in connection with reaching our target store count.
Savings Plan.
In February 2017, we announced a plan to implement significant cost savings, excluding reinvestment (Savings Plan). The Savings Plan includes a combination of both cost of sales improvements and SG&A expense savings. Cost of sales improvements are expected to come from reducing product development cycle times, optimizing material yields, consolidating our factory base and continuing to move production outside of China. SG&A expense savings are expected to come from further retail store consolidations, process improvement efficiencies and lower unallocated indirect spend. In May 2017, we provided an update that the goal of the Savings Plan is to drive approximately
$100,000
in operating profit improvement by the end of fiscal year 2020.
Review of Strategic Alternatives.
In April 2017, we announced that our Board of Directors has initiated a process to review a broad range of strategic alternatives. This review process includes an exploration and evaluation of strategic alternatives to enhance stockholder value, which may include a sale or other transaction.
Trends Impacting our Overall Business
Our overall business has been, and we expect that it will continue to be, impacted by several important trends:
|
•
|
Sales of our products are highly seasonal and are sensitive to weather conditions, which are beyond our control. Even though we continue to expand our product lines and create more year-round styles
|
32
for our brands, the effect of favorable or unfavorable weather on our aggregate sales and operating results has been, and is likely to continue to be, significant.
|
•
|
We believe there has been a meaningful shift in the way consumers shop for products and make purchasing decisions. In particular, across the industry, brick and mortar retail stores are experiencing significant and prolonged decreases in consumer traffic as consumers continue to migrate to shopping online. This shift is impacting the performance of our DTC business and of our wholesale customers.
|
|
•
|
In light of the shift in consumer shopping behavior, we are optimizing our brick and mortar retail footprint. In connection with store closures, we have been impacted by costs to exit lease agreements, retail store fixed asset impairments and other closure costs. We expect this trend to continue as we further evaluate and optimize our retail fleet.
|
|
•
|
We continue to expect that our E-Commerce business will be a driver of long-term growth, although we expect the year-over-year growth rate will decline over time as the size of our E-Commerce business increases.
|
|
•
|
We believe consumers are buying product closer to the particular wearing occasion (buy now, wear now), which we believe tends to shorten the purchasing windows for weather-dependent product. Not only does this trend impact our DTC business, we believe it is also impacting the purchasing behavior of our large wholesale customers. In particular, these customers appear to be shortening their purchasing windows as a way to address the evolving behavior of retail consumers and to manage their own product inventory.
|
|
•
|
Foreign currency exchange rate fluctuations have significantly increased the value of the US dollar compared to most major foreign currencies over the past couple of years. While we seek to hedge some of the risks associated with foreign currency exchange rate fluctuations, these changes are largely outside of our control. We expect these changes will continue to impact the demand for our products and our operating results.
|
Use of Non-GAAP Measures
In order to provide a framework for assessing how our underlying businesses performed during the relevant periods, excluding the effect of foreign currency exchange rate fluctuations, throughout this Annual Report on Form 10-K we provide certain financial information on a “constant currency basis”, which is in addition to the financial measures calculated and presented in accordance with United States generally accepted accounting principles (US GAAP). In order to calculate our constant currency information, we calculate the current period financial information using the foreign currency exchange rates that were in effect during the previous comparable period, excluding the effects of foreign currency exchange rate hedges and re-measurements in the consolidated balance sheets. We believe that evaluating certain financial and operating measures, such as net sales reportable operating segment information on a constant currency basis is important, as it facilitates comparison of our current financial performance to our historical financial performance, excluding the impact of foreign currency exchange rate fluctuations that are not indicative of our core operating results and are largely outside of our control. However, constant currency measures should not be considered in isolation as an alternative to US dollar measures that reflect current period exchange rates, or to other financial measures calculated and presented in accordance with US GAAP.
Segment Overview
UGG Brand
The UGG brand has been one of the most iconic and recognized brands in the global footwear industry which highlights our successful track record of building niche brands into lifestyle market leaders. With loyal consumers around the world the UGG brand has proven to be a highly resilient line of premium footwear, with expanded product offerings and a growing global audience that attracts women, men and children.
We believe the continued demand for UGG brand products has been, and will continue to be, driven by the following:
|
•
|
High consumer brand loyalty, due to delivering quality and luxuriously comfortable UGG footwear.
|
33
|
•
|
Evolution of our Classics business through the introduction of products such as the Classic Slim, the Classic Luxe, the Classic Street, and the Classic II.
|
|
•
|
Diversification of our UGG product lines, including women's spring and summer, men's product lines, and lifestyle product offerings. We believe that the evolution of the UGG brand and our strategy of product diversification will also help decrease our reliance on sheepskin.
|
|
•
|
Continued enhancement of our Omni-Channel capabilities to enable us to increasingly engage existing and prospective consumers in a more connected environment and expose them to our brands.
|
Teva Brand
For over 30 years, the Teva brand has fueled the expression of freedom. The Teva brand pioneered the sport sandal category in 1984, and now is a leader within the sport sandal and modern outdoor lifestyle category.
During calendar year 2017, we began to leverage elements, including particular styles, of the Ahnu brand under the umbrella of the Teva brand.
Sanuk Brand
The Sanuk brand was founded almost 20 years ago, and from its origins in the Southern California surf culture, has emerged into a brand with an expanding fan base and presence in the relaxed casual shoe and sandal categories. The Sanuk brand’s use of unexpected materials and unconventional constructions combined with its fun and playful branding has contributed to the brand’s identity and growth since its inception, and led to successful products such as the Yoga Mat™ sandal collection and the SIDEWALK SURFERS.
As part of our annual assessment of the Sanuk brand's wholesale reportable operating segment goodwill in the third quarter of fiscal year 2017, we determined that there was an indication of impairment of the Sanuk brand's wholesale reportable operating segment goodwill. Consistent with the applicable accounting guidance, we performed the two-step impairment assessment and, as a result of this assessment, we recorded an
$113,944
non-cash impairment charge to the Sanuk brand's wholesale reportable segment goodwill. This conclusion was primarily the result of lower-than-forecasted sales for the Sanuk brand wholesale reportable segment, lower market multiples for non-athletic footwear and apparel, and a more limited view of international and domestic expansion opportunities for the brand given the changing retail environment. In connection with the Sanuk brand goodwill impairment, we evaluated the Sanuk brand's definite long-lived assets for indicators of impairment. Our analysis determined that the Sanuk brand's amortizable patent under the Sanuk wholesale reportable operating segment was fully impaired and we recorded a non-cash impairment charge to the patent of $
4,086
. Our analysis also determined that the Sanuk brand's other intangible assets were not impaired as of the date on which the impairment test was completed, as it was determined that the undiscounted future cash flows associated with those assets exceeded the carrying value. However, additional impairment charges could be incurred in future periods.
See Note 3, “Goodwill and Other Intangible Assets”, to our consolidated financial statements in Part IV of this Annual Report on Form 10-K for further information.
While we now have a more limited view of the growth and expansion opportunities for the Sanuk brand, we continue to believe that the Sanuk brand is an important component of our overall brand portfolio, especially within the casual shoe and sandal markets. However, we cannot assure investors that our efforts will result in the Sanuk brand's growth.
Other Brands
Our other brands consist of the Hoka, Koolaburra, and Ahnu brands. These brands are sold through most of our distribution channels, and primarily through our wholesale channels.
The Hoka brand is a line of running footwear that offers maximal cushioning with minimal weight and is designed for runners of all capacities. The Hoka brand is quickly becoming a top brand in the domestic run specialty channel and has received strong word-of-mouth marketing that has fueled both domestic and international sales growth.
34
The Koolaburra brand is a line of fashion casual footwear using sheepskin and other plush materials. The Ahnu brand is a line of performance outdoor footwear, which we have discontinued operating and have begun to leverage under the Teva brand umbrella, as described above.
Direct-to-Consumer
Our DTC business is comprised of our retail stores and E-Commerce websites. As a result of our evolving Omni-Channel strategy, we believe that our retail stores and websites are largely intertwined and dependent on one another. We believe that in many cases consumers interact with both our brick and mortar stores and our websites, before making purchase decisions. Our retail stores are predominantly UGG brand concept stores and UGG brand outlet stores. Through our outlet stores, we sell some of our discontinued styles from prior seasons, full price in-line products, as well as products made specifically for the outlet stores.
At March 31, 2017, we had a total of
160
retail stores worldwide, which includes
96
concept stores and
64
outlet stores. During fiscal year 2017, we opened
17
new stores, reclassified
12
European concession stores as owned stores, converted
two
owned stores to partner retail stores, and closed
20
stores. Concession stores are considered concept stores that are operated by us within a department or other store, which we lease from the store owner by paying a percentage of concession store sales. Partner retail stores are branded stores that are wholly owned and operated by third parties. Upon conversion or opening of new partner retail stores, each of these stores became wholly-owned and operated by third parties in China. Sales made to the partner retail stores are included primarily in our UGG brand wholesale reportable operating segment and not in our DTC reportable operating segment, as of the date of conversion.
Our E-Commerce business provides us with an opportunity to communicate a consistent brand message to customers that is in line with our brands' promises, drives awareness of key brand initiatives, offers targeted information to specific consumer demographics, and drives consumers to our retail stores. As of March 31, 2017, we operate our E-Commerce business through an aggregate of
22
Company-owned websites in
nine
different countries.
We report comparable DTC sales on a constant currency basis for combined retail stores and E-Commerce businesses that were open throughout the reporting period in both the current year and prior year. There may be variations in the way that we calculate comparable DTC sales as compared to some of our competitors and other apparel retailers. As a result, information included in this Annual Report on Form 10-K regarding our comparable DTC sales may not be comparable to similar data made available by our competitors or other apparel retailers.
Seasonality
Our business is seasonal, with the highest percentage of UGG brand net sales occurring in the quarters ending September 30th and December 31st and the highest percentage of Teva and Sanuk brand net sales occurring in the quarters ending March 31st and June 30th of each year. With the size of the UGG brand relative to our other brands, net sales in the quarters ending September 30th and December 31st have significantly exceeded net sales in the quarters ending March 31st and June 30th.
See Note 14, “Quarterly Summary of Information (Unaudited)”, to our consolidated financial statements in Part IV of this Annual Report on Form 10-K for further information.
35
Results of Operations
Year Ended
March 31, 2017
Compared to Year Ended
March 31, 2016
The following table summarizes our results of operations:
|
Years Ended March 31,
|
||||||||||||||||||||
|
2017
|
2016
|
Change
|
||||||||||||||||||
|
Amount
|
%
|
Amount
|
%
|
Amount
|
%
|
|||||||||||||||
|
Net sales
|
$
|
1,790,147
|
|
100.0
|
%
|
$
|
1,875,197
|
|
100.0
|
%
|
$
|
(85,050
|
)
|
(4.5
|
)%
|
|||||
|
Cost of sales
|
954,912
|
|
53.3
|
|
1,028,529
|
|
54.8
|
|
(73,617
|
)
|
(7.2
|
)
|
||||||||
|
Gross profit
|
835,235
|
|
46.7
|
|
846,668
|
|
45.2
|
|
(11,433
|
)
|
(1.4
|
)
|
||||||||
|
Selling, general and administrative expenses
|
837,154
|
|
46.8
|
|
684,541
|
|
36.5
|
|
152,613
|
|
22.3
|
|
||||||||
|
(Loss) income from operations
|
(1,919
|
)
|
(0.1
|
)
|
162,127
|
|
8.7
|
|
(164,046
|
)
|
(101.2
|
)
|
||||||||
|
Other expense, net
|
5,067
|
|
0.3
|
|
5,242
|
|
0.3
|
|
(175
|
)
|
(3.3
|
)
|
||||||||
|
(Loss) income before income taxes
|
(6,986
|
)
|
(0.4
|
)
|
156,885
|
|
8.4
|
|
(163,871
|
)
|
(104.5
|
)
|
||||||||
|
Income tax (benefit) expense
|
(12,696
|
)
|
(0.7
|
)
|
34,620
|
|
1.9
|
|
(47,316
|
)
|
(136.7
|
)
|
||||||||
|
Net income (loss)
|
$
|
5,710
|
|
0.3
|
%
|
$
|
122,265
|
|
6.5
|
%
|
$
|
(116,555
|
)
|
(95.3
|
)%
|
|||||
Net Sales.
The following table summarizes our net sales by location and our net sales by brand and channel:
|
Years Ended March 31,
|
||||||||||||||
|
2017
|
2016
|
Change
|
||||||||||||
|
Amount
|
Amount
|
Amount
|
%
|
|||||||||||
|
Net sales by location:
|
||||||||||||||
|
US
|
$
|
1,141,303
|
|
$
|
1,219,744
|
|
$
|
(78,441
|
)
|
(6.4
|
)%
|
|||
|
International
|
648,844
|
|
655,453
|
|
(6,609
|
)
|
(1.0
|
)
|
||||||
|
Total
|
$
|
1,790,147
|
|
$
|
1,875,197
|
|
$
|
(85,050
|
)
|
(4.5
|
)%
|
|||
|
Net sales by brand and channel:
|
||||||||||||||
|
UGG brand:
|
||||||||||||||
|
Wholesale
|
$
|
826,355
|
|
$
|
918,102
|
|
$
|
(91,747
|
)
|
(10.0
|
)%
|
|||
|
Direct-to-Consumer
|
624,682
|
|
606,247
|
|
18,435
|
|
3.0
|
|
||||||
|
Total
|
1,451,037
|
|
1,524,349
|
|
(73,312
|
)
|
(4.8
|
)
|
||||||
|
Teva brand:
|
||||||||||||||
|
Wholesale
|
103,694
|
|
121,239
|
|
(17,545
|
)
|
(14.5
|
)
|
||||||
|
Direct-to-Consumer
|
14,021
|
|
11,810
|
|
2,211
|
|
18.7
|
|
||||||
|
Total
|
117,715
|
|
133,049
|
|
(15,334
|
)
|
(11.5
|
)
|
||||||
|
Sanuk brand:
|
||||||||||||||
|
Wholesale
|
77,552
|
|
90,719
|
|
(13,167
|
)
|
(14.5
|
)
|
||||||
|
Direct-to-Consumer
|
14,214
|
|
15,522
|
|
(1,308
|
)
|
(8.4
|
)
|
||||||
|
Total
|
91,766
|
|
106,241
|
|
(14,475
|
)
|
(13.6
|
)
|
||||||
|
Other brands:
|
||||||||||||||
|
Wholesale
|
116,206
|
|
100,820
|
|
15,386
|
|
15.3
|
|
||||||
|
Direct-to-Consumer
|
13,423
|
|
10,738
|
|
2,685
|
|
25.0
|
|
||||||
|
Total
|
129,629
|
|
111,558
|
|
18,071
|
|
16.2
|
|
||||||
|
Total
|
$
|
1,790,147
|
|
$
|
1,875,197
|
|
$
|
(85,050
|
)
|
(4.5
|
)%
|
|||
|
Total Wholesale
|
$
|
1,123,807
|
|
$
|
1,230,880
|
|
$
|
(107,073
|
)
|
(8.7
|
)%
|
|||
|
Total Direct-to-Consumer
|
666,340
|
|
644,317
|
|
22,023
|
|
3.4
|
|
||||||
|
Total
|
$
|
1,790,147
|
|
$
|
1,875,197
|
|
$
|
(85,050
|
)
|
(4.5
|
)%
|
|||
36
The decrease in overall net sales was largely due to lower UGG, Teva and Sanuk brand wholesale sales, which was partially offset by increased other brand wholesale and DTC sales. We experienced a decrease of 2.3% in overall weighted-average selling price per pair (WASPP), primarily driven by a decrease in WASPP for the UGG brand, which drove the overall decrease in wholesale sales. We also experienced a decrease in the number of pairs sold in our UGG, Teva, and Sanuk brands which contributed to an overall decrease in volume of footwear sold for all brands of 2.2% to approximately 31,400 pairs sold for the
year ended March 31, 2017
from approximately 32,100 pairs for the
year ended March 31, 2016
. The decrease was largely attributable to lower North American UGG wholesale sales. In addition, we experienced reduced wholesale sales in Europe during the third quarter of fiscal year 2017 as a result of our transition to the new European third party logistics provider (3PL). On a constant currency basis, overall net sales decreased 4.1% to approximately $1,800,300 in fiscal year 2017 compared to fiscal year 2016.
Wholesale net sales of our UGG brand decreased due to a decline in WASPP and in the volume of pairs sold. The decrease in WASPP had an impact of approximately $75,000, and was primarily attributable to changes in product mix and a higher proportion of international closeout sales at lower prices relative to the prior period. The decrease in WASPP was slightly offset by a shift in channel mix to DTC. The decrease in the volume of pairs sold had an impact of approximately $31,000, primarily attributable to lower North American wholesale sales. These decreases were partially offset by positive impacts from lower sales reserves and chargebacks due to lower sales and less promotional activity compared to the prior period. On a constant currency basis, wholesale net sales of our UGG brand decreased 9.7% to approximately $829,800 in fiscal year 2017 compared to fiscal year 2016.
Wholesale net sales of our Teva brand decreased largely due to a decrease in the volume of pairs sold, partially offset by a slight net increase in WASPP. The decrease in the volume of pairs sold had an impact of approximately $17,000. The net increase in WASPP was primarily attributable to lower prices on closeout sales and a shift in product mix.
Wholesale net sales of our Sanuk brand decreased primarily due to a decrease in the volume of pairs sold and a decrease in WASPP. The decrease in the volume of pairs sold had an impact of approximately $9,000. The decrease in WASPP had an impact of approximately $4,200, which was primarily due to lower prices on closeout sales and a shift in product mix.
Wholesale net sales of our other brands increased primarily due to an increase in the volume of pairs sold, offset by a decrease in WASPP. The increase in volume of pairs sold had an impact of approximately $22,000 primarily driven by growth for the Hoka and Koolaburra brands, partially offset by a decrease in the discontinued brands' volume of pairs sold. The decrease in WASPP had an impact of approximately $5,000 due to a shift in product mix.
DTC net sales increased
3.4%
to
$666,340
primarily due to an increase in net sales from our E-Commerce business of approximately $29,200, offset by a decrease in net sales from our retail store business of approximately $7,200. The increase in total DTC net sales was largely due to an increase in the volume of pairs sold of approximately $78,500 due to growth in E-Commerce, offset by a decrease in WASPP with an impact of approximately $50,500. The decrease in WASPP was due to a shift in product mix. On a constant currency basis, DTC net sales increased 4.5% to approximately $673,800 in fiscal year 2017 compared to fiscal year 2016.
Comparable DTC net sales for the 52 weeks ended April 2, 2017 increased 2.6% on a constant currency basis to approximately $520,500 compared to the same period in fiscal year 2016. The increase in comparable DTC net sales was primarily due to improved growth in E-Commerce worldwide, partially offset by a decline in sales at our retail stores.
International sales, which are included in the reportable operating segment sales presented above, decreased by
1.0%
. International sales represented
36.2%
and
35.0%
of worldwide net sales for the years ended
March 31, 2017
and 2016, respectively. The decrease in international sales was due to lower wholesale sales for the UGG and Teva brands in Europe and the UGG and Sanuk brands in Asia. On a constant currency basis, international sales increased 1.6% to approximately $666,100 in fiscal year 2017 compared to fiscal year 2016.
Gross Profit.
Gross margin was
46.7%
for the year ended
March 31, 2017
compared to
45.2%
for the year ended March 31, 2016. The overall improvement in gross margin was driven by a higher proportion of DTC net sales and lower material costs, changes in product mix, decreased domestic promotional activity, and the lower impact of closeout sales compared to the prior period. This was slightly offset by the strengthening of the US dollar.
37
Selling, General and Administrative Expenses.
The change in SG&A expenses for the year ended
March 31, 2017
compared to the year ended
March 31, 2016
were primarily due to:
|
•
|
impairment charges for the Sanuk brand's wholesale reportable operating segment's goodwill and patent of approximately
$118,000
;
|
|
•
|
increased other payroll expenses of approximately $7,300, primarily attributable to costs related to transitioning warehouse and customer service locations and less capitalization of labor costs associated with the business transformation project;
|
|
•
|
increased commission expenses of approximately $6,300, largely driven by terminations of sales agent agreements;
|
|
•
|
increased professional service costs of approximately $6,000, including restructuring charges for consulting services and other outside services;
|
|
•
|
increased depreciation expenses for IT-related assets for our business transformation project of approximately $6,000;
|
|
•
|
increased other operating expenses of approximately $4,600, primarily driven by innovation and design costs and outside services, as well as third party management fees for Asian operations in the E-Commerce channel;
|
|
•
|
increased expenses of approximately $4,500 due to contingent consideration credits taken in fiscal year 2016 that are not recurring in fiscal year 2017;
|
|
•
|
impairment charges for IT-related long-lived assets and related maintenance contract termination costs of approximately $3,400, included in restructuring charges;
|
|
•
|
increased warehouse expenses of approximately $2,100, largely driven by costs related to closing and transitioning 3PL warehouses;
|
|
•
|
decreased bad debt expense of approximately $2,500, due to a reduction in delinquent customer accounts in the current period; and
|
|
•
|
decreased occupancy and rent expense of approximately $1,700 due to higher restructuring charges incurred for retail store closures and office consolidations in the prior period.
|
(Loss) Income from Operations.
The following table summarizes operating (loss) income by reportable operating segment:
|
Years Ended March 31,
|
||||||||||||||
|
2017
|
2016
|
Change
|
||||||||||||
|
Amount
|
Amount
|
Amount
|
%
|
|||||||||||
|
UGG brand wholesale
|
$
|
213,407
|
|
$
|
246,990
|
|
$
|
(33,583
|
)
|
(13.6
|
)%
|
|||
|
Teva brand wholesale
|
10,045
|
|
17,692
|
|
(7,647
|
)
|
(43.2
|
)
|
||||||
|
Sanuk brand wholesale
|
(110,582
|
)
|
15,565
|
|
(126,147
|
)
|
(810.5
|
)
|
||||||
|
Other brands wholesale
|
1,571
|
|
(4,384
|
)
|
5,955
|
|
135.8
|
|
||||||
|
Direct-to-Consumer
|
109,802
|
|
101,756
|
|
8,046
|
|
7.9
|
|
||||||
|
Unallocated overhead costs
|
(226,162
|
)
|
(215,492
|
)
|
(10,670
|
)
|
(5.0
|
)
|
||||||
|
Total
|
$
|
(1,919
|
)
|
$
|
162,127
|
|
$
|
(164,046
|
)
|
(101.2
|
)%
|
|||
The increase in loss from operations resulted from lower sales and higher overall SG&A expenses, primarily driven by the impairment and restructuring charges described above. These factors were partially offset by higher overall gross margins attributable to reduced material costs and changes in product mix, decreased promotional activity, and the lower impact of closeout sales compared to the prior period.
38
The decrease in income from operations of UGG brand wholesale was primarily the result of lower sales.
The decrease in income from operations of Teva brand wholesale was due to lower sales.
The increase in loss from operations of Sanuk brand wholesale was primarily due to impairment charges for goodwill and long-lived assets of approximately
$118,000
, as described above, as well as lower sales and lower gross margins.
The increase in income from operations of other brands wholesale was due to higher sales and improved gross margins primarily attributable to the Hoka and Koolaburra brands, offset by higher SG&A expenses driven by higher selling and marketing costs.
The increase in income from operations of DTC was primarily due to higher sales and improved gross margins in our E-Commerce business, offset by higher SG&A expenses driven by impairment charges for retail store assets for stores that have been identified for closure, as described above.
Unallocated overhead costs increased due to restructuring charges, as described above, slightly offset by lower performance-based compensation expenses and fluctuations in various foreign currencies.
Refer to Note 12, "Reportable Operating Segments", to our consolidated financial statements in Part IV of this Annual Report on Form 10-K for a discussion of our reportable operating segments.
Other Expense, Net.
The increase in total other expense, net was primarily due to an increase in interest expense as a result of the higher average balances outstanding under our revolving credit facilities compared to fiscal year 2016.
Income Taxes.
Income tax (benefit) expense and the effective income tax rates were as follows:
|
Years Ended March 31,
|
|||||||
|
2017
|
2016
|
||||||
|
Income tax (benefit) expense
|
$
|
(12,696
|
)
|
$
|
34,620
|
|
|
|
Effective income tax rate
|
181.7
|
%
|
22.1
|
%
|
|||
The change in the effective tax rate was primarily due to the domestic net operating loss generated during the year ended March 31, 2017, driven by the impact of domestic restructuring charges and non-cash impairment charges, as discussed above, as well as a decrease in domestic net sales, and a decrease in the compensation earned by our foreign-based global product sourcing organization.
Foreign income before income taxes was
$49,319,000
and
$105,938,000
and worldwide (loss) income before income taxes was
$(6,986)
and
$156,885
for the
years ended March 31, 2017
and
2016
, respectively. The decrease in foreign income before income taxes was primarily due to an increase in foreign operating expenses related to restructuring charges and a decrease in compensation earned by our foreign-based global product sourcing organization during the year ended
March 31, 2017
compared to the year ended
March 31, 2016
. Foreign income before income taxes, as a percentage of worldwide loss before taxes, increased primarily due to the recording of domestic non-cash impairment charges, as discussed above, as well as a decrease in domestic sales during the year ended
March 31, 2017
compared to the year ended
March 31, 2016
.
We expect that our foreign income or loss before income taxes, as well as our effective tax rate, will continue to fluctuate from period to period based on several factors, including the outcome of optimizing our retail fleet, the impact of internal savings initiatives, the impact of our global product sourcing organization, our actual financial and operating results from sales generated in domestic and foreign markets, and changes in domestic and foreign tax laws (or in the application or interpretation of those laws). In particular, we believe that the continuing evolution and expansion of our brands, our continuing strategy of enhancing product diversification, and the expected growth from our international DTC business, will result in increases in foreign income before income taxes both in absolute terms and as a percentage of worldwide income before income taxes. In addition, we believe that our effective tax rate will continue to be impacted by our actual foreign income before income taxes relative to our actual worldwide income before income taxes. Notably, with respect to fiscal year 2017, the Sanuk brand's wholesale reportable operating segment impairment charges for goodwill and long-lived assets, as discussed above, had the effect of significantly reducing domestic and worldwide
39
income before income taxes, which increased foreign income before income taxes as a percentage of worldwide income before income taxes.
For fiscal year 2017, we generated approximately
$21,569
of our pre-tax earnings from a country which does not impose a corporate income tax compared to
$35,402
during fiscal year 2016. Unremitted earnings of non-US subsidiaries are expected to be reinvested outside of the US indefinitely. Such earnings would become taxable upon the sale or liquidation of these subsidiaries or upon the remittance of dividends.
As of March 31, 2017
, we had approximately
$265,773,000
of cash and cash equivalents outside the US that would be subject to additional income taxes if it were to be repatriated.
Net Income.
Our net income decreased primarily due to lower sales and higher SG&A expenses attributable to the impairment and restructuring charges discussed above, offset by higher gross margins. Our net income per share decreased due to lower net income, partially offset by a slightly lower number of weighted-average common shares outstanding.
Other Comprehensive Loss.
Other comprehensive loss increased as a result of increased foreign currency translation losses driven by changes in exchange rates for Asian and European currencies during the year ended
March 31, 2017
compared to the year ended March 31, 2016.
40
Year Ended
March 31, 2016
Compared to Year Ended
March 31, 2015
The following table summarizes our results of operations:
|
Years Ended March 31,
|
||||||||||||||||||||
|
2016
|
2015
|
Change
|
||||||||||||||||||
|
Amount
|
%
|
Amount
|
%
|
Amount
|
%
|
|||||||||||||||
|
Net sales
|
$
|
1,875,197
|
|
100.0
|
%
|
$
|
1,817,057
|
|
100.0
|
%
|
$
|
58,140
|
|
3.2
|
%
|
|||||
|
Cost of sales
|
1,028,529
|
|
54.8
|
|
938,949
|
|
51.7
|
|
89,580
|
|
9.5
|
|
||||||||
|
Gross profit
|
846,668
|
|
45.2
|
|
878,108
|
|
48.3
|
|
(31,440
|
)
|
(3.6
|
)
|
||||||||
|
Selling, general and administrative expenses
|
684,541
|
|
36.5
|
|
653,689
|
|
36.0
|
|
30,852
|
|
4.7
|
|
||||||||
|
Income from operations
|
162,127
|
|
8.7
|
|
224,419
|
|
12.3
|
|
(62,292
|
)
|
(27.8
|
)
|
||||||||
|
Other expense, net
|
5,242
|
|
0.3
|
|
3,280
|
|
0.2
|
|
1,962
|
|
59.8
|
|
||||||||
|
Income before income taxes
|
156,885
|
|
8.4
|
|
221,139
|
|
12.1
|
|
(64,254
|
)
|
(29.1
|
)
|
||||||||
|
Income tax expense
|
34,620
|
|
1.9
|
|
59,359
|
|
3.2
|
|
(24,739
|
)
|
(41.7
|
)
|
||||||||
|
Net income
|
$
|
122,265
|
|
6.5
|
%
|
$
|
161,780
|
|
8.9
|
%
|
$
|
(39,515
|
)
|
(24.4
|
)%
|
|||||
Net Sales.
The following table summarizes our net sales by location and our net sales by brand and channel:
|
Years Ended March 31,
|
||||||||||||||
|
2016
|
2015
|
Change
|
||||||||||||
|
Amount
|
Amount
|
Amount
|
%
|
|||||||||||
|
Net sales by location:
|
||||||||||||||
|
US
|
$
|
1,219,744
|
|
$
|
1,165,350
|
|
$
|
54,394
|
|
4.7
|
%
|
|||
|
International
|
655,453
|
|
651,707
|
|
3,746
|
|
0.6
|
|
||||||
|
Total
|
$
|
1,875,197
|
|
$
|
1,817,057
|
|
$
|
58,140
|
|
3.2
|
%
|
|||
|
Net sales by brand and channel:
|
||||||||||||||
|
UGG brand:
|
||||||||||||||
|
Wholesale
|
$
|
918,102
|
|
$
|
903,926
|
|
$
|
14,176
|
|
1.6
|
%
|
|||
|
Direct-to-Consumer
|
606,247
|
|
589,267
|
|
16,980
|
|
2.9
|
|
||||||
|
Total
|
1,524,349
|
|
1,493,193
|
|
31,156
|
|
2.1
|
|
||||||
|
Teva brand:
|
||||||||||||||
|
Wholesale
|
121,239
|
|
116,931
|
|
4,308
|
|
3.7
|
|
||||||
|
Direct-to-Consumer
|
11,810
|
|
9,812
|
|
1,998
|
|
20.4
|
|
||||||
|
Total
|
133,049
|
|
126,743
|
|
6,306
|
|
5.0
|
|
||||||
|
Sanuk brand:
|
||||||||||||||
|
Wholesale
|
90,719
|
|
102,690
|
|
(11,971
|
)
|
(11.7
|
)
|
||||||
|
Direct-to-Consumer
|
15,522
|
|
12,021
|
|
3,501
|
|
29.1
|
|
||||||
|
Total
|
106,241
|
|
114,711
|
|
(8,470
|
)
|
(7.4
|
)
|
||||||
|
Other brands:
|
||||||||||||||
|
Wholesale
|
100,820
|
|
76,152
|
|
24,668
|
|
32.4
|
|
||||||
|
Direct-to-Consumer
|
10,738
|
|
6,258
|
|
4,480
|
|
71.6
|
|
||||||
|
Total
|
111,558
|
|
82,410
|
|
29,148
|
|
35.4
|
|
||||||
|
Total
|
$
|
1,875,197
|
|
$
|
1,817,057
|
|
$
|
58,140
|
|
3.2
|
%
|
|||
|
Total Wholesale
|
$
|
1,230,880
|
|
$
|
1,199,699
|
|
$
|
31,181
|
|
2.6
|
%
|
|||
|
Total Direct-to-Consumer
|
644,317
|
|
617,358
|
|
26,959
|
|
4.4
|
|
||||||
|
Total
|
$
|
1,875,197
|
|
$
|
1,817,057
|
|
$
|
58,140
|
|
3.2
|
%
|
|||
The increase in overall net sales was due to increases in total DTC net sales and other brands, UGG brand and Teva brand wholesale sales, partially offset by a decrease in Sanuk brand wholesale sales. We experienced an increase
41
in the number of pairs sold in the UGG brand, other brands and Teva brand wholesale, as well as the DTC business, offset in part by a decrease in the number of pairs sold in the Sanuk brand wholesale. This resulted in an increase in the overall volume of footwear sold for all brands of 4.6% to approximately 32,100 pairs sold for the year ended March 31, 2016 from approximately 30,700 pairs for the year ended March 31, 2015. The mitigating impacts on overall net sales were increased promotional activity, which consisted of vendor-specific markdowns, price reductions, chargebacks, sales discounts, and sales reserves. On a constant currency basis, overall net sales increased 5.9% to approximately $1,925,000 in fiscal year 2016 compared to fiscal year 2015.
Wholesale net sales of our UGG brand were positively impacted by an increase in the volume of pairs sold in the amount of approximately $73,000. Wholesale net sales were negatively impacted by an increase in promotional activity of approximately $27,000 to promote sales that were slow due to warmer weather and to clear out inventory that will be obsolete in future seasons. Wholesale net sales were also negatively impacted by a decrease in WASPP of approximately $26,000 reflecting unfavorable foreign currency exchange rates and an increased impact of approximately $7,000 from closeout sales. On a constant currency basis, wholesale net sales of our UGG brand increased 4.5% to approximately $945,000 in fiscal year 2016 compared to fiscal year 2015.
Wholesale net sales of our Teva brand increased largely due to an increase in the volume of pairs sold and an increase in WASPP. The increase in the volume of pairs sold had an impact of approximately $1,000 and the increase in WASPP had an impact of approximately $2,000. The increase in WASPP was attributable to a decreased impact from closeout sales as compared to the prior period.
Wholesale net sales of our Sanuk brand decreased primarily due to a decrease in the volume of pairs sold, offset in part by an increase in WASPP. The decrease in the volume of pairs sold had an impact of approximately $13,000 and the increase in WASPP had an impact of approximately $1,000. The increase in WASPP was attributable to a decreased impact from closeout sales as compared to the prior period.
Wholesale net sales of our other brands increased due to an increase in the volume of pairs sold primarily for the Hoka brand and an increase in WASPP. The increase in volume of pairs sold had an impact of approximately $22,000 and the increase in WASPP had an impact of approximately $2,000. The increase in WASPP mainly reflects a shift in product mix.
DTC net sales increased 4.4% to approximately $644,000 primarily due to an increase in net sales from our E-Commerce business of approximately $32,000, partially offset by a decrease in net sales from our retail store business of approximately $5,000. The increase in total DTC net sales was primarily the result of an increase in the number of pairs sold with an impact of approximately $92,000 primarily due to the UGG and Teva brands. The increase in DTC net sales was primarily due to the number of stores opened since March 31, 2015, increased traffic to our websites and improved conversion rates in both E-Commerce and retail businesses due to improved product offerings and new promotions offered on Classic products, offset in part, by declining traffic trends in our retail stores worldwide. These increases were offset in part by a decrease in WASPP of approximately $66,000 and an increase in promotional activity of approximately $3,000 primarily related to the UGG brand. The decrease in WASPP was primarily due to a shift in store mix from concept to outlet, a shift in sales mix to lower priced product in the stores, increased offering of lower price point products for both businesses and the negative impact of foreign currency exchange rate fluctuations. On a constant currency basis, DTC net sales increased 7.4% to approximately $663,000 in fiscal year 2016 compared to fiscal year 2015.
Comparable DTC net sales for the 52 weeks ended March 27, 2016 on a constant currency basis decreased 1.0% to approximately $511,000 compared to the same period in fiscal year 2015 primarily as a result of a decrease in comparable retail store sales of approximately $42,000, largely offset by an increase in comparable sales from E-Commerce operations of approximately $37,000. The decrease in comparable DTC sales was primarily due to declining traffic trends in our retail stores worldwide, offset in part by increased website traffic, and improved conversion rates in both our E-Commerce and retail store businesses due to improved product offerings and new promotions offered on Classic products. The decrease in comparable DTC sales was primarily the result of a decrease in WASPP of approximately $41,000, largely offset by an increase in the number of pairs sold in the amount of $36,000. The decrease in the comparable DTC WASPP was primarily due to a shift in product mix.
International sales, which are included in the reportable operating segment sales presented above, increased 0.6%. International sales represented 35.0% and 35.9% of worldwide net sales for the years ended March 31, 2016 and
2015
, respectively. The increase in international sales was due to increases of approximately $11,000 for other brand products, primarily the Hoka brand, and $7,000 for Teva brand products. The net sales increase was largely
42
offset by sales decreases of approximately $11,000 and $3,000 in UGG and Sanuk brand products, respectively. On a constant currency basis, international sales increased 8.2% to approximately $705,000 during fiscal year 2016 compared to fiscal year 2015.
Gross Profit.
Gross margin was
45.2%
for fiscal year 2016 compared to 48.3% for fiscal year 2015. The overall decline in gross margin was driven by a negative impact from foreign currency exchange rate fluctuations of approximately $13,000 caused by the strengthening of the US dollar, greater promotional activity of approximately $13,000, restructuring and other charges of approximately $5,000, and greater closeouts of approximately $4,000, offset, in part, by improved sheepskin costs of approximately $4,000.
Selling, General and Administrative Expenses.
The change in SG&A expenses for the year ended
March 31, 2016
compared to the year ended
March 31, 2015
were primarily due to:
|
•
|
increased salaries of approximately $19,000, largely attributable to transition and stabilization costs related to the move from Irvine to our new distribution center in Moreno Valley and a timing difference attributable to full operations commencing in the first quarter of fiscal year 2016 at Moreno Valley. Salaries were also impacted by $4,000 of severance related to restructuring charges for our retail store fleet optimization and office consolidations and $4,000 for new retail stores opened subsequent to March 31, 2015;
|
|
•
|
increased occupancy and rent expense of approximately $16,000, largely driven by the $9,000 restructuring charges for early termination of office and store leases related to our retail store fleet optimization and office consolidations and new retail stores opened subsequent to March 31, 2015;
|
|
•
|
increased impairment charges for retail stores of approximately $9,800 for which the fair values did not exceed their carrying values based on our retail store asset impairment analysis;
|
|
•
|
increased expense of approximately $6,000 for store closure and lease termination costs related to our retail store fleet optimization and office consolidations;
|
|
•
|
increased information technology costs of approximately $5,000, largely related to the restructuring charge of $4,000 for impairment of certain supply chain software related to the business transformation project implementation and the reorganization of our supply chain team causing older software to be obsolete;
|
|
•
|
increased depreciation expense of approximately $4,000 related to operations commencing at our new distribution center in Moreno Valley in the first quarter of fiscal year 2016;
|
|
•
|
an increase in our accounts receivable allowances of approximately $4,000, reflecting our ongoing assessments of credit risks for several customers whose recent payment history and financial condition necessitated an increase in the allowance;
|
|
•
|
decreased recognition of performance-based stock compensation of approximately $18,000 because the threshold level of the performance criteria relating to fiscal year 2016 was not achieved as compared to the partial achievement of performance criteria in
fiscal year 2015
;
|
|
•
|
decreased expenses of approximately $12,000 related to the impact of foreign currency exchange rate fluctuations in
fiscal year 2016
compared to
fiscal year 2015
; and
|
|
•
|
decreased amortization expense of approximately $3,000, primarily attributable to the acquisition of our UGG brand distributor that had been selling to retailers in Germany in fiscal year 2015 period that did not carry forward to fiscal year 2016.
|
43
Income from Operations.
The following table summarizes operating income (loss) by reportable operating segment:
|
Years Ended March 31,
|
||||||||||||||
|
2016
|
2015
|
Change
|
||||||||||||
|
Amount
|
Amount
|
Amount
|
%
|
|||||||||||
|
UGG brand wholesale
|
$
|
246,990
|
|
$
|
269,489
|
|
$
|
(22,499
|
)
|
(8.3
|
)%
|
|||
|
Teva brand wholesale
|
17,692
|
|
13,320
|
|
4,372
|
|
32.8
|
|
||||||
|
Sanuk brand wholesale
|
15,565
|
|
21,914
|
|
(6,349
|
)
|
(29.0
|
)
|
||||||
|
Other brands wholesale
|
(4,384
|
)
|
(9,838
|
)
|
5,454
|
|
55.4
|
|
||||||
|
Direct-to-Consumer
|
101,756
|
|
150,320
|
|
(48,564
|
)
|
(32.3
|
)
|
||||||
|
Unallocated overhead costs
|
(215,492
|
)
|
(220,786
|
)
|
5,294
|
|
2.4
|
|
||||||
|
Total
|
$
|
162,127
|
|
$
|
224,419
|
|
$
|
(62,292
|
)
|
(27.8
|
)%
|
|||
The decrease in income from operations resulted from lower gross margins driven by the negative impact of foreign currency exchange rate fluctuations, increased promotional activity of approximately $29,000 and higher SG&A expenses primarily as a result of approximately $25,000 of restructuring and other charges.
The decrease in income from operations of UGG brand wholesale was the result of the increased promotional activity of approximately $27,000. These factors were partially offset by a decrease in operating expenses of approximately $3,000. The decrease in operating expenses is attributable to the decrease in amortization related to the conversion of our Germany distributor in fiscal year 2015 and a decrease in marketing and advertising, offset in part by an increase in accounts receivable allowances.
The increase in income from operations of Teva brand wholesale was primarily the result of a 2.6% increase in gross margin. The increase in gross margin was due to a decreased impact from closeout sales.
The decrease in income from operations of our Sanuk brand wholesale was primarily due to a decrease in sales and $3,000 of restructuring charges, partially offset by a decrease in operating expenses of approximately $3,000. The decrease in operating expenses was primarily attributable to lower marketing and advertising and lower sales and commission expenses.
The operating results of our other brands wholesale improved due to an increase in net sales and a 3.2% increase in gross margin, partially offset by an increase in operating expenses of approximately $5,000 reflecting $2,500 of restructuring charges. The increase in gross margin was primarily attributable to a shift to higher margin Hoka brand products. The increase in operating expenses was also attributable to marketing expenses for the Hoka brand.
The decrease in income from operations of DTC resulted from an increase in operating expenses of approximately $37,000, a decrease in gross profit and the increase in promotional activity of approximately $3,000. The increase in DTC operating expenses was largely attributable to restructuring charges of $10,500 related to our retail store fleet optimization, $9,800 of other impairment charges for retail stores during fiscal year 2016 and operating expenses for stores opened subsequent to March 31, 2015.
The decrease in unallocated overhead costs was primarily due to a lower unfavorable impact of foreign currency exchange rate fluctuations in fiscal year 2016 compared to fiscal year 2015 of approximately $22,000 and a reduction in performance-based stock compensation of approximately $12,000, partially offset by increased salaries of approximately $11,000 primarily for our Moreno Valley distribution center, increased depreciation expense of approximately $7,000 primarily for our Moreno Valley distribution center, increased information technology costs of approximately $3,000 largely related to supply chain software impairment charges and increased occupancy and rent expense of approximately $3,000 primarily for additional corporate office space and our Moreno Valley distribution center and increased general expenses of $4,000.
Refer to Note 12, "Reportable Operating Segments", to our consolidated financial statements in Part IV of this Annual Report on Form 10-K for a discussion of our reportable operating segments.
44
Other Expense, Net.
The increase in total other expense, net was primarily due to an increase in interest expense as a result of the higher average balances outstanding under our revolving credit facilities compared to fiscal year 2015.
Income Taxes.
Income tax expense and effective income tax rates were as follows:
|
Years Ended March 31,
|
|||||||
|
2016
|
2015
|
||||||
|
Income tax expense
|
$
|
34,620
|
|
$
|
59,359
|
|
|
|
Effective income tax rate
|
22.1
|
%
|
26.8
|
%
|
|||
The decrease in the effective tax rate was primarily due to a change in the jurisdictional mix of annual pre-tax income. The jurisdictional mix change was the result of greater promotional activity and restructuring charges reducing domestic profitability in combination with the strategic supply chain reorganization completed during the
year ended March 31, 2015
.
Foreign income before income taxes was
$105,938,000
and
$95,850,000
and worldwide income before income taxes was
$156,885
and
$221,139
for the years ended March 31, 2016 and 2015, respectively. The increase in foreign income before income taxes was primarily due to an increase in compensation earned by our foreign-based global product sourcing organization, which commenced operations on July 1, 2014 and lower foreign operating expenses as a result of amortization related to conversion of our Germany distributor in the prior period and expense reduction efforts.
For fiscal year 2016, we generated approximately
$35,402
of our pre-tax earnings from a country which does not impose a corporate income tax compared to $54,588 for fiscal year 2015. Undistributed earnings of non-US subsidiaries are expected to be reinvested outside of the US indefinitely. Such earnings would become taxable upon the sale or liquidation of these subsidiaries or upon the remittance of dividends.
As of March 31, 2016
, we had approximately $233,000 of cash and cash equivalents outside the US that would be subject to additional income taxes if it were to be repatriated.
For additional information about the factors that may impact our foreign income or loss before income taxes, as well as our effective tax rate, please see the discussion under the heading "Results of Operations - Year Ended March 31, 2017 Compared to Year Ended March 31, 2016 - Income Taxes" above.
Net Income.
Our net income decreased as a result of the factors discussed above. Our net income per share decreased due to lower net income, offset in part by a reduction in the weighted-average common shares outstanding. The overall reduction in the weighted-average common shares outstanding was primarily the result of repurchases of our common stock made during the
year ended March 31, 2016
.
Other Comprehensive Loss.
Other comprehensive loss decreased as a result of decreased net unrealized losses on foreign currency exchange rates as well as increased gains on foreign currency exchange rate hedges, largely attributable to unrealized gains on Asian currencies, partially offset by unrealized losses on Canadian currency exchange rates during the year ended
March 31, 2016
compared to the year ended March 31, 2015.
Liquidity and Capital Resources
Liquidity
We finance our working capital and operating needs using a combination of our cash and cash equivalents balances, cash generated from operations, and as needed, the borrowings available under our credit agreements. In an economic recession or under other adverse economic conditions, our cash generated from operations may decline, and we may be unable to realize a return on our cash and cash equivalents, secure additional credit on favorable terms, or renew or access our existing lines of credit. These factors may impact our working capital reserves and have a material adverse effect on our business.
Our cash flow cycle includes the purchase of or deposits for raw materials, the purchase of inventories, the subsequent sale of the inventories, and the eventual collection of the resulting accounts receivable. As a result, our working capital requirements begin when we purchase, or make deposits on, raw materials and inventories and continue
45
until we ultimately collect the resulting receivables. The seasonality of our UGG brand business requires us to build fall and winter inventories in the quarters ending June 30th and September 30th to support sales for the UGG brand’s major selling seasons, which historically occur during the quarters ending September 30th and December 31st; whereas, the Teva and Sanuk brands build inventory levels beginning in the quarters ending December 31st and March 31st in anticipation of the spring selling season that occurs in the quarters ending March 31st and June 30th. Given the seasonality of our business, our working capital requirements fluctuate significantly throughout the year. The cash required to fund these working capital fluctuations has historically been provided using internal cash balances, cash from ongoing operating activities and short-term borrowings under our credit agreements.
We believe that our cash and cash equivalents balances, cash generated from operations, and available borrowings under the revolving credit facility governed by our Second Amended and Restated Credit Agreement with JPMorgan Chase Bank, National Association (as amended, Domestic Credit Facility), our revolving credit facility in China (as amended, China Credit Facility), and our revolving credit facility in Japan (Japan Credit Facility) will provide sufficient liquidity to enable us to meet our working capital requirements for at least the next 12 months. However, risks and uncertainties that could impact our liquidity include our worldwide sales, our profit margin, the perception of our brands among retail consumers and wholesale customers, our ability to respond to changes in consumer preferences, our ability to collect our receivables in a timely manner, our ability to effectively manage our inventories, our ability to respond to ongoing changes in the retail environment, unexpected changes in weather conditions, and the timing and extent of restructuring charges, among others. Furthermore, we may require additional cash resources due to changed business conditions or other future developments, including any investments or acquisitions we may decide to pursue. If our existing sources of liquidity are insufficient to satisfy our cash requirements, we may seek to borrow under our existing borrowing arrangements, seek new borrowing arrangements, or sell additional debt or equity securities. The sale of convertible debt or equity securities could result in additional dilution to our stockholders, and equity securities may have rights or preferences that are superior to those of our existing stockholders. The incurrence of additional indebtedness would result in additional debt service obligations, could result in operating and financial covenants that would restrict our operations, and could cause us to further encumber our assets. In addition, there can be no assurance that any additional financing will be available on acceptable terms, if at all. Although there are no other material present understandings, commitments or agreements with respect to the acquisition of any other businesses, we may evaluate acquisitions of other businesses or brands. Refer to Part I, Item 1A, "Risk Factors", for a discussion of additional factors that may affect our cash position and liquidity.
Capital Resources
Domestic Credit Facility
As of
March 31, 2017
, we had no outstanding balance and had outstanding letters of credit of approximately
$549
under our Domestic Credit Facility. The Domestic Credit Facility is a
five
-year,
$400,000
secured revolving credit facility. As of
March 31, 2017
, we had debt capacity of approximately
$378,000
out of
$400,000
, due to limitations on consolidated worldwide borrowings under the terms of the Domestic Credit Facility. At
May 30, 2017
, we had no outstanding balance and available borrowings of approximately
$378,000
under our Domestic Credit Facility.
China Credit Facility
As of
March 31, 2017
, we had no outstanding balance and available borrowings of approximately
$44,000
under our China Credit Facility. In October 2016, we entered into a third amendment to our China Credit Facility to provide for an increase in our uncommitted revolving line of credit of up to CNY
300,000
, or approximately
$44,000
. On
March 31, 2017
,
we entered into a fourth amendment to our China Credit Facility which removed Deckers Footwear (Shanghai) Co., LTD, leaving Deckers (Beijing) Trading Co., LTD as the remaining borrower. At
May 30, 2017
, we had
no
outstanding balance and available borrowings of approximately
$44,000
under our China Credit Facility.
Japan Credit Facility
As of
March 31, 2017
, we had
no
outstanding balance and available borrowings of approximately
$49,000
under our Japan Credit Facility. The Japan Credit Facility renews annually, and is guaranteed by Deckers Outdoor Corporation. We have renewed the Japan Credit Facility through January 31, 2018 under the terms of the original agreement. At
May 30, 2017
, we had no outstanding balance and available borrowings of approximately
$49,000
under our Japan Credit Facility.
46
Mortgage
As of
March 31, 2017
, we had an outstanding principal balance under the mortgage on our corporate headquarters property of approximately
$32,631
. The loan will mature and have a balloon payment due on
July 1, 2029
of approximately
$23,700
, in addition to any then-outstanding balance.
At March 31, 2017
, we were in compliance with all debt covenants under our borrowing arrangements and we remain in compliance at
May 30, 2017
.
Refer to Note 6, "Revolving Credit Facilities and Mortgage Payable", to our consolidated financial statements in Part IV of this Annual Report on Form 10-K for further information about our borrowing arrangements.
Off-Balance Sheet Arrangements
We do not have any off-balance sheet arrangements.
Contractual Obligations
The following table summarizes our contractual obligations at
March 31, 2017
and the effects such obligations are expected to have on liquidity and cash flow in future periods.
|
Payments Due by Period
|
|||||||||||||||||||
|
Total
|
Less than
1 Year
|
1-3 Years
|
3-5 Years
|
More than
5 Years
|
|||||||||||||||
|
Operating lease obligations (1)
|
$
|
311,470
|
|
$
|
51,319
|
|
$
|
90,301
|
|
$
|
67,680
|
|
$
|
102,170
|
|
||||
|
Purchase obligations for product (2)
|
392,716
|
|
392,716
|
|
—
|
|
—
|
|
—
|
|
|||||||||
|
Purchase obligations for sheepskin (3)
|
122,869
|
|
69,169
|
|
53,700
|
|
—
|
|
—
|
|
|||||||||
|
Other purchase obligations (4)
|
18,942
|
|
10,814
|
|
8,128
|
|
—
|
|
—
|
|
|||||||||
|
Mortgage obligation (5)
|
50,251
|
|
2,168
|
|
4,336
|
|
4,336
|
|
39,411
|
|
|||||||||
|
Unrecognized tax benefits (6)
|
9,928
|
|
856
|
|
3,273
|
|
5,799
|
|
—
|
|
|||||||||
|
Total
|
$
|
906,176
|
|
$
|
527,042
|
|
$
|
159,738
|
|
$
|
77,815
|
|
$
|
141,581
|
|
||||
|
(1)
|
Our operating lease obligations consist primarily of building leases for our retail locations, distribution centers, and regional offices, and include the cash lease payments of deferred rents.
|
|
(2)
|
Our purchase obligations for product consist mostly of open purchase orders. Outstanding purchase orders are primarily with our third-party manufacturers and most are expected to be paid within one year. We can cancel a significant portion of the purchase obligations under certain circumstances; however, the occurrence of such circumstances is generally limited. As a result, the amount does not necessarily reflect the dollar amount of our binding commitments or minimum purchase obligations, and instead reflects an estimate of our future payment obligations based on information currently available.
|
|
(3)
|
Our purchase obligations for sheepskin represent remaining commitments under existing supply agreements for sheepskin, which are subject to minimum volume commitments. We expect that purchases made by us under these agreements in the ordinary course of business will eventually exceed the minimum commitment levels.
|
|
(4)
|
Our other purchase obligations generally consist of non-cancellable minimum commitments for capital expenditures, obligations under service contracts and requirements to pay promotional expenses. Our promotional expenditures and service contracts are due periodically during fiscal years 2018 through 2020.
|
As of
March 31, 2017
, we had approximately $3,400 of commitments for future capital expenditures primarily related to information technology upgrades at our distribution centers in California and tenant improvements for retail store space and facilities in the US. We estimate that the capital expenditures for fiscal year 2018, including the aforementioned commitments, will not exceed $45,000. We anticipate these expenditures will primarily relate to the build-out of our DTC business and facilities and purchases
47
for IT infrastructure and system improvements. However, the actual amount of our future capital expenditures may differ significantly from this estimate depending on the timing of store openings or conversions from owned stores to partner retail stores, as well as unforeseen needs to replace existing assets and the timing of other expenditures.
|
(5)
|
Our mortgage obligation consists of a mortgage secured by our corporate headquarters property. The mortgage has a fixed interest rate of
4.928%
. Payments represent principal payments in an amount that amortizes the principal balance over a
30
-year period; however, the loan will mature and have a balloon payment due on
July 1, 2029
of approximately
$23,700
, in addition to any then-outstanding balance. Refer to Note 6, "Revolving Credit Facilities and Mortgage Payable", to our consolidated financial statements in Part IV of this Annual Report on Form 10-K for further information regarding our mortgage obligation.
|
|
(6)
|
The unrecognized tax benefits are related to uncertain tax positions taken in our income tax return that would impact the effective tax rate, if recognized. Refer to Note 5, "Income Taxes", to our consolidated financial statements in Part IV of this Annual Report on Form 10-K.
|
Refer to Note 7, "Commitments and Contingencies", to our consolidated financial statements in Part IV of this Annual Report on Form 10-K for further information on purchase obligations and minimum commitments.
Cash Flows
The following table summarizes our cash flows:
|
Years Ended March 31,
|
|||||||||||
|
2017
|
2016
|
2015
|
|||||||||
|
Net cash provided by operating activities
|
$
|
198,677
|
|
$
|
125,581
|
|
$
|
169,654
|
|
||
|
Net cash used in investing activities
|
(44,499
|
)
|
(67,221
|
)
|
(100,636
|
)
|
|||||
|
Net cash used in financing activities
|
(103,070
|
)
|
(36,340
|
)
|
(78,260
|
)
|
|||||
Operating Activities.
Our primary source of liquidity is net cash provided by operating activities, which is driven by the level of net income, non-cash adjustments and changes in working capital.
The increase in net cash provided by operating activities in fiscal year 2017 compared to fiscal year 2016 was primarily due to: (1) lower net income compared to fiscal year 2016, (2) the net impact of changes in non-cash impairment charges and related deferred tax positions, as well as additional restructuring charges, and (3) positive changes in working capital compared to the prior period primarily for inventory and accounts receivable. The change in cash used for inventory was lower compared to the prior period due to lower sales offset by improved inventory management. The change in accounts receivable levels relates to lower accounts receivable balances compared to the prior period due to lower sales and timing differences for collections.
The reduction in net cash provided by operating activities in fiscal year 2016 compared to fiscal year 2015 was primarily due to: (1) changes in inventory levels and trade accounts receivable, (2) the net impact of changes in noncash adjustments, primarily related to depreciation, amortization and accretion and restructuring charges, and (3) a decrease in net income. The change in inventory levels relates to lower than anticipated sales. The change in trade accounts receivable relates to payment delays from customers as a result of slower sell-through primarily caused by warmer weather. These cash flows were offset in part by changes in trade accounts payable in fiscal year 2016 compared to fiscal year 2015. The change in payables relates to the change in inventory levels.
Wholesale accounts receivable turnover decreased to 6.0 times in the year ended March 31, 2017 compared to 6.8 times for the year ended March 31, 2016 due to lower wholesale sales and the impact of higher average accounts receivable balances.
Inventory turnover decreased to 2.2 times in the year ended March 31, 2017 compared to 2.7 times in the year ended March 31, 2016 due to the impact of higher average inventory levels and lower cost of sales.
Investing Activities.
The reduction in net cash used in investing activities in fiscal year 2017 compared to fiscal year 2016 was primarily due to fewer capital expenditures for the business transformation project implementation and
48
business acquisition costs compared to the prior period, as well as the winding down of the build out of our new retail stores and lower costs for purchases of computer hardware and equipment. This was partially offset by the purchase of land adjacent to our corporate headquarters campus during fiscal year 2017.
Net cash used in investing activities for fiscal year 2016 resulted primarily from the purchases of property and equipment and our acquisition of the Koolaburra brand, partially offset by proceeds from the sale of the assets of the MOZO and TSUBO brands. The capital expenditures were primarily related to our business transformation project implementation, the build-out of our distribution center and retail stores, and purchases of computer hardware and software
Net cash used in investing activities for fiscal year 2015 resulted primarily from the purchases of property and equipment and purchase of intangibles. The capital expenditures were primarily related to infrastructure improvements to support our Omni-Channel transformation and international expansion, the build-out of our distribution center and retail stores, and purchases of computer hardware and software. The purchase of intangibles and other assets, net was related to the acquisition of our UGG brand distributor that sold to retailers in Germany.
Financing Activities.
The increase in net cash used in financing activities for fiscal year 2017 compared to fiscal year 2016 was primarily due to an increase in short-term borrowings under our revolving credit facilities, offset by repayments of short-term borrowings, as well as repurchases of our common stock and cash paid for contingent consideration related to the Sanuk brand acquisition.
Net cash used in financing activities for fiscal year 2016 resulted primarily from repayments of short-term borrowings and cash paid for repurchases of our common stock.
Net cash used in financing activities for fiscal year 2015 resulted primarily from repayments of short-term borrowings and cash paid for repurchases of our common stock. This was partially offset by short-term borrowings provided by our lines of credit and funding received from the mortgage obtained on our corporate headquarters property.
During fiscal years 2017, 2016 and 2015, we repurchased approximately
222,000
,
1,420,000
and
1,436,000
shares, respectively, of our common stock. In fiscal years 2017, 2016 and 2015, the cost of these repurchases was approximately
$12,572
,
$94,200
, and
$107,200
, respectively, at an average price per share of
$56.51
,
$66.32
, and
$74.68
, respectively.
At March 31, 2017
, the remaining approved amount under the January 2015 program was approximately
$65,294
.
Refer to Note 8, "Stockholders' Equity", to our consolidated financial statements in Part IV of this Annual Report on Form 10-K for further information on repurchases of our common stock.
Impact of Foreign Currency Exchange Rate Fluctuations
Foreign currency exchange rate fluctuations had an incremental negative impact on each of the years ended March 31, 2017, 2016 and 2015.
Refer to “Results of Operations”, above, the consolidated statements of comprehensive income (loss), Note 9, "Foreign Currency Exchange Rate Contracts and Hedging", to our consolidated financial statements in Part IV of this Annual Report on Form 10-K for further discussion of the impact of foreign currency exchange rate fluctuations.
Critical Accounting Policies and Estimates
Management must make certain estimates and assumptions that affect the amounts reported in the consolidated financial statements and notes, based upon historical experience, existing and known circumstances, authoritative accounting pronouncements and other factors that management believes to be reasonable, but actual results could differ materially from these estimates. Management believes the following critical accounting estimates are most significantly affected by judgments and estimates used in the preparation of our consolidated financial statements and notes thereto: allowances for doubtful accounts, estimated returns liability, sales discounts, and customer chargebacks; inventory valuations; valuation of goodwill, intangible and other long-lived assets; and performance-based stock compensation.
49
Refer to Note 1, "The Company and Summary of Significant Accounting Policies", to our consolidated financial statements in Part IV of this Annual Report on Form 10-K for a discussion of our significant accounting policies and use of estimates, as well as the impact of recent accounting pronouncements.
Accounts Receivable Allowances and Reserves
The following table summarizes data related to the critical accounting estimates for accounts receivable allowances and reserves, which are discussed below:
|
As of March 31,
|
|||||||||||||
|
2017
|
2016
|
||||||||||||
|
Amount
|
% of Gross
Trade Accounts Receivable |
Amount
|
% of Gross
Trade Accounts
Receivable
|
||||||||||
|
Gross trade accounts receivable
|
$
|
190,997
|
|
100
|
%
|
$
|
190,349
|
|
100
|
%
|
|||
|
Allowance for doubtful accounts
|
5,979
|
|
3.1
|
|
5,494
|
|
2.9
|
|
|||||
|
Allowance for sales discounts
|
3,100
|
|
1.6
|
|
2,672
|
|
1.4
|
|
|||||
|
Allowance for chargebacks
|
7,028
|
|
3.7
|
|
4,968
|
|
2.6
|
|
|||||
|
Amount
|
% of Net Sales
|
Amount
|
% of Net Sales
|
||||||||||
|
Net sales for the three months ended
|
$
|
369,465
|
|
100
|
%
|
$
|
378,635
|
|
100
|
%
|
|||
|
Allowance for sales returns
|
16,247
|
|
4.4
|
|
17,061
|
|
4.5
|
|
|||||
|
Sales returns liability
|
2,736
|
|
0.7
|
|
1,889
|
|
0.5
|
|
|||||
Allowance for Doubtful Accounts
We provide a reserve against trade accounts receivable for estimated losses that may result from customers' inability to pay. We determine the amount of the reserve by analyzing known uncollectible accounts, aged trade accounts receivables, economic conditions and forecasts, historical experience and the customers' credit-worthiness. Trade accounts receivable that are subsequently determined to be uncollectible are charged or written off against this reserve. The reserve includes specific reserves for accounts, which all or a portion of are identified as potentially uncollectible, plus a non-specific reserve for the balance of accounts based on our historical loss experience. Reserves have been established for all projected losses of this nature. The slight increase in the allowance for doubtful accounts over the prior year is a result of the ongoing difficult retail environment experienced by certain of our customers which lead to an increased risk that the related outstanding receivables may not be collected. Our use of different estimates and assumptions could produce different financial results. For example, a 1.0% change in the rate used to estimate the reserve for the accounts we consider to have credit risk and are not specifically identified as uncollectible would change the allowance for doubtful accounts at
March 31, 2017
by approximately $1,000.
Allowance for Sales Discounts
A significant portion of our wholesale sales and resulting trade accounts receivable reflects a discount that our customers may take, generally based upon meeting certain order, shipment and payment terms. We use the amount of the discounts that are available to be taken against the period-end trade accounts receivable to estimate and record a corresponding reserve for sales discounts.
Allowance for Chargebacks
When our wholesale customers pay their invoices, they often take deductions for chargebacks against their invoices, which are often valid, and can include chargebacks for price differences, discounts or markdowns and short shipments. Therefore, we record an allowance for the balance of chargebacks that are outstanding in our accounts receivable balance as of the end of each period, along with an estimated reserve for chargebacks that have not yet been taken against outstanding accounts receivable balances. This estimate is based on historical trends of the timing and amount of chargebacks taken against wholesale customer invoices. The increase in the allowance for chargebacks compared to the prior year was primarily due to higher customer chargebacks on wholesale sales in Europe resulting from our transition to the new European 3PL.
50
Allowance for Sales Returns and Sales Returns Liability
We record an allowance for anticipated future returns of goods shipped prior to period end and a liability for anticipated returns of goods sold direct to consumers. In general, we accept returns for damaged or defective products. We also have a policy whereby we accept returns from our DTC customers for a 30-day period. We base the amounts of the allowance and liability on any approved customer requests for returns, historical returns experience, and any recent events that could result in a change from historical returns rates, among other factors. The decrease in the sales return reserve over the prior year was primarily due to lower customer requests for returns. Our use of different estimates and assumptions could produce different financial results. For example, a 1.0% change in the rate used to estimate the percentage of sales expected to ultimately be returned, would change the allowance and liability reserves for total returns at
March 31, 2017
by approximately $2,000.
Inventory Write-Downs
We review inventory on a regular basis for excess, obsolete, and impaired inventory to evaluate write-downs to the lower of cost or expected future net selling prices. Inventories are stated at
$298,851
and
$299,911
, net of inventory write-downs of $7,638 and $7,303 as of
March 31, 2017
and
2016
, respectively. The amount of inventory write-downs as a percentage of inventories was 2.5% and 2.4% as of
March 31, 2017
and
2016
,
respectively. Our use of different estimates and assumptions could produce different financial results. For example, a 10.0% change in the estimated selling prices of our potentially obsolete inventory would change the inventory write-down reserve at
March 31, 2017
by approximately $800.
Valuation of Goodwill, Intangible and Other Long-Lived Assets
We assess the impairment of goodwill and indefinite-lived intangible assets on an annual basis using either a qualitative or quantitative approach. We evaluate the Sanuk brand's goodwill and the Teva brand's indefinite-lived trademarks for impairment at October 31st of each year, and evaluate the UGG brand and other brands’ wholesale reportable operating segment goodwill for impairment at December 31st of each year. The timing of the annual impairment evaluation is prescribed by applicable accounting guidance. We also perform interim impairment evaluations of goodwill and indefinite-lived assets if events or changes in circumstances between annual tests indicate that additional testing is warranted to determine if goodwill may be impaired. Where we use the qualitative assessment, first we determine if, based on qualitative factors, it is more likely than not that an impairment exists. Factors considered include historical financial performance, macroeconomic and industry conditions and the legal and regulatory environment. If the qualitative assessment indicates that it is more likely than not that an impairment exists, then a quantitative assessment is performed. The quantitative assessment requires an analysis of several best estimates and assumptions, including future sales and operating results, and other factors that could affect fair value or otherwise indicate potential impairment. We also consider the reporting units' projected ability to generate income from operations and positive cash flow in future periods, as well as perceived changes in consumer demand, and acceptance of products or factors impacting the industry generally. The fair value assessment could change materially if different estimates and assumptions were used.
Definite-lived intangible and other long-lived assets, such as property and equipment and leasehold improvements, subject to amortization, are reviewed for impairment whenever events or changes in circumstances indicate that the carrying amount of an asset or asset group may not be recoverable based on estimated undiscounted cash flows. If impaired, the asset or asset group is written down to fair value based either on discounted cash flows or appraised values.
At December 31, 2016 and 2015, we performed our annual impairment tests and evaluated the UGG brand and other brands' wholesale reportable operating segment goodwill, and at October 31, 2016 and 2015 we evaluated the Teva brand's indefinite-lived trademarks. Based on comparing the carrying amounts of the UGG brand and other brands' goodwill, as well as the Teva brand's trademarks, to the brands' fiscal year
2017
and
2016
sales and operating results and the brands' long-term forecasts of sales and operating results as of their evaluation dates, we concluded that the carrying amounts of the UGG brand and other brands' goodwill, as well as the Teva brand's trademarks, were not impaired.
During the third quarter of the
year ended March 31, 2017
, we performed the annual impairment assessment of the Sanuk brand's wholesale reportable operating segment goodwill as of October 31, 2016 with the assistance of a third party valuation firm, concluded that the asset was fully impaired and recorded a
$113,944
non-cash impairment charge to the Sanuk brand's wholesale reportable operating segment goodwill during the third quarter of fiscal year
51
2017, which was reflected in SG&A expenses in the consolidated statements of comprehensive income (loss). During the third quarter of the year ended March 31, 2016, we performed the annual impairment test assessment of the Sanuk brand's wholesale reportable operating segment goodwill as of October 31, 2015, concluding that the carrying amount of the Sanuk brand's goodwill was not impaired, based on a comparison of the carrying amounts of the Sanuk brand's goodwill to the fiscal year 2016 sales and operating results and the brand's long-term forecasts of sales and operating results as of October 31, 2015. The change in the sales forecasts between the annual impairment testing dates of October 31, 2016 (during fiscal year 2017) and October 31, 2015 (during fiscal year 2016) was primarily the result of lower-than-forecasted sales, lower market multiples for non-athletic footwear and apparel, and a more limited view of international and domestic expansion opportunities for the brand given the changing retail environment.
During the third quarter of the
year ended March 31, 2017
, we evaluated the Sanuk brand's definite long-lived assets for indicators of impairment, primarily as a result of the goodwill impairment discussed above. The analysis determined that the Sanuk brand's amortizable patent under the Sanuk brand's wholesale reportable operating segment was fully impaired and we recorded a non-cash impairment charge to the patent of $
4,086
during the third quarter of fiscal year 2017, which was reflected in SG&A expenses in the consolidated statements of comprehensive income (loss).
During the third quarter of the
year ended March 31, 2017
, we recorded an impairment for other intangible assets in the DTC reportable operating segment of
$4,743
due to retail-related impairments primarily driven by a decline in market rental rates for European retail stores, which was reflected in SG&A expenses in the consolidated statements of comprehensive income (loss).
Refer to Note 3, "Goodwill and Other Intangible Assets", to our consolidated financial statements in Part IV of this Annual Report on Form 10-K for further information on our goodwill and intangible assets and annual impairment analysis results.
During the years ended
March 31, 2017
and
2016
, we recognized total impairment losses for retail store related fixed assets and software of approximately
$11,300,000
and approximately
$19,000,000
, respectively. Our valuation methodologies used
as of March 31, 2017
did not change from the prior years.
Performance-Based Compensation
In accordance with applicable accounting guidance, we recognize performance-based compensation expense, including performance-based stock compensation and annual cash bonus compensation, when it is deemed probable that the applicable performance criteria will be met. We evaluate the probability of achieving the applicable performance criteria on a quarterly basis. Our probability assessment can fluctuate from quarter to quarter as we assess our projected results against performance criteria. As a result, the related performance-based compensation expense we recognize may also fluctuate from period to period.
At the beginning of each fiscal year, our Compensation Committee reviews our operating results from the prior fiscal year, as well as the financial and strategic plan for future fiscal years. The committee then establishes specific annual financial goals and specific strategic goals for each executive. Vesting of performance-based stock compensation or recognition of cash bonus compensation is based on our achievement of certain targets for annual revenue, operating income, pre-tax income, and earnings per share, as well as achievement of pre-determined individual financial performance criteria that is tailored to individual employees based on their role and responsibilities with us. The performance criteria, as well as our annual targets, differ each year and are based upon many factors, including our current business stage and strategies, our recent financial and operating performance, expected growth rates over the prior year's performance, business and general economic conditions and market and peer group analysis.
Performance-based compensation expense decreased approximately $1,100 in fiscal year 2017 compared to fiscal year 2016. As of March 31, 2017, the performance criteria relating to our fiscal year 2017 performance-based compensation were not achieved. In fiscal year 2016, performance-based compensation expense decreased approximately $18,000 compared to fiscal year 2015. In fiscal year 2016, the performance criteria of all performance-based stock compensation were not achieved and accordingly, we reversed expense for those awards, compared to the fiscal year 2015 performance-based stock compensation where the performance criteria were partially achieved.
Refer to Note 8, "Stockholders' Equity", to our consolidated financial statements in Part IV of this Annual Report on Form 10-K for further information on our performance-based stock compensation.
52
Commodity Price Risk.
We purchase certain materials that are affected by commodity prices, the most significant of which is sheepskin. The supply of sheepskin used in certain UGG brand products is in high demand and there are a limited number of suppliers able to meet our expectations for the quantity and quality of sheepskin required. While there had been significant changes in the price of sheepskin in the years leading up to 2013, the price of sheepskin has recently stabilized. We use purchasing contracts, pricing arrangements, and refundable deposits to attempt to manage price volatility as an alternative to hedging commodity prices. The purchasing contracts and pricing arrangements we use may result in purchase obligations, which are not reflected in our consolidated balance sheets. Refer to Note 7, "Commitments and Contingencies", to our consolidated financial statements in Part IV of this Annual Report on Form 10-K for further information on our sheepskin contracts. In the event of significant commodity cost increases, we will likely not be able to adjust our selling prices sufficiently to eliminate the impact of such increases on our margins.
Foreign Currency Exchange Rate Risk.
We face market risk to the extent that foreign currency exchange rate fluctuations affect our foreign assets, liabilities, revenues and expenses. We hedge certain foreign currency exchange rate risk from existing assets and liabilities. Other than changes in the amount of sales, expenses, and financial positions denominated in foreign currencies, we do not believe that there has been a material change in the nature of our primary market risk exposures, including the categories of market risk to which we are exposed and the particular markets that present the primary risk of loss. There has been recent increased volatility with respect to the exchange rates between US dollars and both British Pounds and Euros. This increased volatility may be due in part to tax, importation and other policies being contemplated by the US government, the withdrawal by the UK from the European Union (commonly referred to as Brexit), the recent elections in the Netherlands and France, and the upcoming elections in the UK in June 2017 and Germany in September 2017. We do not know whether this level of volatility will continue or increase in the near or long term. At
May 30, 2017
, we do not know of or expect there to be any material change in the general nature of our primary market risk exposure in the near term.
As of
March 31, 2017
, the notional amount of foreign currency exchange rate contracts was
$100,000
and the fair value of
$1,365
was recorded in other current assets in the consolidated balance sheets. As of
March 31, 2017
, a hypothetical 10.0% foreign currency exchange rate fluctuation would cause the fair value of our financial instruments to increase or decrease by approximately $10,000. Sensitivity analyses do not consider the actions we may take to mitigate our exposure to changes, nor do they consider the effect such hypothetical changes may have on overall economic activity. As our international operations grow and we increase purchases and sales in foreign currencies, we will continue to evaluate our hedging policy and may utilize additional derivative instruments, as needed, to hedge our foreign currency exchange rate risk. We do not use foreign currency exchange rate contracts for trading purposes. Subsequent to
March 31, 2017
, we entered into Non-Designated Derivative Contracts with notional amounts totaling approximately
$34,000
, which are expected to mature over the next
nine
months, and Designated Derivative Contracts with notional amounts totaling approximately
$21,000
, which are expected to mature over the next
12
months. Refer to Note 9, "Foreign Currency Exchange Rate Contracts and Hedging", to our consolidated financial statements in Part IV of this Annual Report on Form 10-K for further information on our foreign currency exchange rate contracts.
Although the majority of our sales and inventory purchases are denominated in US currency, these sales and inventory purchases may be impacted by fluctuations in the exchange rates between the US dollar and the local currencies in the international markets where our products are sold and manufactured. Our foreign currency exchange rate risk is generated primarily from our European and Asian operations. Approximately
$539,000
, or
30.1%
, and
$526,000
, or
28.1%
, of our total net sales for the years ended
March 31, 2017
and 2016, respectively, were denominated in foreign currencies. As we hold more cash and other monetary assets and liabilities in foreign currencies, we are exposed to financial statement transaction gains and losses as a result of re-measuring the financial positions held in foreign currencies into US dollars for subsidiaries that are US dollar functional and also from re-measuring the financial positions held in US dollars and foreign currencies into the functional currency of subsidiaries that are non-US dollar functional. We re-measure monetary assets and liabilities denominated in foreign currencies into US dollars using the exchange rate as of the end of the reporting period. In addition, certain of our foreign subsidiaries’ local currency is their designated functional currency, and we translate those subsidiaries’ assets and liabilities into US dollars using the exchange rates as of the end of the reporting period, which results in financial statement translation gains and losses recognized in other comprehensive income (loss). Foreign currency exchange rate fluctuations affect our reported profits and can distort comparisons from year to year. In addition, if the US dollar strengthens, it may result in increased pricing pressure on our foreign distributors.
53
Interest Rate Risk.
Our market risk exposure with respect to financial instruments is tied to changes in the prime rate, the federal funds effective rate, and the London Interbank Offered Rate (LIBOR). At our election, interest under our Domestic Credit Facility is tied to adjusted LIBOR or the Alternative Base Rate (ABR), and is variable based on our total adjusted leverage ratio each quarter. The ABR is defined as the rate per annum equal to the greater of (1) the prime rate, (2) the federal funds effective rate plus
0.50%
and (3) adjusted LIBOR for a one-month interest period plus
1.00%
. As of
March 31, 2017
, the effective LIBOR and ABR rates were
2.48%
and
4.50%
, respectively. Our China Credit Facility provides for interest on outstanding borrowings at a rate based on
110.0%
of the People’s Bank of China rate, which was
4.35%
as of
March 31, 2017
. Our Japan Credit Facility provides for interest on outstanding borrowings at a rate based on the Tokyo Interbank Offered Rate for three months plus
0.40%
, and total interest was
0.46%
as of
March 31, 2017
. Assuming average borrowings for the period equal to the trailing 12-month average, a hypothetical 1.0% increase in interest rates under each of the three revolving credit facility agreements would result in an aggregate increase to interest expense of approximately $1,400 for the year ended
March 31, 2017
.
The Consolidated Financial Statements, the Financial Statement Schedule, and the Reports of Independent Registered Public Accounting Firm, are filed with this Annual Report on Form 10-K in a separate section following Part IV, as shown on the index under Item 15, "Exhibits and Financial Statement Schedule", of this Annual Report on Form 10-K.
a) Disclosure Controls and Procedures
We maintain a system of disclosure controls and procedures (as defined in Rule 13a-15(e) under the Securities Exchange Act of 1934) which are designed to provide reasonable assurance that information required to be disclosed in the reports that we file or submit under the Exchange Act is recorded, processed, summarized and reported within the time periods specified in the Securities and Exchange Commission's rules and forms. In designing and evaluating our disclosure controls and procedures, our management recognized that any system of controls and procedures, no matter how well designed and operated, can provide only reasonable assurance of achieving the desired control objectives, as ours are designed to do, and management necessarily was required to apply its judgment in evaluating the cost-benefit relationship of possible controls and procedures. In addition, the design of any system of controls is also based in part upon certain assumptions about the likelihood of future events, and there can be no assurance that any design will succeed in achieving its stated goals under all potential future conditions. Over time, controls may become inadequate because of changes in conditions, or the degree of compliance with policies or procedures may deteriorate. Because of the inherent limitations in a cost-effective control system, misstatements due to error or fraud may occur and not be detected.
We carried out an evaluation, under the supervision and with the participation of management, including the principal executive officer and the principal financial officer, of the effectiveness of the design and operation of our disclosure controls and procedures
as of March 31, 2017
. Based upon that evaluation, the principal executive officer and the principal financial officer concluded that our disclosure controls and procedures were effective at the reasonable assurance level as of March 31, 2017.
b) Management's Report on Internal Control over Financial Reporting
Management is responsible for establishing and maintaining adequate internal control over financial reporting (as defined in Rule 13a-15(f) under the Exchange Act). Our internal control over financial reporting is a process designed under the supervision of our principal executive officer and principal financial officer to provide reasonable assurance regarding the reliability of financial reporting and the preparation of our financial statements for external reporting purposes in accordance with US GAAP. Because of inherent limitations, internal control over financial reporting may not prevent or detect misstatements. Also, projections of any evaluation of effectiveness to future periods are subject to the risk that controls may become inadequate because of changes in conditions, or that the degree of compliance with the policies or procedures may deteriorate.
At March 31, 2017
, our management, including our principal executive officer and principal financial officer, assessed the effectiveness of our internal control over financial reporting using the criteria set forth in
Internal Control — Integrated Framework (2013)
issued by the Committee of Sponsoring Organizations of the Treadway Commission (commonly referred to as COSO). Based on this assessment, our management concluded that,
as of March 31, 2017
,
54
our internal control over financial reporting was effective based on those criteria. The registered public accounting firm that audited our consolidated financial statements in Part IV of this Annual Report on Form 10-K has issued an attestation report on our internal control over financial reporting. Please refer to the section entitled “Report of Independent Registered Public Accounting Firm” on page F-3 of this Annual Report on Form 10-K.
c) Internal Control over Financial Reporting
There were no changes in our internal control over financial reporting identified in management’s evaluation pursuant to Rules 13a-15(d) or 15d-15(d) of the Exchange Act during the
year ended March 31, 2017
that have materially affected, or are reasonably likely to materially affect, our internal control over financial reporting.
d) Principal Executive Officer and Principal Financial and Accounting Officer Certifications
The certifications of our Principal Executive Officer and our Principal Financial and Accounting Officer required by Rule 13a-14(a) of the Exchange Act are filed as Exhibits 31.1, 31.2 and 32 to this Annual Report on Form 10-K. This Part II, Item 9A should be read in conjunction with such certifications for a more complete understanding of the topics presented.
55
References in this Annual Report on Form 10-K to "Deckers", "we", "our", "us", or the "Company" refer to Deckers Outdoor Corporation, together with its consolidated subsidiaries.
The defined periods for the fiscal years ended March 31, 2017, 2016, and 2015 are stated in Items 10, 11, 12, 13, and 14 herein as "year ended" or "years ended".
The information required by this item will be disclosed in our definitive proxy statement on Schedule 14A (Proxy Statement) for our 2017 annual meeting of stockholders and is incorporated herein by reference. The Proxy Statement will be filed with the Securities and Exchange Commission within 120 days after the end of the
year ended March 31, 2017
pursuant to Regulation 14A under the Exchange Act.
The information required by this item will be disclosed in the Proxy Statement, and is incorporated herein by reference.
The information required by this item will be disclosed in the Proxy Statement, and is incorporated herein by reference.
The information required by this item will be disclosed in the Proxy Statement, and is incorporated herein by reference.
The information required by this item will be disclosed in the Proxy Statement, and is incorporated herein by reference.
56
References in this Annual Report on Form 10-K to "Deckers", "we", "our", "us", or the "Company" refer to Deckers Outdoor Corporation, together with its consolidated subsidiaries.
The defined periods for the fiscal years ended March 31, 2017, 2016, and 2015 are stated in Item 15 herein as "year ended" or "years ended".
Refer to the “Index to Consolidated Financial Statements and Financial Statement Schedule” on page F-1 of this Annual Report on Form 10-K for our Consolidated Financial Statements and the Reports of Independent Registered Public Accounting Firm.
|
Exhibit
Number |
Description of Exhibit
|
|
|
3.1
|
Amended and Restated Certificate of Incorporation of Deckers Outdoor Corporation, as amended through May 27, 2010 (Exhibit 3.1 to the Registrant's Form 10-Q filed on August 8, 2011 and incorporated by reference herein)
|
|
|
*3.2
|
Amended and Restated Bylaws of Deckers Outdoor Corporation, as updated through May 24, 2016
|
|
|
10.1
|
Lease Agreement, dated September 15, 2004, by and between Mission Oaks Associates, LLC and Deckers Outdoor Corporation for distribution center at 3001 Mission Oaks Blvd., Camarillo, CA 93012 (Exhibit 10.37 to the Registrant's Form 10-K filed on March 16, 2005 and incorporated by reference herein)
|
|
|
10.2
|
First Amendment to Lease Agreement, dated December 1, 2004, by and between Mission Oaks Associates, LLC and Deckers Outdoor Corporation for distribution center at 3001 Mission Oaks Blvd., Camarillo, CA 93012 (Exhibit 10.38 to the Registrant's Form 10-K filed on March 16, 2005 and incorporated by reference herein)
|
|
|
10.3
|
Amendment to Lease Agreement, dated September 1, 2011, by and between Mission Oaks Associates, LLC and Deckers Outdoor Corporation for distribution center at 3001 Mission Oaks Blvd., Camarillo, CA 93012 (Exhibit 10.23 to the Registrant's Form 10-K filed on February 29, 2012 and incorporated by reference herein)
|
|
|
10.4
|
Amendment to Lease Agreement, dated September 1, 2011, by and between 450 N. Baldwin Park Associates, LLC and Deckers Outdoor Corporation for distribution center at 3175 Mission Oaks Blvd., Camarillo, CA 93012 (Exhibit 10.24 to the Registrant's Form 10-K filed on February 29, 2012 and incorporated by reference herein)
|
|
|
10.5
|
Lease Agreement, dated December 5, 2013, by and between Moreno Knox, LLC and Deckers Outdoor Corporation for distribution center at 17791 Perris Blvd., Moreno Valley, CA 92551 (Exhibit 10.6 to the Registrant’s Form 10-K filed on March 3, 2014 and incorporated by reference herein)
|
|
|
#10.6
|
Deckers Outdoor Corporation 2006 Equity Incentive Plan (Appendix A to the Registrant's Definitive Proxy Statement filed on April 21, 2006 and incorporated by reference herein)
|
|
|
#10.7
|
First Amendment to Deckers Outdoor Corporation 2006 Equity Incentive Plan (Appendix A to the Registrant's Definitive Proxy Statement filed on April 9, 2007 and incorporated by reference herein)
|
|
|
#10.8
|
Deckers Outdoor Corporation Amended and Restated Deferred Stock Unit Compensation Plan, a Sub Plan under the 2006 Equity Incentive Plan, adopted by the Board of Directors on December 14, 2010 (Exhibit 10.24 to the Registrant's Form 10-K filed on March 1, 2011 and incorporated by reference herein)
|
|
|
#10.9
|
Deckers Outdoor Corporation Amended and Restated Deferred Compensation Plan, effective August 1, 2013 (Exhibit 10.10 to the Registrant’s Form 10-K filed on March 3, 2014 and incorporated by reference herein)
|
|
|
#10.10
|
Form of Deckers Outdoor Corporation Management Incentive Program under the 2006 Equity Incentive Plan (Exhibit 10.28 to the Registrant’s Form 10-K filed on March 1, 2013 and incorporated by reference herein)
|
|
57
|
Exhibit
Number
|
Description of Exhibit
|
|
|
#10.11
|
Form of Restricted Stock Unit Award Agreement (Level 2) under the 2006 Equity Incentive Plan (Exhibit 10.3 to the Registrant's Form 8-K filed on May 11, 2007 and incorporated by reference herein)
|
|
|
#10.12
|
Form of Restricted Stock Unit Award Agreement (Level III) under the 2006 Equity Incentive Plan (Exhibit 10.1 to the Registrant's Form 8-K filed on June 28, 2011 and incorporated by reference herein)
|
|
|
#10.13
|
Form of Stock Appreciation Rights Award Agreement (Level 2) under the 2006 Equity Incentive Plan (Exhibit 10.5 to the Registrant's Form 8-K filed on May 11, 2007 and incorporated by reference herein)
|
|
|
#10.14
|
Form of Restricted Stock Unit Award Agreement (2012 LTIP) under the 2006 Equity Incentive Plan (Exhibit 10.1 to the Registrant's Form 8-K filed on May 31, 2012 and incorporated by reference herein)
|
|
|
#10.15
|
Form of Restricted Stock Unit Award Agreement (2013 LTIP) under the 2006 Equity Incentive Plan (Exhibit 10.1 to the Registrant's Form 8-K filed on December 19, 2013 and incorporated by reference herein)
|
|
|
#10.16
|
Form of Restricted Stock Unit Award Agreement (2014 LTIP) under the 2006 Equity Incentive Plan (Exhibit 10.1 to the Registrant's Form 8-K filed on September 24, 2014 and incorporated by reference herein)
|
|
|
#10.17
|
Form of Stock Unit Award Agreement under the 2006 Equity Incentive Plan (Exhibit 10.27 to the Registrant’s Form 10-K filed on March 1, 2013 and incorporated by reference herein)
|
|
|
#10.18
|
Form of Stock Unit Award Agreement under the 2006 Equity Incentive Plan (Exhibit 10.28 to the Registrant’s Form 10-K filed on March 3, 2014 and incorporated by reference herein)
|
|
|
*#10.19
|
Form of Change of Control and Severance Agreement
|
|
|
#10.20
|
Consulting Agreement and General Release, dated January 16, 2015, by and between Zohar Ziv and Deckers Outdoor Corporation (Exhibit 10.1 to the Registrant’s Form 8-K filed on January 21, 2015 and incorporated by reference herein)
|
|
|
#10.21
|
Consulting Agreement and General Release, dated May 6, 2015, by and between Constance Rishwain and Deckers Outdoor Corporation (Exhibit 10.1 to the Registrant’s Form 8-K filed on May 12, 2015 and incorporated by reference herein)
|
|
|
#10.22
|
Consulting Agreement and General Release, dated May 24, 2016 and effective May 31, 2016, entered into by and between Deckers Outdoor Corporation and Angel Martinez (Exhibit 10.1 to the Registrant’s Form 8-K filed on May 27, 2016 and incorporated by reference herein)
|
|
|
10.23
|
Second Amended and Restated Credit Agreement, dated November 13, 2014, by and among Deckers Outdoor Corporation, as Borrower, JPMorgan Chase Bank, National Association, as Administrative Agent, Comerica Bank and HSBC Bank USA, National Association, as Co-Syndication Agents, and the lenders from time to time party thereto (Exhibit 10.1 to the Registrant’s Form 8-K filed on November 19, 2014 and incorporated by reference herein)
|
|
|
10.24
|
Term Loan Agreement, dated July 9, 2014, by and among Deckers Cabrillo, LLC, as Borrower and California Bank & Trust, as Lender (Exhibit 10.1 to the Registrant’s Form 8-K filed on July 15, 2014 and incorporated by reference herein)
|
|
|
10.25
|
Continuing Guaranty Agreement, dated July 9, 2014, by and among Deckers Outdoor Corporation and California Bank & Trust (Exhibit 10.2 to the Registrant’s Form 8-K filed on July 15, 2014 and incorporated by reference herein)
|
|
58
|
Exhibit
Number |
Description of Exhibit
|
|
|
10.26
|
Deed of Trust, Assignment of Leases and Rents and Security Agreement (including Fixture Filing), dated July 9, 2014, executed by Deckers Cabrillo, LLC (Exhibit 10.3 to the Registrant’s Form 8-K filed on July 15, 2014 and incorporated by reference herein)
|
|
|
#10.27
|
Deckers Outdoor Corporation 2015 Employee Stock Purchase Plan (Appendix A to the Registrant's Definitive Proxy Statement filed on July 29, 2015 and incorporated by reference herein)
|
|
|
#10.28
|
Deckers Outdoor Corporation 2015 Stock Incentive Plan (Appendix B to the Registrant's Definitive Proxy Statement filed on July 29, 2015 and incorporated by reference herein)
|
|
|
#10.29
|
Management Incentive Plan (Exhibit 10.1 to the Registrant's Form 10-Q filed on August 10, 2015 and incorporated by reference herein)
|
|
|
#10.30
|
2016 Non-Vested Stock Unit (NSU) Award Agreement (Exhibit 10.2 to the Registrant's Form 10-Q filed on August 10, 2015 and incorporated by reference herein)
|
|
|
#10.31
|
Form of Restricted Stock Unit Award Agreement under 2015 Stock Incentive Plan (2016 LTIP Financial Performance Award) (Exhibit 10.1 to the Registrant’s Form 8-K filed on November 24, 2015 and incorporated by reference herein)
|
|
|
#10.32
|
2017 Performance-Based Annual Restricted Stock Units Agreement (Exhibit 10.1 to the Registrant’s Form 10-Q filed on August 9, 2016 and incorporated by reference herein)
|
|
|
#10.33
|
2017 Time-Based Annual Restricted Stock Units Agreement (Exhibit 10.2 to the Registrant’s Form 10-Q filed on August 9, 2016 and incorporated by reference herein)
|
|
|
#10.34
|
Form of Performance Stock Option Agreement under 2015 Stock Incentive Plan (Exhibit 10.1 to the Registrant’s Form 8-K filed on November 28, 2016 and incorporated by reference herein)
|
|
|
*21.1
|
Subsidiaries of Registrant
|
|
|
*23.1
|
Consent of Independent Registered Public Accounting Firm
|
|
|
*31.1
|
Certification of the Principal Executive Officer Pursuant to Section 302 of the Sarbanes-Oxley Act of 2002
|
|
|
*31.2
|
Certification of the Principal Financial Officer Pursuant to Section 302 of the Sarbanes-Oxley Act of 2002
|
|
|
**32
|
Certification Pursuant to 18 U.S.C. Section 1350 Adopted Pursuant to Section 906 of the Sarbanes-Oxley Act of 2002
|
|
|
*101.1
|
The following materials from the Company's Annual Report on Form 10-K for the annual period ended March 31, 2016, formatted in XBRL (eXtensible Business Reporting Language); (i) Consolidated Balance Sheets at March 31, 2016 and March 31, 2015; (ii) Consolidated Statements of Comprehensive Income (Loss) for the years ended March 31, 2016 and March 31, 2015, quarter transition period ended March 31, 2014, and year ended December 31, 2013; (iii) Consolidated Statements of Cash Flows for the years ended March 31, 2016 and March 31, 2015, quarter transition period ended March 31, 2014, and year ended December 31, 2013, and (iv) Notes to Consolidated Financial Statements.
|
|
* Filed herewith.
** Furnished herewith.
# Management contract or compensatory plan or arrangement.
59
SIGNATURES
Pursuant to the requirements of Section 13 or 15(d) of the Securities Exchange Act of 1934, as amended, the Registrant has duly caused this report to be signed on its behalf by the undersigned, thereunto duly authorized.
|
DECKERS OUTDOOR CORPORATION
(Registrant)
|
|
/s/ THOMAS A. GEORGE
|
|
Thomas A. George
Chief Financial Officer (Principal Financial and Accounting Officer)
|
Date:
May 30, 2017
Pursuant to the requirements of the Securities Exchange Act of 1934, as amended, this report has been signed below by the following persons on behalf of the Registrant and in the capacities and on the dates indicated.
|
/s/ DAVID POWERS
|
Chief Executive Officer (Principal Executive Officer), President and Director
|
May 30, 2017
|
|
David Powers
|
||
|
/s/ THOMAS A. GEORGE
|
Chief Financial Officer
(Principal Financial and Accounting Officer)
|
May 30, 2017
|
|
Thomas A. George
|
||
|
/s/ ANGEL R. MARTINEZ
|
Chairman of the Board
|
May 30, 2017
|
|
Angel R. Martinez
|
||
|
/s/ MICHAEL F. DEVINE, III
|
Director
|
May 30, 2017
|
|
Michael F. Devine, III
|
||
|
/s/ KARYN O. BARSA
|
Director
|
May 30, 2017
|
|
Karyn O. Barsa
|
||
|
/s/ JOHN M. GIBBONS
|
Director
|
May 30, 2017
|
|
John M. Gibbons
|
||
|
/s/ JOHN G. PERENCHIO
|
Director
|
May 30, 2017
|
|
John G. Perenchio
|
||
|
/s/ LAURI M. SHANAHAN
|
Director
|
May 30, 2017
|
|
Lauri M. Shanahan
|
||
|
/s/ JAMES QUINN
|
Director
|
May 30, 2017
|
|
James Quinn
|
||
|
/s/ BONITA C. STEWART
|
Director
|
May 30, 2017
|
|
Bonita C. Stewart
|
||
|
/s/ NELSON C. CHAN
|
Director
|
May 30, 2017
|
|
Nelson C. Chan
|
||
60
DECKERS OUTDOOR CORPORATION AND SUBSIDIARIES
INDEX TO CONSOLIDATED FINANCIAL STATEMENTS
AND FINANCIAL STATEMENT SCHEDULE
|
Page
|
|
|
Consolidated Financial Statements:
|
|
|
Reports of Independent Registered Public Accounting Firm
|
|
|
Consolidated Balance Sheets as of March 31, 2017 and 2016
|
|
|
Consolidated Statements of Comprehensive Income (Loss) for the years ended March 31, 2017, 2016 and 2015
|
|
|
Consolidated Statements of Stockholders' Equity for the years ended March 31, 2017, 2016 and 2015
|
|
|
Consolidated Statements of Cash Flows for the years ended March 31, 2017, 2016 and 2015
|
|
|
Notes to Consolidated Financial Statements
|
|
|
Consolidated Financial Statement Schedule:
|
|
|
Schedule II - Total Valuation and Qualifying Accounts for the years ended March 31, 2017, 2016 and 2015
|
|
All other schedules are omitted because they are not applicable or the required information is shown in the consolidated financial statements or notes thereto.
The defined periods for the fiscal years ended March 31, 2017, 2016 and 2015 in the consolidated financial statements and notes and financial statement schedule thereto are expressed herein as "year ended" or "years ended".
F-1
Report of Independent Registered Public Accounting Firm
The Board of Directors and Stockholders
Deckers Outdoor Corporation:
We have audited the accompanying consolidated financial statements of Deckers Outdoor Corporation and subsidiaries (the Company) as listed in the accompanying index. In connection with our audits of the consolidated financial statements, we also have audited the related consolidated financial statement schedule as listed in the accompanying index. These consolidated financial statements and consolidated financial statement schedule are the responsibility of the Company's management. Our responsibility is to express an opinion on these consolidated financial statements and the consolidated financial statement schedule based on our audits.
We conducted our audits in accordance with the standards of the Public Company Accounting Oversight Board (United States). Those standards require that we plan and perform the audit to obtain reasonable assurance about whether the financial statements are free of material misstatement. An audit includes examining, on a test basis, evidence supporting the amounts and disclosures in the financial statements. An audit also includes assessing the accounting principles used and significant estimates made by management, as well as evaluating the overall financial statement presentation. We believe that our audits provide a reasonable basis for our opinion.
In our opinion, the consolidated financial statements referred to above present fairly, in all material respects, the financial position of Deckers Outdoor Corporation and subsidiaries as of
March 31, 2017
and
2016
, and the results of their operations and their cash flows for the
years ended March 31, 2017
,
2016
and
2015
in conformity with US generally accepted accounting principles. Also in our opinion, the related consolidated financial statement schedule, when considered in relation to the basic consolidated financial statements taken as a whole, presents fairly, in all material respects, the information set forth therein.
We also have audited, in accordance with the standards of the Public Company Accounting Oversight Board (United States), the internal control over financial reporting of Deckers Outdoor Corporation
as of March 31, 2017
, based on criteria established in
Internal Control — Integrated Framework (2013)
issued by the Committee of Sponsoring Organizations of the Treadway Commission (COSO), and our report dated
May 30, 2017
expressed an unqualified opinion on the effectiveness of the internal control over financial reporting of Deckers Outdoor Corporation.
/s/ KPMG LLP
Los Angeles, California
May 30, 2017
F-2
Report of Independent Registered Public Accounting Firm
The Board of Directors and Stockholders
Deckers Outdoor Corporation:
We have audited the internal control over financial reporting of Deckers Outdoor Corporation (the Company) as of
March 31, 2017
based on criteria established in
Internal Control — Integrated Framework (2013)
issued by the Committee of Sponsoring Organizations of the Treadway Commission (COSO). The Company's management is responsible for maintaining effective internal control over financial reporting and for its assessment of the effectiveness of internal control over financial reporting, included in the accompanying Management's Report on Internal Control over Financial Reporting in Item 9A(b), "Management's Report on Internal Control over Financial Reporting". Our responsibility is to express an opinion on the Company's internal control over financial reporting based on our audit.
We conducted our audit in accordance with the standards of the Public Company Accounting Oversight Board (United States). Those standards require that we plan and perform the audit to obtain reasonable assurance about whether effective internal control over financial reporting was maintained in all material respects. Our audit included obtaining an understanding of internal control over financial reporting, assessing the risk that a material weakness exists, and testing and evaluating the design and operating effectiveness of internal control based on the assessed risk. Our audit also included performing such other procedures as we considered necessary in the circumstances. We believe that our audit provides a reasonable basis for our opinion.
A company's internal control over financial reporting is a process designed to provide reasonable assurance regarding the reliability of financial reporting and the preparation of financial statements for external purposes in accordance with generally accepted accounting principles. A company's internal control over financial reporting includes those policies and procedures that (1) pertain to the maintenance of records that, in reasonable detail, accurately and fairly reflect the transactions and dispositions of the assets of the company; (2) provide reasonable assurance that transactions are recorded as necessary to permit preparation of financial statements in accordance with generally accepted accounting principles, and that receipts and expenditures of the company are being made only in accordance with authorizations of management and directors of the company; and (3) provide reasonable assurance regarding prevention or timely detection of unauthorized acquisition, use, or disposition of the company's assets that could have a material effect on the financial statements.
Because of its inherent limitations, internal control over financial reporting may not prevent or detect misstatements. Also, projections of any evaluation of effectiveness to future periods are subject to the risk that controls may become inadequate because of changes in conditions, or that the degree of compliance with the policies or procedures may deteriorate.
In our opinion, Deckers Outdoor Corporation maintained, in all material respects, effective internal control over financial reporting
as of March 31, 2017
, based on criteria established in
Internal Control — Integrated Framework
(2013)
issued by COSO.
We also have audited, in accordance with the standards of the Public Company Accounting Oversight Board (United States), the consolidated balance sheets of Deckers Outdoor Corporation and subsidiaries
as of March 31, 2017
and
2016
, and the results of their operations and their cash flows for the
years ended March 31, 2017
,
2016
and
2015
and our report dated
May 30, 2017
expressed an unqualified opinion on those consolidated financial statements.
/s/ KPMG LLP
Los Angeles, California
May 30, 2017
F-3
DECKERS OUTDOOR CORPORATION AND SUBSIDIARIES
CONSOLIDATED BALANCE SHEETS
(amounts in thousands, except par value)
|
As of March 31,
|
|||||||
|
2017
|
2016
|
||||||
|
ASSETS
|
|||||||
|
Current assets:
|
|||||||
|
Cash and cash equivalents
|
$
|
291,764
|
|
$
|
245,956
|
|
|
|
Trade accounts receivable, net of allowances ($32,354 and $30,195 as of March 31, 2017 and 2016, respectively)
|
158,643
|
|
160,154
|
|
|||
|
Inventories, net of reserves ($7,638 and $7,303 as of March 31, 2017 and 2016, respectively)
|
298,851
|
|
299,911
|
|
|||
|
Prepaid expenses
|
15,996
|
|
18,249
|
|
|||
|
Other current assets
|
30,781
|
|
38,039
|
|
|||
|
Income tax receivable
|
24,786
|
|
23,456
|
|
|||
|
Total current assets
|
820,821
|
|
785,765
|
|
|||
|
Property and equipment, net of accumulated depreciation ($190,758 and $163,807 as of March 31, 2017 and 2016, respectively)
|
225,531
|
|
237,246
|
|
|||
|
Goodwill
|
13,990
|
|
127,934
|
|
|||
|
Other intangible assets, net of accumulated amortization ($54,361 and $45,302 as of March 31, 2017 and 2016, respectively)
|
65,138
|
|
83,026
|
|
|||
|
Deferred tax assets
|
44,708
|
|
20,636
|
|
|||
|
Other assets
|
21,592
|
|
23,461
|
|
|||
|
Total assets
|
$
|
1,191,780
|
|
$
|
1,278,068
|
|
|
|
LIABILITIES AND STOCKHOLDERS' EQUITY
|
|||||||
|
Current liabilities:
|
|||||||
|
Short-term borrowings
|
$
|
549
|
|
$
|
67,475
|
|
|
|
Trade accounts payable
|
95,893
|
|
100,593
|
|
|||
|
Accrued payroll
|
22,608
|
|
20,625
|
|
|||
|
Other accrued expenses
|
31,816
|
|
39,449
|
|
|||
|
Income taxes payable
|
2,719
|
|
6,461
|
|
|||
|
Value added tax payable
|
5,466
|
|
3,895
|
|
|||
|
Total current liabilities
|
159,051
|
|
238,498
|
|
|||
|
Long-term liabilities:
|
|||||||
|
Mortgage payable
|
32,082
|
|
32,631
|
|
|||
|
Income tax liability
|
13,216
|
|
9,073
|
|
|||
|
Deferred rent obligations
|
18,433
|
|
16,139
|
|
|||
|
Other long-term liabilities
|
14,743
|
|
14,256
|
|
|||
|
Total long-term liabilities
|
78,474
|
|
72,099
|
|
|||
|
Commitments and contingencies (Note 7)
|
|
|
|||||
|
Stockholders' equity:
|
|||||||
|
Common stock ($0.01 par value; 125,000 shares authorized; shares issued and outstanding of
31,987
and 32,020 as of March 31, 2017 and 2016, respectively)
|
320
|
|
320
|
|
|||
|
Additional paid-in capital
|
160,797
|
|
161,259
|
|
|||
|
Retained earnings
|
819,589
|
|
826,449
|
|
|||
|
Accumulated other comprehensive loss
|
(26,451
|
)
|
(20,557
|
)
|
|||
|
Total stockholders' equity
|
954,255
|
|
967,471
|
|
|||
|
Total liabilities and stockholders' equity
|
$
|
1,191,780
|
|
$
|
1,278,068
|
|
|
See accompanying notes to the consolidated financial statements.
F-4
DECKERS OUTDOOR CORPORATION AND SUBSIDIARIES
CONSOLIDATED STATEMENTS OF COMPREHENSIVE INCOME (LOSS)
(amounts in thousands, except per share data)
|
Years Ended March 31,
|
|||||||||||
|
2017
|
2016
|
2015
|
|||||||||
|
Net sales
|
$
|
1,790,147
|
|
$
|
1,875,197
|
|
$
|
1,817,057
|
|
||
|
Cost of sales
|
954,912
|
|
1,028,529
|
|
938,949
|
|
|||||
|
Gross profit
|
835,235
|
|
846,668
|
|
878,108
|
|
|||||
|
Selling, general and administrative expenses
|
837,154
|
|
684,541
|
|
653,689
|
|
|||||
|
(Loss) income from operations
|
(1,919
|
)
|
162,127
|
|
|
224,419
|
|
||||
|
Other expense (income), net:
|
|||||||||||
|
Interest income
|
(778
|
)
|
(420
|
)
|
(207
|
)
|
|||||
|
Interest expense
|
7,319
|
|
5,814
|
|
4,220
|
|
|||||
|
Other income, net
|
(1,474
|
)
|
(152
|
)
|
(733
|
)
|
|||||
|
Total other expense, net
|
5,067
|
|
5,242
|
|
3,280
|
|
|||||
|
(Loss) income before income taxes
|
(6,986
|
)
|
156,885
|
|
221,139
|
|
|||||
|
Income tax (benefit) expense
|
(12,696
|
)
|
34,620
|
|
59,359
|
|
|||||
|
Net income
|
5,710
|
|
122,265
|
|
161,780
|
|
|||||
|
Other comprehensive (loss) income, net of tax:
|
|||||||||||
|
Unrealized gain on foreign currency exchange rate hedges
|
704
|
|
461
|
|
450
|
|
|||||
|
Foreign currency translation adjustment
|
(6,598
|
)
|
(550
|
)
|
(18,875
|
)
|
|||||
|
Total other comprehensive loss
|
(5,894
|
)
|
(89
|
)
|
(18,425
|
)
|
|||||
|
Comprehensive (loss) income
|
$
|
(184
|
)
|
$
|
122,176
|
|
$
|
143,355
|
|
||
|
Net income per share:
|
|||||||||||
|
Basic
|
$
|
0.18
|
|
$
|
3.76
|
|
$
|
4.70
|
|
||
|
Diluted
|
$
|
0.18
|
|
$
|
3.70
|
|
$
|
4.66
|
|
||
|
Weighted-average common shares outstanding:
|
|||||||||||
|
Basic
|
32,000
|
|
32,556
|
|
34,433
|
|
|||||
|
Diluted
|
32,355
|
|
33,039
|
|
34,733
|
|
|||||
See accompanying notes to the consolidated financial statements.
F-5
DECKERS OUTDOOR CORPORATION AND SUBSIDIARIES
CONSOLIDATED STATEMENTS OF STOCKHOLDERS' EQUITY
(amounts in thousands)
|
Common Stock
|
Additional
Paid-in Capital |
Retained
Earnings |
Accumulated
Other Comprehensive Loss |
Total Stockholders'
Equity |
||||||||||||||||||
|
Shares
|
Amount
|
|||||||||||||||||||||
|
Balance, March 31, 2014
|
34,624
|
|
$
|
346
|
|
$
|
146,731
|
|
$
|
743,815
|
|
$
|
(2,043
|
)
|
$
|
888,849
|
|
|||||
|
Stock compensation expense
|
11
|
|
—
|
|
13,524
|
|
—
|
|
—
|
|
13,524
|
|
||||||||||
|
Shares issued upon vesting
|
93
|
|
1
|
|
(1
|
)
|
—
|
|
—
|
|
—
|
|
||||||||||
|
Excess tax benefit from stock compensation
|
—
|
|
—
|
|
4,197
|
|
—
|
|
—
|
|
4,197
|
|
||||||||||
|
Shares withheld for taxes
|
—
|
|
—
|
|
(5,674
|
)
|
—
|
|
—
|
|
(5,674
|
)
|
||||||||||
|
Repurchases of common stock
|
(1,436
|
)
|
(14
|
)
|
—
|
|
(107,225
|
)
|
—
|
|
(107,239
|
)
|
||||||||||
|
Net income
|
—
|
|
—
|
|
—
|
|
161,780
|
|
—
|
|
161,780
|
|
||||||||||
|
Total other comprehensive loss
|
—
|
|
—
|
|
—
|
|
—
|
|
(18,425
|
)
|
(18,425
|
)
|
||||||||||
|
Balance, March 31, 2015
|
33,292
|
|
333
|
|
158,777
|
|
798,370
|
|
(20,468
|
)
|
937,012
|
|
||||||||||
|
Stock compensation expense
|
16
|
|
—
|
|
6,622
|
|
—
|
|
—
|
|
6,622
|
|
||||||||||
|
Shares issued upon vesting
|
132
|
|
1
|
|
(1
|
)
|
—
|
|
—
|
|
—
|
|
||||||||||
|
Excess tax benefit from stock compensation
|
—
|
|
—
|
|
471
|
|
—
|
|
—
|
|
471
|
|
||||||||||
|
Shares withheld for taxes
|
—
|
|
—
|
|
(4,610
|
)
|
—
|
|
—
|
|
(4,610
|
)
|
||||||||||
|
Repurchases of common stock
|
(1,420
|
)
|
(14
|
)
|
—
|
|
(94,186
|
)
|
—
|
|
(94,200
|
)
|
||||||||||
|
Net income
|
—
|
|
—
|
|
—
|
|
122,265
|
|
—
|
|
122,265
|
|
||||||||||
|
Total other comprehensive loss
|
—
|
|
—
|
|
—
|
|
—
|
|
(89
|
)
|
(89
|
)
|
||||||||||
|
Balance, March 31, 2016
|
32,020
|
|
320
|
|
161,259
|
|
826,449
|
|
(20,557
|
)
|
967,471
|
|
||||||||||
|
Stock compensation expense
|
23
|
|
—
|
|
6,175
|
|
—
|
|
—
|
|
6,175
|
|
||||||||||
|
Shares issued upon vesting
|
166
|
|
2
|
|
796
|
|
—
|
|
—
|
|
798
|
|
||||||||||
|
Excess tax benefit from stock compensation
|
—
|
|
—
|
|
100
|
|
—
|
|
—
|
|
100
|
|
||||||||||
|
Shares withheld for taxes
|
—
|
|
—
|
|
(7,533
|
)
|
—
|
|
—
|
|
(7,533
|
)
|
||||||||||
|
Repurchases of common stock
|
(222
|
)
|
(2
|
)
|
—
|
|
(12,570
|
)
|
—
|
|
(12,572
|
)
|
||||||||||
|
Net income
|
—
|
|
—
|
|
—
|
|
5,710
|
|
—
|
|
5,710
|
|
||||||||||
|
Total other comprehensive loss
|
—
|
|
—
|
|
—
|
|
—
|
|
(5,894
|
)
|
(5,894
|
)
|
||||||||||
|
Balance, March 31, 2017
|
31,987
|
|
$
|
320
|
|
$
|
160,797
|
|
$
|
819,589
|
|
$
|
(26,451
|
)
|
$
|
954,255
|
|
|||||
See accompanying notes to the consolidated financial statements.
F-6
DECKERS OUTDOOR CORPORATION AND SUBSIDIARIES
CONSOLIDATED STATEMENTS OF CASH FLOWS
(amounts in thousands)
|
Years Ended March 31,
|
|||||||||||
|
2017
|
2016
|
2015
|
|||||||||
|
Cash flows from operating activities:
|
|||||||||||
|
Net income
|
$
|
5,710
|
|
$
|
122,265
|
|
$
|
161,780
|
|
||
|
Adjustments to reconcile net income to net cash provided by (used in) operating activities:
|
|||||||||||
|
Depreciation, amortization and accretion
|
52,628
|
|
50,024
|
|
49,293
|
|
|||||
|
Change in fair value of contingent consideration
|
—
|
|
(4,411
|
)
|
(3,574
|
)
|
|||||
|
Provision for doubtful accounts, net
|
2,847
|
|
5,120
|
|
1,107
|
|
|||||
|
Deferred (benefit) tax provision
|
(24,495
|
)
|
8,167
|
|
9,970
|
|
|||||
|
Stock-based compensation
|
6,175
|
|
6,622
|
|
13,524
|
|
|||||
|
Loss (gain) on sale of assets
|
538
|
|
(1,338
|
)
|
—
|
|
|||||
|
Impairment of goodwill
|
113,944
|
|
—
|
|
—
|
|
|||||
|
Impairment of long-lived assets
|
13,222
|
|
9,773
|
|
—
|
|
|||||
|
Restructuring costs
|
29,087
|
|
24,856
|
|
—
|
|
|||||
|
Other
|
(71
|
)
|
56
|
|
2,969
|
|
|||||
|
Changes in operating assets and liabilities:
|
|||||||||||
|
Trade accounts receivable, net
|
(1,336
|
)
|
(23,545
|
)
|
(36,885
|
)
|
|||||
|
Inventories, net
|
1,060
|
|
(61,492
|
)
|
(26,748
|
)
|
|||||
|
Prepaid expenses and other current assets
|
7,975
|
|
(3,681
|
)
|
(10,376
|
)
|
|||||
|
Income tax receivable
|
(1,331
|
)
|
(8,286
|
)
|
(15,170
|
)
|
|||||
|
Other assets
|
2,259
|
|
(3,082
|
)
|
(144
|
)
|
|||||
|
Trade accounts payable
|
(7,825
|
)
|
14,775
|
|
8,912
|
|
|||||
|
Contingent consideration
|
—
|
|
(819
|
)
|
(364
|
)
|
|||||
|
Accrued expenses
|
(990
|
)
|
(16,221
|
)
|
3,761
|
|
|||||
|
Income taxes payable
|
(3,743
|
)
|
(397
|
)
|
4,883
|
|
|||||
|
Long-term liabilities
|
3,023
|
|
7,195
|
|
6,716
|
|
|||||
|
Net cash provided by operating activities
|
198,677
|
|
125,581
|
|
169,654
|
|
|||||
|
Cash flows from investing activities:
|
|||||||||||
|
Purchases of property and equipment, net
|
(44,499
|
)
|
(65,356
|
)
|
(91,147
|
)
|
|||||
|
Purchases of tangible, intangible, and other assets, net
|
—
|
|
(4,700
|
)
|
(9,489
|
)
|
|||||
|
Proceeds from sale of assets
|
—
|
|
2,835
|
|
—
|
|
|||||
|
Net cash used in investing activities
|
(44,499
|
)
|
(67,221
|
)
|
(100,636
|
)
|
|||||
|
Cash flows from financing activities:
|
|||||||||||
|
Proceeds from short-term borrowings
|
405,988
|
|
449,200
|
|
199,784
|
|
|||||
|
Repayments of short-term borrowings
|
(468,938
|
)
|
(387,120
|
)
|
(201,705
|
)
|
|||||
|
Proceeds from issuance of stock under the employee stock purchase plan
|
798
|
|
—
|
|
—
|
|
|||||
|
Cash paid for shares withheld for taxes
|
(7,865
|
)
|
(3,691
|
)
|
(5,674
|
)
|
|||||
|
Excess tax benefit from stock compensation
|
100
|
|
471
|
|
4,197
|
|
|||||
|
Cash paid for repurchases of common stock
|
(12,572
|
)
|
(94,200
|
)
|
(107,239
|
)
|
|||||
|
Contingent consideration paid
|
(20,058
|
)
|
(445
|
)
|
(115
|
)
|
|||||
|
Loan origination costs on short-term borrowings
|
—
|
|
(62
|
)
|
(818
|
)
|
|||||
|
Proceeds from mortgage loan
|
—
|
|
—
|
|
33,931
|
|
|||||
|
Mortgage loan origination costs
|
—
|
|
—
|
|
(338
|
)
|
|||||
|
Repayment of mortgage principal
|
(523
|
)
|
(493
|
)
|
(283
|
)
|
|||||
|
Net cash used in financing activities
|
(103,070
|
)
|
(36,340
|
)
|
(78,260
|
)
|
|||||
|
Effect of foreign currency exchange rates on cash
|
(5,300
|
)
|
(1,207
|
)
|
(10,703
|
)
|
|||||
|
Net change in cash and cash equivalents
|
45,808
|
|
20,813
|
|
(19,945
|
)
|
|||||
|
Cash and cash equivalents at beginning of period
|
245,956
|
|
225,143
|
|
245,088
|
|
|||||
|
Cash and cash equivalents at end of period
|
$
|
291,764
|
|
$
|
245,956
|
|
$
|
225,143
|
|
||
See accompanying notes to the consolidated financial statements.
DECKERS OUTDOOR CORPORATION AND SUBSIDIARIES
CONSOLIDATED STATEMENTS OF CASH FLOWS
(amounts in thousands)
(Continued)
|
Years Ended March 31,
|
|||||||||||
|
2017
|
2016
|
2015
|
|||||||||
|
Supplemental disclosure of cash flow information:
|
|||||||||||
|
Cash paid during the period for:
|
|||||||||||
|
Income taxes, net of refunds ($17,132, $501, and $4,701 as of March 31, 2017, 2016 and 2015, respectively)
|
$
|
14,099
|
|
$
|
29,916
|
|
$
|
53,504
|
|
||
|
Interest
|
5,494
|
|
4,640
|
|
4,315
|
|
|||||
|
Non-cash investing and financing activities:
|
|||||||||||
|
Accrued for purchases of property and equipment
|
1,101
|
|
2,640
|
|
3,419
|
|
|||||
|
Accrued for asset retirement obligations
|
2,359
|
|
1,394
|
|
786
|
|
|||||
|
Accrued for shares withheld for taxes
|
587
|
|
919
|
|
—
|
|
|||||
See accompanying notes to the consolidated financial statements.
F-7
DECKERS OUTDOOR CORPORATION AND SUBSIDIARIES
NOTES TO CONSOLIDATED FINANCIAL STATEMENTS
March 31, 2017, 2016 and 2015
(amounts in thousands, except share data)
The Company and Basis of Presentation
The consolidated financial statements and notes thereto include the accounts of Deckers Outdoor Corporation and its wholly-owned subsidiaries (collectively referred to as the "Company"). Accordingly, all references herein to Deckers Outdoor Corporation or "Deckers" include the consolidated results of the Company and its subsidiaries. All intercompany balances and transactions have been eliminated in consolidation.
Deckers Outdoor Corporation is a global leader in designing, marketing and distributing innovative footwear, apparel, and accessories developed for both everyday casual lifestyle use and high performance activities. As part of its Omni-Channel platform, the Company's brands are aligned across its Fashion Lifestyle group (the UGG and Koolaburra brands) and Performance Lifestyle group (the Teva, Sanuk and Hoka brands).
The Company sells its products through quality domestic and international retailers, international distributors, and directly to its end-user consumers both domestically and internationally through its Direct-to-Consumer (DTC) business, which is comprised of its retail stores and E-Commerce websites. Independent third party contractors manufacture all of the Company's products.
The Company has
five
reportable operating segments consisting of the strategic business units for the worldwide wholesale operations of the UGG brand, Teva brand, Sanuk brand, other brands, and DTC. The Company's other brands currently consist of the Hoka, Ahnu and Koolaburra brands.
The Company's business is seasonal, with the highest percentage of UGG brand net sales occurring in the quarters ending September 30th and December 31st and the highest percentage of Teva and Sanuk brand net sales occurring in the quarters ending March 31st and June 30th of each year. Net sales of other brands do not have significant seasonal impact on the Company.
The Company was incorporated in 1975 under the laws of the State of California and was reincorporated under the laws of the State of Delaware in 1993.
Certain reclassifications were made for all prior periods presented including the years ended March 31, 2016 and 2015, to conform to the current period presentation.
Reportable Operating Segments
During the first quarter of fiscal year 2016, the Company changed its reportable operating segments to combine the previously separated retail store and E-Commerce operating components into
one
DTC reportable operating segment. The Company now has
five
reportable operating segments including the strategic business units for the worldwide wholesale operations of the UGG brand, Teva brand, Sanuk brand, other brands, and DTC. It is by these reportable operating segments that information is reported to the Chief Operating Decision Maker, who is the principal executive officer. The Company performs an annual analysis of the appropriateness of its reportable operating segments. Refer to Note 12, "Reportable Operating Segments", for further information about the Company's reportable operating segments.
Use of Estimates
The preparation of the Company's consolidated financial statements and notes thereto are in accordance with United States generally accepted accounting principles (US GAAP), which requires management to make estimates and assumptions that affect the amounts reported in these consolidated financial statements and notes thereto. Management bases these estimates and assumptions upon historical experience, existing and known circumstances, authoritative accounting pronouncements and other factors that management believes to be reasonable. Significant areas requiring the use of management estimates relate to inventory write-downs, accounts receivable allowances,
F-8
DECKERS OUTDOOR CORPORATION AND SUBSIDIARIES
NOTES TO CONSOLIDATED FINANCIAL STATEMENTS
March 31, 2017, 2016 and 2015
(amounts in thousands, except share data)
returns liabilities, stock-based compensation, impairment assessments, depreciation and amortization, income tax liabilities, uncertain tax positions and income taxes receivable, the fair value of financial instruments, and the fair values of assets and liabilities, including goodwill and other intangible assets. These estimates are based on information available as of the date of the consolidated financial statements and notes thereto. For the reasons stated, actual results could differ materially from these estimates.
Summary of Significant Accounting Policies
Cash Equivalents
The Company considers all highly liquid investments with an original maturity of three months or less when purchased to be cash equivalents. Cash and cash equivalents included
$198,992
and
$195,575
of money market funds as of
March 31, 2017
and
2016
, respectively.
Allowance for Doubtful Accounts
The Company provides an allowance against trade accounts receivable for estimated losses that may result from customers' inability to pay. The Company determines the amount of the allowance by analyzing known uncollectible accounts, aged trade accounts receivables, economic conditions and forecasts, historical experience and the customers' credit-worthiness. Trade accounts receivable that are subsequently determined to be uncollectible are charged or written off against this allowance. Write-offs against this allowance are recorded in selling, general and administrative (SG&A) expenses in the consolidated statements of comprehensive income (loss). The allowance includes specific allowances for trade accounts, all or a portion of which are identified as potentially uncollectible, plus a non-specific allowance for the balance of accounts based on the Company's historical loss experience. Allowances have been established for all projected losses of this nature.
Allowance for Sales Discounts
The Company provides an allowance against sales discounts for wholesale sales and resulting trade accounts receivable, which reflects a discount that customers may take, generally based upon meeting certain order, shipment and payment terms. The Company uses the amount of the discounts that are available to be taken against the period-end trade accounts receivable to estimate and record a corresponding reserve for sales discounts. Additions to the allowance are recorded against gross sales in the consolidated statements of comprehensive income (loss) and write-offs are recorded against the allowance in the consolidated balance sheets.
Allowance for Chargebacks
The Company provides an allowance against chargebacks from wholesale customers. When customers pay their invoices, they may take deductions for chargebacks against their invoices, which are often valid, and can include chargebacks for price differences, discounts and short shipments. Therefore, the Company records an allowance for the balance of chargebacks that are outstanding in the accounts receivable balance as of the end of each period, along with an estimated reserve for chargebacks that have not yet been taken against outstanding accounts receivable balances. This estimate is based on historical trends of the timing and amount of chargebacks taken against wholesale customer invoices. Additions to the allowance are recorded against gross sales in the consolidated statements of comprehensive income (loss) and write-offs are recorded against the allowance in the consolidated balance sheets.
Allowance for Sales Returns and Sales Returns Liability
The Company provides an allowance for anticipated future returns of goods shipped prior to period end and a liability for anticipated returns of goods sold direct to consumers. In general, the Company accepts returns for damaged or defective products. The Company also has a policy whereby returns are accepted from DTC customers for a
30
-day period. The Company bases the amounts of the allowance and liability on any approved customer requests for returns, historical returns experience, and any recent events that could result in a change from historical returns rates,
F-9
DECKERS OUTDOOR CORPORATION AND SUBSIDIARIES
NOTES TO CONSOLIDATED FINANCIAL STATEMENTS
March 31, 2017, 2016 and 2015
(amounts in thousands, except share data)
among other factors. Changes to the allowance and returns liability are recorded against gross sales in the consolidated statements of comprehensive income (loss).
Inventories
Inventories, principally finished goods on hand and in transit, are stated at the lower of cost (first-in, first-out method) or market (net realizable value). Cost includes initial molds and tooling that are amortized over the life of the mold in cost of sales in the consolidated statements of comprehensive income (loss). Cost also includes shipping and handling fees and costs, which are subsequently expensed to cost of sales. Market values are determined by historical experience with discounted sales, industry trends and the retail environment.
Property and Equipment, Depreciation and Amortization
Property and equipment is stated at cost less accumulated depreciation and amortization, and generally has a useful life expectancy of at least
one
year. Property and equipment includes tangible, non-consumable items owned by the Company valued at or above
$3
, certain computer software costs and internal or external computer system consulting work valued at or above
$3
as defined below, and portable electronic devices valued at or above
$1.5
. Tangible, non-consumable items below these amounts are expensed. The value includes the purchase price, sales tax and costs to acquire (shipping and handling), install (excluding site preparation costs), secure and prepare the item for its intended use.
Depreciation of property and equipment is calculated using the straight-line method based on estimated useful lives, as summarized below.
Capitalized website costs, which are included in the machinery and equipment category below, are immaterial to the Company's consolidated financial statements.
Leasehold improvements are amortized to their residual value, if any, on the straight-line basis over their estimated economic useful lives or the lease term, whichever is shorter. The Company allocates depreciation and amortization of property and equipment to cost of sales and SG&A expenses in the consolidated statements of comprehensive income (loss). The majority of the Company's depreciation and amortization, which arises from its Enterprise Resource Planning systems, warehouses, corporate headquarters and retail stores, due to the nature of its operations, is included in SG&A expenses in the consolidated statements of comprehensive income (loss). The Company outsources all manufacturing; therefore, the amount allocated to cost of sales is not material.
Property and equipment is summarized as follows:
|
As of March 31,
|
||||||||||
|
|
Useful life (years)
|
2017
|
2016
|
|||||||
|
Land
|
Indefinite
|
|
$
|
32,843
|
|
$
|
25,543
|
|
||
|
Building
|
39.5
|
|
38,990
|
|
38,920
|
|
||||
|
Machinery and equipment
|
1-10
|
|
199,602
|
|
189,085
|
|
||||
|
Furniture and fixtures
|
1-7
|
|
38,720
|
|
38,948
|
|
||||
|
Leasehold improvements
|
1-11
|
|
106,134
|
|
108,557
|
|
||||
|
Gross property and equipment
|
416,289
|
|
401,053
|
|
||||||
|
Less accumulated depreciation and amortization
|
190,758
|
|
163,807
|
|
||||||
|
Property and equipment, net
|
$
|
225,531
|
|
$
|
237,246
|
|
||||
During the years ended
March 31, 2017
and
2016
, the Company recognized total impairment losses for retail store related fixed assets and software of approximately
$11,300
and
$19,000
, respectively.
F-10
DECKERS OUTDOOR CORPORATION AND SUBSIDIARIES
NOTES TO CONSOLIDATED FINANCIAL STATEMENTS
March 31, 2017, 2016 and 2015
(amounts in thousands, except share data)
Goodwill and Other Intangible Assets
Intangible assets consist primarily of indefinite-lived trademarks and definite-lived trademarks, customer and distributor relationships, patents, lease rights, and non-compete agreements arising from the application of purchase accounting. Definite-lived intangible assets are amortized over their estimated useful lives to their estimated residual values, if any, on a straight-line basis and reviewed for impairment whenever events or changes in circumstances indicate that the carrying amount of an asset or asset group may not be recoverable based on estimated undiscounted cash flows. If impaired, the asset or asset group is written down to fair value based either on discounted cash flows or appraised values.
Goodwill and indefinite-lived intangible assets are not amortized, but are instead tested annually for impairment. Goodwill is initially recorded as the excess of the purchase price over the fair value of the net assets acquired in a business combination. The Company first assesses qualitative factors to determine whether it is necessary to perform a quantitative assessment of the indefinite-lived intangible asset. The Company does not calculate the fair value of the indefinite-lived intangible asset unless the Company determines, based on a qualitative assessment, that it is more likely than not that its fair value is less than its carrying amount. If the Company concludes that it is more likely than not that its fair value is less than its carrying amount, then the Company compares the fair value of the indefinite-lived intangible asset to its carrying amount, and if the fair value of the indefinite-lived intangible asset exceeds its carrying amount, no impairment charge will be recognized. If the fair value of the indefinite-lived intangible asset is less than its carrying amount, the Company will record an impairment charge to write down the indefinite-lived intangible asset to its fair value. Impairment and amortization are recorded in SG&A expenses in the consolidated statements of comprehensive income (loss).
If, as of the time of conducting the impairment test, it is determined that the value of the reporting unit the acquired net assets were assigned to, as determined by reference to product sales, operating margins or other indicators of value associated with the reporting unit, has declined to a point that the fair value of the reporting unit is below its carrying amount, the Company may be required to write down the amount of goodwill (i.e. take an impairment charge). The goodwill impairment evaluation involves valuing the Company’s various reporting units that carry goodwill, which are currently the same as the Company’s reportable operating segments. Refer to Note 12, "Reportable Operating Segments", for further information on the Company's reportable operating segments. In general, conditions that may indicate impairment include, but are not limited to: a significant adverse change in customer demand or business climate that could affect the value of an asset; change in market share; budget-to-actual performance; consistency of operating margins and capital expenditures; changes in management or key personnel; or changes in general economic conditions.
The Company evaluates the Sanuk brand's wholesale reportable segment goodwill and the Teva brand's indefinite-lived trademarks for impairment at October 31st of each year, and evaluates the UGG brand and other brands’ goodwill for impairment at December 31st of each year. The timing of the annual impairment evaluation is prescribed by applicable accounting guidance. The Company also performs interim impairment evaluations of goodwill and indefinite-lived intangible assets if events or changes in circumstances between annual tests indicate additional testing is warranted to determine if goodwill may be impaired.
The goodwill impairment test is a two-step quantitative process that combines a market and income approach, which involves the use of estimates and assumptions related to the fair value of the reporting units with which goodwill is associated. In the first step, the Company compares the fair value of each reporting unit with goodwill to its carrying value. The Company determines the fair value of its reporting unit with goodwill using a combination of a discounted cash flow analysis and a market value analysis. For purposes of assessing the fair value, the Company uses best estimates and assumptions, including future sales and operating results, and other factors that could affect fair value or otherwise indicate potential impairment. The Company also considers the reporting units' projected ability to generate income from operations and positive cash flow in future periods, as well as perceived changes in consumer demand, and acceptance of products or factors impacting the industry generally. The fair value assessment could change materially if different estimates and assumptions were used. Furthermore, the estimates and assumptions used to calculate fair value of the reporting unit may change from period to period based upon a number of factors, including actual and projected operating results, declining market conditions, changes in the retail and E-Commerce environment,
F-11
DECKERS OUTDOOR CORPORATION AND SUBSIDIARIES
NOTES TO CONSOLIDATED FINANCIAL STATEMENTS
March 31, 2017, 2016 and 2015
(amounts in thousands, except share data)
as well as changes in the competitive environment, and are subject to a high degree of uncertainty. Changes in estimates and assumptions used to determine whether impairment exists, or changes in actual results compared to expected results, could result in additional impairment charges in future periods.
If the fair value of the reporting unit exceeds the carrying value of the net assets assigned to that reporting unit, goodwill is not impaired and the Company is not required to perform further testing. If the carrying value of the net assets assigned to the reporting unit exceeds the fair value of the reporting unit, then the Company must perform step two of the goodwill impairment test in order to determine the impairment charge, if any.
Step two of the goodwill impairment test involves a hypothetical allocation of the estimated fair value of the reporting unit to its net tangible and intangible assets (excluding goodwill) as if the reporting unit were newly acquired, which results in an implied fair value of the goodwill. If the implied fair value of goodwill, as determined by this hypothetical allocation of assets, is less than the carrying value, an impairment charge is recognized for the difference.
Refer to Note 3, "Goodwill and Other Intangible Assets", for further information on the Company's goodwill and intangible assets and annual impairment analysis results. Refer to Note 4, "Fair Value Measurements", for further information on the definition of fair value and related inputs.
Accounting for Long-Lived Assets
Other long-lived assets, such as machinery and equipment, internal use software, and leasehold improvements, are reviewed for impairment whenever events or changes in circumstances indicate that the carrying amount of an asset may not be recoverable. Recoverability of assets to be held and used is measured by a comparison of the carrying amount to estimated undiscounted future cash flows expected to be generated by the asset. If the carrying amount exceeds the estimated future cash flows, an impairment charge is recognized for the amount by which the carrying amount exceeds the fair value of the asset.
At least quarterly, the Company evaluates whether any impairment-triggering events, including the following, have occurred which would require such asset groups to be tested for impairment:
|
•
|
a significant decrease in the market price of a long-lived asset group;
|
|
•
|
a significant adverse change in the extent or manner in which a long-lived asset group is being used or in its physical condition;
|
|
•
|
a significant adverse change in legal factors or in business climate that could affect the value of a long-lived asset group, including an adverse action or assessment by a regulator;
|
|
•
|
an accumulation of costs significantly in excess of the amount originally expected for the acquisition or construction of a long-lived asset group;
|
|
•
|
a current-period operating or cash flow loss combined with a history of operating or cash flow losses or a projection or forecast that demonstrates continuing losses associated with the use of a long-lived asset group; or
|
|
•
|
a current expectation that, more likely than not, a long-lived asset group will be sold or otherwise disposed of significantly before the end of its previously-estimated useful life.
|
When an impairment-triggering event has occurred, the Company tests for recoverability of the asset group's carrying value using estimates of undiscounted future cash flows based on the existing service potential of the applicable asset group. In determining the service potential of a long-lived asset group, the Company considers its remaining useful life, cash-flow generating capacity, and physical output capacity. These estimates include the undiscounted cash flows associated with future expenditures necessary to maintain the existing service potential. Long-lived assets are grouped with other assets and liabilities at the lowest level for which identifiable cash flows are largely independent of
F-12
DECKERS OUTDOOR CORPORATION AND SUBSIDIARIES
NOTES TO CONSOLIDATED FINANCIAL STATEMENTS
March 31, 2017, 2016 and 2015
(amounts in thousands, except share data)
the cash flows of other assets and liabilities. The Company assesses potential impairment of its retail group long-lived assets by comparing projected
12
-month store cash flows to the current carrying value of the store's long-lived assets. Stores that have been opened for more than one year, or have otherwise been identified by management as having one or more indicators of impairment, with projected
12
-month cash flows less than the current carrying amount of the store's long-lived assets are then reviewed to determine if an impairment exists. An impairment loss, if any, would only reduce the carrying amount of long-lived assets in the group based on the fair value of the asset group. Impairment is recorded in SG&A expenses in the consolidated statements of comprehensive income (loss).
Derivative Instruments and Hedging Activities
The Company transacts business in various foreign currencies and has international sales and expenses denominated in foreign currencies, subjecting the Company to foreign currency exchange rate risk. The Company may enter into foreign currency exchange rate forward or option contracts, generally with maturities of
15 months
or less, to reduce the volatility of cash flows primarily related to forecasted revenue denominated in certain foreign currencies. In addition, the Company utilizes foreign currency exchange rate contracts and other derivative instruments to mitigate foreign currency exchange rate risk associated with foreign currency-denominated assets and liabilities, primarily intercompany balances. The Company does not use foreign currency exchange rate contracts for trading purposes.
Certain of the Company's foreign currency exchange rate forward contracts are designated cash flow hedges of forecasted sales (Designated Derivative Contracts) and are subject to foreign currency exchange rate risk. These contracts allow the Company to sell Euros and British Pounds in exchange for US dollars at specified contract rates. Forward contracts are used to hedge forecasted sales over specific quarters. Changes in the fair value of Designated Derivative Contracts are recognized as a component of accumulated other comprehensive income (loss) (OCI) within stockholders' equity, and are recognized in the consolidated statements of comprehensive income (loss) during the period which approximates the time the corresponding third-party sales occur. The Company may also enter into foreign currency exchange rate contracts that are not designated as hedging instruments (Non-Designated Derivative Contracts) for financial accounting purposes. These contracts are generally entered into to offset the gains and losses on certain intercompany balances until the expected time of repayment. Accordingly, any gains or losses resulting from changes in the fair value of Non-Designated Derivative Contracts are recognized in SG&A expenses in the consolidated statements of comprehensive income (loss). The gains and losses on these contracts generally offset the gains and losses associated with the underlying foreign currency-denominated balances, which are also reported in SG&A expenses. Refer to Note 9, "Foreign Currency Exchange Rate Contracts and Hedging", for the impact of derivative instruments and hedging activities on the Company's consolidated financial statements.
The Company records the assets or liabilities associated with derivative instruments and hedging activities at fair value based on Level 2 inputs in other current assets or other current liabilities, respectively, in the consolidated balance sheets. The accounting for gains and losses resulting from changes in fair value depends on the use of the derivative instrument and whether it is designated and qualifies for hedge accounting. Refer to Note 4, "Fair Value Measurements", for more information on the nature of Level 2 inputs.
For all designated hedging relationships, the Company formally documents the hedging relationship and its risk management objective and strategy for undertaking the hedge, the hedging instrument, the hedged transaction, the nature of the risk being hedged, how the hedging instrument's effectiveness in offsetting the hedged risk will be assessed prospectively and retrospectively, and a description of the method used to measure ineffectiveness. The Company factors the nonperformance risk of the Company and the counterparty into the fair value measurements of its derivative instruments. The Company also formally assesses, both at the inception of the hedging relationship and on an ongoing basis, whether the derivative instruments that are used in hedging relationships are highly effective in offsetting changes in cash flows of hedged transactions. The Company assesses hedge effectiveness and measures hedge ineffectiveness at least quarterly. For derivative instruments that are designated and qualify as part of a cash flow hedging relationship, such as Designated Derivative Contracts, the effective portion of the gain or loss on the derivative instrument is recognized in OCI and reclassified into earnings in the same period or periods during which the hedged transaction affects earnings. Gains and losses on the derivative instrument representing either hedge ineffectiveness or hedge components excluded from the assessment of effectiveness are recognized in current earnings.
F-13
DECKERS OUTDOOR CORPORATION AND SUBSIDIARIES
NOTES TO CONSOLIDATED FINANCIAL STATEMENTS
March 31, 2017, 2016 and 2015
(amounts in thousands, except share data)
The Company discontinues hedge accounting prospectively when it determines that the derivative instrument is no longer effective in offsetting cash flows attributable to the hedged risk, the derivative instrument expires or is sold, terminated, or exercised, the cash flow hedge is non-designated because a forecasted transaction is not probable of occurring, or management determines to remove the designation of the cash flow hedge. In all situations in which hedge accounting is discontinued and the derivative instrument remains outstanding, the Company continues to carry the derivative instrument at its fair value on the consolidated balance sheets and recognizes any subsequent changes in fair value in earnings. When it is probable that a forecasted transaction will not occur, the Company discontinues hedge accounting and the accumulated gains or losses in OCI related to the hedging relationship are immediately recognized into earnings.
Comprehensive Income (Loss)
Comprehensive income (loss) is the total of net earnings and all other non-owner changes in equity. Comprehensive income (loss) includes net income (loss), foreign currency translation adjustments, and unrealized gains and losses on cash flow hedges. Refer to Note 10, "Accumulated Other Comprehensive Loss", for further information on components of OCI recognized by the Company.
Net Income per Share
Basic net income per share represents net income divided by the weighted-average number of common shares outstanding for the period. Diluted net income per share represents net income divided by the weighted-average number of shares outstanding, including the dilutive impact of potential issuances of common stock. Refer to Note 11, "Net Income per Share", for a reconciliation of basic to diluted weighted-average common shares outstanding.
Foreign Currency Translation
The Company considers the US dollar as its functional currency. The Company has certain wholly-owned foreign subsidiaries with functional currencies other than the US dollar. In most cases, the Company's foreign subsidiaries' local currency is the same as the designated functional currency. The Company holds a portion of its cash and other monetary assets and liabilities in currencies other than its subsidiary's functional currency, and is exposed to financial statement transaction gains and losses as a result of re-measurement of the financial positions held in US dollars and foreign currencies into the functional currency of subsidiaries that are non-US dollar functional. The Company re-measures these monetary assets and liabilities using the exchange rate at the end of the reporting period, which results in gains and losses that are included in SG&A expenses in the consolidated statements of comprehensive income (loss) as incurred, except for gains and losses arising on intercompany foreign currency transactions that are of a long-term investment nature. In addition, the Company translates assets and liabilities of subsidiaries with reporting currencies other than US dollars into US dollars using the exchange rates at of the end of the reporting period, which results in financial statement translation gains and losses in OCI.
Non-qualified Deferred Compensation
In 2010, the Company established a non-qualified deferred compensation program that permits a select group of management employees to defer earnings to a future date on a non-qualified basis. For each plan year, the Company's Board of Directors may, but is not required to, contribute any amount it desires to any participant under this program. The Company's contribution is determined by the Board of Directors annually. In March 2015, the Board of Directors approved a Company contribution feature for future plan years beginning in calendar year 2016 and gave management the authority to approve actual contributions. As of March 31, 2017 and 2016, no payments were made or pending under this program. The value of the deferred compensation is recognized based on the fair value of the participants' accounts. The Company has established a rabbi trust for the purpose of supporting the benefits payable under this program, with the assets invested in company-owned life insurance policies. Deferred compensation of
$609
is included in other accrued expenses and
$3,531
is included in other long-term liabilities in the consolidated balance sheets
as of March 31, 2017
. Deferred compensation of
$308
is included in other accrued expenses and
$5,993
is included in other long-term liabilities in the consolidated balance sheets
as of March 31, 2016
.
F-14
DECKERS OUTDOOR CORPORATION AND SUBSIDIARIES
NOTES TO CONSOLIDATED FINANCIAL STATEMENTS
March 31, 2017, 2016 and 2015
(amounts in thousands, except share data)
Refer to Note 4, "Fair Value Measurements", for further information on the fair value of deferred compensation assets and liabilities.
Stock-Based Compensation
All of the Company's stock-based compensation is classified within stockholders' equity. Stock compensation expense is measured at the grant date based on the value of the award and is expensed ratably over the service period. The Company recognizes expense only for those awards that management deems probable of achieving the performance criteria and service conditions. Determining the fair value and related expense of stock-based compensation requires judgment, including estimating the percentage of awards that will be forfeited and probabilities of meeting the awards' performance criteria. If actual forfeitures differ significantly from the estimates or if probabilities change during a period, stock compensation expense and the Company's results of operations could be materially impacted. Stock compensation expense is included in SG&A expenses in the consolidated statements of comprehensive income (loss). Refer to Note 8, "Stockholders' Equity", for further information on Company stock-based compensation.
Revenue Recognition
The Company recognizes wholesale, E-Commerce, and international distributor revenue when products are shipped, and retail revenue at the point of sale. All sales are recognized when the customer takes title and assumes risk of loss, collection of the related receivable is reasonably assured, persuasive evidence of an arrangement exists, and the sales price is fixed or determinable. For wholesale and international distributor sales, allowances for estimated returns, discounts, chargebacks, and bad debts are provided for when related revenue is recorded. For E-Commerce sales, allowances for estimated returns and bad debts are provided for when related revenue is recorded. For retail sales, allowances for estimated returns are provided for when related revenue is recorded. Amounts billed for shipping and handling costs are recorded as a component of net sales, while the related costs paid to third-party shipping companies are recorded as cost of sales. The Company presents revenue net of taxes (for example, sales taxes, use taxes, value-added taxes, and some types of excise taxes) collected from customers and remitted to governmental authorities.
Research and Development Costs
All research and development costs are expensed as incurred. Such costs amounted to
$21,256
,
$22,176
, and
$20,872
for the
years ended March 31, 2017
,
2016
and
2015
, respectively, and are included in SG&A expenses in the consolidated statements of comprehensive income (loss).
Advertising, Marketing, and Promotion Expenses
Advertising costs are expensed the first time the advertisement is run. All other costs of advertising, marketing, and promotion are expensed as incurred. These expenses of
$109,579
,
$109,738
, and
$111,162
for the
years ended March 31, 2017
,
2016
and
2015
, respectively, are included in SG&A expenses in the consolidated statements of comprehensive income (loss). Included in prepaid and other current assets as of
March 31, 2017
and
2016
were
$900
and
$1,084
, respectively, related to prepaid advertising, marketing, and promotion expenses for programs to take place after such dates.
Rent Expense
Rent expense is recorded using the straight-line method to account for scheduled rental increases or rent holidays. Lease incentives for tenant improvement allowances are recorded as reductions of rent expense over the lease term. The rental payments under some of the Company's retail store leases are based on a minimum rental plus a percentage of the store's sales in excess of stipulated amounts. Rent expenses are included in SG&A expenses in the consolidated statements of comprehensive income (loss).
F-15
DECKERS OUTDOOR CORPORATION AND SUBSIDIARIES
NOTES TO CONSOLIDATED FINANCIAL STATEMENTS
March 31, 2017, 2016 and 2015
(amounts in thousands, except share data)
Retirement Plan
The Company provides a 401(k) defined contribution plan that eligible US employees may elect to participate in through tax-deferred contributions. The Company matches
50%
of each eligible participant's tax-deferred contributions on up to
6%
of eligible compensation on a per payroll period basis, with a true-up contribution if such eligible participant is employed by the Company on the last day of the calendar year. Internationally, the Company has various defined contribution plans. Certain international locations require mandatory contributions under social programs, and the Company contributes at least the statutory minimums. US 401(k) matching contributions totaled
$2,124
,
$2,182
, and
$1,726
during the
years ended March 31, 2017
,
2016
and
2015
, respectively, and was included in SG&A expenses in the consolidated statements of comprehensive income (loss). In addition, the Company may also make discretionary profit sharing contributions to the plan. However, the Company did not make any profit sharing contributions for the
years ended March 31, 2017
,
2016
and
2015
,
respectively.
Income Taxes
Income taxes are accounted for under the asset and liability method. Deferred tax assets and liabilities are recognized for the future tax consequences attributable to temporary differences between the financial statement carrying amounts of existing assets and liabilities and their respective tax bases. Deferred tax assets and liabilities are measured using enacted tax rates expected to apply to taxable income in the years in which those temporary differences are expected to be recovered or settled. The effect on deferred taxes of a change in tax rates is recognized in the consolidated statements of comprehensive income (loss) in the period that includes the enactment date.
The Company recognizes the effect of income tax positions in the consolidated financial statements only if those positions are more likely than not to be sustained upon examination. Recognized income tax positions are measured at the largest amount of tax benefit that is greater than 50% likely of being realized upon settlement. Changes in recognition or measurement are reflected in the period in which the change in judgment occurs. The Company accounts for interest and penalties accrued for income tax contingencies as interest expense in the consolidated statements of comprehensive income (loss).
Recent Accounting Pronouncements
In May 2014, the Financial Accounting Standards Board (FASB) issued Accounting Standards Update (ASU) No. 2014-09,
Revenue from Contracts with Customers
, which requires an entity to recognize the amount of revenue to which it expects to be entitled for the transfer of promised goods or services to customers. The ASU will replace most existing revenue recognition guidance in US GAAP when it becomes effective. The standard permits the use of either the retrospective or cumulative effect transition method. In August 2015, the FASB issued ASU No. 2015-14,
Revenue from Contracts with Customers
, which provides for a one-year deferral of the effective date of ASU No. 2014-09, as well as early application, which will be effective with respect to the Company's annual and interim reporting periods beginning April 1, 2018. In March 2016, the FASB issued ASU No. 2016-08,
Principal versus Agent Considerations (Reporting Revenue Gross versus Net)
, which clarifies how to apply the implementation guidance related to principal versus agent considerations within ASU No. 2014-09. The Company is continuing to evaluate the effect that the adoption of these ASUs will have on its consolidated financial statements and related disclosures, and has not yet selected a transition method. The Company is currently evaluating its business and contracts to determine any changes to accounting policies, processes or systems necessary to adopt the requirements of the new standard. The Company believes the adoption of this ASU will not have a material impact on its consolidated financial statements, but it is expected to result in expanded disclosures.
In July 2015, the FASB issued ASU No. 2015-11,
Simplifying the Measurement of Inventory
, which changed the US GAAP requirement that, at each financial statement date, entities measure inventory at the lower of cost or market, which is typically determined by reference to the current replacement cost, net realizable value, and the net realizable value less an approximate normal profit margin. The definition of net realizable value under this ASU is the estimated selling price in the ordinary course of business, less reasonably predictable costs of completion, disposal, and transportation. This ASU only applies to inventory that is measured using the first-in, first-out or average cost methods. This ASU is effective with respect to the Company's annual and interim reporting periods beginning on April 1, 2017,
F-16
DECKERS OUTDOOR CORPORATION AND SUBSIDIARIES
NOTES TO CONSOLIDATED FINANCIAL STATEMENTS
March 31, 2017, 2016 and 2015
(amounts in thousands, except share data)
with early adoption permitted, and should be applied prospectively. The adoption of this ASU will not have a material impact on the Company's consolidated financial statements and related disclosures.
In February 2016, the FASB issued ASU 2016-02,
Leases
, to increase transparency and comparability among organizations by recognizing lease assets and lease liabilities on the balance sheet and disclosing key information about leasing arrangements. The new standard requires the recognition of lease assets and lease liabilities by lessees on the balance sheet for those leases classified as operating leases under previous US GAAP. A lessee should recognize a liability in the balance sheet to make lease payments (the lease liability) at fair value and an offsetting right-of-use asset representing its right to use the underlying asset for the lease term. When measuring assets and liabilities arising from a lease, a lessee should include payments to be made in optional periods only if the lessee is reasonably certain that it will exercise an option to extend the lease or will not exercise an option to terminate the lease. Similarly, optional payments to purchase the underlying asset should be included in the measurement of lease assets and lease liabilities only if the lessee is reasonably certain that it will exercise that purchase option. This ASU requires a modified retrospective transition method for leases existing at the beginning of the earliest comparative period presented in the adoption-period consolidated financial statements. Any leases that expire before the initial application will not require any accounting adjustment. This ASU is effective with respect to the Company's annual and interim reporting periods beginning April 1, 2019. The Company is evaluating the effect that the adoption of this ASU will have on its consolidated financial statements and related disclosures, and currently expects an increase in assets and liabilities due to the recognition of the required right-of-use asset and corresponding liability for all lease obligations that are currently classified as operating leases, such as retail stores, showrooms, and distribution facilities, as well as additional disclosure on all existing lease obligations. The income statement recognition of lease expense is not expected to materially change from the current methodology.
In March 2016, the FASB issued ASU No. 2016-09,
Improvements to Employee Share-Based Payment Accounting
, which requires an entity to recognize excess tax benefits and certain tax deficiencies associated with employee share-based payment awards in the income statement instead of in additional paid-in-capital when the awards vest or are settled, and present excess tax benefits as an operating activity on the statement of cash flows instead of as a financing activity. This ASU also allows entities to repurchase more of an employee’s shares for tax withholding purposes without triggering liability accounting, and to make a policy election to either estimate the number of awards that are expected to vest or to account for forfeitures as they occur. In addition, the cash paid by an entity to a tax authority when shares are withheld to satisfy its statutory income tax withholding obligation is required to be classified as a financing activity on its statement of cash flows. This ASU is effective with respect to the Company's annual and interim reporting periods beginning April 1, 2017 and the Company decided to apply this ASU prospectively. The Company evaluated the effect that the adoption of this ASU would have on its consolidated financial statements and related disclosures, and concluded that its adoption will not have a material impact on income tax expenses or additional paid-in capital for results of operations. However, there will be income statement volatility due to the recognition of all excess tax benefits and deficiencies within the consolidated statements of comprehensive income (loss), which will be driven by the number of shares vesting in any given period, and the change in share price between the grant date and the date that the shares vest. Increasing share prices from the grant date to the vesting date will result in lower income tax expense and higher net income.
In August 2016, the FASB issued ASU No. 2016-15,
Statement of Cash Flows, Classification of Certain Cash Receipts and Cash Payments
. The ASU addresses specific cash flow issues with the objective of reducing the diversity
in practice prior to issuance of the update. This ASU is effective with respect to the Company’s annual and interim reporting periods beginning April 1, 2018, with early adoption
permitted. The guidance should be applied retrospectively, requiring adjustment to all comparative periods presented, unless it is impractical to do so, in which case, the guidance should be applied prospectively as of the earliest date practicable. The Company is evaluating the effect that the adoption of this ASU will have on its statement of cash flows
and related disclosures, but its adoption is not expected to have a material impact.
In January 2017, the FASB issued ASU No. 2017-04,
Simplifying the Test for Goodwill Impairment,
which eliminates
step two from the goodwill impairment test. In computing the implied fair value of goodwill under current step two, an
entity previously had to perform procedures to determine the fair value of its assets and liabilities at the impairment
testing date following the procedure required to determine the fair value of assets acquired and liabilities assumed in
F-17
DECKERS OUTDOOR CORPORATION AND SUBSIDIARIES
NOTES TO CONSOLIDATED FINANCIAL STATEMENTS
March 31, 2017, 2016 and 2015
(amounts in thousands, except share data)
a business combination. Under this ASU, an entity is required to perform its annual or interim goodwill impairment test
by comparing the fair value of a reporting unit with its carrying amount. An entity should recognize an impairment
charge for the amount by which the carrying amount exceeds the reporting unit’s fair value. This ASU is effective with respect to
the Company’s annual and interim reporting periods beginning April 1, 2020, with early adoption permitted. The Company is evaluating the effect that the adoption
of this ASU will have on its consolidated financial statements and related disclosures.
In connection with the Company's announced restructuring plan in the fourth quarter of fiscal year 2016, the Company closed
25
retail stores
as of March 31, 2017
, and consolidated its brand operations and corporate headquarters. In connection with these restructuring efforts, the Company incurred total restructuring charges of approximately
$29,100
and
$24,800
during fiscal year 2017 and 2016, respectively, with a total of
$29,100
and
$22,800
recognized in SG&A expenses and approximately
$0
and
$2,000
in cost of sales, respectively. The related liabilities are reflected in accrued payroll and other accrued expenses. Of the total amount, approximately
$11,100
remained accrued as of
March 31, 2017
, and is expected to be paid during fiscal year 2018.
During the year ended March 31, 2017, the Company identified additional s
tores for closure. During fiscal year 2017, the Company recognized approximately
$3,600
in restructuring charges in SG&A expenses related to non-cash impairment charges for the retail store assets for
12
of these stores.
It is anticipated that the Company will incur restructuring costs similar in nature to its historical activities in future fiscal years and in connection with the Company closing retail stores to reach a target retail store count of
125
owned stores by the end of fiscal year 2020.
The following table summarizes the restructuring charges incurred in fiscal years 2017 and 2016:
|
Lease termination costs
|
Retail store fixed asset impairments
|
Severance costs
|
Software and office fixed asset impairments
|
Termination of various contracts and other services
|
Total
|
||||||||||||||||||
|
Fiscal year 2016 charges
|
$
|
8,900
|
|
$
|
5,800
|
|
$
|
4,000
|
|
$
|
3,800
|
|
$
|
2,300
|
|
$
|
24,800
|
|
|||||
|
Paid in cash
|
(1,200
|
)
|
—
|
|
(600
|
)
|
—
|
|
—
|
|
(1,800
|
)
|
|||||||||||
|
Non-cash
|
—
|
|
(5,800
|
)
|
—
|
|
(3,800
|
)
|
(500
|
)
|
(10,100
|
)
|
|||||||||||
|
Liability as of March 31, 2016
|
7,700
|
|
—
|
|
3,400
|
|
—
|
|
1,800
|
|
12,900
|
|
|||||||||||
|
Additional charges
|
9,000
|
|
3,600
|
|
5,800
|
|
3,200
|
|
7,500
|
|
29,100
|
|
|||||||||||
|
Paid in cash
|
(12,000
|
)
|
—
|
|
(6,400
|
)
|
—
|
|
(5,400
|
)
|
(23,800
|
)
|
|||||||||||
|
Non-cash
|
—
|
|
(3,600
|
)
|
(300
|
)
|
(3,200
|
)
|
—
|
|
(7,100
|
)
|
|||||||||||
|
Liability as of March 31, 2017
|
$
|
4,700
|
|
$
|
—
|
|
$
|
2,500
|
|
$
|
—
|
|
$
|
3,900
|
|
$
|
11,100
|
|
|||||
F-18
DECKERS OUTDOOR CORPORATION AND SUBSIDIARIES
NOTES TO CONSOLIDATED FINANCIAL STATEMENTS
March 31, 2017, 2016 and 2015
(amounts in thousands, except share data)
The following table summarizes these restructuring charges by reportable operating segment:
|
Years Ended March 31,
|
|||||||
|
2017
|
2016
|
||||||
|
UGG brand wholesale
|
$
|
2,100
|
|
$
|
—
|
|
|
|
Teva brand wholesale
|
—
|
|
—
|
|
|||
|
Sanuk brand wholesale
|
100
|
|
3,000
|
|
|||
|
Other brands wholesale
|
100
|
|
2,500
|
|
|||
|
Direct-to-Consumer
|
12,900
|
|
10,500
|
|
|||
|
Unallocated overhead costs
|
13,900
|
|
8,800
|
|
|||
|
Total restructuring charges
|
$
|
29,100
|
|
$
|
24,800
|
|
|
The Company's goodwill and other intangible assets are as follows:
|
As of March 31,
|
|||||||
|
2017
|
2016
|
||||||
|
Goodwill
|
|||||||
|
UGG brand
|
$
|
6,101
|
|
$
|
6,101
|
|
|
|
Sanuk brand
|
—
|
|
113,944
|
|
|||
|
Other brands
|
7,889
|
|
7,889
|
|
|||
|
Total Goodwill
|
13,990
|
|
127,934
|
|
|||
|
Other Intangible Assets
|
|||||||
|
Indefinite-lived Intangible Assets
|
|||||||
|
Trademarks
|
15,455
|
|
15,455
|
|
|||
|
Definite-lived Intangible Assets
|
|||||||
|
Trademarks
|
55,244
|
|
55,244
|
|
|||
|
Other
|
57,629
|
|
57,629
|
|
|||
|
Total gross carrying amount
|
112,873
|
|
112,873
|
|
|||
|
Accumulated amortization
|
(54,361
|
)
|
(45,302
|
)
|
|||
|
Accumulated impairment
|
(8,829
|
)
|
—
|
|
|||
|
Net Definite-lived Intangible Assets
|
49,683
|
|
67,571
|
|
|||
|
Total Other Intangible Assets
|
65,138
|
|
83,026
|
|
|||
|
Total Goodwill and Other Intangible Assets
|
$
|
79,128
|
|
$
|
210,960
|
|
|
F-19
DECKERS OUTDOOR CORPORATION AND SUBSIDIARIES
NOTES TO CONSOLIDATED FINANCIAL STATEMENTS
March 31, 2017, 2016 and 2015
(amounts in thousands, except share data)
The weighted-average amortization period for definite-lived intangible assets is
16
years and
13
years for the
years ended March 31, 2017
and 2016, respectively. Intangible assets consist primarily of indefinite-lived trademarks and definite-lived trademarks, customer and distributor relationships, patents, lease rights, and non-compete agreements arising from the application of purchase accounting.
Goodwill is allocated to the wholesale reportable operating segments of the brands described above. Changes in the Company's goodwill balance for the periods presented in the consolidated balance sheets are as follows:
|
Goodwill,
Gross
|
Accumulated
Impairment
|
Goodwill, Net
|
|||||||||
|
Balance, March 31, 2015
|
$
|
143,765
|
|
$
|
(15,831
|
)
|
$
|
127,934
|
|
||
|
Changes related to acquisitions, impairments and other adjustments
|
—
|
|
—
|
|
—
|
|
|||||
|
Balance, March 31, 2016
|
143,765
|
|
(15,831
|
)
|
127,934
|
|
|||||
|
Changes related to acquisitions, impairments and other adjustments
|
—
|
|
(113,944
|
)
|
(113,944
|
)
|
|||||
|
Balance, March 31, 2017
|
$
|
143,765
|
|
$
|
(129,775
|
)
|
$
|
13,990
|
|
||
During the third quarter of the
year ended March 31, 2017
, consistent with applicable accounting guidance, the Company performed the annual impairment assessment of the Sanuk brand's wholesale reportable operating segment goodwill as of October 31, 2016 with the assistance of a third party valuation firm. The annual assessment determined that there was an indication of impairment of the Sanuk brand's wholesale reportable segment goodwill. In particular, step one of the impairment assessment concluded that the fair value of the Sanuk brand's wholesale reportable operating segment was below its carrying value, which was primarily the result of lower-than-forecasted sales, lower market multiples for non-athletic footwear and apparel, and a more limited view of international and domestic expansion opportunities for the brand given the changing retail environment. Accordingly, the Company then performed step two of the impairment assessment, which required fair value to be allocated to all of the assets and liabilities of the Sanuk brand's wholesale reportable operating segment, using a hypothetical allocation of assets, including net tangible and intangible assets. As a result of this analysis, the Company recorded a
$113,944
non-cash impairment charge to the Sanuk brand's wholesale reportable operating segment goodwill during the third quarter of the
year ended March 31, 2017
, which was reflected in SG&A expenses in the consolidated statements of comprehensive income (loss).
At October 31, 2015, the Company performed the annual impairment test and evaluated the Sanuk brand's wholesale reportable operating segment goodwill and, based on comparing the carrying amounts of the Sanuk brand's wholesale reportable operating segment goodwill to the 2016 sales and operating results and the brands' long-term forecasts of sales and operating results as of their evaluation dates, the Company concluded the carrying amount of the Sanuk brand's wholesale reportable operating segment goodwill was not impaired. The change in the sales forecasts between fiscal year 2017 and fiscal year 2016 at the annual impairment testing date of October 31st of each fiscal year, was primarily due to the change in forecast assumptions discussed above.
During the third quarter of the
year ended March 31, 2017
, the Company evaluated the Sanuk brand's definite long-lived assets for indicators of impairment, primarily as a result of the goodwill impairment discussed above. The Company's analysis determined that the Sanuk brand's amortizable patent under the Sanuk brand's wholesale reportable operating segment was fully impaired as the Sanuk SIDEWALK SURFERS utility patent had very limited value in the marketplace because of its limited ability to exclude others from creating similar products. As a result, the Company recorded a non-cash impairment charge to the patent of $
4,086
in the Sanuk wholesale reportable operating segment during the third quarter of fiscal year 2017, which was reflected in SG&A expenses in the consolidated statements of comprehensive income (loss). The impairment charge to the patent will result in lower annual amortization expense of approximately
$500
. The Company's analysis also determined that the Sanuk brand's other intangible assets, other than the amortizable patent discussed above, were not impaired as of the date on which the impairment test was completed, as it was determined that the undiscounted future cash flows associated with those assets exceeded their carrying values. However, as discussed above, additional impairment charges could be incurred in future periods.
F-20
DECKERS OUTDOOR CORPORATION AND SUBSIDIARIES
NOTES TO CONSOLIDATED FINANCIAL STATEMENTS
March 31, 2017, 2016 and 2015
(amounts in thousands, except share data)
At December 31, 2016 and 2015, the Company performed its annual impairment tests and evaluated the UGG brand and other brands' wholesale reportable operating segment goodwill, and at October 31, 2016 and 2015, evaluated the Teva brand's indefinite-lived trademarks. Based on the carrying amounts of the UGG brands and other brands' wholesale reportable segment goodwill and Teva brand's trademarks, the brands' fiscal year
2017
and
2016
sales and operating results, and the brands' long-term forecasts of sales and operating results as of their evaluation dates, the Company concluded that the carrying amounts of the goodwill and trademarks were not impaired.
During the third quarter of the
year ended March 31, 2017
, the Company recorded an impairment for other intangible assets in the DTC reportable operating segment of
$4,743
due to a decline in market rental rates for European retail stores, which was reflected in SG&A expenses in the consolidated statements of comprehensive income (loss).
Aggregate amortization expense for amortizable intangible assets during the
years ended March 31, 2017
, 2016 and 2015 was
$7,945
,
$8,850
, and
$11,291
, respectively.
Charges incurred in the consolidated statements of comprehensive income (loss) relevant to the Company's other intangible assets during the
year ended March 31, 2017
are as follows:
|
Balance, March 31, 2016
|
$
|
83,026
|
|
|
Impairment charges
|
(8,829
|
)
|
|
|
Amortization expense
|
(7,945
|
)
|
|
|
Foreign currency exchange rate fluctuations
|
(1,114
|
)
|
|
|
Balance, March 31, 2017
|
$
|
65,138
|
|
The following table summarizes the expected amortization expense
as of March 31, 2017
for amortizable intangible assets for the next
five years
and thereafter:
|
Years Ending March 31:
|
||||
|
2018
|
$
|
7,572
|
|
|
|
2019
|
6,106
|
|
||
|
2020
|
3,439
|
|
||
|
2021
|
2,526
|
|
||
|
2022
|
2,521
|
|
||
|
Thereafter
|
27,519
|
|
||
|
$
|
49,683
|
|
||
F-21
DECKERS OUTDOOR CORPORATION AND SUBSIDIARIES
NOTES TO CONSOLIDATED FINANCIAL STATEMENTS
March 31, 2017, 2016 and 2015
(amounts in thousands, except share data)
The fair value of the Company's cash and cash equivalents, trade accounts receivable, inventory, prepaid expenses, income taxes receivable, other current assets, short-term borrowings, trade accounts payable, accrued payroll, other accrued expenses, income taxes payable and value added tax payable approximate the carrying values due to the relatively short maturities of these assets and liabilities. The fair values of the Company's long-term liabilities do not significantly differ from the carrying values. The fair value of the contingent consideration related to acquisitions and of the Company's derivative instruments are measured and recorded at fair value on a recurring basis. Changes in fair value of contingent consideration resulting from either accretion or changes in discount rates or in the expectations of achieving the performance criteria are recorded in SG&A expenses in the consolidated statements of comprehensive income (loss). The Company records the fair value of assets or liabilities associated with derivative instruments and hedging activities in other current assets or other accrued expenses, respectively, in the consolidated balance sheets.
The inputs used in measuring fair value are prioritized into the following hierarchy:
|
•
|
Level 1: Quoted prices in active markets for identical assets or liabilities.
|
|
•
|
Level 2: Observable inputs other than quoted prices in active markets for identical assets and liabilities.
|
|
•
|
Level 3: Unobservable inputs in which little or no market activity exists, therefore requiring the reporting entity to develop its own assumptions.
|
The assets and liabilities that are measured on a recurring basis at fair value are summarized as follows:
|
Fair Value as of March 31, 2017
|
Fair Value Measurement Using
|
||||||||||||||
|
Level 1
|
Level 2
|
Level 3
|
|||||||||||||
|
Assets (liabilities) at fair value:
|
|||||||||||||||
|
Non-qualified deferred compensation asset
|
$
|
6,662
|
|
$
|
6,662
|
|
$
|
—
|
|
$
|
—
|
|
|||
|
Non-qualified deferred compensation liability
|
(4,140
|
)
|
(4,140
|
)
|
—
|
|
—
|
|
|||||||
|
Designated Derivative Contracts asset
|
1,365
|
|
—
|
|
1,365
|
|
—
|
|
|||||||
|
Fair Value as of March 31, 2016
|
Fair Value Measurement Using
|
||||||||||||||
|
Level 1
|
Level 2
|
Level 3
|
|||||||||||||
|
Assets (liabilities) at fair value:
|
|||||||||||||||
|
Non-qualified deferred compensation asset
|
$
|
6,083
|
|
$
|
6,083
|
|
$
|
—
|
|
$
|
—
|
|
|||
|
Non-qualified deferred compensation liability
|
(6,301
|
)
|
(6,301
|
)
|
—
|
|
—
|
|
|||||||
|
Designated Derivative Contracts asset
|
2,903
|
|
—
|
|
2,903
|
|
—
|
|
|||||||
|
Designated Derivative Contracts liability
|
(2,549
|
)
|
—
|
|
(2,549
|
)
|
—
|
|
|||||||
|
Contingent consideration for acquisition of business
|
(20,000
|
)
|
—
|
|
—
|
|
(20,000
|
)
|
|||||||
The Level 2 inputs consist of forward spot rates at the end of the applicable reporting period.
The Level 3 inputs include subjective assumptions used to value the contingent consideration liability in connection with prior acquisitions. The fair value of contingent consideration as of March 31, 2016 is related to the Sanuk brand and Hoka brand acquisitions. All contingent consideration payments have been fully paid as of March 31, 2017. Refer to Note 7, "Commitments and Contingencies", for additional information regarding the Company's contingent consideration payments.
F-22
DECKERS OUTDOOR CORPORATION AND SUBSIDIARIES
NOTES TO CONSOLIDATED FINANCIAL STATEMENTS
March 31, 2017, 2016 and 2015
(amounts in thousands, except share data)
The following table presents a reconciliation of the Level 3 measurement (rounded):
|
Balance, March 31, 2015
|
$
|
25,700
|
|
|
Payments
|
(1,300
|
)
|
|
|
Change in fair value
|
(4,400
|
)
|
|
|
Balance, March 31, 2016
|
20,000
|
|
|
|
Payments
|
(20,000
|
)
|
|
|
Balance, March 31, 2017
|
$
|
—
|
|
Income Tax (Benefit) Expense
Components of income tax (benefit) expense are as follows:
|
Years Ended March 31,
|
|||||||||||
|
2017
|
2016
|
2015
|
|||||||||
|
Current
|
|||||||||||
|
Federal
|
$
|
2,184
|
|
$
|
11,971
|
|
$
|
35,459
|
|
||
|
State
|
1,576
|
|
2,443
|
|
6,861
|
|
|||||
|
Foreign
|
8,039
|
|
12,039
|
|
7,069
|
|
|||||
|
Total
|
11,799
|
|
26,453
|
|
49,389
|
|
|||||
|
Deferred
|
|||||||||||
|
Federal
|
(20,287
|
)
|
7,887
|
|
8,234
|
|
|||||
|
State
|
(3,446
|
)
|
1,113
|
|
624
|
|
|||||
|
Foreign
|
(762
|
)
|
(833
|
)
|
1,112
|
|
|||||
|
Total
|
(24,495
|
)
|
8,167
|
|
9,970
|
|
|||||
|
Income tax (benefit) expense
|
$
|
(12,696
|
)
|
$
|
34,620
|
|
$
|
59,359
|
|
||
Foreign income before income taxes was
$49,319
,
$105,938
, and
$95,850
during the
years ended March 31, 2017
,
2016 and 2015, respectively.
F-23
DECKERS OUTDOOR CORPORATION AND SUBSIDIARIES
NOTES TO CONSOLIDATED FINANCIAL STATEMENTS
March 31, 2017, 2016 and 2015
(amounts in thousands, except share data)
Income Tax (Benefit) Expense Reconciliation
Income tax (benefit) expense differed from that obtained by applying the statutory federal income tax rate to income before income taxes as follows:
|
Years Ended March 31,
|
|||||||||||
|
2017
|
2016
|
2015
|
|||||||||
|
Computed expected income taxes
|
$
|
(2,445
|
)
|
$
|
54,910
|
|
$
|
77,399
|
|
||
|
State income taxes, net of federal income tax benefit
|
(1,403
|
)
|
1,298
|
|
3,564
|
|
|||||
|
Foreign rate differential
|
(8,062
|
)
|
(28,233
|
)
|
(25,535
|
)
|
|||||
|
Unrecognized tax benefits
|
2,691
|
|
3,670
|
|
3,566
|
|
|||||
|
Income tax expense on diminution of operations and nondeductible goodwill
|
3,921
|
|
1,352
|
|
—
|
|
|||||
|
Foreign income withholding tax expense
|
432
|
|
—
|
|
—
|
|
|||||
|
Nontaxable income
|
(5,055
|
)
|
—
|
|
—
|
|
|||||
|
Statutory foreign income tax (benefit) expense
|
(2,504
|
)
|
(477
|
)
|
20
|
|
|||||
|
Other
|
(271
|
)
|
2,100
|
|
345
|
|
|||||
|
Income tax (benefit) expense
|
$
|
(12,696
|
)
|
$
|
34,620
|
|
$
|
59,359
|
|
||
Deferred Taxes
The tax effects of temporary differences that give rise to significant portions of deferred tax assets and deferred tax liabilities are presented as follows:
|
As of March 31,
|
|||||||
|
2017
|
2016
|
||||||
|
Deferred tax assets (liabilities), noncurrent:
|
|||||||
|
Amortization and impairment of intangible assets
|
$
|
28,304
|
|
$
|
(5,128
|
)
|
|
|
Depreciation of property and equipment
|
(19,511
|
)
|
(8,804
|
)
|
|||
|
Stock-based compensation
|
6,258
|
|
10,118
|
|
|||
|
Deferred rent
|
6,809
|
|
5,383
|
|
|||
|
Acquisition costs
|
751
|
|
745
|
|
|||
|
Uniform capitalization adjustment to inventory
|
4,971
|
|
5,280
|
|
|||
|
Bad debt and other reserves
|
15,946
|
|
14,163
|
|
|||
|
State taxes
|
(145
|
)
|
863
|
|
|||
|
Prepaid expenses
|
(4,144
|
)
|
(3,622
|
)
|
|||
|
Accrued bonuses
|
1,456
|
|
536
|
|
|||
|
Foreign currency exchange rate hedges
|
(534
|
)
|
(94
|
)
|
|||
|
Other
|
1,376
|
|
1,196
|
|
|||
|
Net operating loss carry-forwards
|
3,171
|
|
—
|
|
|||
|
Net deferred tax assets
|
$
|
44,708
|
|
$
|
20,636
|
|
|
In order to fully realize the deferred tax assets, the Company will need to generate future taxable income of approximately
$126,386
. The deferred tax assets are primarily related to the Company's domestic operations and are currently expected to be realized between fiscal years 2018 and 2029. The change in net deferred tax assets between
March 31, 2017
and
March 31, 2016
includes approximately
$400
attributable to the effective portion of Designated Derivative Contracts recognized in OCI. Refer to Note 9, "Foreign Currency Exchange Rate Contracts and Hedging",
F-24
DECKERS OUTDOOR CORPORATION AND SUBSIDIARIES
NOTES TO CONSOLIDATED FINANCIAL STATEMENTS
March 31, 2017, 2016 and 2015
(amounts in thousands, except share data)
for additional information regarding the Company's derivative instruments and the impact to OCI. Domestic income (loss) before income taxes for the
years ended March 31, 2017
, 2016 and 2015 was
$(56,305)
,
$50,947
, and
$125,289
, respectively. Based upon the level of historical taxable income and projections for future taxable income over the periods in which the deferred tax assets are deductible, management believes it is more likely than not that the results of future operations will generate sufficient taxable income to realize the net deferred tax assets and, accordingly,
no
valuation allowance was recorded in fiscal years
2017
and
2016
.
Tax Impact of Foreign Earnings
As of March 31, 2017
, the Company has not provided deferred taxes on approximately
$505,124
of US GAAP undistributed earnings from non-US subsidiaries where the earnings are considered to be permanently reinvested. Management’s intent is to continue to reinvest these earnings to support the strategic priority for growth in international markets. If management decides at a later date to repatriate these funds to the US, the Company would be required to provide taxes on these amounts based on applicable US tax rates, net of foreign taxes already paid. The Company has not determined the deferred tax liability associated with these undistributed earnings, as doing so is not practicable.
As of March 31, 2017
, the Company had approximately
$265,773
of cash and cash equivalents outside the US.
Unrecognized Tax Benefits
When tax returns are filed, some positions taken are subject to uncertainty about the merits of the position taken or the amount that would be ultimately sustained upon examination. The benefit of a tax position is recognized in the financial statements in the period during which the Company believes it is more likely than not that the position will be sustained upon examination. Tax positions that meet the more likely than not recognition threshold are measured as the largest amount of tax benefit that is more than
50%
likely to be realized upon settlement. The portion of the benefit that exceeds the amount measured, as described above, is reflected as a liability for unrecognized tax benefits in the consolidated balance sheets, along with any associated interest and penalties that would be payable to the taxing authorities upon examination.
A reconciliation of the beginning and ending amounts of total unrecognized tax benefits is as follows:
|
Balance, March 31, 2015
|
$
|
4,667
|
|
|
Gross increase related to current year tax positions
|
2,332
|
|
|
|
Gross increase related to prior year tax positions
|
2,059
|
|
|
|
Settlements
|
(363
|
)
|
|
|
Balance, March 31, 2016
|
8,695
|
|
|
|
Gross increase related to current year tax positions
|
1,878
|
|
|
|
Gross increase related to prior year tax positions
|
1,154
|
|
|
|
Balance, March 31, 2017
|
$
|
11,727
|
|
The amount of accrued unrecognized tax benefits, net of federal benefit, affecting the effective tax rate
as of March 31, 2017
was
$2,691
. The accrual relates to tax positions taken in years that are open to examination.
As of March 31, 2017
, interest and potential penalties of
$2,990
compared to
$1,842
as of March 31, 2016
were accrued in the consolidated balance sheets resulting from tax positions that are subject to examination and were recorded in interest expense in the Company’s consolidated statements of comprehensive income (loss). It is reasonably possible that approximately
$856
of unrecognized tax benefits will be settled within the next 12 months.
The Company files income tax returns in the US federal jurisdiction and various state, local, and foreign jurisdictions. With few exceptions, the Company is no longer subject to US federal, state, local, or non-US income tax examinations by tax authorities for years before 2012.
F-25
DECKERS OUTDOOR CORPORATION AND SUBSIDIARIES
NOTES TO CONSOLIDATED FINANCIAL STATEMENTS
March 31, 2017, 2016 and 2015
(amounts in thousands, except share data)
Although the Company believes its tax estimates are reasonable and prepares its tax filings in accordance with all applicable tax laws, the final determination with respect to any tax audits, and any related litigation, could be materially different from the Company's estimates or from its historical income tax provisions and accruals. The results of an audit or litigation could have a material effect on operating results or cash flows in the periods for which that determination is made. In addition, future period earnings may be adversely impacted by litigation costs, settlements, penalties, or interest assessments.
The Company has on-going income tax examinations in various state and foreign tax jurisdictions. It is the opinion of management that these audits and inquiries will not have a material impact on the Company's consolidated financial statements.
Domestic Credit Facility
In November 2014, the Company amended its revolving credit facility agreement with JPMorgan Chase Bank, National Association (JPMorgan) as the administrative agent, Comerica and HSBC as co-syndication agents, and the lenders party thereto, in its entirety (as amended, the Second Amended and Restated Credit Agreement) (Domestic Credit Facility). In August 2015, the Company entered into an additional amendment to the Second Amended and Restated Credit Agreement to add certain foreign subsidiaries as borrowers, and in October 2016, further amended the Second Amended and Restated Credit Agreement to allow increased borrowing under its China Credit Facility (as defined below). The Domestic Credit Facility is a
five
-year,
$400,000
secured revolving credit facility that contains a
$75,000
sublimit for the issuance of letters of credit and a
$5,000
sublimit for swingline loans, and which matures on November 13, 2019. Subject to customary conditions and the approval of any lender whose commitment would be increased, the Company has the option to increase the maximum principal amount available under the Domestic Credit Facility by up to an additional
$200,000
, resulting in a maximum available principal amount of
$600,000
. No lender under the Domestic Credit Facility has committed at this time or is obligated to provide any such increase in the commitments. In addition to allowing borrowings in US dollars, the Domestic Credit Facility provides a
$150,000
sublimit for borrowings in Euros, British Pounds and any other currency that is subsequently approved by JPMorgan, each lender and the issuing bank. As of
March 31, 2017
, the Company had debt capacity of approximately
$378,000
out of
$400,000
, due to limitations on consolidated worldwide borrowings under the terms of the Domestic Credit Facility.
At the Company's election, interest under the Domestic Credit Facility is tied to the adjusted London Interbank Offered Rate (LIBOR) or the Alternative Base Rate (ABR), and is variable based on the Company's total adjusted leverage ratio each quarter. The initial adjusted LIBOR rate is equal to the effective LIBOR rate for the interest period elected, plus
1.25%
per annum, or at the ABR plus
0.25%
per annum, and thereafter the interest rate will fluctuate between adjusted
LIBOR
plus
1.25%
per annum and adjusted LIBOR plus
2.00%
per annum (or between the ABR plus
0.25%
per annum and the ABR plus
1.00%
per annum), based upon the Company's total adjusted leverage ratio at such time. The ABR is defined in the Second Amended and Restated Credit Agreement as the rate per annum equal to the greater of (1) the prime rate, (2) the federal funds effective rate plus
0.50%
and (3) the adjusted LIBOR rate for a one-month interest period plus
1.00%
.
In addition, the Company is initially required to pay commitment fees of
0.175%
per annum on the daily amount of the available borrowings under the Domestic Credit Facility, and thereafter the fee rate will fluctuate between
0.175%
and
0.30%
per annum, based upon the Company's total adjusted leverage ratio. As of
March 31, 2017
, the adjusted LIBOR and ABR rates were
2.48%
and
4.50%
, respectively.
The Company's obligations under the Domestic Credit Facility are guaranteed by the Company's existing and future wholly-owned domestic subsidiaries (other than certain immaterial subsidiaries, foreign subsidiaries, foreign subsidiary holding companies and specified excluded subsidiaries) (Guarantors), and are secured by a first-priority security interest in substantially all of the assets of the Company and the Guarantors, including all or a portion of the equity interests of certain of the Company's domestic and first-tier foreign subsidiaries.
F-26
DECKERS OUTDOOR CORPORATION AND SUBSIDIARIES
NOTES TO CONSOLIDATED FINANCIAL STATEMENTS
March 31, 2017, 2016 and 2015
(amounts in thousands, except share data)
The Domestic Credit Facility is governed by financial covenants which include: the total adjusted leverage ratio must not be greater than
3.25
to
1.00
; the sum of the consolidated annual earnings before interest, taxes, depreciation, and amortization and annual rental expense, divided by the sum of the annual interest expense and the annual rental expense must be greater than
2.25
to
1.00
on a pro-forma basis; and other customary limitations. The Domestic Credit Facility is governed by certain other covenants which include: the maximum amount paid for capital expenditures may not exceed
$110,000
per year if the total adjusted leverage ratio is equal to or exceeds
2.75
to
1.00
; the maximum additional unsecured debt may not exceed
$200,000
; the Company may not have aggregate Employee Retirement Income Security Act of 1974 events that are considered materially adverse; the Company may not have a change of control (as defined in the Second Amended and Restated Credit Agreement); and no restrictions on cash dividends, share repurchases or acquisitions may be made, provided that no event of default has occurred or is continuing, and that the total adjusted leverage ratio does not exceed
2.75
to
1.00
on a pro-forma basis.
During the
year ended March 31, 2017
, the Company borrowed approximately
$332,000
and repaid approximately
$385,000
under the Domestic Credit Facility. As of
March 31, 2017
, the Company had
no
outstanding balance under the Domestic Credit Facility and had outstanding letters of credit of approximately
$549
. As a result, the available borrowings under the Domestic Credit Facility were approximately
$378,000
at
March 31, 2017
. Amounts outstanding are included in short-term borrowings in the consolidated balance sheets. As of
March 31, 2017
, the Company had a remaining balance of approximately
$1,000
in deferred financing costs related to previous amendments to the Domestic Credit Facility included in prepaid expenses in the consolidated balance sheets. This amount is being amortized ratably over the
five
year term of the Second Amended and Restated Credit Agreement.
Subsequent to
March 31, 2017
, the Company made
no
additional borrowings, resulting in
no
outstanding balance and available borrowings of approximately
$378,000
under the Domestic Credit Facility at
May 30, 2017
.
China Credit Facility
In August 2013, Deckers (Beijing) Trading Co., LTD (DBTC), a wholly-owned subsidiary of the Company, entered into a revolving credit facility agreement in China (as amended, China Credit Facility) that provided for an uncommitted revolving line of credit of up to CNY
60,000
,
or approximately
$9,000
, in the quarters ending September 30th and December 31st and CNY
20,000
, or approximately
$3,000
, in the quarters ending March 31st and June 30th. In December 2013, the China Credit Facility was amended to provide for the uncommitted revolving line of credit of up to CNY
60,000
to be extended to the entire year. In October 2014, the China Credit Facility was further amended to include, among other things, an extension of the aggregate period of borrowing from
12
months to
18
months. In October 2015, the China Credit Facility was further amended to include an increase in the uncommitted revolving line of credit of up to CNY
150,000
,
or approximately
$22,000
, including a sublimit of CNY
50,000
, or approximately
$7,000
, for the Company's wholly-owned subsidiary, Deckers Footwear (Shanghai) Co., LTD (DFSC) and to reduce the aggregate period of borrowing from
18
to
12
months. In October 2016, the China Credit Facility was further amended to include an increase in the uncommitted revolving line of credit of up to CNY
300,000
, or approximately
$44,000
, and to remove the sublimit of CNY
50,000
, or approximately
$7,000
, for DFSC. In March 2017, the China Credit Facility was amended to remove DFSC, leaving DBTC as the remaining borrower.
The China Credit Facility is payable on demand and subject to annual review and renewal. The obligations under the China Credit Facility are guaranteed by the Company for
108.5%
of the facility amount in US dollars. Interest is based on
110.0%
of the People’s Bank of China rate, which was
4.35%
as of
March 31, 2017
.
During the
year ended March 31, 2017
, the Company borrowed approximately
$35,000
and repaid approximately
$48,000
under the China Credit Facility. As of
March 31, 2017
, the Company had
no
outstanding balance under the China Credit Facility and had available borrowings of approximately
$44,000
. Amounts outstanding are included in short-term borrowings in the consolidated balance sheets.
Subsequent to
March 31, 2017
, the Company made
no
additional borrowings, resulting in
no
outstanding balance and available borrowings of approximately
$44,000
under the China Credit Facility at
May 30, 2017
.
F-27
DECKERS OUTDOOR CORPORATION AND SUBSIDIARIES
NOTES TO CONSOLIDATED FINANCIAL STATEMENTS
March 31, 2017, 2016 and 2015
(amounts in thousands, except share data)
Japan Credit Facility
In March 2016, Deckers Japan, G.K., a wholly-owned subsidiary of the Company, entered into a revolving credit facility agreement in Japan (Japan Credit Facility) that provides for an uncommitted revolving line of credit of up to JPY
5,500,000
, or approximately
$49,000
, for a maximum term of
six
months for each draw on the facility. The Japan Credit Facility renews annually, and is guaranteed by the Company. The Company has renewed the Japan Credit Facility through January 31, 2018 under the terms of the original agreement. Interest is based on the Tokyo Interbank Offered Rate (TIBOR) for three months plus
0.40%
.
As of
March 31, 2017
, TIBOR for three months was
0.06%
and the effective interest rate was
0.46%
. The Japan Credit Facility has customary covenants including a restriction against having losses for
two
consecutive years, maintaining an interest coverage ratio greater than
1.00
to
1.00
, and maintaining higher assets than liabilities.
During the
year ended March 31, 2017
, the Company borrowed approximately
$38,000
and repaid approximately
$35,000
under the Japan Credit Facility. As of
March 31, 2017
, the Company had
no
outstanding balance under the Japan Credit Facility and had available borrowings of approximately
$49,000
. Amounts outstanding are included in short-term borrowings in the consolidated balance sheets.
Subsequent to
March 31, 2017
, the Company made
no
additional borrowings, resulting in
no
outstanding balance and available borrowings of approximately
$49,000
under the Japan Credit Facility at
May 30, 2017
.
Mortgage
In July 2014, the Company obtained a mortgage secured by its corporate headquarters property for approximately
$33,900
. As of
March 31, 2017
,
the outstanding principal balance under the mortgage was approximately
$32,631
, which includes approximately
$549
in short-term borrowings and approximately
$32,082
in mortgage payable in the consolidated balance sheets. The mortgage has a fixed interest rate of
4.928%
. Payments include interest and principal in an amount that amortizes the principal balance over a
30
-year period; however, the loan will mature and have a balloon payment, due on
July 1, 2029
of approximately
$23,700
, in addition to any then-outstanding balance. Minimum principal payments over the next
five years
are approximately
$3,040
. In December 2014, the mortgage financial covenants were amended to be consistent with the financial covenants that govern the Domestic Credit Facility, discussed above.
As of
March 31, 2017
, the Company was in compliance with all debt covenants under its borrowing arrangements and remains in compliance at
May 30, 2017
.
The borrowing and repayment amounts disclosed above for the China Credit Facility and Japan Credit Facility have been translated into US dollars using average currency exchange rates in effect as of the borrowing and repayment dates during the fiscal year 2017. The outstanding balance or available borrowing amounts disclosed above for the China Credit Facility and Japan Credit Facility have been translated into US dollars using spot rates in effect as of
March 31, 2017
. As a result, there are differences between the debt balances within this footnote disclosure due to foreign currency exchange rates.
F-28
DECKERS OUTDOOR CORPORATION AND SUBSIDIARIES
NOTES TO CONSOLIDATED FINANCIAL STATEMENTS
March 31, 2017, 2016 and 2015
(amounts in thousands, except share data)
Lease Commitments
The Company leases office, distribution and retail facilities, and automobiles, under operating lease agreements which continue in effect through
2028
. Some of the leases contain renewal options of anywhere from
1
to
15
years. Since the terms of these arrangements meet the accounting definition of operating lease arrangements, the aggregate sum of future minimum lease payments is not reflected on the consolidated balance sheets. Future minimum commitments under the lease agreements are as follows:
|
Years Ending March 31:
|
Future Minimum Lease Commitments
|
|||
|
2018
|
$
|
51,319
|
|
|
|
2019
|
49,040
|
|
||
|
2020
|
41,261
|
|
||
|
2021
|
36,221
|
|
||
|
2022
|
31,459
|
|
||
|
Thereafter
|
102,170
|
|
||
|
$
|
311,470
|
|
||
The following schedule shows the composition of total rental expense:
|
Years Ended March 31,
|
|||||||||||
|
2017
|
2016
|
2015
|
|||||||||
|
Minimum rentals
|
$
|
63,050
|
|
$
|
61,227
|
|
$
|
61,363
|
|
||
|
Contingent rentals
|
15,281
|
|
16,067
|
|
14,707
|
|
|||||
|
$
|
78,331
|
|
$
|
77,294
|
|
$
|
76,070
|
|
|||
Purchase Obligations
Product
The Company had
$392,716
of outstanding purchase orders with its manufacturers at
March 31, 2017
. The Company has an extended design and manufacturing process, which requires it to forecast production volumes and estimate inventory requirements many months before consumers make a decision to purchase its products. The Company generally orders product
four
to
eight
months in advance of the anticipated shipment dates based primarily on orders received from wholesale customers and through the DTC reportable operating segment. Accordingly, the aggregate amount reflects purchase obligations for products that the Company reasonably expects to fulfill in the ordinary course of business. However, a significant portion of the purchase obligations can be cancelled by the Company under certain circumstances; however, the occurrence of such circumstances is generally limited. As a result, the amount does not necessarily reflect the dollar amount of the Company's binding commitments or minimum purchase obligations, and instead reflects an estimate of its future payment obligations based on information currently available.
Sheepskin
The Company had an aggregate of
$122,869
of purchase obligations for sheepskin at
March 31, 2017
. These obligations generally arise under
two
-year supply agreements. The aggregate amount reflects the remaining commitments under these purchase orders. The Company enters into contracts requiring purchase commitments of sheepskin that its affiliates, manufacturers, factories, and other agents (each or collectively, a Buyer) must make on or before a specified target date. These agreements may result in unconditional purchase obligations if a Buyer does not meet the minimum purchase requirements. In the event that a Buyer does not purchase such minimum commitments by the target dates, the Company would be responsible for compliance with any and all minimum purchase commitments
F-29
DECKERS OUTDOOR CORPORATION AND SUBSIDIARIES
NOTES TO CONSOLIDATED FINANCIAL STATEMENTS
March 31, 2017, 2016 and 2015
(amounts in thousands, except share data)
under these contracts, and the Company would make additional deposit payments towards the purchase of the remaining minimum commitments and such additional deposits would be returned as the Buyer purchases the remaining minimum commitments. The contracts do not permit net settlement. There were no additional deposits on remaining minimum commitments as of
March 31, 2017
. Included in other current assets on the consolidated balance sheets are approximately
$12,200
and
$20,000
of additional deposits related to prior sheepskin contracts at
March 31, 2017
and
2016
, respectively.
Minimum commitments for these contracts at
March 31, 2017
were as follows:
|
Contract
Effective Date
|
Final
Target Date
|
Contract Value
|
Remaining
Commitment |
|||||||
|
May 2015
|
September 2017
|
$
|
55,200
|
|
$
|
36,567
|
|
|||
|
September 2015
|
September 2017
|
7,200
|
|
2,172
|
|
|||||
|
October 2016
|
September 2017
|
16,105
|
|
13,427
|
|
|||||
|
November 2016
|
September 2017
|
24,000
|
|
17,003
|
|
|||||
|
October 2016
|
September 2018
|
53,700
|
|
53,700
|
|
|||||
The Company expects that purchases made under these agreements in the ordinary course of business will eventually exceed the minimum commitment levels, and that any deposits will become fully refundable or reflected as a credit against purchases.
Other
The Company had an aggregate of
$18,942
of other purchase obligations at
March 31, 2017
, which generally consisted of material commitments for future capital expenditures, obligations under service contracts, and requirements to pay promotional expenses. Future capital expenditures primarily related to information technology upgrades at the Company's distribution centers in California and tenant improvements for retail store space in the US.
Litigation
From time to time, the Company is involved in various legal proceedings and claims arising in the ordinary course of business. Although the results of legal proceedings and claims cannot be predicted with certainty, the Company currently believes that the final outcome of these ordinary course matters will not, individually or in the aggregate, have a material adverse effect on its business, operating results, financial condition or cash flows. However, regardless of the outcome, litigation can have an adverse impact on the Company because of legal costs, diversion of management time and resources, and other factors.
Contingent Consideration
The purchase price for the Sanuk brand, acquired in July 2011, included contingent consideration payments. The final contingent consideration payment of approximately
$19,700
was paid during the
year ended March 31, 2017
.
The purchase price for the Hoka brand, acquired in September 2012, included contingent consideration through calendar year 2017, with a maximum contingent amount payable of
$2,000
. The conditions for payment were met during the
year ended March 31, 2016
;
$1,700
was paid as of March 31, 2016, and
$300
was paid as of March 31, 2017. The full final contingent consideration has been paid
as of March 31, 2017
.
Indemnification
The Company has agreed to indemnify certain of its licensees, distributors, and promotional partners in connection with claims related to the use of the Company's intellectual property. The terms of such agreements range up to
five
years initially and generally do not provide for a limitation on the maximum potential future payments. From time to
F-30
DECKERS OUTDOOR CORPORATION AND SUBSIDIARIES
NOTES TO CONSOLIDATED FINANCIAL STATEMENTS
March 31, 2017, 2016 and 2015
(amounts in thousands, except share data)
time, the Company also agrees to indemnify its licensees, distributors and promotional partners in connection with claims that the Company’s products infringe the intellectual property rights of third parties. These agreements may or may not be made pursuant to a written contract. In addition, from time to time, the Company also agrees to standard indemnification provisions in commercial agreements in the ordinary course of business.
Management believes the likelihood of any payments under any of these arrangements is remote and would be immaterial. This determination was made based on a prior history of insignificant claims and related payments. There are no currently pending claims relating to indemnification matters involving the Company's intellectual property.
Equity Incentive Plans
In May 2006, the Company adopted the 2006 Equity Incentive Plan (2006 Plan), which was amended on May 9, 2007. In September 2015, the Company's stockholders approved the 2015 Stock Incentive Plan (2015 SIP), which replaced the Company's 2006 Plan. As with the 2006 Plan, the primary purpose of the 2015 SIP is to encourage ownership in the Company by key personnel, whose long-term service is considered essential to the Company’s continued success. The 2015 SIP reserves
1,275,000
shares of the Company’s common stock for issuance to employees, directors, consultants, independent contractors and advisors, plus any additional shares that are forfeited, or are otherwise terminated under the 2006 Plan. The maximum aggregate number of shares that may be issued to employees under the 2015 SIP through the exercise of incentive stock options is
750,000
.
The Company uses various types of stock-based compensation under the 2006 Plan and 2015 SIP, including time-based restricted stock units (RSUs), performance-based stock units (PSUs), stock appreciation rights (SARs) and non-qualified stock options (NQSOs). Annual grants of RSUs (Annual RSUs) and PSUs (Annual PSUs) are available to key personnel and certain executive officers, and long-term incentive (LTIP) awards or options are available to certain officers, including named executive officers.
Annual Awards
The Company has elected to grant Annual RSUs and Annual PSUs to key employees, including certain executive officers of the Company. These grants entitle the recipients to receive shares of common stock of the Company upon vesting. The vesting of Annual PSUs is subject to achievement of certain performance criteria measured over the fiscal year during which they are granted, while Annual RSUs are subject only to time-based vesting restrictions. Annual PSUs vest in equal one-third installments annually over
three
years after the performance criteria are achieved, and Annual RSUs vest in equal annual installments over a
three
-year period following the date of grant. During the
year ended March 31, 2017
, the Company granted
83,971
Annual PSUs at a weighted-average grant date fair value of
$54.51
per share and
184,531
Annual RSUs at a weighted-average grant date fair value of
$61.54
per share. At
March 31, 2017
, the Company determined that the performance criteria for the fiscal year 2017 Annual PSUs was not met, and therefore, the awards were cancelled and the Company recorded a reversal of total stock compensation expense recorded in fiscal year 2017 of
$500
. As of
March 31, 2017
, future unrecognized stock compensation expense for Annual RSUs and Annual PSUs granted to date, excluding estimated forfeitures, was $
7,951
.
Long-Term Incentive Awards
2007 LTIP SARs and 2007 LTIP PSUs
In May 2007, the Company adopted LTIP awards under the 2006 Plan for issuance of SARs (2007 LTIP SARs) and PSUs (2007 LTIP PSUs), which were awarded to certain executive officers of the Company. These awards were subject to vesting based on certain performance criteria and service conditions. Half of the 2007 LTIP SARs and 2007 LTIP PSUs granted were fully vested as of December 31, 2011; the other
half
of the awards granted vested
80%
on December 31, 2015, with the remaining
20%
subject to vesting on December 31, 2016, provided certain performance criteria were achieved. As of December 31, 2016, it was determined that the Company had not achieved the performance
F-31
DECKERS OUTDOOR CORPORATION AND SUBSIDIARIES
NOTES TO CONSOLIDATED FINANCIAL STATEMENTS
March 31, 2017, 2016 and 2015
(amounts in thousands, except share data)
criteria and therefore the remaining awards did not vest and were cancelled. Accordingly, the Company recognized a net reversal of stock compensation expense of
$2,400
during fiscal year 2017.
2013 LTIP PSUs
In December 2013, the Company adopted LTIP awards (2013 LTIP PSUs) under the 2006 Plan. The shares under these awards were available for issuance to current and future members of the Company's management team, including the Company's named executive officers. Each recipient received a specified maximum number of 2013 LTIP PSUs, each of which represented the right to receive
one
share of the Company's common stock. The 2013 LTIP PSUs vested subject to certain performance criteria and service conditions over
three years
and would have vested on
March 31, 2016
.
At March 31, 2016
, the Company did not meet the minimum threshold performance criteria, and the awards did not vest and were cancelled.
2015 LTIP PSUs
In September 2014, the Company approved LTIP awards (2015 LTIP PSUs) under the 2006 Plan. The shares under these awards were available for issuance to current and future members of the Company's leadership team, including the Company's named executive officers. Each recipient received a specified maximum number of 2015 LTIP PSUs, each of which represented the right to receive
one
share of the Company's common stock. The 2015 LTIP PSUs vested subject to certain performance criteria and service conditions over
three
years and would have vested on
March 31, 2017
. Vesting would not have occurred if the minimum threshold performance criteria were not met for the
year ended March 31, 2017
. To the extent financial performance was achieved above the minimum threshold performance criteria, the number of 2015 LTIP PSUs that vested would increase up to the maximum number of units granted under the award. Under this award program, the Company granted awards that contained a maximum amount of approximately
160,000
2015 LTIP PSUs during the
year ended March 31, 2015
. The weighted-average grant date fair value of the 2015 LTIP PSUs was
$98.29
per share.
At March 31, 2016
, the Company did not believe the achievement of at least the minimum threshold performance criteria was probable, and accordingly, the Company recognized a net reversal of stock compensation expense of approximately $
1,400
.
At March 31, 2017
, the Company did not meet the minimum threshold performance criteria and the awards did not vest and were cancelled.
2016 LTIP PSUs
In November 2015, the Company approved LTIP awards (2016 LTIP PSUs) under the 2015 SIP. The shares under these awards were available for issuance to current and future members of the Company's leadership team, including the Company's named executive officers. Each recipient received a specified maximum number of 2016 LTIP PSUs, each of which represented the right to receive
one
share of the Company's common stock. The 2016 LTIP PSUs vest subject to certain performance and market criteria and service conditions over
three
years and would vest on March 31, 2018. To the extent financial performance is achieved above the minimum threshold performance criteria, the number of 2016 LTIP PSUs that will vest will increase up to a maximum of
200%
of the targeted amount for that award. No vesting of any portion of the 2016 LTIP PSUs will occur if the Company fails to achieve at least
90%
of the minimum threshold performance criteria. If the Company achieves the performance criteria, vesting of the 2016 LTIP PSUs will be subject to adjustment based on the application of a total stockholder return (TSR) modifier. The amount of the adjustment will be determined based on a comparison of the Company's TSR relative to the TSR of a pre-determined set of peer group companies for the
36
-month performance period commencing on April 1, 2015 and ending on March 31, 2018. A Monte-Carlo simulation model, which is a generally accepted statistical technique, was used to determine the grant date fair value by simulating a range of possible future stock prices for the Company and each member of the peer group over the TSR
36
-month performance period. Under this award program, the Company granted awards that contained a maximum amount of approximately
308,000
2016 LTIP PSUs during the
year ended March 31, 2016
. The weighted-average grant date fair value of the 2016 LTIP PSUs was
$50.05
per share. The Company does not believe the achievement of at least the minimum threshold performance criteria is probable, and accordingly, did not recognize stock compensation expense for these awards during the
years ended March 31, 2017
and
2016
. If the performance criteria are deemed probable in fiscal year 2018, the Company will recognize a cumulative catch-up adjustment to stock compensation expense.
At March 31, 2017
, the cumulative catch-up adjustment to stock
F-32
DECKERS OUTDOOR CORPORATION AND SUBSIDIARIES
NOTES TO CONSOLIDATED FINANCIAL STATEMENTS
March 31, 2017, 2016 and 2015
(amounts in thousands, except share data)
compensation expense would be approximately
$9,813
, assuming the maximum amount of 2016 LTIP PSUs vest because the performance criteria are deemed probable.
2017 LTIP NQSOs
In November 2016, the Company adopted and approved the grant of NQSOs (2017 LTIP NQSOs) under the Company's 2015 SIP. These options were issued to the Company’s executive officers. Each option grants the recipient the right to purchase a specified number of shares of the Company's common stock at a fixed exercise price per share. The options will vest on March 31, 2019, if the recipient provides continuous service through that date and the Company achieves the minimum threshold performance criteria. The Company measures stock compensation expense for the 2017 LTIP NQSOs at the date of grant using the Black-Scholes option pricing model. This model estimates the fair value of the options based on a number of assumptions, such as expected option life, interest rates, the current fair market value and expected volatility, as well as dividend yield of the Company’s common stock. The fair value of 2017 LTIP NQSOs granted during the
year ended March 31, 2017
was
$5,456
, and
$694
was expensed during the
year ended March 31, 2017
. As of
March 31, 2017
, future unrecognized stock compensation expense for the 2017 LTIP NQSOs granted to date, excluding estimated forfeitures, was $
4,344
.
The following table presents the weighted-average valuation assumptions used for the recognition of stock compensation expense for the 2017 LTIP NQSOs granted during the
year ended March 31, 2017
:
|
Expected life (in years)
|
5.94
|
|
|||
|
Expected volatility
|
41.8
|
%
|
|||
|
Risk free interest rate
|
1.95
|
%
|
|||
|
Dividend yield
|
—
|
%
|
|||
|
Weighted-average exercise price
|
$
|
61.86
|
|
||
|
Weighted-average option value
|
$
|
26.27
|
|
||
Grants to Directors
On a quarterly basis, the Company grants shares of its common stock to each of its outside directors. The fair value of such shares, which is determined based on the closing price at the date of issuance, is expensed on the date of issuance.
Stock Repurchase Programs
In June 2012, the Company approved a stock repurchase program to repurchase up to
$200,000
of the Company's common stock in the open market or in privately-negotiated transactions, subject to market conditions, applicable legal requirements, and other factors. The program did not obligate the Company to acquire any particular amount of common stock and the program may have been suspended at any time at the Company's discretion. At February 28, 2015, the Company had repurchased the full
$200,000
amount authorized under the program through the repurchase of approximately
3,823,000
shares at an average price of
$52.31
per share.
In January 2015, the Company approved a new stock repurchase program to repurchase up to
$200,000
of the Company's common stock, which included the same stipulations as the purchase program approved in June 2012, as described above. During fiscal years 2017, 2016 and 2015, the Company repurchased approximately
222,000
,
1,420,000
and
1,436,000
, respectively, of its common stock. In fiscal years 2017, 2016 and 2015, the cost of these repurchases was approximately
$12,572
,
$94,200
, and
$107,200
, respectively, at an average price per share of
$56.51
,
$66.32
, and
$74.68
, respectively. Under the new program, during the
year ended March 31, 2015
, the Company repurchased approximately
377,000
shares, out of the total
1,436,000
shares repurchased under both programs in fiscal year 2015, for approximately
$27,900
, or an average price of
$74.09
per share.
F-33
DECKERS OUTDOOR CORPORATION AND SUBSIDIARIES
NOTES TO CONSOLIDATED FINANCIAL STATEMENTS
March 31, 2017, 2016 and 2015
(amounts in thousands, except share data)
Since inception through
March 31, 2017
, the Company had repurchased a total of approximately
2,020,000
shares under this program for approximately
$134,706
, or an average price of
$66.69
per share, leaving the remaining approved amount at approximately
$65,294
.
The following is a reconciliation of the Company's retained earnings for repurchases of its common stock during the
year ended March 31, 2017
:
|
Retained Earnings
|
|||
|
Balance at March 31, 2016
|
$
|
826,449
|
|
|
Net income
|
5,710
|
|
|
|
Repurchases of common stock
|
(12,570
|
)
|
|
|
Balance at March 31, 2017
|
$
|
819,589
|
|
The remaining amount of approximately
222,000
shares of the purchase price of
$12,572
was recorded in common stock during the
year ended March 31, 2017
.
Stock Compensation Expense
The table below summarizes stock compensation expense by award or option type recognized in the consolidated statements of comprehensive income (loss):
|
Years Ended March 31,
|
|||||||||||
|
2017
|
2016
|
2015
|
|||||||||
|
Stock compensation expense recorded for:
|
|||||||||||
|
Annual RSUs
|
$
|
5,191
|
|
$
|
2,356
|
|
$
|
1,603
|
|
||
|
Annual PSUs
|
1,203
|
|
3,807
|
|
7,692
|
|
|||||
|
2007 LTIP SARs
|
(1,949
|
)
|
893
|
|
1,846
|
|
|||||
|
LTIP PSUs*
|
(296
|
)
|
(1,511
|
)
|
1,323
|
|
|||||
|
2017 LTIP NQSOs
|
694
|
|
—
|
|
—
|
|
|||||
|
Directors' shares
|
1,168
|
|
1,077
|
|
1,060
|
|
|||||
|
Employee Stock Purchase Plan**
|
164
|
|
—
|
|
—
|
|
|||||
|
Total stock compensation expense
|
6,175
|
|
6,622
|
|
13,524
|
|
|||||
|
Income tax benefit recognized
|
(2,322
|
)
|
(2,525
|
)
|
(5,143
|
)
|
|||||
|
Net stock compensation expense
|
$
|
3,853
|
|
$
|
4,097
|
|
$
|
8,381
|
|
||
*2007 LTIP PSUs, 2013 LTIP PSUs, 2015 LTIP PSUs, and 2016 LTIP PSUs are collectively referred to herein as “LTIP PSUs”.
**The 2015 Employee Stock Purchase Plan (2015 ESPP) provides for the initial authorization of
1,000,000
shares of the Company’s common stock for sale to eligible employees. Eligible employees commenced participation in the 2015 ESPP in March 2016 with payroll deductions. Each consecutive purchase period is
six
months in duration and shares are purchased on the last trading day of the purchase period at a price that reflects a
15%
discount to the closing price on that date. Purchase windows take place in February and August of each fiscal year.
F-34
DECKERS OUTDOOR CORPORATION AND SUBSIDIARIES
NOTES TO CONSOLIDATED FINANCIAL STATEMENTS
March 31, 2017, 2016 and 2015
(amounts in thousands, except share data)
The table below summarizes the total remaining unrecognized stock compensation expense related to nonvested awards that the Company considers are probable to vest and the weighted-average period over which the cost is expected to be recognized
as of March 31, 2017
:
|
Unrecognized
Stock Compensation
Expense
|
Weighted-Average
Remaining
Vesting Period (Years)
|
||||
|
Annual RSUs
|
$
|
7,497
|
|
1.4
|
|
|
Annual PSUs
|
454
|
|
1.0
|
||
|
2007 LTIP SARs
|
—
|
|
—
|
||
|
LTIP PSUs
|
—
|
|
—
|
||
|
2017 LTIP NQSOs
|
4,344
|
|
2.0
|
||
|
Total
|
$
|
12,295
|
|
||
The amount of unrecognized stock compensation expense
as of March 31, 2017
excludes a maximum of
$13,510
of stock compensation expense on the 2016 LTIP PSUs, as achievement of the performance criteria are not deemed probable.
Annual RSUs and Annual PSUs Issued under the 2006 Plan and 2015 SIP
The table below summarizes Annual RSU and Annual PSU activity:
|
Number of
Shares
|
Weighted-
Average
Grant-Date
Fair Value
|
|||||
|
Nonvested at March 31, 2014
|
331,000
|
|
$
|
62.21
|
|
|
|
Granted
|
196,000
|
|
82.34
|
|
||
|
Vested
|
(142,000
|
)
|
68.39
|
|
||
|
Forfeited
|
(30,000
|
)
|
64.18
|
|
||
|
Cancelled*
|
(15,000
|
)
|
84.04
|
|
||
|
Nonvested at March 31, 2015
|
340,000
|
|
70.11
|
|
||
|
Granted
|
240,000
|
|
70.82
|
|
||
|
Vested
|
(132,000
|
)
|
66.74
|
|
||
|
Forfeited
|
(91,000
|
)
|
72.84
|
|
||
|
Cancelled*
|
(154,000
|
)
|
74.22
|
|
||
|
Nonvested at March 31, 2016
|
203,000
|
|
68.80
|
|
||
|
Granted
|
268,000
|
|
59.34
|
|
||
|
Vested
|
(111,000
|
)
|
65.37
|
|
||
|
Forfeited
|
(66,000
|
)
|
70.79
|
|
||
|
Cancelled*
|
(68,000
|
)
|
65.23
|
|
||
|
Nonvested at March 31, 2017
|
226,000
|
|
$
|
63.96
|
|
|
*Shares cancelled during the period represent Annual PSUs granted that did not meet the required performance criteria.
F-35
DECKERS OUTDOOR CORPORATION AND SUBSIDIARIES
NOTES TO CONSOLIDATED FINANCIAL STATEMENTS
March 31, 2017, 2016 and 2015
(amounts in thousands, except share data)
2007 LTIP SARs Issued Under the 2006 Plan
No
SARs have been issued under the 2015 SIP. The table below summarizes 2007 LTIP SARs activity:
|
Number of
2007 LTIP SARs
|
Weighted-
Average
Exercise
Price
|
Weighted-
Average
Remaining
Contractual
Term
(Years)
|
Aggregate
Intrinsic
Value
|
|||||||||
|
Outstanding at March 31, 2014
|
730,000
|
|
$
|
26.73
|
|
6.7
|
$
|
38,700
|
|
|||
|
Exercised
|
(15,000
|
)
|
26.73
|
|
||||||||
|
Outstanding at March 31, 2015
|
715,000
|
|
26.73
|
|
5.8
|
33,000
|
|
|||||
|
Exercised
|
(80,000
|
)
|
26.73
|
|
||||||||
|
Forfeited
|
(15,000
|
)
|
26.73
|
|
||||||||
|
Outstanding at March 31, 2016
|
620,000
|
|
26.73
|
|
3.5
|
20,600
|
|
|||||
|
Exercised
|
(290,000
|
)
|
26.73
|
|
||||||||
|
Forfeited
|
(90,000
|
)
|
26.73
|
|
||||||||
|
Outstanding at March 31, 2017
|
240,000
|
|
$
|
26.73
|
|
5.1
|
$
|
7,920
|
|
|||
|
Exercisable at March 31, 2017
|
240,000
|
|
$
|
26.73
|
|
5.1
|
$
|
7,920
|
|
|||
The maximum contractual term is
10
and
15
years from the grant date for those 2007 LTIP SARs with final vesting dates of December 31, 2011 and December 31, 2015, respectively.
LTIP PSUs Issued Under the 2006 Plan and the 2015 SIP
The table below summarizes the LTIP PSU activity:
|
Number of
Shares
|
Weighted-
Average
Grant-Date
Fair Value
|
|||||
|
Nonvested at March 31, 2014
|
729,000
|
|
$
|
67.01
|
|
|
|
Granted
|
160,000
|
|
98.29
|
|
||
|
Forfeited
|
(35,000
|
)
|
78.39
|
|
||
|
Cancelled*
|
(230,000
|
)
|
82.09
|
|
||
|
Nonvested at March 31, 2015
|
624,000
|
|
68.82
|
|
||
|
Granted
|
308,000
|
|
50.05
|
|
||
|
Vested
|
(47,000
|
)
|
26.73
|
|
||
|
Forfeited
|
(232,000
|
)
|
70.98
|
|
||
|
Cancelled*
|
(264,000
|
)
|
63.22
|
|
||
|
Nonvested at March 31, 2016
|
389,000
|
|
61.53
|
|
||
|
Granted
|
7,000
|
|
56.56
|
|
||
|
Forfeited
|
(27,000
|
)
|
68.63
|
|
||
|
Cancelled*
|
(100,000
|
)
|
89.77
|
|
||
|
Nonvested at March 31, 2017
|
269,000
|
|
$
|
50.22
|
|
|
*Shares cancelled represent LTIP PSUs granted that did not meet the required performance criteria.
F-36
DECKERS OUTDOOR CORPORATION AND SUBSIDIARIES
NOTES TO CONSOLIDATED FINANCIAL STATEMENTS
March 31, 2017, 2016 and 2015
(amounts in thousands, except share data)
2017
LTIP NQSOs Issued Under the 2015 SIP
The table below summarizes the 2017 LTIP NQSO:
|
Number of
Shares
|
Weighted-
Average
Grant-Date
Fair Value
|
Weighted-
Average
Remaining
Contractual
Term
(Years)
|
Aggregate
Intrinsic
Value
|
||||||||||
|
Outstanding at March 31, 2016
|
—
|
|
$
|
—
|
|
—
|
|
$
|
—
|
|
|||
|
Granted
|
208,000
|
|
61.86
|
|
|||||||||
|
Forfeited
|
(16,000
|
)
|
61.86
|
|
|||||||||
|
Outstanding at March 31, 2017
|
192,000
|
|
$
|
61.86
|
|
9.0
|
$
|
—
|
|
||||
|
Exercisable at March 31, 2017
|
—
|
|
$
|
—
|
|
—
|
|
$
|
—
|
|
|||
The amounts granted are the maximum amounts under the respective options.
As of March 31, 2017
, the Company had Designated Derivative Contracts with notional amounts totaling approximately
$100,000
, and the fair value of approximately
$1,365
was recorded in other current assets in the consolidated balance sheets. The Company did not have any Non-Designated Derivative Contracts. The Designated Derivative Contracts are collectively held by a total of
four
counterparties and will mature at various dates over the next
12
months.
As of March 31, 2016
, the Company had Designated Derivative Contracts with notional amounts totaling approximately
$105,000
, held by
seven
counterparties. During the
year ended March 31, 2017
, the Company settled Designated Derivative Contracts with notional amounts totaling approximately
$11,000
and approximately
$105,000
that were entered into during fiscal years 2017 and 2016, respectively. During the
year ended March 31, 2016
, the Company settled Designated Derivative Contracts with notional amounts totaling approximately
$32,000
and approximately
$46,000
that were entered into in fiscal years 2016 and 2015, respectively. During the
years ended March 31, 2017
and 2016, the Company also entered into, and settled, Non-Designated Derivative Contracts with total notional amounts of approximately
$263,000
and
$261,000
, respectively.
The non-performance risk of the Company and the counterparties did not have a material impact on the fair value of the derivative instruments. During the
year ended March 31, 2017
, the designated hedges remained effective. The effective portion of the gain or loss on the derivative instrument is recognized in OCI and reclassified into earnings in the same period or periods during which the hedged transaction affects earnings.
As of March 31, 2017
, the amount of unrealized gains on foreign currency exchange rate hedges recognized in accumulated OCI (see Note 10, "Accumulated Other Comprehensive Loss") is expected to be reclassified into income within the next
12
months.
F-37
DECKERS OUTDOOR CORPORATION AND SUBSIDIARIES
NOTES TO CONSOLIDATED FINANCIAL STATEMENTS
March 31, 2017, 2016 and 2015
(amounts in thousands, except share data)
The following table summarizes the effect of Designated Derivative Contracts:
|
Years Ended March 31,
|
|||||
|
2017
|
2016
|
2015
|
|||
|
Amount of gain (loss) recognized in other comprehensive income (loss) on derivative instruments (effective portion)
|
$8,208
|
$(850)
|
$1,556
|
||
|
Location of amount reclassified from accumulated other comprehensive income (loss) into income (effective portion)
|
Net Sales
|
Net Sales
|
Net Sales
|
||
|
Amount of gain (loss) reclassified from accumulated other comprehensive income (loss) into income (effective portion)
|
$7,082
|
$(1,592)
|
$1,226
|
||
|
Location of amount excluded from effectiveness testing
|
Selling, general and administrative expenses
|
Selling, general and administrative expenses
|
Selling, general and administrative expenses
|
||
|
Amount of gain (loss) excluded from effectiveness testing
|
$534
|
$207
|
$(69)
|
||
The following table summarizes the effect of Non-Designated Derivative Contracts:
|
Years Ended March 31,
|
|||||
|
2017
|
2016
|
2015
|
|||
|
Location of amount recognized in income on derivative instruments
|
Selling, general and administrative expenses
|
Selling, general and administrative expenses
|
Selling, general and administrative expenses
|
||
|
Amount of gain (loss) recognized in income on derivative instruments
|
$2,202
|
$(1,532)
|
$6,383
|
||
Subsequent to
March 31, 2017
, the Company entered into Non-Designated Derivative Contracts with notional amounts totaling approximately
$34,000
, which are expected to mature over the next
9
months, and Designated Derivative Contracts with notional amounts totaling approximately
$21,000
, which are expected to mature over the next
12
months. All hedging contracts held at
May 30, 2017
were held by a total of
four
counterparties.
Accumulated balances of the components within accumulated other comprehensive loss are as follows:
|
As of March 31,
|
|||||||
|
|
2017
|
2016
|
|||||
|
Unrealized gain on foreign currency exchange rate hedges, net of tax
|
$
|
856
|
|
$
|
152
|
|
|
|
Cumulative foreign currency translation adjustment
|
(27,307
|
)
|
(20,709
|
)
|
|||
|
Accumulated other comprehensive loss
|
$
|
(26,451
|
)
|
$
|
(20,557
|
)
|
|
F-38
DECKERS OUTDOOR CORPORATION AND SUBSIDIARIES
NOTES TO CONSOLIDATED FINANCIAL STATEMENTS
March 31, 2017, 2016 and 2015
(amounts in thousands, except share data)
The reconciliation of basic to diluted weighted-average common shares outstanding is as follows:
|
|
Years Ended March 31,
|
|||||||
|
|
2017
|
2016
|
2015
|
|||||
|
Weighted-average shares used in basic computation
|
32,000,000
|
|
32,556,000
|
|
34,433,000
|
|
||
|
Dilutive effect of stock-based awards and options
|
355,000
|
|
483,000
|
|
300,000
|
|
||
|
Weighted-average shares used for diluted computation
|
32,355,000
|
|
33,039,000
|
|
34,733,000
|
|
||
|
Excluded*:
|
||||||||
|
Annual RSUs and Annual PSUs
|
17,000
|
|
—
|
|
—
|
|
||
|
2007 LTIP SARs
|
—
|
|
90,000
|
|
525,000
|
|
||
|
LTIP PSUs
|
269,000
|
|
389,000
|
|
624,000
|
|
||
|
2017 LTIP NQSOs
|
192,000
|
|
—
|
|
—
|
|
||
*The stock-based awards and options excluded from the dilutive effect were excluded either because the shares were anti-dilutive or because the necessary conditions had not been satisfied for the shares to be issuable based on the Company's performance for the years ended March 31, 2017, 2016 and 2015. The number of shares reflected for each of these excluded awards is the maximum number of shares issuable pursuant to these awards. Refer to Note 8, "Stockholder's Equity", for more information on the nature of these awards.
The Company has
five
reportable operating segments consisting of the strategic business units for the worldwide wholesale operations of the UGG brand, Teva brand, Sanuk brand, other brands, and DTC. The Company's other brands currently consist of the Hoka, Koolaburra and Ahnu brands, and included the TSUBO and MOZO brands for the years ended March 31, 2016 and 2015.
The Company's accounting policies for each reportable operating segment are the same as those described in Note 1, "The Company and Summary of Significant Accounting Policies", except that the Company does not allocate corporate overhead costs or non-operating income and expenses to reportable operating segments. The Company evaluates reportable operating segment performance primarily based on net sales and income (loss) from operations.
The wholesale operations of each brand are managed separately because each requires different marketing, research and development, design, sourcing, and sales strategies. The income (loss) from operations for each of the reportable operating segments includes only those costs which are specifically related to each reportable operating segment, which consist primarily of cost of sales, costs for research and development, design, sales and marketing, depreciation, amortization, and the costs of employees and their respective expenses that are directly related to each reportable operating segment. The unallocated corporate overhead costs include: costs of the distribution centers, certain executive and stock-based compensation, accounting and finance, legal, information technology, human resources, and facilities costs, among others.
During the first quarter of fiscal year 2016, the Company changed its reportable operating segments to combine the previously-separated E-Commerce and retail store operating components into
one
DTC reportable operating segment. For the year ended March 31, 2015, certain reclassifications were made to conform to the current period presentation. These changes in reportable operating segments only changed the presentation within the below table and did not impact the Company's consolidated financial statements for any period presented. The reportable operating segment information reported in prior periods has been adjusted retrospectively to conform to the current period presentation.
F-39
DECKERS OUTDOOR CORPORATION AND SUBSIDIARIES
NOTES TO CONSOLIDATED FINANCIAL STATEMENTS
March 31, 2017, 2016 and 2015
(amounts in thousands, except share data)
Reportable operating segment information for the statements of comprehensive income (loss) is summarized as follows:
|
Years Ended March 31,
|
|||||||||||
|
2017
|
2016
|
2015
|
|||||||||
|
Net sales to external customers:
|
|||||||||||
|
UGG brand wholesale
|
$
|
826,355
|
|
$
|
918,102
|
|
$
|
903,926
|
|
||
|
Teva brand wholesale
|
103,694
|
|
121,239
|
|
116,931
|
|
|||||
|
Sanuk brand wholesale
|
77,552
|
|
90,719
|
|
102,690
|
|
|||||
|
Other brands wholesale
|
116,206
|
|
100,820
|
|
76,152
|
|
|||||
|
Direct-to-Consumer
|
666,340
|
|
644,317
|
|
617,358
|
|
|||||
|
$
|
1,790,147
|
|
$
|
1,875,197
|
|
$
|
1,817,057
|
|
|||
|
(Loss) income from operations:
|
|||||||||||
|
UGG brand wholesale
|
$
|
213,407
|
|
$
|
246,990
|
|
$
|
269,489
|
|
||
|
Teva brand wholesale
|
10,045
|
|
17,692
|
|
13,320
|
|
|||||
|
Sanuk brand wholesale
|
(110,582
|
)
|
15,565
|
|
21,914
|
|
|||||
|
Other brands wholesale
|
1,571
|
|
(4,384
|
)
|
(9,838
|
)
|
|||||
|
Direct-to-Consumer
|
109,802
|
|
101,756
|
|
150,320
|
|
|||||
|
Unallocated overhead costs
|
(226,162
|
)
|
(215,492
|
)
|
(220,786
|
)
|
|||||
|
$
|
(1,919
|
)
|
$
|
162,127
|
|
$
|
224,419
|
|
|||
|
Depreciation, amortization and accretion:
|
|||||||||||
|
UGG brand wholesale
|
$
|
3,167
|
|
$
|
2,254
|
|
$
|
5,029
|
|
||
|
Teva brand wholesale
|
24
|
|
54
|
|
94
|
|
|||||
|
Sanuk brand wholesale
|
5,018
|
|
6,556
|
|
6,969
|
|
|||||
|
Other brands wholesale
|
971
|
|
1,101
|
|
931
|
|
|||||
|
Direct-to-Consumer
|
15,669
|
|
19,030
|
|
21,165
|
|
|||||
|
Unallocated overhead costs
|
27,779
|
|
21,029
|
|
15,105
|
|
|||||
|
$
|
52,628
|
|
$
|
50,024
|
|
$
|
49,293
|
|
|||
|
Capital expenditures:
|
|||||||||||
|
UGG brand wholesale
|
$
|
3,444
|
|
$
|
1,458
|
|
$
|
246
|
|
||
|
Teva brand wholesale
|
—
|
|
—
|
|
51
|
|
|||||
|
Sanuk brand wholesale
|
—
|
|
881
|
|
487
|
|
|||||
|
Other brands wholesale
|
191
|
|
51
|
|
351
|
|
|||||
|
Direct-to-Consumer
|
15,277
|
|
18,445
|
|
19,128
|
|
|||||
|
Unallocated overhead costs
|
25,587
|
|
45,351
|
|
71,590
|
|
|||||
|
$
|
44,499
|
|
$
|
66,186
|
|
$
|
91,853
|
|
|||
F-40
DECKERS OUTDOOR CORPORATION AND SUBSIDIARIES
NOTES TO CONSOLIDATED FINANCIAL STATEMENTS
March 31, 2017, 2016 and 2015
(amounts in thousands, except share data)
Inter-segment sales from the Company’s wholesale reportable operating segments to the DTC reportable operating segment are at the Company’s cost, and there is
no
inter-segment profit on these inter-segment sales. (Loss) income from operations of the wholesale reportable operating segments does not include any inter-segment gross profit from sales to the DTC reportable operating segment.
Reportable operating segment information for the consolidated balance sheets is as follows:
|
As of March 31,
|
|||||||
|
2017
|
2016
|
||||||
|
Total assets from reportable operating segments:
|
|||||||
|
UGG brand wholesale
|
$
|
259,444
|
|
$
|
248,937
|
|
|
|
Teva brand wholesale
|
82,505
|
|
87,225
|
|
|||
|
Sanuk brand wholesale
|
80,102
|
|
212,816
|
|
|||
|
Other brands wholesale
|
70,607
|
|
65,072
|
|
|||
|
Direct-to-Consumer
|
113,400
|
|
148,733
|
|
|||
|
$
|
606,058
|
|
$
|
762,783
|
|
||
The assets allocable to each reportable operating segment include accounts receivable, inventory, fixed assets, goodwill, other intangible assets, and certain other assets that are specifically identifiable with one of the Company's reportable operating segments. Unallocated assets are the assets not specifically related to the reportable operating segments and generally include cash and cash equivalents, deferred tax assets, and various other corporate assets shared by the Company's reportable operating segments.
Reconciliations of total assets from reportable operating segments to the consolidated balance sheets are as follows:
|
As of March 31,
|
|||||||
|
2017
|
2016
|
||||||
|
Total assets from reportable operating segments
|
$
|
606,058
|
|
$
|
762,783
|
|
|
|
Unallocated cash and cash equivalents
|
291,764
|
|
245,956
|
|
|||
|
Unallocated deferred tax assets
|
44,708
|
|
20,636
|
|
|||
|
Other unallocated corporate assets
|
249,250
|
|
248,693
|
|
|||
|
Consolidated total assets
|
$
|
1,191,780
|
|
$
|
1,278,068
|
|
|
The Company does not consider international operations a separate reportable operating segment, as management reviews such operations in the aggregate with the aforementioned reportable operating segments. Long-lived assets, which consist of property and equipment, net, in the US and all other countries combined were as follows:
|
As of March 31,
|
|||||||
|
|
2017
|
2016
|
|||||
|
US
|
$
|
206,077
|
|
$
|
211,111
|
|
|
|
All other countries*
|
19,454
|
|
26,135
|
|
|||
|
Total
|
$
|
225,531
|
|
$
|
237,246
|
|
|
*No other country's long-lived assets comprised more than
10%
of the Company's total long-lived assets
as of March 31, 2017
and
2016
.
F-41
DECKERS OUTDOOR CORPORATION AND SUBSIDIARIES
NOTES TO CONSOLIDATED FINANCIAL STATEMENTS
March 31, 2017, 2016 and 2015
(amounts in thousands, except share data)
The Company sells its products to customers throughout the US and to foreign customers located in Europe, Asia, Canada, Australia, and Latin America, among other regions. Approximately
$539,000
or
30.1%
,
$526,000
or
28.1%
, and
$519,000
or
28.6%
of total net sales were denominated in foreign currencies for the
years ended March 31, 2017
, 2016 and 2015, respectively. International sales were
36.2%
,
35.0%
, and
35.9%
, of the Company's total net sales for the
years ended March 31, 2017
, 2016 and 2015, respectively. For the
years ended March 31, 2017
, 2016 and 2015, no single foreign country comprised more than
10%
of the Company's total sales.
Management performs regular evaluations concerning the ability of its customers to satisfy their obligations and records a provision for doubtful accounts based upon these evaluations. The Company's
five
largest customers accounted for approximately
20.3%
of worldwide net sales for the
year ended March 31, 2017
compared to
21.9%
for the
year ended March 31, 2016
. No single customer accounted for more than
10%
of the Company's net sales in the
years ended March 31, 2017
, 2016 and 2015.
At March 31, 2017
and
2016
, the Company had
one
customer representing
11.2%
and
12.8%
of trade accounts receivable, net, respectively.
The Company's production is concentrated at a limited number of independent manufacturing factories in Asia. Sheepskin is the principal raw material for certain UGG products and the majority of sheepskin is purchased from
two
tanneries in China and is sourced primarily from Australia and the UK. Beginning in 2013, in an effort to partially reduce its dependency on sheepskin, the Company began using a proprietary raw material, UGGpure™, which is a wool woven into a durable backing, in some of its UGG brand products. The Company currently purchases UGGpure from
two
suppliers. The other production materials used by the Company are sourced primarily in Asia. The Company's operations are subject to the customary risks of doing business abroad, including, but not limited to, foreign currency exchange rate fluctuations, customs duties and related fees, various import controls and other nontariff barriers, restrictions on the transfer of funds, labor unrest and strikes and, in certain parts of the world, political instability. The supply of sheepskin can be adversely impacted by weather conditions, disease, and harvesting decisions that are completely outside the Company's control. Furthermore, the price of sheepskin is impacted by demand, industry, and competitors.
A portion of the Company's cash and cash equivalents is held as cash in operating accounts with third-party financial institutions. These balances, at times, exceed the Federal Deposit Insurance Corporation insurance limits. While the Company regularly monitors the cash balances in its operating accounts and adjusts the balances as appropriate, these cash balances could be impacted if the underlying financial institutions fail or are subject to other adverse conditions in the financial markets.
The remainder of the Company's cash equivalents is invested in interest-bearing funds managed by third-party investment management institutions. These investments can include US treasury bonds and securities, money market funds, and municipal bonds, among other investments. Certain of these investments are subject to general credit, liquidity, market, and interest rate risks. As of
March 31, 2017
, the Company had experienced no loss or lack of access to cash in its operating accounts or invested cash and cash equivalents.
The Company's cash and cash equivalents are as follows:
|
As of March 31,
|
|||||||
|
2017
|
2016
|
||||||
|
Money market fund accounts
|
$
|
198,992
|
|
$
|
195,575
|
|
|
|
Cash
|
92,772
|
|
50,381
|
|
|||
|
Total cash and cash equivalents
|
$
|
291,764
|
|
$
|
245,956
|
|
|
F-42
The Company's business is seasonal, with the highest percentage of UGG brand net sales occurring in the quarters ending September 30th and December 31st and the highest percentage of Teva and Sanuk brand net sales occurring in the quarters ending March 31st and June 30th of each year. Net sales of other brands do not have significant seasonal impact on the Company. Due to the size of the UGG brand relative to the Company's other brands, the Company's aggregate net sales in the quarters ending September 30th and December 31st have significantly exceeded net sales in the quarters ending March 31st and June 30th.
Summarized unaudited quarterly financial data are as follows:
|
Fiscal Year 2017
|
|||||||||||||||
|
Quarter Ended
|
|||||||||||||||
|
6/30/2016
|
9/30/2016
|
12/31/2016
|
3/31/2017
|
||||||||||||
|
Net sales
|
$
|
174,393
|
|
$
|
485,944
|
|
$
|
760,345
|
|
$
|
369,465
|
|
|||
|
Gross profit
|
76,252
|
|
216,425
|
|
383,634
|
|
158,924
|
|
|||||||
|
(Loss) income from operations
|
(78,319
|
)
|
54,023
|
|
53,250
|
|
(30,873
|
)
|
|||||||
|
Net (loss) income*
|
(58,918
|
)
|
39,305
|
|
41,027
|
|
(15,704
|
)
|
|||||||
|
Net (loss) income per share:
|
|||||||||||||||
|
Basic
|
$
|
(1.84
|
)
|
$
|
1.23
|
|
$
|
1.28
|
|
$
|
(0.49
|
)
|
|||
|
Diluted
|
$
|
(1.84
|
)
|
$
|
1.21
|
|
$
|
1.27
|
|
$
|
(0.49
|
)
|
|||
|
Fiscal Year 2016
|
|||||||||||||||
|
Quarter Ended
|
|||||||||||||||
|
6/30/2015
|
9/30/2015
|
12/31/2015
|
3/31/2016
|
||||||||||||
|
Net sales
|
$
|
213,805
|
|
$
|
486,855
|
|
$
|
795,902
|
|
$
|
378,635
|
|
|||
|
Gross profit
|
86,596
|
|
214,113
|
|
391,017
|
|
154,942
|
|
|||||||
|
(Loss) income from operations
|
(63,708
|
)
|
51,213
|
|
202,500
|
|
(27,878
|
)
|
|||||||
|
Net (loss) income*
|
(47,327
|
)
|
36,377
|
|
156,921
|
|
(23,706
|
)
|
|||||||
|
Net (loss) income per share:
|
|||||||||||||||
|
Basic
|
$
|
(1.43
|
)
|
$
|
1.12
|
|
$
|
4.85
|
|
$
|
(0.73
|
)
|
|||
|
Diluted
|
$
|
(1.43
|
)
|
$
|
1.11
|
|
$
|
4.78
|
|
$
|
(0.73
|
)
|
|||
*Includes restructuring charges of approximately
$29,100
for the
year ended March 31, 2017
primarily incurred during the third and fourth quarter of fiscal year 2017, as well as
$24,800
for the year ended March 31, 2016, incurred during the fourth quarter of fiscal year 2016. In addition, includes non-cash impairment charges of approximately
$113,944
and
$4,086
for the Sanuk brand's wholesale reportable operating segment goodwill and patent during the third quarter of fiscal year 2017. Refer to Note 2, "Restructuring", for further information on the nature of restructuring charges incurred and Note 3, "Goodwill and Other Intangible Assets", for further information on the Sanuk brand non-cash impairment charges.
F-43
Schedule II
DECKERS OUTDOOR CORPORATION AND SUBSIDIARIES
TOTAL VALUATION AND QUALIFYING ACCOUNTS
The following is a summary of allowances for doubtful accounts, sales discounts, chargebacks and sales returns related to accounts receivable:
|
As of March 31,
|
|||||||||||
|
2017
|
2016
|
2015
|
|||||||||
|
Allowance for doubtful accounts (1)
|
|||||||||||
|
Balance at Beginning of Year
|
$
|
5,494
|
|
$
|
2,297
|
|
$
|
1,798
|
|
||
|
Additions
|
2,847
|
|
5,120
|
|
1,107
|
|
|||||
|
Deductions
|
(2,362
|
)
|
(1,923
|
)
|
(608
|
)
|
|||||
|
Balance at End of Year
|
$
|
5,979
|
|
$
|
5,494
|
|
$
|
2,297
|
|
||
|
Allowance for sales discounts (2)
|
|||||||||||
|
Balance at Beginning of Year
|
$
|
2,672
|
|
$
|
2,348
|
|
$
|
2,121
|
|
||
|
Additions
|
20,259
|
|
25,560
|
|
22,869
|
|
|||||
|
Deductions
|
(19,831
|
)
|
(25,236
|
)
|
(22,642
|
)
|
|||||
|
Balance at End of Year
|
$
|
3,100
|
|
$
|
2,672
|
|
$
|
2,348
|
|
||
|
Allowance for chargebacks (3)
|
|||||||||||
|
Balance at Beginning of Year
|
$
|
4,968
|
|
$
|
4,041
|
|
$
|
3,064
|
|
||
|
Additions
|
4,138
|
|
2,267
|
|
2,610
|
|
|||||
|
Deductions
|
(2,078
|
)
|
(1,340
|
)
|
(1,633
|
)
|
|||||
|
Balance at End of Year
|
$
|
7,028
|
|
$
|
4,968
|
|
$
|
4,041
|
|
||
|
Allowance for sales returns (4)
|
|||||||||||
|
Balance at Beginning of Year
|
$
|
17,061
|
|
$
|
9,532
|
|
$
|
8,586
|
|
||
|
Additions
|
62,122
|
|
42,392
|
|
31,253
|
|
|||||
|
Deductions
|
(62,936
|
)
|
(34,863
|
)
|
(30,307
|
)
|
|||||
|
Balance at End of Year
|
$
|
16,247
|
|
$
|
17,061
|
|
$
|
9,532
|
|
||
|
Total Allowances
|
$
|
32,354
|
|
$
|
30,195
|
|
$
|
18,218
|
|
||
|
(1)
|
The additions to the allowance for doubtful accounts represent estimates of the Company's bad debt expense based upon the factors on which the Company evaluates the collectability of its accounts receivable, with actual recoveries netted into additions. Deductions are for the actual write-off of the receivables.
|
|
(2)
|
The additions to the allowance for sales discounts represent estimates of discounts to be taken by the Company's customers based upon the amount of available outstanding terms discounts in the year-end aging. Deductions are for the actual discounts taken by the Company's wholesale customers. Discounts for DTC customers are taken at the point of sale and are not reflected in the allowance for sales discounts.
|
|
(3)
|
The additions to the allowance for chargebacks represent chargebacks taken in the respective year, as well as an estimate of chargebacks related to sales in the current reporting period that will be taken in the future. Deductions are for the actual chargebacks written off against outstanding accounts receivables.
|
|
(4)
|
The additions to the allowance for sales returns represent estimates of returns based upon the Company's historical wholesale customer returns experience. Deductions are for the actual return of products. Returns of product of DTC customers are taken at the point of sale and are not reflected in the allowance for sales returns.
|
See accompanying reports of independent registered public accounting firm.
F-44
TABLE OF CONTENTS
Part IItem 1. BusinessItem 1A. Risk FactorsItem 2. PropertiesItem 3. Legal ProceedingsPart IIItem 5. Market For Registrant's Common Equity, Related Stockholder Matters and Issuer Purchases Of Equity SecuritiesItem 6. Selected Financial DataItem 7. Management's Discussion and Analysis Of Financial Condition and Results Of OperationItem 7A. Quantitative and Qualitative Disclosures About Market RiskItem 8. Financial Statements and Supplementary DataItem 9A. Controls and ProceduresPart IIIItem 10. Directors, Executive Officers and Corporate GovernanceItem 11. Executive CompensationItem 12. Security Ownership Of Certain Beneficial Owners and Management and Related Stockholder MattersItem 13. Certain Relationships and Related Transactions, and Director IndependenceItem 14. Principal Accounting Fees and ServicesPart IVItem 15. Exhibits and Financial Statement ScheduleNote 1. The Company and Summary Of Significant Accounting PoliciesNote 2. RestructuringNote 3. Goodwill and Other Intangible AssetsNote 4. Fair Value MeasurementsNote 5. Income TaxesNote 6. Revolving Credit Facilities and Mortgage PayableNote 7. Commitments and ContingenciesNote 8. Stockholders' EquityNote 9. Foreign Currency Exchange Rate Contracts and HedgingNote 10. Accumulated Other Comprehensive LossNote 11. Net Income Per ShareNote 12. Reportable Operating SegmentsNote 13. Concentration Of Business, Significant Customers and Credit RiskNote 14. Quarterly Summary Of Information (unaudited)