DOUGLAS EMMETT INC
10-Ks and 10-Qs
|
|
|
|
|
|
|
|
|
|
|
|
|
|
|
|
|
|
|
|
|
|
|
|
|
|
|
|
|
|
|
|
|
|
|
|
|
|
|
|
|
|
|
|
|
|
|
|
|
|
UNITED STATES
SECURITIES AND EXCHANGE COMMISSION
WASHINGTON, D.C. 20549
FORM 10-K
|
ANNUAL REPORT PURSUANT TO SECTION 13 OR 15(d) OF THE SECURITIES EXCHANGE ACT OF 1934 FOR THE FISCAL YEAR ENDED DECEMBER 31, 2018
|
Commission file number: 1-33106
Douglas Emmett, Inc.
(Exact name of registrant as specified in its charter)
|
MARYLAND
|
(20-3073047)
|
|
(State or other jurisdiction of incorporation or organization)
|
(I.R.S. Employer Identification No.)
|
1299 Ocean Avenue, Suite 1000, Santa Monica, California 90401
(310) 255-7700
(Address, including Zip Code and Telephone Number, including Area Code, of Registrant’s principal executive offices)
Securities registered pursuant to Section 12(b) of the Act:
|
Title of Each Class
|
Name of Each Exchange on Which Registered
|
|
Common Stock, $0.01 par value per share
|
New York Stock Exchange
|
Securities registered pursuant to Section 12(g) of the Act: None
|
Indicate by check mark if the registrant is a well-known seasoned issuer, as defined in Rule 405 of the Securities Act.
|
Yes
þ
or No
1
|
|
|
|
|
Indicate by check mark if the registrant is not required to file reports pursuant to Section 13 or Section 15 (d) of the Act.
|
Yes
1
or No
þ
|
|
|
|
|
Indicate by check mark whether the registrant: (1) has filed all reports required to be filed by Section 13 or 15(d) of the Securities Exchange Act of 1934 during the preceding 12 months (or for such shorter period that the registrant was required to file such reports), and (2) has been subject to such filing requirements for the past 90 days.
|
Yes
þ
or No
1
|
|
Indicate by check mark whether the registrant has submitted electronically every Interactive Data File required to be submitted pursuant to Rule 405 of Regulation S-T (§232.405 of this chapter) during the preceding 12 months (or for such shorter period that the registrant was required to submit and post such files).
|
Yes
þ
or No
1
|
|
Indicate by check mark if disclosure of delinquent filers pursuant to Item 405 of Regulation S-K is not contained herein, and will not be contained, to the best of registrant’s knowledge, in definitive proxy or information statements incorporated by reference in Part III of this Form 10-K or any amendment to this Form 10-K.
|
þ
|
|
Indicate by check mark whether the registrant is a large accelerated filer, an accelerated filer, a non-accelerated filer, a smaller reporting company or an emerging growth company. See definitions of “large accelerated filer,” “accelerated filer,” “smaller reporting company,” and "emerging growth company" in Rule 12b-2 of the Exchange Act. (Check one):
|
|
|
Large accelerated filer
þ
Accelerated filer
1
Non accelerated filer
1
Smaller reporting company
1
Emerging growth company
1
|
|
|
If an emerging growth company, indicate by check mark if the registrant has elected not to use the extended transition period for complying with any new or revised financial accounting standards provided pursuant to Section 13(a) of the Exchange Act.
¨
|
|
|
Indicate by check mark whether the registrant is a shell company (as defined in Rule 12b-2 of the Exchange Act).
|
Yes
1
or No
þ
|
The aggregate market value of the common stock, $0.01 par value, held by non-affiliates of the registrant, as of
June 29, 2018
, was
$6.47 billion
. (This computation excludes the market value of all shares of Common Stock reported as beneficially owned by executive officers and directors of the registrant. Such exclusion shall not be deemed to constitute an admission that any such person is an affiliate of the Registrant.)
The registrant had
170,222,822
shares of its common stock, $0.01 par value, outstanding as of
February 8, 2019
.
DOCUMENTS INCORPORATED BY REFERENCE
Portions of the registrant’s definitive proxy statement to be issued in conjunction with the registrant’s annual meeting of shareholders to be held in
2019
are incorporated by reference in Part III of this Report on Form 10-K. Such proxy statement will be filed by the registrant with the Securities and Exchange Commission not later than 120 days after the end of the registrant’s fiscal year ended
December 31, 2018
.
1
DOUGLAS EMMETT, INC.
FORM 10-K
|
Table of Contents
|
||
|
|
|
|
|
Page
|
||
|
|
||
|
|
||
|
|
||
2
Glossary
Abbreviations used in this Report:
|
ADA
|
Americans with Disabilities Act of 1990
|
|
AOCI
|
Accumulated Other Comprehensive Income (Loss)
|
|
ASC
|
Accounting Standards Codification
|
|
ASU
|
Accounting Standards Update
|
|
ATM
|
At-the-Market
|
|
BOMA
|
Building Owners and Managers Association
|
|
CEO
|
Chief Executive Officer
|
|
CFO
|
Chief Financial Officer
|
|
Code
|
Internal Revenue Code of 1986, as amended
|
|
COO
|
Chief Operating Officer
|
|
DEI
|
Douglas Emmett, Inc.
|
|
EPA
|
United States Environmental Protection Agency
|
|
EPS
|
Earnings Per Share
|
|
Exchange Act
|
Securities Exchange Act of 1934, as amended
|
|
FASB
|
Financial Accounting Standards Board
|
|
FDIC
|
Federal Deposit Insurance Corporation
|
|
FFO
|
Funds from Operations
|
|
Fund X
|
Douglas Emmett Fund X, LLC
|
|
FIRPTA
|
Foreign Investment Real Property Tax Act
|
|
Funds
|
Unconsolidated institutional real estate funds (Fund X, Partnership X and Opportunity Fund)
|
|
GAAP
|
Generally Accepted Accounting Principles (United States)
|
|
IRS
|
Internal Revenue Service
|
|
IPO
|
Initial Public Offering
|
|
IT
|
Information Technology
|
|
JV
|
Joint Venture
|
|
LIBOR
|
London Interbank Offered Rate
|
|
LTIP Units
|
Long-Term Incentive Plan Units
|
|
MGCL
|
Maryland General Corporation Law
|
|
NAREIT
|
National Association of Real Estate Investment Trusts
|
|
NYSE
|
New York Stock Exchange
|
|
OCI
|
Other Comprehensive Income (Loss)
|
|
OP Units
|
Operating Partnership Units
|
|
Operating Partnership
|
Douglas Emmett Properties, LP
|
|
Opportunity Fund
|
Fund X Opportunity Fund, LLC
|
|
OFAC
|
Office of Foreign Assets Control
|
|
Partnership X
|
Douglas Emmett Partnership X, LP
|
|
PCAOB
|
Public Company Accounting Oversight Board (United States)
|
|
QRS
|
Qualified REIT subsidiary(ies)
|
|
REIT
|
Real Estate Investment Trust
|
|
Report
|
Annual Report on Form 10-K
|
|
SEC
|
Securities and Exchange Commission
|
|
Securities Act
|
Securities Act of 1933, as amended
|
|
S&P 500
|
Standard & Poor's 500 Index
|
|
TRS
|
Taxable REIT subsidiary(ies)
|
|
US
|
United States
|
|
USD
|
United States Dollar
|
|
VIE
|
Variable Interest Entity(ies)
|
3
Glossary
Defined terms used in this Report:
|
Annualized Rent
|
Annualized cash base rent (excluding tenant reimbursements, parking and other income) before abatements under leases commenced as of the reporting date. Annualized rent for our triple net office leases is calculated by adding expense reimbursements and estimates of normal building expenses paid by tenants to base rent. Annualized rent does not include lost rent recovered from insurance and rent for building management use.
|
|
Consolidated Portfolio
|
Includes the properties in our consolidated results, which includes the properties owned by our consolidated JVs.
|
|
Funds From Operations (FFO)
|
We calculate FFO in accordance with the standards established by NAREIT by excluding gains (or losses) on sales of investments in real estate, excluding gains (or losses) from changes in control of investments in real estate, real estate depreciation and amortization (other than amortization of right-of-use assets for which we are the lessee and amortization of deferred loan costs) from our net income (including adjusting for the effect of such items attributable to consolidated joint ventures and unconsolidated real estate funds, but not for noncontrolling interests included in our Operating Partnership). FFO is a non-GAAP supplemental financial measure that we report because it is useful to our investors. See Management’s Discussion and Analysis of Financial Condition and Results of Operations in Item 7 for a discussion of FFO.
|
|
Net Operating Income (NOI)
|
We calculate NOI, a Non-GAAP measure, as revenue less operating expenses attributable to the properties that we own and operate. NOI is calculated by excluding the following from our net income: general and administrative expense, depreciation and amortization expense, other income, other expense, income, including depreciation, from unconsolidated real estate funds, interest expense, gains (or losses) on sales of investments in real estate and net income attributable to noncontrolling interests. NOI is a non-GAAP supplemental financial measure that we report because it is useful to our investors. See Management’s Discussion and Analysis of Financial Condition and Results of Operations in Item 7 for a discussion of our Same Property NOI.
|
|
Occupancy Rate
|
The percentage leased, excluding signed leases not yet commenced, as of the reporting date. Management space is considered leased and occupied, while space taken out of service during a repositioning is excluded from both the numerator and denominator for calculating percentage leased and occupied.
|
|
Recurring Capital Expenditures
|
Building improvements required to maintain revenues once a property has been stabilized, and excludes capital expenditures for (i) acquired buildings being stabilized, (ii) newly developed space, (iii) upgrades to improve revenues or operating expenses, (iv) casualty damage or (v) bringing the property into compliance with governmental requirements.
|
|
Rentable Square Feet
|
Based on the BOMA remeasurement and consists of leased square feet (including square feet with respect to signed leases not commenced as of the reporting date), available square feet, building management use square feet and square feet of the BOMA adjustment on leased space.
|
|
Same Properties
|
Our wholly-owned properties that have been owned and operated by us in a consistent manner, and reported in our consolidated results during the entire span of both periods being compared. We exclude from our same property subset any properties (i) acquired during the comparative periods; (ii) sold, held for sale, contributed or otherwise removed from our consolidated financial statements during the comparative periods; or (iii) that underwent a major repositioning project that we believed significantly affected its results during the comparative periods.
|
|
Short-Term Leases
|
Represents leases that expired on or before the reporting date or had a term of less than one year, including hold over tenancies, month to month leases and other short term occupancies.
|
|
Total Portfolio
|
Includes our Consolidated Portfolio plus the properties owned by our Funds.
|
4
Forward Looking Statements
This Report contains forward-looking statements within the meaning of the Section 27A of the Securities Act and Section 21E of the Exchange Act. You can find many (but not all) of these statements by looking for words such as “believe”, “expect”, “anticipate”, “estimate”, “approximate”, “intend”, “plan”, “would”, “could”, “may”, “future” or other similar expressions in this Report. We claim the protection of the safe harbor contained in the Private Securities Litigation Reform Act of 1995. We caution investors that any forward-looking statements used in this Report, or those that we make orally or in writing from time to time, are based on our beliefs and assumptions, as well as information currently available to us. Actual outcomes will be affected by known and unknown risks, trends, uncertainties and factors beyond our control or ability to predict. Although we believe that our assumptions are reasonable, they are not guarantees of future performance and some will inevitably prove to be incorrect. As a result, our future results can be expected to differ from our expectations, and those differences may be material. Accordingly, investors should use caution when relying on previously reported forward-looking statements, which were based on results and trends at the time they were made, to anticipate future results or trends. Some of the risks and uncertainties that could cause our actual results, performance or achievements to differ materially from those expressed or implied by forward-looking statements include the following:
|
•
|
adverse economic or real estate developments affecting Southern California or Honolulu, Hawaii;
|
|
•
|
competition from other real estate investors in our markets;
|
|
•
|
decreasing rental rates or increasing tenant incentive and vacancy rates;
|
|
•
|
defaults on, early terminations of, or non-renewal of leases by tenants;
|
|
•
|
increases in interest rates or operating costs;
|
|
•
|
insufficient cash flows to service our outstanding debt or pay rent on ground leases;
|
|
•
|
difficulties in raising capital;
|
|
•
|
inability to liquidate real estate or other investments quickly;
|
|
•
|
adverse changes to rent control laws and regulations;
|
|
•
|
environmental uncertainties;
|
|
•
|
natural disasters;
|
|
•
|
insufficient insurance, or increases in insurance costs;
|
|
•
|
inability to successfully expand into new markets and submarkets;
|
|
•
|
difficulties in identifying properties to acquire and failure to complete acquisitions successfully;
|
|
•
|
failure to successfully operate acquired properties;
|
|
•
|
risks associated with property development;
|
|
•
|
risks associated with JVs;
|
|
•
|
conflicts of interest with our officers and reliance on key personnel;
|
|
•
|
changes in zoning and other land use laws;
|
|
•
|
adverse results of litigation or governmental proceedings;
|
|
•
|
failure to comply with laws, regulations and covenants that are applicable to our properties;
|
|
•
|
possible terrorist attacks or wars;
|
|
•
|
possible cyber attacks or intrusions;
|
|
•
|
adverse changes to accounting rules;
|
|
•
|
weaknesses in our internal controls over financial reporting;
|
|
•
|
failure to maintain our REIT status under federal tax laws; and
|
|
•
|
adverse changes to tax laws, including those related to property taxes.
|
For further discussion of these and other risk factors see Item 1A. "Risk Factors” in this Report. This Report and all subsequent written and oral forward-looking statements attributable to us or any person acting on our behalf are expressly qualified in their entirety by the cautionary statements contained or referred to in this section. We do not undertake any obligation to release publicly any revisions to our forward-looking statements to reflect events or circumstances after the date of this Report.
5
PART I
Item 1. Business Overview
Business description
Douglas Emmett, Inc. is a fully integrated, self-administered and self-managed REIT. We are one of the largest owners and operators of high-quality office and multifamily properties located in premier coastal submarkets in Los Angeles and Honolulu. Through our interest in our Operating Partnership and its subsidiaries, our consolidated JVs, and our unconsolidated Funds, we focus on owning, acquiring, developing and managing a significant market share of top-tier office properties and premier multifamily communities in neighborhoods with significant supply constraints, high-end executive housing and key lifestyle amenities. Our properties are located in the Beverly Hills, Brentwood, Burbank, Century City, Olympic Corridor, Santa Monica, Sherman Oaks/Encino, Warner Center/Woodland Hills and Westwood submarkets of Los Angeles County, California, and in Honolulu, Hawaii. We intend to increase our market share in our existing submarkets and may enter into other submarkets with similar characteristics where we believe we can gain significant market share. The terms "us," "we" and "our" as used in this Report refer to Douglas Emmett, Inc. and its subsidiaries on a consolidated basis.
At
December 31, 2018
, we owned a Consolidated Portfolio consisting of (i) a
16.6 million
square foot office portfolio, (ii)
3,595
multifamily apartment units and (iii) fee interests in
two
parcels of land from which we receive rent under ground leases. We also manage and own equity interests in our unconsolidated Funds which, at
December 31, 2018
, owned an additional
1.8 million
square feet of office space. We manage our unconsolidated Funds alongside our Consolidated Portfolio, and we therefore present the statistics for our office portfolio on a Total Portfolio basis. For more information, see Item 2 “Properties” of this Report. As of
December 31, 2018
, our portfolio consisted of the following (not including the
two
parcels of land from which we receive rent under ground leases):
|
|
Consolidated Portfolio
|
Total
Portfolio
|
|
|
Office
(includes ancillary retail space)
|
|||
|
Wholly-owned properties
|
53
|
53
|
|
|
Consolidated JV properties
|
10
|
10
|
|
|
Unconsolidated Fund properties
|
—
|
8
|
|
|
63
|
71
|
||
|
Rentable square feet (in thousands)
|
16,617
|
18,455
|
|
|
Multifamily
|
|||
|
Wholly-owned properties
|
10
|
10
|
|
|
Units
|
3,595
|
3,595
|
|
Business Strategy
We employ a focused business strategy that we have developed and implemented over the past four decades:
|
•
|
Concentration of High Quality Office and Multifamily Properties in Premier Submarkets.
|
First we select submarkets that are supply constrained, with high barriers to entry, key lifestyle amenities, proximity to high-end executive housing and a strong, diverse economic base. Virtually no entitled Class A office space is currently under construction in any of our targeted submarkets. Our submarkets are dominated by small, affluent tenants, whose rents are very small relative to their revenues and often not the paramount factor in their leasing decisions. At
December 31, 2018
, our office portfolio median size tenant was approximately
2,600
square feet. Our office tenants operate in diverse industries, including among others legal, financial services, entertainment, real estate, accounting and consulting, health services, retail, technology and insurance, reducing our dependence on any one industry. In
2016
,
2017
and
2018
, no tenant accounted for more than
10%
of our total revenues.
6
|
•
|
Disciplined Strategy of Acquiring Substantial Market Share.
|
Once we select a submarket, we follow a disciplined strategy of gaining substantial market share to provide us with extensive local transactional market information, pricing power in lease and vendor negotiations and an enhanced ability to identify and negotiate investment opportunities. As a result, we average approximately a
39%
share of the Class A office space in our submarkets based on the square feet of exposure in our total portfolio to each submarket. See "Office Portfolio Summary" in Item 2 “Properties” of this Report.
|
•
|
Proactive Asset and Property Management.
|
Our fully integrated and focused operating platform provides the unsurpassed tenant service demanded in our submarkets, with in-house leasing, proactive asset and property management and internal design and construction services, which we believe provides us with a competitive advantage in managing our property portfolio. Our in-house leasing agents and legal specialists allow us to lease a large property portfolio with a diverse group of smaller tenants, closing an average of approximately
three
office leases each business day, and our in-house construction company allows us to compress the time required for building out many smaller spaces, resulting in reduced vacancy periods. Our property management group oversees day-to-day property management of both our office and multifamily portfolios, allowing us to benefit from the operational efficiencies permitted by our submarket concentration.
Corporate Structure
Douglas Emmett, Inc. was formed as a Maryland corporation on June 28, 2005 to continue and expand the operations of Douglas Emmett Realty Advisors and its 9 institutional funds. All of our assets are directly or indirectly held by our Operating Partnership, which was formed as a Delaware limited partnership on July 25, 2005. As the sole stockholder of the general partner of our Operating Partnership, we generally have the exclusive power under the partnership agreement to manage and conduct the business of our Operating Partnership, subject to certain limited approval and voting rights of the other limited partners. Our interest in our Operating Partnership entitles us to share in the profits and losses and cash distributions in proportion to our percentage ownership.
Funds and JVs
In addition to
fifty-three
office properties and
ten
residential properties wholly owned by our Operating Partnership, we manage and own equity interests in:
|
•
|
three
unconsolidated Funds through which we and institutional investors own
eight
office properties in our core markets totaling
1.8 million
square feet and in which we own a weighted average of
62%
at
December 31, 2018
based on square footage. We are entitled to (i) priority distributions, (ii) distributions based on invested capital, (iii) a carried interest if the investors’ distributions exceed a hurdle rate, (iv) fees for property management and other services and (v) reimbursement of certain costs.
|
|
•
|
three
consolidated JVs through which we and institutional investors own
ten
office properties in our core markets totaling
2.8 million
square feet and in which we own a weighted average of
28%
at
December 31, 2018
based on square footage. We are entitled to (i) distributions based on invested capital as well as (in the case of two of the JVs) additional distributions based on cash net operating income, (ii) fees for property management and other services and (iii) reimbursement of certain acquisition-related expenses and certain other costs.
|
The financial data in this Report presents our Funds on an unconsolidated basis and our JVs on a consolidated basis in accordance with GAAP. Most of the property data in this Report is presented for our Total Portfolio, which includes the properties owned by our JVs and our Funds, as we believe this presentation assists in understanding our business.
Taxation
We believe that we qualify, and we intend to continue to qualify, for taxation as a REIT under the Code, although we cannot assure that this has happened or will happen. See Item 1A "Risk Factors" of this Report for the risks we face regarding taxation as a REIT. The following summary is qualified in its entirety by the applicable Code provisions and related rules, and administrative and judicial interpretations. If we qualify for taxation as a REIT, we will generally not be required to pay federal corporate income taxes on the portion of our net income that is currently distributed to stockholders. This treatment substantially eliminates the “double taxation” (i.e., at the corporate and stockholder levels) that generally results from investment in a corporation. However, we will be required to pay federal income tax under certain circumstances.
7
The Code defines a REIT as a corporation, trust or association (i) which is managed by one or more trustees or directors; (ii) the beneficial ownership of which is evidenced by transferable shares or certificates of beneficial interest; (iii) which would be taxable but for Sections 856 through 860 of the Code as a domestic corporation; (iv) which is neither a financial institution nor an insurance company subject to certain provisions of the Code; (v) the beneficial ownership of which is held by 100 or more persons; (vi) of which, during the last half of each taxable year, not more than 50% in value of the outstanding stock is owned, actually or constructively, by five or fewer individuals; and (vii) which meets certain other tests, described below, regarding the amount of its distributions and the nature of its income and assets. The Code requires that conditions (i) to (iv) be met during the entire taxable year and that condition (v) be met during at least 335 days of a taxable year of 12 months, or during a proportionate part of a taxable year of less than 12 months.
There are two gross income requirements:
|
i.
|
at least 75% of our gross income (excluding gross income from “prohibited transactions” as defined below and qualifying hedges) for each taxable year must be derived directly or indirectly from investments relating to real property or mortgages on real property or from certain types of temporary investment income, and
|
|
ii.
|
at least 95% of our gross income (excluding gross income from “prohibited transactions” and qualifying hedges) for each taxable year must be derived from income that qualifies under the 75% test or from other dividends, interest or gain from the sale or other disposition of stock or securities. In general, a “prohibited transaction” is a sale or other disposition of property (other than foreclosure property) held primarily for sale to customers in the ordinary course of business.
|
We must satisfy five asset tests at the close of each quarter of our taxable year:
|
i.
|
at least 75% of the value of our total assets must be represented by real estate assets including shares of stock of other REITs, debt instruments of publicly offered REITs, certain other stock or debt instruments purchased with the proceeds of a stock offering or long-term public debt offering by us (but only for the one-year period after such offering), cash, cash items and government securities,
|
|
ii.
|
not more than 25% of our total assets may be represented by securities other than those in the 75% asset class,
|
|
iii.
|
of the assets included in the 25% asset class, the value of any one issuer’s securities owned by us may not exceed 5% of the value of our total assets and we may not own more than 10% of the vote or value of the securities of any one issuer, in each case other than securities included under the 75% asset test above and interests in TRS or QRS, each as defined below, and in the case of the 10% value test, subject to certain other exceptions,
|
|
iv.
|
not more than 20% of the value of our total assets may be represented by securities of one or more TRS, and
|
|
v.
|
not more than 25% of the value of our total assets may be represented by nonqualified publicly offered REIT debt instruments.
|
In order to qualify as a REIT, we are required to distribute dividends (other than capital gains dividends) to our stockholders equal to at least (A) the sum of (i) 90% of our “REIT taxable income” (computed without regard to the dividends paid deduction and our net capital gain) and (ii) 90% of the net income, if any (after tax), from foreclosure property, less (B) the sum of certain items of non-cash income. The distributions must be paid in the taxable year to which they relate, or in the following taxable year if declared before we timely file our tax return for such year, if paid on or before the first regular dividend payment date after such declaration and if we so elect and specify the dollar amount in our tax return. To the extent that we do not distribute all of our net long-term capital gains or distribute at least 90%, but less than 100%, of our REIT taxable income, we will be required to pay tax thereon at regular corporate tax rates. Furthermore, if we fail to distribute during each calendar year the sum of at least (i) 85% of our ordinary income for such year, (ii) 95% of our capital gains income for such year, and (iii) any undistributed taxable income from prior periods, we would be required to pay a 4% excise tax on the excess of such required distributions over the amounts actually distributed.
We own interests in various partnerships and limited liability companies. In the case of a REIT that is a partner in a partnership or a member of a limited liability company that is treated as a partnership under the Code, Treasury Regulations provide that for purposes of the REIT income and asset tests, the REIT will be deemed to own its proportionate share of the assets of the partnership or limited liability company (determined in accordance with its capital interest in the entity), subject to special rules related to the 10% asset test, and will be deemed to be entitled to the income of the partnership or limited liability company attributable to such share.
8
We own an interest in a subsidiary which is intended to be treated as a QRS. The Code provides that a QRS will be ignored for federal income tax purposes and all assets, liabilities and items of income, deduction and credit of the QRS will be treated as our assets, liabilities and items of income. We hold certain of our properties through subsidiaries that have elected to be taxed as REITs. We also own interests in certain corporations which have elected to be treated as TRSs. A REIT may own more than 10% of the voting stock and value of the securities of a corporation which jointly elects with the REIT to be a TRS, provided certain requirements are met. A TRS generally may engage in any business, including the provision of customary or non-customary services to tenants of its parent REIT and of others, except a TRS may not manage or operate a hotel or healthcare facility. A TRS is treated as a regular corporation and is subject to federal income tax and applicable state income and franchise taxes at regular corporate rates. In addition, a 100% tax may be imposed on a REIT if its rental, service or other agreements with its TRS, or the TRS agreements with the REIT’s tenants, are not on arm’s-length terms.
We may be required to pay state or local tax in various state or local jurisdictions, including those in which we own properties or otherwise transact business or reside. The state and local tax treatment of us and our stockholders may not conform to the federal income tax consequences discussed above. We may also be subject to certain taxes applicable to REITs, including taxes in lieu of disqualification as a REIT, on undistributed income, and on income from prohibited transactions.
In addition, if we acquire any asset from a corporation that is or has been a C corporation in a transaction in which our tax basis in the asset is less than the fair market value of the asset, in each case determined as of the date on which we acquired the asset, and we subsequently recognize gain on the disposition of the asset during the five year period beginning on the date on which we acquired the asset, then we generally will be required to pay tax at the highest regular corporate tax rate on this gain to the extent of the excess of (i) the fair market value of the asset over (ii) our adjusted tax basis in the asset, in each case determined as of the date on which we acquired the asset.
Insurance
We carry comprehensive liability, fire, extended coverage, business interruption and rental loss insurance covering all of the properties in our portfolio under a blanket insurance policy. We believe the policy specifications and insured limits are appropriate and adequate given the relative risk of loss and the cost of the coverage and industry practice. See Item 1A “Risk Factors” of this Report for the risks we face regarding insurance.
Competition
We compete with a number of developers, owners and operators of office and multifamily real estate, many of which own properties similar to ours in the same markets in which our properties are located. See Item 1A “Risk Factors” of this Report for the risks we face regarding competition.
Regulation
Our properties are subject to various covenants, laws, ordinances and regulations, including regulations relating to common areas, fire and safety requirements, various environmental laws, the ADA and rent control laws. See Item 1A “Risk Factors” of this Report for the risks we face regarding laws and regulations.
Sustainability
In operating our buildings and running our business, we actively work to promote our operations in a sustainable and responsible manner. Our sustainability initiatives include items such as lighting, retrofitting, energy management systems, variable frequency drives in our motors, electricity co-generation, energy efficiency, recycling and water conservation. As a result of our efforts, over 95% of our eligible office space is ENERGY STAR certified by the EPA as having energy efficiency in the top 25% of buildings nationwide. As of the date of this Report, the EPA is evaluating a new scoring system for the ENERGY STAR certification.
Segments
We operate
two
business segments: the acquisition, development, ownership and management of office real estate, and the acquisition, development, ownership and management of multifamily real estate. The services for our office segment include primarily rental of office space and other tenant services, including parking and storage space rental. The services for our multifamily segment include primarily rental of apartments and other tenant services, including parking and storage space rental. See Note
14
to our consolidated financial statements in Item 15 of this Report for more information regarding our segments.
9
Employees
As of
December 31, 2018
, we employed approximately
670
people.
Principal Executive Offices
Our principal executive offices are located in the building we own at 1299 Ocean Avenue, Suite 1000, Santa Monica, California 90401 (telephone 310-255-7700).
Available Information
All reports that we file with the SEC will be available on the SEC website at
www.sec.gov
. We make available on our website at
www.douglasemmett.com
our annual reports on Form 10-K, quarterly reports on Form 10-Q, current reports on Form 8-K, and all amendments thereto, free of charge, as soon as reasonably practicable after we file such reports with, or furnish them to, the SEC. None of the information on or hyperlinked from our website is incorporated into this Report.
For more information, please contact:
Stuart McElhinney
Vice President, Investor Relations
310-255-7751
smcelhinney@douglasemmett.com
Item 1A. Risk Factors
The following risk factors are what we believe to be the most significant risk factors that could adversely affect our business and operations, including, without limitation, our financial condition, REIT status, results of operations and cash flows, our ability to service our debt and pay dividends to our stockholders, our ability to capitalize on business opportunities as they arise, our ability to raise capital, and the market price of our common stock. This is not an exhaustive list, and additional risk factors could adversely affect our business and financial performance. We operate in a very competitive and rapidly changing environment and new risk factors emerge from time to time. It is therefore not possible for us to predict all such risk factors, nor can we assess the impact of all such risk factors on our business or the extent to which any factor, or combination of factors, may cause actual results to differ materially from those contained in any forward-looking statements. This discussion of risk factors includes many forward-looking statements. For cautions about relying on forward-looking statements see “Forward Looking Statements” at the beginning of this Report.
Risks Related to Our Properties and Our Business
All of our properties are located in Los Angeles County, California and Honolulu, Hawaii, and we are therefore exposed to greater risk than if we owned a more geographically diverse portfolio. Our properties in Los Angeles County are concentrated in certain submarkets, exposing us to risks associated with those specific areas.
Because of the geographic concentration of our properties, we are susceptible to adverse economic and regulatory developments, as well as natural disasters, in the markets and submarkets where we operate, including, for example, economic slowdowns, industry slowdowns, business downsizing, business relocations, increases in real estate and other taxes, changes in regulation, earthquakes, floods, droughts and wildfires. California is also regarded as being more litigious, regulated and taxed than many other states.
Our operating performance is subject to risks associated with the real estate industry.
Real estate investments are subject to various risks, fluctuations and cycles in value and demand, many of which are beyond our control. These events include, but are not limited to:
|
•
|
adverse changes in international, national or local economic conditions;
|
|
•
|
inability to rent space on favorable terms, including possible market pressures to offer tenants rent abatements, tenant improvements, early termination rights or below-market renewal options;
|
|
•
|
adverse changes in financial conditions of actual or potential investors, buyers, sellers or tenants;
|
|
•
|
inability to collect rent from tenants;
|
10
|
•
|
competition from other real estate investors, including other real estate operating companies, publicly-traded REITs and institutional investment funds;
|
|
•
|
reduced tenant demand for office space and residential units from matters such as (i) changes in space utilization, (ii) changes in the relative popularity of our properties, (iii) the type of space we provide or (iv) purchasing versus leasing;
|
|
•
|
reduced demand for parking space due to the impact of technology such as self driving cars, and the increasing popularity of car ride sharing services;
|
|
•
|
increases in the supply of office space and residential units;
|
|
•
|
fluctuations in interest rates and the availability of credit, which could adversely affect our ability to obtain financing on favorable terms or at all;
|
|
•
|
increases in expenses (or our reduced ability to recover expenses from our tenants), including insurance costs, labor costs (such as the unionization of our employees or the employees of any parties with whom we contract for services to our buildings), energy prices, real estate assessments and other taxes, as well as costs of compliance with laws, regulations and governmental policies;
|
|
•
|
utility disruptions;
|
|
•
|
the effects of rent controls, stabilization laws and other laws or covenants regulating rental rates;
|
|
•
|
changes in, and changes in enforcement of, laws, regulations and governmental policies, including, without limitation, health, safety, environmental, zoning and tax laws, governmental fiscal policies and the ADA;
|
|
•
|
legislative uncertainty related to federal and state spending and tax policy;
|
|
•
|
difficulty in operating properties effectively;
|
|
•
|
acquiring undesirable properties; and
|
|
•
|
inability to dispose of properties at appropriate times or at favorable prices.
|
We have a substantial amount of debt, which exposes us to interest rate fluctuation risk and the risk of not being able to refinance our debt, which in turn could expose us to the risk of default under our debt obligations.
We have a substantial amount of debt and we may incur significant additional debt for various purposes, including, without limitation, to fund future property acquisitions and development activities, reposition properties and to fund our operations. See Note
7
to our consolidated financial statements in
Item 15
of this Report for more detail regarding our consolidated debt. See "Off-Balance Sheet Arrangements" in Item 7 of this Report for more detail regarding our unconsolidated debt.
Our substantial indebtedness, and the limitations and other constraints imposed on us by our debt agreements, especially during economic downturns when credit is harder to obtain, could adversely affect us, including the following:
|
•
|
our cash flows may be insufficient to meet our required principal and interest payments;
|
|
•
|
servicing our borrowings may leave us with insufficient cash to operate our properties or to pay the distributions necessary to maintain our REIT qualification;
|
|
•
|
we may be unable to borrow additional funds as needed or on favorable terms, which could, among other things, adversely affect our ability to capitalize upon acquisition opportunities;
|
|
•
|
we may be unable to refinance our indebtedness at maturity or the refinancing terms may be less favorable than the terms of our existing indebtedness;
|
|
•
|
we may be forced to dispose of one or more of our properties, possibly on disadvantageous terms;
|
|
•
|
we may violate any restrictive covenants in our loan documents, which could entitle the lenders to accelerate our debt obligations;
|
|
•
|
we may be unable to hedge floating rate debt, counterparties may fail to honor their obligations under our hedge agreements, the hedge agreements may not effectively hedge the interest rate fluctuation risk, and, upon the expiration of any hedge agreements we do have, we will be exposed to the then-existing market rates of interest and future interest rate volatility with respect to debt that is currently hedged; we could also be declared in default on our hedge agreements if we default on the underlying debt that we are hedging;
|
|
•
|
we may default on our obligations and the lenders or mortgagees may foreclose on our properties that secure their loans and receive an assignment of rents and leases;
|
11
|
•
|
our default under any of our indebtedness with cross default provisions could result in a default on other indebtedness; and
|
|
•
|
any foreclosure on our properties could also create taxable income without accompanying cash proceeds, which could adversely affect our ability to meet the REIT distribution requirements imposed by the Code.
|
|
•
|
our floating rate debt and related hedges are indexed to USD-LIBOR, any regulatory changes which impact the USD-LIBOR benchmark could impact our borrowing costs or the effectiveness of our hedges.
|
The rents we receive from new leases may be less than our asking rents, and we may experience rent roll-down from time to time.
As a result of various factors, such as competitive pricing pressure in our submarkets, adverse conditions in the Los Angeles County or Honolulu real estate market, general economic downturns, or the desirability of our properties compared to other properties in our submarkets, the rents we receive on new leases could be less than our in-place rents.
In order to successfully compete against other properties, we must spend money to maintain, repair, and renovate our properties, which reduces our cash flows.
If our properties are not as attractive to current and prospective tenants in terms of rent, services, condition, or location as properties owned by our competitors, we could lose tenants or suffer lower rental rates. As a result, we may from time to time be required to incur significant capital expenditures to maintain the competitiveness of our properties. There can be no assurances that any such expenditures would result in higher occupancy or rental rates, or deter existing tenants from relocating to properties owned by our competitors.
We face intense competition, which could adversely impact the occupancy and rental rates of our properties.
We compete with a number of developers, owners and operators of office and multifamily real estate, many of which own properties similar to ours in the same markets in which our properties are located. If our competitors offer space at rental rates below current market rates, or below the rental rates that we currently charge our tenants, or if they offer tenants significant rent or other concessions, we may lose existing or potential tenants and may not be able to replace them, and we may be pressured to reduce our rental rates below those we currently charge or offer more substantial rent abatements, tenant improvements, early termination rights or below-market renewal options in order to retain tenants when our tenants’ leases expire.
Potential losses, including from adverse weather conditions, natural disasters and title claims, may not be covered by insurance.
Our business operations in Los Angeles County, California and Honolulu, Hawaii are susceptible to, and could be significantly affected by, adverse weather conditions and natural disasters such as earthquakes, tsunamis, hurricanes, volcanoes, drought, wind, floods, landslides and fires. The likelihood of such disasters may be increased as a result of climate changes. Adverse weather conditions and natural disasters could cause significant damage to our properties or to the economies of the regions in which they are located, the risk of which is enhanced by the concentration of our properties’ locations. Our insurance coverage may not be adequate to cover business interruption or losses resulting from adverse weather or natural disasters. In addition, our insurance policies include substantial self-insurance portions and significant deductibles and co-payments for such events, and we are subject to the availability of insurance in the US and the pricing thereof. As a result, we may incur significant costs in the event of adverse weather conditions and natural disasters.
Most of our properties are located in Southern California, an area subject to an increased risk of earthquakes. While we presently carry earthquake insurance on our properties, the amount of our earthquake insurance coverage may not be sufficient to fully cover losses from earthquakes. We may reduce or discontinue earthquake or any other insurance coverage on some or all of our properties in the future if the cost of premiums for any of these policies in our judgment exceeds the value of the coverage discounted for the risk of loss.
We do not carry insurance for certain losses, such as losses caused by certain environmental conditions, asbestos, riots or war. In addition, our title insurance policies generally only insure the value of a property at the time of purchase, and we have not and do not intend to increase our title insurance coverage as the market value of our portfolio increases. As a result, we may not have sufficient coverage against all losses that we may experience, including from adverse title claims.
12
If we experience a loss that is uninsured or which exceeds policy limits, we could incur significant costs and lose the capital invested in the damaged properties as well as the anticipated future cash flows from those properties. If the damaged properties are encumbered, we may continue to be liable for the indebtedness, even if these properties were irreparably damaged.
If any of our properties were destroyed or damaged, then we might not be permitted to rebuild many of those properties to their existing height or size at their existing location under current zoning and land use regulations. In the event that we experience a substantial or comprehensive loss of one of our properties, we may not be able to rebuild such property to its existing specifications and otherwise may have to upgrade such property to meet current code requirements.
New regulations in the submarkets in which we operate could require us to make safety improvements to our buildings, for example requiring us to retrofit our buildings to better withstand earthquakes, and we could incur significant costs complying with those regulations.
Terrorism and war could harm our business and operating results.
The possibility of future terrorist attacks or war could have a negative impact on our operations, even if they are not directed at our properties and even if they never actually occur. Terrorist attacks can also substantially affect the availability and price of insurance coverage for certain types of damages or occurrences, and our insurance policies for terrorism include large deductibles and co-payments. The lack of sufficient insurance for these types of acts could expose us to significant losses.
Security breaches through cyber attacks, cyber intrusions or otherwise, as well as other significant disruptions of our IT networks and related systems could harm our business.
We face risks associated with security breaches, whether through cyber attacks or cyber intrusions over the Internet, malware, computer viruses, attachments to e-mails, persons inside our organization or persons with access to systems inside our organization and other significant disruptions of our IT networks and related systems. The risk of a security breach or disruption, particularly through cyber attack or cyber intrusion, including by computer hackers, foreign governments and cyber terrorists, has generally increased as the number, intensity and sophistication of attempted attacks and intrusions from around the world have increased. Our IT networks and related systems are essential to the operation of our business and our ability to perform day-to-day operations (including managing our building systems) and, in some cases, may be critical to the operations of certain of our tenants. Although we make efforts to maintain the security and integrity of these types of IT networks and related systems, and have implemented various measures to manage the risk of a security breach or disruption, there can be no assurance that our efforts will be effective in preventing attempted security breaches or disruptions. Even the most well protected information, networks, systems and facilities remain potentially vulnerable because the techniques used in such attempted security breaches evolve and generally are not recognized until launched against a target, and in some cases are designed not be detected and, in fact, may not be detected. Accordingly, we may be unable to anticipate these techniques or to implement adequate security barriers or other preventative measures, and thus it is impossible for us to entirely mitigate this risk. A security breach or other significant disruption involving our IT networks and related systems could have an adverse effect on our business, for example:
|
•
|
Disruption to our networks and systems and thus our operations and/or those of our tenants or vendors;
|
|
•
|
Misstated financial reports, violations of loan covenants, missed reporting deadlines and missed permitting deadlines;
|
|
•
|
Inability to comply with laws and regulations;
|
|
•
|
Unauthorized access to, destruction, loss, theft, misappropriation or release of proprietary, confidential, sensitive or otherwise valuable information of ours or others, which others could be used to compete against us or for disruptive, destructive or otherwise harmful purposes;
|
|
•
|
Rendering us unable to maintain the building systems relied upon by our tenants;
|
|
•
|
The requirement of significant management attention and resources to remedy any damages that result;
|
|
•
|
Claims for breach of contract, damages, credits, penalties or termination of leases or other agreements; and
|
|
•
|
Damage to our reputation among our tenants, investors, or others.
|
13
We may be unable to renew leases or lease vacant space.
We may be unable to renew our tenants' leases, in which case we must find new tenants. To attract new tenants or retain existing tenants, particularly in periods of recession, we may have to accept rental rates below our existing rental rates or offer substantial rent abatements, tenant improvements, early termination rights or below-market renewal options. Accordingly, portions of our office and multifamily properties may remain vacant for extended periods of time. In addition, some existing leases currently provide tenants with options to renew the terms of their leases at rates that are below the current market rates or to terminate their leases prior to the expiration date thereof. We actively pursue opportunities for what we believe to be well-located and high quality buildings that may be in a transitional phase due to current or impending vacancies. We cannot assure that any such vacancies will be filled following a property acquisition, or that new tenant leases will be executed at or above market rates. As of
December 31, 2018
,
8.3%
of the square footage in our total office portfolio was available for lease and
9.3%
was scheduled to expire in
2019
. As of
December 31, 2018
,
1.0%
of the units in our multifamily portfolio were available for lease, and substantially all of the leases in our multifamily portfolio must be renewed within the next year. For more information see Item 2 “Properties” of this Report.
Our business strategy for our office portfolio focuses on leasing to smaller-sized tenants which may present greater credit risks.
Our business strategy for our office portfolio focuses on leasing to smaller-sized tenants, which may present greater credit risks because they are more susceptible to economic downturns than larger tenants, and may be more likely to cancel or not renew their leases.
Real estate investments are generally illiquid.
Our real estate investments are relatively difficult to sell quickly. Return of capital and realization of gains, if any, from an investment will generally occur upon disposition or refinancing of the underlying property. We may not be able to realize our investment objectives by sale or be able to refinance at attractive prices within any given period of time. We may also not be able to complete any exit strategy. Any number of factors could increase these risks, such as (i) weak market conditions, (ii) the lack of an established market for a property, (iii) changes in the financial condition or prospects of prospective buyers, (iv) changes in local, national or international economic conditions, and (v) changes in laws, regulations or fiscal policies. Furthermore, certain properties may be adversely affected by contractual rights, such as rights of first offer or ground leases.
We may incur significant costs complying with laws, regulations and covenants that are applicable to our properties.
The properties in our portfolio are subject to various covenants, federal, state and local laws, ordinances, regulatory requirements, including permitting and licensing requirements, various environmental laws, the ADA and rent control laws. Such laws and regulations, including municipal or local ordinances, zoning restrictions and restrictive covenants imposed by community developers may restrict our use of our properties and may require us to obtain approval from local officials or community standards organizations at any time with respect to our properties, including prior to acquiring a property or when undertaking renovations of any of our existing properties. Among other things, these restrictions may relate to fire and safety, seismic, asbestos-cleanup or hazardous material abatement requirements. There can be no assurance that existing laws and regulations will not adversely affect us or the timing or cost of any future acquisitions, developments or renovations, or that additional regulations that increase such delays or result in additional costs will not be adopted. Under the ADA, our properties must meet federal requirements related to access and use by disabled persons to the extent that such properties are “public accommodations”. The costs of our on-going efforts to comply with these laws and regulations are substantial. Moreover, as we have not conducted a comprehensive audit or investigation of all of our properties to determine our compliance with applicable laws and regulations, we may be liable for investigation and remediation costs, penalties, and/or damages, which could be substantial and could adversely affect our ability to sell or rent our property or to borrow using such property as collateral.
14
Because we own real property, we are subject to extensive environmental regulations, which create uncertainty regarding future environmental expenditures and liabilities.
Environmental laws regulate, and impose liability for, releases of hazardous or toxic substances into the environment. Under various provisions of these laws, an owner or operator of real estate may be liable for costs related to soil or groundwater contamination on, in, or migrating to or from its property. Persons who arrange for the disposal or treatment of hazardous or toxic substances may be liable for the costs of cleaning up contamination at the disposal site. Such laws often impose liability regardless of whether the person knew of, or was responsible for, the presence of the hazardous or toxic substances that caused the contamination. The presence of, or contamination resulting from, any of these substances, or the failure to properly remediate them, may adversely affect our ability to sell or rent our property or to borrow using the property as collateral. Persons exposed to hazardous or toxic substances may sue for personal injury damages, for example, some laws impose liability for release of or exposure to asbestos-containing materials, a substance known to be present in a number of our buildings. In other cases, some of our properties have been (or may have been) impacted by contamination from past operations or from off-site sources. As a result, in connection with our current or former ownership, operation, management and development of real properties, we may be potentially liable for investigation and cleanup costs, penalties, and damages under environmental laws.
Although most of our properties have been subjected to preliminary environmental assessments, known as Phase I assessments, by independent environmental consultants that identify certain liabilities, Phase I assessments are limited in scope, and may not include or identify all potential environmental liabilities or risks associated with the property. Unless required by applicable laws or regulations, we may not further investigate, remedy or ameliorate the liabilities disclosed in the Phase I assessments. We cannot assure that these or other environmental studies identified all potential environmental liabilities, or that we will not incur material environmental liabilities in the future. If we do incur material environmental liabilities in the future, we may face significant remediation costs and may find it difficult to sell any affected properties. See Note
17
to our consolidated financial statements in
Item 15
of this Report for more detail regarding our buildings that contain asbestos.
Rent control or rent stabilization legislation and other regulatory restrictions may limit our ability to increase rents and pass through new or increased operating costs to our tenants.
We presently expect to continue operating and acquiring properties in areas that have adopted laws and regulations imposing restrictions on the timing or amount of rent increases or have imposed regulations relating to low- and moderate-income housing. Currently, neither California nor Hawaii have state mandated rent control, but various municipalities within Southern California, including the cities of Los Angeles and Santa Monica where our properties are located, have enacted rent control legislation. Additionally, portions of the Honolulu multifamily market are subject to low- and moderate-income housing regulations and all but one of the properties in our Los Angeles County multifamily portfolio are affected by these laws and regulations. Under current California law we are able to increase rents to market rates once a tenant vacates a rent-controlled unit, however increases in rental rates for renewing tenants are limited by Los Angeles and Santa Monica rent control regulations. We have agreed to rent specified percentages of the units at some of our Honolulu multifamily properties to persons with income below specified levels in exchange for certain tax benefits. These laws and regulations can (i) limit our ability to charge market rents, increase rents, evict tenants or recover increases in our operating expenses, (ii) negatively impact our ability to attract higher-paying tenants, (iii) require us to incur costs for reporting and compliance, and (iv) make it more difficult for us to dispose of properties in certain circumstances. Any failure to comply with these regulations could result in fines, penalties and/or the loss of certain tax benefits and the forfeiture of rents.
We may be unable to complete acquisitions that would grow our business, or successfully integrate and operate acquired properties.
Our planned growth strategy includes the disciplined acquisition of properties as opportunities arise. Our ability to acquire properties on favorable terms and to successfully integrate and operate them is subject to significant risks, including the following:
|
•
|
we may be unable to acquire desired properties because of competition from other real estate investors, including other real estate operating companies, publicly-traded REITs and investment funds;
|
|
•
|
competition from other potential acquirers may significantly increase the purchase price of a desired property;
|
|
•
|
we may acquire properties that are not accretive to our results upon acquisition or we may not successfully manage and lease them up to meet our expectations;
|
|
•
|
we may be unable to generate sufficient cash from operations, or obtain the necessary debt or equity financing to consummate an acquisition or, if obtained, the financing may not be on favorable terms;
|
|
•
|
cash flows from the acquired properties may be insufficient to service the related debt financing;
|
15
|
•
|
we may need to spend more than we budgeted to make necessary improvements or renovations to acquired properties;
|
|
•
|
we may spend significant time and money on potential acquisitions that we do not close;
|
|
•
|
the process of acquiring or pursuing the acquisition of a property may divert the attention of our senior management team from our existing business operations;
|
|
•
|
we may be unable to quickly and efficiently integrate new acquisitions, particularly acquisitions of portfolios of properties, into our existing operations;
|
|
•
|
occupancy and rental rates of acquired properties may be less than expected; and
|
|
•
|
we may acquire properties without recourse, or with limited recourse, for liabilities, whether known or unknown, such as clean-up of environmental contamination, claims by tenants, vendors or other persons against the former owners of the properties and claims for indemnification by general partners, directors, officers and others indemnified by the former owners of the properties.
|
We may be unable to successfully expand our operations into new markets and submarkets.
If the opportunity arises, we may explore acquisitions of properties in new markets. The risks applicable to our ability to acquire, integrate and operate properties in our current markets are also applicable to our ability to acquire, integrate and operate properties in new markets. In addition to these risks, we will not possess the same level of familiarity with the dynamics and market conditions of any new markets that we may enter, which could adversely affect our ability to expand into those markets. We may be unable to build a significant market share or achieve a desired return on our investments in new markets.
We are exposed to risks associated with property development.
We engage in development and redevelopment activities with respect to certain of our properties. To the extent that we do so, we are subject to certain risks, including the following:
|
•
|
We may not complete a development or redevelopment project on schedule or within budgeted amounts (as a result of risks beyond our control, such as weather, labor conditions, material shortages and price increases);
|
|
•
|
We may be unable to lease the developed or redeveloped properties at budgeted rental rates or lease up the property within budgeted time frames;
|
|
•
|
We may devote time and expend funds on development or redevelopment of properties that we may not complete;
|
|
•
|
We may encounter delays or refusals in obtaining all necessary zoning, land use, and other required entitlements, and building, occupancy and other required governmental permits and authorizations;
|
|
•
|
We may encounter delays, refusals and unforeseen cost increases resulting from third-party litigation or objections;
|
|
•
|
We may fail to obtain the financial results expected from properties we develop or redevelop; and
|
|
•
|
We have developed and redeveloped properties in the past, however only in a limited manner in recent years, which could adversely affect our ability to develop or redevelop properties or to achieve our expected returns.
|
We are exposed to certain risks when we enter into JVs or issue securities of our subsidiaries, including our Operating Partnership.
We have and may in the future develop or acquire properties with, or raise capital from, third parties through partnerships, JVs or other entities, or through acquiring or disposing of non-controlling interests in, or sharing responsibility for managing the affairs of, a property, partnership, JV or other entity. This may subject us to risks that may not be present with other methods of ownership, including for example the following:
|
•
|
We may not be able to exercise sole decision-making authority regarding the properties, partnership, JV or other entity, which would allow for impasses on decisions that could restrict our ability to sell or transfer our interests in such entity or such entity’s ability to transfer or sell its assets;
|
|
•
|
Partners or co-venturers may default on their obligations including those related to capital contributions, debt financing or interest rate swaps, which could delay acquisition, construction or development of a property or increase our financial commitment to the partnership or JV;
|
16
|
•
|
Conflicts of interests with our partners or co-venturers as result of matters such as different needs for liquidity, assessments of the market or tax objectives; ownership of competing interests in other properties; and other business interests, policies or objectives that are competitive or inconsistent with ours;
|
|
•
|
If any such jointly owned or managed entity takes or expects to take actions that could jeopardize our status as a REIT or require us to pay tax, we may suffer significantly, including having to dispose of our interest in such entity (if that is possible) or even losing our status as a REIT;
|
|
•
|
Our assumptions regarding the tax impact of any structure or transaction could prove to be incorrect, and we could be exposed to significant taxable income, property tax reassessments or other liabilities, including any liability to third parties that we may assume as part of such transaction or otherwise;
|
|
•
|
Disputes between us and partners or co-venturers may result in litigation or arbitration that would increase our expenses, affect our ability to develop or operate a property and/or prevent our officers and/or directors from focusing their time and effort on our business;
|
|
•
|
We may, in certain circumstances, be liable for the actions of our third-party partners or co-venturers; and
|
|
•
|
We may not be able to raise capital as needed from institutional investors or sovereign wealth funds, or on terms that are favorable.
|
If we default on the ground lease to which one of our properties is subject, our business could be adversely affected.
Some of our properties may be subject to a ground lease. If we default under the terms of such a lease, we may be liable for damages and could lose our ownership interest in the property.
We may not have sufficient cash available for distribution to stockholders at expected levels in the future.
Our distributions could exceed our cash generated from operations. If necessary, we may fund the difference from our existing cash balances or additional borrowings. If our available cash were to decline significantly below our taxable income, we could lose our REIT status unless we could borrow to make such distributions or make any required distributions in common stock.
Our property taxes could increase due to property tax rate changes, reassessments or changes in property tax laws, which would adversely impact our cash flows.
We are required to pay property taxes for our properties, which could increase as property tax rates increase or as our properties are assessed or reassessed by taxing authorities. In California, under current law, reassessment occurs primarily as a result of a “change in ownership”. A potential reassessment may take a considerable amount of time, during which the property taxing authorities make a determination of the occurrence of a “change of ownership”, as well as the actual reassessed value. In addition, from time to time, there have been proposals to base property taxes on commercial properties on their current market value, without any limit based on purchase price. If any similar proposal were adopted, the property taxes we pay could increase substantially. In California, pursuant to an existing state law commonly referred to as Proposition 13, properties are reassessed to market value only at the time of change in ownership or completion of construction, and thereafter, annual property reassessments are limited to 2% of previously assessed values. As a result, Proposition 13 generally results in significant below-market assessed values over time. From time to time, including recently, lawmakers and political coalitions have initiated efforts to repeal or amend Proposition 13 to eliminate its application to commercial and industrial properties. If successful, a repeal of Proposition 13 could substantially increase the assessed values and property taxes for our properties in California.
If a transaction intended to qualify as a Section 1031 Exchange is later determined to be taxable or if we are unable to identify and complete the acquisition of a suitable replacement property to effect a Section 1031 Exchange, we may face adverse consequences, and if the laws applicable to such transactions are amended or repealed, we may not be able to dispose of properties on a tax deferred basis
.
From time to time we may dispose of properties in transactions that are intended to qualify as tax deferred exchanges under Section 1031 of the Code (Section 1031 Exchanges). It is possible that the qualification of a transaction as a Section 1031 Exchange could be successfully challenged and determined to be currently taxable. In such cases, our taxable income would increase as would the amount of distributions we are required to make to satisfy our REIT distribution requirements. This could increase the dividend income to our stockholders by reducing any return of capital they receive. In some circumstances, we may be required to pay additional dividends or, in lieu of that, corporate income tax, possibly including interest and penalties. As a result, we may be required to borrow in order to pay additional dividends or taxes, and the payment of such taxes could cause us to have less cash available to distribute to our stockholders. If a Section 1031 Exchange were later to be determined to be taxable, we may be
17
required to amend our tax returns for the applicable year in question, including any reports we distributed to our stockholders. It is possible that legislation could be enacted that could modify or repeal the laws with respect to Section 1031 Exchanges, which could make it more difficult or not possible for us to dispose of properties on a tax deferred basis.
We face risks associated with contractual counterparties being designated “Prohibited Persons” by the Office of Foreign Assets Control.
The OFAC of the US Department of the Treasury maintains a list of persons designated as terrorists or who are otherwise blocked or banned (“Prohibited Persons”). The OFAC regulations and other laws prohibit conducting business or engaging in transactions with Prohibited Persons. Some of our agreements require us and the other party to comply with the OFAC requirements. If a party with whom we contract is placed on the OFAC list we may be required by the OFAC regulations to terminate the agreement, which could result in a losses or a damage claim by the other party that the termination was wrongful.
Risks Related to Our Organization and Structure
Tax consequences to holders of OP Units upon a sale or refinancing of our properties may cause the interests of our executive officers to differ from the interests of our stockholders.
Some of our properties were contributed to us in exchange for units of our Operating Partnership. As a result of the unrealized built-in gain attributable to such properties at the time of their contribution, some holders of OP Units, including our executive officers, may suffer different and more adverse tax consequences than holders of our common stock upon the sale or refinancing of the properties owned by our Operating Partnership, including disproportionately greater allocations of items of taxable income and gain upon a realization event. As a result, those holders may have different objectives regarding the appropriate pricing, timing and other material terms of any sale or refinancing of certain properties, or whether to sell or refinance such properties at all.
Our executive officers have significant influence over our affairs.
At
December 31, 2018
, our executive officers owned
5%
of our outstanding common stock, but they would own
14%
if they converted all of their OP Units into common stock. As a result, our executive officers, to the extent that they vote their shares in a similar manner, will have significant influence over our affairs and could exercise such influence in a manner that is not in the best interests of our other stockholders, including by attempting to delay, defer or prevent a change of control transaction that might otherwise be in the best interests of our stockholders.
Our growth depends on external sources of capital which are outside of our control.
In order to qualify as a REIT, we are required under the Code to distribute annually at least 90% of our “REIT taxable income", determined without regard to the dividends paid deduction and by excluding any net capital gain. To the extent that we do not distribute all of our net long-term capital gains or at least 90% of our REIT taxable income, we will be required to pay tax thereon at regular corporate tax rates. Because of these distribution requirements, we may not be able to fund future capital needs from our operating cash flows, including acquisitions, development and debt refinancing. Consequently, we expect to rely on third-party sources to fund some of our capital needs and we may not be able to obtain financing on favorable terms or at all. Any additional borrowings will increase our leverage, and any additional equity that we issue will dilute our common stock. Our access to third-party sources of capital depends on many factors, some of which include:
|
•
|
general market conditions;
|
|
•
|
the market’s perception of our growth potential;
|
|
•
|
our current debt levels;
|
|
•
|
our current and expected future earnings;
|
|
•
|
our cash flows and cash dividends; and
|
|
•
|
the market price per share of our common stock.
|
We face risks associated with short-term liquid investments.
From time to time, we have significant cash balances that we invest in a variety of short-term money market fund investments that are intended to preserve principal value and maintain a high degree of liquidity while providing current income. These investments are not insured against loss of principal and there is no guarantee that our investments in these funds will be redeemable at par value. If we cannot liquidate our investments or redeem them at par we could incur losses and experience liquidity issues.
18
Our charter, the partnership agreement of our Operating Partnership, and Maryland law contain provisions that may delay or prevent a change of control transaction.
(i) Our charter contains a five percent ownership limit.
Our charter, subject to certain exceptions, contains restrictions on ownership that limit, and authorizes our directors to take such actions as are necessary and desirable to limit, any person to actual or constructive ownership of not more than five percent of the value or number, whichever is more restrictive, of the outstanding shares of our common stock. Our board of directors, in its sole discretion, may exempt a proposed transferee from the ownership limit. The ownership limit contained in our charter may delay or prevent a transaction or a change of control that might involve a premium price for our common stock or otherwise be in the best interest of our stockholders.
(ii) Our board of directors may create and issue a class or series of preferred stock without stockholder approval.
Our board of directors is empowered under our charter to amend our charter to increase or decrease the aggregate number of shares of our common stock or the number of shares of stock of any class or series that we have authority to issue, to designate and issue from time to time one or more classes or series of preferred stock and to classify or reclassify any unissued shares of our common stock or preferred stock without stockholder approval. Our board of directors may determine the relative rights, preferences and privileges of any class or series of preferred stock issued. As a result, we may issue series or classes of preferred stock with preferences, dividends, powers and rights, voting or otherwise, senior to the rights of our common stock holders. The issuance of preferred stock could also have the effect of delaying or preventing a change of control transaction that might otherwise be in the best interests of our stockholders.
(iii) Certain provisions in the partnership agreement of our Operating Partnership may delay or prevent an unsolicited acquisition of us.
Provisions in our Operating Partnership agreement may delay or make more difficult unsolicited acquisitions of us or changes in our control. These provisions could discourage third parties from making proposals involving an unsolicited acquisition of us or change of our control, although some stockholders might consider such proposals, if made, desirable. These provisions include, among others:
|
•
|
redemption rights of qualifying parties;
|
|
•
|
transfer restrictions on our OP Units;
|
|
•
|
the ability of the general partner in some cases to amend the partnership agreement without the consent of the limited partners; and
|
|
•
|
the right of the limited partners to consent to transfers of the general partnership interest and mergers under specified circumstances.
|
Any potential change of control transaction may be further limited as a result of provisions of the partnership unit designation for certain LTIP Units, which require us to preserve the rights of LTIP unit holders and may restrict us from amending the partnership agreement for our Operating Partnership in a manner that would have an adverse effect on the rights of LTIP unit holders.
(iv) Certain provisions of Maryland law could inhibit changes in control.
Certain provisions of the MGCL may have the effect of inhibiting a third party from making a proposal to acquire us or impeding a change of control under circumstances that otherwise could provide our stockholders with the opportunity to realize a premium over the market price of our common stock, including:
|
•
|
“business combination” provisions that, subject to limitations, prohibit certain business combinations between us and an “interested stockholder” (defined generally as any person who beneficially owns 10% or more of the voting power of our shares or an affiliate thereof) for five years after the most recent date on which the stockholder becomes an interested stockholder, and thereafter impose special appraisal rights and special stockholder voting requirements on these combinations; and
|
19
|
•
|
“control share” provisions that provide that “control shares” of our company (defined as shares which, when aggregated with other shares controlled by the stockholder, entitle the stockholder to exercise one of three increasing ranges of voting power in electing directors) acquired in a “control share acquisition” (defined as the direct or indirect acquisition of ownership or control of “control shares”) have no voting rights except to the extent approved by our stockholders by the affirmative vote of at least two-thirds of all the votes entitled to be cast on the matter, excluding all interested shares.
|
We have elected to opt out of these provisions of the MGCL, in the case of the business combination provisions of the MGCL, by resolution of our board of directors, and in the case of the control share provisions of the MGCL, pursuant to a provision in our bylaws. However, our board of directors may by resolution elect to repeal the foregoing opt-outs from the business combination provisions of the MGCL and we may, by amendment to our bylaws, opt in to the control share provisions of the MGCL in the future.
Our charter, bylaws, our Operating Partnership agreement and Maryland law also contain other provisions that may delay, defer or prevent a transaction or a change of control that might involve a premium price for our common stock or otherwise be in the best interest of our stockholders.
Under their employment agreements, certain of our executive officers will receive severance if they are terminated without cause or resign for good reason.
We have employment agreements with Jordan L. Kaplan, Kenneth M. Panzer and Kevin A. Crummy, which provide each executive with severance if they are terminated without cause or resign for good reason (including following a change of control), based on two or three times (depending on the officer) his annual total of salary, bonus and incentive compensation such as LTIP Units, options or outperformance grants. In addition, these executive officers would not be restricted from competing with us after their departure.
Our fiduciary duties as the sole stockholder of the general partner of our Operating Partnership could create conflicts of interest.
As the sole stockholder of the general partner of our Operating Partnership, we have fiduciary duties to the other limited partners in our Operating Partnership, the discharge of which may conflict with the interests of our stockholders. The limited partners of our Operating Partnership have agreed that, in the event of a conflict in the fiduciary duties owed by us to our stockholders and, in our capacity as general partner of our Operating Partnership, to such limited partners, we are under no obligation to give priority to the interests of such limited partners. The limited partners have the right to vote on certain amendments to the Operating Partnership agreement (which require approval by a majority in interest of the limited partners, including us) and individually to approve certain amendments that would adversely affect their rights. These voting rights may be exercised in a manner that conflicts with the interests of our stockholders. For example, we are unable to modify the rights of limited partners to receive distributions as set forth in the Operating Partnership agreement in a manner that adversely affects their rights without their consent, even though such modification might be in the best interest of our stockholders.
The loss of any of our executive officers or key senior personnel could significantly harm our business.
Our ability to maintain our competitive position is largely dependent on the skill and effort of our executive officers and key senior personnel, who have strong industry reputations, assist us in identifying acquisition and borrowing opportunities, having such opportunities brought to us, and negotiating with tenants and sellers of properties. If we lose the services of any of our executive officers or key senior personnel our business could be adversely affected.
Our board of directors may change significant corporate policies without stockholder approval.
Our investment, financing, borrowing, dividend, operating and other policies are determined by our board of directors. These policies may be amended or revised at any time and from time to time at the discretion of our board of directors without a vote of our stockholders. Our board of directors may change our policies with respect to conflicts of interest provided that such changes are consistent with applicable legal requirements.
20
Compensation awards to our management may not be tied to or correspond with improved financial results or the market price of our common stock.
The compensation committee of our board of directors is responsible for overseeing our compensation and incentive compensation plans. Our compensation committee has significant discretion in structuring compensation packages and may make compensation decisions based on any number of factors. Compensation awards may not be tied to or correspond with improved financial results or the market price of our common stock. See Note
12
to our consolidated financial statements in Item 15 of this Report for more information regarding our stock-based compensation.
If we fail to maintain an effective system of internal control over financial reporting, we may not be able to accurately report our financial results.
An effective system of internal control over financial reporting is necessary for us to provide reliable financial reports, prevent fraud and operate successfully as a public company. There can be no guarantee that our internal controls over financial reporting will be effective in accomplishing all control objectives all of the time. Deficiencies, including material weaknesses, in our internal control over financial reporting that may occur in the future could result in material misstatements in our financial reporting, which could result in restatements of our financial statements. Failure to maintain effective internal controls could cause us to not meet our reporting obligations, which could affect our ability to remain listed with the NYSE or result in SEC enforcement actions, and could cause investors to lose confidence in our reported financial information.
Litigation could have an adverse effect on our business.
From time to time, we are party to various lawsuits, claims and other legal proceedings that arise in the ordinary course of our business. An unfavorable resolution of litigation could adversely affect us. Even when there is a favorable outcome, litigation may result in substantial expenses and significantly divert the attention of our management with a similar adverse effect on us.
New accounting pronouncements could adversely affect our operating results or the reported financial performance of our tenants.
Accounting policies and methods are fundamental to how we record and report our financial condition and results of operations. Uncertainties posed by various initiatives of accounting standard-setting by the FASB and the SEC, which create and interpret applicable accounting standards for U.S. companies, may change the financial accounting and reporting standards or their interpretation and application of these standards that govern the preparation of our financial statements. Similarly, these changes could have a material impact on our tenants’ reported financial condition or results of operations, credit ratings and preferences regarding leasing real estate. See "New Accounting Pronouncements" in Note
2
to our consolidated financial statements in Item 15 of this Report.
Risks Related to Taxes and Our Status as a REIT
Prospective investors should consult with their tax advisors regarding the effects of recently enacted tax legislation and other legislative, regulatory and administrative developments.
On December 22, 2017, the Tax Cuts and Jobs Act (the “
TCJA
”) was signed into law. The TCJA makes major changes to the Code, including a number of provisions of the Code that affect the taxation of REITs and their stockholders. Among the changes made by the TCJA are permanently reducing the generally applicable corporate tax rate, generally reducing the tax rate applicable to individuals and other non-corporate taxpayers for tax years beginning after December 31, 2017 and before January 1, 2026, eliminating or modifying certain previously allowed deductions (including substantially limiting interest deductibility and, for individuals, the deduction for non-business state and local taxes), and, for taxable years beginning after December 31, 2017 and before January 1, 2026, providing for preferential rates of taxation through a deduction of up to 20% (subject to certain limitations) on most ordinary REIT dividends and certain trade or business income of non-corporate taxpayers. The TCJA also imposes new limitations on the deduction of net operating losses, which may result in us having to make additional taxable distributions to our stockholders in order to comply with REIT distribution requirements or avoid taxes on retained income and gains. The effect of the significant changes made by the TCJA are uncertain, and the IRS has issued only limited guidance to date, additional administrative guidance will be required in order to fully evaluate the effect of many provisions. The effect of any technical corrections with respect to the TCJA could have an adverse effect on us or our stockholders. Investors should consult their tax advisors regarding the implications of the TCJA on their investment in our common stock.
21
Failure to qualify as a REIT would result in higher taxes and reduced cash available for distributions.
We have elected to be taxed as a REIT under the Code, commencing with our initial taxable year ended December 31, 2006. To qualify as a REIT, we must satisfy on a continuing basis certain technical and complex income, asset, organizational, distribution, stockholder ownership and other requirements. See Item 1 "Business Overview" of this Report for more information regarding these tests. Our ability to satisfy these tests depends upon our analysis of and compliance with numerous factors, many of which are not subject to a precise determination and have only limited judicial and administrative interpretations, and which are not entirely within our control. Holding most of our assets through our Operating Partnership further complicates the application of the REIT requirements and a technical or inadvertent mistake could jeopardize our REIT status. Legislation, new regulations, administrative interpretations or court decisions could significantly change the tax laws with respect to the requirements for qualification as a REIT or the federal income tax consequences of qualification as a REIT. Although we believe that we will continue to qualify as a REIT, we can give no assurance that we have qualified or will continue to qualify as a REIT.
If we were to fail to qualify as a REIT in any taxable year, and certain relief provisions did not apply, we would be subject to federal income tax on our taxable income at regular corporate rates, and distributions to stockholders would not be deductible by us in computing our taxable income. Any such corporate tax liability could be substantial and would reduce the amount of cash available for distribution to our stockholders. Unless entitled to relief under certain Code provisions, we would also be disqualified from taxation as a REIT for the four taxable years following the year during which we ceased to qualify as a REIT. In addition, if we fail to qualify as a REIT, we would not be required to make distributions to stockholders, and all distributions to stockholders will be subject to tax as dividend income to the extent of our current and accumulated earnings and profits. If we fail to qualify as a REIT for federal income tax purposes and are able to avail ourselves of one or more of the relief provisions under the Code in order to maintain our REIT status, we would nevertheless be required to pay penalty taxes of $50,000 or more for each such failure.
As a result of the above factors, our failure to qualify as a REIT could impair our ability to raise capital and expand our business, substantially reduce distributions to stockholders, result in us incurring substantial indebtedness (to the extent borrowings are feasible) or liquidating substantial investments in order to pay the resulting taxes, and adversely affect the market price of our common stock. One of our Funds, and two of our consolidated JVs, also own properties through one or more entities which are intended to qualify as REITs, and we may in the future use other structures that include REITs. The failure of any such entities to qualify as a REIT could have similar consequences to the REIT subsidiary and could also cause us to fail to qualify as a REIT.
If the Operating Partnership, or any of its subsidiaries, were treated as a regular corporation for federal income tax purposes, we could cease to qualify as a REIT.
Although we believe that the Operating Partnership and other subsidiary partnerships, limited liability companies, REIT subsidiaries, QRS and other subsidiaries (other than the TRS) in which we own a direct or indirect interest will be treated for tax purposes as a partnership, disregarded entity (e.g., in the case of a 100% owned limited liability company), REIT or QRS, as applicable, no assurance can be given that the IRS will not successfully challenge the tax classification of any such entity, or that a court would not sustain such a challenge. If the IRS were successful in treating the Operating Partnership or other subsidiaries as entities taxable as a corporation (including a “publicly traded partnership” taxed as a corporation) for federal income tax purposes, we would likely fail to qualify as a REIT and it would significantly reduce the amount of cash available for distribution by such subsidiaries to us.
22
Even if we qualify as a REIT, we will be required to pay some taxes which would reduce cash available for distributions.
Even if we qualify as a REIT for federal income tax purposes, we will be required to pay certain federal, state and local taxes on our income and property. For example, we will be subject to income tax to the extent that we distribute less than 100% of our REIT taxable income (including capital gains). In addition, any net taxable income earned directly by our TRS, or through entities that are disregarded for federal income tax purposes as entities separate from our TRS, will be subject to federal and possibly state corporate income tax. We have elected to treat several subsidiaries as TRSs, and we may elect to treat other subsidiaries as TRSs in the future. In this regard, several provisions of the laws applicable to REITs and their subsidiaries ensure that a TRS will be subject to an appropriate level of federal income taxation. For example, for taxable years prior to 2018, a TRS is limited in its ability to deduct interest payments made to an affiliated REIT. In addition, the REIT has to pay a 100% tax on some payments that it receives or on some deductions taken by its TRS if the economic arrangements between the REIT, the REIT’s tenants, and the TRS are not comparable to similar arrangements between unrelated parties. In addition, some state and local jurisdictions may tax some of our income even though as a REIT we are not subject to federal income tax on that income because not all states and localities treat REITs the same as they are treated for federal income tax purposes. Moreover, if we have net income from “prohibited transactions,” that income will be subject to a 100% tax. In general, prohibited transactions are sales or other dispositions of property held primarily for sale to customers in the ordinary course of business. Although we do not intend to hold any properties that would be characterized as held primarily for sale to customers in the ordinary course of our business, such characterization is a factual determination and we cannot guarantee that the IRS would agree with our characterization of our properties. To the extent that we are required to pay federal, state and local taxes, we will have less cash available for distributions to our stockholders.
REIT distribution requirements could adversely affect our liquidity and cause us to forego otherwise attractive opportunities.
To qualify as a REIT, we generally must distribute annually at least 90% of our REIT taxable income, excluding any net capital gains. To the extent that we do not distribute all of our net long-term capital gains or at least 90% of our REIT taxable income, we will be required to pay tax thereon at regular corporate tax rates. We intend to make distributions to our stockholders to comply with the Code requirements for REITs and to minimize or eliminate our corporate income tax obligation. Certain types of assets generate substantial mismatches between taxable income and available cash. Such assets include rental real estate that has been financed through financing structures which require some or all of available cash flows to be used to service borrowings. As a result, the requirement to distribute a substantial portion of our taxable income could cause us to sell assets in adverse market conditions, borrow on unfavorable terms, distribute amounts that could otherwise be used to fund our operations, capital expenditures, acquisitions or repayment of debt, or cause us to forego otherwise attractive opportunities.
Dividends payable by REITs do not qualify for the reduced tax rates available for some dividends.
The maximum federal tax rate (not including the Medicare Contribution Tax on unearned income) applicable to income from “qualified dividends” payable to U.S. stockholders that are individuals, trusts and estates is 20%. Dividends payable by REITs, however, generally are not eligible for the 20% rate. However, under the TCJA, for taxable years beginning after December 31, 2017 and before January 1, 2026, individuals, trusts, and estates generally may deduct up to 20% of ordinary REIT dividends. Although these rules do not adversely affect the taxation of REITs or dividends payable by REITs, investors who are individuals, trusts and estates may perceive investments in REITs to be relatively less attractive than investments in the stocks of non-REIT corporations that pay dividends.
REIT stockholders can receive taxable income without cash distributions
.
Under certain circumstances, REITs are permitted to pay required dividends in shares of their stock rather than in cash. If we were to avail ourselves of that option, our stockholders could be required to pay taxes on such stock distributions without the benefit of cash distributions to pay the resulting taxes.
Legislative or other actions affecting REITs could have a negative effect on our investors or us, including our ability to maintain our qualification as a REIT or the federal income tax consequences of such qualification.
Federal income tax laws are constantly under review by persons involved in the legislative process, the IRS and the U.S. Department of the Treasury. Changes to the laws could adversely affect us and our investors. New legislation, Treasury Regulations, administrative interpretations or court decisions could significantly and negatively affect our ability to qualify as a REIT, the federal income tax consequences of such qualification, or the federal income tax consequences of an investment in us. Changes to laws relating to the tax treatment of other entities, or an investment in other entities, could make an investment in such other entities more attractive relative to an investment in a REIT.
23
Non-U.S. investors may be subject to FIRPTA, which would impose tax on certain distributions and on the sale of common stock if we are unable to qualify as a “domestically controlled” REIT or if our stock is not considered to be regularly traded on an established securities market.
A non-U.S. investor disposing of a U.S. real property interest, including shares of a U.S. corporation whose assets consist principally of U.S. real property interests or USRPIs is generally subject to a tax, known as FIRPTA tax, on the gain recognized on the disposition. Such FIRPTA tax does not apply, however, to the disposition of stock in a REIT if the REIT is a “domestically controlled qualified investment entity.” A domestically controlled qualified investment entity includes a REIT in which, at all times during a specified testing period, less than 50% of the value of its shares is held directly or indirectly by non-U.S. holders. In the event that we do not constitute a domestically controlled qualified investment entity, a non-U.S. investor’s sale of our common stock nonetheless will generally not be subject to tax under FIRPTA as a sale of a USRPI, provided that (1) the stock owned is of a class that is “regularly traded” as defined by applicable Treasury regulations, on an established securities market, and (2) the selling non-U.S. investor held 10% or less of our outstanding common stock at all times during a specified testing period. If we were to fail to so qualify as a domestically controlled qualified investment entity and our common stock were to fail to be “regularly traded,” a gain realized by a non-U.S. investor on a sale of our common stock would be subject to FIRPTA tax and applicable withholding. No assurance can be given that we will be a domestically controlled qualified investment entity. Additionally, any distributions we make to our non-U.S. stockholders that are attributable to gain from the sale of any USRPI will also generally be subject to FIRPTA tax and applicable withholdings, unless the recipient non-U.S. stockholder has not owned more than 10% of our common stock at any time during the year preceding the distribution and our common stock is treated as being “regularly traded”.
Item 1B. Unresolved Staff Comments
None.
24
Item 2. Properties
We present property level data for our Total Portfolio, except that we present historical capital expenditures for our Consolidated Portfolio.
Office Portfolio Summary as of
December 31, 2018
|
Submarket
|
Number of Properties
|
Rentable Square
Feet
|
Submarket Rentable Square Feet
(1)
|
Our Market Share in Submarket
(2)
|
|||||||
|
Brentwood
|
15
|
|
2,068,190
|
|
3,328,102
|
62.1
|
%
|
||||
|
Sherman Oaks/Encino
|
12
|
|
3,486,941
|
|
6,528,253
|
53.4
|
|
||||
|
Westwood
|
6
|
|
2,133,881
|
|
4,211,981
|
50.7
|
|
||||
|
Warner Center/Woodland Hills
|
3
|
|
2,830,996
|
|
7,667,855
|
36.9
|
|
||||
|
Honolulu
|
4
|
|
1,763,845
|
|
5,088,599
|
34.7
|
|
||||
|
Olympic Corridor
|
5
|
|
1,141,560
|
|
3,458,794
|
33.0
|
|
||||
|
Beverly Hills
(3)
|
11
|
|
2,194,631
|
|
7,089,250
|
27.9
|
|
||||
|
Santa Monica
|
11
|
|
1,427,671
|
|
9,861,775
|
14.5
|
|
||||
|
Century City
|
3
|
|
951,534
|
|
10,148,454
|
9.4
|
|
||||
|
Burbank
|
1
|
|
456,205
|
|
7,060,975
|
6.5
|
|
||||
|
Total / Weighted Average
(4)
|
71
|
|
18,455,454
|
|
64,444,038
|
39.1
|
%
|
||||
____________________________________________________
|
(1)
|
Source is the
2018
fourth
quarter CBRE Marketview report.
|
|
(2)
|
Calculated by dividing Rentable Square Feet by the applicable Submarket Rentable Square Feet.
|
|
(3)
|
Includes a
216,000
square foot property located just outside the Beverly Hills city limits. To calculate our percentage of the submarket, the property is not included in the numerator or the denominator for consistency with third party data.
|
|
(4)
|
The average of our market share in all submarkets is weighted based on the square feet of exposure in our total portfolio to each submarket.
|
Office Portfolio Percentage Leased and In-place Rents as of
December 31, 2018
|
Submarket
|
Percent Leased
(1)
|
Annualized Rent
(2)
|
Annualized Rent Per Leased Square Foot
(2)
|
||||||||
|
Beverly Hills
|
96.0
|
%
|
$
|
103,654,116
|
|
$
|
51.00
|
|
|||
|
Brentwood
|
91.0
|
|
79,619,517
|
|
44.20
|
|
|||||
|
Burbank
|
100.0
|
|
22,515,408
|
|
49.35
|
|
|||||
|
Century City
|
93.3
|
|
39,841,715
|
|
47.88
|
|
|||||
|
Honolulu
|
87.9
|
|
49,535,063
|
|
33.70
|
|
|||||
|
Olympic Corridor
|
91.5
|
|
38,478,427
|
|
38.62
|
|
|||||
|
Santa Monica
|
93.4
|
|
90,462,372
|
|
71.22
|
|
|||||
|
Sherman Oaks/Encino
|
92.4
|
|
114,073,086
|
|
36.70
|
|
|||||
|
Warner Center/Woodland Hills
|
87.2
|
|
69,732,752
|
|
29.22
|
|
|||||
|
Westwood
|
92.5
|
|
92,882,126
|
|
49.02
|
|
|||||
|
Total / Weighted Average
|
91.7
|
%
|
$
|
700,794,582
|
|
$
|
43.13
|
|
|||
______________________________________________________
(1) Includes
258,614
square feet with respect to signed leases not yet commenced at
December 31, 2018
.
(2) Excludes signed leases not yet commenced at
December 31, 2018
.
25
Office Lease Diversification as of
December 31, 2018
|
Portfolio Tenant Size
|
|||
|
Median
|
Average
|
||
|
Square feet
|
2,600
|
5,500
|
|
|
Office Leases
|
Rentable Square Feet
|
Annualized Rent
|
|||||||||||||||||
|
Square Feet Under Lease
|
Number
|
Percent
|
Amount
|
Percent
|
Amount
|
Percent
|
|||||||||||||
|
2,500 or less
|
1,451
|
|
49.2
|
%
|
1,996,030
|
|
12.3
|
%
|
$
|
84,709,765
|
|
12.1
|
%
|
||||||
|
2,501-10,000
|
1,123
|
|
38.1
|
|
5,492,073
|
|
33.8
|
|
232,835,025
|
|
33.2
|
|
|||||||
|
10,001-20,000
|
237
|
|
8.0
|
|
3,267,485
|
|
20.1
|
|
137,477,094
|
|
19.6
|
|
|||||||
|
20,001-40,000
|
103
|
|
3.5
|
|
2,820,838
|
|
17.4
|
|
118,613,578
|
|
16.9
|
|
|||||||
|
40,001-100,000
|
32
|
|
1.1
|
|
1,770,591
|
|
10.9
|
|
85,517,687
|
|
12.2
|
|
|||||||
|
Greater than 100,000
|
4
|
|
0.1
|
|
901,051
|
|
5.5
|
|
41,641,433
|
|
6.0
|
|
|||||||
|
Total for all leases
|
2,950
|
|
100.0
|
%
|
16,248,068
|
|
100.0
|
%
|
$
|
700,794,582
|
|
100.0
|
%
|
||||||
Largest Office Tenants as of
December 31, 2018
The table below presents tenants paying 1% or more of our aggregate Annualized Rent:
|
Tenant
|
Number of Leases
|
Number of Properties
|
Lease Expiration
(1)
|
Total Leased Square Feet
|
Percent of Rentable Square Feet
|
Annualized Rent
|
Percent of Annualized Rent
|
||||||||||||||
|
Time Warner
(2)
|
3
|
|
3
|
|
2020-2024
|
468,775
|
|
2.5
|
%
|
$
|
22,953,657
|
|
3.2
|
%
|
|||||||
|
UCLA
(3)
|
25
|
|
10
|
|
2019-2027
|
319,161
|
|
1.7
|
|
15,691,388
|
|
2.2
|
|
||||||||
|
William Morris Endeavor
(4)
|
2
|
|
1
|
|
2027
|
205,313
|
|
1.1
|
|
11,671,698
|
|
1.7
|
|
||||||||
|
Morgan Stanley
(5)
|
5
|
|
5
|
|
2022-2027
|
145,488
|
|
0.8
|
|
9,007,837
|
|
1.3
|
|
||||||||
|
Equinox Fitness
(6)
|
5
|
|
5
|
|
2020-2033
|
180,087
|
|
1.0
|
|
7,426,266
|
|
1.1
|
|
||||||||
|
Total
|
40
|
|
24
|
|
1,318,824
|
|
7.1
|
%
|
$
|
66,750,846
|
|
9.5
|
%
|
||||||||
______________________________________________________
|
(1)
|
Expiration dates are per lease (expiration dates do not reflect storage and similar leases).
|
|
(2)
|
Square footage expires as follows: 2,000 square feet in 2020, 11,000 square feet in 2021, and 456,000 square feet in 2024.
|
|
(3)
|
Square footage expires as follows: 6,400 square feet in 2019, 46,000 square feet in 2020, 68,000 square feet in 2021, 55,000 square feet in 2022, 40,000 square feet in 2023, 36,000 square feet in and 2024, 67,000 square feet in 2027. Tenant has options to terminate 31,000 square feet in 2020, 15,000 square feet in 2023, and 51,000 square feet in 2025.
|
|
(4)
|
Tenant has an option to terminate 2,000 square feet in 2020 and 202,000 square feet in 2022.
|
|
(5)
|
Square footage expires as follows: 15,000 square feet in 2022, 30,000 square feet in 2023, 26,000 square feet in 2025, and 74,000 square feet in 2027. Tenant has options to terminate 30,000 square feet in 2021, and 26,000 square feet in 2022.
|
|
(6)
|
Square footage expires as follows: 42,000 square feet in 2020, 33,000 square feet in 2024, 31,000 square feet in 2027, 44,000 square feet in 2028, and 30,000 square feet in 2033.
|
26
Office Industry Diversification as of
December 31, 2018
|
Industry
|
Number of Leases
|
Annualized Rent as a Percent of Total
|
|||
|
Legal
|
577
|
18.0
|
%
|
||
|
Financial Services
|
393
|
14.9
|
|
||
|
Entertainment
|
212
|
13.1
|
|
||
|
Real Estate
|
293
|
11.2
|
|
||
|
Accounting & Consulting
|
363
|
10.2
|
|
||
|
Health Services
|
374
|
7.6
|
|
||
|
Retail
|
194
|
5.9
|
|
||
|
Technology
|
130
|
5.1
|
|
||
|
Insurance
|
103
|
4.1
|
|
||
|
Educational Services
|
57
|
3.7
|
|
||
|
Public Administration
|
93
|
2.3
|
|
||
|
Advertising
|
59
|
1.6
|
|
||
|
Manufacturing & Distribution
|
55
|
1.2
|
|
||
|
Other
|
47
|
1.1
|
|
||
|
Total
|
2,950
|
100.0
|
%
|
||
Office Lease Expirations as of
December 31, 2018
(
assuming non-exercise of renewal options and early termination rights)
|
Year of Lease Expiration
|
Number of
Leases |
Rentable
Square Feet |
Expiring
Square Feet as a Percent of Total |
Annualized Rent at December 31, 2018
|
Annualized
Rent as a Percent of Total |
Annualized
Rent Per Leased Square Foot (1) |
Annualized
Rent Per Leased Square Foot at Expiration (2) |
||||||||||||||||
|
Short Term Leases
|
79
|
|
366,917
|
|
2.0
|
%
|
$
|
13,869,946
|
|
2.0
|
%
|
$
|
37.80
|
|
$
|
37.91
|
|
||||||
|
2019
|
520
|
|
1,708,218
|
|
9.3
|
|
67,811,719
|
|
9.7
|
|
39.70
|
|
40.28
|
|
|||||||||
|
2020
|
644
|
|
2,758,179
|
|
14.9
|
|
113,778,026
|
|
16.2
|
|
41.25
|
|
42.98
|
|
|||||||||
|
2021
|
552
|
|
2,627,560
|
|
14.2
|
|
110,020,206
|
|
15.7
|
|
41.87
|
|
45.00
|
|
|||||||||
|
2022
|
394
|
|
2,051,850
|
|
11.1
|
|
86,049,872
|
|
12.3
|
|
41.94
|
|
46.79
|
|
|||||||||
|
2023
|
324
|
|
2,183,740
|
|
11.8
|
|
97,933,949
|
|
14.0
|
|
44.85
|
|
51.77
|
|
|||||||||
|
2024
|
178
|
|
1,786,529
|
|
9.7
|
|
79,835,721
|
|
11.4
|
|
44.69
|
|
54.86
|
|
|||||||||
|
2025
|
108
|
|
868,826
|
|
4.7
|
|
40,122,752
|
|
5.7
|
|
46.18
|
|
57.40
|
|
|||||||||
|
2026
|
47
|
|
530,434
|
|
2.9
|
|
24,766,078
|
|
3.5
|
|
46.69
|
|
59.14
|
|
|||||||||
|
2027
|
56
|
|
874,683
|
|
4.7
|
|
41,912,643
|
|
6.0
|
|
47.92
|
|
61.92
|
|
|||||||||
|
2028
|
37
|
|
346,330
|
|
1.9
|
|
18,312,269
|
|
2.6
|
|
52.88
|
|
71.11
|
|
|||||||||
|
Thereafter
|
11
|
|
144,802
|
|
0.8
|
|
6,381,401
|
|
0.9
|
|
44.07
|
|
64.72
|
|
|||||||||
|
Subtotal
|
2,950
|
|
16,248,068
|
|
88.0
|
%
|
$
|
700,794,582
|
|
100.0
|
%
|
43.13
|
|
48.99
|
|
||||||||
|
Signed leases not commenced
|
258,614
|
|
1.4
|
|
|||||||||||||||||||
|
Available
|
1,530,903
|
|
8.3
|
|
|||||||||||||||||||
|
Building management use
|
129,323
|
|
0.7
|
|
|||||||||||||||||||
|
BOMA adjustment
(3)
|
288,546
|
|
1.6
|
|
|||||||||||||||||||
|
Total/Weighted Average
|
2,950
|
|
18,455,454
|
|
100.0
|
%
|
$
|
700,794,582
|
|
100.0
|
%
|
$
|
43.13
|
|
$
|
48.99
|
|
||||||
_____________________________________________________
|
(1)
|
Represents annualized rent at
December 31, 2018
divided by leased square feet.
|
|
(2)
|
Represents annualized rent at expiration divided by leased square feet.
|
|
(3)
|
Represents the square footage adjustments for leases that do not reflect BOMA remeasurement.
|
27
Historical Office Tenant Improvements and Leasing Commissions
|
|
Year Ended December 31,
|
||||||||||
|
|
2018
|
2017
|
2016
|
||||||||
|
Renewals
|
|
|
|
||||||||
|
Number of leases
|
467
|
|
482
|
|
419
|
|
|||||
|
Square feet
|
2,420,185
|
|
2,213,716
|
|
1,687,430
|
|
|||||
|
Tenant improvement costs per square foot
(1)
|
$
|
9.22
|
|
$
|
11.47
|
|
$
|
13.49
|
|
||
|
Leasing commission costs per square foot
(1)
|
10.15
|
|
7.77
|
|
7.75
|
|
|||||
|
Total costs per square foot
(1)
|
$
|
19.37
|
|
$
|
19.24
|
|
$
|
21.24
|
|
||
|
New leases
|
|
|
|
|
|
|
|||||
|
Number of leases
|
332
|
|
337
|
|
307
|
|
|||||
|
Square feet
|
1,195,118
|
|
1,189,808
|
|
1,100,800
|
|
|||||
|
Tenant improvement costs per square foot
(1)
|
$
|
24.63
|
|
$
|
28.22
|
|
$
|
26.52
|
|
||
|
Leasing commission costs per square foot
(1)
|
9.30
|
|
12.26
|
|
10.34
|
|
|||||
|
Total costs per square foot
(1)
|
$
|
33.93
|
|
$
|
40.48
|
|
$
|
36.86
|
|
||
|
Total
|
|
|
|
|
|
|
|||||
|
Number of leases
|
799
|
|
819
|
|
726
|
|
|||||
|
Square feet
|
3,615,303
|
|
3,403,524
|
|
2,788,230
|
|
|||||
|
Tenant improvement costs per square foot
(1)
|
$
|
14.31
|
|
$
|
17.32
|
|
$
|
18.63
|
|
||
|
Leasing commission costs per square foot
(1)
|
9.87
|
|
9.34
|
|
8.77
|
|
|||||
|
Total costs per square foot
(1)
|
$
|
24.18
|
|
$
|
26.66
|
|
$
|
27.41
|
|
||
______________________________________________________
|
(1)
|
Tenant improvements and leasing commissions are reported in the period in which the lease is signed. Tenant improvements are based on signed leases, or, for leases in which a tenant improvement allowance was not specified, the amount budgeted at the time the lease commenced.
|
Multifamily Portfolio as of
December 31, 2018
|
Submarket
|
Number of Properties
|
Number of Units
|
Units as a
Percent of Total |
||||||
|
Brentwood
|
5
|
|
950
|
|
26
|
%
|
|||
|
Honolulu
(1)
|
3
|
|
1,825
|
|
51
|
|
|||
|
Santa Monica
|
2
|
|
820
|
|
23
|
|
|||
|
Total
|
10
|
|
3,595
|
|
100
|
%
|
|||
|
Submarket
|
Percent Leased
|
Annualized Rent
(2)
|
Monthly Rent per Leased Unit
|
||||||||
|
Brentwood
|
99.6
|
%
|
$
|
31,529,304
|
|
$
|
2,777
|
|
|||
|
Honolulu
(1)
|
98.5
|
|
39,729,672
|
|
1,849
|
|
|||||
|
Santa Monica
|
99.3
|
|
29,582,376
|
|
3,032
|
|
|||||
|
Total / Weighted Average
|
99.0
|
%
|
$
|
100,841,352
|
|
$
|
2,367
|
|
|||
_______________________________________________________
|
(1)
|
Includes newly developed units just made available for rent.
|
|
(2)
|
The multifamily portfolio also includes
10,495
square feet of ancillary retail space generating annualized rent of
$397,190
, which is not included in multifamily annualized rent.
|
28
Historical Office Recurring Capital Expenditures
(consolidated office portfolio)
|
|
Year Ended December 31,
|
||||||||||
|
2018
|
2017
|
2016
|
|||||||||
|
Recurring capital expenditures
(1)
|
$
|
3,684,483
|
|
$
|
3,537,175
|
|
$
|
3,061,304
|
|
||
|
Total square feet
(1)
|
13,784,509
|
|
13,700,370
|
|
13,011,771
|
|
|||||
|
Recurring capital expenditures per square foot
(1)
|
$
|
0.27
|
|
$
|
0.26
|
|
$
|
0.24
|
|
||
____________________________________________________
|
(1)
|
For
2018
and
2017
, we excluded
ten
properties with an aggregate
2.8 million
square feet, and for
2016
, we excluded
nine
properties with an aggregate
2.9 million
square feet.
|
Historical Multifamily Recurring Capital Expenditures
|
|
Year Ended December 31,
|
||||||||||
|
2018
|
2017
|
2016
|
|||||||||
|
Recurring capital expenditures
(1)(2)
|
$
|
2,564,003
|
|
$
|
1,693,466
|
|
$
|
1,563,445
|
|
||
|
Total units
(1)(2)
|
3,324
|
|
3,380
|
|
3,320
|
|
|||||
|
Recurring capital expenditures per unit
(1)
|
$
|
772
|
|
$
|
507
|
|
$
|
469
|
|
||
____________________________________________________
|
(1)
|
Recurring capital expenditures are costs associated with the turnover of units. Our multifamily portfolio includes a large number of units that, due to Santa Monica rent control laws, have had only modest rent increases since 1979. During 2018, when a tenant vacated one of these units, we incurred on average $44 thousand per unit to bring the unit up to our standards. We classify these capital expenditures as non-recurring.
|
|
(2)
|
Excludes new development units.
|
Item 3. Legal Proceedings
From time to time, we are party to various lawsuits, claims and other legal proceedings that arise in the ordinary course of our business. Excluding ordinary, routine litigation incidental to our business, we are not currently a party to any legal proceedings that we believe would reasonably be expected to have a materially adverse effect on our business, financial condition or results of operations.
Item 4. Mine Safety Disclosures
None.
29
PART II
Item 5. Market for Registrant’s Common Equity, Related Stockholder Matters and Issuer Purchases of Equity Securities
Market for Common Stock; Dividends
Our common stock is traded on the NYSE under the symbol “DEI”. On
December 31, 2018
, the closing price of our common stock was
$34.13
. The table below presents the dividends declared for our common stock as reported by the NYSE:
|
|
First Quarter
|
Second Quarter
|
Third Quarter
|
Fourth Quarter
|
||||||||||||
|
2018
|
|
|
|
|
||||||||||||
|
Dividend declared
|
$
|
0.25
|
|
$
|
0.25
|
|
$
|
0.25
|
|
$
|
0.26
|
|
||||
|
2017
|
|
|
|
|
|
|
|
|
||||||||
|
Dividend declared
|
$
|
0.23
|
|
$
|
0.23
|
|
$
|
0.23
|
|
$
|
0.25
|
|
||||
Holders of Record
We had
15
holders of record of our common stock on
February 8, 2019
. Many of the shares of our common stock are held in “street” name and accordingly, the number of beneficial owners of such shares is not known or included in the foregoing number.
Sales of Unregistered Securities
On
December 20, 2017
, in connection with the purchase of an office property located at 9401 Wilshire Boulevard, Beverly Hills, California, our Operating Partnership issued
$2.6 million
OP Units valued at
$105.7 million
to the seller of the office property, as partial consideration for the purchase. Each OP Unit can be exchanged into one share of our common stock (or its cash equivalent at our option). This issuance did not involve underwriters, underwriter discounts or commissions or any public offering. We believe that the issuance of OP Units is exempt from the registration requirements of the Securities Act under Rule 506 of Regulation D promulgated under the Securities Act and Section 4(2) of the Securities Act as a transaction by an issuer not involving any public offering. There was no advertising, general promotion or other marketing undertaken in connection with the issuance. The investor represented and warranted that (i) it acquired the OP Units for investment purposes only and not for the purpose of further distribution; (ii) it had sufficient knowledge and experience in financial and business matters and the ability to bear the economic risk of its investment, and (iii) that the OP Units were taken for investment purposes and not with a view to resale in violation of applicable securities laws.
Repurchases of Equity Securities
None.
30
Performance Graph
The information below shall not be deemed to be “soliciting material” or to be “filed” with the SEC or subject to Regulation 14A or 14C, other than as provided in Item 201 of Regulation S-K, or to the liabilities of Section 18 of the Exchange Act, except to the extent we specifically request that such information be treated as soliciting material or specifically incorporate it by reference into a filing under the Securities Act or the Exchange Act.
The graph below compares the cumulative total return on our common stock from
December 31, 2013
to
December 31, 2018
to the cumulative total return of the S&P 500, NAREIT Equity and an appropriate “peer group” index (assuming a $100 investment in our common stock and in each of the indexes on
December 31, 2013
, and that all dividends were reinvested into additional shares of common stock at the frequency with which dividends are paid on the common stock during the applicable fiscal year). The total return performance presented in this graph is not necessarily indicative of, and is not intended to suggest, the total future return performance.
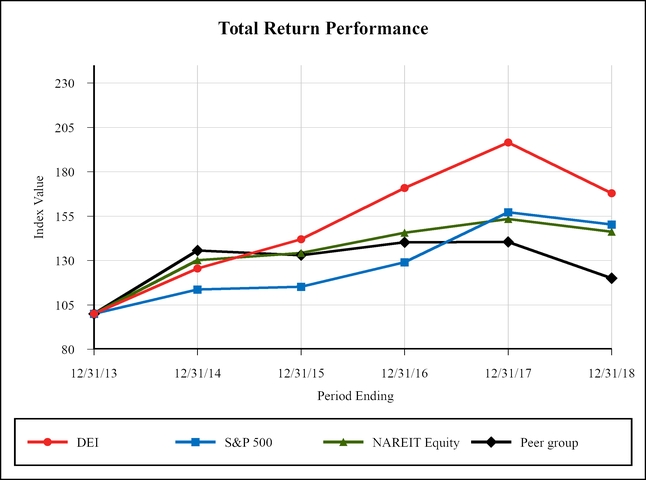
|
|
Period Ending
|
|||||||||||||||||||
|
Index
|
12/31/13
|
12/31/14
|
12/31/15
|
12/31/16
|
12/31/17
|
12/31/18
|
||||||||||||||
|
DEI
|
100.00
|
|
125.59
|
|
141.97
|
|
170.85
|
|
196.54
|
|
167.91
|
|
||||||||
|
S&P 500
|
100.00
|
|
113.69
|
|
115.26
|
|
129.05
|
|
157.22
|
|
150.33
|
|
||||||||
|
NAREIT Equity
(1)
|
100.00
|
|
130.14
|
|
134.30
|
|
145.74
|
|
153.36
|
|
146.27
|
|
||||||||
|
Peer group
(2)
|
100.00
|
|
135.67
|
|
133.05
|
|
140.31
|
|
140.49
|
|
120.04
|
|
||||||||
|
(1)
|
FTSE NAREIT Equity REITs index.
|
|
(2)
|
Consists of Boston Properties, Inc. (BXP), Kilroy Realty Corporation (KRC), SL Green Realty Corp. (SLG), Vornado Trust (VNO) and Hudson Pacific Properties, Inc (HPP).
|
31
Item 6. Selected Financial Data
The table below presents selected consolidated financial and operating data and should be read in conjunction with “Management’s Discussion and Analysis of Financial Condition and Results of Operations” and our financial statements included in Items 7 and 15 in this Report, respectively.
|
|
Year Ended December 31,
|
||||||||||||||||||
|
|
2018
|
2017
|
2016
|
2015
|
2014
|
||||||||||||||
|
Consolidated Statements of Operations Data
(In thousands):
|
|
|
|
|
|
||||||||||||||
|
Total office revenues
|
$
|
777,931
|
|
$
|
715,546
|
|
$
|
645,633
|
|
$
|
540,975
|
|
$
|
519,405
|
|
||||
|
Total multifamily revenues
|
$
|
103,385
|
|
$
|
96,506
|
|
$
|
96,918
|
|
$
|
94,799
|
|
$
|
80,117
|
|
||||
|
Total revenues
|
$
|
881,316
|
|
$
|
812,052
|
|
$
|
742,551
|
|
$
|
635,774
|
|
$
|
599,522
|
|
||||
|
Operating income
|
$
|
251,944
|
|
$
|
241,023
|
|
$
|
220,817
|
|
$
|
189,527
|
|
$
|
167,854
|
|
||||
|
Net income attributable to common stockholders
|
$
|
116,086
|
|
$
|
94,443
|
|
$
|
85,397
|
|
$
|
58,384
|
|
$
|
44,621
|
|
||||
|
Per Share Data:
|
|
|
|
|
|
|
|
|
|
|
|||||||||
|
Net income attributable to common stockholders per share - basic
|
$
|
0.68
|
|
$
|
0.58
|
|
$
|
0.57
|
|
$
|
0.40
|
|
$
|
0.31
|
|
||||
|
Net income attributable to common stockholders per share - diluted
|
$
|
0.68
|
|
$
|
0.58
|
|
$
|
0.55
|
|
$
|
0.39
|
|
$
|
0.30
|
|
||||
|
Weighted average common shares outstanding (in thousands):
|
|
|
|
|
|
|
|
|
|
|
|||||||||
|
Basic
|
169,893
|
|
160,905
|
|
149,299
|
|
146,089
|
|
144,013
|
|
|||||||||
|
Diluted
|
169,902
|
|
161,230
|
|
153,190
|
|
150,604
|
|
148,121
|
|
|||||||||
|
Dividends declared per common share
|
$
|
1.01
|
|
$
|
0.94
|
|
$
|
0.89
|
|
$
|
0.85
|
|
$
|
0.81
|
|
||||
|
|
As of December 31,
|
||||||||||||||||||
|
|
2018
|
2017
|
2016
|
2015
|
2014
|
||||||||||||||
|
Balance Sheet Data (In thousands):
|
|
|
|
|
|
|
|
|
|
|
|||||||||
|
Total assets
|
$
|
8,261,709
|
|
$
|
8,292,641
|
|
$
|
7,613,705
|
|
$
|
6,066,161
|
|
$
|
5,938,973
|
|
||||
|
Secured notes payable and revolving credit facility, net
|
$
|
4,134,030
|
|
$
|
4,117,390
|
|
$
|
4,369,537
|
|
$
|
3,611,276
|
|
$
|
3,419,667
|
|
||||
|
Property Data:
|
|
|
|
|
|
|
|
|
|
|
|||||||||
|
Number of consolidated properties
(1)
|
73
|
|
73
|
|
69
|
|
64
|
|
63
|
|
|||||||||
_________________________________________________________
|
(1)
|
All properties are wholly-owned by our Operating Partnership, except for
ten
office properties owned by our consolidated JVs. The consolidated properties do not include the
eight
properties owned by our unconsolidated Funds.
|
32
Item 7. Management’s Discussion and Analysis of Financial Condition and Results of Operations
The following discussion should be read in conjunction with our consolidated financial statements and related notes in Part IV,
Item 15
of this Report. Our results of operations for the years ended
December 31, 2018
,
2017
and
2016
were affected by property acquisitions and dispositions - see Note
3
to our consolidated financial statements in
Item 15
of this Report.
Business Description
Douglas Emmett, Inc. is a fully integrated, self-administered and self-managed REIT. Through our interest in our Operating Partnership and its subsidiaries, our consolidated JVs and our unconsolidated Funds, we are one of the largest owners and operators of high-quality office and multifamily properties in Los Angeles County, California and in Honolulu, Hawaii. We focus on owning, acquiring, developing and managing a substantial share of top-tier office properties and premier multifamily communities in neighborhoods that possess significant supply constraints, high-end executive housing and key lifestyle amenities. As of
December 31, 2018
, our portfolio consisted of the following:
|
|
Consolidated Portfolio
(1)
|
Total Portfolio
(2)
|
|||
|
Office
|
|||||
|
Class A Properties
(3)
|
63
|
71
|
|||
|
Rentable Square Feet (in thousands)
|
16,617
|
18,455
|
|||
|
Leased rate
|
91.9%
|
91.7%
|
|||
|
Occupied rate
|
90.4%
|
90.3%
|
|||
|
Multifamily
|
|||||
|
Properties
(3)
|
10
|
10
|
|||
|
Units
|
3,595
|
3,595
|
|||
|
Leased rate
|
99.0%
|
99.0%
|
|||
|
Occupied rate
|
97.0%
|
97.0%
|
|||
__________________________________________________
|
(1)
|
Our Consolidated Portfolio includes the properties in our consolidated results. Through our subsidiaries, we own 100% of these properties except for
ten
office properties totaling
2.8 million
square feet, which we own through
three
consolidated JVs. Our Consolidated Portfolio also includes
two
parcels of land from which we receive ground rent from ground leases to the owners of a Class A office building and a hotel.
|
|
(2)
|
Our Total Portfolio includes our Consolidated Portfolio as well as
eight
properties totaling
1.8 million
square feet owned by our unconsolidated Funds. See Note
5
to our consolidated financial statements in
Item 15
of this Report for more information about our unconsolidated Funds.
|
|
(3)
|
Our office and multifamily portfolios include ancillary retail space.
|
Annualized rent
As of
December 31, 2018
, annualized rent from our Consolidated Portfolio was derived as follows:
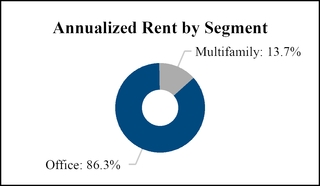 ______
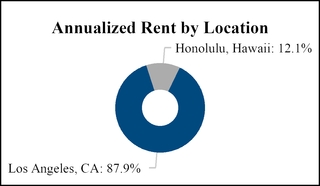
33
Financings, Developments and Repositionings
Financings
In February 2018, we borrowed
335 million
under a secured, non-recourse interest-only loan maturing in
March 2025
. The loan bears interest at
LIBOR + 1.30%
, which was effectively fixed at
3.84%
for five years through interest rate swaps. The loan is secured by a wholly-owned office property. We used the proceeds from the loan and our credit line to pay off two loans totaling $426 million which were scheduled to mature in 2019. See Note
7
to our consolidated financial statements in
Item 15
of this Report for more information regarding our debt.
Developments
|
•
|
In West Los Angeles, we are building a
34
story high-rise apartment building with
376
apartments. The tower is being built on a site that is directly adjacent to our existing office building and a
712
unit residential property that we own. We expect the cost of the development to be approximately
$180.0 million
to
$200.0 million
, which does not include the cost of the land which we have owned since
1997
. As part of the project, we are investing additional capital to build a one acre park on Wilshire Boulevard that will be available to the public and provide a valuable amenity to our surrounding properties and community. We expect construction to take about
3
years.
|
|
•
|
At our Moanalua Hillside Apartments in Honolulu, as of the date of this Report, we completed the construction of an additional
491
new apartments in addition to our existing
680
apartments. We also invested additional capital to upgrade the existing buildings, improve the parking and landscaping, built a new leasing and management office, and constructed a new fitness center and two pools.
|
|
•
|
In downtown Honolulu, we are converting a
25
story,
490 thousand
square foot office tower into approximately
500
rental apartments. We expect the conversion to occur in phases over a number of years as the office space is vacated. We currently estimate the construction costs to be approximately
$80.0 million
to
$110.0 million
, although the inherent uncertainties of development are compounded by the multi-year and phased nature of the conversion. Assuming timely approvals, we expect the first units to be delivered in 2020. This project will help address the severe shortage of rental housing in Honolulu and revitalize the central business district.
|
Repositionings
We often strategically purchase properties with large vacancies or expected near-term lease roll-over and use our knowledge of the property and submarket to reposition the property for the optimal use and tenant mix. The work we undertake to reposition a building typically takes months or even years, and could involve a range of improvements from a complete structural renovation to a targeted remodeling of selected spaces. We generally select a property for repositioning at the time we purchase it, although repositioning efforts can also occur at properties that we already own. During the repositioning, the affected property may display depressed rental revenue and occupancy levels which impacts our results and, therefore, comparisons of our performance from period to period.
34
Rental Rate Trends - Total Portfolio
Office Rental Rates
The table below presents the average annual rental rate per leased square foot and the annualized lease transaction costs per leased square foot for leases executed in our total office portfolio:
|
|
Year Ended December 31,
|
|||||||||||
|
2018
|
2017
|
2016
|
2015
|
2014
|
||||||||
|
Average straight-line rental rate
(1)(2)
|
$48.77
|
$44.48
|
$43.21
|
$42.65
|
$35.93
|
|||||||
|
Annualized lease transaction costs
(3)
|
$5.80
|
$5.68
|
$5.74
|
$4.77
|
$4.66
|
|||||||
___________________________________________________
|
(1)
|
Because straight-line rent takes into account the full economic value of each lease, including rent concessions and escalations, we believe that it may provide a better comparison than ending cash rents, which include the impact of the annual escalations over the entire term of the lease. However, care should be taken in any comparison, as the averages are often significantly affected from period to period by factors such as the buildings, submarkets, and types of space and terms involved in the leases executed during the respective reporting period.
|
|
(2)
|
Reflects the weighted average straight-line Annualized Rent.
|
|
(3)
|
Reflects the weighted average leasing commissions and tenant improvement allowances divided by the weighted average number of years for the leases. Excludes leases substantially negotiated by the seller in the case of acquired properties and leases for tenants relocated due to repositioning projects.
|
Office Rent Roll
The table below presents the rent roll for new and renewed leases per leased square foot executed in our total office portfolio during the year ended
December 31, 2018
:
|
Rent Roll
(1)(2)
|
Starting Cash Rent
|
Straight-line Rent
|
Expiring Cash Rent
|
||||||
|
Leases signed during the period
|
$46.44
|
$48.77
|
N/A
|
||||||
|
Prior leases for the same space
|
$35.19
|
$37.11
|
$40.87
|
||||||
|
Percentage change
|
32.0%
|
31.4%
|
13.6%
|
(3)
|
|||||
___________________________________________________
|
(1)
|
Represents the average initial stabilized cash and straight-line rents on new and renewal leases signed during the quarter compared to the prior lease on the same space, excluding Short-Term Leases, leases where the prior lease was terminated more than a year before signing of the new lease, and leases in acquired buildings where we believe the information about the prior agreement is incomplete or where we believe base rent reflects other off-market inducements to the tenant that are not reflected in the prior lease document.
|
|
(2)
|
Our office rent roll can fluctuate from period to period as a result of changes in our submarkets, buildings and term of the expiring leases, making these metrics difficult to predict.
|
|
(3)
|
The percentage change for expiring cash rent represents the comparison between the starting cash rent on leases executed during the respective period and the expiring cash rent on the prior leases for the same space.
|
35
Multifamily Rental Rates
The table below presents the average annual rental rate per leased unit for new tenants:
|
|
Year Ended December 31,
|
|||||||||||||||||||||
|
2018
|
2017
|
2016
|
2015
|
2014
|
||||||||||||||||||
|
Average annual rental rate - new tenants
(1)
|
$
|
27,542
|
|
$
|
28,501
|
|
$
|
28,435
|
|
$
|
27,936
|
|
$
|
28,870
|
|
|||||||
_____________________________________________________
|
(1)
|
These average rental rates are not directly comparable from year to year because of changes in the properties and units included. In particular, in each of 2018 and 2016, we significantly expanded the number of units in our portfolio in Honolulu, where the rental rates are lower than the average in our portfolio.
|
Multifamily Rent Roll
During
2018
, average rent on leases to new tenants was
0.5%
lower
for the same unit at the time it became vacant.
Occupancy Rates - Total Portfolio
The tables below present the occupancy rates for our total office portfolio and multifamily portfolio:
|
|
December 31,
|
||||||||||||||||
|
Occupancy Rates
(1)
as of:
|
2018
|
2017
|
2016
|
2015
|
2014
|
||||||||||||
|
Office portfolio
|
90.3
|
%
|
89.8
|
%
|
90.4
|
%
|
91.2
|
%
|
90.5
|
%
|
|||||||
|
Multifamily portfolio
(2)
|
97.0
|
%
|
96.4
|
%
|
97.9
|
%
|
98.0
|
%
|
98.2
|
%
|
|||||||
|
|
Year Ended December 31,
|
||||||||||||||||
|
Average Occupancy Rates
(1)(3)
:
|
2018
|
2017
|
2016
|
2015
|
2014
|
||||||||||||
|
Office portfolio
|
89.4
|
%
|
89.5
|
%
|
90.6
|
%
|
90.9
|
%
|
90.0
|
%
|
|||||||
|
Multifamily portfolio
(2)
|
96.6
|
%
|
97.2
|
%
|
97.6
|
%
|
98.2
|
%
|
98.5
|
%
|
|||||||
___________________________________________________
|
(1)
|
Occupancy rates include the impact of property acquisitions, most of whose occupancy rates at the time of acquisition were below that of our existing portfolio.
|
|
(2)
|
The occupancy rate for our multifamily portfolio was impacted during 2018 by the new units that we are leasing at our
Moanalua Hillside Apartments
development in Honolulu - see "Financings, Developments and Repositionings".
|
|
(3)
|
Average occupancy rates are calculated by averaging the occupancy rates at the end of each of the quarters in the period and at the end of the quarter immediately prior to the start of the period.
|
36
Office Lease Expirations
As of
December 31, 2018
, assuming non-exercise of renewal options and early termination rights, we expect to see expiring square footage in our total office portfolio as follows:
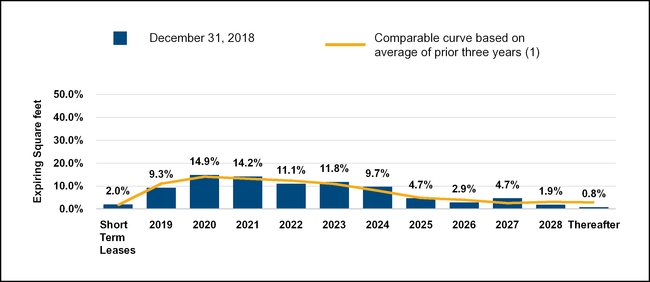
______________________________________________________
(1) Average of the percentage of leases at
December 31
,
2015
,
2016
, and
2017
with the same remaining duration as the leases for the labeled year had at
December 31, 2018
. Acquisitions are included in the prior year average commencing in the quarter after the acquisition.
37
Results of Operations
Comparison of
2018
to
2017
|
2018
|
2017
|
Favorable (Unfavorable)
|
Percentage
|
Commentary
|
|||||||||||||||
|
(In thousands)
|
|||||||||||||||||||
|
Revenues
|
|||||||||||||||||||
|
Office rental revenue and tenant recoveries
|
$
|
661,147
|
|
$
|
606,852
|
|
$
|
54,295
|
|
8.9
|
%
|
The increase was due to increase in rental revenues and tenant recoveries of $27.2 million from properties that we acquired in 2017 and an increase in rental revenues and tenant recoveries of $27.1 million from properties that we owned throughout both periods. The increase from properties that we owned throughout both periods was primarily due to (i) an increase in rental rates, partially offset by a decrease in occupancy and (ii) an increase in tenant recoveries due to an increase in recoverable operating costs.
|
|||||||
|
Office parking and other income
|
$
|
116,784
|
|
$
|
108,694
|
|
$
|
8,090
|
|
7.4
|
%
|
The increase was due to parking and other income of $5.8 million from properties that we owned throughout both periods and an increase of $2.3 million from properties that we acquired in 2017. The increase in parking and other income from properties that we owned throughout both periods primarily reflects an increase in parking rates, partially offset by a decrease in occupancy and an increase in ground rent income.
|
|||||||
|
Multifamily revenue
|
$
|
103,385
|
|
$
|
96,506
|
|
$
|
6,879
|
|
7.1
|
%
|
The increase was primarily due to an increase in rental revenues of $6.4 million, of which $3.4 million was due to an increase in revenues from new apartments at our Moanalua development and $3.0 million was due to increases in revenues from properties that we owned throughout both periods. The increase from the properties that we owned throughout both periods was due to an increase in rental rates for in-place leases, partially offset by a decrease in occupancy.
|
|||||||
|
Operating expenses
|
|||||||||||||||||||
|
Office rental expenses
|
$
|
252,751
|
|
$
|
233,633
|
|
$
|
(19,118
|
)
|
(8.2
|
)%
|
The increase was due to rental expenses of $10.9 million from properties that we owned throughout both periods and an increase of $8.2 million from properties that we acquired during 2017. The increase from properties that we owned throughout both periods was primarily due to an increase in scheduled services expenses, utility expenses, personnel expenses, repairs and maintenance and real estate taxes.
|
|||||||
|
Multifamily rental expenses
|
$
|
28,116
|
|
$
|
24,401
|
|
$
|
(3,715
|
)
|
(15.2
|
)%
|
The increase was primarily due to an increase of $2.9 million from properties that we owned throughout both periods and an increase of $0.8 million from new apartments at our Moanalua development. The increase from the properties that we owned throughout both periods was primarily due to personnel expenses, utility expenses, real estate taxes and scheduled services expenses.
|
|||||||
38
|
2018
|
2017
|
Favorable (Unfavorable)
|
Percentage
|
Commentary
|
|||||||||||||||
|
(In thousands)
|
|||||||||||||||||||
|
General and administrative
|
$
|
38,641
|
|
$
|
36,234
|
|
$
|
(2,407
|
)
|
(6.6
|
)%
|
The increase was primarily due to an increase in personnel expenses, partially offset by a decrease in payroll tax expense due to options that were exercised in the comparable period.
|
|||||||
|
Depreciation and amortization
|
$
|
309,864
|
|
$
|
276,761
|
|
$
|
(33,103
|
)
|
(12.0
|
)%
|
The increase was due to an increase in depreciation and amortization of $18.4 million from properties that we acquired during 2017, an increase of $1.2 million from new apartments at our Moanalua development, and an increase of $13.5 million from properties that we owned throughout both periods. The increase from properties that we owned throughout both periods was primarily due to accelerated depreciation related to our office property repositionings.
|
|||||||
|
Non-Operating Income and Expenses
|
|||||||||||||||||||
|
Other income
|
$
|
11,414
|
|
$
|
9,712
|
|
$
|
1,702
|
|
17.5
|
%
|
The increase was primarily due to an increase in interest income due to higher money market interest rates.
|
|||||||
|
Other expenses
|
$
|
(7,472
|
)
|
$
|
(7,037
|
)
|
$
|
(435
|
)
|
(6.2
|
)%
|
The increase was primarily due an increase in expenses from the health club that we own and operate, and an increase in acquisition-related expenses related to properties that we did not acquire.
|
|||||||
|
Income, including depreciation, from unconsolidated real estate funds
|
$
|
6,400
|
|
$
|
5,905
|
|
$
|
495
|
|
8.4
|
%
|
The increase was primarily due to an increase in net income for our unconsolidated Funds, which was primarily due to (i) an increase in revenues due to an increase in rental rates and (ii) higher interest income due to higher money market interest rates, partially offset by an increase in interest expense due to higher debt balances and higher interest rates.
|
|||||||
|
Interest expense
|
$
|
(133,402
|
)
|
$
|
(145,176
|
)
|
$
|
11,774
|
|
8.1
|
%
|
The decrease was primarily due to lower debt balances.
|
|||||||
|
Demolition expenses
|
$
|
(272
|
)
|
$
|
—
|
|
$
|
(272
|
)
|
100.0
|
%
|
The increase reflects expenses to demolish an existing structure to allow our high-rise apartment development in Brentwood, California.
|
|||||||
39
Comparison of
2017
to
2016
|
2017
|
2016
|
Favorable (Unfavorable)
|
Percentage
|
Commentary
|
|||||||||||||||
|
(In thousands)
|
|||||||||||||||||||
|
Revenues
|
|||||||||||||||||||
|
Office rental revenues and tenant recoveries.
|
$
|
606,852
|
|
$
|
545,061
|
|
$
|
61,791
|
|
11.3
|
%
|
The increase was due to rental revenues and tenant recoveries of $49.0 million from properties that we acquired in 2016 and 2017 and an increase in rental revenues and tenant recoveries of $15.9 million from the properties that we owned throughout both periods, partially offset by a decrease of $3.1 million in rental revenues from a property that we sold during 2016. The increase from properties that we owned throughout both periods was primarily due to (i) an increase in rental rates, partially offset by a decrease in occupancy and a decrease of $1.5 million in the accretion from below-market leases and (ii) an increase in tenant recoveries due to an increase in recoverable operating costs .
|
|||||||
|
Office parking and other income
|
$
|
108,694
|
|
$
|
100,572
|
|
$
|
8,122
|
|
8.1
|
%
|
The increase was due to parking and other income of $5.1 million from properties that we acquired in 2016 and 2017 and an increase of $3.5 million in parking and other income from properties that we owned throughout both periods, partially offset by a decrease of $0.5 million in parking and other income from a property that we sold during 2016. The increase in parking and other income from properties that we owned throughout both periods primarily reflects increases in rates, partially offset by a decrease in occupancy.
|
|||||||
|
Multifamily revenue
|
$
|
96,506
|
|
$
|
96,918
|
|
$
|
(412
|
)
|
(0.4
|
)%
|
The decrease was due to a decrease of $2.8 million in the accretion from below-market leases, partially offset by an increase of $2.4 million in rental revenues and parking income. The decrease in the accretion from below-market leases was due to the completion in the fourth quarter 2016 of the amortization of below-market lease intangibles recorded at the time of our IPO. The increase in rental revenues and parking income was primarily due to an increase in rental rates.
|
|||||||
|
Operating expenses
|
|||||||||||||||||||
|
Office rental expenses
|
$
|
233,633
|
|
$
|
214,546
|
|
$
|
(19,087
|
)
|
(8.9
|
)%
|
The increase was due to rental expenses of $17.3 million from properties that we acquired during 2016 and 2017 and an increase of $3.2 million from properties that we owned throughout both periods, partially offset by a decrease of $1.4 million from a property that we sold during 2016. The increase from properties that we owned throughout both periods was primarily due to an increase in personnel expenses, utilities and real estate taxes, partially offset by a decrease in parking expenses.
|
|||||||
|
Multifamily rental expenses
|
$
|
24,401
|
|
$
|
23,317
|
|
$
|
(1,084
|
)
|
(4.6
|
)%
|
The increase was due to a prior year excise tax refund of $0.5 million in 2016 which offset expenses in that year and increases in scheduled services, personnel expenses and utilities in 2017.
|
|||||||
40
|
2017
|
2016
|
Favorable (Unfavorable)
|
Percentage
|
Commentary
|
|||||||||||||||
|
(In thousands)
|
|||||||||||||||||||
|
General and administrative
|
$
|
36,234
|
|
$
|
34,957
|
|
$
|
(1,277
|
)
|
(3.7
|
)%
|
The increase was primarily due to an increase in personnel expenses.
|
|||||||
|
Depreciation and amortization
|
$
|
276,761
|
|
$
|
248,914
|
|
$
|
(27,847
|
)
|
(11.2
|
)%
|
The increase was primarily due to depreciation and amortization of $24.6 million from properties that we acquired during 2016 and 2017 and an increase of $3.7 million from properties that we owned throughout both periods, partially offset by a decrease of $0.5 million from a property that we sold during 2016. The increase from the properties that we owned throughout both periods was primarily due to an increase in building improvements, tenant improvements and leasing commissions.
|
|||||||
|
Non-Operating Income and Expenses
|
|||||||||||||||||||
|
Other income
|
$
|
9,712
|
|
$
|
8,759
|
|
$
|
953
|
|
10.9
|
%
|
The increase was primarily due to an increase in interest income and revenue from the health club that we own and operate.
|
|||||||
|
Other expenses
|
$
|
(7,037
|
)
|
$
|
(9,477
|
)
|
$
|
2,440
|
|
25.7
|
%
|
The decrease was primarily due to $2.8 million of acquisition-related expenses incurred in connection with the acquisition of properties by our consolidated JVs in 2016. We commenced capitalizing acquisition-related expenses in 2017 as a result of a change in accounting policy - see Note 2 to our consolidated financial statements in Item 15 of this Report.
|
|||||||
|
Income, including depreciation, from unconsolidated real estate funds
|
$
|
5,905
|
|
$
|
7,812
|
|
$
|
(1,907
|
)
|
(24.4
|
)%
|
The decrease was primarily due to an increase in interest expense and loan costs for one of our unconsolidated Funds related to a 2017 loan refinancing.
|
|||||||
|
Interest expense
|
$
|
(145,176
|
)
|
$
|
(146,148
|
)
|
$
|
972
|
|
0.7
|
%
|
The decrease was due to a decrease in our Operating Partnership interest expense of $13.3 million as a result of lower debt balances, partially offset by interest expense of $12.3 million from debt related to our consolidated JV property acquisitions in 2016 and 2017.
|
|||||||
|
Gains on sales of investments in real estate
|
$
|
—
|
|
$
|
14,327
|
|
$
|
(14,327
|
)
|
(100.0
|
)%
|
In 2016 we sold (i) a thirty-percent ownership interest in one of our consolidated JVs to a third party investor and recognized a gain of $1.1 million, (ii) a thirty-five percent ownership interest in one of our consolidated JVs to a third party investor and recognized a gain of $0.6 million and (iii) a wholly-owned office property and recognized a gain of $12.7 million.
|
|||||||
41
Non-GAAP Supplemental Financial Measure: FFO
Usefulness to Investors
We report FFO because it is a widely reported measure of the performance of equity REITs, and is also used by some investors to identify trends in occupancy rates, rental rates and operating costs from year to year, and to compare our performance with other REITs. FFO is a non-GAAP financial measure for which we believe that net income is the most directly comparable GAAP financial measure. FFO has limitations as a measure of our performance because it excludes depreciation and amortization of real estate, and captures neither the changes in the value of our properties that result from use or market conditions, nor the level of capital expenditures, tenant improvements and leasing commissions necessary to maintain the operating performance of our properties, all of which have real economic effect and could materially impact our results from operations. FFO should be considered only as a supplement to net income as a measure of our performance and should not be used as a measure of our liquidity or cash flow, nor is it indicative of funds available to fund our cash needs, including our ability to pay dividends. Other REITs may not calculate FFO in accordance with the NAREIT definition and, accordingly, our FFO may not be comparable to the FFO of other REITs. See "Results of Operations" above for a discussion of the items that impacted our net income.
Comparison of
2018
to
2017
Our FFO
increased
by
45.0 million
, or
12.7%
, to
$399.7 million
for
2018
compared to
$354.7 million
for
2017
, which was primarily due to (i) an increase in operating income from our office portfolio due to acquisitions in 2017 and higher rental rates, (ii) an increase in operating income from our multifamily portfolio due to rent from new apartments at our Moanalua development and higher rental rates in existing units in our portfolio, and (iii) a decrease in interest expense due to lower debt balances, partially offset by an increase in general and administrative expenses due to an increase in personnel costs.
Comparison of
2017
to
2016
Our FFO
increased
by
$29.0 million
, or
8.9%
, to
$354.7 million
for
2017
compared to
$325.7 million
for
2016
, which was primarily due to (i) an increase in operating income from our office portfolio due to property acquisitions in 2016 and 2017 and increasing rental rates, (ii) a decrease in other expenses as a result of acquisition-related costs we expensed in 2016, while similar costs were capitalized in 2017 as a result of the adoption of an ASU in 2017, and (iii) a decrease in interest expense due to lower debt balances, partially offset by (a) a decrease in the operating income from our multifamily portfolio due to a decrease in the accretion from below-market leases due to the completion in 2016 of the amortization of below-market lease intangibles recorded at the time of our IPO, and an excise tax refund of $0.5 million that reduced our multifamily operating expenses in 2016, (b) an increase in general and administrative expenses due an increase in personnel costs, and (c) a decrease in the FFO of our Funds due to an increase in interest expense and loan costs related to the refinancing of a loan for one of our Funds during 2017.
Reconciliation to GAAP
The table below reconciles our FFO (the FFO attributable to our common stockholders and noncontrolling interests in our Operating Partnership - which includes our share of our consolidated JVs and our unconsolidated Funds FFO) to net income attributable to common stockholders computed in accordance with GAAP:
|
|
Year Ended December 31,
|
|||||||||||||
|
(In thousands)
|
2018
|
2017
|
2016
|
|||||||||||
|
|
|
|
||||||||||||
|
Net income attributable to common stockholders
|
$
|
116,086
|
|
$
|
94,443
|
|
$
|
85,397
|
|
|||||
|
Depreciation and amortization of real estate assets
|
309,864
|
|
276,761
|
|
248,914
|
|
||||||||
|
Net income attributable to noncontrolling interests
|
12,526
|
|
9,984
|
|
10,693
|
|
||||||||
|
Adjustments attributable to unconsolidated funds
(1)
|
16,702
|
|
16,220
|
|
16,016
|
|
||||||||
|
Adjustments attributable to consolidated JVs
(2)
|
(55,448
|
)
|
(42,674
|
)
|
(20,961
|
)
|
||||||||
|
Gain on sale of investment in real estate
|
—
|
|
—
|
|
(14,327
|
)
|
||||||||
|
FFO
|
$
|
399,730
|
|
$
|
354,734
|
|
$
|
325,732
|
|
|||||
___________________________________________________
|
(1)
|
Adjusts for our share of our unconsolidated Funds depreciation and amortization of real estate assets.
|
|
(2)
|
Adjusts for the net income and depreciation and amortization of real estate assets that is attributable to the noncontrolling interests in our consolidated JVs.
|
42
Non-GAAP Supplemental Financial Measure: Same Property NOI
Usefulness to Investors
We report Same Property NOI to facilitate a comparison of our operations between reported periods. Many investors use Same Property NOI to evaluate our operating performance and to compare our operating performance with other REITs, because it can reduce the impact of investing transactions on operating trends. NOI is a non-GAAP financial measure for which we believe that net income is the most directly comparable GAAP financial measure. We report NOI because it is a widely recognized measure of the performance of equity REITs, and is used by some investors to identify trends in occupancy rates, rental rates and operating costs and to compare our operating performance with that of other REITs. NOI has limitations as a measure of our performance because it excludes depreciation and amortization expense, and captures neither the changes in the value of our properties that result from use or market conditions, nor the level of capital expenditures, tenant improvements and leasing commissions necessary to maintain the operating performance of our properties, all of which have real economic effect and could materially impact our results from operations. Other REITs may not calculate Same Property NOI in the same manner. As a result, our Same Property NOI may not be comparable to the Same Property NOI of other REITs. Same Property NOI should be considered only as a supplement to net income as a measure of our performance and should not be used as a measure of our liquidity or cash flow, nor is it indicative of funds available to fund our cash needs, including our ability to pay dividends.
Comparison of
2018
to
2017
:
Our
2018
same properties included
47
office properties, aggregating
11.8 million
Rentable Square Feet, and
9
multifamily properties with an aggregate
2,640
units:
|
(In thousands)
|
2018
|
2017
|
Favorable (Unfavorable)
|
Percentage
|
Commentary
|
|||||||||||
|
Office revenues
|
$
|
502,912
|
|
$
|
480,101
|
|
$
|
22,811
|
|
4.8
|
%
|
The increase was primarily due to an increase in rental and parking rates, an increase in tenant recovery revenues reflecting an increase in recoverable operating costs and an increase in ground rent income.
|
||||
|
Office expenses
|
(166,541
|
)
|
(158,262
|
)
|
(8,279
|
)
|
(5.2
|
)%
|
The increase was primarily due to an increase in scheduled services expenses, utility expenses, personnel expenses, repairs and maintenance and real estate taxes.
|
|||||||
|
Office NOI
|
336,371
|
|
321,839
|
|
14,532
|
|
4.5
|
%
|
||||||||
|
Multifamily revenues
|
84,587
|
|
81,927
|
|
2,660
|
|
3.2
|
%
|
The increase was primarily due to an increase in rental revenues due to an increase in occupancy and rental rates.
|
|||||||
|
Multifamily expenses
|
(21,508
|
)
|
(19,969
|
)
|
(1,539
|
)
|
(7.7
|
)%
|
The increase was primarily due to an increase in personnel expenses, scheduled services expenses, utility expenses, repairs and maintenance and real estate taxes.
|
|||||||
|
Multifamily NOI
|
63,079
|
|
61,958
|
|
1,121
|
|
1.8
|
%
|
||||||||
|
Total NOI
|
$
|
399,450
|
|
$
|
383,797
|
|
$
|
15,653
|
|
4.1
|
%
|
|||||
43
Reconciliation to GAAP
The table below presents a reconciliation of our Same Property NOI to net income attributable to common stockholders:
|
(In thousands)
|
2018
|
2017
|
|||||
|
Same Property NOI
|
$
|
399,450
|
|
$
|
383,797
|
|
|
|
Non-comparable office revenues
|
275,019
|
|
235,445
|
|
|||
|
Non-comparable office expenses
|
(86,210
|
)
|
(75,371
|
)
|
|||
|
Non-comparable multifamily revenues
|
18,770
|
|
14,579
|
|
|||
|
Non-comparable multifamily expenses
|
(6,580
|
)
|
(4,432
|
)
|
|||
|
NOI
|
600,449
|
|
554,018
|
|
|||
|
General and administrative
|
(38,641
|
)
|
(36,234
|
)
|
|||
|
Depreciation and amortization
|
(309,864
|
)
|
(276,761
|
)
|
|||
|
Operating income
|
251,944
|
|
241,023
|
|
|||
|
Other income
|
11,414
|
|
9,712
|
|
|||
|
Other expenses
|
(7,472
|
)
|
(7,037
|
)
|
|||
|
Income, including depreciation, from unconsolidated real estate funds
|
6,400
|
|
5,905
|
|
|||
|
Interest expense
|
(133,402
|
)
|
(145,176
|
)
|
|||
|
Demolition expenses
|
(272
|
)
|
—
|
|
|||
|
Net income
|
128,612
|
|
104,427
|
|
|||
|
Less: Net income attributable to noncontrolling interests
|
(12,526
|
)
|
(9,984
|
)
|
|||
|
Net income attributable to common stockholders
|
$
|
116,086
|
|
$
|
94,443
|
|
|
44
Comparison of
2017
to
2016
Our
2017
same properties included
51
office properties, aggregating
13.0 million
rentable square feet, and
9
multifamily properties with an aggregate
2,640
units:
|
(In thousands)
|
2017
|
2016
|
Favorable (Unfavorable)
|
Percentage
|
Commentary
|
|||||||||||
|
Office revenues
|
$
|
551,651
|
|
$
|
531,734
|
|
$
|
19,917
|
|
3.7
|
%
|
The increase was primarily due to an increase in rental and parking rates, as well as higher tenant recovery revenues reflecting increased recoverable operating costs.
|
||||
|
Office expenses
|
(176,916
|
)
|
(173,977
|
)
|
(2,939
|
)
|
(1.7
|
)%
|
The increase was primarily due to an increase in personnel expenses, utilities and real estate taxes, partially offset by a decrease in parking expenses.
|
|||||||
|
Office NOI
|
374,735
|
|
357,757
|
|
16,978
|
|
4.7
|
%
|
||||||||
|
Multifamily revenues
|
81,927
|
|
82,328
|
|
(401
|
)
|
(0.5
|
)%
|
The decrease was primarily due to a decrease of $2.8 million in the accretion from below-market leases, partially offset by an increase in rental revenues and parking and other income. The decrease in the accretion from below-market leases was due to the completion in 2016 of the amortization of below-market lease intangibles recorded at the time of our IPO. The increase in rental revenues and parking and other income was primarily due to an increase in rental rates.
|
|||||||
|
Multifamily expenses
|
(19,969
|
)
|
(19,229
|
)
|
(740
|
)
|
(3.8
|
)%
|
The increase was primarily due to an excise tax refund of $0.5 million in 2016 which offset other operating expenses.
|
|||||||
|
Multifamily NOI
|
61,958
|
|
63,099
|
|
(1,141
|
)
|
(1.8
|
)%
|
||||||||
|
Total NOI
|
$
|
436,693
|
|
$
|
420,856
|
|
$
|
15,837
|
|
3.8
|
%
|
|||||
45
Reconciliation to GAAP
The table below presents a reconciliation of our Same Property NOI to net income attributable to common stockholders:
|
(In thousands)
|
2017
|
2016
|
|||||
|
Same Property NOI
|
$
|
436,693
|
|
$
|
420,856
|
|
|
|
Non-comparable office revenues
|
163,895
|
|
113,899
|
|
|||
|
Non-comparable office expenses
|
(56,717
|
)
|
(40,569
|
)
|
|||
|
Non-comparable multifamily revenues
|
14,579
|
|
14,590
|
|
|||
|
Non-comparable multifamily expenses
|
(4,432
|
)
|
(4,088
|
)
|
|||
|
NOI
|
554,018
|
|
504,688
|
|
|||
|
General and administrative
|
(36,234
|
)
|
(34,957
|
)
|
|||
|
Depreciation and amortization
|
(276,761
|
)
|
(248,914
|
)
|
|||
|
Operating income
|
241,023
|
|
220,817
|
|
|||
|
Other income
|
9,712
|
|
8,759
|
|
|||
|
Other expenses
|
(7,037
|
)
|
(9,477
|
)
|
|||
|
Income, including depreciation, from unconsolidated real estate funds
|
5,905
|
|
7,812
|
|
|||
|
Interest expense
|
(145,176
|
)
|
(146,148
|
)
|
|||
|
Income before gains
|
104,427
|
|
81,763
|
|
|||
|
Gains on sales of investments in real estate
|
—
|
|
14,327
|
|
|||
|
Net income
|
104,427
|
|
96,090
|
|
|||
|
Less: Net income attributable to noncontrolling interests
|
(9,984
|
)
|
(10,693
|
)
|
|||
|
Net income attributable to common stockholders
|
$
|
94,443
|
|
$
|
85,397
|
|
|
Liquidity and Capital Resources
Short-term liquidity
Excluding acquisitions, development projects and debt refinancings, we expect to meet our short-term liquidity requirements through cash on hand, cash generated by operations, and our revolving credit facility. See Note
7
to our consolidated financial statements in Item 15 of this Report for more information regarding our revolving credit facility.
Long-term liquidity
Our long-term liquidity needs consist primarily of funds necessary to pay for acquisitions, development projects and debt refinancings. We do not expect to have sufficient funds on hand to cover these long-term cash requirements due to the requirement to distribute a substantial majority of our income on an annual basis imposed by REIT federal tax rules. We plan to meet our long-term liquidity needs through long-term secured non-recourse indebtedness, the issuance of equity securities, including common stock and OP Units, as well as property dispositions and JV transactions. We have an ATM program which would allow us, subject to market conditions, to sell up to
$400 million
of shares of common stock as of the date of this Report.
To mitigate the impact of changing interest rates on our cash flows from operations, most of our long-term secured loans carry fixed interest rates, and we generally enter into interest rate swap agreements with respect to our loans with floating interest rates. These swap agreements generally expire between one to two years before the maturity date of the related loan, during which time we can refinance the loan without any interest penalty. See Notes
7
and
9
to our consolidated financial statements in
Item 15
of this Report for more information regarding our debt and derivative contracts, respectively.
46
Contractual obligations as of
December 31, 2018
|
|
Payment due by period
|
|||||||||||||||||||||
|
(In thousands)
|
Total
|
Less than
1 year
|
2-3
years
|
4-5
years
|
Thereafter
|
|||||||||||||||||
|
Term loan principal payments
(1)
|
$
|
4,163,982
|
|
$
|
145,718
|
|
$
|
401,539
|
|
$
|
2,536,685
|
|
$
|
1,080,040
|
|
|||||||
|
Ground lease payments
(2)
|
49,843
|
|
733
|
|
1,466
|
|
1,466
|
|
46,178
|
|
||||||||||||
|
Development commitments
(3)
|
202,865
|
|
89,381
|
|
113,484
|
|
—
|
|
—
|
|
||||||||||||
|
Capital expenditures and tenant improvements commitments
(4)
|
55,340
|
|
55,340
|
|
—
|
|
—
|
|
—
|
|
||||||||||||
|
Total
|
$
|
4,472,030
|
|
$
|
291,172
|
|
$
|
516,489
|
|
$
|
2,538,151
|
|
$
|
1,126,218
|
|
|||||||
____________________________________________________
|
(1)
|
Reflects the future principal payments due on our secured notes payable and revolving credit facility, excluding any maturity extension options. For more information regarding our debt and the interest rates that determine our periodic interest payments see Note
7
to our consolidated financial statements in Item 15 of this Report.
|
|
(2)
|
Reflects the future minimum ground lease payments. See Note
16
to our consolidated financial statements in Item 15 of this Report.
|
|
(3)
|
See "Financings, Developments and Repositionings" for a discussion of our developments.
|
|
(4)
|
Reflects the aggregate remaining contractual commitment for capital expenditure projects and repositionings, as well as tenant improvements. See "Financings, Developments and Repositionings" for a discussion of our repositionings.
|
Off-Balance Sheet Arrangements
Unconsolidated Funds Debt
Our unconsolidated Funds have their own secured non-recourse debt, and we have made certain environmental and other limited indemnities and guarantees covering customary non-recourse carve-outs related to those loans. We have also guaranteed the related swaps. Our Funds have agreed to indemnify us for any amounts that we would be required to pay under these agreements. As of
December 31, 2018
, all of the obligations under the respective loans and swap agreements have been performed in accordance with the terms of those agreements. For information regarding our Funds and Funds' debt,
see Notes
5
and
17
, respectively, to our consolidated financial statements in Item 15 of this Report.
47
Cash Flows
Comparison of
2018
to
2017
|
2018
|
2017
|
Increase (Decrease)
|
Percentage
|
||||||||||||||
|
(In thousands)
|
|||||||||||||||||
|
Cash flows provided by operating activities
(1)
|
$
|
432,982
|
|
$
|
402,697
|
|
$
|
30,285
|
|
7.5
|
%
|
||||||
|
Cash flows used in investing activities
(2)
|
$
|
(249,551
|
)
|
$
|
(669,595
|
)
|
$
|
(420,044
|
)
|
(62.7
|
)%
|
||||||
|
Cash flows (used in) provided by financing activities
(3)
|
$
|
(213,849
|
)
|
$
|
330,616
|
|
$
|
(544,465
|
)
|
(164.7
|
)%
|
||||||
___________________________________________________
|
(1)
|
Our cash flows
provided by
operating activities are primarily dependent upon the occupancy and rental rates of our portfolio, the collectability of rent and recoveries from our tenants, and the level of our operating expenses and general and administrative costs, and interest expense. The
increase
was primarily due to (i) an increase in operating income from our office portfolio due to acquisitions in 2017 and higher rental rates, (ii) an increase in operating income from our multifamily portfolio due to rents from new apartments at our Moanalua development and higher rental rates from existing units, and (iii) a decrease in interest expense due to lower debt balances.
|
|
(2)
|
Our cash flows
used in
investing activities is generally used to fund property acquisitions, developments and redevelopment projects, and Recurring and non-Recurring Capital Expenditures. The
decrease
is primarily due to $537.7 million paid for properties acquired in 2017, partially offset by (i) an increase of $70.7 million for capital expenditures for improvements to real estate and (ii) a decrease of $36.2 million in capital distributions received from our Funds.
|
|
(3)
|
Our cash flows
used in
financing activities are generally impacted by our borrowings and capital activities, as well as dividends and distributions paid to common stockholders and noncontrolling interests, respectively. The
decrease
is primarily due to (i) $593.2 million in proceeds from the issuance of common stock in 2017, (ii) $284.2 million in contributions from non-controlling interests in 2017, partially offset by (a) an increase of $299.7 million in net borrowings and (b) a decrease of $52.6 million in payroll taxes paid related to the exercise of stock options.
|
Critical Accounting Policies
Our discussion and analysis of our financial condition and results of operations is based upon our consolidated financial statements, which have been prepared in accordance with GAAP, which requires us to make estimates of certain items which affect the reported amounts of our assets, liabilities, revenues and expenses. While we believe that our estimates are based upon reasonable assumptions and judgments at the time that they are made, some of our estimates could prove to be incorrect, and those differences could be material. Below is a discussion of our critical accounting policies, which are the policies we believe require the most estimate and judgment. See Note
2
to our consolidated financial statements included in
Item 15
of this Report for the summary of our significant accounting policies.
Investment in Real Estate
Acquisitions
We allocate the purchase price, which includes the capitalized transaction costs, of acquired properties to: (i) land, (ii) buildings and improvements, (iii) tenant improvements and identifiable intangible assets such as in-place at-market leases, (iv) acquired above- and below-market ground and tenant leases, and if applicable (v) assumed debt, based upon our estimates of expected future cash flows and other valuation techniques. We estimate the relative fair values of the tangible assets on an ‘‘as-if-vacant’’ basis. The estimated relative fair value of acquired in-place at-market leases are the estimated costs to lease the property to the occupancy level at the date of acquisition, including the fair value of leasing commissions and legal costs. We evaluate the time period over which we expect such occupancy level to be achieved and include an estimate of the net operating costs (primarily real estate taxes, insurance and utilities) incurred during the lease-up period. Above and below-market ground and tenant leases are recorded as an asset or liability based upon the present value (using an interest rate which reflects the risks associated with the leases acquired) of the difference between the contractual amounts to be paid or received pursuant to the in-place ground or tenant leases, respectively, and our estimate of fair market rental rates for the corresponding in-place leases, over the remaining non-cancelable term of the leases. Assumed debt is recorded at fair value based upon the present value of the expected future payments.
48
These estimates require judgment, involve complex calculations, and the allocations have a direct and material impact on our results of operations because, for example, (i) there would be less depreciation if we allocate more value to land (which is not depreciated), or (ii) if we allocate more value to buildings than to tenant improvements, the depreciation would be recognized over a much longer time period, because buildings are depreciated over a longer time period than tenant improvements.
Cost capitalization
We capitalize development costs, including predevelopment costs, interest, property taxes, insurance and other costs directly related to the development of real estate. Indirect development costs, including salaries and benefits, office rent, and associated costs for those individuals directly responsible for and who spend their time on development activities are also capitalized and allocated to the projects to which they relate. Development costs are capitalized while substantial activities are ongoing to prepare an asset for its intended use. We consider a development project to be substantially complete when the residential units or office space is available for occupancy but no later than one year after cessation of major construction activity. Costs incurred after a project is substantially complete and ready for its intended use, or after development activities have ceased, are expensed as incurred. Costs previously capitalized related to abandoned developments are charged to earnings. Expenditures for repairs and maintenance are expensed as incurred. The capitalization of development costs requires judgment, and can directly and materially impact our results of operations because, for example, (i) if we don't capitalize costs that should be capitalized, then our operating expenses would be overstated during the development period, and the subsequent depreciation of the developed real estate would be understated, or (ii) if we capitalize costs that should not be capitalized, then our operating expenses would be understated during the development period, and the subsequent depreciation of the real estate would be overstated. We capitalized development costs of
$78.7 million
,
$66.0 million
and
$31.6 million
during
2018
,
2017
or
2016
, respectively.
Impairment of Long-Lived Assets
We assess our investment in real estate and our investment in our Funds for impairment on a periodic basis, and whenever events or changes in circumstances indicate that the carrying value of our investments may not be recoverable. If the undiscounted future cash flows expected to be generated by the asset are less than the carrying value of the asset, and our evaluation indicates that we may be unable to recover the carrying value, then we would record an impairment loss to the extent that the carrying value exceeds the estimated fair value of the asset. Our estimates of future cash flows are based in part upon assumptions regarding future occupancy, rental rates and operating costs, and could differ materially from actual results. We record real estate held for sale at the lower of carrying value or estimated fair value, less costs to sell, and similarly recognize impairment losses if we believe that we cannot recover the carrying value. Our evaluation of market conditions for assets held for sale requires judgment, and our expectations could differ materially from actual results. Impairment losses would reduce our net income and could be material. We did not record any impairment losses for our long-lived assets during
2018
,
2017
or
2016
.
Revenue Recognition for Tenant Recoveries
Our tenant recovery revenues for recoverable operating expenses are recognized as revenue in the period that the recoverable expenses are incurred. Subsequent to year-end, we perform reconciliations on a lease-by-lease basis and bill or credit each tenant for any differences between the estimated expenses we billed to the tenant and the actual expenses incurred. Estimating tenant recovery revenues requires an in-depth analysis of the complex terms of each underlying lease. Examples of estimates and judgments made when determining the amounts recoverable include:
|
•
|
estimating the recoverable expenses;
|
|
•
|
estimating the impact of changes to expense and occupancy during the year;
|
|
•
|
estimating the fixed and variable components of operating expenses for each building;
|
|
•
|
conforming recoverable expense pools to those used in the base year for the underlying lease; and
|
|
•
|
judging whether an expense or capital expenditure is recoverable pursuant to the terms of the underlying lease.
|
These estimates require judgment and involve complex calculations. If our estimates prove to be incorrect, then our tenant recovery revenues and net income could be materially and adversely affected in future periods when we perform our reconciliations. The impact of changing our current year tenant recovery billings by 5% would result in a change to our tenant recovery revenues and net income of
$2.4 million
,
$2.1 million
and
$2.0 million
during
2018
,
2017
and
2016
, respectively.
49
Allowances for Tenant and Deferred Rent Receivables
Our estimates regarding the adequacy of our allowances for uncollectible tenant and deferred rent receivables requires judgment, including the creditworthiness of specific tenants and general economic trends and conditions. For most of our tenants, our only security is their security deposits or letters of credit, and in some cases we do not require any security deposit or letter of credit. If our allowances are not sufficient to cover the unsecured losses from our tenants who fail to make contractual payments, our revenues and net income could be materially and adversely affected in future periods. As of
December 31, 2018
,
2017
and
2016
, the total of our allowances was
$8.1 million
,
$6.5 million
and
$7.8 million
, respectively. The impact of changing the allowances by 5% would result in a change to our revenues and net income of
$403 thousand
,
$323 thousand
and
$390 thousand
during
2018
,
2017
and
2016
, respectively.
Stock-Based Compensation
We award stock-based compensation to certain employees and non-employee directors in the form of LTIP Units. We recognize the fair value of the awards over the requisite vesting period, which is based upon service. The fair value of the awards is based upon the market value of our common stock on the grant date and a discount for post-vesting restrictions. Our estimate of the discount for post-vesting restrictions requires judgment. If our estimate of the discount is too high or too low it would result in the fair value of the awards that we make being too low or too high, respectively, which would result in an under- or over-expense of stock-based compensation, respectively, and this under- or over-expensing of stock-based compensation could be material to our net income. Stock-based compensation expense was
$22.3 million
,
$18.5 million
and
$17.4 million
for
2018
,
2017
and
2016
, respectively. The impact of changing the discount rate by 5% would result in a change to our stock-based compensation expense and net income of
$1.1 million
,
$0.9 million
and
$0.9 million
during
2018
,
2017
and
2016
, respectively.
Item 7A. Quantitative and Qualitative Disclosures about Market Risk
We use derivative instruments to hedge interest rate risk related to our floating rate borrowings. However, our use of these instruments exposes us to credit risk from the potential inability of our counterparties to perform under the terms of those agreements. We attempt to minimize this credit risk by contracting with a variety of high-quality financial counterparties. See Notes
7
and
9
to our consolidated financial statements in Item 15 of this Report for more information regarding our debt and derivatives. At
December 31, 2018
,
6.0%
of our debt was unhedged floating rate debt. A fifty-basis point change in the one month USD LIBOR interest rate would result in an annual impact to our earnings (through interest expense) of
$1.3 million
. We calculate interest sensitivity by multiplying the amount of unhedged floating rate debt by fifty-basis points.
In July 2017, the Financial Conduct Authority (the authority that regulates LIBOR) announced it intends to stop compelling banks to submit rates for the calculation of LIBOR after 2021. The Alternative Reference Rates Committee ("ARRC") has proposed that the Secured Overnight Financing Rate ("SOFR") is the rate that represents best practice as the alternative to USD-LIBOR for use in derivatives and other financial contracts that are currently indexed to USD-LIBOR. ARRC has proposed a paced market transition plan to SOFR from USD-LIBOR and organizations are currently working on industry wide and company specific transition plans as it relates to derivatives and cash markets exposed to USD-LIBOR. Our floating rate borrowings and derivative instruments are indexed to USD-LIBOR and we are monitoring this activity and evaluating the related risks.
Item 8. Financial Statements and Supplementary Data
See the Index to our Financial Statements in
Part IV, Item 15
.
Item 9. Changes in and Disagreements with Accountants on Accounting and Financial Disclosure
None.
50
Item 9A. Controls and Procedures
As of
December 31, 2018
, the end of the period covered by this Report, we carried out an evaluation, under the supervision and with the participation of management, including our CEO and CFO, regarding the effectiveness of our disclosure controls and procedures (as defined in Rules 13a-15(e) and 15d-15(e) under the Exchange Act) at the end of the period covered by this Report. Based on the foregoing, our CEO and CFO concluded, as of that time, that our disclosure controls and procedures were effective in ensuring that information required to be disclosed by us in reports filed or submitted under the Exchange Act (i) is processed, recorded, summarized and reported within the time periods specified in the SEC’s rules and forms and (ii) is accumulated and communicated to our management, including our CEO and our CFO, as appropriate, to allow for timely decisions regarding required disclosure.
There have not been any changes in our internal control over financial reporting that occurred during the quarter ended
December 31, 2018
, that have materially affected, or are reasonably likely to materially affect, our internal control over financial reporting.
Management’s Report on Internal Control Over Financial Reporting and the Report of Independent Registered Public Accounting Firm thereon appear at pages
F-1
and
F-3
, respectively, and are incorporated herein by reference.
Item 9B. Other Information
None.
51
PART III
Item 10. Directors, Executive Officers and Corporate Governance
Information required by this item is incorporated by reference to the information set forth under the captions “Election of Directors (Proposal 1) – Information Concerning Current Directors and Nominees”, “Executive Officers”, “Corporate Governance”, “Board Meetings and Committees” and “Section 16(a) Beneficial Ownership Reporting Compliance”, in our Proxy Statement for the
2019
Annual Meeting of Stockholders to be filed with the SEC within 120 days after
December 31, 2018
.
Item 11. Executive Compensation
Information required by this item is incorporated by reference to the information set forth under the captions “Executive Compensation”, “Compensation Committee Report”, “Director Compensation”, and “Compensation Committee Interlocks and Insider Participation”, in our Proxy Statement for the
2019
Annual Meeting of Stockholders to be filed with the SEC within 120 days after
December 31, 2018
.
Item 12. Security Ownership of Certain Beneficial Owners and Management and Related Stockholder Matters
Securities Authorized for Issuance Under Stock-Based Compensation Plan
The following table presents information with respect to shares of our common stock that may be issued under our existing stock incentive plan as of
December 31, 2018
:
|
Plan Category
|
Number of shares of common stock to be issued upon exercise of outstanding options, warrants and rights
(In thousands)
|
Weighted-average exercise price of outstanding options, warrants and rights
|
Number of shares of common stock remaining available for future issuance under stock-based compensation plans (excluding shares reflected in column (a))
(In thousands)
|
|||
|
|
(a)
|
(b)
|
(c)
|
|||
|
Stock-based compensation plans approved by stockholders
|
(1)
|
2,780
|
(2)
|
$—
|
(3)
|
659
|
___________________________________________________________
|
(1)
|
For a description of our 2016 Omnibus Stock Incentive Plan, see Note
12
to our consolidated financial statements in Item 15 of this Report. We did not have any other stock-based compensation plans as of
December 31, 2018
.
|
|
(2)
|
Consists of
1.8 million
vested and
0.9 million
unvested LTIP Units.
|
|
(3)
|
We have no outstanding options. There are no exercise prices for LTIP Units.
|
The remaining information required by this item is incorporated by reference to the information set forth under the caption “Voting Securities and Principal Stockholders—Security Ownership of Certain Beneficial Owners and Management”, in our Proxy Statement for the
2019
Annual Meeting of Stockholders to be filed with the SEC within 120 days after
December 31, 2018
.
Item 13. Certain Relationships and Related Transactions, and Director Independence
Information required by this item is incorporated by reference to the information set forth under the captions “Election of Directors (Proposal 1) – Information Concerning Current Directors and Nominees”, “Corporate Governance” and “Transactions With Related Persons”, in our Proxy Statement for the
2019
Annual Meeting of Stockholders to be filed with the SEC within 120 days after
December 31, 2018
.
Item 14. Principal Accounting Fees and Services
Information required by this item is incorporated by reference to the information set forth under the caption “Independent Registered Public Accounting Firm” in our Proxy Statement for the
2019
Annual Meeting of Stockholders to be filed with the SEC within 120 days after
December 31, 2018
.
52
PART IV
Item 15. Exhibits and Financial Statement Schedule
(a)(1) and (2) Financial Statements and Schedules
|
Index
|
||
|
Page
|
||
|
Note: All other schedules have been omitted because the required information is not present, or not present in amounts sufficient to require submission of the schedule, or because the information required is included in the financial statements or notes thereto.
|
||
53
(a)(3) exhibits
|
Number
|
Description
|
Footnote
|
|
1.1
|
(1)
|
|
|
1.2
|
(2)
|
|
|
3.1
|
(3)
|
|
|
3.2
|
(4)
|
|
|
3.3
|
(5)
|
|
|
3.4
|
(6)
|
|
|
4.1
|
(7)
|
|
|
10.1
|
(7)
|
|
|
10.2
|
(8)
|
|
|
10.3
|
(9)
|
|
|
10.4
|
(10)
|
|
|
10.5
|
(11)
|
|
|
10.6
|
(11)
|
|
|
10.7
|
(12)
|
|
|
10.8
|
(12)
|
|
|
10.9
|
(12)
|
|
|
21.1
|
|
|
|
23.1
|
|
|
|
31.1
|
|
|
|
31.2
|
|
|
|
32.1
|
(13)
|
|
|
32.2
|
(13)
|
|
|
101.INS
|
XBRL Instance Document.*
|
|
|
101.SCH
|
XBRL Taxonomy Extension Schema Document.*
|
|
|
101.CAL
|
XBRL Taxonomy Extension Calculation Linkbase Document.*
|
|
|
101.DEF
|
XBRL Taxonomy Extension Definition Linkbase Document.*
|
|
|
101.LAB
|
XBRL Taxonomy Extension Label Linkbase Document.*
|
|
|
101.PRE
|
XBRL Taxonomy Extension Presentation Linkbase Document.*
|
|
|
*
|
Filed with this 10-K .
|
|
|
+
|
Denotes management contract or compensatory plan, contract or arrangement.
|
|
|
(1)
|
Filed with Form 8-K on August 7, 2017 and incorporated herein by this reference. (File number 001-33106)
|
|
|
(2)
|
Filed with Form 8-K on November 22, 2017 and incorporated herein by this reference. (File number 001-33106)
|
|
|
(3)
|
Filed with Amendment No. 6 to Form S-11 on October 19, 2006 and incorporated herein by this reference. (File number 333-135082)
|
|
54
|
(4)
|
Filed with Form 8-K on September 6, 2013 and incorporated herein by this reference. (File number 001-33106)
|
|
|
(5)
|
Filed with Form 8-K on October 30, 2006 and incorporated herein by this reference. (File number 001-33106)
|
|
|
(6)
|
Filed with Form 8-K on April 9, 2018 and incorporated herein by this reference. (File number 001-33106)
|
|
|
(7)
|
Filed with Amendment No. 3 to Form S-11 on October 3, 2006 and incorporated herein by this reference. (File number 333-135082)
|
|
|
(8)
|
Filed with Form S-11 on June 16, 2006 and incorporated herein by this reference. (File number 333-135082)
|
|
|
(9)
|
Filed with Amendment No. 2 to Form S-11 on September 20, 2006 and incorporated herein by this reference. (File number 333-135082)
|
|
|
(10)
|
Filed with Form 8-K on June 3, 2016 and incorporated herein by this reference. (File number 001-33106)
|
|
|
(11)
|
Filed with Form 8-K on December 12, 2016 and incorporated herein by this reference. (File number 001-33106)
|
|
|
(12)
|
Filed with Form 8-K on December 21, 2018 and incorporated herein by this reference. (File number 001-33106)
|
|
|
(13)
|
In accordance with SEC Release No. 33-8212, these exhibits are being furnished, and are not being filed as part of this Report on Form 10-K or as a separate disclosure document, and are not being incorporated by reference into any Securities Act registration statement.
|
|
Item 16. 10-K Summary
None.
55
SIGNATURES
Pursuant to the requirements of Section 13 or 15(d) of the Securities Exchange Act of 1934, the registrant has duly caused this Report to be signed on its behalf by the undersigned, thereunto duly authorized.
|
|
DOUGLAS EMMETT, INC.
|
|
|
|
|
|
|
Dated:
|
By:
|
/s/ JORDAN L. KAPLAN
|
|
February 15, 2019
|
|
Jordan L. Kaplan
|
|
|
|
President and CEO
|
Pursuant to the requirements of the Securities Exchange Act of 1934, this Report has been signed by the persons below, in their respective capacities, on behalf of the registrant as of
February 15, 2019
.
|
Signature
|
Title
|
|
|
|
|
|
|
/s/ JORDAN L. KAPLAN
|
|
|
|
Jordan L. Kaplan
|
President, CEO and Director
(Principal Executive Officer)
|
|
|
|
|
|
|
/s/ MONA M. GISLER
|
|
|
|
Mona M. Gisler
|
CFO
(Principal Financial and Accounting Officer)
|
|
|
|
|
|
|
/s/ DAN A. EMMETT
|
|
|
|
Dan A. Emmett
|
Chairman of the Board
|
|
|
|
|
|
|
/s/ KENNETH M. PANZER
|
|
|
|
Kenneth M. Panzer
|
COO and Director
|
|
|
|
|
|
|
/s/ CHRISTOPHER H. ANDERSON
|
|
|
|
Christopher H. Anderson
|
Director
|
|
|
/s/ LESLIE E. BIDER
|
|
|
|
Leslie E. Bider
|
Director
|
|
|
/s/ DR. DAVID T. FEINBERG
|
||
|
Dr. David T. Feinberg
|
Director
|
|
|
/s/ VIRGINIA A. MCFERRAN
|
||
|
Virginia A. McFerran
|
Director
|
|
|
/s/ THOMAS E. O’HERN
|
|
|
|
Thomas E. O’Hern
|
Director
|
|
|
|
|
|
|
/s/ WILLIAM E. SIMON, JR.
|
|
|
|
William E. Simon, Jr.
|
Director
|
|
56
Report of Management on Internal Control over Financial Reporting
The management of Douglas Emmett, Inc. is responsible for establishing and maintaining adequate internal control over financial reporting, as defined in Rules 13a-15(f) and 15d-15(f) under the Securities Exchange Act of 1934.
Our system of internal control is designed to provide reasonable assurance regarding the reliability of financial reporting and preparation of our financial statements for external reporting purposes in accordance with US GAAP. Our management, including the undersigned CEO and CFO, assessed the effectiveness of our internal control over financial reporting as of
December 31, 2018
. In conducting its assessment, management used the criteria issued by the Committee of Sponsoring Organizations of the Treadway Commission on Internal Control—Integrated Framework (2013 Framework). Based on this assessment, management concluded that, as of
December 31, 2018
, our internal control over financial reporting was effective based on those criteria.
Management, including our CEO and CFO, does not expect that our disclosure controls and procedures, or our internal controls will prevent all error and fraud. A control system, no matter how well conceived and operated, can provide only reasonable, not absolute, assurance that the objectives of the control system are met. Further, the design of a control system must reflect the fact that there are resource constraints and the benefit of controls must be considered relative to their costs. Because of the inherent limitations in all control systems, no evaluation of controls can provide absolute assurance that all control issues and instances of fraud, if any, have been detected.
The effectiveness of our internal control over financial reporting as of
December 31, 2018
, has been audited by Ernst & Young LLP, the independent registered public accounting firm that audited the consolidated financial statements included in this annual report, as stated in their report appearing on page
F-3
, which expresses an unqualified opinion on the effectiveness of our internal control over financial reporting as of
December 31, 2018
.
|
/s/ JORDAN L. KAPLAN
|
|
Jordan L. Kaplan
|
|
President and CEO
|
|
/s/ MONA M. GISLER
|
|
Mona M. Gisler
|
|
CFO
|
February 15, 2019
F- 1
Report of Independent Registered Public Accounting Firm
To the Shareholders and the Board of Directors of Douglas Emmett, Inc.
Opinion on the Financial Statements
We have audited the accompanying consolidated balance sheets of Douglas Emmett, Inc. (the “Company”) as of
December 31, 2018
and
2017
, and the related consolidated statements of operations, comprehensive income, equity and cash flows for each of the three years in the period ended
December 31, 2018
and the related notes and financial statement schedule listed in the Index at Item 15(a) (collectively referred to as the “consolidated financial statements”). In our opinion, the consolidated financial statements present fairly, in all material respects, the financial position of the Company at
December 31, 2018
and
2017
, and the results of its operations and its cash flows for each of the three years in the period ended
December 31, 2018
, in conformity with U.S. generally accepted accounting principles.
We also have audited, in accordance with the standards of the Public Company Accounting Oversight Board (United States) (PCAOB), the Company’s internal control over financial reporting as of December 31, 2018, based on criteria established in Internal Control-Integrated Framework issued by the Committee of Sponsoring Organizations of the Treadway Commission (2013 Framework), and our report dated
February 15, 2019
expressed an unqualified opinion thereon.
Basis for Opinion
These financial statements are the responsibility of the Company's management. Our responsibility is to express an opinion on the Company’s financial statements based on our audits. We are a public accounting firm registered with the PCAOB and are required to be independent with respect to the Company in accordance with the U.S. federal securities laws and the applicable rules and regulations of the Securities and Exchange Commission and the PCAOB.
We conducted our audits in accordance with the standards of the PCAOB. Those standards require that we plan and perform the audit to obtain reasonable assurance about whether the financial statements are free of material misstatement, whether due to error or fraud. Our audits included performing procedures to assess the risks of material misstatement of the financial statements, whether due to error or fraud, and performing procedures that respond to those risks. Such procedures included examining, on a test basis, evidence regarding the amounts and disclosures in the financial statements. Our audits also included evaluating the accounting principles used and significant estimates made by management, as well as evaluating the overall presentation of the financial statements. We believe that our audits provide a reasonable basis for our opinion.
/s/ Ernst & Young LLP
We have served as the Company's auditor since 1995.
Los Angeles, California
February 15, 2019
F- 2
Report of Independent Registered Public Accounting Firm
To the Shareholders and the Board of Directors of Douglas Emmett, Inc.
Opinion on Internal Control over Financial Reporting
We have audited Douglas Emmett, Inc.’s internal control over financial reporting as of
December 31, 2018
, based on criteria established in Internal Control-Integrated Framework issued by the Committee of Sponsoring Organizations of the Treadway Commission (2013 framework) (the COSO criteria). In our opinion, Douglas Emmett, Inc. (the Company) maintained, in all material respects, effective internal control over financial reporting as of
December 31, 2018
, based on the COSO criteria.
We also have audited, in accordance with the standards of the Public Company Accounting Oversight Board (United States) (PCAOB), the consolidated balance sheets of Douglas Emmett, Inc. as of
December 31, 2018
and
2017
and the related consolidated statements of operations, comprehensive income, equity and cash flows for each of the three years in the period ended
December 31, 2018
, and related notes and financial statement schedule listed in the Index at Item 15(a), and our report dated
February 15, 2019
expressed an unqualified opinion thereon.
Basis for Opinion
The Company’s management is responsible for maintaining effective internal control over financial reporting, and for its assessment of the effectiveness of internal control over financial reporting included in the accompanying Report of Management on Internal Control over Financial Reporting. Our responsibility is to express an opinion on the Company’s internal control over financial reporting based on our audit. We are a public accounting firm registered with the PCAOB and are required to be independent with respect to the Company in accordance with the U.S federal securities laws and the applicable rules and regulations of the Securities and Exchange Commission and the PCAOB.
We conducted our audit in accordance with the standards of the PCAOB. Those standards require that we plan and perform the audit to obtain reasonable assurance about whether effective internal control over financial reporting was maintained in all material respects.
Our audit included obtaining an understanding of internal control over financial reporting, assessing the risk that a material weakness exists, testing and evaluating the design and operating effectiveness of internal control based on the assessed risk, and performing such other procedures as we considered necessary in the circumstances. We believe that our audit provides a reasonable basis for our opinion.
Definition and Limitations of Internal Control Over Financial Reporting
A company’s internal control over financial reporting is a process designed to provide reasonable assurance regarding the reliability of financial reporting and the preparation of financial statements for external purposes in accordance with generally accepted accounting principles. A company’s internal control over financial reporting includes those policies and procedures that (1) pertain to the maintenance of records that, in reasonable detail, accurately and fairly reflect the transactions and dispositions of the assets of the company; (2) provide reasonable assurance that transactions are recorded as necessary to permit preparation of financial statements in accordance with generally accepted accounting principles, and that receipts and expenditures of the company are being made only in accordance with authorizations of management and directors of the company; and (3) provide reasonable assurance regarding prevention or timely detection of unauthorized acquisition, use, or disposition of the company’s assets that could have a material effect on the financial statements.
Because of its inherent limitations, internal control over financial reporting may not prevent or detect misstatements. Also, projections of any evaluation of effectiveness to future periods are subject to the risk that controls may become inadequate because of changes in conditions, or that the degree of compliance with the policies or procedures may deteriorate.
/s/ Ernst & Young LLP
Los Angeles, California
February 15, 2019
F- 3
Douglas Emmett, Inc.
Consolidated Balance Sheets
(In thousands, except share data)
|
|
December 31, 2018
|
December 31, 2017
|
|||||
|
Assets
|
|
|
|
|
|||
|
Investment in real estate:
|
|
|
|
|
|||
|
Land
|
$
|
1,065,099
|
|
$
|
1,062,345
|
|
|
|
Buildings and improvements
|
7,995,203
|
|
7,886,201
|
|
|||
|
Tenant improvements and lease intangibles
|
840,653
|
|
756,190
|
|
|||
|
Property under development
|
129,753
|
|
124,472
|
|
|||
|
Investment in real estate, gross
|
10,030,708
|
|
9,829,208
|
|
|||
|
Less: accumulated depreciation and amortization
|
(2,246,887
|
)
|
(2,012,752
|
)
|
|||
|
Investment in real estate, net
|
7,783,821
|
|
7,816,456
|
|
|||
|
Cash and cash equivalents
|
146,227
|
|
176,645
|
|
|||
|
Tenant receivables, net
|
4,371
|
|
2,980
|
|
|||
|
Deferred rent receivables, net
|
124,834
|
|
106,021
|
|
|||
|
Acquired lease intangible assets, net
|
3,251
|
|
4,293
|
|
|||
|
Interest rate contract assets
|
73,414
|
|
60,069
|
|
|||
|
Investment in unconsolidated real estate funds
|
111,032
|
|
107,735
|
|
|||
|
Other assets
|
14,759
|
|
18,442
|
|
|||
|
Total Assets
|
$
|
8,261,709
|
|
$
|
8,292,641
|
|
|
|
Liabilities
|
|||||||
|
Secured notes payable and revolving credit facility, net
|
$
|
4,134,030
|
|
$
|
4,117,390
|
|
|
|
Interest payable, accounts payable and deferred revenue
|
130,154
|
|
103,947
|
|
|||
|
Security deposits
|
50,733
|
|
50,414
|
|
|||
|
Acquired lease intangible liabilities, net
|
52,569
|
|
75,635
|
|
|||
|
Interest rate contract liabilities
|
1,530
|
|
807
|
|
|||
|
Dividends payable
|
44,263
|
|
42,399
|
|
|||
|
Total liabilities
|
4,413,279
|
|
4,390,592
|
|
|||
|
Equity
|
|||||||
|
Douglas Emmett, Inc. stockholders' equity:
|
|||||||
|
Common Stock, $0.01 par value, 750,000,000 authorized, 170,214,809 and 169,564,927 outstanding at December 31, 2018 and December 31, 2017, respectively
|
1,702
|
|
1,696
|
|
|||
|
Additional paid-in capital
|
3,282,316
|
|
3,272,539
|
|
|||
|
Accumulated other comprehensive income
|
53,944
|
|
43,099
|
|
|||
|
Accumulated deficit
|
(935,630
|
)
|
(879,810
|
)
|
|||
|
Total Douglas Emmett, Inc. stockholders' equity
|
2,402,332
|
|
2,437,524
|
|
|||
|
Noncontrolling interests
|
1,446,098
|
|
1,464,525
|
|
|||
|
Total equity
|
3,848,430
|
|
3,902,049
|
|
|||
|
Total Liabilities and Equity
|
$
|
8,261,709
|
|
$
|
8,292,641
|
|
|
See accompanying notes to the consolidated financial statements.
F- 4
Douglas Emmett, Inc.
Consolidated Statements of Operations
(In thousands, except per share data)
|
|
Year Ended December 31,
|
||||||||||
|
|
2018
|
2017
|
2016
|
||||||||
|
Revenues
|
|
|
|||||||||
|
Office rental
|
|
|
|||||||||
|
Rental revenues and tenant recoveries
|
$
|
661,147
|
|
$
|
606,852
|
|
$
|
545,061
|
|
||
|
Parking and other income
|
116,784
|
|
108,694
|
|
100,572
|
|
|||||
|
Total office revenues
|
777,931
|
|
715,546
|
|
645,633
|
|
|||||
|
|
|
|
|
||||||||
|
Multifamily rental
|
|||||||||||
|
Rental revenues
|
95,423
|
|
89,039
|
|
89,996
|
|
|||||
|
Parking and other income
|
7,962
|
|
7,467
|
|
6,922
|
|
|||||
|
Total multifamily revenues
|
103,385
|
|
96,506
|
|
96,918
|
|
|||||
|
Total revenues
|
881,316
|
|
812,052
|
|
742,551
|
|
|||||
|
|
|
|
|
||||||||
|
Operating Expenses
|
|||||||||||
|
Office expenses
|
252,751
|
|
233,633
|
|
214,546
|
|
|||||
|
Multifamily expenses
|
28,116
|
|
24,401
|
|
23,317
|
|
|||||
|
General and administrative
|
38,641
|
|
36,234
|
|
34,957
|
|
|||||
|
Depreciation and amortization
|
309,864
|
|
276,761
|
|
248,914
|
|
|||||
|
Total operating expenses
|
629,372
|
|
571,029
|
|
521,734
|
|
|||||
|
Operating income
|
251,944
|
|
241,023
|
|
220,817
|
|
|||||
|
Other income
|
11,414
|
|
9,712
|
|
8,759
|
|
|||||
|
Other expenses
|
(7,472
|
)
|
(7,037
|
)
|
(9,477
|
)
|
|||||
|
Income, including depreciation, from unconsolidated real estate funds
|
6,400
|
|
5,905
|
|
7,812
|
|
|||||
|
Interest expense
|
(133,402
|
)
|
(145,176
|
)
|
(146,148
|
)
|
|||||
|
Demolition expenses
|
(272
|
)
|
—
|
|
—
|
|
|||||
|
Income before gains
|
128,612
|
|
104,427
|
|
81,763
|
|
|||||
|
Gains on sales of investments in real estate
|
—
|
|
—
|
|
14,327
|
|
|||||
|
Net income
|
128,612
|
|
104,427
|
|
96,090
|
|
|||||
|
Less: Net income attributable to noncontrolling interests
|
(12,526
|
)
|
(9,984
|
)
|
(10,693
|
)
|
|||||
|
Net income attributable to common stockholders
|
$
|
116,086
|
|
$
|
94,443
|
|
$
|
85,397
|
|
||
|
Net income attributable to common stockholders per share – basic
|
$
|
0.68
|
|
$
|
0.58
|
|
$
|
0.57
|
|
||
|
Net income attributable to common stockholders per share – diluted
|
$
|
0.68
|
|
$
|
0.58
|
|
$
|
0.55
|
|
||
See accompanying notes to the consolidated financial statements.
F- 5
Douglas Emmett, Inc.
Consolidated Statements of Comprehensive Income
(In thousands)
|
|
Year Ended December 31,
|
||||||||||
|
|
2018
|
2017
|
2016
|
||||||||
|
Net income
|
$
|
128,612
|
|
$
|
104,427
|
|
$
|
96,090
|
|
||
|
Other comprehensive income: cash flow hedges
|
15,070
|
|
34,290
|
|
40,474
|
|
|||||
|
Comprehensive income
|
143,682
|
|
138,717
|
|
136,564
|
|
|||||
|
Less: Comprehensive income attributable to noncontrolling interests
|
(16,751
|
)
|
(16,331
|
)
|
(26,726
|
)
|
|||||
|
Comprehensive income attributable to common stockholders
|
$
|
126,931
|
|
$
|
122,386
|
|
$
|
109,838
|
|
||
See accompanying notes to the consolidated financial statements.
F- 6
Douglas Emmett, Inc.
Consolidated Statements of Equity
(In thousands, except per share data)
|
|
Year Ended December 31,
|
|||||||||||
|
|
2018
|
2017
|
2016
|
|||||||||
|
|
|
|
||||||||||
|
Shares of Common Stock
|
Beginning balance
|
169,565
|
|
151,530
|
|
146,919
|
|
|||||
|
Conversion of OP Units
|
629
|
|
1,059
|
|
1,753
|
|
||||||
|
Issuance of common stock
|
—
|
|
15,687
|
|
1,400
|
|
||||||
|
Exercise of stock options
|
21
|
|
1,289
|
|
1,458
|
|
||||||
|
Ending balance
|
170,215
|
|
169,565
|
|
151,530
|
|
||||||
|
|
|
|
|
|||||||||
|
Common Stock
|
Beginning balance
|
$
|
1,696
|
|
$
|
1,515
|
|
$
|
1,469
|
|
||
|
Conversion of OP Units
|
6
|
|
11
|
|
17
|
|
||||||
|
Issuance of common stock
|
—
|
|
157
|
|
14
|
|
||||||
|
Exercise of stock options
|
—
|
|
13
|
|
15
|
|
||||||
|
Ending balance
|
$
|
1,702
|
|
$
|
1,696
|
|
$
|
1,515
|
|
|||
|
|
|
|
|
|||||||||
|
Additional Paid-in Capital
|
Beginning balance
|
$
|
3,272,539
|
|
$
|
2,725,157
|
|
$
|
2,706,753
|
|
||
|
Conversion of OP Units
|
10,286
|
|
14,231
|
|
23,043
|
|
||||||
|
Repurchase of OP Units
|
(59
|
)
|
(6,763
|
)
|
(498
|
)
|
||||||
|
Issuance of common stock
|
—
|
|
593,011
|
|
49,365
|
|
||||||
|
Taxes paid on exercise of stock options
|
(450
|
)
|
(53,097
|
)
|
(53,506
|
)
|
||||||
|
Ending balance
|
$
|
3,282,316
|
|
$
|
3,272,539
|
|
$
|
2,725,157
|
|
|||
|
|
|
|
|
|||||||||
|
AOCI
|
Beginning balance
|
$
|
43,099
|
|
$
|
15,156
|
|
$
|
(9,285
|
)
|
||
|
Beginning balance adjustment - ASU 2017-12 adoption
|
211
|
|
—
|
|
—
|
|
||||||
|
Cash flow hedge fair value adjustments
|
10,634
|
|
27,943
|
|
24,441
|
|
||||||
|
Ending balance
|
$
|
53,944
|
|
$
|
43,099
|
|
$
|
15,156
|
|
|||
|
|
|
|
|
|||||||||
|
Accumulated Deficit
|
Beginning balance
|
$
|
(879,810
|
)
|
$
|
(820,685
|
)
|
$
|
(772,726
|
)
|
||
|
Beginning balance adjustment - ASU 2017-12 adoption
|
(211
|
)
|
—
|
|
—
|
|
||||||
|
Net income attributable to common stockholders
|
116,086
|
|
94,443
|
|
85,397
|
|
||||||
|
Dividends
|
(171,695
|
)
|
(153,568
|
)
|
(133,356
|
)
|
||||||
|
Ending balance
|
$
|
(935,630
|
)
|
$
|
(879,810
|
)
|
$
|
(820,685
|
)
|
|||
|
Noncontrolling Interests
|
Beginning balance
|
$
|
1,464,525
|
|
$
|
1,092,928
|
|
$
|
355,337
|
|
||
|
Net income attributable to noncontrolling interests
|
12,526
|
|
9,984
|
|
10,693
|
|
||||||
|
Cash flow hedge fair value adjustments
|
4,225
|
|
6,347
|
|
16,033
|
|
||||||
|
Contributions
|
—
|
|
284,248
|
|
459,752
|
|
||||||
|
Sales of equity interests in consolidated JVs
|
—
|
|
—
|
|
291,028
|
|
||||||
|
Distributions
|
(52,142
|
)
|
(38,101
|
)
|
(35,478
|
)
|
||||||
|
Issuance of OP Units for acquisition of real estate
|
—
|
|
105,687
|
|
|
|
||||||
|
Conversion of OP Units
|
(10,292
|
)
|
(14,242
|
)
|
(23,060
|
)
|
||||||
|
Repurchase of OP Units with cash
|
(49
|
)
|
(3,341
|
)
|
(328
|
)
|
||||||
|
Stock-based compensation
|
27,305
|
|
21,015
|
|
18,951
|
|
||||||
|
Ending balance
|
$
|
1,446,098
|
|
$
|
1,464,525
|
|
$
|
1,092,928
|
|
|||
|
|
|
|
|
|||||||||
|
Total Equity
|
Beginning balance
|
$
|
3,902,049
|
|
$
|
3,014,071
|
|
$
|
2,281,548
|
|
||
|
Net income
|
128,612
|
|
104,427
|
|
96,090
|
|
||||||
|
Cash flow hedge fair value adjustments
|
14,859
|
|
34,290
|
|
40,474
|
|
||||||
|
Issuance of common stock, net
|
—
|
|
593,168
|
|
49,379
|
|
||||||
|
Issuance of OP Units for acquisition of real estate
|
—
|
|
105,687
|
|
—
|
|
||||||
|
Repurchase of OP Units with cash
|
(108
|
)
|
(10,104
|
)
|
(826
|
)
|
||||||
|
Taxes paid on exercise of stock options
|
(450
|
)
|
(53,084
|
)
|
(53,491
|
)
|
||||||
|
Contributions
|
—
|
|
284,248
|
|
459,752
|
|
||||||
|
Sales of equity interests in consolidated JVs
|
—
|
|
—
|
|
291,028
|
|
||||||
|
Dividends
|
(171,695
|
)
|
(153,568
|
)
|
(133,356
|
)
|
||||||
|
Distributions
|
(52,142
|
)
|
(38,101
|
)
|
(35,478
|
)
|
||||||
|
Stock-based compensation
|
27,305
|
|
21,015
|
|
18,951
|
|
||||||
|
Ending balance
|
$
|
3,848,430
|
|
$
|
3,902,049
|
|
$
|
3,014,071
|
|
|||
|
Dividends declared per common share
|
$
|
1.01
|
|
$
|
0.94
|
|
$
|
0.89
|
|
|||
F- 7
|
|
Year Ended December 31,
|
||||||||||
|
|
2018
|
|
2017
|
|
2016
|
||||||
|
Operating Activities
|
|
|
|
|
|||||||
|
Net income
|
$
|
128,612
|
|
$
|
104,427
|
|
$
|
96,090
|
|
||
|
Adjustments to reconcile net income to net cash provided by operating activities:
|
|||||||||||
|
Income, including depreciation, from unconsolidated real estate funds
|
(6,400
|
)
|
(5,905
|
)
|
(7,812
|
)
|
|||||
|
Gains on sales of investments in real estate
|
—
|
|
—
|
|
(14,327
|
)
|
|||||
|
Depreciation and amortization
|
309,864
|
|
276,761
|
|
248,914
|
|
|||||
|
Net accretion of acquired lease intangibles
|
(22,025
|
)
|
(18,006
|
)
|
(18,198
|
)
|
|||||
|
Straight-line rent
|
(18,813
|
)
|
(12,855
|
)
|
(13,599
|
)
|
|||||
|
Increase in the allowance for doubtful accounts
|
2,154
|
|
406
|
|
422
|
|
|||||
|
Deferred loan costs amortized and written off
|
8,292
|
|
10,834
|
|
8,927
|
|
|||||
|
Amortization of loan premium
|
(205
|
)
|
—
|
|
—
|
|
|||||
|
Non-cash market value adjustments on interest rate contracts
|
—
|
|
51
|
|
(196
|
)
|
|||||
|
Amortization of stock-based compensation
|
22,299
|
|
18,478
|
|
17,448
|
|
|||||
|
Operating distributions from unconsolidated real estate funds
|
6,400
|
|
5,905
|
|
2,668
|
|
|||||
|
Change in working capital components:
|
|||||||||||
|
Tenant receivables
|
(3,545
|
)
|
(1,221
|
)
|
(680
|
)
|
|||||
|
Interest payable, accounts payable and deferred revenue
|
1,376
|
|
24,942
|
|
10,712
|
|
|||||
|
Security deposits
|
319
|
|
4,424
|
|
7,307
|
|
|||||
|
Other assets
|
4,654
|
|
(5,544
|
)
|
1,773
|
|
|||||
|
Net cash provided by operating activities
|
432,982
|
|
402,697
|
|
339,449
|
|
|||||
|
Investing Activities
|
|||||||||||
|
Capital expenditures for improvements to real estate
|
(179,062
|
)
|
(108,326
|
)
|
(91,826
|
)
|
|||||
|
Capital expenditures for developments
|
(68,459
|
)
|
(63,018
|
)
|
(27,720
|
)
|
|||||
|
Property acquisitions
|
—
|
|
(537,669
|
)
|
(1,619,759
|
)
|
|||||
|
Proceeds from sale of investments in real estate, net
|
—
|
|
—
|
|
348,203
|
|
|||||
|
Loan payments received from related parties
|
—
|
|
—
|
|
763
|
|
|||||
|
Acquisition of additional interests in unconsolidated real estate funds
|
(9,379
|
)
|
(4,142
|
)
|
—
|
|
|||||
|
Capital distributions from unconsolidated real estate funds
|
7,349
|
|
43,560
|
|
24,170
|
|
|||||
|
Net cash used in investing activities
|
(249,551
|
)
|
(669,595
|
)
|
(1,366,169
|
)
|
|||||
|
Financing Activities
|
|||||||||||
|
Proceeds from borrowings
|
667,000
|
|
1,410,500
|
|
2,109,500
|
|
|||||
|
Repayment of borrowings
|
(655,326
|
)
|
(1,698,544
|
)
|
(1,335,580
|
)
|
|||||
|
Loan cost payments
|
(2,992
|
)
|
(11,442
|
)
|
(24,586
|
)
|
|||||
|
Contributions from noncontrolling interests in consolidated JVs
|
—
|
|
284,248
|
|
459,752
|
|
|||||
|
Distributions paid to noncontrolling interests
|
(52,142
|
)
|
(38,101
|
)
|
(35,478
|
)
|
|||||
|
Dividends paid to common stockholders
|
(169,831
|
)
|
(146,026
|
)
|
(130,821
|
)
|
|||||
|
Taxes paid on exercise of stock options
|
(450
|
)
|
(53,084
|
)
|
(53,491
|
)
|
|||||
|
Repurchase of OP Units
|
(108
|
)
|
(10,104
|
)
|
(826
|
)
|
|||||
|
Proceeds from issuance of common stock, net
|
—
|
|
593,169
|
|
49,379
|
|
|||||
|
Net cash (used in) provided by financing activities and restricted cash
|
(213,849
|
)
|
330,616
|
|
1,037,849
|
|
|||||
|
(Decrease) increase in cash and cash equivalents
|
(30,418
|
)
|
63,718
|
|
11,129
|
|
|||||
|
Cash and cash equivalents and restricted cash - beginning balance
|
176,766
|
|
113,048
|
|
101,919
|
|
|||||
|
Cash and cash equivalents and restricted cash - ending balance
|
$
|
146,348
|
|
$
|
176,766
|
|
$
|
113,048
|
|
||
Supplemental Cash Flows Information
|
|
Year Ended December 31,
|
||||||||||
|
|
2018
|
2017
|
2016
|
||||||||
|
Operating Activities
|
|||||||||||
|
Cash paid for interest, net of capitalized interest
|
$
|
124,487
|
|
$
|
135,824
|
|
$
|
137,884
|
|
||
|
Capitalized interest paid
|
$
|
3,520
|
|
$
|
2,745
|
|
$
|
1,193
|
|
||
|
Non-cash Investing Transactions
|
|||||||||||
|
Accrual for real estate and development capital expenditures
|
$
|
24,702
|
|
$
|
3,776
|
|
$
|
7,182
|
|
||
|
Capitalized stock-based compensation for improvements to real estate and developments
|
$
|
5,006
|
|
$
|
2,537
|
|
$
|
1,503
|
|
||
|
Removal of fully depreciated and amortized tenant improvements and lease intangibles
|
$
|
75,729
|
|
$
|
53,687
|
|
$
|
146,739
|
|
||
|
Removal of fully amortized acquired lease intangible assets
|
$
|
1,582
|
|
$
|
414
|
|
$
|
1,306
|
|
||
|
Removal of fully accreted acquired lease intangible liabilities
|
$
|
15,431
|
|
$
|
5,057
|
|
$
|
56,278
|
|
||
|
Issuance of OP Units for acquisition of real estate
|
$
|
—
|
|
$
|
105,687
|
|
$
|
—
|
|
||
|
Application of deposit to acquisition of real estate
|
$
|
—
|
|
$
|
—
|
|
$
|
75,000
|
|
||
|
Non-cash Financing Transactions
|
|||||||||||
|
Gain recorded in AOCI - Adoption of ASU 2017-12 - consolidated derivatives
|
$
|
211
|
|
$
|
—
|
|
$
|
—
|
|
||
|
Gain recorded in AOCI - consolidated derivatives
|
$
|
22,723
|
|
$
|
16,512
|
|
$
|
14,192
|
|
||
|
Gain recorded in AOCI - unconsolidated Funds' derivatives (our share)
|
$
|
3,052
|
|
$
|
3,275
|
|
$
|
8
|
|
||
|
Assumption of term loan for acquisition of real estate
|
$
|
—
|
|
$
|
36,460
|
|
$
|
—
|
|
||
|
Dividends declared
|
$
|
171,695
|
|
$
|
153,568
|
|
$
|
133,356
|
|
||
|
Common stock issued in exchange for OP Units
|
$
|
10,292
|
|
$
|
14,242
|
|
$
|
23,060
|
|
||
See accompanying notes to the consolidated financial statements.
F- 8
1. Overview
Organization and Business Description
Douglas Emmett, Inc. is a fully integrated, self-administered and self-managed REIT. We are one of the largest owners and operators of high-quality office and multifamily properties in Los Angeles County, California and Honolulu, Hawaii. Through our interest in our Operating Partnership and its subsidiaries, consolidated JVs and unconsolidated Funds, we focus on owning, acquiring, developing and managing a significant market share of top-tier office properties and premier multifamily communities in neighborhoods that possess significant supply constraints, high-end executive housing and key lifestyle amenities. The terms "us," "we" and "our" as used in the financial statements refer to Douglas Emmett, Inc. and its subsidiaries on a consolidated basis.
At
December 31, 2018
, our Consolidated Portfolio consisted of (i) a
16.6 million
square foot office portfolio, (ii)
3,595
multifamily apartment units and (iii) fee interests in
two
parcels of land from which we receive rent under ground leases. We also manage and own equity interests in unconsolidated Funds which, at
December 31, 2018
, owned an additional
1.8 million
square feet of office space. We manage our unconsolidated Funds alongside our Consolidated Portfolio, and we therefore present the statistics for our office portfolio on a Total Portfolio basis. As of
December 31, 2018
, our portfolio (not including
two
parcels of land from which we receive rent under ground leases), consisted of the following office and multifamily properties (both of which include ancillary retail space):
|
|
Consolidated Portfolio
|
Total Portfolio
|
|
|
Office
|
|||
|
Wholly-owned properties
|
53
|
53
|
|
|
Consolidated JV properties
|
10
|
10
|
|
|
Unconsolidated Fund properties
|
—
|
8
|
|
|
63
|
71
|
||
|
Multifamily
|
|||
|
Wholly-owned properties
|
10
|
10
|
|
|
Total
|
73
|
81
|
|
Basis of Presentation
The accompanying financial statements are the consolidated financial statements of Douglas Emmett, Inc. and its subsidiaries, including our Operating Partnership and our consolidated JVs. All significant intercompany balances and transactions have been eliminated in our consolidated financial statements. Our Operating Partnership and consolidated JVs are VIEs of which we are the primary beneficiary. As of
December 31, 2018
, the total consolidated assets, liabilities and equity of the VIEs was
$8.26 billion
(of which
$7.78 billion
related to investment in real estate),
$4.41 billion
and
$3.85 billion
(of which
$1.45 billion
related to noncontrolling interests), respectively.
During the current reporting period, we reported our office rental revenues and tenant recoveries on a combined basis as Rental revenues and tenant recoveries in our consolidated statements of operations and we reclassified the comparable periods to conform to the current period presentation.
The accompanying financial statements have been prepared pursuant to the rules and regulations of the SEC in conformity with US GAAP as established by the FASB in the ASC. The accompanying financial statements include, in our opinion, all adjustments, consisting of normal recurring adjustments, necessary to present fairly the financial information set forth therein. Any reference to the number or class of properties, square footage, per square footage amounts, apartment units and geography, are unaudited and outside the scope of our independent registered public accounting firm’s audit of our financial statements in accordance with the standards of the PCAOB.
F- 9
2. Summary of Significant Accounting Policies
Use of Estimates
The preparation of financial statements in conformity with GAAP requires management to make certain estimates that affect the reported amounts in the consolidated financial statements and accompanying notes. Actual results could differ materially from those estimates.
Investment in Real Estate
Acquisitions
We account for property acquisitions as asset acquisitions, and include the acquired properties results of operations in our results of operations from the respective acquisition date. We allocate the purchase price, which includes the capitalized transaction costs, to: (i) land, (ii) buildings and improvements, (iii) tenant improvements and identifiable intangible assets such as in-place at-market leases, (iv) acquired above- and below-market ground and tenant leases (including for renewal options), and if applicable (v) assumed debt, based upon our estimates of expected future cash flows and other valuation techniques. Our estimates are based upon expected future cash flows and other valuation techniques. We estimate the relative fair values of the tangible assets on an ‘‘as-if-vacant’’ basis. The estimated relative fair value of acquired in-place at-market leases are the estimated costs to lease the property to the occupancy level at the date of acquisition, including the fair value of leasing commissions and legal costs. We evaluate the time period over which we expect such occupancy level to be achieved and include an estimate of the net operating costs (primarily real estate taxes, insurance and utilities) incurred during the lease-up period. Above- and below-market ground and tenant leases are recorded as an asset or liability based on the present value (using an interest rate which reflects the risks associated with the leases acquired) of the difference between the contractual amounts to be paid or received pursuant to the in-place ground or tenant leases, respectively, and our estimate of the fair market rental rates for the corresponding in-place leases, over the remaining non-cancelable term of the lease. Assumed debt is recorded at fair value based upon the present value of the expected future payments. See Note
3
for our property acquisition disclosures.
Depreciation
Buildings and improvements are depreciated on a straight-line basis using an estimated life of
forty years
for buildings and
fifteen years
for improvements, and are carried on our balance sheet, offset by the related accumulated depreciation and any impairment charges, until they are sold. Tenant improvements are depreciated on a straight-line basis over the life of the related lease, with any remaining balance depreciated in the period of any early lease termination. Acquired in-place leases are amortized on a straight line basis over the weighted average remaining term of the acquired in-place leases, and are carried on our balance sheet, offset by the related accumulated amortization, until the related building is either sold or impaired. Lease intangibles are amortized on a straight-line basis over the related lease term, with any remaining balance amortized in the period of any early lease termination. Acquired above- and below-market tenant leases are amortized/accreted on a straight line basis over the life of the related lease and recorded as either an increase (for below-market leases) or a decrease (for above-market leases) to rental revenue. Acquired above- and below-market ground leases, from which we earn ground rent income, are amortized/accreted on a straight line basis over the life of the related lease and recorded either as an increase (for below-market leases) or a decrease (for above-market leases) to rental revenue. Acquired above- and below-market ground leases, for which we incur ground rent expense, are accreted/ amortized over the life of the related lease and recorded either as an increase (for below-market leases) or a decrease (for above-market leases) to expense. We accelerate depreciation for affected assets when we renovate our buildings or existing buildings are impacted by new developments. When assets are sold or retired, their cost and related accumulated depreciation or amortization are removed from our balance sheet with the resulting gains or losses, if any, reflected in our results of operations for the respective period.
Real Estate Held for Sale
Properties are classified as held for sale in our consolidated balance sheets when they meet certain requirements, including the approval of the sale of the property, the marketing of the property for sale, and our expectation that the sale will likely occur within the next 12 months. Properties classified as held for sale are carried at the lower of their carrying value or fair value less costs to sell, and we also cease to depreciate the property. As of
December 31, 2018
and
2017
, we did not have any properties held for sale.
F- 10
Dispositions
Recognition of gains or losses from sales of investments in real estate requires that we meet certain revenue recognition criteria and transfer control of the real estate to the buyer. The gain or loss recorded is measured as the difference between the sales price, less costs to sell, and the carrying value of the real estate when we sell it. See Note
3
for our property disposition disclosures.
Cost capitalization
Costs incurred during the period of construction of real estate are capitalized. Cost capitalization of development and redevelopment activities begins during the predevelopment period, which we define as the activities that are necessary to begin the development of the property. We cease capitalization upon substantial completion of the project, but no later than one year from cessation of major construction activity. We also cease capitalization when activities necessary to prepare the property for its intended use have been suspended. Capitalized costs are included in Property under development in our consolidated balance sheets. Once major construction activity has ceased and the development or redevelopment property is in the lease-up phase, the capitalized costs are transferred to (i) Land, (ii) Building and improvements and (iii) Tenant improvements and lease intangibles on our consolidated balance sheets as the historical cost of the property. Demolition expenses and repairs and maintenance are recorded as expense when incurred.
During
2018
,
2017
and
2016
, we capitalized
$78.7 million
,
$66.0 million
and
$31.6 million
of costs related to our developments, respectively, which included
$3.5 million
,
$2.7 million
and
$1.2 million
of capitalized interest, respectively.
Investment in Unconsolidated Real Estate Funds
We manage and hold equity interests in
three
Funds: Fund X, Partnership X and the Opportunity Fund. As of
December 31, 2018
, we held direct and indirect equity interests of
71.3%
of Fund X,
24.5%
of Partnership X and
6.2%
of the Opportunity Fund. We account for our investments in the Funds using the equity method because we have significant influence but not control over the Funds, and our Funds do not qualify as VIEs. Our investment balance includes our share of the net assets of the combined Funds, acquisition basis difference, additional basis for capital raising costs, our share of our Funds' accumulated other comprehensive income (loss) related to our Funds' derivatives, and notes receivable from our Funds. As of
December 31, 2018
and
2017
, the total basis difference was
$2.2 million
and
$2.9 million
, respectively. See Note
5
for our Fund disclosures.
Impairment of Long-Lived Assets
We periodically assess whether there has been any impairment in the carrying value of our properties and whenever events or changes in circumstances indicate that the carrying value of a property may not be recoverable. An impairment charge would be recorded if events or changes in circumstances indicate that a decline in the fair value below the carrying value has occurred and the decline is other-than-temporary. Recoverability of the carrying value of our properties is measured by a comparison of the carrying value to the undiscounted future cash flows expected to be generated by the property. If the carrying value exceeds the estimated undiscounted future cash flows, an impairment loss is recorded equal to the difference between the property's carrying value and its fair value based on the estimated discounted future cash flows. We also perform a similar periodic assessment for our investments in our Funds. Based upon such periodic assessments, no impairments occurred during
2018
,
2017
or
2016
.
Cash and Cash Equivalents
We consider short-term investments with maturities of three months or less when purchased to be cash equivalents.
Revenue Recognition
Rental revenues and tenant recoveries from tenant leases are included in Rental revenues and tenant recoveries in the consolidated statements of operations. All of our tenant leases are classified as operating leases. For lease terms exceeding one year, rental income is recognized on a straight-line basis over the lease term. Deferred rent receivables represent rental revenue recognized on a straight-line basis in excess of billed rents. If a lease is canceled then the deferred rent is recognized over the new remaining lease term. We recognized straight line rent of
$18.8 million
,
$12.9 million
and
$13.6 million
during
2018
,
2017
and
2016
, respectively. Rental revenue from month-to-month leases or leases with no scheduled rent increases or other adjustments is recognized on a monthly basis when earned.
Lease termination fees, which are included in Rental revenues and tenant recoveries in the consolidated statements of operations, are recognized on a straight line basis over the new remaining lease term when the related lease is canceled. We recognized lease termination revenue of
$1.6 million
,
$2.1 million
and
$2.4 million
during
2018
,
2017
and
2016
, respectively.
F- 11
Tenant improvements constructed, and owned by us, and reimbursed by tenants are recorded as our assets, and the related revenue, which are included in Rental revenues and tenant recoveries in the consolidated statements of operations, is recognized over the related lease term. We recognized revenue for leasehold improvements of
$3.5 million
,
$2.6 million
and
$2.6 million
during
2018
,
2017
and
2016
, respectively.
Estimated tenant recoveries for real estate taxes, common area maintenance and other recoverable operating expenses, which are included in Rental revenues and tenant recoveries in the consolidated statements of operations, are recognized as revenue on a gross basis in the period that the recoverable expenses are incurred. Subsequent to year-end, we perform reconciliations on a lease-by-lease basis and bill or credit each tenant for any differences between the estimated expenses we billed to the tenant and the actual expenses incurred.
Office parking revenues, which are included in office Parking and other income in our consolidated statements of operations, are within the scope of Topic 606 (Revenue from Contracts with Customers), which we adopted in the first quarter of 2018 on a prospective basis. See "Adopted ASUs" further below. The lease contracts generally make a specified number of parking spaces available to the tenant, and we bill and recognize parking revenues on a monthly basis in accordance with the lease agreements generally using the monthly parking rates in effect at the time of billing. Office parking revenues were
$102.5 million
,
$96.2 million
and
$88.8 million
for the years ended
December 31, 2018
,
2017
and
2016
, respectively. Office parking receivables were
$1.1 million
and
$1.0 million
as of
December 31, 2018
and
2017
, respectively, and are included in Tenant receivables in our consolidated balance sheets.
Allowances for Tenant Receivables and Deferred Rent Receivables
We present our tenant receivables and deferred rent receivables net of allowances on our consolidated balance sheets. Tenant receivables consist primarily of amounts due for contractual lease payments and reimbursements of common area maintenance expenses, property taxes, and other costs recoverable from tenants. Deferred rent receivables represent the amount by which the cumulative straight-line rental revenue recorded to date exceeds the cumulative cash rents billed to date under the lease agreement. We consider many factors when evaluating the level of allowances necessary, including evaluations of individual tenant receivables, historical loss activity, current economic conditions and other relevant factors. We generally obtain letters of credit or security deposits from our tenants. The table below presents our allowances and security obtained from our tenants:
|
(In thousands)
|
December 31, 2018
|
December 31, 2017
|
|||||
|
Allowance for tenant receivables
|
$
|
5,215
|
|
$
|
3,062
|
|
|
|
Allowance for deferred rent receivables
|
$
|
2,849
|
|
$
|
3,405
|
|
|
|
Letters of credit from our tenants
|
$
|
27,749
|
|
$
|
25,212
|
|
|
|
Cash security deposits from our tenants
|
$
|
50,733
|
|
$
|
50,414
|
|
|
The table below presents the impact of the changes in our allowances on our results of operations:
|
Year Ended December 31,
|
|||||||||||
|
(In thousands)
|
2018
|
2017
|
2016
|
||||||||
|
Tenant receivables allowance - decrease in net income
|
$
|
(2,154
|
)
|
$
|
(406
|
)
|
$
|
(422
|
)
|
||
|
Deferred rent receivables allowance - increase in net income
|
$
|
556
|
|
$
|
1,739
|
|
$
|
898
|
|
||
Insurance Recoveries
Insurance recoveries related to property damage are recorded as other income when payment is either received or receipt is determined to be probable.
F- 12
Interest Income
Interest income from our short-term money market fund investments is recognized on an accrual basis. Interest income is included in other income in the consolidated statements of operations.
Loan Costs
Loan costs incurred directly with the issuance of secured notes payable and revolving credit facilities are deferred and amortized to interest expense over the respective loan or credit facility term. Any unamortized amounts are written off upon early repayment of the secured notes payable, and the related cost and accumulated amortization are removed from our balance sheet.
To the extent that a refinancing is considered an exchange of debt with the same lender, we account for loan costs based upon whether the old debt is determined to be modified or extinguished for accounting purposes. If the old debt is determined to be modified then we (i) continue to defer and amortize any unamortized deferred loan costs associated with the old debt at the time of the modification over the new term of the modified debt, (ii) defer and amortize the lender costs incurred in connection with the modification over the new term of the modified debt, and (iii) expense all other costs associated with the modification. If the old debt is determined to be extinguished then we (i) write off any unamortized deferred loan costs associated with the extinguished debt at the time of the extinguishment and remove the related cost and accumulated amortization from our balance sheet, (ii) expense all lender costs associated with the extinguishment, and (iii) defer and amortize all other costs incurred directly in connection with the extinguishment over the term of the new debt.
In circumstances where we modify or exchange our revolving credit facility with the same lender, we account for the loan costs based upon whether the borrowing capacity of the new arrangement is (a) equal to or greater than the borrowing capacity of the old arrangement, or (b) less than the borrowing capacity of the old arrangement (borrowing capacity is defined as the product of the remaining term and the maximum available credit). If the borrowing capacity of the new arrangement is greater than or equal to the borrowing capacity of the old arrangement, then we (i) continue to defer and amortize the unamortized deferred loan costs from the old arrangement over the term of the new arrangement and (ii) defer all lender and other costs incurred directly in connection with the new arrangement over the term of the new arrangement. If the borrowing capacity of the new arrangement is less than the borrowing capacity of the old arrangement, then we (i) write off any unamortized deferred loan costs at the time of the transaction related to the old arrangement in proportion to the decrease in the borrowing capacity of the old arrangement and (ii) defer all lender and other costs incurred directly in connection with the new arrangement over the term of the new arrangement.
Deferred loan costs are presented on the balance sheet as a deduction from the carrying amount of our secured notes payable and revolving credit facility. All loan costs expensed and deferred loan costs amortized are included in interest expense in our consolidated statements of operations. See Note
7
for our loan cost disclosures.
Debt Discounts and Premiums
Debt discounts and premiums related to recording debt assumed in connection with property acquisitions at fair value are generally amortized and accreted, respectively, on a straight-line basis over the remaining term of the related loan, which approximates the effective interest method. The amortization/accretion is included in interest expense in our consolidated statements of operations.
Derivative Contracts
We make use of interest rate swap and cap contracts to manage the risk associated with changes in interest rates on our floating-rate debt. When we enter into a floating-rate term loan, we generally enter into an interest rate swap agreement for the equivalent principal amount, for a period covering the majority of the loan term, which effectively converts our floating-rate debt to a fixed-rate basis during that time. In limited instances, we also make use of interest rate caps to limit our exposure to interest rate increases on our floating-rate debt. We do not speculate in derivatives and we do not make use of any other derivative instruments.
F- 13
We adopted ASU No. 2017-12 on a prospective basis in the first quarter of 2018 - see "Adopted ASUs" further below. When entering into derivative agreements, we generally elect to designate them as cash flow hedges for accounting purposes. Changes in fair value of hedging instruments designated as cash flow hedges are recorded in accumulated other comprehensive income (loss) (AOCI), which is a component of equity outside of earnings. For our Funds' hedging instruments designated as cash flow hedges, we record our share of the changes in fair value of the hedging instrument in AOCI. Amounts recorded in AOCI related to our designated hedges are reclassified to interest expense as interest payments are made on the hedged floating rate debt. Amounts reported in AOCI related to our Funds' hedges are reclassified to income, including depreciation, from unconsolidated real estate funds, as interest payments are made by our Funds on their hedged floating rate debt. Changes in fair value of hedging instruments not designated as cash flow hedges are recorded as interest expense.
We present our derivatives on the balance sheet at fair value on a gross basis. Our share of the fair value of our Funds' derivatives is included in our investment in unconsolidated real estate funds on our consolidated balance sheet. See Note
9
for our derivative disclosures.
Stock-Based Compensation
We account for stock-based compensation, including stock options and LTIP Units, using the fair value method of accounting. The estimated fair value of stock options and LTIP Units is amortized over the vesting period, which is based upon service. See Note
12
for our stock-based compensation disclosures.
EPS
We calculate basic EPS by dividing the net income attributable to common stockholders for the period by the weighted average number of common shares outstanding during the respective period. We calculate diluted EPS by dividing the net income attributable to common stockholders for the period by the weighted average number of common shares and dilutive instruments outstanding during the respective period using the treasury stock method. Unvested LTIP Units contain non-forfeitable rights to dividends and we account for them as participating securities and include them in the computation of basic and diluted EPS using the two-class method. See Note
11
for our EPS disclosures.
Segment Information
Segment information is prepared on the same basis that our management reviews information for operational decision-making purposes. We operate
two
business segments: the acquisition, development, ownership and management of office real estate, and the acquisition, development, ownership and management of multifamily real estate. The services for our office segment include primarily rental of office space and other tenant services, including parking and storage space rental. The services for our multifamily segment include primarily rental of apartments and other tenant services, including parking and storage space rental. See Note
14
for our segment disclosures.
Income Taxes
We have elected to be taxed as a REIT under the Code, commencing with our initial taxable year ended December 31, 2006. To qualify as a REIT, we are required (among other things) to distribute at least
90%
of our REIT taxable income to our stockholders and meet various other requirements imposed by the Code relating to matters such as operating results, asset holdings, distribution levels and diversity of stock ownership. Provided that we qualify for taxation as a REIT, we are generally not subject to corporate-level income tax on the earnings distributed currently to our stockholders that we derive from our REIT qualifying activities. If we fail to qualify as a REIT in any taxable year, and are unable to avail ourselves of certain savings provisions set forth in the Code, all of our taxable income would be subject to federal income tax at regular corporate rates, including any applicable alternative minimum tax for taxable years prior to 2018. We have elected to treat several of our subsidiaries as TRSs, which generally may engage in any business, including the provision of customary or non-customary services to our tenants. A TRS is treated as a regular corporation and is subject to federal income tax and applicable state income and franchise taxes at regular corporate rates. Our TRSs did not have significant tax provisions or deferred income tax items for
2018
,
2017
or
2016
. Our subsidiaries (other than our TRS), including our Operating Partnership, are partnerships, disregarded entities, QRSs or REITs, as applicable, for federal income tax purposes. Under applicable federal and state income tax rules, the allocated share of net income or loss from disregarded entities or flow-through entities is reportable in the income tax returns of the respective owners. Accordingly, no income tax provision is included in our consolidated financial statements for these entities.
F- 14
New Accounting Pronouncements
Changes to GAAP are implemented by the FASB in the form of ASUs. We consider the applicability and impact of all ASUs. Other than the ASUs discussed below, the FASB has not issued any other ASUs during
2018
that we expect to be applicable and have a material impact on our financial statements.
Adopted ASUs
During
2018
we adopted the ASUs listed below:
Revenue from Contracts with Customers
In May 2014, the FASB issued ASU No. 2014-09, "Revenue from Contracts with Customers" (Topic 606), which provides guidance for the accounting of revenue from contracts with customers, and supersedes Topic 605, "Revenue Recognition", and most industry-specific guidance throughout the industry topics of the Codification. In March 2016, the FASB issued ASU No. 2016-08, "Principal versus Agent Considerations (Reporting Revenue Gross versus Net)", which amends Topic 606 and clarifies the guidance for principal versus agent considerations. In April 2016, the FASB issued ASU No. 2016-10, "Identifying Performance Obligations and Licensing" which amends Topic 606 and provides guidance for identifying performance obligations and licensing. In May 2016, the FASB issued ASU No. 2016-12, "Narrow-Scope Improvements and Practical Expedients" which amends Topic 606 and provides guidance for a variety of revenue recognition related topics. In February 2017, the FASB issued ASU No. 2017-05 "Other Income - Gains and Losses from the Derecognition of Nonfinancial Assets" (Subtopic 610-20), which provides guidance for recognizing gains and losses from the transfer of nonfinancial assets in contracts with non-customers. Sales of real estate are now accounted for under Subtopic 610-20 which focuses on a transfer of control. The amendments in these ASUs were effective in the first quarter of 2018 and were required to be applied on a retrospective basis. We adopted the ASU in the first quarter of 2018 and it did not have a material impact on our financial statements. Most of our revenues are derived from lease contracts with tenants and are not within the scope of the respective ASUs. Although our office parking revenues are within the scope of the respective ASUs, the timing and pattern of revenue recognition was not impacted.
Derivatives and Hedging
In August 2017, the FASB issued ASU No. 2017-12, "Derivatives and Hedging (Topic 815): Targeted Improvements to Accounting for Hedging Activities". The ASU requires the entire change in the fair value of the hedging instrument included in the assessment of hedge effectiveness be recorded in other comprehensive income. GAAP historically provided special hedge accounting only for the portion of the hedge deemed to be “highly effective” and requires an entity to separately reflect the amount by which the hedging instrument does not offset the hedged item, which is referred to as the “ineffective” amount. The amendments are effective in the first quarter of 2019 and are required to be applied on a prospective basis. We early adopted the ASU in the first quarter of 2018 and it did not have a material impact on our financial statements. The ASU requires the cumulative effect of initially applying the ASU as an adjustment to AOCI with a corresponding adjustment to the opening balance of retained earnings as of the beginning of the fiscal year in which the ASU is adopted. On January 1, 2018, we recorded such an adjustment to AOCI and accumulated deficit of
$211 thousand
. See Note
10
.
ASUs Not Yet Adopted
Leases
In February 2016, the FASB issued ASU No. 2016-02, "Leases" (Topic 842). The primary difference between Topic 842 and current GAAP is the recognition of lease assets and liabilities on the balance sheet by lessees for leases classified as operating leases under current GAAP. The accounting applied by lessors is largely unchanged from current GAAP, for example, the vast majority of operating leases will remain classified as operating leases, and lessors will continue to recognize lease income for those leases on a straight-line basis over the lease term. Topic 842 requires separation of the lease from the non-lease components (for example, maintenance services or other activities that transfer a good or service to the customer) in a contract. Only the lease components should be accounted for in accordance with Topic 842. The consideration in the contract is allocated to the lease and non-lease components on a relative standalone selling price basis and the non-lease component would be accounted for in accordance with ASC 606 ("Revenue from Contracts with Customers"). In July 2018, the FASB issued ASU No. 2018-11 which includes an optional practical expedient for lessors to elect, by class of underlying asset, to not separate the lease from the non-lease components if certain criteria are met. Based on our preliminary assessment, we expect that operating leases for which we are the lessor will qualify for the single component presentation, and we therefore expect to elect adoption of this practical expedient.
F- 15
Topic 842 defines initial direct costs of a lease (which we have historically capitalized) as costs that would not have been incurred had the lease not been executed. Costs to negotiate a lease that would have been incurred regardless of whether the lease was executed, such as employee salaries, are not considered to be initial direct costs, and may not be capitalized. We capitalized
$7.9 million
of leasing costs during the year ended
December 31, 2018
that would not qualify as initial direct costs and would be expensed under Topic 842. The expensing of those costs, adjusted for amortization expense, would have reduced net income attributable to common stockholders by
$6.0 million
for the year ended
December 31, 2018
.
We pay rent under a ground lease which expires on
December 31, 2086
. See Note
16
for more information regarding this ground lease. We currently account for the lease as an operating lease. We expect to recognize a right-of-use asset and lease liability for this ground lease in the first quarter of 2019 when we adopt the ASU. We do not expect the change in accounting for the ground lease to have a material impact on our financial position or results of operations.
The treatment of our revenues could be impacted by Topic 842, however, we do not expect any impact to be material to our financial statements.
In December 2018, the FASB issued ASU 2018-20, an update to ASC Topic 842,
Leases
, which provides guidance on accounting for sales and other similar taxes collected from lessees, certain lessor costs, and recognition of variable payments for contracts with lease and nonlease components. We do not expect the ASU to have a material impact on our financial statements.
The ASUs are effective in the first quarter of 2019 and are required to be adopted using either a) a modified retrospective approach which results in a cumulative adjustment to the opening balance of retained earnings (accumulated deficit) on January 1, 2017, and restatement of the amounts presented prior to January 1, 2019 for leases that existed or were entered into after January 1, 2017, the beginning of the earliest comparative period presented in the 2019 consolidated financial statements, or b) a modified retrospective transition method which results in a cumulative adjustment to the opening balance of retained earnings (accumulated deficit) on January 1, 2019 for leases that existed or were entered into prior to January 1, 2019, the effective date of the ASU. All leases entered into on or after January 1, 2019 would be accounted for as prescribed by ASC 842. ASC 842 provides a practical expedient package that allows entities to not (a) reassess whether any expired or existing contracts are considered or contain leases; (b) reassess the lease classification for any expired or existing leases; and (c) reassess initial direct costs for any existing leases. The Company plans to elect the modified retrospective transition method for adoption on January 1, 2019 and expects to elect the use of the practical expedient package described above. We plan to adopt the ASUs in the first quarter of 2019.
F- 16
3. Investment in Real Estate
We account for our property acquisitions as asset acquisitions. Prior to January 1, 2017, we accounted for our property acquisitions as business combinations. The acquired properties results of operations are included in our results of operations from the respective acquisition dates.
2018 Acquisitions
During 2018, we did not purchase any properties.
2017 Acquisitions
During 2017, (i) a consolidated JV that we manage and in which we own an equity interest acquired
three
Class A office properties (1299 Ocean Avenue, 429 Santa Monica Boulevard and 9665 Wilshire Boulevard), for which investors contributed
$284.0 million
directly to the JV, and (ii) we acquired
one
wholly-owned Class A office property (9401 Wilshire Boulevard). The table below summarizes the purchase price allocations for the acquisitions. The contract and purchase prices differ due to prorations and similar matters.
|
(In thousands)
|
1299 Ocean
|
429 Santa Monica
|
9665 Wilshire
|
9401 Wilshire
(1)
|
|||||||||||
|
Submarket
|
Santa Monica
|
Santa Monica
|
Beverly Hills
|
Beverly Hills
|
|||||||||||
|
Acquisition date
|
April 25
|
April 25
|
July 20
|
December 20
|
|||||||||||
|
Contract price
|
$
|
275,800
|
|
$
|
77,000
|
|
$
|
177,000
|
|
$
|
143,647
|
|
|||
|
Building square footage
|
206
|
87
|
171
|
146
|
|||||||||||
|
Investment in real estate:
|
|
|
|||||||||||||
|
Land
|
$
|
22,748
|
|
$
|
4,949
|
|
$
|
5,568
|
|
$
|
6,740
|
|
|||
|
Buildings and improvements
|
260,188
|
|
69,286
|
|
175,960
|
|
144,467
|
|
|||||||
|
Tenant improvements and lease intangibles
|
5,010
|
|
3,248
|
|
1,112
|
|
7,843
|
|
|||||||
|
Acquired above- and below-market leases, net
|
(10,683
|
)
|
(722
|
)
|
(4,339
|
)
|
(11,559
|
)
|
|||||||
|
Assumed debt
(2)
|
—
|
|
—
|
|
—
|
|
(36,460
|
)
|
|||||||
|
Net assets and liabilities acquired
|
$
|
277,263
|
|
$
|
76,761
|
|
$
|
178,301
|
|
$
|
111,031
|
|
|||
_____________________________________________________
|
(1)
|
We issued OP Units to the seller in connection with the acquisition of 9401 Wilshire. See Note
10
for more information.
|
|
(2)
|
We assumed a loan from the seller in connection with the acquisition of 9401 Wilshire. At the date of acquisition, the loan had a fair value of
$36.5 million
and a principal balance of
$32.3 million
. See Note
7
for more information.
|
F- 17
2016 Acquisitions
Westwood Portfolio Acquisition
On
February 29, 2016
(Acquisition Date), a consolidated JV which we manage and in which we own an equity interest acquired
four
Class A office properties located in Westwood, California (Westwood Portfolio) for a contract price of
$1.34 billion
. As of the Acquisition Date, we had contributed
sixty
-percent of the equity to the JV, which was subsequently reduced to
thirty
-percent on May 31, 2016 (Sell Down Date) when we sold half of our ownership interest to a third party investor. The table below summarizes our purchase accounting and funding sources for the acquisition. The contract and purchase price differ due to prorations and similar matters.
|
(in thousands)
|
Actual at Closing
(1)
|
Pro Forma Sell Down Adjustments
(2)
|
Pro Forma
|
||||||||
|
Building square footage
|
1,725
|
|
1,725
|
|
|||||||
|
Use of funds:
|
|
|
|||||||||
|
Land
|
$
|
94,996
|
|
$
|
94,996
|
|
|||||
|
Buildings and improvements
|
1,236,786
|
|
1,236,786
|
|
|||||||
|
Tenant improvements and lease intangibles
|
50,439
|
|
50,439
|
|
|||||||
|
Acquired above- and below-market leases, net
(3)
|
(49,708
|
)
|
(49,708
|
)
|
|||||||
|
Net assets and liabilities acquired
|
$
|
1,332,513
|
|
$
|
1,332,513
|
|
|||||
|
Source of funds:
|
|||||||||||
|
Cash on hand
(4)
|
$
|
153,745
|
|
$
|
—
|
|
$
|
153,745
|
|
||
|
Credit facility
(5)
|
290,000
|
|
(240,000
|
)
|
50,000
|
|
|||||
|
Non-recourse term loan, net
(6)
|
568,768
|
|
—
|
|
568,768
|
|
|||||
|
Noncontrolling interests
|
320,000
|
|
240,000
|
|
560,000
|
|
|||||
|
Total source of funds
|
$
|
1,332,513
|
|
$
|
—
|
|
$
|
1,332,513
|
|
||
________________________________________________
|
(1)
|
Reflects the purchase of the Westwood Portfolio on the Acquisition Date when we contributed
sixty
-percent of the equity to the consolidated JV.
|
|
(2)
|
Reflects our sale of
thirty
-percent of the equity in the JV on the Sell Down Date, presented as of the Acquisition Date, treated as in-substance real estate, which reduced our ownership interest in the JV to
thirty
-percent. We sold the interest for the
$240.0 million
we contributed plus an additional
$1.1 million
to compensate us for the cost of holding the investment. We recognized a gain on the sale of
$1.1 million
. We used the proceeds from the sale to pay down the balance owed on our revolving credit facility.
|
|
(3)
|
As of the Acquisition Date, the weighted average remaining life of the acquired above- and below-market leases was approximately
4.4 years
.
|
|
(4)
|
Cash paid included a
$75.0 million
deposit,
$67.5 million
paid at closing, and
$11.2 million
spent on loan costs in connection with securing the
$580.0 million
term loan.
|
|
(5)
|
Reflects borrowings using our credit facility, which bears interest at
LIBOR + 1.40%
. See Note
7
for information regarding our credit facility.
|
|
(6)
|
Reflects
100%
(not our pro rata share) of a
$580.0 million
interest-only non-recourse loan, net of deferred loan costs of
$11.2 million
incurred to secure the loan. The loan has a
seven
-year term and is secured by the Westwood Portfolio. Interest on the loan is floating at
LIBOR + 1.40%
, which has been effectively fixed at
2.37%
per annum for
five
years through interest rate swaps. See Note
7
for information regarding this loan.
|
F- 18
The table below presents the revenues and net income attributable to common stockholders from the Westwood Portfolio included in the consolidated statement of operations from the Acquisition Date:
|
Year Ended December 31,
|
|||||||||||
|
(in thousands)
|
2018
|
2017
|
2016
|
||||||||
|
Total office revenues
|
$
|
102,398
|
|
$
|
96,106
|
|
$
|
80,464
|
|
||
|
Net income attributable to common stockholders
(1)
|
$
|
6,163
|
|
$
|
6,346
|
|
$
|
2,998
|
|
||
______________________________________________________
|
(1)
|
Excluding transaction costs, net income attributable to common stockholders was
$6.2 million
,
$6.3 million
and
$5.0 million
for the years ended
December 31, 2018
,
2017
and
2016
, respectively.
|
The table below presents the historical results of Douglas Emmett, Inc. and the Westwood Portfolio on a combined basis as if the acquisition was completed on January 1, 2016, based on our
thirty
-percent ownership interest and includes adjustments that give effect to events that are (i) directly attributable to the acquisition, (ii) expected to have a continuing impact on us, and (iii) are factually supportable. The pro forma reflects the hypothetical impact of the acquisition on us and does not purport to represent what our results of operations would have been had the acquisition occurred on January 1, 2016, or project the results of operations for any future period. The information does not reflect cost savings or operating synergies that may result from the acquisition or the costs to achieve any such potential cost savings or operating synergies. Transaction costs related to the acquisition have been excluded.
|
Year Ended December 31,
|
|||
|
(in thousands, except per share information)
|
2016
|
||
|
Pro forma revenues
|
$
|
755,878
|
|
|
Pro forma net income attributable to common stockholders
|
$
|
84,319
|
|
|
Pro forma net income attributable to common stockholders per share – basic
|
$
|
0.56
|
|
|
Pro forma net income attributable to common stockholders per share – diluted
|
$
|
0.55
|
|
F- 19
Other 2016 Acquisitions
During 2016, a consolidated JV which we manage and in which we own an equity interest acquired
two
Class A office properties. As of
July 21, 2016
, we had contributed
fifty-five
percent of the equity to the JV, which was reduced to
twenty
-percent when we sold
thirty-five
percent to a third party investor for
$51.6 million
, which included
$194 thousand
to compensate us for the cost of holding the investment. We recognized a gain of
$587 thousand
on the sale, which is included in Gains on sales of investments in real estate in our consolidated statements of operations. In addition to purchasing a
thirty-five
percent interest from us, investors contributed
$139.8 million
to the JV. Including the effect of the sale of our interest, investors now hold an aggregate of
eighty
-percent of the capital interests in the JV. As part of the acquisitions, the JV borrowed a
$146.0 million
under a
three
year, interest only, non-recourse loan bearing interest at
LIBOR + 1.55%
. The loan was secured by the acquired properties. The loan was refinanced in 2017. See Note
7
. The table below summarizes the purchase accounting for the acquisitions. The contract and purchase prices differ due to prorations and similar matters.
|
(in thousands)
|
12100 Wilshire
|
233 Wilshire
|
|||||
|
Submarket
|
Brentwood
|
Santa Monica
|
|||||
|
Acquisition date
|
July 21
|
September 27
|
|||||
|
Contract price
|
$
|
225,000
|
|
$
|
139,500
|
|
|
|
Building square footage
|
365
|
|
129
|
|
|||
|
Investment in real estate:
|
|
|
|||||
|
Land
|
$
|
20,164
|
|
$
|
9,263
|
|
|
|
Buildings and improvements
|
199,698
|
|
126,938
|
|
|||
|
Tenant improvements and lease intangibles
|
9,057
|
|
3,488
|
|
|||
|
Acquired above- and below-market leases, net
|
(4,523
|
)
|
(1,838
|
)
|
|||
|
Net assets and liabilities acquired
|
$
|
224,396
|
|
$
|
137,851
|
|
|
2016 Disposition
During 2016, we sold a
168,000
square foot Class A office property located in Sherman Oaks, California with a carrying value of
$42.8 million
for a contract price of
$56.7 million
, and we incurred transaction costs of
$1.2 million
resulting in a net gain of
$12.7 million
. The gain is included in Gains on sales of investments in real estate in our consolidated statements of operations.
F- 20
4. Acquired Lease Intangibles
Summary of our Acquired Lease Intangibles
|
(In thousands)
|
December 31, 2018
|
December 31, 2017
|
||||||
|
Above-market tenant leases
|
$
|
5,595
|
|
$
|
7,177
|
|
||
|
Above-market tenant leases - accumulated amortization
|
(3,289
|
)
|
(3,846
|
)
|
||||
|
Above-market ground lease where we are the lessor
|
1,152
|
|
1,152
|
|
||||
|
Above-market ground lease - accumulated amortization
|
(207
|
)
|
(190
|
)
|
||||
|
Acquired lease intangible assets, net
|
$
|
3,251
|
|
$
|
4,293
|
|
||
|
Below-market tenant leases
|
$
|
112,175
|
|
$
|
127,606
|
|
||
|
Below-market tenant leases - accumulated accretion
|
(63,013
|
)
|
(55,428
|
)
|
||||
|
Above-market ground lease where we are the tenant
|
4,017
|
|
4,017
|
|
||||
|
Above-market ground lease - accumulated accretion
|
(610
|
)
|
(560
|
)
|
||||
|
Acquired lease intangible liabilities, net
|
$
|
52,569
|
|
$
|
75,635
|
|
||
Impact on the Consolidated Statements of Operations
The table below summarizes the net amortization/accretion related to our above- and below-market leases:
|
|
Year Ended December 31,
|
||||||||||
|
(In thousands)
|
2018
|
2017
|
2016
|
||||||||
|
Net accretion of above- and below-market tenant lease assets and liabilities
(1)
|
$
|
21,992
|
|
$
|
17,973
|
|
$
|
18,165
|
|
||
|
Amortization of an above-market ground lease
(2)
|
(17
|
)
|
(17
|
)
|
(17
|
)
|
|||||
|
Accretion of an above-market ground lease liability
(3)
|
50
|
|
50
|
|
50
|
|
|||||
|
Total
|
$
|
22,025
|
|
$
|
18,006
|
|
$
|
18,198
|
|
||
_______________________________________________________________________________________
(1) Recorded as a net increase to office and multifamily rental revenues.
(2) Recorded as a decrease to office parking and other income.
(3) Recorded as a decrease to office expense.
The table below presents the future net accretion related to our above- and below-market leases at
December 31, 2018
. The above-market ground lease liability presented in the tables above will be offset against a right of use ground lease asset on January 1, 2019 when we adopt ASU No. 2016-02 - see Note 2, and there is therefore no future accretion for that lease reflected in the table below.
|
Year ending December 31:
|
Net increase to revenues
|
|||
|
(In thousands)
|
||||
|
2019
|
$
|
15,521
|
|
|
|
2020
|
12,516
|
|
||
|
2021
|
6,813
|
|
||
|
2022
|
4,157
|
|
||
|
2023
|
2,542
|
|
||
|
Thereafter
|
4,362
|
|
||
|
Total
|
$
|
45,911
|
|
|
F- 21
5. Investments in Unconsolidated Real Estate Funds
Description of our Funds
We manage and own equity interests in
three
unconsolidated Funds, the Opportunity Fund, Fund X and Partnership X, through which we and investors own
eight
office properties totaling
1.8 million
square feet. During the third quarter of 2018 we purchased an additional
1.9%
interest in Fund X. We purchased a
3.7%
interest in the Opportunity Fund during the second quarter of 2017 and
2.5%
during the fourth quarter of 2017. The Opportunity Fund's only investment is a
13.1%
interest in Fund X. At
December 31, 2018
, we held direct and indirect equity interests of
6.2%
in the Opportunity Fund,
71.3%
of Fund X and
24.5%
of Partnership X. Our Funds pay us fees and reimburse us for certain expenses related to property management and other services we provide. We also receive distributions based on invested capital and on any profits that exceed certain specified cash returns to the investors. The table below presents cash distributions received from our Funds:
|
|
Year Ended December 31,
|
||||||||||
|
(In thousands)
|
2018
|
2017
|
2016
|
||||||||
|
Operating distributions received
|
$
|
6,400
|
|
$
|
5,905
|
|
$
|
2,668
|
|
||
|
Capital distributions received
|
7,349
|
|
43,560
|
|
24,170
|
|
|||||
|
Total distributions received
|
$
|
13,749
|
|
$
|
49,465
|
|
$
|
26,838
|
|
||
Summarized Financial Information for our Funds
The tables below present selected financial information for the Funds on a combined basis. The amounts presented reflect
100%
(not our pro-rata share) of amounts related to the Funds, and are based upon historical acquired book value:
|
(In thousands)
|
December 31, 2018
|
December 31, 2017
|
|||||
|
Total assets
|
$
|
694,713
|
|
$
|
704,186
|
|
|
|
Total liabilities
|
$
|
525,483
|
|
$
|
523,767
|
|
|
|
Total equity
|
$
|
169,230
|
|
$
|
180,419
|
|
|
|
|
Year Ended December 31,
|
||||||||||
|
(In thousands)
|
2018
|
2017
|
2016
|
||||||||
|
Total revenues
|
$
|
79,590
|
|
$
|
75,896
|
|
$
|
73,171
|
|
||
|
Operating income
|
$
|
22,959
|
|
$
|
20,640
|
|
$
|
19,477
|
|
||
|
Net income
|
$
|
6,260
|
|
$
|
5,085
|
|
$
|
8,213
|
|
||
6. Other Assets
|
(In thousands)
|
December 31, 2018
|
December 31, 2017
|
|||||
|
Restricted cash
|
$
|
121
|
|
$
|
121
|
|
|
|
Prepaid expenses
|
7,830
|
|
9,235
|
|
|||
|
Other indefinite-lived intangibles
|
1,988
|
|
1,988
|
|
|||
|
Furniture, fixtures and equipment, net
|
1,101
|
|
1,155
|
|
|||
|
Other
|
3,719
|
|
5,943
|
|
|||
|
Total other assets
|
$
|
14,759
|
|
$
|
18,442
|
|
|
F- 22
7. Secured Notes Payable and Revolving Credit Facility, Net
|
Description
|
Maturity
Date
(1)
|
Principal Balance as of December 31, 2018
|
Principal Balance as of December 31, 2017
|
Variable Interest Rate
|
Fixed Interest
Rate
(2)
|
Swap Maturity Date
|
||||||||||
|
(In thousands)
|
||||||||||||||||
|
Wholly Owned Subsidiaries
|
||||||||||||||||
|
Term loan
(3)
|
—
|
$
|
—
|
|
$
|
146,974
|
|
—
|
|
—
|
|
—
|
||||
|
Term loan
(3)
|
—
|
—
|
|
280,721
|
|
—
|
|
—
|
|
—
|
||||||
|
Fannie Mae loan
|
10/1/2019
|
145,000
|
|
145,000
|
|
LIBOR + 1.25%
|
|
N/A
|
|
N/A
|
||||||
|
Term loan
(4)
|
4/15/2022
|
340,000
|
|
340,000
|
|
LIBOR + 1.40%
|
|
2.77%
|
|
4/1/2020
|
||||||
|
Term loan
(4)
|
7/27/2022
|
180,000
|
|
180,000
|
|
LIBOR + 1.45%
|
|
3.06%
|
|
7/1/2020
|
||||||
|
Term loan
(4)
|
11/1/2022
|
400,000
|
|
400,000
|
|
LIBOR + 1.35%
|
|
2.64%
|
|
11/1/2020
|
||||||
|
Term loan
(4)
|
6/23/2023
|
360,000
|
|
360,000
|
|
LIBOR + 1.55%
|
2.57%
|
7/1/2021
|
||||||||
|
Term loan
(4)
|
12/23/2023
|
220,000
|
|
220,000
|
|
LIBOR + 1.70%
|
3.62%
|
12/23/2021
|
||||||||
|
Term loan
(4)
|
1/1/2024
|
300,000
|
|
300,000
|
|
LIBOR + 1.55%
|
3.46%
|
1/1/2022
|
||||||||
|
Term loan
(4)
|
3/3/2025
|
335,000
|
|
—
|
|
LIBOR + 1.30%
|
3.84%
|
3/1/2023
|
||||||||
|
Fannie Mae loan
(4)
|
4/1/2025
|
102,400
|
|
102,400
|
|
LIBOR + 1.25%
|
|
2.84%
|
|
3/1/2020
|
||||||
|
Fannie Mae loan
(4)
|
12/1/2025
|
115,000
|
|
115,000
|
|
LIBOR + 1.25%
|
|
2.76%
|
|
12/1/2020
|
||||||
|
Fannie Mae loan
(4)
|
6/1/2027
|
550,000
|
|
550,000
|
|
LIBOR + 1.37%
|
3.16%
|
6/1/2022
|
||||||||
|
Term loan
(5)
|
6/1/2038
|
31,582
|
|
32,213
|
|
N/A
|
4.55%
|
N/A
|
||||||||
|
Revolving credit facility
(6)
|
8/21/2020
|
105,000
|
|
—
|
|
LIBOR + 1.40%
|
N/A
|
N/A
|
||||||||
|
Total Wholly Owned Subsidiary Debt
|
3,183,982
|
|
3,172,308
|
|
|
|
|
|
|
|||||||
|
Consolidated JVs
|
||||||||||||||||
|
Term loan
(4)
|
2/28/2023
|
580,000
|
|
580,000
|
|
LIBOR + 1.40%
|
2.37%
|
3/1/2021
|
||||||||
|
Term loan
(4)
|
12/19/2024
|
400,000
|
|
400,000
|
|
LIBOR + 1.30%
|
3.47%
|
1/1/2023
|
||||||||
|
Total Consolidated Debt
(7)
|
4,163,982
|
|
4,152,308
|
|
||||||||||||
|
Unamortized loan premium, net
|
3,986
|
|
4,191
|
|
||||||||||||
|
Unamortized deferred loan costs, net
|
(33,938
|
)
|
(39,109
|
)
|
|
|
|
|
|
|||||||
|
Total Consolidated Debt, net
|
$
|
4,134,030
|
|
$
|
4,117,390
|
|
|
|
|
|
|
|||||
_____________________________________________________
Except as noted below, each loan (including our revolving credit facility) is non-recourse and secured by
one
or more separate collateral pools consisting of
one
or more properties, and requires monthly payments of interest only with the outstanding principal due upon maturity.
|
(1)
|
Maturity dates include the effect of extension options.
|
|
(2)
|
Includes the effect of interest rate swaps and excludes the effect of prepaid loan fees. See Note
9
for details of our interest rate swaps. See below for details of our loan costs.
|
|
(3)
|
At
December 31, 2018
, these loans have been paid off.
|
|
(4)
|
Loan agreement includes a
zero
-percent LIBOR floor. The corresponding swaps do not include such a floor.
|
|
(5)
|
Requires monthly payments of principal and interest. Principal amortization is based upon a
30
-year amortization schedule.
|
|
(6)
|
$400.0 million
revolving credit facility. Unused commitment fees range from
0.15%
to
0.20%
.
|
|
(7)
|
See Note
13
for our fair value disclosures.
|
F- 23
Debt Statistics
The following table summarizes our fixed and floating rate debt:
|
(In thousands)
|
Principal Balance as of December 31, 2018
|
Principal Balance as of December 31, 2017
|
||||||
|
Aggregate swapped to fixed rate loans
|
$
|
3,882,400
|
|
$
|
3,547,400
|
|
||
|
Aggregate fixed rate loans
|
31,582
|
|
459,908
|
|
||||
|
Aggregate floating rate loans
|
250,000
|
|
145,000
|
|
||||
|
Total Debt
|
$
|
4,163,982
|
|
$
|
4,152,308
|
|
||
The following table summarizes certain debt statistics:
|
Statistics for consolidated loans with interest fixed under the terms of the loan or a swap
|
|
|
Principal balance (in billions)
|
$3.91
|
|
Weighted average remaining life (including extension options)
|
5.4 years
|
|
Weighted average remaining fixed interest period
|
2.6 years
|
|
Weighted average annual interest rate
|
3.07%
|
Future Principal Payments
At
December 31, 2018
, the minimum future principal payments due on our secured notes payable and revolving credit facility were as follows:
|
Year ending December 31:
|
Excluding Maturity Extension Options
|
Including Maturity Extension Options
(1)
|
||||||
|
(In thousands)
|
||||||||
|
2019
|
$
|
145,718
|
|
$
|
145,718
|
|
||
|
2020
|
400,752
|
|
105,752
|
|
||||
|
2021
|
787
|
|
787
|
|
||||
|
2022
|
1,040,823
|
|
920,823
|
|
||||
|
2023
|
1,495,862
|
|
1,160,862
|
|
||||
|
Thereafter
|
1,080,040
|
|
1,830,040
|
|
||||
|
Total future principal payments
|
$
|
4,163,982
|
|
$
|
4,163,982
|
|
||
____________________________________________
|
(1)
|
Our loan agreements generally require that we meet certain minimum financial thresholds to be able to extend the loan maturity.
|
Loan Costs
Deferred loan costs are net of accumulated amortization of
$24.2 million
and
$18.0 million
at
December 31, 2018
and
December 31, 2017
, respectively. The table below presents loan costs, which are included in interest expense in our consolidated statements of operations:
|
|
Year Ended December 31,
|
||||||||||
|
(In thousands)
|
2018
|
2017
|
2016
|
||||||||
|
Loan costs expensed
|
$
|
418
|
|
$
|
2,359
|
|
$
|
1,441
|
|
||
|
Deferred loan cost amortization
|
7,874
|
|
9,033
|
|
7,608
|
|
|||||
|
Total
|
$
|
8,292
|
|
$
|
11,392
|
|
$
|
9,049
|
|
||
F- 24
8. Interest Payable, Accounts Payable and Deferred Revenue
|
(In thousands)
|
December 31, 2018
|
December 31, 2017
|
||||||
|
Interest payable
|
$
|
10,657
|
|
$
|
9,829
|
|
||
|
Accounts payable and accrued liabilities
|
75,111
|
|
62,741
|
|
||||
|
Deferred revenue
|
44,386
|
|
31,377
|
|
||||
|
Total interest payable, accounts payable and deferred revenue
|
$
|
130,154
|
|
$
|
103,947
|
|
||
9. Derivative Contracts
Derivative Summary
As of
December 31, 2018
, all of our interest rate swaps, which include the interest rate swaps of our consolidated JVs and our unconsolidated Funds, were designated as cash flow hedges:
|
Number of Interest Rate Swaps
|
Notional (In thousands)
|
|||||
|
Consolidated derivatives
(1)(3)
|
27
|
$
|
3,882,400
|
|
||
|
Unconsolidated Funds' derivatives
(2)(3)
|
4
|
$
|
510,000
|
|
||
___________________________________________________
|
(1)
|
The notional amount reflects
100%
, not our pro-rata share, of our consolidated JVs' derivatives.
|
|
(2)
|
The notional amount reflects
100%
, not our pro-rata share, of our unconsolidated Funds' derivatives.
|
|
(3)
|
See Note
13
for our derivative fair value disclosures.
|
Credit-risk-related Contingent Features
We have agreements with each of our interest rate swap counterparties that contain a provision under which we could also be declared in default on our derivative obligations if we default on the underlying indebtedness that we are hedging. As of
December 31, 2018
, there have been no events of default with respect to our interest rate swaps or our consolidated JVs' or unconsolidated Funds' interest rate swaps. We do not post collateral for our interest rate swap contract liabilities. The fair value of our interest rate swap contract liabilities, including accrued interest and excluding credit risk adjustments, were as follows:
|
(In thousands)
|
December 31, 2018
|
December 31, 2017
|
||||||
|
Consolidated derivatives
(1)
|
$
|
1,681
|
|
$
|
915
|
|
||
|
Unconsolidated Funds' derivatives
(2)
|
$
|
—
|
|
$
|
—
|
|
||
___________________________________________________
|
(1)
|
Includes
100%
, not our pro-rata share, of our consolidated JVs' derivatives.
|
|
(2)
|
Our unconsolidate
d
Funds' did not have any derivatives in a liability position.
|
F- 25
Counterparty Credit Risk
We are subject to credit risk from the counterparties on our interest rate swap contract assets because we do not receive collateral. We seek to minimize that risk by entering into agreements with a variety of high quality counterparties with investment grade ratings. The fair value of our interest rate swap contract assets, including accrued interest and excluding credit risk adjustments , were as follows:
|
(In thousands)
|
December 31, 2018
|
December 31, 2017
|
||||||
|
Consolidated derivatives
(1)
|
$
|
76,021
|
|
$
|
60,093
|
|
||
|
Unconsolidated Funds' derivatives
(2)
|
$
|
12,576
|
|
$
|
9,350
|
|
||
___________________________________________________
|
(1)
|
Includes
100%
, not our pro-rata share, of our consolidated JVs' derivatives.
|
|
(2)
|
The amounts reflect
100%
, not our pro-rata share, of our unconsolidated Funds' derivatives.
|
Impact of Hedges on AOCI and the Consolidated Statements of Operations
The table below presents the effect of our derivatives on our AOCI and the consolidated statements of operations:
|
(In thousands)
|
Year Ended December 31,
|
||||||||||
|
|
2018
|
2017
|
2016
|
||||||||
|
Derivatives Designated as Cash Flow Hedges:
|
|
|
|||||||||
|
Consolidated derivatives:
|
|||||||||||
|
Gain recorded in AOCI - adoption of ASU 2017-12
(1)(2)
|
$
|
211
|
|
$
|
—
|
|
$
|
—
|
|
||
|
Gain recorded in AOCI before reclassifications
(1)(2)
|
$
|
22,723
|
|
$
|
16,512
|
|
$
|
14,192
|
|
||
|
(Gain) loss reclassified from AOCI to Interest Expense
(1)
|
$
|
(10,103
|
)
|
$
|
13,976
|
|
$
|
25,917
|
|
||
|
Interest Expense presented in the consolidated statements of operations
|
$
|
(133,402
|
)
|
$
|
(145,176
|
)
|
$
|
(146,148
|
)
|
||
|
(Gain) loss related to ineffectiveness recorded in Interest Expense
|
$
|
—
|
|
$
|
51
|
|
$
|
(196
|
)
|
||
|
Unconsolidated Funds' derivatives (our share)
(3)
:
|
|
|
|
|
|||||||
|
Gain recorded in AOCI before reclassifications
(1)
|
$
|
3,052
|
|
$
|
3,275
|
|
$
|
8
|
|
||
|
(Gain) loss reclassified from AOCI to Income, including depreciation, from unconsolidated real estate funds
(1)
|
$
|
(813
|
)
|
$
|
527
|
|
$
|
357
|
|
||
|
Income, including depreciation, from unconsolidated real estate funds presented in the consolidated statements of operations
|
$
|
6,400
|
|
$
|
5,905
|
|
$
|
7,812
|
|
||
__________________________________________________
|
(1)
|
See Note
10
for our AOCI reconciliation.
|
|
(2)
|
See Note
2
regarding the ASU adoption.
|
|
(3)
|
We calculate our share by multiplying the total amount for each Fund by our equity interest in the respective Fund.
|
Future Reclassifications from AOCI
At
December 31, 2018
, our estimate of the AOCI related to derivatives designated as cash flow hedges, that will be reclassified to earnings during the next year as interest rate swap payments are made, is as follows:
|
(In thousands)
|
|||
|
Consolidated derivatives:
|
|||
|
Gains to be reclassified from AOCI to Interest Expense
|
$
|
36,161
|
|
|
Unconsolidated Funds' derivatives (our share):
|
|||
|
Gains to be reclassified from AOCI to Income, including depreciation, from unconsolidated real estate funds
|
$
|
2,565
|
|
F- 26
10. Equity
Transactions
2018
Transactions
During
2018
, we (i) acquired
629 thousand
OP Units in exchange for issuing an equal number of shares of our common stock to the holders of the OP Units, (ii) acquired
3 thousand
OP Units for
$108 thousand
in cash and (iii) issued
21 thousand
shares of our common stock for the exercise of
49 thousand
stock options on a net settlement basis (net of the exercise price and related taxes).
2017
Transactions
During
2017
, we or our Operating Partnership, (i) acquired
1.1 million
OP Units in exchange for issuing an equal number of shares of our common stock to the holders of the OP Units, (ii) issued
1.3 million
shares of our common stock for the exercise of
3.9 million
stock options on a net settlement basis (net of the exercise price and related taxes), (iii) issued
15.7 million
shares of our common stock under our ATM program for net proceeds of
$593.3 million
, and (iv) issued
2.6 million
OP Units valued at
$105.7 million
in connection with the acquisition of the 9401 Wilshire office property, of which we subsequently acquired
248 thousand
OP Units for
$10.1 million
in cash. One of our JVs acquired
three
office properties, 1299 Ocean Avenue, 429 Santa Monica and 9665 Wilshire, for which investors contributed
$284.0 million
directly to the JV.
2016
Transactions
During
2016
we (i) acquired
1.8 million
OP Units in exchange for issuing an equal number of shares of our common stock to the holders of OP Units, (ii) acquired
25 thousand
OP Units for
$826 thousand
in cash, (iii) issued
1.5 million
shares of our common stock for the exercise of
7.6 million
stock options on a net settlement basis (net of the exercise price and related taxes), (iv) issued
1.4 million
shares of our common stock under our ATM program for net proceeds of
49.4 million
.
We also created two JVs to acquire various properties: (i) in the JV which acquired the Westwood Portfolio, investors acquired an aggregate of
seventy
-percent of the capital interests, as a result of contributing
$320 million
directly to the JV for a
forty
-percent interest and acquiring a
thirty
-percent interest from us for
$241.1 million
, (resulting in a gain of
$1.1 million
), and (ii) in the second JV, which acquired
two
office properties, 12100 Wilshire and 233 Wilshire, investors acquired an aggregate of
eighty
-percent of the capital interests, as a result of contributing
$139.8 million
directly to the JV and acquiring a
thirty-five
-percent interest from us for
$51.6 million
(resulting in a gain of
$587 thousand
).
Noncontrolling Interests
Our noncontrolling interests consist of interests in our Operating Partnership and consolidated JVs which are not owned by us. Noncontrolling interests in our Operating Partnership consist of OP Units and fully-vested LTIP Units, and represented approximately
14%
of our Operating Partnership's total interests as of
December 31, 2018
when we and our Operating Partnership had
170.2 million
shares of common stock and
28.2 million
OP Units and fully-vested LTIP Units outstanding. A share of our common stock, an OP Unit and an LTIP Unit (once vested and booked up) have essentially the same economic characteristics, sharing equally in the distributions from our Operating Partnership. Investors who own OP Units have the right to cause our Operating Partnership to acquire their OP Units for an amount of cash per unit equal to the market value of one share of our common stock at the date of acquisition, or, at our election, exchange their OP Units for shares of our common stock on a
one-for-one b
asis. LTIP Units have been granted to our key employees and non-employee directors as part of their compensation, see Note
12
.
F- 27
Changes in our Ownership Interest in our Operating Partnership
The table below presents the effect on our equity from net income attributable to common stockholders and changes in our ownership interest in our Operating Partnership:
|
Year Ended December 31,
|
|||||||||||
|
(In thousands)
|
2018
|
2017
|
2016
|
||||||||
|
Net income attributable to common stockholders
|
$
|
116,086
|
|
$
|
94,443
|
|
$
|
85,397
|
|
||
|
Transfers from noncontrolling interests:
|
|||||||||||
|
Exchange of OP Units with noncontrolling interests
|
10,292
|
|
14,242
|
|
23,060
|
|
|||||
|
Repurchase of OP Units from noncontrolling interests
|
(59
|
)
|
(6,764
|
)
|
(498
|
)
|
|||||
|
Net transfers from noncontrolling interests
|
10,233
|
|
7,478
|
|
22,562
|
|
|||||
|
Change from net income attributable to common stockholders and transfers from noncontrolling interests
|
$
|
126,319
|
|
$
|
101,921
|
|
$
|
107,959
|
|
||
AOCI Reconciliation
(1)
The table below presents a reconciliation of our AOCI, which consists solely of adjustments related to derivatives designated as cash flow hedges:
|
Year Ended December 31,
|
|||||||||||
|
(In thousands)
|
2018
|
2017
|
2016
|
||||||||
|
Beginning balance
|
$
|
43,099
|
|
$
|
15,156
|
|
$
|
(9,285
|
)
|
||
|
Adoption of ASU 2017-12 - cumulative opening balance adjustment
(2)
|
211
|
|
—
|
|
—
|
|
|||||
|
Consolidated derivatives:
|
|||||||||||
|
Other comprehensive income before reclassifications
|
22,723
|
|
16,512
|
|
14,192
|
|
|||||
|
Reclassification of (gains) losses from AOCI to Interest Expense
|
(10,103
|
)
|
13,976
|
|
25,917
|
|
|||||
|
Unconsolidated Funds' derivatives (our share):
|
|||||||||||
|
Other comprehensive income before reclassifications
|
3,052
|
|
3,275
|
|
8
|
|
|||||
|
Reclassification of (gains) losses from AOCI to Income, including depreciation, from unconsolidated real estate funds
|
(813
|
)
|
527
|
|
357
|
|
|||||
|
Net current period OCI
|
15,070
|
|
34,290
|
|
40,474
|
|
|||||
|
OCI attributable to noncontrolling interests
|
(4,225
|
)
|
(6,347
|
)
|
(16,033
|
)
|
|||||
|
OCI attributable to common stockholders
|
10,845
|
|
27,943
|
|
24,441
|
|
|||||
|
Ending balance
|
$
|
53,944
|
|
$
|
43,099
|
|
$
|
15,156
|
|
||
__________________________________________________
|
(1)
|
See Note
9
for the details of our derivatives and Note
13
for our derivative fair value disclosures.
|
|
(2)
|
See Note
2
regarding our adoption of the ASU on January 1, 2018.
|
F- 28
Dividends (unaudited)
Our common stock dividends paid during
2018
are classified for federal income tax purposes as follows:
|
Record Date
|
Paid Date
|
Dividend Per Share
|
Ordinary Income Percentage
|
Capital Gain Percentage
|
Return of Capital Percentage
|
Amount Qualifying as a Section 199A Dividend
|
||||||||||||
|
12/29/2017
|
1/15/2018
|
$
|
0.25
|
|
32.5
|
%
|
—
|
%
|
67.5
|
%
|
32.5
|
%
|
||||||
|
3/29/2018
|
4/17/2018
|
0.25
|
|
32.5
|
%
|
—
|
%
|
67.5
|
%
|
32.5
|
%
|
|||||||
|
6/29/2018
|
7/13/2018
|
0.25
|
|
32.5
|
%
|
—
|
%
|
67.5
|
%
|
32.5
|
%
|
|||||||
|
9/28/2018
|
10/16/2018
|
0.25
|
|
32.5
|
%
|
—
|
%
|
67.5
|
%
|
32.5
|
%
|
|||||||
|
Total / Weighted Average
|
$
|
1.00
|
|
32.5
|
%
|
—
|
%
|
67.5
|
%
|
32.5
|
%
|
|||||||
11. EPS
The table below presents the calculation of basic and diluted EPS:
|
Year Ended December 31,
|
|||||||||||
|
2018
|
2017
|
2016
|
|||||||||
|
Numerator (In thousands):
|
|||||||||||
|
Net income attributable to common stockholders
|
$
|
116,086
|
|
$
|
94,443
|
|
$
|
85,397
|
|
||
|
Allocation to participating securities: Unvested LTIP Units
|
(546
|
)
|
(626
|
)
|
(468
|
)
|
|||||
|
Numerator for basic and diluted net income attributable to common stockholders
|
$
|
115,540
|
|
$
|
93,817
|
|
$
|
84,929
|
|
||
|
Denominator (In thousands):
|
|||||||||||
|
Weighted average shares of common stock outstanding - basic
|
169,893
|
|
160,905
|
|
149,299
|
|
|||||
|
Effect of dilutive securities: Stock options
(1)
|
9
|
|
325
|
|
3,891
|
|
|||||
|
Weighted average shares of common stock and common stock equivalents outstanding - diluted
|
169,902
|
|
161,230
|
|
153,190
|
|
|||||
|
Basic EPS:
|
|||||||||||
|
Net income attributable to common stockholders per share
|
$
|
0.68
|
|
$
|
0.58
|
|
$
|
0.57
|
|
||
|
Diluted EPS:
|
|||||||||||
|
Net income attributable to common stockholders per share
|
$
|
0.68
|
|
$
|
0.58
|
|
$
|
0.55
|
|
||
____________________________________________________
|
(1)
|
The following securities were excluded from the calculation of diluted EPS because including them would be anti-dilutive to the calculation:
|
|
|
Year Ended December 31,
|
|||||||
|
(In thousands)
|
2018
|
2017
|
2016
|
|||||
|
OP Units
|
26,661
|
|
24,810
|
|
25,110
|
|
||
|
Vested LTIP Units
|
813
|
|
274
|
|
578
|
|
||
F- 29
12. Stock-Based Compensation
2016 Omnibus Stock Incentive Plan
The Douglas Emmett, Inc. 2016 Omnibus Stock Incentive Plan, our stock incentive plan (our "2016 Plan"), permits us to make grants of incentive stock options, non-qualified stock options, stock appreciation rights, deferred stock awards, restricted stock awards, dividend equivalent rights and other stock-based awards. We had an aggregate of
3.4 million
shares available for grant as of
December 31, 2018
. Awards such as LTIP Units, deferred stock and restricted stock, which deliver the full value of the underlying shares, are counted against the Plan limits as
two
shares. Awards such as stock options and stock appreciation rights are counted as
one
share. The number of shares reserved under our 2016 Plan is also subject to adjustment in the event of a stock split, stock dividend or other change in our capitalization. Shares of stock underlying any awards that are forfeited, canceled or otherwise terminated (other than by exercise) are added back to the shares of stock available for future issuance under the 2016 Plan. For options exercised, our policy is to issue common stock on a net settlement basis - net of the exercise price and related taxes.
Until it expired in 2016, we made grants under our 2006 Omnibus Stock Incentive Plan (our "2006 Plan"), which was substantially similar to our 2016 Plan. No further awards may be granted under our 2006 Plan, although awards granted under the 2006 Plan in the past and which are still outstanding will continue to be governed by the terms of our 2006 Plan.
Our 2016 and 2006 Plans (the "Plans") are administered by the compensation committee of our board of directors. The compensation committee may interpret our Plans and make all determinations necessary or desirable for the administration of our Plans. The committee has full power and authority to select the participants to whom awards will be granted, to make any combination of awards to participants, to accelerate the exercisability or vesting of any award and to determine the specific terms and conditions of each award, subject to the provisions of our 2016 Plan. All officers, employees, directors and other key personnel (including consultants and prospective employees) are eligible to participate in our 2016 Plan.
We have made certain awards in the form of a separate series of units of limited partnership interests in our Operating Partnership called LTIP Units, which can be granted either as free-standing awards or in tandem with other awards under our 2016 Plan. Our LTIP Units are valued by reference to the value of our common stock at the time of grant, and are subject to such conditions and restrictions as the compensation committee may determine, including continued employment or service, and/or achievement of pre-established performance goals, financial metrics and other objectives. Once vested, LTIP Units can generally be converted to OP Units on a one for one basis, provided our stock price increases by more than a specified hurdle.
Employee Awards
We grant stock-based compensation in the form of LTIP Units as a part of our annual incentive compensation to various employees each year, a portion which vests at the date of grant, and the remainder which vests in
three
equal annual installments over the
three
calendar years following the grant date. Compensation expense for LTIP Units which are not vested at the grant date is recognized on a straight-line basis over the requisite service period for each separately vesting portion of the award. We have also made long-term grants in the form of LTIP Units to certain employees, which generally vest in equal annual installments over
four
to
five
calendar years following the grant date, and some of these grants include a portion which vests at the date of grant. In aggregate, we granted
898 thousand
,
800 thousand
and
704 thousand
LTIP Units to employees during
2018
,
2017
and
2016
, respectively.
Non-Employee Director Awards
As annual fees for their services, each of our non-employee directors receives a grant of LTIP Units that vests on a quarterly basis during the year the services are rendered, which is the calendar year following the grant date. We granted
37 thousand
,
28 thousand
and
35 thousand
LTIP Units to our non-employee directors during
2018
,
2017
and
2016
, respectively.
Compensation Expense
Total stock-based compensation expense, net of capitalized amounts, was
$22.3 million
,
$18.5 million
and
$17.4 million
during
2018
,
2017
and
2016
, respectively. Certain amounts of stock-based compensation expense are capitalized for employees who provide leasing and construction services. We capitalized
$5.0 million
,
$2.5 million
, and
$1.5 million
during
2018
,
2017
and
2016
, respectively. At
December 31, 2018
, the total unrecognized stock-based compensation expense for unvested LTIP Unit awards was
$19.4 million
, which will be recognized over a weighted-average term of
two years
.
F- 30
Stock-Based Award Activity
The table below presents our outstanding stock options activity:
|
Fully Vested Stock Options:
|
Number of Stock Options (Thousands)
|
Weighted Average Exercise Price
|
Weighted Average
Remaining Contract Life (Months)
|
Total
Intrinsic Value (Thousands)
|
Intrinsic Value of Options Exercised (Thousands)
|
||||||||||||
|
Outstanding at December 31, 2015
|
11,535
|
|
$
|
18.04
|
|
23
|
$
|
151,569
|
|
||||||||
|
Exercised
|
(7,566
|
)
|
$
|
20.98
|
|
$
|
104,108
|
|
|||||||||
|
Outstanding at December 31, 2016
|
3,969
|
|
$
|
12.43
|
|
27
|
$
|
95,770
|
|
||||||||
|
Exercised
|
(3,920
|
)
|
$
|
12.43
|
|
$
|
102,963
|
|
|||||||||
|
Outstanding at December 31, 2017
|
49
|
|
$
|
12.66
|
|
16
|
$
|
1,375
|
|
||||||||
|
Exercised
|
(49
|
)
|
$
|
12.66
|
|
$
|
1,196
|
|
|||||||||
|
Outstanding at December 31, 2018
|
—
|
|
|||||||||||||||
The table below presents our unvested LTIP Units activity:
|
Unvested LTIP Units:
|
Number of Units (Thousands)
|
Weighted Average Grant Date Fair Value
|
Grant Date Fair Value (Thousands)
|
||||||||
|
Outstanding at December 31, 2015
|
1,096
|
|
$
|
19.85
|
|
||||||
|
Granted
|
739
|
|
$
|
27.62
|
|
$
|
20,420
|
|
|||
|
Vested
|
(778
|
)
|
$
|
22.23
|
|
$
|
17,293
|
|
|||
|
Forfeited
|
(17
|
)
|
$
|
27.77
|
|
$
|
473
|
|
|||
|
Outstanding at December 31, 2016
|
1,040
|
|
$
|
23.46
|
|
||||||
|
Granted
|
828
|
|
$
|
29.89
|
|
$
|
24,745
|
|
|||
|
Vested
|
(807
|
)
|
$
|
25.40
|
|
$
|
20,497
|
|
|||
|
Forfeited
|
(5
|
)
|
$
|
31.36
|
|
$
|
172
|
|
|||
|
Outstanding at December 31, 2017
|
1,056
|
|
$
|
26.98
|
|
||||||
|
Granted
|
935
|
|
$
|
27.01
|
|
$
|
25,247
|
|
|||
|
Vested
|
(1,036
|
)
|
$
|
25.82
|
|
$
|
26,740
|
|
|||
|
Forfeited
|
(10
|
)
|
$
|
34.18
|
|
$
|
333
|
|
|||
|
Outstanding at December 31, 2018
|
945
|
|
$
|
28.20
|
|
||||||
F- 31
13. Fair Value of Financial Instruments
Our estimates of the fair value of financial instruments were determined using available market information and widely used valuation methods. Considerable judgment is necessary to interpret market data and determine an estimated fair value. The use of different market assumptions or valuation methods may have a material effect on the estimated fair values. The FASB fair value framework hierarchy distinguishes between assumptions based on market data obtained from sources independent of the reporting entity, and the reporting entity’s own assumptions about market-based inputs. The hierarchy is as follows:
Level 1 - inputs utilize unadjusted quoted prices in active markets for identical assets or liabilities.
Level 2 - inputs are observable either directly or indirectly for similar assets and liabilities in active markets.
Level 3 - inputs are unobservable assumptions generated by the reporting entity
As of
December 31, 2018
, we did not have any fair value estimates of financial instruments using Level 3 inputs.
Financial instruments disclosed at fair value
Short term financial instruments:
The carrying amounts for cash and cash equivalents, tenant receivables, revolving credit line, interest payable, accounts payable, security deposits and dividends payable approximate fair value because of the short-term nature of these instruments.
Secured notes payable:
See Note
7
for the details of our secured notes payable. We estimate the fair value of our consolidated secured notes payable by calculating the credit-adjusted present value of the principal and interest payments for each secured note payable. The calculation incorporates observable market interest rates which we consider to be Level 2 inputs, assumes that the loans will be outstanding through maturity, and excludes any maturity extension options. The table below presents the estimated fair value and carrying value of our secured notes payable (excluding our, revolving credit facility), the carrying value includes unamortized loan premium and excludes unamortized deferred loan fees:
|
(In thousands)
|
December 31, 2018
|
December 31, 2017
|
||||||
|
Fair value
|
$
|
4,087,979
|
|
$
|
4,195,489
|
|
||
|
Carrying value
|
$
|
4,062,968
|
|
$
|
4,156,499
|
|
||
Financial instruments measured at fair value
Derivative instruments:
See Note
9
for the details of our derivatives. We present our derivatives on the balance sheet at fair value, on a gross basis, excluding accrued interest. We estimate the fair value of our derivative instruments by calculating the credit-adjusted present value of the expected future cash flows of each derivative. The calculation incorporates the contractual terms of the derivatives, observable market interest rates which we consider to be Level 2 inputs, and credit risk adjustments to reflect the counterparty's as well as our own nonperformance risk. Our derivatives are not subject to master netting arrangements. The table below presents the estimated fair value of our derivatives:
|
(In thousands)
|
December 31, 2018
|
December 31, 2017
|
|||||
|
Derivative Assets:
|
|||||||
|
Fair value - c
onsolidated
derivatives
(1)
|
$
|
73,414
|
|
$
|
60,069
|
|
|
|
Fair value -
unconsolidated
Funds' derivatives
(2)
|
$
|
12,228
|
|
$
|
9,437
|
|
|
|
Derivative Liabilities:
|
|||||||
|
Fair value - c
onsolidated
derivatives
(1)
|
$
|
1,530
|
|
$
|
807
|
|
|
|
Fair value -
unconsolidated
Funds' derivatives
(2)
|
$
|
—
|
|
$
|
—
|
|
|
___________________________________________________________________________________
|
(1)
|
Consolidated derivatives, which include
100%
, not our pro-rata share, of our consolidated JVs' derivatives, are included in interest rate contracts in our consolidated balance sheets. The fair values exclude accrued interest which is included in interest payable in the consolidated balance sheet.
|
|
(2)
|
Reflects
100%
, not our pro-rata share, of our unconsolidated Funds' derivatives. Our pro-rata share of the amounts related to the unconsolidated Funds' derivatives is included in our Investment in unconsolidated real estate funds in our consolidated balance sheets. See Note
17
regarding our unconsolidated Funds debt and derivatives.
|
F- 32
14. Segment Reporting
Segment information is prepared on the same basis that our management reviews information for operational decision-making purposes. We operate in
two
business segments: (i) the acquisition, development, ownership and management of office real estate and (ii) the acquisition, development, ownership and management of multifamily real estate. The services for our office segment primarily include rental of office space and other tenant services, including parking and storage space rental. The services for our multifamily segment include rental of apartments and other tenant services, including parking and storage space rental. Asset information by segment is not reported because we do not use this measure to assess performance or make decisions to allocate resources. Therefore, depreciation and amortization expense is not allocated among segments. General and administrative expenses and interest expense are not included in segment profit as our internal reporting addresses these items on a corporate level. The table below presents the operating activity of our reportable segments:
|
(In thousands)
|
Year Ended December 31,
|
||||||||||
|
2018
|
2017
|
2016
|
|||||||||
|
Office Segment
|
|||||||||||
|
Total office revenues
|
$
|
777,931
|
|
$
|
715,546
|
|
$
|
645,633
|
|
||
|
Office expenses
|
(252,751
|
)
|
(233,633
|
)
|
(214,546
|
)
|
|||||
|
Office segment profit
|
525,180
|
|
481,913
|
|
431,087
|
|
|||||
|
Multifamily Segment
|
|||||||||||
|
Total multifamily revenues
|
103,385
|
|
96,506
|
|
96,918
|
|
|||||
|
Multifamily expenses
|
(28,116
|
)
|
(24,401
|
)
|
(23,317
|
)
|
|||||
|
Multifamily segment profit
|
75,269
|
|
72,105
|
|
73,601
|
|
|||||
|
Total profit from all segments
|
$
|
600,449
|
|
$
|
554,018
|
|
$
|
504,688
|
|
||
The table below presents a reconciliation of the total profit from all segments to net income attributable to common stockholders:
|
(In thousands)
|
Year Ended December 31,
|
||||||||||
|
2018
|
2017
|
2016
|
|||||||||
|
Total profit from all segments
|
$
|
600,449
|
|
$
|
554,018
|
|
$
|
504,688
|
|
||
|
General and administrative
|
(38,641
|
)
|
(36,234
|
)
|
(34,957
|
)
|
|||||
|
Depreciation and amortization
|
(309,864
|
)
|
(276,761
|
)
|
(248,914
|
)
|
|||||
|
Other income
|
11,414
|
|
9,712
|
|
8,759
|
|
|||||
|
Other expenses
|
(7,472
|
)
|
(7,037
|
)
|
(9,477
|
)
|
|||||
|
Income, including depreciation, from unconsolidated real estate funds
|
6,400
|
|
5,905
|
|
7,812
|
|
|||||
|
Interest expense
|
(133,402
|
)
|
(145,176
|
)
|
(146,148
|
)
|
|||||
|
Demolition expenses
|
(272
|
)
|
—
|
|
—
|
|
|||||
|
Income before gains
|
128,612
|
|
104,427
|
|
81,763
|
|
|||||
|
Gains on sales of investments in real estate
|
—
|
|
—
|
|
14,327
|
|
|||||
|
Net income
|
128,612
|
|
104,427
|
|
96,090
|
|
|||||
|
Less: Net income attributable to noncontrolling interests
|
(12,526
|
)
|
(9,984
|
)
|
(10,693
|
)
|
|||||
|
Net income attributable to common stockholders
|
$
|
116,086
|
|
$
|
94,443
|
|
$
|
85,397
|
|
||
F- 33
15. Future Minimum Lease Rental Receipts
We lease space to tenants primarily under non-cancelable operating leases that generally contain provisions for a base rent plus reimbursement of certain operating expenses, and we own fee interests in
two
parcels of land from which we receive rent under ground leases. The table below presents the future minimum base rentals on our non-cancelable office tenant and ground leases at
December 31, 2018
:
|
Year Ending December 31,
|
(In thousands)
|
||
|
2019
|
$
|
578,162
|
|
|
2020
|
531,875
|
|
|
|
2021
|
437,528
|
|
|
|
2022
|
353,395
|
|
|
|
2023
|
269,535
|
|
|
|
Thereafter
|
656,926
|
|
|
|
Total future minimum base rentals
(1)
|
$
|
2,827,421
|
|
_____________________________________________________
|
(1)
|
Does not include (i) residential leases, which typically have a term of
one
year or less, (ii) holdover rent, (ii) other types of rent such as storage and antenna rent, (iv) tenant reimbursements, (v) straight line rent, (vi) amortization/accretion of acquired above/below-market lease intangibles and (vii) percentage rents. The amounts assume that early termination options held by tenants are not exercised.
|
16. Future Minimum Lease Rental Payments
We pay rent under a ground lease which expires on
December 31, 2086
. The rent is fixed at
$733 thousand
per year until
February 28, 2029
, and will then reset to the greater of the existing ground rent or market. We incurred ground rent expense of
$733 thousand
during
2018
,
2017
and
2016
, respectively. The table below, which assumes that the ground rent payments will continue to be
$733 thousand
per year after
February 28, 2029
, presents the future minimum ground lease payments as of
December 31, 2018
:
|
Year ending December 31:
|
(In thousands)
|
||
|
2019
|
$
|
733
|
|
|
2020
|
733
|
|
|
|
2021
|
733
|
|
|
|
2022
|
733
|
|
|
|
2023
|
733
|
|
|
|
Thereafter
|
46,178
|
|
|
|
Total future minimum lease payments
|
$
|
49,843
|
|
F- 34
17. Commitments, Contingencies and Guarantees
Legal Proceedings
From time to time, we are party to various lawsuits, claims and other legal proceedings that arise in the ordinary course of our business. Excluding ordinary, routine litigation incidental to our business, we are not currently a party to any legal proceedings that we believe would reasonably be expected to have a materially adverse effect on our business, financial condition or results of operations.
Concentration of Risk
We are subject to credit risk with respect to our tenant receivables and deferred rent receivables related to our tenant leases. Our tenants' ability to honor the terms of their respective leases remains dependent upon economic, regulatory and social factors. We seek to minimize our credit risk from our tenant leases by (i) targeting smaller, more affluent tenants, from a diverse mix of industries, (ii) performing credit evaluations of prospective tenants, and (iii) obtaining security deposits or letters of credit from our tenants. In
2018
,
2017
and
2016
, no tenant accounted for more than 10% of our total revenues. See Note 2 for the details of our allowances for tenant receivables and deferred rent receivables.
All of our properties, including the properties of our consolidated JVs and unconsolidated Funds, are located in Los Angeles County, California and Honolulu, Hawaii, and we are therefore susceptible to adverse economic and regulatory developments, as well as natural disasters, in those markets.
We are subject to credit risk with respect to our interest rate swap counterparties that we use to manage the risk associated with our floating rate debt. We do not post or receive collateral with respect to our swap transactions. See Note
9
for the details of our interest rate contracts. We seek to minimize our credit risk by entering into agreements with a variety of high quality counterparties with investment grade ratings.
We have significant cash balances invested in a variety of short-term money market funds that are intended to preserve principal value and maintain a high degree of liquidity while providing current income. These investments are not insured against loss of principal and there is no guarantee that our investments in these funds will be redeemable at par value. We also have significant cash balances in bank accounts with high quality financial institutions with investment grade ratings. Interest bearing bank accounts at each U.S. banking institution are insured by the FDIC up to
$250 thousand
.
Asset Retirement Obligations
Conditional asset retirement obligations represent a legal obligation to perform an asset retirement activity in which the timing and/or method of settlement is conditional on a future event that may or may not be within our control. A liability for a conditional asset retirement obligation must be recorded if the fair value of the obligation can be reasonably estimated. Environmental site assessments have identified
twenty-eight
buildings in our Consolidated Portfolio, and
four
buildings owned by our unconsolidated Funds which contain asbestos, and would have to be removed in compliance with applicable environmental regulations if these properties are demolished or undergo major renovations. As of
December 31, 2018
, the obligations to remove the asbestos from these properties if they were demolished or undergo major renovations have indeterminable settlement dates, and we are unable to reasonably estimate the fair value of the associated conditional asset retirement obligation. As of
December 31, 2018
, the obligations to remove the asbestos from properties that are currently undergoing major renovations, or that we plan to renovate in the future, are not material to our financial statements.
Development and Other Contracts
During 2016, we commenced building an additional
491
new apartments at our Moanalua Hillside Apartments in Honolulu, Hawaii. We also invested additional capital to upgrade the existing buildings, improve the parking and landscaping, built a new leasing and management office, and constructed a new fitness facility and two pools. In West Los Angeles, we are building a high-rise apartment building with
376
apartments. As of
December 31, 2018
, we had an aggregate remaining contractual commitment for these development projects of approximately
$202.9 million
. As of
December 31, 2018
, we had an aggregate remaining contractual commitment for repositionings, capital expenditure projects and tenant improvements of approximately
$55.3 million
.
F- 35
Guarantees
We have made certain environmental and other limited indemnities and guarantees covering customary non-recourse carve- outs for our unconsolidated Funds' debt. We have also guaranteed the related swaps. Our Funds have agreed to indemnify us for any amounts that we would be required to pay under these agreements. As of
December 31, 2018
, all of the obligations under the related debt and swap agreements have been performed in accordance with the terms of those agreements. The table below summarizes our Funds' debt as of
December 31, 2018
. The amounts represent 100% (not our pro-rata share) of the amounts related to our Funds:
|
Fund
(1)
|
Loan Maturity Date
|
Principal Balance
(In millions)
|
Variable Interest Rate
|
Swap Fixed Interest Rate
|
Swap Maturity Date
|
|||||||
|
Partnership X
(2)(4)
|
3/1/2023
|
$
|
110.0
|
|
LIBOR + 1.40%
|
2.30%
|
3/1/2021
|
|||||
|
Fund X
(3)(4)
|
7/1/2024
|
400.0
|
|
LIBOR + 1.65%
|
3.44%
|
7/1/2022
|
||||||
|
$
|
510.0
|
|
||||||||||
___________________________________________________
|
(1)
|
See Note
5
for more information regarding our unconsolidated Funds.
|
|
(2)
|
Floating rate term loan, swapped to fixed, which is secured by
two
properties and requires monthly payments of interest only, with the outstanding principal due upon maturity. As of
December 31, 2018
, assuming a
zero
-percent LIBOR interest rate during the remaining life of the swap, the maximum future payments under the swap agreement were
$2.2 million
.
|
|
(3)
|
Floating rate term loan, swapped to fixed, which is secured by
six
properties and requires monthly payments of interest only, with the outstanding principal due upon maturity. As of
December 31, 2018
, assuming a
zero
-percent LIBOR interest rate during the remaining life of the swap, the maximum future payments under the swap agreement were
$25.4 million
. Loan agreement includes the requirement to purchase an interest rate cap if one month LIBOR equals or exceeds
3.56%
for
fourteen
consecutive days after the related swap matures.
|
|
(4)
|
Loan agreement includes a
zero
-percent LIBOR floor. The corresponding swaps do not include such a floor.
|
F- 36
18. Quarterly Financial Information (unaudited)
The tables below present selected quarterly information for
2018
and
2017
:
|
|
Three Months Ended
|
||||||||||||||
|
(In thousands, except per share amounts)
|
March 31,
2018 |
June 30, 2018
|
September 30, 2018
|
December 31, 2018
|
|||||||||||
|
Total revenue
|
$
|
212,247
|
|
$
|
219,469
|
|
$
|
223,308
|
|
$
|
226,292
|
|
|||
|
Net income before noncontrolling interests
|
$
|
32,631
|
|
$
|
37,033
|
|
$
|
35,416
|
|
$
|
23,532
|
|
|||
|
Net income attributable to common stockholders
|
$
|
28,206
|
|
$
|
31,684
|
|
$
|
30,561
|
|
$
|
25,635
|
|
|||
|
Net income per common share - basic
|
$
|
0.17
|
|
$
|
0.19
|
|
$
|
0.18
|
|
$
|
0.15
|
|
|||
|
Net income per common share - diluted
|
$
|
0.17
|
|
$
|
0.19
|
|
$
|
0.18
|
|
$
|
0.15
|
|
|||
|
Weighted average shares of common stock outstanding - basic
|
169,601
|
|
169,916
|
|
169,926
|
|
170,121
|
|
|||||||
|
Weighted average shares of common stock and common stock equivalents outstanding - diluted
|
169,625
|
|
169,926
|
|
169,931
|
|
170,121
|
|
|||||||
|
|
Three Months Ended
|
||||||||||||||
|
(In thousands, except per share amounts)
|
March 31,
2017 |
June 30, 2017
|
September 30, 2017
|
December 31, 2017
|
|||||||||||
|
Total revenue
|
$
|
194,481
|
|
$
|
199,632
|
|
$
|
208,749
|
|
$
|
209,190
|
|
|||
|
Net income before noncontrolling interests
|
$
|
21,780
|
|
$
|
22,153
|
|
$
|
28,508
|
|
$
|
31,986
|
|
|||
|
Net income attributable to common stockholders
|
$
|
19,049
|
|
$
|
20,244
|
|
$
|
25,614
|
|
$
|
29,536
|
|
|||
|
Net income per common share - basic
|
$
|
0.12
|
|
$
|
0.13
|
|
$
|
0.15
|
|
$
|
0.17
|
|
|||
|
Net income per common share - diluted
|
$
|
0.12
|
|
$
|
0.13
|
|
$
|
0.15
|
|
$
|
0.17
|
|
|||
|
Weighted average shares of common stock outstanding - basic
|
152,490
|
|
155,898
|
|
165,471
|
|
169,521
|
|
|||||||
|
Weighted average shares of common stock and common stock equivalents outstanding - diluted
|
153,655
|
|
155,952
|
|
165,520
|
|
169,562
|
|
|||||||
F- 37
Douglas Emmett, Inc.
Schedule III - Consolidated Real Estate and Accumulated Depreciation and Amortization
As of December 31, 2018
(In thousands)
|
|
|
Initial Cost
|
Cost Capitalized Subsequent to Acquisition
|
Gross Carrying Amount
|
|
|
|
|||||||||||||||||||||||||||||
|
Property Name
|
Encumb-rances
|
Land
|
Building & Improve-ments
(2)
|
Improve-
ments
(2)
|
Land
|
Building & Improve-ments
(2)
|
Total
(3)
|
Accumulated Depreciation & Amortization
|
Year Built / Renovated
|
Year Acquired
|
||||||||||||||||||||||||||
|
Office Properties
|
||||||||||||||||||||||||||||||||||||
|
100 Wilshire
|
$
|
—
|
|
$
|
12,769
|
|
$
|
78,447
|
|
$
|
145,881
|
|
$
|
27,108
|
|
$
|
209,989
|
|
$
|
237,097
|
|
$
|
67,476
|
|
1968/2002
|
1999
|
||||||||||
|
233 Wilshire
|
62,962
|
|
9,263
|
|
130,426
|
|
2,572
|
|
9,263
|
|
132,998
|
|
142,261
|
|
9,677
|
|
1975/2008-2009
|
2016
|
||||||||||||||||||
|
401 Wilshire
|
—
|
|
9,989
|
|
29,187
|
|
121,993
|
|
21,787
|
|
139,382
|
|
161,169
|
|
44,421
|
|
1981/2000
|
1996
|
||||||||||||||||||
|
429 Santa Monica
|
33,691
|
|
4,949
|
|
72,534
|
|
2,900
|
|
4,949
|
|
75,434
|
|
80,383
|
|
4,309
|
|
1982/2016
|
2017
|
||||||||||||||||||
|
1299 Ocean
|
124,699
|
|
22,748
|
|
265,198
|
|
8,311
|
|
22,748
|
|
273,509
|
|
296,257
|
|
13,325
|
|
1980/2006
|
2017
|
||||||||||||||||||
|
1901 Avenue of the Stars
|
—
|
|
18,514
|
|
131,752
|
|
112,641
|
|
26,163
|
|
236,744
|
|
262,907
|
|
79,484
|
|
1968/2001
|
2001
|
||||||||||||||||||
|
8484 Wilshire
(1)
|
16,132
|
|
8,846
|
|
77,780
|
|
16,070
|
|
8,846
|
|
93,850
|
|
102,696
|
|
17,804
|
|
1972/2013
|
2013
|
||||||||||||||||||
|
9401 Wilshire
|
31,582
|
|
6,740
|
|
152,310
|
|
1,071
|
|
6,740
|
|
153,381
|
|
160,121
|
|
5,281
|
|
1971
|
2017
|
||||||||||||||||||
|
9601 Wilshire
|
145,845
|
|
16,597
|
|
54,774
|
|
107,741
|
|
17,658
|
|
161,454
|
|
179,112
|
|
56,579
|
|
1962/2004
|
2001
|
||||||||||||||||||
|
9665 Wilshire
|
77,445
|
|
5,568
|
|
177,072
|
|
12,946
|
|
5,568
|
|
190,018
|
|
195,586
|
|
7,489
|
|
1971
|
2017
|
||||||||||||||||||
|
10880 Wilshire
|
198,794
|
|
29,995
|
|
437,514
|
|
9,072
|
|
29,988
|
|
446,593
|
|
476,581
|
|
38,643
|
|
1970/2009
|
2016
|
||||||||||||||||||
|
10960 Wilshire
|
201,893
|
|
45,844
|
|
429,769
|
|
20,484
|
|
45,852
|
|
450,245
|
|
496,097
|
|
38,549
|
|
1971/2006
|
2016
|
||||||||||||||||||
|
11777 San Vicente
|
—
|
|
5,032
|
|
15,768
|
|
29,640
|
|
6,714
|
|
43,726
|
|
50,440
|
|
14,937
|
|
1974/1998
|
1999
|
||||||||||||||||||
|
12100 Wilshire
|
101,203
|
|
20,164
|
|
208,755
|
|
6,040
|
|
20,164
|
|
214,795
|
|
234,959
|
|
18,348
|
|
1985
|
2016
|
||||||||||||||||||
|
12400 Wilshire
|
—
|
|
5,013
|
|
34,283
|
|
76,716
|
|
8,828
|
|
107,184
|
|
116,012
|
|
36,034
|
|
1985
|
1996
|
||||||||||||||||||
|
16501 Ventura
|
39,803
|
|
6,759
|
|
53,112
|
|
10,937
|
|
6,759
|
|
64,049
|
|
70,808
|
|
13,314
|
|
1986/2012
|
2013
|
||||||||||||||||||
|
Beverly Hills Medical Center
|
—
|
|
4,955
|
|
27,766
|
|
28,476
|
|
6,435
|
|
54,762
|
|
61,197
|
|
18,559
|
|
1964/2004
|
2004
|
||||||||||||||||||
|
Bishop Place
|
—
|
|
8,317
|
|
105,651
|
|
58,572
|
|
8,833
|
|
163,707
|
|
172,540
|
|
57,295
|
|
1992
|
2004
|
||||||||||||||||||
|
Bishop Square
|
180,000
|
|
16,273
|
|
213,793
|
|
25,831
|
|
16,273
|
|
239,624
|
|
255,897
|
|
62,676
|
|
1972/1983
|
2010
|
||||||||||||||||||
|
Brentwood Court
|
—
|
|
2,564
|
|
8,872
|
|
506
|
|
2,563
|
|
9,379
|
|
11,942
|
|
3,332
|
|
1984
|
2006
|
||||||||||||||||||
|
Brentwood Executive Plaza
|
39,169
|
|
3,255
|
|
9,654
|
|
32,249
|
|
5,921
|
|
39,237
|
|
45,158
|
|
13,349
|
|
1983/1996
|
1995
|
||||||||||||||||||
|
Brentwood Medical Plaza
|
35,905
|
|
5,934
|
|
27,836
|
|
1,427
|
|
5,933
|
|
29,264
|
|
35,197
|
|
10,572
|
|
1975
|
2006
|
||||||||||||||||||
|
Brentwood San Vicente Medical
|
—
|
|
5,557
|
|
16,457
|
|
1,039
|
|
5,557
|
|
17,496
|
|
23,053
|
|
6,266
|
|
1957/1985
|
2006
|
||||||||||||||||||
|
Brentwood/Saltair
|
—
|
|
4,468
|
|
11,615
|
|
11,625
|
|
4,775
|
|
22,933
|
|
27,708
|
|
8,131
|
|
1986
|
2000
|
||||||||||||||||||
|
Bundy/Olympic
|
34,273
|
|
4,201
|
|
11,860
|
|
29,416
|
|
6,030
|
|
39,447
|
|
45,477
|
|
13,909
|
|
1991/1998
|
1994
|
||||||||||||||||||
|
Camden Medical Arts
|
38,021
|
|
3,102
|
|
12,221
|
|
27,789
|
|
5,298
|
|
37,814
|
|
43,112
|
|
13,057
|
|
1972/1992
|
1995
|
||||||||||||||||||
|
Carthay Campus
|
48,007
|
|
6,595
|
|
70,454
|
|
5,036
|
|
6,594
|
|
75,491
|
|
82,085
|
|
12,275
|
|
1965/2008
|
2014
|
||||||||||||||||||
|
Century Park Plaza
|
128,311
|
|
10,275
|
|
70,761
|
|
123,949
|
|
16,153
|
|
188,832
|
|
204,985
|
|
56,516
|
|
1972/1987
|
1999
|
||||||||||||||||||
|
Century Park West
(1)
|
5,618
|
|
3,717
|
|
29,099
|
|
1,033
|
|
3,667
|
|
30,182
|
|
33,849
|
|
11,273
|
|
1971
|
2007
|
||||||||||||||||||
|
Columbus Center
|
14,362
|
|
2,096
|
|
10,396
|
|
9,758
|
|
2,333
|
|
19,917
|
|
22,250
|
|
7,041
|
|
1987
|
2001
|
||||||||||||||||||
|
Coral Plaza
|
25,831
|
|
4,028
|
|
15,019
|
|
18,426
|
|
5,366
|
|
32,107
|
|
37,473
|
|
11,236
|
|
1981
|
1998
|
||||||||||||||||||
|
Cornerstone Plaza
(1)
|
10,630
|
|
8,245
|
|
80,633
|
|
6,231
|
|
8,263
|
|
86,846
|
|
95,109
|
|
26,906
|
|
1986
|
2007
|
||||||||||||||||||
|
Encino Gateway
|
—
|
|
8,475
|
|
48,525
|
|
55,755
|
|
15,653
|
|
97,102
|
|
112,755
|
|
33,083
|
|
1974/1998
|
2000
|
||||||||||||||||||
|
Encino Plaza
|
—
|
|
5,293
|
|
23,125
|
|
48,919
|
|
6,165
|
|
71,172
|
|
77,337
|
|
25,121
|
|
1971/1992
|
2000
|
||||||||||||||||||
|
Encino Terrace
|
91,133
|
|
12,535
|
|
59,554
|
|
96,475
|
|
15,533
|
|
153,031
|
|
168,564
|
|
51,989
|
|
1986
|
1999
|
||||||||||||||||||
|
Executive Tower
(1)
|
15,098
|
|
6,660
|
|
32,045
|
|
60,003
|
|
9,471
|
|
89,237
|
|
98,708
|
|
32,313
|
|
1989
|
1995
|
||||||||||||||||||
|
First Financial Plaza
|
54,084
|
|
12,092
|
|
81,104
|
|
3,655
|
|
12,092
|
|
84,759
|
|
96,851
|
|
10,691
|
|
1986
|
2015
|
||||||||||||||||||
|
Gateway Los Angeles
|
46,785
|
|
2,376
|
|
15,302
|
|
48,207
|
|
5,119
|
|
60,766
|
|
65,885
|
|
21,250
|
|
1987
|
1994
|
||||||||||||||||||
|
Harbor Court
|
30,992
|
|
51
|
|
41,001
|
|
47,131
|
|
12,060
|
|
76,123
|
|
88,183
|
|
22,257
|
|
1994
|
2004
|
||||||||||||||||||
|
Honolulu Club
|
—
|
|
1,863
|
|
16,766
|
|
5,766
|
|
1,863
|
|
22,532
|
|
24,395
|
|
8,147
|
|
1980
|
2008
|
||||||||||||||||||
|
Landmark II
|
—
|
|
6,086
|
|
109,259
|
|
66,476
|
|
13,070
|
|
168,751
|
|
181,821
|
|
56,261
|
|
1989
|
1997
|
||||||||||||||||||
|
Lincoln/Wilshire
|
38,021
|
|
3,833
|
|
12,484
|
|
23,012
|
|
7,475
|
|
31,854
|
|
39,329
|
|
10,872
|
|
1996
|
2000
|
||||||||||||||||||
|
MB Plaza
|
32,090
|
|
4,533
|
|
22,024
|
|
32,047
|
|
7,503
|
|
51,101
|
|
58,604
|
|
16,949
|
|
1971/1996
|
1998
|
||||||||||||||||||
|
Olympic Center
|
41,313
|
|
5,473
|
|
22,850
|
|
32,894
|
|
8,247
|
|
52,970
|
|
61,217
|
|
17,828
|
|
1985/1996
|
1997
|
||||||||||||||||||
|
One Westwood
(1)
|
15,994
|
|
10,350
|
|
29,784
|
|
62,621
|
|
9,194
|
|
93,561
|
|
102,755
|
|
31,359
|
|
1987/2004
|
1999
|
||||||||||||||||||
|
Palisades Promenade
|
—
|
|
5,253
|
|
15,547
|
|
54,537
|
|
9,664
|
|
65,673
|
|
75,337
|
|
21,362
|
|
1990
|
1995
|
||||||||||||||||||
F- 38
Douglas Emmett, Inc.
Schedule III - Consolidated Real Estate and Accumulated Depreciation and Amortization
As of December 31, 2018
(In thousands)
|
|
|
Initial Cost
|
Cost Capitalized Subsequent to Acquisition
|
Gross Carrying Amount
|
|
|
|
|||||||||||||||||||||||||||||
|
Property Name
|
Encumb-rances
|
Land
|
Building & Improve-ments
(2)
|
Improve-ments
(2)
|
Land
|
Building & Improve-ments
(2)
|
Total
(3)
|
Accumulated Depreciation & Amortization
|
Year Built / Renovated
|
Year Acquired
|
||||||||||||||||||||||||||
|
Office Properties (continued)
|
||||||||||||||||||||||||||||||||||||
|
Saltair/San Vicente
|
21,269
|
|
5,075
|
|
6,946
|
|
16,813
|
|
7,557
|
|
21,277
|
|
28,834
|
|
7,643
|
|
1964/1992
|
1997
|
||||||||||||||||||
|
San Vicente Plaza
|
—
|
|
7,055
|
|
12,035
|
|
51
|
|
7,055
|
|
12,086
|
|
19,141
|
|
4,621
|
|
1985
|
2006
|
||||||||||||||||||
|
Santa Monica Square
(1)
|
9,169
|
|
5,366
|
|
18,025
|
|
21,310
|
|
6,863
|
|
37,838
|
|
44,701
|
|
13,611
|
|
1983/2004
|
2001
|
||||||||||||||||||
|
Second Street Plaza
|
49,505
|
|
4,377
|
|
15,277
|
|
35,680
|
|
7,421
|
|
47,913
|
|
55,334
|
|
16,450
|
|
1991
|
1997
|
||||||||||||||||||
|
Sherman Oaks Galleria
|
300,000
|
|
33,213
|
|
17,820
|
|
402,194
|
|
48,328
|
|
404,899
|
|
453,227
|
|
139,046
|
|
1981/2002
|
1997
|
||||||||||||||||||
|
Studio Plaza
|
—
|
|
9,347
|
|
73,358
|
|
139,850
|
|
15,015
|
|
207,540
|
|
222,555
|
|
79,664
|
|
1988/2004
|
1995
|
||||||||||||||||||
|
The Tower
|
65,969
|
|
9,643
|
|
160,602
|
|
3,146
|
|
9,643
|
|
163,748
|
|
173,391
|
|
15,289
|
|
1988/1998
|
2016
|
||||||||||||||||||
|
The Trillium
(1)
|
26,472
|
|
20,688
|
|
143,263
|
|
87,532
|
|
21,989
|
|
229,494
|
|
251,483
|
|
75,904
|
|
1988
|
2005
|
||||||||||||||||||
|
Valley Executive Tower
|
92,618
|
|
8,446
|
|
67,672
|
|
103,059
|
|
11,737
|
|
167,440
|
|
179,177
|
|
56,133
|
|
1984
|
1998
|
||||||||||||||||||
|
Valley Office Plaza
|
41,271
|
|
5,731
|
|
24,329
|
|
47,813
|
|
8,957
|
|
68,916
|
|
77,873
|
|
24,998
|
|
1966/2002
|
1998
|
||||||||||||||||||
|
Verona
|
—
|
|
2,574
|
|
7,111
|
|
14,729
|
|
5,111
|
|
19,303
|
|
24,414
|
|
6,686
|
|
1991
|
1997
|
||||||||||||||||||
|
Village on Canon
|
58,337
|
|
5,933
|
|
11,389
|
|
49,556
|
|
13,303
|
|
53,575
|
|
66,878
|
|
17,903
|
|
1989/1995
|
1994
|
||||||||||||||||||
|
Warner Center Towers
|
335,000
|
|
43,110
|
|
292,147
|
|
417,365
|
|
59,419
|
|
693,203
|
|
752,622
|
|
233,979
|
|
1982-1993/2004
|
2002
|
||||||||||||||||||
|
Westside Towers
|
107,386
|
|
8,506
|
|
79,532
|
|
80,586
|
|
14,568
|
|
154,056
|
|
168,624
|
|
51,893
|
|
1985
|
1998
|
||||||||||||||||||
|
Westwood Center
|
113,344
|
|
9,512
|
|
259,341
|
|
9,508
|
|
9,513
|
|
268,848
|
|
278,361
|
|
24,383
|
|
1965/2000
|
2016
|
||||||||||||||||||
|
Westwood Place
|
65,669
|
|
8,542
|
|
44,419
|
|
51,718
|
|
11,448
|
|
93,231
|
|
104,679
|
|
31,580
|
|
1987
|
1999
|
||||||||||||||||||
|
Multifamily Properties
|
||||||||||||||||||||||||||||||||||||
|
555 Barrington
|
50,000
|
|
6,461
|
|
27,639
|
|
40,247
|
|
14,903
|
|
59,444
|
|
74,347
|
|
20,360
|
|
1989
|
1999
|
||||||||||||||||||
|
Barrington Plaza
|
210,000
|
|
28,568
|
|
81,485
|
|
153,090
|
|
58,208
|
|
204,935
|
|
263,143
|
|
69,633
|
|
1963/1998
|
1998
|
||||||||||||||||||
|
Barrington/Kiowa
|
11,345
|
|
5,720
|
|
10,052
|
|
580
|
|
5,720
|
|
10,632
|
|
16,352
|
|
3,656
|
|
1974
|
2006
|
||||||||||||||||||
|
Barry
|
9,000
|
|
6,426
|
|
8,179
|
|
460
|
|
6,426
|
|
8,639
|
|
15,065
|
|
3,086
|
|
1973
|
2006
|
||||||||||||||||||
|
Kiowa
|
4,535
|
|
2,605
|
|
3,263
|
|
372
|
|
2,605
|
|
3,635
|
|
6,240
|
|
1,274
|
|
1972
|
2006
|
||||||||||||||||||
|
Moanalua Hillside Apartments
|
145,000
|
|
22,252
|
|
157,353
|
|
40,280
|
|
32,826
|
|
186,987
|
|
219,813
|
|
41,344
|
|
1968/2004/2018
|
2005
|
||||||||||||||||||
|
Pacific Plaza
|
78,000
|
|
10,091
|
|
16,159
|
|
73,520
|
|
27,816
|
|
71,954
|
|
99,770
|
|
23,839
|
|
1963/1998
|
1999
|
||||||||||||||||||
|
The Shores
|
212,000
|
|
20,809
|
|
74,191
|
|
198,955
|
|
60,555
|
|
233,400
|
|
293,955
|
|
76,519
|
|
1965-67/2002
|
1999
|
||||||||||||||||||
|
Villas at Royal Kunia
|
90,120
|
|
42,887
|
|
71,376
|
|
14,463
|
|
35,163
|
|
93,563
|
|
128,726
|
|
36,210
|
|
1990/1995
|
2006
|
||||||||||||||||||
|
Waena Apartments
|
102,400
|
|
26,864
|
|
119,272
|
|
1,006
|
|
26,864
|
|
120,279
|
|
147,143
|
|
13,638
|
|
1970/2009-2014
|
2014
|
||||||||||||||||||
|
Ground Lease
|
||||||||||||||||||||||||||||||||||||
|
Owensmouth/Warner
(1)
|
5,887
|
|
23,848
|
|
—
|
|
—
|
|
23,848
|
|
—
|
|
23,848
|
|
—
|
|
N/A
|
2006
|
||||||||||||||||||
|
Total Operating Properties
|
$
|
4,163,982
|
|
$
|
790,894
|
|
$
|
5,402,373
|
|
$
|
3,707,759
|
|
$
|
1,065,099
|
|
$
|
8,835,856
|
|
$
|
9,900,955
|
|
$
|
2,246,887
|
|
||||||||||||
|
Property Under Development
|
||||||||||||||||||||||||||||||||||||
|
Landmark II Development
|
$
|
—
|
|
$
|
13,070
|
|
$
|
—
|
|
$
|
34,766
|
|
$
|
13,070
|
|
$
|
34,766
|
|
$
|
47,836
|
|
$
|
—
|
|
N/A
|
N/A
|
||||||||||
|
Moanalua Hillside Apartments - Development
|
—
|
|
2,468
|
|
—
|
|
76,045
|
|
2,468
|
|
78,871
|
|
81,339
|
|
—
|
|
N/A
|
N/A
|
||||||||||||||||||
|
Other Developments
|
—
|
|
—
|
|
—
|
|
578
|
|
—
|
|
578
|
|
578
|
|
—
|
|
N/A
|
N/A
|
||||||||||||||||||
|
Total Property Under Development
|
$
|
—
|
|
$
|
15,538
|
|
$
|
—
|
|
$
|
111,389
|
|
$
|
15,538
|
|
$
|
114,215
|
|
$
|
129,753
|
|
$
|
—
|
|
|
|
||||||||||
|
Total
|
$
|
4,163,982
|
|
$
|
806,432
|
|
$
|
5,402,373
|
|
$
|
3,819,148
|
|
$
|
1,080,637
|
|
$
|
8,950,071
|
|
$
|
10,030,708
|
|
$
|
2,246,887
|
|
|
|
||||||||||
_____________________________________________________
|
(1)
|
These properties are encumbered by our revolving credit facility, which had a
$105.0 million
balance as of
December 31, 2018
.
|
|
(2)
|
Includes tenant improvements and lease intangibles.
|
|
(3)
|
At
December 31, 2018
, the aggregate federal income tax cost basis for consolidated real estate was
$6.90 billion
(unaudited).
|
F- 39
Douglas Emmett, Inc.
Schedule III - Consolidated Real Estate and Accumulated Depreciation and Amortization
As of December 31, 2018
(In thousands)
The table below presents a reconciliation of our investment in real estate:
|
Year Ended December 31,
|
|||||||||||
|
|
2018
|
2017
|
2016
|
||||||||
|
Investment in real estate, gross
|
|
|
|
||||||||
|
Beginning balance
|
$
|
9,829,208
|
|
$
|
8,998,120
|
|
$
|
7,266,009
|
|
||
|
Property acquisitions
|
—
|
|
707,120
|
|
1,750,828
|
|
|||||
|
Improvements
|
271,948
|
|
111,642
|
|
96,649
|
|
|||||
|
Developments
|
5,281
|
|
66,013
|
|
31,559
|
|
|||||
|
Properties held for sale
|
—
|
|
—
|
|
(186
|
)
|
|||||
|
Removal of fully depreciated and amortized tenant improvements and lease intangibles
|
(75,729
|
)
|
(53,687
|
)
|
(146,739
|
)
|
|||||
|
Ending balance
|
$
|
10,030,708
|
|
$
|
9,829,208
|
|
$
|
8,998,120
|
|
||
|
Accumulated depreciation and amortization
|
|||||||||||
|
Beginning balance
|
$
|
(2,012,752
|
)
|
$
|
(1,789,678
|
)
|
$
|
(1,687,998
|
)
|
||
|
Depreciation and amortization
|
(309,864
|
)
|
(276,761
|
)
|
(248,914
|
)
|
|||||
|
Properties held for sale
|
—
|
|
—
|
|
495
|
|
|||||
|
Removal of fully depreciated and amortized tenant improvements and lease intangibles
|
75,729
|
|
53,687
|
|
146,739
|
|
|||||
|
Ending balance
|
$
|
(2,246,887
|
)
|
$
|
(2,012,752
|
)
|
$
|
(1,789,678
|
)
|
||
|
Investment in real estate, net
|
$
|
7,783,821
|
|
$
|
7,816,456
|
|
$
|
7,208,442
|
|
||
F- 40
TABLE OF CONTENTS
Part IItem 1. Business OverviewItem 1A. Risk FactorsItem 1B. Unresolved Staff CommentsItem 2. PropertiesItem 3. Legal ProceedingsItem 4. Mine Safety DisclosuresPart IIItem 5. Market For Registrant S Common Equity, Related Stockholder Matters and Issuer Purchases Of Equity SecuritiesItem 6. Selected Financial DataItem 7. Management S Discussion and Analysis Of Financial Condition and Results Of OperationsItem 7A. Quantitative and Qualitative Disclosures About Market RiskItem 8. Financial Statements and Supplementary DataItem 9. Changes in and Disagreements with Accountants on Accounting and Financial DisclosureItem 9A. Controls and ProceduresItem 9B. Other InformationPart IIIItem 10. Directors, Executive Officers and Corporate GovernanceItem 11. Executive CompensationItem 12. Security Ownership Of Certain Beneficial Owners and Management and Related Stockholder MattersItem 13. Certain Relationships and Related Transactions, and Director IndependenceItem 14. Principal Accounting Fees and ServicesPart IVItem 15. Exhibits and Financial Statement ScheduleItem 16. 10-k Summary