DOUGLAS EMMETT INC
10-Ks and 10-Qs
|
|
|
|
|
|
|
|
|
|
|
|
|
|
|
|
|
|
|
|
|
|
|
|
|
|
|
|
|
|
|
|
|
|
|
|
|
|
|
|
|
|
|
|
|
|
|
|
|
|
United States
Securities and Exchange Commission
Washington, D.C. 20549
FORM
10-Q
|
|
QUARTERLY REPORT PURSUANT TO SECTION 13 OR 15(d) OF THE SECURITIES EXCHANGE ACT OF 1934 | ||||
For the quarterly period ended
June 30, 2020
or
|
|
TRANSITION REPORT PURSUANT TO SECTION 13 OR 15(d) OF THE SECURITIES EXCHANGE ACT OF 1934 | ||||
For the transition period from _____ to _____
Commission file number:
001-33106

(Exact name of registrant as specified in its charter)
|
|
|
||||
| (State or other jurisdiction of incorporation or organization) | (I.R.S. Employer Identification No.) | ||||
|
|
, |
|
, |
|
|
||||||||||||
| (Address of principal executive offices) | (Zip Code) | ||||||||||||||||
(
310
)
255-7700
(Registrant’s telephone number, including area code)
N/A
(Former name, former address and former fiscal year, if changed since last report)
Securities registered pursuant to Section 12(b) of the Act:
| Title of Each Class | Trading Symbol | Name of Each Exchange on Which Registered | ||||||||||||
|
|
|
|
||||||||||||
Indicate by check mark whether the registrant (1) has filed all reports required to be filed by Section 13 or 15(d) of the Securities Exchange Act of 1934 during the preceding 12 months (or for such shorter period that the registrant was required to file such reports), and (2) has been subject to such filing requirements for the past 90 days.
Yes
☒
No
☐
Indicate by check mark whether the registrant has submitted electronically every Interactive Data File required to be submitted pursuant to Rule 405 of Regulation S-T (§232.405 of this chapter) during the preceding 12 months (or for such shorter period that the registrant was required to submit such files).
Yes
☒
No
☐
Indicate by check mark whether the registrant is a large accelerated filer, an accelerated filer, a non-accelerated filer, a smaller reporting company, or an emerging growth company. See definitions of "large accelerated filer", "accelerated filer", "smaller reporting company" and "emerging growth company" in Rule 12b-2 of the Exchange Act.
|
|
☒ | Accelerated filer | ☐ | |||||||||||
| Non-accelerated filer | ☐ | Smaller reporting company |
|
|||||||||||
| Emerging growth company |
|
|||||||||||||
If an emerging growth company, indicate by check mark if the registrant has elected not to use the extended transition period for complying with any new or revised financial accounting standards provided pursuant to Section 13(a) of the Exchange Act.
☐
Indicate by check mark whether the registrant is a shell company (as defined in Rule 12b-2 of the Exchange Act). Yes
☐
No
☒
Indicate the number of shares outstanding of each of the issuer’s classes of common stock, as of the latest practicable date.
| Class | Outstanding at | July 31, 2020 | |||||||||
| Common Stock, $0.01 par value per share |
|
shares | |||||||||
1
|
DOUGLAS EMMETT, INC.
FORM 10-Q
|
||||||||
| Table of Contents | ||||||||
| Page | ||||||||
2
Glossary
Abbreviations used in this Report:
| AOCI | Accumulated Other Comprehensive Income (Loss) | ||||
| ASC | Accounting Standards Codification | ||||
| ASU | Accounting Standards Update | ||||
| ATM | At-the-Market | ||||
| BOMA | Building Owners and Managers Association | ||||
| CEO | Chief Executive Officer | ||||
| CFO | Chief Financial Officer | ||||
| Code | Internal Revenue Code of 1986, as amended | ||||
| COVID-19 | Coronavirus Disease 2019 | ||||
| DEI | Douglas Emmett, Inc. | ||||
| EPS | Earnings Per Share | ||||
| Exchange Act | Securities Exchange Act of 1934, as amended | ||||
| FASB | Financial Accounting Standards Board | ||||
| FDIC | Federal Deposit Insurance Corporation | ||||
| FFO | Funds From Operations | ||||
| Fund X | Douglas Emmett Fund X, LLC | ||||
| Funds | Unconsolidated Institutional Real Estate Funds | ||||
| GAAP | Generally Accepted Accounting Principles (United States) | ||||
| JV | Joint Venture | ||||
| LIBOR | London Interbank Offered Rate | ||||
| LTIP Units | Long-Term Incentive Plan Units | ||||
| NAREIT | National Association of Real Estate Investment Trusts | ||||
| OCI | Other Comprehensive Income (Loss) | ||||
| OP Units | Operating Partnership Units | ||||
| Operating Partnership | Douglas Emmett Properties, LP | ||||
| Opportunity Fund | Fund X Opportunity Fund, LLC | ||||
| Partnership X | Douglas Emmett Partnership X, LP | ||||
| PCAOB | Public Company Accounting Oversight Board (United States) | ||||
| REIT | Real Estate Investment Trust | ||||
| Report | Quarterly Report on Form 10-Q | ||||
| SEC | Securities and Exchange Commission | ||||
| Securities Act | Securities Act of 1933, as amended | ||||
| TRS | Taxable REIT Subsidiary(ies) | ||||
| US | United States | ||||
| USD | United States Dollar | ||||
| VIE | Variable Interest Entity(ies) | ||||
3
Glossary
Defined terms used in this Report:
| Annualized Rent | Annualized cash base rent (excludes tenant reimbursements, parking and other revenue) before abatements under leases commenced as of the reporting date and expiring after the reporting date. Annualized Rent for our triple net office properties (in Honolulu and one single tenant building in Los Angeles) is calculated by adding expense reimbursements and estimates of normal building expenses paid by tenants to base rent. Annualized Rent does not include lost rent recovered from insurance and rent for building management use. Annualized Rent includes rent for a health club that we own and operate in Honolulu and for our corporate headquarters in Santa Monica. We report Annualized Rent because it is a widely reported measure of the performance of equity REITs, and is used by some investors as a means to determine tenant demand and to compare our performance and value with other REITs. We use Annualized Rent to manage and monitor the performance of our office and multifamily portfolios. | ||||
| Consolidated Portfolio | Includes all of the properties included in our consolidated results, including our consolidated JVs. | ||||
|
Funds From Operations (FFO)
|
We calculate FFO in accordance with the standards established by NAREIT by excluding gains (or losses) on sales of investments in real estate, gains (or losses) from changes in control of investments in real estate, real estate depreciation and amortization (other than amortization of right-of-use assets for which we are the lessee and amortization of deferred loan costs), and impairment write-downs of real estate from our net income (including adjusting for the effect of such items attributable to consolidated JVs and unconsolidated Funds, but not for noncontrolling interests included in our Operating Partnership). FFO is a non-GAAP supplemental financial measure that we report because we believe it is useful to our investors. See Management’s Discussion and Analysis of Financial Condition and Results of Operations in Item 2 of this Report for a discussion of FFO. | ||||
| Leased Rate | The percentage leased as of the reporting date. Management space is considered leased. Space taken out of service during a repositioning or which is vacant as a result of a fire or other damage is excluded from both the numerator and denominator for calculating percentage leased. We report Leased Rate because it is a widely reported measure of the performance of equity REITs, and is also used by some investors as a means to determine tenant demand and to compare our performance with other REITs. We use Leased Rate to manage and monitor the performance of our office and multifamily portfolios. | ||||
|
Net Operating Income (NOI)
|
We calculate NOI as revenue less operating expenses attributable to the properties that we own and operate. NOI is calculated by excluding the following from our net income: general and administrative expense, depreciation and amortization expense, other income, other expenses, income from unconsolidated Funds, interest expense, gain from consolidation of JVs, gains (or losses) on sales of investments in real estate and net income attributable to noncontrolling interests. NOI is a non-GAAP supplemental financial measure that we report because we believe it is useful to our investors. See Management’s Discussion and Analysis of Financial Condition and Results of Operations in Item 2 of this Report for a discussion of our Same Property NOI. | ||||
| Occupancy Rate | We calculate the Occupancy Rate by excluding signed leases not yet commenced from the Leased Rate. Management space is considered occupied. Space taken out of service during a repositioning or which is vacant as a result of a fire or other damage is excluded from both the numerator and denominator for calculating Occupancy Rate. We report Occupancy Rate because it is a widely reported measure of the performance of equity REITs, and is also used by some investors as a means to determine tenant demand and to compare our performance with other REITs. We use Occupancy Rate to manage and monitor the performance of our office and multifamily portfolios. | ||||
| Rental Rate | We present two forms of Rental Rates - Cash Rental Rates and Straight-Line Rental Rates. Cash Rental Rate is calculated by dividing the rent paid by the Rentable Square Feet. Straight-Line Rental Rate is calculated by dividing the average rent over the lease term by the Rentable Square Feet. | ||||
4
Glossary
| Recurring Capital Expenditures | Building improvements required to maintain revenues once a property has been stabilized, and excludes capital expenditures for (i) acquired buildings being stabilized, (ii) newly developed space, (iii) upgrades to improve revenues or operating expenses or significantly change the use of the space, (iv) casualty damage and (v) bringing the property into compliance with governmental or lender requirements. We report Recurring Capital Expenditures because it is a widely reported measure of the performance of equity REITs, and is used by some investors as a means to determine our cash flow requirements and to compare our performance with other REITs. We use Recurring Capital Expenditures to manage and monitor the performance of our office and multifamily portfolios. | ||||
|
Rentable Square Feet
|
Based on the BOMA remeasurement and consists of leased square feet (including square feet with respect to signed leases not commenced as of the reporting date), available square feet, building management use square feet and square feet of the BOMA adjustment on leased space. We report Rentable Square Feet because it is a widely reported measure of the performance and value of equity REITs, and is also used by some investors to compare our performance and value with other REITs. We use Rentable Square Feet to manage and monitor the performance of our office portfolio. | ||||
| Same Properties | Our consolidated properties that have been owned and operated by us in a consistent manner, and reported in our consolidated results during the entire span of both periods being compared. We exclude from our same property subset any properties (i) acquired during the comparative periods; (ii) sold, held for sale, contributed or otherwise removed from our consolidated financial statements during the comparative periods; or (iii) that underwent a major repositioning project or were impacted by development activity that we believed significantly affected the properties' results during the comparative periods. | ||||
| Short-Term Leases | Represents leases that expired on or before the reporting date or had a term of less than one year, including hold over tenancies, month to month leases and other short-term occupancies. | ||||
| Total Portfolio | Includes our Consolidated Portfolio plus the properties owned by our Fund. | ||||
5
This Report contains forward-looking statements within the meaning of the Section 27A of the Securities Act and Section 21E of the Exchange Act. You can find many (but not all) of these statements by looking for words such as “believe”, “expect”, “anticipate”, “estimate”, “approximate”, “intend”, “plan”, “would”, “could”, “may”, “future” or other similar expressions in this Report. We claim the protection of the safe harbor contained in the Private Securities Litigation Reform Act of 1995. We caution investors that any forward-looking statements used in this Report, or those that we make orally or in writing from time to time, are based on our beliefs and assumptions, as well as information currently available to us. Actual outcomes will be affected by known and unknown risks, trends, uncertainties and factors beyond our control or ability to predict. Although we believe that our assumptions are reasonable, they are not guarantees of future performance and some will inevitably prove to be incorrect. As a result, our future results can be expected to differ from our expectations, and those differences may be material. Accordingly, investors should use caution when relying on previously reported forward-looking statements, which were based on results and trends at the time they were made, to anticipate future results or trends. Some of the risks and uncertainties that could cause our actual results, performance or achievements to differ materially from those expressed or implied by forward-looking statements include the following:
•
adverse developments related to the COVID-19 pandemic;
•
adverse economic or real estate developments affecting Southern California or Honolulu, Hawaii;
•
competition from other real estate investors in our markets;
•
decreasing rental rates or increasing tenant incentive and vacancy rates;
•
defaults on, early terminations of, or non-renewal of leases by tenants;
•
increases in interest rates or operating costs;
•
insufficient cash flows to service our outstanding debt or pay rent on ground leases;
•
difficulties in raising capital;
•
inability to liquidate real estate or other investments quickly;
•
adverse changes to rent control laws and regulations;
•
environmental uncertainties;
•
natural disasters;
•
insufficient insurance, or increases in insurance costs;
•
inability to successfully expand into new markets and submarkets;
•
difficulties in identifying properties to acquire and failure to complete acquisitions successfully;
•
failure to successfully operate acquired properties;
•
risks associated with property development;
•
risks associated with JVs;
•
conflicts of interest with our officers and reliance on key personnel;
•
changes in zoning and other land use laws;
•
adverse results of litigation or governmental proceedings;
•
failure to comply with laws, regulations and covenants that are applicable to our business;
•
possible terrorist attacks or wars;
•
possible cyber attacks or intrusions;
•
adverse changes to accounting rules;
•
weaknesses in our internal controls over financial reporting;
•
failure to maintain our REIT status under federal tax laws; and
•
adverse changes to tax laws, including those related to property taxes.
For further discussion of these and other risk factors see Item 1A. "Risk Factors” in our 2019 Annual Report on Form 10-K for the fiscal year ended December 31, 2019, and Item 1A. "Risk Factors" in this Report. This Report and all subsequent written and oral forward-looking statements attributable to us or any person acting on our behalf are expressly qualified in their entirety by the cautionary statements contained or referred to in this section. We do not undertake any obligation to release publicly any revisions to our forward-looking statements to reflect events or circumstances after the date of this Report.
6
PART I. FINANCIAL INFORMATION
Item 1. Financial Statements
|
Douglas Emmett, Inc.
Consolidated Balance Sheets
(In thousands, except share data)
|
|||||||||||
| June 30, 2020 | December 31, 2019 | ||||||||||
| Unaudited | |||||||||||
| Assets | |||||||||||
| Investment in real estate: | |||||||||||
| Land | $ |
|
$ |
|
|||||||
| Buildings and improvements |
|
|
|||||||||
| Tenant improvements and lease intangibles |
|
|
|||||||||
| Property under development |
|
|
|||||||||
| Investment in real estate, gross |
|
|
|||||||||
| Less: accumulated depreciation and amortization |
(
|
(
|
|||||||||
| Investment in real estate, net |
|
|
|||||||||
| Ground lease right-of-use asset |
|
|
|||||||||
| Cash and cash equivalents |
|
|
|||||||||
| Tenant receivables |
|
|
|||||||||
| Deferred rent receivables |
|
|
|||||||||
| Acquired lease intangible assets, net |
|
|
|||||||||
| Interest rate contract assets |
|
|
|||||||||
| Investment in unconsolidated Fund |
|
|
|||||||||
| Other assets |
|
|
|||||||||
| Total Assets | $ |
|
$ |
|
|||||||
| Liabilities | |||||||||||
| Secured notes payable and revolving credit facility, net | $ |
|
$ |
|
|||||||
| Ground lease liability |
|
|
|||||||||
| Interest payable, accounts payable and deferred revenue |
|
|
|||||||||
| Security deposits |
|
|
|||||||||
| Acquired lease intangible liabilities, net |
|
|
|||||||||
| Interest rate contract liabilities |
|
|
|||||||||
| Dividends payable |
|
|
|||||||||
| Total liabilities |
|
|
|||||||||
| Equity | |||||||||||
| Douglas Emmett, Inc. stockholders' equity: | |||||||||||
|
Common Stock, $
|
|
|
|||||||||
| Additional paid-in capital |
|
|
|||||||||
| Accumulated other comprehensive loss |
(
|
(
|
|||||||||
| Accumulated deficit |
(
|
(
|
|||||||||
| Total Douglas Emmett, Inc. stockholders' equity |
|
|
|||||||||
| Noncontrolling interests |
|
|
|||||||||
| Total equity |
|
|
|||||||||
| Total Liabilities and Equity | $ |
|
$ |
|
|||||||
See accompanying notes to the consolidated financial statements.
7
Douglas Emmett, Inc.
Consolidated Statements of Operations
(Unaudited; in thousands, except per share data)
| Three Months Ended June 30, | Six Months Ended June 30, | ||||||||||||||||||||||
| 2020 | 2019 | 2020 | 2019 | ||||||||||||||||||||
| Revenues | |||||||||||||||||||||||
| Office rental | |||||||||||||||||||||||
| Rental revenues and tenant recoveries | $ |
|
$ |
|
$ |
|
$ |
|
|||||||||||||||
| Parking and other income |
|
|
|
|
|||||||||||||||||||
| Total office revenues |
|
|
|
|
|||||||||||||||||||
| Multifamily rental | |||||||||||||||||||||||
| Rental revenues |
|
|
|
|
|||||||||||||||||||
| Parking and other income |
|
|
|
|
|||||||||||||||||||
| Total multifamily revenues |
|
|
|
|
|||||||||||||||||||
| Total revenues |
|
|
|
|
|||||||||||||||||||
| Operating Expenses | |||||||||||||||||||||||
| Office expenses |
|
|
|
|
|||||||||||||||||||
| Multifamily expenses |
|
|
|
|
|||||||||||||||||||
| General and administrative expenses |
|
|
|
|
|||||||||||||||||||
| Depreciation and amortization |
|
|
|
|
|||||||||||||||||||
| Total operating expenses |
|
|
|
|
|||||||||||||||||||
| Operating income |
|
|
|
|
|||||||||||||||||||
| Other income |
|
|
|
|
|||||||||||||||||||
| Other expenses |
(
|
(
|
(
|
(
|
|||||||||||||||||||
| (Loss) income from unconsolidated Funds |
(
|
|
|
|
|||||||||||||||||||
| Interest expense |
(
|
(
|
(
|
(
|
|||||||||||||||||||
| Net (loss) income |
(
|
|
|
|
|||||||||||||||||||
| Less: Net loss (income) attributable to noncontrolling interests |
|
(
|
|
(
|
|||||||||||||||||||
| Net income attributable to common stockholders | $ |
|
$ |
|
$ |
|
$ |
|
|||||||||||||||
| Net income per common share – basic and diluted | $ |
|
$ |
|
$ |
|
$ |
|
|||||||||||||||
See accompanying notes to the consolidated financial statements.
8
Douglas Emmett, Inc.
Consolidated Statements of Comprehensive Income (Loss)
(Unaudited and in thousands)
| Three Months Ended June 30, | Six Months Ended June 30, | ||||||||||||||||||||||
| 2020 | 2019 | 2020 | 2019 | ||||||||||||||||||||
| Net (loss) income | $ |
(
|
$ |
|
$ |
|
$ |
|
|||||||||||||||
| Other comprehensive loss: cash flow hedges |
(
|
(
|
(
|
(
|
|||||||||||||||||||
| Comprehensive loss |
(
|
(
|
(
|
(
|
|||||||||||||||||||
| Less: Comprehensive loss attributable to noncontrolling interests |
|
|
|
|
|||||||||||||||||||
| Comprehensive loss attributable to common stockholders | $ |
(
|
$ |
(
|
$ |
(
|
$ |
(
|
|||||||||||||||
See accompanying notes to the consolidated financial statements.
9
Douglas Emmett, Inc.
Consolidated Statements of Equity
(Unaudited; in thousands, except per share data)
| Three Months Ended June 30, | Six Months Ended June 30, | |||||||||||||||||||||||||
| 2020 | 2019 | 2020 | 2019 | |||||||||||||||||||||||
| Shares of Common Stock | Beginning balance |
|
|
|
|
|||||||||||||||||||||
| Exchange of OP Units for common stock |
|
|
|
|
||||||||||||||||||||||
| Issuance of common stock |
|
|
|
|
||||||||||||||||||||||
| Ending balance |
|
|
|
|
||||||||||||||||||||||
| Common Stock | Beginning balance | $ |
|
$ |
|
$ |
|
$ |
|
|||||||||||||||||
| Exchange of OP units for common stock |
|
|
|
|
||||||||||||||||||||||
| Issuance of common stock |
|
|
|
|
||||||||||||||||||||||
| Ending balance | $ |
|
$ |
|
$ |
|
$ |
|
||||||||||||||||||
| Additional Paid-in Capital | Beginning balance | $ |
|
$ |
|
$ |
|
$ |
|
|||||||||||||||||
| Exchange of OP Units for common stock |
|
|
|
|
||||||||||||||||||||||
| Repurchase of OP Units with cash |
|
|
(
|
(
|
||||||||||||||||||||||
| Issuance of common stock, net |
|
|
|
|
||||||||||||||||||||||
| Ending balance | $ |
|
$ |
|
$ |
|
$ |
|
||||||||||||||||||
| AOCI | Beginning balance | $ |
(
|
$ |
|
$ |
(
|
$ |
|
|||||||||||||||||
| Cash flow hedge adjustments |
(
|
(
|
(
|
(
|
||||||||||||||||||||||
| Ending balance | $ |
(
|
$ |
(
|
$ |
(
|
$ |
(
|
||||||||||||||||||
| Accumulated Deficit | Beginning balance | $ |
(
|
$ |
(
|
$ |
(
|
$ |
(
|
|||||||||||||||||
| ASU 2016-02 adoption |
|
|
|
(
|
||||||||||||||||||||||
| Net income attributable to common stockholders |
|
|
|
|
||||||||||||||||||||||
| Dividends |
(
|
(
|
(
|
(
|
||||||||||||||||||||||
| Ending balance | $ |
(
|
$ |
(
|
$ |
(
|
$ |
(
|
||||||||||||||||||
| Noncontrolling Interests | Beginning balance | $ |
|
$ |
|
$ |
|
$ |
|
|||||||||||||||||
| ASU 2016-02 adoption |
|
|
|
(
|
||||||||||||||||||||||
| Net (loss) income attributable to noncontrolling interests |
(
|
|
(
|
|
||||||||||||||||||||||
| Cash flow hedge adjustments |
(
|
(
|
(
|
(
|
||||||||||||||||||||||
| Contributions |
|
|
|
|
||||||||||||||||||||||
| Distributions |
(
|
(
|
(
|
(
|
||||||||||||||||||||||
| Exchange of OP Units for common stock |
|
(
|
(
|
(
|
||||||||||||||||||||||
| Repurchase of OP Units with cash |
|
|
(
|
(
|
||||||||||||||||||||||
| Stock-based compensation |
|
|
|
|
||||||||||||||||||||||
| Ending balance | $ |
|
$ |
|
$ |
|
$ |
|
||||||||||||||||||
10
Douglas Emmett, Inc.
Consolidated Statements of Equity
(Unaudited; in thousands, except per share data)
| Three Months Ended June 30, | Six Months Ended June 30, | |||||||||||||||||||||||||
| 2020 | 2019 | 2020 | 2019 | |||||||||||||||||||||||
| Total Equity | Beginning balance | $ |
|
$ |
|
$ |
|
$ |
|
|||||||||||||||||
|
|
|
|
(
|
|||||||||||||||||||||||
| Net (loss) income |
(
|
|
|
|
||||||||||||||||||||||
| Cash flow hedge adjustments |
(
|
(
|
(
|
(
|
||||||||||||||||||||||
| Issuance of common stock, net |
|
|
|
|
||||||||||||||||||||||
| Repurchase of OP Units with cash |
|
|
(
|
(
|
||||||||||||||||||||||
| Contributions |
|
|
|
|
||||||||||||||||||||||
| Dividends |
(
|
(
|
(
|
(
|
||||||||||||||||||||||
| Distributions |
(
|
(
|
(
|
(
|
||||||||||||||||||||||
| Stock-based compensation |
|
|
|
|
||||||||||||||||||||||
| Ending balance | $ |
|
$ |
|
$ |
|
$ |
|
||||||||||||||||||
| Dividends declared per common share | $ |
|
$ |
|
$ |
|
$ |
|
||||||||||||||||||
See accompanying notes to the consolidated financial statements.
11
Douglas Emmett, Inc.
Consolidated Statements of Cash Flows
(Unaudited and in thousands)
| Six Months Ended June 30, | |||||||||||
| 2020 | 2019 | ||||||||||
| Operating Activities | |||||||||||
| Net income | $ |
|
$ |
|
|||||||
| Adjustments to reconcile net income to net cash provided by operating activities: | |||||||||||
| Income from unconsolidated Funds |
(
|
(
|
|||||||||
| Depreciation and amortization |
|
|
|||||||||
| Net accretion of acquired lease intangibles |
(
|
(
|
|||||||||
| Straight-line rent |
|
(
|
|||||||||
| Write-off of uncollectible amounts |
|
|
|||||||||
| Loan premium amortized and written off |
(
|
(
|
|||||||||
| Deferred loan costs amortized and written off |
|
|
|||||||||
| Derivative non-cash adjustments |
|
(
|
|||||||||
| Amortization of stock-based compensation |
|
|
|||||||||
| Operating distributions from unconsolidated Funds |
|
|
|||||||||
| Change in working capital components: | |||||||||||
| Tenant receivables |
(
|
(
|
|||||||||
| Interest payable, accounts payable and deferred revenue |
|
(
|
|||||||||
| Security deposits |
(
|
|
|||||||||
| Other assets |
|
|
|||||||||
| Net cash provided by operating activities |
|
|
|||||||||
| Investing Activities | |||||||||||
| Capital expenditures for improvements to real estate |
(
|
(
|
|||||||||
| Capital expenditures for developments |
(
|
(
|
|||||||||
| Insurance recoveries for damage to real estate |
|
|
|||||||||
| Property acquisition |
|
(
|
|||||||||
| Acquisition of additional interests in unconsolidated Fund |
(
|
(
|
|||||||||
| Capital distributions from unconsolidated Funds |
|
|
|||||||||
| Net cash used in investing activities |
(
|
(
|
|||||||||
| Financing Activities | |||||||||||
| Proceeds from borrowings |
|
|
|||||||||
| Repayment of borrowings |
(
|
(
|
|||||||||
| Loan cost payments |
(
|
(
|
|||||||||
| Contributions from noncontrolling interests in consolidated JVs |
|
|
|||||||||
| Distributions paid to noncontrolling interests |
(
|
(
|
|||||||||
| Dividends paid to common stockholders |
(
|
(
|
|||||||||
| Repurchase of OP Units |
(
|
(
|
|||||||||
| Proceeds from issuance of common stock, net |
|
|
|||||||||
| Net cash used in financing activities |
(
|
|
|||||||||
| Increase in cash and cash equivalents and restricted cash |
|
|
|||||||||
| Cash and cash equivalents and restricted cash - beginning balance |
|
|
|||||||||
| Cash and cash equivalents and restricted cash - ending balance | $ |
|
$ |
|
|||||||
12
Douglas Emmett, Inc.
Consolidated Statements of Cash Flows
(Unaudited and in thousands)
| Reconciliation of Ending Cash Balance | |||||||||||
| Six Months Ended June 30, | |||||||||||
| 2020 | 2019 | ||||||||||
| Cash and cash equivalents - ending balance | $ |
|
$ |
|
|||||||
| Restricted cash - ending balance |
|
|
|||||||||
| Cash and cash equivalents and restricted cash - ending balance | $ |
|
$ |
|
|||||||
Supplemental Cash Flows Information
| Six Months Ended June 30, | |||||||||||
| 2020 | 2019 | ||||||||||
| Operating Activities | |||||||||||
| Cash paid for interest, net of capitalized interest | $ |
|
$ |
|
|||||||
| Capitalized interest paid | $ |
|
$ |
|
|||||||
| Non-cash Investing Transactions | |||||||||||
| Accrual for real estate and development capital expenditures | $ |
|
$ |
|
|||||||
| Capitalized stock-based compensation for improvements to real estate and developments | $ |
|
$ |
|
|||||||
| Removal of fully depreciated and amortized tenant improvements and lease intangibles | $ |
|
$ |
|
|||||||
| Removal of fully amortized acquired lease intangible assets | $ |
|
$ |
|
|||||||
| Removal of fully accreted acquired lease intangible liabilities | $ |
|
$ |
|
|||||||
| Property acquisition accrual | $ |
|
$ |
|
|||||||
| Recognition of ground lease right-of-use asset - Adoption of ASU 2016-02 | $ |
|
$ |
|
|||||||
| Above-market ground lease intangible liability offset against right-of-use asset - Adoption of ASU 2016-02 | $ |
|
$ |
|
|||||||
| Recognition of ground lease liability - Adoption of ASU 2016-02 | $ |
|
$ |
|
|||||||
| Non-cash Financing Transactions | |||||||||||
| Loss recorded in AOCI - consolidated derivatives | $ |
(
|
$ |
(
|
|||||||
| Loss recorded in AOCI - unconsolidated Funds' derivatives (our share) | $ |
(
|
$ |
(
|
|||||||
| Non-cash contributions from noncontrolling interests in consolidated JVs | $ |
|
$ |
|
|||||||
| Non-cash distributions to noncontrolling interests | $ |
|
$ |
|
|||||||
| Dividends declared | $ |
|
$ |
|
|||||||
| Exchange of OP Units for common stock | $ |
|
$ |
|
|||||||
See accompanying notes to the consolidated financial statements.
13
1.
Overview
Organization and Business Description
Douglas Emmett, Inc. is a fully integrated, self-administered and self-managed REIT. We are one of the largest owners and operators of high-quality office and multifamily properties in Los Angeles County, California and Honolulu, Hawaii. Through our interest in our Operating Partnership and its subsidiaries, consolidated JVs and unconsolidated Fund, we focus on owning, acquiring, developing and managing a significant market share of top-tier office properties and premier multifamily communities in neighborhoods that possess significant supply constraints, high-end executive housing and key lifestyle amenities. The terms "us," "we" and "our" as used in the consolidated financial statements refer to Douglas Emmett, Inc. and its subsidiaries on a consolidated basis.
At June 30, 2020, our Consolidated Portfolio consisted of (i) a
17.9
million square foot office portfolio, (ii)
4,209
multifamily apartment units and (iii) fee interests in
two
parcels of land from which we receive rent under ground leases. We also manage and own an equity interest in an unconsolidated Fund which, at June 30, 2020, owned an additional
0.4
million square feet of office space. We manage our unconsolidated Fund alongside our Consolidated Portfolio, and we therefore present the statistics for our office portfolio on a Total Portfolio basis.
As of June 30, 2020, our portfolio (not including
two
parcels of land from which we receive rent under ground leases), consisted of the following properties (including ancillary retail space):
| Consolidated Portfolio |
Total
Portfolio |
||||||||||
| Office | |||||||||||
| Wholly-owned properties |
|
|
|||||||||
| Consolidated JV properties |
|
|
|||||||||
| Unconsolidated Fund properties |
|
|
|||||||||
|
|
|
||||||||||
| Multifamily | |||||||||||
| Wholly-owned properties |
|
|
|||||||||
| Consolidated JV properties |
|
|
|||||||||
|
|
|
||||||||||
| Total |
|
|
|||||||||
Basis of Presentation
The accompanying consolidated financial statements are the consolidated financial statements of Douglas Emmett, Inc. and its subsidiaries, including our Operating Partnership and our consolidated JVs. All significant intercompany balances and transactions have been eliminated in our consolidated financial statements.
We consolidate entities in which we are considered to be the primary beneficiary of a VIE or have a majority of the voting interest of the entity. We are deemed to be the primary beneficiary of a VIE when we have (i) the power to direct the activities of that VIE that most significantly impact its economic performance, and (ii) the obligation to absorb losses or the right to receive benefits that could potentially be significant to the VIE. We do not consolidate entities in which the other parties have substantive kick-out rights to remove our power to direct the activities, most significantly impacting the economic performance, of that VIE. In determining whether we are the primary beneficiary, we consider factors such as ownership interest, management representation, authority to control decisions, and contractual and substantive participating rights of each party.
We consolidate our Operating Partnership through which we conduct substantially all of our business, and own, directly and through subsidiaries, substantially all of our assets, and are obligated to repay substantially all of our liabilities, including $
3.11
billion of consolidated debt. See Note 8. We also consolidate
four
JVs. As of June 30, 2020, these consolidated entities had aggregate total consolidated assets of $
9.27
billion (of which $
8.88
billion related to investment in real estate), aggregate total consolidated liabilities of $
5.23
billion (of which $
4.67
billion related to debt), and aggregate total consolidated equity of $
4.04
billion (of which $
1.56
billion related to noncontrolling interests).
14
Douglas Emmett, Inc.
Notes to Consolidated Financial Statements (unaudited) (continued)
2.
Summary of Significant Accounting Policies
We have not made any changes to our significant accounting policies disclosed in our 2019 Annual Report on Form 10-K.
Use of Estimates
The preparation of consolidated financial statements in conformity with US GAAP requires management to make certain estimates that affect the reported amounts in the consolidated financial statements and accompanying notes. Actual results could differ materially from those estimates.
Revenue Recognition
Rental revenues and tenant recoveries
We account for our rental revenues and tenant recoveries in accordance with Topic 842 "Leases". Rental revenues and tenant recoveries are included in: (i) Rental revenues and tenant recoveries under Office rental, and (ii) Rental revenues under Multifamily rental, in our consolidated statements of operations.
In accordance with Topic 842, we perform an assessment as to whether or not substantially all of the amounts due under a tenant’s lease agreement is deemed probable of collection. This assessment involves using a methodology that requires judgment and estimates about matters that are uncertain at the time the estimates are made, including tenant specific factors, specific industry conditions, and general economic trends and conditions.
For leases where we have concluded it is probable that we will collect substantially all the lease payments due under those leases, we continue to record lease income on a straight-line basis over the lease term. For leases where we have concluded that it is not probable that we will collect substantially all the lease payments due under those leases, we limit the lease income to the lesser of the income recognized on a straight-line basis or cash basis. If our conclusion of collectibility changes, we will record the difference between the lease income that would have been recognized on a straight-line basis and cash basis as a current-period adjustment to rental revenues and tenant recoveries. We write-off tenant receivables and deferred rent receivables as a charge against rental revenues and tenant recoveries in the period we conclude that substantially all of the lease payments are not probable of collection. If we subsequently collect amounts that were previously written off then the amounts collected are recorded as an increase to our rental revenues and tenant recoveries.
Charges for uncollectible amounts, related to tenant receivables and deferred rent receivables, which for the three and six months ended June 30, 2020 were primarily due to the impact of the COVID-19 pandemic, reduced our rental revenues and tenant recoveries by $
29.8
million and $
1.0
million for the three months ended June 30, 2020 and 2019, and $
35.0
million and $
3.4
million for the six months ended June 30, 2020 and 2019, respectively.
Douglas Emmett, Inc.
Notes to Consolidated Financial Statements (unaudited) (continued)
Office parking revenues
We account for our office parking revenues in accordance with ASC 606 "Revenue from Contracts with Customers". Office parking revenues are included in Parking and other income under Office rental in our consolidated statements of operations. Our lease contracts generally make a specified number of parking spaces available to the tenant, and we bill and recognize parking revenues on a monthly basis in accordance with the lease agreements, generally using the monthly parking rates in effect at the time of billing. Office
revenues were $
14.7
million and $
26.9
million for the three months ended June 30, 2020 and 2019, and $
44.9
million and $
53.3
million for the six months ended June 30, 2020 and 2019, respectively. Office parking receivables were $
0.4
million and $
1.3
million as of June 30, 2020 and December 31, 2019, respectively, and are included in Tenant receivables in our consolidated balance sheets.
Income Taxes
We have elected to be taxed as a REIT under the Code. Provided that we qualify for taxation as a REIT, we are generally not subject to corporate-level income tax on the earnings distributed currently to our stockholders that we derive from our REIT qualifying activities. We are subject to corporate-level tax on the earnings that we derive through our TRS.
New Accounting Pronouncements
Changes to US GAAP are implemented by the FASB in the form of ASUs. We consider the applicability and impact of all ASUs. Other than the ASUs discussed below, the FASB has not issued any other ASUs that we expect to be applicable and have a material impact on our consolidated financial statements.
ASUs Adopted
ASU 2016-13 (Topic 326 - "Financial Instruments-Credit Losses")
In June 2016, the FASB issued ASU No. 2016-13, "Measurement of Credit Losses on Financial Instruments", which amends "Financial Instruments-Credit Losses" (Topic 326). The ASU provides guidance for measuring credit losses on financial instruments. The ASU is effective for fiscal years beginning after December 15, 2019, including interim periods within those years, which for us was the first quarter of 2020. The amendments in the ASU should be applied on a modified-retrospective basis. The ASU impacts our measurement of credit losses for our Office parking receivables, which were $
0.4
million and $
1.3
million as of June 30, 2020 and December 31, 2019, respectively, and are included in Tenant receivables in our consolidated balance sheets. We adopted the ASU in the first quarter of 2020 and it did not have a material impact on our consolidated financial statements.
ASU 2020-04 (Topic 848 - "Reference Rate Reform")
In March 2020, the FASB issued ASU No. 2020-04, "Reference Rate Reform", which contains practical expedients for reference rate reform related activities that impact debt, leases, derivatives and other contracts. The practical expedients are optional and may be elected over time as reference rate reform activities occur. We elected to apply the hedge accounting expedients related to probability and the assessments of effectiveness for future LIBOR-indexed cash flows to assume that the index upon which future hedged transactions will be based matches the index on the corresponding derivatives. Application of these expedients maintains the presentation of derivatives consistent with past presentation. We will continue to evaluate the impact of the ASU and may apply other elections, as applicable, as additional changes in the market occur. Our election to apply the hedge accounting expedients in the first quarter of 2020 did not have a material impact on our consolidated financial statements.
16
Douglas Emmett, Inc.
Notes to Consolidated Financial Statements (unaudited) (continued)
Other Pronouncements
FASB COVID-19 Lease Modification Accounting Relief
In April 2020, the FASB staff issued a question and answer document (the “Lease Modification Q&A”) on the application of lease accounting guidance to lease concessions provided as a result of the COVID-19 pandemic. Under the existing lease accounting guidance, we would be required to determine on a lease-by-lease basis if a lease concession was the result of a new arrangement reached with the tenant (treated within the lease modification accounting framework) or if a lease concession was under the enforceable rights and obligations within the existing lease agreement (precluded from applying the lease modification accounting framework). The Lease Modification Q&A allows us, if certain criteria are met, to bypass the lease-by-lease analysis, and instead elect to either apply the lease modification accounting framework or not, with such election applied consistently to leases with similar characteristics and similar circumstances. We will avail ourselves of the election to avoid performing a lease-by-lease analysis. The Lease Modification Q&A did not have material impact on our consolidated financial statements; however, its impact on our future consolidated financial statements is dependent upon the extent of any lease concessions granted to tenants as a result of the COVID-19 pandemic in future periods and the elections made by us at the time of entering into such concessions.
FASB COVID-19 Cash Flow Hedge Accounting Relief
In April 2020, the FASB staff issued a question and answer document (the “Cash Flow Hedge Accounting Q&A”) on the application of cash flow hedge accounting guidance to cash flow hedges impacted by the COVID-19 pandemic. The Cash Flow Hedge Accounting Q&A clarifies that: (i) when cash flow hedge accounting has been discontinued, the delays in the timing of the forecasted transactions related to the impact of the COVID-19 pandemic may be considered rare cases caused by extenuating circumstances outside the control or influence of an entity, thereby allowing amounts deferred in AOCI to remain in AOCI until the forecasted transaction affects earnings, and (ii) missed forecasts, related to the effects of the COVID-19 pandemic, do not need to be considered when determining whether the entity has exhibited a pattern of missing forecasts that would call into question the entity’s ability to accurately predict forecasted transactions and the propriety of using cash flow hedge accounting in the future for similar transactions. The Cash Flow Hedge Accounting Q&A did not have material impact on our consolidated financial statements; however, its impact on our future consolidated financial statements is dependent upon our cash flow hedge forecasted transactions being impacted by the COVID-19 pandemic in future periods.
17
Douglas Emmett, Inc.
Notes to Consolidated Financial Statements (unaudited) (continued)
3.
Investment in Real Estate
We account for our property acquisitions as asset acquisitions. The acquired property's results of operations are included in our results of operations from the respective acquisition date.
Six Months Ended June 30, 2020
During six months ended June 30, 2020, we did not purchase any properties.
Six Months Ended June 30, 2019
On June 7, 2019, we acquired The Glendon, a residential community in Westwood, and on June 28, 2019, we contributed the property to a consolidated JV that we manage and in which we own a
twenty
percent capital interest.
The table below summarizes the purchase price allocation for the acquisition. The contract and purchase prices differ due to prorations and similar adjustments:
| (In thousands, except number of units) | The Glendon | ||||
| Submarket | West Los Angeles | ||||
| Acquisition date | June 7, 2019 | ||||
| Contract price | $ |
|
|||
| Number of multifamily units |
|
||||
| Retail square footage |
|
||||
| Investment in real estate: | |||||
| Land | $ |
|
|||
| Buildings and improvements |
|
||||
| Tenant improvements and lease intangibles |
|
||||
| Acquired above- and below-market leases, net |
(
|
||||
| Net assets and liabilities acquired | $ |
|
|||
4.
Ground Lease
We pay rent under a ground lease located in Honolulu, Hawaii, which expires on December 31, 2086. The rent is fixed at $
733
thousand per year until February 28, 2029, after which it will reset to the greater of the existing ground rent or market. As of June 30, 2020, the right-of-use asset carrying value of this ground lease was $
7.5
million and the ground lease liability was $
10.9
million.
We incurred ground rent expense of $
183
thousand for the three months ended June 30, 2020 and 2019, and $
365
thousand and $
363
thousand for the six months ended June 30, 2020 and 2019, respectively, which is included in Office expenses in our consolidated statements of operations.
The table below, which assumes that the ground rent payments will continue to be $
733
thousand per year after February 28, 2029, presents the future minimum ground lease payments as of June 30, 2020:
| Twelve months ending June 30: | (In thousands) | ||||
| 2021 | $ |
|
|||
| 2022 |
|
||||
| 2023 |
|
||||
| 2024 |
|
||||
| 2025 |
|
||||
| Thereafter |
|
||||
| Total future minimum lease payments | $ |
|
|||
18
Douglas Emmett, Inc.
Notes to Consolidated Financial Statements (unaudited) (continued)
5.
Acquired Lease Intangibles
Summary of our Acquired Lease Intangibles
| (In thousands) | June 30, 2020 | December 31, 2019 | |||||||||
| Above-market tenant leases | $ |
|
$ |
|
|||||||
| Above-market tenant leases - accumulated amortization |
(
|
(
|
|||||||||
| Above-market ground lease where we are the lessor |
|
|
|||||||||
| Above-market ground lease - accumulated amortization |
(
|
(
|
|||||||||
| Acquired lease intangible assets, net | $ |
|
$ |
|
|||||||
| Below-market tenant leases | $ |
|
$ |
|
|||||||
| Below-market tenant leases - accumulated accretion |
(
|
(
|
|||||||||
| Acquired lease intangible liabilities, net | $ |
|
$ |
|
|||||||
Impact on the Consolidated Statements of Operations
The table below summarizes the net amortization/accretion related to our above- and below-market leases:
| Three Months Ended June 30, | Six Months Ended June 30, | ||||||||||||||||||||||
| (In thousands) | 2020 | 2019 | 2020 | 2019 | |||||||||||||||||||
|
Net accretion of above- and below-market tenant lease assets and liabilities
(1)
|
$ |
|
$ |
|
$ |
|
$ |
|
|||||||||||||||
|
Amortization of an above-market ground lease asset
(2)
|
(
|
(
|
(
|
(
|
|||||||||||||||||||
| Total | $ |
|
$ |
|
$ |
|
$ |
|
|||||||||||||||
______________________________________________
(1) Recorded as a net increase to office and multifamily rental revenues.
(2) Recorded as a decrease to office parking and other income.
19
Douglas Emmett, Inc.
Notes to Consolidated Financial Statements (unaudited) (continued)
6.
Investments in Unconsolidated Funds
Description of our Funds
As of June 30, 2020, we manage and own an equity interest of
33.5
% in an unconsolidated Fund, Partnership X, through which we and other investors in the Fund own
two
office properties totaling
0.4
million square feet. During the six months ended June 30, 2020 we purchased additional interests of
3.6
% in Partnership X for $
6.6
million.
On November 21, 2019, we restructured Fund X which resulted in Fund X being treated as a consolidated JV from November 21, 2019, and we closed the Opportunity Fund. See Note 6 in our 2019 Annual Report on Form 10-K for more information.
At June 30, 2019, we managed and held direct and indirect equity interests in
three
unconsolidated Funds, consisting of
6.2
% of the Opportunity Fund,
72.7
% of Fund X and
24.6
% of Partnership X, through which we and investors in the Funds' owned
eight
office properties totaling
1.8
million square feet. We purchased an additional interest of
1.4
% in Fund X during the six months ended June 30, 2019.
Our Funds pay us fees and reimburse us for certain expenses related to property management and other services we provide, which are included in Other income in our consolidated statements of operations. We also receive distributions based on invested capital and on any profits that exceed certain specified cash returns to the investors.
The table below presents cash distributions we received from our Funds:
| Six Months Ended June 30, | |||||||||||
| (In thousands) | 2020 | 2019 | |||||||||
|
Operating distributions received
(1)
|
$ |
|
$ |
|
|||||||
|
Capital distributions received
(1)
|
|
|
|||||||||
|
Total distributions received
(1)
|
$ |
|
$ |
|
|||||||
_________________________________________________
(1) The distributions are not directly comparable to the prior period; the distributions during the six months ended June 30, 2020 reflect distributions only from Partnership X, whereas the distributions during the six months ended June 30, 2019 reflect distributions from the Opportunity Fund, Fund X and Partnership X.
Summarized Financial Information for our Funds
The tables below present selected financial information for the Funds. The amounts presented reflect
100
% (not our pro-rata share) of amounts related to the Funds, and are based upon historical acquired book value:
| (In thousands) | June 30, 2020 | December 31, 2019 | |||||||||
|
Total assets
(1)
|
$ |
|
$ |
|
|||||||
|
Total liabilities
(1)
|
$ |
|
$ |
|
|||||||
|
Total equity
(1)
|
$ |
|
$ |
|
|||||||
______________________________________________
(1) The balances reflect the financial position of Partnership X.
| Six Months Ended June 30, | |||||||||||
| (In thousands) | 2020 | 2019 | |||||||||
|
Total revenues
(1)
|
$ |
|
$ |
|
|||||||
|
Operating income
(1)
|
$ |
|
$ |
|
|||||||
|
Net income
(1)
|
$ |
|
$ |
|
|||||||
______________________________________________
(1) The results of operations are not directly comparable to the prior period; the balances for the six months ended June 30, 2020 reflect only the operations of Partnership X, whereas the balances for the six months ended June 30, 2019 reflect the combined operations of the Opportunity Fund, Fund X and Partnership X.
20
Douglas Emmett, Inc.
Notes to Consolidated Financial Statements (unaudited) (continued)
7.
Other Assets
| (In thousands) | June 30, 2020 | December 31, 2019 | |||||||||
| Restricted cash | $ |
|
$ |
|
|||||||
| Prepaid expenses |
|
|
|||||||||
| Other indefinite-lived intangibles |
|
|
|||||||||
| Furniture, fixtures and equipment, net |
|
|
|||||||||
| Other |
|
|
|||||||||
| Total other assets | $ |
|
$ |
|
|||||||
21
Douglas Emmett, Inc.
Notes to Consolidated Financial Statements (unaudited) (continued)
8.
Secured Notes Payable and Revolving Credit Facility, Net
| Description |
Maturity
Date
(1)
|
Principal Balance as of June 30, 2020 | Principal Balance as of December 31, 2019 | Variable Interest Rate |
Fixed Interest
Rate
(2)
|
Swap Maturity Date | ||||||||||||||||||||||||||||||||
| (In thousands) | ||||||||||||||||||||||||||||||||||||||
| Consolidated Wholly Owned Subsidiaries | ||||||||||||||||||||||||||||||||||||||
|
Term loan
(3)
|
|
$ |
|
$ |
|
LIBOR +
|
|
|
||||||||||||||||||||||||||||||
|
Term loan
(3)
|
|
|
|
LIBOR +
|
|
|
||||||||||||||||||||||||||||||||
|
Fannie Mae loan
(3)
|
|
|
|
LIBOR +
|
|
|
||||||||||||||||||||||||||||||||
|
Term loan
(3)
|
|
|
|
LIBOR +
|
|
|
||||||||||||||||||||||||||||||||
|
Term loan
(3)
|
|
|
|
LIBOR +
|
|
|
||||||||||||||||||||||||||||||||
|
Term loan
(3)(4)
|
|
|
|
LIBOR +
|
|
|
||||||||||||||||||||||||||||||||
|
Term loan
(3)(5)
|
|
|
|
LIBOR +
|
|
|
||||||||||||||||||||||||||||||||
|
Fannie Mae loan
(3)
|
|
|
|
LIBOR +
|
|
|
||||||||||||||||||||||||||||||||
|
Fannie Mae loan
(3)
|
|
|
|
LIBOR +
|
|
|
||||||||||||||||||||||||||||||||
|
Fannie Mae loan
(3)(6)
|
|
|
|
LIBOR +
|
|
|
||||||||||||||||||||||||||||||||
|
Term loan
(7)
|
|
|
|
N/A |
|
N/A | ||||||||||||||||||||||||||||||||
|
Revolving credit facility
(8)
|
|
|
|
LIBOR +
|
N/A | N/A | ||||||||||||||||||||||||||||||||
| Total Wholly Owned Subsidiary Debt |
|
|
||||||||||||||||||||||||||||||||||||
| Consolidated JVs | ||||||||||||||||||||||||||||||||||||||
|
Term loan
(9)
|
— | — |
|
— | — | — | ||||||||||||||||||||||||||||||||
|
Term loan
(3)
|
|
|
|
LIBOR +
|
|
|
||||||||||||||||||||||||||||||||
|
Term loan
(3)
|
|
|
|
LIBOR +
|
|
|
||||||||||||||||||||||||||||||||
|
Term loan
(3)(10)
|
|
|
|
LIBOR +
|
|
|
||||||||||||||||||||||||||||||||
|
Term loan
(3)
|
|
|
|
LIBOR +
|
|
|
||||||||||||||||||||||||||||||||
|
Total Consolidated Debt
(11)
|
|
|
||||||||||||||||||||||||||||||||||||
| Unamortized loan premium, net |
|
|
||||||||||||||||||||||||||||||||||||
| Unamortized deferred loan costs, net |
(
|
(
|
||||||||||||||||||||||||||||||||||||
| Total Consolidated Debt, net | $ |
|
$ |
|
||||||||||||||||||||||||||||||||||
_______________________________________________________________________
Except as noted below, our loans and revolving credit facility: (i) are non-recourse, (ii) are secured by separate collateral pools consisting of
one
or more properties, (iii) require interest-only monthly payments with the outstanding principal due upon maturity, and (iv) contain certain financial covenants which could require us to deposit excess cash flow with the lender under certain circumstances unless we (at our option) either provide a guarantee or additional collateral or pay down the loan within certain parameters set forth in the loan documents. Certain loans with maturity date extensions require us to meet minimum financial thresholds in order to exercise those extensions.
(1)
Maturity dates include the effect of extension options.
(2)
Effective rate as of June 30, 2020. Includes the effect of interest rate swaps and excludes the effect of prepaid loan fees. See Note 10 for details of our interest rate swaps. See below for details of our loan costs.
(3)
The loan agreement includes a
zero
-percent LIBOR floor. The corresponding swaps do not include such a floor.
(4)
Effective rate will decrease to
2.36
% on July 1, 2020.
(5)
Effective rate will increase to
2.31
% on July 1, 2021.
(6)
Effective rate will increase to
3.25
% on December 1, 2020.
(7)
Requires monthly payments of principal and interest. Principal amortization is based upon a
30
-year amortization schedule.
(8)
$
400
million revolving credit facility. Unused commitment fees range from
0.10
% to
0.15
%. The loan agreement includes a
zero
-percent LIBOR floor.
(9)
We paid this loan off during the second quarter.
(10)
We closed this loan during the second quarter. The effective rate will decrease to
2.26
% on July 1, 2022
(11)
The table does not include our unconsolidated Fund's loan - see Note 16. See Note 13 for our fair value disclosures.
22
Douglas Emmett, Inc.
Notes to Consolidated Financial Statements (unaudited) (continued)
Debt Statistics
The table below summarizes our consolidated fixed and floating rate debt:
| (In thousands) | Principal Balance as of June 30, 2020 | Principal Balance as of December 31, 2019 | ||||||||||||
| Aggregate swapped to fixed rate loans | $ |
|
$ |
|
||||||||||
| Aggregate fixed rate loans |
|
|
||||||||||||
| Total Debt | $ |
|
$ |
|
||||||||||
The table below summarizes certain consolidated debt statistics as of June 30, 2020:
| Statistics for consolidated loans with interest fixed under the terms of the loan or a swap | ||||||||
| Principal balance (in billions) |
$
|
|||||||
| Weighted average remaining life (including extension options) |
|
|||||||
| Weighted average remaining fixed interest period |
|
|||||||
| Weighted average annual interest rate |
|
|||||||
Future Principal Payments
At June 30, 2020, the minimum future principal payments due on our consolidated secured notes payable and revolving credit facility were as follows:
| Twelve months ending June 30: |
Including Maturity Extension Options
(1)
|
|||||||
| (In thousands) | ||||||||
| 2021 | $ |
|
||||||
| 2022 |
|
|||||||
| 2023 |
|
|||||||
| 2024 |
|
|||||||
| 2025 |
|
|||||||
| Thereafter |
|
|||||||
| Total future principal payments | $ |
|
||||||
____________________________________________
(1) Some of our loan agreements require that we meet certain minimum financial thresholds to be able to extend the loan maturity.
23
Douglas Emmett, Inc.
Notes to Consolidated Financial Statements (unaudited) (continued)
Loan Premium and Loan Costs
Loan premium is net of accumulated amortization of $
0.9
million and $
0.5
million at June 30, 2020 and December 31, 2019, respectively. Deferred loan costs are net of accumulated amortization of $
34.4
million and $
30.7
million at June 30, 2020 and December 31, 2019, respectively.
The table below presents loan premium and loan costs, which are included in Interest expense in our consolidated statements of operations:
| Three Months Ended June 30, | Six Months Ended June 30, | ||||||||||||||||||||||
| (In thousands) | 2020 | 2019 | 2020 | 2019 | |||||||||||||||||||
| Loan premium amortized and written off | $ |
(
|
$ |
(
|
$ |
(
|
$ |
(
|
|||||||||||||||
| Deferred loan costs amortized and written off |
|
|
|
|
|||||||||||||||||||
| Loan costs expensed |
|
|
|
|
|||||||||||||||||||
| Total | $ |
|
$ |
|
$ |
|
$ |
|
|||||||||||||||
9.
Interest Payable, Accounts Payable and Deferred Revenue
| (In thousands) | June 30, 2020 | December 31, 2019 | |||||||||
| Interest payable | $ |
|
$ |
|
|||||||
| Accounts payable and accrued liabilities |
|
|
|||||||||
| Deferred revenue |
|
|
|||||||||
| Total interest payable, accounts payable and deferred revenue | $ |
|
$ |
|
|||||||
10.
Derivative Contracts
We make use of interest rate swap contracts to manage the risk associated with changes in interest rates on our floating-rate debt. When we enter into a floating-rate term loan, we generally enter into an interest rate swap agreement for the equivalent principal amount, for a period covering the majority of the loan term, which effectively converts our floating-rate debt to a fixed-rate basis during that time. We do not speculate in derivatives and we do not make use of any other derivative instruments. See Note 8 regarding our debt and our consolidated JVs' debt that is hedged. See Note 16 regarding our unconsolidated Fund's debt that is hedged.
Derivative Summary
As of June 30, 2020, our interest rate swaps, which include the interest rate swaps of our consolidated JVs and our unconsolidated Fund, were designated as cash flow hedges:
| Number of Interest Rate Swaps |
Notional
(In thousands) |
||||||||||
|
Consolidated derivatives
(1)(2)(4)(5)
|
|
$ |
|
||||||||
|
Unconsolidated Fund's derivatives
(3)(4)(5)
|
|
$ |
|
||||||||
___________________________________________________
(1)
The notional amount reflects
100
%, not our pro-rata share, of our consolidated JVs' derivatives.
(2)
The notional amount includes: (a) swaps with a total initial notional amount of $
120.0
million, that will increase to $
1.18
billion in the future to replace existing swaps as they expire, and (b) forward swaps (swaps effective after June 30, 2020) with a total initial notional of $
845.0
million, that will increase to $
1.03
billion in the future to replace existing swaps as they expire.
(3)
The notional amount reflects
100
%, not our pro-rata share, of our unconsolidated Fund's derivatives.
(4)
Our derivative contracts do not provide for right of offset between derivative contracts.
(5)
See Note 13 for our derivative fair value disclosures.
24
Douglas Emmett, Inc.
Notes to Consolidated Financial Statements (unaudited) (continued)
Credit-risk-related Contingent Features
Our swaps include credit-risk related contingent features. For example, we have agreements with certain of our interest rate swap counterparties that contain a provision under which we could be declared in default on our derivative obligations if repayment of the underlying indebtedness that we are hedging is accelerated by the lender due to our default on the indebtedness. As of June 30, 2020, there have been no events of default with respect to our interest rate swaps, our consolidated JVs' or our unconsolidated Fund's interest rate swaps. We do not post collateral for our interest rate swap contract liabilities.
The fair value of our interest rate swap contract liabilities, including accrued interest and excluding credit risk adjustments, was as follows:
| (In thousands) | June 30, 2020 | December 31, 2019 | |||||||||
|
Consolidated derivatives
(1)
|
$ |
|
$ |
|
|||||||
|
Unconsolidated Fund's derivatives
(2)
|
$ |
|
$ |
|
|||||||
___________________________________________________
(1)
The amounts reflect
100
%, not our pro-rata share, of our consolidated JVs' derivatives.
(2)
The amounts reflect
100
%, not our pro-rata share, of our unconsolidated Fund's derivatives.
Counterparty Credit Risk
We are subject to credit risk from the counterparties on our interest rate swap contract assets because we do not receive collateral. We seek to minimize that risk by entering into agreements with a variety of counterparties with investment grade ratings.
The fair value of our interest rate swap contract assets, including accrued interest and excluding credit risk adjustments, was as follows:
| (In thousands) | June 30, 2020 | December 31, 2019 | |||||||||
|
Consolidated derivatives
(1)
|
$ |
|
$ |
|
|||||||
|
Unconsolidated Fund's derivatives
(2)
|
$ |
|
$ |
|
|||||||
___________________________________________________
(1)
The amounts reflect
100
%, not our pro-rata share, of our consolidated JVs' derivatives.
(2)
The amounts reflect
100
%, not our pro-rata share, of our unconsolidated Fund's derivatives.
Impact of Hedges on AOCI and the Consolidated Statements of Operations
The table below presents the effect of our derivatives on our AOCI and the consolidated statements of operations:
| (In thousands) | Six Months Ended June 30, | ||||||||||
| 2020 | 2019 | ||||||||||
| Derivatives Designated as Cash Flow Hedges: | |||||||||||
| Consolidated derivatives: | |||||||||||
|
Loss recorded in AOCI before reclassifications
(1)
|
$ |
(
|
$ |
(
|
|||||||
|
Loss (gain) reclassified from AOCI to Interest Expense
(1)
|
$ |
|
$ |
(
|
|||||||
| Interest Expense presented in the consolidated statements of operations | $ |
(
|
$ |
(
|
|||||||
|
Unconsolidated Funds' derivatives (our share)
(2)
:
|
|||||||||||
|
Loss recorded in AOCI before reclassifications
(1)
|
$ |
(
|
$ |
(
|
|||||||
|
Gain reclassified from AOCI to Income from unconsolidated Funds
(1)
|
$ |
(
|
$ |
(
|
|||||||
| Income from unconsolidated Funds presented in the consolidated statements of operations | $ |
|
$ |
|
|||||||
___________________________________________________
(1)
See Note 11 for our AOCI reconciliation.
(2)
We calculate our share by multiplying the total amount for each Fund by our equity interest in the respective Fund.
25
Douglas Emmett, Inc.
Notes to Consolidated Financial Statements (unaudited) (continued)
Future Reclassifications from AOCI
At June 30, 2020, our estimate of the AOCI related to derivatives designated as cash flow hedges that will be reclassified to earnings during the next twelve months as interest rate swap payments are made is as follows:
| (In thousands) | |||||
| Consolidated derivatives: | |||||
| Losses to be reclassified from AOCI to Interest Expense | $ |
(
|
|||
|
Unconsolidated Fund's derivative (our share)
(1)
:
|
|||||
| Losses to be reclassified from AOCI to Income (loss) from unconsolidated Funds | $ |
(
|
|||
_________________________________________
11.
Equity
Transactions
Six Months Ended June 30, 2020
During the six months ended June 30, 2020, (i) we acquired
5
thousand OP Units in exchange for issuing an equal number of shares of our common stock to the holders of the OP Units, and (ii) we acquired
150
OP Units for $
7
thousand in cash.
Six Months Ended June 30, 2019
During the six months ended June 30, 2019, (i) we acquired
75
thousand OP Units in exchange for issuing an equal number of shares of our common stock to the holders of the OP Units, and (ii) we acquired
13
thousand OP Units for $
507
thousand in cash, and (iii) we issued
4.9
million shares of our common stock under our ATM program for net proceeds of $
201.2
million.
We also purchased a property on June 7, 2019 for a contract price of $
365.1
million, which we subsequently contributed to one of our consolidated JVs on June 28, 2019. We manage and own a
twenty
percent capital interest in the JV. To partially fund the acquisition of the property, we closed a secured, non-recourse $
160.0
million interest-only loan scheduled to mature in June 2029, and the loan was assumed by the consolidated JV to which we contributed the property. Noncontrolling interests in the JV contributed $
176.0
million to the JV for the acquisition of the property. See Note 3 for more information regarding the property acquisition and Note 8 for more information regarding the loan.
Noncontrolling Interests
Our noncontrolling interests consist of interests in our Operating Partnership and consolidated JVs which are not owned by us. Noncontrolling interests in our Operating Partnership owned
29.1
million OP Units and fully-vested LTIP Units, and represented approximately
14
% of our Operating Partnership's total outstanding interests as of June 30, 2020 when we owned
175.4
millions OP Units (to match our
175.4
million shares of outstanding common stock).
A share of our common stock, an OP Unit and an LTIP Unit (once vested and booked up) have essentially the same economic characteristics, sharing equally in the distributions from our Operating Partnership. Investors who own OP Units have the right to cause our Operating Partnership to acquire their OP Units for an amount of cash per unit equal to the market value of one share of our common stock at the date of acquisition, or, at our election, exchange their OP Units for shares of our common stock on a
one
-for-one b
asis. LTIP Units have been granted to our employees and non-employee directors as part of their compensation. These awards generally vest over a service period and once vested can generally be converted to OP Units provided our stock price increases by more than a specified hurdle.
26
Douglas Emmett, Inc.
Notes to Consolidated Financial Statements (unaudited) (continued)
Changes in our Ownership Interest in our Operating Partnership
The table below presents the effect on our equity from net income attributable to common stockholders and changes in our ownership interest in our Operating Partnership:
| Six Months Ended June 30, | |||||||||||
| (In thousands) | 2020 | 2019 | |||||||||
| Net income attributable to common stockholders | $ |
|
$ |
|
|||||||
| Transfers from noncontrolling interests: | |||||||||||
| Exchange of OP Units with noncontrolling interests |
|
|
|||||||||
| Repurchase of OP Units from noncontrolling interests |
(
|
(
|
|||||||||
| Net transfers from noncontrolling interests |
|
|
|||||||||
| Change from net income attributable to common stockholders and transfers from noncontrolling interests | $ |
|
$ |
|
|||||||
AOCI Reconciliation
(1)
The table below presents a reconciliation of our AOCI, which consists solely of adjustments related to derivatives designated as cash flow hedges:
| Six Months Ended June 30, | |||||||||||
| (In thousands) | 2020 | 2019 | |||||||||
| Beginning balance | $ |
(
|
$ |
|
|||||||
| Consolidated derivatives: | |||||||||||
| Other comprehensive loss before reclassifications |
(
|
(
|
|||||||||
| Reclassification of loss (gain) from AOCI to Interest Expense |
|
(
|
|||||||||
|
Unconsolidated Funds' derivatives (our share)
(2)
:
|
|||||||||||
| Other comprehensive loss before reclassifications |
(
|
(
|
|||||||||
| Reclassification of gain from AOCI to Income (loss) from unconsolidated Funds |
(
|
(
|
|||||||||
| Net current period OCI |
(
|
(
|
|||||||||
| OCI attributable to noncontrolling interests |
|
|
|||||||||
| OCI attributable to common stockholders |
(
|
(
|
|||||||||
| Ending balance | $ |
(
|
$ |
(
|
|||||||
___________________________________________________
(1)
See Note 10 for the details of our derivatives and Note 13 for our derivative fair value disclosures.
(2)
We calculate our share by multiplying the total amount for each Fund by our equity interest in the respective Fund.
27
Douglas Emmett, Inc.
Notes to Consolidated Financial Statements (unaudited) (continued)
Equity Compensation
On June 2, 2016, the Douglas Emmett 2016 Omnibus Stock Incentive Plan, as amended (the "2016 Plan"), became effective after receiving stockholder approval, superseding our prior plan, the Douglas Emmett 2006 Omnibus Stock Incentive Plan (the "2006 Plan"), both of which allow for awards to our directors, officers, employees and consultants. The key terms of the two plans are substantially identical, except for the date of expiration, the number of shares authorized for grants and various technical provisions. Grants after June 2, 2016 were awarded under the 2016 Plan, while grants prior to that date were awarded under the 2006 Plan (grants under the 2006 Plan remain outstanding according to their terms). Both plans are administered by the compensation committee of our board of directors. On May 28, 2020, our stockholders approved an amendment to the 2016 Plan to, among other things, increase the number of common shares for future awards by
9.5
million.
The table below presents our stock-based compensation expense:
| Three Months Ended June 30, | Six Months Ended June 30, | ||||||||||||||||||||||
| (In thousands) | 2020 | 2019 | 2020 | 2019 | |||||||||||||||||||
| Stock-based compensation expense, net | $ |
|
$ |
|
$ |
|
$ |
|
|||||||||||||||
| Capitalized stock-based compensation | $ |
|
$ |
|
$ |
|
$ |
|
|||||||||||||||
28
Douglas Emmett, Inc.
Notes to Consolidated Financial Statements (unaudited) (continued)
12.
EPS
We calculate basic EPS by dividing the net income attributable to common stockholders for the period by the weighted average number of common shares outstanding during the period. We calculate diluted EPS by dividing the net income attributable to common stockholders for the period by the weighted average number of common shares and dilutive instruments outstanding during the period using the treasury stock method. We account for unvested LTIP awards that contain non-forfeitable rights to dividends as participating securities and include these securities in the computation of basic and diluted EPS using the two-class method.
The table below presents the calculation of basic and diluted EPS:
| Three Months Ended June 30, | Six Months Ended June 30, | ||||||||||||||||||||||
| 2020 | 2019 | 2020 | 2019 | ||||||||||||||||||||
| Numerator (In thousands): | |||||||||||||||||||||||
| Net income attributable to common stockholders | $ |
|
$ |
|
$ |
|
$ |
|
|||||||||||||||
| Allocation to participating securities: Unvested LTIP Units |
(
|
(
|
(
|
(
|
|||||||||||||||||||
| Net income attributable to common stockholders - basic and diluted | $ |
|
$ |
|
$ |
|
$ |
|
|||||||||||||||
| Denominator (In thousands): | |||||||||||||||||||||||
|
Weighted average shares of common stock outstanding - basic and diluted
(2)
|
|
|
|
|
|||||||||||||||||||
| Net income per common share - basic and diluted | $ |
|
$ |
|
$ |
|
$ |
|
|||||||||||||||
____________________________________________________
(1) Outstanding OP Units and vested LTIP Units are not included in the denominator in calculating diluted EPS, even though they may be exchanged under certain conditions for common stock on a
one
-for-one basis, because their associated net income (equal on a per unit basis to the Net income per common share - diluted) was already deducted in calculating Net income attributable to common stockholders. Accordingly, any exchange would not have any effect on diluted EPS. The table below presents the OP Units and vested LTIP Units outstanding for the respective periods:
| Three Months Ended June 30, | Six Months Ended June 30, | ||||||||||||||||||||||
| (In thousands) | 2020 | 2019 | 2020 | 2019 | |||||||||||||||||||
| OP Units |
|
|
|
|
|||||||||||||||||||
| Vested LTIP Units |
|
|
|
|
|||||||||||||||||||
29
Douglas Emmett, Inc.
Notes to Consolidated Financial Statements (unaudited) (continued)
13.
Fair Value of Financial Instruments
Our estimates of the fair value of financial instruments were determined using available market information and widely used valuation methods. Considerable judgment is necessary to interpret market data and determine an estimated fair value. The use of different market assumptions or valuation methods may have a material effect on the estimated fair values. The FASB fair value framework hierarchy distinguishes between assumptions based on market data obtained from sources independent of the reporting entity, and the reporting entity’s own assumptions about market-based inputs. The hierarchy is as follows:
Level 1 - inputs utilize unadjusted quoted prices in active markets for identical assets or liabilities.
Level 2 - inputs are observable either directly or indirectly for similar assets and liabilities in active markets.
As of June 30, 2020, we did not have any fair value estimates of financial instruments using Level 3 inputs.
Financial instruments disclosed at fair value
Short term financial instruments:
The carrying amounts for cash and cash equivalents, tenant receivables, revolving credit line, interest payable, accounts payable, security deposits and dividends payable approximate fair value because of the short-term nature of these instruments.
Secured notes payable:
See Note 8 for the details of our secured notes payable. We estimate the fair value of our consolidated secured notes payable by calculating the credit-adjusted present value of the principal and interest payments for each secured note payable. The calculation incorporates observable market interest rates which we consider to be Level 2 inputs, assumes that the loans will be outstanding through maturity, and includes any maturity extension options.
The table below presents the estimated fair value and carrying value of our secured notes payable (excluding our revolving credit facility), the carrying value includes unamortized loan premium and excludes unamortized deferred loan fees:
| (In thousands) | June 30, 2020 | December 31, 2019 | |||||||||
| Fair value | $ |
|
$ |
|
|||||||
| Carrying value | $ |
|
$ |
|
|||||||
Ground lease liability:
See Note 4 for the details of our ground lease. We estimate the fair value of our ground lease liability by calculating the present value of the future lease payments disclosed in Note 4 using our incremental borrowing rate. The calculation incorporates observable market interest rates which we consider to be Level 2 inputs.
The table below presents the estimated fair value and carrying value of our ground lease liability:
| (In thousands) | June 30, 2020 | December 31, 2019 | |||||||||
| Fair value | $ |
|
$ |
|
|||||||
| Carrying value | $ |
|
$ |
|
|||||||
30
Douglas Emmett, Inc.
Notes to Consolidated Financial Statements (unaudited) (continued)
Financial instruments measured at fair value
Derivative instruments:
See Note 10 for the details of our derivatives. We present our derivatives in our consolidated balance sheets at fair value, on a gross basis, excluding accrued interest. We estimate the fair value of our derivative instruments by calculating the credit-adjusted present value of the expected future cash flows of each derivative. The calculation incorporates the contractual terms of the derivatives, observable market interest rates which we consider to be Level 2 inputs, and credit risk adjustments to reflect the counterparty's as well as our own non-performance risk. Our derivatives are not subject to master netting arrangements.
The table below presents the estimated fair value of our derivatives:
| (In thousands) | June 30, 2020 | December 31, 2019 | |||||||||
| Derivative Assets: | |||||||||||
|
Fair value - consolidated derivatives
(1)
|
$ |
|
$ |
|
|||||||
|
Fair value - unconsolidated Fund's derivatives
(2)
|
$ |
|
$ |
|
|||||||
| Derivative Liabilities: | |||||||||||
|
Fair value - consolidated derivatives
(1)
|
$ |
|
$ |
|
|||||||
|
Fair value - unconsolidated Fund's derivatives
(2)
|
$ |
|
$ |
|
|||||||
____________________________________________________
(1) Consolidated derivatives, which include
100
%, not our pro-rata share, of our consolidated JVs' derivatives, are included in interest rate contracts in our consolidated balance sheets. The fair values exclude accrued interest which is included in interest payable in the consolidated balance sheets.
(2) The amounts reflect
100
%, not our pro-rata share, of our unconsolidated Fund's derivatives. Our pro-rata share of the amounts related to the unconsolidated Fund's derivatives is included in our Investment in unconsolidated Funds in our consolidated balance sheets. See "Guarantees" in Note 16 regarding our unconsolidated Fund's debt and derivatives.
31
Douglas Emmett, Inc.
Notes to Consolidated Financial Statements (unaudited) (continued)
14.
Segment Reporting
Segment information is prepared on the same basis that our management reviews information for operational decision-making purposes. We operate in
two
business segments: (i) the acquisition, development, ownership and management of office real estate and (ii) the acquisition, development, ownership and management of multifamily real estate. The services for our office segment primarily include rental of office space and other tenant services, including parking and storage space rental. The services for our multifamily segment include rental of apartments and other tenant services, including parking and storage space rental. Asset information by segment is not reported because we do not use this measure to assess performance or make decisions to allocate resources. Therefore, depreciation and amortization expense is not allocated among segments. General and administrative expenses and interest expense are not included in segment profit as our internal reporting addresses these items on a corporate level.
The table below presents the operating activity of our reportable segments:
| (In thousands) | Three Months Ended June 30, | Six Months Ended June 30, | |||||||||||||||||||||
| 2020 | 2019 | 2020 | 2019 | ||||||||||||||||||||
| Office Segment | |||||||||||||||||||||||
| Total office revenues | $ |
|
$ |
|
$ |
|
$ |
|
|||||||||||||||
| Office expenses |
(
|
(
|
(
|
(
|
|||||||||||||||||||
| Office segment profit |
|
|
|
|
|||||||||||||||||||
| Multifamily Segment | |||||||||||||||||||||||
| Total multifamily revenues |
|
|
|
|
|||||||||||||||||||
| Multifamily expenses |
(
|
(
|
(
|
(
|
|||||||||||||||||||
| Multifamily segment profit |
|
|
|
|
|||||||||||||||||||
| Total profit from all segments | $ |
|
$ |
|
$ |
|
$ |
|
|||||||||||||||
The table below presents a reconciliation of the total profit from all segments to net income attributable to common stockholders:
| (In thousands) | Three Months Ended June 30, | Six Months Ended June 30, | |||||||||||||||||||||
| 2020 | 2019 | 2020 | 2019 | ||||||||||||||||||||
| Total profit from all segments | $ |
|
$ |
|
$ |
|
$ |
|
|||||||||||||||
| General and administrative expenses |
(
|
(
|
(
|
(
|
|||||||||||||||||||
| Depreciation and amortization |
(
|
(
|
(
|
(
|
|||||||||||||||||||
| Other income |
|
|
|
|
|||||||||||||||||||
| Other expenses |
(
|
(
|
(
|
(
|
|||||||||||||||||||
| Income from unconsolidated Funds |
(
|
|
|
|
|||||||||||||||||||
| Interest expense |
(
|
(
|
(
|
(
|
|||||||||||||||||||
| Net (loss) income |
(
|
|
|
|
|||||||||||||||||||
| Less: Net loss (income) attributable to noncontrolling interests |
|
(
|
|
(
|
|||||||||||||||||||
| Net income attributable to common stockholders | $ |
|
$ |
|
$ |
|
$ |
|
|||||||||||||||
32
Douglas Emmett, Inc.
Notes to Consolidated Financial Statements (unaudited) (continued)
15.
Future Minimum Lease Rental Receipts
We lease space to tenants primarily under non-cancelable operating leases that generally contain provisions for a base rent plus reimbursement of certain operating expenses, and we own fee interests in
two
parcels of land from which we receive rent under ground leases.
The table below presents the future minimum base rentals on our non-cancelable office tenant and ground leases at June 30, 2020:
| Twelve months ending June 30: | (In thousands) | ||||
| 2021 | $ |
|
|||
| 2022 |
|
||||
| 2023 |
|
||||
| 2024 |
|
||||
| 2025 |
|
||||
| Thereafter |
|
||||
|
Total future minimum base rentals
(1)
|
$ |
|
|||
___________________________________
(1) Does not include (i) residential leases, which typically have a term of one year or less, (ii) holdover rent, (iii) other types of rent such as storage and antenna rent, (iv) tenant reimbursements, (v) straight- line rent, (vi) amortization/accretion of acquired above/below-market lease intangibles and (vii) percentage rents. The amounts assume that early termination options held by tenants are not exercised.
16.
Commitments, Contingencies and Guarantees
Legal Proceedings
From time to time, we are party to various lawsuits, claims and other legal proceedings that arise in the ordinary course of our business. Excluding ordinary, routine litigation incidental to our business, we are not currently a party to any legal proceedings that we believe would reasonably be expected to have a materially adverse effect on our business, financial condition or results of operations.
Concentration of Risk
We are subject to credit risk with respect to our tenant receivables and deferred rent receivables related to our tenant leases. Our tenants' ability to honor the terms of their respective leases remains dependent upon economic, regulatory and social factors. We seek to minimize our credit risk from our tenant leases by (i) targeting smaller, more affluent tenants, from a diverse mix of industries, (ii) performing credit evaluations of prospective tenants and (iii) obtaining security deposits or letters of credit from our tenants. For the six months ended June 30, 2020 and 2019, no tenant accounted for more than 10% of our total revenues.
All of our properties, including the properties of our consolidated JVs and unconsolidated Fund, are located in Los Angeles County, California and Honolulu, Hawaii, and we are therefore susceptible to adverse economic and regulatory developments, as well as natural disasters, in those markets.
We are subject to credit risk with respect to our interest rate swap counterparties that we use to manage the risk associated with our floating rate debt. We do not post or receive collateral with respect to our swap transactions. Our swap contracts do not provide for right of offset between derivative contracts. See Note 10 for the details of our interest rate contracts. We seek to minimize our credit risk by entering into agreements with a variety of counterparties with investment grade ratings.
33
Douglas Emmett, Inc.
Notes to Consolidated Financial Statements (unaudited) (continued)
We have significant cash balances invested in a variety of short-term money market funds that are intended to preserve principal value and maintain a high degree of liquidity while providing current income. These investments are not insured against loss of principal and there is no guarantee that our investments in these funds will be redeemable at par value. We also have significant cash balances in bank accounts with high quality financial institutions with investment grade ratings. Interest bearing bank accounts at each U.S. banking institution are insured by the FDIC up to $250 thousand.
Asset Retirement Obligations
Conditional asset retirement obligations represent a legal obligation to perform an asset retirement activity in which the timing and/or method of settlement is conditional on a future event that may or may not be within our control. A liability for a conditional asset retirement obligation must be recorded if the fair value of the obligation can be reasonably estimated. Environmental site assessments have identified
thirty-two
buildings in our Consolidated Portfolio which contain asbestos, and would have to be removed in compliance with applicable environmental regulations if these properties are demolished or undergo major renovations.
As of June 30, 2020, the obligations to remove the asbestos from properties which are currently undergoing major renovations, or that we plan to renovate in the future, are not material to our consolidated financial statements. As of June 30, 2020, the obligations to remove the asbestos from our other properties have indeterminable settlement dates, and we are unable to reasonably estimate the fair value of the associated conditional asset retirement obligations.
Development and Other Contracts
In West Los Angeles, we are building a high-rise apartment building with
376
apartments. In downtown Honolulu, we are converting a 25 story,
490,000
square foot office tower into approximately
500
apartments in phases over a number of years as the office space is vacated.
As of June 30, 2020, we had an aggregate remaining contractual commitment for these and other development projects of approximately $
201.8
million. As of June 30, 2020, we had an aggregate remaining contractual commitment for repositionings, capital expenditure projects and tenant improvements of approximately $
11.4
million.
Guarantees
We have made certain environmental and other limited indemnities and guarantees covering customary non-recourse carve- outs for our unconsolidated Fund's debt. We have also guaranteed the related swap. Our Fund has agreed to indemnify us for any amounts that we would be required to pay under these agreements. As of June 30, 2020, all of the obligations under the related debt and swap agreements have been performed in accordance with the terms of those agreements.
The table below summarizes our Fund's debt as of June 30, 2020. The amounts reflect 100%, not our pro-rata share, of the amounts related to our Fund:
|
Fund
(1)
|
Loan Maturity Date |
Principal Balance
(In Millions) |
Variable Interest Rate | Swap Fixed Interest Rate | Swap Maturity Date | |||||||||||||||||||||||||||
|
Partnership X
(2)(3)
|
|
$ |
|
LIBOR +
|
|
|
||||||||||||||||||||||||||
___________________________________________________
(1)
See Note 6 for more information regarding our unconsolidated Fund.
(2)
Floating rate term loan, swapped to fixed, which is secured by
two
properties and requires monthly payments of interest only, with the outstanding principal due upon maturity. As of June 30, 2020, assuming a
zero
-percent LIBOR interest rate during the remaining life of the swap, the maximum future payments under the swap agreement were $
0.7
million.
(3)
Loan agreement includes a
zero
-percent LIBOR floor. The corresponding swap does not include such a floor.
34
Item 2. Management’s Discussion and Analysis of Financial Condition and Results of Operations
The following discussion should be read in conjunction with our Forward Looking Statements disclaimer, and our consolidated financial statements and related notes in Part I, Item 1 of this Report. Our results of operations were affected by transactions during the respective period - see Financings, Developments and Repositionings further below.
Business Description
Douglas Emmett, Inc. is a fully integrated, self-administered and self-managed REIT. Through our interest in our Operating Partnership and its subsidiaries, our consolidated JVs and our unconsolidated Fund, we are one of the largest owners and operators of high-quality office and multifamily properties in Los Angeles County, California and in Honolulu, Hawaii. We focus on owning, acquiring, developing and managing a substantial share of top-tier office properties and premier multifamily communities in neighborhoods that possess significant supply constraints, high-end executive housing and key lifestyle amenities. As of June 30, 2020, our portfolio consisted of the following (including ancillary retail space):
|
Consolidated Portfolio
(1)
|
Total Portfolio
(2)
|
||||||||||||||||
| Office | |||||||||||||||||
| Class A Properties | 70 | 72 | |||||||||||||||
|
Rentable Square Feet (in thousands)
(3)
|
17,939 | 18,324 | |||||||||||||||
| Leased rate | 91.0% | 90.9% | |||||||||||||||
| Occupancy rate | 89.3% | 89.3% | |||||||||||||||
| Multifamily | |||||||||||||||||
| Properties | 12 | 12 | |||||||||||||||
| Units | 4,209 | 4,209 | |||||||||||||||
| Leased rate | 98.7% | 98.7% | |||||||||||||||
| Occupied rate | 92.1% | 92.1% | |||||||||||||||
______________________________________________________________________
(1) Our Consolidated Portfolio includes the properties in our consolidated results. Through our subsidiaries, we own 100% of these properties, except for seventeen office properties totaling 4.3 million square feet and one residential property with 350 apartments, which we own through four consolidated JVs. Our Consolidated Portfolio also includes two land parcels from which we receive ground rent from ground leases to the owners of a Class A office building and a hotel.
(2) Our Total Portfolio includes our Consolidated Portfolio as well as two properties totaling 0.4 million square feet owned by our unconsolidated Fund. See Note 6 to our consolidated financial statements in Item 1 of this Report for more information about our unconsolidated Fund.
(3) As of June 30, 2020, we removed approximately 226,000 Rentable Square Feet of vacant space at an office building that we are converting to residential apartments.
Revenues by Segment and Location
During the six months ended June 30, 2020, revenues from our Consolidated Portfolio were derived as follows:
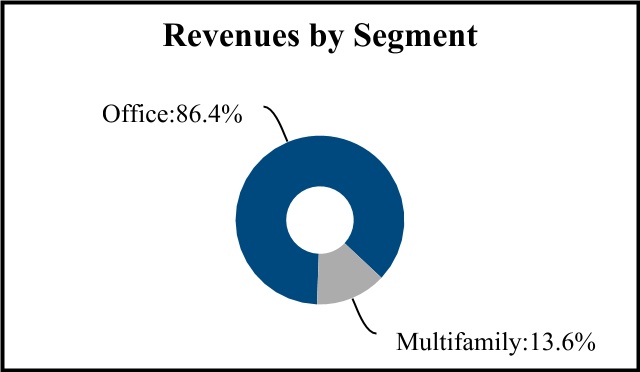 ____
____
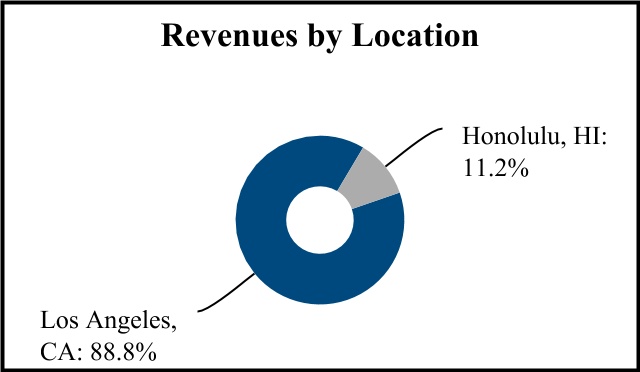
35
Impacts of the COVID-19 Pandemic on our Business
Our buildings have remained open and available to our tenants throughout the pandemic. Our rent collections continue to be negatively impacted by the pandemic and our markets' very tenant-oriented lease enforcement moratoriums, which are considerably out of sync with other gateway markets. The cities where we primarily operate, Los Angeles, Beverly Hills and Santa Monica, have passed unusually punitive ordinances prohibiting evictions and allowing rent deferral for residential, retail, and office tenants, regardless of financial distress. The ordinances cover our residential, retail and office tenants (with some carveouts for large tenants) and generally prohibit landlords not only from evicting tenants but also from imposing any late fees or interest and allow tenants to pay back the deferred rent over a certain period.
At the end of the second quarter, we wrote off certain tenant receivables and deferred rent receivables. For the three and six months ended June 30, 2020, charges for uncollectible amounts related to tenant receivables and deferred rent receivables, which were primarily due to the COVID-19 pandemic, reduced our rental revenues and tenant recoveries by $
29.8
million and $
35.0
million, respectively. If we subsequently collect amounts that were previously written off, then the amounts collected will be recorded as an increase to our rental revenues and tenant recoveries. See "Revenue Recognition" in Note 2 to our consolidated financial statements in Item 1 of this Report. We don’t know how the COVID-19 pandemic will impact future collections.
Our tenant retention was in-line with our pre-COVID expectations. Although the decline in our office occupancy during the quarter was expected, leasing volume would have to improve significantly to recover that occupancy this year. During this time, we had savings from variable expenses which partly offset the write-offs and the decrease in our parking revenues.
Other considerations that could impact our future leasing, rent collections, and revenue include:
•
How long the pandemic continues.
•
Whether the local governments that have authorized rent deferrals in our markets modify or extend the deferral terms, or alternatively allow them to expire as written.
•
Whether more tenants stop paying rent if the impact to their business grows.
•
How attendance in our buildings changes and drives parking revenue or rent collection.
•
How leasing activity and occupancy will evolve.
On the capital front, construction is continuing on our two large multifamily development projects, although the projects may take a little longer under current conditions. We have temporarily suspended work on new office repositioning projects.
Overall, we expect the COVID-19 pandemic to continue to adversely impact many parts of our business, and those impacts have been, and will continue, to be material. For more information of the risks to our business, please see Item 1A "Risk Factors" below and in our quarterly report on Form 10-Q for the quarter ended March 31, 2020, that we filed with the SEC on May 8, 2020.
36
Financings, Developments and Repositionings
Financings
During the first quarter of 2020:
◦
We entered into forward interest rate swaps to hedge future term-loan refinancings. The forward swaps have an initial notional amount of $495.0 million, with effective dates ranging from June 2020 to March 2021, and maturity dates ranging from April 2025 to June 2025, fixing the one-month LIBOR interest rate in a range of 0.74% to 0.91%.
During the second quarter of 2020:
◦
On May 15, 2020, we refinanced a loan for one of our consolidated JVs. We closed a secured, non-recourse $450.0 million interest-only loan, which is scheduled to mature in May 2027. The loan bears interest at LIBOR + 1.35%, which was effectively fixed at 2.26% following the expiration of the current swaps, for an average fixed interest rate of 2.6% per annum through April 2025. We used part of the proceeds to pay off a $400.0 million loan, secured by the same properties, that was scheduled to mature in July 2024.
See Notes 8 and 10 to our consolidated financial statements in Item 1 of this Report for more information regarding our debt and derivatives, respectively.
Developments
•
Residential High-Rise Tower, Brentwood, California
In West Los Angeles, we are building a 34 story high-rise apartment building with 376 apartments. The tower is being built on a site that is directly adjacent to an existing office building and a 712 unit residential property, both of which we own. We expect the cost of the development to be approximately $180 million to $200 million, which does not include the cost of the land which we have owned since 1997. As part of the project, we are investing additional capital to build a one acre park on Wilshire Boulevard that will be available to the public and provide a valuable amenity to our surrounding properties and community. Construction continues on the project, although we may face some delays as a result of the impact of the COVID-19 pandemic on permitting and other logistics. We currently expect the first units to be delivered in 2022.
•
1132 Bishop Street, Honolulu, Hawaii
In downtown Honolulu, we are converting a 25 story, 490 thousand square foot office tower into approximately 500 apartments. This project will help address the severe shortage of rental housing in Honolulu and revitalize the central business district. The conversion is occurring in phases over a number of years as the office space is vacated. We currently estimate the construction costs to be approximately $80 million to $100 million, although the inherent uncertainties of development are compounded by the multi-year and phased nature of the conversion and potential impacts from the COVID-19 pandemic. We began leasing the new units during the second quarter of 2020.
Repositionings
We often strategically purchase properties with large vacancies or expected near-term lease roll-over and use our knowledge of the property and submarket to reposition the property for the optimal use and tenant mix. In addition, we may reposition properties already in our portfolio. The work we undertake to reposition a building typically takes months or even years, and could involve a range of improvements from a complete structural renovation to a targeted remodeling of selected spaces. During the repositioning, the affected property may display depressed rental revenue and occupancy levels that impact our results and, therefore, comparisons of our performance from period to period. We have temporarily suspended work on new office repositioning projects due to the COVID-19 pandemic.
37
Rental Rate Trends - Total Portfolio
Office Rental Rates
The table below presents the average annual rental rate per leased square foot and the annualized lease transaction costs per leased square foot for leases executed in our total office portfolio during the respective periods:
| Six Months Ended | Year Ended December 31, | |||||||||||||||||||||||||||||||||||||
| June 30, 2020 | 2019 | 2018 | 2017 | 2016 | ||||||||||||||||||||||||||||||||||
|
Average straight-line rental rate
(1)(2)
|
$43.61 | $49.65 | $48.77 | $44.48 | $43.21 | |||||||||||||||||||||||||||||||||
|
Annualized lease transaction costs
(3)
|
$5.26 | $6.02 | $5.80 | $5.68 | $5.74 | |||||||||||||||||||||||||||||||||
___________________________________________________
(1)
These average rental rates are not directly comparable from year to year because the averages are significantly affected from period to period by factors such as the buildings, submarkets, and types of space and terms involved in the leases executed during the respective reporting period. Because straight-line rent takes into account the full economic value of each lease, including rent concessions and escalations, we believe that it may provide a better comparison than ending cash rents, which include the impact of the annual escalations over the entire term of the lease.
(2)
Reflects the weighted average straight-line Annualized Rent.
(3)
Reflects the weighted average leasing commissions and tenant improvement allowances divided by the weighted average number of years for the leases. Excludes leases substantially negotiated by the seller in the case of acquired properties and leases for tenants relocated from space at landlord's request.
Office Rent Roll
The table below presents the rent roll for new and renewed leases per leased square foot executed in our total office portfolio:
| Six Months Ended June 30, 2020 | |||||||||||||||||||||||
|
Rent Roll
(1)(2)
|
Expiring
Rate
(2)
|
New/Renewal Rate
(2)
|
Percentage Change | ||||||||||||||||||||
| Cash Rent | $39.85 | $43.10 | 8.2% | ||||||||||||||||||||
| Straight-line Rent | $35.92 | $43.61 | 21.4% | ||||||||||||||||||||
___________________________________________________
(1)
Represents the average annual initial stabilized cash and straight-line rents per square foot on new and renewed leases signed during the quarter compared to the prior leases for the same space. Excludes Short-Term Leases, leases where the prior lease was terminated more than a year before signing of the new lease, leases for tenants relocated from space at landlord's request, and leases in acquired buildings where we believe the information about the prior agreement is incomplete or where we believe base rent reflects other off-market inducements to the tenant.
(2)
Our office rent roll can fluctuate from period to period as a result of changes in our submarkets, buildings and term of the expiring leases, making these metrics difficult to predict.
38
Multifamily Rental Rates
The table below presents the average annual rental rate per leased unit for new tenants:
| Six Months Ended | Year Ended December 31, | |||||||||||||||||||||||||||||||||||||
| June 30, 2020 | 2019 | 2018 | 2017 | 2016 | ||||||||||||||||||||||||||||||||||
|
Average annual rental rate - new tenants
(1)
|
$28,064 | $28,350 | $27,542 | $28,501 | $28,435 | |||||||||||||||||||||||||||||||||
_____________________________________________________
(1) These average rental rates are not directly comparable from year to year because of changes in the properties and units included. For example: (i) the average for 2018 decreased from 2017 because we added a significant number of units at our Moanalua Hillside Apartments development in Honolulu, where the rental rates are lower than the average in our portfolio, and (ii) the average for 2019 increased from 2018 because we acquired The Glendon where higher rental rates offset the effect of adding additional units at our Moanalua Hillside Apartments development.
Multifamily Rent Roll
The rent on leases subject to rent change during the six months ended June 30, 2020 (new tenants and existing tenants undergoing annual rent review) was 0.1% lower than the prior rent on the same unit.
Occupancy Rates - Total Portfolio
The tables below present the occupancy rates for our total office portfolio and multifamily portfolio:
| December 31, | ||||||||||||||||||||||||||||||||||||||
|
Occupancy Rates
(1)
as of:
|
June 30, 2020 | 2019 | 2018 | 2017 | 2016 | |||||||||||||||||||||||||||||||||
| Office portfolio | 89.3% | 91.4% | 90.3% | 89.8% | 90.4% | |||||||||||||||||||||||||||||||||
|
Multifamily portfolio
(2)
|
92.1% | 95.2% | 97.0% | 96.4% | 97.9% | |||||||||||||||||||||||||||||||||
| Six Months Ended | Year Ended December 31, | |||||||||||||||||||||||||||||||||||||
|
Average Occupancy
Rates
(1)(3)
:
|
June 30, 2020 | 2019 | 2018 | 2017 | 2016 | |||||||||||||||||||||||||||||||||
| Office portfolio | 90.5% | 90.7% | 89.4% | 89.5% | 90.6% | |||||||||||||||||||||||||||||||||
|
Multifamily portfolio
(2)
|
94.5% | 96.5% | 96.6% | 97.2% | 97.6% | |||||||||||||||||||||||||||||||||
___________________________________________________
(1)
Occupancy rates include the impact of property acquisitions, most of whose occupancy rates at the time of acquisition were below that of our existing portfolio.
(2)
The Occupancy Rate for our multifamily portfolio was impacted by a large number of leases signed in June 2020 that took occupancy after quarter end, an acquisition in 2019, and new units at our Moanalua Hillside Apartments development in Honolulu in 2019 and 2018.
(3)
Average occupancy rates are calculated by averaging the occupancy rates at the end of each of the quarters in the period and at the end of the quarter immediately prior to the start of the period.
39
Office Lease Expirations
As of June 30, 2020, assuming non-exercise of renewal options and early termination rights, we expect to see expiring square footage in our total office portfolio as follows:
____________________________________________________
(1) Average of the percentage of leases at June 30, 2017, 2018, and 2019 with the same remaining duration as the leases for the labeled year had at June 30, 2020. Acquisitions are included in the prior year average commencing in the quarter after the acquisition.
40
Results of Operations
Comparison of three months ended June 30, 2020 to three months ended June 30, 2019
| Three Months Ended June 30, | Favorable | |||||||||||||||||||||||||||||||||||||
| 2020 | 2019 | (Unfavorable) | % | Commentary | ||||||||||||||||||||||||||||||||||
| (In thousands) | ||||||||||||||||||||||||||||||||||||||
| Revenues | ||||||||||||||||||||||||||||||||||||||
| Office rental revenue and tenant recoveries | $ | 158,813 | $ | 171,674 | $ | (12,861) | (7.5) | % | The decrease was primarily due to a decrease of $26.6 million of rental revenues and tenant recoveries from properties that we owned throughout both periods, which was primarily due to the write-off of uncollectible tenant receivables and the associated deferred rent receivables as a result of the COVID-19 pandemic, partly offset by an increase of $13.1 million of rental revenue and tenant recoveries from a JV we consolidated in November 2019. | |||||||||||||||||||||||||||||
| Office parking and other income | $ | 18,176 | $ | 30,515 | $ | (12,339) | (40.4) | % | The decrease was due to a decrease of $13.7 million in parking and other income from properties we owned throughout both periods, which was primarily due to a decrease in parking activity as a result of the COVID-19 pandemic, partly offset by an increase of $1.3 million of parking and other income from a JV we consolidated in November 2019. | |||||||||||||||||||||||||||||
| Multifamily revenue | $ | 30,807 | $ | 28,345 | $ | 2,462 | 8.7 | % | The increase was due to an increase of $2.3 million in revenues from a property that we purchased in the second quarter of 2019 (see note 3 to our consolidated financial statements in item 1 of this Report), and an increase of $0.8 million in revenues from our new units at our Moanalua Hillside apartments development, partly offset by a decrease of $0.7 million in revenues from properties we owned throughout both periods. The decrease of $0.7 from properties we owned throughout both periods was primarily due to write-offs of uncollectible tenant receivables and lower rental revenues at a property where units are temporarily unoccupied as a result of a fire, partly offset by $2.6 million of insurance proceeds for lost rental revenue at the respective property. | |||||||||||||||||||||||||||||
| Operating expenses | ||||||||||||||||||||||||||||||||||||||
| Office rental expenses | $ | 60,301 | $ | 64,308 | $ | 4,007 | 6.2 | % | The decrease was due to a decrease of $8.5 million in rental expenses from properties that we owned throughout both periods, partly offset by an increase of $4.2 million in rental expenses from a JV we consolidated in November 2019. The decrease in rental expenses from properties that we owned throughout both periods was primarily due to a decrease in scheduled services expenses and utility expenses, as a result of lower utilization caused by the COVID-19 pandemic. | |||||||||||||||||||||||||||||
41
| Three Months Ended June 30, | Favorable | |||||||||||||||||||||||||||||||||||||
| 2020 | 2019 | (Unfavorable) | % | Commentary | ||||||||||||||||||||||||||||||||||
| (In thousands) | ||||||||||||||||||||||||||||||||||||||
| Multifamily rental expenses | $ | 8,856 | $ | 7,712 | $ | (1,144) | (14.8) | % | The increase was due to an increase of $1.1 million in rental expenses from a property that we purchased in the second quarter of 2019. | |||||||||||||||||||||||||||||
| General and administrative expenses | $ | 9,863 | $ | 9,159 | $ | (704) | (7.7) | % | The increase was primarily due to an increase in personnel expenses. | |||||||||||||||||||||||||||||
| Depreciation and amortization | $ | 98,765 | $ | 78,724 | $ | (20,041) | (25.5) | % | The increase was due to (i) an increase of $9.1 million of depreciation and amortization from an office building we are converting to a residential building in Hawaii, due to accelerated depreciation of the building, (ii) $8.7 million of depreciation and amortization from a JV we consolidated in November 2019, and (iii) an increase of $1.4 million in depreciation and amortization from a property we purchased in the second quarter of 2019. | |||||||||||||||||||||||||||||
| Non-Operating Income and Expenses | ||||||||||||||||||||||||||||||||||||||
| Other income | $ | 325 | $ | 2,892 | $ | (2,567) | (88.8) | % | The decrease was due to (i) a decrease of $1.4 million in revenues from a health club in Honolulu that we own and operate, caused by the COVID-19 pandemic, (ii) a decrease of $0.6 million in interest income due to lower money market balances and interest rates, and (iii) a decrease of $0.5 million in revenues related to our Fund that was consolidated as a JV in November 2019. Other income includes a $1.2 million asset write-down for the estimated property damage to a building impacted by fire offset by the associated $1.2 million of insurance proceeds received for property damage. | |||||||||||||||||||||||||||||
| Other expenses | $ | (478) | $ | (1,807) | $ | 1,329 | 73.5 | % | The decrease was primarily due to a decrease of $1.1 million in expenses for the health club in Honolulu, due to lower utilization caused by the COVID-19 pandemic, and a decrease of $0.3 million in expenses related to our Fund that was consolidated as a JV in November 2019. | |||||||||||||||||||||||||||||
| (Loss) income from unconsolidated Funds | $ | (140) | $ | 2,207 | $ | (2,347) | (106.3) | % | The decrease was primarily due to a net loss in 2020 for our remaining unconsolidated Fund compared to net income for our Funds in 2019 (one of our Funds was consolidated as a JV in November 2019). The net loss in 2020 for our remaining Fund was primarily due to (i) the write-off of uncollectible tenant receivables and the associated deferred rent receivables, and (ii) a decrease in parking income, both as a result of the COVID-19 pandemic. | |||||||||||||||||||||||||||||
| Interest expense | $ | (35,190) | $ | (34,063) | $ | (1,127) | (3.3) | % | The increase was primarily due to higher debt balances from a JV that was consolidated in November 2019 and a property that we purchased in the second quarter of 2019. | |||||||||||||||||||||||||||||
42
Comparison of six months ended June 30, 2020 to six months ended June 30, 2019
| Six Months Ended June 30, | Favorable | |||||||||||||||||||||||||||||||||||||
| 2020 | 2019 | (Unfavorable) | % | Commentary | ||||||||||||||||||||||||||||||||||
| (In thousands) | ||||||||||||||||||||||||||||||||||||||
|
Revenues
|
||||||||||||||||||||||||||||||||||||||
| Office rental revenue and tenant recoveries | $ | 344,640 | $ | 338,909 | $ | 5,731 | 1.7 | % | The increase was primarily due to rental revenue and tenant recoveries of $28.3 million from a JV we consolidated in November 2019, partly offset by a decrease of $24.3 million in rental revenue and tenant recoveries from properties that we owned throughout both periods. The decrease from properties that we owned throughout both periods was primarily due to the write-off of uncollectible tenant receivables and the associated deferred rent receivables as a result of the COVID-19 pandemic. | |||||||||||||||||||||||||||||
| Office parking and other income | $ | 52,238 | $ | 60,570 | $ | (8,332) | (13.8) | % | The decrease was due to a decrease of $12.9 million in parking and other income from properties we owned throughout both periods, primarily due to a decrease in parking activity as a result of the COVID-19 pandemic, partly offset by an increase of $4.2 million of parking and other income from a JV we consolidated in November 2019. | |||||||||||||||||||||||||||||
| Multifamily revenue | $ | 62,268 | $ | 55,241 | $ | 7,027 | 12.7 | % | The increase was due to an increase of (i) $6.6 million in revenue from a property that we purchased in the second quarter of 2019, and (ii) an increase of $1.9 million in revenues from the new apartments at our Moanalua Hillside Apartments development, partly offset by (a) a decrease of $1.5 million in revenues from properties we owned throughout both periods. The decrease of $1.5 from properties we owned throughout both periods was primarily due to write-offs of uncollectible tenant receivables and lower rental revenues at a property where units are temporarily unoccupied as a result of a fire, partly offset by $2.6 million of insurance proceeds for lost rental revenue at the respective property. | |||||||||||||||||||||||||||||
| Operating expenses | ||||||||||||||||||||||||||||||||||||||
| Office rental expenses | $ | 129,965 | $ | 127,757 | $ | (2,208) | (1.7) | % | The increase was due to an increase of $9.5 million in rental expenses from a JV we consolidated in November 2019, and an increase of $0.7 million in rental expenses from a property we purchased in the second quarter of 2019, partly offset by a decrease of $8.0 million in rental expenses from properties that we owned throughout both periods. The decrease in rental expenses from properties that we owned throughout both periods was due to a decrease in scheduled services expenses, utility expenses, and repairs and maintenance expenses, as a result of lower utilization caused by the COVID-19 pandemic. | |||||||||||||||||||||||||||||
43
| Six Months Ended June 30, | Favorable | |||||||||||||||||||||||||||||||||||||
| 2020 | 2019 | (Unfavorable) | % | Commentary | ||||||||||||||||||||||||||||||||||
| (In thousands) | ||||||||||||||||||||||||||||||||||||||
| Multifamily rental expenses | $ | 18,212 | $ | 15,267 | $ | (2,945) | (19.3) | % | The increase was due to an increase of $2.6 million in rental expenses from the property we purchased in the second quarter of 2019, and an increase of $0.3 million in rental expenses from the new apartments at our Moanalua Hillside Apartments development. | |||||||||||||||||||||||||||||
| General and administrative expenses | $ | 20,198 | $ | 18,991 | $ | (1,207) | (6.4) | % | The increase was primarily due to an increase in personnel expenses. | |||||||||||||||||||||||||||||
| Depreciation and amortization | $ | 196,542 | $ | 158,597 | $ | (37,945) | (23.9) | % | The increase was due to (i) depreciation and amortization of $17.6 million from a JV we consolidated in November 2019, (ii) an increase of $17.1 million in depreciation and amortization from an office building we are converting to a residential building in Hawaii, due to accelerated depreciation of the building, and (iii) an increase of $3.7 million in depreciation and amortization from the property we purchased in the second quarter of 2019. | |||||||||||||||||||||||||||||
| Non-Operating Income and Expenses | ||||||||||||||||||||||||||||||||||||||
| Other income | $ | 2,314 | $ | 5,790 | $ | (3,476) | (60.0) | % | The decrease was due to (i) a decrease of $1.6 million in revenue from a health club in Honolulu that we own and operate, caused by the COVID-19 pandemic, (ii) a decrease of $1.0 million in revenue related to our Fund that was consolidated as a JV in November 2019, and (iii) a decrease of $0.9 million in interest income due to lower money market balances and interest rates. Other income includes a $4.0 million asset write-down for the estimated property damage to a building impacted by fire offset by the associated $4.0 million of insurance proceeds received for property damage. | |||||||||||||||||||||||||||||
| Other expenses | $ | (1,874) | $ | (3,652) | $ | 1,778 | 48.7 | % | The decrease was primarily due to a decrease of $1.2 million in expenses for the health club in Honolulu, due to lower utilization caused by the COVID-19 pandemic, and a decrease in expenses of $0.6 million related to our Fund that was consolidated as a JV in November 2019. | |||||||||||||||||||||||||||||
| Income from unconsolidated Funds | $ | 183 | $ | 3,758 | $ | (3,575) | (95.1) | % | The decrease was primarily due to the consolidation of one of our Funds as a JV in November 2019. | |||||||||||||||||||||||||||||
| Interest expense | $ | (70,610) | $ | (67,356) | $ | (3,254) | (4.8) | % | The increase was primarily due to higher debt balances related to a JV we consolidated in November 2019 and a property that we purchased in the second quarter of 2019. | |||||||||||||||||||||||||||||
44
Non-GAAP Supplemental Financial Measure: FFO
Usefulness to Investors
We report FFO because it is a widely reported measure of the performance of equity REITs, and is also used by some investors to identify the impact of trends in occupancy rates, rental rates and operating costs from year to year, excluding impacts from changes in the value of our real estate, and to compare our performance with other REITs. FFO is a non-GAAP financial measure for which we believe that net income is the most directly comparable GAAP financial measure. FFO has limitations as a measure of our performance because it excludes depreciation and amortization of real estate, and captures neither the changes in the value of our properties that result from use or market conditions, nor the level of capital expenditures, tenant improvements and leasing commissions necessary to maintain the operating performance of our properties, all of which have real economic effect and could materially impact our results from operations. FFO should be considered only as a supplement to net income as a measure of our performance and should not be used as a measure of our liquidity or cash flow, nor is it indicative of funds available to fund our cash needs, including our ability to pay dividends. Other REITs may not calculate FFO in accordance with the NAREIT definition and, accordingly, our FFO may not be comparable to the FFO of other REITs. See "Results of Operations" above for a discussion of the items that impacted our net income.
Comparison of three months ended June 30, 2020 to three months ended June 30, 2019
For the three months ended June 30, 2020, FFO decreased by $23.4 million, or 21.7%, to $84.4 million, compared to $107.8 million for the three months ended June 30, 2019. The decrease was primarily due to a decrease in the operating income from our office portfolio (office revenues less office rental expenses), partly offset by an increase in the operating income from our multifamily portfolio (multifamily revenues less multifamily rental expenses). The decrease in operating income from our office portfolio was primarily due to (i) the write-off of uncollectible tenant receivables and the associated deferred rent receivables, and (ii) a decrease in parking income, partly offset by office rental expense savings, all as a result of the COVID-19 pandemic. The increase in operating income from our multifamily portfolio was primarily due to a multifamily property we purchased in June 2019 and the new apartments from our Moanalua Hillside Apartments development.
Comparison of six months ended June 30, 2020 to six months ended June 30, 2019
For the six months ended June 30, 2020, FFO decreased by $14.6 million, or 6.9%, to $196.3 million, compared to $210.9 million for the six months ended June 30, 2019. The decrease was primarily due to the same reasons listed above.
Reconciliation to GAAP
The table below reconciles our FFO (the FFO attributable to our common stockholders and noncontrolling interests in our Operating Partnership - which includes our share of our consolidated JVs and our unconsolidated Funds FFO) to net income attributable to common stockholders computed in accordance with GAAP:
| Three Months Ended June 30, | Six Months Ended June 30, | ||||||||||||||||||||||||||||
| (In thousands) | 2020 | 2019 | 2020 | 2019 | |||||||||||||||||||||||||
| Net income attributable to common stockholders | $ | 2,030 | $ | 33,966 | $ | 28,953 | $ | 62,667 | |||||||||||||||||||||
|
Depreciation and amortization of real estate assets
(1)
|
98,765 | 78,724 | 196,542 | 158,597 | |||||||||||||||||||||||||
|
Net (loss) income attributable to noncontrolling interests
(1)
|
(7,502) | 5,894 | (4,711) | 9,981 | |||||||||||||||||||||||||
|
Adjustments attributable to unconsolidated Funds
(1)(2)
|
696 | 4,336 | 1,350 | 8,850 | |||||||||||||||||||||||||
|
Adjustments attributable to consolidated JVs
(1)(3)
|
(9,581) | (15,119) | (25,844) | (29,196) | |||||||||||||||||||||||||
| FFO | $ | 84,408 | $ | 107,801 | $ | 196,290 | $ | 210,899 | |||||||||||||||||||||
_______________________________________________
(1)
We restructured one of our unconsolidated Funds in November 2019 after which it was consolidated as a JV. The various adjustments in the reconciliation of FFO are therefore not directly comparable to the comparable period. See Note 6 to our consolidated financial statements in our 2019 Annual Report on Form 10-K for more information.
(2)
Adjusts for our share of our unconsolidated Funds' depreciation and amortization of real estate assets.
(3)
Adjusts for the net income (loss) and depreciation and amortization of real estate assets that is attributable to the noncontrolling interests in our consolidated JVs.
45
Non-GAAP Supplemental Financial Measure: Same Property NOI
Usefulness to Investors
We report Same Property NOI to facilitate a comparison of our operations between reported periods. Many investors use Same Property NOI to evaluate our operating performance and to compare our operating performance with other REITs, because it can reduce the impact of investing transactions on operating trends. Same Property NOI is a non-GAAP financial measure for which we believe that net income is the most directly comparable GAAP financial measure. We report Same Property NOI because it is a widely recognized measure of the performance of equity REITs, and is used by some investors to identify trends in occupancy rates, rental rates and operating costs and to compare our operating performance with that of other REITs. Same Property NOI has limitations as a measure of our performance because it excludes depreciation and amortization expense, and captures neither the changes in the value of our properties that result from use or market conditions, nor the level of capital expenditures, tenant improvements and leasing commissions necessary to maintain the operating performance of our properties, all of which have real economic effect and could materially impact our results from operations. Other REITs may not calculate Same Property NOI in the same manner. As a result, our Same Property NOI may not be comparable to the Same Property NOI of other REITs. Same Property NOI should be considered only as a supplement to net income as a measure of our performance and should not be used as a measure of our liquidity or cash flow, nor is it indicative of funds available to fund our cash needs, including our ability to pay dividends.
Comparison of three months ended June 30, 2020 to three months ended June 30, 2019
Our Same Properties for 2020 included 60 office properties, aggregating 16.1 million Rentable Square Feet, and 8 multifamily properties with an aggregate 1,928 units. The amounts presented include 100% (not our pro-rata share). Our Same Property results of operations for the three months ended June 30, 2020 were primarily impacted by the COVID-19 pandemic.
| Three Months Ended June 30, | Favorable | ||||||||||||||||||||||||||||||||||
| 2020 | 2019 | (Unfavorable) | % | Commentary | |||||||||||||||||||||||||||||||
| (In thousands) | |||||||||||||||||||||||||||||||||||
| Office revenues | $ | 158,516 | $ | 197,353 | $ | (38,837) | (19.7) | % | The decrease was primarily due to (i) a decrease in rental revenues due to the write-off of uncollectible tenant receivables and the associated deferred rent receivables, (ii) a decrease in tenant recoveries due to a decrease in recoverable operating costs and the write-off of uncollectible tenant receivables, and (iii) a decrease in parking income. | ||||||||||||||||||||||||||
| Office expenses | (53,762) | (61,690) | 7,928 | 12.9 | % | The decrease was primarily due to a decrease in parking expenses, utility expenses, and janitorial expenses. | |||||||||||||||||||||||||||||
| Office NOI | 104,754 | 135,663 | (30,909) | (22.8) | % | ||||||||||||||||||||||||||||||
| Multifamily revenues | 14,597 | 15,674 | (1,077) | (6.9) | % | The decrease was primarily due to a decrease in rental revenues due to the write-off of uncollectible tenant receivables and a decrease in occupancy. | |||||||||||||||||||||||||||||
| Multifamily expenses | (3,925) | (3,948) | 23 | 0.6 | % | The decrease was primarily due to a decrease in repairs and maintenance expenses and utility expenses, partly offset by an increase in personnel expenses, scheduled services expenses and property taxes. | |||||||||||||||||||||||||||||
| Multifamily NOI | 10,672 | 11,726 | (1,054) | (9.0) | % | ||||||||||||||||||||||||||||||
| Total NOI | $ | 115,426 | $ | 147,389 | $ | (31,963) | (21.7) | % | |||||||||||||||||||||||||||
46
Reconciliation to GAAP
The table below presents a reconciliation of our Same Property NOI to net income attributable to common stockholders:
| Three Months Ended June 30, | |||||||||||||||||
| (In thousands) | 2020 | 2019 | |||||||||||||||
| Same Property NOI | $ | 115,426 | $ | 147,389 | |||||||||||||
| Non-comparable office revenues | 18,473 | 4,836 | |||||||||||||||
| Non-comparable office expenses | (6,539) | (2,618) | |||||||||||||||
| Non-comparable multifamily revenues | 16,210 | 12,671 | |||||||||||||||
| Non-comparable multifamily expenses | (4,931) | (3,764) | |||||||||||||||
| NOI | 138,639 | 158,514 | |||||||||||||||
| General and administrative expenses | (9,863) | (9,159) | |||||||||||||||
| Depreciation and amortization | (98,765) | (78,724) | |||||||||||||||
| Operating income | 30,011 | 70,631 | |||||||||||||||
| Other income | 325 | 2,892 | |||||||||||||||
| Other expenses | (478) | (1,807) | |||||||||||||||
| Income from unconsolidated Funds | (140) | 2,207 | |||||||||||||||
| Interest expense | (35,190) | (34,063) | |||||||||||||||
| Net (loss) income | (5,472) | 39,860 | |||||||||||||||
| Less: Net loss (income) attributable to noncontrolling interests | 7,502 | (5,894) | |||||||||||||||
| Net income attributable to common stockholders | $ | 2,030 | $ | 33,966 | |||||||||||||
47
Comparison of six months ended June 30, 2020 to six months ended June 30, 2019
Our Same Properties for 2020 included 60 office properties, aggregating 16.1 million Rentable Square Feet, and 8 multifamily properties with an aggregate 1,928 units. The amounts presented include 100% (not our pro-rata share). Our Same Property results of operations for the six months ended June 30, 2020
were primarily impacted by the COVID-19 pandemic.
| Six Months Ended June 30, | Favorable | ||||||||||||||||||||||||||||||||||
| 2020 | 2019 | (Unfavorable) | % | Commentary | |||||||||||||||||||||||||||||||
| (In thousands) | |||||||||||||||||||||||||||||||||||
| Office revenues | $ | 355,576 | $ | 390,138 | $ | (34,562) | (8.9)% | The decrease was primarily due to (i) a decrease in rental revenues due to the write-off of uncollectible tenant receivables and the associated deferred rent receivables, (ii) a decrease in tenant recoveries due to a decrease in recoverable operating costs and the write-off of uncollectible tenant receivables, and (iii) a decrease in parking income. | |||||||||||||||||||||||||||
| Office expenses | (115,710) | (122,566) | 6,856 | 5.6% | The decrease was primarily due to a decrease in parking expenses, utility expenses, and janitorial expenses. | ||||||||||||||||||||||||||||||
| Office NOI | 239,866 | 267,572 | (27,706) | (10.4)% | |||||||||||||||||||||||||||||||
| Multifamily revenues | 30,254 | 31,507 | (1,253) | (4.0)% | The decrease was primarily due to a decrease in rental revenues due to the write-off of uncollectible tenant receivables and a decrease in occupancy. | ||||||||||||||||||||||||||||||
| Multifamily expenses | (8,083) | (7,969) | (114) | (1.4)% | The increase was primarily due to an increase in scheduled services expenses, personnel expenses and property taxes, partly offset by a decrease in repairs and maintenance expenses. | ||||||||||||||||||||||||||||||
| Multifamily NOI | 22,171 | 23,538 | (1,367) | (5.8)% | |||||||||||||||||||||||||||||||
| Total NOI | $ | 262,037 | $ | 291,110 | $ | (29,073) | (10.0)% | ||||||||||||||||||||||||||||
48
Reconciliation to GAAP
The table below presents a reconciliation of our Same Property NOI to net income attributable to common stockholders:
| Six Months Ended June 30, | |||||||||||||||||
| (In thousands) | 2020 | 2019 | |||||||||||||||
| Same Property NOI | $ | 262,037 | $ | 291,110 | |||||||||||||
| Non-comparable office revenues | 41,302 | 9,341 | |||||||||||||||
| Non-comparable office expenses | (14,255) | (5,191) | |||||||||||||||
| Non-comparable multifamily revenues | 32,014 | 23,734 | |||||||||||||||
| Non-comparable multifamily expenses | (10,129) | (7,298) | |||||||||||||||
| NOI | 310,969 | 311,696 | |||||||||||||||
| General and administrative expenses | (20,198) | (18,991) | |||||||||||||||
| Depreciation and amortization | (196,542) | (158,597) | |||||||||||||||
| Operating income | 94,229 | 134,108 | |||||||||||||||
| Other income | 2,314 | 5,790 | |||||||||||||||
| Other expenses | (1,874) | (3,652) | |||||||||||||||
| Income from unconsolidated Funds | 183 | 3,758 | |||||||||||||||
| Interest expense | (70,610) | (67,356) | |||||||||||||||
| Net income | 24,242 | 72,648 | |||||||||||||||
| Less: Net loss (income) attributable to noncontrolling interests | 4,711 | (9,981) | |||||||||||||||
| Net income attributable to common stockholders | $ | 28,953 | $ | 62,667 | |||||||||||||
49
Liquidity and Capital Resources
Short-term liquidity
During the six months ended June 30, 2020, we generated cash from operations of $236.8 million. As of June 30, 2020, we had $176.4 million of cash and cash equivalents, and we had a zero balance on our $400.0 million revolving credit facility. Our earliest debt maturity is February 28, 2023. Excluding acquisitions, development projects and debt refinancings, we expect to meet our short-term liquidity requirements through cash on hand, cash generated by operations and our revolving credit facility. See Note 8 to our consolidated financial statements in Item 1 of this Report for more information regarding our debt.
Long-term liquidity
Our long-term liquidity needs consist primarily of funds necessary to pay for acquisitions, development projects and debt refinancings. We do not expect to have sufficient funds on hand to cover these long-term cash requirements due to the requirement to distribute a substantial majority of our income on an annual basis imposed by REIT federal tax rules. We plan to meet our long-term liquidity needs through long-term secured non-recourse indebtedness, the issuance of equity securities, including common stock and OP Units, as well as property dispositions and JV transactions.
We only use property level, non-recourse debt. As of June 30, 2020, approximately 41% of our total office portfolio is totally unencumbered. To mitigate the impact of changing interest rates on our cash flows from operations, we generally enter into interest rate swap agreements with respect to our loans with floating interest rates. These swap agreements generally expire between one to two years before the maturity date of the related loan, during which time we can refinance the loan without any interest penalty. See Notes 8 and 10 to our consolidated financial statements in Item 1 of this Report for more information regarding our debt and derivative contracts, respectively.
Contractual Obligations
See the following notes to our consolidated financial statements in Item 1 of this Report for information regarding our contractual commitments:
•
Note 4 - minimum future ground lease payments;
•
Note 8 - minimum future principal payments for our secured notes payable and revolving credit facility, and the interest rates that determine our future periodic interest payments; and
•
Note 16 - developments, capital expenditure projects and repositionings.
Off-Balance Sheet Arrangements
Unconsolidated Fund's Debt
Our Fund has its own secured non-recourse debt, and we have made certain environmental and other limited indemnities and guarantees covering customary non-recourse carve-outs related to that loan. We have also guaranteed the related swap. Our Fund has agreed to indemnify us for any amounts that we would be required to pay under these agreements. As of June 30, 2020, all of the obligations under the respective loan and swap agreements have been performed in accordance with the terms of those agreements. See Note 16 to our consolidated financial statements in Item 1 of this Report for more information about our Fund's debt.
50
Cash Flows
Comparison of six months ended June 30, 2020 to six months ended June 30, 2019
| Six Months Ended June 30, | Increase | ||||||||||||||||||||||||||||
| 2020 | 2019 | (Decrease) | % | ||||||||||||||||||||||||||
| (In thousands) | |||||||||||||||||||||||||||||
|
Net cash provided by operating activities
(1)
|
$ | 236,809 | $ | 228,176 | $ | 8,633 | 3.8 | % | |||||||||||||||||||||
|
Net cash used in investing activities
(2)
|
$ | (129,959) | $ | (482,444) | $ | (352,485) | (73.1) | % | |||||||||||||||||||||
|
Net cash (used in) provided by financing activities
(3)
|
$ | (84,140) | $ | 412,003 | $ | (496,143) | (120.4) | % | |||||||||||||||||||||
________________________________________________________________________
(1) Our cash flows from operating activities are primarily dependent upon the occupancy and rental rates of our portfolio, the collectibility of rent and recoveries from our tenants, and the level of our operating expenses and general and administrative expenses, and interest expense. The increase in cash provided by operating activities was primarily due to: (i) an increase in cash operating income from our office portfolio (office cash revenues less office cash rental expenses) primarily due to an increase in our ownership interest in a JV we consolidated in November 2019, and (ii) an increase in cash operating income from our multifamily portfolio (multifamily cash revenues less multifamily cash rental expenses) primarily due to our acquisition in June 2019 of The Glendon residential community, and the leasing of new units at our Moanalua Hillside Apartments development.
(2) Our cash flows from investing activities is generally used to fund property acquisitions, developments and redevelopment projects, and Recurring and non-Recurring Capital Expenditures. The decrease in cash used in investing activities was primarily due to: (i) $364.5 million paid for a property that we purchased in June 2019, (ii) a decrease of $9.8 million in capital expenditures for improvements to real estate, partly offset by (iii) an increase of $23.5 million in capital expenditures for developments.
(3) Our cash flows from financing activities are generally impacted by our borrowings and capital activities, as well as dividends and distributions paid to common stockholders and noncontrolling interests, respectively. The difference in cash used in financing activities during the six months ended June 30, 2020, compared to the cash provided by financing activities during the six months ended June 30, 2019, was primarily due to: (i) $201.0 million of net proceeds from the issuance of common stock in 2019, (ii) $163.6 million of contributions from noncontrolling interests in consolidated JVs in 2019, (iii) a decrease of $125.0 million in net borrowings, and (iv) an increase of $9.6 million in dividends paid to our common stock holders.
Critical Accounting Policies
We did not adopt any new ASUs during the second quarter of 2020. We adopted ASUs during the first quarter of 2020 - see Note 2 to our consolidated financial statements in Item 1 of this Report for a discussion of the ASUs. The adoption of the ASUs did not have a material impact on our financial statements. We have not made any other changes to our critical accounting policies disclosed in our 2019 Annual Report on Form 10-K.
Our discussion and analysis of our financial condition and results of operations is based upon our consolidated financial statements, which have been prepared in accordance with US GAAP, and which requires us to make estimates of certain items, which affect the reported amounts of our assets, liabilities, revenues and expenses. While we believe that our estimates are based upon reasonable assumptions and judgments at the time that they are made, some of our estimates could prove to be incorrect, and those differences could be material. Some of our estimates are subject to adjustment as we believe appropriate, based on revised estimates, and reconciliation to actual results when available.
51
Item 3. Quantitative and Qualitative Disclosures about Market Risk
We use derivative instruments to hedge interest rate risk related to our floating rate borrowings. However, our use of these instruments exposes us to credit risk from the potential inability of our counterparties to perform under the terms of those agreements. We attempt to minimize this credit risk by contracting with a variety of high-quality financial counterparties. See Notes 8 and 10 to our consolidated financial statements in Item 1 of this Report for more information regarding our debt and derivatives. As of June 30, 2020, we have no outstanding floating rate debt that is unhedged.
In July 2017, the Financial Conduct Authority (the authority that regulates LIBOR) announced it intends to stop compelling banks to submit rates for the calculation of LIBOR after 2021. As a result, the Federal Reserve Board and the Federal Reserve Bank of New York organized the Alternative Reference Rates Committee ("ARRC"), which identified the Secured Overnight Financing Rate ("SOFR") as its preferred alternative to USD-LIBOR for use in derivatives and other financial contracts that are currently indexed to USD-LIBOR. ARRC has proposed a paced market transition plan to SOFR from USD-LIBOR and organizations are currently working on industry-wide and company-specific transition plans as it relates to derivatives and cash markets exposed to USD-LIBOR.
Our floating rate borrowings and derivative instruments are indexed to USD-LIBOR and we are monitoring this activity and evaluating the related risks - which include interest on loans and amounts received and paid on derivative instruments. These risks arise in connection with transitioning contracts to a new alternative rate. The value of loans or derivative instruments tied to LIBOR could also be impacted if LIBOR is limited or discontinued. While we expect LIBOR to be available in substantially its current form until the end of 2021, it is possible that LIBOR will become unavailable prior to that point. This could result, for example, if sufficient banks decline to make submissions to the LIBOR administrator. In that case, the risks associated with the transition to an alternative reference rate will be accelerated and potentially magnified.
Item 4. Controls and Procedures
As of June 30, 2020, the end of the period covered by this Report, we carried out an evaluation, under the supervision and with the participation of management, including our CEO and CFO, regarding the effectiveness of our disclosure controls and procedures (as defined in Rules 13a-15(e) and 15d-15(e) under the Exchange Act) at the end of the period covered by this Report. Based on the foregoing, our CEO and CFO concluded, as of that time, that our disclosure controls and procedures were effective in ensuring that information required to be disclosed by us in reports filed or submitted under the Exchange Act (i) is processed, recorded, summarized and reported within the time periods specified in the SEC’s rules and forms and (ii) is accumulated and communicated to our management, including our CEO and our CFO, as appropriate, to allow for timely decisions regarding required disclosure.
There have not been any changes in our internal control over financial reporting that occurred during the quarter ended June 30, 2020, that have materially affected, or are reasonably likely to materially affect, our internal control over financial reporting.
52
PART II. OTHER INFORMATION
Item 1. Legal Proceedings
From time to time, we are party to various lawsuits, claims and other legal proceedings that arise in the ordinary course of our business. Excluding ordinary routine litigation incidental to our business, we are not currently a party to any legal proceedings that we believe would reasonably be expected to have a materially adverse effect on our business, financial condition or results of operations.
Item 1A. Risk Factors
Except for the risk factor related to the COVID-19 pandemic in our quarterly report on Form 10-Q for the quarter ended March 31, 2020, we are not aware of any other material changes to the risk factors disclosed in Part I, “Item 1A. Risk Factors” in our Annual Report on Form 10-K for the year ended December 31, 2019.
Item 2. Unregistered Sales of Equity Securities and Use of Proceeds
None.
Item 3. Defaults Upon Senior Securities
None.
Item 4. Mine Safety Disclosures
Not applicable.
Item 5. Other Information
None.
Item 6. Exhibits
| Exhibit Number | Description | |||||||
| 31.1 | ||||||||
| 31.2 | ||||||||
|
32.1*
|
||||||||
|
32.2*
|
||||||||
|
101.INS
|
Inline XBRL Instance Document - the instance document does not appear in the interactive data file because its XBRL tags are embedded within the inline XBRL document.
|
|||||||
|
101.SCH
|
Inline XBRL Taxonomy Extension Schema Document.
|
|||||||
|
101.CAL
|
Inline XBRL Taxonomy Extension Calculation Linkbase Document.
|
|||||||
|
101.DEF
|
Inline XBRL Taxonomy Extension Definition Linkbase Document.
|
|||||||
|
101.LAB
|
Inline XBRL Taxonomy Extension Label Linkbase Document.
|
|||||||
|
101.PRE
|
Inline XBRL Taxonomy Extension Presentation Linkbase Document.
|
|||||||
| 104 | Cover Page Interactive Data File (embedded within the Inline XBRL document) | |||||||
________________________________________________
* In accordance with SEC Release No. 33-8212, these exhibits are being furnished, and are not being filed as part of this Report on Form 10-Q or as a separate disclosure document, and are not being incorporated by reference into any Securities Act registration statement.
53
Pursuant to the requirements of the Exchange Act, the registrant has duly caused this report to be signed on its behalf by the undersigned, thereunto duly authorized.
| DOUGLAS EMMETT, INC. | ||||||||||||||
| Date: | August 7, 2020 | By: | /s/ JORDAN L. KAPLAN | |||||||||||
| Jordan L. Kaplan | ||||||||||||||
| President and CEO | ||||||||||||||
| Date: | August 7, 2020 | By: | /s/ PETER D. SEYMOUR | |||||||||||
| Peter D. Seymour | ||||||||||||||
| CFO | ||||||||||||||
54
TABLE OF CONTENTS
Part I. Financial InformationItem 1. Financial StatementsItem 2. Management S Discussion and Analysis Of Financial Condition and Results Of OperationsNote 4 - Minimum Future Ground Lease Payments;Note 16 - Developments, Capital Expenditure Projects and RepositioningsItem 3. Quantitative and Qualitative Disclosures About Market RiskItem 4. Controls and ProceduresPart II. Other InformationItem 1. Legal ProceedingsItem 1A. Risk FactorsItem 2. Unregistered Sales Of Equity Securities and Use Of ProceedsItem 3. Defaults Upon Senior SecuritiesItem 4. Mine Safety DisclosuresItem 5. Other InformationItem 6. Exhibits