DELL TECHNOLOGIES INC.
10-Ks and 10-Qs
|
|
|
|
|
|
|
|
|
|
|
|
|
|
|
|
|
|
|
|
|
|
|
|
|
|
|
|
|
|
|
|
|
|
|
|
|
|
|
|
|
|
|
|
|
|
|
|
|
|
|
|
|
|
|
|
|
|
|
|
|
|
|
|
|
|
|
|
|
|
|
|
|
|
|
|
|
|
|
|
|
|
|
|
|
|
|
|
|
|
|
|
|
|
|
|
|
|
|
|
|
|
|
|
|
|
|
|
|
|
|
|
|
|
|
|
|
|
|
|
|
|
|
|
|
|
|
|
|
|
|
|
|
|
|
|
|
|
|
|
|
|
|
|
|
|
|
|
UNITED STATES
SECURITIES AND EXCHANGE COMMISSION
Washington, D.C. 20549
Form 10-K
|
(Mark One)
|
|
|
|
þ
|
|
ANNUAL REPORT PURSUANT TO SECTION 13 OR 15(d) OF THE SECURITIES
EXCHANGE ACT OF 1934 |
|
For the fiscal year ended February 2, 2018
|
||
|
or
|
||
|
☐
|
|
TRANSITION REPORT PURSUANT TO SECTION 13 OR 15(d) OF THE SECURITIES
EXCHANGE ACT OF 1934
|
|
For the transition period from
to
|
||
Commission file number:
001-37867
Dell Technologies Inc.
(Exact name of registrant as specified in its charter)
|
Delaware
|
|
80-0890963
|
|
(State or other jurisdiction of incorporation or organization)
|
|
(I.R.S. Employer Identification No.)
|
One Dell Way, Round Rock, Texas 78682
(Address of principal executive offices) (Zip Code)
1-800-289-3355
(Registrant's telephone number, including area code)
Securities registered pursuant to Section 12(b) of the Act:
|
Title of each class
|
Name of each exchange on which registered
|
|
Class V Common Stock, par value $0.01 per share
|
New York Stock Exchange
|
Securities registered pursuant to Section 12(g) of the Act:
None
Indicate by check mark if the registrant is a well-known seasoned issuer, as defined in Rule 405 of the Securities Act.
Yes
þ
No ☐
Indicate by check mark if the registrant is not required to file reports pursuant to Section 13 or Section 15(d) of the Act.
Yes ☐ No
þ
Indicate by check mark whether the registrant (1) has filed all reports required to be filed by Section 13 or 15(d) of the Securities Exchange Act of 1934 during the preceding 12 months (or for such shorter period that the registrant was required to file such reports), and (2) has been subject to such filing requirements for the past 90 days. Yes
þ
No
☐
Indicate by check mark whether the registrant has submitted electronically and posted on its corporate Web site, if any, every Interactive Data File required to be submitted and posted pursuant to Rule 405 of Regulation S-T during the preceding 12 months (or for such shorter period that the registrant was required to submit and post such files). Yes
þ
No
☐
Indicate by check mark if disclosure of delinquent filers pursuant to Item 405 of Regulation S-K is not contained herein, and will not be contained, to the best of registrant’s knowledge, in definitive proxy or information statements incorporated by reference in Part III of this Form 10-K or any amendment to this Form 10-K.
þ
Indicate by check mark whether the registrant is a large accelerated filer, an accelerated filer, a non-accelerated filer, a smaller reporting company, or emerging growth company. See the definitions of “large accelerated filer,” “accelerated filer,” “smaller reporting company,” and “emerging growth company” in Rule 12b-2 of the Exchange Act.
|
Large accelerated filer
þ
|
|
Accelerated filer
☐
|
|
Non-accelerated filer
☐
(Do not check if a smaller reporting company)
|
|
Smaller reporting company
☐
|
|
Emerging growth company
☐
|
||
If an emerging growth company, indicate by check mark if the registrant has elected not to use the extended transition period for complying with any new or revised financial accounting standards provided pursuant to Section 13(a) of the Exchange Act.
☐
Indicate by check mark whether the registrant is a shell company (as defined in Rule 12b-2 of the Act). Yes
☐
No
þ
As of August 4, 2017, the last business day of the registrant’s most recently completed second fiscal quarter, the aggregate market value of the shares of the Class V Common Stock of the registrant held by non-affiliates was approximately $13,072,939,343 (based on the closing price of $64.39 per share reported on the New York Stock Exchange on that date).
As of
March 21, 2018
, there were
768,938,138
shares of the registrant's common stock outstanding, consisting of
199,354,950
outstanding shares of Class V Common Stock,
409,538,423
outstanding shares of Class A Common Stock,
136,986,858
outstanding shares of Class B Common Stock, and
23,057,907
outstanding shares of Class C Common Stock.
DOCUMENTS INCORPORATED BY REFERENCE
The information required by Part III of this report, to the extent not set forth herein, is incorporated by reference from the registrant's proxy statement relating to the annual meeting of stockholders in 2018. Such proxy statement will be filed with the Securities and Exchange Commission within 120 days after the end of the fiscal year to which this report relates.
2
CAUTIONARY NOTE REGARDING FORWARD-LOOKING STATEMENTS
This report contains
"
forward-looking statements
"
within the meaning of Section 27A of the Securities Act of 1933 and Section 21E of the Securities Exchange Act of 1934. The words
"
may,
"
"
will,
"
"
anticipate,
"
"
estimate,
"
"
expect,
"
"
intend,
"
"
plan,
"
"
aim,
"
"
seek,
"
and similar expressions as they relate to us or our management are intended to identify these forward-looking statements. All statements by us regarding our expected financial position, revenues, cash flows and other operating results, business strategy, legal proceedings, and similar matters are forward-looking statements. Our expectations expressed or implied in these forward-looking statements may not turn out to be correct. Our results could be materially different from our expectations because of various risks, including the risks discussed in "Part I — Item 1A — Risk Factors" and in our other periodic and current reports filed with the Securities and Exchange Commission ("SEC"). Any forward-looking statement speaks only as of the date as of which such statement is made, and, except as required by law, we undertake no obligation to update any forward-looking statement after the date as of which such statement was made, whether to reflect changes in circumstances or our expectations, the occurrence of unanticipated events, or otherwise.
3
DELL TECHNOLOGIES INC.
TABLE OF CONTENTS
|
Page
|
||
4
Unless the context indicates otherwise, references in this report to "we," "us," "our," the "Company," and "Dell Technologies" mean Dell Technologies Inc. and its consolidated subsidiaries, references to "Dell" mean Dell Inc. and Dell Inc.'s consolidated subsidiaries, and references to "EMC" mean EMC Corporation and EMC Corporation's consolidated subsidiaries.
Our fiscal year is the 52- or 53-week period ending on the Friday nearest January 31. We refer to our fiscal years ended February 2, 2018, February 3, 2017, and January 29, 2016 as "Fiscal 2018," "Fiscal 2017," and "Fiscal 2016," respectively. Fiscal 2018 and Fiscal 2016 included 52 weeks. Fiscal 2017 included 53 weeks, with the extra week included in the fourth quarter of Fiscal 2017.
Business
Dell Technologies is a strategically aligned family of businesses, poised to become the essential infrastructure company, from the edge to the core to the cloud, as we continue our mission to advance human progress through technology. We seek to accomplish this by executing two, related, high-level strategic initiatives: helping our customers transform their businesses through digital, IT, workforce, and security transformation, while extending our many leading market positions in client solutions and IT infrastructure.
Dell Technologies brings together the entire infrastructure from hardware to software to services. The core of IT is evolving in our hyper-connected world, containing both centralized data centers and geographically distributed hyper-converged infrastructure. Dell Technologies is a leader in the traditional technology of today and a leader in the cloud-native infrastructure of tomorrow. Through our recent combination with EMC, Dell Technologies offers next-generation solutions through our Client Solutions Group, Infrastructure Solutions Group, VMware, Inc. (NYSE: VMW), RSA Information Security ("RSA"), SecureWorks Corp. ("SecureWorks"), Pivotal Software, Inc. ("Pivotal"), Boomi, Inc. ("Boomi"), and Virtustream, Inc. ("Virtustream"). Our solutions enable digital transformation and encompass software-defined data centers, all-flash arrays, hybrid cloud, converged and hyper-converged infrastructure, cloud-native software application development tools, mobile, and security solutions. In addition, we provide important value differentiators through our extended warranty and delivery offerings, and software and peripherals, which are closely tied to the sale of our hardware products.
Dell Technologies is committed to its customers. As we innovate to make our customers' existing IT increasingly productive, we help them reinvest their savings into the next generation of technologies that they need to succeed in the digital economy. We are positioned to help customers of any size and are differentiated by our practical innovation and efficient, simple, and affordable solutions.
During Fiscal 2018, we celebrated the one year anniversary of our historic merger with EMC, and recognize the many accomplishments we have made since the merger. These accomplishments include the broad expansion of our product portfolio, integration of our supply chain, and achievement of revenue synergies across the business. With these accomplishments, we believe we are well-positioned for long-term sustainable growth and innovation. As we continue our integration of the EMC acquired businesses, we remain committed to our customers, supporting them with outstanding solutions, products, and services. We will continue our focus on building superior customer relationships through our direct model and our network of channel partners, which includes value-added resellers, system integrators, distributors, and retailers. We also will continue to balance our efforts to drive cost efficiencies in the business with strategic investments in areas that will enable growth, such as our sales force, marketing, and research and development, as we seek to strengthen our position as a leading global technology company poised for long-term sustainable growth and innovation.
Products and Services
We design, develop, manufacture, market, sell, and support a wide range of products and services. We are organized into the following business units, which are our reportable segments: Client Solutions Group; Infrastructure Solutions Group; and VMware.
|
•
|
Client Solutions Group ("CSG")
— Offerings by CSG include branded hardware, such as personal computers ("PCs"), notebooks, and branded peripherals, such as monitors and projectors, as well as third-party software and peripherals.
|
5
Our computing devices are designed with our commercial and consumer customers' needs in mind, and we seek to optimize performance, reliability, manageability, design, and security. In addition to our traditional PC business, we also have a portfolio of thin client offerings that is well-positioned to benefit from the growth trends in cloud computing. CSG hardware and services also provide the architecture to enable the Internet of Things and connected ecosystems to securely and efficiently capture massive amounts of data for analytics and actionable insights for commercial customers. CSG also offers attached software, peripherals, and services, including support and deployment, configuration, and extended warranty services.
Approximately
50
% of CSG revenue is generated by sales to customers in the Americas, with the remaining portion derived from sales to customers in Europe, the Middle East, and Africa ("EMEA") and in Asia Pacific and Japan ("APJ").
|
•
|
Infrastructure Solutions Group ("ISG")
— EMC's Information Storage segment and our existing Enterprise Solutions Group were combined in Fiscal 2017 to create the Infrastructure Solutions Group. ISG enables the digital transformation of our enterprise customers through our trusted cloud and big data solutions, which are built upon a modern data center infrastructure. The comprehensive portfolio of advanced storage solutions includes traditional storage solutions as well as next-generation storage solutions (including all-flash arrays, scale-out file, object platforms, and software-defined solutions). The server portfolio includes high-performance rack, blade, tower, and hyperscale servers. The networking portfolio helps our business customers transform and modernize their infrastructure, mobilize and enrich end-user experiences, and accelerate business applications and processes. Strengths in core server and storage solutions enable us to offer leading converged and hyper-converged solutions, which allow our customers to accelerate their IT transformation by acquiring scalable integrated IT solutions instead of building and assembling their own IT platforms. ISG also offers attached software, peripherals, and services, including support and deployment, configuration, and extended warranty services.
|
ISG includes Virtustream product and service offerings. Virtustream's cloud software and infrastructure-as-a-service solutions enable customers to migrate, run, and manage mission-critical applications in cloud-based IT environments, and represent a key element of our strategy to help customers support their applications in a variety of cloud native environments. Beginning in the first quarter of Fiscal 2019, we will no longer manage Virtustream within ISG and, as such, will report Virtustream results within other businesses, rather than within ISG. This change in reporting structure will not impact our previously reported consolidated financial results, but our prior period segment results will be recast to reflect the change.
Approximately 50% of ISG revenue is generated by sales to customers in the Americas, with the remaining portion derived from sales to customers in EMEA and APJ.
|
•
|
VMware
— The VMware reportable segment ("VMware") reflects the operations of VMware, Inc. (NYSE: VMW) within Dell Technologies. See Exhibit 99.1 filed with this report for further details on the differences between VMware reportable segment results and VMware, Inc. results.
|
VMware provides compute, cloud, mobility, networking and security infrastructure software to businesses that provides a flexible digital foundation for the applications that empower businesses to serve their customers globally. VMware has continued to broaden its product and solution offerings beyond compute virtualization to include offerings that allow organizations to manage IT resources across private clouds and complex multi-cloud, multi-device environments by leveraging synergies across three categories: software-defined data center; hybrid cloud computing; and end-user computing. VMware's software-defined data center includes the fundamental compute layer for the data center (vSphere); storage and availability to offer cost-effective holistic data storage and protection options (vSAN); network and security (VMware NSX); and cloud management and automation (vRealize) products. VMware currently enables its customers to run, manage, connect, and secure applications across private and public clouds (VMware Cloud). During Fiscal 2018, VMware entered into a strategic alliance with Amazon Web Services ("AWS") to offer an integrated hybrid offering, VMware Cloud on AWS. VMware Cloud on AWS enables customers to run applications across vSphere-based private, public, and hybrid cloud environments. VMware's end-user computing offerings (such as Workspace ONE) enable IT organizations to enhance enterprise security for corporate applications, data, and endpoints for their end users by leveraging VMware's software-defined data center solutions to extend the value of virtualization and management from data centers to devices.
Approximately 50% of VMware revenue is generated by sales to customers in the
United States.
6
Our other businesses, described below, consist of product and service offerings of RSA, SecureWorks, Pivotal, and Boomi. These businesses are not classified as reportable segments, either individually or collectively, as the results of the businesses are not material to our overall results and the businesses do not meet the criteria for reportable segments.
|
•
|
RSA
provides essential cybersecurity solutions engineered to enable organizations to detect, investigate, and respond to advanced attacks, confirm and manage identities, and, ultimately, help reduce IP theft, fraud, and cybercrime.
|
|
•
|
SecureWorks
(NASDAQ: SCWX) is a leading global provider of intelligence-driven information security solutions singularly focused on protecting its clients from cyber attacks.
|
|
•
|
Pivotal
provides a leading cloud-native platform that makes software development and IT operations a strategic advantage for customers. Pivotal's cloud-native platform, Pivotal Cloud Foundry, accelerates and streamlines software development by reducing the complexity of building, deploying and operating new cloud-native applications and modernizing legacy applications. On March 23, 2018, in preparation for an initial public offering of Pivotal's Class A common stock, Pivotal filed a registration statement on Form S-1 with the SEC. No public market currently exists for Pivotal's Class A common stock.
|
|
•
|
Boomi
specializes in cloud-based integration, connecting information between existing on-premise and cloud-based applications to ensure business processes are optimized, data is accurate, and workflow is reliable.
|
See
Note 22
of the
Notes to the Consolidated Financial Statements
included in this report for more information about our other businesses.
For further discussion regarding our current reportable segments, see "Part II — Item 7 —Management's Discussion and Analysis of Financial Condition and Results of Operations — Results of Operations — Business Unit Results."
Dell Financial Services
We also offer or arrange various financing options and services for our customers in North America, Europe, Australia, and New Zealand through Dell Financial Services and its affiliates ("DFS"). DFS services include originating, collecting, and servicing customer receivables primarily related to the purchase of Dell Technologies products and services. The results of these operations are allocated to our segments based on the underlying product or service financed. For additional information about our financing arrangements, see
Note 7
of the
Notes to the Consolidated Financial Statements
included in this report.
Research and Development
We focus on developing scalable technology solutions that incorporate highly desirable features and capabilities at competitive prices. We employ a collaborative approach to product design and development in which our engineers, with direct customer input, design innovative solutions and work with a global network of technology companies to architect new system designs, influence the direction of future development, and integrate new technologies into our products. We manage our research and development ("R&D") spending by targeting those innovations and products that we believe are most valuable to our customers and by relying on the capabilities of our strategic relationships. Through this collaborative, customer-focused approach, we strive to deliver new and relevant products to the market quickly and efficiently. Additionally, from time to time, we make strategic investments in publicly-traded and privately-held companies that develop software, hardware, and other technologies or provide services supporting our technologies.
VMware represents a significant portion of our R&D activities and has assembled an experienced group of developers with systems management, public and private cloud, desktop, digital mobility, security, applications, software-as-a-service, networking, storage, and open source software expertise. VMware also has strong ties to leading academic institutions around the world, and invests in joint research with academia. Product development efforts are prioritized through a combination of engineering-driven innovation and customer- and market-driven feedback.
Dell Technologies has a global R&D presence, with total R&D expenses of
$4.4 billion, $
2.6 billion, and $1.1 billion for Fiscal 2018, Fiscal 2017, and Fiscal 2016, respectively. These investments reflect our commitment to R&D activities that ultimately support our mission: to help our customers build their digital future and to transform IT.
7
Manufacturing and Materials
We own manufacturing facilities located in the United States, Malaysia, China, Brazil, India, Poland, and Ireland. See "Item 2 — Properties" for information about our manufacturing and distribution facilities.
We also utilize contract manufacturers throughout the world to manufacture or assemble our products under the Dell Technologies brand as part of our strategy to enhance our variable cost structure and to achieve our goals of generating cost efficiencies, delivering products faster, better serving our customers, and building a world-class supply chain.
Our manufacturing process consists of assembly, software installation, functional testing, and quality control. We conduct operations utilizing a formal, documented quality management system to ensure that our products and services satisfy customer needs and expectations. Testing and quality control are also applied to components, parts, sub-assemblies, and systems obtained from third-party suppliers.
Our quality management system is maintained through the testing of components, sub-assemblies, software, and systems at various stages in the manufacturing process. Quality control procedures also include a burn-in period for completed units after assembly, ongoing production reliability audits, failure tracking for early identification of production and component problems, and information from customers obtained through services and support programs. This system is certified to the ISO 9001 International Standard that includes most of our global sites that design, manufacture, and service our products.
Our order fulfillment, manufacturing, and test facilities in Massachusetts, North Carolina, and Ireland are certified to the ISO 14001 International Standard for environmental management systems and also have achieved OHSAS 18001 certification, an international standard for facilities with world-class safety and health management systems. These internationally-recognized endorsements of ongoing quality and environmental management are among the highest levels of certifications available. We also have implemented Lean Six Sigma methodologies to ensure that the quality of our designs, manufacturing, test processes, and supplier relationships are continually improved.
We maintain a robust Supplier Code of Conduct, actively manage recycling processes for our returned products, and are certified by the Environmental Protection Agency as a Smartway Transport Partner.
We purchase materials, supplies, product components, and products from a large number of qualified suppliers. In some cases, where multiple sources of supply are not available, we rely on single-source or a limited number of sources of supply if we believe it is advantageous to do so because of performance, quality, support, delivery, capacity, or price considerations. We believe that any disruption that may occur because of our dependence on single- or limited-source vendors would not disproportionately disadvantage us relative to our competitors. See "Item 1A — Risk Factors — Risk Factors Relating to Our Business — Reliance on vendors for products and components, many of which are single-source or limited-source suppliers, could harm Dell Technologies' business by adversely affecting product availability, delivery, reliability, and cost" for information about the risks associated with Dell Technologies' use of single- or limited-source suppliers.
Geographic Operations
Our global corporate headquarters is located in Round Rock, Texas. We have operations and conduct business in many countries located in the Americas, Europe, the Middle East, Asia, and other geographic regions. To increase our global presence, we continue to focus on emerging markets outside of the United States, Western Europe, Canada, and Japan. We continue to view these geographical markets, which include the vast majority of the world's population, as a long-term growth opportunity. Accordingly, we pursue the development of technology solutions that meet the needs of these markets. Our expansion in emerging markets creates additional complexity in coordinating the design, development, procurement, manufacturing, distribution, and support of our product and services offerings. For information about the amount of net revenue we generated from our operations outside of the United States during the last three fiscal years, see
Note 22
of the Notes to the Consolidated Financial Statements included in this report.
8
Competition
We operate in an industry in which there are rapid technological advances in hardware, software, and services offerings. We face ongoing product and price competition in all areas of our business, including from both branded and generic competitors. We compete based on our ability to offer customers competitive, scalable, and integrated solutions that provide the most current and desired product and services features at a competitive price. We closely monitor market pricing and solutions trends, including the effect of foreign exchange rate movements, in an effort to provide the best value for our customers. We believe that our strong relationships with our customers and channel partners allow us to respond quickly to changing customer needs and other macroeconomic factors.
The markets in which we compete are highly competitive and are comprised of large and small companies across all areas of our business. We believe that new businesses will continue to enter these markets and develop technologies that, if commercialized, may compete with our products and services. Moreover, current competitors may enter into new strategic relationships with new or existing competitors, which may further increase the competitive pressures. See "Item 1A — Risk Factors" for information about our competitive risks.
Sales and Marketing
We operate a diversified business model with the majority of our revenue and operating income derived from commercial clients that consist of large enterprises, small and medium-sized businesses, and public sector customers. We sell products and services directly to customers and through other sales channels, such as value-added resellers, system integrators, distributors, and retailers. During Fiscal 2018, our other sales channels contributed approximately
50% of our net revenue.
Our customers include large global and national corporate businesses, public institutions that include government, educational institutions, healthc
are organizations, and law enforcement agencies, small and medium-sized businesses, and consumers. Our sales efforts are organized around the evolving needs of our customers, and our marketing initiatives reflect this focus. We believe that our unified global sales and marketing team creates a sales organization that is more customer-focused, collaborative, and innovative. Our go-to-market strategy includes a direct business model, as well as channel distribution. Our direct business model emphasizes direct communication with customers, thereby allowing us to refine our products and marketing programs for specific customers groups, and we continue to pursue this strategy. In addition to our direct business model, we rely on a network of channel partners to sell our products and services, enabling us to efficiently serve a greater number of customers.
We market our products and services to small and medium-sized businesses and consumers through various advertising media. To react quickly to our customers' needs, we track our Net Promoter Score, a customer loyalty metric that is widely used across various industries. Increasingly, we also engage with customers through our social media communities on
www.delltechnologies.com
and in external social media channels.
For large business and institutional customers, we maintain a field sales force throughout the world. Dedicated account teams, which include technical sales specialists, form long-term relationships to provide our largest customers with a single source of assistance, develop tailored solutions for these customers, position the capabilities of Dell Technologies, and provide us with customer feedback. For these customers, we offer several programs designed to provide single points of contact and accountability with dedicated account managers, special pricing, and consistent service and support programs. We also maintain specific sales and marketing programs targeting federal, state, and local governmental agencies, as well as healthcare and educational customers.
Patents, Trademarks, and Licenses
As of
February 2, 2018
, we held a worldwide portfolio of 16,563 patents and had an additional 11,774 patent applications pending. Of those amounts, VMware, Inc. owned 2,183 patents and had an additional 2,763 patent applications pending. We also hold licenses to use numerous third-party patents. To replace expiring patents, we obtain new patents through our ongoing research and development activities. The inventions claimed in our patents and patent applications cover aspects of our current and possible future computer system products, manufacturing processes, and related technologies. Our product, business method, and manufacturing process patents may establish barriers to entry in many product lines. Although we use our patented inventions and also license them to others, we are not substantially dependent on any single patent or group of related patents. We have entered into a variety of intellectual property licensing and cross-licensing agreements and software licensing agreements with other companies. We anticipate that our worldwide patent portfolio will continue to be of value in negotiating intellectual property rights with others in the industry.
9
We have obtained U.S. federal trademark registration for the Dell word mark and logo mark and the VMware word and logo mark. We have pending applications to register Dell EMC word marks.
As of
February 2, 2018
, we owned registrations for 336 of our other trademarks in the United States and had pending applications for registration of 64 other trademarks. We believe that the DELL, Dell EMC, and VMware word marks and logo marks in the United States are material to our operations. As of
February 2, 2018
, we also had applied for, or obtained registration of, the DELL word mark and several other marks in approximately 184 other co
untries.
From time to time, other companies and individuals assert exclusive patent, copyright, trademark, or other intellectual property rights to technologies or marks that are alleged to be relevant to the technology industry or our business. We evaluate each claim relating to our products and, if appropriate, seek a license to use the protected technology. The licensing agreements generally do not require the licensor to assist us in duplicating the licensor's patented technology, nor do the agreements protect us from trade secret, copyright, or other violations by us or our suppliers in developing or selling the licensed products.
Unless otherwise noted, trademarks appearing in this report are owned by us. We disclaim proprietary interest in the marks and names of others. Net Promoter Score is a trademark of Satmetrix Systems, Inc., Bain & Company, Inc., and Fred Reichheld.
Government Regulation and Sustainability
Government Regulation
— Our business is subject to regulation by various U.S. federal and state governmental agencies and other governmental agencies. Such regulation includes the activities of the U.S. Federal Communications Commission; the anti-trust regulatory activities of the U.S. Federal Trade Commission, the U.S. Department of Justice, and the European Union; the consumer protection laws and financial services regulation of the U.S. Federal Trade Commission and various state governmental agencies; the export regulatory activities of the U.S. Department of Commerce and the U.S. Department of the Treasury; the import regulatory activities of the U.S. Customs and Border Protection; the product safety regulatory activities of the U.S. Consumer Product Safety Commission and the U.S. Department of Transportation; the health information privacy and security requirements of the U.S. Department of Health and Human Services; and the environmental, employment and labor, and other regulatory activities of a variety of governmental authorities in each of the countries in which we conduct business. We were not assessed any material environmental fines, nor did we have any material environmental remediation or other environmental costs, during Fiscal 2018.
Our Philosophy on Sustainability: Building a Legacy of Good
— One of the core tenets of Dell Technologies is the belief that technology should drive human progress. We remain committed to putting our technology and expertise to work where it can do the most good for people and our planet. This commitment is intimately tied to our business goals of driving growth, helping mitigate risk, and ensuring business opportunities by building our brand. Based on the idea that we all win when we create shared value, we created the Legacy of Good plan to build on the strengths throughout our value chain to create social, environmental, and economic value by uniting our purpose with our business objectives. The plan features 22 bold goals for the year 2020 across the material areas of our business, ultimately setting the agenda for building a better future where everyone can reach their full potential while sharing in and supporting the common good.
The following are key areas of focus in our Legacy of Good plan:
Creating Net Positive Outcomes
— Creating net positive outcomes means putting back more into society, the environment, and the global economy than we take out. In particular, we focus on helping customers harness the power of technology to deliver better social and environmental outcomes.
Energy Efficiency
— We have set a goal to reduce the energy intensity of our entire product portfolio by 80% by 2020.
Technology Take-back, Reuse, and Recycling
— We begin thinking about recycling at the design phase, asking our product engineers to work with recyclers to understand how to make products easy to repair or disassemble for recycling. When our products reach the end of their life cycles, we make it easy for customers to recycle their obsolete electronic equipment.
Circular Economy and Design for the Environment
— Recycling, reuse, and closed-loop manufacturing form the bedrock of the circular economy, ensuring that materials already in circulation stay in the economy instead of exiting as waste. Within our own operations, we look at how materials can be used, or reused, in ways that extend their value.
Reducing Our Footprint, Caring for Our Planet
— We are focused on reducing the impact of our operations on the environment. Our teams examine practices and processes throughout our facilities to identify other opportunities for greater
10
efficiency. Many of our locations purchase some or all of their electricity from renewable sources and many of our manufacturing facilities are approaching zero waste to landfill.
Further, Dell is committed to maintaining the vitality of our oceans with our work concerning ocean-bound plastics used in our supply chain. We have made a pledge to the United Nations to increase our annual use of ocean plastics by 10 times by 2025 and to help build further demand by convening a working group with other manufacturers to create an open-source ocean plastics supply chain. To that end, during Fiscal 2018, we partnered to bring together a cross-industry consortium of global companies that also are committed to scaling the use of ocean-bound plastics.
Social and Environmental Responsibility ("SER") in the Supply Chain
— We are committed to responsible business practices and hold ourselves and our suppliers to a high standard of excellence. We work in partnership with our suppliers to reduce risks that could lead to harm of workers, production suspensions, factory shut-downs, or environmental damage. All of our suppliers must agree to our global supplier principles and accept the Electronic Industry Citizenship Coalition Code of Conduct. Additionally, we are committed to a conflict-free mineral supply chain.
Youth Learning
— Technology skills are critical to continued innovation and can have a profound effect on our businesses, communities, and sustainability. We have a strong commitment to Science, Technology, Engineering, and Math ("STEM") and other youth learning activities, providing funding, volunteer time, and technology to underserved populations.
Partnering with TGen on Technology for Good
— Together with the Translational Genomics Research Institute ("TGen"), we are changing the paradigm in the treatment of childhood cancers. We developed the Genomic Data Analysis Platform — a complete high-performance computing infrastructure solution uniquely designed to meet the needs of genomic data collection and analysis. Over the past six years, we have increased computational capacity over three times, and increased storage speeds and capacity to over four times that of the original systems, thereby reducing the time it takes to sequence a genome from multiple weeks to just six hours.
The Fiscal 2017 Corporate Social Responsibility Report is available at
www.dell.com/crreport
, and the Fiscal 2018 report is expected to be available in June 2018. The VMware Fiscal 2017 Global Impact Report is available at
www.vmware.com/company/sustainability
, and the Fiscal 2018 report is expected to be available in September 2018.
Product Backlog
We believe that product backlog is not a meaningful indicator of net revenue that can be expected for any period. Our business model generally gives us flexibility to manage product backlog at any point in time by expediting shipping or prioritizing customer orders toward products that have shorter lead times, thereby reducing product backlog and increasing current period revenue. Moreover, product backlog at any point in time may not result in the generation of any predictable amount of net revenue in any subsequent period, as unfilled orders can generally be canceled at any time by the customer. Product backlog at any point in time may not result in the generation of any predictable amount of net revenue in any subsequent period.
Employees
At the end of Fiscal 2018, we had approximately
145,000
total full-time employees, approximately
22,000
of whom were employees of VMware, Inc. In comparison, at the end of Fiscal 2017, we had approximately 138,000 total full-time employees, approximately 20,000 of whom were employees of VMware, Inc. At the end of Fiscal 2018, approximately
39%
of our full-time employees were located in the United States and approximately
61%
were located in other countries.
Corporate Information
We are a holding company that conducts our operations through subsidiaries.
We were incorporated in the state of Delaware on January 31, 2013 under the name Denali Holding Inc. in connection with Dell's going-private transaction, which was completed in October 2013. We changed our name to Dell Technologies Inc. on August 25, 2016. The mailing address of our principal executive offices is One Dell Way, Round Rock, Texas 78682. Our telephone number is 1-800-289-3355.
11
Our website address is
www.delltechnologies.com
. We make available free of charge through our website our annual reports on Form 10-K, quarterly reports on Form 10-Q, and current reports on Form 8-K, and all amendments to those reports, as soon as reasonably practicable after we electronically file or furnish reports with the Securities and Exchange Commission ("SEC"). The contents of our website are not a part of this annual report on Form 10-K.
DHI Group and Class V Group
Dell Technologies has two groups of common stock, denoted as the DHI Group Common Stock and the Class V Common Stock. The DHI Group Common Stock consists of four classes of common stock, referred to as Class A Common Stock, Class B Common Stock, Class C Common Stock, and Class D Common Stock. The DHI Group generally refers to the direct and indirect interest of Dell Technologies in all of Dell Technologies' business, assets, properties, liabilities, and preferred stock other than those attributable to the Class V Group, as well as the DHI Group's retained interest in the Class V Group equal to approximately
39%
of Dell Technologies' economic interest in the Class V Group as of
February 2, 2018
. The Class V Common Stock is intended to track the economic performance of approximately
61%
of Dell Technologies' economic interest in the Class V Group as of such date. The Class V Group consists solely of VMware, Inc. common stock held by Dell Technologies. As of
February 2, 2018
, the Class V Group consisted of approximately
331 million
shares of VMware, Inc. common stock. See
Note 18
of the Notes to the Consolidated Financial Statements included in this report and Exhibit 99.1 filed with this report for more information regarding the allocation of earnings from Dell Technologies' interest in VMware between the DHI Group and the Class V Common Stock.
Executive Officers of Dell Technologies
The following table sets forth, as of
March 29, 2018
, information about our executive officers, who are appointed by our board of directors.
|
Name
|
Age
|
Position
|
||
|
Michael S. Dell
|
53
|
Chief Executive Officer
|
||
|
Jeremy Burton
|
50
|
Chief Marketing Officer
|
||
|
Jeffrey W. Clarke
|
55
|
Vice Chairman, Products and Operations
|
||
|
Howard D. Elias
|
60
|
President, Dell Services, Digital and IT
|
||
|
Marius Haas
|
50
|
President and Chief Commercial Officer
|
||
|
Steven H. Price
|
56
|
Chief Human Resources Officer
|
||
|
Karen H. Quintos
|
54
|
Chief Customer Officer
|
||
|
Rory Read
|
56
|
Chief Operating Executive and Chief Integration Officer, Dell
|
||
|
Richard J. Rothberg
|
54
|
General Counsel
|
||
|
William F. Scannell
|
55
|
President, Global Enterprise Sales and Customer Operations, Dell EMC
|
||
|
Thomas W. Sweet
|
58
|
Chief Financial Officer
|
||
Michael S. Dell
— Mr. Dell serves as Chairman of the Board and Chief Executive Officer of Dell Technologies. Mr. Dell has held the title of Chairman of the Board of Dell Inc. since he founded the company in 1984. Mr. Dell also served as Chief Executive Officer of Dell Inc. from 1984 until July 2004 and resumed that role in January 2007. In 1998, Mr. Dell formed MSD Capital for the purpose of managing his and his family's investments, and, in 1999, he and his wife established the Michael & Susan Dell Foundation to provide philanthropic support to a variety of global causes. He is an honorary member of the Foundation Board of the World Economic Forum and is an executive committee member of the International Business Council. He serves as a member of the Technology CEO Council and is a member of the U.S. Business Council and the Business Roundtable. He also serves on the governing board of the Indian School of Business in Hyderabad, India, and is a board member of Catalyst, Inc., a non-profit organization that promotes inclusive workplaces for women. In June 2014, Mr. Dell was named the United Nations foundation's first Global Advocate for Entrepreneurship.
Jeremy Burton
— Mr. Burton serves as the Chief Marketing Officer of Dell Technologies, directly responsible for the global marketing structure, strategy, and all aspects of the company's enterprise marketing efforts, including brand, communications, digital, and field and channel marketing. In addition to his marketing responsibilities, Mr. Burton leads Corporate Development, with responsibility for mergers and acquisitions and venture capital investment activity. Mr. Burton served as EMC's President, Products and Marketing from March 2014 until EMC's acquisition by Dell Technologies. He was EMC's Executive Vice President, Product Operations and Marketing from July 2012 to March 2014. In these roles, Mr. Burton
12
was responsible for product divisions within EMC's Information Infrastructure business, including product strategy, research and development, operations, CTO office, global alliances, and global marketing. Mr. Burton joined EMC in March 2010 as Executive Vice President and Chief Marketing Officer. Prior to joining EMC, Mr. Burton held several senior leadership roles, including serving as President and Chief Executive Officer of Serena Software, Inc., a global independent software company, and as Group President of the Security and Data Management Business Unit of Symantec Corporation, a provider of security, storage, and systems management solutions. Prior to joining Symantec, he served as Executive Vice President of the Data Management Group and as Chief Marketing Officer at VERITAS Software Corporation (now a part of Symantec). Earlier in his career, Mr. Burton spent nearly a decade at Oracle Corporation, a large enterprise software company, ultimately in the role of Senior Vice President of Product and Services Marketing. For more information, see "Part II — Item 9B — Other Information" included in this report.
Jeffrey W. Clarke
— Mr. Clarke serves as Vice Chairman, Products and Operations of Dell Technologies, responsible for Dell Technologies' global supply chain, and leads its product organizations: Infrastructure Solutions Group and Client Solutions Group. Mr. Clarke has served as Vice Chairman, Products and Operations since September 2017, before which he served as Vice Chairman and President, Operations and Client Solutions with Dell Technologies and, previously, Dell, since January 2009. In these roles, Mr. Clarke has been responsible for global manufacturing, procurement, and supply chain activities worldwide, as well as the engineering, design, and development of desktop PCs, notebooks, and workstations for customers ranging from consumers and small and medium-sized businesses to large corporate enterprises. In addition, Mr. Clarke currently leads customer support, sales operations, commerce services functions, and IT planning and governance globally for Dell. From January 2003 until January 2009, Mr. Clarke served as Senior Vice President, Business Product Group. From November 2001 to January 2003, Mr. Clarke served as Vice President and General Manager, Relationship Product Group. In 1995, Mr. Clarke became the director of desktop development. Mr. Clarke joined Dell in 1987 as a quality engineer and has served in a variety of other engineering and management roles.
Howard D. Elias
— Mr. Elias serves as President, Dell Services, Digital and IT of Dell Technologies, supporting customers across the Client Solutions and Infrastructure Solutions Groups. Mr. Elias oversees technology and deployment services, consulting services, global support services, education services, global Centers of Excellence, and the IT organization. Mr. Elias previously served as President and Chief Operating Officer, EMC Global Enterprise Services from January 2013 until EMC's acquisition by Dell Technologies, and was President and Chief Operating Officer, EMC Information Infrastructure and Cloud Services from September 2009 to January 2013. In these roles, Mr. Elias was responsible for setting the strategy, driving the execution, and creating the best practices for services that enabled the digital transformation and data center modernization of EMC's customers. Mr. Elias also had responsibility at EMC for leading the integration of the Dell and EMC businesses, including overseeing the cross-functional teams that drove all facets of integration planning. Previously, Mr. Elias was EMC's Executive Vice President, Global Marketing and Corporate Development, responsible for all marketing, sales enablement, technology alliances, corporate development, and new ventures. Mr. Elias was also a co-founder and served on the board of managers for the Virtual Computing Environment Company, now part of Dell Technologies' converged platform division. Prior to joining EMC, Mr. Elias served in various capacities at Hewlett-Packard Company, a provider of information technology products, services, and solutions for enterprise customers, most recently as Senior Vice President of Business Management and Operations for the Enterprise Systems Group. Mr. Elias is a director of TEGNA Inc., a media and digital business company.
Marius Haas
— Mr. Haas serves as President and Chief Commercial Officer of Dell Technologies, responsible for the global go-to-market organization, delivering innovative and practical solutions to commercial customers. In this role, Mr. Haas also has responsibility for Dell channel partners, as well as for public and federal customers worldwide. Mr. Haas previously served as Dell's Chief Commercial Officer and President, Enterprise Solutions from 2012 to September 2016, where he was responsible for strategy, development, and deployment of all data center and cloud solutions globally. Mr. Haas came to Dell in 2012 from Kohlberg Kravis Roberts & Co. L.P., a global investment firm, where he was responsible for identifying and pursuing new investments, while supporting existing portfolio companies with operational expertise. Before his service in that role, Mr. Haas served at Hewlett-Packard Company's Networking Division as Senior Vice President and Worldwide General Manager from 2008 to
2011 and as Chief of Staff to the CEO and Senior Vice President of Strategy and Corporate Development from 2003 to
2008. He has previously served as a member of McKinsey & Company CSO Council, the Ernst & Young Corporate Development Leadership Network, the board of directors for Airtight Networks, and the board of directors of the Association of Strategic Alliance Professionals. Mr. Haas currently serves on the board of directors of the US-China Business Council.
Steven H. Price
— Mr. Price serves as Dell Technologies' Chief Human Resources Officer, leading both human resources and global facilities functions. In this role, Mr. Price is responsible for overall human resources strategy in support of the purpose, values, and business initiatives of Dell Technologies. He is also responsible for addressing the culture, leadership, talent, and performance challenges of the company. Mr. Price previously served as Dell's Senior Vice President, Human
13
Resources from June 2010 to September 2016. Mr. Price joined Dell in February 1997 and has served in many key leadership roles throughout the HR organization, including Vice President of HR Operations, Global Talent Management, Vice President of HR for the global Consumer business, Vice President of HR Americas, and Vice President of HR EMEA. Prior to joining Dell in 1997, Mr. Price spent 13 years with SC Johnson Wax, a producer of consumer products based in Racine, Wisconsin. Having started his career there in sales, he later moved into human resources, where he held a variety of senior positions. Mr. Price also is the executive sponsor for the Slack Employee Resource Group at Dell Technologies.
Karen H. Quintos
— Ms. Quintos serves as Chief Customer Officer of Dell Technologies, where she leads a global organization solely devoted to customer advocacy, and is responsible for setting and executing a total customer experience strategy. Ms. Quintos also leads the Diversity and Inclusion and Corporate Responsibility business imperatives, which encompass social responsibility, entrepreneurship, and diversity. Ms. Quintos previously served as Senior Vice President and Chief Marketing Officer ("CMO") for Dell from September 2010 to September 2016, where she led marketing for Dell's global commercial business, brand strategy, global communications, social media, corporate responsibility, customer insights, marketing talent development, and agency management. Before becoming CMO, Ms. Quintos served as Vice President of Dell's global public business, from January 2008 to September 2010, and she also held various executive roles in marketing and in Dell's Services and Supply Chain Management teams since joining Dell in 2000. Ms. Quintos came to Dell from Citigroup, Inc., an investment banking and financial services company, where she served as Vice President of Global Operations and Technology. She also spent 12 years with Merck & Co., a manufacturer and distributor of pharmaceuticals, where she held a variety of marketing, operations, and supply chain leadership positions. She has served on multiple boards of directors and currently serves on the boards of Lennox International, the Susan G. Komen for the Cure, and Penn State's Smeal Business School. Ms. Quintos also is founder and executive sponsor of Dell's Wise employee resource group.
Rory Read
— Mr. Read serves as Chief Operating Executive and Chief Integration Officer, Dell. Mr. Read has served in his present role since October 2015, and is responsible for leading the integration of the Dell and EMC businesses. From March 2015 to October 2015, Mr. Read served as Chief Operating Officer and President of Worldwide Commercial Sales for Dell, where he was responsible for cross-business unit and country-level operational planning, building and leading Dell's best-in-class sales engine, and overseeing the strategy for the company's global channel team, system integrator partners, and direct sales force. Prior to joining Dell in March 2015, Mr. Read served as President and Chief Executive Officer at Advanced Micro Devices, Inc., a technology company, from August 2011 to October 2014, where he also served as a member of the board of directors. Before that service, he spent over five years as President and Chief Operating Officer at Lenovo Group Ltd., a computer technology company, where he was responsible for driving growth, execution, profitability, and performance across an enterprise encompassing more than 160 countries. Mr. Read also spent 23 years at International Business Machines Corporation ("IBM"), a technology and consulting company, serving in various leadership roles in the Asia-Pacific region and globally.
Richard J. Rothberg
— Mr. Rothberg serves as General Counsel and Secretary for Dell Technologies. In this role, in which he has served since November 2013, Mr. Rothberg oversees the global legal department and manages government affairs, compliance, and ethics. He is also responsible for global security. Mr. Rothberg joined Dell in 1999 and has served in critical leadership roles throughout the legal department. He served as Vice President of Legal, supporting Dell's businesses in the Europe, Middle East, and Africa region before moving to Singapore in 2008 as Vice President of Legal for the Asia-Pacific and Japan region. Mr. Rothberg returned to the United States in 2010 to serve as Vice President of Legal for the North America and Latin America regions. In this role, he was lead counsel for sales and operations in the Americas and for the enterprise solutions, software, and end-user computing business units. He also led the government affairs organization worldwide. Prior to joining Dell, Mr. Rothberg spent nearly eight years in senior legal roles at Caterpillar Inc., an equipment manufacturing company, in senior legal roles in Nashville, Tennessee and Geneva, Switzerland. Mr. Rothberg was also an attorney for IBM Credit Corporation and at Rogers & Wells, a law firm.
William F. Scannell
— Mr. Scannell serves as President, Global Enterprise Sales and Customer Operations, Dell EMC, leading the global go-to-market organization serving enterprise customers. In this role, in which he has served since September 2017, Mr. Scannell leads the Dell EMC sales teams to deliver technology solutions to large enterprises and public institutions worldwide. He is responsible for driving global growth and continued market leadership by delivering and supporting enterprise products, services, and solutions to organizations in established and new markets around the world. Previously, Mr. Scannell served as President, Global Sales and Customer Operations at EMC Corporation. In this role, to which he was appointed in July 2012, Mr. Scannell focused on driving coordination and teamwork among EMC's business unit sales forces, as well as building and maintaining relationships with EMC's largest global accounts, global alliance partners, and global channel partners. Mr. Scannell began his career as an EMC sales representative in 1986, becoming country manager of Canada in 1988. Shortly thereafter, his responsibilities expanded to include the United States and Latin America. In 1999, Mr. Scannell
14
moved to London to oversee EMC's business across all of Europe, Middle East and Africa. He then managed worldwide sales in 2001 and 2002 before being appointed Executive Vice President in 2007.
Thomas W. Sweet
— Mr. Sweet serves as Chief Financial Officer of Dell Technologies. In this role, in which he has served since January 2014, he is responsible for all aspects of the company's finance function, including accounting, financial planning and analysis, tax, treasury, investor relations, and corporate strategy. From May 2007 to January 2014, Mr. Sweet served in a variety of finance leadership roles for Dell, including as Vice President of Corporate Finance, Controller, and Chief Accounting Officer with responsibility for global accounting, tax, treasury, and investor relations, as well as for global finance services. Mr. Sweet was responsible for external financial reporting for more than five years when Dell Inc. was a publicly-traded company. Prior to his service in those roles, Mr. Sweet served in a variety of finance leadership positions, including as Vice President responsible for overall finance activities within the corporate business, education, government, and healthcare business units of Dell. Mr. Sweet also has served as Vice President of internal audit and in a number of sales leadership roles in education and corporate business units since joining Dell in 1997.
15
Our business, operating results, financial condition, and prospects are subject to a variety of significant risks, many of which are beyond our control. The following is a description of some of the important risk factors that may cause our actual results in future periods to differ substantially from those we currently expect or seek. The risks described below are not the only risks facing us. There are additional risks and uncertainties not currently known to us or that we currently deem to be immaterial that also may materially adversely affect our business, operating results, financial condition, or prospects.
Risk Factors Relating to Our Business
Competitive pressures may adversely affect Dell Technologies' industry unit share position, revenue, and profitability.
Dell Technologies operates in an industry in which there are rapid technological advances in hardware, software, and services offerings. As a result, Dell Technologies faces aggressive product and price competition from both branded and generic competitors. Dell Technologies competes based on its ability to offer to its customers competitive integrated solutions that provide the most current and desired product and services features. There is a risk that Dell Technologies' competitors may provide products that are less costly, perform better or include additional features that are not available with Dell Technologies' products. There also is a risk that Dell Technologies' product portfolios may quickly become outdated or that Dell Technologies' market share may quickly erode. Further, efforts to balance the mix of products and services in order to optimize profitability, liquidity, and growth may put pressure on Dell Technologies' industry position.
As the technology industry continues to expand globally, there may be new and increased competition in different geographic regions. The generally low barriers to entry in the technology industry increase the potential for challenges from new industry competitors. There also may be increased competition from new types of products as the options for mobile and cloud computing solutions increase. In addition, companies with which Dell Technologies has strategic alliances may become competitors in other product areas or current competitors may enter into new strategic relationships with new or existing competitors, all of which may further increase the competitive pressures on Dell Technologies.
Reliance on vendors for products and components, many of which are single-source or limited-source suppliers, could harm Dell Technologies' business by adversely affecting product availability, delivery, reliability, and cost.
Dell Technologies maintains several single-source or limited-source supplier relationships, including relationships with third-party software providers, either because multiple sources are not readily available or because the relationships are advantageous due to performance, quality, support, delivery, capacity, or price considerations. A delay in the supply of a critical single- or limited-source product or component may prevent the timely shipment of the related product in desired quantities or configurations. In addition, Dell Technologies may not be able to replace the functionality provided by third-party software currently offered with its products if that software becomes obsolete, defective, or incompatible with future product versions or is not adequately maintained or updated. Even where multiple sources of supply are available, qualification of the alternative suppliers and establishment of reliable supplies could result in delays and a possible loss of sales, which could harm Dell Technologies' operating results.
Dell Technologies obtains many of its products and all of its components from third-party vendors, many of which are located outside of the United States. In addition, significant portions of Dell Technologies' products are assembled by contract manufacturers, primarily in various locations in Asia. A significant concentration of such outsourced manufacturing is currently performed by only a few of Dell Technologies' contract manufacturers, often in single locations. Dell Technologies sells components to these contract manufacturers and generates large non-trade accounts receivables, an arrangement that would present a risk of uncollectibility if the financial condition of a contract manufacturer should deteriorate.
Although these relationships generate cost efficiencies, they limit Dell Technologies' direct control over production. The increasing reliance on vendors subjects Dell Technologies to a greater risk of shortages and reduced control over delivery schedules of components and products, as well as a greater risk of increases in product and component costs. Because Dell Technologies maintains minimal levels of component and product inventories, a disruption in component or product availability could harm Dell Technologies' ability to satisfy customer needs. In addition, defective parts and products from these vendors could reduce product reliability and harm Dell Technologies' reputation.
16
If Dell Technologies fails to achieve favorable pricing from vendors, its profitability could be adversely affected.
Dell Technologies' profitability is affected by its ability to achieve favorable pricing from vendors and contract manufacturers, including through negotiations for vendor rebates, marketing funds, and other vendor funding received in the normal course of business. Because these supplier negotiations are continuous and reflect the evolving competitive environment, the variability in timing and amount of incremental vendor discounts and rebates can affect Dell Technologies' profitability. The vendor programs may change periodically, potentially resulting in adverse profitability trends if Dell Technologies cannot adjust pricing or variable costs. An inability to establish a cost and product advantage, or determine alternative means to deliver value to customers, may adversely affect Dell Technologies' revenue and profitability.
Adverse global economic conditions and instability in financial markets may harm Dell Technologies' business and result in reduced net revenue and profitability.
As a global company with customers operating in a broad range of businesses and industries, Dell Technologies' performance is affected by global economic conditions. Adverse economic conditions may negatively affect customer demand for Dell Technologies' products and services. Such economic conditions could result in postponed or decreased spending amid customer concerns over unemployment, reduced asset values, volatile energy costs, geopolitical issues, the availability and cost of credit, and the stability and solvency of financial institutions, financial markets, businesses, local and state governments, and sovereign nations. Weak global economic conditions also could harm Dell Technologies' business by contributing to product shortages or delays, insolvency of key suppliers, customer and counterparty insolvencies, and increased challenges in managing Dell Technologies' treasury operations. Any such effects could have a negative impact on Dell Technologies' net revenue and profitability.
Dell Technologies' results of operations may be adversely affected if it fails to successfully execute its growth strategy.
Dell Technologies' growth strategy involves reaching more customers through direct sales, new distribution channels, expanding relationships with resellers, and augmenting select business areas through targeted acquisitions and other commercial arrangements. As more customers are reached through new distribution channels and expanded reseller relationships, Dell Technologies may fail to manage effectively the increasingly difficult tasks of inventory management and demand forecasting. The ability to implement this growth strategy depends on a successful transitioning of sales capabilities, the successful addition to the breadth of Dell Technologies' solutions capabilities through selective acquisitions of other businesses, and the effective management of the consequences of these strategic initiatives. If Dell Technologies is unable to meet these challenges, its results of operations could be adversely affected.
Dell Technologies faces risks and challenges in connection with its transformation to an essential infrastructure solutions provider and its business strategy.
Dell Technologies expects its strategic transformation to an essential infrastructure solutions provider to take more time and investment, and the investments it must make are likely to result in lower gross margins and raise its operating expenses and capital expenditures.
For Fiscal 2018, Dell Technologies' Client Solutions business generated approximately 50% of Dell Technologies' net revenue, and largely relied on PC sales. Revenue from Client Solutions absorbs Dell Technologies' significant overhead costs and allows for scaled procurement. As a result, Client Solutions remains an important component in Dell Technologies' broad transformation strategy. While Dell Technologies continues to rely on Client Solutions as a critical element of its business, Dell Technologies also anticipates an increasingly challenging demand environment in Client Solutions and intensifying market competition. Current challenges in Client Solutions stem from fundamental changes in the PC market, including a decline in worldwide revenues for desktop and laptop PCs, and lower shipment forecasts for PC products due to a general lengthening of the replacement cycle for PC products and increasing interest in alternative mobile solutions. PC shipments worldwide declined during calendar year 2017, and further deterioration in the PC market may occur. Other challenges include declining margins as demand for PC products shifts from higher-margin premium products to lower-cost and lower-margin products, particularly in emerging markets, and significant and increasing competition from efficient and low-cost manufacturers and from manufacturers of innovative and higher-margin PC products.
The challenges Dell Technologies faces in its transformation include low operating margins for the Infrastructure Solutions Group, referred to as ISG, and, although Client Solutions drives pull-through revenue and cross-selling of ISG solutions, the potential for further margin erosion remains due to intense competition, including emerging competitive pressure from cloud services. Improving the integration of Dell Technologies' product and service offerings as well as its ability to cross-sell remain
17
a work in progress, as Dell Technologies is in the early stages of integrating its products into solutions and thus far has limited overlap in the base of large customers for the Client Solutions business and the ISG business. In addition, returns from Dell Technologies' prior acquisitions have been mixed and will require additional investments to reposition the business for growth, while cross-selling synergies have not been achieved as anticipated. As a result of the foregoing challenges, Dell Technologies' business, financial condition, and results of operations may be adversely affected.
Dell Technologies may not successfully implement its acquisition strategy, which could result in unforeseen operating difficulties and increased costs.
Dell Technologies makes strategic acquisitions of other companies as part of its growth strategy. Dell Technologies could experience unforeseen operating difficulties in assimilating or integrating the businesses, technologies, services, products, personnel, or operations of acquired companies, especially if Dell Technologies is unable to retain the key personnel of an acquired company. Further, future acquisitions may result in a delay or reduction of sales for both Dell Technologies and the acquired company because of customer uncertainty about the continuity and effectiveness of solutions offered by either company and may disrupt Dell Technologies' existing business by diverting resources and significant management attention that otherwise would be focused on development of the existing business. Acquisitions also may negatively affect Dell Technologies' relationships with strategic partners if the acquisitions are seen as bringing Dell Technologies into competition with such partners.
To complete an acquisition, Dell Technologies may be required to use substantial amounts of cash, engage in equity or debt financings, or enter into credit agreements to secure additional funds. Such debt financings could involve restrictive covenants that might limit Dell Technologies' capital-raising activities and operating flexibility. Further, an acquisition may negatively affect Dell Technologies' results of operations because it may expose Dell Technologies to unexpected liabilities, require the incurrence of charges and substantial indebtedness or other liabilities, have adverse tax consequences, result in acquired in-process research and development expenses, or in the future require the amortization, write-down or impairment of amounts related to deferred compensation, goodwill, and other intangible assets, or fail to generate a financial return sufficient to offset acquisition costs.
In addition, Dell Technologies periodically divests businesses, including businesses that are no longer a part of its strategic plan. These divestitures similarly require significant investment of time and resources, may disrupt Dell Technologies' business and distract management from other responsibilities, and may result in losses on disposition or continued financial involvement in the divested business, including through indemnification or other financial arrangements, for a period following the transaction, which could adversely affect Dell Technologies' financial results.
If its cost efficiency measures are not successful, Dell Technologies may become less competitive.
Dell Technologies continues to focus on minimizing operating expenses through cost improvements and simplification of its corporate structure. Certain factors may prevent the achievement of these goals, which may negatively affect Dell Technologies' competitive position. For example, Dell Technologies may experience delays or unanticipated costs in implementing its cost efficiency plans, which could prevent the timely or full achievement of expected cost efficiencies.
Dell Technologies' inability to manage solutions and product and services transitions in an effective manner could reduce the demand for Dell Technologies' solutions, products, and services, and the profitability of Dell Technologies' operations.
Continuing improvements in technology result in the frequent introduction of new solutions, products, and services, improvements in product performance characteristics, and short product life cycles. If Dell Technologies fails to manage in an effective manner transitions to new solutions and offerings, the products and services associated with such offerings and customer demand for Dell Technologies' solutions, products, and services could diminish, and Dell Technologies' profitability could suffer.
Dell Technologies is increasingly sourcing new products and transitioning existing products through its contract manufacturers and manufacturing outsourcing relationships in order to generate cost efficiencies and better serve its customers. The success of product transitions depends on a number of factors, including the availability of sufficient quantities of components at attractive costs. Product transitions also present execution challenges and risks, including the risk that new or upgraded products may have quality issues or other defects.
18
Failure to deliver high-quality hardware, software, and services could lead to loss of customers and diminished profitability.
Dell Technologies must identify and address quality issues associated with its hardware, software, and services, many of which include third-party components. Although quality testing is performed regularly to detect quality problems and implement required solutions, failure to identify and correct significant product quality issues before the sale of such products to customers could result in lower sales, increased warranty or replacement expenses, and reduced customer confidence, which could harm Dell Technologies' operating results.
Dell Technologies' ability to generate substantial non-U.S. net revenue is subject to additional risks and uncertainties.
Sales outside the United States accounted for approximately 51% of Dell Technologies' consolidated net revenue for Fiscal 2018. Dell Technologies' future growth rates and success are substantially dependent on the continued growth of Dell Technologies' business outside of the United States. Dell Technologies' international operations face many risks and uncertainties, including varied local economic and labor conditions, political instability, changes in the U.S. and international regulatory environments, and the impacts of trade protection measures, tax laws (including U.S. taxes on foreign operations), copyright levies, and foreign currency exchange rates. Any of these factors could negatively affect Dell Technologies' international business results and prospects for growth.
Dell Technologies' profitability may be adversely affected by product, customer, and geographic sales mix, and seasonal sales trends.
Dell Technologies' overall profitability for any period may be adversely affected by changes in the mix of products, customers, and geographic markets reflected in sales for that period, and by seasonal trends. Profit margins vary among products, services, customers, and geographic markets. For instance, services offerings generally have a higher profit margin than consumer products. In addition, parts of Dell Technologies' business are subject to seasonal sales trends. Among the trends with the most significant impact on Dell Technologies' operating results, sales to government customers (particularly the U.S. federal government) are typically stronger in Dell Technologies' third fiscal quarter, sales in Europe, the Middle East, and Africa are often weaker in Dell Technologies' third fiscal quarter, and sales to consumers are typically strongest during Dell Technologies' fourth fiscal quarter.
Dell Technologies may lose revenue opportunities and experience gross margin pressure if sales channel participants fail to perform as expected.
Dell Technologies relies on third-party value-added resellers, system integrators, distributors, retailers, and other sales channels to complement its direct sales organization in order to reach more end-users globally. Future operating results depend on the performance of sales channel participants and on Dell Technologies' success in maintaining and developing these relationships. Revenue and gross margins could be negatively affected if the financial condition or operations of channel participants weaken as a result of adverse economic conditions or other business challenges, or if uncertainty regarding the demand for Dell Technologies' products causes channel participants to reduce their orders for these products. Further, some channel participants may consider the expansion of Dell Technologies' direct sales initiatives to conflict with their business interests as distributors or resellers of Dell Technologies' products, which could lead them to reduce their investment in the distribution and sale of such products, or to cease all sales of Dell Technologies' products.
Dell Technologies' financial performance could suffer from reduced access to the capital markets by Dell Technologies or some of its customers.
Dell Technologies may access debt and capital sources to provide financing for customers and to obtain funds for general corporate purposes, including working capital, acquisitions, capital expenditures, and funding of customer receivables. In addition, Dell Technologies maintains customer financing relationships with some companies that rely on access to the debt and capital markets to meet significant funding needs. Any inability of these companies to access such markets could compel Dell Technologies to self-fund transactions with such companies or to forgo customer financing opportunities, which could harm Dell Technologies' financial performance. The debt and capital markets may experience extreme volatility and disruption from time to time in the future, which could result in higher credit spreads in such markets and higher funding costs for Dell Technologies. Deterioration in Dell Technologies' business performance, a credit rating downgrade, volatility in the securitization markets, changes in financial services regulation, or adverse changes in the economy could lead to reductions in the availability of debt financing. In addition, these events could limit Dell Technologies' ability to continue asset securitizations or other forms of financing from debt or capital sources, reduce the amount of financing receivables that Dell
19
Technologies originates, or negatively affect the costs or terms on which Dell Technologies may be able to obtain capital. Any of these developments could adversely affect Dell Technologies' net revenue, profitability, and cash flows.
Weak economic conditions and additional regulation could harm Dell Technologies' financial services activities.
Dell Technologies' financial services activities are negatively affected by adverse economic conditions that contribute to loan delinquencies and defaults. An increase in loan delinquencies and defaults would result in greater net credit losses, which may require Dell Technologies to increase its reserves for customer receivables. In addition, the implementation of new financial services regulation, or the application of existing financial services regulation in countries where Dell Technologies expands its financial services and related supporting activities, could unfavorably affect the profitability and cash flows of Dell Technologies' consumer financing activities.
Dell Technologies is subject to counterparty default risks.
Dell Technologies has numerous arrangements with financial institutions that include cash and investment deposits, interest rate swap contracts, foreign currency option contracts, and forward contracts. As a result, Dell Technologies is subject to the risk that the counterparty to one or more of these arrangements will default, either voluntarily or involuntarily, on its performance under the terms of the arrangement. In times of market distress, a counterparty may default rapidly and without notice, and Dell Technologies may be unable to take action to cover its exposure, either because of lack of contractual ability to do so or because market conditions make it difficult to take effective action. If one of Dell Technologies' counterparties becomes insolvent or files for bankruptcy, Dell Technologies' ability eventually to recover any losses suffered as a result of that counterparty's default may be limited by the liquidity of the counterparty or the applicable legal regime governing the bankruptcy proceeding. In the event of such a default, Dell Technologies could incur significant losses, which could harm Dell Technologies' business and adversely affect its results of operations and financial condition.
The exercise by customers of certain rights under their services contracts with Dell Technologies, or Dell Technologies' failure to perform as it anticipates at the time it enters into services contracts, could adversely affect Dell Technologies' revenue and profitability.
Many of Dell Technologies' services contracts allow customers to take actions that may adversely affect Dell Technologies' revenue and profitability. These actions include terminating a contract if Dell Technologies' performance does not meet specified service levels, requesting rate reductions or contract termination, reducing the use of Dell Technologies' services, or terminating a contract early upon payment of agreed fees. In addition, Dell Technologies estimates the costs of delivering the services at the outset of the contract. If Dell Technologies fails to estimate such costs accurately and actual costs significantly exceed estimates, Dell Technologies may incur losses on the services contracts.
Loss of government contracts could harm Dell Technologies' business.
Contracts with U.S. federal, state, and local governments and with foreign governments are subject to future funding that may affect the extension or termination of programs and to the right of such governments to terminate contracts for convenience or non-appropriation. There is pressure on governments, both domestically and internationally, to reduce spending. Funding reductions or delays could adversely affect public sector demand for Dell Technologies' products and services. In addition, if Dell Technologies violates legal or regulatory requirements, the applicable government could suspend or disbar Dell Technologies as a contractor, which would unfavorably affect Dell Technologies' net revenue and profitability.
Dell Technologies' business could suffer if Dell Technologies does not develop and protect its proprietary intellectual property or obtain or protect licenses to intellectual property developed by others on commercially reasonable and competitive terms.
If Dell Technologies or its suppliers are unable to develop or protect desirable technology or technology licenses, Dell Technologies may be prevented from marketing products, may have to market products without desirable features, or may incur substantial costs to redesign products. Dell Technologies also may have to defend or enforce legal actions or pay damages if Dell Technologies is found to have violated the intellectual property of other parties. Although Dell Technologies' suppliers might be contractually obligated to obtain or protect such licenses and indemnify Dell Technologies against related expenses, those suppliers could be unable to meet their obligations. Although Dell Technologies invests in research and development and obtains additional intellectual property through acquisitions, those activities do not guarantee that Dell Technologies will develop or obtain intellectual property necessary for profitable operations. Costs involved in developing and protecting rights in intellectual property may have a negative impact on Dell Technologies' business. In addition, Dell Technologies' operating
20
costs could increase because of copyright levies or similar fees by rights holders and collection agencies in European and other countries.
Infrastructure disruptions could harm Dell Technologies' business.
Dell Technologies depends on its information technology and manufacturing infrastructure to achieve its business objectives. Natural disasters, manufacturing failures, telecommunications system failures, or defective or improperly installed new or upgraded business management systems could lead to disruptions in this infrastructure. Portions of Dell Technologies' IT infrastructure also may experience interruptions, delays or cessations of service, or produce errors in connection with systems integration or migration work. Such disruptions may adversely affect Dell Technologies' ability to receive or process orders, manufacture and ship products in a timely manner or otherwise conduct business in the normal course. Further, portions of Dell Technologies' services business involve the processing, storage, and transmission of data, which also would be negatively affected by such an event. Disruptions in Dell Technologies' infrastructure could lead to loss of customers and revenue, particularly during a period of heavy demand for Dell Technologies' products and services. Dell Technologies also could incur significant expense in repairing system damage and taking other remedial measures.
Cyber attacks or other data security incidents that disrupt Dell Technologies' operations or result in the breach or other compromise of proprietary or confidential information about Dell Technologies or Dell Technologies' workforce, customers, or other third parties could disrupt Dell Technologies' business, harm its reputation, cause Dell Technologies to lose clients, and expose Dell Technologies to costly regulatory enforcement and litigation.
Dell Technologies manages, stores, and otherwise processes various proprietary information and sensitive or confidential data relating to its operations. In addition, Dell Technologies' cloud computing businesses routinely process, store, and transmit large amounts of data, including sensitive and personally identifiable information, for Dell Technologies' customers. Dell Technologies may experience breaches or other compromise of the information technology systems it uses for these purposes, as criminal or other actors may be able to penetrate Dell Technologies' network security and misappropriate or compromise Dell Technologies' confidential information or that of third parties, create system disruptions or cause shutdowns. Further, hardware and operating system software and applications that Dell Technologies produces or procures from third parties may contain defects in design or manufacture, including "bugs" and other problems that could unexpectedly interfere with the operation of such systems.
The costs to address the foregoing security problems and security vulnerabilities before or after a cyber incident could be significant. Remediation efforts may not be successful and could result in interruptions, delays, or cessation of service, and loss of existing or potential customers that may impede Dell Technologies' sales, manufacturing, distribution, or other critical functions. Dell Technologies could lose existing or potential customers for outsourcing services or other information technology solutions in connection with any actual or perceived security vulnerabilities in Dell Technologies' products. In addition, breaches of Dell Technologies' security measures and the unapproved dissemination of proprietary information or sensitive or confidential data about Dell Technologies or its customers or other third parties could expose Dell Technologies, its customers, or other third parties affected to a risk of loss or misuse of this information, result in regulatory enforcement, litigation and potential liability for Dell Technologies, damage Dell Technologies' brand and reputation, or otherwise harm Dell Technologies' business. Further, Dell Technologies relies in certain limited capacities on third-party data management providers and other vendors whose possible security problems and security vulnerabilities may have similar effects on Dell Technologies.
Dell Technologies is subject to laws, rules, and regulations in the United States and other countries relating to the collection, use, and security of user and other data. Dell Technologies' ability to execute transactions and to possess and use personal information and data in conducting its business subjects it to legislative and regulatory burdens that may require Dell Technologies to notify regulators and customers, employees, or other individuals of a data security breach, including in the European Union when the EU General Data Protection Regulation takes effect in May 2018. Dell Technologies has incurred, and will continue to incur, significant expenses to comply with mandatory privacy and security standards and protocols imposed by law, regulation, industry standards, or contractual obligations, but despite such expenditures may face regulatory and other legal actions in the event of a data breach or perceived or actual non-compliance with such requirements.
21
Failure to hedge effectively Dell Technologies' exposure to fluctuations in foreign currency exchange rates and interest rates could adversely affect Dell Technologies' financial condition and results of operations.
Dell Technologies utilizes derivative instruments to hedge its exposure to fluctuations in foreign currency exchange rates and interest rates. Some of these instruments and contracts may involve elements of market and credit risk in excess of the amounts recognized in Dell Technologies' financial statements. If Dell Technologies is not successful in monitoring its foreign exchange exposures and conducting an effective hedging program, Dell Technologies' foreign currency hedging activities may not offset the impact of fluctuations in currency exchange rates on its future results of operations and financial position.
The expiration of tax holidays or favorable tax rate structures, unfavorable outcomes in tax audits and other tax compliance matters, or adverse legislative or regulatory tax changes could result in an increase in Dell Technologies' tax expense or Dell Technologies' effective income tax rate.
Portions of Dell Technologies' operations are subject to a reduced tax rate or are free of tax under various tax holidays that expire in whole or in part from time to time. Many of these holidays may be extended when certain conditions are met, or may be terminated if certain conditions are not met. If the tax holidays are not extended, or if Dell Technologies fails to satisfy the conditions of the reduced tax rate, its effective tax rate would be impacted. Dell Technologies' effective tax rate also could be impacted if Dell Technologies' geographic sales mix changes. In addition, any actions by Dell Technologies to repatriate non-U.S. earnings for which it has not previously provided for U.S. taxes may affect the effective tax rate.
The application of tax laws to Dell Technologies' operations and past transactions involves some inherent uncertainty. Dell Technologies is continually under audit in various tax jurisdictions. Although Dell Technologies believes its tax positions are appropriate, Dell Technologies may not be successful in resolving potential tax claims that arise from these audits. An unfavorable outcome in certain of these matters could result in a substantial increase in Dell Technologies' tax expense. In addition, Dell Technologies' provision for income taxes could be affected by changes in the valuation of deferred tax assets.
Changes in tax laws (including any future Treasury notices or regulations related to the Tax Cuts and Jobs Act that was signed into law on December 22, 2017) could adversely affect Dell Technologies' operations and profitability. In recent years, numerous legislative, judicial, and administrative changes have been made to tax laws applicable to Dell Technologies and companies similar to Dell Technologies. Additional changes to tax laws are likely to occur, and such changes may adversely affect Dell Technologies' tax liability.
Dell Technologies' profitability could suffer from any impairment of its portfolio investments.
Dell Technologies invests a significant portion of its available funds in a portfolio consisting primarily of debt securities of various types and maturities pending the deployment of these funds in Dell Technologies' business. Dell Technologies' earnings performance could suffer from any impairment of its investments. Dell Technologies' portfolio securities generally are classified as available-for-sale and are recorded in Dell Technologies' financial statements at fair value. If any such investments experience declines in market price and it is determined that such declines are other than temporary, Dell Technologies may have to recognize in earnings the decline in the fair market value of such investments below their cost or carrying value.
Unfavorable results of legal proceedings could harm Dell Technologies' business and result in substantial costs.
Dell Technologies is involved in various claims, suits, investigations, and legal proceedings that arise from time to time in the ordinary course of business, as well as those that arose in connection with Dell's going-private transaction and the EMC merger transaction, including those described elsewhere in this report. Additional legal claims or regulatory matters may arise in the future and could involve stockholder, consumer, regulatory, compliance, intellectual property, antitrust, tax, and other issues on a global basis. Litigation is inherently unpredictable. Regardless of the merits of the claims, litigation may be both time-consuming and disruptive to Dell Technologies' business. Dell Technologies could incur judgments or enter into settlements of claims that could adversely affect its operating results or cash flows in a particular period. In addition, Dell Technologies' business, operating results, and financial condition could be adversely affected if any infringement or other intellectual property claim made against it by any third party is successful, or if Dell Technologies fails to develop non-infringing technology or license the proprietary rights on commercially reasonable terms and conditions.
22
Dell Technologies is incurring increased costs and is subject to additional regulations and requirements as a public company, and Dell Technologies' management is required to devote substantial time to compliance matters, which could lower Dell Technologies' profits or make it more difficult to run its business.
Since it became a public company in June 2016, Dell Technologies has been incurring significant legal, accounting, and other expenses that it had not incurred as a private company, including costs associated with public company reporting requirements and costs of recruiting and retaining non-executive directors. Dell Technologies also is incurring costs associated with the Sarbanes-Oxley Act of 2002 and related rules implemented by the SEC and the New York Stock Exchange ("NYSE"), on which its Class V Common Stock is listed. The expenses incurred by public companies generally for financial reporting and corporate governance purposes have been increasing. The increased Dell Technologies' legal and financial compliance costs have made some activities more time-consuming and costly. Dell Technologies' management has to devote substantial time to ensuring that it complies with all of these requirements. Laws and regulations affecting public company directors and executive officers could make it more difficult for Dell Technologies to attract and retain qualified persons to serve on its board of directors or its board committees or as its executive officers. Further, if Dell Technologies is unable to satisfy its obligations as a public company, the Class V Common Stock could be subject to delisting from the NYSE and Dell Technologies could be subject to fines, sanctions, and other regulatory action and potentially civil litigation.
Dell Technologies is obligated to develop and maintain proper and effective internal control over financial reporting and any failure to do so may adversely affect investor confidence in Dell Technologies and, as a result, the value of the Class V Common Stock.
Dell Technologies is required by Section 404 of the Sarbanes-Oxley Act of 2002 to furnish an annual report by management on, among other matters, its assessment of the effectiveness of its internal control over financial reporting. The assessment must include disclosure of any material weaknesses identified by Dell Technologies' management in its report. Dell Technologies also is required to disclose significant changes made in its internal control over financial reporting. In addition, Dell Technologies' independent registered public accounting firm is required to express an opinion each year as to the effectiveness of Dell Technologies' internal control over financial reporting. The process of designing, implementing, and testing internal control over financial reporting is time-consuming, costly, and complicated.
During the evaluation and testing process of its internal controls, if Dell Technologies identifies one or more material weaknesses in its internal control over financial reporting, Dell Technologies will be unable to assert that its internal control over financial reporting is effective. Dell Technologies may experience material weaknesses or significant deficiencies in its internal control over financial reporting in the future. Any failure to maintain internal control over financial reporting could severely inhibit Dell Technologies' ability to issue accurate reports of its financial condition or results of operations. If Dell Technologies is unable to conclude that its internal control over financial reporting is effective, or if Dell Technologies' independent registered public accounting firm determines that Dell Technologies has a material weakness or significant deficiencies in its internal control over financial reporting, investors could lose confidence in the accuracy and completeness of Dell Technologies' financial reports, the market price of the Class V Common Stock could decline, and Dell Technologies could be subject to sanctions or investigations by the SEC or other regulatory authorities. Failure to remedy any material weakness in its internal control over financial reporting, or to implement or maintain other effective control systems required of public companies, also could restrict future access to the capital markets by Dell Technologies or its subsidiaries.
Compliance requirements of current or future environmental and safety laws, or other laws, may increase costs, expose Dell Technologies to potential liability and otherwise harm Dell Technologies' business.
Dell Technologies' operations are subject to environmental and safety regulations in all areas in which Dell Technologies conducts business. Product design and procurement operations must comply with new and future requirements relating to climate change laws and regulations, materials composition, sourcing, energy efficiency and collection, recycling, treatment, transportation, and disposal of electronics products, including restrictions on mercury, lead, cadmium, lithium metal, lithium ion, and other substances. If Dell Technologies fails to comply with applicable rules and regulations regarding the transportation, source, use, and sale of such regulated substances, Dell Technologies could be subject to liability. The costs and timing of costs under environmental and safety laws are difficult to predict, but could have an adverse impact on Dell Technologies' business.
In addition, Dell Technologies and its subsidiaries are subject to various anti-corruption laws that prohibit improper payments or offers of payments to foreign governments and their officials for the purpose of obtaining or retaining business, and are also subject to export controls, customs, and economic sanctions laws and embargoes imposed by the U.S. government. Violations of the Foreign Corrupt Practices Act or other anti-corruption laws or export control, customs, or economic sanctions laws may
23
result in severe criminal or civil sanctions and penalties, and Dell Technologies and its subsidiaries may be subject to other liabilities which could have a material adverse effect on their business, results of operations, and financial condition.
Dell Technologies also is subject to provisions of the Dodd-Frank Wall Street Reform and Consumer Protection Act intended to improve transparency and accountability concerning the supply of minerals originating from the conflict zones of the Democratic Republic of Congo or adjoining countries. Dell Technologies will incur costs to comply with the disclosure requirements of this law and may realize other costs relating to the sourcing and availability of minerals used in Dell Technologies' products. Further, Dell Technologies may face reputational harm if its customers or other Dell Technologies stakeholders conclude that Dell Technologies is unable to sufficiently verify the origins of the minerals used in its products.
Armed hostilities, terrorism, natural disasters, or public health issues could harm Dell Technologies' business.
Armed hostilities, terrorism, natural disasters, or public health issues, whether in the United States or abroad, could cause damage or disruption to Dell Technologies or Dell Technologies' suppliers and customers, or could create political or economic instability, any of which could harm Dell Technologies' business. For example, the earthquake and tsunami in Japan and severe flooding in Thailand which occurred during fiscal year 2012 caused damage to infrastructure and factories that disrupted the supply chain for a variety of components used in Dell's products. Any such future events could cause a decrease in demand for Dell Technologies' products, make it difficult or impossible to deliver products or for suppliers to deliver components, and create delays and inefficiencies in Dell Technologies' supply chain.
Dell Technologies is highly dependent on the services of Michael S. Dell, its Chief Executive Officer, and its success depends on the ability to attract, retain, and motivate key employees.
Dell Technologies is highly dependent on the services of Michael S. Dell, its Chief Executive Officer and largest stockholder. If Dell Technologies loses the services of Mr. Dell, Dell Technologies may not be able to locate a suitable or qualified replacement, and Dell Technologies may incur additional expenses to recruit a replacement, which could severely disrupt Dell Technologies' business and growth. Further, Dell Technologies relies on key personnel, including other members of its executive leadership team, to support its business and increasingly complex product and services offerings. Dell Technologies may not be able to attract, retain, and motivate the key professional, technical, marketing, and staff resources needed.
Dell Technologies' substantial level of indebtedness could adversely affect its financial condition.
Dell Technologies and its subsidiaries have a substantial amount of indebtedness, which require significant interest and other debt service payments. As of
February 2, 2018
, Dell Technologies and its subsidiaries had approximately
$51.9 billion
of short-term and long-term indebtedness. As of the same date, Dell Technologies and its subsidiaries also had an additional $4.9 billion available for borrowing under its revolving credit facilities.
Dell Technologies' substantial level of indebtedness could have important consequences, including the following:
|
•
|
Dell Technologies must use a substantial portion of its cash flow from operations to pay interest and principal on its senior credit facilities, its senior secured and senior unsecured notes, and its other indebtedness, which reduces funds available to Dell Technologies for other purposes such as working capital, capital expenditures, other general corporate purposes, and potential acquisitions;
|
|
•
|
Dell Technologies' ability to refinance such indebtedness or to obtain additional financing for working capital, capital expenditures, acquisitions, or other general corporate purposes may be impaired;
|
|
•
|
Dell Technologies is exposed to fluctuations in interest rates because Dell Technologies' senior credit facilities have variable rates of interest;
|
|
•
|
Dell Technologies' leverage may be greater than that of some of its competitors, which may put Dell Technologies at a competitive disadvantage and reduce Dell Technologies' flexibility in responding to current and changing industry and financial market conditions; and
|
|
•
|
Dell Technologies may be unable to comply with financial and other restrictive covenants in its senior credit facilities, the notes, and other indebtedness that limit Dell Technologies' ability to incur additional debt, make investments, and sell assets, which could result in an event of default that, if not cured or waived, would have an adverse effect on Dell Technologies' business and prospects and could force it into bankruptcy or liquidation.
|
24
Dell Technologies and its subsidiaries may be able to incur substantial additional indebtedness in the future, subject to the restrictions contained in Dell Technologies' and its subsidiaries' credit facilities and the indentures that govern the notes. If new indebtedness is added to the debt levels of Dell Technologies and its subsidiaries, the related risks that Dell Technologies now faces could intensify. Dell Technologies' ability to access additional funding under its revolving credit facilities will depend upon, among other factors, the absence of a default under either such facility, including any default arising from a failure to comply with the related covenants. If Dell Technologies is unable to comply with its covenants under its revolving credit facilities, Dell Technologies' liquidity may be adversely affected.
From time to time, when it believes it is advantageous to do so, Dell Technologies may seek to reduce its leverage by repaying certain of its indebtedness before the maturity dates of such indebtedness. Dell Technologies may be unable to generate operating cash flows and other cash necessary to achieve a level of debt reduction that will significantly enhance the company’s credit quality and reduce the risks associated with its substantial indebtedness.
As of
February 2, 2018
, approximately $12.6 billion of Dell Technologies' debt was variable-rate debt and a 100 basis point increase in interest rates would have resulted in an increase of approximately
$126 mi
llion in annual interest expense on such debt. Dell Technologies' ability to meet its expenses, to remain in compliance with its covenants under its debt instruments and to make future principal and interest payments in respect of its debt depends on, among other factors, Dell Technologies' operating performance, competitive developments, and financial market conditions, all of which are significantly affected by financial, business, economic, and other factors. Dell Technologies is not able to control many of these factors. Given current industry and economic conditions, Dell Technologies' cash flow may not be sufficient to allow Dell Technologies to pay principal and interest on its debt and meet its other obligations.
The financial performance of Dell Technologies is affected by the financial performance of VMware, Inc..
Because Dell Technologies consolidates the financial results of VMware, Inc. in its results of operations, its financial performance is affected by the financial performance of VMware, Inc. VMware, Inc.'s financial performance may be affected by a number of factors, including, but not limited to:
|
•
|
fluctuations in demand, adoption rates, sales cycles (which have been increasing in length), and pricing levels for VMware, Inc.'s products and services;
|
|
•
|
changes in customers' budgets for information technology purchases and in the timing of its purchasing decisions;
|
|
•
|
the timing of recognizing revenues in any given quarter, which can be affected by a number of factors, including product announcements, beta programs, and product promotions that can cause revenue recognition of certain orders to be deferred until future products to which customers are entitled become available;
|
|
•
|
the timing of announcements or releases of new or upgraded products and services by VMware, Inc. or by its competitors;
|
|
•
|
the timing and size of business realignment plans and restructuring charges;
|
|
•
|
VMware, Inc.'s ability to maintain scalable internal systems for reporting, order processing, license fulfillment, product delivery, purchasing, billing, and general accounting, among other functions;
|
|
•
|
VMware, Inc.'s ability to control costs, including its operating expenses;
|
|
•
|
credit risks of VMware, Inc.'s distributors, who account for a significant portion of VMware, Inc.'s product revenues and accounts receivable;
|
|
•
|
VMware, Inc.'s ability to process sales at the end of the quarter;
|
|
•
|
seasonal factors, such as the end of fiscal period budget expenditures by VMware, Inc.'s customers and the timing of holiday and vacation periods;
|
|
•
|
renewal rates and the amounts of the renewals for enterprise agreements, as the original terms of such agreements expire;
|
25
|
•
|
the timing and amount of software development costs that may be capitalized;
|
|
•
|
unplanned events that could affect market perception of the quality or cost-effectiveness of VMware, Inc.'s products and solutions; and
|
|
•
|
VMware, Inc.'s ability to predict accurately the degree to which customers will elect to purchase its subscription-based offerings in place of licenses to its on-premises offerings.
|
Dell Technologies' pension plan assets are subject to market volatility.
Through the EMC merger transaction, Dell Technologies assumed a noncontributory defined pension plan, which was originally part of the EMC legacy acquisition of Data General. The plan's assets are invested in common stocks, bonds, and cash. As of
February 2, 2018
the expected long-term rate of return on the plan's assets was
6.5%
, which represented the average of the expected long-term rates of return weighted by the plan's assets as of
February 2, 2018
. As market conditions permit, Dell Technologies expects to continue to shift the asset allocation to lower the percentage of investments in equities and increase the percentage of investments in long-duration fixed-income securities. The effect of such a change could result in a reduction in the long-term rate of return on plan assets and an increase in future pension expense. As of
February 2, 2018
, the ten-year historical rate of return on plan assets was 7.38%, and the inception-to-date return on plan assets was 9.74%. Should Dell Technologies not achieve the expected rate of return on the plan's assets or if the plan experiences a decline in the fair value of its assets, Dell Technologies may be required to contribute assets to the plan, which could materially adversely affect its results of operations or financial condition.
Risk Factors Relating to Ownership of Dell Technologies
The MD stockholders and the SLP stockholders have the ability to elect all of the directors of Dell Technologies, and such stockholders' interests may differ from the interests of the holders of Class V Common Stock.
By reason of their ownership of substantially all of Dell Technologies' Class A Common Stock, Michael S. Dell and a separate property trust for the benefit of his wife (the "MD stockholders")
have the ability to elect all of the Group I Directors, who have an aggregate of 3 of the 13 total votes on the Dell Technologies board of directors, and all of the Group II Directors, who have an aggregate of 7 of the 13 total votes on the Dell Technologies board of directors. By reason of their ownership of all of the Class B Common Stock, investment funds affiliated with Silver Lake Partners (the "SLP stockholders") have the ability to elect all of the Group III Directors, who have an aggregate of 3 of the 13 total votes on the Dell Technologies board of directors. Michae
l S. Dell is the sole Group II Director and therefore is entitled to cast a majority of the votes entitled to be cast by all Dell Technologies directors and thereby approve any matter submitted to the Dell Technologies board of directors other than any matter that also requires the separate approval of the Capital Stock Committee or the audit committee. Egon Durban and Simon Patterson are the sole Group III Directors. Dell Technologies' directors owe fiduciary duties to Dell Technologies as a whole and to all of Dell Technologies' stockholders and not just to holders of a particular class of shares.
Dell Technologies is controlled by the MD stockholders and the SLP stockholders, whose interests may differ from the interests of the holders of Class V Common Stock.
By reason of their ownership of Class A Common Stock possessing a majority of the aggregate votes entitled to be cast by holders of Dell Technologies' Class A Common Stock, Class B Common Stock, Class C Common Stock, and Class V Common Stock, voting together as a single class, the MD stockholders have the ability to approve any matter submitted to the vote of all of the outstanding shares of Dell Technologies common stock voting together as a single class.
Through their control of Dell Technologies, subject to certain special voting rights of the Class V Common Stock related to actions that affect the Class V Common Stock and certain consent rights of the SLP stockholders, the MD stockholders and the MSD Partners stockholders are able to control actions to be taken by Dell Technologies, including the election of directors of Dell Technologies' subsidiaries (including VMware, Inc. and its subsidiaries), amendments to Dell Technologies' organizational documents and the approval of significant corporate transactions, including mergers, sales of substantially all of Dell Technologies' assets, distributions of Dell Technologies' assets, the incurrence of indebtedness, and any incurrence of liens on Dell Technologies' assets.
26
The Dell Technologies board of directors has formed an executive committee of the board consisting entirely of directors designated by the MD stockholders and the SLP stockholders, and has delegated a substantial portion of the power and authority of the Dell Technologies board of directors to the executive committee.
The Dell Technologies board of directors has formed an executive committee of the board consisting entirely of Group II Directors and Group III Directors (none of whom are independent directors under NYSE rules), and has delegated a substantial portion of the power and authority of the Dell Technologies board of directors to the executive committee. Among other matters, the executive committee has been delegated the board's power and authority, subject to specified limits, to review and approve, with respect to Dell Technologies and its subsidiaries, acquisitions and dispositions, the annual budget and business plan, the incurrence of indebtedness, entry into material commercial agreements, joint ventures and strategic alliances, and the commencement and settlement of material litigation. In addition, the executive committee acts as the compensation committee of Dell Technologies' board of directors. The interests of the MD stockholders, who have the ability to elect all of the Group II Directors, and the SLP stockholders, who have the ability to elect all of the Group III Directors may differ materially from the interests of the holders of Class V Common Stock and Dell Technologies' other stakeholders.
The MD stockholders and the SLP stockholders will be able to continue to strongly influence or effectively control decisions made by the Dell Technologies board of directors even if they own less than
50
% of Dell Technologies' combined voting power.
So long as the MD stockholders and the SLP stockholders c
ontinue to own a significant amount of Dell Technologies' combined voting power, even if such amount is less than 50%, they will continue to be able to strongly influence or effectively control decisions made by the Dell Technologies board of directors. For example, before an initial public offering of DHI Group Common Stock, so long as the MD stockholders and th
e SLP stockholders each continue to beneficially own an aggregate number of shares of DHI Group Common Stock equal to 9,818,182 or more shares of DHI Group Common Stock, as adjusted for any stock split, stock dividend, reverse stock split, or similar event, they will be jointly entitled to nominate for election as directors up to three Group I Directors, the MD stockholders will be entitled to nominate for election as directors up to three Group II Directors, and the SLP stockholders will be entitled to nominate for election as directors up to three Group III Directors. Following an initial public offering of DHI Group Common Stock, so long as each of the MD stockholders and the SLP stockholders beneficially own at least 5% of all outstand
ing shares
of Dell Technologies stock entitled to vote generally in the election of directors, each of the MD stockholders and the SLP stockholders will be entitled to nominate at least one individual for election to the board, with each of the MD stockholders and the SLP stockholders having the right to nominate a number of directors equal to the percentage of the total voting power for the regular election of directors of Dell Technologies beneficially owned by the MD stockholders or by the SLP stockholders, as the case may be, multiplied by the number of directors then on the Dell Technologies board.
The MD Stockholders, the MSD Partners stockholders, and the SLP stockholders and their respective affiliates may have interests that conflict with the interests of other stockholders or those of Dell Technologies.
In the ordinary course of their business activities, the MD stockholders, investment funds affiliated with MSD Partners, L.P. (the "MSD Partners stockholders"), and the SLP stockholders and their respective affiliates may engage in activities where their interests conflict with interests of other stockholders or those of the company. The Dell Technologies certificate of incorporation provides that none of the MD stockholders, the MSD Partners stockholders, and the SLP stockholders, any of their respective affiliates or any director who is not employed by Dell Technologies (including any non-employee director who serves as one of Dell Technologies' officers in both his director and officer capacities) or his or her affiliates have any duty to refrain from engaging, directly or indirectly, in the same business activities or similar business activities or lines of business in which Dell Technologies operates. The MD stockholders, the MSD Partners stockholders, and the SLP stockholders also may pursue acquisition opportunities that may be complementary to Dell Technologies' business and, as a result, those acquisition opportunities may not be available to Dell Technologies. In addition, such stockholders may have an interest in pursuing acquisitions, divestitures, and other transactions that, in their judgment, could enhance the value of their investment in Dell Technologies, even though such transactions might involve risks to other stockholders.
Dell Technologies is a "controlled company" within the meaning of NYSE rules and, as a result, qualifies for, and relies on, exemptions from certain corporate governance requirements, as a result of which holders of Class V Common Stock do not have the same protections afforded to stockholders of companies that are subject to such requirements.
As of
February 2, 2018
, for any matter submitted to a vote of the holders of Dell Technologies common stock voting together as a single class:
27
|
•
|
the number of votes to which holders of Class A Common Stock are entitled represent approximately 72% of the total number of votes to which all holders of Dell Technologies common stock are entitled;
|
|
•
|
the number of votes to which holders of Class B Common Stock are entitled represent approximately 24% of the total number of votes to which all holders of Dell Technologies common stock are entitled;
|
|
•
|
the number of votes to which holders of Class C Common Stock are entitled represent less than 1% of the total number of votes to which all holders of Dell Technologies common stock are entitled; and
|
|
•
|
the number of votes to which holders of Class V Common Stock are entitled represent approximately 4% of the total number of votes to which all holders of Dell Technologies common stock are entitled.
|
Accordingly, the MD stockholders and the SLP stockholders control a majority of the combined voting power of all classes of Dell Technologies stock entitled to vote generally in the election of directors.
Dell Technologies is a "controlled company" within the meaning of NYSE rules. Under t
hese rules, a company of which more than 50% of the voting power in the election of directors is held by an individual, group, or another company is a "controlled company" and may elect not to comply with certain corporate governance requirements, in
cluding the requirements that:
|
•
|
Dell Technologies have a board that is composed of a majority of "independent directors," as defined under the rules of the NYSE;
|
|
•
|
Dell Technologies have a compensation committee that is composed entirely of independent directors; and
|
|
•
|
Dell Technologies have a nominating and corporate governance committee that is composed entirely of independent directors.
|
Dell Technologies is utilizing these exemptions. As a result, a majority of the directors on the Dell Technologies board of directors are not independent directors and none of the committees of the Dell Technologies board of directors consists entirely of independent directors, other than the audit committee and the Capital Stock Committee. Accordingly, holders of Class V Common Stock do not have the same protections afforded to stockholders of companies that are subject to all of the corporate governance requirements of the NYSE.
The Dell Technologies certificate of incorporation designates a state court of the State of Delaware or the federal district court for the District of Delaware as the sole and exclusive forum for certain types of actions and proceedings that may be initiated by Dell Technologies' stockholders, which could limit the ability of the holders of Class V Common Stock to obtain a favorable judicial forum for disputes with Dell Technologies or with directors, officers, or the controlling stockholders of Dell Technologies.
Under the Dell Technologies certificate of incorporation, unless Dell Technologies consents in writing to the selection of an alternative forum, the sole and exclusive forum will be a state court located within the State of Delaware (or, if no state court located within the State of Delaware has jurisdiction, the federal district court for the District of Delaware) for:
|
•
|
any derivative action or proceeding brought on behalf of Dell Technologies;
|
|
•
|
any action asserting a claim of breach of a fiduciary duty owed by any director or officer or stockholder of Dell Technologies to Dell Technologies or Dell Technologies' stockholders;
|
|
•
|
any action asserting a claim against Dell Technologies or any director or officer or stockholder of Dell Technologies arising pursuant to any provision of the Delaware General Corporation Law or Dell Technologies' certificate of incorporation or bylaws; or
|
|
•
|
any action asserting a claim against Dell Technologies or any director or officer or stockholder of Dell Technologies governed by the internal affairs doctrine.
|
These provisions of the Dell Technologies certificate of incorporation could limit the ability of the holders of the Class V Common Stock to obtain a favorable judicial forum for disputes with Dell Technologies or with directors, officers, or the controlling stockholders of Dell Technologies, which may discourage such lawsuits against Dell Technologies and its directors,
28
officers, and stockholders. Alternatively, if a court were to find these provisions of its constituent documents inapplicable to, or unenforceable in respect of, one or more of the specified types of actions or proceedings, Dell Technologies may incur additional costs associated with resolving such matters in other jurisdictions, which could adversely affect its business, financial condition, and results of operations.
Risk Factors Relating to the Class V Common Stock
Holders of Class V Common Stock are common stockholders of Dell Technologies and, therefore, are subject to risks associated with an investment in Dell Technologies as a whole.
Even though Dell Technologies attributes, for financial reporting purposes, all of Dell Technologies' consolidated assets, liabilities, revenue, and expenses to either the DHI Group or the Class V Group in order to determine the DHI Group and Class V Common Stock earnings and earnings per share and to prepare the unaudited financial information for the Class V Group, Dell Technologies retains legal title to all of Dell Technologies' assets, and Dell Technologies' tracking stock capitalization does not limit Dell Technologies' legal responsibility, or that of Dell Technologies' subsidiaries, for their debts and liabilities. The DHI Group generally refers to the direct and indirect interest of Dell Technologies in all of Dell Technologies' business, assets, properties, liabilities, and preferred stock other than those attributable to the Class V Group, as well as the DHI Group's retained interest in the Class V Group equal to approximately
39%
of Dell Technologies' economic interest in the Class V Group as of
February 2, 2018
. The Class V Common Stock is intended to track the economic performance of approximately
61%
of Dell Technologies' economic interest in the Class V Group as of
February 2, 2018
. The Class V Group consists solely of VMware, Inc. common stock held by Dell Technologies. As of
February 2, 2018
, the Class V Group consisted of approximately
331 million
shares of VMware, Inc. common stock.
Although Dell Technologies' tracking stock policy provides that reallocations of assets between groups may result in the creation of inter-group debt or an increase or decrease of the DHI Group's inter-group interest in the Class V Group or in an offsetting reallocation of cash or other assets, Dell Technologies' creditors are not limited by Dell Technologies' tracking stock capitalization from proceeding against any assets against which they could have proceeded if Dell Technologies did not have a tracking stock capitalization. The DHI Group and the Class V Group are not separate legal entities and cannot own assets, and, as a result, holders of Class V Common Stock do not have special legal rights related to specific assets attributed to the Class V Group and, in any liquidation, holders of DHI Group Common Stock and holders of Class V Common Stock will be entitled to their proportionate interests in assets of Dell Technologies after payment or provision for payment of the debts and liabilities of Dell Technologies and payment or provision for payment of any preferential amount due to the holders of any other class or series of stock based on their respective numbers of liquidation units.
The Dell Technologies board of directors may not reallocate assets and liabilities between the DHI Group and the Class V Group without the approval of the Capital Stock Committee, which currently consists solely of independent directors, but any such reallocation of assets and liabilities may make it difficult to assess the future prospects of either group based on its past performance.
The Dell Technologies board of directors may not allocate or reallocate assets and liabilities to one group or the other without the approval of the Capital Stock Committee, which must consist of a majority of independent directors and currently consists solely of independent directors. Any such allocation or reallocation may be made without the approval of any of Dell Technologies' stockholders in accordance with the Dell Technologies tracking stock policy and the Dell Technologies certificate of incorporation. Any such reallocation made by the Dell Technologies board of directors, as well as the existence of the right in and of itself to effect a reallocation, may affect the ability of investors to assess the future prospects of either group, including its liquidity and capital resource needs, based on its past performance. Stockholders also may have difficulty evaluating the liquidity and capital resources of each group based on past performance, as the Dell Technologies board of directors may use one group's liquidity to fund the other group's liquidity and capital expenditure requirements through the use of inter-group loans or other inter-group arrangements.
Any allocation or reallocation of assets and liabilities to one group or the other that results in the Class V Common Stock ceasing to track the performance of the Class A common stock of VMware, Inc. could result in the delisting of the Class V Common Stock from the NYSE, as discussed below, which would materially adversely affect the liquidity and value of the Class V Common Stock.
The listing standards of the NYSE include certain requirements to maintain the listing of an Equity Investment Tracking Stock, and if the Class V Common Stock were delisted because of the failure to meet any of such requirements, the liquidity and value of the Class V Common Stock would be materially adversely affected.
29
The NYSE has listing standards for a tracking stock, which the NYSE refers to as an "Equity Investment Tracking Stock," that tracks the performance of an investment by the issuer in the common equity of another company listed on the NYSE, such as VMware, Inc. The listing standards of the NYSE provide that the Class V Common Stock could be delisted from the NYSE if:
|
•
|
the Class A common stock of VMware, Inc. ceases to be listed on the NYSE;
|
|
•
|
Dell Technologies ceases to own, directly or indirectly,
at least 50% of either the economic interest or the voting power of all of the outstanding classes of common equity of VMware, Inc.; or
|
|
•
|
the Class V Common Stock ceases to track the performance of the Class A common stock of VMware, Inc.
|
If any of the foregoing conditions were no longer met at any time, the NYSE would determine whether the Class V Common Stock could meet any other applicable initial listing standard in place at that time. If the Class V Common Stock did not qualify for initial listing at that time under another applicable listing standard, the NYSE would commence delisting proceedings. Further, if trading in the Class A common stock of VMware, Inc. were suspended or delisting proceedings were commenced with respect to such Class A common stock, trading in the Class V Common Stock would be suspended or delisting proceedings would be commenced with respect to the Class V Common Stock at the same time. Any delisting of the Class V Common Stock would materially adversely affect the liquidity and value of the Class V Common Stock.
The market price of Class V Common Stock may not reflect the performance of the Class V Group as Dell Technologies intends.
The market price of the Class V Common Stock may not reflect the performance of Dell Technologies' interest in VMware, Inc. and any other businesses, assets, and liabilities that may be attributed to the Class V Group at any time. Holders of Class V Common Stock are common stockholders of Dell Technologies as a whole and, as such, are subject to all risks associated with an investment in Dell Technologies and all of Dell Technologies' businesses, assets, and liabilities, including the approximately
$51.9 billion
of short-term and long-term indebtedness that Dell Technologies has outstanding as of
February 2, 2018
. In addition, investors may discount the value of the Class V Common Stock because it is part of a common enterprise rather than of a stand-alone entity. As a result of the characteristics of tracking stocks, tracking stocks often trade at a discount to the estimated value of the assets or businesses they are intended to track.
The market price of Class V Common Stock may be volatile, could fluctuate substantially, and could be affected by factors that do not affect traditional common stock.
The market price of Class V Common Stock may be materially affected by, among other factors:
|
•
|
actual or anticipated fluctuations in VMware, Inc.'s operating results or in the operating results of any other businesses attributable to the Class V Group from time to time;
|
|
•
|
potential acquisition activity by Dell Technologies or the companies in which Dell Technologies invests;
|
|
•
|
adverse changes in the credit rating or credit quality of Dell Technologies and its subsidiaries;
|
|
•
|
issuances of additional debt or equity securities to raise capital by Dell Technologies or the companies in which Dell Technologies invests and the manner in which that debt or the proceeds of an equity issuance are attributed to each of the groups;
|
|
•
|
changes in financial estimates by securities analysts regarding Class V Common Stock or the companies attributable to either of Dell Technologies' groups;
|
|
•
|
changes in market valuations of other companies engaged in similar lines of business;
|
|
•
|
the complex nature and the potential difficulties investors may have in understanding the terms of the Class V Common Stock, as well as concerns regarding the possible effect of certain of those terms on an investment in Dell Technologies' stock; and
|
|
•
|
general market conditions.
|
30
The market price of Class V Common Stock may fluctuate significantly as a result of these and other factors. The market price of the Class V Common Stock may decline from time to time and you may not be able to sell your shares of Class V Common Stock at an attractive price or at all.
Dell Technologies may not pay dividends equally or at all on the Class V Common Stock.
VMware, Inc. does not currently pay dividends on its common stock, and any decisions regarding dividends on the VMware, Inc. common stock would be a decision of VMware, Inc.'s board of directors. Dell Technologies does not presently intend to pay cash dividends on the Class V Common Stock. If VMware, Inc. were to pay a dividend on the VMware, Inc. common stock owned by Dell Technologies that is attributable to the Class V Group, Dell Technologies could, but would not be required to, distribute some or all of that amount to the holders of Class V Common Stock. Dell Technologies has the right to pay dividends on the shares of common stock of each group in equal or unequal amounts, and Dell Technologies may pay dividends on the shares of common stock of one group and not pay dividends on shares of common stock of the other group. In addition, any dividends or distributions on, or repurchases of, shares relating to either group will reduce Dell Technologies' assets legally available to be paid as dividends on the shares relating to the other group.
Dell Technologies' operations are conducted almost entirely through its subsidiaries and its ability to generate cash to make future dividend payments, if any, is highly dependent on the cash flows and the receipt of funds from its subsidiaries via dividends or intercompany loans. To the extent that Dell Technologies determines in the future to pay dividends on the DHI Group Common Stock or the Class V Common Stock, the terms of certain agreements governing Dell Technologies' or its subsidiaries' indebtedness, including the revolving credit facilities of Dell Technologies and any credit facilities of VMware, Inc., may significantly restrict the ability of Dell Technologies' subsidiaries to pay dividends or otherwise transfer assets to Dell Technologies, as well as the ability of Dell Technologies to pay dividends to holders of its common stock. In addition, Delaware law imposes requirements that may restrict Dell Technologies' ability to pay dividends to holders of its common stock.
Dell Technologies' tracking stock capital structure could create conflicts of interest, and the Dell Technologies board of directors might make decisions that could adversely affect only some holders of Dell Technologies' common stock.
Dell Technologies' tracking stock capital structure could give rise to circumstances in which the interests of holders of stock of one group might diverge or appear to diverge from the interests of holders of stock of the other group. In addition, given the nature of their businesses, there may be inherent conflicts of interests between the DHI Group and the Class V Group. Dell Technologies' groups are not separate entities and thus holders of DHI Group Common Stock and Class V Common Stock do not have the right to elect separate boards of directors. As a result, Dell Technologies' officers and directors owe fiduciary duties to Dell Technologies as a whole and all of Dell Technologies' stockholders as opposed to only holders of a particular group. Decisions deemed to be in the best interest of Dell Technologies and all of Dell Technologies' stockholders may not be in the best interest of a particular group when considered independently, such as:
|
•
|
decisions as to the terms of any business relationships that may be created between the DHI Group and the Class V Group or the terms of any reallocations of assets between the groups;
|
|
•
|
decisions as to the allocation of corporate opportunities between the groups, especially where the opportunities might meet the strategic business objectives of both groups;
|
|
•
|
decisions as to operational and financial matters that could be considered detrimental to one group but beneficial to the other;
|
|
•
|
decisions as to the conversion of Class V Common Stock into Class C Common Stock, which the Dell Technologies board of directors may make in its sole discretion, so long as the Class C Common Stock is then traded on a U.S. securities exchange;
|
|
•
|
decisions regarding the increase or decrease of the inter-group interest that the DHI Group may own in the Class V Group from time to time;
|
|
•
|
decisions as to the internal or external financing attributable to businesses or assets attributed to either of Dell Technologies' groups;
|
|
•
|
decisions as to the dispositions of assets of either of Dell Technologies' groups; and
|
31
|
•
|
decisions as to the payment of dividends on the stock relating to either of Dell Technologies' groups.
|
Ownership of DHI Group Common Stock and Class V Common Stock by Dell Technologies' directors or officers may create or appear to create conflicts of interest.
With the exception of the three independent directors who serve as Group I Directors (whose equity compensation by Dell Technologies must be approximately half in the form of Class V Common Stock or options to acquire Class V Common Stock based on value at the time of grant), it is expected that all or substantially all of the direct and indirect equity ownership in Dell Technologies of Dell Technologies' directors and officers will continue to consist of DHI Group Common Stock. Such ownership of DHI Group Common Stock by Dell Technologies' directors and officers could create or appear to create conflicts of interest when they are faced with decisions that could have different implications for the holders of DHI Group Common Stock or Class V Common Stock.
The Dell Technologies board of directors may not change the Dell Technologies tracking stock policy without the approval of the Capital Stock Committee, which currently consists solely of independent directors, but any such change may be made to the detriment of either group without stockholder approval.
The Dell Technologies board of directors has adopted the Dell Technologies tracking stock policy described in this report to serve as guidelines in making decisions regarding the relationships between the DHI Group and the Class V Group with respect to matters such as tax liabilities and benefits, inter-group debt, inter-group interests, allocation and reallocation of assets, financing alternatives, corporate opportunities, payment of dividends, and similar items. These policies also set forth the initial allocation of Dell Technologies' businesses, assets, and liabilities between the groups. These policies are not included in the Dell Technologies certificate of incorporation. The Dell Technologies board of directors may not change or make exceptions to these policies without the approval of the Capital Stock Committee, which must consist of a majority of independent directors and which currently consists solely of independent directors. Because these policies relate to matters concerning the day-to-day management of Dell Technologies as opposed to significant corporate actions, such as a merger involving Dell Technologies or a sale of substantially all of Dell Technologies' assets, no stockholder approval is required with respect to their adoption or amendment. A decision to change, or make exceptions to, these policies or adopt additional policies could disadvantage one group while conferring an advantage on the other.
Holders of shares of stock relating to a particular group may not have any remedies if any action by Dell Technologies' directors or officers has an adverse effect on only that stock.
Principles of Delaware law and the provisions of the Dell Technologies certificate of incorporation may protect decisions of the Dell Technologies board of directors that have a disparate impact upon holders of shares of stock relating to a particular group. Under Delaware law, the Dell Technologies board of directors has a duty to act with due care and in the best interests of all stockholders. Principles of Delaware law established in cases involving differing treatment of multiple classes or series of stock provide that, subject to any applicable provisions of the corporation's certificate of incorporation, a board of directors owes an equal duty to all stockholders and does not have separate or additional duties to holders of any class or series of stock. Judicial opinions in Delaware involving tracking stocks have established that decisions by directors or officers involving differing treatment of holders of tracking stocks may be judged under the business judgment rule. In some circumstances, Dell Technologies' directors or officers may be required to make a decision that is viewed as adverse to the holders of shares relating to a particular group. Under the principles of Delaware law and the business judgment rule referred to above, Dell Technologies stockholders may not be able to successfully challenge decisions they believe have a disparate impact upon the stockholders of one of Dell Technologies' groups if a majority of the Dell Technologies board of directors is disinterested and independent with respect to the action taken, is adequately informed with respect to the action taken, and acts in good faith and in the honest belief that the Dell Technologies board of directors is acting in the best interests of Dell Technologies and all of Dell Technologies' stockholders.
Dell Technologies may dispose of assets of the Class V Group without the approval of holders of the Class V Common Stock.
Delaware law requires stockholder approval only for a sale or other disposition of all or substantially all of the assets of Dell Technologies taken as a whole, and the Dell Technologies certificate of incorporation does not require a separate class vote in the case of a sale of a significant amount of assets attributed to any of Dell Technologies' groups. As long as the assets attributed to the Class V Group proposed to be disposed of represent less than substantially all of Dell Technologies' assets, Dell Technologies may approve sales and other dispositions of any amount of the assets attributed to such group without any stockholder approval.
32
If Dell Technologies disposes of all or substantially all of the assets attributed to the Class V Group (which means, for this p
urpose, assets representing 80% of the fair value of the total assets of the Class V Group as of such date, as determined by the Dell Technologies board of directors), Dell Technologies would be required, if the disposition is not an exclude
d transaction under the terms of the Dell Technologies certificate of incorporation, to choose one or more of the following three alternatives:
|
•
|
declare and pay a dividend on the Class V Common Stock;
|
|
•
|
redeem shares of the Class V Common Stock in exchange for cash, securities, or other property; or
|
|
•
|
so long as the Class C Common Stock is then traded on a U.S. securities exchange, convert all or a portion of the outstanding Class V Common Stock into Class C Common Stock.
|
In this type of a transaction, holders of the Class V Common Stock may receive less value than the value that a third-party buyer might pay for all or substantially all of the assets of the Class V Group.
The Dell Technologies board of directors will decide, in its sole discretion, how to proceed and is not required to select the option that would result in the highest value to holders of any group of Dell Technologies' common stock.
Holders of Class V Common Stock may receive less consideration upon a sale of the assets attributed to the Class V Group than if such group were a separate company.
If the Class V Group were a separate, independent company and its shares were acquired by another person, certain costs of that sale, including corporate level taxes, might not be payable in connection with that acquisition. As a result, stockholders of a separate, independent company with the same assets might receive a greater amount of proceeds than the holders of Class V Common Stock would receive upon a sale of all or substantially all of the assets of the Class V Group. In addition, in the event of such a sale, the per share consideration to be paid to holders of Class V Common Stock may not be equal to or more than the per share value before or after the announcement of a sale of all or substantially all of the assets of the Class V Group. Further, there is no requirement that the consideration paid be tax-free to the holders of Class V Common Stock. Accordingly, if Dell Technologies sells all or substantially all of the assets attributed to the Class V Group, the value of Dell Technologies' stockholders' investment in Dell Technologies could decrease.
In the event of a liquidation of Dell Technologies, holders of Class V Common Stock will not have a priority with respect to the assets attributed to the Class V Group remaining for distribution to stockholders.
Under the Dell Technologies certificate of incorporation, upon Dell Technologies' liquidation, dissolution, or winding-up, holders of the Class V Common Stock will be entitled to receive, in respect of their shares of such stock, their proportionate interest in all of Dell Technologies' assets, if any, remaining for distribution to holders of common stock in proportion to their respective number of "liquidation units" per share. Relative liquidation units will be based on the volume-weighted average price of the Class V Common Stock over the period of ten trading days commencing shortly after the initial filing of the Dell Technologies certificate of incorporation and the determination of the Dell Technologies board of directors of the value of the DHI Group Common Stock at such time. Hence, the assets to be distributed to a holder of Class V Common Stock upon a liquidation, dissolution, or winding-up of Dell Technologies will not be linked to the relative value of the assets attributed to the Class V Group at that time or to changes in the relative value of the DHI Group Common Stock and the Class V Common Stock over time.
The Dell Technologies board of directors in its sole discretion may elect to convert the Class V Common Stock into Class C Common Stock, thereby changing the nature of the investment.
The Dell Technologies certificate of incorporation permits the Dell Technologies board of directors, in its sole discretion, to convert all of the outstanding shares of Class V Common Stock into Class C Common Stock at such time as the Class C Common Stock is already traded on a U.S. securities exchange and the shares are converted at a ratio that provides the holders of the Class V Common Stock with the applicable conversion premium to which they are entitled. A conversion would preclude the holders of Class V Common Stock from retaining their investment in a security that is intended to reflect separately the performance of the Class V Group. Dell Technologies cannot predict the impact on the market value of Dell Technologies' stock of (1) the Dell Technologies board of directors' ability to effect any such conversion or (2) the exercise of this conversion right by Dell Technologies.
33
If Dell Technologies exercises its option to convert all outstanding shares of Class V Common Stock into shares of Class C Common Stock, such conversion would effectively eliminate Dell Technologies' tracking stock structure because, upon conversion, the holders of Class V Common Stock would hold one of four series of DHI Group Common Stock, none of which, after such conversion, would be intended to track the performance of any distinct tracking groups. Upon any such conversion, for example, holders would no longer have special class voting rights or be subject to certain redemption or conversion provisions related to the Class V Group. In addition, there would no longer be a Capital Stock Committee or a tracking stock policy.
Holders of DHI Group Common Stock and Class V Common Stock generally vote together and holders of Class V Common Stock have limited separate voting rights.
Holders of DHI Group Common Stock and Class V Common Stock vote together as a single class, except in certain limited circumstances prescribed by the Dell Technologies certificate of incorporation and under Delaware law. Each share of Class V Common Stock and Class C Common Stock has one vote per share. Each share of Class A Common Stock and Class B Common Stock has ten votes per share. Holders of Class D Common Stock do not vote on any matters except to the extent required under Delaware law. In addition, the Group II Directors are elected solely by the holders of Class A Common Stock voting as a separate class and the Group III Directors are elected solely by the holders of Class B Common Stock voting as a separate class.
As of
February 2, 2018
, the number of votes to which holders of Class V Common Stock are entitled represent approximately
4% of the total number of votes to which all holders of Dell Technologies common stock are entitled, the number of votes to which holders of Class A Common Stock are entitled represent approximately 72% of the total number of votes to which all holders of Dell Technologies common stock are entitled, the number of votes to which holders of Class B Common Stock are entitled represent approximately 24% of the total number of votes to which all holders of Dell Technologies common stock are entitled, and the number of votes to which holders of Class C Common Stock are entitled represent less than 1%
of the total number of votes to which all holders of Dell Technologies common stock are entitled. As a result, when holders of DHI Group Common Stock and Class V Common Stock vote together as a single class, holders of DHI Group Common Stock will be in a position to control the outcome of the vote even if the matter involves a conflict of interest among Dell Technologies' stockholders or has a greater impact on one group than the other.
Certain restrictions provided in the Dell Technologies certificate of incorporation will lapse on the two-year anniversary of the closing of the EMC merger transaction, which would allow Dell Technologies to cause VMware, Inc. Class A common stock to cease to be publicly listed and would prevent investors who may view the market price of VMware, Inc. Class A common stock as relevant to a valuation of the VMware business from accessing sale information.
Certain restrictions in the Dell Technologies, Inc. certificate of incorporation prohibit Dell Technologies from acquiring shares of VMware, Inc. common stock for two years after the closing of the EMC merger transaction in September 2016 in circumstances in which the VMware, Inc. Class A common stock would cease to be listed on a U.S. national securities exchange, subject to certain exceptions related to tax consolidation. While investors may view the market price of VMware, Inc. Class A common stock as relevant to a valuation of the VMware business, the Class V Common Stock and the VMware, Inc. Class A common stock have different characteristics, which Dell Technologies believes may affect their respective market prices in distinct ways. If Dell Technologies determined to take such actions following the expiration of such restrictions in the Dell Technologies certificate of incorporation and the VMware, Inc. Class A common stock ceased to trade publicly, such action could cause the Class V Common Stock to be delisted from the NYSE, as discussed above, which would materially adversely affect the liquidity and value of the Class V Common Stock.
Holders of Class V Common Stock may not benefit from any potential premiums paid to the public holders of VMware, Inc. Class A common stock.
Dell Technologies or other persons may choose to purchase shares of VMware, Inc. Class A common stock at a premium, and holders of Class V Common Stock would not be entitled to a similar premium for their shares of Class V Common Stock in such circumstances.
34
Dell Technologies' capital structure, as well as the fact that the Class V Group is not an independent company, may inhibit or prevent acquisition bids for the Class V Group and may make it difficult for a third party to acquire Dell Technologies, even if doing so may be beneficial to Dell Technologies' stockholders.
If the Class V Group were a separate, independent company, any person interested in acquiring the Class V Group without negotiating with management could seek control of the group by obtaining control of its outstanding voting stock by means of a tender offer or a proxy contest. Although Dell Technologies intends the Class V Common Stock to reflect the separate economic performance of the Class V Group, the group is not a separate entity and a person interested in acquiring only the Class V Group without negotiation with Dell Technologies' management could obtain control of the group only by obtaining control of a majority in voting power of all of the outstanding shares of common stock of Dell Technologies. Even if the MD stockholders and the SLP stockholders approved such an acquisition, the existence of shares of common stock relating to different groups could present complexities and in certain circumstances pose obstacles, financial and otherwise, to an acquiring person that are not present in companies that do not have capital structures similar to the Dell Technologies capital structure.
Certain provisions of the Dell Technologies certificate of incorporation and the Dell Technologies bylaws may discourage, delay, or prevent a change in control of Dell Technologies that a stockholder may consider favorable. These provisions include:
|
•
|
limitations on who may call special meetings of stockholders;
|
|
•
|
advance notice requirements for nominations of candidates for election to the Dell Technologies board of directors and for proposals for other businesses; and
|
|
•
|
the existence of authorized and unissued stock, including "blank check" preferred stock, which could be issued by the Dell Technologies board of directors without approval of the holders of Dell Technologies common stock to persons friendly to Dell Technologies' then-current management, thereby protecting the continuity of Dell Technologies' management, or which could be used to dilute the stock ownership of persons seeking to obtain control of Dell Technologies.
|
Further, as a Delaware corporation, Dell Technologies is subject to provisions of Delaware law that may deter a takeover attempt that its stockholders may find beneficial. These anti-takeover provisions and other provisions under Delaware law could discourage, delay, or prevent a transaction involving a change in control of Dell Technologies, including actions that its stockholders may deem advantageous, or negatively affect the trading price of its common stock, including the Class V Common Stock. These provisions also could discourage proxy contests and make it more difficult for Dell Technologies' stockholders to elect directors of their choosing and to cause Dell Technologies to take other corporate actions that may be desired by its stockholders.
The Dell Technologies board of directors is authorized to issue and designate shares of preferred stock in additional series without stockholder approval.
The Dell Technologies certificate of incorporation authorizes the Dell Technologies board of directors, without the approval of its stockholders, to issue 1 million shares of preferred stock, subject to limitations prescribed by applicable law, rules, and regulations and the provisions of the Dell Technologies certificate of incorporation, as shares of preferred stock in series, to establish from time to time the number of shares to be included in each such series and to fix the designation, powers, preferences, and rights of the shares of each such series and the qualifications, limitations, or restrictions thereof. The powers, preferences, and rights of these additional series of preferred stock may be senior to or on parity with Dell Technologies' classes of common stock, including the Class V Common Stock, which may reduce the value of the Class V Common Stock.
Future sales, or the perception of future sales, by Dell Technologies or holders of Class V Common Stock in the public market could cause the market price for the Class V Common Stock to decline.
The sale of substantial amounts of shares of the Class V Common Stock in the public market, or the perception that such sales could occur, could harm the prevailing market price of shares of the Class V Common Stock. These sales, or the possibility that these sales may occur, also might make it more difficult for Dell Technologies to sell equity securities in the future at a time and at a price that it deems appropriate.
35
None.
Our principal executive offices and global headquarters are located at One Dell Way, Round Rock, Texas.
As of
February 2, 2018
, we owned or leased
31.9 million
square feet of office, manufacturing, and warehouse space worldwide:
|
Owned
|
Leased
|
||||
|
(in thousands)
|
|||||
|
U.S. facilities
|
10,176
|
|
5,970
|
|
|
|
International facilities
|
4,484
|
|
11,252
|
|
|
|
Total (a)
|
14,660
|
|
17,222
|
|
|
____________________
|
(a)
|
Includes
3.2 million
square feet of subleased or vacant space.
|
As of
February 2, 2018
, our facilities consisted of business centers, which include facilities that contain operations for sales, technical support, administrative, and support functions; manufacturing operations; and research and development centers.
Because of the interrelation of the products and services offered in each of our segments, we generally do not designate our properties to any segment. With limited exceptions, each property is used at least in part by all of our segments, and we retain the flexibility to make future use of each of the properties available to each of the segments. Of our properties, approximately
5 million
square feet of space that house executive and administrative offices, research and development, sales and marketing functions, and data centers are used solely by our VMware segment.
Dell Technologies believes that its existing properties are suitable and adequate for its current needs and that it can readily meet its requirements for additional space at competitive rates by extending expiring leases or by finding alternative space.
The information required by this item is incorporated herein by reference to the information set forth under the caption "Legal Matters" in
Note 13
of the
Notes to the Consolidated Financial Statements
included in "Part II — Item 8 — Financial Statements and Supplementary Data."
Not applicable.
36
Market for Class V Common Stock
Our Class V Common Stock is listed on the New York Stock Exchange ("NYSE") under the ticker symbol "DVMT." The following table sets forth information regarding the high and low sales prices of shares of our Class V Common Stock for the fiscal year ended
February 2, 2018
, and for the period from September 7, 2016, the date on which our Class V Common Stock began trading on the NYSE, through
February 3, 2017
.
|
Class V Common Stock
|
|||||||
|
High
|
Low
|
||||||
|
Fiscal year ended February 2, 2018
|
|||||||
|
Fourth quarter
|
$
|
92.40
|
|
$
|
68.71
|
|
|
|
Third quarter
|
$
|
83.98
|
|
$
|
62.73
|
|
|
|
Second quarter
|
$
|
69.73
|
|
$
|
59.93
|
|
|
|
First quarter
|
$
|
67.80
|
|
$
|
62.24
|
|
|
|
Fiscal year ended February 3, 2017
|
|||||||
|
Fourth quarter
|
$
|
64.64
|
|
$
|
48.19
|
|
|
|
Third quarter (from September 7, 2016)
|
$
|
50.89
|
|
$
|
45.02
|
|
|
There is no public market for our Class A Common Stock, our Class B Common Stock, or our Class C Common Stock. No shares of our Class D Common Stock were outstanding as of
February 2, 2018
.
Holders
As of
March 21, 2018
, there were
4,649
holders of record of our Class V Common Stock,
38
holders of record of our Class A Common Stock,
5
holders of record of our Class B Common Stock, and
124
holders of record of our Class C Common Stock. The number of record holders does not include individuals or entities that beneficially own shares of any class of our common stock, but whose shares are held of record by a broker, bank, or other nominee.
Dividends
Subsequent to the listing of our Class V Common Stock on the NYSE on September 7, 2016, we have not paid or declared cash dividends on our common stock.
We do not currently intend to pay cash dividends on our common stock in the foreseeable future. Any future determination to declare cash dividends will be made at the discretion of our board of directors and will depend upon our results of operations, financial condition and business prospects, limitations on the payment of dividends under our certificate of incorporation, the terms of our indebtedness and applicable law, and such other factors as our board of directors may deem relevant. For information about restrictions on our ability to pay cash dividends on the common stock, see "Part I — Item 1A — Risk Factors — Risk Factors Relating to the Class V Common Stock — Dell Technologies may not pay dividends equally or at all on the Class V Common Stock."
Purchases of Equity Securities
On September 7, 2016, our board of directors approved a stock repurchase program (the "DHI Group Repurchase Program") that authorizes us to use assets of the DHI Group to repurchase up to
$1.0 billion
of shares of our Class V Common Stock over a two-year period beginning on September 7, 2016. On December 13, 2016, our board of directors approved the suspension of the DHI Group Repurchase Program until such time as the board of directors authorizes the reinstatement of that program. The board of directors has not authorized the reinstatement of the program and we did not repurchase any shares of our Class V Common Stock during the fourth quarter of Fiscal 2018. As of
February 2, 2018
, the approximate dollar value of shares of Class V Common Stock that may yet be purchased was
$676 million
authorized under the DHI Group Repurchase Program.
37
Stock Performance Graph
The following graph compares the cumulative total return on our Class V Common Stock for the period of September 7, 2016,
the date on which our Class V Common Stock began trading on the NYSE, through
February 2, 2018
with the total return over
the same period on the S&P 500 Index and the S&P 500 Systems Software Index. The graph assumes that $100 was invested on September 7, 2016 in the Class V Common Stock and in each of the foregoing indices and assumes reinvestment of dividends, if any. The comparisons in the graph are based on historical data and are not necessarily indicative of the future price performance of the Class V Common Stock.
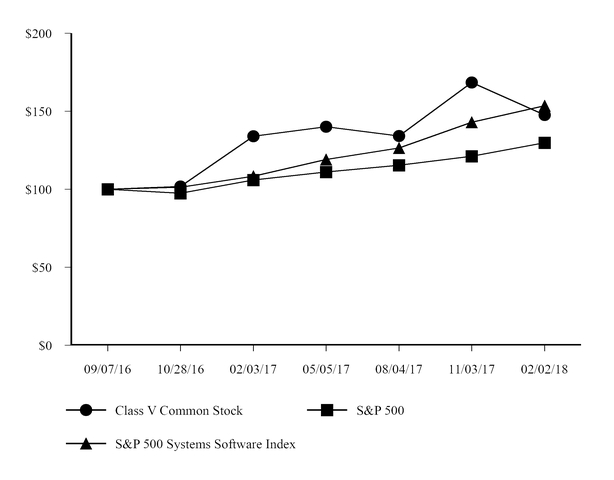
|
Fiscal Year 2017
|
Fiscal Year 2018
|
|||||||||||||||||||||||||||
|
September 7, 2016
|
October 28, 2016
|
February 3, 2017
|
May 5, 2017
|
August 4, 2017
|
November 3, 2017
|
February 2, 2018
|
||||||||||||||||||||||
|
Class V Common Stock
|
$
|
100.00
|
|
$
|
101.81
|
|
$
|
134.06
|
|
$
|
140.19
|
|
$
|
134.15
|
|
$
|
168.48
|
|
$
|
147.71
|
|
|||||||
|
S&P 500
|
$
|
100.00
|
|
$
|
97.49
|
|
$
|
105.94
|
|
$
|
111.19
|
|
$
|
115.39
|
|
$
|
121.13
|
|
$
|
129.92
|
|
|||||||
|
S&P 500 Systems Software Index
|
$
|
100.00
|
|
$
|
101.28
|
|
$
|
108.32
|
|
$
|
119.07
|
|
$
|
126.57
|
|
$
|
142.95
|
|
$
|
153.56
|
|
|||||||
The preceding stock performance graph shall not be deemed to be incorporated by reference by means of any general statement incorporating by reference this annual report on Form 10-K into any filing under the Securities Act or the Securities Exchange Act of 1934, except to the extent that Dell Technologies specifically incorporates such information by reference, and shall not otherwise be deemed filed under such Acts.
38
The following selected consolidated financial data for our company should be read in conjunction with "Part II — Item 7 — Management's Discussion and Analysis of Financial Condition and Results of Operations" and "Part II — Item 8 — Financial Statements and Supplementary Data." Consolidated results of operations and cash flow data for the fiscal years ended
February 2, 2018, February 3, 2017, and January 29, 2016
and balance sheet data as of
February 2, 2018
and
February 3, 2017
have been derived from our audited consolidated financial statements included in "Part II — Item 8 — Financial Statements and Supplementary Data."
Consolidated results of operations and cash flow data for the fiscal year ended
January 30, 2015
and balance sheet data as of
January 29, 2016
have been derived from our audited consolidated financial statements in our annual report on Form 10-K for the fiscal year ended February 3, 2017, which are not included or incorporated by reference herein.
Consolidated results of operations and cash flow data for the period from October 29, 2013 to January 31, 2014 and the period from February 2, 2013 to October 28, 2013 and balance sheet data as of January 30, 2015 have been derived from our audited consolidated financial statements included in the proxy statement/prospectus dated June 6, 2016 forming part of our registration statement on Form S-4 (Registration No. 333-208524) filed with the SEC, which are not included or incorporated by reference herein. The consolidated balance sheet data as of January 31, 2014 have been derived from our audited consolidated financial statements for the fiscal year then ended, which are not included or incorporated by reference herein. As discussed further below, for all periods preceding the fiscal year ended January 30, 2015, the financial results are not reflective of discontinued operations.
DHI Group and Class V Group
Dell Technologies has two groups of common stock, denoted as the DHI Group Common Stock and the Class V Common Stock. The DHI Group Common Stock consists of four classes of common stock, referred to as Class A Common Stock, Class B Common Stock, Class C Common Stock, and Class D Common Stock. The DHI Group generally refers to the direct and indirect interest of Dell Technologies in all of Dell Technologies' business, assets, properties, liabilities, and preferred stock other than those attributable to the Class V Group, as well as the DHI Group's retained interest in the Class V Group equal to approximately
39%
of Dell Technologies' economic interest in the Class V Group as of
February 2, 2018
. The Class V Common Stock is intended to track the economic performance of approximately
61%
of Dell Technologies' economic interest in the Class V Group as of such date. The Class V Group consists solely of VMware, Inc. common stock held by Dell Technologies. As of
February 2, 2018
, the Class V Group consisted of approximately
331 million
shares of VMware, Inc. common stock. See
Note 17
and
Note 18
of the Notes to the Consolidated Financial Statements included in this report and Exhibit 99.1 filed with this report for more information regarding the allocation of earnings from Dell Technologies' interest in VMware, Inc. between the DHI Group and the Class V Common Stock.
Basis of Presentation
Divestitures
— Dell Inc. ("Dell") closed substantially all of the divestiture of Dell Services on November 2, 2016 and the divestiture of Dell Software Group on October 31, 2016. On January 23, 2017, EMC, a subsidiary of Dell Technologies, closed the divestiture of the Dell EMC Enterprise Content Division. In accordance with applicable accounting guidance, the results of Dell Services, Dell Software Group, and the Enterprise Content Division, as well as the related gains or losses on sale, are presented as discontinued operations in the Consolidated Statements of Income (Loss) for the fiscal years ended February 3, 2017, January 29, 2016, and January 30, 2015 and, as such, have been excluded from continuing operations in the selected financial data presented below for those periods, except as otherwise indicated. Dell Technologies believes presenting Dell Services and Dell Software Group as discontinued operations for periods preceding the fiscal year ended January 30, 2015 is not material to understanding the results of operations and trends of Dell Technologies and is not relevant to the holders of the Class V Common Stock, which is intended to track the performance of a portion of Dell Technologies' economic interest in VMware, Inc., a majority-owned consolidated subsidiary of EMC, subsequent to the closing of the EMC merger transaction. In this regard, the performance of the Class V Common Stock is not affected by the operations of Dell Technologies prior to the consummation of the EMC merger transaction, as Dell Technologies did not acquire EMC's investment in VMware, Inc. until the completion of the EMC merger transaction on September 7, 2016. See
Note 4
of the
Notes to the Consolidated Financial Statements
included in this report for additional information on divestitures.
Going-Private Transaction
— On October 29, 2013, Dell Technologies acquired Dell in a transaction referred to as the going-private transaction. For the purposes of the consolidated financial data included in this report, periods prior to October 29, 2013 reflect the financial position, results of operations, and changes in financial position of Dell and its consolidated subsidiaries
39
prior to the going-private transaction, referred to as the Predecessor, and periods beginning on or after October 29, 2013 reflect the financial position, results of operations, and changes in financial position of Dell Technologies Inc. and its consolidated subsidiaries as a result of the going-private transaction, referred to as the Successor. As a result of the going-private transaction, the results of operations and financial position of the Predecessor and Successor are not directly comparable.
|
Successor
|
|||||||||||||||
|
Fiscal Year Ended
|
|||||||||||||||
|
February 2, 2018
|
February 3, 2017 (a)
|
January 29, 2016
|
January 30, 2015
|
||||||||||||
|
(in millions, except per share data)
|
|||||||||||||||
|
Results of Operations and Cash Flow Data:
|
|||||||||||||||
|
Net revenue
|
$
|
78,660
|
|
$
|
61,642
|
|
$
|
50,911
|
|
$
|
54,142
|
|
|||
|
Gross margin
|
$
|
20,054
|
|
$
|
12,959
|
|
$
|
8,387
|
|
$
|
8,896
|
|
|||
|
Operating loss
|
$
|
(3,333
|
)
|
$
|
(3,252
|
)
|
$
|
(514
|
)
|
$
|
(316
|
)
|
|||
|
Loss from continuing operations before income taxes
|
$
|
(5,688
|
)
|
$
|
(5,356
|
)
|
$
|
(1,286
|
)
|
$
|
(1,215
|
)
|
|||
|
Loss from continuing operations
|
$
|
(3,855
|
)
|
$
|
(3,737
|
)
|
$
|
(1,168
|
)
|
$
|
(1,108
|
)
|
|||
|
Earnings (loss) per share attributable to Dell Technologies Inc.:
|
|||||||||||||||
|
Continuing operations - Class V Common Stock - basic
|
$
|
1.41
|
|
$
|
1.44
|
|
$
|
—
|
|
$
|
—
|
|
|||
|
Continuing operations - DHI Group - basic
|
$
|
(7.08
|
)
|
$
|
(8.52
|
)
|
$
|
(2.88
|
)
|
$
|
(2.74
|
)
|
|||
|
Continuing operations - Class V Common Stock - diluted
|
$
|
1.39
|
|
$
|
1.43
|
|
$
|
—
|
|
$
|
—
|
|
|||
|
Continuing operations - DHI Group - diluted
|
$
|
(7.08
|
)
|
$
|
(8.52
|
)
|
$
|
(2.88
|
)
|
$
|
(2.74
|
)
|
|||
|
Number of weighted-average shares outstanding:
|
|||||||||||||||
|
Class V Common Stock - basic
|
203
|
|
217
|
|
—
|
|
—
|
|
|||||||
|
DHI Group - basic
|
567
|
|
470
|
|
405
|
|
404
|
|
|||||||
|
Class V Common Stock - diluted
|
203
|
|
217
|
|
—
|
|
—
|
|
|||||||
|
DHI Group - diluted
|
567
|
|
470
|
|
405
|
|
404
|
|
|||||||
|
Net cash provided by operating activities
|
$
|
6,810
|
|
$
|
2,309
|
|
$
|
2,162
|
|
$
|
2,551
|
|
|||
____________________
|
(a)
|
The fiscal year ended February 3, 2017 included 53 weeks.
|
40
|
Successor
|
Predecessor
|
|||||||
|
October 29, 2013 to January 31, 2014
|
February 2, 2013 to October 28, 2013
|
|||||||
|
(in millions, except per share data)
|
||||||||
|
Results of Operations and Cash Flow Data (a):
|
||||||||
|
Net revenue
|
$
|
14,075
|
|
$
|
42,302
|
|
||
|
Gross margin
|
$
|
1,393
|
|
$
|
7,991
|
|
||
|
Operating income (loss)
|
$
|
(1,798
|
)
|
$
|
518
|
|
||
|
Income (loss) before income taxes
|
$
|
(2,002
|
)
|
$
|
320
|
|
||
|
Net income (loss)
|
$
|
(1,612
|
)
|
$
|
(93
|
)
|
||
|
Earnings (loss) per common share:
|
||||||||
|
Basic
|
$
|
(4.06
|
)
|
$
|
(0.05
|
)
|
||
|
Diluted
|
$
|
(4.06
|
)
|
$
|
(0.05
|
)
|
||
|
Number of weighted-average shares outstanding:
|
||||||||
|
Basic
|
397
|
|
1,755
|
|
||||
|
Diluted
|
397
|
|
1,755
|
|
||||
|
Net cash provided by operating activities
|
$
|
1,082
|
|
$
|
1,604
|
|
||
____________________
(a) Results of operations for the periods presented in the table above have not been reclassified to present the divested businesses as discontinued operations.
|
Successor
|
|||||||||||||||||||
|
February 2, 2018
|
February 3, 2017
|
January 29, 2016
|
January 30, 2015
|
January 31, 2014
|
|||||||||||||||
|
(in millions)
|
|||||||||||||||||||
|
Balance Sheet Data:
|
|||||||||||||||||||
|
Cash and cash equivalents (a)
|
$
|
13,942
|
|
$
|
9,474
|
|
$
|
6,322
|
|
$
|
5,398
|
|
$
|
6,449
|
|
||||
|
Total assets
|
$
|
122,281
|
|
$
|
118,206
|
|
$
|
45,122
|
|
$
|
48,029
|
|
$
|
51,153
|
|
||||
|
Short-term debt
|
$
|
7,873
|
|
$
|
6,329
|
|
$
|
2,981
|
|
$
|
2,920
|
|
$
|
3,063
|
|
||||
|
Long-term debt
|
$
|
43,998
|
|
$
|
43,061
|
|
$
|
10,650
|
|
$
|
11,071
|
|
$
|
14,352
|
|
||||
|
Total Dell Technologies Inc. stockholders’ equity
|
$
|
9,326
|
|
$
|
13,243
|
|
$
|
1,466
|
|
$
|
2,904
|
|
$
|
4,014
|
|
||||
____________________
(a) Cash and cash equivalents as of January 31, 2014 has not been adjusted to present the cash and cash equivalents of the divested businesses as held for sale.
41
ITEM 7
—
MANAGEMENT'S DISCUSSION AND ANALYSIS OF FINANCIAL CONDITION AND RESULTS OF OPERATIONS
This management's discussion and analysis should be read in conjunction with the audited Consolidated Financial Statements and accompanying Notes included in this annual report on Form 10-K. In addition to historical financial information, the following discussion contains forward-looking statements that reflect our plans, estimates, and beliefs, and that are subject to numerous risks and uncertainties. Our actual results may differ materially from those expressed or implied in any forward-looking statements.
Unless otherwise indicated, all results presented are prepared in a manner that complies, in all material respects, with accounting principles generally accepted in the United States of America ("GAAP"). Additionally, unless otherwise indicated, all changes identified for the current-period results represent comparisons to results for the prior corresponding fiscal period.
Unless the context indicates otherwise, references in this report to "we," "us," "our," the "Company," and "Dell Technologies" mean Dell Technologies Inc. and its consolidated subsidiaries, references to "Dell" mean Dell Inc. and Dell Inc.'s consolidated subsidiaries, and references to "EMC" mean EMC Corporation and EMC Corporation's consolidated subsidiaries.
Our fiscal year is the 52- or 53-week period ending on the Friday nearest January 31. We refer to our fiscal years ended February 2, 2018, February 3, 2017, and January 29, 2016 as "Fiscal 2018," "Fiscal 2017," and "Fiscal 2016," respectively. Fiscal 2018 and Fiscal 2016 included 52 weeks. Fiscal 2017 included 53 weeks, with the extra week included in the fourth quarter of Fiscal 2017.
On September 7, 2016, we completed our acquisition by merger of EMC. The consolidated results of EMC are included in Dell Technologies' consolidated results for Fiscal 2018 and the portion of Fiscal 2017 subsequent to the EMC merger transaction. During Fiscal 2017, we closed the Dell Services, Dell Software Group ("DSG"), and Enterprise Content Division ("ECD") divestiture transactions. Accordingly, the results of operations of Dell Services, DSG, and ECD, as well as the related gains or losses on sale, have been excluded from the results of continuing operations in the relevant periods, except as otherwise indicated.
INTRODUCTION
Dell Technologies is a strategically aligned family of businesses, poised to become the essential infrastructure company, from the edge to the core to the cloud, as we continue our mission to advance human progress through technology. We seek to accomplish this by executing two, related, high-level strategic initiatives: helping our customers transform their businesses through digital, IT, workforce and security transformation, while extending our many leading market positions in client solutions and IT infrastructure.
Dell Technologies brings together the entire infrastructure from hardware to software to services. The core of IT is evolving in our hyper-connected world, containing both centralized data centers and geographically distributed hyper-converged infrastructure. Dell Technologies is a leader in the traditional technology of today and a leader in the cloud-native infrastructure of tomorrow. Through our recent combination with EMC, Dell Technologies offers next-generation solutions through our Client Solutions Group, Infrastructure Solutions Group, VMware, Inc., RSA Information Security ("RSA"), SecureWorks Corp. ("SecureWorks"), Pivotal Software, Inc. ("Pivotal"), Boomi, Inc. ("Boomi"), and Virtustream, Inc. ("Virtustream"). Our next-generation solutions enable digital transformation and encompass software-defined data centers, all-flash arrays, hybrid cloud, converged and hyper-converged infrastructure, cloud-native application development tools, mobile, and security solutions. In addition, we provide important value differentiators through our extended warranty and delivery offerings, and software and peripherals, which are closely tied to the sale of our hardware products.
Dell Technologies is committed to our customers. As we innovate to make our customers' existing IT increasingly productive, we help them reinvest their savings into the next generation of technologies that they need to succeed in the digital economy. We are positioned to help customers of any size and are differentiated by our practical innovation and efficient, simple, and affordable solutions.
During Fiscal 2018, we celebrated the one year anniversary of our historic merger with EMC, and recognize the many accomplishments we have made since the merger. These accomplishments include the broad expansion of our product
42
portfolio, integration of our supply chain, and achievement of revenue synergies across the business. With these accomplishments, we believe we are well-positioned for long-term sustainable growth and innovation. As we continue our integration of the EMC acquired businesses, we remain committed to our customers, supporting them with outstanding solutions, products, and services. We will continue our focus on building superior customer relationships through our direct model and our network of channel partners, which includes value-added resellers, system integrators, distributors, and retailers. We also will continue to balance our efforts to drive cost efficiencies in the business with strategic investments in areas that will enable growth, such as our sales force, marketing, and research and development, as we seek to strengthen our position as a leading global technology company poised for long-term sustainable growth and innovation.
Products and Services
We design, develop, manufacture, market, sell, and support a wide range of products and services. We are organized into the following business units, which are our reportable segments: Client Solutions Group; Infrastructure Solutions Group; and VMware. Due to our divestitures of Dell Services, Dell Software Group, and Dell EMC Enterprise Content Division, the results of these businesses, as well as the related gains or losses on sale, have been excluded from the results of continuing operations in the relevant periods, except as otherwise indicated.
|
•
|
Client Solutions Group ("CSG")
— Offerings by CSG include branded hardware, such as desktop PCs, notebooks, and workstations, and branded peripherals, such as monitors, and projectors. CSG also offers attached software, peripherals, and services, including support and deployment, configuration, and extended warranty services.
|
Approximately half of CSG revenue is generated by sales to customers in the Americas, with the remaining portion derived from sales to customers in the Europe, Middle East, and Africa region ("EMEA") and the Asia-Pacific and Japan region ("APJ").
|
•
|
Infrastructure Solutions Group ("ISG")
— EMC's Information Storage segment and our former Enterprise Solutions Group were merged to create the Infrastructure Solutions Group, which contains storage, server, and networking offerings. The comprehensive portfolio of advanced storage solutions includes traditional storage solutions as well as next-generation storage solutions (including all-flash arrays and scale-out file, and object platforms). The server portfolio includes high-performance rack, blade, tower, and hyperscale servers. The networking portfolio enables our business customers to transform and modernize their infrastructure, mobilize and enrich end-user experiences, and accelerate business applications and processes. ISG also offers attached software, peripherals, and services, including support and deployment, configuration, and extended warranty services.
|
Approximately half of ISG revenue is generated by sales to customers in the Americas, with the remaining portion derived from sales to customers in EMEA and APJ.
|
•
|
VMware
— The VMware reportable segment ("VMware") reflects the operations of VMware, Inc. (NYSE: VMW) within Dell Technologies. See Exhibit 99.1 filed with this report for further details on the differences between VMware reportable segment results and VMware, Inc. results.
|
VMware provides compute, cloud, mobility, networking and security infrastructure software to businesses that provides a flexible digital foundation for the applications that empower businesses to serve their customers globally. VMware offers a broad portfolio of virtualization technologies across three main product groups: software-defined data center; hybrid cloud computing; and end-user computing.
Approximately half of VMware revenue is generated by sales to customers in the United States.
Our other businesses, described below, consist of product and service offerings of RSA, SecureWorks, Pivotal, and Boomi. These businesses are not classified as reportable segments, either individually or collectively, as the results of the businesses are not material to our overall results and the businesses do not meet the criteria for reportable segments.
|
•
|
RSA
provides essential cybersecurity solutions engineered to enable organizations to detect, investigate, and respond to advanced attacks, confirm and manage identities, and, ultimately, help reduce IP theft, fraud, and cybercrime.
|
|
•
|
SecureWorks
(NASDAQ: SCWX) is a leading global provider of intelligence-driven information security solutions singularly focused on protecting its clients from cyber attacks.
|
43
|
•
|
Pivotal
provides a leading cloud-native platform that makes software development and IT operations a strategic advantage for customers. Pivotal's cloud-native platform, Pivotal Cloud Foundry, accelerates and streamlines software development by reducing the complexity of building, deploying and operating new cloud-native applications and modernizing legacy applications. On March 23, 2018, in preparation for an initial public offering of Pivotal's Class A common stock, Pivotal filed a registration statement on Form S-1 with the SEC. No public market currently exists for Pivotal's Class A common stock.
|
|
•
|
Boomi
specializes in cloud-based integration, connecting information between existing on-premise and cloud-based applications to ensure business processes are optimized, data is accurate and workflow is reliable.
|
See
Note 22
of the
Notes to the Consolidated Financial Statements
included in this report for more information about our other businesses.
For further discussion regarding our current reportable segments, see "Results of Operations — Business Unit Results."
Dell Financial Services
We also offer or arrange various financing options and services for our customers in North America, Europe, Australia, and New Zealand through Dell Financial Services and its affiliates ("DFS"). DFS services include originating, collecting, and servicing customer receivables primarily related to the purchase of Dell Technologies products. The results of these operations are allocated to our segments based on the underlying product or service financed. For additional information about our financing arrangements, see
Note 7
of the
Notes to the Consolidated Financial Statements
included in this report.
Strategic Investments and Acquisitions
As part of our strategy, we will continue to evaluate opportunities for strategic investments through our venture capital investment arm, Dell Technologies Capital, with a focus on emerging technology areas that are relevant to the Dell Technologies' unique family of businesses and that will complement our existing portfolio of solutions. Our investment areas include storage, software-defined networking, management and orchestration, security, machine learning and artificial intelligence, Big Data and analytics, cloud, Internet of Things, and software development operations. In addition to these investments, we also may make disciplined acquisitions targeting businesses that advance our strategic objectives.
Business Trends and Challenges
We are seeing an unprecedented rate of change in the IT industry. Organizations of all kinds are embracing digital technology to achieve their business objectives. Our vision is to be an essential infrastructure company and leader in end-user computing, data center infrastructure solutions, virtualization, Internet of Things ("IoT"), and cloud software that our customers continue to trust and rely on for their IT solutions and transformations as they embrace the multi-cloud environment of today. To further advance this vision, we recently unveiled a new IoT strategy, division, and an array of solutions to support IoT adoption for our customers. We accelerate results for our customers by enabling them to be more efficient, mobile, informed, and secure. We continue to invest in research and development, sales, and other key areas of our business to deliver superior products and solutions capabilities and to drive execution of long-term sustainable growth. We believe that our results will benefit from an integrated go-to-market strategy, including enhanced coordination among the family of Dell Technologies companies, and from our differentiated products and solutions capabilities. We intend to continue to execute on our business model and seek to balance liquidity, profitability, and growth to position our company for long-term success.
We are able to leverage our traditional strength in the PC market to offer solutions and services that provide higher-value, recurring revenue streams. Given current market trends, we expect that the demand environment will continue to be cyclical and that competitive dynamics will continue to pressure our CSG business. However, we are committed to a long-term growth strategy that we believe will benefit from the consolidation trends that are occurring in our markets. Our CSG offerings remain an important element of our strategy, generating strong cash flow and opportunities for cross-selling of complementary solutions.
44
We expect that ISG will continue to be impacted by the changing nature of the IT infrastructure market and competitive environment. Cloud-native applications are expected to continue as a primary growth driver in the infrastructure market as IT organizations increasingly become multi-cloud environments. We believe the complementary cloud solutions across our business, created through our combination with EMC, strongly position us to meet these demands for our customers who are increasingly looking to leverage cloud-based computing. We also continue to be impacted by the emerging trends of enterprises deploying software-defined storage, hyper-converged infrastructure, and modular solutions based on server-centric architectures. These trends have put pressure on our traditional storage offerings, and we are focused on strategically repositioning our storage portfolio. We have leading solutions through our ISG and VMware data center offerings. In addition, through our research and development efforts, we expect to develop new solutions in this rapidly changing industry that we believe will enable us to continue to provide superior solutions to our customers.
In ISG, we are also seeing increased interest in flexible consumption models by our customers as they seek to build greater flexibility into their cost structures. These solutions are generally multi-year contracts that typically result in recognition of revenue over the term of the arrangement. We expect these flexible consumption models will further strengthen our customer relationships, and will provide more predictable revenue streams over time.
During Fiscal 2018, we experienced higher component costs that primarily impacted CSG and ISG. We expect this trend to moderate in Fiscal 2019.
We manage our business on a U.S. dollar basis. However, we have a large global presence, generating approximately half of our revenue by sales to customers outside of the United States during Fiscal 2018 and Fiscal 2017. Our revenues, therefore, can be impacted by fluctuations in foreign currency exchange rates. We utilize a comprehensive hedging strategy intended to mitigate the impact of foreign currency volatility over time, and we adjust pricing when possible to further minimize foreign currency impacts. The percentage of our revenues generated in regions outside of the United States did not change substantially as a result of the EMC merger transaction.
EMC Merger Transaction
As described in
Note 3
of the
Notes to the Consolidated Financial Statements
included in this report, on September 7, 2016, a wholly-owned subsidiary of Dell Technologies Inc. ("Merger Sub") merged with and into EMC Corporation, a Massachusetts corporation ("EMC"), with EMC surviving the merger as a wholly-owned subsidiary of Dell Technologies Inc. (the "EMC merger transaction").
Pursuant to the terms of the merger agreement, upon the completion of the EMC merger transaction, each issued and outstanding share of common stock, par value
$0.01
per share, of EMC (approximately
2.0 billion
as of September 7, 2016) was converted into the right to receive (1)
$24.05
in cash, without interest, and (2)
0.11146
validly issued, fully paid and non-assessable shares of common stock of Dell Technologies Inc. designated as Class V Common Stock, par value
$0.01
per share, plus cash in lieu of any fractional shares. Shares of the Class V Common Stock were approved for listing on the New York Stock Exchange (the "NYSE") under the ticker symbol "DVMT" and began trading on September 7, 2016.
In connection with the EMC merger transaction, all principal, accrued but unpaid interest, fees, and other amounts (other than certain contingent obligations) outstanding at the effective time of the EMC merger transaction under EMC's unsecured revolving credit facility, Dell's asset-based revolving credit facility, and Dell's term facilities were substantially repaid concurrently with the closing. Further, all commitments to lend and guarantees and security interests, as applicable, in connection therewith were terminated or released. The aggregate amounts of principal, interest, and premium necessary to redeem in full the outstanding $1.4 billion in aggregate principal amount of 5.625% Senior First Lien Notes due 2020 co-issued by Dell International and Denali Finance Corp. were deposited with the trustee for such notes, and such notes were thereby satisfied and discharged, concurrently with the effective time of the EMC merger transaction. All of Dell's other outstanding senior notes and all of EMC's outstanding senior notes remained outstanding after the effective time of the EMC merger transaction in accordance with their respective terms.
Dell Technologies financed the EMC merger transaction, the repayment of the foregoing indebtedness of EMC and Dell outstanding as of the closing of the EMC merger transaction, and the payment of related fees and expenses, with debt financing arrangements in an aggregate principal amount of approximately
$45.9 billion
, equity financing arrangements of approximately
$4.4 billion
, and cash on hand of approximately
$7.8 billion
.
See
Note 3
and
Note 8
to the Consolidated Financial Statements included in this report for additional information regarding the EMC merger transaction and the related financing transactions.
45
NON-GAAP FINANCIAL MEASURES
In this management's discussion and analysis, we use supplemental measures of our performance which are derived from our consolidated financial information but which are not presented in our consolidated financial statements prepared in accordance with accounting principles generally accepted in the United States of America ("GAAP"). These non-GAAP financial measures include non-GAAP product net revenue; non-GAAP services net revenue; non-GAAP net revenue; non-GAAP product gross margin; non-GAAP services gross margin; non-GAAP gross margin; non-GAAP operating expenses; non-GAAP operating income; non-GAAP net income from continuing operations; earnings before interest and other, net, taxes, depreciation and amortization ("EBITDA"); and adjusted EBITDA.
We use non-GAAP financial measures to supplement financial information presented on a GAAP basis. We believe that excluding certain items from our GAAP results allows management to better understand our consolidated financial performance from period to period and better project our future consolidated financial performance as forecasts are developed at a level of detail different from that used to prepare GAAP-based financial measures. Moreover, we believe these non-GAAP financial measures provide our stakeholders with useful information to help them evaluate our operating results by facilitating an enhanced understanding of our operating performance and enabling them to make more meaningful period to period comparisons.
There are limitations to the use of the non-GAAP financial measures presented in this report. Our non-GAAP financial measures may not be comparable to similarly titled measures of other companies. Other companies, including companies in our industry, may calculate non-GAAP financial measures differently than we do, limiting the usefulness of those measures for comparative purposes.
Non-GAAP product net revenue, non-GAAP services net revenue, non-GAAP net revenue, non-GAAP product gross margin, non-GAAP services gross margin, non-GAAP gross margin, non-GAAP operating expenses, non-GAAP operating income, and non-GAAP net income from continuing operations, as defined by us, exclude the impact of purchase accounting, amortization of intangible assets, transaction-related expenses, other corporate expenses and, for non-GAAP net income from continuing operations, an aggregate adjustment for income taxes. As the excluded items have a material impact on our financial results, our management compensates for this limitation by relying primarily on our GAAP results and using non-GAAP financial measures supplementally or for projections when comparable GAAP financial measures are not available. The non-GAAP financial measures are not meant to be considered as indicators of performance in isolation from or as a substitute for net revenue, gross margin, operating expenses, operating income, or net income prepared in accordance with GAAP, and should be read only in conjunction with financial information presented on a GAAP basis.
Reconciliations of each non-GAAP financial measure to its most directly comparable GAAP financial measure are presented below. We encourage you to review the reconciliations in conjunction with the presentation of the non-GAAP financial measures for each of the periods presented. See the discussion below for more information on each of the excluded items as well as our reasons for excluding them from our non-GAAP results. In future fiscal periods, we may exclude such items and may incur income and expenses similar to these excluded items. Accordingly, the exclusion of these items and other similar items in our non-GAAP presentation should not be interpreted as implying that these items are non-recurring, infrequent, or unusual.
The following is a summary of the items excluded from the most comparable GAAP financial measures to calculate our non-GAAP financial measures:
|
•
|
Amortization of Intangible Assets
—
Amortization of intangible assets primarily consists of amortization of customer relationships, developed technology, and trade names. In connection with the EMC merger transaction and the acquisition of Dell Inc. by Dell Technologies Inc. on October 29, 2013, referred to as the going-private transaction, all of the tangible and intangible assets and liabilities of EMC and Dell, respectively, were accounted for and recognized at fair value on the transaction dates. Accordingly, for the periods presented, amortization of intangible assets represents amortization associated with intangible assets recognized in connection with the EMC merger transaction and the going-private transaction. Amortization charges for purchased intangible assets are significantly impacted by the timing and magnitude of our acquisitions, and these charges may vary in amount from period to period. We exclude these charges for purposes of calculating the non-GAAP financial measures presented below to facilitate a more meaningful evaluation of our current operating performance and comparisons to our past operating performance.
|
|
•
|
Impact of Purchase Accounting
—
The impact of purchase accounting includes purchase accounting adjustments, related to the EMC merger transaction and the going-private transaction, recorded under the acquisition method of accounting in
|
46
accordance with the accounting guidance for business combinations. This guidance prescribes that the purchase price be allocated to assets acquired and liabilities assumed based on the estimated fair value of such assets and liabilities on the date of the transaction. Accordingly, all of the assets and liabilities acquired in the EMC merger transaction and the going-private transaction were accounted for and recognized at fair value as of the respective transaction dates, and the fair value adjustments are being amortized over the estimated useful lives in the periods following the transactions. The fair value adjustments primarily relate to deferred revenue, inventory, and property, plant, and equipment. The purchase accounting adjustments and related amortization of those adjustments are reflected in our GAAP results; however, we evaluate the operating results of the underlying businesses on a non-GAAP basis, after removing such adjustments. We believe that excluding the impact of purchase accounting provides results that are useful in understanding our current operating performance and provides more meaningful comparisons to our past operating performance.
|
•
|
Transaction-related Expenses
—
Transaction-related expenses consist of acquisition, integration, and divestiture related costs, and are expensed as incurred. These expenses primarily represent costs for legal, banking, consulting, and advisory services, as well as certain compensatory retention awards directly related to the EMC merger transaction and related integration. During Fiscal 2017, transaction-related expenses includes $0.8 billion in day one stock-based compensation charges primarily related to the acceleration of vesting of EMC stock options and related taxes incurred in connection with the EMC merger transaction.
|
|
•
|
Other Corporate Expenses
— Other corporate expenses consists of severance, facility action costs, and stock-based compensation expense associated with equity awards. Severance costs are primarily related to severance and benefits for employees terminated pursuant to cost savings initiatives. Facility action costs were $0.2 billion during Fiscal 2018. We expect to incur additional costs in Fiscal 2019 as we continue to integrate owned and leased facilities and as we seek opportunities for operational efficiencies and cost savings. Other corporate expenses vary from period to period and are significantly impacted by the timing and nature of these events. Therefore, although we may incur these types of expenses in the future, we believe that eliminating these charges for purposes of calculating the non-GAAP financial measures presented below facilitates a more meaningful evaluation of our current operating performance and comparisons to our past operating performance.
|
|
•
|
Aggregate Adjustment for Income Taxes
— The aggregate adjustment for income taxes is the estimated combined income tax effect for the adjustments described above. During Fiscal 2018, this amount includes a provisional tax benefit of
$0.3 billion
which was recorded in the fourth quarter of Fiscal 2018 related to the Tax Cuts and Jobs Act of 2017 (“U.S. Tax Reform” or the “Act”) which was signed into law on December 22, 2017. For further information regarding U.S. Tax Reform, see
Note 14
of the
Notes to the Consolidated Financial Statements
included in this report. During Fiscal 2017, this amount also includes tax charges of
$0.2 billion
on previously untaxed earnings of a foreign subsidiary that will no longer be permanently reinvested as a result of the Dell Services and DSG divestitures. The tax effects are determined based on the tax jurisdictions where the above items were incurred.
|
47
The table below presents a reconciliation of each non-GAAP financial measure to the most directly comparable GAAP measure for each of
the
periods presented:
|
|
Fiscal Year Ended
|
||||||||||||||||
|
|
February 2, 2018
|
% Change
|
February 3, 2017
|
% Change
|
January 29, 2016
|
||||||||||||
|
(in millions, except percentages)
|
|||||||||||||||||
|
Product net revenue
|
$
|
58,801
|
|
21
|
%
|
$
|
48,706
|
|
14
|
%
|
$
|
42,742
|
|
||||
|
Non-GAAP adjustments:
|
|||||||||||||||||
|
Impact of purchase accounting
|
170
|
|
300
|
|
(27
|
)
|
|||||||||||
|
Non-GAAP product net revenue
|
$
|
58,971
|
|
20
|
%
|
$
|
49,006
|
|
15
|
%
|
$
|
42,715
|
|
||||
|
Services net revenue
|
$
|
19,859
|
|
54
|
%
|
12,936
|
|
58
|
%
|
8,169
|
|
||||||
|
Non-GAAP adjustments:
|
|||||||||||||||||
|
Impact of purchase accounting
|
1,099
|
|
880
|
|
486
|
|
|||||||||||
|
Non-GAAP services net revenue
|
$
|
20,958
|
|
52
|
%
|
$
|
13,816
|
|
60
|
%
|
$
|
8,655
|
|
||||
|
Net revenue
|
$
|
78,660
|
|
28
|
%
|
61,642
|
|
21
|
%
|
50,911
|
|
||||||
|
Non-GAAP adjustments:
|
|||||||||||||||||
|
Impact of purchase accounting
|
1,269
|
|
1,180
|
|
459
|
|
|||||||||||
|
Non-GAAP net revenue
|
$
|
79,929
|
|
27
|
%
|
$
|
62,822
|
|
22
|
%
|
$
|
51,370
|
|
||||
|
Product gross margin
|
$
|
8,586
|
|
31
|
%
|
6,537
|
|
26
|
%
|
5,179
|
|
||||||
|
Non-GAAP adjustments:
|
|||||||||||||||||
|
Amortization of intangibles
|
3,694
|
|
1,652
|
|
392
|
|
|||||||||||
|
Impact of purchase accounting
|
213
|
|
1,104
|
|
30
|
|
|||||||||||
|
Transaction-related expenses
|
11
|
|
24
|
|
1
|
|
|||||||||||
|
Other corporate expenses
|
25
|
|
29
|
|
9
|
|
|||||||||||
|
Non-GAAP product gross margin
|
$
|
12,529
|
|
34
|
%
|
$
|
9,346
|
|
67
|
%
|
$
|
5,611
|
|
||||
|
Services gross margin
|
$
|
11,468
|
|
79
|
%
|
6,422
|
|
100
|
%
|
3,208
|
|
||||||
|
Non-GAAP adjustments:
|
|||||||||||||||||
|
Amortization of intangibles
|
—
|
|
1
|
|
—
|
|
|||||||||||
|
Impact of purchase accounting
|
1,099
|
|
903
|
|
482
|
|
|||||||||||
|
Transaction-related expenses
|
13
|
|
19
|
|
5
|
|
|||||||||||
|
Other corporate expenses
|
76
|
|
128
|
|
1
|
|
|||||||||||
|
Non-GAAP services gross margin
|
$
|
12,656
|
|
69
|
%
|
$
|
7,473
|
|
102
|
%
|
$
|
3,696
|
|
||||
|
Gross margin
|
$
|
20,054
|
|
55
|
%
|
12,959
|
|
55
|
%
|
8,387
|
|
||||||
|
Non-GAAP adjustments:
|
|||||||||||||||||
|
Amortization of intangibles
|
3,694
|
|
1,653
|
|
392
|
|
|||||||||||
|
Impact of purchase accounting
|
1,312
|
|
2,007
|
|
512
|
|
|||||||||||
|
Transaction-related expenses
|
24
|
|
43
|
|
6
|
|
|||||||||||
|
Other corporate expenses
|
101
|
|
157
|
|
10
|
|
|||||||||||
|
Non-GAAP gross margin
|
$
|
25,185
|
|
50
|
%
|
$
|
16,819
|
|
81
|
%
|
$
|
9,307
|
|
||||
48
|
|
Fiscal Year Ended
|
||||||||||||||||
|
|
February 2, 2018
|
% Change
|
February 3, 2017
|
% Change
|
January 29, 2016
|
||||||||||||
|
(in millions, except percentages)
|
|||||||||||||||||
|
Operating expenses
|
$
|
23,387
|
|
44
|
%
|
$
|
16,211
|
|
82
|
%
|
$
|
8,901
|
|
||||
|
Non-GAAP adjustments:
|
|||||||||||||||||
|
Amortization of intangibles
|
(3,286
|
)
|
(2,028
|
)
|
(1,577
|
)
|
|||||||||||
|
Impact of purchase accounting
|
(234
|
)
|
(287
|
)
|
(92
|
)
|
|||||||||||
|
Transaction-related expenses
|
(478
|
)
|
(1,445
|
)
|
(103
|
)
|
|||||||||||
|
Other corporate expenses
|
(1,059
|
)
|
(745
|
)
|
(47
|
)
|
|||||||||||
|
Non-GAAP operating expenses
|
$
|
18,330
|
|
57
|
%
|
$
|
11,706
|
|
65
|
%
|
$
|
7,082
|
|
||||
|
Operating loss
|
$
|
(3,333
|
)
|
(2
|
)%
|
$
|
(3,252
|
)
|
(533
|
)%
|
$
|
(514
|
)
|
||||
|
Non-GAAP adjustments:
|
|||||||||||||||||
|
Amortization of intangibles
|
6,980
|
|
3,681
|
|
1,969
|
|
|||||||||||
|
Impact of purchase accounting
|
1,546
|
|
2,294
|
|
604
|
|
|||||||||||
|
Transaction-related expenses
|
502
|
|
1,488
|
|
109
|
|
|||||||||||
|
Other corporate expenses
|
1,160
|
|
902
|
|
57
|
|
|||||||||||
|
Non-GAAP operating income
|
$
|
6,855
|
|
34
|
%
|
$
|
5,113
|
|
130
|
%
|
$
|
2,225
|
|
||||
|
Net loss from continuing operations
|
$
|
(3,855
|
)
|
(3
|
)%
|
$
|
(3,737
|
)
|
(220
|
)%
|
$
|
(1,168
|
)
|
||||
|
Non-GAAP adjustments:
|
|||||||||||||||||
|
Amortization of intangibles
|
6,980
|
|
3,681
|
|
1,969
|
|
|||||||||||
|
Impact of purchase accounting
|
1,546
|
|
2,294
|
|
604
|
|
|||||||||||
|
Transaction-related expenses
|
502
|
|
1,485
|
|
83
|
|
|||||||||||
|
Other corporate expenses
|
1,160
|
|
902
|
|
77
|
|
|||||||||||
|
Aggregate adjustment for income taxes
|
(2,673
|
)
|
(1,938
|
)
|
(512
|
)
|
|||||||||||
|
Non-GAAP net income from continuing operations
|
$
|
3,660
|
|
36
|
%
|
$
|
2,687
|
|
155
|
%
|
$
|
1,053
|
|
||||
In addition to the above measures, we also use EBITDA and adjusted EBITDA to provide additional information for evaluation of our operating performance. Adjusted EBITDA excludes purchase accounting adjustments related to the EMC merger transaction and the going-private transaction, acquisition, integration, and divestiture related costs, severance and facility action costs, and stock-based compensation expense. We believe that, due to the non-operational nature of the purchase accounting entries, it is appropriate to exclude these adjustments.
As is the case with the non-GAAP measures presented above, users should consider the limitations of using EBITDA and adjusted EBITDA, including the fact that those measures do not provide a complete measure of our operating performance. EBITDA and adjusted EBITDA do not purport to be alternatives to net income (loss) as measures of operating performance or to cash flows from operating activities as a measure of liquidity. In particular, EBITDA and adjusted EBITDA are not intended to be a measure of free cash flow available for management's discretionary use, as these measures do not consider certain cash requirements, such as working capital needs, capital expenditures, contractual commitments, interest payments, tax payments, and other debt service requirements.
49
The table below presents a reconciliation of EBITDA and adjusted EBITDA to net loss from continuing operations for the periods presented:
|
Fiscal Year Ended
|
|||||||||||||||||
|
|
February 2, 2018
|
% Change
|
February 3, 2017
|
% Change
|
January 29, 2016
|
||||||||||||
|
(in millions, except percentages)
|
|||||||||||||||||
|
Net loss from continuing operations
|
$
|
(3,855
|
)
|
(3
|
)%
|
$
|
(3,737
|
)
|
(220
|
)%
|
$
|
(1,168
|
)
|
||||
|
Adjustments:
|
|||||||||||||||||
|
Interest and other, net (a)
|
2,355
|
|
2,104
|
|
772
|
|
|||||||||||
|
Income tax provision (benefit)
|
(1,833
|
)
|
(1,619
|
)
|
(118
|
)
|
|||||||||||
|
Depreciation and amortization
|
8,634
|
|
4,840
|
|
2,494
|
|
|||||||||||
|
EBITDA
|
$
|
5,301
|
|
234
|
%
|
$
|
1,588
|
|
(20
|
)%
|
$
|
1,980
|
|
||||
|
EBITDA
|
$
|
5,301
|
|
234
|
%
|
$
|
1,588
|
|
(20
|
)%
|
$
|
1,980
|
|
||||
|
Adjustments:
|
|||||||||||||||||
|
Stock-based compensation expense
|
835
|
|
392
|
|
63
|
|
|||||||||||
|
Impact of purchase accounting (b)
|
1,274
|
|
1,926
|
|
487
|
|
|||||||||||
|
Transaction-related expenses (c)
|
502
|
|
1,525
|
|
83
|
|
|||||||||||
|
Other corporate expenses (d)
|
305
|
|
510
|
|
20
|
|
|||||||||||
|
Adjusted EBITDA
|
$
|
8,217
|
|
38
|
%
|
$
|
5,941
|
|
126
|
%
|
$
|
2,633
|
|
||||
________________
|
(a)
|
See "Results of Operations — Interest and Other, Net" for more information on the components of interest and other, net.
|
|
(b)
|
This amount includes the non-cash purchase accounting adjustments related to the EMC merger transaction and the going-private transaction.
|
|
(c)
|
Transaction-related expenses consist of acquisition, integration, and divestiture related costs.
|
|
(d)
|
Consists of severance and facility action costs.
|
50
RESULTS OF OPERATIONS
Consolidated Results
The following table summarizes our consolidated results from continuing operations for each of the periods presented. Unless otherwise indicated, all changes identified for the current-period results represent comparisons to results for the prior corresponding fiscal period.
|
Fiscal Year Ended
|
|||||||||||||||||||||||||||
|
|
February 2, 2018
|
February 3, 2017
|
January 29, 2016
|
||||||||||||||||||||||||
|
|
Dollars
|
% of
Net Revenue |
%
Change |
Dollars
|
% of
Net Revenue |
%
Change |
Dollars
|
% of
Net Revenue |
|||||||||||||||||||
|
(in millions, except percentages)
|
|||||||||||||||||||||||||||
|
Net revenue:
|
|||||||||||||||||||||||||||
|
Product
|
$
|
58,801
|
|
74.8
|
%
|
21
|
%
|
$
|
48,706
|
|
79.0
|
%
|
14
|
%
|
$
|
42,742
|
|
84.0
|
%
|
||||||||
|
Services
|
19,859
|
|
25.2
|
%
|
54
|
%
|
12,936
|
|
21.0
|
%
|
58
|
%
|
8,169
|
|
16.0
|
%
|
|||||||||||
|
Total net revenue
|
$
|
78,660
|
|
100.0
|
%
|
28
|
%
|
$
|
61,642
|
|
100.0
|
%
|
21
|
%
|
$
|
50,911
|
|
100.0
|
%
|
||||||||
|
Gross margin:
|
|||||||||||||||||||||||||||
|
Product (a)
|
$
|
8,586
|
|
14.6
|
%
|
31
|
%
|
$
|
6,537
|
|
13.4
|
%
|
26
|
%
|
$
|
5,179
|
|
12.1
|
%
|
||||||||
|
Services (b)
|
11,468
|
|
57.7
|
%
|
79
|
%
|
6,422
|
|
49.6
|
%
|
100
|
%
|
3,208
|
|
39.3
|
%
|
|||||||||||
|
Total gross margin
|
$
|
20,054
|
|
25.5
|
%
|
55
|
%
|
$
|
12,959
|
|
21.0
|
%
|
55
|
%
|
$
|
8,387
|
|
16.5
|
%
|
||||||||
|
Operating expenses
|
$
|
23,387
|
|
29.7
|
%
|
44
|
%
|
$
|
16,211
|
|
26.3
|
%
|
82
|
%
|
$
|
8,901
|
|
17.5
|
%
|
||||||||
|
Operating loss
|
$
|
(3,333
|
)
|
(4.2
|
)%
|
(2
|
)%
|
$
|
(3,252
|
)
|
(5.3
|
)%
|
(533
|
)%
|
$
|
(514
|
)
|
(1.0
|
)%
|
||||||||
|
Net loss from continuing operations
|
$
|
(3,855
|
)
|
(4.9
|
)%
|
(3
|
)%
|
$
|
(3,737
|
)
|
(6.1
|
)%
|
(220
|
)%
|
$
|
(1,168
|
)
|
(2.3
|
)%
|
||||||||
|
Net loss attributable to Dell Technologies Inc.
|
$
|
(3,728
|
)
|
(4.7
|
)%
|
(123
|
)%
|
$
|
(1,672
|
)
|
(2.7
|
)%
|
(51
|
)%
|
$
|
(1,104
|
)
|
(2.2
|
)%
|
||||||||
|
Non-GAAP Financial Information
|
|||||||||||||||||||||||||||
|
Non-GAAP net revenue:
|
|||||||||||||||||||||||||||
|
Product
|
$
|
58,971
|
|
73.8
|
%
|
20
|
%
|
$
|
49,006
|
|
78.0
|
%
|
15
|
%
|
$
|
42,715
|
|
83.2
|
%
|
||||||||
|
Services
|
20,958
|
|
26.2
|
%
|
52
|
%
|
13,816
|
|
22.0
|
%
|
60
|
%
|
8,655
|
|
16.8
|
%
|
|||||||||||
|
Total non-GAAP net revenue
|
$
|
79,929
|
|
100.0
|
%
|
27
|
%
|
$
|
62,822
|
|
100.0
|
%
|
22
|
%
|
$
|
51,370
|
|
100.0
|
%
|
||||||||
|
Non-GAAP gross margin:
|
|||||||||||||||||||||||||||
|
Product (a)
|
$
|
12,529
|
|
21.2
|
%
|
34
|
%
|
$
|
9,346
|
|
19.1
|
%
|
67
|
%
|
$
|
5,611
|
|
13.1
|
%
|
||||||||
|
Services (b)
|
12,656
|
|
60.4
|
%
|
69
|
%
|
7,473
|
|
54.1
|
%
|
102
|
%
|
3,696
|
|
42.7
|
%
|
|||||||||||
|
Total non-GAAP gross margin
|
$
|
25,185
|
|
31.5
|
%
|
50
|
%
|
$
|
16,819
|
|
26.8
|
%
|
81
|
%
|
$
|
9,307
|
|
18.1
|
%
|
||||||||
|
Non-GAAP operating expenses
|
$
|
18,330
|
|
22.9
|
%
|
57
|
%
|
$
|
11,706
|
|
18.6
|
%
|
65
|
%
|
$
|
7,082
|
|
13.8
|
%
|
||||||||
|
Non-GAAP operating income
|
$
|
6,855
|
|
8.6
|
%
|
34
|
%
|
$
|
5,113
|
|
8.1
|
%
|
130
|
%
|
$
|
2,225
|
|
4.3
|
%
|
||||||||
|
Non-GAAP net income from continuing operations
|
$
|
3,660
|
|
4.6
|
%
|
36
|
%
|
$
|
2,687
|
|
4.3
|
%
|
155
|
%
|
$
|
1,053
|
|
2.0
|
%
|
||||||||
|
EBITDA
|
$
|
5,301
|
|
6.6
|
%
|
234
|
%
|
$
|
1,588
|
|
2.5
|
%
|
(20
|
)%
|
$
|
1,980
|
|
3.9
|
%
|
||||||||
|
Adjusted EBITDA
|
$
|
8,217
|
|
10.3
|
%
|
38
|
%
|
$
|
5,941
|
|
9.5
|
%
|
126
|
%
|
$
|
2,633
|
|
5.1
|
%
|
||||||||
____________________
|
(a)
|
Product gross margin percentages represent product gross margin as a percentage of product net revenue, and non-GAAP product gross margin percentages represent product gross margin as a percentage of non-GAAP product net revenue.
|
|
(b)
|
Services gross margin percentages represent services gross margin as a percentage of services net revenue, and non-GAAP services gross margin percentages represent services gross margin as a percentage of non-GAAP services net revenue.
|
51
Non-GAAP product net revenue, non-GAAP services net revenue, non-GAAP net revenue, non-GAAP product gross margin, non-GAAP services gross margin, non-GAAP gross margin, non-GAAP operating expenses, non-GAAP operating income, non-GAAP net income from continuing operations, EBITDA, and adjusted EBITDA are not measurements of financial performance prepared in accordance with GAAP. Non-GAAP financial measures as a percentage of revenue are calculated based on non-GAAP net revenue. See "Non-GAAP Financial Measures" for information about these non-GAAP financial measures, including our reasons for including these measures, material limitations with respect to the usefulness of the measures, and a reconciliation of each non-GAAP financial measure to the most directly comparable GAAP financial measure.
As a result of the EMC merger transaction completed on September 7, 2016 and its impact on Fiscal 2017 results, our results for the fiscal periods discussed below are not directly comparable.
Overview
During Fiscal 2018, our net revenue and non-GAAP net revenue increased
28%
and
27%
, respectively. The increase in net revenue and non-GAAP net revenue was attributable to the incremental net revenue from the EMC acquired businesses and, to a lesser extent, an increase in CSG net revenue. The EMC merger transaction had an impact on the mix of revenue contributed by our business units. CSG net revenue represented approximately 50% of our net revenue during Fiscal 2018. In comparison, CSG net revenue constituted a higher proportion of our net revenue during Fiscal 2017, representing approximately 60% of our net revenue.
Our operating loss increased
2%
during Fiscal 2018, primarily due to higher operating expenses from the EMC acquired businesses, mostly offset by an increase in gross margin. While the EMC acquired businesses contributed higher gross margin overall, we experienced gross margin pressure in ISG related to the changing product mix within ISG as well as component cost inflation, particularly for memory components used in ISG products.
Our operating loss was impacted by purchase accounting adjustments associated with the EMC merger transaction and, to a lesser extent, the going-private transaction, amortization of intangible assets, transaction-related expenses, and other corporate expenses. In aggregate, these items totaled
$10.2 billion
and
$8.4 billion
for Fiscal 2018 and Fiscal 2017, respectively. Excluding these adjustments, non-GAAP operating income during Fiscal 2018 increased
34%
to
$6.9 billion
, primarily as a result of an increase in operating income for VMware and, to a lesser extent, CSG.
Cash provided by operating activities was
$6.8 billion
during Fiscal 2018. The increase in operating cash flows during Fiscal 2018 was driven by improved profitability, including the incremental profitability from the EMC acquired businesses, and ongoing working capital initiatives. See "Market Conditions, Liquidity, Capital Commitments, and Contractual Cash Obligations" for further information on our cash flow metrics.
Net Revenue
Fiscal 2018 compared to Fiscal 2017
During Fiscal 2018, our net revenue and non-GAAP net revenue increased
28%
, and
27%
, respectively, primarily due to the incremental net revenue from the EMC acquired businesses and, to a lesser extent, an increase in CSG net revenue. See "Business Unit Results" for further information.
|
•
|
Product Net Revenue
— Product net revenue includes revenue from the sale of hardware products and software licenses. During Fiscal 2018, product net revenue and non-GAAP product net revenue increased
21%
and
20%
, respectively, primarily due to the incremental product net revenue from the EMC acquired businesses and, to a lesser extent, an increase in CSG product net revenue. The increases in product net revenue and non-GAAP product net revenue during Fiscal 2018 were driven by strength in sales of notebooks, workstations, servers, and VMware license revenue.
|
|
•
|
Services Net Revenue
— Services net revenue includes revenue from our services offerings, third-party software license sales, and support services related to hardware products and software licenses. During Fiscal 2018, services net revenue and non-GAAP services net revenue increased
54%
and
52%
, respectively. These increases were primarily due to the incremental services net revenue from the EMC acquired businesses.
|
From a geographical perspective, net revenue generated by sales to customers in all regions increased in Fiscal 2018 primarily as a result of the incremental net revenue from the EMC acquired businesses. Our mix of revenues generated in the Americas, EMEA, and APJ did not change substantially as a result of the EMC merger transaction.
52
Fiscal 2017 compared to Fiscal 2016
During Fiscal 2017, our net revenue increased
21%
due to the favorable impact of net revenue from the EMC acquired businesses of approximately $9.2 billion, partially offset by purchase accounting adjustments of approximately $1.0 billion. An increase of 2% in CSG net revenue also contributed to higher net revenue during Fiscal 2017. Our non-GAAP net revenue increased
22%
during Fiscal 2017, primarily due to the impact from the EMC acquired businesses.
|
•
|
Product Net Revenue
— During Fiscal 2017, product net revenue increased
14%
, and non-GAAP product net revenue increased
15%
, primarily due to the impact from the EMC acquired businesses.
|
|
•
|
Services Net Revenue
— During Fiscal 2017, services net revenue increased
58%
due to the impact from the EMC acquired businesses. Non-GAAP services net revenue increased
60%
during Fiscal 2017.
|
See "Business Unit Results" for further information regarding revenue from our products, services, and software offerings.
From a geographical perspective, net revenue generated by sales to customers in all regions increased during Fiscal 2017 primarily as a result of the impact from the EMC acquired businesses.
Gross Margin
Fiscal 2018 compared to Fiscal 2017
During Fiscal 2018, our gross margin increased
55%
to
$20.1 billion
, and our gross margin percentage increased
450
basis points to
25.5%
. The increases in our gross margin and gross margin percentage were primarily attributable to incremental gross margin from the EMC acquired businesses, which have higher gross margin percentages. The effect of the higher gross margin and gross margin percentage was partially offset by the combined impact of amortization of intangibles and purchase accounting adjustments as a result of the EMC merger transaction.
Our gross margin for the Fiscal 2018 and Fiscal 2017 included the effect of amortization of intangibles and purchase accounting adjustments related to the EMC merger transaction and, to a lesser extent, the going-private transaction, of
$5.0 billion
and
$3.7 billion
, respectively. Excluding these costs, transaction-related expenses, and other corporate expenses, total non-GAAP gross margin for Fiscal 2018 increased
50%
to
$25.2 billion
and non-GAAP gross margin percentage increased
470
basis points to
31.5%
. The increase in non-GAAP gross margin and non-GAAP gross margin percentage was primarily attributable to incremental gross margin from the EMC acquired businesses.
|
•
|
Products
— During Fiscal 2018, product gross margin increased
31%
to
$8.6 billion
, and product gross margin percentage increased
120
basis points to
14.6%
. These increases in product gross margin and product gross margin percentage were driven primarily by additional product gross margin from the EMC acquired businesses, which was partially offset by an increase in amortization of intangibles related to the EMC merger transaction, and to a lesser extent, component cost pressures in CSG and ISG.
|
During Fiscal 2018, non-GAAP product gross margin increased
34%
to
$12.5 billion
, and non-GAAP product gross margin percentage increased
210
basis points to
21.2%
. The increase in non-GAAP product gross margin from the EMC acquired businesses was partially offset by component cost pressures in CSG and ISG. Gross margin strengthened throughout Fiscal 2018 as we managed our pricing in response to the cost environment during the period.
Our gross margins include benefits relating primarily to settlements from certain vendors regarding their past pricing practices. Vendor settlements are allocated to our segments based on the relative amount of affected vendor products sold by each segment. These benefits, which were entirely allocated to CSG, were
$68 million
and $80 million for Fiscal 2018 and Fiscal 2017, respectively.
|
•
|
Services
— During Fiscal 2018, services gross margin increased
79%
to
$11.5 billion
, and services gross margin percentage increased
810
basis points to
57.7%
. During Fiscal 2018, non-GAAP services gross margin increased
69%
to
$12.7 billion
, and non-GAAP services gross margin percentage increased
630
basis points to
60.4%
. These increases were primarily attributable to the incremental services gross margin from the EMC acquired businesses.
|
53
Fiscal 2017 compared to Fiscal 2016
During Fiscal 2017, our total gross margin increased
55%
to
$13.0 billion
, and our gross margin percentage increased 450 basis points to
21.0%
. The increase in our total gross margin was primarily attributable to incremental gross margin of approximately $3.7 billion from the EMC acquired businesses, which had higher gross margin percentages. Cost favorability in CSG also contributed to the improvement in total gross margin, but to a lesser extent. The effects of these factors on total gross margin were partially offset by the impact of purchase accounting adjustments and amortization of intangibles related to the EMC merger transaction and the going-private transaction.
Gross margin for Fiscal 2017 included the effect of
$3.7 billion
of amortization of intangibles and purchase accounting adjustments related to the EMC merger transaction and the going-private transaction. In comparison, the impacts of purchase
accounting adjustments and amortization of intangibles were
$0.9 billion
in Fiscal 2016, and in this period related only to the going-private transaction. During Fiscal 2017, our total non-GAAP gross margin increased
81%
to
$16.8 billion
and our non-GAAP gross margin percentage increased
870
basis points to
26.8%
. The increase in our total non-GAAP gross margin was primarily due to the impact from the EMC acquired businesses.
|
•
|
Products
— During Fiscal 2017, product gross margin increased
26%
to
$6.5 billion
, and product gross margin percentage increased
130
basis points to
13.4%
. These increases in product gross margin and product gross margin percentage were driven primarily by an increase in CSG gross margin due to a favorable cost position and a richer product mix and, to a lesser extent, by the incremental product gross margin attributable to the EMC acquired businesses.
|
During Fiscal 2017, non-GAAP product gross margin increased
67%
to
$9.3 billion
, and non-GAAP product gross margin percentage increased
600
basis points to
19.1%
. The increase in non-GAAP product gross margin was primarily attributable to the incremental product gross margin from the EMC acquired businesses and an increase in CSG gross margin.
|
•
|
Services
— During Fiscal 2017, our gross margin for services increased
100%
to
$6.4 billion
, and our services gross margin percentage increased
1,030
basis points to
49.6%
. The increase in services gross margin was primarily attributable to gross margin from the EMC acquired businesses. Purchase accounting adjustments totaled
$0.9 billion
during Fiscal 2017, compared to
$0.5 billion
during Fiscal 2016. Excluding these costs, transaction-related expenses and other corporate expenses, non-GAAP gross margin for services increased
102%
to
$7.5 billion
and services gross margin percentage increased
1,140
basis points to
54.1%
.
|
Vendor Programs and Settlements
Our gross margin is affected by our ability to achieve competitive pricing with our vendors and contract manufacturers, including through our negotiation of a variety of vendor rebate programs to achieve lower net costs for the various components we include in our products. Under these programs, vendors provide us with rebates or other discounts from the list prices for the components, which are generally elements of their pricing strategy. We account for vendor rebates and other discounts as a reduction in cost of net revenue. We manage our costs on a total net cost basis, which includes supplier list prices reduced by vendor rebates and other discounts.
The terms and conditions of our vendor rebate programs are largely based on product volumes and are generally negotiated either at the beginning of the annual or quarterly period, depending on the program. The timing and amount of vendor rebates and other discounts we receive under the programs may vary from period to period, reflecting changes in the competitive environment. We monitor our component costs and seek to address the effects of any changes to terms that might arise under our vendor rebate programs. Our gross margins for Fiscal 2018, Fiscal 2017, and Fiscal 2016 were not materially affected by any changes to the terms of our vendor rebate programs, as the amounts we received under these programs were generally stable relative to our total net cost. We are not aware of any significant changes to vendor pricing or rebate programs that may impact our results in the near term.
In addition, we have pursued legal action against certain vendors and are currently involved in negotiations with other vendors regarding their past pricing practices. We have negotiated settlements with some of these vendors and may have additional settlements in future periods. These settlements are allocated to our segments based on the relative amount of affected vendor products sold by each segment. Pricing settlements benefited product gross margins in Fiscal 2018, Fiscal 2017, and Fiscal 2016 by
$68 million
, $80 million, and $97 million, respectively.
54
Operating Expenses
The following table presents information regarding our operating expenses during each of the periods presented:
|
Fiscal Year Ended
|
||||||||||||||||||||||||||
|
|
February 2, 2018
|
February 3, 2017
|
January 29, 2016
|
|||||||||||||||||||||||
|
|
Dollars
|
% of
Net Revenue |
%
Change |
Dollars
|
% of
Net Revenue |
%
Change |
Dollars
|
% of
Net Revenue |
||||||||||||||||||
|
(in millions, except percentages)
|
||||||||||||||||||||||||||
|
Operating expenses:
|
||||||||||||||||||||||||||
|
Selling, general, and administrative
|
$
|
19,003
|
|
24.1
|
%
|
40
|
%
|
$
|
13,575
|
|
22.0
|
%
|
73
|
%
|
$
|
7,850
|
|
15.4
|
%
|
|||||||
|
Research and development
|
4,384
|
|
5.6
|
%
|
66
|
%
|
2,636
|
|
4.3
|
%
|
151
|
%
|
1,051
|
|
2.1
|
%
|
||||||||||
|
Total operating expenses
|
$
|
23,387
|
|
29.7
|
%
|
44
|
%
|
$
|
16,211
|
|
26.3
|
%
|
82
|
%
|
$
|
8,901
|
|
17.5
|
%
|
|||||||
|
Other Financial Information
|
||||||||||||||||||||||||||
|
Non-GAAP operating expenses
|
$
|
18,330
|
|
22.9
|
%
|
57
|
%
|
$
|
11,706
|
|
18.6
|
%
|
65
|
%
|
$
|
7,082
|
|
13.8
|
%
|
|||||||
Fiscal 2018 compared to Fiscal 2017
During Fiscal 2018, total operating expenses increased
44%
. Our operating expenses include the impact of purchase accounting associated with the EMC merger transaction and, to a lesser extent, the going-private transaction, amortization of intangible assets, transaction-related expenses, and other corporate expenses. In aggregate, these items totaled
$5.1 billion
and
$4.5 billion
for Fiscal 2018 and Fiscal 2017, respectively. Excluding these costs, total non-GAAP operating expenses increased
57%
. The increases in operating expenses and non-GAAP operating expenses were primarily due to the incremental operating costs from the EMC acquired businesses.
|
•
|
Selling, General, and Administrative
— Selling, general, and administrative ("SG&A") expenses increased
40%
during Fiscal 2018. The increases in SG&A expenses were primarily driven by incremental operating costs of the EMC acquired businesses.
|
|
•
|
Research and Development
—
Research and development ("R&D") expenses are primarily composed of personnel-related expenses related to product development. R&D expenses as a percentage of net revenue for Fiscal 2018 and Fiscal 2017 were approximately
5.6%
and
4.3%
, respectively. The increase in R&D expenses was attributable to the expansion of our R&D capability through the EMC merger transaction. As our industry continues to change and as the needs of our customers evolve, we intend to support R&D initiatives to innovate and introduce new and enhanced solutions into the market.
|
We will continue to balance our efforts to drive cost efficiencies in the business with strategic investments in areas that will enable growth, such as our sales force, marketing, and R&D.
Fiscal 2017 compared to Fiscal 2016
During Fiscal 2017, our total operating expenses increased
82%
. The increase in total operating expenses was primarily due to incremental costs associated with the EMC acquired businesses, including transaction-related expenses. These transaction-related expenses include consulting and advisory services and retention payments. Our operating expenses include purchase accounting adjustments associated with the EMC merger transaction and the going-private transaction, amortization of intangible assets, transaction-related expenses, and other corporate expenses. In aggregate, these items totaled
$4.5 billion
and
$1.8 billion
for Fiscal 2017 and Fiscal 2016, respectively. Excluding these costs, total non-GAAP operating expenses increased
65%
primarily due to the impact from the EMC acquired businesses.
|
•
|
Selling, General, and Administrative
— SG&A expenses increased
73%
during Fiscal 2017. The increases in SG&A expenses were primarily driven by incremental costs associated with the EMC acquired businesses and also reflected the impact of our increased investment in sales capabilities and marketing costs.
|
55
|
•
|
Research and Development
—
R&D expenses were approximately
4.3%
and
2.1%
of net revenue for Fiscal 2017 and Fiscal 2016, respectively. The increases in R&D expenses were attributable to the expansion of our R&D capability through the EMC merger transaction.
|
Operating Income/Loss
Fiscal 2018 compared to Fiscal 2017
Our operating loss increased
2%
during Fiscal 2018, primarily due to higher operating expenses from the EMC acquired businesses as well as an increase in amortization of intangibles related to the EMC merger transaction, mostly offset by an increase in gross margin. While the EMC acquired businesses contributed higher gross margin overall, we experienced gross margin pressure in ISG related to the changing product mix within ISG as well as component cost inflation, particularly for memory components used in ISG products.
Our operating loss includes the impact of purchase accounting associated with the EMC merger transaction and, to a lesser extent, the going-private transaction, amortization of intangible assets, transaction-related expenses, and other corporate expenses. In aggregate, these items totaled
$10.2 billion
and
$8.4 billion
for Fiscal 2018 and Fiscal 2017, respectively. Excluding these costs, non-GAAP operating income for Fiscal 2018 increased
34%
to
$6.9 billion
. The increase in non-GAAP operating income for Fiscal 2018 was attributable to an increase in operating income for VMware and CSG.
Fiscal 2017 compared to Fiscal 2016
Our operating loss was
$3.3 billion
and
$0.5 billion
during Fiscal 2017 and Fiscal 2016, respectively. The increase in operating loss was primarily attributable to higher operating expenses, partially offset by increases in gross margin. Our operating loss includes purchase accounting adjustments associated with the EMC merger transaction and the going-private transaction, amortization of intangible assets, transaction-related expenses, and other corporate expenses. In aggregate, these items totaled
$8.4 billion
and
$2.7 billion
for Fiscal 2017 and Fiscal 2016, respectively. Excluding these costs, non-GAAP operating income increased
130%
to
$5.1 billion
during Fiscal 2017. The increase in non-GAAP operating income was primarily attributable to an increase in gross margin, which was partially offset by higher operating expenses from the EMC acquired businesses.
Interest and Other, Net
The following table provides
information regarding
interest and other, net for each of the periods presented:
|
|
Fiscal Year Ended
|
||||||||||
|
|
February 2, 2018
|
February 3, 2017
|
January 29, 2016
|
||||||||
|
|
(in millions)
|
||||||||||
|
Interest and other, net:
|
|
|
|
|
|
|
|||||
|
Investment income, primarily interest
|
$
|
207
|
|
$
|
102
|
|
$
|
39
|
|
||
|
Gain (loss) on investments, net
|
72
|
|
4
|
|
(2
|
)
|
|||||
|
Interest expense
|
(2,406
|
)
|
(1,751
|
)
|
(680
|
)
|
|||||
|
Foreign exchange
|
(113
|
)
|
(77
|
)
|
(107
|
)
|
|||||
|
Debt extinguishment
|
—
|
|
(337
|
)
|
—
|
|
|||||
|
Other
|
(115
|
)
|
(45
|
)
|
(22
|
)
|
|||||
|
Total interest and other, net
|
$
|
(2,355
|
)
|
$
|
(2,104
|
)
|
$
|
(772
|
)
|
||
Fiscal 2018 compared to Fiscal 2017
During Fiscal 2018, changes in interest and other, net were unfavorable by
$251 million
primarily due to an increase in interest expense from new borrowings associated with the EMC merger transaction, which was partially offset by expenses incurred in Fiscal 2017 of approximately
$337 million
related to debt extinguishment and new borrowings that did not recur in Fiscal 2018. See
Note 8
of the
Notes to the Consolidated Financial Statements
included in this report for further information regarding our debt.
56
Fiscal 2017 compared to Fiscal 2016
During Fiscal 2017, changes in interest and other, net were unfavorable by
$1.3 billion
, primarily due to an increase in interest expense from higher average debt balances from debt issued in connection with the EMC merger transaction, and to costs related to debt extinguishment associated with that transaction.
Income and Other Taxes
On December 22, 2017, the Tax Cuts and Jobs Act of 2017 (“U.S. Tax Reform” or the “Act”) was signed into law. U.S. Tax Reform lowers the U.S. corporate income tax rate to 21% from 35% and establishes a modified territorial system requiring a mandatory deemed repatriation tax on undistributed earnings of foreign subsidiaries (the “Transition Tax”). For Fiscal 2019, U.S. Tax Reform also requires a minimum tax on certain future earnings generated by foreign subsidiaries while providing for future tax-free repatriation of earnings through a 100% dividends-received deduction, and places limitations on the deductibility of net interest expense.
GAAP requires the effect of a change in tax laws to be recognized in the period that includes the enactment date. Accordingly, we recognized a provisional tax benefit in the fourth quarter of Fiscal 2018 of $0.3 billion related to U.S. Tax Reform, primarily driven by a $1.3 billion tax benefit related to the remeasurement of deferred tax assets and liabilities, offset by $1.0 billion of current and future income tax expenses related to the Transition Tax.
Our effective income tax rates for continuing operations were
32.2%
,
30.2%
, and
9.2%
on pre-tax losses from continuing operations of
$5.7 billion
,
$5.4 billion
, and
$1.3 billion
for Fiscal 2018, Fiscal 2017, and Fiscal 2016, respectively. The change in our effective income tax rate for Fiscal 2018 as compared to Fiscal 2017 was primarily attributable to tax benefits from charges incurred associated with the EMC merger transaction, including purchase accounting adjustments, interest charges, and stock-based compensation expense. The change in our effective income tax rate was also impacted by tax benefits recognized in the current period related to U.S. Tax Reform, as well as by tax charges recognized in the prior year related to the divestiture of Dell Services and DSG. The change in our effective income tax rate for Fiscal 2017 as compared to Fiscal 2016 was primarily attributable to tax benefits from charges associated with the EMC merger transaction, including purchase accounting adjustments, interest charges, and stock-based compensation expense, which were primarily incurred in higher tax jurisdictions. See
Note 3
of the
Notes to the Consolidated Financial Statements
included in this report for more information on the EMC merger transaction.
Our effective income tax rate can fluctuate depending on the geographic distribution of our world-wide earnings, as our foreign earnings are generally taxed at lower rates than in the United States. In certain jurisdictions, our tax rate is significantly less than the applicable statutory rate as a result of tax holidays. The majority of our foreign income that is subject to these tax holidays and lower tax rates is attributable to Singapore, China, and Malaysia. A significant portion of these income tax benefits relates to a tax holiday that expired at the end of Fiscal 2017. We have negotiated new terms for the affected subsidiary. These new terms provide for a reduced income tax rate and will be effective for a two-year bridge period expiring at the end of Fiscal 2019. We are currently seeking new terms for the affected subsidiary beyond Fiscal 2019, and it is uncertain whether any terms will be agreed upon. Our other tax holidays will expire in whole or in part during Fiscal 2019 through Fiscal 2023. Many of these tax holidays and reduced tax rates may be extended when certain conditions are met or may be terminated early if certain conditions are not met. The differences between our effective income tax rate and the U.S. federal statutory rate of 33.7% principally resulted from the geographical distribution of taxable income discussed above and permanent differences between the book and tax treatment of certain items. As discussed above, starting in Fiscal 2019, our U.S. corporate income tax rate will be lowered from 35% to 21%. In addition, we will be subject to additional provisions of U.S. Tax Reform including a minimum tax on foreign earnings, and limitations on the deductibility of net interest expense. These provisions could have a material impact on our future effective income tax rate.
For further discussion regarding tax matters, including the status of income tax audits, see
Note 14
of the
Notes to the Consolidated Financial Statements
included in this report.
57
Net Income/Loss from Continuing Operations
Fiscal 2018 compared to Fiscal 2017
During Fiscal 2018, net loss from continuing operations increased
3%
to a net loss from continuing operations of
$3.9 billion
. The increase in net loss from continuing operations during Fiscal 2018 was primarily attributable to an increase in operating loss and to an increase in interest and other, net expense, which was partially offset by an increase in tax benefit. Net loss from continuing operations for Fiscal 2018 included amortization of intangible assets, the impact of purchase accounting,transaction-related expenses, and other corporate expenses. Excluding these costs and the related tax impacts, non-GAAP net income from continuing operations increased
36%
to
$3.7 billion
during the Fiscal 2018. The increase in non-GAAP net income from continuing operations during Fiscal 2018 was primarily attributable to increases in operating income, the effect of which was partially offset by increases in interest and other, net expense and income tax expense.
Fiscal 2017 compared to Fiscal 2016
During Fiscal 2017, net loss from continuing operations increased
220%
to a net loss from continuing operations of
$3.7 billion
. The increase in net loss from continuing operations for Fiscal 2017 was primarily attributable to an increase in operating loss and to an increase in interest and other, net expense. The effect of these factors was partially offset by an increase in tax benefit during the period. Net loss from continuing operations for Fiscal 2017 included amortization of intangible assets, purchase accounting adjustments, transaction-related expenses, and other corporate expenses. Excluding these costs, non-GAAP net income from continuing operations increased
155%
to
$2.7 billion
during Fiscal 2017. The increase in non-GAAP net income from continuing operations during Fiscal 2017 was primarily attributable to an increase in operating income, the effect of which was partially offset by an increase in interest and other, net expense.
Non-controlling Interests
Fiscal 2018 compared to Fiscal 2017
During Fiscal 2018 and Fiscal 2017, net loss attributable to non-controlling interests was
$127 million
and
$46 million
, respectively. Net loss attributable to non-controlling interests primarily consisted of net loss attributable to the non-controlling interest in VMware, Inc. For more information about our non-controlling interests, see
Note 16
of the
Notes to the Consolidated Financial Statements
included in this report.
Fiscal 2017 compared to Fiscal 2016
During Fiscal 2017, net loss attributable to non-controlling interests was $46 million. Net loss attributable to non-controlling interests was primarily attributable to the net loss attributable to non-controlling interest in VMware, Inc. of $41 million. During Fiscal 2016, Dell Technologies did not have any non-controlling interests.
Net Income/Loss Attributable to Dell Technologies Inc.
Fiscal 2018 compared to Fiscal 2017
Net loss attributable to Dell Technologies Inc. represents net income/loss from continuing operations, an adjustment for non-controlling interests, and, in Fiscal 2017, an adjustment for discontinued operations. During Fiscal 2018 and Fiscal 2017, net loss attributable to Dell Technologies Inc. was
$3.7 billion
and
$1.7 billion
, respectively. The increase in net loss attributable to Dell Technologies Inc. during Fiscal 2018 was primarily attributable to an increase in net loss from continuing operations and the absence of income from our discontinued operations in Fiscal 2018, due to completion of the divestiture transactions in Fiscal 2017.
Fiscal 2017 compared to Fiscal 2016
During Fiscal 2017 and Fiscal 2016, net loss attributable to Dell Technologies Inc. was $1.7 billion and $1.1 billion, respectively. The increase in Fiscal 2017 was due to an increase in net loss from continuing operations, offset partially by an increase in income from discontinued operations. For more information regarding our discontinued operations, see
Note 4
of the
Notes to the Consolidated Financial Statements
included in this report.
58
Business Unit Results
Our reportable segments are based on the following business units: CSG, ISG, and VMware. A description of our three business units is provided under "Introduction." See
Note 22
of the
Notes to the Consolidated Financial Statements
included in this report for a reconciliation of net revenue and operating income by reportable segment to consolidated net revenue and consolidated operating loss, respectively.
Client Solutions Group:
The following table presents net revenue and operating income attributable to CSG for the respective periods:
|
Fiscal Year Ended
|
|||||||||||||||
|
February 2,
2018 |
% Change
|
February 3,
2017 |
% Change
|
January 29,
2016 |
|||||||||||
|
(in millions, except percentages)
|
|||||||||||||||
|
Net Revenue:
|
|||||||||||||||
|
Commercial
|
$
|
27,747
|
|
7%
|
$
|
26,006
|
|
1%
|
$
|
25,747
|
|
||||
|
Consumer
|
11,708
|
|
9%
|
10,748
|
|
6%
|
10,130
|
|
|||||||
|
Total CSG net revenue
|
$
|
39,455
|
|
7%
|
$
|
36,754
|
|
2%
|
$
|
35,877
|
|
||||
|
Operating Income:
|
|||||||||||||||
|
CSG operating income
|
$
|
2,193
|
|
19%
|
$
|
1,845
|
|
31%
|
$
|
1,410
|
|
||||
|
% of segment net revenue
|
5.6
|
%
|
5.0
|
%
|
3.9
|
%
|
|||||||||
Fiscal 2018 compared to Fiscal 2017
Net Revenue
—
During Fiscal 2018, CSG net revenue increased
7%
, driven by an increase in overall average selling price in both the commercial and consumer product categories, as we managed our pricing in response to the cost environment during the period. During Fiscal 2018, CSG net revenue also benefited from increases in units sold, as we experienced a general improvement in customer demand, which favored premium notebooks and workstations.
From a geographical perspective, net revenue attributable to CSG increased across all regions during Fiscal 2018.
Operating Income
—
During Fiscal 2018, CSG operating income as a percentage of net revenue increased
60
basis points to
5.6%
primarily due to a reduction in CSG operating expenses as a percentage of net revenue, as we continued to manage our cost position. This benefit was partially offset by increased component costs, which we were able to mitigate through pricing actions. We will continue to adjust our pricing practices as needed based upon relevant factors, including the competitive environment and component costs. We expect that component cost increases will moderate in Fiscal 2019. The impact of the vendor settlements recorded in Fiscal 2018 and Fiscal 2017 did not affect comparability for these periods.
Fiscal 2017 compared to Fiscal 2016
Net Revenue
— During Fiscal 2017, CSG net revenue increased 2%, driven by an increase in both commercial and consumer net revenue. Commercial net revenue benefited from an increase in volume of premium notebook and workstation units sold, partially offset by a decrease in overall average selling prices. The increase in consumer net revenue was driven by an increase in the volume of notebook units sold, which also was partially offset by a decrease in overall average selling prices. The increase in volume of commercial and consumer notebooks sold was attributable to an overall improvement in customer demand. Both commercial and consumer businesses experienced a decrease in overall average selling prices as we strategically managed our pricing position given competitive conditions and the favorable cost environment.
From a geographical perspective, net revenue attributable to CSG increased in the Americas and APJ during Fiscal 2017, while net revenue in EMEA was unchanged.
59
Operating Income
— During Fiscal 2017, CSG operating income as a percentage of net revenue increased 110 basis points to 5.0%. This increase was driven by improvement in our gross margin percentage, which was principally the result of a favorable cost position and a richer product mix of premium notebooks and workstations.
Infrastructure Solutions Group:
The following table presents net revenue and operating income attributable to ISG for the respective periods:
|
|
Fiscal Year Ended
|
||||||||||||||
|
|
February 2,
2018 |
% Change
|
February 3,
2017 |
% Change
|
January 29,
2016 |
||||||||||
|
|
(in millions, except percentages)
|
||||||||||||||
|
Net Revenue:
|
|
|
|
|
|
||||||||||
|
Servers and networking
|
$
|
15,398
|
|
20%
|
$
|
12,834
|
|
1%
|
$
|
12,761
|
|
||||
|
Storage
|
15,254
|
|
71%
|
8,942
|
|
303%
|
2,217
|
|
|||||||
|
Total ISG net revenue
|
$
|
30,652
|
|
41%
|
$
|
21,776
|
|
45%
|
$
|
14,978
|
|
||||
|
|
|
|
|
|
|
||||||||||
|
Operating Income:
|
|
|
|
|
|
||||||||||
|
ISG operating income
|
$
|
2,179
|
|
(9)%
|
$
|
2,393
|
|
127%
|
$
|
1,052
|
|
||||
|
% of segment net revenue
|
7.1
|
%
|
|
11.0
|
%
|
|
7.0
|
%
|
|||||||
Fiscal 2018 compared to Fiscal 2017
Net Revenue
—
During Fiscal 2018, ISG net revenue increased
41%
primarily due to incremental storage net revenue associated with the EMC acquired storage business, and to a lesser extent, increases in servers and networking. Revenue from servers and networking increased
20%
during Fiscal 2018, driven by an increase in both average selling price and units sold of our PowerEdge server product. Average selling prices increased as we managed our pricing in response to the current component cost environment, and also reflected the sale of servers with higher memory and storage content. Storage revenue increased
71%
during Fiscal 2018 due to the incremental revenue from the EMC acquired storage business. Although we experienced strong growth in all-flash and hyper-converged infrastructure products, we are experiencing reduced demand in ISG for certain elements of our storage portfolio, including traditional high-end and midrange storage offerings. We are addressing this dynamic through investments in our go-to-market capability and product enhancements.
In ISG, we are seeing increased interest in flexible consumption models by our customers as they seek to build greater flexibility into their cost structures. We generally provide these solutions under multi-year contracts that typically result in recognition of revenue over the term of the arrangement. We expect these flexible consumption models will further strengthen our customer relationships, and will build more predictable revenue streams over time.
From a geographical perspective, during Fiscal 2018, ISG net revenue increased in all regions due to the incremental revenue from the EMC acquired storage business. The EMC acquired storage business operates on a world-wide basis with a geographic mix similar to that of the legacy Dell ISG business.
Operating Income
—
During Fiscal 2018, ISG operating income decreased
390
basis points to
7.1%
primarily due to increased operating expenses from the EMC acquired businesses and larger investments in our go-to-market capabilities and research and development. While the EMC acquired storage business contributed higher gross margin overall, we experienced gross margin pressure due to changing product mix within ISG as well as component cost inflation, particularly for memory components used in ISG products, which we expect to moderate in Fiscal 2019.
Fiscal 2017 compared to Fiscal 2016
Net Revenue
— During Fiscal 2017, ISG net revenue increased 45% due to incremental net revenue associated with the EMC acquired storage business, which caused storage revenue to increase 303%. Revenue from servers and networking was relatively unchanged over the period, resulting from the offsetting dynamics of an increase in average selling prices due to a shift to PowerEdge servers with richer configurations, as well as to a decline in volume of PowerEdge units, as customer demand has shifted to cloud and hyperscale servers, which generally have a lower average selling price.
60
From a geographical perspective, during Fiscal 2017, ISG net revenue increased in all regions due to the incremental revenue from the EMC acquired storage business.
Operating Income
— During Fiscal 2017, ISG operating income as a percentage of net revenue increased 400 basis points to 11.0%. The increase in ISG operating income percentage was primarily driven by the favorable impact of higher gross margin percentages and operating income percentages from the EMC acquired businesses. The gross margin percentage for the legacy Dell ISG business was relatively flat over the period.
VMware:
The following table presents net revenue and operating income attributable to VMware for the respective periods:
|
|
Fiscal Year Ended
|
||||||||||||||
|
|
February 2,
2018 |
|
% Change
|
|
February 3,
2017 |
|
% Change
|
|
January 29,
2016 |
||||||
|
|
(in millions, except percentages)
|
||||||||||||||
|
Net Revenue:
|
|
|
|
|
|
|
|
|
|
||||||
|
VMware net revenue
|
$
|
7,925
|
|
|
146%
|
|
$
|
3,225
|
|
|
NA
|
|
$
|
—
|
|
|
|
|
|
|
|
|
|
|
|
|
||||||
|
Operating Income:
|
|
|
|
|
|
|
|
|
|
||||||
|
VMware operating income
|
$
|
2,520
|
|
|
126%
|
|
$
|
1,113
|
|
|
NA
|
|
$
|
—
|
|
|
% of segment net revenue
|
31.8
|
%
|
|
|
|
34.5
|
%
|
|
|
|
NA
|
|
|||
Fiscal 2018 compared to Fiscal 2017
Net Revenue
—
VMware net revenue during Fiscal 2018 primarily consisted of revenue from the sale of software licenses under perpetual licenses, related software maintenance and support, training, consulting services, and hosted services. VMware net revenue for Fiscal 2018 benefited from balanced performance in all major geographies and broad strength across the product portfolio.
From a geographical perspective, approximately half of VMware net revenue during Fiscal 2018 was generated by sales to customers in the United States.
Operating Income
—
During Fiscal 2018, VMware operating income as a percentage of net revenue was
31.8%
, primarily driven by strong gross margin performance during the year.
Fiscal 2017 compared to Fiscal 2016
Net Revenue
— VMware net revenue during Fiscal 2017 represents revenue from the EMC merger transaction date of September 7, 2016 through February 3, 2017. VMware net revenue for Fiscal 2017 primarily consisted of revenue from the sale of software licenses under perpetual licenses, related software maintenance and support, training, consulting services, and hosted services.
From a geographical perspective, approximately half of VMware net revenue during Fiscal 2017 was generated by sales to customers in the United States.
Operating Income
— During Fiscal 2017, VMware operating income as a percentage of net revenue was 34.5%. The VMware operating income percentage during Fiscal 2017 was impacted by the timing of the completion of the EMC merger transaction.
61
Accounts Receivable
We sell products and services directly to customers and through a variety of sales channels, including retail distribution. Our accounts receivable, net, was
$11.2 billion
and
$9.4 billion
as of
February 2, 2018
and
February 3, 2017
, respectively. We maintain an allowance for doubtful accounts to cover receivables that may be deemed uncollectible. The allowance for losses is based on a provision for accounts that are collectively evaluated based on historical bad debt experience as well as specific identifiable customer accounts that are deemed at risk. As of
February 2, 2018
and
February 3, 2017
, the allowance for doubtful accounts was
$103 million
and
$57 million
, respectively. Based on our assessment, we believe that we are adequately reserved for expected credit losses. We monitor the aging of our accounts receivable and continue to take actions to reduce our exposure to credit losses.
Dell Financial Services and Financing Receivables
Dell Financial Services and its affiliates ("DFS") offers a wide range of financial services, including originating, collecting, and servicing customer receivables primarily related to the purchase of Dell Technologies' products and services. In some cases, we also offer financing on the purchase of third-party technology products that complement our portfolio of products and services. New financing originations were
$6.3 billion
,
$4.5 billion
, and
$3.7 billion
for
Fiscal 2018
,
Fiscal 2017
, and
Fiscal 2016
, respectively. As of
February 2, 2018
and
February 3, 2017
, our financing receivables, net were
$7.6 billion
and
$5.9 billion
, respectively. The increases in new financing originations and financing receivables during Fiscal 2018 were attributable to growth in DFS offerings related to customer purchases of products and services from the EMC acquired businesses.
We have securitization facilities to fund revolving loans and fixed-term leases and loans through consolidated special purpose entities, referred to as SPEs, which we account for as secured borrowings. We transfer certain U.S. and European customer financing receivables to these SPEs, whose purpose is to facilitate the funding of customer receivables through financing arrangements with multi-seller conduits that issue asset-backed debt securities in the capital markets and to private investors. During Fiscal 2018 and Fiscal 2017, we transferred
$3.9 billion
and
$3.3 billion
, respectively, to these SPEs. The DFS debt related to all of our securitization facilities included as secured borrowings was
$3.9 billion
and
$3.1 billion
as of
February 2, 2018
and
February 3, 2017
, respectively. In addition, the carrying amount of the corresponding financing receivables was
$4.6 billion
and
$3.6 billion
as of
February 2, 2018
and
February 3, 2017
, respectively. As a result of the EMC merger transaction, we are expanding our existing securitization facilities to allow for additional funding of customer receivables in the capital markets.
We maintain an allowance to cover expected financing receivable credit losses and evaluate credit loss expectations based on our total portfolio. For
Fiscal 2018
,
Fiscal 2017
, and
Fiscal 2016
, the principal charge-off rate for our total portfolio was
1.5%
,
2.0%
, and
2.5%
,
respectively. The credit quality of our financing receivables has improved in recent years due to an overall improvement in the credit environment and as the mix of high-quality commercial accounts in our portfolio has increased. The allowance for losses is determined based on various factors, including historical and anticipated experience, past due receivables, receivable type, and customer risk profile. As of
February 2, 2018
and
February 3, 2017
, the allowance for financing receivable losses was
$145 million
and
$143 million
, respectively. In general, the loss rates on our financing receivables have improved over the periods presented. We expect relatively stable loss rates in future periods, with movements in these rates being primarily driven by seasonality and a continued shift in portfolio composition to lower risk commercial assets. We continue to monitor broader economic indicators and their potential impact on future loss performance. We have an extensive process to manage our exposure to customer credit risk, including active management of credit lines and our collection activities. We also sell selected fixed-term financing receivables to unrelated third parties on a periodic basis, primarily to manage certain concentrations of customer credit exposure. Based on our assessment of the customer financing receivables, we believe that we are adequately reserved.
See
Note 7
of the
Notes to the Consolidated Financial Statements
included in this report for additional information about our financing receivables and the associated allowances.
62
Deferred Revenue
Deferred revenue is recorded when billings have been generated or payments have been received for undelivered products or services, or in situations where revenue recognition criteria have not been met. Deferred revenue represents amounts received in advance for extended warranty services, software maintenance, unearned license fees, and deferred profit on third-party software offerings. Deferred revenue is recognized on these items when the revenue recognition criteria are met, generally resulting in ratable recognition over the contract term. We also have deferred revenue related to undelivered hardware and professional services, consisting of installations and consulting engagements, which are recognized as our obligations under the contract are completed.
Our total deferred revenue was
$22.2 billion
and
$18.7 billion
as of
February 2, 2018
and
February 3, 2017
, respectively. The increase in our deferred revenue was driven by a $2.2 billion increase in deferrals, primarily related to maintenance, extended warranty services, and the introduction of our flexible consumption model offerings. The increase also reflected $1.2 billion of amortization of our deferred revenue fair value adjustment primarily related to purchase accounting for the EMC merger transaction. A majority of our deferred revenue as of
February 2, 2018
is expected to be recognized over the next two years.
Off-Balance Sheet Arrangements
As of
February 2, 2018
, we had no off-balance sheet arrangements that have or are reasonably likely to have a current or future material effect on our financial condition or results of operations.
63
MARKET CONDITIONS, LIQUIDITY, CAPITAL COMMITMENTS, AND CONTRACTUAL CASH OBLIGATIONS
Market Conditions
We regularly monitor economic conditions and associated impacts on the financial markets and our business. We consistently evaluate the financial health of our supplier base, carefully manage customer credit, diversify counterparty risk, and monitor the concentration risk of our cash and cash equivalents balances globally. We routinely monitor our financial exposure to borrowers and counterparties.
We monitor credit risk associated with our financial counterparties using various market credit risk indicators such as credit ratings issued by nationally recognized rating agencies and changes in market credit default swap levels. We perform periodic evaluations of our positions with these counterparties and may limit exposure to any one counterparty in accordance with our policies. We monitor and manage these activities depending on current and expected market developments.
We use derivative instruments to hedge certain foreign currency exposures. We use forward contracts and purchased options designated as cash flow hedges to protect against the foreign currency exchange rate risks inherent in our forecasted transactions denominated in currencies other than the U.S. dollar. In addition, we primarily use forward contracts and may use purchased options to hedge monetary assets and liabilities denominated in a foreign currency. See
Note 9
of the
Notes to the Consolidated Financial Statements
included in this report for more information about our use of derivative instruments.
We are exposed to interest rate risk related to our variable-rate debt and investment portfolio. In the normal course of business, we follow established policies and procedures to manage this risk, including monitoring of our asset and liability mix. As a result, we do not anticipate any material losses from interest rate risk. For additional information, see "Item 7A
—
Quantitative and Qualitative Disclosures About Market Risk."
The impact of any credit adjustments related to our use of counterparties on our Consolidated Financial Statements included in this report has been immaterial.
Liquidity and Capital Resources
To support our ongoing business operations, we rely on operating cash flows as our primary source of liquidity. We monitor the efficiency of our balance sheet to ensure that we have adequate liquidity to support our strategic initiatives. In addition to internally generated cash, we have access to other capital sources to finance our strategic initiatives and fund growth in our financing operations. As of
February 2, 2018
, we had
$13.9 billion
of total cash and cash equivalents, the majority of which was held outside of the United States. Our strategy is to deploy capital from any potential source, whether internally generated cash or debt, depending on the adequacy and availability of that source of capital and whether it can be accessed in a cost-effective manner.
A significant portion of our income is earned in non-U.S. jurisdictions. Prior to the enactment of U.S. Tax Reform as discussed above, earnings available to be repatriated to the United States would be subject to U.S. federal income tax, less applicable foreign tax credits. U.S. Tax Reform fundamentally changes the U.S. approach to taxation of foreign earnings to a modified territorial tax system, which generally allows companies to make distributions of non-U.S. earnings to the United States without incurring additional U.S. federal tax. However, local and U.S. state taxes may still apply. We have provided for future tax liabilities on income earned in non-U.S. jurisdictions, except for foreign earnings that are considered indefinitely reinvested outside of the United States.
64
The following table summarizes our cash and cash equivalents as well as our available borrowings as of
February 2, 2018
and
February 3, 2017
:
|
February 2, 2018
|
February 3, 2017
|
||||||
|
(in millions)
|
|||||||
|
Cash and cash equivalents, and available borrowings:
|
|||||||
|
Cash and cash equivalents (a)
|
$
|
13,942
|
|
$
|
9,474
|
|
|
|
Remaining available borrowings under revolving credit facilities
|
4,875
|
|
2,678
|
|
|||
|
Total cash, cash equivalents, and available borrowings
|
$
|
18,817
|
|
$
|
12,152
|
|
|
__________________
(a) Of the
$13.9 billion
of cash and cash equivalents as of
February 2, 2018
, $6.0 billion was held by VMware, Inc.
Our revolving credit facilities include the Revolving Credit Facility and China Revolving Credit Facility. Available borrowings under these facilities are reduced by draws on the facility and, under the Revolving Credit Facility, outstanding letters of credit. As of
February 2, 2018
, there were no borrowings outstanding under either facility and remaining available borrowings totaled approximately
$3.8 billion
. These available borrowings may be used periodically for general corporate purposes.
The VMware Revolving Credit Facility and Pivotal Revolving Credit Facility have maximum aggregate borrowings of
$1.0 billion
and
$100 million
, respectively. None of the net proceeds of such borrowings will be made available to support the operations or satisfy any corporate purposes of Dell Technologies, other than the operations and corporate purposes of VMware, Inc., Pivotal, and their respective subsidiaries. As of
February 2, 2018
, $1.0 billion was available under the VMware Revolving Credit Facility and $80 million was available under the Pivotal Revolving Credit Facility.
We believe that our current cash and cash equivalents, along with cash that will be provided by future operations and borrowings expected to be available under the Revolving Credit Facility and China Revolving Credit Facility, will be sufficient over at least the next twelve months to fund our operations, capital expenditures, share repurchases, debt service requirements, and other corporate needs.
65
Debt
The following table summarizes our outstanding debt as of
February 2, 2018
and
February 3, 2017
:
|
February 2, 2018
|
February 3, 2017
|
||||||
|
(in millions)
|
|||||||
|
Restricted Subsidiary Debt
|
|||||||
|
Core debt:
|
|||||||
|
Senior Secured Credit Facilities and First Lien Notes
|
$
|
30,595
|
|
$
|
31,638
|
|
|
|
Unsecured Notes and Debentures
|
2,452
|
|
2,453
|
|
|||
|
Senior Notes
|
3,250
|
|
3,250
|
|
|||
|
EMC Notes
|
5,500
|
|
5,500
|
|
|||
|
DFS allocated debt
|
(1,892
|
)
|
(1,675
|
)
|
|||
|
Total core debt
|
39,905
|
|
41,166
|
|
|||
|
DFS related debt:
|
|||||||
|
DFS debt
|
4,796
|
|
3,464
|
|
|||
|
DFS allocated debt
|
1,892
|
|
1,675
|
|
|||
|
Total DFS related debt
|
6,688
|
|
5,139
|
|
|||
|
Other
|
2,054
|
|
4,051
|
|
|||
|
Unrestricted Subsidiary Debt
|
|||||||
|
VMware Notes
|
4,000
|
|
—
|
|
|||
|
Other
|
47
|
|
—
|
|
|||
|
Total unrestricted subsidiary debt
|
4,047
|
|
—
|
|
|||
|
Total debt, principal amount
|
52,694
|
|
50,356
|
|
|||
|
Carrying value adjustments
|
(823
|
)
|
(966
|
)
|
|||
|
Total debt, carrying value
|
$
|
51,871
|
|
$
|
49,390
|
|
|
The outstanding principal amount of our debt was $
52.7 billion
as of
February 2, 2018
, which included core debt of
$39.9 billion
. We define core debt as the total principal amount of our debt, less: (a) DFS related debt, (b) other debt, and (c) unrestricted subsidiary debt.
DFS related debt primarily represents debt from securitization and structured financing programs. To fund expansion of the DFS business, we balance the use of our securitization and structure financing programs with other sources of liquidity. We approximate the amount of our debt used to fund the DFS business by applying a 7:1 debt to equity ratio to our financing receivables balance, based on the underlying credit quality of the assets. See
Note 7
of the
Notes to the Consolidated Financial Statements
included in this report for more information about our DFS debt.
As of
February 2, 2018
, other debt primarily consisted of the $2.0 billion Margin Loan Facility. As of
February 3, 2017
, other debt primarily consisted of the Margin Bridge Facility and VMware Note Bridge Facility which were repaid during Fiscal 2018.
VMware, Inc., Pivotal, and their respective subsidiaries are unrestricted subsidiaries for purposes of the existing debt of Dell Technologies. Neither Dell Technologies nor any of its subsidiaries, other than VMware, Inc., is obligated to make payment on the VMware Notes. None of the net proceeds of the VMware Notes will be made available to support the operations or satisfy any corporate purposes of Dell Technologies, other than the operations and corporate purposes of VMware, Inc. and its subsidiaries.
Our requirements for cash to pay principal and interest have increased significantly due to the borrowings that were required to finance the EMC merger transaction. We or our affiliates, at our or their sole discretion, may purchase, redeem, prepay, refinance, or otherwise retire any amount of our outstanding indebtedness under the terms of such indebtedness at any time and from time to time, in open market or negotiated transactions with the holders of such indebtedness, as appropriate market conditions exist.
66
See
Note 8
of the
Notes to the Consolidated Financial Statements
included in this report for more information about our debt and our unrestricted subsidiaries.
Fiscal 2018
During Fiscal 2018, we completed two refinancing transactions of the Senior Secured Credit Facilities. In the first refinancing transaction, which occurred during the first quarter of Fiscal 2018, we refinanced the Term Loan B Facility to reduce the interest rate margin by
0.75%
and to increase the outstanding principal amount by
$0.5 billion
. We applied the proceeds from the Term Loan B Facility refinancing to repay
$0.5 billion
principal amount of the Margin Bridge Facility. Additionally, during the first quarter of Fiscal 2018, we entered into the Margin Loan Facility in the principal amount of
$2.0 billion
, and used the proceeds of the new facility to repay the Margin Bridge Facility in full.
In the second refinancing transaction, which occurred during the third quarter of Fiscal 2018, we refinanced the Term Loan A-2 Facility, Term Loan A-3 Facility, Term Loan B Facility, and the Revolving Credit Facility. As a result of the refinancing, the interest rate margin under each of these facilities decreased by
0.50%
and the outstanding principal amount of the Term Loan A-2 Facility increased by $672 million, which was used to pay
$212 million
principal amount of the Term Loan A-3 Facility and
$460 million
principal amount of the Term Loan B Facility. Further, the Revolving Credit Facility's borrowing capacity increased by
$180 million
to $3.3 billion.
During Fiscal 2018, we repaid approximately
$1.2 billion
principal amount of our term loan facilities and
$0.4 billion
under the Revolving Credit Facility and issued an additional
$1.3 billion
, net, in DFS debt to support the expansion of the DFS financing receivables portfolio.
Further, during the third quarter of Fiscal 2018, VMware, Inc. completed a public offering of senior notes in the aggregate principal amount of $4.0 billion (the "VMware Notes"). VMware, Inc. used a portion of the net proceeds from the offering to repay certain intercompany promissory notes previously issued by it to EMC in the aggregate principal amount of $1.2 billion. We applied the proceeds of this repayment, and other cash, to repay $1.5 billion principal amount of the VMware Note Bridge Facility. VMware, Inc. has disclosed that it intends to use the remaining net proceeds of the debt issuance to fund additional repurchases of up to $1.0 billion of its Class A common stock through August 31, 2018, and for general VMware, Inc. corporate purposes, including mergers and acquisitions and repaying other indebtedness.
Fiscal 2017
To finance the EMC merger transaction, we issued an aggregate principal amount of
$45.9 billion
in new debt, which included proceeds from the sale of the First Lien Notes and Senior Notes, as well as borrowings under the Senior Secured Credit Facilities (including the Revolving Credit Facility), the Asset Sale Bridge Facility, the Margin Bridge Facility, and the VMware Note Bridge Facility at the closing of the transaction. Additionally, on September 7, 2016, EMC had outstanding senior notes (the "EMC Notes") consisting of
$2.5 billion
aggregate principal amount of its
1.875%
Notes due June 2018,
$2.0 billion
aggregate principal amount of its
2.650%
Notes due June 2020 and
$1.0 billion
aggregate principal amount of its
3.375%
Notes due June 2023. The EMC Notes remain outstanding following the closing of the EMC merger transaction.
67
Cash Flows
The following table contains a summary of our Consolidated Statements of Cash Flows for the respective periods:
|
Fiscal Year Ended
|
|||||||||||
|
|
February 2,
2018 |
February 3,
2017 |
January 29,
2016 |
||||||||
|
(in millions)
|
|||||||||||
|
Net change in cash from:
|
|||||||||||
|
Operating activities
|
$
|
6,810
|
|
$
|
2,309
|
|
$
|
2,162
|
|
||
|
Investing activities
|
(2,881
|
)
|
(31,256
|
)
|
(321
|
)
|
|||||
|
Financing activities
|
364
|
|
31,821
|
|
(496
|
)
|
|||||
|
Effect of exchange rate changes on cash and cash equivalents
|
175
|
|
24
|
|
(167
|
)
|
|||||
|
Change in cash and cash equivalents
|
$
|
4,468
|
|
$
|
2,898
|
|
$
|
1,178
|
|
||
Operating Activities
— Cash provided by operating activities was
$6.8 billion
for Fiscal 2018 compared to
$2.3 billion
for Fiscal 2017. The increase in operating cash flows during Fiscal 2018 was driven by improved profitability, predominantly due to the incremental profitability from the EMC acquired businesses, and ongoing working capital initiatives. Further, cash paid for transaction costs during Fiscal 2017 did not recur in Fiscal 2018. The increase in operating cash flows was partially offset by the growth in our financing receivables portfolio and cash paid for interest and taxes.
Cash provided by operating activities was
$2.3 billion
for Fiscal 2017 compared to
$2.2 billion
for Fiscal 2016. Cash flow performance during both periods was strong and remained relatively unchanged as the incremental profitability from the EMC acquired businesses during Fiscal 2017 was largely offset by cash paid for transaction costs.
Investing Activities
—
Investing activities primarily consist of cash used to fund strategic investments, the maturities, sales, and purchases of investments, capital expenditures for property, plant, and equipment, and capitalized software development costs. During Fiscal 2018, cash used by investing activities was
$2.9 billion
and was primarily driven by capital expenditures, VMware Inc.'s Fiscal 2018 acquisitions, and the net purchases of investments. See
Note 3
of the
Notes to the Consolidated Financial Statements
included in this report for further information regarding VMware, Inc.'s acquisitions. In comparison, cash used in investing activities was
$31.3 billion
during Fiscal 2017, principally due to our use of $37.6 billion, net cash to fund the EMC merger transaction.
Cash used in investing activities during Fiscal 2016, which primarily consisted of capital expenditures, was $0.3 billion.
Financing Activities
— Financing activities primarily consist of the proceeds and repayments of debt and cash used to repurchase common stock. Cash provided by financing activities of
$0.4 billion
during Fiscal 2018 was driven by net proceeds from debt, primarily due to the issuance of the VMware Notes, partially offset by cash used for share repurchases.
In comparison, during Fiscal 2017, cash provided by financing activities was $31.8 billion. Cash provided by financing activities consisted primarily of $46.9 billion in cash proceeds from debt, $43.2 billion of which was issued in connection with the EMC merger transaction, and $4.4 billion in proceeds from the sale and issuance of our Class A, Class B, and Class C Common Stock for financing of that transaction. These issuances were partially offset by $17.0 billion in repayments of debt, $0.9 billion in payments of debt issuance costs, $1.3 billion in payments to repurchase common stock, and $0.4 billion in payments in connection with the appraisal litigation related to the going-private transaction.
During Fiscal 2016, cash used in financing activities was $0.5 billion and primarily consisted of net repayments of debt.
68
Key Performance Metrics
Our key performance metrics are net revenue, operating income, adjusted EBITDA, and cash flows from operations, and are discussed elsewhere in this report. Our cash conversion cycle is presented below. Our approach to, and use of the cash conversion cycle has evolved since the EMC merger transaction.
Accordingly, we believe a consolidated cash conversion cycle no longer constitutes a key performance metric for Dell Technologies. Beginning in the first quarter of Fiscal 2019, we will no longer present information about this metric as part of our management's discussion and analysis.
Cash Conversion Cycle
The following table presents the components of our cash conversion cycle
for the periods presented:
|
Three Months Ended
|
||||||||
|
|
February 2, 2018
|
February 3, 2017
|
January 29, 2016
|
|||||
|
Days of sales outstanding (a)
|
49
|
|
48
|
|
39
|
|
||
|
Days of supply in inventory (b)
|
16
|
|
18
|
|
14
|
|
||
|
Days in accounts payable (c)
|
(109
|
)
|
(100
|
)
|
(112
|
)
|
||
|
Cash conversion cycle (d)
|
(44
|
)
|
(34
|
)
|
(59
|
)
|
||
__________________
|
(a)
|
Days of sales outstanding, referred to as DSO, calculates the average collection period of our receivables. DSO is based on the ending net trade receivables and the most recent quarterly non-GAAP net revenue for each period. DSO also includes the effect of product costs related to customer shipments not yet recognized as revenue that are classified in other current assets, as we believe this provides a more relevant metric that aligns with actual sales activity in the quarter, regardless of revenue recognition under GAAP. DSO is calculated by adding accounts receivable, net of allowance for doubtful accounts, and customer shipments in transit and dividing that sum by average non-GAAP net revenue per day for the current quarter (90 days for the three months ended
February 2, 2018
and
January 29, 2016
, and 97 days for the three months ended
February 3, 2017
). As of
February 2, 2018
, DSO and days of customer shipments not yet recognized were 45 and 4 days, respectively. As of
February 3, 2017
, DSO and days of customer shipments not yet recognized were 44 and 3 days, respectively. As of
January 29, 2016
, DSO and days of customer shipments not yet recognized were 34 and 5 days, respectively.
|
|
(b)
|
Days of supply in inventory, referred to as DSI, measures the average number of days from procurement to sale of our products. DSI is based on ending inventory and non-GAAP cost of goods sold for each period. DSI is calculated by dividing ending inventory by average non-GAAP cost of goods sold per day for the current quarter (90 days for the three months ended
February 2, 2018
and
January 29, 2016
, and 97 days for the three months ended
February 3, 2017
).
|
|
(c)
|
Days in accounts payable, referred to as DPO, calculates the average number of days our payables remain outstanding before payment. DPO is based on ending accounts payable and non-GAAP cost of goods sold for each period. DPO is calculated by dividing accounts payable by average non-GAAP cost of goods sold per day for the current quarter (90 days for the three months ended
February 2, 2018
and
January 29, 2016
, and 97 days for the three months ended
February 3, 2017
).
|
|
(d)
|
We calculate our cash conversion cycle using non-GAAP net revenue and non-GAAP cost of goods sold because we believe that excluding certain items from the GAAP results facilitates management's understanding of this key performance metric.
|
69
The table below provides reconciliations of each non-GAAP financial measure used in calculating the DSO, DSI, and DPO metrics to its most directly comparable GAAP financial measure:
|
Three Months Ended
|
|||||||||||
|
|
February 2, 2018
|
February 3, 2017
|
January 29, 2016
|
||||||||
|
(in millions)
|
|||||||||||
|
Net revenue
|
$
|
21,935
|
|
$
|
20,074
|
|
$
|
12,679
|
|
||
|
Non-GAAP adjustments:
|
|||||||||||
|
Impact of purchase accounting
|
284
|
|
507
|
|
89
|
|
|||||
|
Non-GAAP net revenue
|
$
|
22,219
|
|
$
|
20,581
|
|
$
|
12,768
|
|
||
|
Cost of goods sold
|
$
|
16,155
|
|
$
|
15,543
|
|
$
|
10,425
|
|
||
|
Non-GAAP adjustments:
|
|||||||||||
|
Amortization of intangibles
|
(910
|
)
|
(847
|
)
|
(97
|
)
|
|||||
|
Impact of purchase accounting
|
(8
|
)
|
(603
|
)
|
(15
|
)
|
|||||
|
Transaction-related expenses
|
(2
|
)
|
(18
|
)
|
—
|
|
|||||
|
Other corporate expenses
|
(38
|
)
|
(89
|
)
|
(3
|
)
|
|||||
|
Non-GAAP cost of goods sold
|
$
|
15,197
|
|
$
|
13,986
|
|
$
|
10,310
|
|
||
For the three months ended
February 2, 2018
, the change in our cash conversion cycle was favorable by
10
days when compared to the three months ended
February 3, 2017
. This change was driven by a nine day improvement in DPO, which was primarily attributable to alignment of supplier payment terms as part of our ongoing integration efforts following the EMC merger transaction. DSI also improved by two days, driven by efficient inventory management despite increased sales volume, while DSO was essentially flat.
For the three months ended
February 3, 2017
, changes in our cash conversion cycle were unfavorable by 25 days when compared to the three months ended January 29, 2016. This change was primarily driven by the acquisition of EMC, which had a negative impact across all three components. DPO decreased 12 days primarily due to supplier payments terms of the EMC acquired businesses, DSO increased 9 days primarily due to differences in collections management from the EMC acquired businesses, and a DSI increased 4 days primarily as a result of a longer inventory cycle associated with the EMC acquired product lines.
We believe our business model allows us to maintain an efficient cash conversion cycle, which compares favorably with that of others in our industry.
Capital Commitments
Capital Expenditures
— During Fiscal 2018 and Fiscal 2017, we spent
$1.2 billion
and
$0.7 billion
, respectively, on property, plant, and equipment. These expenditures were primarily incurred in connection with our global expansion efforts and infrastructure investments made to support future growth. Product demand, product mix, and the use of contract manufacturers, as well as ongoing investments in operating and information technology infrastructure, influence the level and prioritization of our capital expenditures. Aggregate capital expenditures for Fiscal 2019, which will be primarily related to infrastructure investments and strategic initiatives, are currently expected to total between $1.1 billion and $1.3 billion.
70
Repurchases of Common Stock
Class V Common Stock Repurchases by Dell Technologies Inc.
— On September 7, 2016, our board of directors approved a stock repurchase program (the "DHI Group Repurchase Program") under which we are authorized to use assets of the DHI Group to repurchase up to $1.0 billion of shares of Class V Common Stock over a period of two years. During the fiscal year ended February 3, 2017, we repurchased 7 million shares of Class V Common Stock for $324 million using cash of the DHI Group. Shares repurchased under the DHI Group Repurchase Program are being held as treasury stock at
cost.
On December 13, 2016, the board of directors approved the suspension of the DHI Group Repurchase Program until such time as the board of directors authorizes the reinstatement of that program.
As of February 2, 2018, remaining authorized amount for share repurchases under the DHI Group Repurchase Program was $676 million.
On December 13, 2016, the board of directors approved a stock repurchase program (the “Class V Group Repurchase Program”) which authorized us to use assets of the Class V Group to repurchase up to
$500 million
of shares of Class V Common Stock over a period of
six months
.
During Fiscal 2018
, we repurchased
1.3 million
shares of Class V Common Stock for
$82 million
pursuant to and in completion of this initial authorization. A total of 8.4 million shares were repurchased under this initial authorization, including shares repurchased during Fiscal 2017.
On March 27, 2017 and August 18, 2017, the board of directors approved two amendments of the Class V Group Repurchase Program (the "March 2017 Class V Group Repurchase Program" and the “August 2017 Class V Group Repurchase Program,” respectively) which, when combined, authorized us to use assets of the Class V Group to repurchase up to an additional
$600 million
of shares of Class V Common Stock over additional six month periods from the respective board approval dates. On May 9, 2017, we completed the March 2017 Class V Group Repurchase Program, pursuant to which we repurchased
4.6 million
shares of Class V Common Stock for
$300 million
. On October 31, 2017, we completed August 2017 Class V Group Repurchase Program, pursuant to which we repurchased
3.8 million
shares of Class V Common Stock for
$300 million
.
Class A Common Stock Repurchases by VMware, Inc.
— On December 15, 2016, we entered into a stock purchase agreement with VMware, Inc. (the "December 2016 Stock Purchase Agreement"), pursuant to which VMware, Inc. agreed to repurchase for cash
$500 million
of shares of VMware, Inc. Class A common stock from a subsidiary of Dell Technologies. During Fiscal 2018, VMware, Inc. repurchased
1.4 million
shares for $125 million pursuant to and in completion of the December 2016 Stock Purchase Agreement. VMware, Inc. repurchased a total of 6.2 million shares under this agreement, including shares repurchased during Fiscal 2017. We applied the proceeds from the sale to the repurchase of shares of our Class V Common Stock under the Class V Group Repurchase Program described above. All shares repurchased under VMware, Inc.'s stock repurchase programs are retired.
In January 2017 and August 2017, VMware, Inc.'s board of directors authorized the repurchase of up to
$2.2 billion
of shares of VMware, Inc. Class A common sto
ck (the "January 2017 Authorization" for up to
$1.2 billion
through the end of Fiscal 2018, and the "August 2017 Authorization" for up to
$1 billion
through August 31, 2018). On March 29, 2017 and August 23, 2017, we entered into two new stock purchase agreements with VMware, Inc. (the "March 2017 Stock Purchase Agreement" and the "August 2017 Stock Purchase Agreement," respectively), pursuant to which VMware, Inc. agreed to repurchase for cash a total of
$600 million
of shares of VMware, Inc. Class A common stock from a subsidiary of Dell Technologies. VMware, Inc. repurchased approximately
6.1 million
shares of Class A common stock, consisting of
3.4 million
shares pursuant to the March 2017 Stock Purchase Agreement and
2.7 million
shares pursuant to the August 2017 Stock Purchase Agreement. We applied the proceeds of the sales to the repurchase of shares of the Class V Common Stock under the March 2017 and August 2017 Class V Group Repurchase Programs described above. As of November 3, 2017, the sale transactions under the March 2017 and August 2017 Stock Purchase Agreements were completed. The purchase prices of the
3.4 million
shares and
2.7 million
shares repurchased by VMware, Inc. were each based on separate volume-weighted average per share prices of the Class A common stock as reported on the New York Stock Exchange during separate specified reference periods, less a discount of
3.5%
from the respective volume-weighted average per share price.
During Fiscal 2018, VMware, Inc. repurchased
6.4 million
shares of Class A common stock in the open market for
$724 million
.
As of
February 2, 2018
, the cumulative authorized amount remaining for share repurchases by VMware, Inc. was
$876 million
, which represents the
$2.2 billion
authorized since January 2017, less
$600 million
Class A common stock repurchases from a subsidiary of the Company during Fiscal 2018, and less
$724 million
of the Class A common stock repurchases in the open market during Fiscal 2018.
71
For more information regarding share repurchase programs, see
Note 18
of the
Notes to the Consolidated Financial Statements
included in this report.
Contractual Cash Obligations
The following table summarizes our contractual cash obligations as of
February 2, 2018
:
|
Payments Due by Fiscal Year
|
|||||||||||||||||||
|
Total
|
2019
|
2020-2021
|
2022-2023
|
Thereafter
|
|||||||||||||||
|
(in millions)
|
|||||||||||||||||||
|
Contractual cash obligations:
|
|||||||||||||||||||
|
Principal payments on long-term debt
|
$
|
52,694
|
|
$
|
7,888
|
|
$
|
9,899
|
|
$
|
13,567
|
|
$
|
21,340
|
|
||||
|
Operating leases
|
2,060
|
|
405
|
|
620
|
|
335
|
|
700
|
|
|||||||||
|
Purchase obligations
|
3,521
|
|
3,046
|
|
375
|
|
96
|
|
4
|
|
|||||||||
|
Interest
|
16,751
|
|
2,181
|
|
3,769
|
|
2,738
|
|
8,063
|
|
|||||||||
|
Uncertain tax positions (a)
|
—
|
|
—
|
|
—
|
|
—
|
|
—
|
|
|||||||||
|
Contractual cash obligations
|
$
|
75,026
|
|
$
|
13,520
|
|
$
|
14,663
|
|
$
|
16,736
|
|
$
|
30,107
|
|
||||
____________________
|
(a)
|
We have approximately $
3.2
billion in additional liabilities associated with uncertain tax positions as of
February 2, 2018
. We are unable to reliably estimate the expected payment dates for any liabilities for uncertain tax positions.
|
Principal Payments on Long-Term Debt
—
Our expected principal cash payments on borrowings are exclusive of discounts and premiums. We have outstanding long-term notes with varying maturities. As of February 2, 2018, the future principal payments related to our DFS debt were expected to be $3.3 billion in Fiscal 2019, $1.4 billion in Fiscal 2020-2021, and immaterial thereafter. For additional information about our debt, see
Note 8
of the
Notes to the Consolidated Financial Statements
included in this report.
Operating Leases
—
We lease property and equipment, manufacturing facilities, and office space under non-cancelable leases. Certain of these leases obligate us to pay taxes, maintenance, and repair costs.
Purchase Obligations
—
Purchase obligations are defined as contractual obligations to purchase goods or services that are enforceable and legally binding on us. These obligations specify all significant terms, including fixed or minimum quantities to be purchased; fixed, minimum, or variable price provisions; and the approximate timing of the transaction. Purchase obligations do not include contracts that may be canceled without penalty.
We utilize several suppliers to manufacture sub-assemblies for our products. Our efficient supply chain management allows us to enter into flexible and mutually beneficial purchase arrangements with our suppliers in order to minimize inventory risk. Consistent with industry practice, we acquire raw materials or other goods and services, including product components, by issuing to suppliers authorizations to purchase based on our projected demand and manufacturing needs. These purchase orders are typically fulfilled within 30 days and are entered into during the ordinary course of business in order to establish best pricing and continuity of supply for our production. Purchase orders are not included in purchase obligations, as they typically represent our authorization to purchase rather than binding purchase obligations.
Interest
—
See
Note 8
of the
Notes to the Consolidated Financial Statements
included in this report for further discussion of our debt and related interest expense.
72
Critical Accounting Policies
We prepare our financial statements in conformity with GAAP, which requires certain estimates, assumptions, and judgments to be made that may affect our Consolidated Statements of Financial Position and Consolidated Statements of Income. Accounting policies that have a significant impact on our Consolidated Financial Statements are described in
Note 2
of the
Notes to the Consolidated Financial Statements
included in this report. The accounting estimates and assumptions discussed in this section are those that we consider to be the most critical. We consider an accounting policy to be critical if the nature of the estimate or assumption is subject to a material level of judgment and if changes in those estimates or assumptions are reasonably likely to materially impact our Consolidated Financial Statements. We have discussed the development, selection, and disclosure of our critical accounting policies with the Audit Committee of our board of directors.
Revenue Recognition and Related Allowances
— We enter into contracts to sell our products and services, and frequently enter into sales arrangements with customers that contain multiple elements or deliverables, such as hardware, services, software licenses, and peripherals. Significant judgments and estimates are necessary for the allocation of the proceeds received from an arrangement to the multiple elements, and the appropriate timing of revenue recognition.
We record reductions to revenue for estimated customer sales returns, rebates, and certain other customer incentive programs. These reductions to revenue are made based upon reasonable and reliable estimates that are determined by historical experience, contractual terms, and current conditions. The primary factors affecting our accrual for estimated customer returns include estimated return rates as well as the number of units shipped that have a right of return that has not expired as of the balance sheet date. If returns cannot be reliably estimated, revenue is not recognized until a reliable estimate can be made or the return right lapses. Each quarter, we reevaluate our estimates to assess the adequacy of our recorded accruals and allowance for doubtful accounts, and adjust the amounts as necessary.
We sell our products directly to customers as well as through other channels, including value-added resellers, system integrators, distributors, and retailers. Sales through our sales channels are primarily made under agreements allowing for limited rights of return, price protection, rebates, and marketing development funds. We have generally limited return rights through contractual caps or we have an established selling history for these arrangements. Therefore, there are sufficient data to establish reasonable and reliable estimates of returns for the majority of these sales. To the extent price protection or return rights are not limited and a reliable estimate cannot be made, all of the revenue and related costs are deferred until the product has been sold to the end-user or the rights expire. We record estimated reductions to revenue or an expense for channel programs at the later of the offer or the time revenue is recognized.
Another significant judgment includes determining whether Dell or a reseller is acting as the principal in a transaction. For arrangements in which a reseller is the principal, revenue is recognized on a net basis. All other revenue is recognized on a gross basis.
As our business evolves, the mix of products and services sold will impact the timing of when revenue and related costs are recognized. We analyze various factors, including a review of specific transactions, the credit-worthiness of our customers, our historical experience, and market and economic conditions. Changes in judgments on these factors could materially impact the timing and amount of revenue and costs recognized.
Business Combinations and Intangible Assets, Including Goodwill
— We account for business combinations using the acquisition method of accounting, and, accordingly, the assets and liabilities of the acquired business are recorded at their fair values at the date of acquisition. The excess of the purchase price over the estimated fair value is recorded as goodwill. Any changes in the estimated fair values of the net assets recorded for acquisitions prior to the finalization of more detailed analysis, but not to exceed one year from the date of acquisition, will change the amount of the purchase price allocable to goodwill. The cumulative impact of any subsequent changes to any purchase price allocations that are material to our consolidated financial results will be adjusted in the reporting period in which the adjustment amount is determined. All acquisition costs are expensed as incurred. Identifiable intangible assets with finite lives are amortized over their estimated useful lives. In-process research and development costs are recorded at fair value as an indefinite-lived intangible asset and assessed for impairment thereafter until completion, at which point the asset is amortized over its expected useful life. Separately recognized transactions associated with business combinations are generally expensed subsequent to the acquisition date. The application of business combination and impairment accounting requires the use of significant estimates and assumptions.
The results of operations of acquired businesses are included in our Consolidated Financial Statements from the acquisition date.
73
Goodwill and indefinite-lived intangible assets are tested for impairment annually during the third fiscal quarter and whenever events or circumstances may indicate that an impairment has occurred. To determine whether goodwill is impaired, we first assess certain qualitative factors. Based on this assessment, if it is determined more likely than not that the fair value of a goodwill reporting unit is less than its carrying amount, we perform the quantitative analysis of the goodwill impairment test. The fair value of each of our goodwill reporting units is generally estimated using a combination of public company multiples and discounted cash flow methodologies, and then compared to the carrying value of each goodwill reporting unit.
Standard Warranty Liabilities
— We record warranty liabilities at the time of sale for the estimated costs that may be incurred under the terms of the limited warranty. The liability for standard warranties is included in accrued and other current and other non-current liabilities on the Consolidated Statements of Financial Position.
The specific warranty terms and conditions vary depending upon the product sold and the country in which we do business, but generally include technical support, parts, and labor over a period ranging from one to three years. Factors that affect our warranty liability include the number of installed units currently under warranty,
historical and anticipated rates of warranty claims on those units, and cost per claim to satisfy our warranty obligation. The anticipated rate of warranty claims is the primary factor impacting our estimated warranty obligation. The other factors are less significant due to the fact that the average remaining aggregate warranty period of the covered installed base is approximately 16 months, repair parts are generally already in stock or available at pre-determined prices, and labor rates are generally arranged at pre-established amounts with service providers. Warranty claims are reasonably predictable based on historical experience of failure rates. If actual
results differ from our estimates, we revise our estimated warranty liability to reflect such changes. Each quarter, we reevaluate our estimates to assess the adequacy of the recorded warranty liabilities and adjust the amounts as necessary.
Income Taxes
— We are subject to income tax in the United States and numerous foreign jurisdictions. Significant judgments are required in determining the consolidated provision for income taxes. We calculate a provision for income taxes using the asset and liability method, under which deferred tax assets and liabilities are recognized by identifying the temporary differences arising from the different treatment of items for tax and accounting purposes. We provide related valuation allowances for deferred tax assets, where appropriate. Significant judgment is required in determining any valuation allowance against deferred tax assets. In assessing the need for a valuation allowance, we consider all available evidence for each jurisdiction, including past operating results, estimates of future taxable income, and the feasibility of ongoing tax planning strategies. In the event we determine that all or part of the net deferred tax assets are not realizable in the future, we will make an adjustment to the valuation allowance that would be charged to earnings in the period such determination is made.
Significant judgment is also required in evaluating our uncertain tax positions. Although we believe our tax return positions are sustainable, we recognize tax benefits from uncertain tax positions in the financial statements only when it is more likely than not that the positions will be sustained upon examination, including resolution of any related appeals or litigation processes, based on the technical merits and a consideration of the relevant taxing authority's administrative practices and precedents. To the extent that the final tax outcome of these matters is different from the amounts recorded, such differences will impact the provision for income taxes in the period in which such determination is made. The provision for income taxes includes the impact of reserve provisions and changes to reserves that are considered appropriate, as well as the related net interest and penalties. We believe we have provided adequate reserves for all uncertain tax positions.
Loss Contingencies
— We are subject to the possibility of various losses arising in the ordinary course of business. We consider the likelihood of loss or impairment of an asset or the incurrence of a liability, as well as our ability to reasonably estimate the amount of loss, in determining loss contingencies. An estimated loss contingency is accrued when it is probable that an asset has been impaired or a liability has been incurred and the amount of loss can be reasonably estimated. We regularly evaluate current information available to us to determine whether such accruals should be adjusted and whether new accruals are required. Third parties have in the past asserted, and may in the future assert, claims or initiate litigation related to exclusive patent, copyright, and other intellectual property rights to technologies and related standards that are relevant to us. If any infringement or other intellectual property claim made against us by any third party is successful, or if we fail to develop non-infringing technology or license the proprietary rights on commercially reasonable terms and conditions, our business, operating results, and financial condition could be materially and adversely affected.
Inventories
— We state our inventory at the lower of cost or market. We record a write-down for inventories of components and products, including third-party products held for resale, which have become obsolete or are in excess of anticipated demand or net realizable value. We perform a detailed review of inventory each fiscal
quarter that considers multiple factors, including demand forecasts, product life cycle status, product development plans, current sales levels, and component cost trends. The industries in which we compete are subject to demand changes. If future demand or market conditions for our products are less favorable than
forecasted or if unforeseen technological changes negatively impact the utility of component inventory, we may be required to record additional write-downs, which would adversely affect our gross margin.
74
Recently Issued Accounting Pronouncements
See
Note 2
of the
Notes to the Consolidated Financial Statements
included in this report for a summary of recently issued accounting pronouncements that are applicable to our Consolidated Financial Statements.
75
Dell Technologies is exposed to a variety of market risks, including risks associated with foreign currency exchange rate fluctuations, interest rate changes affecting its variable-rate debt, and changes in the market value of investments. In the normal course of business, Dell Technologies employs established policies and procedures to manage these risks.
Foreign Currency Risk
During Fiscal 2018 and Fiscal 2017, the principal foreign currencies in which Dell Technologies transacted business were the Euro, Chinese Renminbi, Japanese Yen, British Pound, and Canadian Dollar. The objective of Dell Technologies in managing its exposures to foreign currency exchange rate fluctuations is to reduce the impact of adverse fluctuations associated with foreign currency exchange rate changes on earnings and cash flows. Accordingly, Dell Technologies utilizes foreign currency option contracts and forward contracts to hedge its exposure on forecasted transactions and firm commitments for certain currencies. Dell Technologies monitors its foreign currency exchange exposures to ensure the overall effectiveness of its foreign currency hedge positions. However, there can be no assurance that the foreign currency hedging activities will continue to substantially offset the impact of fluctuations in currency exchange rates on Dell Technologies' results of operations and financial position in the future.
Based on the outstanding foreign currency hedge instruments of Dell Technologies, which include designated and non-designated instruments, there was a maximum potential one-day loss in fair value at
a 95% confidence level of approximately
$17 million
as of
February 2, 2018
and
$25 million
as of
February 3, 2017
using a Value-at-Risk ("VAR") model. By using market implied rates and incorporating volatility and correlation among the currencies of a portfolio, the VAR model simulates 10,000 randomly generated market prices and calculates the difference between the fifth percentile and the average as the Value-at-Risk. The VAR model is a risk estimation tool and is not intended to represent actual losses in fair value that could be incurred. Additionally, as Dell Technologies utilizes foreign currency instruments for hedging forecasted and firmly committed transactions, a loss in fair value for those instruments is generally offset by increases in the value of the underlying exposure.
Interest Rate Risk
Dell Technologies is primarily exposed to interest rate risk related to its variable-rate debt and investment portfolio.
Variable-Rate Debt
— As of
February 2, 2018
, Dell Technologies' variable-rate debt consisted of
$10.6 billion
of outstanding borrowings under its Senior Secured Credit Facilities,
$2.0 billion
of outstanding borrowings under its Margin Loan Facility, and
$2.8 billion
of outstanding DFS borrowings. Amounts outstanding under these facilities generally bear interest at variable rates equal to applicable margins plus specified base rates or LIBOR-based rates. Accordingly, Dell Technologies is exposed to market risk based on fluctuations in interest rates on borrowings under the facilities where we do not mitigate the interest rate risk through the use of interest rate swaps. As of
February 2, 2018
, outstanding borrowings under the facilities accrued interest at an annual rate between
0.87%
and
9.45%
. Based on this variable-rate debt outstanding as of
February 2, 2018
, a 100 basis point increase in interest rates would have resulted in an increase of approximately
$140
million in annual interest expense. For more information about our debt, see
Note 8
of the
Notes to the Consolidated Financial Statements
included in this report.
By comparison, as of
February 3, 2017
, Dell Technologies had $11.6 billion of outstanding borrowings under its Senior Secured Credit Facilities and $4.0 billion of outstanding borrowings under its Margin Bridge Facility and VMware Note Bridge Facility. Based on this variable-rate debt outstanding as of February 3, 2017, a 100 basis point increase in interest rates would have resulted in an increase of approximately $156 million in annual interest expense.
Investment Portfolio
— We maintain an investment portfolio consisting of debt and equity securities of various types and maturities which is exposed to interest rate risk. The investments are classified as available-for-sale and are all denominated in U.S. dollars. These securities are recorded on the consolidated balance sheet at market value, with any unrealized gain or temporary non-credit related loss recorded in other comprehensive loss. These instruments are not leveraged and are not held for trading purposes. Dell Technologies mitigates the risks related to its investment portfolio by investing primarily in high-quality credit securities, limiting the amount that can be invested in any single issuer, and investing in short-to-intermediate-term investments. As of
February 2, 2018
and
February 3, 2017
, a 100 basis point increase or decrease in interest rates would have resulted in a
$79
million and
$74 million
impact, respectively, on the fair value of this portfolio.
See
Note 6
of the
Notes to the Consolidated Financial Statements
included in this report for more information on our investment portfolio.
76
ITEM 8
—
FINANCIAL STATEMENTS AND SUPPLEMENTARY DATA
Index
|
Page
|
|
77
Report of Independent Registered Public Accounting Firm
To the Board of Directors and Stockholders of Dell Technologies Inc.
Opinions on the Financial Statements and Internal Control over Financial Reporting
We have audited the accompanying consolidated statements of financial position of Dell Technologies Inc. and its subsidiaries (the "Company”) as of February 2, 2018 and February 3, 2017, and the related consolidated statements of income (loss), comprehensive income (loss), stockholders’ equity and cash flows for each of the three years in the period ended February 2, 2018, including the related notes (collectively referred to as the “consolidated financial statements”).
We also have audited the Company's internal control over financial reporting as of February 2, 2018, based on criteria established in
Internal Control - Integrated Framework
(2013)
issued by the Committee of Sponsoring Organizations of the Treadway Commission (COSO).
In our opinion, the consolidated financial statements referred to above present fairly, in all material respects, the financial position of the Company as of February 2, 2018 and February 3, 2017,
and the results of their
operations and their cash flows for each of the three years in the period ended February 2, 2018
in conformity with accounting principles generally accepted in the United States of America. Also in our opinion, the Company maintained, in all material respects, effective internal control over financial reporting as of February 2, 2018, based on criteria established in
Internal Control - Integrated Framework
(2013)
issued by the COSO.
Basis for Opinions
The Company's management is responsible for these consolidated financial statements, for maintaining effective internal control over financial reporting, and for its assessment of the effectiveness of internal control over financial reporting, included in Management’s Annual Report on Internal Control Over Financial Reporting appearing under Item 9A. Our responsibility is to express opinions on the Company’s consolidated financial statements and on the Company's internal control over financial reporting based on our audits. We are a public accounting firm registered with the Public Company Accounting Oversight Board (United States) ("PCAOB") and are required to be independent with respect to the Company in accordance with the U.S. federal securities laws and the applicable rules and regulations of the Securities and Exchange Commission and the PCAOB.
We conducted our audits in accordance with the standards of the PCAOB. Those standards require that we plan and perform the audits to obtain reasonable assurance about whether the consolidated financial statements are free of material misstatement, whether due to error or fraud, and whether effective internal control over financial reporting was maintained in all material respects.
Our audits of the consolidated financial statements included performing procedures to assess the risks of material misstatement of the consolidated financial statements, whether due to error or fraud, and performing procedures that respond to those risks. Such procedures included examining, on a test basis, evidence regarding the amounts and disclosures in the consolidated financial statements. Our audits also included evaluating the accounting principles used and significant estimates made by management, as well as evaluating the overall presentation of the consolidated financial statements. Our audit of internal control over financial reporting included obtaining an understanding of internal control over financial reporting, assessing the risk that a material weakness exists, and testing and evaluating the design and operating effectiveness of internal control based on the assessed risk. Our audits also included performing such other procedures as we considered necessary in the circumstances. We believe that our audits provide a reasonable basis for our opinions.
Definition and Limitations of Internal Control over Financial Reporting
A company’s internal control over financial reporting is a process designed to provide reasonable assurance regarding the reliability of financial reporting and the preparation of financial statements for external purposes in accordance with generally accepted accounting principles. A company’s internal control over financial reporting includes those policies and procedures that (i) pertain to the maintenance of records that, in reasonable detail, accurately and fairly reflect the transactions and dispositions of the assets of the company; (ii) provide reasonable assurance that transactions are recorded as necessary to permit preparation of financial statements in accordance with generally accepted accounting principles, and that receipts and expenditures of the company are being made only in accordance with authorizations of management and directors of the company; and (iii) provide reasonable assurance regarding prevention or timely detection of unauthorized acquisition, use, or disposition of the company’s assets that could have a material effect on the financial statements.
78
Because of its inherent limitations, internal control over financial reporting may not prevent or detect misstatements. Also, projections of any evaluation of effectiveness to future periods are subject to the risk that controls may become inadequate because of changes in conditions, or that the degree of compliance with the policies or procedures may deteriorate.
/s/ PricewaterhouseCoopers LLP
Austin, Texas
March 29, 2018
We have served as the Company’s auditor since 1986.
79
DELL TECHNOLOGIES INC.
CONSOLIDATED STATEMENTS OF FINANCIAL POSITION
(in millions)
|
February 2, 2018
|
February 3, 2017
|
||||||
|
ASSETS
|
|||||||
|
Current assets:
|
|
|
|
|
|||
|
Cash and cash equivalents
|
$
|
13,942
|
|
$
|
9,474
|
|
|
|
Short-term investments
|
2,187
|
|
1,975
|
|
|||
|
Accounts receivable, net
|
11,177
|
|
9,420
|
|
|||
|
Short-term financing receivables, net
|
3,919
|
|
3,222
|
|
|||
|
Inventories, net
|
2,678
|
|
2,538
|
|
|||
|
Other current assets
|
5,054
|
|
4,144
|
|
|||
|
Total current assets
|
38,957
|
|
30,773
|
|
|||
|
Property, plant, and equipment, net
|
5,390
|
|
5,653
|
|
|||
|
Long-term investments
|
4,163
|
|
3,802
|
|
|||
|
Long-term financing receivables, net
|
3,724
|
|
2,651
|
|
|||
|
Goodwill
|
39,920
|
|
38,910
|
|
|||
|
Intangible assets, net
|
28,265
|
|
35,053
|
|
|||
|
Other non-current assets
|
1,862
|
|
1,364
|
|
|||
|
Total assets
|
$
|
122,281
|
|
$
|
118,206
|
|
|
|
LIABILITIES, REDEEMABLE SHARES, AND STOCKHOLDERS’ EQUITY
|
|||||||
|
Current liabilities:
|
|
|
|
|
|||
|
Short-term debt
|
$
|
7,873
|
|
$
|
6,329
|
|
|
|
Accounts payable
|
18,334
|
|
14,422
|
|
|||
|
Accrued and other
|
7,661
|
|
7,119
|
|
|||
|
Short-term deferred revenue
|
12,024
|
|
10,265
|
|
|||
|
Total current liabilities
|
45,892
|
|
38,135
|
|
|||
|
Long-term debt (Note 8)
|
43,998
|
|
43,061
|
|
|||
|
Long-term deferred revenue
|
10,223
|
|
8,431
|
|
|||
|
Other non-current liabilities
|
6,797
|
|
9,339
|
|
|||
|
Total liabilities
|
106,910
|
|
98,966
|
|
|||
|
Commitments and contingencies (Note 13)
|
|
|
|
|
|||
|
Redeemable shares (Note 20)
|
384
|
|
231
|
|
|||
|
Stockholders' equity:
|
|||||||
|
Common stock and capital in excess of $.01 par value (Note 18)
|
19,889
|
|
20,199
|
|
|||
|
Treasury stock at cost
|
(1,440
|
)
|
(752
|
)
|
|||
|
Accumulated deficit
|
(9,253
|
)
|
(5,609
|
)
|
|||
|
Accumulated other comprehensive income (loss)
|
130
|
|
(595
|
)
|
|||
|
Total Dell Technologies Inc. stockholders’ equity
|
9,326
|
|
13,243
|
|
|||
|
Non-controlling interests
|
5,661
|
|
5,766
|
|
|||
|
Total stockholders' equity
|
14,987
|
|
19,009
|
|
|||
|
Total liabilities, redeemable shares, and stockholders' equity
|
$
|
122,281
|
|
$
|
118,206
|
|
|
The accompanying notes are an integral part of these
Consolidated Financial Statements.
80
DELL TECHNOLOGIES INC.
(in millions, except per share amounts
)
|
Fiscal Year Ended
|
|||||||||||
|
|
February 2, 2018
|
February 3, 2017
|
January 29, 2016
|
||||||||
|
Net revenue:
|
|
|
|||||||||
|
Products
|
$
|
58,801
|
|
$
|
48,706
|
|
$
|
42,742
|
|
||
|
Services
|
19,859
|
|
12,936
|
|
8,169
|
|
|||||
|
Total net revenue
|
78,660
|
|
61,642
|
|
50,911
|
|
|||||
|
Cost of net revenue:
|
|||||||||||
|
Products
|
50,215
|
|
42,169
|
|
37,563
|
|
|||||
|
Services
|
8,391
|
|
6,514
|
|
4,961
|
|
|||||
|
Total cost of net revenue
|
58,606
|
|
48,683
|
|
42,524
|
|
|||||
|
Gross margin
|
20,054
|
|
12,959
|
|
8,387
|
|
|||||
|
Operating expenses:
|
|||||||||||
|
Selling, general, and administrative
|
19,003
|
|
13,575
|
|
7,850
|
|
|||||
|
Research and development
|
4,384
|
|
2,636
|
|
1,051
|
|
|||||
|
Total operating expenses
|
23,387
|
|
16,211
|
|
8,901
|
|
|||||
|
Operating loss
|
(3,333
|
)
|
(3,252
|
)
|
(514
|
)
|
|||||
|
Interest and other, net
|
(2,355
|
)
|
(2,104
|
)
|
(772
|
)
|
|||||
|
Loss from continuing operations before income taxes
|
(5,688
|
)
|
(5,356
|
)
|
(1,286
|
)
|
|||||
|
Income tax benefit
|
(1,833
|
)
|
(1,619
|
)
|
(118
|
)
|
|||||
|
Net loss from continuing operations
|
(3,855
|
)
|
(3,737
|
)
|
(1,168
|
)
|
|||||
|
Income from discontinued operations, net of income taxes (Note 4)
|
—
|
|
2,019
|
|
64
|
|
|||||
|
Net loss
|
(3,855
|
)
|
(1,718
|
)
|
(1,104
|
)
|
|||||
|
Less: Net loss attributable to non-controlling interests
|
(127
|
)
|
(46
|
)
|
—
|
|
|||||
|
Net loss attributable to Dell Technologies Inc.
|
$
|
(3,728
|
)
|
$
|
(1,672
|
)
|
$
|
(1,104
|
)
|
||
|
Earnings (loss) per share attributable to Dell Technologies Inc. - basic:
|
|||||||||||
|
Continuing operations - Class V Common Stock - basic
|
$
|
1.41
|
|
$
|
1.44
|
|
$
|
—
|
|
||
|
Continuing operations - DHI Group - basic
|
$
|
(7.08
|
)
|
$
|
(8.52
|
)
|
$
|
(2.88
|
)
|
||
|
Discontinued operations - DHI Group - basic
|
$
|
—
|
|
$
|
4.30
|
|
$
|
0.16
|
|
||
|
Earnings (loss) per share attributable to Dell Technologies Inc. - diluted:
|
|||||||||||
|
Continuing operations - Class V Common Stock - diluted
|
$
|
1.39
|
|
$
|
1.43
|
|
$
|
—
|
|
||
|
Continuing operations - DHI Group - diluted
|
$
|
(7.08
|
)
|
$
|
(8.52
|
)
|
$
|
(2.88
|
)
|
||
|
Discontinued operations - DHI Group - diluted
|
$
|
—
|
|
$
|
4.30
|
|
$
|
0.16
|
|
||
The accompanying notes are an integral part of these
Consolidated Financial Statements.
81
DELL TECHNOLOGIES INC.
CONSOLIDATED STATEMENTS OF COMPREHENSIVE INCOME (LOSS)
(in millions)
|
Fiscal Year Ended
|
|||||||||||
|
February 2, 2018
|
February 3, 2017
|
January 29, 2016
|
|||||||||
|
Net loss
|
$
|
(3,855
|
)
|
$
|
(1,718
|
)
|
$
|
(1,104
|
)
|
||
|
Other comprehensive income (loss), net of tax
|
|||||||||||
|
Foreign currency translation adjustments
|
791
|
|
(254
|
)
|
(138
|
)
|
|||||
|
Available-for-sale investments:
|
|||||||||||
|
Change in unrealized gains (losses)
|
31
|
|
(17
|
)
|
—
|
|
|||||
|
Reclassification adjustment for net losses realized in net loss
|
2
|
|
1
|
|
—
|
|
|||||
|
Net change in market value of investments
|
33
|
|
(16
|
)
|
—
|
|
|||||
|
Cash flow hedges:
|
|||||||||||
|
Change in unrealized gains (losses)
|
(248
|
)
|
20
|
|
152
|
|
|||||
|
Reclassification adjustment for net (gains) losses included in net loss
|
134
|
|
(43
|
)
|
(367
|
)
|
|||||
|
Net change in cash flow hedges
|
(114
|
)
|
(23
|
)
|
(215
|
)
|
|||||
|
Pension and other postretirement plans:
|
|||||||||||
|
Recognition of actuarial net gain from pension and other postretirement plans
|
13
|
|
19
|
|
—
|
|
|||||
|
Reclassification adjustments for net gains (losses) from pension and other postretirement plans
|
—
|
|
—
|
|
—
|
|
|||||
|
Net change in actuarial net gain from pension and other postretirement plans
|
13
|
|
19
|
|
—
|
|
|||||
|
Total other comprehensive income (loss), net of tax expense (benefit) of $12, $(3), and $(8), respectively
|
723
|
|
(274
|
)
|
(353
|
)
|
|||||
|
Comprehensive loss, net of tax
|
(3,132
|
)
|
(1,992
|
)
|
(1,457
|
)
|
|||||
|
Less: Net loss attributable to non-controlling interests
|
(127
|
)
|
(46
|
)
|
—
|
|
|||||
|
Less: Other comprehensive loss attributable to non-controlling interests
|
(2
|
)
|
(3
|
)
|
—
|
|
|||||
|
Comprehensive loss attributable to Dell Technologies Inc.
|
$
|
(3,003
|
)
|
$
|
(1,943
|
)
|
$
|
(1,457
|
)
|
||
The accompanying notes are an integral part of these Consolidated Financial Statements.
82
DELL TECHNOLOGIES INC.
(in millions; continued on next page)
|
|
Fiscal Year Ended
|
||||||||||
|
|
February 2, 2018
|
February 3, 2017
|
January 29, 2016
|
||||||||
|
Cash flows from operating activities:
|
|
||||||||||
|
Net loss
|
$
|
(3,855
|
)
|
$
|
(1,718
|
)
|
$
|
(1,104
|
)
|
||
|
Adjustments to reconcile net loss to net cash provided by operating activities:
|
|||||||||||
|
Depreciation and amortization
|
8,634
|
|
4,938
|
|
2,872
|
|
|||||
|
Amortization of debt issuance costs
|
183
|
|
268
|
|
59
|
|
|||||
|
Stock-based compensation expense
|
835
|
|
398
|
|
72
|
|
|||||
|
Deferred income taxes
|
(2,595
|
)
|
(2,201
|
)
|
(205
|
)
|
|||||
|
Effects of exchange rate changes on monetary assets and liabilities denominated in foreign currencies
|
113
|
|
74
|
|
122
|
|
|||||
|
Net (gain)/loss on sale of businesses
|
16
|
|
(2,319
|
)
|
—
|
|
|||||
|
Provision for doubtful accounts — including financing receivables
|
164
|
|
120
|
|
171
|
|
|||||
|
Other
|
230
|
|
60
|
|
56
|
|
|||||
|
Changes in assets and liabilities, net of effects from acquisitions and dispositions:
|
|||||||||||
|
Accounts receivable
|
(1,515
|
)
|
(1,776
|
)
|
187
|
|
|||||
|
Financing receivables
|
(1,653
|
)
|
(751
|
)
|
(321
|
)
|
|||||
|
Inventories
|
(325
|
)
|
1,076
|
|
(5
|
)
|
|||||
|
Other assets
|
(1,009
|
)
|
215
|
|
(28
|
)
|
|||||
|
Accounts payable
|
3,779
|
|
751
|
|
(374
|
)
|
|||||
|
Deferred revenue
|
3,298
|
|
2,622
|
|
867
|
|
|||||
|
Accrued and other liabilities
|
510
|
|
552
|
|
(207
|
)
|
|||||
|
Change in cash from operating activities
|
6,810
|
|
2,309
|
|
2,162
|
|
|||||
|
Cash flows from investing activities:
|
|||||||||||
|
Investments:
|
|||||||||||
|
Purchases
|
(4,389
|
)
|
(778
|
)
|
(27
|
)
|
|||||
|
Maturities and sales
|
3,878
|
|
1,173
|
|
7
|
|
|||||
|
Capital expenditures
|
(1,212
|
)
|
(699
|
)
|
(482
|
)
|
|||||
|
Proceeds from sale of facilities, land, and other assets
|
—
|
|
24
|
|
88
|
|
|||||
|
Capitalized software development costs
|
(369
|
)
|
(207
|
)
|
—
|
|
|||||
|
Collections on purchased financing receivables
|
30
|
|
35
|
|
85
|
|
|||||
|
Acquisition of businesses, net
|
(658
|
)
|
(37,629
|
)
|
—
|
|
|||||
|
Divestitures of businesses, net
|
—
|
|
6,873
|
|
8
|
|
|||||
|
Asset acquisitions, net
|
(96
|
)
|
—
|
|
—
|
|
|||||
|
Asset dispositions, net
|
(59
|
)
|
—
|
|
—
|
|
|||||
|
Other
|
(6
|
)
|
(48
|
)
|
—
|
|
|||||
|
Change in cash from investing activities
|
(2,881
|
)
|
(31,256
|
)
|
(321
|
)
|
|||||
The accompanying notes are an integral part of these Consolidated Financial Statements.
83
DELL TECHNOLOGIES INC.
CONSOLIDATED STATEMENTS OF CASH FLOWS
(continued; in millions)
|
Fiscal Year Ended
|
|||||||||||
|
February 2, 2018
|
February 3, 2017
|
January 29, 2016
|
|||||||||
|
Cash flows from financing activities:
|
|||||||||||
|
Payment of dissenting shares obligation
|
—
|
|
(446
|
)
|
—
|
|
|||||
|
Share repurchases for tax withholdings of equity awards
|
(385
|
)
|
(93
|
)
|
(2
|
)
|
|||||
|
Proceeds from the issuance of DHI Group Common Stock
|
—
|
|
4,422
|
|
—
|
|
|||||
|
Proceeds from the issuance of common stock of subsidiaries
|
131
|
|
164
|
|
—
|
|
|||||
|
Repurchases of DHI Group Common Stock
|
(6
|
)
|
(10
|
)
|
—
|
|
|||||
|
Repurchases of Class V Common Stock
|
(723
|
)
|
(701
|
)
|
—
|
|
|||||
|
Repurchases of common stock of subsidiaries
|
(724
|
)
|
(611
|
)
|
—
|
|
|||||
|
Payments for debt issuance costs
|
(48
|
)
|
(853
|
)
|
(10
|
)
|
|||||
|
Proceeds from debt
|
14,439
|
|
46,893
|
|
5,460
|
|
|||||
|
Repayments of debt
|
(12,321
|
)
|
(16,960
|
)
|
(5,950
|
)
|
|||||
|
Other
|
1
|
|
16
|
|
6
|
|
|||||
|
Change in cash from financing activities
|
364
|
|
31,821
|
|
(496
|
)
|
|||||
|
Effect of exchange rate changes on cash and cash equivalents
|
175
|
|
24
|
|
(167
|
)
|
|||||
|
Change in cash and cash equivalents
|
4,468
|
|
2,898
|
|
1,178
|
|
|||||
|
Cash and cash equivalents at beginning of period, including amounts held for sale
|
9,474
|
|
6,576
|
|
5,398
|
|
|||||
|
Cash and cash equivalents at end of the period
|
13,942
|
|
9,474
|
|
6,576
|
|
|||||
|
Less: Cash included in current assets held for sale
|
—
|
|
—
|
|
254
|
|
|||||
|
Cash and cash equivalents from continuing operations
|
$
|
13,942
|
|
$
|
9,474
|
|
$
|
6,322
|
|
||
|
Income tax paid
|
$
|
924
|
|
$
|
978
|
|
$
|
264
|
|
||
|
Interest paid
|
$
|
2,192
|
|
$
|
1,575
|
|
$
|
585
|
|
||
The accompanying notes are an integral part of these Consolidated Financial Statements.
84
DELL TECHNOLOGIES INC.
CONSOLIDATED STATEMENTS OF STOCKHOLDERS' EQUITY
(in millions; continued on next page
)
|
Common Stock and Capital in Excess of Par Value
|
||||||||||||||||||
|
Issued Shares
|
Amount
|
Accumulated Deficit
|
Accumulated Other Comprehensive Income/(Loss)
|
Total Stockholders' Equity
|
||||||||||||||
|
Balances as of January 30, 2015
|
405
|
|
$
|
5,708
|
|
$
|
(2,833
|
)
|
$
|
29
|
|
$
|
2,904
|
|
||||
|
Net loss
|
—
|
|
—
|
|
(1,104
|
)
|
—
|
|
(1,104
|
)
|
||||||||
|
Foreign currency translation adjustments
|
—
|
|
—
|
|
—
|
|
(138
|
)
|
(138
|
)
|
||||||||
|
Cash flow hedges, net change
|
—
|
|
—
|
|
—
|
|
(215
|
)
|
(215
|
)
|
||||||||
|
Stock-based compensation expense
|
—
|
|
72
|
|
—
|
|
—
|
|
72
|
|
||||||||
|
Revaluation of redeemable shares
|
—
|
|
(53
|
)
|
—
|
|
—
|
|
(53
|
)
|
||||||||
|
Balances as of January 29, 2016
|
405
|
|
$
|
5,727
|
|
$
|
(3,937
|
)
|
$
|
(324
|
)
|
$
|
1,466
|
|
||||
The accompanying notes are an integral part of these Consolidated Financial Statements.
85
DELL TECHNOLOGIES INC.
CONSOLIDATED STATEMENTS OF STOCKHOLDERS' EQUITY
(in millions; continued on next page
)
|
Common Stock and Capital in Excess of Par Value
|
Treasury Stock
|
||||||||||||||||||||||||||||||||||||||||||||||
|
DHI Group
|
Class V Common Stock
|
DHI Group
|
Class V Common Stock
|
||||||||||||||||||||||||||||||||||||||||||||
|
Issued Shares
|
Amount
|
Issued Shares
|
Amount
|
Shares
|
Amount
|
Shares
|
Amount
|
Accumulated Deficit
|
Accumulated Other Comprehensive Income/(Loss)
|
Dell Technologies Stockholders' Equity
|
Non-Controlling Interests
|
Total Stockholders' Equity
|
|||||||||||||||||||||||||||||||||||
|
Balances as of January 29, 2016
|
405
|
|
$
|
5,727
|
|
—
|
|
$
|
—
|
|
—
|
|
$
|
—
|
|
—
|
|
$
|
—
|
|
$
|
(3,937
|
)
|
$
|
(324
|
)
|
$
|
1,466
|
|
$
|
—
|
|
$
|
1,466
|
|
||||||||||||
|
Net loss
|
—
|
|
—
|
|
—
|
|
—
|
|
—
|
|
—
|
|
—
|
|
—
|
|
(1,672
|
)
|
—
|
|
(1,672
|
)
|
(46
|
)
|
(1,718
|
)
|
|||||||||||||||||||||
|
Foreign currency translation adjustments
|
—
|
|
—
|
|
—
|
|
—
|
|
—
|
|
—
|
|
—
|
|
—
|
|
—
|
|
(254
|
)
|
(254
|
)
|
—
|
|
(254
|
)
|
|||||||||||||||||||||
|
Investments, net change
|
—
|
|
—
|
|
—
|
|
—
|
|
—
|
|
—
|
|
—
|
|
—
|
|
—
|
|
(13
|
)
|
(13
|
)
|
(3
|
)
|
(16
|
)
|
|||||||||||||||||||||
|
Cash flow hedges, net change
|
—
|
|
—
|
|
—
|
|
—
|
|
—
|
|
—
|
|
—
|
|
—
|
|
—
|
|
(23
|
)
|
(23
|
)
|
—
|
|
(23
|
)
|
|||||||||||||||||||||
|
Pension and other post-retirement
|
—
|
|
—
|
|
—
|
|
—
|
|
—
|
|
—
|
|
—
|
|
—
|
|
—
|
|
19
|
|
19
|
|
—
|
|
19
|
|
|||||||||||||||||||||
|
Fair value of non-controlling interests assumed in business combination
|
—
|
|
—
|
|
—
|
|
—
|
|
—
|
|
—
|
|
—
|
|
—
|
|
—
|
|
—
|
|
—
|
|
6,048
|
|
6,048
|
|
|||||||||||||||||||||
|
Issuance of common stock
|
164
|
|
4,441
|
|
223
|
|
10,041
|
|
—
|
|
—
|
|
—
|
|
—
|
|
—
|
|
—
|
|
14,482
|
|
—
|
|
14,482
|
|
|||||||||||||||||||||
|
Stock-based compensation expense
|
—
|
|
98
|
|
—
|
|
—
|
|
—
|
|
—
|
|
—
|
|
—
|
|
—
|
|
—
|
|
98
|
|
300
|
|
398
|
|
|||||||||||||||||||||
|
Tax benefit from stock-based compensation
|
—
|
|
9
|
|
—
|
|
—
|
|
—
|
|
—
|
|
—
|
|
—
|
|
—
|
|
—
|
|
9
|
|
1
|
|
10
|
|
|||||||||||||||||||||
|
Treasury stock repurchases
|
—
|
|
—
|
|
—
|
|
—
|
|
—
|
|
(10
|
)
|
14
|
|
(742
|
)
|
—
|
|
—
|
|
(752
|
)
|
—
|
|
(752
|
)
|
|||||||||||||||||||||
|
Revaluation of redeemable shares
|
—
|
|
(125
|
)
|
—
|
|
—
|
|
—
|
|
—
|
|
—
|
|
—
|
|
—
|
|
—
|
|
(125
|
)
|
—
|
|
(125
|
)
|
|||||||||||||||||||||
|
Impact from equity transactions of non-controlling interests
|
—
|
|
18
|
|
—
|
|
—
|
|
—
|
|
—
|
|
—
|
|
—
|
|
—
|
|
—
|
|
18
|
|
(534
|
)
|
(516
|
)
|
|||||||||||||||||||||
|
Other
|
—
|
|
(10
|
)
|
—
|
|
—
|
|
—
|
|
—
|
|
—
|
|
—
|
|
—
|
|
—
|
|
(10
|
)
|
—
|
|
(10
|
)
|
|||||||||||||||||||||
|
Balances as of February 3, 20
17
|
569
|
|
$
|
10,158
|
|
223
|
|
$
|
10,041
|
|
—
|
|
$
|
(10
|
)
|
14
|
|
$
|
(742
|
)
|
$
|
(5,609
|
)
|
$
|
(595
|
)
|
$
|
13,243
|
|
$
|
5,766
|
|
$
|
19,009
|
|
||||||||||||
The accompanying notes are an integral part of these Consolidated Financial Statements.
86
DELL TECHNOLOGIES INC.
CONSOLIDATED STATEMENTS OF STOCKHOLDERS' EQUITY
(continued; in millions
)
|
Common Stock and Capital in Excess of Par Value
|
Treasury Stock
|
||||||||||||||||||||||||||||||||||||||||||||||
|
DHI Group
|
Class V Common Stock
|
DHI Group
|
Class V Common Stock
|
||||||||||||||||||||||||||||||||||||||||||||
|
Issued Shares
|
Amount
|
Issued Shares
|
Amount
|
Shares
|
Amount
|
Shares
|
Amount
|
Accumulated Deficit
|
Accumulated Other Comprehensive Income/(Loss)
|
Dell Technologies Stockholders' Equity
|
Non-Controlling Interests
|
Total Stockholders' Equity
|
|||||||||||||||||||||||||||||||||||
|
Balances as of February 3, 2017
|
569
|
|
$
|
10,158
|
|
223
|
|
$
|
10,041
|
|
—
|
|
$
|
(10
|
)
|
14
|
|
$
|
(742
|
)
|
$
|
(5,609
|
)
|
$
|
(595
|
)
|
$
|
13,243
|
|
$
|
5,766
|
|
$
|
19,009
|
|
||||||||||||
|
Adjustment for adoption of accounting standard (Note 1)
|
—
|
|
—
|
|
—
|
|
—
|
|
—
|
|
—
|
|
—
|
|
—
|
|
84
|
|
—
|
|
84
|
|
—
|
|
84
|
|
|||||||||||||||||||||
|
Net loss
|
—
|
|
—
|
|
—
|
|
—
|
|
—
|
|
—
|
|
—
|
|
—
|
|
(3,728
|
)
|
—
|
|
(3,728
|
)
|
(127
|
)
|
(3,855
|
)
|
|||||||||||||||||||||
|
Foreign currency translation adjustments
|
—
|
|
—
|
|
—
|
|
—
|
|
—
|
|
—
|
|
—
|
|
—
|
|
—
|
|
791
|
|
791
|
|
—
|
|
791
|
|
|||||||||||||||||||||
|
Investments, net change
|
—
|
|
—
|
|
—
|
|
—
|
|
—
|
|
—
|
|
—
|
|
—
|
|
—
|
|
35
|
|
35
|
|
(2
|
)
|
33
|
|
|||||||||||||||||||||
|
Cash flow hedges, net change
|
—
|
|
—
|
|
—
|
|
—
|
|
—
|
|
—
|
|
—
|
|
—
|
|
—
|
|
(114
|
)
|
(114
|
)
|
—
|
|
(114
|
)
|
|||||||||||||||||||||
|
Pension and other post-retirement
|
—
|
|
—
|
|
—
|
|
—
|
|
—
|
|
—
|
|
—
|
|
—
|
|
—
|
|
13
|
|
13
|
|
—
|
|
13
|
|
|||||||||||||||||||||
|
Issuance of common stock
|
2
|
|
(31
|
)
|
—
|
|
—
|
|
—
|
|
—
|
|
—
|
|
—
|
|
—
|
|
—
|
|
(31
|
)
|
—
|
|
(31
|
)
|
|||||||||||||||||||||
|
Stock-based compensation
|
—
|
|
109
|
|
—
|
|
—
|
|
—
|
|
—
|
|
—
|
|
—
|
|
—
|
|
—
|
|
109
|
|
730
|
|
839
|
|
|||||||||||||||||||||
|
Treasury stock repurchases
|
—
|
|
—
|
|
—
|
|
—
|
|
1
|
|
(6
|
)
|
10
|
|
(682
|
)
|
—
|
|
—
|
|
(688
|
)
|
—
|
|
(688
|
)
|
|||||||||||||||||||||
|
Revaluation of redeemable shares
|
—
|
|
(153
|
)
|
—
|
|
—
|
|
—
|
|
—
|
|
—
|
|
—
|
|
—
|
|
—
|
|
(153
|
)
|
—
|
|
(153
|
)
|
|||||||||||||||||||||
|
Impact from equity transactions of non-controlling interests
|
—
|
|
(235
|
)
|
—
|
|
—
|
|
—
|
|
—
|
|
—
|
|
—
|
|
—
|
|
—
|
|
(235
|
)
|
(706
|
)
|
(941
|
)
|
|||||||||||||||||||||
|
Balances as of February 2,
2018
|
571
|
|
$
|
9,848
|
|
223
|
|
$
|
10,041
|
|
1
|
|
$
|
(16
|
)
|
24
|
|
$
|
(1,424
|
)
|
$
|
(9,253
|
)
|
$
|
130
|
|
$
|
9,326
|
|
$
|
5,661
|
|
$
|
14,987
|
|
||||||||||||
The accompanying notes are an integral part of these Consolidated Financial Statements.
87
NOTE 1
—
BASIS OF PRESENTATION
EMC Merger Transaction
— On September 7, 2016, a wholly-owned subsidiary of Dell Technologies Inc. ("Merger Sub") merged with and into EMC Corporation, a Massachusetts corporation ("EMC"), with EMC surviving the merger as a wholly-owned subsidiary of Dell Technologies Inc. (the "EMC merger transaction"). See
Note 3
of the
Notes to the Consolidated Financial Statements
for additional information on the EMC merger transaction.
Divestitures
— On November 2, 2016, Dell Inc. ("Dell"), a wholly-owned subsidiary of Dell Technologies Inc., completed substantially all of the divestiture of Dell Services. On October 31, 2016, Dell completed the divestiture of Dell Software Group ("DSG"). On January 23, 2017, EMC, a subsidiary of the Company, completed the divestiture of the Dell EMC Enterprise Content Division ("ECD"). In accordance with applicable accounting guidance, the results of Dell Services, DSG, and ECD are presented as discontinued operations in the
Consolidated Statements of Income (Loss)
and, as such, have been excluded from both continuing operations and segment results for the relevant periods. See
Note 4
of the
Notes to the Consolidated Financial Statements
for additional information.
Going-Private Transaction
- On October 29, 2013, Dell Technologies acquired Dell in a transaction referred to as the going-private transaction.
Basis of Presentation —
These Consolidated Financial Statements have been prepared in accordance with accounting principles generally accepted in the United States of America ("GAAP"). References in these Notes to the Consolidated Financial Statements to the "Company" or "Dell Technologies" mean Dell Technologies Inc. individually and together with its consolidated subsidiaries.
As a result of the EMC merger transaction completed on September 7, 2016, the Company's results of operations, comprehensive income (loss), and cash flows for the fiscal periods reflected in these Consolidated Financial Statements are not directly comparable as the results of the acquired businesses are only included in the consolidated results from September 7, 2016.
Unless the context indicates otherwise, references in these
Notes to the Consolidated Financial Statements
to "VMware" mean the VMware reportable segment, which reflects the operations of VMware, Inc. (NYSE: VMW) within Dell Technologies. See Exhibit 99.1 filed with the annual report on Form 10-K for the fiscal year ended
February 2, 2018
for information on the differences between VMware reportable segment results and VMware, Inc. results.
88
NOTE 2
—
DESCRIPTION OF BUSINESS AND SUMMARY OF SIGNIFICANT ACCOUNTING POLICIES
Description of Business
— The Company is a strategically aligned family of businesses that offers a broad range of technology solutions, including desktops, notebooks, servers and networking products, storage products, cloud solutions products, services, software, and third-party software and peripherals.
Fiscal Year
— The Company's fiscal year is the 52- or 53-week period ending on the Friday nearest January 31. The fiscal years ended
February 2, 2018
("
Fiscal 2018
") and
January 29, 2016
("
Fiscal 2016
") were 52-week periods. The fiscal year ended
February 3, 2017
("
Fiscal 2017
") was a 53-week period.
Principles of Consolidation
— These consolidated financial statements include the accounts of Dell Technologies and its wholly-owned subsidiaries, as well as the accounts of SecureWorks Corp. (“SecureWorks"), VMware, Inc., and Pivotal Software, Inc. ("Pivotal"), companies which are majority-owned by Dell Technologies. All intercompany transactions have been eliminated.
On April 27, 2016, SecureWorks completed a registered underwritten initial public offering of its Class A common stock. As of
February 2, 2018
, Dell Technologies held approximately
87.1%
of the outstanding equity interest in SecureWorks. As Dell Technologies is the controlling stockholder of SecureWorks, SecureWorks' financial results have been consolidated with those of Dell Technologies. The portion of the results of operations of SecureWorks allocable to its other owners is shown as net income (loss) attributable to the non-controlling interests in the Consolidated Statements of Income (Loss), as an adjustment to net income (loss) attributable to Dell Technologies stockholders. Additionally, the cumulative portion of the results of operations of SecureWorks allocable to those other owners, along with the interest in the net assets of SecureWorks attributable to those other owners, is shown as a component of non-controlling interests in the Consolidated Statements of Financial Position as of
February 2, 2018
.
As of
February 2, 2018
, Dell Technologies held approximately
81.9%
of the outstanding equity interest in VMware, Inc. VMware, Inc.'s financial results have been consolidated with those of Dell Technologies since
September 7, 2016
, at which time Dell Technologies became VMware, Inc.'s controlling stockholder. The portion of the results of operations of VMware, Inc. allocable to its other owners is shown as net income (loss) attributable to the non-controlling interests in the Consolidated Statements of Income (Loss) as an adjustment to net income (loss) attributable to Dell Technologies stockholders. Additionally, the cumulative portion of the results of operations of VMware, Inc. allocable to those other owners, along with the interest in the net assets of VMware, Inc. attributable to those other owners, is shown as a component of non-controlling interests in the Consolidated Statements of Financial Position as of
February 2, 2018
.
As of
February 2, 2018
, Dell Technologies held approximately
77.1%
of the outstanding equity interest in Pivotal. Pivotal's financial results have been consolidated with those of Dell Technologies since
September 7, 2016
, at which time Dell Technologies became Pivotal's controlling stockholder. A portion of the non-controlling interest in Pivotal is held by third parties in the form of preferred equity instruments. Accordingly, there is no net income attributable to this portion of non-controlling interest in the Consolidated Statements of Income (Loss). The other portion of the non-controlling interest in Pivotal is held by third parties in the form of common stock. As such, there is net income (loss) attributable to this portion of non-controlling interest in the Consolidated Statements of Income (Loss) as an adjustment to net income (loss) attributable to Dell Technologies stockholders. Additionally, the interest in the net assets of Pivotal attributable to those other owners is shown as a component of non-controlling interests in the Consolidated Statements of Financial Position as of
February 2, 2018
.
Use of Estimates
— The preparation of financial statements in accordance with GAAP requires management to make estimates and assumptions that affect the amounts reported in the Consolidated Financial Statements and the accompanying Notes. Actual results could differ materially from those estimates.
Cash and Cash Equivalents
— All highly liquid investments, including credit card receivables due from banks, with original maturities of 90 days or less at date of purchase, are reported at fair value and are considered to be cash equivalents. All other investments not considered to be cash equivalents are separately categorized as investments.
Investments
— All debt security investments with effective maturities in excess of one year and substantially all equity and other securities are recorded as long-term investments in the
Consolidated Statements of Financial Position
. In comparison, debt security instruments with an effective maturity of one year or less are classified as short-term investments in the
Consolidated Statements of Financial Position
.
89
Unrealized gain and loss positions on investments classified as available-for-sale are included within accumulated other comprehensive income (loss), net of any related tax effect. Realized gains and losses and other-than-temporary impairments are reclassified from accumulated other comprehensive income (loss) to interest and other, net. Investments accounted for under the cost method are recorded at cost initially, which approximates fair value. Subsequently, if there is an indicator of impairment, the impairment is recognized in interest and other, net in the
Consolidated Statements of Income (Loss)
.
Allowance for Doubtful Accounts
— The Company recognizes an allowance for losses on accounts receivable in an amount equal to the estimated probable losses, net of recoveries. The allowance is based on an analysis of current receivables aging and expected future write-offs, as well as an assessment of specific identifiable customer accounts considered at risk or uncollectible. The expense associated with the allowance for doubtful accounts is recognized in selling, general, and administrative expenses.
Financing Receivables
—
Financing receivables are presented net of allowance for losses and consist of customer receivables and residual interest. Customer receivables include revolving loans and fixed-term leases and loans resulting primarily from the sale of the Company's products and services. The Company has two portfolios: (1) fixed-term leases and loans and (2) revolving loans, and assesses risk at the portfolio level to determine the appropriate allowance levels. The portfolio segments are further segregated into classes based on products, customer type, and credit risk evaluation: (1) Revolving - Dell Preferred Account ("DPA"); (2) Revolving - Dell Business Credit ("DBC"); and (3) Fixed-term - Consumer and Commercial. Fixed-term leases and loans are offered to qualified small and medium-sized businesses, large commercial accounts, governmental organizations, and educational entities. Additionally, fixed-term loans are also offered to certain individual consumer customers. Revolving loans are offered under private label credit financing programs. The DPA revolving loan programs are offered to individual consumers and the DBC revolving loan programs are offered to small and medium-sized business customers.
The Company retains a residual interest in equipment leased under its fixed-term lease programs. The amount of the residual interest is established at the inception of the lease based upon estimates of the value of the equipment at the end of the lease term using historical studies, industry data, and future value-at-risk demand valuation methods. On a quarterly basis, the Company assesses the carrying amount of its recorded residual values for impairment. Anticipated declines in specific future residual values that are considered to be other-than-temporary are recorded curren
tly in earnings.
Allowance for Financing Receivable Losses
—
The Company recognizes an allowance for losses on financing receivables in an amount equal to the probable losses net of recoveries. The allowance for losses is generally determined at the aggregate portfolio level based on a variety of factors, including historical and anticipated experience, past due receivables, receivable type, and customer risk profile. Customer account principal and interes
t are charged to the allowance for losses when an account is deemed to be uncollectible or generally when the account is 180 days delinquen
t. While the Company does not generally place financing receivables on non-accrual status during the delinquency period, accrued interest is included in the allowance for loss calculation and, therefore, the Company is adequately reserved in the event of charge off. Recoveries on receivables previously charged off as uncollectible are recorded to the allowance for financing receivables losses. The expense associated with the allowance for financing receivables losses is recognized as cost of net revenue. Both fixed and revolving receivable loss rates are affected by macroeconomic conditions, including the level of gross domestic product ("GDP") growth, unemployment rates, the level of commercial capital equipment investment, and the credit quality of the borrower.
Asset Securitization
—
The Company transfers certain U.S. and European customer financing receivables to Special Purpose Entities ("SPEs") that meet the definition of a Variable Interest Entity ("VIE") and are consolidated into the Consolidated Financial Statements. These SPEs are bankruptcy-remote legal entities with separate assets and liabilities. The purpose of the SPEs is to facilitate the funding of customer receivables in the capital markets. These SPEs have entered into financing arrangements with multi-seller conduits that, in turn, issue asset-backed debt securities in the capital markets. The asset securitizations in the SPEs are accounted for as secured borrowings. See
Note 7
of the
Notes to the Consolidated Financial Statements
for additional information on the impact of the consolidation.
Inventories
—
Inventories are stated at the lower of cost or market with cost being determined on a first-in, first-out basis. Adjustments to reduce the cost of inventory to its net realizable value are made, if required, for estimated excess, obsolescence, or impaired balances.
90
Property, Plant, and Equipment
—
Property, plant, and equipment are carried at depreciated cost. Depreciation is determined using the straight-line method over the shorter of the estimated economic lives of the assets or the lease term. The estimated useful lives of the Company's property, plant, and equipment are generally as follows:
|
Estimated Useful Life
|
|
|
Computer equipment
|
3-5 years
|
|
Buildings
|
10-30 years or term of underlying land lease
|
|
Leasehold improvements
|
Shorter of 5-20 years or lease term
|
|
Machinery and equipment
|
3-5 years
|
Gains or losses related to retirements or dispositions of fixed assets are recognized in the period during which the retirement or disposition occurs.
Capitalized Software Development Costs
— In accordance with the applicable accounting standards, software development costs related to the development of new product offerings are capitalized subsequent to the establishment of technological feasibility, which is demonstrated by the completion of a detailed program design or working model, if no program design is completed. The Company amortizes capitalized costs straight line over the estimated useful lives of the products, which is generally
two
years.
As of
February 2, 2018
, capitalized software development costs were
$489 million
and are included in other non-current assets, net in the accompanying Consolidated Statements of Financial Position. Amortization expense for the period ended
February 2, 2018
was
$82 million
. Amortization expense for the period from September 7, 2016 through February 3, 2017 was immaterial.
Prior to the EMC merger transaction, there were no significant capitalized software development costs specific to the legacy businesses of Dell Technologies due to the timing in the research and development process of establishing technological feasibility.
The Company capitalizes certain internal and external costs to acquire or create internal use software which are incurred subsequent to the completion of the preliminary project stage. Development costs are amortized straight line over the shorter of the expected useful life of the software or
five
years. Costs associated with maintenance and minor enhancements to the features and functionality of the Company's website are expensed as incurred.
Impairment of Long-Lived Assets
— The Company reviews long-lived assets for impairment when events or changes in circumstances indicate the carrying amount of an asset may not be recoverable. The Company assesses the recoverability of the assets based on the undiscounted future cash flows expected from the use and eventual disposition of the asset. If the carrying amount of the asset is determined not to be recoverable, a write-down to fair value is recorded. Fair values are determined based on quoted market values, discounted cash flows, or external appraisals, as applicable. Long-lived assets to be disposed of are reported at the lower of carrying amount or fair value less costs to sell.
Business Combinations
— The Company accounts for business combinations, including the EMC merger transaction and the going-private transaction described in Note 1 of the
Notes to the Consolidated Financial Statements
. See
Note 3
of the
Notes to the Consolidated Financial Statements
for more information on the EMC merger transaction. Accordingly, the assets and liabilities of the acquired business are recorded at their fair values at the date of acquisition. The excess of the purchase price over the fair value of the tangible and intangible assets acquired and the liabilities assumed is recorded as goodwill. During the measurement period, if new information is obtained about facts and circumstances that existed as of the acquisition date, cumulative changes in the estimated fair values of the net assets recorded may change the amount of the purchase price allocable to goodwill. During the measurement period, which expires one year from the acquisition date, changes to any purchase price allocations that are material to the Company's consolidated financial results will be adjusted in the reporting period in which the adjustment amount is determined.
In-process research and development costs are recorded at fair value as an indefinite-lived intangible asset and assessed for impairment thereafter until completion, at which point the asset is amortized over its expected useful life. All acquisition costs are expensed as incurred, and the results of operations of acquired businesses are included in the Consolidated Financial Statements from the acquisition date.
91
Intangible Assets Including Goodwill
— Identifiable intangible assets with finite lives are amortized over their estimated useful lives. Intangible assets are reviewed for impairment when events and circumstances indicate the asset may be impaired. Goodwill and indefinite-lived intangible assets are tested for impairment annually during the third fiscal quarter and whenever events or circumstances indicate that an impairment may have occurred.
Foreign Currency Translation
— The majority of the Company's international sales are made by international subsidiaries, most of which have the U.S. dollar as their functional currency. The Company's subsidiaries that do not have the U.S. dollar as their functional currency translate assets and liabilities at current rates of exchange in effect at the balance sheet date. Revenue and expenses from these international subsidiaries are translated using the monthly average exchange rates in effect for the period in which the transactions occur. Foreign currency translation adjustments are included as a component of accumulated other comprehensive income (loss) ("OCI") in stockholders' equity.
Local currency transactions of international subsidiaries that have the U.S. dollar as the functional currency are remeasured into U.S. dollars using the current rates of exchange for monetary assets and liabilities and historical rates of exchange for non-monetary assets and liabilities. Gains and losses from remeasurement of monetary assets and liabilities are included in interest and other, net.
Hedging Instruments
— The Company uses derivative financial instruments, primarily forwards, options, and swaps, to hedge certain foreign currency and interest rate exposures. The relationships between hedging instruments and hedged items, as well as the risk management objectives and strategies for undertaking hedge transactions, are formally documented. The Company does not use derivatives for speculative purposes.
All derivative instruments are recognized as either assets or liabilities in the Consolidated Statements of Financial Position and are measured at fair value. Hedge accounting is applied based upon the criteria established by accounting guidance for derivative instruments and hedging activities. Derivatives are assessed for hedge effectiveness both at the onset of the hedge and at regular intervals throughout the life of the derivative. Any hedge ineffectiveness is recognized currently in earnings as a component of interest and other, net. For derivatives that are not designated as hedges or do not qualify for hedge accounting treatment, the Company recognizes the change in the instrument's fair value currently in earnings as a component of interest and other, net. The Company's hedge portfolio includes non-designated derivatives and derivatives designated as cash flow hedges.
For derivative instruments that are designated as cash flow hedges, hedge ineffectiveness is measured by comparing the cumulative change in the fair value of the hedge contract with the cumulative change in the fair value of the hedged item, both of which are based on forward rates. The Company records the effective portion of the gain or loss on the derivative instrument in accumulated other comprehensive income (loss), as a separate component of stockholders' equity, and reclassifies the gain or loss into earnings in the period during which the hedged transaction is recognized in earnings.
Cash flows from derivative instruments are presented in the same category on the Consolidated Statements of Cash Flows as the cash flows from the underlying hedged items. See
Note 9
of the
Notes to the Consolidated Financial Statements
for a description of the Company's derivative financial instrument activities.
Revenue Recognition
— Net revenue primarily includes sales of hardware, services, software licenses, and peripherals. The Company recognizes revenue for these products and services when it is realized or realizable and earned. Revenue is recognized when persuasive evidence of an arrangement exists; delivery has occurred or services have been rendered; the Company's fee to its customer is fixed or determinable; and collection of the resulting receivable is reasonably assured. This policy is applicable to all sales, including sales to resellers and end-users.
Revenue from certain third-party software sales and extended warranties for third-party products, for which the Company does not meet the criteria for gross revenue recognition, is recognized on a net basis. All other revenue is recognized on a gross basis.
The following summarizes the major terms of contractual relationships with customers and the manner in which the Company accounts for sales transactions.
92
Products
Product revenue consists of computer hardware, enterprise hardware, and software licenses sales that are delivered, sold as a subscription or sold on a consumption basis. Computer hardware and enterprise hardware include notebooks and desktop PCs, servers, storage hardware, and other hardware-related devices. Software license sales include optional, stand-alone software applications. Software applications provide customers with resource management, backup and archiving, information security, information management and intelligence, data analytics, and server virtualization capabilities. Revenue from the sale of hardware products and systems is recognized when title and risk of loss pass to the customer. Delivery is considered complete when products have been shipped to the Company's customer, title and risk of loss have transferred to the customer, and customer acceptance has been satisfied. Customer acceptance is satisfied if acceptance is obtained from the customer, if all acceptance provisions lapse, or if the Company has evidence that all acceptance provisions have been satisfied. Depending on the nature of the arrangement, revenue from software license sales is generally recognized upon shipment or electronic delivery. For certain arrangements, revenue is recognized based on usage or ratably over the term of the arrangement. License revenue from royalty arrangements is recognized upon either receipt of royalty reports or payments from third parties.
The Company records reductions to revenue for estimated customer sales returns, rebates, and certain other customer incentive programs. These reductions to revenue are made based upon reasonable and reliable estimates that are determined by historical experience, contractual terms, and current conditions. The primary factors affecting the Company's accrual for estimated customer returns include estimated return rates as well as the number of units shipped that have a right of return that has not expired as of the balance sheet date. If returns cannot be reliably estimated, revenue is not recognized until a reliable estimate can be made or the return right lapses.
The Company sells its products directly to customers as well as through other sales channels, such as value-added resellers, system integrators, distributors, and retailers. The Company recognizes revenue on these sales when the reseller has economic substance apart from the Company; any credit risk has been identified and quantified; title and risk of loss have passed to the channel; the fee paid to the Company is not contingent upon resale or payment by the end user; and the Company has no further obligations related to bringing about resale or delivery.
Sales through the Company's sales channels are primarily made under agreements allowing for limited rights of return, price protection, rebates, and marketing development funds. The Company has generally limited return rights through contractual caps or has an established selling history for these arrangements. Therefore, there is sufficient data to establish reasonable and reliable estimates of returns for the majority of these sales. To the extent price protection or return rights are not limited and a reliable estimate cannot be made, all of the revenue and related costs are deferred until the product has been sold to the end-user or the rights expire. The Company records estimated reductions to revenue or an expense for channel programs at the later of the offer or the time revenue is recognized.
The Company defers the cost of shipped products awaiting revenue recognition until revenue is recognized.
Services
Services revenue consists of hardware and software maintenance, installation services, professional services, training revenue, third-party software revenue, and software sold as a service. The Company recognizes revenue from fixed-price support or maintenance contracts sold for both hardware and software ratably over the contract period and recognizes the costs associated with these contracts as incurred. For sales of extended warranties with a separate contract price, the Company defers revenue equal to the separately stated price. Revenue associated with undelivered elements is deferred and recorded when delivery occurs or services are provided. Revenue from extended warranty and service contracts, for which the Company is obligated to perform, is recorded as deferred revenue and subsequently recognized over the term of the contract on a straight-line basis or when the service is completed and the costs associated with these contracts are recognized as incurred.
93
Multiple Deliverables
When an arrangement has more than one element, such as hardware, software, and services contained in a single arrangement, the Company first allocates revenue based upon the relative selling price into two categories: (1) non-software components, such as hardware and any hardware-related items, such as required system software that functions with the hardware to deliver the essential functionality of the hardware and related post-contract customer support, software as a service subscriptions, and other services; and (2) software components, such as optional software applications and related items, such as post-contract customer support and other services. The Company then allocates revenue within the non-software category to each element based upon its relative selling price using a hierarchy of vendor-specific objective evidence ("VSOE"), third-party evidence of selling price ("TPE"), or estimated selling prices ("ESP"), if VSOE or TPE does not exist. The Company allocates revenue within the software category to the undelivered elements based upon their fair value using VSOE, with the residual revenue allocated to the delivered elements. If the Company cannot objectively determine the VSOE of the fair value of any undelivered software element, it defers revenue for all software components until all elements are delivered and services have been performed, until fair value can objectively be determined for any remaining undelivered elements, or until software maintenance is the only undelivered element, in which case revenue is recognized over the maintenance term for all software elements.
The Company allocates the amount of revenue recognized for delivered elements to the amount that is not subject to forfeiture or refund or contingent on the future delivery of products or services.
Customers under software maintenance agreements are entitled to receive updates and upgrades on a when-and-if-available basis, and various types of technical support based on the level of support purchased. In the event specific features, functionality, entitlements, or the release version of an upgrade or new product have been announced but not delivered, and customers will receive that upgrade or new product as part of a current software maintenance contract, a specified upgrade is deemed created and product revenues are deferred on purchases made after the announcement date until delivery of the upgrade or new product. The amount and elements to be deferred are dependent on whether the Company has established VSOE of fair value for the upgrade or new product.
Other
The Company records revenue from the sale of equipment under sales-type leases as product revenue in an amount equal to the present value of minimum lease payments at the inception of the lease. Sales-type leases also produce financing income, which is included in net products revenue in the Consolidated Statements of Income (Loss) and is recognized at consistent rates of return over the lease term. Revenue from operating leases is recognized over the lease period. The Company also offers qualified customers revolving credit lines for the purchase of products and services offered by the Company. Financing income attributable to these revolving loans is recognized in net products revenue on an accrual basis.
The Company reports revenue net of any revenue-based taxes assessed by governmental authorities that are imposed on and concurrently with specific revenue-producing transactions.
Standard Warranty Liabilities
— The Company records warranty liabilities for estimated costs of fulfilling its obligations under standard limited hardware and software warranties at the time of sale. The liability for standard warranties is included in accrued and other current and other non-current liabilities in the Consolidated Statements of Financial Position. The specific warranty terms and conditions vary depending upon the product sold and the country in which the Company does business, but generally includes technical support, parts, and labor over a period ranging from
one
to
three
years. Factors that affect the Company's warranty liability include the number of installed units currently under warranty, historical and anticipated rates of warranty claims on those units, and cost per claim to satisfy the Company's warranty obligation. The anticipated rate of warranty claims is the primary factor impacting the estimated warranty obligation. The other factors are less significant due to the fact that the average remaining aggregate warranty period of the covered installed base is approximately
19
months, repair parts are generally already in stock or available at pre-determined prices, and labor rates are generally arranged at pre-established amounts with service providers. Warranty claims are relatively predictable based on historical experience of failure rates. If actual results differ from the estimates, the Company revises its estimated warranty liability. Each quarter, the Company reevaluates its estimates to assess the adequacy of its recorded warranty liabilities and adjusts the amounts as necessary.
94
Deferred Revenue
— Deferred revenue is recorded when billings have been generated or payments have been received for undelivered products or services, or in the situation where revenue recognition criteria have not been met. Deferred revenue represents amounts received in advance for extended warranty services, software maintenance, unearned license fees, and deferred profit on third-party software offerings. Deferred revenue is recognized on these items when the revenue recognition criteria are met, generally resulting in ratable recognition over the contract term. The Company also has deferred revenue related to undelivered hardware and professional services, consisting of installations and consulting engagements, which are recognized as the Company's obligations under the contract are completed.
Vendor Rebates and Settlements
— The Company may receive consideration from vendors in the normal course of business. Certain of these funds are rebates of purchase price paid and others are related to reimbursement of costs incurred by the Company to sell the vendor's products. The Company recognizes a reduction of cost of goods sold if the funds are determined to be a reduction of the price of the vendor's products. If the consideration is a reimbursement of costs incurred by the Company to sell or develop the vendor's products, then the consideration is classified as a reduction of that cost, most often operating expenses, in the Consolidated Statements of Income (Loss). In order to be recognized as a reduction of operating expenses, the reimbursement must be for a specific, incremental, and identifiable cost incurred by the Company in selling the vendor's products or services.
In addition, the Company may settle commercial disputes with vendors from time to time. Claims for loss recoveries are recognized when a loss event has occurred, recovery is considered probable, the agreement is finalized, and collectibility is assured. Amounts received by the Company from vendors for loss recoveries are generally recorded as a reduction of cost of goods sold.
Loss Contingencies
— The Company is subject to the possibility of various losses arising in the ordinary course of business. The Company considers the likelihood of loss or impairment of an asset or the incurrence of a liability, as well as the Company's ability to reasonably estimate the amount of loss, in determining loss contingencies. An estimated loss contingency is accrued when it is probable that an asset has been impaired or a liability has been incurred and the amount of loss can be reasonably estimated. The Company regularly evaluates current information available to determine whether such accruals should be adjusted and whether new accruals are required.
Shipping Costs
— The Company's shipping and handling costs are included in cost of net revenue in the Consolidated Statements of Income (Loss).
Selling, General, and Administrative
— Selling expenses include items such as sales salaries and commissions, marketing and advertising costs, and contractor services. Advertising costs are expensed as incurred in selling, general, and administrative expenses in the Consolidated Statements of Income (Loss). For the fiscal years ended
February 2, 2018, February 3, 2017, and January 29, 2016
, advertising expenses were
$1,045 million
,
$772 million
, and
$594 million
, respectively. General and administrative expenses include items for the Company's administrative functions, such as finance, legal, human resources, and information technology support. These functions include costs for items such as salaries, maintenance and supplies, insurance, depreciation expense, and allowance for doubtful accounts.
Research and Development
— Research and development ("R&D") costs are expensed as incurred. R&D costs include salaries and benefits and other personnel-related costs associated with product development. Also included in R&D expenses are infrastructure costs, which consist of equipment and material costs, facilities-related costs, depreciation expense, and intangible asset amortization.
Income Taxes
— Deferred tax assets and liabilities are recorded based on the difference between the financial statement and tax basis of assets and liabilities using enacted tax rates in effect for the year in which the differences are expected to reverse. The Company calculates a provision for income taxes using the asset and liability method, under which deferred tax assets and liabilities are recognized by identifying the temporary differences arising from the different treatment of items for tax and accounting purposes. The Company provides valuation allowances for deferred tax assets, where appropriate. In assessing the need for a valuation allowance, the Company considers all available evidence for each jurisdiction, including past operating results, estimates of future taxable income, and the feasibility of ongoing tax planning strategies. In the event the Company determines that all or part of the net deferred tax assets are not realizable in the future, the Company will make an adjustment to the valuation allowance that would be charged to earnings in the period in which such determination is made.
95
The accounting guidance for uncertainties in income tax prescribes a comprehensive model for the financial statement recognition, measurement, presentation, and disclosure of uncertain tax positions taken or expected to be taken in income tax returns. The Company recognizes a tax benefit from an uncertain tax position in the financial statements only when it is more likely than not that the position will be sustained upon examination, including resolution of any related appeals or litigation processes, based on the technical merits and a consideration of the relevant taxing authority's administrative practices and precedents.
The Global Intangible Low-Taxed Income ("GILTI") provisions of the Tax Cuts and Reform Act signed into law on December 22, 2017 require the Company to include in its U.S. income tax return foreign subsidiary earnings in excess of an allowable return on the foreign subsidiary's tangible assets. The Company has not yet elected an accounting policy related to how it will account for GILTI and therefore has not provided any deferred tax impacts of GILTI in its Consolidated Financial Statements for the fiscal year ended February 2, 2018.
Stock-Based Compensation
— The Company measures stock-based compensation expense for all share-based awards granted based on the estimated fair value of those awards at grant date. For service-based stock options, the Company typically estimates the fair value of these awards using the Black-Scholes valuation model and for performance-based stock options, the Company estimates the fair value of these awards using the Monte Carlo valuation model.
The compensation cost of service-based stock options, restricted stock, and restricted stock units is recognized net of any estimated forfeitures on a straight-line basis over the employee requisite service period. Compensation cost for performance-based options, containing a market condition, is recognized on a graded accelerated basis net of estimated forfeitures over the requisite service period. Forfeiture rates are estimated at grant date based on historical experience and adjusted in subsequent periods for differences in actual forfeitures from those estimates. See
Note 19
of the
Notes to the Consolidated Financial Statements
for further discussion of stock-based compensation.
Recently Issued Accounting Pronouncements
Revenue from Contracts with Customers
—
In May 2014, the Financial Accounting Standards Board (the "FASB") issued amended guidance on the recognition of revenue from contracts with customers. The objective of the new standard is to establish a single comprehensive model for entities to use in accounting for revenue arising from contracts with customers and will supersede substantially all of the existing revenue recognition guidance, including industry-specific guidance. The new standard requires entities to recognize revenue when it transfers promised goods or services to customers in an amount that reflects the consideration to which the entity expects to be entitled in exchange for those goods or services. Further, the new standard requires additional disclosures to help enable users of the financial statements to better understand the nature, amount, timing, risks, and judgments related to revenue recognition and related cash flows from contracts with customers. Concurrently, the FASB issued guidance on the accounting for costs to fulfill or obtain a customer contract. The Company elected to adopt the new standards effective February 3, 2018 using the full retrospective method, which requires the Company to recast each prior period presented consistent with the new guidance.
Adoption of the standard will have a material impact on the Company's Consolidated Financial Statements. The most significant changes are the following:
|
•
|
Software license revenue
. Currently, the Company defers revenue for certain software arrangements due to the absence of vendor specific objective evidence ("VSOE") of fair value for all or a portion of the deliverables. Under the new standard, the Company will no longer be required to establish VSOE of fair value in order to account for elements in an arrangement as separate units of accounting, and will be able to record revenue upon satisfaction of each performance obligation, resulting in more up-front recognition of software license revenue.
|
In addition, the Company currently accounts for third-party software licenses and post-contract customer support ("PCS") as a single unit of account, because it does not have VSOE of fair value for PCS in most cases. Thus, the Company currently presents the entire arrangement for the software license and PCS together in services revenue and cost of services revenue. Under the new standard, the Company will separate the value of the license from the value of the PCS. The license value will be recognized upon delivery and the PCS will be recognized over the related contractual term. For presentation purposes, the license revenue and cost of net revenue will be recorded in products, and the PCS revenue and cost of net revenue will be recorded in services on the Company’s Consolidated Statement of Income (Loss).
96
|
•
|
Variable consideration.
The Company will estimate the transaction price for elements of consideration which are variable, primarily customer rebates. This consideration will then be recognized to the Consolidated Statement of Income (Loss) commensurate with the timing of the performance obligation to which it is related.
|
|
•
|
Extended warranty revenue
. For contracts that include both hardware and extended warranty, the new standard will result in more of the aggregate transaction price being allocated to the hardware and less to extended warranty, because the Company will no longer defer revenue based on the separately stated price of the extended warranty provided under the contract. With more of the transaction price being allocated to the hardware, more revenue under these arrangements will be recognized earlier, upon shipment of the hardware.
|
|
•
|
Costs to obtain a contract
. Within the scope of the new accounting standard, the FASB issued additional accounting guidance for certain costs related to a contract with a customer. In particular, the guidance relates to the incremental costs of obtaining a contract with a customer and costs incurred in fulfilling a contract with a customer. For contracts over one year, the Company will capitalize proportional sales commission costs, including bonuses associated with goal attainment, and will amortize these costs over their expected period of benefit.
|
The expected impacts to the opening Consolidated Statement of Financial Position are summarized as follows:
|
•
|
Accounts receivable, net
. The adoption of the new revenue standard will result in an increase to accounts receivable, net primarily due to the following two factors:
|
First, the return rights provision, which represents an estimate of expected customer returns currently presented as a reduction of accounts receivable, net, will instead be presented outside of accounts receivable, net in two separate balance sheet line items. A liability will be recorded in accrued and other for the estimated value of the sales amounts to be returned to the customer, and an asset will be recorded in other current assets representing the cost of the inventory estimated to be returned.
Second, the standard provides new guidance regarding transfer of control of goods to the customer. Under these new guidelines, the Company has determined that for certain hardware contracts in the United States, transfer of control and recognition of revenue can occur earlier. This will result in an increase in accounts receivable, net and a decrease in the in-transit deferral recorded in other current assets.
|
•
|
Other assets
. The adoption of the standard will result in an increase in other assets due to capitalization of the costs to obtain a contract, as well as the accounts receivable, net of impacts discussed above.
|
|
•
|
Deferred revenue.
The adoption of the standard will result in a decline in deferred revenue due to earlier recognition of revenue for software licenses, and less of aggregate transaction price being allocated to extended warranty. This reduction will be partially offset by an increase resulting from the change in presentation of deferred costs on third-party software offerings, which are routinely sold as an attached component of the Company's hardware offering.
|
The pre-tax impact to the opening Consolidated Statement of Financial Position as of January 29, 2016 is currently estimated to be an approximately
$1 billion
benefit to accumulated deficit. For the fiscal year ended February 3, 2017, the impact to net revenue is currently estimated to be an increase of between
$0.4 billion
and
$0.6 billion
, and the impact to operating income is expected to be an increase of between
$0.7 billion
and
$0.9 billion
. The Company is still assessing the income tax impact of the adoption of the new standard, as well as the impact that the standard will have on the Consolidated Statement of Income (Loss) for the fiscal year ended February 2, 2018. Adoption of the standard will have no impact to cash from or used in operating, financing or investing activities on the Consolidated Statements of Cash Flows.
Recognition and Measurement of Financial Assets and Financial Liabilities
—
In January 2016, the FASB issued amended guidance that addresses certain aspects of recognition, measurement, presentation, and disclosure of financial instruments. The amended guidance requires changes in the fair value of equity investments, other than those accounted for under the equity method, to be recognized through net income, rather than other comprehensive income. Adoption of the standard will be applied through a cumulative one-time adjustment to retained earnings, which is not expected to be material to the Consolidated Financial Statements. For the Company’s equity investments without readily determinable fair values, the Company expects to elect the measurement alternative to record those investments at cost, less impairment, and adjusted by observable price
97
changes on a prospective basis. The impact of the standard on the Consolidated Statements of Income (Loss) will depend on the relative changes in market price of the equity investments. The Company will adopt this standard for the fiscal year beginning February 3, 2018.
Leases
—
In February 2016, the FASB issued amended guidance on the accounting for leasing transactions. The primary objective of this update is to increase transparency and comparability among organizations by requiring lessees to recognize a lease liability for the obligation to make lease payments and a right-of-use asset for the right to use the underlying asset for the lease term. The guidance also makes some changes to lessor accounting and requires additional disclosures about all leasing arrangements. Companies are required to use a modified retrospective approach for leases that exist or are entered into after the beginning of the earliest comparative period in the financial statements. The Company is currently evaluating the impact that the standard will have on the Consolidated Financial Statements. In the area of lessee accounting, the Company anticipates that the most significant change will be recognition of right of use assets and lease liabilities on the Consolidated Statements of Financial Position. In the area of lessor accounting, the Company anticipates that the most significant change will be an increase in originations of operating leases due to elimination of the third-party residual value guarantee insurance in the sales-type lease test. The Company will adopt this standard for the fiscal year beginning February 2, 2019.
Measurement of Credit Losses on Financial Instruments
—
In June 2016, the FASB issued amended guidance which replaces the current incurred loss impairment methodology for measurement of credit losses on financial instruments with a methodology that reflects expected credit losses and requires consideration of a broader range of reasonable and supportable information to inform credit loss estimates. Public entities must adopt the new guidance for fiscal years beginning after December 15, 2019, and interim periods within those fiscal years, with early adoption permitted for fiscal periods beginning after December 15, 2018. The Company is currently evaluating the impact that the standard will have on the Consolidated Financial Statements.
Classification of Certain Cash Receipts and Cash Payments —
In August 2016, the FASB issued amended guidance on the presentation and classification of eight specific cash flow issues with the objective of reducing existing diversity in practice. Companies should reflect any adjustments on a retrospective basis, if practicable; otherwise, adoption is required to be applied as of the earliest date practicable.
The Company will adopt this standard for th
e fiscal year beginning February 3, 2018, and will apply adjustments retrospectively to each prior period presented on the Condensed Consolidated Statements of Cash Flows for that period. The Company is currently evaluating the impact of the standard, which other than requiring certain reclassifications on the Consolidated Statements of Cash Flows is not expected to have a material impact on the Consolidated Financial Statements.
Statement of Cash Flows, Restricted Cash
— In November 2016, the FASB issued amended guidance requiring entities to include restricted cash and restricted cash equivalents in cash balances on the cash flow statement, and also to provide a supplemental reconciliation of cash, cash equivalents and restricted cash. Public entities must adopt the new guidance for fiscal years, and interim periods within those fiscal years, beginning after December 15, 2017, with early adoption perm
itted. The Company will adopt this standard for the fiscal year beginning February 3, 2018, and will apply adjustments retrospectively to each prior period presented on the Condensed C
onsolidated Statements of Cash Flows for that period and provide the supplemental reconciliation. The Company does not expect that the standard will have a material impact on its Consolidated Financial Statements as its restricted cash balance does not change significantly from period to period.
Simplifying the Test for Goodwill Impairment —
In January 2017, the FASB issued amended guidance to simplify the subsequent measurement of goodwill by removing Step 2 of the goodwill impairment test. Instead, under the amendments in the new guidance, an entity should perform its annual, or interim, goodwill impairment test by comparing the fair value of a reporting unit with its carrying amount. An entity should recognize an impairment charge for the amount by which the carrying amount exceeds the reporting unit's fair value. Public entities must adopt the new guidance in fiscal years beginning after December 15, 2019, with early adoption permitted. The Company is currently evaluating the impact of the new guidance, but does not expect that the standard will have an impact on its Consolidated Financial Statements.
Derivatives and Hedging
—
In August 2017, the FASB issued amended guidance that will make more financial and non-financial hedging strategies eligible for hedge accounting. The amended guidance changes how companies assess effectiveness, and also amends the presentation and disclosure requirements. The guidance is intended to simplify the application of hedge accounting and increase transparency as to the scope and results of hedging programs. Immediate early adoption is permitted in any interim or annual period. The Company will early adopt this standard for the fiscal year beginning
98
February 3, 2018. The Company does not expect the adoption of this standard to have a material impact on the Consolidated Financial Statements.
Income Statement - Reporting Comprehensive Income
—
In February 2018, the
FASB issued guidance that will permit entities to reclassify to retained earnings tax effects stranded in accumulated other comprehensive income as a result of U.S. Tax Reform, discussed in
Note 14
to the
Notes to the Consolidated Financial Statements
. The guidance gives entities the option to reclassify these amounts, but requires new disclosures regardless of whether they elect to do so. The guidance is effective for fiscal years beginning after December 15, 2018, and interim periods within those fiscal years. Early adoption is permitted. Companies may apply the standard retrospectively or as a cumulative adjustment in the period of adoption. The Company does not expect the adoption of this standard to have a material impact that the standard will have on the Consolidated Financial Statements.
Recently Adopted Accounting Pronouncements
Improvements to Employee Share-Based Payment Accounting —
In March 2016, the FASB issued amended guidance on the accounting for employee share-based payments, including the accounting for income taxes and forfeitures, classification of awards as either equity or liabilities, and classification of cash flows. The Company adopted this guidance at the beginning of Fiscal 2018. In accordance with the new guidance, excess tax benefits or deficiencies for stock-based compensation are now reflected as a component of the provision for income taxes on the Consolidated Statements of Income (Loss), whereas they were previously recorded as additional paid-in capital. The Company has elected to continue to estimate expected forfeitures. Additionally, the Company now presents excess tax benefits as an operating activity rather than a financing activity on the Consolidated Statements of Cash Flows, while the cash flows related to employee taxes paid for withheld shares are presented as a financing activity, with prior periods adjusted accordingly. The adoption of the amended guidance did not have a material impact on the Consolidated Financial Statements. The prospective impact of the new standard will depend on the Company's stock price at the vesting or exercise dates of the awards and the number of awards that vest or are exercised in each period, but the Company does not expect the impact to be material in future periods.
Intra-Entity Transfers of Assets Other Than Inventory —
In October 2016, the FASB issued amended guidance on the accounting for income taxes. The new guidance requires companies to recognize the income tax effects of intra-entity asset transfers, other than transfers of inventory, when the transfer occurs instead of when the asset is sold to a third party. The new guidance should be applied on a modified-retrospective basis with the cumulative-effect adjustment to retained earnings as of the beginning of the period of adoption. The Company early adopted this guidance at the beginning of Fiscal 2018. At adoption, approximately
$84 million
was reclassified from other non-current liabilities to retained earnings, resulting in a net credit to retained earnings.
99
NOTE 3
—
BUSINESS COMBINATIONS
Fiscal 2018
VMware, Inc. Acquisitions
VeloCloud Networks, Inc.
— During the fourth quarter of the fiscal year ended February 2, 2018, VMware, Inc. completed the acquisition of VeloCloud Networks, Inc. (“VeloCloud”), a provider of cloud-delivered software-defined wide-area network (SD-WAN) technology for enterprises and service providers. VMware, Inc. acquired VeloCloud to build on its network virtualization platform, VMware NSX, and to expand its networking portfolio. The total purchase price was
$499 million
, net of cash acquired of
$24 million
. The purchase price primarily included
$142 million
of identifiable intangible assets and
$326 million
of goodwill that is not expected to be deductible for tax purposes. The identifiable intangible assets primarily include completed technology of
$87 million
and customer contracts of
$44 million
, with estimated useful lives of
six
to
seven
years. The fair value of assumed unvested equity attributed to post-combination services was
$30 million
and will be expensed over the remaining requisite service periods on a straight-line basis. The estimated fair value of the stock options assumed by the Company was determined using the Black-Scholes option pricing model.
The preliminary allocation of the purchase price was based on a preliminary valuation and assumptions, and is subject to change within the measurement period. VMware, Inc. expects to finalize the allocation of the purchase price as soon as practicable and not later than one year from the acquisition date.
Prior to the closing of the acquisition, Dell Technologies, including VMware Inc., held an ownership interest in VeloCloud. Upon completion of the step acquisition, Dell Technologies recognized a gain of
$8 million
in interest and other, net for the remeasurement of its previously held ownership interest to fair value, which was
$12 million
.
The Company has not presented pro forma results of operations for the VeloCloud acquisition because it is not material to the Company's consolidated results of operations, financial position, or cash flows.
Other Business Combinations
— During the second quarter of the fiscal year ended February 2, 2018, VMware, Inc. completed the acquisitions of Wavefront and Apteligent, Inc., which were not material to the Consolidated Financial Statements. These acquisitions are a part of VMware, Inc.’s strategy to accelerate the development of VMware, Inc.'s Cloud services and other technologies. The aggregate purchase price for the
two
acquisitions was
$323 million
, inclusive of the fair value of the Company's existing investment in Wavefront of
$69 million
and cash acquired of
$35 million
. The aggregate purchase price included
$36 million
of identifiable intangible assets and
$238 million
of goodwill that is not expected to be deductible for tax purposes. The identifiable intangible assets primarily relate to purchased technology, with estimated useful lives of
five years
. The fair value of assumed unvested equity attributable to post-combination services was
$37 million
and will be expensed over the remaining requisite service periods on a straight-line basis. The estimated fair value of the stock options assumed by the Company was determined using the Black-Scholes option pricing model.
The preliminary allocation of the purchase price was based on a preliminary valuation and assumptions, and is subject to change within the measurement period. VMware, Inc. expects to finalize the allocation of the purchase price as soon as practicable and not later than one year from the acquisition date.
Prior to the closing of the acquisition, Dell Technologies, including VMware, Inc., held an ownership interest in Wavefront. Upon completion of the step acquisition, Dell Technologies recognized a
$45 million
gain in interest and other, net for the remeasurement of its previously held ownership interest to fair value.
The Company has not presented pro forma results of operations for the foregoing acquisitions because they are not material to the Company's consolidated results of operations, financial position, or cash flows.
Fiscal 2017
EMC Merger Transaction
On September 7, 2016, EMC became a wholly-owned subsidiary of the Company as a result of the merger of Merger Sub with and into EMC. Pursuant to the terms of the merger agreement, upon the completion of the EMC merger transaction, each
100
issued and outstanding share of common stock, par value
$0.01
per share, of EMC (approximately
2.0 billion
shares as of September 7, 2016) was converted into the right to receive (1)
$24.05
in cash, without interest, and (2)
0.11146
validly issued, fully paid, and non-assessable shares of common stock of the Company designated as Class V Common Stock, par value
$0.01
per share (the "Class V Common Stock"), plus cash in lieu of any fractional shares. Shares of the Class V Common Stock were approved for listing on the New York Stock Exchange (the "NYSE") under the ticker symbol "DVMT" and began trading on September 7, 2016.
In connection with the EMC merger transaction, the Company authorized
343 million
shares of Class V Common Stock. On September 7, 2016, Dell Technologies issued
223 million
shares of Class V Common Stock to EMC shareholders at a purchase price of
$45.07
per share for an aggregate purchase price of approximately
$10 billion
. The total fair value of consideration transferred to effect the EMC merger transaction was approximately
$64 billion
, which primarily consisted of cash and such shares of Class V Common Stock, as well as the fair value of non-controlling interests in VMware, Inc. and Pivotal, majority-owned consolidated subsidiaries of EMC. See
Note 18
of the
Notes to the Consolidated Financial Statements
for additional information on the Class V Common Stock.
Fair Value of Consideration Transferred
— The following table summarizes the consideration transferred to effect the EMC merger transaction:
|
Purchase Price
|
|||
|
(in millions)
|
|||
|
Consideration transferred:
|
|||
|
Cash
|
$
|
47,694
|
|
|
Expense and other (a)
|
968
|
|
|
|
Class V Common Stock (b)
|
10,041
|
|
|
|
Total consideration transferred
|
58,703
|
|
|
|
Non-controlling interests (c)
|
6,048
|
|
|
|
Less: Post-merger stock compensation expense (d)
|
(800
|
)
|
|
|
Total purchase price to allocate
|
$
|
63,951
|
|
____________________
(a)
Expense and other primarily consists of cash payment for post-merger stock compensation expense, as described in footnote (d), and the value related to pre-merger services of EMC equity awards converted to deferred cash awards.
|
(b)
|
The fair value of the Class V Common Stock is based on the issuance of approximately
223 million
shares with a per-share fair value of
$45.07
(the opening share price of the Class V Common Stock on the NYSE on September 7, 2016, the first day of trading), which shares were intended to track the economic performance of approximately
65%
of the Company's economic interest in the VMware business, as of the closing date of the EMC merger transaction.
|
|
(c)
|
Non-controlling interests in VMware, Inc. and Pivotal was
$6.0 billion
as of September 7, 2016. The fair value of the non-controlling interest related to VMware, Inc. was calculated by multiplying outstanding shares of VMware, Inc. common stock that were not owned by EMC by
$73.28
(the opening share price of VMware, Inc. Class A common stock on the NYSE on September 7, 2016). The fair value of the non-controlling interest relating to Pivotal was calculated based on the fair value of Pivotal, the ownership percentage of the non-controlling interests, and a discount for lack of control related to the non-controlling interest.
|
|
(d)
|
Pursuant to the guidelines of ASC 805, a portion of the consideration related to accelerated EMC equity awards was recorded as post-merger day one stock compensation expense. This expense is attributable to post-merger services not rendered due to the acceleration.
|
101
Assets Acquired and Liabilities Assumed
— The EMC merger transaction has been accounted for as a business combination under the acquisition method of accounting. The cumulative impact of any subsequent changes resulting from the facts and circumstances that existed as of the transaction date will be adjusted in the reporting period in which the adjustment amount is determined. The following table summarizes, as of
February 2, 2018
, the purchase price allocation to the assets acquired and the liabilities assumed in the EMC merger transaction (in millions):
|
Current assets:
|
|||
|
Cash and cash equivalents
|
$
|
10,080
|
|
|
Short-term investments
|
1,765
|
|
|
|
Accounts receivable
|
2,810
|
|
|
|
Short-term financing receivables
|
64
|
|
|
|
Inventories, net
|
1,993
|
|
|
|
Other current assets
|
903
|
|
|
|
Total current assets
|
17,615
|
|
|
|
Property, plant, and equipment
|
4,490
|
|
|
|
Long-term investments
|
4,317
|
|
|
|
Long-term financing receivables, net
|
65
|
|
|
|
Goodwill
|
31,539
|
|
|
|
Purchased intangibles
|
31,218
|
|
|
|
Other non-current assets
|
445
|
|
|
|
Total assets
|
$
|
89,689
|
|
|
Current liabilities:
|
|||
|
Short-term debt
|
$
|
905
|
|
|
Accounts payable
|
728
|
|
|
|
Accrued and other
|
3,259
|
|
|
|
Short-term deferred revenue
|
4,954
|
|
|
|
Total current liabilities
|
9,846
|
|
|
|
Long-term debt
|
5,474
|
|
|
|
Long-term deferred revenue
|
3,469
|
|
|
|
Deferred tax liabilities
|
6,625
|
|
|
|
Other non-current liabilities
|
324
|
|
|
|
Total liabilities
|
25,738
|
|
|
|
Total net assets
|
$
|
63,951
|
|
The table above includes amounts allocated to ECD, which was divested in the fiscal year ended
February 3, 2017
. See
Note 4
of the
Notes to the Consolidated Financial Statements
for more information on discontinued operations.
102
Pro Forma Financial Information
— The following table provides unaudited pro forma results of operations for the periods presented as if the transaction date had occurred on January 31, 2015, the first day of the fiscal year ended January 29, 2016.
|
Fiscal Year Ended
|
|||||||
|
February 3, 2017
|
January 29, 2016
|
||||||
|
(in millions)
|
|||||||
|
Total net revenue
|
$
|
74,225
|
|
$
|
73,138
|
|
|
|
Net loss attributable to Dell Technologies Inc.
|
$
|
(3,200
|
)
|
$
|
(6,013
|
)
|
|
The pro forma information for the
fiscal year ended February 3, 2017
combines the Company's historical results for the
fiscal year ended February 3, 2017
and EMC's historical results for the period from February 1, 2016 to September 6, 2016. The pro forma information for the fiscal year ended January 29, 2016 combines the Company's historical results for the fiscal year ended January 29, 2016 with EMC's historical results for the fiscal year ended December 31, 2015. The historical results have been adjusted in the pro forma information to give effect to items that are (a) directly attributable to the EMC merger transaction, (b) factually supportable, and (c) expected to have a continuing impact on the combined company's results. The unaudited pro forma results include the recognition of non-recurring purchase accounting adjustments related to the step-up of inventory of
$0.7 billion
as well as the recognition of non-recurring transaction and integration costs, including accelerated stock-based compensation expense, of
$1.5 billion
in the fiscal year ended January 29, 2016.
The pro forma information does not purport to represent what the combined company's results of operations or financial condition would have been had the EMC merger transaction actually occurred on the date indicated, and does not purport to project the combined company's results of operations for any future period or as of any future date.
103
NOTE 4
—
DISCONTINUED OPERATIONS
During the fiscal year ended
February 3, 2017
, Dell Inc. entered into a definitive agreement with NTT Data International L.L.C. to divest substantially all of Dell Services, and on November 2, 2016, the parties closed substantially all of the transaction. During the fiscal year ended
February 3, 2017
, Dell Inc. entered into a definitive agreement with Francisco Partners and Elliot Management Corporation to divest substantially all of DSG, and on October 31, 2016, the parties closed the transaction. During the fiscal year ended
February 3, 2017
, EMC, a subsidiary of the Company, entered into a definitive agreement with OpenText Corporation to divest the Dell EMC Enterprise Content Division, and on January 23, 2017, the parties closed the transaction. Upon closing of the respective transactions, the Company entered into transition services agreements with NTT Data International L.L.C., Francisco Partners and Elliot Management, and OpenText Corporation pursuant to which the Company provides various administrative services on an interim transitional basis. Transition services may be provided for up to
one year
, with an option to renew after that period. The Company also entered into various commercial agreements with NTT Data International L.L.C., Francisco Partners and Elliot Management, and OpenText Corporation that include reseller agreements for certain offerings.
In accordance with applicable accounting guidance, the Company reclassified the financial results of Dell Services, DSG, and ECD as discontinued operations in the
Consolidated Statements of Income (Loss)
for the relevant periods. The following tables present key financial results of Dell Services, DSG, and ECD included in "Income from discontinued operations, net of income taxes" for the fiscal years ended
February 3, 2017
and
January 29, 2016
:
|
Fiscal Year Ended February 3, 2017
|
|||||||||||||||
|
ECD (a)
|
Dell Services
|
DSG
|
Total
|
||||||||||||
|
(in millions)
|
|||||||||||||||
|
Net revenue
|
$
|
209
|
|
$
|
1,980
|
|
$
|
975
|
|
$
|
3,164
|
|
|||
|
Cost of net revenue
|
56
|
|
1,563
|
|
252
|
|
1,871
|
|
|||||||
|
Operating expenses
|
137
|
|
347
|
|
726
|
|
1,210
|
|
|||||||
|
Interest and other, net
|
(1
|
)
|
(8
|
)
|
(2
|
)
|
(11
|
)
|
|||||||
|
Income (loss) from discontinued operations before income taxes and gain (loss) on disposal
|
15
|
|
62
|
|
(5
|
)
|
72
|
|
|||||||
|
Income tax provision (benefit)
|
3
|
|
(40
|
)
|
(23
|
)
|
(60
|
)
|
|||||||
|
Income from discontinued operations, net of income taxes, before gain (loss) on disposal
|
12
|
|
102
|
|
18
|
|
132
|
|
|||||||
|
Gain (loss) on disposal, net of tax expense (benefit) of $182, $(256), and $506, respectively
|
(356
|
)
|
1,680
|
|
563
|
|
1,887
|
|
|||||||
|
Income (loss) from discontinued operations, net of income taxes
|
$
|
(344
|
)
|
$
|
1,782
|
|
$
|
581
|
|
$
|
2,019
|
|
|||
____________________
|
(a)
|
The Company classified the results of ECD as discontinued operations for the period from
September 7, 2016 through February 3, 2017
because the ECD business was only included in the Company's consolidated results since the closing of the EMC merger transaction on September 7, 2016.
|
104
|
Fiscal Year Ended January 29, 2016
|
|||||||||||
|
Dell Services
|
DSG
|
Total
|
|||||||||
|
(in millions)
|
|||||||||||
|
Net revenue
|
$
|
2,686
|
|
$
|
1,289
|
|
$
|
3,975
|
|
||
|
Cost of net revenue
|
2,157
|
|
373
|
|
2,530
|
|
|||||
|
Operating expenses
|
399
|
|
915
|
|
1,314
|
|
|||||
|
Interest and other, net
|
—
|
|
(20
|
)
|
(20
|
)
|
|||||
|
Loss from discontinued operations before income taxes
|
130
|
|
(19
|
)
|
111
|
|
|||||
|
Income tax benefit
|
42
|
|
5
|
|
47
|
|
|||||
|
Loss from discontinued operations, net of income taxes
|
$
|
88
|
|
$
|
(24
|
)
|
$
|
64
|
|
||
Cash flows from the Company's discontinued operations are included in the accompanying Consolidated Statements of Cash Flows.
The significant cash flow items from Dell Services and DSG for the fiscal years ended
February 3, 2017
and
January 29, 2016
were as follows:
|
Fiscal Year Ended
|
|||||||
|
February 3, 2017
|
January 29, 2016
|
||||||
|
Depreciation and amortization (a)
|
$
|
32
|
|
$
|
211
|
|
|
|
Capital expenditures
|
$
|
82
|
|
$
|
91
|
|
|
____________________
|
(a)
|
Depreciation and amortization ceased upon determination that Dell Services and DSG had met the criteria for discontinued operations reporting as of March 27, 2016 and June 19, 2016, respectively. Depreciation and amortization for ECD ceased upon determination that the held for sale criteria were met as of September 7, 2016, concurrently with the closing of the EMC merger transaction.
|
Depreciation and amortization for ECD ceased upon determination that the held-for-sale criteria were met. Capital expenditures for ECD were immaterial for the period from September 7, 2016 through October 28, 2016.
105
NOTE 5
—
FAIR VALUE MEASUREMENTS
The following table presents the Company's hierarchy for its assets and liabilities measured at fair value on a recurring basis as of
February 2, 2018
and
February 3, 2017
:
|
|
February 2, 2018 (a)
|
February 3, 2017
|
|||||||||||||||||||||||||||||
|
|
Level 1
|
Level 2
|
Level 3
|
Total
|
Level 1
|
Level 2
|
Level 3
|
Total
|
|||||||||||||||||||||||
|
|
Quoted
Prices in Active Markets for Identical Assets |
Significant
Other Observable Inputs |
Significant
Unobservable Inputs |
|
Quoted
Prices in Active Markets for Identical Assets |
Significant
Other Observable Inputs |
Significant
Unobservable Inputs |
|
|||||||||||||||||||||||
|
|
(in millions)
|
||||||||||||||||||||||||||||||
|
Assets:
|
|
|
|
|
|
|
|
|
|
|
|
|
|
|
|
|
|||||||||||||||
|
Cash and cash equivalents:
|
|||||||||||||||||||||||||||||||
|
Money market funds
|
$
|
8,641
|
|
$
|
—
|
|
$
|
—
|
|
$
|
8,641
|
|
$
|
4,866
|
|
$
|
—
|
|
$
|
—
|
|
$
|
4,866
|
|
|||||||
|
Municipal obligations
|
—
|
|
—
|
|
—
|
|
—
|
|
—
|
|
3
|
|
—
|
|
3
|
|
|||||||||||||||
|
U.S. corporate debt securities
|
—
|
|
23
|
|
—
|
|
23
|
|
—
|
|
—
|
|
—
|
|
—
|
|
|||||||||||||||
|
Foreign corporate debt securities
|
—
|
|
65
|
|
—
|
|
65
|
|
—
|
|
—
|
|
—
|
|
—
|
|
|||||||||||||||
|
Debt securities:
|
|||||||||||||||||||||||||||||||
|
U.S. government and agencies
|
682
|
|
392
|
|
—
|
|
1,074
|
|
444
|
|
470
|
|
—
|
|
914
|
|
|||||||||||||||
|
U.S. corporate
|
—
|
|
2,003
|
|
—
|
|
2,003
|
|
—
|
|
1,800
|
|
—
|
|
1,800
|
|
|||||||||||||||
|
Foreign
|
—
|
|
2,547
|
|
—
|
|
2,547
|
|
—
|
|
2,083
|
|
—
|
|
2,083
|
|
|||||||||||||||
|
Municipal obligations
|
—
|
|
—
|
|
—
|
|
—
|
|
—
|
|
352
|
|
—
|
|
352
|
|
|||||||||||||||
|
Asset-backed securities
|
—
|
|
—
|
|
—
|
|
—
|
|
—
|
|
4
|
|
—
|
|
4
|
|
|||||||||||||||
|
Equity and other securities
|
236
|
|
5
|
|
—
|
|
241
|
|
169
|
|
—
|
|
—
|
|
169
|
|
|||||||||||||||
|
Derivative instruments
|
—
|
|
83
|
|
—
|
|
83
|
|
—
|
|
205
|
|
—
|
|
205
|
|
|||||||||||||||
|
Total assets
|
$
|
9,559
|
|
$
|
5,118
|
|
$
|
—
|
|
$
|
14,677
|
|
$
|
5,479
|
|
$
|
4,917
|
|
$
|
—
|
|
$
|
10,396
|
|
|||||||
|
Liabilities:
|
|
|
|
|
|
|
|
|
|
|
|
|
|
|
|
|
|||||||||||||||
|
Derivative instruments
|
$
|
—
|
|
$
|
184
|
|
$
|
—
|
|
$
|
184
|
|
$
|
—
|
|
$
|
64
|
|
$
|
—
|
|
$
|
64
|
|
|||||||
|
Total liabilities
|
$
|
—
|
|
$
|
184
|
|
$
|
—
|
|
$
|
184
|
|
$
|
—
|
|
$
|
64
|
|
$
|
—
|
|
$
|
64
|
|
|||||||
____________________
(a) The Company did not transfer any securities between levels during the
fiscal year ended February 2, 2018
.
The following section describes the valuation methodologies the Company uses to measure financial instruments at fair value:
Money Market Funds
— The Company's investment in money market funds that are classified as cash equivalents hold underlying investments with a weighted average maturity of
90
days
or less and are recognized at fair value. The valuations of these securities are based on quoted prices in active markets for identical assets, when available, or pricing models whereby all significant inputs are observable or can be derived from or corroborated by observable market data. The Company reviews security pricing and assesses liquidity on a quarterly bas
is. As of
February 2, 2018
, the Company's U.S. portfolio had no material exposure to money market funds with a fluctuating net asset value.
Equity and Other Securities
— The majority of the Company's investments in equity and other securities that are measured at fair value on a recurring basis consist of strategic investments in publicly traded companies.
The valuation of these securities is based on quoted prices in active markets.
Debt Securities
— The majority of the Company's debt securities consists of various fixed income securities such as U.S. government and agencies, U.S. corporate, and foreign. Valuation is based on pricing models whereby all significant inputs, including benchmark yields, reported trades, broker-dealer quotes, issue spreads, benchmark securities, bids, offers, and other
106
market related data, are observable or can be derived from or corroborated by observable market data for substantially the full term of the asset. Inputs are documented in accordance with the fair value measurements hierarchy. The Company reviews security pricing and assesses liquidity on a quarterly basis. See
Note 6
of the
Notes to the Consolidated Financial Statements
for additional information about investments.
Derivative Instruments
— The Company's derivative financial instruments consist primarily of foreign currency forward and purchased option contracts and interest rate swaps. The fair value of the portfolio is determined using valuation models based on market observable inputs, including interest rate curves, forward and spot prices for currencies, and implied volatilities. Credit risk is also factored into the fair value calculation of the Company's derivative instrument portfolio. See
Note 9
of the
Notes to the Consolidated Financial Statements
for a description of the Company's derivative financial instrument activities.
Assets and Liabilities Measured at Fair Value on a Nonrecurring Basis
— Certain assets are measured at fair value on a nonrecurring basis and therefore are not included in the recurring fair value table above. These assets consist primarily of non-financial assets such as goodwill and intangible assets. See
Note 10
of the
Notes to the Consolidated Financial Statements
for additional information about goodwill and intangible assets.
As of
February 2, 2018
and
February 3, 2017
, the Company held strategic investments of
$485 million
and
$455 million
, respectively. These investments are accounted for under the cost method and are not included in the recurring fair value table above. Investments accounted for under the cost method are recorded at cost initially, which approximates fair value. Subsequently, if there is an indicator of impairment, the impairment is recognized. In evaluating these investments for impairment, the Company uses inputs including pre- and post-money valuations of recent financing events and the impact of those on its fully diluted ownership percentages, as well as other available information regarding the issuer's historical and forecasted performance. As these investments are early-stage companies which are not publicly traded, it is not practicable for the Company to reliably estimate the fair value of these investments.
Carrying Value and Estimated Fair Value of Outstanding Debt
— The following table summarizes the carrying value and estimated fair value of the Company's outstanding debt as described in
Note 8
of the
Notes to the Consolidated Financial Statements
, including the current portion, as of the dates indicated:
|
February 2, 2018
|
February 3, 2017
|
||||||||||||||
|
Carrying Value
|
Fair Value
|
Carrying Value
|
Fair Value
|
||||||||||||
|
(in billions)
|
|||||||||||||||
|
Senior Secured Credit Facilities
|
$
|
10.4
|
|
$
|
10.6
|
|
$
|
11.4
|
|
$
|
11.7
|
|
|||
|
First Lien Notes
|
$
|
19.7
|
|
$
|
21.9
|
|
$
|
19.7
|
|
$
|
21.8
|
|
|||
|
Unsecured Notes and Debentures
|
$
|
2.3
|
|
$
|
2.5
|
|
$
|
2.3
|
|
$
|
2.5
|
|
|||
|
Senior Notes
|
$
|
3.1
|
|
$
|
3.4
|
|
$
|
3.1
|
|
$
|
3.5
|
|
|||
|
EMC Notes
|
$
|
5.5
|
|
$
|
5.4
|
|
$
|
5.5
|
|
$
|
5.4
|
|
|||
|
VMware Notes
|
$
|
4.0
|
|
$
|
3.9
|
|
$
|
—
|
|
$
|
—
|
|
|||
|
Margin Bridge Facility
|
$
|
—
|
|
$
|
—
|
|
$
|
2.5
|
|
$
|
2.5
|
|
|||
|
Margin Loan Facility
|
$
|
2.0
|
|
$
|
2.0
|
|
$
|
—
|
|
$
|
—
|
|
|||
|
VMware Note Bridge Facility
|
$
|
—
|
|
$
|
—
|
|
$
|
1.5
|
|
$
|
1.5
|
|
|||
The fair values of the outstanding debt shown in the table above, as well as the DFS debt, were determined based on observable market prices in a less active market or based on valuation methodologies using observable inputs and were categorized as Level 2 in the fair value hierarchy. The fair value of DFS debt approximates carrying value.
107
NOTE 6
—
INVESTMENTS
The following table summarizes, by major security type, the carrying value and amortized cost of the Company's investments. All debt security investments with remaining effective maturities in excess of one year and substantially all equity and other securities are recorded as long-term investments in the Consolidated Statements of Financial Position.
|
February 2, 2018
|
February 3, 2017
|
||||||||||||||||||||||||||||||
|
Cost
|
Unrealized Gain
|
Unrealized (Loss)
|
Carrying Value
|
Cost
|
Unrealized Gain
|
Unrealized (Loss)
|
Carrying Value
|
||||||||||||||||||||||||
|
(in millions)
|
|||||||||||||||||||||||||||||||
|
Investments:
|
|||||||||||||||||||||||||||||||
|
U.S. government and agencies
|
$
|
485
|
|
$
|
—
|
|
$
|
(2
|
)
|
$
|
483
|
|
$
|
231
|
|
$
|
—
|
|
$
|
—
|
|
$
|
231
|
|
|||||||
|
U.S. corporate debt securities
|
660
|
|
—
|
|
(2
|
)
|
658
|
|
651
|
|
—
|
|
(1
|
)
|
650
|
|
|||||||||||||||
|
Foreign debt securities
|
1,048
|
|
—
|
|
(2
|
)
|
1,046
|
|
743
|
|
—
|
|
(1
|
)
|
742
|
|
|||||||||||||||
|
Municipal obligations
|
—
|
|
—
|
|
—
|
|
—
|
|
348
|
|
—
|
|
—
|
|
348
|
|
|||||||||||||||
|
Asset-backed securities
|
—
|
|
—
|
|
—
|
|
—
|
|
4
|
|
—
|
|
—
|
|
4
|
|
|||||||||||||||
|
Total short-term investments
|
2,193
|
|
—
|
|
(6
|
)
|
2,187
|
|
1,977
|
|
—
|
|
(2
|
)
|
1,975
|
|
|||||||||||||||
|
U.S. government and agencies
|
600
|
|
—
|
|
(9
|
)
|
591
|
|
689
|
|
—
|
|
(6
|
)
|
683
|
|
|||||||||||||||
|
U.S. corporate debt securities
|
1,361
|
|
—
|
|
(16
|
)
|
1,345
|
|
1,164
|
|
—
|
|
(14
|
)
|
1,150
|
|
|||||||||||||||
|
Foreign debt securities
|
1,518
|
|
—
|
|
(17
|
)
|
1,501
|
|
1,356
|
|
—
|
|
(15
|
)
|
1,341
|
|
|||||||||||||||
|
Municipal obligations
|
—
|
|
—
|
|
—
|
|
—
|
|
4
|
|
—
|
|
—
|
|
4
|
|
|||||||||||||||
|
Equity and other securities (a)
|
640
|
|
86
|
|
—
|
|
726
|
|
604
|
|
22
|
|
(2
|
)
|
624
|
|
|||||||||||||||
|
Total long-term investments
|
4,119
|
|
86
|
|
(42
|
)
|
4,163
|
|
3,817
|
|
22
|
|
(37
|
)
|
3,802
|
|
|||||||||||||||
|
Total investments
|
$
|
6,312
|
|
$
|
86
|
|
$
|
(48
|
)
|
$
|
6,350
|
|
$
|
5,794
|
|
$
|
22
|
|
$
|
(39
|
)
|
$
|
5,777
|
|
|||||||
____________________
|
(a)
|
The majority of equity and other securities are strategic investments accounted for under the cost method, while the remainder are investments that are measured at fair value on a recurring basis. See
Note 5
of the
Notes to the Consolidated Financial Statements
for additional information on investments measured at fair value on a recurring basis.
|
The Company's investments in debt securities are classified as available-for-sale securities, which are carried at fair value.
As of
February 2, 2018
, the aggregate fair value of investments held in a continuous unrealized loss position for greater than 12 months was
$1.9 billion
, and the unrealized loss of these investments was
$25 million
. As of
February 3, 2017
, all investments in an unrealized loss position were in a continuous unrealized loss position for less than 12 months.
The maturities of debt securities held at
February 2, 2018
are as follows:
|
Amortized Cost
|
Carrying Value
|
||||||
|
(in millions)
|
|||||||
|
Due within one year
|
$
|
2,193
|
|
$
|
2,187
|
|
|
|
Due after 1 year through 5 years
|
3,419
|
|
3,378
|
|
|||
|
Due after 5 years through 10 years
|
60
|
|
59
|
|
|||
|
Total
|
$
|
5,672
|
|
$
|
5,624
|
|
|
108
NOTE 7
—
FINANCIAL SERVICES
The Company offers or arranges various financing options and services for its customers in North America, Europe, Australia, and New Zealand through Dell Financial Services and its affiliates ("DFS"). The key activities of DFS include originating, collecting, and servicing customer receivables primarily related to the purchase of Dell Technologies products and services. In some cases, DFS also offers financing on the purchase of third-party technology products that complement the Dell Technologies portfolio of products and services. New financing originations were
$6.3 billion
,
$4.5 billion
, and
$3.7 billion
for the fiscal years ended
February 2, 2018
,
February 3, 2017
, and
January 29, 2016
, respectively. The increases in new financing originations and financing receivables during the
fiscal year ended February 2, 2018
were attributable to growth in the DFS offerings related to customer purchases of products and services from the EMC acquired businesses.
In June 2017, as part of the global expansion of Dell Technologies' captive financing model, the Company purchased a portfolio of customer fixed-term financing receivables totaling approximately
$89 million
from Bank of Queensland. Bank of Queensland was previously the Company's preferred financing partner in Australia and New Zealand.
Financing Receivables
The Company's financing receivables are aggregated into the following categories:
|
•
|
Revolving loans
— Revolving loans offered under private label credit financing programs provide qualified customers with a revolving credit line for the purchase of products and services offered by Dell Technologies. These private label credit financing programs are referred to as Dell Preferred Account ("DPA") and Dell Business Credit ("DBC"). The DPA product is primarily offered to individual consumer customers, and the DBC product is primarily offered to small and medium-sized commercial customers. Revolving loans in the United States bear interest at a variable annual percentage rate that is tied to the prime rate. Based on historical payment patterns,
revolving loan transactions are typically repaid within
twelve months
on average.
|
|
•
|
Fixed-term sales-type leases and loans
— The Company enters into sales-type lease arrangements with customers who seek lease financing. Leases with business customers have fixed terms of generally
two
to
four years
. Future maturities of minimum lease and associated financing payments as of
February 2, 2018
were as follo
ws:
Fiscal 2019
-
$2,210 million
;
Fiscal 2020
-
$1,449 million
;
Fiscal 2021
-
$717 million
;
Fiscal 2022
-
$198 million
;
Fiscal 2023 and beyond
-
$48 million
. Future maturities and associated financing payments referenced herein represent the aggregate payments under the customer lease contract. The Company also offers fixed-term loans to qualified small businesses, large commercial accounts, governmental organizations, educational entities, and certain individual consumer customers.
These loans are repaid in equal payments including interest and have defined terms of generally
three
to
five years
.
|
The following table summarizes the components of the Company's financing receivables segregated by portfolio segment as of
February 2, 2018
and
February 3, 2017
:
|
|
February 2, 2018
|
February 3, 2017
|
|||||||||||||||||||||
|
Revolving
|
Fixed-term
|
Total
|
Revolving
|
Fixed-term
|
Total
|
||||||||||||||||||
|
|
(in millions)
|
||||||||||||||||||||||
|
Financing receivables, net:
|
|
|
|
|
|||||||||||||||||||
|
Customer receivables, gross
|
$
|
900
|
|
$
|
6,282
|
|
$
|
7,182
|
|
$
|
1,009
|
|
$
|
4,530
|
|
$
|
5,539
|
|
|||||
|
Allowances for losses
|
(81
|
)
|
(64
|
)
|
(145
|
)
|
(91
|
)
|
(52
|
)
|
(143
|
)
|
|||||||||||
|
Customer receivables, net
|
819
|
|
6,218
|
|
7,037
|
|
918
|
|
4,478
|
|
5,396
|
|
|||||||||||
|
Residual interest
|
—
|
|
606
|
|
606
|
|
—
|
|
477
|
|
477
|
|
|||||||||||
|
Financing receivables, net
|
$
|
819
|
|
$
|
6,824
|
|
$
|
7,643
|
|
$
|
918
|
|
$
|
4,955
|
|
$
|
5,873
|
|
|||||
|
Short-term
|
$
|
819
|
|
$
|
3,100
|
|
$
|
3,919
|
|
$
|
918
|
|
$
|
2,304
|
|
$
|
3,222
|
|
|||||
|
Long-term
|
$
|
—
|
|
$
|
3,724
|
|
$
|
3,724
|
|
$
|
—
|
|
$
|
2,651
|
|
$
|
2,651
|
|
|||||
109
The following tables summarize the changes in the allowance for financing receivable losses for the respective periods:
|
Fiscal Year Ended
|
|||||||||||
|
|
Revolving
|
Fixed-term
|
Total
|
||||||||
|
|
(in millions)
|
||||||||||
|
Allowance for financing receivable losses:
|
|||||||||||
|
Balances as of January 30, 2015
|
$
|
145
|
|
$
|
49
|
|
$
|
194
|
|
||
|
Charge-offs, net of recoveries
|
(105
|
)
|
(17
|
)
|
(122
|
)
|
|||||
|
Provision charged to income statement
|
78
|
|
26
|
|
104
|
|
|||||
|
Balances as of January 29, 2016
|
118
|
|
58
|
|
176
|
|
|||||
|
Charge-offs, net of recoveries
|
(91
|
)
|
(17
|
)
|
(108
|
)
|
|||||
|
Provision charged to income statement
|
64
|
|
11
|
|
75
|
|
|||||
|
Balances as of February 3, 2017
|
91
|
|
52
|
|
143
|
|
|||||
|
Charge-offs, net of recoveries
|
(84
|
)
|
(17
|
)
|
(101
|
)
|
|||||
|
Provision charged to income statement
|
74
|
|
29
|
|
103
|
|
|||||
|
Balances as of February 2, 2018
|
$
|
81
|
|
$
|
64
|
|
$
|
145
|
|
||
The following table summarizes the aging of the Company's customer financing receivables, gross, including accrued interest, as of
February 2, 2018
and
February 3, 2017
, segregated by class:
|
February 2, 2018
|
February 3, 2017
|
||||||||||||||||||||||||||||||
|
Current
|
Past Due 1 — 90 Days
|
Past Due > 90 Days
|
Total
|
Current
|
Past Due 1 — 90 Days
|
Past Due > 90 Days
|
Total
|
||||||||||||||||||||||||
|
(in millions)
|
|||||||||||||||||||||||||||||||
|
Revolving — DPA
|
$
|
633
|
|
$
|
59
|
|
$
|
23
|
|
$
|
715
|
|
$
|
715
|
|
$
|
66
|
|
$
|
27
|
|
$
|
808
|
|
|||||||
|
Revolving — DBC
|
162
|
|
19
|
|
4
|
|
185
|
|
175
|
|
22
|
|
4
|
|
201
|
|
|||||||||||||||
|
Fixed-term — Consumer and Commercial
|
5,414
|
|
775
|
|
93
|
|
6,282
|
|
3,994
|
|
506
|
|
30
|
|
4,530
|
|
|||||||||||||||
|
Total customer receivables, gross
|
$
|
6,209
|
|
$
|
853
|
|
$
|
120
|
|
$
|
7,182
|
|
$
|
4,884
|
|
$
|
594
|
|
$
|
61
|
|
$
|
5,539
|
|
|||||||
The increase in the Company's fixed-term past due balances was attributable to administrative processes for larger transactions, and, to a lesser extent, additional originations from the EMC merger transaction, and does not indicate a deterioration in the credit quality of the portfolio.
110
Credit Quality
The following table summarizes customer receivables, gross, including accrued interest, by credit quality indicator segregated by class, as of
February 2, 2018
and
February 3, 2017
. The categories shown in the table below segregate customer receivables based on the relative degrees of credit risk. The credit quality indicators for DPA revolving accounts are measured primarily as of each quarter-end date, while all other indicators are generally updated on a periodic basis.
For DPA revolving receivables shown in the table below, the Company makes credit decisions based on proprietary scorecards, which include the customer's credit history, payment history, credit usage, and other credit agency-related elements. The higher quality category includes prime accounts generally of a higher credit quality that are comparable to U.S. customer FICO scores of
720
or above. The mid-category represents the mid-tier accounts that are comparable to U.S. customer FICO scores from
660
to
719
. The lower category is generally sub-prime and represents lower credit quality accounts that are comparable to U.S. customer FICO scores below
660
. For the DBC revolving receivables and fixed-term commercial receivables shown in the table below, an internal grading system is utilized that assigns a credit level score based on a number of considerations, including liquidity, operating performance, and industry outlook. The grading criteria and classifications for the fixed-term products differ from those for the revolving products as loss experience varies between these product and customer groups. The credit quality categories cannot be compared between the different classes as loss experience varies substantially between the classes.
|
|
February 2, 2018
|
February 3, 2017
|
|||||||||||||||||||||||||||||
|
Higher
|
Mid
|
Lower
|
Total
|
Higher
|
Mid
|
Lower
|
Total
|
||||||||||||||||||||||||
|
|
(in millions)
|
||||||||||||||||||||||||||||||
|
Revolving — DPA
|
$
|
131
|
|
$
|
223
|
|
$
|
361
|
|
$
|
715
|
|
$
|
136
|
|
$
|
244
|
|
$
|
428
|
|
$
|
808
|
|
|||||||
|
Revolving — DBC
|
$
|
48
|
|
$
|
58
|
|
$
|
79
|
|
$
|
185
|
|
$
|
61
|
|
$
|
60
|
|
$
|
80
|
|
$
|
201
|
|
|||||||
|
Fixed-term — Consumer and Commercial (a)
|
$
|
3,334
|
|
$
|
1,828
|
|
$
|
1,120
|
|
$
|
6,282
|
|
$
|
2,232
|
|
$
|
1,428
|
|
$
|
870
|
|
$
|
4,530
|
|
|||||||
____________________
|
(a)
|
During the three months ended May 5, 2017, the Company modified its credit scoring methodology for fixed-term financing receivables in response to changes in its go-to-market strategy. This methodology has been modified to a single, consistent, and comparable model across all fixed-term product customers. In connection with this change, the Company has recategorized existing fixed-term customers and has recast prior period credit quality categories to align with the current period presentation.
|
111
The Company maintains programs which facilitate the funding of financing receivables in the capital markets in North America, Europe, Australia, and New Zealand. The following table summarizes DFS debt as of the periods indicated.
|
February 2, 2018
|
February 3, 2017
|
||||||
|
(in millions)
|
|||||||
|
DFS U.S. debt
|
|||||||
|
Securitization facilities
|
$
|
1,498
|
|
$
|
1,481
|
|
|
|
Fixed-term securitization offerings
|
2,034
|
|
1,364
|
|
|||
|
Other
|
32
|
|
4
|
|
|||
|
Total DFS U.S. debt
|
3,564
|
|
2,849
|
|
|||
|
DFS international debt
|
|||||||
|
Securitization facility
|
404
|
|
233
|
|
|||
|
Other structured facilities
|
628
|
|
382
|
|
|||
|
Note payable
|
200
|
|
—
|
|
|||
|
Total DFS international debt
|
1,232
|
|
615
|
|
|||
|
Total DFS debt
|
$
|
4,796
|
|
$
|
3,464
|
|
|
|
Total short-term DFS debt
|
$
|
3,327
|
|
$
|
2,088
|
|
|
|
Total long-term DFS debt
|
$
|
1,469
|
|
$
|
1,376
|
|
|
DFS U.S. Debt
Securitization Facilities
—
The Company maintains separate securitization facilities in the United States for fixed-term leases and loans and revolving loans. This debt is collateralized solely by the U.S. financing receivables in the facilities. The debt has a variable interest rate and the duration of this debt is based on the terms of the underlying financing receivables. As of
February 2, 2018
, the total debt capacity related to the U.S. securitization facilities was
$2.1 billion
. The Company enters into interest swap agreements to effectively convert a portion of its securitization debt from a floating rate to a fixed rate. See
Note 9
of the
Notes to the Consolidated Financial Statements
for additional information about interest rate swaps.
The Company's U.S. securitization facility for revolving loans
is effective through June 10, 2018.
The Company's U.S. securitization facility
for fixed-term leases and loans was renewed on February 12, 2018 and is now effective through February 22, 2020.
The securitization facilities contain standard structural features related to the performance of the securitized receivables which include defined credit losses, delinquencies, average credit scores, and minimum collection requirements. In the event one or more of these criteria are not met and the Company is unable to restructure the facility, no further funding of receivables will be permitted and the timing of the Company's expected cash flows from over-collateralization will be delayed. As of
February 2, 2018
, these criteria were met.
Fixed-Term Securitization Offerings
—
The Company periodically issues asset-backed debt securities under fixed-term securitization programs to private investors. The asset-backed debt securities are collateralized solely by the U.S. fixed-term financing receivables in the offerings, which are held by SPEs, as discussed below. The interest rate on these securities is fixed and ranges fr
om
0.53%
to
3.61%
,
and the duration of these securities is based on the terms of the underlying financing receivables.
DFS International Debt
Securitization Facility
—
The Company maintains a securitization facility in Europe for fixed-term leases and loans. This facility
is effective through January 13, 2019
. As of
February 2, 2018
, the total debt capacity related to the international securitization facility was
$751 million
.
The securitization facility contains standard structural features related to the performance of the securitized receivables which include defined credit losses, delinquencies, average credit scores, and minimum collection requirements. In the event one or
112
more of these criteria are not met and the Company is unable to restructure the program, no further funding of receivables will be permitted and the timing of the Company's expected cash flows from over-collateralization will be delayed. As of
February 2, 2018
, these criteria were met.
Other Structured Facilities
—
In connection with the Company's international financing operations, the Company has entered into revolving structured financing debt programs related to its fixed-term lease and loan products sold in Canada, Europe, Australia, and New Zealand. The Canadian facility, which is collateralized solely by Canadian financing receivables, had a total debt capacity of
$183 million
as of
February 2, 2018
, and is effective through January 16, 2023. The European facility, which is collateralized solely by European financing receivables, had a total debt capacity of
$500 million
as of February 2, 2018, and is effective through December 14, 2020. The Australia and New Zealand facility, which is collateralized solely by the Australia and New Zealand financing receivables, had a total debt capacity of
$96 million
as of
February 2, 2018
, and is effective through January 29, 2020.
Note Payable
—
On November 27, 2017, the Company entered into an unsecured credit agreement to fund receivables in Mexico. The aggregate principal amount of the note payable is
$200 million
. The note will bear interest at either LIBOR plus
2.25%
, for the borrowings denominated in U.S. dollars, or the Mexican Interbank Equilibrium Interest Rate ("TIIE") plus
2.00%
, for the borrowings denominated in Mexican pesos. The note will mature on December 1, 2020. Although the note is unsecured, the Company intends to manage the note in the same manner as its structured financing programs, so that the collections from financing receivables in Mexico will be used to pay down principal and interest of the note.
Variable Interest Entities
In connection with the securitization facilities discussed above, the Company transfers certain U.S. and European customer financing receivables to Special Purpose Entities ("SPEs") that meet the definition of a Variable Interest Entity ("VIE") and are consolidated, along with the associated debt, into the Consolidated Financial Statements, as the Company is the primary beneficiary of those VIEs. These SPEs are bankruptcy-remote legal entities with separate assets and liabilities. The purpose of these SPEs is to facilitate the funding of customer receivables in the capital markets.
The following table shows financing receivables held by the consolidated VIEs as of the respective dates:
|
|
February 2, 2018
|
February 3, 2017
|
|||||
|
|
(in millions)
|
||||||
|
Financing receivables held by consolidated VIEs, net:
|
|
|
|
|
|||
|
Short-term, net
|
$
|
2,572
|
|
$
|
2,227
|
|
|
|
Long-term, net
|
1,981
|
|
1,381
|
|
|||
|
Financing receivables held by consolidated VIEs, net
|
$
|
4,553
|
|
$
|
3,608
|
|
|
Financing receivables transferred via securitization through SPEs were
$3.9 billion
and
$3.3 billion
for the fiscal years ended
February 2, 2018
and
February 3, 2017
, respectively.
Some of the SPEs have entered into financing arrangements with multi-seller conduits that, in turn, issue asset-backed debt securities in the capital markets. The DFS debt outstanding, which is collateralized by the financing receivables held by the consolidated VIEs, was
$3.9 billion
and
$3.1 billion
as of
February 2, 2018
and
February 3, 2017
, respectively. The Company's risk of loss related to securitized receivables is limited to the amount by which the Company's right to receive collections for assets securitized exceeds the amount required to pay interest, principal, and fees and expenses related to the asset-backed securities. The Company provides credit enhancement to the securitization in the form of over-collateralization.
Financing Receivable Sales
To manage certain concentrations of customer credit exposure, the Company may sell selected fixed-term financing receivables to unrelated third parties on a periodic basis. The amount of financing receivables sold was
$683 million
,
$321 million
, and
$91 million
for the fiscal years ended
February 2, 2018
,
February 3, 2017
, and
January 29, 2016
, respectively.
The increase in financing receivable sales during the
fiscal year ended February 2, 2018
was primarily attributable to the growth in customer syndications related to the financing of products and services from the EMC acquired businesses.
113
NOTE 8
—
DEBT
The following table summarizes the Company's outstanding debt as of the dates indicated:
|
|
February 2, 2018
|
February 3, 2017
|
|||||
|
(in millions)
|
|||||||
|
Secured Debt
|
|
||||||
|
Senior Secured Credit Facilities:
|
|||||||
|
3.58% Term Loan B Facility due September 2023
|
$
|
4,988
|
|
$
|
4,987
|
|
|
|
Term Loan A-1 Facility due December 2018
|
—
|
|
600
|
|
|||
|
3.33% Term Loan A-2 Facility due September 2021
|
4,394
|
|
3,876
|
|
|||
|
3.08% Term Loan A-3 Facility due December 2018
|
1,213
|
|
1,800
|
|
|||
|
3.33% Revolving Credit Facility due September 2021
|
—
|
|
375
|
|
|||
|
First Lien Notes:
|
|||||||
|
3.48% due June 2019
|
3,750
|
|
3,750
|
|
|||
|
4.42% due June 2021
|
4,500
|
|
4,500
|
|
|||
|
5.45% due June 2023
|
3,750
|
|
3,750
|
|
|||
|
6.02% due June 2026
|
4,500
|
|
4,500
|
|
|||
|
8.10% due July 2036
|
1,500
|
|
1,500
|
|
|||
|
8.35% due July 2046
|
2,000
|
|
2,000
|
|
|||
|
Unsecured Debt
|
|||||||
|
Unsecured Notes and Debentures:
|
|||||||
|
5.65% due April 2018
|
500
|
|
500
|
|
|||
|
5.875% due June 2019
|
600
|
|
600
|
|
|||
|
4.625% due April 2021
|
400
|
|
400
|
|
|||
|
7.10% due April 2028
|
300
|
|
300
|
|
|||
|
6.50% due April 2038
|
388
|
|
388
|
|
|||
|
5.40% due September 2040
|
264
|
|
265
|
|
|||
|
Senior Notes:
|
|||||||
|
5.875% due June 2021
|
1,625
|
|
1,625
|
|
|||
|
7.125% due June 2024
|
1,625
|
|
1,625
|
|
|||
|
EMC Notes:
|
|||||||
|
1.875% due June 2018
|
2,500
|
|
2,500
|
|
|||
|
2.650% due June 2020
|
2,000
|
|
2,000
|
|
|||
|
3.375% due June 2023
|
1,000
|
|
1,000
|
|
|||
|
VMware Notes:
|
|||||||
|
2.30% due August 2020
|
1,250
|
|
—
|
|
|||
|
2.95% due August 2022
|
1,500
|
|
—
|
|
|||
|
3.90% due August 2027
|
1,250
|
|
—
|
|
|||
|
DFS Debt (Note 7)
|
4,796
|
|
3,464
|
|
|||
|
Other
|
|||||||
|
4.02% Margin Loan Facility due April 2022
|
2,000
|
|
—
|
|
|||
|
Margin Bridge Facility due September 2017
|
—
|
|
2,500
|
|
|||
|
VMware Note Bridge Facility due September 2017
|
—
|
|
1,500
|
|
|||
|
Other
|
101
|
|
51
|
|
|||
|
Total debt, principal amount
|
$
|
52,694
|
|
$
|
50,356
|
|
|
114
|
February 2, 2018
|
February 3, 2017
|
||||||
|
(in millions)
|
|||||||
|
Total debt, principal amount
|
$
|
52,694
|
|
$
|
50,356
|
|
|
|
Unamortized discount, net of unamortized premium
|
(266
|
)
|
(284
|
)
|
|||
|
Debt issuance costs
|
(557
|
)
|
(682
|
)
|
|||
|
Total debt, carrying value
|
$
|
51,871
|
|
$
|
49,390
|
|
|
|
Total short-term debt, carrying value
|
$
|
7,873
|
|
$
|
6,329
|
|
|
|
Total long-term debt, carrying value
|
$
|
43,998
|
|
$
|
43,061
|
|
|
During the fiscal year ended
February 2, 2018
, the Company completed two refinancing transactions of the Senior Secured Credit Facilities described below. In the first refinancing transaction, which occurred during the three months ended May 5, 2017, the Company refinanced the Term Loan B Facility to reduce the interest rate margin by
0.75%
and to increase the outstanding principal amount by
$500 million
. The Company applied the proceeds from the Term Loan B Facility refinancing to repay
$500 million
principal amount of the Margin Bridge Facility, without premium or penalty, and accrued and unpaid interest thereon. Additionally, during the three months ended May 5, 2017, the Company entered into the Margin Loan Facility in the principal amount of
$2.0 billion
, and used the proceeds of the new facility to repay the Margin Bridge Facility, without premium or penalty.
In the second refinancing transaction, which occurred during the three months ended November 3, 2017, the Company refinanced the Term Loan A-2 Facility, Term Loan A-3 Facility, Term Loan B Facility, and the Revolving Credit Facility. As a result, the interest rate margin decreased
0.50%
for each of the Term Loan A-2 Facility, Term Loan A-3 Facility, Term Loan B Facility, and the Revolving Credit Facility. Additionally, the outstanding principal amount of the Term Loan A-2 Facility increased by
$672 million
, which was used to pay
$212 million
principal amount of the Term Loan A-3 Facility and
$460 million
principal amount of the Term Loan B Facility. Further, the Revolving Credit Facility's borrowing capacity increased
$180 million
to
$3.3 billion
.
During the fiscal year ended
February 2, 2018
, the Company repaid approximately
$1.2 billion
principal amount
of its term loan facilities and
$0.4 billion
under the Revolving Credit Facility and issued an additional
$1.3 billion
, net, in DFS debt to support the expansion of its financing receivables portfolio.
Further, during the fiscal year ended
February 2, 2018
, VMware, Inc. completed a public offering of senior notes in the aggregate amount of
$4.0 billion
. VMware, Inc. used a portion of the net proceeds from the offering to repay certain intercompany promissory notes previously issued by it to EMC in the aggregate principal amount of
$1.2 billion
. The Company applied the proceeds of this repayment, and other cash, to repay
$1.5 billion
principal amount of the VMware Note Bridge Facility, without premium or penalty.
Secured Debt
Senior Secured Credit Facilities
—
At the closing of the EMC merger transaction on September 7, 2016, the Company entered into a credit agreement that provides for senior secured credit facilities (the "Senior Secured Credit Facilities") in the aggregate principal amount of
$17.6 billion
comprising (a) term loan facilities and (b) a senior secured Revolving Credit Facility, which includes capacity for up to
$0.5 billion
of letters of credit and for borrowings of up to
$0.4 billion
under swing-line loans. As of
February 2, 2018
, available borrowings under the Revolving Credit Facility totaled
$3.3 billion
. The Senior Secured Credit Facilities provide that the borrowers have the right at any time, subject to customary conditions, to request incremental term loans or incremental revolving commitments.
Borrowings under the Senior Secured Credit Facilities bear interest at a rate per annum equal to an applicable margin, plus, at the borrowers' option, either (a) a base rate, which, under the Term Loan B Facility, is subject to an interest rate floor of
1.75%
per annum, and under all other borrowings is subject to an interest rate floor of
0%
per annum, or (b) a London interbank offered rate ("LIBOR"), which, under the Term Loan B Facility, is subject to an interest rate floor of
0.75%
per annum, and under all other borrowings is subject to an interest rate floor of
0%
per annum. Interest is payable, in the case of loans bearing interest based on LIBOR, at the end of each interest period (but at least every three months), in arrears and, in the case of loans bearing interest based on the base rate, quarterly in arrears.
115
The Term Loan A-2 Facility amortizes in equal quarterly installments in aggregate annual amounts equal to
5%
of the original principal amount in the first year after the closing date of the refinancing transaction on October 20, 2017,
10%
of the original principal amount in each of the second and third years after October 20, 2017, and
70%
of the original principal amount in the fourth year after October 20, 2017. The Term Loan B Facility amortizes in equal quarterly installments in aggregate annual amounts equal to
1%
of the original principal amount. The Term Loan A-3 Facility and the Revolving Credit Facility have no amortization. The Term Loan A-3 Facility requires the borrowers to prepay outstanding borrowings under these facilities with
100%
of the net cash proceeds of certain non-ordinary course asset sales or dispositions. The borrowers may voluntarily repay outstanding loans under the term loan facilities and the Revolving Credit Facility at any time without premium or penalty, other than customary "breakage" costs.
All obligations of the borrowers under the Senior Secured Credit Facilities and certain swap agreements, cash management arrangements, and certain letters of credit provided by any lender or agent party to the Senior Secured Credit Facilities or any of its affiliates and certain other persons are secured by (a) a first-priority security interest in certain tangible and intangible assets of the borrowers and the guarantors and (b) a first-priority pledge of
100%
of the capital stock of the borrowers, Dell Inc., and each wholly-owned material restricted subsidiary of the borrowers and the guarantors, in each case subject to certain thresholds, exceptions, and permitted liens.
First Lien Notes
— The senior secured notes (collectively, the "First Lien Notes") were issued on June 1, 2016 in an aggregate principal amount of
$20.0 billion
. Interest on these borrowings is payable semiannually. The First Lien Notes are secured, on a pari passu basis with the Senior Secured Credit Facilities, on a first-priority basis by substantially all of the tangible and intangible assets of the issuers and guarantors that secure obligations under the Senior Secured Credit Facilities, including pledges of all capital stock of the issuers, of Dell, and of certain wholly-owned material subsidiaries of the issuers and the guarantors, subject to certain exceptions.
The Company has agreed to use commercially reasonable efforts to register with the SEC notes having terms substantially identical to the terms of the First Lien Notes as part of an offer to exchange such registered notes for the First Lien Notes. The Company will be obligated to pay additional interest on the First Lien Notes if it fails to consummate such an exchange offer within
five years
after the closing date of the EMC merger transaction.
China Revolving Credit Facility
— On October 31, 2017, the Company entered into a credit agreement (the "China Revolving Credit Facility") with a bank lender for a secured revolving loan facility in an aggregate principal amount not to exceed
$500 million
. Borrowings under the China Revolving Credit Facility bear interest at a rate per annum of
0.6%
plus LIBOR. The Company may voluntarily repay outstanding loans under the China Revolving Credit Facility at any time without premium or penalty, other than customary "breakage" costs. The facility will expire on October 31, 2018. As of
February 2, 2018
, there were no outstanding borrowings under the China Revolving Credit Facility.
Unsecured Debt
Unsecured Notes and Debentures
— The Company has outstanding unsecured notes and debentures (collectively, the "Unsecured Notes and Debentures") that were issued prior to the acquisition of Dell by Dell Technologies Inc. in the going-private transaction. Interest on these borrowings is payable semiannually.
Senior Notes
— The senior unsecured notes (collectively, the "Senior Notes") were issued on June 22, 2016 in an aggregate principal amount of
$3.25 billion
. Interest on these borrowings is payable semiannually.
EMC Notes
— On September 7, 2016, EMC had outstanding
$2.5 billion
aggregate principal amount of its
1.875%
Notes due June 2018,
$2.0 billion
aggregate principal amount of its
2.650%
Notes due June 2020, and
$1.0 billion
aggregate principal amount of its
3.375%
Notes due June 2023 (collectively, the "EMC Notes"). Interest on these borrowings is payable semiannually. The EMC Notes remain outstanding following the closing of the EMC merger transaction.
VMware Notes
— On August 21, 2017, VMware, Inc. completed a public offering of senior notes in the aggregate amount of
$4.0 billion
, consisting of outstanding principal due on the following dates:
$1.25 billion
due August 21, 2020,
$1.50 billion
due August 21, 2022, and
$1.25 billion
due August 21, 2027 (collectively, the "VMware Notes"). The VMware Notes bear interest, payable semiannually, at annual rates of
2.30%
,
2.95%
, and
3.90%
, respectively. None of the net proceeds of such borrowings will be made available to support the operations or satisfy any corporate purposes of Dell Technologies, other than the operations and corporate purposes of VMware, Inc. and VMware, Inc.’s subsidiaries.
116
VMware Revolving Credit Facility
— On September 12, 2017, VMware, Inc. entered into an unsecured credit agreement, establishing a revolving credit facility (the “VMware Revolving Credit Facility”), with a syndicate of lenders that provides the company with a borrowing capacity of up to
$1.0 billion
which may be used for VMware, Inc. corporate purposes. Commitments under the VMware Revolving Credit Facility are available for a period of
five years
, which may be extended, subject to the satisfaction of certain conditions, by up to
two
one year
periods. The credit agreement contains certain representations, warranties, and covenants. Commitment fees, interest rates, and other terms of borrowings under the VMware Revolving Credit Facility may vary based on VMware, Inc.’s external credit ratings. None of the net proceeds of such borrowings will be made available to support the operations or satisfy any corporate purposes of Dell Technologies, other than the operations and corporate purposes of VMware, Inc. and VMware, Inc.’s subsidiaries. As of
February 2, 2018
, there were no outstanding borrowings under the VMware Revolving Credit Facility.
DFS Debt
See
Note 7
and
Note 9
of the
Notes to the Consolidated Financial Statements
, respectively, for discussion of DFS debt and the interest rate swap agreements that hedge a portion of that debt.
Other
Margin Loan Facility
— On April 12, 2017, the Company entered into the Margin Loan Facility in an aggregate principal amount of
$2.0 billion
. VMW Holdco LLC, a wholly-owned subsidiary of EMC, is the borrower under the Margin Loan Facility, which is secured by
60 million
shares of Class B common stock of VMware, Inc. and
20 million
shares of Class A common stock of VMware, Inc. Loans under the Margin Loan Facility bear interest at a rate per annum payable, at the borrower's option, either at (a) a base rate plus
1.25%
per annum or (b) a LIBOR-based rate plus
2.25%
per annum. Interest under the Margin Loan Facility is payable quarterly.
The Margin Loan Facility will mature in April 2022. The borrower may voluntarily repay outstanding loans under the Margin Loan Facility at any time without premium or penalty, other than customary "breakage" costs, subject to certain minimum threshold amounts for prepayment.
Margin Bridge Facility
—
On September 7, 2016, Merger Sub and EMC entered into a credit agreement providing for a senior secured margin bridge facility in an aggregate principal amount of
$2.5 billion
(the "Margin Bridge Facility").
As described above, during the three months ended May 5, 2017, the Company separately applied the proceeds from the Term Loan B Facility refinancing and the issuance of the Margin Loan Facility to repay the Margin Bridge Facility, without premium or penalty.
VMware Note Bridge Facility
—
On September 7, 2016, Merger Sub and EMC entered into a credit agreement providing for a senior secured note bridge facility in an aggregate principal amount of
$1.5 billion
(the "VMware Note Bridge Facility"). As described above, the Company repaid the VMware Note Bridge Facility during the fiscal year ended
February 2, 2018
.
Pivotal Revolving Credit Facility
— On September 7, 2017,
Pivotal entered into a credit agreement (the "Pivotal Revolving Credit Facility") that provides for a senior secured revolving loan facility in an aggregate principal amount not to exceed
$100 million
. The credit facility contains customary representations, warranties, and covenants, including financial covenants. The credit agreement will expire on September 8, 2020, unless it is terminated earlier
. None of the net proceeds of borrowings under the facility will be made available to support the operations or satisfy any corporate purposes of Dell Technologies, other than the operations and corporate purposes of Pivotal and Pivotal's subsidiaries. As of
February 2, 2018
, outstanding borrowings under the Pivotal Revolving Credit Facility were
$20 million
.
117
Aggregate Future Maturities
As of
February 2, 2018
, aggregate future maturities of the Company's debt were as follows:
|
|
Maturities by Fiscal Year
|
||||||||||||||||||||||||||
|
|
2019
|
2020
|
2021
|
2022
|
2023
|
Thereafter
|
Total
|
||||||||||||||||||||
|
|
(in millions)
|
||||||||||||||||||||||||||
|
Senior Secured Credit Facilities and First Lien Notes
|
$
|
1,541
|
|
$
|
4,245
|
|
$
|
371
|
|
$
|
7,888
|
|
$
|
63
|
|
$
|
16,487
|
|
$
|
30,595
|
|
||||||
|
Unsecured Notes and Debentures
|
500
|
|
600
|
|
—
|
|
400
|
|
—
|
|
952
|
|
2,452
|
|
|||||||||||||
|
Senior Notes and EMC Notes
|
2,500
|
|
—
|
|
2,000
|
|
1,625
|
|
—
|
|
2,625
|
|
8,750
|
|
|||||||||||||
|
VMware Notes
|
—
|
|
—
|
|
1,250
|
|
—
|
|
1,500
|
|
1,250
|
|
4,000
|
|
|||||||||||||
|
DFS Debt
|
3,328
|
|
847
|
|
530
|
|
82
|
|
9
|
|
—
|
|
4,796
|
|
|||||||||||||
|
Margin Loan Facility
|
—
|
|
—
|
|
—
|
|
—
|
|
2,000
|
|
—
|
|
2,000
|
|
|||||||||||||
|
Other
|
19
|
|
—
|
|
56
|
|
—
|
|
—
|
|
26
|
|
101
|
|
|||||||||||||
|
Total maturities, principal amount
|
7,888
|
|
5,692
|
|
4,207
|
|
9,995
|
|
3,572
|
|
21,340
|
|
52,694
|
|
|||||||||||||
|
Associated carrying value adjustments
|
(14
|
)
|
(32
|
)
|
(8
|
)
|
(192
|
)
|
(30
|
)
|
(547
|
)
|
(823
|
)
|
|||||||||||||
|
Total maturities, carrying value amount
|
$
|
7,874
|
|
$
|
5,660
|
|
$
|
4,199
|
|
$
|
9,803
|
|
$
|
3,542
|
|
$
|
20,793
|
|
$
|
51,871
|
|
||||||
Covenants and Unrestricted Net Assets
—
The credit agreement for the Senior Secured Credit Facilities contain customary negative covenants that generally limit the ability of Denali Intermediate Inc., a wholly-owned subsidiary of Dell Technologies ("Dell Intermediate"), Dell, and Dell's and Denali Intermediate's other restricted subsidiaries to incur debt, create liens, make fundamental changes, enter into asset sales, make certain investments, pay dividends or distribute or redeem certain equity interests, prepay or redeem certain debt, and enter into certain transactions with affiliates. The indenture governing the Senior Notes contains customary negative covenants that generally limit the ability of Denali Intermediate, Dell, and Dell's and Denali Intermediate's other restricted subsidiaries to incur additional debt or issue certain preferred shares, pay dividends on or make other distributions in respect of capital stock or make other restricted payments, make certain investments, sell or transfer certain assets, create liens on certain assets to secure debt, consolidate, merge, sell, or otherwise dispose of all or substantially all assets, enter into certain transactions with affiliates, and designate subsidiaries as unrestricted subsidiaries. The negative covenants under such credit agreements and indenture are subject to certain exceptions, qualifications, and "baskets." The indentures governing the First Lien Notes, the Unsecured Notes and Debentures, and the EMC Notes variously impose limitations, subject to specified exceptions, on creating certain liens, entering into sale and lease-back transactions, and entering into certain asset sales. The foregoing credit agreements and indentures contain customary events of default, including failure to make required payments, failure to comply with covenants, and the occurrence of certain events of bankruptcy and insolvency.
As of
February 2, 2018
, the Company had certain consolidated subsidiaries that were designated as unrestricted subsidiaries for all purposes of the applicable credit agreements and the indentures governing the First Lien Notes and the Senior Notes. Substantially all of the net assets of the Company's consolidated subsidiaries were restricted, with the exception of the Company's unrestricted subsidiaries, primarily VMware Inc., SecureWorks, Pivotal, and their respective subsidiaries, as of
February 2, 2018
.
The Term Loan A-2 Facility, the Term Loan A-3 Facility, and the Revolving Credit Facility are subject to a first lien net leverage ratio covenant that is tested at the end of each fiscal quarter of Dell with respect to Dell's preceding four fiscal quarters. The Company was in compliance with all financial covenants as of
February 2, 2018
.
118
NOTE 9
—
DERIVATIVE INSTRUMENTS AND HEDGING ACTIVITIES
Derivative Instruments
As part of its risk management strategy, the Company uses derivative instruments, primarily foreign currency forward and option contracts and interest rate swaps, to hedge certain foreign currency and interest rate exposures, respectively.
The Company's objective is to offset gains and losses resulting from these exposures with gains and losses on the derivative contracts used to hedge the exposures, thereby reducing volatility of earnings and protecting the fair values of assets and liabilities. For derivatives designated as cash flow hedges, the Company assesses hedge effectiveness both at the onset of the hedge and at regular intervals throughout the life of the derivative and recognizes any ineffective portion of the hedge in earnings as a component of interest and other, net. Hedge ineffectiveness recognized in earnings was not material during the fiscal years ended
February 2, 2018
,
February 3, 2017
, and
January 29, 2016
.
Foreign Exchange Risk
The Company uses foreign currency forward and option contracts designated as cash flow hedges to protect against the foreign currency exchange rate risks inherent in its forecasted transactions denominated in currencies other than the U.S. dollar. Hedge accounting is applied based upon the criteria established by accounting guidance for derivative instruments and hedging activities. The risk of loss associated with purchased options is limited to premium amounts paid for the option contracts. The risk of loss associated with forward contracts is equal to the exchange rate differential from the time the contract is entered into until the time it is settled. The majority of these contracts typically expire in
twelve months
or less.
During the fiscal years ended
February 2, 2018
,
February 3, 2017
, and
January 29, 2016
, the Company did not discontinue any cash flow hedges related to foreign exchange contracts that had a material impact on the Company's results of operations due to the probability that the forecasted cash flows would not occur.
The Company uses forward contracts to hedge monetary assets and liabilities denominated in a foreign currency. These contracts generally expire in
three months
or less, are considered economic hedges, and are not designated for hedge accounting. The change in the fair value of these instruments represents a natural hedge as their gains and losses offset the changes in the underlying fair value of the monetary assets and liabilities due to movements in currency exchange rates.
In connection with the expanded offerings of DFS in Europe, forward contracts are used to hedge financing receivables denominated in foreign currencies. These contracts are not designated for hedge accounting and most expire within
three years
or less.
Interest Rate Risk
The Company uses interest rate swaps to hedge the variability in cash flows related to the interest rate payments on structured financing debt. The interest rate swaps economically convert the variable rate on the structured financing debt to a fixed interest rate to match the underlying fixed rate being received on fixed-term customer leases and loans. These contracts are not designated for hedge accounting and most expire within
three years
or less.
Interest rate swaps are utilized to manage the interest rate risk, at a portfolio level, associated with DFS operations in Europe. The interest rate swaps economically convert the fixed rate on financing receivables to a three-month Euribor floating rate basis in order to match the floating rate nature of the banks' funding pool. These contracts are not designated for hedge accounting and most expire within
three years
or less.
The Company utilizes cross currency amortizing swaps to hedge the currency and interest rate risk exposure associated with the securitization program that was established in Europe in January 2017. The cross currency swaps combine a Euro-based interest rate swap with a British Pound or U.S. Dollar foreign exchange forward contract in which the Company pays a fixed British Pound or U.S. Dollar amount and receives a floating amount in Euro linked to the one-month Euribor. The notional value of the swaps amortizes in line with the expected cash flows and run-off of the securitized assets. The swaps mature within
five years
or less and are not designated for hedge accounting.
119
Notional Amounts of Outstanding Derivative Instruments
The notional amounts of the Company's outstanding derivative instruments were as follows as of the dates indicated:
|
|
February 2, 2018
|
February 3, 2017 (a)
|
|||||
|
|
(in millions)
|
||||||
|
Foreign exchange contracts:
|
|
|
|
|
|||
|
Designated as cash flow hedging instruments
|
$
|
4,392
|
|
$
|
3,781
|
|
|
|
Non-designated as hedging instruments
|
6,223
|
|
5,146
|
|
|||
|
Total
|
$
|
10,615
|
|
$
|
8,927
|
|
|
|
Interest rate contracts:
|
|||||||
|
Non-designated as hedging instruments
|
$
|
1,897
|
|
$
|
1,251
|
|
|
____________________
|
(a)
|
During the fiscal year ended
February 2, 2018
, the notional amount calculation methodology was enhanced to reflect the sum of the absolute value of derivative instruments netted by currency. Prior period amounts have been updated to conform with the current period presentation.
|
Effect of Derivative Instruments on the Consolidated Statements of Financial Position and the Consolidated Statements of Income (Loss)
|
Derivatives in
Cash Flow Hedging Relationships |
Gain (Loss)
Recognized in Accumulated OCI, Net of Tax, on Derivatives (Effective Portion) |
Location of Gain (Loss)
Reclassified from Accumulated OCI into Income (Effective Portion) |
Gain (Loss)
Reclassified from Accumulated OCI into Income (Effective Portion) |
Location of Gain (Loss) Recognized in Income on Derivative (Ineffective Portion)
|
Gain (Loss) Recognized in Income on Derivative (Ineffective Portion)
|
|||||||||||
|
(in millions)
|
||||||||||||||||
|
For the fiscal year ended February 2, 2018
|
||||||||||||||||
|
|
|
Total net revenue
|
$
|
(77
|
)
|
|||||||||||
|
Foreign exchange contracts
|
$
|
(248
|
)
|
Total cost of net revenue
|
(57
|
)
|
||||||||||
|
Interest rate contracts
|
—
|
|
Interest and other, net
|
—
|
|
Interest and other, net
|
$
|
—
|
|
|||||||
|
Total
|
$
|
(248
|
)
|
|
$
|
(134
|
)
|
|
$
|
—
|
|
|||||
|
For the fiscal year ended February 3, 2017
|
||||||||||||||||
|
|
|
Total net revenue
|
$
|
57
|
|
|||||||||||
|
Foreign exchange contracts
|
$
|
20
|
|
Total cost of net revenue
|
(13
|
)
|
||||||||||
|
Interest rate contracts
|
—
|
|
Interest and other, net
|
—
|
|
Interest and other, net
|
$
|
(1
|
)
|
|||||||
|
Total
|
$
|
20
|
|
|
$
|
44
|
|
|
$
|
(1
|
)
|
|||||
|
For the fiscal year ended January 29, 2016
|
||||||||||||||||
|
|
|
Total net revenue
|
$
|
328
|
|
|||||||||||
|
Foreign exchange contracts
|
$
|
152
|
|
Total cost of net revenue
|
40
|
|
||||||||||
|
Interest rate contracts
|
—
|
|
Interest and other, net
|
—
|
|
Interest and other, net
|
$
|
(1
|
)
|
|||||||
|
Total
|
$
|
152
|
|
|
$
|
368
|
|
|
$
|
(1
|
)
|
|||||
120
Fair Value of Derivative Instruments in the Consolidated Statements of Financial Position
The Company presents its foreign exchange derivative instruments on a net basis in the Consolidated Statements of Financial Position due to the right of offset by its counterparties under master netting arrangements.
The fair value of those derivative instruments presented on a gross basis as of each date indicated below was as follows:
|
|
February 2, 2018
|
||||||||||||||||||
|
|
Other Current
Assets |
Other Non-
Current Assets |
Other Current
Liabilities |
Other Non-Current
Liabilities |
Total
Fair Value |
||||||||||||||
|
|
|
(in millions)
|
|
||||||||||||||||
|
Derivatives designated as hedging instruments:
|
|||||||||||||||||||
|
Foreign exchange contracts in an asset position
|
$
|
9
|
|
$
|
—
|
|
$
|
11
|
|
$
|
—
|
|
$
|
20
|
|
||||
|
Foreign exchange contracts in a liability position
|
(7
|
)
|
—
|
|
(52
|
)
|
—
|
|
(59
|
)
|
|||||||||
|
Net asset (liability)
|
2
|
|
—
|
|
(41
|
)
|
—
|
|
(39
|
)
|
|||||||||
|
Derivatives not designated as hedging instruments:
|
|||||||||||||||||||
|
Foreign exchange contracts in an asset position
|
194
|
|
3
|
|
141
|
|
—
|
|
338
|
|
|||||||||
|
Foreign exchange contracts in a liability position
|
(127
|
)
|
—
|
|
(283
|
)
|
—
|
|
(410
|
)
|
|||||||||
|
Interest rate contracts in an asset position
|
—
|
|
11
|
|
—
|
|
—
|
|
11
|
|
|||||||||
|
Interest rate contracts in a liability position
|
—
|
|
—
|
|
—
|
|
(1
|
)
|
(1
|
)
|
|||||||||
|
Net asset (liability)
|
67
|
|
14
|
|
(142
|
)
|
(1
|
)
|
(62
|
)
|
|||||||||
|
Total derivatives at fair value
|
$
|
69
|
|
$
|
14
|
|
$
|
(183
|
)
|
$
|
(1
|
)
|
$
|
(101
|
)
|
||||
|
|
February 3, 2017
|
||||||||||||||||||
|
|
Other Current
Assets |
Other Non-
Current Assets |
Other Current
Liabilities |
Other Non-Current
Liabilities |
Total
Fair Value |
||||||||||||||
|
|
|
(in millions)
|
|
||||||||||||||||
|
Derivatives designated as hedging instruments:
|
|||||||||||||||||||
|
Foreign exchange contracts in an asset position
|
$
|
41
|
|
$
|
—
|
|
$
|
17
|
|
$
|
—
|
|
$
|
58
|
|
||||
|
Foreign exchange contracts in a liability position
|
(19
|
)
|
—
|
|
(6
|
)
|
—
|
|
(25
|
)
|
|||||||||
|
Net asset (liability)
|
22
|
|
—
|
|
11
|
|
—
|
|
33
|
|
|||||||||
|
Derivatives not designated as hedging instruments:
|
|||||||||||||||||||
|
Foreign exchange contracts in an asset position
|
309
|
|
2
|
|
31
|
|
—
|
|
342
|
|
|||||||||
|
Foreign exchange contracts in a liability position
|
(131
|
)
|
—
|
|
(103
|
)
|
—
|
|
(234
|
)
|
|||||||||
|
Interest rate contracts in an asset position
|
—
|
|
3
|
|
—
|
|
—
|
|
3
|
|
|||||||||
|
Interest rate contracts in a liability position
|
—
|
|
—
|
|
—
|
|
(3
|
)
|
(3
|
)
|
|||||||||
|
Net asset (liability)
|
178
|
|
5
|
|
(72
|
)
|
(3
|
)
|
108
|
|
|||||||||
|
Total derivatives at fair value
|
$
|
200
|
|
$
|
5
|
|
$
|
(61
|
)
|
$
|
(3
|
)
|
$
|
141
|
|
||||
121
The following table presents the gross amounts of the Company's derivative instruments, amounts offset due to master netting agreements with the Company's counterparties, and the net amounts recognized in the Consolidated Statements of Financial Position.
|
February 2, 2018
|
|||||||||||||||||||||||
|
Gross Amounts of Recognized Assets/ (Liabilities)
|
Gross Amounts Offset in the Statement of Financial Position
|
Net Amounts of Assets/ (Liabilities) Presented in the Statement of Financial Position
|
Gross Amounts not Offset in the Statement of Financial Position
|
Net Amount
|
|||||||||||||||||||
|
Financial Instruments
|
Cash Collateral Received or Pledged
|
||||||||||||||||||||||
|
(in millions)
|
|||||||||||||||||||||||
|
Derivative instruments:
|
|||||||||||||||||||||||
|
Financial assets
|
$
|
369
|
|
$
|
(286
|
)
|
$
|
83
|
|
$
|
—
|
|
$
|
—
|
|
$
|
83
|
|
|||||
|
Financial liabilities
|
(470
|
)
|
286
|
|
(184
|
)
|
—
|
|
—
|
|
(184
|
)
|
|||||||||||
|
Total derivative instruments
|
$
|
(101
|
)
|
$
|
—
|
|
$
|
(101
|
)
|
$
|
—
|
|
$
|
—
|
|
$
|
(101
|
)
|
|||||
|
February 3, 2017
|
|||||||||||||||||||||||
|
Gross Amounts of Recognized Assets/ (Liabilities)
|
Gross Amounts Offset in the Statement of Financial Position
|
Net Amounts of Assets/ (Liabilities) Presented in the Statement of Financial Position
|
Gross Amounts not Offset in the Statement of Financial Position
|
Net Amount
|
|||||||||||||||||||
|
Financial Instruments
|
Cash Collateral Received or Pledged
|
||||||||||||||||||||||
|
(in millions)
|
|||||||||||||||||||||||
|
Derivative instruments:
|
|||||||||||||||||||||||
|
Financial assets
|
$
|
403
|
|
$
|
(198
|
)
|
$
|
205
|
|
$
|
—
|
|
$
|
—
|
|
$
|
205
|
|
|||||
|
Financial liabilities
|
(262
|
)
|
198
|
|
(64
|
)
|
—
|
|
—
|
|
(64
|
)
|
|||||||||||
|
Total derivative instruments
|
$
|
141
|
|
$
|
—
|
|
$
|
141
|
|
$
|
—
|
|
$
|
—
|
|
$
|
141
|
|
|||||
122
NOTE 10
—
GOODWILL AND INTANGIBLE ASSETS
Goodwill
The following table presents goodwill allocated to the Company's business segments as of
February 2, 2018
,
February 3, 2017
, and
January 29, 2016
and changes in the carrying amount of goodwill for the respective periods:
|
|
Client Solutions Group
|
Infrastructure Solutions Group (a)
|
VMware
|
Other Businesses (b)
|
Total
|
||||||||||||||
|
(in millions)
|
|||||||||||||||||||
|
Balances as of January 29, 2016
|
$
|
4,428
|
|
$
|
3,907
|
|
$
|
—
|
|
$
|
71
|
|
$
|
8,406
|
|
||||
|
Goodwill acquired
|
—
|
|
12,872
|
|
15,070
|
|
3,597
|
|
31,539
|
|
|||||||||
|
Impact of foreign currency translation
|
—
|
|
(169
|
)
|
—
|
|
(32
|
)
|
(201
|
)
|
|||||||||
|
Goodwill divested
|
—
|
|
(834
|
)
|
—
|
|
—
|
|
(834
|
)
|
|||||||||
|
Other adjustments
|
(191
|
)
|
(169
|
)
|
—
|
|
360
|
|
—
|
|
|||||||||
|
Balances as of February 3, 2017
|
4,237
|
|
15,607
|
|
15,070
|
|
3,996
|
|
38,910
|
|
|||||||||
|
Goodwill acquired
|
—
|
|
—
|
|
565
|
|
9
|
|
574
|
|
|||||||||
|
Impact of foreign currency translation
|
—
|
|
359
|
|
—
|
|
90
|
|
449
|
|
|||||||||
|
Goodwill divested
|
—
|
|
(13
|
)
|
—
|
|
—
|
|
(13
|
)
|
|||||||||
|
Balances as of February 2, 2018
|
$
|
4,237
|
|
$
|
15,953
|
|
$
|
15,635
|
|
$
|
4,095
|
|
$
|
39,920
|
|
||||
____________________
|
(a)
|
Infrastructure Solutions Group is composed of the Core Storage, Servers, and Networking goodwill reporting unit and Virtustream goodwill reporting unit.
|
|
(b)
|
Other Businesses consists of offerings by RSA Information Security, SecureWorks, Pivotal, and Boomi.
|
Goodwill and indefinite-lived intangible assets are tested for impairment annually during the third fiscal quarter and whenever events or circumstances may indicate that an impairment has occurred. Based on the results of the annual impairment test, which was a quantitative test for certain goodwill reporting units and a qualitative test for others, no impairment of goodwill or indefinite-lived intangible assets existed for any reporting unit as of
November 3, 2017
. As a result of this analysis, it was determined that the excess of fair value over carrying amount was greater than
20%
for all of the Company's existing goodwill reporting units as of
November 3, 2017
, with the exception of the Core Storage, Servers, and Networking goodwill reporting unit within the Infrastructure Solutions Group segment, which had an excess of fair value over carrying amount of
18%
as of such date. Management will continue to monitor the Core Storage, Servers, and Networking goodwill reporting unit and consider potential impacts to the impairment assessment. Further, the Company did not have any accumulated goodwill impairment charges as of
February 2, 2018
.
Management exercised significant judgment related to the above assessment, including the identification of goodwill reporting units, assignment of assets and liabilities to goodwill reporting units, assignment of goodwill to reporting units, and determination of the fair value of each goodwill reporting unit. The fair value of each goodwill reporting unit is generally estimated using a combination of public company multiples and discounted cash flow methodologies. This analysis requires significant judgment, including estimation of future cash flows, which is dependent on internal forecasts, the estimation of the long-term growth rate of the Company's business, and the determination of the Company's weighted average cost of capital. Changes in these estimates and assumptions could materially affect the fair value of the goodwill reporting unit, potentially resulting in a non-cash impairment charge.
123
Intangible Assets
The Company's intangible assets as of
February 2, 2018
and
February 3, 2017
were as follows:
|
|
February 2, 2018
|
February 3, 2017
|
|||||||||||||||||||||
|
|
Gross
|
Accumulated
Amortization
|
Net
|
Gross
|
Accumulated
Amortization
|
Net
|
|||||||||||||||||
|
|
(in millions)
|
||||||||||||||||||||||
|
Customer relationships
|
$
|
22,764
|
|
$
|
(8,637
|
)
|
$
|
14,127
|
|
$
|
22,708
|
|
$
|
(5,552
|
)
|
$
|
17,156
|
|
|||||
|
Developed technology
|
15,586
|
|
(6,196
|
)
|
9,390
|
|
14,569
|
|
(2,510
|
)
|
12,059
|
|
|||||||||||
|
Trade names
|
1,277
|
|
(407
|
)
|
870
|
|
1,268
|
|
(201
|
)
|
1,067
|
|
|||||||||||
|
Leasehold assets (liabilities)
|
128
|
|
(6
|
)
|
122
|
|
128
|
|
(1
|
)
|
127
|
|
|||||||||||
|
Definite-lived intangible assets
|
39,755
|
|
(15,246
|
)
|
24,509
|
|
38,673
|
|
(8,264
|
)
|
30,409
|
|
|||||||||||
|
In-process research and development
|
—
|
|
—
|
|
—
|
|
890
|
|
—
|
|
890
|
|
|||||||||||
|
Indefinite-lived trade names
|
3,756
|
|
—
|
|
3,756
|
|
3,754
|
|
—
|
|
3,754
|
|
|||||||||||
|
Total intangible assets
|
$
|
43,511
|
|
$
|
(15,246
|
)
|
$
|
28,265
|
|
$
|
43,317
|
|
$
|
(8,264
|
)
|
$
|
35,053
|
|
|||||
Amortization expense related to definite-lived intangible assets was approximately
$7.0 billion
,
$3.7 billion
, and
$2.0 billion
for the fiscal years ended
February 2, 2018, February 3, 2017, and January 29, 2016
, respectively. The amortization expense for the fiscal year ended February 2, 2018 was primarily related to the intangible assets acquired in the EMC merger transaction. There wer
e
no
material impairment charges related to intangible assets during the fiscal years ended
February 2, 2018, February 3, 2017, and January 29, 2016
.
Estimated future annual pre-tax amortization expense of definite-lived intangible assets as of
February 2, 2018
over the next five fiscal years and thereafter is as follows:
|
Fiscal Years
|
(in millions)
|
||
|
2019
|
$
|
6,083
|
|
|
2020
|
4,297
|
|
|
|
2021
|
3,356
|
|
|
|
2022
|
2,638
|
|
|
|
2023
|
1,754
|
|
|
|
Thereafter
|
6,381
|
|
|
|
Total
|
$
|
24,509
|
|
124
NOTE 11
—
WARRANTY LIABILITY
The Company record
s a liability for its standard limited warranties at the time of sale for the estimated costs that may be incurred. The liability for standard warranties is included in accrued and other current liabilities and other non-current liabilities in the Consolidated Statements of Financial Position.
Changes in the Company's liability for standard limited warranties are presented in
the following table for the periods indicated.
|
Fiscal Year Ended
|
|||||||||||
|
|
February 2, 2018
|
February 3, 2017
|
January 29, 2016
|
||||||||
|
(in millions)
|
|||||||||||
|
Warranty liability:
|
|||||||||||
|
Warranty liability at beginning of period
|
$
|
604
|
|
$
|
574
|
|
$
|
679
|
|
||
|
Warranty liability assumed through EMC merger transaction
|
—
|
|
125
|
|
—
|
|
|||||
|
Costs accrued for new warranty contracts and changes in estimates for pre-existing warranties (a) (b)
|
905
|
|
852
|
|
754
|
|
|||||
|
Service obligations honored
|
(970
|
)
|
(947
|
)
|
(859
|
)
|
|||||
|
Warranty liability at end of period
|
$
|
539
|
|
$
|
604
|
|
$
|
574
|
|
||
|
Current portion
|
$
|
367
|
|
$
|
405
|
|
$
|
381
|
|
||
|
Non-current portion
|
$
|
172
|
|
$
|
199
|
|
$
|
193
|
|
||
____________________
|
(a)
|
Changes in cost estimates related to pre-existing warranties are aggregated with accruals for new standard warranty contracts. The Company's warranty liability process does not differentiate between estimates made for pre-existing warranties and new warranty obligations.
|
|
(b)
|
Includes the impact of foreign currency exchange rate fluctuations.
|
125
NOTE 12
—
SEVERANCE CHARGES
In connection with the transformation of the Company's business model, the Company incurs costs related to employee severance. The Company records a liability for these costs when it is probable that employees will be entitled to termination benefits and the amounts can be reasonably estimated. The liability related to these actions is included in accrued and other current liabilities in the
Consolidated Statements of Financial Position
.
The following table sets forth the activity related to the Company's severance liability for the respective periods:
|
|
Severance Costs
|
||
|
|
(in millions)
|
||
|
Balance as of January 30, 2015
|
$
|
95
|
|
|
Severance charges to provision
|
20
|
|
|
|
Cash paid and other
|
(89
|
)
|
|
|
Balance as of January 29, 2016
|
26
|
|
|
|
Severance liability assumed through EMC merger transaction
|
70
|
|
|
|
Severance charges to provision
|
541
|
|
|
|
Cash paid and other
|
(221
|
)
|
|
|
Balance as of February 3, 2017
|
416
|
|
|
|
Severance charges to provision
|
159
|
|
|
|
Cash paid and other
|
(400
|
)
|
|
|
Balance as of February 2, 2018
|
$
|
175
|
|
Severance costs are included in cost of net revenue, selling, general, and administrative expenses, and research and development expenses in the Consolidated Statements of Income (Loss) as follows:
|
Fiscal Year Ended
|
|||||||||||
|
February 2, 2018
|
February 3, 2017
|
January 29, 2016
|
|||||||||
|
(in millions)
|
|||||||||||
|
Severance charges:
|
|||||||||||
|
Cost of net revenue
|
$
|
46
|
|
$
|
122
|
|
$
|
1
|
|
||
|
Selling, general, and administrative
|
46
|
|
355
|
|
(1
|
)
|
|||||
|
Research and development
|
67
|
|
64
|
|
20
|
|
|||||
|
Total
|
$
|
159
|
|
$
|
541
|
|
$
|
20
|
|
||
126
NOTE 13
—
COMMITMENTS AND CONTINGENCIES
Lease Commitments
The Company leases property and equipment, manufacturing facilities, and office space under non-cancelable leases. Certain of these leases obligate the Company to pay taxes, maintenance, and repair costs. As of
February 2, 2018
future minimum lease payments under these non-cancelable leases were as follows:
$405 million
in
Fiscal 2019
;
$345 million
in
Fiscal 2020
;
$275 million
in
Fiscal 2021
;
$204 million
in
Fiscal 2022
;
$131 million
in
Fiscal 2023
; and
$700 million
thereafter.
The amount of the future lease commitments after Fiscal 2023 is primarily for the ground leases on VMware Inc.'s Palo Alto, California headquarter facilities, which expire in Fiscal 2047.
For the fiscal years ended
February 2, 2018, February 3, 2017, and January 29, 2016
, rent expense under all leases totaled
$571 million
,
$279 million
, and
$91 million
, respectively.
Purchase Obligations
The Company has contractual obligations to purchase goods or services, which specify significant terms, including fixed or minimum quantities to be purchased; fixed, minimum, or variable price provisions; and the approximate timing of the transaction. As of
February 2, 2018
, purchase obligations were
$3,046 million
,
$219 million
, and
$256 million
for
Fiscal 2019
,
Fiscal 2020
, and
Fiscal 2021 and thereafter
, respectively.
Legal Matters
The Company is involved in various claims, suits, assessments, investigations, and legal proceedings that arise from time to time in the ordinary course of its business, including those identified below, consisting of matters involving consumer, antitrust, tax, intellectual property, and other issues on a global basis. The Company accrues a liability when it believes that it is both probable that a liability has been incurred and that it can reasonably estimate the amount of the loss. The Company reviews these accruals at least quarterly and adjusts them to reflect ongoing negotiations, settlements, rulings, advice of legal counsel, and other relevant information. To the extent new information is obtained and the Company's views on the probable outcomes of claims, suits, assessments, investigations, or legal proceedings change, changes in the Company's accrued liabilities would be recorded in the period in which such a determination is made. For some matters, the amount of liability is not probable or the amount cannot be reasonably estimated and therefore accruals have not been made. The following is a discussion of the Company's significant legal matters and other proceedings:
127
EMC Merger Litigation
— The Company, Dell, and Universal Acquisition Co. ("Universal") were named as defendants in
fifteen
putative class-action lawsuits brought by purported EMC shareholders and VMware, Inc. stockholders challenging the proposed merger between the Company, Dell, and Universal on the one hand, and EMC on the other (the "EMC merger"). Those suits are captioned as follows:
|
Case
|
Court
|
Filing Date
|
|
|
1.
|
IBEW Local No. 129 Benefit Fund v. Tucci
,
Civ. No. 1584-3130-BLS1
|
Mass. Superior Court, Suffolk County
|
10/15/2015
|
|
2.
|
Barrett v. Tucci
,
Civ. No. 15-6023-A
|
Mass. Superior Court, Middlesex County
|
10/16/2015
|
|
3.
|
Graulich v. Tucci
,
Civ. No. 1584-3169-BLS1
|
Mass. Superior Court, Suffolk County
|
10/19/2015
|
|
4.
|
Vassallo v. EMC Corp.
,
Civ. No. 1584-3173-BLS1
|
Mass. Superior Court, Suffolk County
|
10/19/2015
|
|
5.
|
City of Miami Police Relief & Pension Fund v. Tucci
,
Civ. No. 1584-3174-BLS1
|
Mass. Superior Court, Suffolk County
|
10/19/2015
|
|
6.
|
Lasker v. EMC Corp.
,
Civ. No. 1584-3214-BLS1
|
Mass. Superior Court, Suffolk County
|
10/23/2015
|
|
7.
|
Walsh v. EMC Corp.
,
Civ. No. 15-13654
|
U.S. District Court,
District of Massachusetts
|
10/27/2015
|
|
8.
|
Local Union No. 373 U.A. Pension Plan v. EMC Corp.
,
Civ. No. 1584-3253-BLS1
|
Mass. Superior Court, Suffolk County
|
10/28/2015
|
|
9.
|
City of Lakeland Emps.' Pension & Ret. Fund v. Tucci
,
Civ. No. 1584-3269-BLS1 |
Mass. Superior Court, Suffolk County
|
10/28/2015
|
|
10.
|
Ma v. Tucci
,
Civ. No. 1584-3281-BLS1
|
Mass. Superior Court, Suffolk County
|
10/29/2015
|
|
11.
|
Stull v. EMC Corp.
,
Civ. No. 15-13692
|
U.S. District Court,
District of Massachusetts
|
10/30/2015
|
|
12.
|
Jacobs v. EMC Corp.
,
Civ. No. 15-6318-H
|
Mass. Superior Court, Middlesex County
|
11/12/2015
|
|
13.
|
Ford v. VMware, Inc.
,
C.A. No. 11714-VCL
|
Delaware Chancery Court
|
11/17/2015
|
|
14.
|
Pancake v. EMC Corp.
,
Civ. No. 16-10040
|
U.S. District Court,
District of Massachusetts
|
1/11/2016
|
|
15.
|
Booth Family Trust v. EMC Corp.
,
Civ. No. 16-10114
|
U.S. District Court,
District of Massachusetts
|
1/26/2016
|
The
fifteen
lawsuits sought, among other things, injunctive relief enjoining the EMC merger, rescission of the EMC merger if consummated, an award of fees and costs, and/or an award of damages.
The complaints in the IBEW, Barrett, Graulich, Vassallo, City of Miami, Lasker, Local Union No. 373, City of Lakeland, and Ma actions generally allege that the EMC directors breached their fiduciary duties to EMC shareholders in connection with the EMC merger by, among other things, failing to maximize shareholder value and agreeing to provisions in the EMC merger agreement that discouraged competing bids. After consolidating the
fifteen
complaints, by decision dated December 7, 2015, the Business Litigation Session of the Suffolk County Superior Court in Massachusetts dismissed all
nine
complaints for failure to make a demand on the EMC board of directors.
Three
of the
nine
plaintiffs in the consolidated actions appealed the judgment dismissing their complaints. The Massachusetts Supreme Judicial Court granted an application for direct appellate review, and heard oral argument on the appeal on November 7, 2016. On March 6, 2017, the Supreme Judicial Court issued a decision affirming the dismissal. This decision terminated the consolidated actions.
The complaints in the Walsh, Stull, Pancake, and Booth actions allege that the EMC directors breached their fiduciary duties to EMC shareholders in connection with the EMC merger by, among other things, failing to maximize shareholder value and agreeing to provisions in the EMC merger agreement that discouraged competing bids. The complaints generally further allege that the preliminary registration statement on Form S-4 filed by the Company on
128
December 14, 2015, in connection with the transaction contained material misstatements and omissions, in violation of Section 14(a) of the Securities Exchange Act of 1934 (the "Exchange Act") and SEC Rule 14a-9 promulgated thereunder and that the Company, Dell, and Universal acted as controlling persons of EMC under Section 20(a) of the Exchange Act. On June 6, 2016, the Securities and Exchange Commission declared effective the Company's registration statement on Form S-4 relating to the EMC merger (the "SEC Form S-4"), including the amendments thereto. On June 17, 2016, the parties to the Walsh, Stull, Pancake, and Booth actions submitted to the Court a Stipulation and Proposed Order Dismissing Action and Retaining Jurisdiction to Determine Plaintiffs' Counsel's Application for an Award of Attorneys' Fees and Reimbursement of Expenses. In the stipulation, the plaintiffs represented to the Court that they believe sufficient information had been disclosed to warrant dismissal of the actions as moot in light of the disclosures in the SEC Form S-4, including the amendments thereto. On October 25, 2016, following an agreement between the parties with respect to payment of attorneys' fees and expenses, the Court entered an order terminating the
four
actions for all purposes.
The amended complaints in the Jacobs and Ford actions allege that EMC, as the majority stockholder of VMware, Inc., and the individual defendants, who were directors of EMC, VMware, Inc., or both, breached their fiduciary duties to minority stockholders of VMware, Inc. in connection with the proposed EMC merger by allegedly entering into or approving a merger that favors the interests of EMC and Dell at the expense of the minority stockholders. The plaintiffs in the Jacobs action also brought suit against the Company, Dell, and Universal as alleged aiders and abettors. Effective December 2, 2016, the parties entered into an agreement to resolve the Jacobs action, pursuant to which the plaintiff voluntarily dismissed the action with prejudice. Under the operative amended complaint in the Ford action, the plaintiffs also brought suit against the Company and Dell for alleged breach of fiduciary duties to VMware, Inc. and its stockholders, and against the Company, Dell, and Universal for aiding and abetting the alleged breach of fiduciary duties by EMC's and VMware, Inc.'s directors. Certain defendants filed motions to dismiss the amended complaint on June 21, 2016. A hearing on those motions was held on February 3, 2017. On May 2, 2017, the Court dismissed the amended complaint for failure to state a claim upon which relief could be granted and no appeal was taken. All
fifteen
EMC merger-related lawsuits are now fully and finally resolved.
Appraisal Proceedings
— On October 29, 2013, Dell Technologies acquired Dell in a transaction referred to as the going-private transaction. Holders of shares of Dell common stock who did not vote on September 12, 2013 in favor of the proposal to adopt the amended going-private transaction agreement and who properly demanded appraisal of their shares and who otherwise comply with the requirements of Section 262 of the Delaware General Corporate Law ("DGCL") are entitled to seek appraisal for, and obtain payment in cash for the judicially determined "fair value" (as defined pursuant to Section 262 of the DGCL) of, their shares in lieu of receiving the going-private transaction consideration. Dell initially recorded a liability of
$13.75
for each share with respect to which appraisal has been demanded and as to which the demand has not been withdrawn, together with interest at the statutory rate discussed below. This liability was approximately
$129 million
as of both
February 2, 2018
and
February 3, 2017
. The Court of Chancery ruled that the fair value of the appraisal shares as of October 29, 2013, the date on which the going-private transaction became effective, was
$17.62
per share. This ruling would entitle the holders of the remaining
5,505,630
shares subject to the appraisal proceedings to
$17.62
per share, plus interest at a statutory rate, compounded quarterly. On November 21, 2016, the Court of Chancery entered final judgment in the appraisal action. On November 22, 2016, Dell filed a notice of appeal to the Delaware Supreme Court, which issued a decision on December 14, 2017. In its decision, the Delaware Supreme Court reversed, in part, and affirmed, in part, the decision of the Delaware Court of Chancery. On January 2, 2018, the Delaware Supreme Court issued its formal mandate remanding the matter to the Court of Chancery for further proceedings consistent with its opinion. In accordance with direction by the Court of Chancery, the parties have submitted proposals to the Court of Chancery outlining the remaining issues to be adjudicated and a schedule for resolving those issues. The Company believes it was adequately reserved for the appraisal proceedings as of
February 2, 2018
.
Securities Litigation
— On May 22, 2014, a securities class action seeking compensatory damages was filed in the United States District Court for the Southern District of New York, captioned the City of Pontiac Employee Retirement
System vs. Dell Inc. et. al. (Case No. 1:14-cv-03644). The action names as defendants Dell Inc. and certain current and former executive officers, and alleges that Dell made false and misleading statements about Dell's business operations and products between February 22, 2012 and May 22, 2012, which resulted in artificially inflated stock prices. The case was transferred to the United States District Court for the Western District of Texas, where the defendants filed a motion to dismiss. On September 16, 2016, the Court denied the motion to dismiss and the case is
129
proceeding with discovery. The defendants believe the claims asserted are without merit and the risk of material loss is remote.
Copyright Levies
— The Company's obligation to collect and remit copyright levies in certain European Union ("EU") countries may be affected by the resolution of legal proceedings pending in Germany and other EU member states against various companies, including Dell subsidiaries. The plaintiffs in those proceedings generally seek to impose or modify the levies with respect to sales of such equipment as multifunction devices, phones, personal computers, storage devices, and printers, alleging that such products enable the copying of copyrighted materials. Some of the proceedings also challenge whether the levy schemes in those countries comply with EU law. Certain EU member countries that do not yet impose levies on digital devices are expected to implement legislation to enable them to extend existing levy schemes, while some other EU member countries are expected to limit the scope of levy schemes and their applicability in the digital hardware environment. Dell, other companies, and various industry associations have opposed the extension of levies to the digital environment and have advocated alternative models of compensation to rights holders. The Company continues to collect levies in certain EU countries where it has determined that based on local laws it is probable that it has a payment obligation. The amount of levies is generally based on the number of products sold and the per-product amounts of the levies, which vary. The Company accrues a liability when it believes that it is both probable that a loss has been incurred and when it can reasonably estimate the amount of the loss.
Other Litigation
— The various legal proceedings in which Dell is involved include commercial litigation and a variety of patent suits. In some of these cases, Dell is the sole defendant. More often, particularly in the patent suits, Dell is one of a number of defendants in the electronics and technology industries. Dell is actively defending a number of patent infringement suits, and several pending claims are in various stages of evaluation. While the number of patent cases varies over time, Dell does not currently anticipate that any of these matters will have a material adverse effect on its business, financial condition, results of operations, or cash flows.
As of
February 2, 2018
,
the Company does not believe there is a reasonable possibility that a material loss exceeding the amounts already accrued for these or other proceedings or matters has been incurred.
However, since the ultimate resolution of any such proceedings and matters is inherently unpredictable, the Company's business, financial condition, results of operations, or cash flows could be materially affected in any particular period by unfavorable outcomes in one or more of these proceedings or matters. Whether the outcome of any claim, suit, assessment, investigation, or legal proceeding, individually or collectively, could have a material adverse effect on the Company's business, financial condition, results of operations, or cash flows will depend on a number of variables, including the nature, timing, and amount of any associated expenses, amounts paid in settlement, damages, or other remedies or consequences.
Indemnifications
In the ordinary course of business, the Company enters into contractual arrangements under which it may agree to indemnify the third party to such arrangements from any losses incurred relating to the services it performs on behalf of the Company or for losses arising from certain events as defined in the particular contract, such as litigation or claims relating to past performance. Such indemnification obligations may not be subject to maximum loss clauses. Historically, payments related to these indemnifications have not been material to the Company.
In connection with the divestitures discussed in
Note 4
of the
Notes to the Consolidated Financial Statements
, the Company has indemnified the purchasers of businesses for the occurrence of specified events. The Company does not currently believe that contingent obligations to provide indemnification in connection with these divestitures will have a material adverse effect on the Company.
Certain Concentrations
The Company maintains cash and cash equivalents, derivatives, and certain other financial instruments with various financial institutions that potentially subject it to concentration of credit risk. As part of its risk management processes, the Company performs periodic evaluations of the relative credit standing of these financial institutions. The Company has not sustained material credit losses from instruments held at these financial institutions. Further, the Company does not anticipate nonperformance by any of the counterparties.
130
The Company markets and sells its products and services to large corporate clients, governments, and health care and education accounts, as well as to small and medium-sized businesses and individuals. No single customer accounted for more than 10% of the Company's consolidated net revenue during the fiscal year ended
February 2, 2018
,
February 3, 2017
, or January 29, 2016.
The Company utilizes a limited number of contract manufacturers who assemble a portion of its products. The Company may purchase components from suppliers and sell those components to the contract manufacturers, thereby creating receivable balances from the contract manufacturers. The agreements with the majority of the contract manufacturers allow the Company a legal right to offset its payables against these receivables, thus mitigating the credit risk wholly or in part. Receivables from the Company's four largest contract manufacturers represented the majority of the gross non-trade receivables of
$3.3 billion
and
$2.7 billion
as of
February 2, 2018
and
February 3, 2017
, respectively, of which
$2.8 billion
and
$2.2 billion
as of
February 2, 2018
and
February 3, 2017
, respectively, have been offset against the corresponding payables. The portion of receivables not offset against payables is included in other current assets in the Consolidated Statement of Financial Position. The Company does not reflect the sale of the components in revenue and does not recognize any profit on the component sales until the related products are sold.
131
NOTE 14
—
INCOME AND OTHER TAXES
On December 22, 2017, the Tax Cuts and Jobs Act of 2017 (“U.S. Tax Reform” or the “Act”) was signed into law. Among other things, U.S. Tax Reform lowers the U.S. corporate income tax rate to 21% from 35% and establishes a modified territorial system requiring a mandatory deemed repatriation tax on undistributed earnings of foreign subsidiaries (the “Transition Tax”). For Fiscal 2019, U.S. Tax Reform also requires a minimum tax on certain future earnings generated by foreign subsidiaries while providing for future tax-free repatriation of earnings through a 100% dividends-received deduction, and places limitations on the deductibility of net interest expense.
GAAP requires the effect of a change in tax laws to be recognized in the period that includes the enactment date. Due to the complexities involved in accounting for the enactment of U.S. Tax Reform, the SEC staff issued Staff Accounting Bulletin No. 118 (“SAB 118”), which allows companies to record provisional amounts in earnings for the first year following the Act's enactment, with those provisional amounts required to be finalized by the end of that year. In accordance with GAAP and SAB 118, the Company recognized a provisional tax benefit in the fourth quarter of Fiscal 2018 of
$0.3 billion
related to U.S. Tax Reform, primarily driven by a
$1.3 billion
tax benefit related to the remeasurement of deferred tax assets and liabilities, offset by
$1.0 billion
current and future income tax expenses related to the Transition Tax. The Company’s provisional estimates are based on its initial analysis using available information and estimates. Given the significant complexity of U.S. Tax Reform, anticipated guidance from the U.S. Treasury, the potential for additional guidance from the SEC or the FASB related to the Act, or additional information becoming available, in accordance with SAB 118, the Company’s provisional benefit may be adjusted during Fiscal 2019 and will be finalized no later than the fourth quarter of Fiscal 2019. Revisions to the Company’s provisional estimates may be material to the Company.
The Company's provision for income taxes for the fiscal periods reflected in the Consolidated Financial Statements are not directly comparable primarily due to U.S. Tax Reform in Fiscal 2018 as well as purchase accounting adjustments, interest charges, and stock-based compensation charges incurred as a result of the EMC merger transaction that was completed in Fiscal 2017. For more information regarding the EMC merger transaction, see
Note 3
of the
Notes to the Consolidated Financial Statements
.
The provision (benefit) for income taxes from continuing operations consisted of the following for the respective periods:
|
Fiscal Year Ended
|
|||||||||||
|
February 2, 2018
|
February 3, 2017
|
January 29, 2016
|
|||||||||
|
(in millions)
|
|||||||||||
|
Current:
|
|||||||||||
|
Federal
|
$
|
52
|
|
$
|
(139
|
)
|
$
|
(174
|
)
|
||
|
State/local
|
111
|
|
46
|
|
(2
|
)
|
|||||
|
Foreign
|
599
|
|
322
|
|
228
|
|
|||||
|
Current
|
762
|
|
229
|
|
52
|
|
|||||
|
Deferred:
|
|||||||||||
|
Federal
|
(2,301
|
)
|
(1,676
|
)
|
(119
|
)
|
|||||
|
State/local
|
(156
|
)
|
(120
|
)
|
(15
|
)
|
|||||
|
Foreign
|
(138
|
)
|
(52
|
)
|
(36
|
)
|
|||||
|
Deferred
|
(2,595
|
)
|
(1,848
|
)
|
(170
|
)
|
|||||
|
Provision (benefit) for income taxes
|
$
|
(1,833
|
)
|
$
|
(1,619
|
)
|
$
|
(118
|
)
|
||
132
The Company's income (loss) from continuing operations before income taxes consisted of the following for the respective periods:
|
Fiscal Year Ended
|
|||||||||||
|
February 2, 2018
|
February 3, 2017
|
January 29, 2016
|
|||||||||
|
(in millions)
|
|||||||||||
|
Domestic
|
$
|
(6,494
|
)
|
$
|
(7,173
|
)
|
$
|
(3,498
|
)
|
||
|
Foreign
|
806
|
|
1,817
|
|
2,212
|
|
|||||
|
Loss from continuing operations before income taxes
|
$
|
(5,688
|
)
|
$
|
(5,356
|
)
|
$
|
(1,286
|
)
|
||
A reconciliation of the Company's income tax benefit from continuing operations to the statutory U.S. federal tax rate is as follows:
|
Fiscal Year Ended
|
||||||||
|
February 2, 2018
|
February 3, 2017
|
January 29, 2016
|
||||||
|
U.S. federal statutory rate
|
33.7
|
%
|
35.0
|
%
|
35.0
|
%
|
||
|
State income taxes, net of federal tax benefit
|
2.7
|
|
2.7
|
|
1.9
|
|
||
|
Tax impact of foreign operations
|
(8.0
|
)
|
(4.9
|
)
|
(33.4
|
)
|
||
|
Change in valuation allowance impacting tax rate and non-deductible operating losses
|
(1.7
|
)
|
(1.1
|
)
|
4.2
|
|
||
|
U.S. Tax Reform
|
5.6
|
|
—
|
|
—
|
|
||
|
IRS tax audit settlement
|
—
|
|
5.5
|
|
—
|
|
||
|
Vendor and other settlements
|
0.4
|
|
0.5
|
|
2.5
|
|
||
|
Non-deductible transaction-related costs
|
—
|
|
(2.1
|
)
|
(0.6
|
)
|
||
|
Other
|
(0.5
|
)
|
(5.4
|
)
|
(0.4
|
)
|
||
|
Total
|
32.2
|
%
|
30.2
|
%
|
9.2
|
%
|
||
A portion of the Company's operations is subject to a reduced tax rate or is free of tax under various tax holidays. For the fiscal years ended
February 2, 2018
,
February 3, 2017
, and
January 29, 2016
, the income tax benefits attributable to the tax status of the affected subsidiaries were estimated to be approximately
$238 million
(
$0.42
per share of DHI Group Common Stock),
$369 million
(
$0.79
per share of DHI Group Common Stock), and
$205 million
(
$0.51
per share of DHI Group Common Stock), respectively. These income tax benefits are included in tax impact of foreign operations in the table above. Although a significant portion of these income tax benefits relate to a tax holiday that expired during the fiscal year ended February 3, 2017, the Company has negotiated new terms for the affected subsidiary. These new terms provide for a reduced income tax rate and will be effective for a
two
-year bridge period expiring at the end of Fiscal 2019. The Company is currently seeking new terms for the affected subsidiary beyond Fiscal 2019 and it is uncertain whether any terms will be agreed upon. The Company's other tax holidays will expire in whole or in part during Fiscal 2019 through Fiscal 2023. Many of these tax holidays and reduced tax rates may be extended when certain conditions are met or may be terminated early if certain conditions are not met.
Prior to U.S. Tax Reform, the Company had not provided deferred taxes on undistributed earnings and other outside basis differences of its foreign subsidiaries as it was the Company's intention for these basis differences to remain indefinitely reinvested. U.S. Tax Reform fundamentally changes the U.S. approach to taxation of foreign earnings to a partial territorial tax system, which generally allows companies to make distributions of non-U.S. earnings to the United States without incurring additional U.S. tax. Additionally, as a result of the Transition Tax, substantially all of the Company’s undistributed earnings as of December 31, 2017 will not be subject to further U.S. federal income taxation. As a result, as of February 2, 2018, the Company intends to repatriate certain foreign earnings that have been taxed in the United States to the extent the foreign earnings are not restricted by local laws and can be accessed in a cost-effective manner. The Company recorded an immaterial deferred tax liability for the additional non-U.S. taxes which are expected to be incurred related to the repatriation of these earnings.
133
The Company carries other outside basis differences in its subsidiaries, primarily arising from purchase accounting adjustments, undistributed earnings that are considered indefinitely reinvested, and foreign earnings that are restricted by local laws or are cost prohibitive for repatriation. As of February 2, 2018, the Company has not recognized deferred income tax on
$68.2 billion
of outside basis differences because it has the intent and ability to indefinitely reinvest these basis differences. These basis differences could be reversed through a sale of the subsidiaries or the receipt of dividends from the subsidiaries, as well as various other events, none of which are considered probable as of the date of the Company’s annual report on Form 10‑K for the fiscal year ended February 2, 2018. Determination of the amount of unrecognized deferred income tax liability related to these outside basis differences is not practicable.
The components of the Company's net deferred tax assets (liabilities) were as follows as of
February 2, 2018
and
February 3, 2017
:
|
February 2, 2018
|
February 3, 2017
|
||||||
|
(in millions)
|
|||||||
|
Deferred tax assets:
|
|||||||
|
Deferred revenue and warranty provisions
|
$
|
1,447
|
|
$
|
1,955
|
|
|
|
Provisions for product returns and doubtful accounts
|
115
|
|
131
|
|
|||
|
Credit carryforwards
|
540
|
|
511
|
|
|||
|
Loss carryforwards
|
509
|
|
372
|
|
|||
|
Operating and compensation related accruals
|
604
|
|
765
|
|
|||
|
Other
|
122
|
|
262
|
|
|||
|
Deferred tax assets
|
3,337
|
|
3,996
|
|
|||
|
Valuation allowance
|
(815
|
)
|
(737
|
)
|
|||
|
Deferred tax assets, net of valuation allowance
|
2,522
|
|
3,259
|
|
|||
|
Deferred tax liabilities:
|
|||||||
|
Leasing and financing
|
(178
|
)
|
(109
|
)
|
|||
|
Property and equipment
|
(483
|
)
|
(743
|
)
|
|||
|
Acquired intangibles
|
(4,004
|
)
|
(7,281
|
)
|
|||
|
Other
|
(194
|
)
|
(38
|
)
|
|||
|
Deferred tax liabilities
|
(4,859
|
)
|
(8,171
|
)
|
|||
|
Net deferred tax assets (liabilities)
|
$
|
(2,337
|
)
|
$
|
(4,912
|
)
|
|
134
The tables below summarize the net operating loss carryforwards, tax credit carryforwards, and other deferred tax assets with related valuation allowances recognized as of
February 2, 2018
and
February 3, 2017
:
|
February 2, 2018
|
|||||||||||||
|
Deferred Tax Assets
|
Valuation Allowance
|
Net Deferred Tax Assets
|
First Year Expiring
|
||||||||||
|
(in millions)
|
|||||||||||||
|
Credit carryforwards
|
$
|
540
|
|
$
|
(366
|
)
|
$
|
174
|
|
Fiscal 2019
|
|||
|
Loss carryforwards
|
509
|
|
(279
|
)
|
230
|
|
Fiscal 2019
|
||||||
|
Other deferred tax assets
|
2,288
|
|
(170
|
)
|
2,118
|
|
NA
|
||||||
|
Total
|
$
|
3,337
|
|
$
|
(815
|
)
|
$
|
2,522
|
|
||||
|
February 3, 2017
|
|||||||||||||
|
Deferred Tax Assets
|
Valuation Allowance
|
Net Deferred Tax Assets
|
First Year Expiring
|
||||||||||
|
(in millions)
|
|||||||||||||
|
Credit carryforwards
|
$
|
511
|
|
$
|
(406
|
)
|
$
|
105
|
|
Fiscal 2018
|
|||
|
Loss carryforwards
|
372
|
|
(205
|
)
|
167
|
|
Fiscal 2018
|
||||||
|
Other deferred tax assets
|
3,113
|
|
(126
|
)
|
2,987
|
|
NA
|
||||||
|
Total
|
$
|
3,996
|
|
$
|
(737
|
)
|
$
|
3,259
|
|
||||
The Company's credit carryforwards as of February 2, 2018 and February 3, 2017 relate primarily to U.S. tax credits. The Company had deferred tax assets related to federal, state, and foreign net operating loss carryforwards of
$96 million
,
$172 million
, and
$241 million
, respectively, as of
February 2, 2018
, and
$132 million
,
$62 million
, and
$178 million
, respectively, as of
February 3, 2017
. The valuation allowances for other deferred tax assets as of
February 2, 2018
and
February 3, 2017
are primarily related to foreign jurisdictions. The Company has determined that it will be able to realize the remainder of its deferred tax assets, based on the future reversal of deferred tax liabilities.
A reconciliation of the Company's beginning and ending balance of unrecognized tax benefits is as follows:
|
Fiscal Year Ended
|
|||||||||||
|
February 2, 2018
|
February 3, 2017
|
January 29, 2016
|
|||||||||
|
(in millions)
|
|||||||||||
|
Balance, beginning of year
|
$
|
2,752
|
|
$
|
2,479
|
|
$
|
2,455
|
|
||
|
Unrecognized tax benefits assumed through EMC merger transaction
|
—
|
|
558
|
|
—
|
|
|||||
|
Increases related to tax positions of the current year
|
155
|
|
116
|
|
70
|
|
|||||
|
Increases related to tax position of prior years
|
98
|
|
227
|
|
52
|
|
|||||
|
Reductions for tax positions of prior years
|
(90
|
)
|
(379
|
)
|
(61
|
)
|
|||||
|
Lapse of statute of limitations
|
(34
|
)
|
(30
|
)
|
(24
|
)
|
|||||
|
Audit settlements
|
(14
|
)
|
(219
|
)
|
(13
|
)
|
|||||
|
Balance, end of year
|
$
|
2,867
|
|
$
|
2,752
|
|
$
|
2,479
|
|
||
During the fiscal year ended
February 3, 2017
, the Company acquired
$558
million of unrecognized tax benefits in connection with the EMC merger transaction. The Company's net unrecognized tax benefits were
$3.2 billion
and
$3.1 billion
as of
February 2, 2018
and
February 3, 2017
, respectively, and are included
in other non-current liabilities in the Consolidated Statements of Financial Position.
The unrecognized tax benefits in the table above include
$2.2 billion
and
$2.3 billion
as of
February 2, 2018
and
February 3, 2017
, respectively, that, if recognized, would have impacted income tax expense. The table does not include accrued interest
135
and penalties of
$860 million
and
$737 million
as of
February 2, 2018
and
February 3, 2017
, respectively. Tax benefits associated with interest and state tax deductions and other indirect jurisdictional effects of uncertain tax positions were
$537 million
and
$286 million
as of February 2, 2018 and February 3, 2017, respectively. Interest and penalties related to income tax liabilities are included in income tax expense. The Company recorded interest and penalties of
$184 million
,
$94 million
, and
$63 million
for the fiscal years ended
February 2, 2018
,
February 3, 2017
, and
January 29, 2016
, respectively.
Judgment is required in evaluating the Company's uncertain tax positions and determining the Company's provision for income taxes. The Company does not anticipate a significant change to the total amount of unrecognized tax benefits within the next twelve months.
During the fiscal year ended February 3, 2017, the Company closed the Internal Revenue Service ("IRS") audit for fiscal years 2004 through 2006. As a result, during Fiscal 2017, the Company recorded a net benefit to the provision for income taxes of
$297 million
.
The Company's U.S. federal income tax returns for fiscal years 2007 through 2009 are currently under consideration by the Office of Appeals of the IRS. The IRS issued a Revenue Agent's Report ("RAR") related to those years during the fiscal year ended February 3, 2017. The IRS has proposed adjustments primarily relating to transfer pricing matters with which the Company disagrees and will contest through the IRS administrative appeals procedures. In May 2017, the IRS commenced a federal income tax audit for fiscal years 2010 through 2014, which could take several years to complete. Prior to the EMC merger transaction, EMC received a RAR for its tax years 2009 and 2010. On May 5, 2017, EMC received an RAR for its tax year 2011. The Company also disagrees with certain proposed adjustments in these RARs and is currently contesting the proposed adjustments through the IRS administrative appeals process.
The Company is also currently under income tax audits in various state and foreign jurisdictions. The Company is undergoing negotiations, and in some cases contested proceedings, relating to tax matters with the taxing authorities in these jurisdictions. The Company believes that it has provided adequate reserves related to all matters contained in tax periods open to examination. Although the Company believes it has made adequate provisions for the uncertainties surrounding these audits, should the Company experience unfavorable outcomes, such outcomes could have a material impact on its results of operations, financial position, and cash flows. With respect to major U.S. state and foreign taxing jurisdictions, the Company is generally not subject to tax examinations for years prior to fiscal year 2007.
The Company takes certain non-income tax positions in the jurisdictions in which it operates and has received certain non-income tax assessments from various jurisdictions. The Company believes that a material loss in these matters is not probable and that it is not reasonably possible that a material loss exceeding amounts already accrued has been incurred. The Company believes its positions in these non-income tax litigation matters are supportable and that it ultimately will prevail in the matters. In the normal course of business, the Company's positions and conclusions related to its non-income taxes could be challenged and assessments may be made. To the extent new information is obtained and the Company's views on its positions, probable outcomes of assessments, or litigation change, changes in estimates to the Company's accrued liabilities would be recorded in the period in which such a determination is made. In the resolution process for income tax and non-income tax audits, in certain situations the Company will be required to provide collateral guarantees or indemnification to regulators and tax authorities until the matter is resolved.
136
NOTE 15
—
ACCUMULATED OTHER COMPREHENSIVE LOSS
Accumulated other comprehensive loss is presented in stockholders' equity in the Consolidated Statements of Financial Position and consists of amounts related to foreign currency translation adjustments, unrealized net gains (losses) on investments, unrealized net gains (losses) on cash flow hedges, and actuarial net gains (losses) from pension and other postretirement plans.
The following table presents changes in accumulated other comprehensive loss, net of tax, by the following components for the periods indicated:
|
Foreign Currency Translation Adjustments
|
Investments
|
Cash Flow Hedges
|
Pension and Other Postretirement Plans
|
Accumulated Other Comprehensive Loss
|
|||||||||||||||
|
(in millions)
|
|||||||||||||||||||
|
Balances as of January 30, 2015
|
$
|
(220
|
)
|
$
|
—
|
|
$
|
249
|
|
$
|
—
|
|
$
|
29
|
|
||||
|
Other comprehensive income (loss) before reclassifications
|
(138
|
)
|
—
|
|
152
|
|
—
|
|
14
|
|
|||||||||
|
Amounts reclassified from accumulated other comprehensive loss
|
—
|
|
—
|
|
(367
|
)
|
—
|
|
(367
|
)
|
|||||||||
|
Total change for the period
|
(138
|
)
|
—
|
|
(215
|
)
|
—
|
|
(353
|
)
|
|||||||||
|
Balances as of January 29, 2016
|
(358
|
)
|
—
|
|
34
|
|
—
|
|
(324
|
)
|
|||||||||
|
Other comprehensive income (loss) before reclassifications
|
(254
|
)
|
(17
|
)
|
20
|
|
19
|
|
(232
|
)
|
|||||||||
|
Amounts reclassified from accumulated other comprehensive loss
|
—
|
|
1
|
|
(43
|
)
|
—
|
|
(42
|
)
|
|||||||||
|
Total change for the period
|
(254
|
)
|
(16
|
)
|
(23
|
)
|
19
|
|
(274
|
)
|
|||||||||
|
Less: Change in comprehensive income (loss) attributable to non-controlling interests
|
—
|
|
(3
|
)
|
—
|
|
—
|
|
(3
|
)
|
|||||||||
|
Balances as of February 3, 2017
|
(612
|
)
|
(13
|
)
|
11
|
|
19
|
|
(595
|
)
|
|||||||||
|
Other comprehensive income (loss) before reclassifications
|
791
|
|
31
|
|
(248
|
)
|
13
|
|
587
|
|
|||||||||
|
Amounts reclassified from accumulated other comprehensive loss
|
—
|
|
2
|
|
134
|
|
—
|
|
136
|
|
|||||||||
|
Total change for the period
|
791
|
|
33
|
|
(114
|
)
|
13
|
|
723
|
|
|||||||||
|
Less: Change in comprehensive loss attributable to non-controlling interests
|
—
|
|
(2
|
)
|
—
|
|
—
|
|
(2
|
)
|
|||||||||
|
Balances as of February 2, 2018
|
$
|
179
|
|
$
|
22
|
|
$
|
(103
|
)
|
$
|
32
|
|
$
|
130
|
|
||||
Amounts related to investments are reclassified to net income when gains and losses are realized. See
Note 5
and
Note 6
of the
Notes to the Consolidated Financial Statements
for more information on the Company's investments. Amounts related to the Company's cash flow hedges are reclassified to net income during the same period in which the items being hedged are recognized in earnings. In addition, any hedge ineffectiveness related to cash flow hedges is recognized currently in net income. See
Note 9
of the
Notes to the Consolidated Financial Statements
for more information on the Company's derivative instruments.
137
The following table presents reclassifications out of accumulated other comprehensive loss, net of tax, to net income (loss) for the periods presented:
|
Fiscal Year Ended
|
|||||||||||||||||||||||
|
February 2, 2018
|
February 3, 2017
|
||||||||||||||||||||||
|
Investments
|
Cash Flow Hedges
|
Total
|
Investments
|
Cash Flow Hedges
|
Total
|
||||||||||||||||||
|
(in millions)
|
|||||||||||||||||||||||
|
Total reclassifications, net of tax:
|
|||||||||||||||||||||||
|
Net revenue
|
$
|
—
|
|
$
|
(77
|
)
|
$
|
(77
|
)
|
$
|
—
|
|
$
|
57
|
|
$
|
57
|
|
|||||
|
Cost of net revenue
|
—
|
|
(57
|
)
|
(57
|
)
|
—
|
|
(13
|
)
|
(13
|
)
|
|||||||||||
|
Interest and other, net
|
(2
|
)
|
—
|
|
(2
|
)
|
(1
|
)
|
(1
|
)
|
(2
|
)
|
|||||||||||
|
Total reclassifications, net of tax
|
$
|
(2
|
)
|
$
|
(134
|
)
|
$
|
(136
|
)
|
$
|
(1
|
)
|
$
|
43
|
|
$
|
42
|
|
|||||
138
NOTE 16
—
NON-CONTROLLING INTERESTS
VMware, Inc.
— The non-controlling interests' share of equity in VMware, Inc. is reflected as a component of the non-controlling interests in the accompanying Consolidated Statements of Financial Position and was
$5.1 billion
and
$5.2 billion
as of
February 2, 2018
and
February 3, 2017
, respectively. As of
February 2, 2018
and
February 3, 2017
, the Company held approximately
81.9%
and
82.5%
, respectively, of the outstanding equity interest in VMware, Inc. VMware, Inc. restricted stock awards ("RSAs") were not included in the determination of these ownership interest percentages, as VMware, Inc. had no RSAs outstanding as of
February 2, 2018
, and an immaterial number of RSAs outstanding as of
February 3, 2017
.
SecureWorks
— On April 27, 2016, SecureWorks completed a registered underwritten initial public offering of its Class A common stock. The non-controlling interests' share of equity in SecureWorks is reflected as a component of the non-controlling interests in the accompanying Consolidated Statements of Financial Position and was
$87 million
and
$86 million
as of
February 2, 2018
and
February 3, 2017
, respectively. As of
February 2, 2018
and
February 3, 2017
, the Company held approximately
87.1%
and
87.5%
, respectively, of the outstanding equity interest in SecureWorks, excluding RSAs. As of
February 2, 2018
and
February 3, 2017
, the Company held approximately
86.3%
and
86.9%
, respectively, of the outstanding equity interest in SecureWorks, including RSAs.
Pivotal
— A portion of the non-controlling interests in Pivotal is held by third parties in the form of preferred equity instruments. Due to the terms of such instruments, Pivotal's results of operations and equity activity are not attributable to such interests in Pivotal in the
Consolidated Statements of Income (Loss)
and
Consolidated Statements of Financial Position
. The preferred equity instruments are convertible into common shares at the non-controlling owner's election at any time. The remaining portion of the non-controlling interests in Pivotal is held by third parties in the form of common stock. Pivotal's results of operations and equity activity are attributable to such interests in Pivotal in the
Consolidated Statements of Income (Loss)
and
Consolidated Statements of Financial Position
. The non-controlling interests' share of equity in Pivotal, including both preferred equity instruments and common stock, is reflected as a component of the non-controlling interests in the accompanying Consolidated Statements of Financial Position and was
$489 million
and
$472 million
as of
February 2, 2018
and
February 3, 2017
, respectively. As of
February 2, 2018
and
February 3, 2017
, the Company held approximately
77.1%
and
77.8%
, respectively, of the outstanding equity interest in Pivotal. Pivotal RSAs were not included in the determination of these ownership interest percentages, as Pivotal had an immaterial number of RSAs outstanding as of
February 2, 2018
and
February 3, 2017
.
The effect of changes in the Company's ownership interest in VMware, Inc., SecureWorks, and Pivotal on the Company's equity was as follows:
|
Fiscal Year Ended
|
|||
|
February 2, 2018
|
|||
|
(in millions)
|
|||
|
Net loss attributable to Dell Technologies Inc.
|
$
|
(3,728
|
)
|
|
Transfers (to) from the non-controlling interests:
|
|||
|
Increase in Dell Technologies Inc. additional paid-in-capital for equity issuances and other equity activity
|
620
|
|
|
|
Decrease in Dell Technologies Inc. additional paid-in-capital for equity issuances and other equity activity
|
(855
|
)
|
|
|
Net transfers to non-controlling interests
|
(235
|
)
|
|
|
Change from net loss attributable to Dell Technologies Inc. and transfers to/from the non-controlling interests
|
$
|
(3,963
|
)
|
139
NOTE 17
—
EARNINGS (LOSS) PER SHARE
Basic earnings (loss) per share is based on the weighted-average effect of all common shares issued and outstanding and is calculated by dividing net income (loss) by the weighted-average shares outstanding during the period. Diluted earnings (loss) per share is calculated by dividing net income (loss) by the weighted-average number of common shares used in the basic earnings (loss) per share calculation plus the number of common shares that would be issued assuming exercise or conversion of all potentially dilutive instruments. The Company excludes equity instruments from the calculation of diluted earnings (loss) per share if the effect of including such instruments is antidilutive.
The Company has
two
groups of common stock, denoted as the DHI Group Common Stock and the Class V Common Stock. The DHI Group Common Stock consists of
four
classes of common stock, referred to as Class A Common Stock, Class B Common Stock, Class C Common Stock, and Class D Common Stock. The DHI Group generally refers to the direct and indirect interest of Dell Technologies in all of Dell Technologies' business, assets, properties, liabilities, and preferred stock other than those attributable to the Class V Group, as well as the DHI Group's retained interest in the Class V Group equal to approximately
39%
of the Company's economic interest in the Class V Group as of
February 2, 2018
. The Class V Common Stock is intended to track the economic performance of approximately
61%
of the Company's economic interest in the Class V Group as of such date. The Class V Group consists solely of VMware, Inc. common stock held by the Company. As of
February 2, 2018
, the Class V Group consisted of approximately
331 million
shares of VMware, Inc. common stock. See
Note 18
of the
Notes to the Consolidated Financial Statements
and Exhibit 99.1 filed with the annual report on Form 10-K for the fiscal year ended
February 2, 2018
for more information regarding the allocation of earnings from Dell Technologies' interest in VMware, Inc. between the DHI Group and the Class V Common Stock.
For purposes of calculating earnings (loss) per share, the Company used the two-class method. As all classes of DHI Group Common Stock share the same rights in dividends, basic and diluted earnings (loss) per share are the same for each class of DHI Group Common Stock.
The following table sets forth basic and diluted earnings (loss) per share for each of the periods presented:
|
|
Fiscal Year Ended
|
||||||||||
|
|
February 2, 2018
|
February 3, 2017
|
January 29, 2016
|
||||||||
|
(in millions)
|
|||||||||||
|
Earnings (loss) per share attributable to Dell Technologies Inc. - basic:
|
|||||||||||
|
Continuing operations - Class V Common Stock - basic
|
$
|
1.41
|
|
$
|
1.44
|
|
$
|
—
|
|
||
|
Continuing operations - DHI Group - basic
|
$
|
(7.08
|
)
|
$
|
(8.52
|
)
|
$
|
(2.88
|
)
|
||
|
Discontinued operations - DHI Group - basic
|
$
|
—
|
|
$
|
4.30
|
|
$
|
0.16
|
|
||
|
Earnings (loss) per share attributable to Dell Technologies Inc. - diluted:
|
|||||||||||
|
Continuing operations - Class V Common Stock - diluted
|
$
|
1.39
|
|
$
|
1.43
|
|
$
|
—
|
|
||
|
Continuing operations - DHI Group - diluted
|
$
|
(7.08
|
)
|
$
|
(8.52
|
)
|
$
|
(2.88
|
)
|
||
|
Discontinued operations - DHI Group - diluted
|
$
|
—
|
|
$
|
4.30
|
|
$
|
0.16
|
|
||
140
The following table sets forth the computation of basic and diluted earnings (loss) per share for each of the periods presented:
|
Fiscal Year Ended
|
|||||||||||
|
February 2, 2018
|
February 3, 2017
|
January 29, 2016
|
|||||||||
|
(in millions)
|
|||||||||||
|
Numerator: Continuing operations - Class V Common Stock
|
|||||||||||
|
Net income from continuing operations attributable to Class V Common Stock - basic
|
$
|
286
|
|
$
|
313
|
|
$
|
—
|
|
||
|
Incremental dilution from VMware, Inc. attributable to Class V Common Stock (a)
|
(4
|
)
|
(3
|
)
|
—
|
|
|||||
|
Net income from continuing operations attributable to Class V Common Stock - diluted
|
$
|
282
|
|
$
|
310
|
|
$
|
—
|
|
||
|
Numerator: Continuing operations - DHI Group
|
|||||||||||
|
Net loss from continuing operations attributable to DHI Group - basic
|
$
|
(4,014
|
)
|
$
|
(4,004
|
)
|
$
|
(1,168
|
)
|
||
|
Incremental dilution from VMware, Inc. attributable to DHI Group (a)
|
(3
|
)
|
(2
|
)
|
—
|
|
|||||
|
Net loss from continuing operations attributable to DHI Group - diluted
|
$
|
(4,017
|
)
|
$
|
(4,006
|
)
|
$
|
(1,168
|
)
|
||
|
Numerator: Discontinued operations - DHI Group
|
|||||||||||
|
Income from discontinued operations, net of income taxes - basic and diluted
|
$
|
—
|
|
$
|
2,019
|
|
$
|
64
|
|
||
|
Denominator: Class V Common Stock weighted-average shares outstanding
|
|
|
|
|
|
|
|||||
|
Weighted-average shares outstanding - basic
|
203
|
|
217
|
|
—
|
|
|||||
|
Dilutive effect of options, restricted stock units, restricted stock, and other (b)
|
—
|
|
—
|
|
—
|
|
|||||
|
Weighted-average shares outstanding - diluted
|
203
|
|
217
|
|
—
|
|
|||||
|
Weighted-average shares outstanding - antidilutive (b)
|
—
|
|
—
|
|
—
|
|
|||||
|
Denominator: DHI Group weighted-average shares outstanding
|
|||||||||||
|
Weighted-average shares outstanding - basic
|
567
|
|
470
|
|
405
|
|
|||||
|
Dilutive effect of options, restricted stock units, restricted stock, and other
|
—
|
|
—
|
|
—
|
|
|||||
|
Weighted-average shares outstanding - diluted
|
567
|
|
470
|
|
405
|
|
|||||
|
Weighted-average shares outstanding - antidilutive (c)
|
35
|
|
31
|
|
53
|
|
|||||
____________________
|
(a)
|
The incremental dilution from VMware, Inc. represents the impact of VMware, Inc.'s dilutive securities on the diluted earnings (loss) per share of the DHI Group and the Class V Common Stock, respectively, and is calculated by multiplying the difference between VMware, Inc.'s basic and diluted earnings (loss) per share by the number of shares of VMware, Inc. Class A common stock owned by the Company.
|
|
(b)
|
The dilutive effect of Class V Common Stock-based incentive awards was not material to the calculation of the weighted-average Class V Common Stock shares outstanding. The antidilutive effect of these awards was also not material.
|
|
(c)
|
Stock-based incentive awards have been excluded from the calculation of the DHI Group's diluted earnings (loss) per share because their effect would have been antidilutive, as the Company had a net loss from continuing operations attributable to the DHI Group for the periods presented.
|
141
The following table presents a reconciliation to the consolidated net income (loss) attributable to Dell Technologies Inc.:
|
Fiscal Year Ended
|
|||||||||||
|
February 2, 2018
|
February 3, 2017
|
January 29, 2016
|
|||||||||
|
Net income from continuing operations attributable to Class V Common Stock
|
$
|
286
|
|
$
|
313
|
|
$
|
—
|
|
||
|
Net loss from continuing operations attributable to DHI Group
|
(4,014
|
)
|
(4,004
|
)
|
(1,168
|
)
|
|||||
|
Net loss from continuing operations attributable to Dell Technologies Inc.
|
(3,728
|
)
|
(3,691
|
)
|
(1,168
|
)
|
|||||
|
Income from discontinued operations, net of income taxes (Note 4)
|
—
|
|
2,019
|
|
64
|
|
|||||
|
Net loss attributable to Dell Technologies Inc.
|
$
|
(3,728
|
)
|
$
|
(1,672
|
)
|
$
|
(1,104
|
)
|
||
142
NOTE 18
—
CAPITALIZATION
On June 26, 2017, the stockholders of the Company voted at the Company’s 2017 annual meeting of stockholders to adopt an amendment to the Company’s certificate of incorporation to increase (1) the total authorized number of shares of the Company’s capital stock, including preferred stock, from
2,144,025,308
shares to
9,144,025,308
shares, (2) the total authorized number of shares of the Company’s common stock from
2,143,025,308
shares to
9,143,025,308
shares and (3) the total authorized number of shares of the Company’s Class C Common Stock from
900,000,000
shares to
7,900,000,000
shares, in each case representing an increase of
seven billion
shares. A certificate of amendment to the Company’s certificate of incorporation effectuating the amendment was filed with the Secretary of State of the State of Delaware on June 29, 2017 and became effective on that date.
The following table summarizes the Company's authorized, issued, and outstanding common stock as of the dates indicated:
|
Authorized
|
Issued
|
Outstanding
|
||||||
|
(in millions of shares)
|
||||||||
|
Common stock as of February 3, 2017
|
||||||||
|
Class A
|
600
|
|
410
|
|
410
|
|
||
|
Class B
|
200
|
|
137
|
|
137
|
|
||
|
Class C
|
900
|
|
22
|
|
22
|
|
||
|
Class D
|
100
|
|
—
|
|
—
|
|
||
|
Class V
|
343
|
|
223
|
|
209
|
|
||
|
2,143
|
|
792
|
|
778
|
|
|||
|
Common stock as of February 2, 2018
|
||||||||
|
Class A
|
600
|
|
410
|
|
410
|
|
||
|
Class B
|
200
|
|
137
|
|
137
|
|
||
|
Class C
|
7,900
|
|
24
|
|
23
|
|
||
|
Class D
|
100
|
|
—
|
|
—
|
|
||
|
Class V
|
343
|
|
223
|
|
199
|
|
||
|
9,143
|
|
794
|
|
769
|
|
|||
Preferred Stock
— The Company is authorized to issue
one million
shares of preferred stock, par value
$.01
per share. As of
February 2, 2018
,
no
shares of preferred stock were issued or outstanding.
Common Stock
DHI Group Common Stock
and DHI Group
— The Class A Common Stock, the Class B Common Stock, the Class C Common Stock, and the Class D Common Stock are collectively referred to as the DHI Group Common Stock. The par value for all classes of DHI Group Common Stock is
$.01
per share. The Class A Common Stock, the Class B Common Stock, the Class C Common Stock, and the Class D Common Stock share equally in dividends declared or accumulated and have equal participation rights in undistributed earnings. The DHI Group generally refers to the direct and indirect interest of Dell Technologies in all of Dell Technologies' business, assets, properties, liabilities, and preferred stock other than those attributable to the Class V Group, as well as the DHI Group's retained interest in the Class V Group.
Of the
164 million
shares of DHI Group Common Stock issued during the fiscal year ended February 3, 2017 (other than in connection with the reclassification of the previously outstanding Series A, Series B, and Series C common stock of the Company),
160 million
shares were issued in connection with the EMC merger transaction. The Company issued and sold the following shares of DHI Group Common Stock at a purchase price of
$27.50
per share to the persons identified below for an aggregate purchase price of
$4.4 billion
, pursuant to
four
separate common stock purchase agreements:
|
•
|
86,909,091
shares of Class A Common Stock to Michael S. Dell and a separate property trust for the benefit of his wife
|
143
|
•
|
16,104,050
shares of Class A Common Stock to investment funds affiliated with MSD Partners, L.P.
|
|
•
|
38,805,040
shares of Class B Common Stock to investment funds affiliated with Silver Lake Partners
|
|
•
|
18,181,818
shares of Class C Common Stock to Temasek Holdings Private Limited
|
The Company applied the proceeds from the sale of the shares to finance a portion of the consideration for the EMC merger transaction.
Class V Common Stock and Class V Group
— In connection with the EMC merger transaction, the Company authorized
343 million
shares of Class V Common Stock. The Class V Common Stock is a type of common stock commonly referred to as a tracking stock, which is a class of common stock that is intended to track the economic performance of a defined set of assets and liabilities.
As of
February 2, 2018
, the
199 million
shares of outstanding Class V Common Stock were intended to track the economic performance of approximately
61%
of Dell Technologies' economic interest in the Class V Group. The Class V Group as of such date consisted solely of approximately
331 million
shares of VMware, Inc. common stock held by the Company. The remaining
39%
economic interest in the Class V Group as of
February 2, 2018
was represented by the approximately
127 million
retained interest shares held by the DHI Group.
Repurchases of Common Stock; Treasury Stock
Class V Common Stock Repurchases by Dell Technologies Inc.
— On September 7, 2016, the board of directors of the Company approved a stock repurchase program (the "DHI Group Repurchase Program") under which the Company is authorized to use assets of the DHI Group to repurchase up to
$1.0 billion
of shares of Class V Common Stock over a period of
two
years. During the fiscal year ended February 3, 2017, the Company repurchased
7 million
shares of Class V Common Stock for
$324 million
using cash of the DHI Group. Shares repurchased under the DHI Group Repurchase Program are being held as treasury stock at
cost.
On December 13, 2016, the board of directors approved the suspension of the DHI Group Repurchase Program until such time as the board of directors authorizes the reinstatement of that program.
As of February 2, 2018, the Company's remaining authorized amount for share repurchases under the DHI Group Repurchase Program was
$676 million
.
As cash of the DHI Group was used for Class V Common Stock repurchases under the DHI Group Repurchase Program, these repurchased shares were attributed to the DHI Group for the purposes of determining the DHI Group's retained interest in the Class V Group. As a result, the number of retained interest shares of the DHI Group, which, together with the number of shares of Class V Common Stock outstanding, are used to calculate such retained interest, increased on a one-for-one basis for each share of Class V Common Stock repurchased under the program.
On December 13, 2016, the board of directors approved a stock repurchase program (the "Class V Group Repurchase Program") which authorized the Company to use assets of the Class V Group to repurchase up to
$500 million
of shares of Class V Common Stock over a period of
six months
. During the fiscal year ended February 2, 2018, the Company repurchased
1.3 million
shares of Class V Common Stock for
$82 million
pursuant to and in completion of this initial authorization. The Company repurchased a total of
8.4 million
shares under this initial authorization, including shares repurchased during the fiscal year ended
February 3, 2017
.
On March 27, 2017 and August 18, 2017, the board of directors approved two amendments of the Class V Group Repurchase Program (the "March 2017 Class V Group Repurchase Program" and the “August 2017 Class V Group Repurchase Program,” respectively) which, when combined, authorized the Company to use assets of the Class V Group to repurchase up to an additional
$600 million
of shares of Class V Common Stock over additional six month periods from the respective board approval dates. On May 9, 2017, the Company completed the March 2017 Class V Group Repurchase Program, pursuant to which it repurchased
4.6 million
shares of Class V Common Stock for
$300 million
. On October 31, 2017, the Company completed the August 2017 Class V Group Repurchase Program, pursuant to which it repurchased
3.8 million
shares of Class V Common Stock for
$300 million
.
144
The following table presents the repurchase activity with respect to the Class V Common Stock for the
fiscal year ended February 2, 2018
, and the attribution of the Class V Group between the Class V Common Stock and the DHI Group's retained interest as of the dates indicated:
|
Class V Common Stock
|
DHI Group Retained Interest
|
||||||||||
|
Shares of Class V Common Stock
|
Interest in Class V Group
|
Retained Interest Shares
|
Interest in Class V Group
|
||||||||
|
As of September 7, 2016
|
223
|
|
65
|
%
|
120
|
|
35
|
%
|
|||
|
DHI Group Repurchase Program
|
(7
|
)
|
7
|
|
|||||||
|
Class V Group Repurchase Program
|
(7
|
)
|
—
|
|
|||||||
|
As of February 3, 2017
|
209
|
|
62
|
%
|
127
|
|
38
|
%
|
|||
|
Repurchases of Class V Common Stock
|
(10
|
)
|
—
|
|
|||||||
|
As of February 2, 2018
|
199
|
|
61
|
%
|
127
|
|
39
|
%
|
|||
All shares of Class V Common Stock repurchased by the Company pursuant to the repurchase programs are held as treasury stock at cost. The repurchase of shares pursuant to the Class V Group repurchase programs was funded from proceeds received by the Class V Group from the sale by a subsidiary of the Company of shares of Class A common stock of VMware, Inc. owned by such subsidiary, as described below under "Class A Common Stock Repurchases by VMware, Inc." Share repurchases made by VMware, Inc. of its Class A common stock from a subsidiary of the Company do not affect the determination of the respective interests of the Class V Common Stock and the DHI Group in the Class V Group. See Exhibit 99.1 filed with the annual report on Form 10-K for the fiscal year ended
February 2, 2018
for more information regarding Unaudited Attributed Financial Information for the Class V Group.
Class A Common Stock Repurchases by VMware, Inc.
— On December 15, 2016, the Company entered into a stock purchase agreement with VMware, Inc. (the "December 2016 Stock Purchase Agreement"), pursuant to which VMware, Inc. agreed to repurchase for cash
$500 million
of shares of VMware, Inc. Class A common stock from a subsidiary of the Company.
During the fiscal year ended February 2, 2018, VMware, Inc. repurchased
1.4 million
shares for
$125 million
pursuant to
and in completion of
the December 2016 Stock Purchase Agreement
.
VMware, Inc. repurchased a total of
6.2 million
shares under this agreement, including shares repurchased during the fiscal year ended
February 3, 2017
. The Company applied the proceeds from the sale to the repurchase of shares of its Class V Common Stock under the Class V Group Repurchase Program described above. All shares repurchased under VMware, Inc.'s stock repurchase programs are retired.
In January 2017 and August 2017, VMware, Inc.'s board of directors authorized the repurchase of up to
$2.2 billion
of shares of VMware, Inc. Class A common sto
ck (the "January 2017 Authorization" for up to
$1.2 billion
through the end of Fiscal 2018, and the "August 2017 Authorization" for up to
$1.0 billion
through August 31, 2018). On March 29, 2017 and August 23, 2017, the Company entered into two new stock purchase agreements with VMware, Inc. (the "March 2017 Stock Purchase Agreement" and the "August 2017 Stock Purchase Agreement," respectively), pursuant to which VMware, Inc. agreed to repurchase for cash a total of
$600 million
of shares of VMware, Inc. Class A common stock from a subsidiary of the Company. VMware, Inc. repurchased approximately
6.1 million
shares of Class A common stock, consisting of
3.4 million
shares pursuant to the March 2017 Stock Purchase Agreement and
2.7 million
shares pursuant to the August 2017 Stock Purchase Agreement. The proceeds from the sales were applied by the Company to the repurchase of shares of the Class V Common Stock under the March 2017 and August 2017 Class V Group Repurchase Programs described above. As of November 3, 2017, the sale transactions under the March 2017 and August 2017 Stock Purchase Agreements were completed. The purchase prices of the
3.4 million
shares and
2.7 million
shares repurchased by VMware, Inc. were e
ach based on separate volume-weighted average per share prices of the Class A common stock as reported on the New York Stock Exchange during separate specified reference periods, less a discount of
3.5%
from the respective volume-weighted average per share price.
During the fiscal year ended
February 2, 2018
, VMware, Inc. repurchased
6.4 million
shares of Class A common stock in the open market for
$724 million
.
As of
February 2, 2018
, the cumulative authorized amount remaining for share repurchases by VMware, Inc. was
$876 million
, which represents the
$2.2 billion
authorized since January 2017, less
$600 million
of the Class A common stock repurchases
145
from a subsidiary of the Company during the fiscal year ended
February 2, 2018
, and less
$724 million
of the Class A common stock repurchases in the open market during the fiscal year ended
February 2, 2018
.
DHI Group Common Stock Repurchases
— During the fiscal years ended
February 2, 2018
and
February 3, 2017
, the Company repurchased an immaterial number of shares of DHI Group Common Stock for approximately
$6 million
and
$10 million
, respectively.
146
NOTE 19
—
STOCK-BASED COMPENSATION
Stock-based Compensation Expense
Stock-based compensation expense for the Company was recognized in the Consolidated Statements of Income (Loss) as follows for the respective periods:
|
Fiscal Year Ended
|
|||||||||||
|
|
February 2, 2018
|
February 3, 2017
|
January 29, 2016
|
||||||||
|
|
(in millions)
|
||||||||||
|
Stock-based compensation expense (a) (b):
|
|
|
|||||||||
|
Cost of net revenue
|
$
|
66
|
|
$
|
35
|
|
$
|
10
|
|
||
|
Operating expenses
|
769
|
|
363
|
|
62
|
|
|||||
|
Stock-based compensation expense before taxes
|
835
|
|
398
|
|
72
|
|
|||||
|
Income tax benefit
|
(268
|
)
|
(122
|
)
|
(26
|
)
|
|||||
|
Stock-based compensation expense, net of income taxes
|
$
|
567
|
|
$
|
276
|
|
$
|
46
|
|
||
____________________
|
(a)
|
As a result of the EMC merger transaction, stock-based compensation expense before taxes for the fiscal year ended
February 2, 2018
includes
$683 million
related to VMware, Inc. plans discussed below. Stock-based compensation expense before taxes for the fiscal year ended
February 3, 2017
includes
$279 million
related to VMware, Inc. plans for the period from
September 7, 2016 through February 3, 2017
.
|
|
(b)
|
Stock-based compensation expense before taxes for the fiscal year ended
February 3, 2017
does not include
$807 million
of post-merger stock-based compensation expense and related taxes resulting from the EMC merger transaction. See
Note 3
of the
Notes to the Consolidated Financial Statements
for more information on the EMC merger transaction.
|
Dell Technologies Inc. Stock-based Compensation Plans
Dell Technologies Inc. 2013 Stock Incentive Plan
—
On September 7, 2016, at the effective time of the EMC merger transaction, the Denali Holding Inc. 2013 Stock Incentive Plan (the "2013 Plan") was amended and restated as the Dell Technologies Inc. 2013 Stock Incentive Plan (the "Restated Plan"). Employees, consultants, non-employee directors, and other service providers of the Company or its affiliates are eligible to participate in the Restated Plan. The Restated Plan authorizes the issuance of an aggregate of
75 million
shares of the Company's Class C Common Stock and
500,000
shares of the Company's Class V Common Stock, of which
61 million
shares of Class C Common Stock were previously reserved for issuance under the 2013 Plan. The Restated Plan authorizes the Company to grant stock options, restricted stock units ("RSUs"), stock appreciation rights ("SARs"), RSAs, and dividend equivalents.
As of
February 2, 2018
and
February 3, 2017
, there were
30 million
and
26 million
shares, respectively, of common stock of Dell Technologies available for future grants under the Restated Plan.
Stock Opt
ion Agreements
— Stock options granted under the
Restated Plan include service-based awards and performance-based awards. A majority of the service-based stock options vest pro-rata at each option anniversary date over a
five
-year period. Performance-based stock options, with a market condition, become exercisable upon achievement of return on equity ("ROE") metrics up to the
seven
-year anniversary of the going-private transaction date, depending upon the achievement of the market condition. Both service-based and performance-based stock options are granted with option exercise prices equal to the fair market value of the Company's common stock, as determined by the Company's board of directors or authorized committee. Generally, shares of common stock issued under both service-based and performance-based awards are subject to liquidity events, such as an initial public offering, change in control, sales of common stock under a semi-annual company liquidity program, and calls and puts resulting upon the occurrence of specified events. A majority of the stock options expire
ten years
after the date of grant.
147
Stock Option Activity
— The following table summarizes stock option activity settled in DHI Group Common Stock during the fiscal years ended
February 2, 2018
,
February 3, 2017
, and
January 29, 2016
:
|
Number of Options
|
Weighted-Average Exercise Price
|
Weighted Average Remaining Contractual Term
|
Aggregate Intrinsic Value (a)
|
|||||||||
|
(in millions)
|
(per share)
|
(in years)
|
(in millions)
|
|||||||||
|
Options outstanding as of January 30, 2015
|
55
|
|
$
|
14.11
|
|
|||||||
|
Granted
|
2
|
|
24.05
|
|
||||||||
|
Exercised
|
—
|
|
—
|
|
||||||||
|
Forfeited
|
(3
|
)
|
19.07
|
|
||||||||
|
Canceled/expired
|
—
|
|
—
|
|
||||||||
|
Options outstanding as of January 29, 2016
|
54
|
|
14.30
|
|
||||||||
|
Granted
|
2
|
|
27.09
|
|
||||||||
|
Exercised
|
(1
|
)
|
14.12
|
|
||||||||
|
Forfeited
|
(7
|
)
|
15.51
|
|
||||||||
|
Canceled/expired
|
—
|
|
—
|
|
||||||||
|
Options outstanding as of February 3, 2017
|
48
|
|
14.75
|
|
||||||||
|
Granted
|
—
|
|
—
|
|
||||||||
|
Exercised
|
(4
|
)
|
14.62
|
|
||||||||
|
Forfeited
|
(2
|
)
|
13.75
|
|
||||||||
|
Canceled/expired
|
—
|
|
—
|
|
||||||||
|
Options outstanding as of February 2, 2018 (b)
|
42
|
|
$
|
14.80
|
|
5.7
|
$
|
776
|
|
|||
|
Exercisable as of February 2, 2018
|
18
|
|
$
|
15.17
|
|
5.5
|
$
|
329
|
|
|||
|
Vested and expected to vest (net of estimated forfeitures) as of February 2, 2018
|
40
|
|
$
|
14.80
|
|
5.7
|
$
|
732
|
|
|||
____________________
|
(a)
|
The aggregate intrinsic values represent the total pre-tax intrinsic values based on the fair market value of the DHI Group Common Stock as of
February 2, 2018
that would have been received by the option holders had all in-the-money options been exercised as of that date.
|
|
(b)
|
Of the
42 million
stock options outstanding on
February 2, 2018
,
19 million
related to performance-based awards and
23 million
related to service-based awards.
|
The total fair value of options vested was
$45 million
,
$50 million
, and
$42 million
for the fiscal years ended
February 2, 2018
,
February 3, 2017
, and
January 29, 2016
, respectively. The pre-tax intrinsic value of the options exercised was
$62 million
,
$18 million
, and
$4 million
for the fiscal years ended
February 2, 2018
,
February 3, 2017
, and
January 29, 2016
, respectively. As of
February 2, 2018
, there was
$45 million
of total unrecognized stock-based compensation expense, net of estimated forfeitures, related to unvested stock options expected to be recognized over a weighted-average period of
1.6 years
.
The tax benefit realized from the exercise of stock options was
$21 million
,
$6 million
, and
$1 million
for the fiscal years ended
February 2, 2018
,
February 3, 2017
, and
January 29, 2016
, respectively.
In connection with the EMC merger transaction and in accordance with the merger agreement, certain executives holding unvested restricted stock units of EMC ("EMC RSUs") were given the opportunity to elect to exchange each unvested EMC RSU held by such executives that would otherwise have vested in the ordinary course on or after January 1, 2017 for (a) a deferred cash award having a cash value equal to the closing price of a share of EMC common stock on the last trading day before the closing date of the EMC merger transaction, or
$29.05
, and (b) an option ("rollover option") to purchase a share of Class C Common Stock of Dell Technologies (the "rollover opportunity"). The rollover options have a
three
-year term and a per share exercise price equal to the fair market value of a share of Class C Common Stock on the date of grant, or
$27.50
, and, to the extent vested, may be exercised using a cashless exercise method for both the exercise price and the applicable minimum required tax withholding (subject to certain limitations). Each deferred cash award will vest, and each rollover option will vest and thereby become exercisable, on the same schedule as the EMC RSU for which they were exchanged
148
(with any performance-vesting condition deemed satisfied at the target level of performance upon the closing of the EMC merger transaction). Pursuant to the rollover opportunity, options to purchase
1.8 million
shares of Class C Common Stock were issued and have been included within the stock option activity table above as granted options.
Valuation of Service-Based Stock Option Awards
— For service-based stock options granted under the 2013 Plan and the Restated Plan, the Company utilized the Black-Scholes option pricing model to estimate the fair value of stock options at the grant date. The Black-Scholes option pricing model incorporates various assumptions, including leveraged adjusted volatility of a public peer group, expected term, risk-free interest rates, and dividend yields. The weighted assumptions utilized for valuation of options under this model as well as the weighted-average grant date fair value of stock options granted during the respective periods are presented below.
The expected term is based on historical experience and on the terms and conditions of the stock awards granted to employees. For the periods presented, option valuations used leverage-adjusted volatility of a peer group, and the expected term was based on analysis of the Company's historical option settlement experience and on the terms and conditions of the stock awards granted.
The assumptions utilized in this model as well as the weighted-average grant date fair value of stock options granted in DHI Group Common Stock are presented below. The Company granted an immaterial number of service-based stock options during the fiscal year ended
February 2, 2018
.
|
Fiscal Year Ended
|
|||||||
|
February 3, 2017
|
January 29, 2016
|
||||||
|
Weighted-average grant date fair value of stock options granted per option
|
$
|
10.36
|
|
$
|
10.05
|
|
|
|
Expected term (in years)
|
3.4
|
|
5.1
|
|
|||
|
Risk-free rate (U.S. Government Treasury Note)
|
0.9
|
%
|
1.5
|
%
|
|||
|
Expected volatility
|
51
|
%
|
46
|
%
|
|||
|
Expected dividend yield
|
—
|
%
|
—
|
%
|
|||
Valuation of Performance-Based Stock Option Awards
— For performance-based stock options granted under the 2013 Plan and the Restated Plan, the Company utilized the Monte Carlo valuation model to simulate probabilities of achievement of the market condition and the grant date fair value. The valuation model for performance-based option grants during the fiscal years ended
February 2, 2018
,
February 3, 2017
, and
January 29, 2016
used a weighted-average leverage adjusted
five years
peer volatility and corresponding risk free interest rate. Upon fulfillment of a ROE condition, a specific portion of the performance options become exercisable. An embedded binomial lattice option pricing model was used to determine the value of these exercisable options using the assumption that each option will be exercised at the midpoint between the date of satisfaction of a ROE condition and the expiration date of such option.
The assumptions utilized in this model as well as the weighted-average grant date fair value of stock options granted are presented below. There were no performance-based stock options granted during the fiscal year ended
February 2, 2018
.
|
Fiscal Year Ended
|
|||||||
|
February 3, 2017
|
January 29, 2016
|
||||||
|
Weighted-average grant date fair value of stock options granted per option
|
$
|
8.83
|
|
$
|
10.85
|
|
|
|
Expected term (in years)
|
—
|
|
—
|
|
|||
|
Risk-free rate (U.S. Government Treasury Note)
|
1.7
|
%
|
2.0
|
%
|
|||
|
Expected volatility
|
44
|
%
|
50
|
%
|
|||
|
Expected dividend yield
|
—
|
%
|
—
|
%
|
|||
Restricted Stock
— The Company's restricted stock primarily consists of RSU awards granted to employees. RSUs are valued based on the Company's Class C Common Stock price on the date of grant. The shares underlying the RSU awards are not issued until the RSU vests. Upon vesting, each RSU converts into one share of DHI Group Common Stock.
149
The Company's restricted stock also includes performance stock unit ("PSU") awards, which have been granted to certain members of the Company's senior leadership team. The PSU awards include performance conditions and, in certain cases, a time-based vesting component. For PSU awards granted under the Restated Plan, the Company utilized the Monte Carlo valuation model to simulate the probabilities of achievement of the market condition to determine the grant date fair value. The vesting and payout of the PSU awards depends upon the return on equity achieved on various measurement dates or liquidity events.
The following table summarizes restricted stock and restricted stock units activity
settled in DHI Group Common Stock
during the
fiscal years ended
February 2, 2018
and
February 3, 2017
. For the fiscal year ended
January 29, 2016
, the total estimated vest date fair value of restricted stock unit awards was not material.
|
|
Number of Units
|
Weighted-Average Grant Date Fair Value
|
||||
|
(in millions)
|
(per unit)
|
|||||
|
Outstanding, January 29, 2016
|
—
|
|
$
|
—
|
|
|
|
Granted
|
11
|
|
19.66
|
|
||
|
Vested
|
—
|
|
—
|
|
||
|
Forfeited
|
(1
|
)
|
19.63
|
|
||
|
Outstanding, February 3, 2017
|
10
|
|
19.63
|
|
||
|
Granted
|
1
|
|
23.04
|
|
||
|
Vested
|
(1
|
)
|
27.59
|
|
||
|
Forfeited
|
(3
|
)
|
19.13
|
|
||
|
Outstanding, February 2, 2018 (a)
|
7
|
|
$
|
18.73
|
|
|
_________________
|
(a)
|
As of
February 2, 2018
, the
7 million
units outstanding included
2 million
RSUs and
5 million
PSUs.
|
As of
February 2, 2018
, restricted stock that is expected to vest was as follows:
|
Number of Units
|
Weighted Average Remaining Contractual Term
|
Aggregate Intrinsic Value (a)
|
||||||
|
(in millions)
|
(in years)
|
(in millions)
|
||||||
|
Expected to vest, February 2, 2018
|
6
|
|
3.3
|
$
|
212
|
|
||
_________________
|
(a)
|
The aggregate intrinsic values represent the total pre-tax intrinsic values based on the fair market value of the DHI Group Common Stock as of
February 2, 2018
that would have been received by the RSU holders had the RSUs been issued as of
February 2, 2018
.
|
The
total fair value of restricted stock that vested during the year ended February 2, 2018 was
$37 million
and the pre-tax intrinsic value was
$44 million
.
As of February 2, 2018,
7 million
shares of restricted stock were outstanding, with an aggregate intrinsic value of
$246 million
.
As of
February 2, 2018
, there was
$78 million
of unrecognized stock-based compensation expense, net of estimated forfeitures, related to these awards expected to be recognized over a weighted-average period of approximately
1.7 years
.
Dell Technologies Shares Withheld for Taxes
— Under certain situations, shares are sold to cover employee taxes for both the vesting of restricted stock units and the exercise of stock options. For the fiscal years ended
February 2, 2018
and
February 3, 2017
,
1.0 million
and
0.2 million
shares, respectively, were withheld to cover
$35 million
and
$6 million
, respectively, of employees' tax obligations. Shares withheld for taxes for the fiscal year ended
January 29, 2016
were immaterial.
150
VMware, Inc. Stock-based Compensation Plans
VMware, Inc. 2007 Equity and Incentive Plan
—
In June 2007, VMware, Inc. adopted its 2007 Equity and Incentive Plan (the "2007 Plan"). As of
February 2, 2018
, the number of authorized shares of VMware, Inc. Class A common stock under the 2007 Plan was
126 million
. The number of shares underlying outstanding equity awards that VMware, Inc. assumes in the course of business acquisitions are also added to the 2007 Plan reserve on an as-converted basis. VMware, Inc. has assumed
6 million
shares, which accordingly have been added to the authorized shares under the 2007 Plan reserve.
Awards under the 2007 Plan may be in the form of stock-based awards such as RSUs or stock options. VMware, Inc.'s Compensation and Corporate Governance Committee determines the vesting schedule for all equity awards. Generally, restricted stock grants made under the 2007 Plan have a
three
-year to
four
-year period over which they vest and vest
25%
the first year and semi-annually thereafter. The value of RSU grants is based on VMware, Inc.'s stock price on the date of grant. The shares underlying the RSU awards are not issued until the RSUs vest. Upon vesting, each RSU converts into one share of VMware, Inc. Class A common stock. VMware, Inc.'s restricted stock also includes PSU awards which have been granted to certain VMware, Inc. executives and employees. The PSU awards include performance conditions and, in certain cases, a time-based or market-based vesting component. Upon vesting, each PSU award will convert into VMware, Inc.'s Class A common stock at various ratios ranging from
0.5
to
2.0
shares per PSU, depending upon the degree of achievement of the performance target designated by each award. If minimum performance thresholds are not achieved, then no shares will be issued.
The per share exercise price for a stock option awarded under the 2007 Plan shall not be less than
100%
of the per share fair market value of VMware, Inc. Class A common stock on the date of grant. Most options granted under the 2007 Plan vest
25%
after the first year and monthly thereafter over the following three years and expire between
six
and
seven
years from the date of grant. VMware, Inc. utilizes authorized and unissued shares to satisfy all shares issued under the 2007 Plan. As of
February 2, 2018
, there were an aggregate of approximately
16 million
shares of common stock available for issuance pursuant to future grants under the 2007 Plan.
VMware, Inc. Employee Stock Purchase Plan
— In June 2007, VMware, Inc. adopted its 2007 Employee Stock Purchase Plan (the "ESPP"), which is intended to be qualified under Section 423 of the Internal Revenue Code. As of
February 2, 2018
, the number of authorized shares under the ESPP was approximately
23 million
. Under the ESPP, eligible VMware, Inc. employees are granted options to purchase shares at the lower of
85%
of the fair market value of the stock at the time of grant or
85%
of the fair market value at the time of exercise.
The option period is generally
twelve months
and includes
two
embedded
six
-month option periods. Options are exercised at the end of each embedded option period. If the fair market value of the stock is lower on the first day of the second embedded option period than it was at the time of grant, then the
twelve
-month option period expires and each enrolled participant is granted a new
twelve
-month option. As of
February 2, 2018
, approximately
9 million
shares of VMware, Inc. Class A common stock were available for issuance under the ESPP.
The following table summarizes ESPP activity for the fiscal year ended
February 2, 2018
, and during the period from
September 7, 2016 through February 3, 2017
:
|
Fiscal Year Ended February 2, 2018
|
For the Period September 7, 2016 through February 3, 2017
|
||||||
|
(in millions, except per share amounts)
|
|||||||
|
Cash proceeds
|
$
|
65
|
|
$
|
60
|
|
|
|
Class A common shares purchased
|
0.9
|
|
1.5
|
|
|||
|
Weighted-average price per share
|
$
|
72.40
|
|
$
|
40.65
|
|
|
151
As of
February 2, 2018
,
$80 million
of ESPP withholdings were recorded as a liability in accrued and other on the Consolidated Statements of Financial Position for the purchase that occurred on February 28, 2018. Total unrecognized stock-based compensation expense as of
February 2, 2018
for the ESPP was
$7 million
.
VMware, Inc. 2007 Equity and Incentive Plan Stock Options
— The following table summarizes stock option activity for VMware, Inc. employees in VMware, Inc. stock options:
|
Number of Options
|
Weighted-Average Exercise Price
|
Weighted Average Remaining Contractual Term
|
Aggregate Intrinsic Value (a)
|
|||||||||
|
(in millions)
|
(per share)
|
(in years)
|
(in millions)
|
|||||||||
|
Options outstanding as of September 7, 2016
|
2
|
|
$
|
65.01
|
|
|||||||
|
Granted
|
—
|
|
—
|
|
||||||||
|
Exercised
|
—
|
|
—
|
|
||||||||
|
Forfeited
|
—
|
|
|
|||||||||
|
Canceled/Expired
|
—
|
|
|
|||||||||
|
Options outstanding as of February 3, 2017 (b)
|
2
|
|
69.38
|
|
||||||||
|
Granted
|
1
|
|
13.79
|
|
||||||||
|
Exercised
|
(1
|
)
|
53.50
|
|
||||||||
|
Forfeited
|
—
|
|
—
|
|
||||||||
|
Canceled/Expired
|
—
|
|
—
|
|
||||||||
|
Options outstanding as of February 2, 2018
|
2
|
|
$
|
54.63
|
|
5.1
|
$
|
112
|
|
|||
|
Exercisable as of February 2, 2018
|
1
|
|
$
|
73.60
|
|
3.3
|
$
|
50
|
|
|||
|
Vested and expected to vest (net of estimated forfeitures) as of February 2, 2018
|
2
|
|
$
|
54.56
|
|
5.1
|
$
|
112
|
|
|||
_________________
|
(a)
|
The aggregate intrinsic values represent the total pre-tax intrinsic values based on VMware, Inc.'s closing stock price of
$122.72
as of
February 2, 2018
that would have been received by the option holders had all in-the-money options been exercised as of that date.
|
(b)
Stock option activity during the period was immaterial. The ending weighted-average exercise price was calculated based on underlying options outstanding as of
February 3, 2017
.
The above table includes stock options granted in conjunction with unvested stock options assumed in business combinations. As a result, the weighted-average exercise price per share may vary from the VMware, Inc. stock price at time of grant. The total fair value of VMware, Inc. stock options that vested during the fiscal year ended
February 2, 2018
and for the period from
September 7, 2016 through February 3, 2017
was
$32 million
and
$13 million
, respectively. The pre-tax intrinsic value of the options exercised during the fiscal year ended
February 2, 2018
and for the period from
September 7, 2016 through February 3, 2017
was
$62 million
and
$13 million
, respectively.
The tax benefit realized from the exercise of stock options was
$21 million
and
$4 million
for the fiscal year ended
February 2, 2018
and for the period from
September 7, 2016 through February 3, 2017
, respectively. As of
February 2, 2018
, there was
$46 million
of total unrecognized stock-based compensation expense, net of estimated forfeitures, related to unvested stock options expected to be recognized over a weighted-average period of approximately
one year
.
Fair Value of VMware, Inc. Options
— The fair value of each option to acquire VMware, Inc. Class A common stock granted is estimated on the date of grant using the Black-Scholes option-pricing model. The assumptions utilized in this model, as well as the weighted-average assumptions, are presented below. There were no stock options granted under the 2007 Plan during the period from
September 7, 2016 through February 3, 2017
.
152
|
Fiscal Year Ended
|
|||
|
February 2, 2018
|
|||
|
VMware, Inc. 2007 Equity and Incentive Plan
|
|||
|
Weighted-average grant date fair value of stock options granted per option
|
$
|
83.62
|
|
|
Expected term (in years)
|
3.3
|
|
|
|
Risk-free rate (U.S. Government Treasury Note)
|
1.7
|
%
|
|
|
Expected volatility
|
29
|
%
|
|
|
Expected dividend yield
|
—
|
%
|
|
|
Fiscal Year Ended
|
|||||||
|
February 2, 2018
|
February 3, 2017
|
||||||
|
VMware, Inc. Employee Stock Purchase Plan
|
|||||||
|
Weighted-average grant date fair value of stock options granted per option
|
$
|
21.93
|
|
$
|
13.57
|
|
|
|
Expected term (in years)
|
0.9
|
|
0.8
|
|
|||
|
Risk-free rate (U.S. Government Treasury Note)
|
1.2
|
%
|
0.5
|
%
|
|||
|
Expected volatility
|
23
|
%
|
38
|
%
|
|||
|
Expected dividend yield
|
—
|
%
|
—
|
%
|
|||
The weighted-average grant date fair value of VMware, Inc. stock options can fluctuate from period to period primarily due to higher valued options assumed through business combinations with exercise prices lower than the fair market value of VMware, Inc.'s stock on the date of grant.
For equity awards granted, volatility is based on an analysis of historical stock prices and implied volatilities of VMware, Inc.'s Class A common stock. The expected term is based on historical exercise patterns and post-vesting termination behavior, the term of the option period for grants made under the ESPP, or the weighted-average remaining term for options assumed in acquisitions. VMware, Inc.'s expected dividend yield input was
zero
as it has not historically paid, nor expects in the future to pay, cash dividends on its common stock. The risk-free interest rate is based on a U.S. Treasury instrument whose term is consistent with the expected term of the stock options.
153
VMware, Inc. Restricted Stock
— The following table summarizes VMware, Inc.'s restricted stock activity since
September 7, 2016
:
|
|
Number of Units
|
Weighted-Average Grant Date Fair Value
|
||||
|
(in millions)
|
(per unit)
|
|||||
|
Outstanding, September 7, 2016
|
22
|
|
$
|
67.01
|
|
|
|
Granted
|
2
|
|
79.81
|
|
||
|
Vested
|
(3
|
)
|
72.94
|
|
||
|
Forfeited
|
(1
|
)
|
69.19
|
|
||
|
Outstanding, February 3, 2017
|
20
|
|
67.41
|
|
||
|
Granted
|
8
|
|
93.84
|
|
||
|
Vested
|
(9
|
)
|
67.89
|
|
||
|
Forfeited
|
(2
|
)
|
72.68
|
|
||
|
Outstanding, February 2, 2018 (a)
|
17
|
|
$
|
78.62
|
|
|
_________________
|
(a)
|
As of
February 2, 2018
, the
17 million
units outstanding included
16.7 million
RSUs and
0.7 million
PSUs. The above table includes RSUs issued in exchange for outstanding unvested RSUs in connection with business combinations.
|
As of
February 2, 2018
, restricted stock that is expected to vest was as follows:
|
Number of Units
|
Weighted Average Remaining Contractual Term
|
Aggregate Intrinsic Value (a)
|
||||||
|
(in millions)
|
(in years)
|
(in millions)
|
||||||
|
Expected to vest, February 2, 2018
|
15
|
|
2.5
|
$
|
1,855
|
|
||
_________________
|
(a)
|
The aggregate intrinsic value represent the total pre-tax intrinsic values based on VMware, Inc.'s closing stock price of
$122.72
as of
February 2, 2018
that would have been received by the RSU holders had the RSUs been issued as of
February 2, 2018
.
|
The total fair value of VMware, Inc. restricted stock awards that vested during the fiscal year ended
February 2, 2018
and the period from
September 7, 2016 through February 3, 2017
was
$616 million
and
$203 million
, respectively, and the pre-tax intrinsic value was
$946 million
and
$218 million
, respectively. As of
February 2, 2018
,
17 million
restricted shares of VMware, Inc.'s Class A common stock were outstanding, with an aggregate intrinsic value of
$2,130 million
based on VMware, Inc.'s closing stock price as of
February 2, 2018
.
As of
February 2, 2018
, there was
$999 million
of unrecognized stock-based compensation expense, net of estimated forfeitures, related to these awards expected to be recognized over a weighted-average period of approximately
1.5 years
.
VMware, Inc. Shares Withheld for Taxes
— For the fiscal year ended
February 2, 2018
and for the period from
September 7, 2016 through February 3, 2017
, VMware, Inc. repurchased and retired or withheld
3 million
shares and
1 million
shares of VMware, Inc. Class A common stock, respectively, for
$348 million
and
$77 million
, respectively, to cover tax withholding obligations. These amounts may differ from the amounts of cash remitted for tax withholding obligations on the consolidated statements of cash flows due to the timing of payments. Pursuant to the respective award agreements, these shares were withheld in conjunction with the net share settlement upon the vesting of restricted stock and restricted stock units (including PSUs) during the period. The value of the withheld shares, including restricted stock units, was classified as a reduction to additional paid-in capital.
154
Other Plans
In addition to the plans disclosed above, the Company has issued equity grants settling in its Class V Common Stock as well as classes of stock of its subsidiaries, including SecureWorks. The stock option and restricted stock unit activity under these plans was not material during the fiscal years ended
February 2, 2018
,
February 3, 2017
, and
January 29, 2016
.
NOTE 20
—
REDEEMABLE SHARES
Awards under the Company's stock incentive plans include certain rights that allow the holder to exercise a put feature for the underlying Class A or Class C Common Stock after a
six
month holding period following the issuance of such common stock. The put feature requires the Company to purchase the stock at its fair market value. Accordingly, these awards and common stock are subject to reclassification from equity to temporary equity, and the Company determines the award amounts to be classified as temporary equity as follows:
|
•
|
For stock options to purchase Class C Common Stock subject to service requirements, the intrinsic value of the option is multiplied by the portion of the option for which services have been rendered. Upon exercise of the option, the amount in temporary equity represents the fair value of the Class C Common Stock.
|
|
•
|
For SARs, RSUs, or RSAs, any of which stock award types are subject to service requirements, the fair value of the share is multiplied by the portion of the shares for which services have been rendered.
|
|
•
|
For share-based arrangements that are subject to the occurrence of a contingent event, those amounts are not reclassified to temporary equity until the contingency has been satisfied.
|
The amount of redeemable shares classified as temporary equity as of
February 2, 2018
was
$384 million
, which consisted of
2.9 million
issued and outstanding unrestricted common shares,
0.4 million
RSUs,
0.1 million
RSAs, and
15.3 million
outstandi
ng stock options. The amount of redeemable shares classified as temporary equity as of
February 3, 2017
was
$231 million
, which consisted of
1.1 million
issued and outstanding unrestricted common shares,
0.4 million
RSUs,
0.1 million
RSAs, and
13.7 million
outstanding stock options.
155
NOTE 21
—
RETIREMENT PLAN BENEFITS
Defined Benefit Pension Plan
In connection with the EMC merger transaction completed on
September 7, 2016
, the Company assumed all of EMC's defined benefit obligations and related plan assets, including a noncontributory defined benefit pension plan (the "Pension Plan") which was assumed as a result of EMC's prior acquisition of Data General. Certain of the Company's foreign subsidiaries also have defined benefit pension plans which were assumed as part of the EMC merger transaction and do not have a material impact on the results of operations or financial position of the Company.
Benefits under the Pension Plan are generally based on either career average or final average salaries and creditable years of service as defined in the plan. The annual cost for the Pension Plan is determined using the projected unit credit actuarial cost method that includes actuarial assumptions and estimates which are subject to change. As of December 1999, this plan was frozen, so employees no longer accrue pension benefits for future services. The measurement date for the Pension Plan is the end of the Company's fiscal year.
The following table presents the components of the changes in the Pension Plan benefit obligation for the periods indicated:
|
Benefit Obligation
|
|||
|
(in millions)
|
|||
|
Benefit obligation as of September 7, 2016
|
$
|
590
|
|
|
Interest cost
|
8
|
|
|
|
Benefits paid
|
(11
|
)
|
|
|
Actuarial loss (gain)
|
(52
|
)
|
|
|
Benefit obligation as of February 3, 2017
|
535
|
|
|
|
Interest cost
|
21
|
|
|
|
Benefits paid
|
(24
|
)
|
|
|
Actuarial loss (gain)
|
14
|
|
|
|
Benefit obligation as of February 2, 2018
|
$
|
546
|
|
On a weighted-average basis, the assumed discount rate used to determine the benefit obligations at
February 2, 2018
,
February 3, 2017
, and
September 7, 2016
was
3.8%
,
4.1%
, and
3.4%
, respectively.
The following table presents the components of the changes in the fair value of plan assets for the periods indicated:
|
Plan Assets
|
|||
|
(in millions)
|
|||
|
Fair value of plan assets as of September 7, 2016
|
$
|
493
|
|
|
Actual return on plan assets
|
(12
|
)
|
|
|
Benefits paid
|
(11
|
)
|
|
|
Fair value of plan assets as of February 3, 2017
|
470
|
|
|
|
Actual return on plan assets
|
59
|
|
|
|
Benefits paid
|
(24
|
)
|
|
|
Fair value of plan assets as of February 2, 2018
|
$
|
505
|
|
The under-funded status of the Pension Plan at
February 2, 2018
and
February 3, 2017
was
$41 million
and
$65 million
, respectively, and is classified as a component of other long-term liabilities in the
Consolidated Statements of Financial Position
. The Company did not make any significant contributions to the plan for the fiscal year ended
February 2, 2018
and for the period from
September 7, 2016 through February 3, 2017
, and does not expect to make any significant contributions to the Pension Plan in Fiscal 2019.
156
The following table presents the components of net periodic benefit cost recognized for the periods indicated:
|
Fiscal Year Ended
|
|||||||
|
February 2, 2018
|
September 7, 2016 through February 3, 2017
|
||||||
|
(in millions)
|
|||||||
|
Interest cost
|
$
|
21
|
|
$
|
8
|
|
|
|
Expected return on plan assets
|
(30
|
)
|
(16
|
)
|
|||
|
Recognized actuarial loss
|
—
|
|
—
|
|
|||
|
Net periodic benefit cost
|
$
|
(9
|
)
|
$
|
(8
|
)
|
|
The discount rate and expected long-term rate of return on plan assets used in the accounting for the Pension Plan to determine the net periodic benefit cost for the fiscal year ended
February 2, 2018
was
4.1%
and
6.5%
, respectively. The discount rate and expected long-term rate of return on plan assets used in the accounting for the Pension Plan to determine the net periodic benefit cost for the period from
September 7, 2016 through February 3, 2017
was
3.4%
and
6.5%
, respectively.
For the fiscal year ended
February 2, 2018
, the Pension Plan had net gains of
$39 million
that were primarily the result of an increase in the discount rate and the rate of return on plan assets. The net gains were recognized in accumulated other comprehensive loss.
There were
no
reclassifications from accumulated other comprehensive loss to a component of net periodic benefit cost during the fiscal year ended
February 2, 2018
. Additionally, the Company expects that
none
of the total balance included in accumulated other comprehensive loss at
February 2, 2018
will be recognized as a component of net periodic benefit cost in Fiscal 2019.
At
February 2, 2018
, future benefit payments are expected to be paid as follows:
$26 million
in
Fiscal 2019
;
$28 million
in
Fiscal 2020
;
$29 million
in
Fiscal 2021
;
$31 million
in
Fiscal 2022
;
$32 million
in
Fiscal 2023
; and
$173 million
thereafter.
Fair Value of Plan Assets
—
The following table presents the fair value of each class of plan assets by level within the fair value hierarchy as of
February 2, 2018
and
February 3, 2017
:
|
February 2, 2018
|
February 3, 2017
|
||||||||||||||||||||||||||||||
|
Level 1
|
Level 2
|
Level 3
|
Total
|
Level 1
|
Level 2
|
Level 3
|
Total
|
||||||||||||||||||||||||
|
(in millions)
|
|||||||||||||||||||||||||||||||
|
Common collective trusts (a)
|
$
|
—
|
|
$
|
350
|
|
$
|
—
|
|
$
|
350
|
|
$
|
—
|
|
$
|
331
|
|
$
|
—
|
|
$
|
331
|
|
|||||||
|
U.S. Treasury securities
|
7
|
|
—
|
|
—
|
|
7
|
|
1
|
|
—
|
|
—
|
|
1
|
|
|||||||||||||||
|
Corporate debt securities (b)
|
—
|
|
147
|
|
—
|
|
147
|
|
—
|
|
137
|
|
—
|
|
137
|
|
|||||||||||||||
|
Total
|
$
|
7
|
|
$
|
497
|
|
$
|
—
|
|
504
|
|
$
|
1
|
|
$
|
468
|
|
$
|
—
|
|
469
|
|
|||||||||
|
Plan payables, net of accrued interest and dividends (c)
|
1
|
|
1
|
|
|||||||||||||||||||||||||||
|
Total, net
|
$
|
505
|
|
$
|
470
|
|
|||||||||||||||||||||||||
_________________
|
(a)
|
Common collective trusts are valued at the net asset value calculated by the fund manager based on the underlying investments and are classified within Level 2 of the fair value hierarchy.
|
|
(b)
|
Corporate debt securities are valued daily at the closing price reported in active U.S. financial markets and are classified within Level 2 of the fair value hierarchy.
|
|
(c)
|
Dividends, accrued interest, and net plan payables are not material to the plan assets and therefore have not been classified into the fair value hierarchy.
|
157
Investment Strategy
—
The Pension Plan's assets are managed by outside investment managers. The Company's investment strategy with respect to plan assets is to achieve a long-term growth of capital, consistent with an appropriate level of risk. The expected long-term rate of return on the plan assets considers the current level of expected returns on risk-free investments (primarily government bonds), the historical level of the risk premium associated with the other asset classes in which the portfolio is invested, and the expectations for future returns of each asset class. The expected return for each asset class was weighted based on the target asset allocation to develop the expected long-term rate of return on assets. As market conditions permit, the Company expects to shift the asset allocation to lower the percentage of investments in equities and increase the percentage of investments in long-duration fixed-income securities. The changes could result in a reduction in the long-term rate of return on the plan assets and increase future pension expense.
The following table presents the target allocation of plan assets as of
February 2, 2018
, and actual allocation of plan assets as of
February 2, 2018
and
February 3, 2017
:
|
Target Allocation
|
Actual Allocation
|
|||||||
|
February 2, 2018
|
February 2, 2018
|
February 3, 2017
|
||||||
|
U.S. large capitalization equity securities
|
25
|
%
|
27
|
%
|
27
|
%
|
||
|
U.S. small capitalization equity securities
|
5
|
|
5
|
|
5
|
|
||
|
Foreign equity securities
|
7
|
|
7
|
|
7
|
|
||
|
U.S. long-duration fixed income securities
|
60
|
|
58
|
|
57
|
|
||
|
Below investment grade corporate fixed income securities
|
3
|
|
3
|
|
4
|
|
||
|
Total
|
100
|
%
|
100
|
%
|
100
|
%
|
||
Employee Benefit Plans
Dell 401(k) Plan
— The Company has a defined contribution retirement plan (the "Dell 401(k) Plan") that complies with Section 401(k) of the Internal Revenue Code. Substantially all Dell employees in the United States before the completion of the EMC merger transaction are eligible to participate in the Dell 401(k) Plan. As of
February 2, 2018
, the Company matches
100%
of each participant's voluntary contributions, subject to a maximum contribution of
6%
of the participant's eligible compensation, up to an annual limit of
$7,500
, and participants vest immediately in all contributions to the Dell 401(k) Plan. The Company's contributions during the fiscal years ended
February 2, 2018
,
February 3, 2017
, and
January 29, 2016
were
$129 million
,
$158 million
, and
$169 million
, respectively. The Company's matching contributions as well as participants' voluntary contributions are invested according to each participant's elections in the investment options provided under the 401(k) Plan.
EMC 401(k) Plan
— The EMC defined contribution retirement plan (the "EMC 401(k) Plan") was assumed in connection with the EMC merger transaction on September 7, 2016. Effective January 1, 2018, the EMC 401(k) Plan was terminated and participant account balances were transferred to the Dell 401(k) Plan. The EMC 401(k) plan complied with Section 401(k) of the Internal Revenue Code for certain employees who were EMC employees before the completion of the EMC merger transaction. Before the transition into the Dell 401(k) Plan on January 1, 2018, the Company's contributions during the fiscal year ended
February 2, 2018
to the EMC 401(k) Plan were
$94 million
. The Company's contributions during the period from
September 7, 2016 through February 3, 2017
to the EMC 401(k) Plan were
$31 million
.
VMware, Inc., SecureWorks, and Pivotal have defined contribution programs for certain employees that comply with Section 401(k) of the Internal Revenue Code.
158
NOTE 22
—
SEGMENT INFORMATION
The Company has
three
reportable segments that are based on the following business units: Client Solutions Group ("CSG"); Infrastructure Solutions Group ("ISG"); and VMware.
CSG includes sales to commercial and consumer customers of desktops, thin client products, and notebooks, as well as services and third-party software and peripherals that are closely tied to the sale of CSG hardware. ISG includes servers, networking, and storage, as well as services and third-party software and peripherals that are closely tied to the sale of ISG hardware. VMware includes a broad portfolio of virtualization technologies across
three
main product groups: software-defined data center; hybrid cloud computing; and end-user computing.
ISG includes Virtustream product and service offerings. Virtustream's cloud software and infrastructure-as-a-service solutions enable customers to migrate, run, and manage mission-critical applications in cloud-based IT environments. Beginning in the first quarter of Fiscal 2019, the Company will no longer manage Virtustream as part of ISG and, as such, will report Virtustream results within other businesses, rather than within ISG. This change in reporting structure will not impact the Company's previously reported consolidated financial results, but the Company's prior period segment results will be recast to reflect the change.
The reportable segments disclosed herein are based on information reviewed by the Company's management to evaluate the business segment results. The Company's measure of segment operating income for management reporting purposes excludes the impact of other businesses, purchase accounting, amortization of intangible assets, unallocated corporate transactions, severance and facility action costs, and transaction-related expenses. The Company does not allocate assets to the above reportable segments for internal reporting purposes.
159
The following table presents a reconciliation of net revenue by the Company's reportable segments to the Company's consolidated net revenue as well as a reconciliation of consolidated segment operating income to the Company's consolidated operating loss:
|
|
Fiscal Year Ended
|
||||||||||
|
|
February 2, 2018
|
February 3, 2017
|
January 29, 2016
|
||||||||
|
|
(in millions)
|
||||||||||
|
Consolidated net revenue:
|
|
|
|
|
|||||||
|
Client Solutions Group
|
$
|
39,455
|
|
$
|
36,754
|
|
$
|
35,877
|
|
||
|
Infrastructure Solutions Group
|
30,652
|
|
21,776
|
|
14,978
|
|
|||||
|
VMware
|
7,925
|
|
3,225
|
|
—
|
|
|||||
|
Reportable segment net revenue
|
78,032
|
|
61,755
|
|
50,855
|
|
|||||
|
Other businesses (a)
|
1,901
|
|
1,026
|
|
382
|
|
|||||
|
Unallocated transactions (b)
|
(4
|
)
|
41
|
|
133
|
|
|||||
|
Impact of purchase accounting (c)
|
(1,269
|
)
|
(1,180
|
)
|
(459
|
)
|
|||||
|
Total net revenue
|
$
|
78,660
|
|
$
|
61,642
|
|
$
|
50,911
|
|
||
|
Consolidated operating income (loss):
|
|||||||||||
|
Client Solutions Group
|
$
|
2,193
|
|
$
|
1,845
|
|
$
|
1,410
|
|
||
|
Infrastructure Solutions Group
|
2,179
|
|
2,393
|
|
1,052
|
|
|||||
|
VMware
|
2,520
|
|
1,113
|
|
—
|
|
|||||
|
Reportable segment operating income
|
6,892
|
|
5,351
|
|
2,462
|
|
|||||
|
Other businesses (a)
|
(21
|
)
|
(39
|
)
|
(78
|
)
|
|||||
|
Unallocated transactions (b)
|
(16
|
)
|
(199
|
)
|
(159
|
)
|
|||||
|
Impact of purchase accounting (c)
|
(1,546
|
)
|
(2,294
|
)
|
(604
|
)
|
|||||
|
Amortization of intangibles
|
(6,980
|
)
|
(3,681
|
)
|
(1,969
|
)
|
|||||
|
Transaction-related expenses (d)
|
(502
|
)
|
(1,488
|
)
|
(109
|
)
|
|||||
|
Other corporate expenses (e)
|
(1,160
|
)
|
(902
|
)
|
(57
|
)
|
|||||
|
Total operating loss
|
$
|
(3,333
|
)
|
$
|
(3,252
|
)
|
$
|
(514
|
)
|
||
_________________
|
(a)
|
Other businesses consist of RSA Information Security, SecureWorks, Pivotal, and Boomi, and do not constitute a reportable segment, either individually or collectively, as the results of the businesses are not material to the Company's overall results and the businesses do not meet the criteria for reportable segments.
|
|
(b)
|
Unallocated transactions includes long-term incentives, certain short-term incentive compensation expenses, and other corporate items that are not allocated to Dell Technologies' reportable segments.
|
|
(c)
|
Impact of purchase accounting includes non-cash purchase accounting adjustments that are primarily related to the EMC merger transaction.
|
|
(d)
|
Transaction-related expenses includes acquisition, integration, and divestiture related costs.
|
|
(e)
|
Other corporate expenses includes severance and facility action costs as well as stock-based compensation expense.
|
160
The following table presents net revenue by
business unit categories:
|
|
Fiscal Year Ended
|
||||||||||
|
|
February 2, 2018
|
February 3, 2017
|
January 29, 2016
|
||||||||
|
|
(in millions)
|
||||||||||
|
Net revenue:
|
|
|
|
|
|
|
|||||
|
Client Solutions Group:
|
|||||||||||
|
Commercial
|
$
|
27,747
|
|
$
|
26,006
|
|
$
|
25,747
|
|
||
|
Consumer
|
11,708
|
|
10,748
|
|
10,130
|
|
|||||
|
Total CSG net revenue
|
39,455
|
|
36,754
|
|
35,877
|
|
|||||
|
Infrastructure Solutions Group:
|
|||||||||||
|
Servers and networking
|
15,398
|
|
12,834
|
|
12,761
|
|
|||||
|
Storage
|
15,254
|
|
8,942
|
|
2,217
|
|
|||||
|
Total ISG net revenue
|
30,652
|
|
21,776
|
|
14,978
|
|
|||||
|
VMware
|
|||||||||||
|
Total VMware net revenue
|
7,925
|
|
3,225
|
|
—
|
|
|||||
|
Total segment net revenue
|
$
|
78,032
|
|
$
|
61,755
|
|
$
|
50,855
|
|
||
The following tables present net revenue and property, plant, and equipment, net allocated between the United States and foreign countries:
|
|
Fiscal Year Ended
|
||||||||||
|
|
February 2, 2018
|
February 3, 2017
|
January 29, 2016
|
||||||||
|
|
(in millions)
|
||||||||||
|
Net revenue:
|
|
|
|
|
|
|
|||||
|
United States
|
$
|
38,342
|
|
$
|
30,699
|
|
$
|
24,309
|
|
||
|
Foreign countries
|
40,318
|
|
30,943
|
|
26,602
|
|
|||||
|
Total net revenue
|
$
|
78,660
|
|
$
|
61,642
|
|
$
|
50,911
|
|
||
|
February 2, 2018
|
February 3, 2017
|
||||||
|
(in millions)
|
|||||||
|
Property, plant, and equipment, net:
|
|||||||
|
United States
|
$
|
4,093
|
|
$
|
4,320
|
|
|
|
Foreign countries
|
1,297
|
|
1,333
|
|
|||
|
Total property, plant, and equipment, net
|
$
|
5,390
|
|
$
|
5,653
|
|
|
The allocation between domestic and foreign net rev
enue is based on the location of the customers. Net revenue from any single foreign country did not constitute more than 10% of the Company's consolidated net revenue for the fiscal year ended
February 2, 2018
,
February 3, 2017
, or
January 29, 2016
. Property, plant, and equipment, net from any single foreign country did not constitute more than 10% of the Company's consolidated property, plant, and equipment, net as of
February 2, 2018
or
February 3, 2017
.
161
NOTE 23
—
SUPPLEMENTAL CONSOLIDATED FINANCIAL INFORMATION
The following table provides additional information on selected accounts included in the
Consolidated Statements of Financial Position
as of
February 2, 2018
and
February 3, 2017
:
|
|
February 2, 2018
|
February 3, 2017
|
|||||
|
|
(in millions)
|
||||||
|
Accounts receivable, net:
|
|||||||
|
Gross accounts receivable
|
$
|
11,575
|
|
$
|
9,770
|
|
|
|
Allowance for doubtful accounts
|
(103
|
)
|
(57
|
)
|
|||
|
Allowance for customer returns
|
(295
|
)
|
(293
|
)
|
|||
|
Total accounts receivable, net
|
$
|
11,177
|
|
$
|
9,420
|
|
|
|
Inventories, net:
|
|||||||
|
Production materials
|
$
|
967
|
|
$
|
925
|
|
|
|
Work-in-process
|
514
|
|
503
|
|
|||
|
Finished goods
|
1,197
|
|
1,110
|
|
|||
|
Total inventories, net
|
$
|
2,678
|
|
$
|
2,538
|
|
|
|
Prepaid expenses (a)
|
|||||||
|
Total prepaid expenses
|
$
|
1,016
|
|
$
|
850
|
|
|
|
Property, plant, and equipment, net:
|
|||||||
|
Computer equipment
|
$
|
5,085
|
|
$
|
5,045
|
|
|
|
Land and buildings
|
4,343
|
|
4,299
|
|
|||
|
Machinery and other equipment
|
3,845
|
|
3,770
|
|
|||
|
Total property, plant, and equipment
|
13,273
|
|
13,114
|
|
|||
|
Accumulated depreciation and amortization (b)
|
(7,883
|
)
|
(7,461
|
)
|
|||
|
Total property, plant, and equipment, net
|
$
|
5,390
|
|
$
|
5,653
|
|
|
|
Accrued and other current liabilities:
|
|||||||
|
Compensation
|
$
|
2,948
|
|
$
|
2,641
|
|
|
|
Warranty liability
|
367
|
|
405
|
|
|||
|
Income and other taxes
|
1,229
|
|
943
|
|
|||
|
Other
|
3,117
|
|
3,130
|
|
|||
|
Total accrued and other current liabilities
|
$
|
7,661
|
|
$
|
7,119
|
|
|
|
Other non-current liabilities:
|
|||||||
|
Warranty liability
|
$
|
172
|
|
$
|
199
|
|
|
|
Deferred and other tax liabilities
|
6,110
|
|
8,607
|
|
|||
|
Other
|
515
|
|
533
|
|
|||
|
Total other non-current liabilities
|
$
|
6,797
|
|
$
|
9,339
|
|
|
____________________
|
(a)
|
Prepaid expenses are included in other current assets in the Consolidated Statements of Financial Position.
|
|
(b)
|
During the fiscal years ended
February 2, 2018
,
February 3, 2017
, and
January 29, 2016
, the Company recognized
$1.5 billion
,
$1.2 billion
, and
$0.5 billion
, respectively, in depreciation expense. Additionally, during the fiscal year ended February 2, 2018, the Company retired
$1.1 billion
of fully depreciated property, plant, and equipment.
|
162
Additional Consolidated Statements of Income (Loss) Information
The table below provides details of interest and other, net for the fiscal years ended
February 2, 2018
,
February 3, 2017
, and
January 29, 2016
:
|
Fiscal Year Ended
|
|||||||||||
|
February 2, 2018
|
February 3, 2017
|
January 29, 2016
|
|||||||||
|
(in millions)
|
|||||||||||
|
Interest and other, net:
|
|||||||||||
|
Investment income, primarily interest
|
$
|
207
|
|
$
|
102
|
|
$
|
39
|
|
||
|
Gain (loss) on investments, net
|
72
|
|
4
|
|
(2
|
)
|
|||||
|
Interest expense
|
(2,406
|
)
|
(1,751
|
)
|
(680
|
)
|
|||||
|
Foreign exchange
|
(113
|
)
|
(77
|
)
|
(107
|
)
|
|||||
|
Debt extinguishment
|
—
|
|
(337
|
)
|
—
|
|
|||||
|
Other
|
(115
|
)
|
(45
|
)
|
(22
|
)
|
|||||
|
Total interest and other, net
|
$
|
(2,355
|
)
|
$
|
(2,104
|
)
|
$
|
(772
|
)
|
||
163
Condensed Financial Information of Parent Company
Dell Technologies Inc. has no material assets or standalone operations other than its ownership in its consolidated subsidiaries. There are restrictions under credit agreements and indentures governing the First Lien Notes and the Senior Notes on the Company's ability to obtain funds from any of its subsidiaries through dividends, loans, or advances.
As of February 2, 2018, the Company had certain consolidated subsidiaries that were designated as unrestricted subsidiaries for all purposes of the applicable credit agreements and such indentures. As of
February 2, 2018
, substantially all of the net assets of the Company's consolidated subsidiaries were restricted, with the exception of the Company's unrestricted subsidiaries, primarily VMware, Inc., SecureWorks, Pivotal, and their respective subsidiaries.
Accordingly, this condensed financial information is presented on a "Parent-only" basis. Under a Parent-only presentation, Dell Technologies Inc.'s investments in its consolidated subsidiaries are presented under the equity method of accounting.
The following table presents the financial position of Dell Technologies Inc. (Parent) as of
February 2, 2018
and
February 3, 2017
:
|
Dell Technologies Inc. (Parent)
|
February 2, 2018
|
February 3, 2017
|
|||||
|
(in millions)
|
|||||||
|
Assets:
|
|||||||
|
Cash and cash equivalents
|
$
|
—
|
|
$
|
123
|
|
|
|
Other current assets
|
1
|
|
—
|
|
|||
|
Investments in subsidiaries
|
9,735
|
|
13,412
|
|
|||
|
Other non-current assets
|
—
|
|
4
|
|
|||
|
Total assets
|
9,736
|
|
13,539
|
|
|||
|
Long-term debt (a)
|
26
|
|
26
|
|
|||
|
Accrued and other
|
—
|
|
39
|
|
|||
|
Redeemable shares
|
384
|
|
231
|
|
|||
|
Stockholders' equity:
|
|||||||
|
Common stock and capital in excess of $.01 par value
|
18,449
|
|
19,447
|
|
|||
|
Retained earnings (deficit)
|
(9,253
|
)
|
(5,609
|
)
|
|||
|
Accumulated other comprehensive income (loss)
|
130
|
|
(595
|
)
|
|||
|
Total stockholders' equity
|
9,326
|
|
13,243
|
|
|||
|
Total liabilities, redeemable shares, and stockholders' equity
|
$
|
9,736
|
|
$
|
13,539
|
|
|
____________________
|
(a)
|
In connection with the acquisition of Dell by Dell Technologies Inc. in the going-private transaction, Dell Technologies Inc. issued a
$2.0 billion
subordinated note to Microsoft Global Finance, a subsidiary of Microsoft Corporation. As of
February 2, 2018
and
February 3, 2017
, the outstanding principal amount of the Microsoft Note was
$26 million
, payable at maturity in October 2023.
|
164
The following table presents a reconciliation of (1) the equity in net loss of subsidiaries to the net loss attributable to Dell Technologies Inc. and (2) consolidated net loss to comprehensive net loss attributable to Dell Technologies Inc. for the fiscal years ended
February 2, 2018
,
February 3, 2017
, and
January 29, 2016
.
|
Fiscal Year Ended
|
|||||||||||
|
February 2, 2018
|
February 3, 2017
|
January 29, 2016
|
|||||||||
|
(in millions)
|
|||||||||||
|
Equity in net loss from continuing operations of subsidiaries attributable to Dell Technologies Inc.
|
$
|
(3,723
|
)
|
$
|
(3,684
|
)
|
$
|
(1,177
|
)
|
||
|
Equity in net income (loss) from discontinued operations of subsidiaries
|
—
|
|
2,019
|
|
64
|
|
|||||
|
Equity in net loss of subsidiaries attributable to Dell Technologies Inc.
|
(3,723
|
)
|
(1,665
|
)
|
(1,113
|
)
|
|||||
|
Parent - Interest and other, net
|
(2
|
)
|
(11
|
)
|
8
|
|
|||||
|
Parent - Income tax expense (benefit)
|
3
|
|
(4
|
)
|
(1
|
)
|
|||||
|
Consolidated net loss attributable to Dell Technologies Inc.
|
(3,728
|
)
|
(1,672
|
)
|
(1,104
|
)
|
|||||
|
Consolidated net loss attributable to Dell Technologies Inc.
|
(3,728
|
)
|
(1,672
|
)
|
(1,104
|
)
|
|||||
|
Other comprehensive income (loss) of subsidiaries attributable to Dell Technologies Inc.
|
725
|
|
(271
|
)
|
(353
|
)
|
|||||
|
Comprehensive loss attributable to Dell Technologies Inc.
|
$
|
(3,003
|
)
|
$
|
(1,943
|
)
|
$
|
(1,457
|
)
|
||
165
The following table presents the cash flows of Dell Technologies Inc. (Parent) for the fiscal years ended
February 2, 2018
,
February 3, 2017
, and
January 29, 2016
.
|
Fiscal Year Ended
|
|||||||||||
|
Dell Technologies Inc. (Parent)
|
February 2, 2018
|
February 3, 2017
|
January 29, 2016
|
||||||||
|
(in millions)
|
|||||||||||
|
Change in cash from operating activities
|
$
|
(2
|
)
|
$
|
(2
|
)
|
$
|
(2
|
)
|
||
|
Cash flow from investing activities:
|
|||||||||||
|
Transfer to/from subsidiary
|
640
|
|
35,941
|
|
2
|
|
|||||
|
Acquisition of business, net of cash acquired
|
—
|
|
(39,521
|
)
|
—
|
|
|||||
|
Change in cash from investing activities
|
640
|
|
(3,580
|
)
|
2
|
|
|||||
|
Cash flow from financing activities:
|
|||||||||||
|
Proceeds from the issuance of DHI Group Common Stock
|
—
|
|
4,422
|
|
—
|
|
|||||
|
Shares repurchased for tax withholdings of equity awards
|
(33
|
)
|
(6
|
)
|
(2
|
)
|
|||||
|
Repurchases of DHI Group Common Stock
|
(6
|
)
|
(10
|
)
|
—
|
|
|||||
|
Repurchases of Class V Common Stock
|
(723
|
)
|
(701
|
)
|
—
|
|
|||||
|
Other
|
1
|
|
—
|
|
2
|
|
|||||
|
Change in cash from financing activities
|
(761
|
)
|
3,705
|
|
—
|
|
|||||
|
Change in cash and cash equivalents
|
(123
|
)
|
123
|
|
—
|
|
|||||
|
Cash and cash equivalents at beginning of the period
|
123
|
|
—
|
|
—
|
|
|||||
|
Cash and cash equivalents at end of the period
|
$
|
—
|
|
$
|
123
|
|
$
|
—
|
|
||
166
Valuation and Qualifying Accounts
The following table summarizes the Company's valuation and qualifying accounts for the fiscal years ended February 2, 2018, February 3, 2017, and January 29, 2016:
|
Fiscal Year Ended
|
|||||||||||
|
February 2, 2018
|
February 3, 2017
|
January 29, 2016
|
|||||||||
|
(in millions)
|
|||||||||||
|
Trade Receivables - Allowance for doubtful accounts
|
|||||||||||
|
Balance at beginning of period
|
$
|
57
|
|
$
|
36
|
|
$
|
38
|
|
||
|
Provision charged to income statement
|
60
|
|
43
|
|
64
|
|
|||||
|
Bad debt write-offs
|
(14
|
)
|
(22
|
)
|
(66
|
)
|
|||||
|
Balance at end of period
|
$
|
103
|
|
$
|
57
|
|
$
|
36
|
|
||
|
Trade Receivables - Allowance for customer returns
|
|||||||||||
|
Balance at beginning of period
|
$
|
293
|
|
$
|
123
|
|
$
|
130
|
|
||
|
Provision charged to income statement
|
473
|
|
470
|
|
410
|
|
|||||
|
Sales returns
|
(471
|
)
|
(300
|
)
|
(417
|
)
|
|||||
|
Balance at end of period
|
$
|
295
|
|
$
|
293
|
|
$
|
123
|
|
||
|
Customer Financing Receivables - Allowance for financing receivable losses
|
|||||||||||
|
Balance at beginning of period
|
$
|
143
|
|
$
|
176
|
|
$
|
194
|
|
||
|
Provision charged to income statement
|
103
|
|
75
|
|
104
|
|
|||||
|
Charge-offs, net of recoveries (a)
|
(101
|
)
|
(108
|
)
|
(122
|
)
|
|||||
|
Balance at end of period
|
$
|
145
|
|
$
|
143
|
|
$
|
176
|
|
||
|
Tax Valuation Allowance
|
|||||||||||
|
Balance at beginning of period
|
$
|
737
|
|
$
|
816
|
|
$
|
432
|
|
||
|
Charged to income tax provision
|
78
|
|
(488
|
)
|
384
|
|
|||||
|
Allowance acquired
|
—
|
|
409
|
|
—
|
|
|||||
|
Balance at end of period
|
$
|
815
|
|
$
|
737
|
|
$
|
816
|
|
||
____________________
|
(a)
|
Charge-offs to the allowance for financing receivable losses for customer financing receivables includes principal and interest.
|
167
NOTE 24
—
UNAUDITED QUARTERLY RESULTS
The following tables present selected unaudited consolidated statements of income (loss) for each quarter of Fiscal 2018 and Fiscal 2017:
|
Fiscal 2018
|
|||||||||||||||
|
Q1
|
Q2
|
Q3
|
Q4
|
||||||||||||
|
(in millions, except per share data)
|
|||||||||||||||
|
Net revenue
|
$
|
17,816
|
|
$
|
19,299
|
|
$
|
19,610
|
|
$
|
21,935
|
|
|||
|
Gross margin
|
$
|
4,302
|
|
$
|
4,809
|
|
$
|
5,163
|
|
$
|
5,780
|
|
|||
|
Net income (loss) from continuing operations attributable to Class V Common Stock
|
$
|
118
|
|
$
|
168
|
|
$
|
223
|
|
$
|
(223
|
)
|
|||
|
Net loss from continuing operations attributable to DHI Group
|
(1,452
|
)
|
(1,114
|
)
|
(1,160
|
)
|
(288
|
)
|
|||||||
|
Net loss from continuing operations attributable to Dell Technologies Inc.
|
(1,334
|
)
|
(946
|
)
|
(937
|
)
|
(511
|
)
|
|||||||
|
Income (loss) from discontinued operations, net of income taxes
|
—
|
|
—
|
|
—
|
|
—
|
|
|||||||
|
Net loss attributable to Dell Technologies Inc.
|
$
|
(1,334
|
)
|
$
|
(946
|
)
|
$
|
(937
|
)
|
$
|
(511
|
)
|
|||
|
Earnings (loss) per share attributable to Dell Technologies Inc. - basic:
|
|||||||||||||||
|
Continuing operations - Class V Common Stock - basic
|
$
|
0.57
|
|
$
|
0.83
|
|
$
|
1.10
|
|
$
|
(1.12
|
)
|
|||
|
Continuing operations - DHI Group - basic
|
$
|
(2.57
|
)
|
$
|
(1.97
|
)
|
$
|
(2.05
|
)
|
$
|
(0.51
|
)
|
|||
|
Discontinued operations - DHI Group - basic
|
$
|
—
|
|
$
|
—
|
|
$
|
—
|
|
$
|
—
|
|
|||
|
Earnings (loss) per share attributable to Dell Technologies Inc. - diluted:
|
|||||||||||||||
|
Continuing operations - Class V Common Stock - diluted
|
$
|
0.56
|
|
$
|
0.82
|
|
$
|
1.09
|
|
$
|
(1.12
|
)
|
|||
|
Continuing operations - DHI Group - diluted
|
$
|
(2.57
|
)
|
$
|
(1.97
|
)
|
$
|
(2.05
|
)
|
$
|
(0.51
|
)
|
|||
|
Discontinued operations - DHI Group - diluted
|
$
|
—
|
|
$
|
—
|
|
$
|
—
|
|
$
|
—
|
|
|||
168
|
|
Fiscal 2017
|
||||||||||||||
|
|
Q1
|
Q2
|
Q3
|
Q4
|
|||||||||||
|
|
(in millions, except per share data)
|
||||||||||||||
|
Net revenue
|
$
|
12,241
|
|
$
|
13,080
|
|
$
|
16,247
|
|
$
|
20,074
|
|
|||
|
Gross margin
|
$
|
2,193
|
|
$
|
2,336
|
|
$
|
3,899
|
|
$
|
4,531
|
|
|||
|
Net income from continuing operations attributable to Class V Common Stock
|
$
|
—
|
|
$
|
—
|
|
$
|
175
|
|
$
|
138
|
|
|||
|
Net loss from continuing operations attributable to DHI Group
|
(424
|
)
|
(261
|
)
|
(1,801
|
)
|
(1,518
|
)
|
|||||||
|
Net loss from continuing operations attributable to Dell Technologies Inc.
|
(424
|
)
|
(261
|
)
|
(1,626
|
)
|
(1,380
|
)
|
|||||||
|
Income (loss) from discontinued operations, net of income taxes
|
479
|
|
834
|
|
(438
|
)
|
1,144
|
|
|||||||
|
Net income (loss) attributable to Dell Technologies Inc.
|
$
|
55
|
|
$
|
573
|
|
$
|
(2,064
|
)
|
$
|
(236
|
)
|
|||
|
Earnings (loss) per share attributable to Dell Technologies Inc. - basic:
|
|||||||||||||||
|
Continuing operations - Class V Common Stock - basic
|
$
|
—
|
|
$
|
—
|
|
$
|
0.79
|
|
$
|
0.64
|
|
|||
|
Continuing operations - DHI Group - basic
|
$
|
(1.05
|
)
|
$
|
(0.65
|
)
|
$
|
(3.62
|
)
|
$
|
(2.68
|
)
|
|||
|
Discontinued operations - DHI Group - basic
|
$
|
1.18
|
|
$
|
2.06
|
|
$
|
(0.88
|
)
|
$
|
2.02
|
|
|||
|
Earnings (loss) per share attributable to Dell Technologies Inc. - diluted:
|
|||||||||||||||
|
Continuing operations - Class V Common Stock - diluted
|
$
|
—
|
|
$
|
—
|
|
$
|
0.78
|
|
$
|
0.64
|
|
|||
|
Continuing operations - DHI Group - diluted
|
$
|
(1.05
|
)
|
$
|
(0.65
|
)
|
$
|
(3.63
|
)
|
$
|
(2.68
|
)
|
|||
|
Discontinued operations - DHI Group - diluted
|
$
|
1.18
|
|
$
|
2.06
|
|
$
|
(0.88
|
)
|
$
|
2.02
|
|
|||
169
NOTE 25
—
RELATED PARTY TRANSACTIONS
Dell Technologies is a large global organization which engages in millions of purchase, sales, and other transactions during the fiscal year. The Company enters into purchase and sales transactions with other publicly-traded and privately-held companies, as well as not-for-profit organizations that could be influenced by members of the Company's board of directors or the Comany's executive officers. The Company enters into these arrangements in the ordinary course of its business. Transactions with related parties were immaterial for the fiscal years ended
February 2, 2018
,
February 3, 2017
, and
January 29, 2016
.
NOTE 26
—
SUBSEQUENT EVENTS
Divestiture
— On February 12, 2018, the Company entered into an agreement with Carbonite, Inc. to sell Mozy, Inc., a business of EMC that provides solutions for enterprise cloud backup, for a transaction price of approximately
$146 million
. Upon the closing of the transaction on March 19, 2018, the Company entered into a transition services agreement with Carbonite, Inc. pursuant to which the Company provides various administrative services on an interim transitional basis with an option to renew after that period.
DFS Securitization Facility
— On February 9, 2018, the Company entered into a credit agreement with financial institutions that provides DFS with
$1 billion
of additional capacity for the funding of U.S. customer financing receivables. The debt incurred under this agreement will be collateralized solely by the U.S. financing receivables in the facility. The debt will accrue interest at a variable rate and the duration of the debt will be based on the terms of the underlying financing receivables. Unless earlier terminated, the credit agreement will terminate on February 10, 2020.
Pivotal Initial Public Offering
— On March 23, 2018, in preparation for an initial public offering of Pivotal's Class A common stock, Pivotal filed a registration statement on Form S-1 with the SEC. No public market currently exists for Pivotal's Class A common stock.
Other than the matters identified above, there were no known events occurring after the balance sheet date and up until the date of the issuance of this report that would materially affect the information presented herein.
170
None.
This report includes the certifications of our Chief Executive Officer and Chief Financial Officer required by Rule 13a-14 under the Securities Exchange Act of 1934 (the "Exchange Act"). See Exhibits 31.1 and 31.2 filed with this report. This Item 9A includes information concerning the controls and control evaluations referred to in those certifications.
Evaluation of Disclosure Controls and Procedures
Disclosure controls and procedures (as defined in Rules 13a-15(e) and 15d-15(e) under the Exchange Act) are designed to provide reasonable assurance that information required to be disclosed in reports filed or submitted under the Exchange Act is recorded, processed, summarized, and reported within the time periods specified in SEC rules and forms and that such information is accumulated and communicated to management, including the chief executive officer and the chief financial officer, as appropriate to allow timely decisions regarding required disclosures.
In connection with the preparation of this report, our management, under the supervision and with the participation of our Chief Executive Officer and Chief Financial Officer, conducted an evaluation of the effectiveness of the design and operation of our disclosure controls and procedures as of
February 2, 2018
.
Based on that evaluation, our C
hief Executive Officer and Chief Financial Officer
have concluded that our disclosure controls and procedures were effective at the reasonable assurance level as of
February 2, 2018
.
Management’s Annual Report on Internal Control Over Financial Reporting
Management, under the supervision of the Chief Executive Officer and the Chief Financial Officer, is responsible for establishing and maintaining adequate internal control over financial reporting. Internal control over financial reporting (as defined in Rules 13a-15(f) and 15d(f) under the Exchange Act) is a process designed to provide reasonable assurance regarding the reliability of financial reporting and the preparation of financial statements for external purposes in accordance with generally accepted accounting principles. Internal control over financial reporting includes those policies and procedures which (a) pertain to the maintenance of records that, in reasonable detail, accurately and fairly reflect the transactions and dispositions of assets, (b) provide reasonable assurance that transactions are recorded as necessary to permit preparation of financial statements in accordance with generally accepted accounting principles, (c) provide reasonable assurance that receipts and expenditures are being made only in accordance with appropriate authorization of management and the board of directors, and (d) provide reasonable assurance regarding prevention or timely detection of unauthorized acquisition, use, or disposition of assets that could have a material effect on the financial statements.
In connection with the preparation of this report, our management, under the supervision and with the participation of our Chief Executive Officer and Chief Financial Officer, conducted an evaluation of the effectiveness of our internal control over financial reporting as of
February 2, 2018
, based on the criteria established in
Internal Control — Integrated Framework (2013)
issued by the Committee of Sponsoring Organizations of the Treadway Commission. As a result of that evaluation, management has concluded that our internal control over financial reporting was effective as of
February 2, 2018
.
The effectiveness of our internal control over financial reporting as of
February 2, 2018
, has been audited by PricewaterhouseCoopers LLP, our independent registered public accounting firm, as stated in their report, which is included in “Part II — Item 8 — Financial Statements and Supplementary Data.”
Changes in Internal Control Over Financial Reporting
On September 7, 2016, we completed our acquisition by merger of EMC Corporation as described elsewhere in this report. We continue to integrate policies, processes, people, technology, and operations relating to th
is transaction, and will continue to evaluate the impact of any related changes to our internal control over financial reporti
ng. There were no chang
es in our internal control over financial reporting during the fiscal quarter ended
February 2, 2018
that have materially affected, or are reasonably likely to materially affect, our internal control over financial reporting.
171
Limitations on the Effectiveness of Controls
Our system of controls is designed to provide reasonable, not absolute, assurance regarding the reliability and integrity of accounting and financial reporting. Management does not expect that our disclosure controls and procedures or our internal control over financial reporting will prevent or detect all errors and all fraud. A control system, no matter how well designed and operated, can provide only reasonable, not absolute, assurance that the objectives of the control system will be met. These inherent limitations include the following:
|
•
|
Judgments in decision-making can be faulty, and control and process breakdowns can occur because of simple errors or mistakes.
|
|
•
|
Controls can be circumvented by individuals, acting alone or in collusion with each other, or by management override.
|
|
•
|
The design of any system of controls is based in part on certain assumptions about the likelihood of future events, and there can be no assurance that any design will succeed in achieving its stated goals under all potential future conditions.
|
|
•
|
Over time, controls may become inadequate because of changes in conditions or deterioration in the degree of compliance with associated policies or procedures.
|
|
•
|
The design of a control system must reflect the fact that resources are constrained, and the benefits of controls must be considered relative to their costs.
|
On March 27, 2018, Jeremy Burton, Chief Marketing Officer of Dell Technologies Inc., informed the Company that he will resign from his position effective on April 13, 2018.
172
We have adopted a code of ethics applicable to our principal executive officer and our other senior financial officers. The code of ethics, which we refer to as our Code of Ethics for Senior Financial Officers, is available on the Investors page of our website at
www.delltechnologies.com
. To the extent required by SEC rules, we intend to disclose any amendments to this code and any waiver of a provision of the code for the benefit of any senior financial officers on our website within any period that may be required under SEC rules from time to time.
See "Part I — Item 1 — Business — Executive Officers of Dell Technologies" for more information about our executive officers, which is incorporated by reference in this Item 10. Other information required by this Item 10 is incorporated herein by reference to our definitive proxy statement for our 2018 annual meeting of stockholders, referred to as the "2018 proxy statement," which we will file with the SEC on or before 120 days after our 2018 fiscal year-end, and which will appear in the 2018 proxy statement under the captions "Proposal 1 — Election of Directors" and "Additional Information — Section 16(a) Beneficial Ownership Reporting Compliance."
The following information about the members of our board of directors and the principal occupation or employment of each director is provided as of the date of this report.
|
Michael S. Dell
Chairman and Chief Executive Officer
Dell Technologies Inc.
|
William D. Green
Public Company Director
|
|
David W. Dorman
Founding Partner
Centerview Capital Technology Management, L.P.
|
Ellen J. Kullman
Public Company Director
|
|
Egon Durban
Managing Partner
Silver Lake Partners
|
Simon Patterson
Managing Director
Silver Lake Partners
|
Information required by this Item 11 is incorporated herein by reference to the 2018 proxy statement, including the information in the 2018 proxy statement appearing under the captions "Proposal 1 — Election of Directors — Director Compensation" and "Executive Compensation."
Information required by this Item 12 is incorporated herein by reference to the 2018 proxy statement, including the information in the 2018 proxy statement appearing under the captions "Security Ownership of Certain Beneficial Owners and Management" and "Executive Compensation — Equity Compensation Plans."
Information required by this Item 13 is incorporated herein by reference to the 2018 proxy statement, including the information in the 2018 proxy statement appearing under the captions "Proposal 1 — Elections of Directors" and "Additional Information — Certain Relationships and Related Transactions."
173
Information required by this Item 14 is incorporated herein by reference to the 2018 proxy statement, including the information in the 2018 proxy statement appearing under the caption "Proposal 2 — Ratification of Appointment of Independent Registered Public Accounting Firm."
The following documents are filed as a part of this annual report on Form 10-K:
|
(1)
|
Financial Statements
: The following financial statements are filed as part of this report under "Part II — Item 8 — Financial Statements and Supplementary Data":
|
Consolidated Financial Statements:
Report of Independent Registered Public Accounting Firm
Consolidated Statements of Financial Position at
February 2, 2018
and
February 3, 2017
Consolidated Statements of Income (Loss) for the fiscal years ended
February 2, 2018
,
February 3, 2017
, and
January 29, 2016
Consolidated Statements of Comprehensive Income (Loss) for the fiscal years ended
February 2, 2018
,
February 3, 2017
, and
January 29, 2016
Consolidated Statements of Cash Flows for the fiscal years ended
February 2, 2018
,
February 3, 2017
, and
January 29, 2016
Consolidated Statements of Stockholders' Equity for the fiscal years ended
February 2, 2018
,
February 3, 2017
, and
January 29, 2016
Notes to Consolidated Financial Statements
|
(2)
|
Financial Statement Schedules
: The information required in the following financial statement schedules is included in
Note 23
of the Notes to the Consolidated Financial Statements under "Part II — Item 8 — Financial Statements and Supplementary Data":
|
Schedule I — Condensed Financial Information of Parent Company
Schedule II — Valuation and Qualifying Accounts
All other schedules have been omitted because they are not applicable or the required information is otherwise included in the Consolidated Financial Statements or Notes thereto.
|
(3)
|
Exhibits
:
|
|
Exhibit
Number
|
Description
|
|
|
|
||
174
175
176
177
178
179
|
101 .INS††
|
XBRL Instance Document.
|
|
|
101 .SCH††
|
XBRL Taxonomy Extension Schema Document.
|
|
|
101 .CAL††
|
XBRL Taxonomy Extension Calculation Linkbase Document.
|
|
|
101 .DEF††
|
XBRL Taxonomy Extension Definition Linkbase Document.
|
|
|
101 .LAB††
|
XBRL Taxonomy Extension Label Linkbase Document.
|
|
|
101 .PRE††
|
XBRL Taxonomy Extension Presentation Linkbase Document.
|
|
_________________
|
†
|
Annexes, schedules and exhibits have been omitted pursuant to Item 601(b)(2) of Regulation S-K. Dell Technologies Inc. agrees to furnish supplementally a copy of any omitted attachment to the Securities and Exchange Commission on a confidential basis upon request.
|
|
††
|
Filed with this report.
|
|
†††
|
Furnished with this report.
|
|
*
|
Management contracts or compensation plans or arrangements in which directors or executive officers participate.
|
|
**
|
Pursuant to Item 601(b)(4)(iii) of Regulation S-K, copies of instruments defining the rights of holders of certain long-term debt of the Company and its subsidiaries are not filed. The Company agrees to furnish to the Securities and Exchange Commission, upon request, a copy of each instrument with respect to issuances of such long-term debt.
|
None.
180
SIGNATURES
Pursuant to the requirements of Section 13 or 15(d) of the Securities Exchange Act of 1934, the registrant has duly caused this report to be signed on its behalf by the undersigned, thereunto duly authorized.
|
DELL TECHNOLOGIES INC.
|
||
|
|
By:
|
/s/ MICHAEL S. DELL
|
|
Michael S. Dell
|
||
|
Chairman and Chief Executive Officer
|
||
|
(Duly Authorized Officer)
|
||
Date:
March 29, 2018
Pursuant to the requirements of the Securities Exchange Act of 1934, this report has been signed below by the following persons on behalf of the registrant and in the capacities indicated as of
March 29, 2018
:
|
Signature
|
Title
|
|
|
/s/ MICHAEL S. DELL
|
Chairman and Chief Executive Officer
|
|
|
Michael S. Dell
|
(principal executive officer)
|
|
|
/s/ DAVID W. DORMAN
|
Director
|
|
|
David W. Dorman
|
||
|
/s/ EGON DURBAN
|
Director
|
|
|
Egon Durban
|
||
|
/s/ WILLIAM D. GREEN
|
Director
|
|
|
William D. Green
|
||
|
/s/ ELLEN J. KULLMAN
|
Director
|
|
|
Ellen J. Kullman
|
||
|
/s/ SIMON PATTERSON
|
Director
|
|
|
Simon Patterson
|
||
|
/s/ THOMAS W. SWEET
|
Executive Vice President and Chief Financial Officer
|
|
|
Thomas W. Sweet
|
(principal financial officer)
|
|
|
/s/ MAYA MCREYNOLDS
|
Senior Vice President, Corporate Finance and
|
|
|
Maya McReynolds
|
Chief Accounting Officer
|
|
|
(principal accounting officer)
|
||
181
TABLE OF CONTENTS
Part IItem 1 BusinessItem 1A Risk FactorsItem 1B Unresolved Staff CommentsItem 2 PropertiesItem 3 Legal ProceedingsItem 4 Mine Safety DisclosuresPart IIItem 5 Market For Registrant's Common Equity, Related Stockholder Matters and Issuer Purchases Of Equity SecuritiesItem 6 Selected Financial DataItem 7 Management's Discussion and Analysis Of Financial Condition and Results Of OperationsItem 7A Quantitative and Qualitative Disclosures About Market RiskItem 8 Financial Statements and Supplementary DataNote 1 Basis Of PresentationNote 2 Description Of Business and Summary Of Significant Accounting PoliciesNote 3 Business CombinationsNote 4 Discontinued OperationsNote 5 Fair Value MeasurementsNote 6 InvestmentsNote 7 Financial ServicesNote 8 DebtNote 9 Derivative Instruments and Hedging ActivitiesNote 10 Goodwill and Intangible AssetsNote 11 Warranty LiabilityNote 12 Severance ChargesNote 13 Commitments and ContingenciesNote 14 Income and Other TaxesNote 15 Accumulated Other Comprehensive LossNote 16 Non-controlling InterestsNote 17 Earnings (loss) Per ShareNote 18 CapitalizationNote 19 Stock-based CompensationNote 20 Redeemable SharesNote 21 Retirement Plan BenefitsNote 22 Segment InformationNote 23 Supplemental Consolidated Financial InformationNote 24 Unaudited Quarterly ResultsNote 25 Related Party TransactionsNote 26 Subsequent EventsItem 9 Changes in and Disagreements with Accountants on Accounting and Financial DisclosureItem 9A Controls and ProceduresItem 9B Other InformationPart IIIItem 10 Directors, Executive Officers, and Corporate GovernanceItem 11 Executive CompensationItem 12 Security Ownership Of Certain Beneficial Owners and Management and Related Stockholder MattersItem 13 Certain Relationships and Related Transactions, and Director IndependenceItem 14 Principal Accounting Fees and ServicesPart IVItem 15 Exhibits, Financial Statement SchedulesItem 16 Form 10-k Summary