QUEST DIAGNOSTICS INC
10-Ks and 10-Qs
|
|
|
|
|
|
|
|
|
|
|
|
|
|
|
|
|
|
|
|
|
|
|
|
|
|
|
|
|
|
|
|
|
|
|
|
|
|
|
|
|
|
|
|
|
|
|
|
|
|
|
|
|
|
|
|
UNITED STATES SECURITIES AND EXCHANGE COMMISSION
WASHINGTON, DC 20549
FORM 10-K
Annual Report Pursuant to Section 13 or 15(d) of
the Securities Exchange Act of 1934
For the Fiscal Year Ended
December 31, 2018
Commission File Number 001-12215
Quest Diagnostics Incorporated
500 Plaza Drive
Secaucus, New Jersey 07094
(973) 520-2700
Delaware
(State of Incorporation)
16-1387862
(I.R.S. Employer Identification Number)
|
Securities registered pursuant to Section 12(b) of the Act:
|
|
|
Title of Each Class
|
Name of Each Exchange on Which Registered
|
|
Common Stock, $.01 par value per share
|
New York Stock Exchange
|
|
Securities registered pursuant to Section 12(g) of the Act:
|
None
|
Indicate by check mark if the registrant is a well-known seasoned issuer, as defined in Rule 405 of the Securities Act.
Yes
X
No
Indicate by check mark if the registrant is not required to file reports pursuant to Section 13 or Section 15(d) of the Exchange Act.
Yes
No
X
Indicate by check mark whether the registrant: (1) has filed all reports required to be filed by Section 13 or 15(d) of the Securities Exchange Act of 1934 during the preceding 12 months (or for such shorter period that the registrant was required to file such reports), and (2) has been subject to such filing requirements for the past 90 days.
Yes
X
No
Indicate by check mark whether the registrant has submitted electronically every Interactive Data File required to be submitted and posted pursuant to Rule 405 of Regulation S-T (§232.405 of this chapter) during the preceding 12 months (or for such shorter period that the registrant was required to submit and post such files).
Yes
X
No
Indicate by check mark if disclosure of delinquent filers pursuant to Item 405 of Regulation S-K (§229.405 of this chapter) is not contained herein, and will not be contained, to the best of registrant's knowledge, in definitive proxy or information statements incorporated by reference in Part III of this Form 10-K or any amendment to this Form 10-K. [X]
Indicate by check mark whether the registrant is a large accelerated filer, an accelerated filer, a non-accelerated filer, a smaller reporting company, or an emerging growth company. See the definitions of “large accelerated filer,” “accelerated filer,” “smaller reporting company,” and "emerging growth company" in Rule 12b-2 of the Exchange Act.
|
Large accelerated filer
x
|
Accelerated filer
o
|
|
Non-accelerated filer
o
|
Smaller reporting company
o
|
|
Emerging growth company
o
|
|
If an emerging growth company, indicate by check mark if the registrant has elected not to use the extended transition period for complying with any new or revised financial accounting standards provided pursuant to Section 13(a) of the Exchange Act. [ ]
Indicate by check mark whether the registrant is a shell company (as defined in Rule 12b-2 of the Exchange Act). Yes
No
X
As of June 30,
2018
, the aggregate market value of the approximately $136 million shares of voting and non-voting common equity held by non-affiliates of the registrant was approximately $14.9 billion, based on the closing price on such date of the registrant's Common Stock on the New York Stock Exchange.
As of
January 31, 2019
, there were outstanding
134,261,768
shares of the registrant’s common stock, $.01 par value.
|
Documents Incorporated by Reference
|
Part of Form 10-K into
which incorporated
|
|
Document
|
|
|
Portions of the registrant's Proxy Statement to be filed by April 30, 2019
|
Part III
|
Such Proxy Statement, except for the portions thereof which have been specifically incorporated by reference, shall not be deemed “filed” as part of this report on Form 10-K.
TABLE OF CONTENTS
|
Item
|
Page
|
|
|
Item 1.
|
||
|
Item 1A.
|
||
|
Item 1B.
|
||
|
Item 2.
|
||
|
Item 3.
|
||
|
Item 4.
|
||
|
Item 5.
|
||
|
Item 6.
|
||
|
Item 7.
|
||
|
Item 7A.
|
||
|
Item 8.
|
||
|
Item 9.
|
||
|
Item 9A.
|
||
|
Item 9B.
|
||
|
Item 10.
|
||
|
Item 11.
|
||
|
Item 12.
|
||
|
Item 13.
|
||
|
Item 14.
|
||
|
Item 15.
|
||
|
Item 16.
|
||
i
The discussion in Item 1 below includes several defined terms:
ACA - Affordable Care Act
ACO - Accountable Care Organization
CAP - The College of American Pathologists
CLIA - Clinical Laboratory Improvement Act
CMS - Centers for Medicare and Medicaid Services
FDA - U.S. Food and Drug Administration
IDN - Independent Delivery Network (including hospital health systems)
IPA - Independent Physician Association
LDT - Laboratory-Developed Test
PAMA - The Protecting Access to Medicare Act of 2014
The discussion also includes several tables, indexed in the following guide.
|
Guide to Tables
|
|
|
Table 1 - Portfolio Growth
|
3
|
|
Table 2 - Approaches to Accelerate Growth
|
3
|
|
Table 3 - Key Professional Laboratory Services Offerings
|
4
|
|
Table 4 - Clinical Franchises
|
4
|
|
Table 5 - Recent Consumer-Centric Initiatives
|
5
|
|
Table 6 - Major Themes to Drive Operational Excellence
|
6
|
|
Table 7 - Assets and Capabilities
|
8
|
|
Table 8 - 2018 Net Revenues
|
10
|
|
Table 9 - U.S. Clinical Testing Industry
|
13
|
|
Table 10 - Key Trends
|
13
|
|
Table 11 - Contributing to Reducing Healthcare Costs and Improving Care
|
17
|
|
Table 12 - Customers
|
18
|
|
Table 13 - Factors Considered When Selecting a Diagnostics Information Services Provider
|
21
|
|
Table 14 - 2018 Medicare and Medicaid Revenues as % of Consolidated Net Revenues
|
24
|
|
Table 15 - Key Regulatory Schemes
|
24
|
|
Table 16 - Information Available at Our Corporate Governance Webpage
|
27
|
|
Table 17 - Executive Officers
|
28
|
Item 1. Business
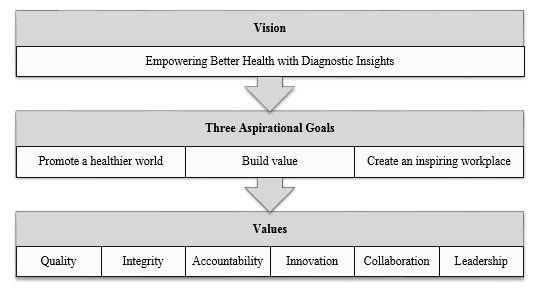
OVERVIEW, VISION, GOALS AND VALUES
Quest Diagnostics Incorporated is the world's leading provider of diagnostic information services. We play a crucial role in the healthcare ecosystem, empowering people to take action to improve health outcomes. Derived from the world's largest database of clinical lab results, our diagnostic insights reveal new avenues to identify and treat disease, inspire healthy behaviors and improve health care management. In the right hands and with the right context, our diagnostic insights can inspire actions that transform lives.
Quest Diagnostics was incorporated in Delaware in 1990; its predecessor companies date back to 1967. We conduct business through our headquarters in Secaucus, New Jersey, and our laboratories, patient service centers, offices and other facilities around the United States and in selected locations outside the United States. Unless the context otherwise requires, the terms “Quest Diagnostics,” the “Company,” “we” and “our” mean Quest Diagnostics Incorporated and its consolidated subsidiaries.
1
The patients we serve comprise approximately one-third of the adult population of the United States annually, and approximately one-half of the adult population in the United States over a three-year period. We estimate that annually we serve approximately half of the physicians and half of the hospitals in the United States.
During
2018
, we generated net revenues of
$7.5 billion
. Additional financial information concerning Quest Diagnostics, including our consolidated subsidiaries and businesses, for each of the years ended
December 31, 2018
,
2017
and
2016
is included in the consolidated financial statements and notes thereto in “Financial Statements and Supplementary Data” in Part II, Item 8.
We have the following vision, goals and values.
OUR STRATEGY
We have a two-point business strategy, reviewed by our Board of Directors and most recently updated at our Investor Day in November 2018, to achieve our vision and our goals.

Accelerate Growth
Our strategy to accelerate revenue growth is based on looking at the Company’s portfolio of services, from the perspective of growth, as discussed in the following table.
2
|
Table 1 - Portfolio Growth
|
|||
|
Theme
|
Key Characteristics
|
At A Glance
|
Quest Value Proposition
|
|
General Diagnostics
|
Testing services generating strong cash flows and steady growth
|
Routine and non-routine testing services
Largest revenue stream
Essential portion of health care delivery
|
Scale
Operational excellence
Access and convenience
|
|
Advanced Diagnostics
|
Testing services providing faster growth through innovation testing model
|
Genetic and advanced molecular testing services
An important part of precision medicine
A growing set of unique, innovation-based competitors
|
Rich clinical, scientific and medical innovation expertise
Quality and reliability of new assays
Ability to manage potential new regulatory requirements
|
|
Diagnostic Services
|
Laboratory and data-related healthcare opportunities providing faster growth
|
Enables partners to deliver health care more efficiently (
e.g.
, risk assessment; Professional Laboratory Services; wellness)
Services to support population health (
e.g.
, data analytics; extended care services)
|
Extensive diagnostic capability
Large and growing database and analytics expertise
Partnerships with industry leaders across healthcare landscape
|
The Company has identified the following five approaches to accelerate growth.
|
Table 2 - Approaches to Accelerate Growth
|
|
1. Delivering a compound annual revenue growth rate of more than 2% through accretive, strategic acquisitions
|
|
Plus organic growth through:
|
|
2. Partnering with health plans, IDNs and other risk bearing entities
|
|
3. Offering the broadest access to diagnostic innovation
|
|
4. Being recognized as the consumer-friendly provider of diagnostic information services
|
|
5. Supporting population health with data analytics and extended care services
|
1. Growing through acquisitions.
The Company has maintained a strategy since November 2012 to grow revenue each year by a 1-2% compound annual growth rate through accretive, strategic acquisitions. At our Investor Day in November 2018, we announced that, in view of key trends in the clinical testing industry (see the discussion of Key Trends on page13, our strategy now is to generate a compound annual growth rate of more than 2%. The Company's approach to acquisitions is discussed below on page 7, under the heading
Deliver disciplined capital deployment
.
2. Partnering with health plans, IDNs and other risk bearing entities.
To help accelerate growth, we are focusing significant resources on large opportunities to partner with outside entities. We are deepening our relationships with health plans. We attempt to build strong partnerships with health plans through engagement, including of the plans, employers, members and clinicians. We strengthen our relationships with health plans and increase the volume of our services for their members by driving value with employers and providing strong value propositions for members and clinicians. This includes building an information platform to help health plans manage utilization and population health, and enhancing processes to help plans keep laboratory testing in network. In 2018, the Company established a long-term strategic partnership with UnitedHealthcare, including collaborating on a variety of value-based programs, became a preferred provider to Horizon Blue Cross Blue Shield of New Jersey (with the exception of its managed Medicaid and Dual Eligible Special Needs plan beneficiaries) and became a participating provider to Blue Cross Blue Shield of Georgia. As a result, the Company began 2019 with access to more than 43 million additional insured lives.
3
We believe that the growing challenges faced by IDNs provides us with an opportunity to more effectively partner with IDNs as they reconsider their laboratory testing strategy. We have deployed a dedicated health systems team to strengthen our relationships with IDNs, including with respect to their reference testing. We provide reference testing for approximately 50% of hospitals in the U.S., and are the leading provider of this testing in the country. Through our Professional Laboratory Services offerings, we have developed a full suite of solutions to help IDNs build and execute their laboratory strategy. Our industry-leading offering, highlighted in table 3 below, enables IDNs to improve quality, reduce the cost of care and focus on core competencies. We believe that market forces including continued price transparency, cost and utilization pressure, evolving healthcare payment models, capital needs, changing technology and limited resources will drive demand for our expertise. In 2018, we implemented a new Professional Laboratory Services relationship with Regional Medical Center Health System, a regional health care provider for a five-county service area in northeast Alabama.
|
Table 3 - Key Professional Laboratory Services Offerings
|
|
|
Lab management outsourcing
|
Advanced data solutions
|
|
Joint venture
|
Reference testing, including advanced diagnostics
|
|
Outreach acquisition
|
Supply chain management and purchasing
|
|
Test menu optimization and spend consolidation
|
Blood utilization management
|
3.
Offering the broadest access to diagnostic innovation.
Our diagnostic solutions deliver high clinical value to the medical community across the U.S. We create value through scientific and product innovation and solution delivery for major clinical opportunities. Starting with a clinical focus on a specific disease state or clinical problem, we take advantage of advanced technology for more precise, comprehensive and actionable information, and deliver the information to the medical community in a meaningful way. We make innovative diagnostic solutions available to community physicians through our connectivity solutions, operational footprint and by making complex results actionable. The 2018 acquisitions of the U.S. laboratory services business of Oxford Immunotec, Inc. (adding the T-SPOT.
TB
tuberculosis and Accutix
®
tick-borne disease testing services to our portfolio of innovative infectious disease testing services) and ReproSource (a national leader in specialty fertility diagnostic services) demonstrate our commitment to expand the reach of diagnostic innovation. We plan to expand our innovative diagnostic solutions through research and development, as well as partnerships with academic institutions, other technology and healthcare leaders and public health agencies.
Our clinical franchises, working with our research and development team, focus on these opportunities and coordinate with our commercial organization to deliver new and improved solutions. Our franchises, listed in table 4 below, are designed to enable us to perform like a boutique service provider while maintaining the advantages of our scale, and to identify and access growing market segments so that we can more wisely deploy our resources and target opportunities to best serve our customers and patients.
|
Table 4 - Clinical Franchises
|
|
|
Cardiovascular, Metabolic and Endocrinology
|
Oncology
|
|
General Health and Wellness
|
Prescription Drug Monitoring and Toxicology
|
|
Infectious Diseases and Immunology
|
Sports Science and Human Performance
|
|
Neurology
|
Women’s and Reproductive Health
|
Our 2018 introduction of
Cardio IQ
®
Insulin Resistance Panel with Score and familial hypercholesterolemia in the cardiometabolic and endocrine area, the growth of tuberculosis testing in our infectious diseases and immunology offerings and the continued growth of our prescription drug monitoring and toxicology testing are recent examples of the power of our clinical franchises to deliver new solutions and foster growth.
4.
Being recognized as the consumer-friendly provider of diagnostic information services
. Consumers expect more from their healthcare providers. They seek convenience, a superior and personalized experience relevant to their needs, and to be empowered to make their own healthcare decisions. Those desires inform our design for our consumer experience. We plan to continue to increase our retail presence, improve the consumer experience and offer consumers the ability to directly access
4
our quality diagnostic information services. The Company has a long history of focusing on consumer interests, including being the first national diagnostic information services provider to offer on-line patient appointment scheduling and a patient connectivity solution. We are a leader in unaided consumer brand awareness among lab services providers and have a high level of satisfaction among patients who have used our services. We have multiple consumer-centric initiatives, highlighted in table 5, focused on securing growth.
|
Table 5 - Recent Consumer-Centric Initiatives
|
|
|
Enhance patient experience
|
• Electronic check-in at patient service centers.
• Improved on-line pre-registration and appointment scheduling.
• Real-time payment determination for additional payers.
|
|
Expand convenient access
|
• Partnerships with Walmart Stores and Safeway to expand convenient access to testing services at select Walmart and Safeway locations across the United States; the number of locations significantly increased in 2018 to over 200.
|
|
Consumer-initiated testing
|
• QuestDirect
TM
, our consumer-initiated testing service, is now available in 48 states.
• Consumers can choose from 35 test packages including general health, men's and women's health, digestive health, heart health, infectious disease and sexually transmitted disease testing.
|
|
Expand consumer connectivity and access to information
|
• >6.5 million registered users in our MyQuest
®
health portal and mobile connectivity solution. Implemented MyQuest Advanced Access
®
, which enables patients to access their historical laboratory test results and trends.
• Patients can manage healthcare for a circle of individuals and receive personal appointment reminders via text messaging.
• MyQuest
®
now supports Health Records using the Apple Health app.
|
|
Expand access to basic health care services
|
• Launched partnership with Walmart Stores to expand access to basic health care services.
|
|
Expand sports diagnostics offering
|
• Continued enhancement and expansion of our Blueprint for Athletes
®
offerings.
|
|
Self-collection technology
|
• Launched proprietary, consumer-friendly self-collection technology to engage consumers at home.
|
|
Expand consumer awareness
|
• Multi-year global collaboration with AncestryDNA to provide genotyping test services.
|
5.
Supporting population health with data analytics and extended care services.
We support population health by offering services designed to identify gaps in care in a population, provide clinical solutions to close the gaps and foster consumer engagement with a solution. Our services help healthcare providers, health plans, sponsors and IDNs deliver better care to their patient populations by identifying and filling gaps in care for their patient populations. We pursue opportunities to provide solutions centered on evidence-supported standards of care and guideline mandated testing. Our offerings include data analytics and extended care services, including services designed to capture and document information. Our services leverage the power of our information assets and integrate our extensive clinical data, to offer solutions using data information services and strategies that enable our customers to deliver the most effective healthcare to the right populations and individuals. Our extended care services leverage our assets and capabilities (
e.g
., call centers, patient service centers and mobile workforce) and our collaborative approach. In 2018, we acquired Mobile Medical Examination Service
TM
, LLC, a leading national provider of home-based health risk assessments and related services with a network of mobile professionals, expanding the services that we provide and strengthening our capabilities to help close gaps in care.
Drive operational excellence
We strive to enhance operational excellence and improve our quality and efficiency across every portion of our value chain and supporting operations, from the time that we interact with a potential customer until the time we receive payment. Improving our operations will yield many benefits, including: enhancing customer experience; improving our quality and competitiveness; strengthening our foundation for growth; and increasing employee engagement and shareholder value.
5
We are building a superior experience, at lower cost, for all of our customers, including patients, health plans, IDNs and clinicians. We endeavor to improve our processes and effectiveness at the same time. We are guided by a service dashboard that focuses throughout our operations on quality for patients, health care providers and employees, including medical quality, on-time delivery, competitive costs and employee safety. We are focusing on the following major themes to drive operational excellence.
|
Table 6 - Major Themes to Drive Operational Excellence
|
|
|
Reduce denials and patient concessions
|
Standardize and automate
|
|
Digitize the customer experience
|
Optimize
|
In 2018, we made strong progress on our initiatives. For example, we completed outfitting our patient service centers with electronic patient check-in, significantly increased the number of health plans using real-time estimation of consumer bills, standardized multiple test platforms (
e.g
., prescription drug monitoring and hematology) and commenced construction of our new 250,000 square foot flagship laboratory in Clifton, New Jersey.
Our cost excellence program, Invigorate, includes structured plans to drive savings and improve performance across the end-to-end value chain, including in such areas as revenue services, information technology and procurement. We exited 2017 with total run-rate savings in excess of $1.3 billion, compared to 2011. We currently aim annually to save approximately 3% of our costs, and in 2018 we achieved that goal.
OUR STRENGTHS
We are the world's leading provider of diagnostic information services. We are the leading provider in the United States of clinical laboratory and anatomic pathology testing, and related services. We offer high value diagnostic information services and diagnostic solutions that are attractive to our customers (discussed under the heading
Customers
beginning on page 17). We believe that our customers prefer providers that offer a comprehensive and innovative range of tests and services and convenient access to those services. We believe that, by offering such services, we strengthen our market offering, market position and reputation. Our strengths are discussed below.
Strong operating principles
We have a foundation of three strong operating principles: strengthen organizational capabilities; remain focused on diagnostic information services; and deliver disciplined capital deployment.
Strengthen organizational capabilities.
We continuously strive to strengthen our organizational capabilities to support our strategy, enable growth and productivity, better focus on our customers, speed decision-making and empower employees. Highlights include:
|
•
|
Our organization is designed to align around future growth opportunities, coordinate units in our business for seamless execution and leverage our company-wide infrastructure to gain more capability, value and efficiency. The value creation side of our business includes product and commercial marketing and is organized by clinical franchise and focuses on customer solutions for the marketplace, including new test development and diagnostic insights. The value delivery side includes sales, laboratory operations, field operations, logistics and client services.
|
|
•
|
We use the Quest Management System to manage our Company. This system provides a foundation for day-to-day management, and includes best-in-class business performance tools to help us develop new capabilities to improve our Company. The system enables us to run the Company with a common language, approach and philosophy, and supports our efforts as we build a high-performance culture, with employees focused on behaviors to make us more agile, transparent, customer-focused, collaborative and performance oriented.
|
|
•
|
Our Everyday Excellence program, which includes guiding principles for our entire organization to support a superior customer experience and to inspire our employees to be their best every day, with every person and with every customer interaction. In 2018, we integrated these principles into our performance assessments and frontline employee behavioral standards.
|
6
|
•
|
Our Leading Quest Academy, which is designed to strengthen our more senior employee leaders through a highly experiential leadership development program focused on creating a high-performance culture and sharpening the capabilities needed to lead our organization, and leadership training programs for other employees.
|
|
•
|
Our Code of Ethics reinforces our commitment to integrity as one of our core values and aligns with our vision, goals and brand.
|
Remain focused on diagnostic information services.
We maintain a sharp focus on providing diagnostic information services. In 2016, we completed our efforts to refocus on these services when we concluded the disposition of our products business. Since 2012, our asset dispositions, including the 2018 sale of our diagnostic information services business in India, collectively generated approximately $1 billion of proceeds.
Deliver disciplined capital deployment.
Our disciplined capital deployment framework includes dividends, share repurchases and investment in our business. The framework is grounded in maintaining an investment grade credit rating. We expect to return a majority of our free cash flow to investors through a combination of dividends and share repurchases. Consistent with that expectation, in November 2018 we announced that we increased our quarterly common stock dividend by 6%, from $0.50 per common share to $0.53 per common share. This represents our eighth increase in the dividend since 2011. For many years, we have maintained a common stock repurchase program. Since the beginning of 2013, we have returned approximately $2.8 billion to stockholders through repurchases of our common stock. Our share repurchases, dividends and capital expenditures in each of the last five years are presented in
Selected Historical Financial Data of Our Company
beginning on page
49
.
The Company's strategy includes generating growth through value-creating, strategically-aligned acquisitions using disciplined investment criteria. We screen potential acquisitions using guidelines that assess strategic fit and financial considerations, including value creation, return on invested capital and impact on our earnings. In 2018, we consummated seven acquisitions, including Mobile Medical Examination Services, LLC (a leading national provider of home-based health risk assessments and related services) and the U.S. laboratory services business of Oxford Immunotec, Inc. (adding the T-SPOT.
TB
tuberculosis and Accutix
®
tick-borne disease testing services to our portfolio of innovative infectious disease testing services). Our material acquisitions in each of the last three years are further discussed in Note 6 to the Consolidated Financial Statements (Part II, Item 8 of this Report).
We will continue to invest in our business in a disciplined manner, including focusing on enhancing our solid foundation of strategic assets and capabilities, accelerating growth and driving operational excellence. Our near-term investments in growth are likely to focus on the strategies to accelerate growth set forth in table 2 above. Our near-term investments to drive operational excellence are likely to focus on improving the customer experience and gaining efficiency, systems standardization, digital enablement of our processes and footprint optimization.
Assets and capabilities to deliver value
We have unmatched size, scale and capabilities. Competitors differ in the services they provide and the reimbursement they receive. We take advantage of our scale, and through the quality and breadth of services that we offer, the manner in which we offer them and the reimbursement that we receive for them, we focus on delivering value to our customers.
7
|
Table 7 - Assets and Capabilities
|
|
|
●
Provide healthcare connectivity solutions to >335,000 clinician and hospital accounts and interface with approximately 700 electronic health records systems
|
●
Own or control approximately 1000 issued and 475 pending patents worldwide in 2018
|
|
●
Strong logistics capabilities
•
make approximately 77,000 stops daily
•
approximately 3,750 courier vehicles
•
25 aircraft serving the U.S.
|
●
One of the largest medical and scientific staffs in the industry to provide interpretive consultation
•
>600 M.D.s and Ph.D.s, many of whom are recognized leaders in their field
•
Genetic counselors
|
|
●
Approximately 22,000 phlebotomists, paramedics, nurses and other health and wellness professionals
|
●
>6,600 patient access points, the most extensive network in the U.S., including phlebotomists in physician offices and >2,250 of our own patient service centers
|
|
●
Access to approximately 90% of U.S. insured lives
|
●
Processed approximately 168 million test requisitions in 2018
|
|
●
Industry-leading test menu
|
●
The largest private database of de-identified test results: >44 billion patient data points delivered over past decade
|
Innovation
We are a leading innovator in diagnostic information services. We continue to introduce new tests, including many with a focus on personalized and targeted medicine, and new services. Our capabilities include discovery, technology development and clinical validation of diagnostic tests. We develop tests at our esoteric laboratories, such as Quest Diagnostics
®
, Nichols Institute
®
, Athena Diagnostics
®
, Med Fusion
TM
, LLC and Cleveland HeartLab
®
, Inc.
We transfer technical innovations to the market through our in-house expertise and our relationships with technology developers, including the academic community, pharmaceutical and biotechnology firms, emerging medical technology companies and others that develop and commercialize novel diagnostics, pharmaceutical and device technologies. We search for new opportunities and continue to build a robust pipeline of new solutions. Through our strengths in assay development and the commercialization of testing services, we believe that we are the partner of choice for developers of new technologies, services and tests to introduce their products to the marketplace.
We seek innovations and solutions that help healthcare providers care for their patients through better testing for predisposition, screening, monitoring, diagnosis, prognosis and treatment choices, and that will reduce the overall cost of healthcare. We seek to develop innovations and solutions that help to determine a patient's genotype or gene expression profile relative to a particular disease and its potential therapies, because they can help healthcare providers to determine a patient's susceptibility to disease or to tailor medical care to an individual's needs - such as determining if a medication might be an optimum choice for a particular person, or tailoring the right dosage once the proper medicine is prescribed. In addition, we aim to develop holistic solutions responsive to challenges that healthcare providers and patients face, by developing solutions of multiple tests, information and services focused on specific clinical challenges, and taking advantage of the latest informatics capabilities. We also look for innovations and solutions that are less invasive than currently available options, to increase the choices that healthcare providers and patients have for the collection of diagnostic samples. We additionally seek innovation in the ways we bring solutions to customers, and in the customer experience, including enhanced services and end-to-end solutions for convenience and support.
Collaboration
We believe that strategic relationships, including with healthcare providers, public health authorities, consumer-focused entities and others, can position us for growth at the center of healthcare and that healthcare companies that can partner effectively with others will be successful in the long term. We collaborate with partners that can help us to achieve our vision of empowering better health through diagnostic insights and have relationships across the spectrum of healthcare. We plan to continue to pursue strategic relationships to help accelerate growth and drive operational excellence.
Through our relationships, we believe that we are a leader in bringing to the market innovation and the ability to empower better health through diagnostic insights. As the industry leader with the largest and broadest U.S. network, we
8
believe we are the distribution channel of choice for developers of new solutions, including large commercial manufacturers, academic medical centers and pharmaceutical and biotechnology firms, to introduce their products to the marketplace. We maintain relationships with advisers and consultants who are leaders in key fields of science and medicine. We work with key groups and organizations, including world class healthcare and consumer-focused leaders, to foster important advances in healthcare, including in precision medicine and healthcare delivery.
In 2018, the Company forged several new strategic relationships, including with Rutgers University (to conduct research related to human athletic performance) and the Synaptic Alliance (establishing a pilot program applying blockchain technology in an effort to improve data quality and reduce administrative costs in healthcare).
Medical and Scientific Expertise
We have strong medical and scientific expertise and aspire to be a trusted authority in diagnostics medicine, provide insights and tools to support public and personal health, lead and facilitate scientific discussion and inspire innovation. Our medical and scientific experts regularly provide presentations, symposia and webinars regarding diagnostic testing and participate on scientific committees determining guidelines for diagnostic usage. They also publish research that demonstrates the clinical value and importance of diagnostic testing, including in connection with our research and development efforts, in peer-reviewed journals, textbooks and other publications. Our Quest Diagnostics Drug Testing Index
TM
is a periodic report of trends, derived from our aggregate drug testing results, cited by employers, the federal government and the media to help identify and quantify drug abuse among the nation's workforce.
Health Information Technology Solutions and Information Assets
We have a history of providing leading information technology for diagnostic information services, including for patients, clinicians and healthcare organizations. We were the first national diagnostic information services provider to offer on-line patient appointment scheduling and a patient connectivity solution. Our MyQuest
®
patient healthcare portal, with over 6.5 million registered users at year-end 2018, enables patients to manage healthcare and medical information for themselves and a circle of others and, among other things, use their smartphone or computer to order a test, receive appointment reminders, receive and archive their Quest Diagnostics test results, find a Quest Diagnostics location and schedule appointments. In 2018, we were a founding member of the Synaptic Healthcare Alliance, which is running a pilot program applying blockchain technology to improve data quality and reduce administrative costs associated with changes to health care provider demographic data.
We also have significant information assets, including many years of test result data, and offer a robust portfolio of powerful analytics that inspire action and deliver value to an array of customers. We offer an array of Quanum
®
solutions based on data insights, including retrospective analytics solutions for healthcare professionals and practices, health plans, IDNs, pharmaceutical companies and public health. We believe that solutions can tap the potential of large amounts of clinical information to: enhance the customer experience; deliver more precise, comprehensive solutions and actionable information; provide increased and interactive insights and analytics; foster greater adherence to clinical and reimbursement guidelines; and advance the development of precision medicine. In addition, we are developing workflow analytics solutions for lab stewardship and predictive analytics solutions for risk stratification. We believe that the breadth and depth of our data, combined with our powerful analytics capabilities, enables us to take advantage of important data-based opportunities in diagnostics, and provides us a competitive advantage.
Quality
Our goal is to provide every patient with services and products of superior quality. We strive to accomplish that through commitment, leadership, and establishing rigorous processes which we measure and continually seek to improve, and by using the Quest Management System, which provides best-in-class business performance tools to create and implement effective and sustainable quality processes. The Quest Diagnostics Quality Program includes policies and procedures to document, measure and monitor the effectiveness of our laboratory operations in providing and improving quality and meeting applicable regulatory requirements. The Quality Program is designed so that the quality of laboratory services is monitored objectively and evaluated systematically to deliver superior quality care, identify opportunities to improve patient care and resolve identified problems. To help achieve our goal of becoming recognized as the undisputed quality leader in the diagnostics information services industry, we have implemented our Quality System Framework, which serves as a reference guide for our employees and describes our Quality System Elements, which provide the structure for each laboratory to achieve and maintain quality processes. We also have a robust Supplier Quality Program designed to ensure we have a high quality supplier network and to raise the bar of quality expectations across that network.
9
Customer Focus
The customer is at the center of everything we do. Customers have a choice when it comes to selecting a healthcare provider and we strive to give them reason to put their trust in us. We use customer insights in developing our approach and processes, listening to the voice of external and internal customers. Focusing on a thorough understanding of customer needs and requirements, we seek to identify and implement solutions and processes that will result in a superior customer experience. Our experienced staff has a passion for providing the highest quality service to our customers. We strive to provide a superior experience for our customers because we believe that this will drive customer loyalty. Our brand -- Action from Insight
®
-- reflects our commitment to a superior customer experience. We also maintain our Everyday Excellence program, which includes guiding principles to support a superior customer experience, inspiring our employees to be their best every day, with every person and with every customer interaction.
BUSINESS OPERATIONS
As of December 31, 2018, the Company was made up of two businesses: Diagnostic Information Services and Diagnostic Solutions. Our Diagnostic Information Services business develops and delivers diagnostic information services, providing insights that empower and enable a broad range of customers, including patients, clinicians, hospitals, IDNs, health plans, employers and ACOs. Our Diagnostic Solutions group includes our risk assessment services business, which offers solutions for insurers, and our healthcare information technology businesses, which offers solutions for healthcare providers. Our services primarily are provided under the Quest Diagnostics brand, but we also provide services under other brands, including AmeriPath
®
, Dermpath Diagnostics
®
, Athena Diagnostics
®
, ExamOne
®
, and Quanum
®
.
We conduct substantially all of our business in the United States. We see opportunities to bring our experience and expertise in diagnostic information services to markets outside the United States, including leveraging existing facilities to serve new markets. We have laboratory facilities in Mexico and Puerto Rico, and have a majority interest in a joint venture in Brazil providing drugs of abuse testing in that market. In 2018, with other leading diagnostic laboratories outside the United States, we established the Global Diagnostics Network
TM
, a strategic working group of diagnostic laboratories committed to unleashing and sharing local innovation to increase global access to diagnostic science, information and services and generating enhanced diagnostic insights to improve the delivery of global healthcare.
We leverage our capabilities and assets to serve our multiple customer bases. The following table shows the percentage of our 2018 net revenues generated by the activities identified.

Diagnostic Information Services
Background - clinical testing.
Clinical testing is an essential element in the delivery of healthcare services. Clinicians use clinical testing for predisposition, screening, monitoring, diagnosis, prognosis and treatment choices of diseases and other medical conditions. Clinical testing is generally categorized as clinical laboratory testing and anatomic pathology services.
Clinical laboratory testing, which can be characterized as routine, non-routine or advanced, generally is performed on whole blood, serum, plasma and other body fluids, such as urine, and specimens such as microbiology samples. Clinical laboratory tests which can be performed by most clinical laboratories are considered routine. Routine testing measures various important bodily health parameters such as the functions of the kidney, heart, liver, thyroid and other organs. Commonly ordered routine tests include blood chemistries, urinalysis, allergy tests and complete blood cell counts. Non-routine tests may require professional “hands-on” attention from highly-skilled technical personnel, generally require more sophisticated
10
informatics, technology, equipment or materials, may be performed less frequently than routine tests and may be reimbursed at higher levels than routine tests. It may not be practical, from a cost-effectiveness or infrastructure perspective, for many hospitals, IDNs, ACOs, commercial laboratories or physician office laboratories to develop and perform a broad menu of non-routine tests, or to perform low-volume non-routine testing in-house. Such tests generally are outsourced to a clinical testing laboratory which can perform these non-routine tests. Some non-routine tests are advanced. Advanced tests include procedures in the areas of molecular diagnostics (including next-generation sequencing), oncology, neurology, companion diagnostics and non-invasive pre-natal and other germline genetic testing.
Anatomic pathology services are performed on tissues, such as biopsies, and other samples, such as human cells. Anatomic pathology involves the diagnosis of cancer and other diseases and medical conditions through examination of tissue and cell samples taken from patients.
Our services.
We are the world's largest provider of diagnostic information services. We provide information and insights based on the industry-leading menu of routine, non-routine and advanced clinical testing and anatomic pathology testing, and other diagnostic information services. We have built strong testing capabilities, including services for the predisposition, diagnosis, treatment and monitoring of cancers and other diseases, and offer advanced tests in many fields, including endocrinology, immunology, neurology and oncology. Increasingly, we are focused on providing solutions and insights to our customers, based on the testing that we perform, the data that we gather and our extensive medical, information and connectivity assets. We believe that offering services, solutions and insights based on a full range of tests, information assets and other capabilities strengthens our market offering, market position and reputation.
We offer the broadest access in the United States to diagnostic information services. We maintain a nationwide network of laboratories, including advanced laboratories (such as our world renowned Quest Diagnostics Nichols Institute
®
) as well as rapid response laboratories (smaller facilities where we can quickly perform an abbreviated menu of routine tests for customers that require rapid turnaround times). We operate 24 hours a day, 365 days a year. Our nationwide network also includes patient service centers, phlebotomists in physician offices, and our connectivity resources, including call centers and mobile paramedics, nurses and other health and wellness professionals. We provide interpretive consultation to healthcare providers through a large medical and scientific staff. Our in-house experts, including medical directors, scientific directors, genetic counselors and board certified geneticists, provide medical and scientific consultation to healthcare providers and patients regarding our tests and test results, and help them best utilize our services to improve outcomes and enhance satisfaction. We also provide testing services, inpatient anatomic pathology and medical director services at hospital laboratories.
We are a leading provider of infectious disease diagnostic information services and strive to be the first to provide diagnostic solutions for emerging infectious diseases, including our offerings for Zika, West Nile Virus, SARS and Influenza A H1N1. We have leading positions in prescription drug monitoring and toxicology, in neurology diagnostics, in advanced cardiovascular diagnostic information services, including our CardioIQ
®
and Cleveland HeartLab
®
offerings, and in cancer diagnostics, including our QuestVantage
®
and Med Fusion
TM
offerings. We are a leader in providing testing for the detection of employee use of drugs of abuse, offering a full range of solutions, including urine, hair, blood and oral fluid tests. We are the largest workplace drug testing provider certified by the U.S. Department of Health and Human Services to perform drug testing using electronic custody and control forms for federally-mandated, safety-sensitive workers.
We are a leading provider of wellness services, including biometric wellness screenings, flu shots and related preventative services that leverage clinical data to improve population health outcomes and reduce healthcare spend. Our wellness solution, Blueprint for Wellness
®
, begins with biometric screenings conveniently offered at the worksite or through our patient service centers. The solution includes highly personalized reporting and incentive management services. Our offering includes intervention programs focused on connecting participants to the right care at the right time, such as a program designed to prevent diabetes and other chronic conditions, and another program that enables participants to speak with a board-certified physician about their results and to be guided about actions based on those results. These services are sold directly to employers and through reseller partnerships with many health plans. We strengthened our wellness offering during 2018 by acquiring the assets of Provant Health, a provider of employer health and wellness services focused on whole person wellness and care cost management.
11
We offer Quanum
®
health information technology solutions, including our products and national healthcare provider network, to help healthcare organizations and clinicians empower better health by leveraging the power of our significant information assets, including many years of test result data, and our technology prowess, including our history of providing leading information technology for diagnostic information services. Our portfolio of offerings is designed to address analytic, clinical and financial needs. The solutions help healthcare organizations and clinicians analyze and put in context data, and enable them to connect across the healthcare system and engage with their stakeholders. They can enter, share and access clinical information without costly information technology implementation or significant workflow disruption. We carefully review our healthcare information technology solutions for compliance with relevant privacy laws and regulations, and for consistency with our Global Privacy Statement.
We offer an array of population health solutions to empower achievement of the triple aim of healthcare: improved quality of care; improved experience for the patient; and better management of overall health care cost. Our services build on the power of our information assets and data capabilities and help clinicians, health plans, sponsors and IDNs deliver better care to their patient populations by identifying gaps in care in a population, providing clinical solutions to close the gaps and fostering consumer engagement with a solution. Our extended care services, including home-based health risk assessments and related services, leverage our assets and capabilities (
e.g
., call centers, patient service centers and mobile workforce) and focus on extending the reach of clinician offices beyond their traditional four walls to assess the health of their populations, and doing so when and where it is convenient for consumers. Once gaps are identified, we engage patients in our retail sites, in home or by telephone, including through our call centers and our mobile base capabilities, including highly-trained healthcare professionals. We also offer services focused on chronic care management, and other services like post-hospital discharge visits, diabetic retinopathy and bone density examinations.
We also offer services to pharmaceutical companies. We have expertise with laboratory developed tests for companion and complementary diagnostics, and offer an array of assets and services to support the development of companion diagnostics, including our robust data set and patient services network. We also offer Quest Clinical Trials Connect
TM
, to help speed drugs to market through better patient recruitment and involvement and improved physician outreach.
Diagnostic Solutions
We are the leading provider of risk assessment services for the life insurance industry. In addition, we offer healthcare organizations and clinicians robust health information technology solutions.
Risk Assessment Services.
ExamOne
®
is the largest provider of risk assessment services to the life insurance industry in North America. We also provide risk assessment services for insurance companies operating outside North America. Our risk assessment services comprise underwriting support services, including data gathering, paramedical examinations and clinical laboratory testing and analytics, designed to assist life insurance companies objectively to evaluate the mortality risks of applicants. Most specimen collections and paramedical examinations are performed by our network of paramedical examiners at the applicant's home or workplace, but they also are offered at approximately 900 Company patient service centers in the United States and approximately 550 additional locations in North America. We also contract with third parties to coordinate providing these exams outside North America.
Healthcare Information Technology.
Our healthcare information technology offerings, including our Quanum
®
electronic health records system and our award-winning Quanum
®
Enterprise Content Solutions for hospitals and IDNs, connect data to decision-making and help clinicians advance clinical and operational strategies. Healthcare organizations have contracted for the use of Quanum
®
Enterprise Content Solutions at over 300 sites in North America. Our Quanum
®
electronic health records offering enables clinicians to generate a complete record of a clinical patient encounter, automates and streamlines the clinician's workflow, provides clinical decision support tools, captures patient encounter notes and lab and radiology results and enables secure communication with patients and other clinicians.
Other
Q
2
Solutions
®
, a joint venture with IQVIA Holdings Inc. in which we own a minority interest, is the second largest central laboratory services company in the world and provides services to customers across all segments of the biopharmaceutical industry. Central laboratory testing services are critical to advances in genomics, precision medicine and drug development. Q
2
Solutions
®
has helped develop many of the oncology precision medicine drugs approved by the FDA in recent years.
12
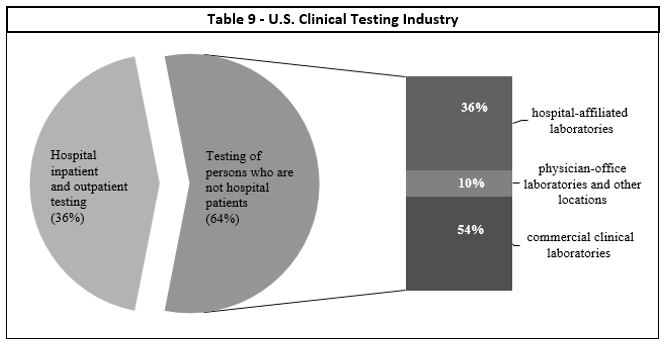
THE UNITED STATES CLINICAL TESTING INDUSTRY
The U.S. clinical testing industry consists of two segments. The following table discusses how we believe the industry is structured.
Key Trends
The healthcare system in the United States is evolving; significant change is taking place in the system. We expect that the evolution of the healthcare industry will continue, and that industry change is likely to be extensive. There are a number of key trends that are having, and that we expect will continue to have, a significant impact on the diagnostic information services business in the United States and on our business. These trends, discussed in the table below, present both opportunities and risks. We believe that several of the trends, including consolidation, price transparency and increased consumer involvement, are favorable to our business.
Because diagnostic information services is an essential healthcare service and because of the key trends discussed below, we believe that the industry will continue to grow over the long term. In addition, we believe that medical laboratory testing market fundamentals are changing. We believe that PAMA-driven reimbursement pressure will induce structural change; that health plan approaches to laboratory testing services will reduce variation in spending on these services; and that growing consumerization in healthcare is sharpening focus on price disparities. We believe that these changing market fundamentals will benefit low-cost, high-value providers like Quest and that we are well positioned to grow from the changing market conditions and benefit from the long-term growth expected in the industry.
|
Table 10 - Key Trends
|
|
|
Prevention and wellness
|
We believe that the value of detection, prevention, wellness and personalized care is well recognized. Consumers, employers, ACOs, IDNs, health plans and government agencies increasingly focus on helping the healthy stay healthy, detecting symptoms among those at risk and providing preventive insight and care that helps avoid disease.
|
|
Medical innovation
|
Medical advances allow for more accurate and earlier diagnosis and treatment of diseases.
Continuing advances in genomics and proteomics are expected to yield new, more sophisticated and specialized diagnostic tests. These advances also are spurring interest in and demand for precision medicine, which relies on diagnostic and prognostic testing and in which data information services and strategies are used to deliver the most effective healthcare to the right populations and individuals.
Pharmacogenomic testing increasingly is used as a parameter to help speed drug approval processes and to better focus therapy based on patient and tumor-specific genetic markers.
Demand also is growing toward comprehensive care management solutions that serve patients, payers and healthcare providers by improving clinical decision support and access to patient data, and by increasing patient participation in care management and population health management.
There is increasing focus on access to patient data and data-driven insights.
|
13
|
Customers and payers; industry consolidation
|
Our customers and payers, including clinicians, health plans, IDNs, ACOs, employers and others, have been consolidating, converging and diversifying. For example, an increased number of hospital systems are considering establishing or have established health insurance plans, and health insurance plans are considering providing or are providing healthcare services. CVS Health, a leading provider of retail medical clinics and pharmacy benefits management services, has acquired Aetna, a leading health insurance provider. Cigna Corporation, a leading health insurance provider, has acquired Express Scripts, a leading pharmacy benefits manager. United Health Group, the parent of UnitedHealthcare, provides a wide array of health care services through its Optum subsidiaries. Health plans are entering agreements with other providers of healthcare services, including laboratory testing services providers, to partner on value-based approaches to delivering health care to populations.
Consolidation is increasing pricing transparency and bargaining power, and may encourage internalization of clinical testing.
Physicians frequently now are employed by hospital systems, IDNs, ACOs or large group practices integrated with healthcare systems, instead of organizing physician-owned practices, which is changing the dynamics for whether clinical testing is performed in or outside of a hospital. Physicians and other clinicians also increasingly are being employed by health plans or their affiliates.
Value-based reimbursement is contributing to changes in the healthcare system. ACOs and patient-centered medical homes have grown as a means to deliver patient care. Healthcare services increasingly are being provided by non-traditional providers (e.g., physician assistants), in non-traditional venues (e.g., retail medical clinics, urgent care centers) and using new technologies (e.g., telemedicine; digital pathology).
In addition, federal healthcare reform legislation adopted in 2010, the ACA, is resulting in changes in the way that some healthcare services are purchased and delivered in the United States. Hospitals and IDNs are under significant pressure, and are evolving.
Patients are also our customers. Increasingly, patients are engaged in their own healthcare, being empowered to manage and understand their healthcare and are bearing responsibility for payment for the services provided to them. See also the discussion under the heading Patients in table 12.
|
|
Pricing transparency
|
There has been a trend toward greater pricing transparency in the healthcare marketplace.
This transparency, combined with increased patient financial responsibility for medical care, is enhancing purchasing sophistication and changes in behavior in the healthcare marketplace. We believe that increased price transparency should benefit low cost, high value providers like our Company.
|
|
Competition
|
The diagnostic information services industry remains fragmented, is highly competitive and is subject to new competition.
Competition is emerging from new technologies (e.g., digital pathology) and growing from non-traditional competitors. Increased hospital acquisitions of physician practices may enhance clinician ties to hospital-affiliated laboratories and may strengthen their competitive position.
New industry entrants with extensive resources may make acquisitions or expand into our traditional areas of operations.
|
|
Healthcare utilization
|
In the past few years, healthcare utilization in the United States has fluctuated based on a number of factors. These factors include, without limitation, the economy, healthcare benefits design, patients delaying medical care and increased patient financial responsibility for medical care.
The ACA contained provisions eliminating patient cost-sharing for preventive services, and additional provisions that we believe have increased the number of patients that have health insurance, including Medicaid, and thus better access to diagnostic testing.
|
14
|
Reimbursement pressure; affordability
|
There is a strong focus in the United States on controlling the overall cost of healthcare.
Healthcare market participants, including governments, are focused on controlling costs. Examples of cost control approaches include reducing reimbursement for healthcare services, changing reimbursement for healthcare services (e.g., shift from fee for service to capitation), changing medical coverage policies (e.g., healthcare benefits design), denying coverage for services, requiring preauthorization of laboratory testing, requiring co-pays, introducing laboratory spend management utilities and payment and patient care innovations such as ACOs and patient-centered medical homes.
In light of continued pressure to reduce systemic healthcare costs, hospitals may change their approach to providing clinical testing services.
The Health Transformation Alliance, a group of over 40 major U.S. companies, was formed to improve and reform the healthcare system in the United States. The rising cost of healthcare in the United States was a key driver for the formation of this alliance.
In 2018, Amazon.com Inc., Berkshire Hathaway Inc. and JPMorgan Chase &Co., citing rising health care costs, announced plans to reduce their workers' health care costs by forming a non-profit venture that would provide simplified, high-quality healthcare for their workers.
Pursuant to PAMA, CMS has promulgated revised reimbursement rates schedules for clinical laboratory testing services provided under Medicare for 2018, 2019 and 2020. Under the revised Medicare Clinical Laboratory Fee Schedule, reimbursement rates for clinical laboratory testing was reduced in 2018 and is scheduled to be reduced again by approximately 10% in each of 2019 and 2020. PAMA calls for further revision of the Medicare Clinical Laboratory Fee Schedule for years after 2020, based on future surveys of market rates; further reduction in reimbursement rates may result from such revisions.
The American Clinical Laboratory Association, of which the Company is a member, initiated a lawsuit charging that in implementing PAMA, CMS failed to follow a Congressional directive to implement a market-based laboratory payment system. The lawsuit was dismissed; appeal of the dismissal is pending. The Company supports this lawsuit and also is pursuing a legislative solution from the revised Medicare Clinical Laboratory Fee Schedule implemented by CMS under PAMA, which the Company contends resulted from a flawed process and failed to protect access to laboratory services for Medicare beneficiaries.
In 2018, CMS finalized a national coverage determination for next-generation sequencing cancer panels. Under the determination, tests that gain FDA approval or clearance as an in vitro companion diagnostic will automatically receive full coverage, provided other coverage criteria are met. Coverage determinations for other diagnostic laboratory tests using next-generation sequencing will be made by Medicare Administrative Contractors. Clinical laboratory services providers are discussing this determination and others with CMS and Medicare Administrative Contractors to attempt to ensure that such providers can continue to provide these essential diagnostic services, but those discussions may not be successful.
While pressure to control healthcare costs poses a risk to our Company, it also creates opportunities, such as an opportunity for increased proper utilization of testing as an efficient means to manage the total cost of healthcare. We believe that it also creates greater opportunities for consolidation and gaining share for high value, low-cost providers, like our Company, as compared to other providers.
|
15
|
Legislative, regulatory and policy environment
|
Government oversight of and attention to the healthcare industry in the United States is significant and increasing; healthcare payment reform is a top issue.
In late 2018, legislation was introduced in Congress that would enable the FDA to regulate LDTs, in vitro diagnostics, software and other items used in the diagnosis of disease. If this legislation were to become law, the FDA could regulate diagnostic tests and components and platforms used as part of these tests. If such legislation were to become law, it could have a significant impact on the clinical laboratory testing industry, including regulating LDTs in new ways and creating avenues of opportunity and competition regarding clinical laboratory testing. New competitors may enter the industry, and competition may come in new forms.
The ACA has created significant uncertainty as healthcare markets react to changes. For example, more than half of the states have opted in to Medicaid expansion and employers may discontinue offering group health insurance to their employees, shifting more people to exchange products.
Certain aspects of the ACA have been repealed, delayed or modified. The scope and timing of any further legislation to repeal, amend, replace, or reform the rest of the ACA is uncertain, but if such legislation were to become law, it could have a significant impact on the U.S. healthcare system. In addition, uncertainty regarding the status of the ACA prior to any such repeal, amendment, replacement or reform could create uncertainty generally in the healthcare market.
A federal court has recently determined that the ACA is unconstitutional; that ruling has been appealed. Uncertainty about court rulings regarding the ACA could add to uncertainty in the healthcare market.
|
|
Informatics; technology; privacy concerns
|
The increased availability of healthcare data, including data made available as a result of next generation DNA sequencing, and the increased ability to effectively analyze that data at population and patient levels, is impacting healthcare practices. It is anticipated that the increased use of data in healthcare, coupled with mobile healthcare IT solutions for doctors and patients, will help to improve patient outcomes and reduce overall healthcare costs.
Informatics, including integrated diagnostic and decision support solutions, predictive analytics, use of population data and healthcare information technology, is spurring advances in precision medicine, including medical decision making and value, for populations and individuals. The increased focus on data and its use is increasing focus on maintaining the privacy of patient data.
There is a need for technology solutions to harness these opportunities. In addition, new technology, social media and mobile technology are changing the way that healthcare markets interact with each other, and the expectations that they have about how services are provided, what services are provided, and other capabilities of healthcare market participants. These developments are creating new opportunities and new challenges and disrupting the healthcare environment. For example, digital pathology is an emerging technology that may change the practice of pathology. Information technology that includes self-learning or "artificial intelligence" features is growing and may impact the healthcare industry.
Healthcare market participants, including pharmaceutical companies, health plans, clinicians, ACOs and IDNs, are striving to leverage interoperability, informatics and analytics to positively influence the health of patient populations while maintaining patient privacy.
|
|
Chronic diseases and conditions; gaps in care
|
We believe that the cost and challenges of identifying, treating and controlling chronic diseases and conditions such as diabetes and heart disease are now well recognized.
As a result of multiple factors, including increased focus on population health management and pressure to reduce the systemic costs associated with such diseases and conditions, there is increased focus on better identifying and attempting to reduce or eliminate the gaps in care historically associated with these diseases and conditions. Healthcare market participants are developing new approaches for this purpose.
|
|
Healthcare services delivery
|
Healthcare delivery is moving out of hospitals, doctor offices and other traditional locations in which it had been provided. Care is increasingly being provided in new settings, such as out-patient and home settings. For example, see the discussion of Emerging Retail Healthcare Providers in table 12. This dynamic offers new opportunities and challenges for healthcare providers and reflects not only efforts to take advantage of new technologies, but also the focus, discussed in this table above under the heading Reimbursement pressure; affordability, on controlling the overall cost of healthcare.
|
16
The Value of Diagnostic Information Services
As noted in table 10, there is an increased focus on the affordability of healthcare. There also is increased focus on a disease-oriented approach to diagnostics, treatment and management. Healthcare providers, consumers and payers increasingly recognize the value of diagnostic information services as a means to improve health and reduce the overall cost of healthcare through early detection, prevention and treatment. Healthcare providers increasingly rely on diagnostic information services to help identify risk for a disease, to detect the symptoms of disease earlier, to aid in the choice of therapeutic regimen, to monitor patient compliance and to evaluate treatment results. Table 11 highlights how diagnostic information services contribute to improving care and reducing health care costs.
|
Table 11 - Contributing to Reducing Healthcare Costs and Improving Care
|
|
• Identifying patients at risk for disease before they require urgent care, hospital treatment or expensive therapies
|
|
• Helping clinicians to target the right medicines for the right patients (those who will benefit from the medicines)
|
|
• Identifying treatment-related side effects
|
|
• Early assessment of the efficacy of a therapy, enabling changes or discontinuation of ineffective therapies
|
|
• Enabling population health management by utilizing diagnostic information, identifying gaps in care and delivering targeted solutions to individuals who need care
|
|
• Identification and proactive management of individuals at risk for developing chronic diseases, to decrease progression and associated costs and morbidity
|
|
• Providing telemedicine services along with laboratory testing to help individuals interpret and obtain appropriate advice and referrals into needed care
|
Customers
We provide diagnostic information services to a broad range of customers, including those discussed below. As discussed in table 10 above, customers are consolidating, converging and diversifying. In many cases, the customer that orders our services is not responsible to pay for them. Depending on the billing arrangement and applicable law, the payer may be the patient or a third party, such as a health plan, Medicare or a Medicaid program. In light of healthcare reform, there is increased market activity regarding alternative payment models, including bundled payment models. Increasingly, patients are bearing greater responsibility for some portion of the payment for the services we provide to them, even if a third party is primarily responsible for payment.
17
|
Table 12 - Customers
|
|
|
Health plans including managed care organizations and other health insurance providers
|
These customers typically reimburse us as a contracted (or out-of-network) provider on behalf of their members. In certain locations, health plans may delegate to IPAs or other alternative delivery systems (
e.g
., physician hospital organizations, ACOs, patient-centered medical homes) the ability to negotiate for diagnostic information services on behalf of certain members.
Health plans and IPAs often require that diagnostic information services providers accept discounted fee structures or assume all or a portion of the financial risk associated with providing such services through capitated payment arrangements. Under capitated payment arrangements, we provide services at a predetermined monthly reimbursement rate for each covered member, generally regardless of the number or cost of services provided by us. Reimbursement under programs that do not provide for capitated payments is typically negotiated on a fee-for-service basis.
Health plans increasingly are adopting policies, practices and procedures based on requirements imposed by government payers such as Medicare and Medicaid. These policies, practices and procedures are subject to change, and may be changed without notice to us.
Reimbursement from our five largest health plans totaled approximately 20%, and no one health plan accounted for 10%, of our consolidated net revenues in 2018. Health plans typically negotiate directly or indirectly with a number of diagnostic information services providers, and represent approximately one-half of our total clinical testing volumes and approximately 35% of our net revenues from diagnostic information services. There has been a trend of consolidation among health plans. Some health plans also have narrowed their provider networks.
We are also sometimes a member of a “complementary network.” A complementary network generally is a set of contractual arrangements that a third party will maintain with various providers that provide discounted fees for the benefit of its customers. A member of a health plan may choose to access a non-contracted provider that is a member of a complementary network; if so, the provider will be reimbursed at a rate negotiated by the complementary network.
We offer to health plans services and programs that leverage our Company's expertise and resources, including our superior access, extensive test menu, medical staff, data, information technology solutions, and wellness and population health management capabilities.
Effective January 1, 2019, Quest Diagnostics had its best access to health plan members in over a decade, as a result of becoming a participating provider to UnitedHealthCare, Blue Cross Blue Shield of Georgia and Horizon Blue Cross and Blue Shield in New Jersey. With access to an additional approximately 43 million insured lives, the Company now has access to approximately 90% of the insured lives in the U.S., including very strong access in key high-population states. We believe that this improved access increases our attractiveness to other customer groups, including clinicians, patients and employers.
|
|
Clinicians
|
Clinicians, including primary care physicians, specialists and physician assistants, requiring diagnostic information services for patients are the primary referral source for our services when patients choose their diagnostic information services provider.
In recent years, there has been a marked increase in the number of physician practices owned by IDNs and hospital systems. There also has been a notable increase in some branches of medicine of the establishment of very large "rolled-up" specialty physician practice groups. Hospitals that own physician practices may require the practices to refer outreach testing to the hospital's affiliated laboratory. Large specialty physician groups may encourage their members to refer testing to other members of the group. In each case, referrals to independent diagnostic services providers may be reduced.
Clinicians determine which laboratory to recommend or use based on a variety of factors, including those set forth in table 13.
|
18
|
Hospitals
|
We believe that we are the industry's leader in servicing hospitals. We provide services to hospitals throughout the United States, including advanced testing services, in some cases helping manage their laboratories and serving as the medical directors of the hospital's histology or clinical laboratory, including through our Professional Laboratory Services offerings.
Hospitals generally maintain an on-site laboratory to perform the significant majority of clinical testing for their patients (inpatients and outpatients) and refer certain testing to outside service providers, which typically charge the hospitals on a negotiated fee-for-service basis. Fee schedules for hospital reference testing services often are negotiated on behalf of hospitals by group purchasing organizations.
Hospitals also provide outreach testing, and historically were able to negotiate higher reimbursement rates with health plans than commercial clinical laboratories for comparable services. They may seek to leverage their relationships with community clinicians by encouraging the clinicians to send their outreach testing to the hospital's laboratory. Increased hospital acquisitions of physician practices may enhance clinician ties to hospital-affiliated laboratories and may strengthen their competitive position.
We also have joint venture arrangements with leading hospitals or IDNs in several metropolitan areas. These joint venture arrangements, which provide diagnostic information services for affiliated hospitals as well as for unaffiliated clinicians and other local healthcare providers, serve as our principal facilities in their service areas. Typically, we have either a majority ownership interest in, or day-to-day management responsibilities for, our joint venture relationships.
In light of continued pressure to reduce systemic healthcare costs, hospitals may change their approach to providing clinical testing services, including by insourcing tests, seeking ways to improve profitability or to better utilize their laboratory capacity. We believe that our combination of services positions us to be an attractive partner for hospitals, offering a full range of strategic relationships.
|
|
ACOs and IDNs
|
An ACO is a network of providers and facilities that share financial risk in providing or arranging for the provision of healthcare. An IDN is a network of providers and facilities working together in providing or arranging for the provision of healthcare. ACOs and IDNs have increased in number; their impact on the provision of healthcare services to date has varied.
ACOs and IDNs may exercise operational and financial control over providers across the continuum of care, and may function as a payer. Thus, they may be able to manage the health of a population group within a defined geography, and also may be able to influence the cost and quality of healthcare delivery, for example through owned entities and through ancillary services. ACOs may be encouraged to consider exclusive arrangements with healthcare providers that become part of the ACO, or to limit service providers to the ACO, since members of the ACO share financial risk.
We are actively engaging with ACOs and IDNs to demonstrate the value of our services.
|
|
Employers
|
Employers use tests for drugs of abuse to determine an individual's employability and his or her “fitness for duty.” Companies with high employee turnover, safety conscious environments or regulatory testing requirements provide the highest volumes of testing. Factors such as the general economy and job market can impact the utilization of drugs-of-abuse testing.
Employers also are investing in health and wellness services. We meet their needs by providing nationwide access to our customizable wellness services (discussed above at page 11), directly and through health plan and health improvement providers. These services help employers, employees and others manage healthcare costs and capitalize on trends in personalized health.
We seek to grow our employer business through offering new and innovative programs to help them with their goals of (1) maintaining a safe and productive workplace, (2) improving healthcare for employees and (3) lowering healthcare costs for employees and employers.
|
19
|
Patients
|
Patients are taking increased interest in and responsibility for their healthcare. Some patients are interested in ordering their own diagnostics tests, rather than relying upon a healthcare professional to order the tests. In addition, patients often are bearing increased financial responsibility for their healthcare (
e.g
., high deductible health plans; rising deductibles). Patients are paying greater attention to their healthcare, are increasing their demands of healthcare providers, have increased expectations regarding their healthcare experiences and are becoming more sophisticated regarding healthcare. For example, in our experience, patients are more focused on transparency, ease of doing business and understanding diagnostics information services than they have been in the past. In addition, patients are seeking prompt, direct access to their test results.
The changing expectations of patients about their healthcare and their healthcare transactions are influencing the way that we think about our business and the services that we provide. We are well positioned to provide information and insights to patients to help them take actions to improve their healthcare, and increasingly we are providing patients with tools to do this. See the discussion of our consumer strategy at page 4.
|
|
Emerging Retail Healthcare Providers
|
In recent years, as the healthcare sector changes, retail providers of healthcare services have emerged and are growing. These providers include "big-box" retailers, pharmacy chains, supermarkets, urgent care centers and Internet-based service providers.
We are taking advantage of opportunities to work with these providers, not only to offer new access points for our services (
e.g
., our collaboration with Safeway), but also to grow our business by expanding our service offerings (
e.g
., our joint venture with Walmart). See the discussion of our consumer strategy at page 4.
|
|
Government Agencies
|
We provide services on a fee-for-service basis to federal, state and local governmental agencies.
Historically, most Medicare and Medicaid beneficiaries were covered under the traditional Medicare and Medicaid programs administered by the federal government. Over the last several years, the federal government has expanded its contracts with private health insurance plans for Medicare beneficiaries and has encouraged such beneficiaries to switch from the traditional programs to the private programs, called “Medicare Advantage” programs. There has been growth of health insurance providers offering Medicare Advantage programs and of beneficiary enrollment in these programs. States also have mandated that Medicaid beneficiaries enroll in private managed care arrangements.
|
|
Pharmaceutical companies
|
We offer an array of assets and services to support the development of companion diagnostics.
We also offer Quest Clinical Trials Connect
TM
, to help speed drugs to market through better patient recruitment and involvement and improved physician outreach.
|
|
Other Laboratories
|
We provide services on a fee-for-service basis to other commercial clinical laboratories.
|
Competition.
While there has been significant consolidation in the diagnostic information services industry in recent years, our industry remains fragmented and highly competitive. We primarily compete with three types of clinical testing providers: commercial clinical laboratories, hospital-affiliated laboratories and physician-office laboratories. Our largest commercial clinical laboratory competitor is Laboratory Corporation of America Holdings, Inc. In addition, we compete with many smaller regional and local commercial clinical laboratories and specialized advanced laboratories. In anatomic pathology, we compete with anatomic pathology practices, including those in academic institutions and large physician group practices, and providers of emerging digital pathology solutions. There also has been a trend among specialty physician practices to establish their own histology laboratory capabilities and/or bring pathologists into their practices, thereby reducing referrals from these practices and increasing the competitive position of these practices.
We believe that healthcare providers consider a number of factors when selecting a diagnostic information services provider. Those factors include:
20
|
Table 13 - Factors Considered When Selecting a Diagnostic Information Services Provider
|
|
|
• Service capability and quality
|
• Reputation in the medical community
|
|
• Accuracy, timeliness and consistency in reporting test results
|
• Healthcare information technology solutions, including connectivity options
|
|
• Access to medical/scientific thought leaders for consultation
|
• Patient access, including the number, convenience and geographic coverage of patient service centers
|
|
• Patient insurance coverage and experience
|
• Ability to develop new and useful tests and services
|
|
• Number and type of tests performed
|
• Qualifications of its staff
|
|
• Pricing and overall value
|
• Provider office workflow
|
|
• Real time payment determination
|
• Capabilities to support population health initiatives
|
We believe that providing the most attractive service offering in the industry, including the most comprehensive test menu, innovative test offerings, a positive customer experience, a staff including medical and scientific experts, strong quality, unparalleled access and distribution, and data-powered integrated information technology solutions provide us with a competitive advantage.
We believe that large diagnostic information services providers have a competitive advantage due to their large networks and lower cost structures, including as a result of PAMA. These advantages should enable larger providers to more effectively serve customers. In addition, we believe that consolidation in the diagnostic information services industry will continue. However, a significant portion of clinical testing is likely to continue to be performed by hospitals, which generally have affiliations with community clinicians and may have more, or more convenient, locations in a market. As a result, we compete against hospital-affiliated laboratories primarily on the basis of service capability, quality and pricing. In addition, market activity may increase the competitive environment. For example, hospital ownership of physician practices may enhance the ties of the clinicians to hospital-affiliated laboratories, enhancing the competitive position of hospital-affiliated laboratories. The formation of ACOs and IDNs, and their approach to contracts with healthcare providers, in addition to the impact of informatics, also may impact competition to provide diagnostic information services.
The diagnostic information services industry is faced with changing technology, new product introductions and new service offerings. Competitors may compete using advanced technology, including technology that enables more convenient or cost-effective testing. Digital pathology is an example of this. Competitors also may compete on the basis of new service offerings. Competitors also may offer testing to be performed outside of a commercial clinical laboratory, such as (1) point-of-care testing that can be performed by physicians in their offices; (2) testing that can be performed by hospitals in their own laboratories; and (3) home testing that can be carried out without requiring the services of outside providers.
The risk assessment and healthcare information technology industries are highly competitive. We have many competitors, some of which have much more extensive experience in these industries and some of which have greater resources. We compete in the risk assessment business by seeking to provide a superior applicant experience, faster services completion and a wider array of quality, integrated services than our competitors. We compete in the healthcare information technology industry by offering solutions that foster better patient care and improve performance for healthcare providers, including smaller and medium sized physician practices.
GENERAL
Sales and Marketing.
Our Diagnostic Information Services business has a unified commercial organization focused on the sale of most of our services. It coordinates closely with our clinical franchises (discussed above at page 4) and marketing organization. The commercial organization is centrally led, and is organized regionally, in conjunction with our operations organization, to focus on local customer needs and to ensure aligned delivery for our customers. Our commercial organization employs world-class processes and tools and strong management discipline. We continue to invest in talent, provide industry-leading training and development, focus on opportunities with IDNs and specialty physicians, and foster a customer-focused, performance-driven culture.
We also maintain sales and marketing organizations for our employer drugs-of-abuse testing services in Diagnostic Information Services and our offerings in Diagnostic Solutions.
21
Information Technology.
We use information systems extensively in virtually all aspects of our business, including clinical testing, test ordering and reporting, billing, customer service, logistics and management of medical data. We endeavor to establish systems that create value and efficiencies for our Company and customers. The successful delivery of our services depends, in part, on the continued and uninterrupted performance of our information technology systems. We take precautionary measures to prevent problems that could affect our information technology systems.
Some of our historic growth has come through acquisitions and, as a result, we continue to use multiple information systems. We have made significant progress implementing common systems, and we continue to standardize laboratory information and billing systems across our operations. We expect that our standardization effort will take several more years to complete, and will result in significantly more centralized systems, improved operating efficiency, more positive customer experiences and enhanced control over our operational environment. Even after we complete our efforts to standardize our historic systems, future business acquisitions may create additional opportunities where we may conclude that system standardization would benefit our company.
Quality Assurance.
As discussed further under the heading
Quality
beginning on page 9, our goal is to provide every patient with services and products of superior quality, and to meet that goal we have adopted the Quest Diagnostics Quality Program and use the Quest Management System. We have a culture of continuous improvement. Employing root cause analysis, process improvements and rigorous tracking and measuring, we seek to enhance quality, continuously reduce defects, streamline processes, further increase the efficacy and efficiency of our operations and processes, eliminate waste and help standardize operations across our Company.
In our laboratory operations, our quality assurance efforts focus on pre-analytic, analytic and post-analytic processes, including positive patient identification of specimens, specimen tracking, analysis and report accuracy, proficiency testing, reference range relevance, process audits, statistical process control and personnel training for all of our laboratories and patient service centers. As part of our quality assurance program, we utilize internal proficiency testing, comprehensive quality control and rigorous process audits. For most clinical laboratory tests, quality control samples are processed in parallel with the analysis of patient specimens. The results of tests on these quality control samples are monitored to identify trends, biases or imprecision in our analytical processes. We also focus on the licensing, credentialing, training and competence of our professional and technical staff.
In addition, we participate in external proficiency testing and have accreditation or licenses for our clinical laboratory operations from various regulatory agencies or accrediting organizations, such as CMS, CAP and certain states. All of our laboratories participate in various external quality surveillance programs, including proficiency testing programs administered by CAP or states. CAP is an independent, nongovernmental organization of board-certified pathologists approved by CMS to inspect clinical laboratories to determine compliance with the standards required by CLIA. CAP offers an accreditation program to which clinical laboratories may voluntarily subscribe. All of our major laboratories, including our laboratories outside the U.S., and a number of our rapid response laboratories, are accredited by CAP. Accreditation includes on-site inspections and participation in the CAP (or equivalent) proficiency testing program. Also, our cytotechnologists and pathologists participate in an internal peer-review evaluation and one or more external individual proficiency testing programs. In addition, some of our laboratories have achieved International Organization for Standardization certification for their quality management systems.
Intellectual Property Rights.
We own significant intellectual property, including patents, patent applications, technology, trade secrets, know-how, copyrights and trademarks in the United States and other countries. From time to time, we also license U.S. and non-U.S. patents, patent applications, technology, trade secrets, know-how, copyrights or trademarks owned by others; we also may license our intellectual property to others. In the aggregate, our intellectual property assets and licenses are of material importance to our business. We believe, however, that no single patent, technology, trademark, intellectual property asset or license is material to our business as a whole.
Our approach is to manage our intellectual property assets, to safeguard them and to maximize their value to our enterprise. We actively defend our important intellectual property assets and pursue protection of our products, processes and other intellectual property where possible.
Our success in remaining a leading innovator in the diagnostic information services industry by continuing to introduce new tests, technology and services will depend, in part, on our ability to license new and improved technologies on favorable terms. Other companies or individuals, including our competitors, may obtain patents or other property rights on tests or processes that we may be performing, that could prevent, limit or interfere with our ability to develop, perform or sell our tests or operate our business.
22
Enterprise Risk Management Program
. We maintain an enterprise risk management program designed to assure a culture of risk awareness throughout the Company's key business, operations and support functions. Our program, which is integrated with the Company’s governance, performance management and internal control frameworks, entails a formal continuous process that identifies, assesses, mitigates and manages the risks from both internal and external conditions that could significantly impact the Company and influence its business strategy and performance. The program is based on the most recent framework issued by the Committee of Sponsoring Organizations of the Treadway Commission, which focuses on the following risk types:
|
•
|
Operational risk - risks arising from systems, processes, people and external events that affect the Company’s operational objectives or fundamental reason for its existence, including: product life-cycle and execution; service quality and performance; information management and data protection and security, including cybersecurity; supply chain and business disruption; and other risks, including human capital and reputation.
|
|
•
|
Financial risk - risks arising from the Company’s ability to meet its financial obligations pursuant to its strategic and operational objectives, including exposure to broad market and more specific industry risk that could impact liquidity, interest rate, credit, pricing and reimbursement, and also to internal and external financial reporting.
|
|
•
|
Legal and compliance risk - risks arising from government and regulatory environment and action, legal proceedings and compliance with integrity policies and procedures.
|
|
•
|
Strategic risk - risks that will impede the Company’s plan to achieve its mission and vision and apply its core values, including changes in the broad market and Company's industry, business development and restructuring activities, competitive threats and practices, technology and product innovation, and public policy.
|
As part of our program, executive management routinely assesses our enterprise level risks, overall Company-level risk tolerance and the effectiveness of risk management, and monitors the progress of and resources applied to risk mitigation; our Board of Directors plays an active role in overseeing our program. Our primary risk factors are discussed in
Risk Factors
beginning on page
30
.
Billing; Government Reimbursement.
We generally bill for diagnostic information services on a fee-for-service basis under one of two types of fee schedules. These fees may be negotiated or discounted. The types of fee schedules are:
|
•
|
“Client” fees charged to physicians, hospitals and institutions for which services are performed on a wholesale basis and which are billed on a monthly basis.
|
|
•
|
“Patient” fees charged to individual patients and certain third-party payers on a claim-by-claim basis.
|
Billing for diagnostic information services is very complicated; we maintain compliance policies and procedures for our billing practices. Patients, insurance companies, Medicare, Medicaid, physicians, hospitals, IDNs, ACOs and employer groups all have different billing requirements. Some billing arrangements require us to bill multiple payers, and there are several other factors that complicate billing (
e.g
., disparity in coverage and information requirements among various payers; incomplete or inaccurate billing information provided by ordering clinicians; and lack of access to patients before performing tests). Auditing for compliance with applicable laws and regulations as well as internal policies and procedures adds further cost to the billing process.
With regard to the clinical testing services performed on behalf of Medicare beneficiaries, we generally must bill Medicare directly and must accept the Medicare carrier's fee schedule amount for covered services as payment in full. In addition, state Medicaid programs are prohibited from paying more (and in most instances, pay significantly less) than Medicare. Currently, Medicare does not require the beneficiary to pay a co-payment for diagnostic testing services reimbursed under the Clinical Laboratory Fee Schedule, but generally does require a patient deductible for anatomic pathology services.
23
Part B of the Medicare program contains fee schedule payment methodologies for clinical testing services performed for covered patients, including a national ceiling on the amount that carriers could pay under their local Medicare clinical testing fee schedules. Historically, the Medicare Clinical Laboratory Fee Schedule and the Medicare Physician Fee Schedule established under that program have been subject to change, including each year. Pursuant to PAMA, which was implemented in 2018, CMS promulgated revised reimbursement schedules for 2018 - 2020 for clinical laboratory testing services provided under Medicare. Reimbursement rates for clinical laboratory testing was reduced in 2018 and is scheduled to be reduced again by approximately 10% in each of 2019 and 2020. PAMA calls for further revision of the Medicare Clinical Laboratory Fee Schedule for years after 2020, based on future surveys of market rates; reimbursement reduction from 2021-23 is capped by PAMA at 15% annually. The following table sets forth the percentage of our consolidated net revenues reimbursed under Medicare and Medicaid in 2018.
.
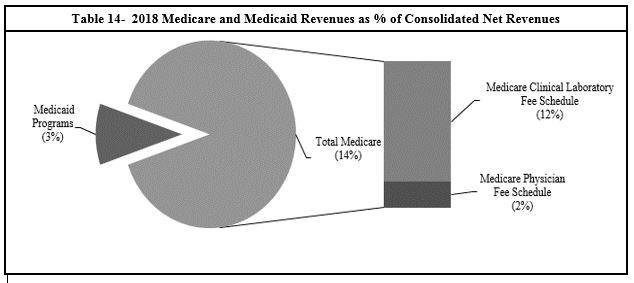
Employees.
At December 31, 2018, we employed approximately 46,000 people. This total excludes employees of the joint ventures where we do not have a majority ownership interest. We have no collective bargaining agreements with unions covering employees in the United States, and we believe that our overall relations with our employees are good.
REGULATION
Key Regulatory Schemes.
Our businesses are subject to or impacted by extensive and frequently changing laws and regulations in the United States (at both the federal and state levels) and the other jurisdictions in which we conduct business, including some particular to our business and others relating to conducting business generally (
e.g
., U.S. Foreign Corrupt Practices Act). We also are subject to inspections and audits by governmental agencies. The table below highlights key regulatory schemes applicable to our businesses.
|
Table 15 - Key Regulatory Schemes
|
|
|
CLIA and State Clinical Laboratory Licensing
|
CLIA regulates the operations of virtually all clinical laboratories, requiring that they be certified by the federal government and that they comply with various technical, operational, personnel and quality requirements intended to ensure that the services provided are accurate, reliable and timely.
State laws may require additional personnel qualifications or licenses, quality control, record maintenance, proficiency testing or detailed review of our scientific method validations and technical procedures for certain tests.
Violations of these laws and regulations may result in monetary fines, criminal and civil penalties and/or suspension or exclusion from participation in Medicare, Medicaid and other federal or state healthcare programs.
|
24
|
Medicare and Medicaid; Fraud and Abuse
|
Diagnostic testing services provided under Medicare and Medicaid programs are subject to complex, evolving, stringent and frequently ambiguous federal and state laws and regulations, including those relating to billing, coverage and reimbursement.
Anti-kickback laws and regulations prohibit making payments or furnishing other benefits to influence the referral of tests billed to Medicare, Medicaid or certain other federal or state healthcare programs.
In addition, federal and state anti-self-referral laws generally prohibit Medicare and Medicaid payments for clinical tests referred by physicians who have an ownership or investment interest in, or a compensation arrangement with, the testing laboratory, unless specific exceptions are met.
Federal substance abuse legislation enacted in 2018 contains anti-kickback provisions that are, by their terms, applicable to laboratory testing paid for by all payers. We are attempting to clarify the application of that legislation.
Some states have similar laws that are not limited in applicability to only Medicare and Medicaid referrals and could also affect tests that are paid for by health plans and other non-governmental payers.
Violations of these laws and regulations may result in monetary fines, criminal and civil penalties and/or suspension or exclusion from participation in Medicare, Medicaid and other federal or state healthcare programs.
|
|
FDA
|
The FDA has regulatory responsibility over, among other areas, instruments, software, test kits, reagents and other devices used by clinical laboratories to perform diagnostic testing in the United States. The FDA also regulates drugs-of-abuse testing for employers and insurers, testing for blood bank purposes and testing of donors of human cells for purposes such as in vitro fertilization.
A number of advanced tests we develop internally are offered as LDTs. The FDA has claimed regulatory authority over all LDTs, but has stated that it exercised enforcement discretion with regard to most LDTs performed by high complexity CLIA-certified laboratories.
Pursuant to the 21st Century Cures Act, the FDA issued guidance regarding its position on the regulation of clinical decision software, which may be used in, or in connection with, LDTs. The guidance attempts to address uncertainty regarding whether FDA approval of certain software is required. In January 2019 the FDA issued a draft guidance on a pre-certification pilot program to help software developers have a speedier and less restrictive path to clearance or approval of their software.
In late 2018, legislation was introduced in Congress that would enable the FDA to regulate LDTs, in vitro diagnostics, software and other items used in the diagnosis of disease. If this legislation were to become law, the FDA could regulate diagnostic tests and components and platforms used as part of these tests. If such legislation were to become law, it could have a significant impact on the clinical laboratory testing industry, including regulating LDTs in new ways and creating avenues of opportunity and competition regarding clinical laboratory testing. New competitors may enter the industry, and competition may come in new forms.
|
|
Environmental, Health and Safety
|
We are subject to laws and regulations related to the protection of the environment, the health and safety of employees and the handling, transportation and disposal of medical specimens, infectious and hazardous waste and radioactive materials.
For example, the U.S. Occupational Safety and Health Administration has established extensive requirements relating specifically to workplace safety for healthcare employers in the U.S. This includes requirements to develop and implement multi-faceted programs to protect workers from exposure to blood-borne pathogens, including preventing or minimizing any exposure through needle stick injuries.
For purposes of transportation, some biological materials and laboratory supplies are classified as hazardous materials and are subject to regulation by one or more of the following agencies: the U.S. Department of Transportation, the U.S. Public Health Service, the U.S. Postal Service and the International Air Transport Association.
|
25
|
Physicians
|
Our pathologists are required to hold a valid license to practice medicine in the jurisdiction in which they practice.
Many of our pathologists enter into an employment agreement. These agreements have varying terms, but generally can be terminated at any time, upon advance notice. Most of the agreements contain covenants generally limiting the activities of the pathologist within a defined geographic area for a limited period of time after termination of employment; the enforceability of these covenants may be limited under state law.
Several jurisdictions, including some in which our businesses are located, prohibit business corporations from engaging in the practice of medicine. In certain jurisdictions, business corporations are prohibited from employing licensed healthcare professionals to provide services on behalf of the corporation; these laws vary. In some jurisdictions, anatomic pathology services are delivered through physician-owned entities that employ the practicing pathologists. The manner in which licensed physicians can be organized to perform medical services may be governed by the laws of the jurisdictions in which medical services are provided and by the medical boards or other entities authorized by these jurisdictions to oversee the practice of medicine.
|
|
Privacy and Security of Health and Personal Information
|
We are subject to laws and regulations regarding protecting the security and privacy of certain healthcare and personal information, including: (a) the federal Health Insurance Portability and Accountability Act and the regulations thereunder, which establish (i) a complex regulatory framework including requirements for safeguarding protected health information and (ii) comprehensive federal standards regarding the uses and disclosures of protected health information; (b) state laws; and (c) the European Union's General Data Protection Regulation.
A healthcare provider may be subject to penalties for non-compliance and may be required to notify individuals or state, federal or county governments if the provider discovers certain breaches of personal information or protected health information.
|
|
Drug Testing; Controlled Substances
|
All U.S. laboratories that perform drug testing for certain public sector employees and employees of certain federally regulated businesses are required to be certified as meeting the detailed performance and quality standards of the Substance Abuse and Mental Health Services Administration.
To obtain access to controlled substances used to perform drugs-of-abuse testing in the United States, laboratories must be licensed by the Drug Enforcement Administration.
|
Compliance.
We strive to conduct our business in compliance with all applicable laws and regulations. We license and maintain appropriate accreditations for all of our laboratories and, where applicable, patient service centers, as required by the appropriate federal and state agencies. We have a long-standing and well-established compliance program. The Quality, Safety and Compliance Committee of our Board of Directors oversees, and receives periodic management reports regarding, our compliance program. Our program includes detailed policies and procedures and training programs intended to ensure the implementation and observance of all applicable laws and regulations (including regarding billing and reimbursement) and Company policies. Further, we conduct in-depth reviews of procedures and facilities to assure regulatory compliance throughout our operations. We conduct annual training of our employees on these compliance policies and procedures.
As an integral part of our billing compliance program, we investigate reported or suspected failures to comply with federal and state healthcare reimbursement requirements. Any Medicare or Medicaid overpayments resulting from non-compliance are refunded by us. As a result of these efforts, we have periodically identified and reported overpayments, refunded the payers for overpayments and taken appropriate corrective action.
Many of the laws and regulations applicable to us, including many of those relating to billing and reimbursement for tests and relationships with clinicians and hospitals, are vague or indefinite or have not been interpreted by the courts. The applicability or interpretation of laws and regulations also may not be clear in light of emerging changes in clinical testing science, healthcare technology and healthcare organizations. They may be interpreted or applied by a prosecutorial, regulatory or judicial authority in a manner that could require us to make changes in our operations, including our pricing and/or billing practices. Such occurrences, regardless of their outcome, could, among other things:
|
•
|
increase our administrative, billing or other operating costs;
|
|
•
|
decrease the amount of reimbursement related to diagnostic information services performed;
|
|
•
|
damage our reputation; or
|
|
•
|
adversely affect important business relationships with third parties.
|
26
Violations of laws relating to billing government healthcare programs or federal and state fraud and abuse laws may result in civil and criminal fines and penalties, exclusion from participation in governmental healthcare programs and the loss of various licenses, certificates and authorizations necessary to operate our business, as well as incur additional liabilities from third-party claims, all of which could have a material adverse effect on our business. Certain violations of these laws may also provide the basis for a civil remedy under the federal False Claims Act, including fines and damages of up to three times the amount claimed. The
qui tam
provisions of the federal False Claims Act and similar provision in certain state false claims acts allow private individuals to bring lawsuits against healthcare companies on behalf of government payers, private payers and/or patients alleging inappropriate billing practices.
The federal or state governments may bring claims based on our current practices, which we believe are lawful. The federal and state governments have substantial leverage in negotiating settlements since the amount of potential damages and fines far exceeds the rates at which we are reimbursed, and the government has the remedy of excluding a non-compliant provider from participation in the Medicare and Medicaid programs. We believe that federal and state governments continue aggressive enforcement efforts against perceived healthcare fraud. Legislative provisions relating to healthcare fraud and abuse provide government enforcement personnel with substantial funding, powers, penalties and remedies to pursue suspected cases of fraud and abuse.
AVAILABLE INFORMATION
The Securities and Exchange Commission (the “SEC”) maintains an internet site, www.sec.gov, that contains annual, quarterly and current reports, proxy and information statements and other information that issuers file electronically with the SEC. We file reports, proxy statements and other information with the SEC; our filings are available to the public at the SEC's internet site.
Our internet address is www.QuestDiagnostics.com. You can access our Investor Relations webpage at www.QuestDiagnostics.com/investor. The information on our website is not incorporated by reference into this Report. We make available free of charge, on or through our Investor Relations webpage, our proxy statements, Annual Report on Form 10-K, Quarterly Reports on Form 10-Q, Current Reports on Form 8-K and any amendments to those reports filed or furnished pursuant to the Securities Exchange Act of 1934, as amended (the “Exchange Act”), as soon as reasonably practical after such material is filed with, or furnished to, the SEC.
We also have a webpage, www.QuestDiagnostics.com/governance, that provides information about our corporate governance, including the following information.
|
Table 16 - Information Available at Our Corporate Governance Webpage
|
|
|
•
Directors
|
•
Corporate Governance Guidelines
|
|
•
Composition of the committees of our Board of Directors
|
•
Code of Ethics
|
|
•
Senior management
|
•
Certificate of Incorporation
|
|
•
Charters for the standing committees of our Board of Directors
|
•
Bylaws
|
|
•
Information about our corporate political contributions
|
•
Values
|
|
•
Statements of beneficial ownership of our equity securities filed by our directors, officers and others under Section 16 of the Exchange Act
|
|
27
EXECUTIVE OFFICERS OF THE COMPANY
The following persons serve as executive officers of the Company.
|
Table 17 - Executive Officers
|
|
|
Name, Age, Title
|
Background
|
|
Stephen H. Rusckowski (61)
Chairman of the Board, President and Chief Executive Officer
|
Mr. Rusckowski joined the Company in May 2012 as President and Chief Executive Officer and became Chairman of the Board on January 1, 2017. From October 2006 until he joined the Company, he was Chief Executive Officer of Philips Healthcare, the largest unit of Royal Philips Electronics, and a member of the Board of Management of Royal Philips Electronics and its Executive Committee. Previously, he was CEO of the Imaging Systems business of Royal Phillips Electronics.
Before joining Philips in 2001, Mr. Rusckowski held numerous management positions with the healthcare division of Hewlett-Packard/Agilent Technologies.
Mr. Rusckowski has been a director of the Company since May 2012. He was a director of Xerox Corporation from February 2015 to 2018, and a director of Covidien plc from December 2013 to January 2015. Mr. Rusckowski served as Chairman of the American Clinical Laboratory Association from 2013 to 2016.
|
|
Everett V. Cunningham (52)
Senior Vice President, Commercial
|
Mr. Cunningham is responsible for the commercial organization for the Company's Diagnostic Information Services business.
Prior to joining the Company in October 2012, he spent 21 years with Pfizer, Inc., where he served from June 2011 to October 2012 as Regional President, Established Products, Asia. From 2009 to 2011, Mr. Cunningham served as Regional President, West Business Unit, Primary Care. From 2007 to 2009, he served as Vice President, Human Resources, Corporate Groups. Before that Mr. Cunningham served Pfizer in a series of sales and leadership and general management roles.
|
|
James E. Davis (56)
Executive Vice President, General Diagnostics
|
In January 2017, Mr. Davis became Executive Vice President, General Diagnostics; previously he was Senior Vice President and Group Executive - Regional Businesses. In January 2015, he assumed responsibility for the general management of the Company's regional Diagnostic Information Services business. Mr. Davis was responsible for our products business from February 2014 until 2016. From February 2014 to January 2015, he was responsible for operations for the Company's Diagnostic Information Services business. He joined Quest Diagnostics in April 2013 as Senior Vice President, Diagnostics Solutions, with responsibility for the healthcare information technology, risk assessment, clinical trials, diagnostic products and employer solutions businesses.
Prior to joining Quest Diagnostics, from March 2012 to April 2013, Mr. Davis served as Lead Director, and then as Chief Executive Officer, of InSightec, Inc., a medical device company that designs and develops ultrasound ablation devices that are guided by magnetic resonance imaging systems.
Previously, Mr. Davis held a number of senior positions in General Electric’s healthcare business, including from 2007 to 2012 as Vice President and General Manager of GE Healthcare’s magnetic resonance imaging business. Prior to joining GE Healthcare, Mr. Davis held leadership positions in GE’s aviation business and led the development of strategic and operational improvement initiatives for clients of McKinsey & Company, Inc.
|
28
|
Catherine T. Doherty (56)
Senior Vice President and Group Executive - Clinical Franchise Solutions and Marketing
|
Since January 2013, Ms. Doherty has been responsible for overseeing the development of clinical franchise solutions in the areas of general health and wellness, cardiovascular, metabolic and endocrinology, infectious disease and immunology, and prescription drug monitoring and toxicology, as well as enterprise-wide marketing. Ms. Doherty is also responsible for the employer solutions and risk assessment businesses. Additionally, in October 2018, QuestDirect, our consumer initiated testing platform was launched under her leadership. She also was responsible for clinical franchise solutions in the areas of neurology and women's health from January 2013 to January 2017 and for the healthcare information technology business from February 2014 to January 2017.
From May 2011 to December 2012, she served as Senior Vice President, Physician Services. Prior to May 2011, Ms. Doherty held a variety of positions of increasing responsibility since joining the Company in 1990, including Vice President, Hospital Services; Vice President, Office of the Chairman; Vice President, Finance and Administration for the Hospital business; Vice President, Communications and Investor Relations; and Chief Accounting Officer.
|
|
Carrie Eglinton Manner (44)
Senior Vice President, Advanced Diagnostics
|
Ms. Eglinton Manner joined the Company in January 2017. She is responsible for the Company's advanced testing activities, including overseeing the development of clinical franchise solutions in the areas of neurology, oncology and women's health.
Previously, Ms. Eglinton Manner spent over 20 years in various leadership roles in healthcare businesses at General Electric. From 2015 to 2016, she served as President and CEO of the Detection and Guidance Solutions business, delivering advanced x-ray technologies spanning the continuum of healthcare. From 2013 to 2015, Ms. Eglinton Manner served as President and CEO of OEC Surgical Mobile C-arm systems. She was President and CEO of General Electric's diagnostic pathology laboratory services business from 2012 to 2013, and President of the Maternal Infant Care Business from 2009 to 2012.
|
|
Mark J. Guinan (57)
Executive Vice President and Chief Financial Officer
|
Mr. Guinan joined the Company in July 2013. From 2010 until joining Quest Diagnostics in 2013, he served as Chief Financial Officer for Hill-Rom Holdings Inc., a manufacturer and provider of medical technologies and related services for the health care industry. Mr. Guinan has served as a director of Myovant Sciences, Ltd. since July 2018.
Previously, he had served in a number of finance and operations roles in a long career at Johnson & Johnson including 2009 to 2010 as Vice President, Chief Procurement Officer, and 2005 to 2009 as Vice President, Group Finance Pharmaceuticals. Before joining Johnson & Johnson in 1997, he held a number of financial roles at Procter & Gamble.
|
|
Michael E. Prevoznik (57)
Senior Vice President and General Counsel
|
Mr. Prevoznik joined the Company as Vice President and General Counsel in August 1999. In 2003, he assumed responsibility for governmental affairs. From 1999 until April 2009, Mr. Prevoznik also had responsibility for the Company's Compliance Department.
In addition, from April 2011 to January 2017, he had management responsibility for the Company's diagnostic information services activities outside the U.S., and from April 2011 to January 2013, he had management responsibility for the Company's clinical trials business.
Prior to joining the Company, Mr. Prevoznik served in positions of increasing responsibility within the compliance organization at SmithKline Beecham, most recently as Vice President, Compliance, with responsibility for coordinating all SmithKline Beecham compliance activities worldwide.
|
29
Item 1A. Risk Factors
You should carefully consider all of the information set forth in this Report, including the following risk factors, before deciding to invest in any of our securities. The risks below are not the only ones that we face. Additional risks not presently known to us, or that we presently deem immaterial, may also negatively impact us. Our business, consolidated financial condition, revenues, results of operations, profitability, reputation or cash flows could be materially impacted by any of these factors.
|
This Report also includes forward-looking statements that involve risks or uncertainties. Our results could differ materially from those anticipated in these forward-looking statements as a result of certain factors, including the risks we face described below and elsewhere. See “Cautionary Factors that May Affect Future Results” on page
38
.
|
The U.S. healthcare system is evolving and medical laboratory testing market fundamentals are changing, and our business could be adversely impacted if we fail to adapt.
The U.S. healthcare system is evolving, in part in response to the passage of the ACA in 2010. The ACA established the Center for Medicare and Medicaid Innovation to examine alternative payment methodologies and conduct demonstration programs. The ACA provided for extensive health insurance reforms, including the elimination of pre-existing condition exclusions and other limitations on coverage, fixed percentages on medical loss ratios, expansion in Medicaid and other programs, employer mandates, individual mandates, creation of state and regional health insurance exchanges, and tax subsidies for individuals to help cover the cost of individual insurance coverage. The ACA also permits the establishment of ACOs.
Certain aspects of the ACA have been repealed, delayed or modified. The scope and timing of any further legislation to repeal, amend, replace, or reform the rest of the ACA is uncertain, but if such legislation were to become law, it could have a significant impact on the U.S. healthcare system. In addition, uncertainty regarding the status of the ACA prior to any such repeal, amendment, replacement or reform could create uncertainty generally in the healthcare market.
A federal court has recently determined that the ACA is unconstitutional; that ruling has been appealed. Uncertainty about court rulings regarding the ACA could add to uncertainty in the healthcare market.
Significant change is taking place in the healthcare system, including as discussed above under the heading
The United States Clinical Testing Industry
, beginning on page
13
. For example, ACOs, IDNs and patient-centered medical homes have grown as a means to deliver patient care. Value-based reimbursement is increasing; CMS has set goals for value-based reimbursement to be achieved. Patients are encouraged to take increased interest in and responsibility for, and often are bearing increased responsibility for payment for, their healthcare. Healthcare industry participants are consolidating. Healthcare services increasingly are being provided by non-traditional providers (
e.g
., physician assistants), in non-traditional venues (
e.g.
, retail medical clinics, urgent care centers) and using new technologies (
e.g.
, telemedicine, digital pathology). Utilization of the healthcare system is being influenced by several factors and may result in a decline in the demand for diagnostic information services.
In addition, we believe that medical laboratory testing market fundamentals are changing. We believe that PAMA-driven reimbursement pressure will induce structural change; that health plan approaches to laboratory testing services will reduce variation in spending on these services and benefit providers like Quest; and that growing consumerization in healthcare is sharpening focus on price disparities. We expect that the evolution of the healthcare industry will continue, and that industry change is likely to be extensive.
30
The clinical testing business is highly competitive, and if we fail to provide an appropriately priced level of service or otherwise fail to compete effectively it could have a material adverse effect on our revenues and profitability.
The clinical testing business remains a fragmented and highly competitive industry. We primarily compete with three types of clinical testing providers: other commercial clinical laboratories, hospital-affiliated laboratories and physician-office laboratories. We also compete with other providers, including anatomic pathology practices and large physician group practices. Hospitals generally maintain on-site laboratories to perform testing on their patients (inpatient or outpatient). In addition, many hospitals compete with commercial clinical laboratories for outreach (non-hospital patients) testing. Hospitals may seek to leverage their relationships with community clinicians and encourage the clinicians to send their outreach testing to the hospital's laboratory. As a result of this affiliation between hospitals and community clinicians, we compete against hospital-affiliated laboratories primarily based on quality and scope of service as well as pricing. In addition, hospitals that own physician practices may require the practices to refer testing to the hospital's laboratory. In recent years, there has been a trend of hospitals acquiring physician practices, increasing the percentage of physician practices owned by hospitals. Increased hospital ownership of physician practices may enhance clinician ties to hospital-affiliated laboratories and may strengthen their competitive position. The formation of ACOs and IDNs, and their approach to contracts with healthcare providers, in addition to the impact of informatics, also may increase competition to provide diagnostic information services.
The diagnostic information services industry also is faced with changing technology and new product introductions. Competitors may compete using advanced technology, including technology that enables more convenient or cost-effective testing. Digital pathology is an example of this. Competitors also may compete on the basis of new service offerings. Competitors also may offer testing to be performed outside of a commercial clinical laboratory, such as (1) point-of-care testing that can be performed by physicians in their offices; (2) advanced testing that can be performed by hospitals in their own laboratories; and (3) home testing that can be carried out without requiring the services of outside providers.
Government payers, such as Medicare and Medicaid, have taken steps to reduce the utilization and reimbursement of healthcare services, including clinical testing services.
We face efforts by government payers to reduce utilization of and reimbursement for diagnostic information services. We expect efforts to reduce reimbursements, to impose more stringent cost controls and to reduce utilization of clinical test services will continue.
Pursuant to PAMA, which was implemented in 2018, CMS promulgated revised reimbursement rate schedules for 2018 - 2020 for clinical laboratory testing services provided under Medicare. Reimbursement rates for clinical laboratory testing were reduced in 2018 and are scheduled to be reduced again by approximately 10% in each of 2019 and 2020. PAMA calls for further revision of the Medicare Clinical Laboratory Fee Schedule for years after 2020, based on future surveys of market rates; reimbursement rate reduction from 2021-23 is capped by PAMA at 15% annually.
In addition, CMS has adopted policies limiting or excluding coverage for clinical tests that we perform. We also provide physician services that are reimbursed by Medicare under a physician fee schedule, which is subject to adjustment on an annual basis. Medicaid reimbursement varies by state and is subject to administrative and billing requirements and budget pressures. The ACA includes further provisions that are designed to control utilization and payment levels.
In addition, over the last several years, the federal government has expanded its contracts with private health insurance plans for Medicare beneficiaries, called “Medicare Advantage” programs, and has encouraged such beneficiaries to switch from the traditional programs to the private programs. There has been growth of health insurance plans offering Medicare Advantage programs, and of beneficiary enrollment in these programs. States have mandated that Medicaid beneficiaries enroll in private managed care arrangements. In addition, state budget pressures have encouraged states to consider several courses of action that may impact our business, such as delaying payments, reducing reimbursement, restricting coverage eligibility, denying claims and service coverage restrictions.
From time to time, the federal government has considered whether competitive bidding could be used to provide clinical testing services for Medicare beneficiaries at attractive rates while maintaining quality and access to care. Congress periodically considers cost-saving initiatives. These initiatives have included coinsurance for clinical testing services, co-payments for clinical testing and further laboratory fee schedule reductions.
31
Health plans and other third parties have taken steps to reduce the utilization and reimbursement of health services, including clinical testing services.
We face efforts by non-governmental third-party payers, including health plans, to reduce utilization of and reimbursement for clinical testing services. Examples include increased use of prior authorization requirements and increased denial of coverage for services. Since the passage of ACA, there is increased market activity regarding alternative payment models, including bundled payment models. We expect continuing efforts by third-party payers, including in their rules, practices and policies, to reduce reimbursements, to impose more stringent cost controls and to reduce utilization of clinical testing services. ACOs and IDNs also may undertake efforts to reduce utilization of, or reimbursement for, diagnostic information services.
The healthcare industry has experienced a trend of consolidation among health insurance plans, resulting in fewer but larger insurance plans with significant bargaining power to negotiate fee arrangements with healthcare providers, including clinical testing providers. These health plans, and independent physician associations, may demand that clinical testing providers accept discounted fee structures or assume all or a portion of the financial risk associated with providing testing services to their members through capitated payment arrangements. Some health plans also are reviewing test coding, evaluating coverage decisions and requiring preauthorization of certain testing. There are also an increasing number of patients enrolling in consumer driven products and high deductible plans that involve greater patient cost-sharing.
The increased consolidation among health plans also has increased pricing transparency and bargaining power and the potential adverse impact of ceasing to be a contracted provider with any such insurer.
Government payers and third parties, including health plans, may not recognize the value of, or compensate or reimburse us for, new and innovative solutions.
Government payers and third parties, including health plans, are taking steps to reduce utilization of, and reimbursement for, some new and innovative healthcare solutions, including new tests and other solutions that we may offer.
In 2018, CMS finalized a national coverage determination for next-generation sequencing cancer panels. Under the determination, tests that gain FDA approval or clearance as an in vitro companion diagnostic will automatically receive full coverage, provided other coverage criteria are met. Coverage determinations for other diagnostic laboratory tests using next-generation sequencing will be made by Medicare Administrative Contractors. Clinical laboratory services providers are discussing this determination and others with CMS and Medicare Administrative Contractors to attempt to ensure that such providers can continue to provide these essential diagnostic services, but those discussions may not be successful.
In response to requests from payers to have a strategy to report a single or at most a few codes to describe procedures used to perform molecular and toxicology testing, the American Medical Association CPT® Editorial Panel has established and replaced billing codes used to report those procedures. The adoption of these revised codes has resulted in limited coverage decisions on certain occasions, payment denials by some payers, and new requirements for documentation to facilitate payment. While some payers have adopted the new payment methods, others have not yet modified their systems and ask that laboratories continue to report their services using the previous reporting strategies, when those codes still exist.
These steps may discourage innovation and access to innovative solutions that we may offer.
Our business operations and reputation may be materially impaired if we do not comply with privacy laws or information security policies.
In our business, we collect, generate, process or maintain sensitive information, such as patient data and other personal information. If we do use or not adequately safeguard that information in compliance with applicable requirements under federal, state and international laws, or if it were disclosed to persons or entities that should not have access to it, our business could be materially impaired, our reputation could suffer and we could be subject to fines, penalties and litigation. In the event of a data security breach, we may be subject to notification obligations, litigation and governmental investigation or sanctions, and may suffer reputational damage, which could have an adverse impact on our business.
We are subject to laws and regulations regarding protecting the security and privacy of certain healthcare and personal information, including: (a) the federal Health Insurance Portability and Accountability Act and the regulations thereunder, which establish (i) a complex regulatory framework including requirements for safeguarding protected health information and (ii) comprehensive federal standards regarding the uses and disclosures of protected health information; (b) state laws; and (c) the European Union's General Data Protection Regulation.
32
Our business could be negatively affected if we are unable to continue to improve our efficiency.
It is important that we continue to improve our efficiency to enable us to mitigate the impact on our profitability of steps taken by government payers and health insurers to reduce the utilization and reimbursement of healthcare services, including diagnostic information services.
Business development activities are inherently risky and integrating our operations with businesses we acquire may be difficult.
We plan selectively to enhance our business from time to time through business development activities, such as acquisitions, licensing, investments and alliances. However, these plans are subject to the availability of appropriate opportunities and competition from other companies seeking similar opportunities. Moreover, the success of any such effort may be affected by a number of factors, including our ability to properly assess and value the potential business opportunity, and to integrate it into our business. The success of our strategic alliances depends not only on our contributions and capabilities, but also on the property, resources, efforts and skills contributed by our strategic partners. Further, disputes may arise with strategic partners, due to conflicting priorities or conflicts of interests.
Each acquisition involves the integration of a separate company that has different systems, processes, policies and cultures. Integration of acquisitions involves a number of risks including the diversion of management's attention to the assimilation of the operations of businesses we have acquired, difficulties in the integration of operations and systems and the realization of potential operating synergies, the assimilation and retention of the personnel of the acquired companies, challenges in retaining the customers of the combined businesses, and potential adverse effects on operating results. The process of combining companies may be disruptive to our businesses and may cause an interruption of, or a loss of momentum in, such businesses as a result of the following difficulties, among others:
|
•
|
loss of key customers or employees;
|
|
•
|
difficulty in standardizing information and other systems;
|
|
•
|
difficulty in consolidating facilities and infrastructure;
|
|
•
|
failure to maintain the quality or timeliness of services that our Company has historically provided;
|
|
•
|
diversion of management's attention from the day-to-day business of our Company as a result of the need to deal with the foregoing disruptions and difficulties; and
|
|
•
|
the added costs of dealing with such disruptions.
|
If we are unable successfully to integrate strategic acquisitions in a timely manner, our business and our growth strategies could be negatively affected. Even if we are able to successfully complete the integration of the operations of other companies or businesses we may acquire in the future, we may not be able to realize all or any of the benefits that we expect to result from such integration, either in monetary terms or in a timely manner.
We are subject to numerous legal and regulatory requirements governing our activities, and we may face substantial fines and penalties, and our business activities may be impacted, if we fail to comply.
Our business is subject to or impacted by extensive and frequently changing laws and regulations in the United States (including at both the federal and state levels) and the other jurisdictions in which we engage in business. While we seek to conduct our business in compliance with all applicable laws, many of the laws and regulations applicable to us are vague or indefinite and have not been interpreted by the courts, including many of those relating to:
|
•
|
billing and reimbursement of clinical testing;
|
|
•
|
certification or licensure of clinical laboratories;
|
|
•
|
the anti-self-referral and anti-kickback laws and regulations;
|
|
•
|
the laws and regulations administered by the FDA;
|
|
•
|
the corporate practice of medicine;
|
|
•
|
operational, personnel and quality requirements intended to ensure that clinical testing services are accurate, reliable and timely;
|
|
•
|
physician fee splitting;
|
|
•
|
relationships with physicians and hospitals;
|
|
•
|
safety and health of laboratory employees; and
|
|
•
|
handling, transportation and disposal of medical specimens, infectious and hazardous waste and radioactive materials.
|
33
These laws and regulations may be interpreted or applied by a prosecutorial, regulatory or judicial authority in a manner that could require us to make changes in our operations, including our pricing and/or billing practices. We may not be able to maintain, renew or secure required permits, licenses or any other regulatory approvals needed to operate our business or commercialize our services. If we fail to comply with applicable laws and regulations, or if we fail to maintain, renew or obtain necessary permits, licenses and approvals, we could suffer civil and criminal penalties, fines, exclusion from participation in governmental healthcare programs and the loss of various licenses, certificates and authorizations necessary to operate our business, as well as incur additional liabilities from third-party claims. If any of the foregoing were to occur, our reputation could be damaged and important business relationships with third parties could be adversely affected.
We regularly receive requests for information, and occasionally subpoenas, from governmental authorities. We also are subject from time to time to
qui tam
claims brought by former employees or other “whistleblowers.” The federal and state governments continue aggressive enforcement efforts against perceived healthcare fraud. Legislative provisions relating to healthcare fraud and abuse provide government enforcement personnel substantial funding, powers, penalties and remedies to pursue suspected cases of fraud and abuse. In addition, the government has substantial leverage in negotiating settlements since the amount of potential damages far exceeds the rates at which we are reimbursed for our services, and the government has the remedy of excluding a non-compliant provider from participation in the Medicare and Medicaid programs. Regardless of merit or eventual outcome, these types of investigations and related litigation can result in:
|
•
|
diversion of management time and attention;
|
|
•
|
expenditure of large amounts of cash on legal fees, costs and payment of damages;
|
|
•
|
limitations on our ability to continue some of our operations;
|
|
•
|
enforcement actions, fines and penalties or the assertion of private litigation claims and damages;
|
|
•
|
decreased demand for our services; and/or
|
|
•
|
injury to our reputation.
|
Although we believe that we are in compliance, in all material respects, with applicable laws and regulations, there can be no assurance that a regulatory agency or tribunal would not reach a different conclusion. Moreover, even when an investigation is resolved favorably, the process may be time-consuming and the legal costs and diversion of management focus may be extensive.
Changes in applicable laws and regulations may result in existing practices becoming more restricted, or subject our existing or proposed services to additional costs, delay, modification, withdrawal or reconsideration. Such changes also could require us to modify our business objectives.
Our business could be adversely impacted by the FDA's approach to regulation.
The FDA has regulatory responsibility over, among other areas, instruments, software, test kits, reagents and other devices used by clinical laboratories to perform diagnostic testing in the U.S. A number of tests we develop internally are offered as LDTs. The FDA has claimed regulatory authority over all LDTs, but has stated that it exercised enforcement discretion with regard to most LDTs performed by high complexity CLIA-certified laboratories.
As the FDA moves to regulate more clinical laboratory testing, its approach to regulation is impacting industry practices and participants, new competitors may enter the industry, and competition may come in new forms.
In late 2018, legislation was introduced in Congress that would enable the FDA to regulate LDTs, in vitro diagnostics, software and other items used in the diagnosis of disease. If this legislation were to become law, the FDA could regulate diagnostic tests and components and platforms used as part of these tests. If such legislation were to become law, it could have a significant impact on the clinical laboratory testing industry, including regulating LDTs in new ways and creating avenues of opportunity and competition regarding clinical laboratory testing. New competitors may enter the industry, and competition may come in new forms.
Pursuant to the 21st Century Cures Act, the FDA issued guidance regarding its position on the regulation of clinical decision software, which may be used in, or in connection with, LDTs. The guidance attempts to clarify whether FDA approval of certain software is required. In January 2019 the FDA issued a draft guidance on a pre-certification pilot program to help software developers have a speedier and less restrictive path to clearance or approval of their software.
34
Failure to accurately bill for our services, or to comply with applicable laws relating to government healthcare programs, could have a material adverse effect on our business.
Billing for diagnostic information services is complex and subject to extensive and non-uniform rules and administrative requirements. Depending on the billing arrangement and applicable law, we bill various payers, such as patients, insurance companies, Medicare, Medicaid, clinicians, hospitals and employer groups. The majority of billing and related operations for our Company are being provided by a third party under the Company's oversight. Failure to accurately bill for our services could have a material adverse effect on our business. In addition, failure to comply with applicable laws relating to billing government healthcare programs may result in various consequences, including: (1) exclusion from participation in Medicare/Medicaid programs; (2) asset forfeitures; (3) civil and criminal fines and penalties; and (4) the loss of various licenses, certificates and authorizations necessary to operate our business.
Hardware and software failures or delays in our information technology systems, including failures resulting from our systems conversions or otherwise, could disrupt our operations and cause the loss of confidential information, customers and business opportunities or otherwise adversely impact our business.
IT systems are used extensively in virtually all aspects of our business, including clinical testing, test reporting, billing, customer service, logistics and management of medical data. Our success depends, in part, on the continued and uninterrupted performance of our IT systems. A failure or delay in our IT systems could impede our ability to serve our customers and patients and protect their confidential personal data. Despite redundancy and backup measures and precautions that we have implemented, our IT systems may be vulnerable to damage, disruptions and shutdown from a variety of sources, including telecommunications or network failures, system conversion or standardization initiatives, human acts and natural disasters. These issues can also arise as a result from failures by third parties with whom we do business and for which we have limited control. Any disruption or failure of our IT systems could have a material impact on our ability to serve our customers and patients, including negatively affecting our reputation in the marketplace.
Despite the security measures we have implemented, our IT systems may be subject to unauthorized tampering, cyber attack or other security breach.
Our IT systems are also subject to potential cyber attacks or other security breaches. These attacks, if successful, could result in shutdowns or significant disruptions of our IT systems and/or in unauthorized persons misappropriating intellectual property and other confidential information, including patient data that we obtain, transmit and store on and through our IT systems.
External actors may develop and deploy viruses and other malicious software programs, including those that target our employees, designed to attack our IT systems or otherwise exploit security vulnerabilities, such as electronic spamming, phishing, spear phishing or similar tactics. As a result of the difficulty in detecting many of these attacks, intrusions and breaches, failures or losses may be repeated or compounded before they are discovered or rectified, which could further increase these costs and consequences. In December 2016, we reported that an internet application on our IT network had been the target of an external cyber attack, resulting in the theft of certain patient data. The accessed data did not include Social Security numbers, credit card information, or insurance and other financial information, and there is no indication that patient data has been misused in any way. When the intrusion was discovered, we immediately took steps to stop any further unauthorized activity.
In addition to the data breach reported in December 2016, our IT systems from time to time have experienced other attacks, viruses, attempted intrusions or similar problems, but each was mitigated. None materially disrupted, interrupted, damaged or shutdown the Company's IT systems, materially disrupted the Company's performance of its business or, to the Company's knowledge, resulted in material unauthorized access to data.
Although the Company has robust security measures implemented, which are monitored and routinely tested both by internal resources and external parties, cyber threats continue to evolve and are often not recognized until such attacks are launched against a potential target. There can be no assurance that the Company can anticipate all such evolving future attacks, viruses or intrusions, implement adequate preventative measures, nor remediate any security vulnerabilities. Such breaches could expose our IT systems to attack, which could result in major disruption of our business, and compromise our customer’s confidential information, result in litigation and potential liability for the Company, government investigation, significant damage to our reputation or otherwise adversely affect our business. Any mitigation or remediation efforts that we undertake may require expenditures of significant resources and the diversion of the attention of management.
35
Third parties to whom we outsource certain of our services or functions, or with whom we interface, may store our confidential, patient data or other confidential information, are also subject to the risks outlined above. A breach or attack affecting these third parties could also harm our business, results of operations and reputation.
We have taken, and continue to take, precautionary measures to reduce the risk of, and detect and respond to, future cyber threats, and prevent or minimize vulnerabilities in our IT systems, including the loss or theft of intellectual property, patient data or other confidential information that we obtain and store on our systems. In addition, we collaborate with government agencies regarding potential cyber threats and have worked with a leading cyber security firm to evaluate and strengthen our systems. There can be no assurances that our precautionary measures will prevent, contain or successfully defend against cyber or information security threats that could have a significant impact on our business.
Failure to develop, or acquire licenses for, new tests, technology and services could negatively impact our testing volume and revenues.
The diagnostic information services industry is faced with changing technology and new product introductions. Other companies or individuals, including our competitors, may obtain patents or other property rights that would prevent, limit or interfere with our ability to develop, perform or sell our solutions or operate our business or increase our costs. In addition, they could introduce new tests, technologies or services that may result in a decrease in the demand for our services or cause us to reduce the prices of our services. Our success in continuing to introduce new solutions, technology and services will depend, in part, on our ability to license new and improved technologies on favorable terms. We may be unable to develop or introduce new solutions or services. We also may be unable to continue to negotiate acceptable licensing arrangements, and arrangements that we do conclude may not yield commercially successful clinical tests. If we are unable to license these testing methods at competitive rates, our research and development costs may increase as a result. In addition, if we are unable to develop and introduce, or license, new solutions, technology and services to expand our advanced testing capabilities, our services may become outdated when compared with our competition.
We may be unable to obtain, maintain or enforce our intellectual property rights and may be subject to intellectual property litigation that could adversely impact our business.
We may be unable to obtain or maintain adequate patent or other proprietary rights for our solutions or services or to successfully enforce our proprietary rights. In addition, we may be subject to intellectual property litigation and we may be found to infringe on the proprietary rights of others, which could force us to do one or more of the following:
|
•
|
cease developing, performing or selling solutions or services that incorporate the challenged intellectual property;
|
|
•
|
obtain and pay for licenses from the holder of the infringed intellectual property right;
|
|
•
|
redesign or re-engineer our tests;
|
|
•
|
change our business processes; or
|
|
•
|
pay substantial damages, court costs and attorneys' fees, including potentially increased damages for any infringement held to be willful.
|
The development of new technologies may impact the healthcare industry, and the development of new, more cost-effective solutions that can be performed by our customers or by patients, and the continued internalization of testing by hospitals or clinicians, could negatively impact our testing volume and revenues.
The diagnostic information services industry is faced with changing technology and new product introductions, including technology that enables more convenient or cost-effective testing. For example, digital pathology is an emerging technology that may change the practice of pathology. Information technology that includes self-learning or "artificial intelligence" features is growing and may impact the healthcare industry.
Competitors also may offer testing to be performed outside of a commercial clinical laboratory, such as (1) point-of-care testing that can be performed by clinicians in their offices; (2) complex testing that can be performed by hospitals in their own laboratories; and (3) home testing that can be carried out without requiring the services of outside providers. Advances in technology also may lead to the need for less frequent testing. Further, diagnostic tests approved or cleared by the FDA for home use are automatically deemed to be “waived” tests under CLIA and may be performed by patients in their homes; test kit manufacturers could seek to increase sales to patients of such test kits.
Some traditional customers for anatomic pathology services, including specialty physicians that generate biopsies through surgical procedures, such as dermatologists, gastroenterologists, urologists and oncologists, have added in-office histology labs or have retained pathologists to read cases on site. Hospitals also are internalizing clinical laboratory testing,
36
including some non-routine and advanced testing. Internalization of testing may reduce demand for services previously referred to outside service providers, such as the Company.
Our outstanding debt may impair our financial and operating flexibility.
As of
December 31, 2018
, we had approximately
$3.9 billion
of debt outstanding. Except for operating leases, we do not have any off-balance sheet financing arrangements in place or available. Our debt agreements contain various restrictive covenants. These restrictions could limit our ability to use operating cash flow in other areas of our business because we must use a portion of these funds to make principal and interest payments on our debt. We have obtained ratings on our public debt from Standard and Poor's, Moody's Investor Services and Fitch Ratings. There can be no assurance that any rating so assigned will remain for any given period of time or that a rating will not be lowered or withdrawn entirely by a rating agency if in that rating agency's judgment future circumstances relating to the basis of the rating, such as adverse changes in our Company or our industry, so warrant. If such ratings are lowered, our borrowing costs could increase. Changes in our credit ratings, however, do not require repayment or acceleration of any of our debt.
We or our subsidiaries may incur additional indebtedness in the future. Our ability to make principal and interest payments will depend on our ability to generate cash in the future. If we incur additional debt, a greater portion of our cash flows may be needed to satisfy our debt service obligations and if we do not generate sufficient cash to meet our debt service requirements, we may need to seek additional financing. In that case, it may be more difficult, or we may be unable, to obtain financing on terms that are acceptable to us. As a result, we would be more vulnerable to general adverse economic, industry and capital markets conditions as well as the other risks associated with indebtedness.
Our ability to attract and retain qualified employees is critical to the success of our business and the failure to do so may materially adversely affect our performance.
Our people are a critical resource. The supply of qualified personnel may be limited and competition for qualified employees is strong. We may lose, or fail to attract and retain, key management personnel, or qualified skilled technical or professional employees (
e.g.
, pathologists).
Failure to establish, and perform to, appropriate quality standards to assure that the appropriate standard of quality is observed in the performance of our diagnostic information services could adversely affect the results of our operations and adversely impact our reputation.
The provision of diagnostic information services involves certain inherent risks. The services that we provide are intended to provide information for healthcare providers in providing patient care. Therefore, users of our services may have a greater sensitivity to errors than the users of services or products that are intended for other purposes.
Negligence in performing our services can lead to injury or other adverse events. We may be sued under physician liability or other liability law for acts or omissions by our pathologists, laboratory personnel and hospital employees who are under the supervision of our hospital-based pathologists. We are subject to the attendant risk of substantial damages awards and risk to our reputation.
We are subject to numerous political, legal, operational and other risks as a result of our international operations which could impact our business in many ways.
Our international operations increase our exposure to risks inherent in doing business in non-U.S. markets, which may vary by market and include: intellectual property legal protections and remedies; weak legal systems which may affect our ability to enforce contractual rights; trade regulations and procedures and actions affecting approval, production, pricing, reimbursement and marketing of services; and challenges based on differing languages and cultures. International operations also require us to devote significant management resources to implement our controls and systems in new markets, and to comply with the U.S. Foreign Corrupt Practices Act and similar anti-corruption laws in non-U.S. jurisdictions.
Our operations may be adversely impacted by the effects of natural disasters such as hurricanes and earthquakes, health pandemics, hostilities or acts of terrorism and other criminal activities.
Our operations may be adversely impacted by the effects of natural disasters such as hurricanes and earthquakes, health pandemics, hostilities or acts of terrorism or other criminal activities. Such events may result in a decline in the number of patients who seek clinical testing services or in our employees' ability to perform their job duties. In addition, such events may interrupt our ability to transport specimens, to receive materials from our suppliers or otherwise to provide our services.
37
Adverse results in material litigation could have an adverse financial impact and an adverse impact on our client base and reputation.
We are involved in various legal proceedings arising in the ordinary course of business including, among other things, disputes as to intellectual property, professional liability and employee-related matters, as well as inquiries from governmental agencies and Medicare or Medicaid carriers. Some proceedings against us involve claims that are substantial in amount and could divert management's attention from operations. The proceedings also may result in substantial monetary damages.
CAUTIONARY FACTORS THAT MAY AFFECT FUTURE RESULTS
Some statements and disclosures in this document are forward-looking statements. Forward-looking statements include all statements that do not relate solely to historical or current facts and can be identified by the use of words such as “may,” “believe,” “will,” “expect,” “project,” “estimate,” “anticipate,” “plan” or “continue.” These forward-looking statements are based on our current plans and expectations and are subject to a number of risks and uncertainties that could cause our plans and expectations, including actual results, to differ materially from the forward-looking statements. Investors are cautioned not to unduly rely on such forward-looking statements when evaluating the information presented in this document. The following important factors could cause our actual financial results to differ materially from those projected, forecasted or estimated by us in forward-looking statements:
|
(a)
|
Heightened competition from commercial clinical testing companies, hospitals, physicians and others.
|
|
(b)
|
Increased pricing pressure from customers, including payers and patients.
|
|
(c)
|
A decline in economic conditions.
|
|
(d)
|
Impact of changes in payment mix, including increased patient financial responsibility and any shift from fee-for-service to discounted, capitated or bundled fee arrangements.
|
|
(e)
|
Adverse actions by government or other third-party payers, including healthcare reform that focuses on reducing healthcare costs but does not recognize the value and importance to healthcare of clinical testing or innovative solutions, unilateral reduction of fee schedules payable to us, unilateral recoupment of amounts allegedly owed and competitive bidding.
|
|
(f)
|
The impact upon our testing volume and collected revenue or general or administrative expenses resulting from compliance with policies and requirements imposed by Medicare, Medicaid and other third-party payers. These include:
|
|
(1)
|
the requirements of government and other payers to provide diagnosis codes and other information for many tests;
|
|
(2)
|
inability to obtain from patients a valid advance consent form for tests that cannot be billed without prior receipt of the form;
|
|
(3)
|
the impact of additional or expanded limited coverage policies and limits on the allowable number of test units or ordering frequency of same; and
|
|
(4)
|
the impact of increased prior authorization programs.
|
|
(g)
|
Adverse results from pending or future government investigations, lawsuits or private actions. These include, in particular, monetary damages, loss or suspension of licenses, and/or suspension or exclusion from the Medicare and Medicaid programs and/or criminal penalties.
|
|
(h)
|
Failure to efficiently integrate acquired businesses and to manage the costs related to any such integration, or to retain key technical, professional or management personnel.
|
|
(i)
|
Denial, suspension or revocation of CLIA certification or other licenses for any of our clinical laboratories under the CLIA standards, revocation or suspension of the right to bill the Medicare and Medicaid programs or other adverse regulatory actions by federal, state and local agencies.
|
|
(j)
|
Changes in and complexity of federal, state or local laws or regulations, including changes that result in new or increased federal or state regulation of commercial clinical laboratories, tests developed by commercial clinical laboratories or other products or services that we offer or activities in which we are engaged, including regulation by the FDA.
|
|
(k)
|
Inability to achieve expected benefits from our acquisitions of other businesses.
|
|
(l)
|
Inability to achieve additional benefits from our business performance tools and efficiency initiatives.
|
|
(m)
|
Adverse publicity and news coverage about the diagnostic information services industry or us.
|
|
(n)
|
Failure of the Company to maintain, defend and secure its financial, accounting, technology, customer data and other operational systems from cyberattacks, IT system outages, telecommunications failures, malicious human acts and failure of the systems of third parties upon which the Company relies.
|
|
(o)
|
Development of technologies that substantially alter the practice of clinical testing, including technology changes that lead to the development of more convenient or cost-effective testing, or testing to be performed outside of a
|
38
commercial clinical laboratory, such as (1) point-of-care testing that can be performed by physicians in their offices, (2) advanced testing that can be performed by hospitals in their own laboratories or (3) home testing that can be carried out without requiring the services of clinical laboratories.
|
(p)
|
Negative developments regarding intellectual property and other property rights that could prevent, limit or interfere with our ability to develop, perform or sell our tests or operate our business. These include:
|
|
(1)
|
Issuance of patents or other property rights to our competitors or others; and
|
|
(2)
|
Inability to obtain or maintain adequate patent or other proprietary rights for our products and services or to successfully enforce our proprietary rights.
|
|
(q)
|
Development of tests by our competitors or others which we may not be able to license, or usage of our technology or similar technologies or our trade secrets or other intellectual property by competitors, any of which could negatively affect our competitive position.
|
|
(r)
|
Regulatory delay or inability to commercialize newly developed or licensed tests or technologies or to obtain appropriate reimbursements for such tests.
|
|
(s)
|
The complexity of billing and revenue recognition for clinical laboratory testing.
|
|
(t)
|
Changes in interest rates and changes in our credit ratings from Standard & Poor's, Moody's Investor Services or Fitch Ratings causing an unfavorable impact on our cost of and access to capital.
|
|
(u)
|
Inability to hire or retain qualified or key senior management personnel.
|
|
(v)
|
Terrorist and other criminal activities, hurricanes, earthquakes or other natural disasters, and health pandemics, which could affect our customers, transportation or systems, or our facilities, and for which insurance may not adequately reimburse us.
|
|
(w)
|
Difficulties and uncertainties in the discovery, development, regulatory environment and/or marketing of new services or solutions or new uses of existing tests.
|
|
(x)
|
Failure to adapt to changes in the healthcare system (including the medical laboratory testing market) and healthcare delivery, including those stemming from the ACA (or its repeal, amendment or replacement), PAMA, trends in utilization of the healthcare system and increased patient financial responsibility for services.
|
|
(y)
|
Results and consequences of governmental inquiries.
|
(z) Difficulty in implementing, or lack of success with, our strategic plan.
(aa) The impact of informatics on our industry and the ability of our Company to adapt to that impact.
(bb) Failure to adequately operationalize appropriate controls around use of our data, including risk of non-compliance with privacy law requirements.
Item 1B. Unresolved Staff Comments
There are no unresolved SEC comments that require disclosure.
Item 2. Properties
Our executive offices are located in Secaucus, New Jersey. We maintain clinical testing laboratories throughout the continental United States; in several instances a joint venture of which we are a partner maintains the laboratory. We also maintain offices, data centers, call centers, distribution centers and patient service centers at locations throughout the United States. In addition, we maintain offices, patient service centers and clinical laboratories in locations outside the United States, including in Puerto Rico and Mexico. Our properties that are not owned are leased on terms and for durations that are reflective of commercial standards in the communities where these properties are located. We believe that, in general, our facilities are suitable and adequate for our current and anticipated future levels of operation and are adequately maintained. We believe that if we were unable to renew a lease on any of our facilities, we could find alternative space at competitive market rates and relocate our operations to such new location without material disruption to our business. Several of our principal facilities are highlighted below.
39
|
Location
|
Leased or Owned
|
|
|
Sacramento, California (laboratory)
|
Leased
|
|
|
West Hills, California (laboratory)
|
Leased
|
|
|
San Juan Capistrano, California (laboratory)
|
Owned
|
|
|
Tampa, Florida (laboratory)
|
Owned
|
|
|
Atlanta, Georgia (laboratory)
|
Owned
|
|
|
Chicago, Illinois (2) (laboratories)
|
One owned, one leased
|
|
|
Marlborough, Massachusetts (laboratories)
|
Leased
|
|
|
Baltimore, Maryland (laboratory)
|
Owned
|
|
|
Teterboro, New Jersey (laboratory)
|
Owned
|
|
|
Philadelphia, Pennsylvania (laboratory)
|
Leased
|
|
|
Dallas, Texas (laboratory)
|
Leased
|
|
|
Chantilly, Virginia (laboratory)
|
Leased
|
|
|
Lenexa, Kansas (laboratory)
|
Owned
|
|
|
Greensboro, North Carolina (laboratory)
|
Leased
|
|
|
Lewisville, Texas (laboratory)
|
Leased
|
|
|
Cleveland, Ohio (laboratory)
|
Leased
|
|
Item 3. Legal Proceedings
See Note 18 to the Consolidated Financial Statements (Part II, Item 8 of this Report) for information regarding legal proceedings in which we are involved.
Item 4. Mine Safety Disclosures
Not applicable.
40
PART II
Item 5. Market for Registrant's Common Equity, Related Stockholder Matters and Issuer Purchases of Equity Securities
Our common stock is listed and traded on the New York Stock Exchange under the symbol “DGX.” As of February 1, 2019, we had approximately 2,600 record holders of our common stock; we believe that the number of beneficial holders of our common stock exceeds the number of record holders.
The table below sets forth the information with respect to purchases made by or on behalf of the Company of its common stock during the
fourth
quarter of
2018
.
|
ISSUER PURCHASES OF EQUITY SECURITIES
|
||||||||||||||
|
Period
|
Total Number of
Shares
Purchased
|
Average Price
Paid per Share
|
Total Number of
Shares Purchased
as Part of Publicly
Announced Plans
or Programs
|
Approximate
Dollar Value of
Shares that May
Yet Be Purchased
Under the Plans
or Programs
(in thousands)
|
||||||||||
|
October 1, 2018 – October 31, 2018
|
|
|
|
|
|
|
|
|
||||||
|
Share Repurchase Program (A)
|
130,414
|
|
$
|
92.01
|
|
130,414
|
|
$
|
755,124
|
|
||||
|
Employee Transactions (B)
|
797
|
|
$
|
103.14
|
|
N/A
|
|
N/A
|
|
|||||
|
November 1, 2018 – November 30, 2018
|
||||||||||||||
|
Share Repurchase Program (A)
|
482,952
|
|
$
|
95.24
|
|
482,952
|
|
$
|
709,126
|
|
||||
|
Employee Transactions (B)
|
714
|
|
$
|
96.06
|
|
N/A
|
|
N/A
|
|
|||||
|
December 1, 2018 – December 31, 2018
|
||||||||||||||
|
Share Repurchase Program (A)
|
1,365,222
|
|
$
|
85.70
|
|
1,365,222
|
|
$
|
592,126
|
|
||||
|
Employee Transactions (B)
|
1,902
|
|
$
|
82.74
|
|
N/A
|
|
N/A
|
|
|||||
|
Total
|
||||||||||||||
|
Share Repurchase Program (A)
|
1,978,588
|
|
$
|
88.45
|
|
1,978,588
|
|
$
|
592,126
|
|
||||
|
Employee Transactions (B)
|
3,413
|
|
$
|
90.29
|
|
N/A
|
|
N/A
|
|
|||||
|
(A)
|
Since the share repurchase program's inception in May 2003, our Board of Directors has authorized $8.0 billion of share repurchases of our common stock through
December 31, 2018
. The share repurchase authority has no set expiration or termination date.
|
|
(B)
|
Includes: (1) shares delivered or attested to in satisfaction of the exercise price and/or tax withholding obligations by holders of stock options (granted under the Company's Amended and Restated Employee Long-Term Incentive Plan) who exercised options; and (2) shares withheld (under the terms of grants under the Long-Term Incentive Plan) to offset tax withholding obligations that occur upon the delivery of outstanding common shares underlying restricted share units and performance share units.
|
41
Performance Graph
Set forth below is a line graph comparing the cumulative total shareholder return on Quest Diagnostics' common stock since December 31, 2013 based on the market price of the Company's common stock and assuming reinvestment of dividends, with the cumulative total shareholder return of companies on the Standard & Poor's 500 Stock Index and the S&P 500 Healthcare Equipment & Services Index.
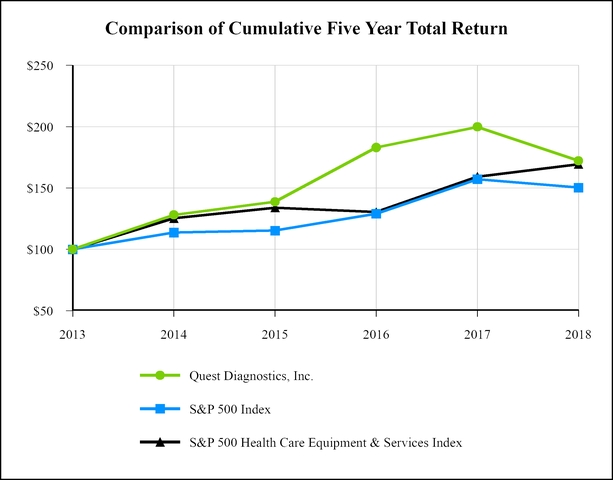
|
Closing DGX Price
|
Total Shareholder Return
|
Performance Graph Values
|
|||||||||||||||||||||||
|
Date
|
DGX
|
S&P 500
|
S&P 500 H.C.
|
DGX
|
S&P 500
|
S&P 500 H.C.
|
|||||||||||||||||||
|
12/31/2014
|
$
|
67.06
|
|
28.06
|
%
|
13.69
|
%
|
25.34
|
%
|
$
|
128.06
|
|
$
|
113.69
|
|
$
|
125.34
|
|
|||||||
|
12/31/2015
|
$
|
71.14
|
|
8.35
|
%
|
1.38
|
%
|
6.89
|
%
|
$
|
138.75
|
|
$
|
115.26
|
|
$
|
133.97
|
|
|||||||
|
12/30/2016
|
$
|
91.90
|
|
31.89
|
%
|
11.96
|
%
|
(2.69
|
)%
|
$
|
183.01
|
|
$
|
129.05
|
|
$
|
130.37
|
|
|||||||
|
12/29/2017
|
$
|
98.49
|
|
9.16
|
%
|
21.83
|
%
|
22.08
|
%
|
$
|
199.77
|
|
$
|
157.22
|
|
$
|
159.15
|
|
|||||||
|
12/31/2018
|
$
|
83.27
|
|
(13.84
|
)%
|
(4.38
|
)%
|
6.47
|
%
|
$
|
172.12
|
|
$
|
150.33
|
|
$
|
169.44
|
|
|||||||
Item 6. Selected Financial Data
|
See page
49
.
|
42
Item 7. Management's Discussion and Analysis of Financial Condition and Results of Operations
|
See page
53
.
|
Item 7A. Quantitative and Qualitative Disclosures About Market Risk
See Management's Discussion and Analysis of Financial Condition and Results of Operations.
Item 8. Financial Statements and Supplementary Data
See Item 15(a)1 and Item 15(a)2.
Item 9. Changes in and Disagreements with Accountants on Accounting and Financial Disclosure
None.
Item 9A. Controls and Procedures
Conclusion Regarding Effectiveness of Disclosure Controls and Procedures
Under the supervision and with the participation of our management, including our Chief Executive Officer and our Chief Financial Officer, we have evaluated the effectiveness of our disclosure controls and procedures (as defined under Rules 13a-15(e) and 15d-15(e) of the Securities Exchange Act of 1934, as amended). Based upon that evaluation, our Chief Executive Officer and our Chief Financial Officer concluded that our disclosure controls and procedures were effective as of the end of the period covered by this annual report.
Report of Management on Internal Control Over Financial Reporting
|
See page
72
.
|
Changes in Internal Control
During the fourth quarter of 2018, there were no changes in our internal control over financial reporting (as defined in Rule 13a-15(f) under the Securities Exchange Act of 1934, as amended) that materially affected, or are reasonably likely to materially affect, our internal control over financial reporting.
Item 9B. Other Information
None.
43
PART III
Item 10. Directors, Executive Officers and Corporate Governance
Our Code of Ethics applies to all employees, executive officers and directors, including our Chief Executive Officer, Chief Financial Officer and Corporate Controller. You can find our Code of Ethics on our corporate governance website,
www.QuestDiagnostics.com/governance
. We will post any amendments to the Code of Ethics, and any waivers that are required to be disclosed by the rules of either the SEC or the New York Stock Exchange, on our website.
Information regarding the Company's executive officers is contained in Part I, Item 1 of this Report under “Executive Officers of the Company.” Information regarding the directors and executive officers of the Company appearing in our Proxy Statement to be filed by April 30,
2019
(“Proxy Statement”) under the captions “Proposal No. 1 - Election of Directors,” “Director Independence,” “Board Committees” and "Section 16(a) Beneficial Ownership Reporting Compliance" is incorporated by reference herein.
Item 11. Executive Compensation
Information appearing in our Proxy Statement under the captions “
2018
Director Compensation Table,” “Compensation Discussion and Analysis,” “Information Regarding Executive Compensation” and “Compensation Committee Report” is incorporated by reference herein.
Item 12. Security Ownership of Certain Beneficial Owners and Management and Related Stockholders' Matters
Information regarding security ownership of certain beneficial owners and management appearing in our Proxy Statement under the captions “Stock Ownership Information” and "Equity Compensation Plan Information" is incorporated by reference herein.
Item 13. Certain Relationships and Related Transactions, and Director Independence
Information regarding certain relationships and related transactions appearing in our Proxy Statement under the captions “Related Person Transactions” and “Director Independence” is incorporated by reference herein.
Item 14. Principal Accounting Fees and Services
Information regarding principal accountant fees and services appearing in our Proxy Statement under the caption “Audit" (excluding the information under the subheading “Audit and Finance Committee Report”) is incorporated by reference herein.
44
PART IV
Item 15. Exhibits, Financial Statement Schedules
|
(a)
|
Documents filed as part of this Report.
|
|
1.
|
Index to financial statements and supplementary data filed as part of this Report.
|
|
Item
|
Page
|
|
Financial Statements
|
|
|
2.
|
Financial Statement Schedule.
|
|
3.
|
Exhibits
|
An exhibit index has been filed as part of this Report beginning on page E-1 and is incorporated herein by reference.
|
(b)
|
Exhibits filed as part of this Report.
|
An exhibit index has been filed as part of this Report beginning on page E-1 and is incorporated herein by reference.
|
(c)
|
None.
|
45
Item 16. Form 10-K Summary
None.
46
Signatures
Pursuant to the requirements of Sections 13 or 15(d) of the Securities Exchange Act of 1934, the Registrant has duly caused this report to be signed on its behalf by the undersigned, thereunto duly authorized, on
February 21, 2019
.
|
QUEST DIAGNOSTICS INCORPORATED
|
||
|
(Registrant)
|
||
|
By:
|
/s/Stephen H. Rusckowski
|
|
|
Stephen H. Rusckowski
|
||
|
Chairman of the Board, President and Chief Executive Officer
|
||
Each individual whose signature appears below constitutes and appoints Michael E. Prevoznik and William J. O'Shaughnessy, Jr., and each of them singly, his or her true and lawful attorneys-in-fact and agents with full power of substitution, for him or her and in his or her name, place and stead, in any and all capacities, to sign any and all amendments to this Annual Report on Form 10-K filed with the Securities and Exchange Commission, granting unto said attorneys-in-fact and agents, and each of them, full power and authority to do and perform each and every act and thing requisite and necessary to be done in and about the premises, as fully to all intents and purposes as he or she might or could do in person, hereby ratifying and confirming all the said attorneys-in-fact and agents or any of them or their or his or her substitute or substitutes, may lawfully do or cause to be done by virtue hereof.
Pursuant to the requirements of the Securities Exchange Act of 1934, this report has been signed below by the following persons on behalf of the Registrant and in the capacities indicated on
February 21, 2019
.
47
|
Signature
|
Capacity
|
|
|
/s/Stephen H. Rusckowski
Stephen H. Rusckowski
|
Chairman of the Board, President and Chief Executive Officer
(Principal Executive Officer)
|
|
|
/s/Mark J. Guinan
Mark J. Guinan
|
Executive Vice President and Chief Financial Officer
(Principal Financial Officer)
|
|
|
/s/Robert A. Klug
Robert A. Klug
|
Vice President, Corporate Controller and Chief Accounting Officer
(Principal Accounting Officer)
|
|
|
/s/Jenne K. Britell, Ph.D.
Jenne K. Britell, Ph.D.
|
Director
|
|
|
/s/Vicky B. Gregg
Vicky B. Gregg
|
Director
|
|
|
/s/Jeffrey M. Leiden, M.D., Ph. D.
Jeffrey M. Leiden, M.D., Ph. D.
|
Director
|
|
|
/s/Timothy L. Main
Timothy L. Main
|
Director
|
|
|
/s/Denise M. Morrison
Denise M. Morrison
|
Director
|
|
|
/s/Gary M. Pfeiffer
Gary M. Pfeiffer
|
Director
|
|
|
/s/Timothy M. Ring
Timothy M. Ring
|
Director
|
|
|
/s/Daniel C. Stanzione, Ph.D.
Daniel C. Stanzione, Ph.D.
|
Director
|
|
|
/s/Helen I. Torley, M.B. Ch. B., M.R.C.P.
Helen I. Torley, M.B. Ch. B., M.R.C.P.
|
Director
|
|
|
/s/Gail R. Wilensky, Ph.D.
Gail R. Wilensky, Ph.D.
|
Director
|
|
48
SELECTED HISTORICAL FINANCIAL DATA OF OUR COMPANY
The following table summarizes selected historical financial data of our Company and our subsidiaries at the dates and for each of the periods presented. We derived the selected historical financial data for the years
2016
through
2018
from the audited consolidated financial statements of our Company. Refer to the Note (a) below regarding the impact of adoption of new accounting standards on our consolidated financial statements. The selected historical financial data is only a summary and should be read together with the audited consolidated financial statements and related notes of our Company and management's discussion and analysis of financial condition and results of operations included elsewhere in this Annual Report on Form 10-K.
|
Year Ended December 31,
|
|||||||||||||||||||
|
2018
|
2017
|
2016
|
2015
|
2014
|
|||||||||||||||
|
(dollars in millions, except per share data)
|
|||||||||||||||||||
|
Operations Data:
|
(a) (b) (c)
|
(a) (d) (e)
|
(a) (f) (g)
|
(a) (h) (i)
|
(a) (j) (k)
|
||||||||||||||
|
Net revenues
|
$
|
7,531
|
|
$
|
7,402
|
|
$
|
7,214
|
|
$
|
7,493
|
|
$
|
7,435
|
|
||||
|
Operating income
|
1,101
|
|
1,165
|
|
1,277
|
|
1,399
|
|
983
|
|
|||||||||
|
Income from continuing operations
|
788
|
|
824
|
|
696
|
|
753
|
|
587
|
|
|||||||||
|
Income from discontinued operations, net of taxes
|
—
|
|
—
|
|
—
|
|
—
|
|
5
|
|
|||||||||
|
Net income
|
788
|
|
824
|
|
696
|
|
753
|
|
592
|
|
|||||||||
|
Less: Net income attributable to noncontrolling interests
|
52
|
|
52
|
|
51
|
|
44
|
|
36
|
|
|||||||||
|
Net income attributable to Quest Diagnostics
|
$
|
736
|
|
$
|
772
|
|
$
|
645
|
|
$
|
709
|
|
$
|
556
|
|
||||
|
Amounts attributable to Quest Diagnostics' stockholders:
|
|||||||||||||||||||
|
Income from continuing operations
|
$
|
736
|
|
$
|
772
|
|
$
|
645
|
|
$
|
709
|
|
$
|
551
|
|
||||
|
Income from discontinued operations, net of taxes
|
—
|
|
—
|
|
—
|
|
—
|
|
5
|
|
|||||||||
|
Net income
|
$
|
736
|
|
$
|
772
|
|
$
|
645
|
|
$
|
709
|
|
$
|
556
|
|
||||
|
Earnings per share attributable to Quest Diagnostics' common stockholders - basic:
|
|||||||||||||||||||
|
Income from continuing operations
|
$
|
5.39
|
|
$
|
5.63
|
|
$
|
4.58
|
|
$
|
4.92
|
|
$
|
3.80
|
|
||||
|
Income from discontinued operations
|
—
|
|
—
|
|
—
|
|
—
|
|
0.03
|
|
|||||||||
|
Net income
|
$
|
5.39
|
|
$
|
5.63
|
|
$
|
4.58
|
|
$
|
4.92
|
|
$
|
3.83
|
|
||||
|
Earnings per share attributable to Quest Diagnostics' common stockholders - diluted:
|
|||||||||||||||||||
|
Income from continuing operations
|
$
|
5.29
|
|
$
|
5.50
|
|
$
|
4.51
|
|
$
|
4.87
|
|
$
|
3.78
|
|
||||
|
Income from discontinued operations
|
—
|
|
—
|
|
—
|
|
—
|
|
0.03
|
|
|||||||||
|
Net income
|
$
|
5.29
|
|
$
|
5.50
|
|
$
|
4.51
|
|
$
|
4.87
|
|
$
|
3.81
|
|
||||
|
Dividends per common share
|
$
|
2.03
|
|
$
|
1.80
|
|
$
|
1.65
|
|
$
|
1.52
|
|
$
|
1.32
|
|
||||
49
|
Year Ended December 31,
|
|||||||||||||||||||
|
2018
|
2017
|
2016
|
2015
|
2014
|
|||||||||||||||
|
(dollars in millions)
|
|||||||||||||||||||
|
Balance Sheet Data (at end of year):
|
(a) (b) (c)
|
(a) (d) (e)
|
(a) (f) (g)
|
(a) (h) (i)
|
(a) (j) (k)
|
||||||||||||||
|
Cash and cash equivalents
|
$
|
135
|
|
$
|
137
|
|
$
|
359
|
|
$
|
133
|
|
$
|
192
|
|
||||
|
Total assets
|
11,003
|
|
10,503
|
|
10,100
|
|
9,962
|
|
9,857
|
|
|||||||||
|
Long-term debt
|
3,429
|
|
3,748
|
|
3,728
|
|
3,492
|
|
3,224
|
|
|||||||||
|
Total debt
|
3,893
|
|
3,784
|
|
3,734
|
|
3,651
|
|
3,742
|
|
|||||||||
|
Redeemable noncontrolling interest
|
77
|
|
80
|
|
77
|
|
70
|
|
—
|
|
|||||||||
|
Other Data:
|
|||||||||||||||||||
|
Net cash provided by operating activities
|
$
|
1,200
|
|
$
|
1,175
|
|
$
|
1,116
|
|
$
|
967
|
|
$
|
944
|
|
||||
|
Net cash used in investing activities
|
(801
|
)
|
(830
|
)
|
(127
|
)
|
(362
|
)
|
(1,025
|
)
|
|||||||||
|
Net cash (used in) provided by financing activities
|
(401
|
)
|
(592
|
)
|
(738
|
)
|
(664
|
)
|
86
|
|
|||||||||
|
Capital expenditures
|
383
|
|
252
|
|
293
|
|
263
|
|
308
|
|
|||||||||
|
Purchases of treasury stock
|
322
|
|
465
|
|
590
|
|
224
|
|
132
|
|
|||||||||
|
Dividends paid
|
266
|
|
247
|
|
223
|
|
212
|
|
187
|
|
|||||||||
|
(a)
|
Net revenues for the years ended December 31, 2017 and 2016 have been restated to reflect the impact of new revenue recognition rules that became effective January 1, 2018 and were adopted on a retrospective basis; Net revenues for the years ended December 31, 2015 and 2014 have not been restated. Cash flow data for the years ended December 31, 2017, 2016, 2015 and 2014 have been restated to reflect the impact of the adoption of two new accounting standards that clarify presentation and classification in the statement of cash flows on a retrospective basis. See Note 2 to the consolidated financial statements for further details on the adoption of new accounting standards. During the third quarter of 2006, we completed the wind down of NID, a test kit manufacturing subsidiary. As a result, the NID operations have been classified as discontinued operations for all periods presented. We will continue to report NID as a discontinued operation until uncertain tax benefits associated with NID are resolved.
|
|
(b)
|
On February 1, 2018, we completed the acquisition of Mobile Medical Examination Services, LLC. ("MedXM"). On June 18, 2018, we completed the acquisition of the outreach laboratory service business of Cape Cod Healthcare, Inc. On September 19, 2018, we completed the acquisition of ReproSource, Inc. ("ReproSource"). On November 6, 2018, we completed the acquisition of the U.S. laboratory service business of Oxford Immunotec, Inc. ("Oxford"). Consolidated operating results for 2018 include the results of operations of MedXM, the outreach laboratory service business of Cape Cod Healthcare, Inc., ReproSource and Oxford subsequent to the closing of the applicable acquisition. For further details regarding our acquisitions, see Note 6 to the consolidated financial statements.
|
|
(c)
|
Operating income included (for 2018):
|
|
•
|
pre-tax charges of $122 million, primarily associated with workforce reductions, systems conversions and integration incurred in connection with further restructuring and integrating our business; and
|
|
•
|
pre-tax charges of $2 million, primarily associated with costs incurred related to certain legal matters and a loss on the sale of a foreign subsidiary partially offset by a gain associated with the decrease in the fair value of the contingent consideration accrual associated with our MedXM acquisition and an insurance claim for hurricane related losses.
|
In addition to the items included in operating income, income from continuing operations included:
|
•
|
excess tax benefits associated with stock-based compensation arrangements of
$18 million
; and
|
|
•
|
income tax benefit of $14 million primarily associated with a change in a tax return accounting method that enabled our Company to accelerate the deduction of certain expenses on its 2017 tax return at the federal corporate statutory tax rate in effect during 2017 partially offset by an income tax expense associated with finalizing the impact of the enactment of the Tax Cuts and Jobs Act ("TCJA").
|
Pursuant to the TCJA, among other changes to U.S. corporate income tax laws, the federal corporate statutory income tax rate was reduced from 35% to 21% effective for 2018.
50
|
(d)
|
On May 1, 2017, we completed the acquisition of the outreach laboratory service business of PeaceHealth Laboratories ("PHL"). On July 14, 2017, we completed the acquisition of Med Fusion, LLC and Clearpoint Diagnostic Laboratories, LLC ("Med Fusion"). On September 28, 2017, we completed the acquisition of the outreach laboratory service businesses of two hospitals of Hartford HealthCare Corporation ("HHC"), The William W. Backus Hospital and The Hospital of Central Connecticut. On December 1, 2017, we completed the acquisition of Cleveland HeartLab, Inc. ("CHL"). On December 7, 2017, we completed the acquisition of certain assets of the clinical and anatomic pathology laboratory business of Shiel Holdings, LLC ("Shiel"). Consolidated operating results for 2017 include the results of operations of PHL, Med Fusion, HHC, CHL and Shiel subsequent to the closing of the applicable acquisition. For further details regarding our acquisitions, see Note 6 to the consolidated financial statements.
|
|
(e)
|
Operating income included (for 2017):
|
|
•
|
pre-tax charges of $105 million, primarily associated with systems conversions, integration and workforce reductions incurred in connection with further restructuring and integrating our business; and
|
|
•
|
pre-tax charges of $12 million, primarily a result of non-cash asset impairment charges and incremental costs incurred as a result of hurricanes and costs incurred related to certain legal matters.
|
In addition to the items included in operating income, income from continuing operations included:
|
•
|
a net pre-tax gain of $2 million, primarily a result of a gain on the sale of an interest in an equity method investment partially offset by non-cash asset impairment charges associated with an investment;
|
|
•
|
$1 million of pre-tax restructuring and integration charges associated with our Q
2
Solutions joint venture;
|
|
•
|
a provisional estimated income tax benefit of $106 million associated with the TCJA, including a deferred income tax benefit of $115 million primarily due to the remeasurement of our net deferred tax liabilities and reserves at the new combined federal and state tax rate, partially offset by $9 million of current tax expense primarily due to the mandatory repatriation toll charge on undistributed foreign earnings and profits;
|
|
•
|
excess tax benefits associated with stock-based compensation arrangements of $37 million; and
|
|
•
|
income tax expense of $3 million primarily a result of recording a valuation allowance against certain net operating loss carryforwards in a geography impacted by hurricanes.
|
Net cash provided by operating activities benefited from a decrease in tax payments associated with the realization of a $62 million deferred tax benefit.
|
(f)
|
On February 29, 2016, we completed the acquisition of the outreach laboratory service business of Clinical Laboratory Partners, LLC ("CLP"), a wholly-owned subsidiary of HHC. Consolidated operating results for 2016 include the results of operations of CLP subsequent to the closing of the acquisition. On May 13, 2016, we completed the sale of our Focus Diagnostics products business ("Focus Sale"). Our Focus Diagnostics products business has not been classified as a discontinued operation. For further details regarding dispositions, see Note 7 to the consolidated financial statements.
|
|
(g)
|
Operating income included (for 2016):
|
|
•
|
a pre-tax gain of $118 million associated with the Focus Sale;
|
|
•
|
pre-tax charges of $78 million, primarily associated with systems conversions and integration incurred in connection with further restructuring and integrating our business; and
|
|
•
|
a net pre-tax gain of $7 million, primarily a result of a non-taxable gain on an escrow recovery associated with an acquisition, partially offset by costs associated with winding down subsidiaries, non-cash asset impairment charges and costs incurred related to certain legal matters.
|
In addition to the items included in operating income, income from continuing operations included:
|
•
|
income tax expense of $84 million associated with the Focus Sale, consisting of $91 million of current income tax expense and a deferred income tax benefit of $7 million;
|
|
•
|
$48 million of pre-tax charges on the retirement of debt associated with the March 2016 cash tender offer and the related income tax benefit of $18 million;
|
|
•
|
non-cash asset impairment charges of $7 million associated with certain investments;
|
|
•
|
$4 million of pre-tax restructuring and integration charges associated with our Q
2
Solutions joint venture; and
|
|
•
|
excess tax benefits associated with stock-based compensation arrangements of $9 million.
|
Net cash provided by operating activities included:
|
•
|
a $17 million cash tax benefit on the retirement of debt associated with the March 2016 cash tender offer;
|
|
•
|
$54 million of proceeds received from the termination of interest rate swap agreements; and
|
|
•
|
$91 million of income taxes paid in connection with the Focus Sale.
|
51
Net cash used in investing activities included proceeds from the sale of businesses of $295 million, principally related to the Focus Sale.
Net cash used in financing activities included $43 million of pre-tax cash charges on the retirement of debt associated with the March 2016 cash tender offer, principally comprised of premiums paid to retire the debt.
|
(h)
|
On August 3, 2015, we completed the acquisition of MemorialCare Health System's laboratory outreach business ("MemorialCare"). On November 16, 2015, we completed the acquisition of the business assets of Superior Mobile Medics, Inc. ("Superior Mobile Medics"). Consolidated operating results for 2015 include the results of operations of MemorialCare and Superior Mobile Medics subsequent to the closing of the applicable acquisition. In July 2015, we contributed our clinical trials testing business to a newly formed global clinical trials central laboratory services joint venture with IQVIA Holdings Inc., Q
2
Solutions ("Clinical Trials Contribution"). Our clinical trials testing business was not classified as a discontinued operation.
|
|
(i)
|
Operating income included (for 2015):
|
|
•
|
pre-tax gain of $334 million associated with the Clinical Trials Contribution;
|
|
•
|
pre-tax charges of $105 million, primarily associated with workforce reductions and professional fees incurred in connection with further restructuring and integrating our business; and
|
|
•
|
net pre-tax charges of $33 million primarily associated with non-cash asset impairment charges and other costs associated with winding down our Celera products business and another subsidiary, costs incurred related to certain legal matters and a pre-tax gain of $13 million associated with a decrease in the fair value of the contingent consideration accrual associated with our Summit Health, Inc. ("Summit Health") acquisition.
|
In addition to the items included in operating income, income from continuing operations included:
|
•
|
$144 million of pre-tax charges on retirement of debt associated with the March 2015 cash tender offer and the April 2015 redemption and the related income tax benefit of $57 million;
|
|
•
|
deferred income tax expense of $145 million associated with the gain on the Clinical Trials Contribution;
|
|
•
|
$58 million deferred income tax benefit associated with winding down a subsidiary; and
|
|
•
|
$5 million of pre-tax restructuring and integration charges associated with our Q
2
Solutions joint venture.
|
Net cash provided by operating activities included:
|
•
|
a $57 million income tax benefit on the retirement of debt associated with the March 2015 cash tender offer and April 2015 redemption;
|
|
•
|
payments associated with an additional payroll cycle in 2015; and
|
|
•
|
an income tax payment in the third quarter of 2015 associated with certain tax contingencies.
|
Net cash used in investing activities included a $33 million investment in Q
2
Solutions.
Net cash used in financing activities included:
|
•
|
$139 million of pre-tax cash charges on retirement of debt associated with the March 2015 cash tender offer and the April 2015 redemption, principally consisting of premiums paid;
|
|
•
|
$51 million of deferred acquisition consideration payments, primarily to UMass Memorial Medical Center ("UMass"), related to the business acquisition in 2013; and
|
|
•
|
$63 million of proceeds from the sale of a noncontrolling interest in a subsidiary to UMass.
|
|
(j)
|
On March 7, 2014, we completed the acquisition of Solstas Lab Partners Group ("Solstas"). On April 18, 2014, we completed the acquisition of Summit Health. On April 16, 2014, we completed the acquisition of the outreach laboratory service operations of Steward Healthcare, LLC ("Steward"). Consolidated operating results for 2014 include the results of operations of Solstas, Summit Health and Steward subsequent to the closing of the applicable acquisition.
|
|
(k)
|
Operating income included (for 2014):
|
|
•
|
pre-tax charges of $121 million, primarily associated with workforce reductions and professional fees incurred in connection with further restructuring and integrating our business;
|
|
•
|
pre-tax charges of $24 million principally associated with costs related to certain legal matters; and
|
|
•
|
pre-tax gain of $9 million associated with a decrease in the fair value of the contingent consideration accrual associated with our Summit Health acquisition.
|
In addition to the items included in operating income, income from continuing operations included discrete income tax benefits of $44 million associated with the favorable resolution of certain tax contingencies.
52
QUEST DIAGNOSTICS INCORPORATED AND SUBSIDIARIES
MANAGEMENT'S DISCUSSION AND ANALYSIS OF FINANCIAL CONDITION AND RESULTS OF OPERATIONS
Our Company
Diagnostic Information Services
Quest Diagnostics empowers people to take action to improve health outcomes. We use our extensive database of clinical lab results to derive diagnostic insights that reveal new avenues to identify and treat disease, inspire healthy behaviors and improve healthcare management. Our diagnostic information services business ("DIS") provides information and insights based on the industry-leading menu of routine, non-routine and advanced clinical testing and anatomic pathology testing, and other diagnostic information services. We provide services to a broad range of customers, including patients, clinicians, hospitals, independent delivery networks ("IDNs"), health plans, employers and accountable care organizations ("ACOs"). We offer the broadest access in the United States to diagnostic information services through our nationwide network of laboratories, patient service centers and phlebotomists in physician offices and our connectivity resources, including call centers and mobile paramedics, nurses and other health and wellness professionals. We are the world's leading provider of diagnostic information services. We provide interpretive consultation with one of the largest medical and scientific staffs in the industry. Our DIS business makes up approximately 95% of our consolidated net revenues. During
2018
, we processed approximately
168 million
test requisitions through our extensive laboratory network.
The clinical testing that we perform is an essential element in the delivery of healthcare services. Clinicians use clinical testing for predisposition, screening, monitoring, diagnosis, prognosis and treatment choices of diseases and other medical conditions. The United States clinical testing industry consists of two segments. One segment, which we believe makes up approximately 36% of the total industry, includes hospital inpatient and outpatient testing. The second segment, which we believe makes up approximately 64% of the total industry, includes testing of persons who are not hospital patients, including testing done in commercial clinical laboratories, physician-office laboratories and other locations, as well as hospital outreach (non-hospital patients) testing. We believe that hospital-affiliated laboratories account for approximately 36% of the second segment, commercial clinical laboratories approximately 54% and physician-office laboratories and other locations account for the balance.
The clinical testing industry is subject to seasonal fluctuations in operating results and cash flows. Typically, testing volume declines during vacation and major holiday periods, reducing net revenues and operating cash flows below annual averages. Testing volume is also subject to declines due to severe weather or other events, which can deter patients from having testing performed and which can vary in duration and severity from year to year. Additionally, orders for clinical testing generated from clinician offices, hospitals and employers can be affected by factors such as changes in the United States economy and regulatory environment, which affect the number of unemployed and uninsured, and design changes in healthcare plans, which affect the number of clinician office and hospital visits.
Diagnostic Solutions
In our Diagnostic Solutions ("DS") businesses, which represents the balance of our consolidated net revenues, we offer a variety of solutions for life insurers and healthcare organizations and clinicians. We are the leading provider of risk assessment services for the life insurance industry. In addition, we offer healthcare organizations and clinicians robust information technology solutions. Prior to the sale of our Focus Diagnostics products business on May 13, 2016 ("Focus Sale") our diagnostics products business manufactured and marketed diagnostic products.
For further details regarding the Focus Sale, see Note 7 to the audited consolidated financial statements.
53
2018
Highlights
|
•
|
Our total net revenues of
$7.5 billion
were
1.7%
above the prior year.
|
|
•
|
In DIS:
|
|
◦
|
Revenues of
$7.2 billion
increased by
1.9%
compared to the prior year, which reflects the impact of recent acquisitions, partially offset by a decrease in organic revenue (revenue growth excluding the impact of acquisitions).
|
|
◦
|
Volume, measured by the number of requisitions, increased 2.5% compared to the prior year.
|
|
◦
|
Revenue per requisition decreased by 1.2% compared to the prior year primarily due to pricing pressure including the impact of the Protecting Access to Medicare Act ("PAMA"), increased denials and higher patient concessions.
|
|
•
|
DS revenues of
$327 million
were
2.3%
below the prior year primarily due to certain royalty revenues received in 2017 related to a royalty agreement, retained from the sale of our products business, that has since expired.
|
|
•
|
Net income attributable to Quest Diagnostics' stockholders was
$736 million
, or
$5.29
per diluted share, in
2018
, compared to
$772 million
, or
$5.50
per diluted share, in 2017.
|
|
•
|
Net cash provided by operating activities was
$1.2 billion
in both
2018
and 2017.
|
We adopted the new accounting standard for revenue recognition effective January 1, 2018 using the full retrospective method which required the restatement of certain previously reported financial results, as well as our days sales outstanding calculation. For further details on the impact of the new accounting standard, refer to Note 2 to the audited consolidated financial statements.
Two Point Strategy
Our two point strategy is described in detail in "
Item 1. Business: Our Strategy
." We continued to execute our strategy during
2018
as follows:
Long-term Strategic Partnership with UnitedHealthcare
On May 24, 2018, we established a long-term strategic partnership with UnitedHealthcare focused on ways to create more personalized care recommendations and a simpler consumer experience for the people enrolled in UnitedHealthcare plans. Effective January 1, 2019, we became a contracted, participating provider of clinical laboratory testing services, on a nationwide basis, for all UnitedHealthcare plans, excluding existing lab capitation arrangements. Prior to January 1, 2019 we were in network for a limited number of UnitedHealthcare plans.
Preferred Provider for Horizon Blue Cross Blue Shield of New Jersey
On November 8, 2018, Horizon Blue Cross Blue Shield of New Jersey announced that it is expanding its laboratory network by adding Quest Diagnostics as an in-network preferred provider of diagnostic information services for its members (with the exception of its managed Medicaid and Dual Eligible Special Needs plan beneficiaries), effective January 1, 2019.
Acquisition of Mobile Medical Examination Services, LLC.
On February 1, 2018, we completed the acquisition of Mobile Medical Examination Services, LLC. ("MedXM"), in an all cash transaction for
$142 million
, net of
$5 million
cash acquired, which consisted of cash consideration of
$130 million
and contingent consideration initially estimated at
$12 million
. The contingent consideration arrangement is dependent upon the achievement of certain revenue targets. MedXM is a leading national provider of home-based health risk assessments and related services. The acquired business is included in our DIS business.
Acquisition of the Outreach Laboratory Service Business of Cape Cod Healthcare, Inc.
On June 18, 2018, we completed the acquisition of the outreach laboratory service business of Cape Cod Healthcare, Inc. in an all cash transaction for
$35 million
. The acquired business is included in our DIS business.
Acquisition of ReproSource, Inc.
On September 19, 2018, we completed the acquisition of ReproSource, Inc. ("ReproSource"), in an all cash transaction for
$35 million
, which consisted of cash consideration of
$30 million
and contingent consideration estimated at
$5
54
million
. The contingent consideration arrangement is dependent on the achievement of certain revenue targets. ReproSource is a national leader in specialty fertility diagnostic services. The acquired business is included in our DIS business.
Acquisition of the U.S. Laboratory Service Business of Oxford Immunotec, Inc.
On November 6, 2018, we completed the acquisition of the U.S. laboratory service business of Oxford Immunotec, Inc. ("Oxford"), in an all cash transaction for $170 million, net of $1 million cash acquired. The acquisition included laboratories in Tennessee and Massachusetts that provide tuberculosis and tick-borne disease testing services. As part of the transaction, Oxford will sell test kits and related accessories to us under a long-term supply agreement. The acquired business is included in our DIS business.
For details regarding our acquisitions, see Note 6 to the audited consolidated financial statements.
Invigorate Program
We are engaged in a multi-year program called Invigorate, which is designed to reduce our cost structure and improve our performance. We delivered more than $700 million in run-rate savings (compared to 2011) as we exited 2014, and delivered more than $1.3 billion in run-rate savings (compared to 2011) as we exited 2017. We currently aim annually to save approximately 3% of our costs, and in 2018 we achieved that goal.
Invigorate has consisted of several flagship programs, with structured plans in each, to drive savings and improve performance across the customer value chain. These flagship programs include: organization excellence; information technology excellence; procurement excellence; field and customer service excellence; lab excellence; and revenue services excellence. In addition to these programs, we identified key themes to change how we operate including reducing denials and patient concessions; further digitizing our business; standardization and automation; and optimization initiatives in our lab network and patient service center network. We believe that our efforts to standardize our information technology systems, equipment and data also foster our efforts to strengthen our foundation for growth and support the value creation initiatives of our clinical franchises by enhancing our operational flexibility, empowering and enhancing the customer experience, facilitating the delivery of actionable insights and bolstering our large data platform.
For the year ended
December 31, 2018
, we incurred $109 million of pre-tax charges under our Invigorate program including $48 million of employee separation costs and other restructuring related costs with the remainder primarily consisting of systems conversion and integration costs, all of which result in cash expenditures. Additional restructuring charges may be incurred in future periods as we identify additional opportunities to achieve further cost savings.
For further details of the Invigorate program and associated costs, see Note 5 to the audited consolidated financial statements.
Outlook and Trends
The healthcare system in the United States is evolving; significant change is taking place in the system. We expect that the evolution of the healthcare industry will continue, and that industry change is likely to be extensive. There are a number of key trends that are having, and that we expect will continue to have, a significant impact on the diagnostic information services business in the United States and on our business. These trends, discussed in
"Item 1, Business: The United States Clinical Testing Industry"
, present both opportunities and risks. We believe that several of the trends, including consolidation, price transparency and increased consumer involvement, are favorable to our business.
Healthcare market participants, including governments, are focusing on controlling costs, including potentially by changing reimbursement for healthcare services (including but not limited to a shift from fee-for-service to capitation), changing medical coverage policies (
e.g
., healthcare benefits design), denying coverage for services, preauthorization of laboratory testing, requiring co-pays, introducing laboratory spend management utilities and payment and patient care innovations such as ACOs and patient-centered medical homes. The ongoing trend of rising patient responsibility and increasing payer denials has resulted in an increase in patient revenues as a percentage of total revenue, which has resulted in an increase in our reserves for patient price concessions. As health plans and government programs require greater levels of patient cost-sharing, our patient price concessions may continue to be negatively impacted and adversely impact our results of operations. As previously mentioned, there could be a shift to capitation arrangements where we agree to a predetermined monthly reimbursement rate for each member enrolled in a restricted plan, generally regardless of the number or cost of services provided by us. In both
2018
and
2017
, we derived approximately 3% of our consolidated net revenues and 11% of our testing volume, respectively, from capitated payment arrangements.
55
Historically, the Medicare Clinical Laboratory Fee Schedule ("CLFS") and the Medicare Physician Fee Schedule established under Part B of the Medicare program have been subject to change, including each year. On November 17, 2017, the Centers for Medicare and Medicaid Services ("CMS") finalized the 2018 Medicare reimbursement rates for clinical laboratory tests under the CLFS pursuant to PAMA. Under the revised Medicare Clinical Laboratory Fee Schedule (in 2018 CLFS revenues comprised 12% of our consolidated net revenues), reimbursement for clinical laboratory testing was reduced in 2018 and is scheduled to be reduced again by approximately 10% in each of 2019 and 2020. PAMA calls for further revision of the CLFS for years after 2020, based on future surveys of market rates; reimbursement rate reduction from 2021-23 is capped by PAMA at 15% annually. We expect reimbursement rate pressure for 2019, including as a result of PAMA, to exceed 2.5%.
In addition, the trend of consolidating, converging and diversifying among our customers and payers has continued. Consolidation is increasing price transparency and bargaining power, and encouraging internalization of clinical testing. We also believe that PAMA may be a further catalyst for consolidation as diagnostic information services providers realize lower Medicare reimbursement rates and large diagnostic information services providers may be able to increase their share of the overall diagnostic information services industry due to their large networks and lower cost structures.
For additional information on our key trends, see "
Item 1. Business: The United States Clinical Testing Industry
."
Critical Accounting Policies
The preparation of financial statements in conformity with accounting principles generally accepted in the United States requires us to make estimates and assumptions and select accounting policies that affect our reported financial results and the disclosure of contingent assets and liabilities.
Our revenues are primarily comprised of a high volume of relatively low-dollar transactions, and about one-half of our total costs and expenses consist of employee compensation and benefits. Due to the nature of our business, several of our accounting policies involve significant estimates and judgments:
|
•
|
revenues and accounts receivable associated with DIS;
|
|
•
|
reserves for general and professional liability claims;
|
|
•
|
reserves for other legal proceedings;
|
|
•
|
accounting for and recoverability of goodwill; and
|
|
•
|
accounting for stock-based compensation expense.
|
Revenues and accounts receivable associated with DIS
The process for estimating revenues and the ultimate collection of receivables associated with our DIS business involves significant assumptions and judgments. We recognize as revenue the amount of consideration to which we expect to be entitled upon completion of the testing process, when results are reported, or when services have been rendered. We estimate the amount of consideration we expect to be entitled to receive from customer groups, determined using the portfolio approach, in exchange for providing services. These estimates include the impact of contractual allowances, including payer denials, and price concessions, as discussed below. The portfolios determined using the portfolio approach consist of the following customers:
|
•
|
Healthcare Insurers
|
|
•
|
Government Payers
|
|
•
|
Client Payers
|
|
•
|
Patients
|
We have a standardized approach to estimate the amount of consideration that we expect to be entitled to, including the impact of contractual allowances, including payer denials, and price concessions. Historical collection and payer reimbursement experience is an integral part of the estimation process related to revenues and receivables. Adjustments to our estimated contractual allowances and implicit price concessions are recorded in the current period as changes in estimates. Further adjustments to the allowances, based on actual receipts, may be recorded upon settlement. Based on our standard process, during the fourth quarter of 2018, we increased our reserves for revenues and accounts receivable by approximately $35 million due to an increase in denials and a shift toward higher patient responsibility throughout the year.
56
We regularly assess the state of our billing operations in order to identify issues which may impact the collectibility of receivables or revenue estimates. We believe that the collectibility of our receivables is directly linked to the quality of our billing processes, most notably those related to obtaining the correct information in order to bill effectively for the services we provide. As such, we continue to implement “best practices” and endeavor to increase the use of electronic ordering to reduce the number of requisitions that we receive from healthcare providers with missing or incorrect billing information. We believe that our collection and revenue estimation processes, along with our close monitoring of our billing operations, help to reduce the risk associated with material adjustments to reserve estimates. However, changes to our estimate of the impact of contractual allowances, including payer denials, and price concessions could have a material impact on our results of operations and financial condition in the period that the estimates are adjusted.
The following table shows the approximate percentage of our total requisition volume and net revenues associated with our DIS business during
2018
applicable to each customer group:
|
% of
|
% of
|
||
|
Total
|
Consolidated
|
||
|
Volume
|
Net Revenues
|
||
|
Healthcare Insurers
|
46
|
35
|
|
|
Government Payers
|
13
|
16
|
|
|
Client Payers
|
37
|
32
|
|
|
Patients *
|
1
|
13
|
|
|
Total DIS
|
97
|
96
|
|
*Patient revenue includes co-pays and deductibles but volume associated with such revenue is reported under Healthcare Insurers.
The following table shows net accounts receivable as of
December 31, 2018
applicable to each payer group:
|
% of
|
|
|
Consolidated
|
|
|
Net Accounts
|
|
|
Receivable
|
|
|
Healthcare Insurers
|
22
|
|
Government Payers
|
13
|
|
Client Payers
|
41
|
|
Patients (including coinsurance and deductible responsibilities)
|
20
|
|
Total DIS
|
96
|
Healthcare insurers
Reimbursements from healthcare insurers are based on fee-for-service schedules and on capitated payment rates. Under fee-for-service arrangements, healthcare insurers are billed at our Company's list price. Net revenues recognized consist of amounts billed net of contractual allowances for differences between amounts billed and the estimated consideration we expect to receive from such payers, which considers historical denial and collection experience and the terms of our contractual arrangements.
Substantially all of the accounts receivable due from healthcare insurers represent amounts billed under fee-for-service arrangements. Collection of our Company's net revenues from healthcare insurers is normally a function of providing complete and correct billing information to the healthcare insurers within the various filing deadlines and generally occurs within 30 to 60 days of billing. Provided we have billed healthcare insurers accurately with complete information prior to the established filing deadline, there has historically been little to no credit risk. If there has been a delay in billing, we determine if the amounts in question will likely go past the filing deadline, and if so, we will reserve accordingly for the billing.
Under capitated arrangements with healthcare insurers, we recognize revenue based on a predetermined monthly reimbursement rate for each member of an insurer's health plan regardless of the number or cost of services provided by us. Approximately 3% of our consolidated net revenues for the year ended
December 31, 2018
are reimbursed under capitated payment arrangements, in which case the healthcare insurers typically reimburse us in the same month services are performed,
57
essentially giving rise to no outstanding accounts receivable at the end of a reporting period. If any capitated payments are not received on a timely basis, we determine the cause and make a separate determination as to whether or not the collection of the amount from the healthcare insurer is at risk and, if so, would reserve accordingly.
Government payers
Reimbursements from government payers are based on fee-for-service schedules set by governmental authorities, including traditional Medicare and Medicaid. Net revenues recognized consist of amounts billed net of contractual allowances for differences between amounts billed and the estimated consideration our Company expects to receive from such payers, which considers historical denial and collection experience.
Collection of our Company's net revenues from government payers is normally a function of providing the complete and correct billing information within the various filing deadlines. Collection generally occurs within 30 days of billing. Provided we have billed government payers accurately with complete information prior to the established filing deadline, there has historically been little to no credit risk. If there has been a delay in billing, we determine if the amounts in question will likely go past the filing deadline, and, if so, we will reserve for the billing accordingly.
Client payers
Client payers include physicians, hospitals, ACOs, IDNs, employers, other commercial laboratories and institutions for which services are performed on a wholesale basis, and are billed based on a negotiated fee schedule. Credit risk and ability to pay are more of a consideration for these payers than healthcare insurers and government payers. Collection of consideration we expect to receive generally occurs within 60 to 90 days of billing. In addition to our standard approach to establishing allowances for doubtful accounts which considers a number of factors including the period they have been outstanding, our approach to client payer receivables also focuses on specific account reviews, historical collection experience and other factors.
Patients
Uninsured patients are billed based on established patient fee schedules or fees negotiated with physicians on behalf of their patients. Insured patients (includes coinsurance and deductible responsibilities) are billed based on fees negotiated with healthcare insurers. Collection of billings from patients is subject to credit risk and ability of the patients to pay. Net revenues consist of amounts billed net of discounts provided to uninsured patients in accordance with our policies and implicit price concessions. Implicit price concessions represent differences between amounts billed and the estimated consideration we expect to receive from patients, which considers historical collection experience and other factors including current market conditions. Patient billings are generally fully reserved for when the related billing reaches 210 days outstanding. Balances are automatically written off when they are sent to collection agencies. Allowances are further adjusted for estimated recoveries of amounts sent to collection agencies based on historical collection experience, which is regularly monitored. Collection of consideration we expect to receive generally occurs within 30 to 60 days of billing.
Reserves for general and professional liability claims
As a general matter, providers of diagnostic information services may be subject to lawsuits alleging negligence or other similar claims. These suits could involve claims for substantial damages. Any professional liability litigation could also have an adverse impact on our client base and reputation. We maintain various liability insurance coverages for claims that could result from providing, or failing to provide, diagnostic information services, including inaccurate testing results, and other exposures. Our insurance coverage limits our maximum exposure on individual claims; however, we are essentially self-insured for a significant portion of these claims. While the basis for claims reserves is actuarially determined losses based upon our historical and projected loss experience, the process of analyzing, assessing and establishing reserve estimates relative to these types of claims involves a high degree of judgment. Although we believe that our present reserves and insurance coverage are sufficient to cover currently estimated exposures, it is possible that we may incur liabilities in excess of our recorded reserves or insurance coverage. Changes in the facts and circumstances associated with claims could have a material impact on our results of operations (principally costs of services), cash flows and financial condition in the period that reserve estimates are adjusted or paid. See Note 18 to the audited consolidated financial statements for a discussion of our reserves for general and professional liability claims.
58
Reserves for other legal proceedings
Our businesses are subject to or impacted by extensive and frequently changing laws and regulations, including inspections and audits by governmental agencies, in the United States (at both the federal and state levels) and the other jurisdictions in which we conduct business. Although we believe that we are in compliance, in all material respects, with applicable laws and regulations, there can be no assurance that a regulatory agency would not reach a different conclusion. Any noncompliance by us with applicable laws and regulations could have a material adverse effect on our results of operations. In addition, these laws and regulations may be interpreted or applied by a prosecutorial, regulatory or judicial authority in a manner that could require us to make changes in our operations, including our pricing and/or billing practices. We have, in the past, entered into several settlement agreements with various government and private payers relating to industry-wide billing and marketing practices that had been substantially discontinued. The federal or state governments may bring claims based on our current practices, which we believe are lawful. In addition, certain federal and state statutes, including the
qui tam
provisions of federal and state false claims acts, allow private individuals to bring lawsuits against healthcare companies on behalf of government or private payers alleging inappropriate billing practices. We are aware of certain pending lawsuits including class action lawsuits, and have received subpoenas related to billing practices. See Note 18 to the audited consolidated financial statements for a discussion of the various legal proceedings that involve our Company.
The process of analyzing, assessing and establishing reserve estimates relative to legal proceedings involves a high degree of judgment. Management has established reserves for legal proceedings in accordance with generally accepted accounting principles. Changes in facts and circumstances related to such proceedings could lead to significant adjustments to reserve estimates for such matters and could have a material impact on our results of operations, cash flows and financial condition in the period that reserve estimates are adjusted or paid.
Accounting for and recoverability of goodwill
We do not amortize goodwill, but evaluate the recoverability and measure the potential impairment of our goodwill annually, or more frequently, in the case of other events that indicate a potential impairment. We have identified the following reporting units for goodwill impairment testing in 2018:
|
•
|
DIS business;
|
|
•
|
Risk assessment services business which is part of our DS businesses
|
The DIS reporting unit components have been aggregated into a single reporting unit because they have similar economic characteristics, including similarities in financial performance, nature of products or services, nature of production processes and types of customers.
Goodwill is evaluated for impairment annually, or more frequently if events or changes in circumstances indicate that the asset might be impaired. The annual impairment test includes an option to perform a qualitative assessment of whether it is more likely than not that a reporting unit's fair value is less than its carrying value; the qualitative analysis may be performed prior to, or as an alternative to, performing a quantitative goodwill impairment test. In evaluating whether it is more likely than not that the fair value of a reporting unit is less than its carrying value, we assess relevant events and circumstances, such as: (a) macroeconomic conditions; (b) industry and market considerations; (c) cost factors; (d) overall financial performance; (e) other relevant entity-specific events; (f) events affecting a reporting unit; and (g) a sustained decrease in share price. If, after assessing the totality of events or circumstances, we determine that it is more likely than not that the fair value of a reporting unit is less than its carrying value, then we are required to perform the quantitative goodwill impairment test. Otherwise, no further analysis is required. Additionally, our policy is to update the fair value calculation of our reporting units and perform the quantitative goodwill impairment test on a periodic basis.
The quantitative impairment test involves the comparison of the fair value of the reporting unit to its carrying value. If the carrying value is greater than our estimate of fair value, an impairment loss will be recognized in the amount of the excess. We calculate the fair value of each reporting unit using either a discounted cash flows analysis that converts future cash flow amounts into a single discounted present value amount or a market approach. We assess the valuation methodology based upon the relevance and availability of the data at the time we perform the valuation. The discounted cash flows analysis includes several unobservable inputs related to our own assumptions. The assumptions and estimates used in the discounted cash flows model are based upon the best available information in the circumstances and include a forecast of expected future cash flows, long-term growth rates, discount rates that are commensurate with economic risks, assumed income tax rates and estimates of capital expenditures and working capital. The fair values of the reporting units could be different if, for example, forecasted revenue growth rates, economic conditions, government regulations or actions by payers to control utilization of or reimbursement for healthcare services, turn out to be different than our assumptions or estimates. Changes in the assumed
59
discount rates due to changes in interest rates could also affect the estimated fair values of the reporting units. We use a discount rate that considers a weighted average cost of capital plus an appropriate risk premium based upon the reporting unit being valued. Our analysis also considers publicly available information regarding the market capitalization of our Company, as well as (i) the financial projections and future prospects of our business, including its growth opportunities and likely operational improvements, and (ii) comparable sales prices, if available. We believe our estimation methods are reasonable and reflect common valuation practices.
On a quarterly basis, we perform a review of our business to determine if events or changes in circumstances have occurred which could have a material adverse effect on the fair value of our Company and its goodwill. If such events or changes in circumstances were deemed to have occurred, we would perform an impairment test of goodwill and record any noted impairment loss.
We perform our annual impairment test during the fourth quarter of the fiscal year. For the year ended
December 31, 2018
, we performed the qualitative assessment for our DIS and risk assessment services reporting units. Based on the totality of the information available for each reporting unit, we concluded that it was more likely than not that the estimated fair values were greater than the carrying values of the reporting units, and as such, no further analysis was required.
Accounting for stock-based compensation expense
We measure stock-based compensation for equity awards at fair value on the date of grant and record stock-based compensation as a charge to earnings, net of the estimated impact of forfeited awards. As such, we recognize stock-based compensation cost only for those stock-based awards that are estimated to ultimately vest over their requisite service period, based on the vesting provisions of the individual grants. The process of estimating the fair value of stock-based compensation awards and recognizing stock-based compensation cost over their requisite service periods involves significant assumptions and judgments.
The fair value of each stock option award granted was estimated on the date of grant using a Black-Scholes option-valuation model. Estimating the fair value of stock option awards on the date of grant using the Black-Scholes option-valuation model requires management to make certain assumptions regarding: (i) the expected volatility in the market price of our common stock; (ii) dividend yield; (iii) risk-free interest rates; and (iv) the period of time employees are expected to hold the award prior to exercise (referred to as the expected holding period). Under the Black-Scholes option-valuation model, the expected volatility is based on historical volatilities of our common stock. The dividend yield is based on the approved annual dividend rate in effect and current market price of the underlying common stock at the time of grant. The risk-free interest rate is based on the U.S. Treasury yield curve in effect at the time of grant for bonds with maturities consistent with the expected holding period of the related award. The expected holding period of the awards granted is estimated using the historical stock option exercise behavior of employees.
We estimate the expected impact of forfeited awards and recognize stock-based compensation cost only for those awards expected to vest. We use historical experience to estimate projected forfeitures. If actual forfeiture rates are materially different from our estimates, stock-based compensation expense could be significantly different from what we have recorded in the current period. We periodically review actual forfeiture experience and adjust our estimates as necessary. The cumulative effect on current and prior periods of a change in the estimated forfeiture rate is recognized as compensation cost in earnings in the period of the change.
The terms of our performance share unit awards allow the recipients to earn a variable number of shares based on the achievement of the performance goals specified in the awards. Stock-based compensation expense associated with performance share units is recognized based on management's best estimates of the achievement of the performance goals specified in such awards and the resulting number of shares that will be earned. If the actual number of performance share units earned is different from our estimates, stock-based compensation could be significantly different from what we have recorded in the current period. The cumulative effect on current and prior periods of a change in the estimated number of performance share units expected to be earned is recognized as compensation cost in earnings in the period of the change. While the assumptions used to calculate and account for stock-based compensation awards represent management's best estimates, these estimates involve inherent uncertainties and the application of management's judgment. As a result, if changes are made to our assumptions and estimates, our stock-based compensation expense could vary significantly from period to period. In addition, the number of awards made under our equity compensation plans, changes in the design of those plans, the price of our shares and the performance of our Company can all cause stock-based compensation expense to vary from period to period.
60
Results of Operations
Basis of Presentation
Our DIS business currently represents our one reportable business segment. The DIS business for each of the three years ended
December 31, 2018
accounted for approximately 95% of our consolidated net revenues. Our other operating segments consist of our DS businesses. For further details regarding our business segment information, see Note 19 to the audited consolidated financial statements.
Results of Operations
The following table sets forth certain results of operations data for the periods presented:
|
$ Increase (Decrease)
|
% Increase (Decrease)
|
||||||||||||||||||||||||
|
2018
|
2017
|
2016
|
2018 vs. 2017
|
2017 vs. 2016
|
2018 vs. 2017
|
2017 vs. 2016
|
|||||||||||||||||||
|
(dollars in millions, except per share data)
|
|||||||||||||||||||||||||
|
Net revenues:
|
|||||||||||||||||||||||||
|
DIS business
|
$
|
7,204
|
|
$
|
7,068
|
|
$
|
6,837
|
|
$
|
136
|
|
$
|
231
|
|
1.9
|
%
|
3.4
|
%
|
||||||
|
DS businesses
|
327
|
|
334
|
|
377
|
|
(7
|
)
|
(43
|
)
|
(2.3
|
)
|
(11.3
|
)
|
|||||||||||
|
Total net revenues
|
$
|
7,531
|
|
$
|
7,402
|
|
$
|
7,214
|
|
$
|
129
|
|
$
|
188
|
|
1.7
|
%
|
2.6
|
%
|
||||||
|
Operating costs and expenses and other operating income:
|
|||||||||||||||||||||||||
|
Cost of services
|
$
|
4,926
|
|
$
|
4,719
|
|
$
|
4,616
|
|
$
|
207
|
|
$
|
103
|
|
4.4
|
%
|
2.2
|
%
|
||||||
|
Selling, general and administrative
|
1,424
|
|
1,443
|
|
1,380
|
|
(19
|
)
|
63
|
|
(1.3
|
)
|
4.6
|
|
|||||||||||
|
Amortization of intangible assets
|
90
|
|
74
|
|
72
|
|
16
|
|
2
|
|
21.2
|
|
2.5
|
|
|||||||||||
|
Loss (gain) on disposition of business
|
4
|
|
—
|
|
(118
|
)
|
4
|
|
118
|
|
NM
|
|
NM
|
|
|||||||||||
|
Other operating (income) expense, net
|
(14
|
)
|
1
|
|
(13
|
)
|
(15
|
)
|
14
|
|
NM
|
|
NM
|
|
|||||||||||
|
Total operating costs and expenses, net
|
$
|
6,430
|
|
$
|
6,237
|
|
$
|
5,937
|
|
$
|
193
|
|
$
|
300
|
|
3.1
|
%
|
5.1
|
%
|
||||||
|
Operating income
|
$
|
1,101
|
|
$
|
1,165
|
|
$
|
1,277
|
|
$
|
(64
|
)
|
$
|
(112
|
)
|
(5.5
|
)%
|
(8.8
|
)%
|
||||||
61
|
Other (expense) income:
|
|||||||||||||||||||||||||
|
Interest expense, net
|
$
|
(167
|
)
|
$
|
(151
|
)
|
$
|
(143
|
)
|
$
|
(16
|
)
|
$
|
(8
|
)
|
10.8
|
%
|
5.3
|
%
|
||||||
|
Other (expense) income, net
|
(8
|
)
|
16
|
|
(48
|
)
|
(24
|
)
|
64
|
|
NM
|
|
NM
|
|
|||||||||||
|
Total non-operating expenses, net
|
$
|
(175
|
)
|
$
|
(135
|
)
|
$
|
(191
|
)
|
$
|
(40
|
)
|
$
|
56
|
|
28.9
|
%
|
(29.1
|
)%
|
||||||
|
Income tax expense
|
$
|
(182
|
)
|
$
|
(241
|
)
|
$
|
(429
|
)
|
$
|
59
|
|
$
|
188
|
|
(24.2
|
)%
|
(43.9
|
)%
|
||||||
|
Effective income tax rate
|
19.7
|
%
|
23.4
|
%
|
39.5
|
%
|
-370 bps
|
|
-1610 bps
|
|
NM
|
|
NM
|
|
|||||||||||
|
Equity in earnings of equity method investees, net of taxes
|
$
|
44
|
|
$
|
35
|
|
$
|
39
|
|
$
|
9
|
|
$
|
(4
|
)
|
24.4
|
%
|
(9.6
|
)%
|
||||||
|
Net income attributable to Quest Diagnostics' stockholders
|
$
|
736
|
|
$
|
772
|
|
$
|
645
|
|
$
|
(36
|
)
|
$
|
127
|
|
(4.7
|
)%
|
19.8
|
%
|
||||||
|
Diluted earnings per common share attributable to Quest Diagnostics’ common stockholders
|
$
|
5.29
|
|
$
|
5.50
|
|
$
|
4.51
|
|
$
|
(0.21
|
)
|
$
|
0.99
|
|
(3.8
|
)%
|
22.0
|
%
|
||||||
NM - Not Meaningful
bps - Basis Points
The following table sets forth certain results of operations data as a percentage of net revenues for the periods presented:
|
2018
|
2017
|
2016
|
||||||
|
Net revenues:
|
||||||||
|
DIS business
|
95.7
|
%
|
95.5
|
%
|
94.8
|
%
|
||
|
DS businesses
|
4.3
|
|
4.5
|
|
5.2
|
|
||
|
Total net revenues
|
100.0
|
%
|
100.0
|
%
|
100.0
|
%
|
||
|
Operating costs and expenses and other operating income:
|
|
|
|
|
|
|
||
|
Cost of services
|
65.4
|
%
|
63.8
|
%
|
64.0
|
%
|
||
|
Selling, general and administrative
|
18.9
|
|
19.5
|
|
19.1
|
|
||
|
Amortization of intangible assets
|
1.2
|
|
1.0
|
|
1.0
|
|
||
|
Loss (gain) on disposition of business
|
0.1
|
|
—
|
|
(1.5
|
)
|
||
|
Other operating (income) expense, net
|
(0.2
|
)
|
—
|
|
(0.3
|
)
|
||
|
Total operating costs and expenses, net
|
85.4
|
%
|
84.3
|
%
|
82.3
|
%
|
||
|
Operating income
|
14.6
|
%
|
15.7
|
%
|
17.7
|
%
|
||
62
Operating Results
Results for the year ended December 31, 2018 were affected by certain items that on a net basis reduced earnings per diluted share by $0.45 as follows:
|
•
|
pre-tax charges of $122 million ($56 million in cost of services, $65 million in selling, general and administrative expenses, and $1 million in
other operating (income) expense, net
), or $0.66 per diluted share, primarily associated with workforce reductions, systems conversions and integration incurred in connection with further restructuring and integrating our business;
|
|
•
|
excess tax benefits associated with stock-based compensation arrangements of
$18 million
, or
$0.13
per diluted share, recorded in income tax expense;
|
|
•
|
an income tax benefit of $14 million, or $0.09 per diluted share, associated with a change in a tax return accounting method that enabled our Company to accelerate the deduction of certain expenses on its 2017 tax return at the federal corporate statutory tax rate in effect during 2017 partially offset by an income tax expense associated with finalizing the impact of the enactment of the Tax Cuts and Jobs Act ("TCJA");
|
|
•
|
net pre-tax charges of $2 million ($12 million in cost of services and $4 million in loss (gain) on disposition of business partially offset by $14 million gain in
other operating (income) expense, net
), or $0.01 per diluted share, primarily attributable to costs incurred related to certain legal matters and a loss on the sale of a foreign subsidiary which were partially offset by a gain associated with the decrease in the fair value of the contingent consideration accrual associated with our MedXM acquisition and an insurance claim for hurricane related losses.
|
Results for the year ended December 31, 2017 were affected by certain items that on a net basis benefited earnings per diluted share by $0.50 as follows:
|
•
|
excess tax benefits associated with stock-based compensation arrangements of
$37 million
, or
$0.27
per diluted share, recorded in income tax expense;
|
|
•
|
a provisional estimated income tax benefit of $106 million, or $0.77 per diluted share, associated with the TCJA, including a deferred income tax benefit of $115 million primarily due to the remeasurement of our net deferred tax liabilities and reserves at the new combined federal and state tax rate, partially offset by $9 million of current tax expense primarily due to the mandatory repatriation toll charge on undistributed foreign earnings and profits;
|
|
•
|
pre-tax charges of $106 million ($45 million in cost of services, $60 million in selling, general and administrative expenses and $1 million in equity in earnings of equity method investees, net of taxes), or $0.47 per diluted share, primarily associated with systems conversions, integration and workforce reductions incurred in connection with further restructuring and integrating our business; and
|
|
•
|
net pre-tax charges of $10 million ($5 million in cost of services, $7 million in selling, general and administrative expenses and $2 million benefit in
other (expense) income, net
), or $0.07 per diluted share primarily associated with non-cash asset impairment charges associated with an investment, non-cash asset impairment charges and incremental costs incurred as a result of hurricanes, and costs incurred related to certain legal matters, partially offset by gain on the sale of an interest in an equity method investment.
|
Results for the year ended December 31, 2016 were affected by certain items that on a net basis reduced earnings per diluted share by $0.20 as follows:
|
•
|
excess tax benefits associated with stock-based compensation arrangements of $9 million, or $0.06 per diluted share, recorded in income tax expense;
|
|
•
|
pre-tax gain of $118 million, or $0.24 per diluted share, related to the Focus Sale recorded in loss (gain) on disposition of business;
|
|
•
|
pre-tax charges of $82 million ($40 million in cost of services, $37 million in selling, general and administrative expenses, $1 million in
other operating (income) expense, net
and $4 million in equity in earnings of equity method investees, net of taxes), or $0.35 per diluted share, primarily associated with systems conversions and integration costs incurred in connection with further restructuring and integrating our business;
|
|
•
|
pre-tax charges of $48 million, or $0.21 per diluted share, related to the 2016 loss on retirement of debt associated with the March 2016 cash tender offer ("2016 Tender Offer"), in which we purchased $73 million of our Senior Notes due 2037 and $127 million of our Senior Notes due 2040, recorded in other (expense) income, net; and
|
63
|
•
|
pre-tax costs of $6 million in selling, general and administrative expenses, a net pre-tax gain of $13 million in
other operating (income) expense, net
and pre-tax costs of $7 million in
other (expense) income, net
that on a combined basis benefited diluted earnings per share by $0.06, primarily a result of a non-taxable gain on an escrow recovery associated with an acquisition, partially offset by costs associated with winding down subsidiaries, non-cash asset impairment charges and costs incurred related to certain legal matters.
|
Net Revenues
Net revenues for the year ended December 31, 2018 increased by
1.7%
compared to the prior year.
DIS revenues for the year ended December 31, 2018 increased by
1.9%
compared to the prior year reflecting the impact of recent acquisitions. Acquisitions contributed 3.2% to DIS revenue growth with organic revenue growth (growth excluding the impact of acquisitions) down 1.3%. DIS volume increased by 2.5%, with acquisitions and organic growth contributing approximately 2% and 0.5%, respectively, to DIS volume growth. Revenue per requisition decreased by 1.2% compared to the prior year primarily from pricing pressure, including pricing pressure due to PAMA and all other sources, of slightly less than 1.5%; increased denials; higher patient concessions and lower revenue per requisition associated with our growth in professional lab services engagements, partially offset by favorable test mix, driven in part by acquisitions.
Net revenues for the year ended December 31, 2017 increased by
2.6%
compared to the prior year. The Focus Sale negatively impacted revenue growth by 0.4% and we estimate that hurricanes negatively impacted revenue growth by approximately 0.4%.
DIS revenues for the year ended December 31, 2017 increased by
3.4%
compared to the prior year, which reflected continuing expansion of hospital health system relationships and growth in non-routine (including advanced diagnostics)
testing. Organic growth (growth excluding the impact of acquisitions) and acquisitions contributed approximately 2.1% and 1.3%, respectively, to DIS revenue growth. DIS volume, measured by the number of requisitions, increased 2.3%, with organic growth and acquisitions contributing approximately 1.4% and 0.9%, respectively, to DIS volume growth. Revenue per requisition increased by 1.1% compared to the prior year. Revenue per requisition benefited from favorable test mix, driven in part by acquisitions, partially offset by moderate pricing pressure of less than 1% and lower revenue per requisition associated with our growth in professional lab services engagements.
Combined revenues in our DS businesses for the year ended December 31, 2017 decreased by
11.3%
compared to the prior year primarily due to the Focus Sale.
Cost of Services
Cost of services consists principally of costs for obtaining, transporting and testing specimens as well as facility costs used for the delivery of our services.
Cost of services
increased
by
$207 million
for the year ended December 31, 2018 compared to the prior year. The increase was primarily driven by additional operating costs associated with our acquisitions, $20 million of incremental expense associated with reinvestments in the business with savings from tax reform, higher supplies expense, and higher depreciation expense associated with increased capital expenditures, partially offset by lower performance-based compensation.
Cost of services increased
$103 million
for the year ended December 31, 2017 compared to the prior year. The increases were primarily driven by additional operating costs associated with our acquisitions, higher compensation and benefits expense, and higher supplies expense related to increased testing volume.
Selling, General and Administrative Expenses ("SG&A")
SG&A consists principally of the costs associated with our sales and marketing efforts, billing operations, bad debt expense and general management and administrative support as well as administrative facility costs.
SG&A
decreased
by
$19 million
for the year ended December 31, 2018, compared to the prior year primarily driven by lower compensation and benefits expense including performance-based compensation, partially offset by additional operating costs associated with our acquisitions and $19 million of incremental expense associated with reinvestments in the business with savings from tax reform.
64
SG&A increased
$63 million
for the year ended December 31, 2017 compared to the prior year. The increase in SG&A was primarily driven by higher systems conversion, integration and workforce reduction costs associated with our Invigorate program, additional operating costs associated with our acquisitions and higher performance-based compensation costs.
Amortization of Intangible Assets
The
$16 million
increase
in amortization of intangible assets for the year ended December 31, 2018 compared to the prior year was associated with our acquisitions.
The
$2 million
increase in amortization of intangible assets for the year ended December 31, 2017 compared to the prior year was associated with our acquisitions.
Loss (Gain) on Disposition of Business
For the year ended December 31, 2018, loss on disposition of business was due to the sale of a foreign subsidiary. For the year ended December 31, 2016, gain on disposition of business was a result of the Focus Sale.
Other Operating (Income) Expense, net
Other operating (income) expense, net
includes miscellaneous income and expense items and other charges related to operating activities.
For the year ended December 31, 2018, other operating (income) expense, net included a gain of $12 million associated with a decrease in the fair value of the contingent consideration accrual associated with our MedXM acquisition.
For the year ended December 31, 2016, other operating (income) expense, net principally consisted of a $22 million non-taxable gain on an escrow recovery associated with an acquisition, partially offset by $7 million of non-cash asset impairment charges.
Operating Income
Operating income was
$1,101 million
or
14.6%
of net revenue for the year ended December 31, 2018,
$1,165 million
or
15.7%
of revenue for the year ended December 31, 2017, and
$1,277 million
or
17.7%
of net revenue for the year ended December 31, 2016.
In addition to the impact of the above items, operating income as a percentage of net revenues for the year ended December 31, 2018 decreased compared to the prior year as certain acquisitions completed during 2017 and 2018 initially have lower operating income (including amortization of acquired intangibles) as compared to the overall business until such time as full cost synergies can be realized through integration of the acquired business.
Interest Expense, net
Interest expense, net for the year ended December 31, 2018
increased
by
$16 million
compared to the prior year. The increase in interest expense, net was primarily driven by higher interest rates associated with our variable rate indebtedness combined with higher average outstanding indebtedness.
Interest expense, net for the year ended December 31, 2017 increased by
$8 million
compared to the prior year. The increase in interest expense, net was primarily driven by higher interest rates associated with our variable rate indebtedness combined with higher average outstanding indebtedness.
Other (Expense) Income, net
Other (expense) income, net
represents miscellaneous income and expense items related to non-operating activities, such as gains and losses associated with investments, other non-operating assets and early retirement of debt.
For the year ended December 31, 2018, other (expense) income, net included $6 million of losses associated with investments in our deferred compensation plans and the loss on the write-off of an equity investment.
65
For the year ended December 31, 2017, other (expense) income, net included $13 million of gains associated with investments in our deferred compensation plans and a $7 million gain on the sale of an interest in an equity method investment, which were partially offset by non-cash asset impairment charges associated with certain investments of $6 million.
For the year ended December 31, 2016, other (expense) income, net included the loss on retirement of debt of $48 million associated with the 2016 Tender Offer and non-cash asset impairment charges associated with certain investments of $7 million.
Income Tax Expense
For the year ended December 31, 2018, income tax expense included a $15 million income tax benefit associated with a change in a tax return accounting method that enabled our Company to accelerate the deduction of certain expenses on its 2017 tax return at the federal corporate statutory rate in effect during 2017; a $7 million net income tax benefit associated with tax reserves primarily related to the expiration of the statute of limitations for certain income tax returns; and $18 million of excess tax benefits associated with stock-based compensation arrangements. In addition to these items, our effective income tax rate for the year ended December 31, 2018 benefited from the reduced corporate tax rate as a result of TCJA.
For the year ended December 31, 2017, income tax expense and our effective income tax rate benefited from the impact of the enactment of TCJA and excess tax benefits associated with stock-based compensation arrangements. We recorded a provisional estimated income tax benefit of $106 million, associated with the TCJA, including a deferred income tax benefit of $115 million primarily due to the remeasurement of our net deferred tax liabilities and reserves at the new combined federal and state tax rate, partially offset by $9 million of current tax expense primarily due to the mandatory repatriation toll charge on undistributed foreign earnings and profits. In addition, income tax expense included $37 million of excess tax benefits associated with stock-based compensation arrangements.
For the year ended December 31, 2016, income tax expense included $84 million of income taxes associated with the Focus Sale, partially offset by $9 million of excess tax benefits associated with stock-based compensation arrangements and an income tax benefit of $18 million associated with the 2016 Tender Offer. The income tax expense associated with the Focus Sale resulted in an effective tax rate of 71.4% on the transaction, which was significantly in excess of the statutory tax rate primarily due to a lower tax basis in the assets sold, specifically the goodwill associated with the disposition. Our effective income tax rate for the year ended December 31, 2016 was negatively impacted by the higher tax rate, 71.4%, associated with the Focus Sale, partially offset by a non-taxable gain on an escrow recovery associated with an acquisition and $9 million of excess tax benefits associated with stock-based compensation arrangements.
Equity in Earnings of Equity Method Investees, Net of Taxes
For the year ended December 31, 2018 there was a
$9 million
increase in equity in earnings of equity method investees, net of taxes, primarily associated with our investment in the Q
2
Solutions joint venture.
For the year ended December 31, 2017 there was a
$4 million
decrease in equity in earnings of equity method investees, net of taxes.
Quantitative and Qualitative Disclosures About Market Risk
We address our exposure to market risks, principally the risk of changes in interest rates, through a controlled program of risk management that includes the use of derivative financial instruments. We do not hold or issue derivative financial instruments for speculative purposes. We seek to mitigate the variability in cash outflows that result from changes in interest rates by maintaining a balanced mix of fixed-rate and variable-rate debt obligations. In order to achieve this objective, we have entered into interest rate swaps. Interest rate swaps involve the periodic exchange of payments without the exchange of underlying principal or notional amounts. Net settlements are recognized as an adjustment to interest expense. We believe that our exposures to foreign exchange impacts and changes in commodity prices are not material to our consolidated financial condition or results of operations. For further details regarding our significant accounting policies on interest rate risk and foreign currency, see Note 2 to the audited consolidated financial statements.
66
As of both
December 31, 2018
and
2017
, the fair value of our debt was estimated at approximately
$4.0 billion
using quoted prices in active markets and yields for the same or similar types of borrowings, taking into account the underlying terms of the debt instruments. As of
December 31, 2018
and
2017
, the estimated fair value exceeded the carrying value of the debt by
$85 million
and
$247 million
, respectively. A hypothetical 10% increase in market interest rates (representing
39
and
31
basis points on average at
December 31, 2018
and
2017
, respectively) would potentially reduce the estimated fair value of our debt by approximately
$88 million
and
$90 million
as of
December 31, 2018
and
2017
, respectively.
Borrowings under our secured receivables credit facility and our senior unsecured revolving credit facility are subject to variable interest rates. Interest on our secured receivables credit facility is based on either a rate that is intended to approximate commercial paper rates for highly rated issuers, or LIBOR, plus a spread. Interest on our senior unsecured revolving credit facility is subject to a pricing schedule that can fluctuate based on changes in our credit ratings. As such, our borrowing cost under this credit arrangement will be subject to both fluctuations in interest rates and changes in our credit ratings. As of
December 31, 2018
, the borrowing rates under these debt instruments were: for our secured receivables credit facility, commercial paper rates for highly rated issuers, or LIBOR, plus a spread of
0.70%
to
0.725%
; and for our senior unsecured revolving credit facility, LIBOR plus
1.125%
. As of
December 31, 2018
, there was
$160 million
in borrowings outstanding under our $600 million secured receivables credit facility and no borrowings outstanding under our $750 million senior unsecured revolving credit facility.
The notional amount of fixed-to-variable interest rate swaps as of both
December 31, 2018
and
2017
was
$1.2 billion
. The aggregate fair value of the fixed-to-variable interest rate swaps was
$93 million
and
$89 million
, in a liability position, as of
December 31, 2018
and
2017
, respectively.
Based on our net exposure to interest rate changes, a hypothetical 10% change to the variable rate component of our variable rate indebtedness (representing
24
basis points) would potentially change annual interest expense by
$3 million
. A hypothetical 10% change in the forward one-month LIBOR curve (representing a
25
basis point change in the weighted average yield) would potentially change the fair value of our derivative liabilities by
$17 million
.
For further details regarding our outstanding debt and our financial instruments and hedging activities, see Notes 14 and 15, respectively, to the audited consolidated financial statements.
Risk Associated with Investment Portfolio
Our investment portfolio includes equity investments comprised primarily of strategic equity holdings in privately and publicly held companies. These securities are exposed to price fluctuations and are generally concentrated in the life sciences industry. Equity investments (except those accounted for under the equity method of accounting or those that result in consolidation of the investee) with readily determinable fair values are measured at fair value with changes in fair value recognized in net income. Equity investments that do not have readily determinable fair values are measured at cost minus impairment, if any, plus or minus changes resulting from observable price changes; we regularly evaluate these equity investments to determine if there are any indicators that the investment is impaired. The carrying value of our equity investments that do not have readily determinable fair values was
$10 million
as of
December 31, 2018
.
We do not hedge our equity price risk. The impact of an adverse movement in equity prices on our holdings in privately held companies cannot be easily quantified, as our ability to realize returns on investments depends on, among other things, the enterprises’ ability to raise additional capital or derive cash inflows from continuing operations or through liquidity events such as initial public offerings, mergers or private sales.
Liquidity and Capital Resources
|
2018
|
2017
|
2016
|
|||||||||
|
(dollars in millions)
|
|||||||||||
|
Net cash provided by operating activities
|
$
|
1,200
|
|
$
|
1,175
|
|
$
|
1,116
|
|
||
|
Net cash used in investing activities
|
(801
|
)
|
(830
|
)
|
(127
|
)
|
|||||
|
Net cash used in financing activities
|
(401
|
)
|
(592
|
)
|
(738
|
)
|
|||||
|
Net change in cash and cash equivalents and restricted cash
|
$
|
(2
|
)
|
$
|
(247
|
)
|
$
|
251
|
|
||
Cash and Cash Equivalents
67
Cash and cash equivalents consist of cash and highly liquid short-term investments. Cash and cash equivalents as of
December 31, 2018
,
2017
and
2016
totaled
$135 million
,
$137 million
and
$359 million
, respectively.
As of
December 31, 2018
, approximately 33% of our
$135 million
of consolidated cash and cash equivalents were held outside of the United States. Our current liquidity position does not require repatriation of these funds in order to fund operations in the United States. However, as a result of changes introduced by the TCJA, we may repatriate back to the United States the portion of these foreign funds not expected to be used to maintain or expand operations, including through acquisitions, outside of the United States.
Cash Flows from Operating Activities
Net cash provided by operating activities for the year ended
December 31, 2018
was
$1.2 billion
, and increased
$25 million
compared to the prior year primarily as a result of:
|
•
|
a decrease in 2018 tax payments of $159 million primarily due to the impact of TCJA; partially offset by;
|
|
•
|
lower operating income in 2018 as compared to 2017; and
|
|
•
|
timing of movements in our working capital accounts.
|
Net cash provided by operating activities for the year ended
December 31, 2017
was
$1.2 billion
, compared to
$1.1 billion
for the year ended
December 31, 2016
. This
$59 million
increase in cash provided by operating activities was primarily a result of:
|
•
|
a decrease in 2017 tax payments associated with the realization of a $62 million deferred tax benefit in 2017 and a $91 million tax payment in 2016 related to the Focus Sale; and
|
|
•
|
improved operating performance in 2017; partially offset by;
|
|
•
|
$54 million of proceeds received in the third quarter of 2016 from the termination of interest swap agreements.
|
Days sales outstanding, a measure of billing and collection efficiency, was 54 days, 47 days and 48 days as of
December 31, 2018
,
2017
and
2016
, respectively.
Cash Flows from Investing Activities
Net cash used in investing activities for the year ended
December 31, 2018
was
$801 million
, compared to
$830 million
for the year ended
December 31, 2017
. This
$29 million
decrease in cash used in investing activities was a result of:
|
•
|
$160 million
decrease in cash paid for business acquisitions; partially offset by;
|
|
•
|
$131 million
increase in capital expenditures.
|
Net cash used in investing activities for the year ended
December 31, 2017
was
$830 million
, compared to
$127 million
for the year ended
December 31, 2016
. This
$703 million
increase in cash used in investing activities was a result of:
|
•
|
$442 million increase in cash paid for business acquisitions; and
|
|
•
|
$294 million decrease in proceeds from the disposition of businesses, primarily a result of the Focus Sale in 2016; partially offset by;
|
|
•
|
$41 million decrease in capital expenditures
|
Cash Flows from Financing Activities
Net cash used in financing activities for the year ended
December 31, 2018
was
$401 million
, compared to
$592 million
for the year ended
December 31, 2017
. This
$191 million
decrease in cash used in financing activities was primarily a result of:
|
•
|
$143 million
decrease in cash paid for repurchases of our common stock (see "Share Repurchases" for further details) in 2018; and
|
|
•
|
$124 million in net borrowings (proceeds from borrowings less repayments of debt) in 2018, compared to $23 million in net borrowings in 2017; partially offset by;
|
|
•
|
$31 million
decrease in proceeds from the exercise of stock options, which was a result of a decrease in the volume of stock options exercised over the past year.
|
68
Net cash used in financing activities for the year ended
December 31, 2017
was
$592 million
, compared to
$738 million
for the year ended
December 31, 2016
. This
$146 million
decrease in cash used in financing activities was primarily a result of:
|
•
|
$125 million decrease in repurchases of our common stock (see "Share Repurchases" for further details) in 2017;
|
|
•
|
$80 million increase in bank overdrafts, which are generally settled in cash the following business day;
|
|
•
|
$57 million increase in proceeds from the exercise of stock options, which was a result of an increase in the volume of stock options exercised compared to the prior year; and
|
|
•
|
$43 million of payments related to the retirement of debt in 2016; partially offset by;
|
|
•
|
$23 million in net borrowings (proceeds from borrowings less repayments of debt) in 2017, compared to $141 million in net borrowings in 2016; and
|
|
•
|
$24 million increase in dividends paid.
|
In 2018, there were $2,090 million in cumulative borrowings under the secured receivables credit facility primarily associated with working capital requirements as well as the funding of our 2018 acquisitions and
$1,960 million
in repayments. In 2018, there were no borrowings or repayments under our senior unsecured revolving credit facility.
In 2017, there were $205 million in cumulative borrowings primarily associated with the funding of the Cleveland HeartLab, Inc. and Shiel Holdings, LLC ("Shiel") acquisitions in December 2017 and $175 million in repayments under our secured receivables credit facility. In 2017, there were no borrowings under our senior unsecured revolving credit facility.
In 2016, we completed the issuance of the $500 million principal amount of 3.45% senior notes due June 2026, the 2016 Tender Offer and repaid the remaining $150 million outstanding under the Senior Notes due April 2016. In addition, both cumulative borrowings and repayments under our secured receivables credit facility totaled $1.2 billion in 2016. Both cumulative borrowings and repayments under our senior unsecured revolving credit facility totaled $155 million in 2016.
For details regarding our debt and related transactions, see Note 14 to the audited consolidated financial statements.
Dividend Program
During each of the first three quarters of 2018, our Board of Directors declared a quarterly cash dividend of
$0.50
per common share. During the fourth quarter of 2018, our Board of Directors declared a quarterly cash dividend of
$0.53
per common share. During each of the four quarters of 2017 and the fourth quarter of 2016, our Board of Directors declared a quarterly cash dividend of $0.45 per common share. During each of the first three quarters of 2016, our Board of Directors declared a quarterly cash dividend of $0.40 per common share. We expect to fund future dividend payments with cash flows from operations.
Share Repurchases
In December 2016, our Board of Directors authorized us to repurchase an additional $1 billion of our common stock. As of December 31, 2018,
$0.6 billion
remained available under the share repurchase authorization.
For the year ended
December 31, 2018
, we repurchased
3.4 million
shares of our common stock for
$325 million
, which included an accrual of $3 million recorded in accounts payable and accrued expenses in the consolidated balance sheet for share repurchases not settled.
For the year ended
December 31, 2017
, we repurchased
4.6 million
shares of our common stock for
$465 million
.
For the year ended
December 31, 2016
, we repurchased
7.4 million
shares of our common stock for
$590 million
, which included 3.1 million shares repurchased under an accelerated share repurchase program.
For further details regarding our share repurchases, see Note 16 to the audited consolidated financial statements.
69
Contractual Obligations and Commitments
The following table summarizes certain of our contractual obligations as of
December 31, 2018
(dollars in millions):
|
Payments due by period
|
||||||||||||||||||||
|
Contractual Obligations
|
Total
|
Less than
1 year
|
1-3 years
|
4-5 years
|
After 5 years
|
|||||||||||||||
|
Outstanding debt
|
$
|
3,936
|
|
$
|
460
|
|
$
|
1,350
|
|
$
|
—
|
|
$
|
2,126
|
|
|||||
|
Capital lease obligations
|
36
|
|
4
|
|
6
|
|
4
|
|
22
|
|
||||||||||
|
Interest payments on outstanding debt
|
1,476
|
|
169
|
|
269
|
|
214
|
|
824
|
|
||||||||||
|
Operating leases
|
691
|
|
181
|
|
249
|
|
139
|
|
122
|
|
||||||||||
|
Purchase obligations
|
1,831
|
|
300
|
|
546
|
|
440
|
|
545
|
|
||||||||||
|
Merger consideration obligation
|
14
|
|
9
|
|
5
|
|
—
|
|
—
|
|
||||||||||
|
Total contractual obligations
|
$
|
7,984
|
|
$
|
1,123
|
|
$
|
2,425
|
|
$
|
797
|
|
$
|
3,639
|
|
|||||
Interest payments on our outstanding debt have been calculated after giving effect to our interest rate swap agreements, using the interest rates as of
December 31, 2018
applied to the
December 31, 2018
balances, which are assumed to remain outstanding through their maturity dates.
A description of the terms of our indebtedness and related debt service requirements and our future payments under certain of our contractual obligations is contained in Note 14 to the audited consolidated financial statements. A discussion and analysis regarding our minimum rental commitments under noncancelable operating leases is contained in Note 18 to the audited consolidated financial statements. Purchase obligations include our noncancelable commitments to purchase product or services as described in Note 18 to the audited consolidated financial statements. A discussion regarding our acquisitions of Shiel and ReproSource and the related merger consideration obligation is contained in Note 6 to the audited consolidated financial statements. A discussion regarding the fair value of the contingent consideration associated with our acquisitions is discussed in Note 8 to the audited consolidated financial statements.
As of
December 31, 2018
, our total liabilities associated with unrecognized tax benefits were approximately
$107 million
, which were excluded from the table above. We expect that these liabilities may decrease by less than
$34 million
within the next twelve months, primarily as a result of payments, settlements, expiration of statutes of limitations and/or the conclusion of tax examinations on certain tax positions. For the remainder, we cannot make reasonably reliable estimates of the timing of the future payments of these liabilities. Additionally, it is reasonably possible that within the next 12 months, as a result of ongoing negotiations with tax authorities and the expiration of statutes of limitations, our total liabilities associated with unrecognized tax benefits may further decrease and beneficially impact the effective tax rate. However, due to the inherent uncertainty of the negotiations and the resulting outcomes we are not able to estimate the effective tax rate impact at this time. For further details regarding the contingent tax liability reserves, see Note 9 to the audited consolidated financial statements.
In connection with the sale of an 18.9% noncontrolling interest in a subsidiary to UMass, we granted UMass the right to require us to purchase all of its interest in the subsidiary at fair value commencing July 1, 2020. As of
December 31, 2018
, the fair value of the redeemable noncontrolling interest on the consolidated balance sheet was
$77 million
, which was excluded from the table above. Since the redemption of the noncontrolling interest is outside of our control, we cannot make a reasonably reliable estimate of the timing of the future payment, if any, of the redeemable noncontrolling interest. For further details regarding the redeemable noncontrolling interest, see Note 16 to the audited consolidated financial statements.
Our credit agreements contain various covenants and conditions, including the maintenance of certain financial ratios, that could impact our ability to, among other things, incur additional indebtedness. As of
December 31, 2018
, we were in compliance with the various financial covenants included in our credit agreements and we do not expect these covenants to adversely impact our ability to execute our growth strategy or conduct normal business operations.
70
Equity Method Investees
Our equity method investees primarily consist of our clinical trials central laboratory services joint venture and our diagnostic information services joint ventures, which are accounted for under the equity method of accounting. Our investment in equity method investees equals less than 5% of our consolidated total assets. Our proportionate share of income before income taxes associated with our equity method investees is approximately 6% of our consolidated income before income taxes and equity in earnings of equity method investees. We have no material unconditional obligations or guarantees to, or in support of, our equity method investees and their operations. For further details regarding related party transactions with our equity method investees, see Note 20 to the audited consolidated financial statements.
Requirements and Capital Resources
We estimate that we will invest approximately $350 million to $400 million during
2019
for capital expenditures, to support and grow our existing operations, principally related to investments in information technology, laboratory equipment and facilities, including our new multi-year laboratory construction in New Jersey, and additional investments in our advanced and consumer growth strategies.
As of
December 31, 2018
, $1.1 billion of borrowing capacity was available under our existing credit facilities consisting of $369 million available under our secured receivables credit facility and $750 million available under our senior unsecured revolving credit facility. The secured receivables credit facility includes a $250 million loan commitment which matures October 2019, and a $250 million loan commitment and a $100 million letter of credit facility which mature October 2020. The senior unsecured revolving credit facility matures in March 2023.
We believe the borrowing capacity under the credit facilities described above continues to be available to us. Should one or several banks no longer participate in either of our credit facilities, we would not expect it to impact our ability to fund operations. We expect that we will be able to replace our existing credit facilities with alternative arrangements prior to their expiration.
We believe that our cash and cash equivalents and cash from operations, together with our borrowing capacity under our credit facilities, will provide sufficient financial flexibility to fund seasonal and other working capital requirements, capital expenditures, debt service requirements and other obligations, cash dividends on common shares, share repurchases and additional growth opportunities for the foreseeable future. We believe that our credit profile should provide us with access to additional financing to refinance upcoming debt maturities and, if necessary, to fund growth opportunities that cannot be funded from existing sources.
Inflation
We believe that inflation generally does not have a material adverse effect on our results of operations or financial condition.
Impact of New Accounting Standards
The impacts of recent accounting pronouncements not yet effective on our audited consolidated financial statements are discussed in Note 2 to the audited consolidated financial statements.
71
REPORT OF MANAGEMENT ON INTERNAL CONTROL OVER FINANCIAL REPORTING
The management of the Company, including its Chief Executive Officer and Chief Financial Officer, is responsible for establishing and maintaining adequate internal control over financial reporting as defined in Rules 13a-15(f) and 15d-15(f) under the Securities Exchange Act of 1934, as amended. Management assessed the effectiveness of the Company's internal control over financial reporting as of
December 31, 2018
based on criteria for effective internal control over financial reporting described in
“Internal Control - Integrated Framework (2013)”
issued by the Committee of Sponsoring Organizations of the Treadway Commission. Based on this assessment, management has determined that the Company's internal control over financial reporting as of
December 31, 2018
is effective.
The Company's internal control over financial reporting is a process designed to provide reasonable assurance regarding the reliability of financial reporting and the preparation of financial statements for external purposes in accordance with accounting principles generally accepted in the United States of America. Internal control over financial reporting includes policies and procedures that: (1) pertain to the maintenance of records that, in reasonable detail, accurately and fairly reflect the transactions and dispositions of the assets of the Company; (2) provide reasonable assurance that transactions are recorded as necessary to permit preparation of financial statements in accordance with accounting principles generally accepted in the United States of America, and that receipts and expenditures of the Company are being made only in accordance with authorization of management and directors of the Company; and (3) provide reasonable assurance regarding prevention or timely detection of unauthorized acquisition, use or disposition of assets that could have a material effect on the consolidated financial statements.
Because of its inherent limitations, internal control over financial reporting may not prevent or detect misstatements. Also, projections of any evaluation of effectiveness to future periods are subject to the risk that controls may become inadequate because of changes in conditions, or that the degree of compliance with the policies or procedures may deteriorate.
PricewaterhouseCoopers LLP, the independent registered public accounting firm that audited the financial statements included in this annual report, audited the Company's internal control over financial reporting as of
December 31, 2018
and issued their audit report on the Company's internal control over financial reporting included herein.
72
Report of Independent Registered Public Accounting Firm
To the Board of Directors and Stockholders of Quest Diagnostics Incorporated
Opinions on the Financial Statements and Internal Control over Financial Reporting
We have audited the accompanying consolidated balance sheets of Quest Diagnostics Incorporated
and its subsidiaries
(the “Company”) as of December 31,
2018
and 2017,
and the related consolidated statements of operations, comprehensive income, stockholders’ equity and cash flows for each of the three years in the period ended December 31, 2018, including the related notes and financial statement schedule
of valuation accounts and reserves for each of the three years in the period ended December 31, 2018 listed
under Item 15(a)2 (collectively referred to as the “consolidated financial statements”).
We also have audited the Company's internal control over financial reporting as of December 31, 2018, based on criteria established in
Internal Control - Integrated Framework
(2013)
issued by the Committee of Sponsoring Organizations of the Treadway Commission (COSO).
In our opinion, the consolidated
financial statements referred to above present fairly, in all material respects, the financial position of the Company as of December 31, 2018
and 2017
,
and the results of its
operations and its
cash flows for each of the three years in the period ended December 31, 2018
in conformity with accounting principles generally accepted in the United States of America. Also in our opinion, the Company maintained, in all material respects, effective internal control over financial reporting as of December 31, 2018, based on criteria established in
Internal Control - Integrated Framework
(2013)
issued by the COSO.
Change in Accounting Principle
As discussed in Note 2 to the consolidated financial statements, the Company changed the manner in which it accounts for revenues from contracts with customers in 2018.
Basis for Opinions
The Company's management is responsible for these consolidated financial statements, for maintaining effective internal control over financial reporting, and for its assessment of the effectiveness of internal control over financial reporting, included in the accompanying Report of Management on Internal Control over Financial Reporting. Our responsibility is to express opinions on the Company’s consolidated financial statements and on the Company's internal control over financial reporting based on our audits. We are a public accounting firm registered with the Public Company Accounting Oversight Board (United States) (PCAOB) and are required to be independent with respect to the Company in accordance with the U.S. federal securities laws and the applicable rules and regulations of the Securities and Exchange Commission and the PCAOB.
We conducted our audits in accordance with the standards of the PCAOB. Those standards require that we plan and perform the audits to obtain reasonable assurance about whether the consolidated
financial statements are free of material misstatement, whether due to error or fraud, and whether effective internal control over financial reporting was maintained in all material respects.
Our audits of the consolidated
financial statements included performing procedures to assess the risks of material misstatement of the consolidated
financial statements, whether due to error or fraud, and performing procedures that respond to those risks. Such procedures included examining, on a test basis, evidence regarding the amounts and disclosures in the consolidated
financial statements. Our audits also included evaluating the accounting principles used and significant estimates made by management, as well as evaluating the overall presentation of the consolidated
financial statements. Our audit of internal control over financial reporting included obtaining an understanding of internal control over financial reporting, assessing the risk that a material weakness exists, and testing and evaluating the design and operating effectiveness of internal control based on the assessed risk. Our audits also included performing such other procedures as we considered necessary in the circumstances. We believe that our audits provide a reasonable basis for our opinions.
Definition and Limitations of Internal Control over Financial Reporting
A company’s internal control over financial reporting is a process designed to provide reasonable assurance regarding the reliability of financial reporting and the preparation of financial statements for external purposes in accordance with generally accepted accounting principles. A company’s internal control over financial reporting includes those policies and procedures that (i) pertain to the maintenance of records that, in reasonable detail, accurately and fairly reflect the transactions and dispositions of the assets of the company; (ii) provide reasonable assurance that transactions are recorded as necessary to
F- 1
permit preparation of financial statements in accordance with generally accepted accounting principles, and that receipts and expenditures of the company are being made only in accordance with authorizations of management and directors of the company; and (iii) provide reasonable assurance regarding prevention or timely detection of unauthorized acquisition, use, or disposition of the company’s assets that could have a material effect on the financial statements.
Because of its inherent limitations, internal control over financial reporting may not prevent or detect misstatements. Also, projections of any evaluation of effectiveness to future periods are subject to the risk that controls may become inadequate because of changes in conditions, or that the degree of compliance with the policies or procedures may deteriorate.
|
/s/
|
PricewaterhouseCoopers LLP
|
|
Florham Park, New Jersey
|
|
|
February 21, 2019
|
|
We have served as the Company’s auditor since 1995.
F- 2
QUEST DIAGNOSTICS INCORPORATED AND SUBSIDIARIES
CONSOLIDATED BALANCE SHEETS
DECEMBER 31, 2018
AND
2017
(in millions, except per share data)
|
2018
|
2017
|
||||||
|
Assets
|
|
|
|
|
|||
|
Current assets:
|
|
|
|
|
|||
|
Cash and cash equivalents
|
$
|
135
|
|
$
|
137
|
|
|
|
Accounts receivable, net of allowance for doubtful accounts of $15 and $13 as of December 31, 2018 and 2017, respectively
|
1,012
|
|
924
|
|
|||
|
Inventories
|
99
|
|
95
|
|
|||
|
Prepaid expenses and other current assets
|
144
|
|
150
|
|
|||
|
Total current assets
|
1,390
|
|
1,306
|
|
|||
|
Property, plant and equipment, net
|
1,288
|
|
1,145
|
|
|||
|
Goodwill
|
6,563
|
|
6,335
|
|
|||
|
Intangible assets, net
|
1,207
|
|
1,119
|
|
|||
|
Investments in equity method investees
|
436
|
|
462
|
|
|||
|
Other assets
|
119
|
|
136
|
|
|||
|
Total assets
|
$
|
11,003
|
|
$
|
10,503
|
|
|
|
Liabilities and Stockholders’ Equity
|
|
|
|
|
|||
|
Current liabilities:
|
|
|
|
|
|||
|
Accounts payable and accrued expenses
|
$
|
1,021
|
|
$
|
1,021
|
|
|
|
Current portion of long-term debt
|
464
|
|
36
|
|
|||
|
Total current liabilities
|
1,485
|
|
1,057
|
|
|||
|
Long-term debt
|
3,429
|
|
3,748
|
|
|||
|
Other liabilities
|
745
|
|
663
|
|
|||
|
Commitments and contingencies
|
|
|
|
|
|||
|
Redeemable noncontrolling interest
|
77
|
|
80
|
|
|||
|
Stockholders’ equity:
|
|
|
|
|
|||
|
Quest Diagnostics stockholders’ equity:
|
|
|
|
|
|||
|
Common stock, par value $0.01 per share; 600 shares authorized as of both December 31, 2018 and 2017; 217 and 216 shares issued as of December 31, 2018 and 2017, respectively
|
2
|
|
2
|
|
|||
|
Additional paid-in capital
|
2,667
|
|
2,612
|
|
|||
|
Retained earnings
|
7,602
|
|
7,138
|
|
|||
|
Accumulated other comprehensive loss
|
(59
|
)
|
(48
|
)
|
|||
|
Treasury stock, at cost; 82 shares and 81 shares as of December 31, 2018 and 2017, respectively
|
(4,996
|
)
|
(4,783
|
)
|
|||
|
Total Quest Diagnostics stockholders’ equity
|
5,216
|
|
4,921
|
|
|||
|
Noncontrolling interests
|
51
|
|
34
|
|
|||
|
Total stockholders’ equity
|
5,267
|
|
4,955
|
|
|||
|
Total liabilities and stockholders’ equity
|
$
|
11,003
|
|
$
|
10,503
|
|
|
The accompanying notes are an integral part of these statements.
F- 3
QUEST DIAGNOSTICS INCORPORATED AND SUBSIDIARIES
CONSOLIDATED STATEMENTS OF OPERATIONS
FOR THE YEARS ENDED
DECEMBER 31, 2018
,
2017
AND
2016
(in millions, except per share data)
|
2018
|
2017
|
2016
|
|||||||||
|
Net revenues
|
$
|
7,531
|
|
$
|
7,402
|
|
$
|
7,214
|
|
||
|
Operating costs and expenses and other operating income:
|
|
|
|
|
|
|
|||||
|
Cost of services
|
4,926
|
|
4,719
|
|
4,616
|
|
|||||
|
Selling, general and administrative
|
1,424
|
|
1,443
|
|
1,380
|
|
|||||
|
Amortization of intangible assets
|
90
|
|
74
|
|
72
|
|
|||||
|
Loss (gain) on disposition of business
|
4
|
|
—
|
|
(118
|
)
|
|||||
|
Other operating (income) expense, net
|
(14
|
)
|
1
|
|
(13
|
)
|
|||||
|
Total operating costs and expenses, net
|
6,430
|
|
6,237
|
|
5,937
|
|
|||||
|
Operating income
|
1,101
|
|
1,165
|
|
1,277
|
|
|||||
|
Other (expense) income:
|
|
|
|
|
|
|
|||||
|
Interest expense, net
|
(167
|
)
|
(151
|
)
|
(143
|
)
|
|||||
|
Other (expense) income, net
|
(8
|
)
|
16
|
|
(48
|
)
|
|||||
|
Total non-operating expenses, net
|
(175
|
)
|
(135
|
)
|
(191
|
)
|
|||||
|
Income before income taxes and equity in earnings of equity method investees
|
926
|
|
1,030
|
|
1,086
|
|
|||||
|
Income tax expense
|
(182
|
)
|
(241
|
)
|
(429
|
)
|
|||||
|
Equity in earnings of equity method investees, net of taxes
|
44
|
|
35
|
|
39
|
|
|||||
|
Net income
|
788
|
|
824
|
|
696
|
|
|||||
|
Less: Net income attributable to noncontrolling interests
|
52
|
|
52
|
|
51
|
|
|||||
|
Net income attributable to Quest Diagnostics
|
$
|
736
|
|
$
|
772
|
|
$
|
645
|
|
||
|
Earnings per share attributable to Quest Diagnostics’ common stockholders:
|
|
|
|
|
|||||||
|
Basic
|
$
|
5.39
|
|
$
|
5.63
|
|
$
|
4.58
|
|
||
|
Diluted
|
$
|
5.29
|
|
$
|
5.50
|
|
$
|
4.51
|
|
||
The accompanying notes are an integral part of these statements.
F- 4
QUEST DIAGNOSTICS INCORPORATED AND SUBSIDIARIES
CONSOLIDATED STATEMENTS OF COMPREHENSIVE INCOME
FOR THE YEARS ENDED
DECEMBER 31, 2018
,
2017
AND
2016
(in millions)
|
2018
|
2017
|
2016
|
|||||||||
|
Net income
|
$
|
788
|
|
$
|
824
|
|
$
|
696
|
|
||
|
Other comprehensive (loss) income:
|
|||||||||||
|
Currency translation
|
(11
|
)
|
20
|
|
(34
|
)
|
|||||
|
Investment adjustments, net of taxes
|
—
|
|
3
|
|
(2
|
)
|
|||||
|
Net deferred loss on cash flow hedges, net of tax
|
2
|
|
1
|
|
2
|
|
|||||
|
Other comprehensive (loss) income
|
(9
|
)
|
24
|
|
(34
|
)
|
|||||
|
Comprehensive income
|
779
|
|
848
|
|
662
|
|
|||||
|
Less: Comprehensive income attributable to noncontrolling interests
|
52
|
|
52
|
|
51
|
|
|||||
|
Comprehensive income attributable to Quest Diagnostics
|
$
|
727
|
|
$
|
796
|
|
$
|
611
|
|
||
The accompanying notes are an integral part of these statements.
F- 5
QUEST DIAGNOSTICS INCORPORATED AND SUBSIDIARIES
CONSOLIDATED STATEMENTS OF CASH FLOWS
FOR THE YEARS ENDED
DECEMBER 31, 2018
,
2017
AND
2016
(in millions)
|
2018
|
2017
|
2016
|
|||||||||
|
Cash flows from operating activities:
|
|
|
|
|
|||||||
|
Net income
|
$
|
788
|
|
$
|
824
|
|
$
|
696
|
|
||
|
Adjustments to reconcile net income to net cash provided by operating activities:
|
|
|
|
|
|
|
|||||
|
Depreciation and amortization
|
309
|
|
270
|
|
249
|
|
|||||
|
Provision for doubtful accounts
|
6
|
|
8
|
|
7
|
|
|||||
|
Deferred income tax provision
|
73
|
|
9
|
|
37
|
|
|||||
|
Stock-based compensation expense
|
61
|
|
79
|
|
69
|
|
|||||
|
Loss (gain) on disposition of business
|
4
|
|
—
|
|
(118
|
)
|
|||||
|
Payment of debt extinguishment costs
|
—
|
|
—
|
|
43
|
|
|||||
|
Other, net
|
8
|
|
(6
|
)
|
(2
|
)
|
|||||
|
Changes in operating assets and liabilities:
|
|
|
|
|
|
|
|||||
|
Accounts receivable
|
(65
|
)
|
9
|
|
(42
|
)
|
|||||
|
Accounts payable and accrued expenses
|
(19
|
)
|
(8
|
)
|
56
|
|
|||||
|
Income taxes payable
|
4
|
|
16
|
|
42
|
|
|||||
|
Termination of interest rate swap agreements
|
—
|
|
—
|
|
54
|
|
|||||
|
Other assets and liabilities, net
|
31
|
|
(26
|
)
|
25
|
|
|||||
|
Net cash provided by operating activities
|
1,200
|
|
1,175
|
|
1,116
|
|
|||||
|
Cash flows from investing activities:
|
|
|
|
|
|||||||
|
Business acquisitions, net of cash acquired
|
(421
|
)
|
(581
|
)
|
(139
|
)
|
|||||
|
Proceeds from disposition of business
|
2
|
|
1
|
|
295
|
|
|||||
|
Capital expenditures
|
(383
|
)
|
(252
|
)
|
(293
|
)
|
|||||
|
Decrease in investments and other assets
|
1
|
|
2
|
|
10
|
|
|||||
|
Net cash used in investing activities
|
(801
|
)
|
(830
|
)
|
(127
|
)
|
|||||
|
Cash flows from financing activities:
|
|
|
|
|
|||||||
|
Proceeds from borrowings
|
2,090
|
|
205
|
|
1,869
|
|
|||||
|
Repayments of debt
|
(1,966
|
)
|
(182
|
)
|
(1,728
|
)
|
|||||
|
Purchases of treasury stock
|
(322
|
)
|
(465
|
)
|
(590
|
)
|
|||||
|
Exercise of stock options
|
99
|
|
130
|
|
73
|
|
|||||
|
Employee payroll tax withholdings on stock issued under stock-based compensation plans
|
(21
|
)
|
(23
|
)
|
(10
|
)
|
|||||
|
Dividends paid
|
(266
|
)
|
(247
|
)
|
(223
|
)
|
|||||
|
Distributions to noncontrolling interest partners
|
(54
|
)
|
(51
|
)
|
(41
|
)
|
|||||
|
Payment of debt extinguishment costs
|
—
|
|
—
|
|
(43
|
)
|
|||||
|
Contributions from noncontrolling interest partners
|
16
|
|
4
|
|
—
|
|
|||||
|
Other financing activities, net
|
23
|
|
37
|
|
(45
|
)
|
|||||
|
Net cash used in financing activities
|
(401
|
)
|
(592
|
)
|
(738
|
)
|
|||||
|
Net change in cash and cash equivalents and restricted cash
|
(2
|
)
|
(247
|
)
|
251
|
|
|||||
|
Cash and cash equivalents and restricted cash, beginning of year
|
137
|
|
384
|
|
133
|
|
|||||
|
Cash and cash equivalents and restricted cash, end of year
|
$
|
135
|
|
$
|
137
|
|
$
|
384
|
|
||
|
Cash and cash equivalents
|
$
|
135
|
|
$
|
137
|
|
$
|
359
|
|
||
|
Restricted cash
|
—
|
|
—
|
|
25
|
|
|||||
|
Cash and cash equivalents and restricted cash, end of year
|
$
|
135
|
|
$
|
137
|
|
$
|
384
|
|
||
The accompanying notes are an integral part of these statements.
F- 6
QUEST DIAGNOSTICS INCORPORATED AND SUBSIDIARIES
CONSOLIDATED STATEMENTS OF STOCKHOLDERS’ EQUITY
FOR THE YEARS ENDED
DECEMBER 31, 2018
,
2017
AND
2016
(in millions)
|
Quest Diagnostics Stockholders’ Equity
|
||||||||||||||||||||||||||||
|
Shares of
Common Stock Out-
standing
|
Common
Stock
|
Additional
Paid-In
Capital
|
Retained
Earnings
|
Accumulated
Other
Comprehensive
Loss
|
Treasury
Stock, at
Cost
|
Non-
controlling
Interests
|
Total Stock-holders’
Equity
|
Redeemable Non-controlling Interest
|
||||||||||||||||||||
|
Balance, December 31, 2015
|
143
|
|
$
|
2
|
|
$
|
2,481
|
|
$
|
6,199
|
|
$
|
(38
|
)
|
$
|
(3,960
|
)
|
$
|
29
|
|
$
|
4,713
|
|
$
|
70
|
|
||
|
Net income
|
|
|
|
|
|
|
645
|
|
|
|
|
|
44
|
|
689
|
|
7
|
|
||||||||||
|
Other comprehensive loss, net of tax
|
|
|
|
|
|
|
|
|
(34
|
)
|
|
|
|
|
(34
|
)
|
||||||||||||
|
Dividends declared
|
|
|
|
|
|
|
(231
|
)
|
|
|
|
|
|
|
(231
|
)
|
||||||||||||
|
Distributions to noncontrolling interest partners
|
|
|
|
|
|
|
|
|
|
|
|
|
(41
|
)
|
(41
|
)
|
|
|
||||||||||
|
Issuance of common stock under benefit plans
|
|
|
|
|
7
|
|
|
|
|
|
15
|
|
|
|
22
|
|
||||||||||||
|
Stock-based compensation expense
|
|
|
|
|
65
|
|
|
|
|
|
4
|
|
|
|
69
|
|
||||||||||||
|
Exercise of stock options
|
1
|
|
|
|
2
|
|
|
|
|
|
71
|
|
|
|
73
|
|
||||||||||||
|
Shares to cover employee payroll tax withholdings on stock issued under stock-based compensation plans
|
|
|
|
|
(10
|
)
|
|
|
|
|
|
|
|
|
(10
|
)
|
||||||||||||
|
Purchases of treasury stock
|
(7
|
)
|
|
|
|
|
|
|
|
|
(590
|
)
|
|
|
(590
|
)
|
||||||||||||
|
Balance, December 31, 2016
|
137
|
|
$
|
2
|
|
$
|
2,545
|
|
$
|
6,613
|
|
$
|
(72
|
)
|
$
|
(4,460
|
)
|
$
|
32
|
|
$
|
4,660
|
|
$
|
77
|
|
||
|
Net income
|
|
|
|
|
|
|
772
|
|
|
|
|
|
45
|
|
817
|
|
7
|
|
||||||||||
|
Other comprehensive income, net of tax
|
|
|
|
|
|
|
|
|
24
|
|
|
|
|
|
24
|
|
||||||||||||
|
Dividends declared
|
|
|
|
|
|
|
(247
|
)
|
|
|
|
|
|
|
(247
|
)
|
||||||||||||
|
Distributions to noncontrolling interest partners
|
|
|
|
|
|
|
|
|
|
|
|
|
(47
|
)
|
(47
|
)
|
(4
|
)
|
||||||||||
|
Issuance of common stock under benefit plans
|
|
|
|
|
11
|
|
|
|
|
|
12
|
|
|
|
23
|
|
||||||||||||
|
Stock-based compensation expense
|
|
|
|
|
75
|
|
|
|
|
|
4
|
|
|
|
79
|
|
||||||||||||
|
Exercise of stock options
|
3
|
|
|
|
4
|
|
|
|
|
|
126
|
|
|
|
130
|
|
||||||||||||
|
Shares to cover employee payroll tax withholdings on stock issued under stock-based compensation plans
|
|
|
|
|
(23
|
)
|
|
|
|
|
|
|
|
|
(23
|
)
|
||||||||||||
|
Purchases of treasury stock
|
(5
|
)
|
|
|
|
|
|
|
|
|
(465
|
)
|
|
|
(465
|
)
|
||||||||||||
|
Contributions from noncontrolling interest partners
|
|
|
4
|
|
4
|
|
|
|
||||||||||||||||||||
|
Balance, December 31, 2017
|
135
|
|
$
|
2
|
|
$
|
2,612
|
|
$
|
7,138
|
|
$
|
(48
|
)
|
$
|
(4,783
|
)
|
$
|
34
|
|
$
|
4,955
|
|
$
|
80
|
|
||
|
Net income
|
|
|
|
|
|
|
736
|
|
|
|
|
|
45
|
|
781
|
|
7
|
|
||||||||||
|
Other comprehensive loss, net of tax
|
|
|
|
|
|
|
|
|
(9
|
)
|
|
|
|
|
(9
|
)
|
||||||||||||
|
Dividends declared
|
|
|
|
|
|
|
(274
|
)
|
|
|
|
|
|
|
(274
|
)
|
||||||||||||
|
Distributions to noncontrolling interest partners
|
|
|
|
|
|
|
|
|
|
|
|
|
(44
|
)
|
(44
|
)
|
(10
|
)
|
||||||||||
|
Issuance of common stock under benefit plans
|
|
|
|
|
14
|
|
|
|
|
|
14
|
|
|
|
28
|
|
||||||||||||
|
Stock-based compensation expense
|
|
|
|
|
56
|
|
|
|
|
|
5
|
|
|
|
61
|
|
||||||||||||
|
Exercise of stock options
|
3
|
|
|
|
6
|
|
|
|
|
|
93
|
|
|
|
99
|
|
||||||||||||
|
Shares to cover employee payroll tax withholdings on stock issued under stock-based compensation plans
|
|
|
|
|
(21
|
)
|
|
|
|
|
|
|
|
|
(21
|
)
|
||||||||||||
|
Purchases of treasury stock
|
(3
|
)
|
|
|
|
|
|
|
|
|
(325
|
)
|
|
|
(325
|
)
|
||||||||||||
|
Contributions from noncontrolling interest partners
|
|
|
|
|
|
|
16
|
|
16
|
|
|
|||||||||||||||||
|
Reclassification of stranded tax effects resulting from enactment of the Tax Cuts and Jobs Act
|
|
|
|
2
|
|
(2
|
)
|
|
|
|
—
|
|
|
|||||||||||||||
|
Balance, December 31, 2018
|
135
|
|
$
|
2
|
|
$
|
2,667
|
|
$
|
7,602
|
|
$
|
(59
|
)
|
$
|
(4,996
|
)
|
$
|
51
|
|
$
|
5,267
|
|
$
|
77
|
|
||
The accompanying notes are an integral part of these statements.
F- 7
QUEST DIAGNOSTICS INCORPORATED AND SUBSIDIARIES
NOTES TO CONSOLIDATED FINANCIAL STATEMENTS
(in millions unless otherwise indicated)
1. DESCRIPTION OF BUSINESS
Background
Quest Diagnostics Incorporated and its subsidiaries ("Quest Diagnostics" or the "Company") empower people to take action to improve health outcomes. The Company uses its extensive database of clinical lab results to derive diagnostic insights that reveal new avenues to identify and treat disease, inspire healthy behaviors and improve healthcare management. The Company's diagnostic information services business ("DIS") provides information and insights based on the industry-leading menu of routine, non-routine and advanced clinical testing and anatomic pathology testing, and other diagnostic information services. The Company provides services to a broad range of customers, including patients, clinicians, hospitals, independent delivery networks ("IDNs"), health plans, employers and accountable care organizations ("ACOs"). The Company offers the broadest access in the United States to diagnostic information services through its nationwide network of laboratories, patient service centers and phlebotomists in physician offices and the Company's connectivity resources, including call centers and mobile paramedics, nurses and other health and wellness professionals. The Company is the world's leading provider of diagnostic information services. The Company provides interpretive consultation with one of the largest medical and scientific staffs in the industry and hundreds of M.D.s and Ph.D.s, many of whom are recognized leaders in their fields. The Company's Diagnostic Solutions ("DS") businesses are the leading provider of risk assessment services for the life insurance industry and offer healthcare organizations and clinicians robust information technology solutions.
2. SUMMARY OF SIGNIFICANT ACCOUNTING POLICIES
Principles of Consolidation
The consolidated financial statements include the accounts of all entities controlled by the Company through its direct or indirect ownership of a majority voting interest and the accounts of any variable interest entities ("VIEs") where the Company is subject to a majority of the risk of loss from the variable interest entity's activities, or entitled to receive a majority of the entity's residual returns, or both. The Company assesses the requirements related to the consolidation of VIEs, including a qualitative assessment of power and economics that considers which entity has the power to direct the activities that “most significantly impact” the VIEs' economic performance and has the obligation to absorb losses of, or the right to receive benefits that could be potentially significant to, the VIE. All significant intercompany accounts and transactions are eliminated in consolidation.
Income attributable to the minority interest in the Company's majority owned and controlled consolidated subsidiaries is recorded as net income attributable to noncontrolling interests in the consolidated statements of operations and the noncontrolling interest is reflected as a separate component of consolidated stockholders' equity.
Reclassifications
As a result of the adoption of the new accounting standard associated with clarifying presentation and classification in the statement of cash flows, certain reclassifications have been made to the prior period financial statements to conform to the current period presentation. In addition, the Company adopted the new revenue recognition accounting standard on a full retrospective basis, which requires the Company to restate certain previously reported results. For further details regarding the impact of these new accounting standards, see
New Accounting Standards
.
Equity Method Investments
Investments in entities which the Company does not control, but in which it has a substantial ownership interest (generally between
20%
and
49%
) and can exercise significant influence, are accounted for using the equity method of accounting. These investments are classified as investments in equity method investees in the consolidated balance sheets. The Company records its pro rata share of the earnings, adjusted for accretion of basis difference, of these investments in equity in earnings of equity method investees, net of taxes in the consolidated statements of operations. The Company reviews its investments in equity method investees for impairment whenever events or changes in circumstances indicate that the carrying amounts may not be recoverable.
F- 8
QUEST DIAGNOSTICS INCORPORATED AND SUBSIDIARIES
NOTES TO CONSOLIDATED FINANCIAL STATEMENTS – CONTINUED
(in millions unless otherwise indicated)
Use of Estimates
The preparation of financial statements in conformity with accounting principles generally accepted in the United States (“GAAP”) requires management to make estimates and assumptions that affect the reported amounts of assets and liabilities and disclosure of contingent assets and liabilities at the date of the financial statements and the reported amounts of revenues and expenses during the reporting period. Actual results could differ from those estimates.
Revenue Recognition
The Company primarily recognizes as revenue the amount that reflects the consideration to which it expects to be entitled in exchange for goods sold or services rendered upon completion of the testing process, when results are reported, or when services have been rendered (see Note 3). Net revenues from Medicare and Medicaid programs were approximately
16%
,
17%
and
17%
of the Company's consolidated net revenues for the years ended December 31, 2018, 2017 and 2016, respectively.
Taxes on Income
The provision for income taxes represents income taxes paid or payable for the current year plus the change in deferred taxes during the year. Current and deferred income taxes are measured based on the tax laws that are enacted as of the balance sheet date of the relevant reporting period. Deferred tax assets and liabilities are recognized for the expected future tax consequences of differences between the carrying amounts of assets and liabilities and their respective tax bases using tax rates in effect for the year in which the differences are expected to reverse. A valuation allowance is provided when it is more likely than not that some portion or all of the deferred tax assets will not be realized. The effect on deferred tax assets and liabilities of a change in tax rates is recognized in income in the period when the change is enacted. Tax benefits from uncertain tax positions are recognized only if the tax position is more likely than not to be sustained upon examination by taxing authorities based on the technical merits of the position.
Earnings Per Share
The Company's unvested restricted stock units that contain non-forfeitable rights to dividends are participating securities and, therefore, are included in the earnings allocation in computing earnings per share using the two-class method. Basic earnings per common share is calculated by dividing net income, adjusted for earnings allocated to participating securities, by the weighted average number of common shares outstanding. Diluted earnings per common share is calculated by dividing net income, adjusted for earnings allocated to participating securities, by the weighted average number of common shares outstanding after giving effect to all potentially dilutive common shares outstanding during the period. Potentially dilutive common shares include the dilutive effect of outstanding stock options and performance share units granted under the Company's Amended and Restated Employee Long-Term Incentive Plan (“ELTIP”) and its Amended and Restated Non-Employee Director Long-Term Incentive Plan (“DLTIP”). Earnings allocable to participating securities include the portion of dividends declared as well as the portion of undistributed earnings during the period allocable to participating securities.
Stock-Based Compensation
The Company measures stock-based compensation for equity awards at fair value on the date of grant and records stock-based compensation as a charge to earnings net of the estimated impact of forfeited awards. As such, the Company recognizes stock-based compensation cost
only for those stock-based awards that are estimated to ultimately vest over their requisite service period, based on the vesting provisions of the individual grants. The cumulative effect on current and prior periods of a change in the estimated forfeiture rate is recognized as compensation cost in earnings in the period of the change. The terms of the Company's performance share unit awards allow the recipients of such awards to earn a variable number of shares based on the achievement of the performance goals specified in the awards. Stock-based compensation expense associated with performance share units is recognized based on management's best estimates of the achievement of the performance goals specified in such awards and the resulting number of shares that will be earned. The cumulative effect on current and prior periods of a change in the estimated number of performance share units expected to be earned is recognized as compensation cost in earnings in the period of the change. The Company recognizes stock-based compensation expense related to the Company's Amended and Restated Employee Stock Purchase Plan (“ESPP”) based on the
15%
discount at purchase. For further details regarding stock-based compensation, see Note 17.
F- 9
QUEST DIAGNOSTICS INCORPORATED AND SUBSIDIARIES
NOTES TO CONSOLIDATED FINANCIAL STATEMENTS – CONTINUED
(in millions unless otherwise indicated)
Fair Value Measurements
The Company determines fair value measurements used in its consolidated financial statements based upon the exit price that would be received to sell an asset or paid to transfer a liability in an orderly transaction between market participants exclusive of any transaction costs, as determined by either the principal market or the most advantageous market.
Inputs used in the valuation techniques to derive fair values are classified based on a three-level hierarchy. The basis for fair value measurements for each level within the hierarchy is described below with Level 1 having the highest priority and Level 3 having the lowest.
Level 1: Quoted prices in active markets for identical assets or liabilities.
Level 2: Quoted prices for similar assets or liabilities in active markets; quoted prices for identical or similar instruments in markets that are not active; and model-derived valuations in which all significant inputs are observable in active markets.
Level 3: Valuations derived from valuation techniques in which one or more significant inputs are unobservable.
Foreign Currency
The Company predominately uses the U.S. dollar as its functional currency. The functional currency of the Company's foreign operating subsidiaries generally is the applicable local currency. Assets and liabilities denominated in non-U.S. dollars are translated into U.S. dollars at exchange rates as of the end of the reporting period. Income and expense items are translated at the average monthly exchange rates during the year. Resulting translation adjustments are recorded as a component of accumulated other comprehensive loss within stockholders' equity. Gains and losses from foreign currency transactions, which are denominated in a currency other than the functional currency, are included within other operating (income) expense, net in the consolidated statements of operations. Transaction gains and losses have historically not been material. The Company may be exposed to market risk for changes in foreign exchange rates primarily under certain intercompany receivables and payables. From time to time, the Company uses foreign exchange forward contracts to mitigate the exposure of the eventual net cash inflows or outflows resulting from these intercompany transactions. The Company's foreign exchange exposure is not material to the Company's consolidated financial condition. The Company does not hedge its net investment in non-U.S. subsidiaries because it views those investments as long-term in nature.
Cash and Cash Equivalents
Cash and cash equivalents include all highly-liquid investments with original maturities, at the time acquired by the Company, of three months or less.
Concentration of Credit Risk
Financial instruments that potentially subject the Company to concentrations of credit risk are principally cash, cash equivalents, short-term investments, accounts receivable and derivative financial instruments. The Company's policy is to place its cash, cash equivalents and short-term investments in highly-rated financial instruments and institutions. Concentration of credit risk with respect to accounts receivable is mitigated by the diversity of the Company's payers and their dispersion across many different geographic regions, and is limited to certain payers who are large buyers of the Company's services. To reduce risk, the Company routinely assesses the financial strength of these payers and, consequently, believes that its accounts receivable credit risk exposure, with respect to these payers, is limited. While the Company has receivables due from federal and state governmental agencies, the Company does not believe that such receivables represent a credit risk since the related healthcare programs are funded by federal and state governments, and payment is primarily dependent on submitting appropriate documentation. As of
December 31, 2018
and
2017
, receivables due from government payers under the Medicare and Medicaid programs represent approximately
13%
and
14%
, respectively, of the Company's consolidated net accounts receivable. The portion of the Company's accounts receivable due from patients comprises the largest portion of credit risk. As of both
December 31, 2018
and
2017
, receivables due from patients represent approximately
20%
of the Company's consolidated net accounts receivable. The Company applies assumptions and judgments including historical collection experience for assessing collectibility and determining net revenues and accounts receivable from patients.
F- 10
QUEST DIAGNOSTICS INCORPORATED AND SUBSIDIARIES
NOTES TO CONSOLIDATED FINANCIAL STATEMENTS – CONTINUED
(in millions unless otherwise indicated)
Accounts Receivable and Allowance for Doubtful Accounts
Accounts receivable are reported at realizable value, net of allowances for doubtful accounts, which are estimated and recorded in the period the related revenue is recorded. The Company has a standardized approach to estimate and review the collectibility of its receivables based on a number of factors, including the period they have been outstanding. Changes to the allowances for doubtful accounts estimates are recorded as an adjustment to bad debt expense within selling, general and administrative expenses in the consolidated statements of operations. Receivables deemed to be uncollectible are charged against the allowance for doubtful accounts at the time such receivables are written-off. Recoveries of receivables previously written-off are recorded as credits to the allowance for doubtful accounts.
Inventories
Inventories, which consist principally of finished goods testing supplies and reagents, are valued at the lower of cost (first in, first out method) and net realizable value.
Property, Plant and Equipment
Property, plant and equipment is recorded at cost. Major renewals and improvements are capitalized, while maintenance and repairs are expensed as incurred. Costs incurred for computer software developed or obtained for internal use are capitalized for application development activities and expensed as incurred for preliminary project activities and post-implementation activities. Capitalized costs include external direct costs of materials and services consumed in developing or obtaining internal-use software, payroll and payroll-related costs for employees who are directly associated with the internal-use software project, and interest costs incurred, when material, while developing internal-use software. Capitalization of such costs ceases when the project is substantially complete and ready for its intended purpose. Costs for maintenance and training are expensed as incurred. The Company capitalizes interest on borrowings during the active construction period of major capital projects. Capitalized interest is added to the cost of the underlying assets and is amortized over the expected useful lives of the assets. Depreciation and amortization are provided on the straight-line method over expected useful asset lives as of
December 31, 2018
as follows:
|
•
|
buildings and improvements, ranging up to
thirty-one and a half
years;
|
|
•
|
laboratory equipment and furniture and fixtures, ranging from
five
to
twelve
years;
|
|
•
|
leasehold improvements, the lesser of the useful life of the improvement or the remaining life of the building or lease, as applicable; and
|
|
•
|
computer software developed or obtained for internal use,
five
to
ten
years.
|
Goodwill
Goodwill represents the excess of the fair value of the acquiree (including the fair value of non-controlling interests) over the recognized bases of the net identifiable assets acquired and includes the future economic benefits from other assets that could not be individually identified and separately recognized. Goodwill is not amortized, but instead is periodically reviewed for impairment and an impairment charge is recorded in the periods in which the recorded carrying value of goodwill is more than its fair value.
The goodwill test is performed at least annually, or more frequently if events or changes in circumstances indicate that the asset might be impaired. The annual impairment test includes an option to perform a qualitative assessment of whether it is more likely than not that a reporting unit's fair value is less than its carrying value; the qualitative test may be performed prior to, or as an alternative to, performing a quantitative goodwill impairment test. If, after assessing the totality of events or circumstances, the Company determines that it is more likely than not that the fair value of a reporting unit is less than its carrying value, then the Company is required to perform the quantitative goodwill impairment test. Otherwise, no further analysis is required. Additionally, the Company's policy is to update the fair value calculation of its reporting units and perform the quantitative goodwill impairment test on a periodic basis.
The quantitative impairment test involves the comparison of the fair value of the reporting unit to its carrying value. The Company calculates the fair value of each reporting unit using either a discounted cash flows analysis that converts future cash flow amounts into a single discounted present value amount or a market approach. The Company assesses the valuation methodology based upon the relevance and availability of the data at the time that the valuation is performed. The Company
F- 11
QUEST DIAGNOSTICS INCORPORATED AND SUBSIDIARIES
NOTES TO CONSOLIDATED FINANCIAL STATEMENTS – CONTINUED
(in millions unless otherwise indicated)
compares the estimate of fair value for the reporting unit to the carrying value of the reporting unit. If the carrying value is greater than the estimate of fair value, an impairment loss will be recognized in the amount of the excess.
On a quarterly basis, the Company performs a review of its business to determine if events or changes in circumstances have occurred which could have a material adverse effect on the fair value of the Company and its goodwill. If such events or changes in circumstances were deemed to have occurred, the Company would perform an impairment test of goodwill as of the end of the quarter and record any noted impairment loss.
The Company performs its annual impairment test during the fourth quarter of the fiscal year. For the year ended
December 31, 2018
, the Company performed the qualitative assessment for its DIS and risk assessment services reporting units. Based on the totality of information available for the DIS and risk assessment services reporting units, the Company concluded that it was more likely than not that the estimated fair values were greater than the carrying values of the reporting units, and as such, no further analysis was required. For the year ended December 31, 2017, in accordance with its policy to perform the quantitative test on a periodic basis, the Company updated the fair value calculation of its reporting units, performed the quantitative impairment test and concluded that goodwill was not impaired.
Intangible Assets
Intangible assets are recognized at fair value, as an asset apart from goodwill if the asset arises from contractual or other legal rights, or if it is separable. Intangible assets, principally representing the cost of customer-related intangibles, non-competition agreements and technology acquired, are capitalized and amortized on the straight-line method over their expected useful life, which generally ranges from
five
to
twenty
years. Intangible assets with indefinite useful lives, consisting principally of acquired tradenames, are not amortized, but instead are periodically reviewed for impairment.
The Company reviews indefinite-lived intangible assets periodically for impairment and an impairment charge is recorded in the periods in which the recorded carrying value of indefinite-lived intangibles is more than its estimated fair value. The indefinite-lived intangible asset impairment test is performed at least annually, or more frequently in the case of other events that indicate a potential impairment.
Based upon the Company’s most recent annual impairment tests completed during the fourth quarter of the years ended
December 31, 2018
and
2017
, the Company concluded that indefinite-lived intangible assets were not impaired.
The Company reviews the recoverability of its long-lived assets (including amortizable intangible assets), other than goodwill and indefinite-lived intangible assets, when events or changes in circumstances occur that indicate that the carrying value of the asset may not be recoverable. Evaluation of possible impairment is based on the Company's ability to recover the asset from the expected future pre-tax cash flows (undiscounted and without interest charges) of the related operations. If the expected undiscounted pre-tax cash flows are less than the carrying amount of such asset, an impairment loss is recognized for the difference between the estimated fair value and carrying amount of the asset.
Investments
The Company's equity investments (except for those accounted for under the equity method of accounting), are included in other assets in the consolidated balance sheets and include:
|
•
|
Equity investments with readily determinable fair values which are comprised of participant-directed investments of deferred employee compensation and related Company matching contributions held in trusts pursuant to the Company's supplemental deferred compensation plans (see Note 17). These investments are measured at fair value with both realized and unrealized gains and losses recorded in current earnings as a component of non-operating expense within other (expense) income, net in the consolidated statement of operations. For the years ended
December 31, 2018
,
2017
and
2016
, gains and (losses) from these equity securities totaled
$(2) million
,
$8 million
, and
$3 million
, respectively. The carrying value of these investments, which are included in other assets on the consolidated balance sheet, were
$53 million
and
$58 million
at
December 31, 2018
and
2017
, respectively.
|
F- 12
QUEST DIAGNOSTICS INCORPORATED AND SUBSIDIARIES
NOTES TO CONSOLIDATED FINANCIAL STATEMENTS – CONTINUED
(in millions unless otherwise indicated)
|
•
|
Equity investments that do not have readily determinable fair values which consist of investments in preferred and common shares of privately held companies. These investments are measured at cost minus impairment, if any, plus or minus changes resulting from observable price changes. The Company regularly evaluates these equity investments to determine if there are any indicators that the investment is impaired; no impairment charges were recognized related to these investments for the years ended
December 31, 2018
,
2017
, and
2016
. The carrying value of these investments, which are included in other assets on the consolidated balance sheet, were
$10 million
and
$9 million
at
December 31, 2018
and
2017
, respectively.
|
Derivative Financial Instruments
The Company uses derivative financial instruments to manage its exposure to market risks for changes in interest rates and, from time to time, foreign currencies. This strategy includes the use of interest rate swap agreements, forward starting interest rate swap agreements, treasury lock agreements and foreign currency forward contracts to manage its exposure to movements in interest and currency rates. The Company has established policies and procedures for risk assessment and the approval, reporting and monitoring of derivative financial instrument activities. These policies prohibit holding or issuing derivative financial instruments for speculative purposes. The Company does not enter into derivative financial instruments that contain credit risk-related contingent features or requirements to post collateral.
Interest Rate Risk
The Company is exposed to interest rate risk on its cash and cash equivalents and its debt obligations. Interest income earned on cash and cash equivalents may fluctuate as interest rates change; however, due to their relatively short maturities, the Company does not hedge these assets or their investment cash flows and the impact of interest rate risk is not material. The Company's debt obligations consist of fixed-rate and variable-rate debt instruments. The Company's primary objective is to achieve the lowest overall cost of funding while managing the variability in cash outflows within an acceptable range. In order to achieve this objective, the Company has entered into interest rate swaps. Interest rate swaps involve the periodic exchange of payments without the exchange of underlying principal or notional amounts. Net settlements between the counterparties are recognized as an adjustment to interest expense, net.
The Company accounts for these derivatives as either an asset or liability measured at its fair value. The fair value is based upon model-derived valuations in which all significant inputs are observable in active markets and includes an adjustment for the credit risk of the obligor's non-performance. For a derivative instrument that has been formally designated as a fair value hedge, fair value gains or losses on the derivative instrument along with offsetting fair value gains or losses on the hedged item that are attributable to the risk being hedged are reported in other (expense) income, net in the consolidated statements of operations. For derivatives that have been formally designated as a cash flow hedge, the change in the fair value of the derivatives is recorded in accumulated other comprehensive loss. Upon maturity or early termination of an effective interest rate swap designated as a cash flow hedge, unrealized gains or losses are deferred in stockholders' equity, as a component of accumulated other comprehensive loss, and are amortized as an adjustment to interest expense over the period during which the hedged forecasted transaction affects earnings, which is when the Company recognizes interest expense on the hedged cash flows. At inception and quarterly thereafter, the Company formally assesses whether the derivatives that are used in hedging transactions are highly effective in offsetting changes in the fair value or cash flows of the hedged item. After the initial quantitative assessment, this analysis is performed on a qualitative basis and, if it is determined that the hedging relationship was and continues to be highly effective, no further analysis is required. All components of each derivative financial instrument's gain or loss are included in the assessment of hedge effectiveness. If it is determined that a derivative ceases to be a highly effective hedge, the Company discontinues hedge accounting and any deferred gains or losses related to a discontinued cash flow hedge shall continue to be reported in accumulated other comprehensive loss, unless it is probable that the forecasted transaction will not occur. If it is probable that the forecasted transaction will not occur by the originally specified time period, the Company discontinues hedge accounting, and any deferred gains or losses reported in accumulated other comprehensive loss are classified into earnings immediately.
Comprehensive Income (Loss)
Comprehensive income (loss) encompasses all changes in stockholders' equity (except those arising from transactions with stockholders) and includes:
|
•
|
Foreign currency translation adjustments;
|
F- 13
QUEST DIAGNOSTICS INCORPORATED AND SUBSIDIARIES
NOTES TO CONSOLIDATED FINANCIAL STATEMENTS – CONTINUED
(in millions unless otherwise indicated)
|
•
|
Net deferred loss on cash flow hedges, which represents deferred losses, net of tax on interest rate related derivative financial instruments designated as cash flow hedges, net of amounts reclassified to interest expense (see Note 16).
|
Prior to adoption of the new accounting guidance on recognition and measurement of financial assets and liabilities (see
New Accounting Standards)
, comprehensive income (loss) also included equity investment adjustments, which represented unrealized holding gains (losses), net of tax on available for sale securities, net of other-than-temporary impairment amounts reclassified to other (expense) income, net.
New Accounting Standards
Adoption of New Accounting Standards
On January 1, 2018, the Company adopted a new accounting standard issued by the Financial Accounting Standards Board ("FASB") on revenue recognition using the full retrospective method. This new accounting standard outlines a single comprehensive model to use in accounting for revenue arising from contracts with customers. This standard supersedes existing revenue recognition requirements and eliminates most industry-specific revenue recognition guidance from GAAP. The core principle of the revenue recognition standard is to require an entity to recognize as revenue the amount that reflects the consideration to which it expects to be entitled in exchange for goods or services as it transfers control to its customers. As a result of the Company's adoption of this standard, the majority of the amounts that were historically classified as bad debt expense, primarily related to patient responsibility, are now considered an implicit price concession in determining net revenues. Accordingly, the Company reports uncollectible balances associated with patient responsibility as a reduction of the transaction price and therefore as a reduction in net revenues when historically these amounts were classified as bad debt expense within selling, general and administrative expenses. In addition, the adoption of this new accounting standard resulted in increased disclosure, including qualitative and quantitative disclosures about the nature, amount, timing and uncertainty of revenue and cash flows arising from contracts with customers. For further details, see Note 3.
Adoption of the standard impacted the Company's previously reported results as follows:
|
As Previously Reported
|
Adjustment for New Accounting Standard on Revenue Recognition
|
As Restated
|
|||||||||
|
Year Ended December 31, 2017
|
|||||||||||
|
Consolidated Statements of Operations:
|
|||||||||||
|
Net revenues
|
$
|
7,709
|
|
$
|
(307
|
)
|
$
|
7,402
|
|
||
|
Selling, general and administrative expenses
|
$
|
1,750
|
|
$
|
(307
|
)
|
$
|
1,443
|
|
||
|
Net income attributable to Quest Diagnostics
|
$
|
772
|
|
$
|
—
|
|
$
|
772
|
|
||
|
Consolidated Statements of Cash Flows:
|
|||||||||||
|
Provision for doubtful accounts
|
$
|
315
|
|
$
|
(307
|
)
|
$
|
8
|
|
||
|
Changes in operating assets and liabilities:
|
|||||||||||
|
Accounts receivable
|
$
|
(298
|
)
|
$
|
307
|
|
$
|
9
|
|
||
F- 14
QUEST DIAGNOSTICS INCORPORATED AND SUBSIDIARIES
NOTES TO CONSOLIDATED FINANCIAL STATEMENTS – CONTINUED
(in millions unless otherwise indicated)
|
As Previously Reported
|
Adjustment for New Accounting Standard on Revenue Recognition
|
As Restated
|
|||||||||
|
Year Ended December 31, 2016
|
|||||||||||
|
Consolidated Statements of Operations:
|
|||||||||||
|
Net revenues
|
$
|
7,515
|
|
$
|
(301
|
)
|
$
|
7,214
|
|
||
|
Selling, general and administrative expenses
|
$
|
1,681
|
|
$
|
(301
|
)
|
$
|
1,380
|
|
||
|
Net income attributable to Quest Diagnostics
|
$
|
645
|
|
$
|
—
|
|
$
|
645
|
|
||
|
Consolidated Statements of Cash Flows:
|
|||||||||||
|
Provision for doubtful accounts
|
$
|
308
|
|
$
|
(301
|
)
|
$
|
7
|
|
||
|
Changes in operating assets and liabilities:
|
|||||||||||
|
Accounts receivable
|
$
|
(343
|
)
|
$
|
301
|
|
$
|
(42
|
)
|
||
|
Balance, December 31, 2017
|
|||||||||||
|
Consolidated Balance Sheets:
|
|||||||||||
|
Accounts receivable
|
$
|
1,193
|
|
$
|
(256
|
)
|
$
|
937
|
|
||
|
Allowance for doubtful accounts
|
$
|
269
|
|
$
|
(256
|
)
|
$
|
13
|
|
||
|
Accounts receivable, net of allowance for doubtful accounts
|
$
|
924
|
|
$
|
—
|
|
$
|
924
|
|
||
On January 1, 2018, the Company adopted a new accounting standard issued by the FASB on the recognition and measurement of financial assets and financial liabilities. This new accounting standard requires that all equity investments (except those accounted for under the equity method of accounting or those that result in consolidation of the investee) be measured at fair value with changes in fair value recognized in net income. However, companies may elect to measure equity investments that do not have readily determinable fair values at cost minus impairment, if any, plus or minus changes resulting from observable price changes in orderly transactions for the identical or a similar investment of the same issuer. In addition, the new accounting standard eliminated the requirement to disclose the method and significant assumptions used to estimate the fair value for financial instruments measured at amortized cost on the balance sheet. The standard was adopted on a modified retrospective basis with amounts reported in accumulated other comprehensive income associated with equity securities previously classified as held for sale reclassified to retained earnings upon adoption. The adoption of this standard did not have a material impact on the Company's results of operations, financial position, or cash flows.
On January 1, 2018, the Company adopted two new accounting standards issued by the FASB that clarify presentation and classification in the statement of cash flows on a retrospective basis. As a result of adoption:
|
•
|
Amounts generally described as restricted cash and restricted cash equivalents are now presented with cash and cash equivalents when reconciling the beginning-of-period and end-of-period total amounts shown on the statement of cash flows. As a result of adoption, there was no impact to cash flows from operating, investing or financing activities for the year ended
December 31, 2018
. For the year ended December 31, 2016, proceeds from the disposition of business within cash flows from investing activities now includes
$25 million
of proceeds associated with the sale of the Focus Diagnostics products business which were initially held in escrow and included in restricted cash. The receipt of the escrow proceeds, which was previously reported as a cash inflow from investing activities for the year ended
December 31, 2017
, is no longer presented within the net change in cash and cash equivalents and restricted cash for 2017 as it is included in the beginning-of-period balance of restricted cash. Refer to Note 7 to the consolidated financial statements for more information regarding the disposition of the Focus Diagnostics products business.
|
|
•
|
The classification of how certain cash receipts and payments are presented within the statement of cash flows has been clarified. As a result, the payment of debt extinguishment costs and the repayment of original issue debt discount of
$43 million
and
$4 million
, respectively, for the year ended December 31, 2016 are now presented as a financing cash outflow in the consolidated statement of cash flows for the year ended
|
F- 15
QUEST DIAGNOSTICS INCORPORATED AND SUBSIDIARIES
NOTES TO CONSOLIDATED FINANCIAL STATEMENTS – CONTINUED
(in millions unless otherwise indicated)
December 31, 2016 whereas they were previously presented as an operating cash outflow. There were no debt retirement costs for the years ended December 31, 2018 and 2017.
On January 1, 2018, the Company adopted a new accounting standard issued by the FASB that provides a framework for evaluating whether a transaction should be accounted for as an acquisition (or disposal) of assets or a business. If an entity determines that substantially all of the fair value of the gross assets acquired is concentrated in a single identifiable asset or a group of similar identifiable assets, then the set of transferred assets and activities is not a business. If this threshold is not met, in order to be considered a business the set of transferred assets and activities must include, at a minimum, an input and a substantive process that together significantly contribute to the ability to create outputs. The adoption of this standard, which was done on a prospective basis, will require future transactions to be evaluated under the new framework.
On April 1, 2018, the Company elected to adopt a new accounting standard issued by the FASB to reclassify stranded tax effects resulting from enactment of the Tax Cuts and Jobs Act ("TCJA") from accumulated other comprehensive income to retained earnings. The adoption of this standard did not have a material impact on the Company's results of operations, financial position or cash flows.
New Accounting Standards To Be Adopted
In October 2018, the FASB issued an Accounting Standard Update (“ASU”) that allows the Company to include the Overnight Index Swap Rate based on the Secured Overnight Financing Rate as an additional benchmark interest rate for hedge accounting purposes. This ASU is effective for the Company in the first quarter of 2019 with early adoption permitted and will be applied prospectively for new or redesignated hedges entered into after the adoption date. Adoption of this standard is not expected to have a material impact on the Company’s results of operations, financial position and cash flows.
In August 2018, the FASB issued an ASU that aligns the requirements for deferring implementation costs incurred in a cloud computing arrangement that is a service contract with the requirements for capitalizing implementation costs incurred to develop or obtain internal-use software. This ASU is effective for the Company in the first quarter of 2020 with early adoption permitted and can be applied either retrospectively or prospectively to all implementation costs incurred after the date of adoption. The Company is currently assessing the impact of the adoption of this ASU on the Company’s results of operations, financial position and cash flows.
In February 2016, the FASB issued an ASU that amends accounting for leases. Under the new guidance, a lessee will recognize assets and liabilities for most leases on its balance sheet but will recognize expense on its statement of operations similar to current lease accounting. The ASU is effective for the Company in the first quarter of 2019 with early adoption permitted. As a result of the adoption of the new standard the Company expects to record additional lease assets and lease liabilities of approximately
$500 million
as of January 1, 2019 with respect to the Company's operating leases. Accounting for the Company's finance leases will remain substantially unchanged. Additionally, the standard will not materially impact the Company's results of operations or cash flows. In July 2018, the FASB issued an ASU to provide an additional transition method to adopt the guidance by allowing entities to initially apply the new lease standard at the adoption date and recognize a cumulative effect to the opening balance of retained earnings, which the Company plans to elect. The Company will also elect the package of practical expedients, which among other things will allow the Company to carrying forward its historical lease classification.
In June 2016, the FASB issued an ASU that changes the impairment model for most financial instruments, including trade receivables, from an incurred loss method to a new forward-looking approach, based on expected losses. The estimate of expected credit losses will require entities to incorporate considerations of historical information, current information and reasonable and supportable forecasts. This ASU is effective for the Company in the first quarter of 2020 and must be adopted using a modified retrospective transition approach. The Company is currently assessing the impact of the adoption of this ASU on the Company’s results of operations, financial position and cash flows.
F- 16
QUEST DIAGNOSTICS INCORPORATED AND SUBSIDIARIES
NOTES TO CONSOLIDATED FINANCIAL STATEMENTS – CONTINUED
(in millions unless otherwise indicated)
3. REVENUE RECOGNITION
DIS
Net revenues in the Company’s DIS business accounted for approximately
95%
of the Company’s total net revenues for the years ended
December 31, 2018
,
2017
and
2016
and are primarily comprised of a high volume of relatively low-dollar transactions. The DIS business, which provides clinical testing services and other services, satisfies its performance obligation and recognizes revenues upon completion of the testing process, when results are reported, or when services have been rendered. The Company estimates the amount of consideration it expects to be entitled to receive from customer groups, determined using the portfolio approach, in exchange for providing services. These estimates include the impact of contractual allowances, including payer denials, and price concessions, as discussed below. The portfolios determined using the portfolio approach consist of the following groups of customers: healthcare insurers, government payers, client payers and patients. Contracts with customers in the DIS business do not contain significant financing components based on the typical period of time between performance of services and collection of consideration.
The process for estimating revenues and the ultimate collection of accounts receivable involves significant judgment and estimation. The Company follows a standard process, which considers historical denial and collection experience and other factors, to estimate contractual allowances and implicit price concessions, recording adjustments in the current period as changes in estimates. Further adjustments to the allowances, based on actual receipts, may be recorded upon settlement. Based on this process, during the fourth quarter of 2018, the Company increased its reserves for revenues and accounts receivable by approximately
$35 million
due to an increase in denials and a shift toward higher patient responsibility throughout the year.
The following are descriptions of the DIS business’ portfolios:
Healthcare Insurers
Reimbursements from healthcare insurers are based on negotiated fee-for-service schedules and on capitated payment rates. Under fee-for-service arrangements, healthcare insurers are billed at the Company's list price. Net revenues recognized consist of amounts billed net of contractual allowances for differences between amounts billed and the estimated consideration the Company expects to receive from such payers, which considers historical denial and collection experience and the terms of the Company’s contractual arrangements.
Collection of the Company's net revenues from healthcare insurers is normally a function of providing complete and correct billing information to the healthcare insurers within the various filing deadlines and generally occurs within
30
to
60
days of billing. Provided the Company has billed healthcare insurers accurately with complete information prior to the established filing deadline, there has historically been little to no credit risk. If there has been a delay in billing, the Company determines if the amounts in question will likely go past the filing deadline, and if so, it will reserve accordingly for the billing.
Under capitated arrangements with healthcare insurers, the Company recognizes revenue based on a predetermined monthly reimbursement rate for each member of an insurer's health plan regardless of the number or cost of services provided by the Company. Healthcare insurers typically reimburse the Company under capitated arrangements in the same month services are performed, essentially giving rise to no outstanding accounts receivable at the end of a reporting period. If any capitated payments are not received on a timely basis, the Company determines the cause and makes a separate determination as to whether or not the collection of the amount from the healthcare insurer is at risk and, if so, would reserve accordingly.
Government Payers
Reimbursements from government payers are based on fee-for-service schedules set by governmental authorities, including traditional Medicare and Medicaid. Net revenues recognized consist of amounts billed net of contractual allowances for differences between amounts billed and the estimated consideration the Company expects to receive from such payers, which considers historical denial and collection experience and other factors.
Collection of the Company's net revenues from government payers is normally a function of providing the complete and correct billing information within the various filing deadlines and generally occurs within
30
days of billing. Provided the Company has billed government payers accurately with complete information prior to the established filing deadline, there has
F- 17
QUEST DIAGNOSTICS INCORPORATED AND SUBSIDIARIES
NOTES TO CONSOLIDATED FINANCIAL STATEMENTS – CONTINUED
(in millions unless otherwise indicated)
historically been little to no credit risk. If there has been a delay in billing, the Company determines if the amounts in question will likely go past the filing deadline, and, if so, it will reserve for the billing accordingly.
Client Payers
Client payers include physicians, hospitals, ACOs, IDNs, employers, other commercial laboratories and institutions for which services are performed on a wholesale basis, and are billed based on negotiated fee schedules. Credit risk and ability to pay are more of a consideration for these payers than healthcare insurers and government payers. Collection of consideration the Company expects to receive generally occurs within
60
to
90
days of billing.
Patients
Uninsured patients are billed based on established patient fee schedules or fees negotiated with physicians on behalf of their patients. Insured patients (includes coinsurance and deductible responsibilities) are billed based on fees negotiated with healthcare insurers. Collection of billings from patients is subject to credit risk and ability of the patients to pay. Net revenues consist of amounts billed net of discounts provided to uninsured patients in accordance with the Company’s policies and implicit price concessions. Implicit price concessions represent differences between amounts billed and the estimated consideration the Company expects to receive from patients, which considers historical collection experience and other factors including current market conditions. Patient billings are generally fully reserved for when the related billing reaches
210
days outstanding. Balances are automatically written off when they are sent to collection agencies. Allowances are further adjusted for estimated recoveries of amounts sent to collection agencies based on historical collection experience, which is regularly monitored. Collection of consideration the Company expects to receive generally occurs within
30
to
60
days of billing.
DS
The Company’s DS businesses primarily satisfy their performance obligations and recognize revenues when delivery has occurred or services have been rendered. Collection of consideration the Company expects to receive generally occurs within
30
to
60
days of billing.
The approximate percentage of net revenue by type of customer was as follows:
|
Twelve Months Ended December 31,
|
|||||||||
|
2018
|
2017
|
2016
|
|||||||
|
Healthcare insurers:
|
|||||||||
|
Fee-for-service
|
32
|
%
|
34
|
%
|
34
|
%
|
|||
|
Capitated
|
3
|
|
3
|
|
4
|
|
|||
|
Total healthcare insurers
|
35
|
|
37
|
|
38
|
|
|||
|
Government payers
|
16
|
|
17
|
|
17
|
|
|||
|
Client payers
|
32
|
|
30
|
|
29
|
|
|||
|
Patient
|
13
|
|
12
|
|
11
|
|
|||
|
Total DIS
|
96
|
|
96
|
|
95
|
|
|||
|
DS
|
4
|
|
4
|
|
5
|
|
|||
|
Net revenues
|
100
|
%
|
100
|
%
|
100
|
%
|
|||
For the years ended
December 31, 2018
,
2017
and
2016
, substantially all of the Company’s services were provided within the United States, see Note 19.
F- 18
QUEST DIAGNOSTICS INCORPORATED AND SUBSIDIARIES
NOTES TO CONSOLIDATED FINANCIAL STATEMENTS – CONTINUED
(in millions unless otherwise indicated)
4. EARNINGS PER SHARE
The computation of basic and diluted earnings per common share is as follows (in millions, except per share data):
|
|
2018
|
2017
|
2016
|
||||||||
|
Amounts attributable to Quest Diagnostics’ common stockholders:
|
|
|
|
|
|||||||
|
Net income attributable to Quest Diagnostics
|
$
|
736
|
|
$
|
772
|
|
$
|
645
|
|
||
|
Less: Earnings allocated to participating securities
|
3
|
|
3
|
|
3
|
|
|||||
|
Earnings available to Quest Diagnostics’ common stockholders – basic and diluted
|
$
|
733
|
|
$
|
769
|
|
$
|
642
|
|
||
|
Weighted average common shares outstanding – basic
|
136
|
|
137
|
|
140
|
|
|||||
|
Effect of dilutive securities:
|
|
|
|
|
|||||||
|
Stock options and performance share units
|
3
|
|
3
|
|
2
|
|
|||||
|
Weighted average common shares outstanding – diluted
|
139
|
|
140
|
|
142
|
|
|||||
|
Earnings per share attributable to Quest Diagnostics’ common stockholders:
|
|
|
|
|
|||||||
|
Basic
|
$
|
5.39
|
|
$
|
5.63
|
|
$
|
4.58
|
|
||
|
Diluted
|
$
|
5.29
|
|
$
|
5.50
|
|
$
|
4.51
|
|
||
The following securities were not included in the calculation of diluted earnings per share due to their antidilutive effect:
|
2018
|
2017
|
2016
|
||||||
|
Stock options
|
2
|
|
2
|
|
1
|
|
||
5. RESTRUCTURING ACTIVITIES
Invigorate Program
The Company is committed to a program called Invigorate which is designed to reduce its cost structure and improve performance. Invigorate consists of several flagship programs, with structured plans in each, to drive savings and improve performance across the customer value chain. These flagship programs include: organization excellence; information technology excellence; procurement excellence; service excellence; lab excellence; and billing excellence. In addition to these programs, the Company identified key themes to change how it operates including reducing denials and patient concessions; further digitizing the business; standardization and automation; and optimization initiatives in the areas of lab network and patient service center network. The Invigorate program is intended to partially offset reimbursement pressures and labor and benefit cost increases; free up additional resources to invest in science, innovation and other growth initiatives; and enable the Company to improve service quality and operating profitability.
Restructuring Charges
The following table provides a summary of the Company's pre-tax restructuring charges for the years ended
December 31, 2018
,
2017
and
2016
:
|
2018
|
2017
|
2016
|
|||||||||
|
Employee separation costs
|
$
|
45
|
|
$
|
29
|
|
$
|
9
|
|
||
|
Facility-related costs
|
4
|
|
1
|
|
2
|
|
|||||
|
Asset impairment charges
|
2
|
|
3
|
|
—
|
|
|||||
|
Total restructuring charges
|
$
|
51
|
|
$
|
33
|
|
$
|
11
|
|
||
F- 19
QUEST DIAGNOSTICS INCORPORATED AND SUBSIDIARIES
NOTES TO CONSOLIDATED FINANCIAL STATEMENTS – CONTINUED
(in millions unless otherwise indicated)
The restructuring charges incurred for the years ended
December 31, 2018
, 2017 and 2016 were primarily associated with various workforce reduction initiatives as the Company continued to simplify and restructure its organization. Of the total restructuring charges incurred during the year ended
December 31, 2018
,
$22 million
and
$29 million
were recorded in cost of services and selling, general and administrative expenses, respectively. Of the total restructuring charges incurred during the year ended
December 31, 2017
,
$11 million
and
$22 million
were recorded in cost of services and selling, general and administrative expenses, respectively. Of the total restructuring charges incurred during the year ended
December 31, 2016
,
$6 million
and
$5 million
were recorded in cost of services and selling, general and administrative expenses, respectively.
Charges for all periods presented were primarily recorded in the Company's DIS business.
The following table summarizes the activity of the restructuring liability as of December 31, 2018 and 2017, which is included in accrued expenses in Note 13:
|
Employee Separation Costs
|
Facility-Related Costs
|
Total
|
|||||||||
|
Balance, December 31, 2016
|
$
|
6
|
|
$
|
3
|
|
$
|
9
|
|
||
|
Income statement expense
|
29
|
|
1
|
|
30
|
|
|||||
|
Cash payments
|
(14
|
)
|
(3
|
)
|
(17
|
)
|
|||||
|
Balance, December 31, 2017
|
21
|
|
1
|
|
22
|
|
|||||
|
Income statement expense
|
45
|
|
4
|
|
49
|
|
|||||
|
Cash payments
|
(29
|
)
|
(4
|
)
|
(33
|
)
|
|||||
|
Balance, December 31, 2018
|
$
|
37
|
|
$
|
1
|
|
$
|
38
|
|
||
6.
BUSINESS ACQUISITIONS
2018 Acquisitions
During 2018, the Company completed acquisitions for an aggregate purchase price of
$440 million
, net of cash acquired, including the acquisitions discussed below. The 2018 acquisitions resulted in goodwill of
$228 million
, of which
$190 million
is deductible for tax purposes. These acquisitions also resulted in
$178 million
of intangible assets, principally comprised of customer-related intangibles. Net revenues attributable to the 2018 acquisitions were
$84 million
for the year ended December 31, 2018.
Acquisition of Mobile Medical Examination Services, LLC.
On February 1, 2018, the Company completed its acquisition of Mobile Medical Examination Services, LLC. ("MedXM"), in an all cash transaction for
$142 million
, net of
$5 million
cash acquired, which consisted of cash consideration of
$130 million
and contingent consideration estimated at
$12 million
. The contingent consideration arrangement is dependent upon the achievement of certain revenue targets. Subsequent to the acquisition, the estimated fair value of the contingent consideration was reduced to
$0
as a result of updated revenue forecasts for 2018 compared to the earn-out revenue target included in the contingent consideration arrangement, resulting in a
$12 million
net gain recorded in other operating (income) expense, net. MedXM is a leading national provider of home-based health risk assessments and related services. Through the acquisition, the Company acquired all of MedXM's operations. The assets acquired and liabilities assumed consist of
$77 million
of intangible assets,
$57 million
of goodwill (of which
$45 million
is tax deductible),
$7 million
of working capital and
$1 million
of property, plant and equipment. The intangible assets consist primarily of customer related assets which are being amortized over a useful life of
15 years
. For further details regarding the fair value of the contingent consideration, see Note 8.
Acquisition of the Outreach Laboratory Service Business of Cape Cod Healthcare, Inc.
On June 18, 2018, the Company completed the acquisition of the outreach laboratory service business of Cape Cod Healthcare, Inc., in an all cash transaction for
$35 million
. The assets acquired principally consist of tax deductible goodwill and customer-related intangible assets.
F- 20
QUEST DIAGNOSTICS INCORPORATED AND SUBSIDIARIES
NOTES TO CONSOLIDATED FINANCIAL STATEMENTS – CONTINUED
(in millions unless otherwise indicated)
Acquisition of ReproSource, Inc.
On September 19, 2018, the Company completed the acquisition of ReproSource, Inc. ("ReproSource"), in an all cash transaction for
$35 million
, which consisted of cash consideration of
$30 million
and contingent consideration estimated at
$5 million
. The contingent consideration arrangement is dependent upon the achievement of certain revenue targets. ReproSource is a national leader in specialty fertility diagnostic services. Through the acquisition, the Company acquired all of ReproSource's operations. Based on the preliminary purchase price allocation, the assets acquired principally consist of goodwill, technology-related intangible assets and customer-related intangible assets. For further details regarding the fair value of the contingent consideration, see Note 8.
Acquisition of the U.S. Laboratory Service Business of Oxford Immunotec, Inc.
On November 6, 2018, the Company completed the acquisition of all of the operations of the U.S. laboratory service business of Oxford Immunotec, Inc. ("Oxford"), in an all cash transaction for
$170 million
, net of
$1 million
cash acquired. The acquisition included laboratories in Tennessee and Massachusetts that provide tuberculosis and tick-borne disease testing services. As part of the transaction, Oxford will sell test kits and related accessories to the Company under a long-term supply agreement. Based on the preliminary purchase price allocation, the assets acquired and liabilities assumed consist of $
54 million
of intangible assets,
$99 million
of tax deductible goodwill,
$12 million
of working capital and
$5 million
of property, plant and equipment. The intangible assets consist primarily of customer-related and contract-related assets which are being amortized over a useful life of
15
years and
5
years, respectively.
2017 Acquisitions
During 2017, the Company completed acquisitions for an aggregate purchase price of
$587 million
, net of cash acquired, including the acquisitions discussed below. The 2017 acquisitions resulted in goodwill of
$335 million
, of which
$273 million
is deductible for tax purposes. These acquisitions also resulted in
$242 million
of intangible assets, principally comprised of customer-related intangibles.
Acquisition of the Outreach Laboratory Service Business of PeaceHealth Laboratories
On May 1, 2017, the Company completed the acquisition of the outreach laboratory service business of PeaceHealth Laboratories ("PHL"), in an all cash transaction for
$101 million
. PHL is a healthcare system in Oregon, Washington and Alaska. The assets acquired principally consist of
$71 million
of tax deductible goodwill and
$30 million
of customer-related intangible assets. The intangible assets are being amortized over a useful life of
15
years.
Acquisition of Med Fusion, LLC and Clearpoint Diagnostic Laboratories, LLC
On July 14, 2017, the Company completed the acquisitions of Med Fusion, LLC and Clearpoint Diagnostic Laboratories, LLC ("Med Fusion"), in an all cash transaction for
$150 million
. Through the acquisition, the Company acquired all of Med Fusion's operations. Med Fusion provides precision medicine diagnostics to aid cancer treatment nationwide and the acquired businesses form the Company's center of excellence in precision diagnostics for oncology. The assets acquired principally consist of
$84 million
of customer-related intangible assets,
$64 million
of goodwill (of which
$62 million
is tax deductible) and
$31 million
of property, plant and equipment. The liabilities assumed principally consist of a
$28 million
capital lease obligation. The intangible assets are being amortized over a useful life of
15
years.
Acquisition of the Outreach Laboratory Service Business of The William W. Backus Hospital and The Hospital of Central Connecticut
On September 28, 2017, the Company completed the acquisition of the outreach laboratory service businesses of two hospitals of Hartford HealthCare Corporation ("HHC"), The William W. Backus Hospital and The Hospital of Central Connecticut, in an all cash transaction for
$30 million
. The assets acquired principally consist of tax deductible goodwill and customer-related intangible assets.
F- 21
QUEST DIAGNOSTICS INCORPORATED AND SUBSIDIARIES
NOTES TO CONSOLIDATED FINANCIAL STATEMENTS – CONTINUED
(in millions unless otherwise indicated)
Acquisition of Cleveland HeartLab, Inc.
On December 1, 2017, the Company completed the acquisition of Cleveland HeartLab, Inc. ("CHL") in an all cash transaction for
$94 million
, net of
$12 million
cash acquired. CHL is a specialty clinical laboratory and disease management company, which forms the basis for the Company’s advanced diagnostics center of excellence in cardiovascular testing. Through the acquisition, the Company acquired all of CHL's operations. The assets acquired and liabilities assumed consist of
$55 million
of goodwill (of which
$1 million
is tax deductible),
$32 million
of intangible assets,
$11 million
of deferred tax assets associated with acquired net operating losses,
$11 million
of deferred tax liabilities primarily associated with acquired intangible assets,
$4 million
of working capital and
$3 million
of property, plant and equipment. The intangible assets consist primarily of customer related assets which are being amortized over a useful life of
15
years.
Acquisition of the Clinical and Anatomic Pathology Laboratory Business of Shiel Holdings, LLC
On December 7, 2017, the Company completed the acquisition of
ce
rtain assets of the clinical and anatomic pathology laboratory business of Shiel Holdings, LLC ("Shiel") in an all cash transaction for
$176 million
, which consisted of cash consideration of
$170 million
and contingent consideration estimated at
$6 million
. The contingent consideration arrangement is dependent upon the achievement of certain testing volume benchmarks. Shiel serves the New York-New Jersey metropolitan area. The assets acquired principally consist of
$106 million
of goodwill (of which
$100 million
is tax deductible) and
$70 million
of customer-related intangible assets. The intangible assets are being amortized over a useful life of
15
years. For further details regarding the fair value of the contingent consideration, see Note 8.
2016 Acquisitions
During 2016, the Company completed acquisitions for an aggregate purchase price of
$139 million
, including the acquisition of the outreach laboratory service business of Clinical Laboratory Partners, LLC discussed below. The 2016 acquisitions resulted in goodwill of
$95 million
, all of which is deductible for tax purposes. These acquisitions also resulted in
$44 million
of intangible assets, principally comprised of customer-related intangibles.
Acquisition of the Outreach Laboratory Service Business of Clinical Laboratory Partners, LLC
On February 29, 2016, the Company completed the acquisition of the outreach laboratory service business of Clinical Laboratory Partners, LLC ("CLP"), a wholly-owned subsidiary of HHC, in an all cash transaction for
$135 million
. CLP provides clinical testing services to physicians, hospitals, clinics and long-term care facilities in Connecticut. The assets acquired principally consist of
$91 million
of tax deductible goodwill and
$43 million
of customer-related intangible assets, which are being amortized over a useful life of
15
years.
General Information
The acquisitions described above were accounted for under the acquisition method of accounting. As such, the assets acquired and liabilities assumed are recorded based on their estimated fair values as of the closing date. Supplemental pro forma combined financial information has not been presented as the impact of the acquisitions is not material to the Company's consolidated financial statements. The goodwill recorded primarily includes the expected synergies resulting from combining the operations of the acquired entities with those of the Company and the value associated with an assembled workforce and other intangible assets that do not qualify for separate recognition. All of the goodwill acquired in connection with these acquisitions has been allocated to the Company's DIS business. For further details regarding business segment information, see Note 19.
F- 22
QUEST DIAGNOSTICS INCORPORATED AND SUBSIDIARIES
NOTES TO CONSOLIDATED FINANCIAL STATEMENTS – CONTINUED
(in millions unless otherwise indicated)
7. DISPOSITIONS
Sale of Focus Diagnostics Products
On March 29, 2016, the Company entered into a definitive agreement to sell the assets of its non-core Focus Diagnostics products business ("Focus Diagnostics") to DiaSorin S.p.A. ("DiaSorin"). On May 13, 2016, the Company completed the sale of Focus Diagnostics for
$300 million
in cash, or
$293 million
net of transaction costs and working capital adjustments, which included
$25 million
of proceeds which were initially held in escrow and received in 2017. For the year ended December 31, 2016, the Company recorded a
$118 million
pre-tax gain on disposition of business. The Company also recorded income tax expense of
$84 million
, consisting of
$91 million
of current income tax expense (all of which was paid in 2016) and a deferred income tax benefit of
$7 million
. The income tax expense resulted in an effective tax rate of
71.4%
, which was significantly in excess of the statutory tax rate primarily due to a lower tax basis in the assets sold, specifically the goodwill associated with the disposition.
The assets disposed of consisted of
$113 million
of goodwill,
$30 million
of intangible assets, with the remaining
$38 million
consisting of accounts receivable, inventories and property, plant and equipment. In addition, the disposition included liabilities of
$6 million
.
In connection with the sale, the Company entered into a
five
year supply agreement with DiaSorin. The supply agreement, which does not include a minimum purchase commitment, enables the Company to purchase certain products and supplies used in its DIS business.
Focus Diagnostics, prior to May 13, 2016, was included in all other operating segments and has not been classified as a discontinued operation. For further details regarding business segment information, see Note 19.
F- 23
QUEST DIAGNOSTICS INCORPORATED AND SUBSIDIARIES
NOTES TO CONSOLIDATED FINANCIAL STATEMENTS – CONTINUED
(in millions unless otherwise indicated)
8. FAIR VALUE MEASUREMENTS
Assets and Liabilities Measured at Fair Value on a Recurring Basis
The following table provides a summary of the recognized assets and liabilities that are measured at fair value on a recurring basis:
|
Basis of Fair Value Measurements
|
|||||||||||||||
|
Total
|
Level 1
|
Level 2
|
Level 3
|
||||||||||||
|
December 31, 2018
|
|||||||||||||||
|
Assets:
|
|
|
|
|
|
|
|
|
|||||||
|
Trading securities
|
$
|
53
|
|
$
|
53
|
|
$
|
—
|
|
$
|
—
|
|
|||
|
Cash surrender value of life insurance policies
|
34
|
|
—
|
|
34
|
|
—
|
|
|||||||
|
Total
|
$
|
87
|
|
$
|
53
|
|
$
|
34
|
|
$
|
—
|
|
|||
|
Liabilities:
|
|
|
|
|
|
|
|
|
|||||||
|
Deferred compensation liabilities
|
$
|
96
|
|
$
|
—
|
|
$
|
96
|
|
$
|
—
|
|
|||
|
Interest rate swaps
|
93
|
|
—
|
|
93
|
|
—
|
|
|||||||
|
Contingent consideration
|
14
|
|
—
|
|
—
|
|
14
|
|
|||||||
|
Total
|
$
|
203
|
|
$
|
—
|
|
$
|
189
|
|
$
|
14
|
|
|||
|
December 31, 2017
|
|||||||||||||||
|
Assets:
|
|
|
|
|
|
||||||||||
|
Trading securities
|
$
|
58
|
|
$
|
58
|
|
$
|
—
|
|
$
|
—
|
|
|||
|
Cash surrender value of life insurance policies
|
37
|
|
—
|
|
37
|
|
—
|
|
|||||||
|
Equity securities
|
2
|
|
2
|
|
—
|
|
—
|
|
|||||||
|
Total
|
$
|
97
|
|
$
|
60
|
|
$
|
37
|
|
$
|
—
|
|
|||
|
Liabilities:
|
|
|
|
|
|
|
|
|
|||||||
|
Deferred compensation liabilities
|
$
|
103
|
|
$
|
—
|
|
$
|
103
|
|
$
|
—
|
|
|||
|
Interest rate swaps
|
89
|
|
—
|
|
89
|
|
—
|
|
|||||||
|
Contingent consideration
|
7
|
|
—
|
|
—
|
|
7
|
|
|||||||
|
Total
|
$
|
199
|
|
$
|
—
|
|
$
|
192
|
|
$
|
7
|
|
|||
The Company offers certain employees the opportunity to participate in non-qualified supplemental deferred compensation plans. A participant's deferrals, together with Company matching credits, are invested in a variety of participant-directed stock and bond mutual funds that are classified as trading securities. The trading securities are classified within Level 1 because the changes in the fair value of these securities are measured using quoted prices in active markets based on the market price per unit multiplied by the number of units held, exclusive of any transaction costs. A corresponding adjustment for changes in fair value of the trading securities is also reflected in the changes in fair value of the deferred compensation obligation. The deferred compensation liabilities are classified within Level 2 because their inputs are derived principally from observable market data by correlation to the trading securities.
The Company offers certain employees the opportunity to participate in a non-qualified deferred compensation program. A participant's deferrals, together with Company matching credits, are “invested” at the direction of the employee in a hypothetical portfolio of investments which are tracked by an administrator. The Company purchases life insurance policies, with the Company named as beneficiary of the policies, for the purpose of funding the program's liability. Changes in the cash surrender value of the life insurance policies are based upon earnings and changes in the value of the underlying investments. Changes in the fair value of the deferred compensation obligation are derived using quoted prices in active markets based on the market price per unit multiplied by the number of units. The cash surrender value and the deferred compensation obligations are classified within Level 2 because their inputs are derived principally from observable market data by correlation
F- 24
QUEST DIAGNOSTICS INCORPORATED AND SUBSIDIARIES
NOTES TO CONSOLIDATED FINANCIAL STATEMENTS – CONTINUED
(in millions unless otherwise indicated)
to the hypothetical investments. This plan was amended effective January 1, 2018 so that future deferrals under the plan may only be made by participants who made deferrals under the plan in 2017.
The fair value measurements of the Company's interest rate swaps classified within Level 2 of the fair value hierarchy are model-derived valuations as of a given date in which all significant inputs are observable in active markets including certain financial information and certain assumptions regarding past, present and future market conditions.
Investment in equity securities represents an investment in registered shares of a publicly-held company. The Company's investment in equity securities is classified within Level 1 of the fair value hierarchy because the fair value is obtained from quoted prices in an active market. During 2018, the Company wrote off the remaining carrying value of its investment.
In April 2014, the Company completed the acquisition of Steward Health Care Systems, LLC's laboratory outreach business. In connection with the acquisition, the Company initially recorded a contingent consideration liability of
$4 million
. The contingent consideration liability was classified within Level 3 of the fair value hierarchy measured at fair value using a probability weighted and discounted cash flow method. During 2018, the Company made the final payment associated with the contingent consideration arrangement.
In December 2017, the Company completed the acquisition of Shiel which provides for up to
$15 million
of contingent consideration to be paid based on the achievement of certain testing volume benchmarks. In connection with the acquisition, the Company initially recorded a contingent consideration liability of
$6 million
which was classified within Level 3 of the fair value hierarchy. The contingent consideration was measured at fair value using an option-pricing model. Significant inputs included management's estimate of volume and other market inputs including comparable company revenue volatility of
6.9%
and a discount rate of
4.5%
. The estimated fair value of the contingent consideration associated with Shiel was increased to
$7 million
in 2018 as a result of the remeasurement of the liability. Any contingent consideration associated with Shiel is expected to be paid in 2019. For further details regarding the Shiel acquisition, see Note 6.
In February 2018, the Company completed the acquisition of MedXM which provides for up to
$30 million
of contingent consideration to be paid based on the achievement of certain revenue targets. In connection with the acquisition, the Company initially recorded a contingent consideration liability of
$12 million
which was classified within Level 3 of the fair value hierarchy. The contingent consideration was measured at fair value using an option-pricing model. Significant inputs included management's estimate of revenue and other market inputs including comparable company revenue volatility of
12.7%
and a discount rate of
5.4%
. Subsequent to the acquisition, the estimated fair value of the contingent consideration was reduced to
$0
as a result of updated revenue forecasts for 2018 compared to the earn-out revenue target included in the contingent consideration arrangement. For further details regarding the MedXM acquisition, see Note 6.
In September 2018, the Company completed the acquisition of ReproSource which provides for up to
$10 million
of contingent consideration to be paid based on the achievement of certain revenue targets. In connection with the acquisition, the Company initially recorded a contingent consideration liability of
$5 million
which was classified within Level 3 of the fair value hierarchy. The contingent consideration was measured at fair value using an option-pricing model. Significant inputs included management's estimate of revenue and other market inputs including comparable company revenue volatility of
8.5%
and a discount rate of
6.5%
. The contingent consideration associated with ReproSource is expected to be paid in up to two installments in 2020 and 2021. For further details regarding the ReproSource acquisition, see Note 6.
F- 25
QUEST DIAGNOSTICS INCORPORATED AND SUBSIDIARIES
NOTES TO CONSOLIDATED FINANCIAL STATEMENTS – CONTINUED
(in millions unless otherwise indicated)
The following table provides a reconciliation of the beginning and ending balances of liabilities using significant unobservable inputs (Level 3):
|
Contingent Consideration
|
|||
|
Balance, December 31, 2016
|
$
|
3
|
|
|
Purchases, additions and issuances
|
6
|
|
|
|
Settlements
|
(2
|
)
|
|
|
Balance, December 31, 2017
|
7
|
|
|
|
Purchases, additions and issuances
|
19
|
|
|
|
Settlements
|
(1
|
)
|
|
|
Total (gains)/losses included in earnings - realized/unrealized
|
(11
|
)
|
|
|
Balance, December 31, 2018
|
$
|
14
|
|
The
$11 million
net gain included in earnings associated with the change in the fair value of contingent consideration for the year ended December 31, 2018 is reported in other operating (income) expense, net.
The carrying amounts of cash and cash equivalents, accounts receivable and accounts payable and accrued expenses approximate fair value based on the short maturities of these instruments. As of both
December 31, 2018
and
2017
, the fair value of the Company's debt was estimated at
$4.0 billion
. Principally all of the Company's debt is classified within Level 1 of the fair value hierarchy because the fair value of the debt is estimated based on rates currently offered to the Company with identical terms and maturities, using quoted active market prices and yields, taking into account the underlying terms of the debt instruments.
9. TAXES ON INCOME
The Company's pre-tax income before equity in earnings of equity method investees consisted of approximately
$0.9 billion
,
$1.0 billion
and
$1.1 billion
from U.S. operations and a pre-tax (loss) income of
$(1) million
,
$(7) million
and
$4 million
from foreign operations for the years ended
December 31, 2018
,
2017
and
2016
, respectively.
The Company recognized the income tax effects of the TCJA in its 2017 consolidated financial statements in accordance with Staff Accounting Bulletin No. 118, which provides Securities and Exchange Commission staff guidance for the application of Accounting Standards Codification Topic 740,
Income Taxes
, in the reporting period in which the TCJA was signed into law. As such, the Company’s 2017 financial results reflected the provisional estimate of the income tax effects of the TCJA.
During the year ended December 31, 2017, the Company recorded a provisional estimated income tax benefit of
$106 million
associated with the TCJA, including a deferred income tax benefit of
$115 million
primarily due to the remeasurement of net deferred tax liabilities and reserves at the new combined federal and state tax rate, partially offset by
$9 million
of current tax expense primarily due to the mandatory repatriation toll charge on undistributed foreign earnings and profits. The Company did not identify items for which the income tax effects of the TCJA have not been completed and a reasonable estimate could not be determined as of December 31, 2017. During the year ended December 31, 2018, the Company finalized the effect of the enactment of TCJA and recorded an additional
$1 million
of current income tax expense.
As a result of the TCJA, the Company changed its assertion that it intends to indefinitely reinvest undistributed earnings from certain non-U.S. subsidiaries outside the U.S. The Company is indefinitely reinvested in the remaining basis difference and it is not practicable to determine the associated amount of unrecognized deferred tax liability.
During the year ended December 31, 2016, the Company recorded
$84 million
of income tax expense, consisting of
$91 million
of current income tax expense and a deferred income tax benefit of
$7 million
, associated with the sale of Focus Diagnostics (see Note 7). In addition, the Company recognized a non-taxable gain on an escrow recovery associated with an acquisition.
F- 26
QUEST DIAGNOSTICS INCORPORATED AND SUBSIDIARIES
NOTES TO CONSOLIDATED FINANCIAL STATEMENTS – CONTINUED
(in millions unless otherwise indicated)
The components of income tax expense (benefit) for
2018
,
2017
and
2016
were as follows:
|
2018
|
2017
|
2016
|
|||||||||
|
Current:
|
|||||||||||
|
Federal
|
$
|
82
|
|
$
|
226
|
|
$
|
346
|
|
||
|
State and local
|
26
|
|
5
|
|
45
|
|
|||||
|
Foreign
|
1
|
|
1
|
|
1
|
|
|||||
|
Deferred:
|
|||||||||||
|
Federal
|
66
|
|
(20
|
)
|
33
|
|
|||||
|
State and local
|
10
|
|
27
|
|
4
|
|
|||||
|
Foreign
|
(3
|
)
|
2
|
|
—
|
|
|||||
|
Total
|
$
|
182
|
|
$
|
241
|
|
$
|
429
|
|
||
A reconciliation of the federal statutory rate to the Company's effective tax rate for
2018
,
2017
and
2016
was as follows:
|
2018
|
2017
|
2016
|
||||||
|
Tax provision at statutory rate
|
21.0
|
%
|
35.0
|
%
|
35.0
|
%
|
||
|
State and local income taxes, net of federal benefit
|
4.7
|
|
3.8
|
|
3.3
|
|
||
|
Gains and losses on book and tax basis difference
|
—
|
|
(0.1
|
)
|
3.3
|
|
||
|
Impact of noncontrolling interests
|
(1.4
|
)
|
(1.9
|
)
|
(1.8
|
)
|
||
|
Excess tax benefits on stock-based compensation arrangements
|
(1.9
|
)
|
(3.6
|
)
|
(0.8
|
)
|
||
|
Return to provision true-ups
|
(1.4
|
)
|
(2.0
|
)
|
(0.8
|
)
|
||
|
Impact of TCJA enactment
|
0.1
|
|
(10.4
|
)
|
—
|
|
||
|
Change in accounting method
|
(1.6
|
)
|
—
|
|
—
|
|
||
|
Other, net
|
0.2
|
|
2.6
|
|
1.3
|
|
||
|
Effective tax rate
|
19.7
|
%
|
23.4
|
%
|
39.5
|
%
|
||
In 2018, the Company filed for a tax return accounting method change, effective for the tax year ending December 31, 2017, to accelerate the deduction of certain expenses on its 2017 tax return at the higher 2017 federal corporate statutory rate resulting in a
$15 million
income tax benefit.
In 2016, the sale of Focus Diagnostics and the non-taxable gain on an escrow recovery associated with an acquisition resulted in the gains and losses on book and tax basis difference as discussed above.
The tax effects of temporary differences that give rise to significant portions of the deferred tax assets (liabilities) as of
December 31, 2018
and
2017
were as follows:
|
2018
|
2017
|
||||||
|
Non-current deferred tax assets (liabilities):
|
|||||||
|
Accounts receivable reserves
|
$
|
66
|
|
$
|
63
|
|
|
|
Liabilities not currently deductible
|
137
|
|
129
|
|
|||
|
Stock-based compensation
|
38
|
|
41
|
|
|||
|
Basis differences in investments, joint ventures and subsidiaries
|
(80
|
)
|
(79
|
)
|
|||
|
Net operating loss carryforwards, net of valuation allowance
|
80
|
|
83
|
|
|||
|
Depreciation and amortization
|
(484
|
)
|
(403
|
)
|
|||
|
Total non-current deferred tax liabilities, net
|
$
|
(243
|
)
|
$
|
(166
|
)
|
|
As of
2017
, non-current deferred tax assets of
$4 million
are recorded in other assets. As of
December 31, 2018
and
2017
, non-current deferred tax liabilities of
$243 million
and
$170 million
, respectively, are included in other liabilities.
F- 27
QUEST DIAGNOSTICS INCORPORATED AND SUBSIDIARIES
NOTES TO CONSOLIDATED FINANCIAL STATEMENTS – CONTINUED
(in millions unless otherwise indicated)
As of
December 31, 2018
, the Company had estimated net operating loss carryforwards for federal and state income tax purposes of
$131 million
and
$1.3 billion
, respectively, which expire at various dates through
2038
. Estimated net operating loss carryforwards for foreign income tax purposes are
$56 million
as of
December 31, 2018
, some of which can be carried forward indefinitely while others expire at various dates through
2028
. As of
December 31, 2018
,
2017
and
2016
, deferred tax assets associated with net operating loss carryforwards of
$147 million
,
$155 million
and
$204 million
, respectively, have each been reduced by valuation allowances of
$54 million
,
$57 million
and
$56 million
, respectively.
Income taxes payable, including those classified as long-term in other liabilities as of
December 31, 2018
and
2017
, were
$85 million
and
$82 million
, respectively. Prepaid income taxes were
$14 million
and
$37 million
as of
December 31, 2018
and
2017
, respectively, and were recorded in prepaid expenses and other current assets.
The total amount of unrecognized tax benefits as of and for the years ended
December 31, 2018
,
2017
and
2016
consisted of the following:
|
2018
|
2017
|
2016
|
|||||||||
|
Balance, beginning of year
|
$
|
115
|
|
$
|
98
|
|
$
|
91
|
|
||
|
Additions:
|
|||||||||||
|
For tax positions of current year
|
2
|
|
5
|
|
3
|
|
|||||
|
For tax positions of prior years
|
11
|
|
23
|
|
12
|
|
|||||
|
Reductions:
|
|||||||||||
|
Changes in judgment
|
(6
|
)
|
(2
|
)
|
(1
|
)
|
|||||
|
Expirations of statutes of limitations
|
(15
|
)
|
(6
|
)
|
(7
|
)
|
|||||
|
Settlements
|
—
|
|
(3
|
)
|
—
|
|
|||||
|
Balance, end of year
|
$
|
107
|
|
$
|
115
|
|
$
|
98
|
|
||
The contingent liabilities for tax positions primarily relate to uncertainties associated with the realization of tax benefits derived from the allocation of income and expense among state jurisdictions, the characterization and timing of certain tax deductions associated with business combinations, income and expenses associated with certain intercompany licensing arrangements, certain tax credits and the deductibility of certain settlement payments.
The total amount of unrecognized tax benefits as of
December 31, 2018
, that, if recognized, would affect the effective income tax rate is
$56 million
. Based upon the expiration of statutes of limitations, settlements and/or the conclusion of tax examinations, the Company believes it is reasonably possible that the total amount of unrecognized tax benefits may decrease by up to
$34 million
within the next twelve months.
Accruals for interest expense on contingent tax liabilities are classified in income tax expense in the consolidated statements of operations. Accruals for penalties have historically been immaterial. Interest expense included in income tax expense in each of the years ended
December 31, 2018
,
2017
and
2016
was approximately
$1 million
,
$1 million
and
$2 million
, respectively. As of
December 31, 2018
and
2017
, the Company has approximately
$14 million
and
$13 million
, respectively, accrued, net of the benefit of a federal and state deduction, for the payment of interest on uncertain tax positions.
The recognition and measurement of certain tax benefits includes estimates and judgment by management and inherently involves subjectivity. Changes in estimates may create volatility in the Company's effective tax rate in future periods and may be due to settlements with various tax authorities (either favorable or unfavorable), the expiration of the statute of limitations on some tax positions and obtaining new information about particular tax positions that may cause management to change its estimates.
In the regular course of business, various federal, state, local and foreign tax authorities conduct examinations of the Company's income tax filings and the Company generally remains subject to examination until the statute of limitations expires for the respective jurisdiction. The Internal Revenue Service has either completed its examinations of the Company's consolidated federal income tax returns or the statute of limitations has expired up through and including the
2014
tax year pending Joint Committee of Congress approval of refund for settlement of certain tax adjustments related to the
2009
tax year. At this time, the Company does not believe that there will be any material additional payments beyond its recorded contingent liability reserves that may be required as a result of these tax audits. As of
December 31, 2018
, a summary of the tax years that
F- 28
QUEST DIAGNOSTICS INCORPORATED AND SUBSIDIARIES
NOTES TO CONSOLIDATED FINANCIAL STATEMENTS – CONTINUED
(in millions unless otherwise indicated)
remain subject to examination, awaiting approval, are under appeal, or are otherwise unresolved for the Company's major jurisdictions are:
United States - federal
2009
,
2015
-
2018
United States - various states
2009
-
2018
10. SUPPLEMENTAL CASH FLOW & OTHER DATA
Supplemental cash flow and other data for the years ended
December 31, 2018
,
2017
and
2016
was as follows:
|
2018
|
2017
|
2016
|
|||||||||
|
Depreciation expense
|
$
|
219
|
|
$
|
196
|
|
$
|
177
|
|
||
|
Amortization expense
|
90
|
|
74
|
|
72
|
|
|||||
|
Depreciation and amortization expense
|
$
|
309
|
|
$
|
270
|
|
$
|
249
|
|
||
|
Interest expense
|
$
|
(169
|
)
|
$
|
(153
|
)
|
$
|
(144
|
)
|
||
|
Interest income
|
2
|
|
2
|
|
1
|
|
|||||
|
Interest expense, net
|
$
|
(167
|
)
|
$
|
(151
|
)
|
$
|
(143
|
)
|
||
|
Interest paid
|
$
|
174
|
|
$
|
159
|
|
$
|
148
|
|
||
|
Income taxes paid
|
$
|
84
|
|
$
|
243
|
|
$
|
361
|
|
||
|
Assets acquired under capital leases
|
$
|
1
|
|
$
|
7
|
|
$
|
—
|
|
||
|
Accounts payable associated with capital expenditures
|
$
|
11
|
|
$
|
26
|
|
$
|
9
|
|
||
|
Accounts payable associated with purchases of treasury stock
|
$
|
3
|
|
$
|
—
|
|
$
|
—
|
|
||
|
Dividends payable
|
$
|
71
|
|
$
|
61
|
|
$
|
62
|
|
||
|
Businesses acquired:
|
|
|
|
|
|||||||
|
Fair value of assets acquired
|
$
|
453
|
|
$
|
657
|
|
$
|
139
|
|
||
|
Fair value of liabilities assumed
|
7
|
|
58
|
|
—
|
|
|||||
|
Fair value of net assets acquired
|
446
|
|
599
|
|
139
|
|
|||||
|
Merger consideration paid (payable), net
|
(19
|
)
|
(6
|
)
|
—
|
|
|||||
|
Cash paid for business acquisitions
|
427
|
|
593
|
|
139
|
|
|||||
|
Less: Cash acquired
|
6
|
|
12
|
|
—
|
|
|||||
|
Business acquisitions, net of cash acquired
|
$
|
421
|
|
$
|
581
|
|
$
|
139
|
|
||
F- 29
QUEST DIAGNOSTICS INCORPORATED AND SUBSIDIARIES
NOTES TO CONSOLIDATED FINANCIAL STATEMENTS – CONTINUED
(in millions unless otherwise indicated)
11. PROPERTY, PLANT AND EQUIPMENT
Property, plant and equipment as of
December 31, 2018
and
2017
consisted of the following:
|
2018
|
2017
|
||||||
|
Land
|
$
|
29
|
|
$
|
29
|
|
|
|
Buildings and improvements
|
429
|
|
430
|
|
|||
|
Laboratory equipment and furniture and fixtures
|
1,691
|
|
1,594
|
|
|||
|
Leasehold improvements
|
606
|
|
544
|
|
|||
|
Computer software developed or obtained for internal use
|
1,013
|
|
934
|
|
|||
|
Construction-in-progress
|
202
|
|
140
|
|
|||
|
3,970
|
|
3,671
|
|
||||
|
Less: Accumulated depreciation and amortization
|
(2,682
|
)
|
(2,526
|
)
|
|||
|
Total
|
$
|
1,288
|
|
$
|
1,145
|
|
|
12. GOODWILL AND INTANGIBLE ASSETS
The changes in goodwill for the years ended
December 31, 2018
and
2017
were as follows:
|
2018
|
2017
|
||||||
|
Balance, beginning of year
|
$
|
6,335
|
|
$
|
6,000
|
|
|
|
Goodwill acquired during the year
|
228
|
|
335
|
|
|||
|
Balance, end of year
|
$
|
6,563
|
|
$
|
6,335
|
|
|
Principally all of the Company’s goodwill as of
December 31, 2018
and
2017
was associated with its DIS business.
For the year ended
December 31, 2018
, goodwill acquired during the period was principally associated with the Oxford, MedXM, ReproSource and Cape Cod Healthcare, Inc. acquisitions (see Note 6).
For the year ended December 31, 2017, goodwill acquired during the period was principally associated with the Shiel, PHL, Med Fusion, CHL and HHC acquisitions (see Note 6).
F- 30
QUEST DIAGNOSTICS INCORPORATED AND SUBSIDIARIES
NOTES TO CONSOLIDATED FINANCIAL STATEMENTS – CONTINUED
(in millions unless otherwise indicated)
Intangible assets as of
December 31, 2018
and
2017
consisted of the following:
|
Weighted
Average
Amortization
Period (in years)
|
December 31, 2018
|
December 31, 2017
|
|||||||||||||||||||||||
|
Cost
|
Accumulated
Amortization
|
Net
|
Cost
|
Accumulated
Amortization
|
Net
|
||||||||||||||||||||
|
Amortizing intangible assets:
|
|
|
|
|
|
|
|
|
|
|
|||||||||||||||
|
Customer-related
|
18
|
$
|
1,355
|
|
$
|
(478
|
)
|
$
|
877
|
|
$
|
1,210
|
|
$
|
(404
|
)
|
$
|
806
|
|
||||||
|
Non-compete agreements
|
8
|
3
|
|
(2
|
)
|
1
|
|
7
|
|
(5
|
)
|
2
|
|
||||||||||||
|
Technology
|
17
|
104
|
|
(50
|
)
|
54
|
|
95
|
|
(45
|
)
|
50
|
|
||||||||||||
|
Other
|
9
|
114
|
|
(75
|
)
|
39
|
|
105
|
|
(80
|
)
|
25
|
|
||||||||||||
|
Total
|
17
|
1,576
|
|
(605
|
)
|
971
|
|
1,417
|
|
(534
|
)
|
883
|
|
||||||||||||
|
Intangible assets not subject to amortization:
|
|
|
|
|
|
|
|
|
|||||||||||||||||
|
Trade names
|
|
235
|
|
—
|
|
235
|
|
235
|
|
—
|
|
235
|
|
||||||||||||
|
Other
|
|
1
|
|
—
|
|
1
|
|
1
|
|
—
|
|
1
|
|
||||||||||||
|
Total intangible assets
|
$
|
1,812
|
|
$
|
(605
|
)
|
$
|
1,207
|
|
$
|
1,653
|
|
$
|
(534
|
)
|
$
|
1,119
|
|
|||||||
The estimated amortization expense related to amortizable intangible assets for each of the five succeeding fiscal years and thereafter as of
December 31, 2018
is as follows:
|
Year Ending December 31,
|
|
|
|
|
2019
|
$
|
97
|
|
|
2020
|
96
|
|
|
|
2021
|
90
|
|
|
|
2022
|
86
|
|
|
|
2023
|
85
|
|
|
|
Thereafter
|
517
|
|
|
|
Total
|
$
|
971
|
|
13. ACCOUNTS PAYABLE AND ACCRUED EXPENSES
Accounts payable and accrued expenses as of
December 31, 2018
and
2017
consisted of the following:
|
2018
|
2017
|
||||||
|
Accrued wages and benefits (including incentive compensation)
|
$
|
249
|
|
$
|
325
|
|
|
|
Accrued expenses
|
274
|
|
246
|
|
|||
|
Trade accounts payable
|
222
|
|
224
|
|
|||
|
Overdrafts
|
98
|
|
71
|
|
|||
|
Dividend payable
|
71
|
|
61
|
|
|||
|
Accrued interest
|
47
|
|
46
|
|
|||
|
Accrued insurance
|
29
|
|
32
|
|
|||
|
Income taxes payable
|
17
|
|
9
|
|
|||
|
Merger consideration payable
|
14
|
|
7
|
|
|||
|
Total
|
$
|
1,021
|
|
$
|
1,021
|
|
|
F- 31
QUEST DIAGNOSTICS INCORPORATED AND SUBSIDIARIES
NOTES TO CONSOLIDATED FINANCIAL STATEMENTS – CONTINUED
(in millions unless otherwise indicated)
14. DEBT
Long-term debt (including capital lease obligations) as of
December 31, 2018
and
2017
consisted of the following:
|
2018
|
2017
|
||||||
|
Secured Receivables Credit Facility (3.39% and 2.27% at December 31, 2018 and 2017, respectively)
|
$
|
160
|
|
$
|
30
|
|
|
|
2.70% Senior Notes due April 2019
|
300
|
|
300
|
|
|||
|
4.75% Senior Notes due January 2020
|
507
|
|
514
|
|
|||
|
2.50% Senior Notes due March 2020
|
300
|
|
300
|
|
|||
|
4.70% Senior Notes due April 2021
|
557
|
|
559
|
|
|||
|
4.25% Senior Notes due April 2024
|
299
|
|
303
|
|
|||
|
3.50% Senior Notes due March 2025
|
562
|
|
566
|
|
|||
|
3.45% Senior Notes due June 2026
|
469
|
|
470
|
|
|||
|
6.95% Senior Notes due July 2037
|
175
|
|
174
|
|
|||
|
5.75% Senior Notes due January 2040
|
244
|
|
244
|
|
|||
|
4.70% Senior Notes due March 2045
|
300
|
|
300
|
|
|||
|
Other
|
37
|
|
44
|
|
|||
|
Debt issuance costs
|
(17
|
)
|
(20
|
)
|
|||
|
Total long-term debt
|
3,893
|
|
3,784
|
|
|||
|
Less: Current portion of long-term debt
|
464
|
|
36
|
|
|||
|
Total long-term debt, net of current portion
|
$
|
3,429
|
|
$
|
3,748
|
|
|
Secured Receivables Credit Facility
On October 26, 2018, the Company amended the agreement for the $
600 million
secured receivables credit facility (the “Secured Receivables Credit Facility”) previously amended in October 2017, maintaining the borrowing capacity under the facility at
$600 million
. Under the Secured Receivables Credit Facility, the Company can borrow against a
$250 million
loan commitment maturing October 2019, and a
$250 million
loan commitment maturing October 2020, and can issue up to
$100 million
of letters of credit (see Note 18) through October 2020. Borrowings under the Secured Receivables Credit Facility are collateralized by certain domestic receivables. As of
December 31, 2018
, interest on the borrowings under the Secured Receivables Credit Facility is based on either commercial paper rates for highly-rated issuers or LIBOR plus a spread of
0.70%
to
0.725%
. The Secured Receivables Credit Facility contains various covenants which could impact the Company's ability to, among other things, incur additional indebtedness. As of
December 31, 2018
and
2017
, there was
$160 million
and
$30 million
, respectively, of outstanding borrowings under the Secured Receivables Credit Facility.
Senior Unsecured Revolving Credit Facility
In March 2018, the Company amended and restated the agreement for its $
750 million
senior unsecured revolving credit facility (the “Credit Facility” or "Senior Unsecured Revolving Credit Facility"). As a result, the Credit Facility will mature in March 2023. Under the Credit Facility, the Company can issue letters of credit totaling $
150 million
(see Note 18). Issued letters of credit reduce the available borrowing capacity under the facility. Interest on the Credit Facility is based on certain published rates plus an applicable margin based on changes in the Company's public debt ratings. At the option of the Company, it may elect to lock into LIBOR-based interest rates for periods up to six months. Interest on any outstanding amounts not covered under LIBOR-based interest rate contracts is based on an alternate base rate, which is calculated by reference to the prime rate, the federal funds rate or an adjusted LIBOR rate. As of both
December 31, 2018
and
2017
, the Company's borrowing rate for LIBOR-based loans under the Credit Facility was
LIBOR
plus
1.125%
. The Credit Facility contains various covenants, including the maintenance of a financial leverage ratio, which could impact the Company's ability to, among other things, incur additional indebtedness. As of both
December 31, 2018
and
2017
, there were
no
outstanding borrowings under the Credit Facility.
F- 32
QUEST DIAGNOSTICS INCORPORATED AND SUBSIDIARIES
NOTES TO CONSOLIDATED FINANCIAL STATEMENTS – CONTINUED
(in millions unless otherwise indicated)
Senior Notes Offerings
In May 2016, the Company completed a
$500 million
senior notes offering (the "2016 Senior Notes"). The offering consisted of
$500 million
in aggregate principal of
3.45%
senior notes due June 2026, issued at a discount of
$1 million
. The Company incurred
$4 million
of costs associated with the 2016 Senior Notes, which is included as a reduction to the carrying amount of long-term debt and is being amortized over the term of the related debt. The net proceeds from the 2016 Senior Notes were used to repay outstanding indebtedness under the Senior Unsecured Revolving Credit Facility and the Secured Receivables Credit Facility and for general corporate purposes.
All of the senior notes are unsecured obligations of the Company and rank equally with the Company's other senior unsecured obligations. None of the Company's senior notes have a sinking fund requirement.
Retirement of Debt
In March 2016, the Company completed a cash tender offer to purchase up to
$200 million
aggregate principal amount of its
6.95%
Senior Notes due July 2037 ("Senior Notes due 2037") and
5.75%
Senior Notes due January 2040 ("Senior Notes due 2040"). The Company purchased
$73 million
of its Senior Notes due 2037 and
$127 million
of its Senior Notes due 2040.
For the year ended December 31, 2016, the Company recorded a loss on retirement of debt, principally comprised of premiums paid of
$48 million
in other (expense) income, net.
Maturities of Long-Term Debt
As of
December 31, 2018
, long-term debt matures as follows:
|
Year Ending December 31,
|
|||
|
2019
|
$
|
464
|
|
|
2020
|
803
|
|
|
|
2021
|
553
|
|
|
|
2022
|
3
|
|
|
|
2023
|
1
|
|
|
|
Thereafter
|
2,148
|
|
|
|
Total maturities of long-term debt
|
3,972
|
|
|
|
Unamortized discount
|
(9
|
)
|
|
|
Debt issuance costs
|
(17
|
)
|
|
|
Fair value basis adjustments attributable to hedged debt
|
(53
|
)
|
|
|
Total long-term debt
|
3,893
|
|
|
|
Less: Current portion of long-term debt
|
464
|
|
|
|
Total long-term debt, net of current portion
|
$
|
3,429
|
|
15. FINANCIAL INSTRUMENTS
Interest Rate Derivatives – Cash Flow Hedges
From time to time, the Company has entered into various interest rate lock agreements and forward starting interest rate swap agreements to hedge part of the Company's interest rate exposure associated with the variability in future cash flows attributable to changes in interest rates.
In May 2016, the Company entered into interest rate lock agreements with several financial institutions for a total notional amount of
$250 million
which were accounted for as cash flow hedges. These agreements were entered into to hedge a portion of the Company’s interest rate exposure associated with variability in future cash flows attributable to changes in the ten-year treasury rates related to the planned issuance of the 2016 Senior Notes. In connection with the issuance of the 2016 Senior Notes, these agreements were settled, and the Company paid
$1 million
. These losses are deferred in stockholders’
F- 33
QUEST DIAGNOSTICS INCORPORATED AND SUBSIDIARIES
NOTES TO CONSOLIDATED FINANCIAL STATEMENTS – CONTINUED
(in millions unless otherwise indicated)
equity, net of taxes, as a component of accumulated other comprehensive loss, and amortized as an adjustment to interest expense, net over the term of the respective senior notes.
The total net loss, net of taxes, recognized in accumulated other comprehensive loss, related to the Company's cash flow hedges was
$9 million
as of both
December 31, 2018
and
2017
. The net amount of deferred losses on cash flow hedges that is expected to be reclassified from accumulated other comprehensive loss into interest expense, net within the next twelve months is
$3 million
.
Interest Rate Derivatives – Fair Value Hedges
The Company maintains various fixed-to-variable interest rate swaps to convert a portion of the Company's long-term debt into variable interest rate debt. A summary of the notional amounts of these interest rate swaps as of
December 31, 2018
and
2017
was as follows:
|
Notional Amount
|
||||||||
|
Debt Instrument
|
2018
|
2017
|
||||||
|
4.25% Senior Notes due April 2024
|
250
|
|
250
|
|
||||
|
3.50% Senior Notes due March 2025
|
600
|
|
600
|
|
||||
|
3.45% Senior Notes due June 2026
|
350
|
|
350
|
|
||||
|
$
|
1,200
|
|
$
|
1,200
|
|
|||
The fixed-to-variable interest rate swap agreements in the table above have variable interest rates ranging from one-month LIBOR plus
2.2%
to one-month LIBOR plus
3.0%
.
As of December 31, 2015, the Company had entered into various fixed-to-variable interest rate swap agreements with an aggregate notional amount of
$1.2 billion
. In July 2016, the Company terminated those interest rate swaps agreements. As a result of the termination, the Company received proceeds of
$60 million
, which included
$6 million
of accrued interest. The remaining basis adjustment on the respective debt obligation of
$54 million
will be amortized as a reduction of interest expense over the remaining terms of the hedged debt instrument. Immediately after the termination of these interest rate swaps, the Company entered into new fixed-to-variable interest rate swap agreements, which are reflected in the table above.
As of
December 31, 2018
and
2017
, the following amounts were recorded on the consolidated balance sheet related to cumulative basis adjustments for fair value hedges included in the carrying amount of long-term debt:
|
Carrying Amount of Hedged Long-Term Debt
|
Hedge Accounting Basis Adjustment (a)
|
Carrying Amount of Hedged Long-Term Debt
|
Hedge Accounting Basis Adjustment (a)
|
||||||||||||||
|
Balance Sheet Classification
|
December 31, 2018
|
December 31, 2018
|
December 31, 2017
|
December 31, 2017
|
|||||||||||||
|
Long-term debt
|
$
|
1,125
|
|
$
|
(53
|
)
|
$
|
1,132
|
|
$
|
(33
|
)
|
|||||
(a) The balance includes
$40 million
and
$56 million
of remaining unamortized hedging adjustment on a discontinued relationship as of
December 31, 2018
and
2017
, respectively.
F- 34
QUEST DIAGNOSTICS INCORPORATED AND SUBSIDIARIES
NOTES TO CONSOLIDATED FINANCIAL STATEMENTS – CONTINUED
(in millions unless otherwise indicated)
The following table presents the effect of fair value hedge accounting on the statement of operations for the years ended
December 31, 2018
and
2017
, respectively:
|
Year Ended December 31,
|
|||||||
|
2018
|
2017
|
||||||
|
Other (expense) income, net
|
Other (expense) income, net
|
||||||
|
Total for line item in which the effects of fair value hedges are recorded
|
(8
|
)
|
16
|
|
|||
|
Gain (loss) on fair value hedging relationships:
|
|||||||
|
Hedged items (Long-term debt)
|
4
|
|
1
|
|
|||
|
Derivatives designated as hedging instruments
|
(4
|
)
|
(1
|
)
|
|||
Interest Rate Derivatives - Economic Hedges
In March 2016, in connection with the retirement of debt (see Note 14), the Company entered into reverse interest rate lock agreements with several financial institutions which were not designated for hedge accounting. The Company entered into these agreements to hedge the variability in cash flows associated with
$75 million
of the
$200 million
principal amount of debt that was retired in the first quarter of 2016. These agreements were settled during the first quarter of 2016 resulting in a gain of
$1 million
which was recognized in other (expense) income, net.
A summary of the fair values of derivative instruments in the consolidated balance sheets was as follows:
|
December 31, 2018
|
December 31, 2017
|
||||||||||
|
Balance Sheet
Classification
|
Fair Value
|
Balance Sheet
Classification
|
Fair Value
|
||||||||
|
Derivatives Designated as Hedging Instruments
|
|
|
|
|
|
||||||
|
Interest rate swaps
|
Other liabilities
|
$
|
93
|
|
Other liabilities
|
$
|
89
|
|
|||
16. STOCKHOLDERS’ EQUITY AND REDEEMABLE NONCONTROLLING INTEREST
Stockholders' Equity
Series Preferred Stock
Quest Diagnostics is authorized to issue up to
10 million
shares of Series Preferred Stock, par value
$1.00
per share. The Company's Board of Directors has the authority to issue such shares without stockholder approval and to determine the designations, preferences, rights and restrictions of such shares.
No
shares are currently outstanding.
Common Stock
On May 4, 2006, the Company's Restated Certificate of Incorporation was amended to increase the number of authorized shares of common stock, par value
$0.01
per share, from
300 million
shares to
600 million
shares.
Changes in Accumulated Other Comprehensive Income (Loss) by Component
Comprehensive income (loss) includes:
|
•
|
Foreign currency translation adjustments;
|
|
•
|
Net deferred loss on cash flow hedges, which represents deferred losses, net of tax on interest rate related derivative financial instruments designated as cash flow hedges, net of amounts reclassified to interest expense (see Note 15).
|
F- 35
QUEST DIAGNOSTICS INCORPORATED AND SUBSIDIARIES
NOTES TO CONSOLIDATED FINANCIAL STATEMENTS – CONTINUED
(in millions unless otherwise indicated)
Prior to adoption of the new accounting guidance on recognition and measurement of financial assets and liabilities, comprehensive income (loss) also included investment adjustments, which represented unrealized holding gains (losses), net of tax on available for sale securities, net of other-than-temporary impairment amounts reclassified to other (expense) income, net. Refer to Note 2 for details regarding the adoption of the new accounting standard related to the recognition and measurement of financial assets and liabilities.
For the years ended
December 31, 2018
,
2017
and
2016
, the tax effects related to investment adjustments, deferred losses on cash flow hedges and other were not material. Foreign currency translation adjustments related to indefinite investments in non-U.S. subsidiaries are not adjusted for income taxes.
The changes in accumulated other comprehensive income (loss) by component for
2018
,
2017
and
2016
were as follows:
|
Foreign
Currency
Translation
Adjustment
|
Investment Adjustments
|
Net Deferred Loss on Cash Flow Hedges
|
Other
|
Accumulated Other Comprehensive Income (Loss)
|
|||||||||||||||
|
Balance, December 31, 2015
|
$
|
(24
|
)
|
$
|
(1
|
)
|
$
|
(12
|
)
|
$
|
(1
|
)
|
$
|
(38
|
)
|
||||
|
Other comprehensive loss before reclassifications
|
(34
|
)
|
(2
|
)
|
—
|
|
—
|
|
(36
|
)
|
|||||||||
|
Amounts reclassified from accumulated other comprehensive loss
|
—
|
|
—
|
|
2
|
|
—
|
|
2
|
|
|||||||||
|
Net current period other comprehensive (loss) income
|
(34
|
)
|
(2
|
)
|
2
|
|
—
|
|
(34
|
)
|
|||||||||
|
Balance, December 31, 2016
|
(58
|
)
|
(3
|
)
|
(10
|
)
|
(1
|
)
|
(72
|
)
|
|||||||||
|
Other comprehensive income before reclassifications
|
20
|
|
—
|
|
—
|
|
—
|
|
20
|
|
|||||||||
|
Amounts reclassified from accumulated other comprehensive loss
|
—
|
|
3
|
|
1
|
|
—
|
|
4
|
|
|||||||||
|
Net current period other comprehensive income
|
20
|
|
3
|
|
1
|
|
—
|
|
24
|
|
|||||||||
|
Balance, December 31, 2017
|
(38
|
)
|
—
|
|
(9
|
)
|
(1
|
)
|
(48
|
)
|
|||||||||
|
Other comprehensive loss before reclassifications
|
(15
|
)
|
—
|
|
—
|
|
—
|
|
(15
|
)
|
|||||||||
|
Amounts reclassified from accumulated other comprehensive loss
|
4
|
|
—
|
|
2
|
|
|
|
6
|
|
|||||||||
|
Net current period other comprehensive loss
|
(11
|
)
|
—
|
|
2
|
|
—
|
|
(9
|
)
|
|||||||||
|
Reclassification of stranded tax effects resulting from enactment of the Tax Cuts and Jobs Act
|
—
|
|
—
|
|
(2
|
)
|
—
|
|
(2
|
)
|
|||||||||
|
Balance, December 31, 2018
|
$
|
(49
|
)
|
$
|
—
|
|
$
|
(9
|
)
|
$
|
(1
|
)
|
$
|
(59
|
)
|
||||
For the years ended
December 31, 2018
,
2017
and
2016
, the gross deferred losses on cash flow hedges were reclassified from accumulated other comprehensive loss to interest expense, net.
For the year ended December 31, 2018, foreign currency translation adjustment amounts were reclassified from accumulated other comprehensive loss to loss (gain) on disposition of business as a result of the sale of a foreign subsidiary.
For the year ended December 31, 2017, the other-than-temporary impairment amount included in investment adjustments were reclassified from accumulated other comprehensive loss to other (expense) income, net.
F- 36
QUEST DIAGNOSTICS INCORPORATED AND SUBSIDIARIES
NOTES TO CONSOLIDATED FINANCIAL STATEMENTS – CONTINUED
(in millions unless otherwise indicated)
Dividend Program
During each of the first three quarters of 2018, the Company's Board of Directors declared a quarterly cash dividend of
$0.50
per common share. During the fourth quarter of 2018, the Company's Board of Directors declared a quarterly cash dividend of
$0.53
per common share. During each of the four quarters of 2017 and during the fourth quarter of 2016, the Company's Board of Directors declared a quarterly cash dividend of
$0.45
per common share. During each of the first three quarters of 2016, the Company's Board of Directors declared a quarterly cash dividend of
$0.40
per common share.
Share Repurchase Program
In December 2016, the Company’s Board of Directors authorized the Company to repurchase an additional
$1 billion
of the Company's common stock.
As of
December 31, 2018
,
$592 million
remained available under the Company’s share repurchase authorization. The share repurchase authorization has no set expiration or termination date.
Share Repurchases
For the year ended
December 31, 2018
, the Company repurchased
3.4 million
shares of its common stock for
$325 million
, which includes an accrual of
$3 million
recorded in accounts payable and accrued expenses in the consolidated balance sheet for share repurchases not settled.
For the year ended
December 31, 2017
, the Company repurchased
4.6 million
shares of its common stock for
$465 million
.
For the year ended
December 31, 2016
, the Company repurchased
7.4 million
shares of its common stock for
$590 million
, which included
3.1 million
shares repurchased under an accelerated share repurchase agreement ("ASR") as follows:
In May 2016, the Company entered into an ASR with a financial institution to repurchase
$250 million
of the Company's common stock as part of the Company's share repurchase program. The ASR was structured as a combination of two transactions: (1) a treasury stock repurchase; and (2) a forward contract, which permitted the Company to purchase shares immediately with the final purchase price of those shares determined by the volume weighted average price of the Company's common stock during the repurchase period, less a fixed discount. Under the ASR, the Company paid
$250 million
to the financial institution and received
3.1 million
shares of common stock, resulting in a final price per share of
$81.04
. The Company initially received
2.8 million
shares of its common stock during the second quarter of 2016 and received an additional
0.3 million
shares upon completion of the ASR during the third quarter of 2016.
Shares Reissued from Treasury Stock
For the years ended
December 31, 2018
,
2017
and
2016
the Company reissued
3 million
shares,
2 million
shares and
2 million
shares, respectively, from treasury stock for shares issued under the ESPP and stock option plans.
Redeemable Noncontrolling Interest
In connection with the sale of an
18.9%
noncontrolling interest in a subsidiary to UMass Memorial Medical Center ("UMass") on July 1, 2015, the Company granted UMass the right to require the Company to purchase all of its interest in the subsidiary at fair value commencing July 1, 2020. The subsidiary performs diagnostic information services in a defined territory within the state of Massachusetts. Since the redemption of the noncontrolling interest is outside of the Company's control, it has been presented outside of stockholders' equity at the greater of its carrying amount or its fair value. The Company records changes in the fair value of the noncontrolling interest immediately as they occur. As of
December 31, 2018
and
2017
, the redeemable noncontrolling interest was
$77 million
and
$80 million
, respectively, and was presented at its fair value. The fair value measurement of the redeemable noncontrolling interest is classified within Level 3 of the fair value hierarchy because the fair value is based on a discounted cash flow analysis that takes into account, among other items, the Company's expected future cash flows, long term growth rates, and a discount rate commensurate with economic risk.
F- 37
QUEST DIAGNOSTICS INCORPORATED AND SUBSIDIARIES
NOTES TO CONSOLIDATED FINANCIAL STATEMENTS – CONTINUED
(in millions unless otherwise indicated)
17. STOCK OWNERSHIP AND COMPENSATION PLANS
Employee and Non-employee Directors Stock Ownership Programs
In 2005, the Company established the ELTIP to replace the Company's prior plan. The ELTIP provides for three types of awards: (a) stock options, (b) stock appreciation rights and (c) stock awards. The ELTIP provides for the grant to eligible employees of either non-qualified or incentive stock options, or both, to purchase shares of Company common stock at an exercise price no less than the fair market value of the Company's common stock on the date of grant. Grants of stock appreciation rights allow eligible employees to receive a payment based on the appreciation of Company common stock in cash, shares of Company common stock or a combination thereof. The stock appreciation rights are granted at an exercise price no less than the fair market value of the Company's common stock on the date of grant. Stock options and stock appreciation rights granted under the ELTIP expire on the date designated by the Board of Directors but in no event more than
ten
years from date of grant. No stock appreciation rights have been granted under the ELTIP. The stock options and shares are subject to forfeiture if employment terminates prior to the end of the vesting period prescribed by the Board of Directors. For all award types, the vesting period is generally over
three
years from the date of grant. For performance share unit awards, the actual amount of shares earned is based on the achievement of the performance goals specified in the awards. The maximum number of shares of Company common stock that may be optioned or granted under the ELTIP is approximately
71 million
shares.
In 2005, the Company established the DLTIP to replace the Company's prior plan. The DLTIP provides for the grant to non-employee directors of non-qualified stock options to purchase shares of Company common stock at an exercise price no less than the fair market value of the Company's common stock on the date of grant. The DLTIP also permits awards of restricted stock and restricted stock units to non-employee directors. Stock options granted under the DLTIP expire on the date designated by the Board of Directors but in no event more than
ten
years from date of grant. For all award types, the vesting period is generally over
three
years from the date of grant, regardless of whether the award recipient remains a director of the Company. The maximum number of shares that may be issued under the DLTIP is
2.4 million
shares. For the years ended
December 31, 2018
,
2017
and
2016
, grants under the DLTIP totaled
15 thousand
shares,
13 thousand
shares and
21 thousand
shares, respectively.
The Company's practice has been to issue shares related to its stock-based compensation program from shares of its common stock held in treasury or by issuing new shares of its common stock. See Note 16 for further information regarding the Company's share repurchase program.
The fair value of each stock option award granted was estimated on the date of grant using a Black-Scholes option-valuation model. The expected volatility under the Black-Scholes option-valuation model was based on historical volatilities of the Company's common stock. The dividend yield was based on the approved annual dividend rate in effect and current market price of the underlying common stock at the time of grant. The risk-free interest rate was based on the U.S. Treasury yield curve in effect at the time of grant for bonds with maturities consistent with the expected holding period of the related award. The expected holding period was estimated using the historical stock option exercise behavior of employees.
The weighted average assumptions used in valuing stock options granted in the periods presented were:
|
2018
|
2017
|
2016
|
|||
|
Fair value at grant date
|
$18.14
|
$15.98
|
$10.35
|
||
|
Expected volatility
|
19.1%
|
19.8%
|
21.6%
|
||
|
Dividend yield
|
1.9%
|
1.9%
|
2.4%
|
||
|
Risk-free interest rate
|
2.8%
|
2.1%
|
1.4%
|
||
|
Expected holding period, in years
|
5.3
|
5.2
|
5.3
|
||
The fair value of restricted stock awards, restricted stock units and performance share units is the average market price of the Company's common stock at the date of grant.
F- 38
QUEST DIAGNOSTICS INCORPORATED AND SUBSIDIARIES
NOTES TO CONSOLIDATED FINANCIAL STATEMENTS – CONTINUED
(in millions unless otherwise indicated)
The following summarizes the activity relative to stock option awards for
2018
:
|
Shares
|
Weighted
Average Exercise Price
|
Weighted Average Remaining Contractual Term
(in years)
|
Aggregate Intrinsic Value
|
|||||||||
|
Options outstanding, beginning of year
|
8.5
|
|
$
|
70.11
|
|
|||||||
|
Options granted
|
1.6
|
|
103.56
|
|
||||||||
|
Options exercised
|
(1.6
|
)
|
63.08
|
|
||||||||
|
Options forfeited and canceled
|
(0.1
|
)
|
93.51
|
|
||||||||
|
Options outstanding, end of year
|
8.4
|
|
$
|
77.35
|
|
6.7
|
$
|
102
|
|
|||
|
Exercisable, end of year
|
5.1
|
|
$
|
67.17
|
|
5.6
|
$
|
90
|
|
|||
|
Vested and expected to vest, end of year
|
8.3
|
|
$
|
76.98
|
|
6.6
|
$
|
102
|
|
|||
The aggregate intrinsic value in the table above represents the total pre-tax intrinsic value (the difference between the Company's closing common stock price on the last trading day of
2018
and the exercise price, multiplied by the number of in-the-money options) that would have been received by the option holders had all option holders exercised their options on
December 31, 2018
. This amount changes based on the fair market value of the Company's common stock. Total intrinsic value of options exercised in
2018
,
2017
and
2016
was
$67 million
,
$94 million
and
$30 million
, respectively.
As of
December 31, 2018
, there was
$14 million
of unrecognized stock-based compensation cost related to nonvested stock options which is expected to be recognized over a weighted average period of
1.7
years.
The following summarizes the activity relative to stock awards, including restricted stock awards, restricted stock units and performance share units, for
2018
,
2017
and
2016
:
|
2018
|
2017
|
2016
|
||||||||||||||||||
|
Shares
|
Weighted
Average
Grant Date
Fair Value
|
Shares
|
Weighted
Average
Grant Date
Fair Value
|
Shares
|
Weighted
Average
Grant Date
Fair Value
|
|||||||||||||||
|
Shares outstanding, beginning of year
|
1.3
|
|
$
|
77.90
|
|
1.5
|
|
$
|
63.88
|
|
1.7
|
|
$
|
59.92
|
|
|||||
|
Shares granted
|
0.4
|
|
103.51
|
|
0.4
|
|
96.27
|
|
0.6
|
|
67.26
|
|
||||||||
|
Shares vested
|
(0.5
|
)
|
74.00
|
|
(0.6
|
)
|
57.59
|
|
(0.4
|
)
|
58.98
|
|
||||||||
|
Shares forfeited and canceled
|
(0.1
|
)
|
90.16
|
|
—
|
|
—
|
|
(0.4
|
)
|
57.31
|
|
||||||||
|
Shares outstanding, end of year
|
1.1
|
|
$
|
88.13
|
|
1.3
|
|
$
|
77.90
|
|
1.5
|
|
$
|
63.88
|
|
|||||
As of
December 31, 2018
, there was
$22 million
of unrecognized stock-based compensation cost related to nonvested stock awards, which is expected to be recognized over a weighted average period of
1.6
years. Total fair value of shares vested was
$54 million
,
$58 million
and
$28 million
for the years ended
December 31, 2018
,
2017
and
2016
, respectively. The amount of unrecognized stock-based compensation cost is subject to change based on changes, if any, to management's best estimates of the achievement of the performance goals specified in such awards and the resulting number of shares that will be earned at the end of the performance periods.
For the years ended
December 31, 2018
,
2017
and
2016
, stock-based compensation expense totaled
$61 million
,
$79 million
and
$69 million
, respectively. Income tax benefits recognized in the consolidated statements of operations related to stock-based compensation expense totaled
$33 million
,
$67 million
and
$32 million
for the years ended
December 31, 2018
,
2017
and
2016
, respectively, which includes excess tax benefits associated with stock-based compensation arrangements of
$18 million
,
$37 million
and
$9 million
for the years ended
December 31, 2018
,
2017
and
2016
, respectively.
F- 39
QUEST DIAGNOSTICS INCORPORATED AND SUBSIDIARIES
NOTES TO CONSOLIDATED FINANCIAL STATEMENTS – CONTINUED
(in millions unless otherwise indicated)
Employee Stock Purchase Plan
Under the Company's ESPP, substantially all employees can elect to have up to
10%
of their annual wages withheld to purchase Quest Diagnostics common stock. The purchase price of the stock is
85%
of the market price of the Company's common stock on the last business day of each calendar month. Under the ESPP, the maximum number of shares of Quest Diagnostics common stock which may be purchased by eligible employees is
9 million
. Approximately
326 thousand
,
278 thousand
and
332 thousand
shares of common stock were purchased by eligible employees in
2018
,
2017
and
2016
, respectively.
Defined Contribution Plans
The Company maintains qualified defined contribution plans covering substantially all of its employees. The maximum Company matching contribution is
5%
of eligible employee compensation. The Company's expense for contributions to its defined contribution plans aggregated
$78 million
,
$76 million
and
$76 million
for
2018
,
2017
and
2016
, respectively.
Supplemental Deferred Compensation Plans
The Company has a supplemental deferred compensation plan that is an unfunded, non-qualified plan that provides for certain management and highly compensated employees to defer up to
50%
of their salary in excess of their defined contribution plan limits and for certain eligible employees, up to
95%
of their variable incentive compensation. The maximum Company matching contribution is
5%
of eligible employee compensation. The compensation deferred under this plan, together with Company matching amounts, are credited with earnings or losses measured by the mirrored rate of return on investments elected by plan participants. Each plan participant is fully vested in all deferred compensation, Company match and earnings credited to their account. The amounts accrued under the Company's deferred compensation plans were
$53 million
and
$58 million
as of
December 31, 2018
and
2017
, respectively. Although the Company is currently contributing all participant deferrals and matching amounts to trusts, the funds in these trusts, totaling
$53 million
and
$58 million
as of
December 31, 2018
and
2017
, respectively, are general assets of the Company and are subject to any claims of the Company's creditors.
The Company also offers certain employees the opportunity to participate in a non-qualified deferred compensation program. Eligible participants are allowed to defer up to
$20 thousand
of eligible compensation per year. The Company matches employee contributions equal to
25%
, up to a maximum of
$5 thousand
per plan year. A participant's deferrals, together with Company matching credits, are “invested” at the direction of the employee in a hypothetical portfolio of investments which are tracked by an administrator. Each participant is fully vested in their deferred compensation and vests in Company matching contributions over a
four
-year period at
25%
per year. This plan was amended effective January 1, 2018 so that future deferrals under the plan may only be made by participants who made deferrals under the plan in 2017. The amounts accrued under this plan were
$43 million
and
$45 million
as of
December 31, 2018
and
2017
, respectively. The Company purchases life insurance policies, with the Company named as beneficiary of the policies, for the purpose of funding the program's liability. The cash surrender value of such life insurance policies was
$34 million
and
$37 million
as of
December 31, 2018
and
2017
, respectively.
For the years ended
December 31, 2018
,
2017
and
2016
, the Company's expense for matching contributions to these plans were not material.
18. COMMITMENTS AND CONTINGENCIES
Letters of Credit and Contractual Obligations
The Company can issue letters of credit under its Secured Receivables Credit Facility and Senior Unsecured Revolving Credit Facility (see Note 14). In support of its risk management program, to ensure the Company’s performance or payment to third parties,
$71 million
in letters of credit under the Secured Receivables Credit Facility were outstanding as of
December 31, 2018
. The letters of credit primarily represent collateral for current and future automobile liability and workers’ compensation loss payments.
F- 40
QUEST DIAGNOSTICS INCORPORATED AND SUBSIDIARIES
NOTES TO CONSOLIDATED FINANCIAL STATEMENTS – CONTINUED
(in millions unless otherwise indicated)
Minimum rental commitments under noncancelable operating leases, primarily real estate, in effect as of
December 31, 2018
are as follows:
|
Year Ending December 31,
|
|||
|
2019
|
$
|
181
|
|
|
2020
|
143
|
|
|
|
2021
|
106
|
|
|
|
2022
|
79
|
|
|
|
2023
|
60
|
|
|
|
Thereafter
|
122
|
|
|
|
Minimum lease payments
|
$
|
691
|
|
Operating lease rental expense for
2018
,
2017
and
2016
totaled
$220 million
,
$219 million
and
$216 million
, respectively. Rent expense associated with operating leases that include scheduled rent increases and tenant incentives, such as rent holidays and improvement allowances, is recorded on a straight-line basis over the term of the lease.
The Company has certain noncancelable commitments, primarily under take-or-pay arrangements, to purchase products or services from various suppliers, mainly for consulting and other service agreements, and standing orders to purchase reagents and other laboratory supplies. As of
December 31, 2018
, the approximate total future purchase commitments are
$157 million
, of which
$68 million
are expected to be incurred in
2019
,
$66 million
are expected to be incurred in
2020
through
2021
and the balance thereafter.
Billing and Collection Agreement
In September 2016, the Company entered into a
ten
year agreement with a third party to outsource its billing and related operations for the majority of the Company’s revenues. Services under the agreement commenced during the fourth quarter of 2016. The agreement includes an annual fee, which is subject to adjustment based on certain changes in the Company's requisition volume and the achievement of various performance metrics.
Contingent Lease Obligations
The Company remains subject to contingent obligations under certain real estate leases, including real estate leases that were entered into by certain predecessor companies of a subsidiary prior to the Company's acquisition of the subsidiary. While over the course of many years, the title to certain properties and interest in the subject leases have been transferred to third parties and the subject leases have been amended several times by such third parties, the lessors have not formally released the subsidiary predecessor companies from their original obligations under the leases and therefore remain contingently liable in the event of default. The remaining terms of the lease obligations and the Company's corresponding indemnifications range up to
29
years. The lease payments under certain leases are subject to market value adjustments and contingent rental payments and therefore, the total contingent obligations under the leases cannot be precisely determined but are likely to total several hundred million dollars. A claim against the Company would be made only upon the current lessee's default and, in certain cases, after a series of claims and corresponding defaults by third parties that precede the Company in the order of liability. The Company also has certain indemnification rights from other parties to recover losses in the event of default on the lease obligations. The Company believes that the likelihood of its performance under these contingent obligations is remote and no liability has been recorded for any potential payments under the contingent lease obligations.
Legal Matters
The Company is involved in various legal proceedings. Some of the proceedings against the Company involve claims that could be substantial in amount.
In the normal course of business, the Company has been named, from time to time, as a defendant in various legal actions, including arbitrations, class actions and other litigation, arising in connection with the Company's activities as a provider of diagnostic testing, information and services. These actions could involve claims for substantial compensatory and/
F- 41
QUEST DIAGNOSTICS INCORPORATED AND SUBSIDIARIES
NOTES TO CONSOLIDATED FINANCIAL STATEMENTS – CONTINUED
(in millions unless otherwise indicated)
or punitive damages or claims for indeterminate amounts of damages, and could have an adverse impact on the Company's client base and reputation.
The Company is also involved, from time to time, in other reviews, investigations and proceedings by governmental agencies regarding the Company's business, including, among other matters, operational matters, which may result in adverse judgments, settlements, fines, penalties, injunctions or other relief. The number of these reviews, investigations and proceedings has increased in recent years with regard to many firms in the healthcare services industry, including the Company.
The federal or state governments may bring claims based on the Company's current practices, which it believes are lawful. In addition, certain federal and state statutes, including the
qui tam
provisions of the federal False Claims Act, allow private individuals to bring lawsuits against healthcare companies on behalf of government or private payers. The Company is aware of lawsuits, and from time to time has received subpoenas, related to billing practices based on the qui tam provisions of the Civil False Claims Act or other federal and state statutes, regulations or other laws. The Company understands that there may be other pending qui tam claims brought by former employees or other "whistle blowers" as to which the Company cannot determine the extent of any potential liability.
Management cannot predict the outcome of such matters. Although management does not anticipate that the ultimate outcome of such matters will have a material adverse effect on the Company's financial condition, given the high degree of judgment involved in establishing loss estimates related to these types of matters, the outcome of such matters may be material to the Company's results of operations or cash flows in the period in which the impact of such matters is determined or paid.
These matters are in different stages. Some of these matters are in their early stages. Matters may involve responding to and cooperating with various government investigations and related subpoenas. As of
December 31, 2018
, the Company does not believe that any material losses related to the legal matters described above are probable.
Reserves for Legal Matters
Reserves for legal matters totaled
$1 million
and
$2 million
as of
December 31, 2018
and
2017
, respectively.
Reserves for General and Professional Liability Claims
As a general matter, providers of clinical testing services may be subject to lawsuits alleging negligence or other similar legal claims. These suits could involve claims for substantial damages. Any professional liability litigation could also have an adverse impact on the Company's client base and reputation. The Company maintains various liability insurance coverages for, among other things, claims that could result from providing, or failing to provide, clinical testing services, including inaccurate testing results, and other exposures. The Company's insurance coverage limits its maximum exposure on individual claims; however, the Company is essentially self-insured for a significant portion of these claims. Reserves for such matters, including those associated with both asserted and incurred but not reported claims, are established on an undiscounted basis by considering actuarially determined losses based upon the Company's historical and projected loss experience. Such reserves totaled
$125 million
and
$118 million
as of
December 31, 2018
and
2017
, respectively. Management believes that established reserves and present insurance coverage are sufficient to cover currently estimated exposures.
19. BUSINESS SEGMENT INFORMATION
The Company's DIS business is the only reportable segment based on the manner in which the Chief Executive Officer, who is the Company's chief operating decision maker ("CODM"), assesses performance and allocates resources across the organization. The DIS business provides diagnostic information services to a broad range of customers, including patients, clinicians, hospitals, IDNs, health plans, employers and ACOs. The Company is the world's leading provider of diagnostic information services, which includes providing information and insights based on the industry-leading menu of routine, non-routine and advanced clinical testing and anatomic pathology testing, and other diagnostic information services. The DIS business accounted for approximately
95%
of net revenues in
2018
,
2017
and
2016
.
All other operating segments include the Company's DS businesses, which consists of its risk assessment services, healthcare information technology, and diagnostic products (prior to disposition on May 13, 2016) businesses. The Company's DS businesses are the leading provider of risk assessment services for the life insurance industry and offer healthcare organizations and clinicians robust information technology solutions.
F- 42
QUEST DIAGNOSTICS INCORPORATED AND SUBSIDIARIES
NOTES TO CONSOLIDATED FINANCIAL STATEMENTS – CONTINUED
(in millions unless otherwise indicated)
In addition to the sale of Focus Diagnostics (see Note 7) in 2016, the Company wound down its Celera products business, which did not have a material impact on the Company's consolidated financial statements. As a result of these transactions, the Company has disposed of its diagnostics products business.
As of
December 31, 2018
, substantially all of the Company’s services were provided within the United States, and substantially all of the Company’s assets were located within the United States.
The following table is a summary of segment information for the years ended
December 31, 2018
,
2017
and
2016
. Segment asset information is not presented since it is not used by the CODM at the operating segment level. Operating earnings (loss) of each segment represents net revenues less directly identifiable expenses to arrive at operating income (loss) for the segment. General corporate activities included in the table below are comprised of general management and administrative corporate expenses, amortization and impairment of intangibles assets, other operating income and expenses net of certain general corporate activity costs that are allocated to the DIS and DS businesses, and the gain on disposition of businesses associated with the dispositions of Focus Diagnostics (see Note 7). The accounting policies of the segments are the same as those of the Company as set forth in Note 2.
|
2018
|
2017
|
2016
|
|||||||||
|
Net revenues:
|
|
|
|
|
|||||||
|
DIS business
|
$
|
7,204
|
|
$
|
7,068
|
|
$
|
6,837
|
|
||
|
All other operating segments
|
327
|
|
334
|
|
377
|
|
|||||
|
Total net revenues
|
$
|
7,531
|
|
$
|
7,402
|
|
$
|
7,214
|
|
||
|
Operating earnings (loss):
|
|
|
|
|
|||||||
|
DIS business
|
$
|
1,235
|
|
$
|
1,313
|
|
$
|
1,244
|
|
||
|
All other operating segments
|
47
|
|
52
|
|
64
|
|
|||||
|
General corporate activities
|
(181
|
)
|
(200
|
)
|
(31
|
)
|
|||||
|
Total operating income
|
1,101
|
|
1,165
|
|
1,277
|
|
|||||
|
Non-operating expenses, net
|
(175
|
)
|
(135
|
)
|
(191
|
)
|
|||||
|
Income before income taxes and equity in earnings of equity method investees
|
926
|
|
1,030
|
|
1,086
|
|
|||||
|
Income tax expense
|
(182
|
)
|
(241
|
)
|
(429
|
)
|
|||||
|
Equity in earnings of equity method investees, net of taxes
|
44
|
|
35
|
|
39
|
|
|||||
|
Net income
|
788
|
|
824
|
|
696
|
|
|||||
|
Less: Net income attributable to noncontrolling interests
|
52
|
|
52
|
|
51
|
|
|||||
|
Net income attributable to Quest Diagnostics
|
$
|
736
|
|
$
|
772
|
|
$
|
645
|
|
||
Depreciation and amortization expense for the years ended
December 31, 2018
,
2017
and
2016
were as follows:
|
2018
|
2017
|
2016
|
|||||||||
|
DIS business
|
$
|
213
|
|
$
|
189
|
|
$
|
170
|
|
||
|
All other operating segments
|
6
|
|
6
|
|
6
|
|
|||||
|
General corporate
|
90
|
|
75
|
|
73
|
|
|||||
|
Total depreciation and amortization
|
$
|
309
|
|
$
|
270
|
|
$
|
249
|
|
||
F- 43
QUEST DIAGNOSTICS INCORPORATED AND SUBSIDIARIES
NOTES TO CONSOLIDATED FINANCIAL STATEMENTS – CONTINUED
(in millions unless otherwise indicated)
Capital expenditures for the years ended
December 31, 2018
,
2017
and
2016
were as follows:
|
2018
|
2017
|
2016
|
|||||||||
|
DIS business
|
$
|
330
|
|
$
|
219
|
|
$
|
264
|
|
||
|
All other operating segments
|
16
|
|
15
|
|
21
|
|
|||||
|
General corporate
|
37
|
|
18
|
|
8
|
|
|||||
|
Total capital expenditures
|
$
|
383
|
|
$
|
252
|
|
$
|
293
|
|
||
Net revenues by major service for the years ended
December 31, 2018
,
2017
and
2016
were as follows:
|
2018
|
2017
|
2016
|
|||||||||
|
Routine clinical testing services
|
$
|
4,217
|
|
$
|
4,006
|
|
$
|
3,878
|
|
||
|
Gene-based and esoteric (including advanced diagnostics) testing services
|
2,409
|
|
2,449
|
|
2,335
|
|
|||||
|
Anatomic pathology testing services
|
578
|
|
612
|
|
624
|
|
|||||
|
All other
|
327
|
|
335
|
|
377
|
|
|||||
|
Total net revenues
|
$
|
7,531
|
|
$
|
7,402
|
|
$
|
7,214
|
|
||
20. RELATED PARTIES
The Company's equity method investees primarily consist of its clinical trials central laboratory services joint venture and its diagnostic information services joint ventures, which are accounted for under the equity method of accounting. During the years ended
December 31, 2018
, 2017 and 2016, the Company recognized net revenues of
$36 million
,
$37 million
and
$33
million, respectively, associated with diagnostic information services provided to its equity method investees. As of both
December 31, 2018
and 2017, there was
$3 million
of accounts receivable from equity method investees related to such services.
During the years ended
December 31, 2018
, 2017 and 2016, the Company recognized income of
$15 million
,
$16 million
and
$19 million
, respectively, associated with the performance of certain corporate services, including transition services, for its equity method investees, classified within selling, general and administrative expenses. As of
December 31, 2018
and 2017, there was
$3 million
and
$7 million
, respectively, of other receivables from equity method investees included in prepaid expenses and other current assets related to these service agreements and other transition related items. In addition, accounts payable and accrued expenses as of both
December 31, 2018
and 2017 included
$1 million
due to equity method investees.
During the year ended December 31, 2018, the Company contributed
$10 million
to an equity method investee to fund its share of an acquisition made by the equity method investee.
21. SUBSEQUENT EVENTS
On February 11, 2019, the Company completed the acquisition of the clinical laboratory service business of Boyce & Bynum Pathology Laboratories, P.C. ("Boyce & Bynum") in an all cash transaction for
$55 million
and up to
$25 million
of contingent consideration if certain testing volume benchmarks are achieved. Boyce and Bynum serves the Midwest region.
The preliminary purchase price allocation for the Boyce & Bynum acquisition, which will be accounted for as a business combination, is not provided as the appraisal necessary to assess the fair values of assets acquired and liabilities assumed is not yet complete, but a significant portion of the purchase price is expected to be allocated to intangible assets and goodwill.
F- 44
QUEST DIAGNOSTICS INCORPORATED AND SUBSIDIARIES
Quarterly Operating Results (unaudited)
(in millions, except per share data)
|
2018 (a)
|
First
Quarter
|
Second
Quarter
|
Third
Quarter
|
Fourth
Quarter
|
Total
Year
|
||||||||||||||
|
(b)
|
(c)
|
(d)
|
(e)
|
||||||||||||||||
|
Net revenues
|
$
|
1,884
|
|
$
|
1,919
|
|
$
|
1,889
|
|
$
|
1,839
|
|
$
|
7,531
|
|
||||
|
Gross profit
|
658
|
|
676
|
|
667
|
|
604
|
|
2,605
|
|
|||||||||
|
Net income
|
189
|
|
233
|
|
227
|
|
139
|
|
788
|
|
|||||||||
|
Less: Net income attributable to noncontrolling interests
|
12
|
|
14
|
|
14
|
|
12
|
|
52
|
|
|||||||||
|
Net income attributable to Quest Diagnostics
|
$
|
177
|
|
$
|
219
|
|
$
|
213
|
|
$
|
127
|
|
$
|
736
|
|
||||
|
Earnings per share attributable to Quest Diagnostics' stockholders:
|
|||||||||||||||||||
|
Basic
|
$
|
1.30
|
|
$
|
1.60
|
|
$
|
1.56
|
|
$
|
0.93
|
|
$
|
5.39
|
|
||||
|
Diluted
|
$
|
1.27
|
|
$
|
1.57
|
|
$
|
1.53
|
|
$
|
0.92
|
|
$
|
5.29
|
|
||||
|
2017 (a)
|
First
Quarter
|
Second
Quarter
|
Third
Quarter
|
Fourth
Quarter
|
Total
Year
|
||||||||||||||
|
(f)
|
(g)
|
(h)
|
(i)
|
||||||||||||||||
|
Net revenues
|
$
|
1,817
|
|
$
|
1,864
|
|
$
|
1,856
|
|
$
|
1,865
|
|
$
|
7,402
|
|
||||
|
Gross profit
|
652
|
|
694
|
|
666
|
|
671
|
|
2,683
|
|
|||||||||
|
Net income
|
175
|
|
207
|
|
175
|
|
267
|
|
824
|
|
|||||||||
|
Less: Net income attributable to noncontrolling interests
|
11
|
|
14
|
|
14
|
|
13
|
|
52
|
|
|||||||||
|
Net income attributable to Quest Diagnostics
|
$
|
164
|
|
$
|
193
|
|
$
|
161
|
|
$
|
254
|
|
$
|
772
|
|
||||
|
Earnings per share attributable to Quest Diagnostics' stockholders:
|
|||||||||||||||||||
|
Basic
|
$
|
1.19
|
|
$
|
1.40
|
|
$
|
1.18
|
|
$
|
1.86
|
|
$
|
5.63
|
|
||||
|
Diluted
|
$
|
1.16
|
|
$
|
1.37
|
|
$
|
1.15
|
|
$
|
1.82
|
|
$
|
5.50
|
|
||||
|
(a)
|
The process for estimating revenues and the ultimate collection of accounts receivable involves significant judgment and estimation. The Company follows a standard process, which considers historical denial and collection experience and other factors, to estimate contractual allowances and implicit price concessions, recording adjustments in the current period as changes in estimates. Based on this process, during the fourth quarter of 2018, the Company increased its reserves for revenues and accounts receivable by approximately
$35 million
(see Note 3 to the consolidated financial statements). Net revenues for 2017 have been restated to reflect the impact of new revenue recognition rules that became effective January 1, 2018 and were adopted on a retrospective basis (see Note 2 to the consolidated financial statements).
|
|
(b)
|
Included pre-tax charges of
$31 million
, primarily associated with workforce reduction, systems conversions and integration incurred in connection with further restructuring and integrating the Company (
$12 million
in cost of services,
$18 million
in selling, general and administrative expenses and
$1 million
in other operating (income) expense, net); and excess tax benefits associated with stock-based compensation arrangements of
$8 million
recorded in income tax expense.
|
|
(c)
|
Included pre-tax charges of
$25 million
, primarily associated with workforce reduction, systems conversions and integration incurred in connection with further restructuring and integrating the Company (
$14 million
in cost of services and
$11 million
in selling, general and administrative expenses); net pre-tax charges of
$10 million
, primarily associated with certain legal matters partially offset by a gain associated with an insurance claim for hurricane related losses (
$11 million
in cost of services offset by a
$1 million
gain in other operating (income) expense, net); excess tax benefits associated with stock-based compensation arrangements of
$5 million
recorded in income tax expense; and an income tax benefit of
$15 million
associated with a change in a tax return accounting method that enabled the company to accelerate the deduction of certain expenses on its 2017 tax return at the federal corporate statutory tax rate in effect during 2017.
|
F- 45
QUEST DIAGNOSTICS INCORPORATED AND SUBSIDIARIES
Quarterly Operating Results (unaudited)
(in millions, except per share data)
|
(d)
|
Included pre-tax charges of
$19 million
, primarily associated with workforce reduction, systems conversions and integration incurred in connection with further restructuring and integrating the Company (
$10 million
in cost of services and
$9 million
in selling, general and administrative expenses); a pre-tax benefit of
$12 million
primarily associated with the decrease in the fair value of the contingent consideration accrual associated with the MedXM acquisition partially offset by non-cash asset impairment charges (
$13 million
gain in other operating (income) expense, net offset by
$1 million
in cost of services); and excess tax benefits associated with stock-based compensation arrangements of
$4 million
recorded in income tax expense.
|
|
(e)
|
Included pre-tax charges of
$47 million
, primarily associated with workforce reductions, systems conversions and integration incurred in connection with further restructuring and integrating the Company (
$20 million
in cost of services and
$27 million
in selling, general and administrative expenses); pre-tax charges of
$4 million
, primarily associated with the loss on the sale of a foreign subsidiary recorded in loss (gain) on disposition of business;
$1 million
of income tax expense associated with finalizing the impact of the enactment of TCJA; and excess tax benefits associated with stock-based compensation arrangements of
$1 million
recorded in income tax expense.
|
|
(f)
|
Included pre-tax charges of
$18 million
, primarily associated with systems conversions and integration incurred in connection with further restructuring and integrating the Company (
$10 million
in cost of services and
$8 million
in selling, general and administrative expenses); and excess tax benefits associated with stock-based compensation arrangements of
$16 million
recorded in income tax expense.
|
|
(g)
|
Included pre-tax charges of
$23 million
, primarily associated with systems conversions and integration incurred in connection with further restructuring and integrating the Company (
$9 million
in cost of services,
$13 million
in selling, general and administrative expenses, and
$1 million
in equity in earnings of equity method investees, net of taxes); pre-tax gain of
$7 million
related to the sale of an interest in an equity method investment recorded in other (expense) income, net;
$2 million
in costs incurred related to certain legal matters recorded in selling, general and administrative expenses; and excess tax benefits associated with stock-based compensation arrangements of
$13 million
recorded in income tax expense.
|
|
(h)
|
Included pre-tax charges of
$23 million
, primarily associated with systems conversions and integration incurred in connection with further restructuring and integrating the Company (
$12 million
in cost of services and
$11 million
in selling, general and administrative expenses); pre-tax charges of
$9 million
primarily associated with non-cash asset impairment charges and incremental costs incurred as a result of hurricanes (
$3 million
in cost of services,
$1 million
in selling, general and administrative expenses, and
$5 million
in other (expense) income, net); and excess tax benefits associated with stock-based compensation arrangements of
$7 million
recorded in income tax expense.
|
|
(i)
|
Included pre-tax charges of
$42 million
, primarily associated with systems conversions, integration and workforce reductions incurred in connection with further restructuring and integrating the Company (
$14 million
in cost of services and
$28 million
in selling, general and administrative expenses); pre-tax charges of
$6 million
, primarily related to non-cash asset impairment charges and incremental costs incurred as a result of the hurricanes (
$2 million
in cost of services and
$4 million
in selling, general and administrative expenses); a provisional estimated income tax benefit of
$106 million
associated with the TCJA, including a deferred income tax benefit of
$115 million
primarily due to the remeasurement of net deferred tax liabilities and reserves at the new combined federal and state tax rate, partially offset by
$9 million
of current tax expense primarily due to the mandatory repatriation toll charge on undistributed foreign earnings and profits; and excess tax benefits associated with stock-based compensation arrangements of
$1 million
recorded in income tax expense.
|
F- 46
QUEST DIAGNOSTICS INCORPORATED AND SUBSIDIARIES
SCHEDULE II - VALUATION ACCOUNTS AND RESERVES
(in millions)
|
Balance at
Beginning of Year
|
Provision for Doubtful Accounts
|
Net Deductions
and Other
|
Balance at
End of Year
|
||||||||||||
|
Year Ended December 31, 2018
|
|||||||||||||||
|
Doubtful accounts and allowances
|
$
|
13
|
|
$
|
6
|
|
$
|
4
|
|
(a)
|
$
|
15
|
|
||
|
Year Ended December 31, 2017
|
|||||||||||||||
|
Doubtful accounts and allowances
|
$
|
6
|
|
$
|
8
|
|
$
|
1
|
|
(a)
|
$
|
13
|
|
||
|
Year Ended December 31, 2016
|
|||||||||||||||
|
Doubtful accounts and allowances
|
9
|
|
$
|
7
|
|
$
|
10
|
|
(a)
|
$
|
6
|
|
|||
|
(a)
|
Primarily represents the write-off of accounts receivable, net of recoveries.
|
F- 47
SECURITIES AND EXCHANGE COMMISSION
Washington, D.C. 20549
EXHIBITS TO FORM 10-K
For the fiscal year ended
December 31, 2018
Commission File No. 001-12215
QUEST DIAGNOSTICS INCORPORATED
|
Exhibit
Number
|
Description
|
|
3.1
|
|
|
3.2
|
|
|
4.1
|
|
|
4.2
|
|
|
4.3
|
|
|
4.4
|
|
|
4.5
|
|
|
4.6
|
|
|
4.7
|
|
|
4.8
|
|
|
4.9
|
|
|
4.10
|
|
|
4.11
|
|
E -
1
|
4.12
|
|
|
4.13
|
|
|
4.14
|
|
|
4.15
|
|
|
4.16
|
|
|
4.17
|
|
|
4.18
|
|
|
4.19
|
|
|
4.20
|
|
|
4.21
|
|
|
4.22
|
|
|
4.23
|
|
|
4.24
|
|
E -
2
|
4.25
|
|
|
4.26
|
|
|
4.27
|
|
|
4.28
|
|
|
4.29
|
|
|
10.1‡
|
|
|
10.2‡
|
|
|
10.3‡
|
|
|
10.4‡
|
|
|
10.5‡
|
|
|
10.6‡
|
|
|
10.7‡
|
|
|
10.8‡
|
|
E -
3
|
10.9‡
|
|
|
10.10‡
|
|
|
10.11‡*
|
|
|
10.12‡
|
|
|
10.13‡
|
|
|
10.14‡
|
|
|
10.15‡
|
|
|
10.16‡
|
|
|
10.17‡
|
|
|
10.18‡
|
|
|
10.19‡
|
|
|
11.1
|
Statement re: Computation of Earnings Per Common Share (the calculation of per share earnings is in Part II, Item 8, Note 4 to the consolidated financial statements (Earnings Per Share) and is omitted in accordance with Item 601(b)(11) of Regulation S-K)
|
|
21.1*
|
|
|
23.1*
|
|
|
24.1*
|
|
|
31.1*
|
|
|
31.2*
|
|
E -
4
|
32.1**
|
|
|
32.2**
|
|
|
101.INS*
|
dgx-20181231.xml
|
|
101.SCH*
|
dgx-20181231.xsd
|
|
101.CAL*
|
dgx-20181231_cal.xml
|
|
101.DEF*
|
dgx-20181231_def.xml
|
|
101.LAB*
|
dgx-20181231_lab.xml
|
|
101.PRE*
|
dgx-20181231_pre.xml
|
|
*
|
Filed herewith.
|
|
**
|
Furnished herewith.
|
|
‡
|
Management contract or compensatory plan or arrangement required to be filed as an exhibit to this Form 10-K pursuant to Item 15(b) of Form 10-K.
|
E -
5
TABLE OF CONTENTS
Part IIIItem 1. BusinessItem 1A. Risk FactorsItem 1B. Unresolved Staff CommentsItem 2. PropertiesItem 3. Legal ProceedingsItem 4. Mine Safety DisclosuresPart IIItem 5. Market For Registrant's Common Equity, Related Stockholder Matters and Issuer Purchases Of Equity SecuritiesItem 6. Selected Financial DataItem 7. Management's Discussion and Analysis Of Financial Condition and Results Of OperationsItem 7A. Quantitative and Qualitative Disclosures About Market RiskItem 8. Financial Statements and Supplementary DataItem 9. Changes in and Disagreements with Accountants on Accounting and Financial DisclosureItem 9A. Controls and ProceduresItem 9B. Other InformationItem 10. Directors, Executive Officers and Corporate GovernanceItem 11. Executive CompensationItem 12. Security Ownership Of Certain Beneficial Owners and Management and Related Stockholders' MattersItem 13. Certain Relationships and Related Transactions, and Director IndependenceItem 14. Principal Accounting Fees and ServicesPart IVItem 15. Exhibits, Financial Statement SchedulesItem 16. Form 10-k SummaryItem 1. Business: Our StrategyItem 1. Business: The United States Clinical Testing Industry