HORTON D R INC /DE/
10-Ks and 10-Qs
|
|
|
|
|
|
|
|
|
|
|
|
|
|
|
|
|
|
|
|
|
|
|
|
|
|
|
|
|
|
|
|
|
|
|
|
|
|
|
|
|
|
|
|
|
|
|
|
|
|
|
|
|
UNITED STATES SECURITIES AND EXCHANGE COMMISSION
Washington, D.C. 20549
_______________________________________________________________________________________________________________
FORM 10-K
ANNUAL REPORT PURSUANT TO SECTION 13 OR 15(d) OF
THE SECURITIES EXCHANGE ACT OF 1934
For the fiscal year ended September 30, 2012
Commission file number 1-14122
___________________________________________________________________________________________________________________
D.R. Horton, Inc.
(Exact name of registrant as specified in its charter)
|
Delaware
(State or other jurisdiction of incorporation or organization)
|
75-2386963
(I.R.S. Employer Identification No.)
|
|
|
301 Commerce Street, Suite 500, Fort Worth, Texas
(Address of principal executive offices)
|
76102
(Zip Code)
|
|
(817) 390-8200
(Registrant’s telephone number, including area code)
Securities registered pursuant to Section 12(b) of the Act:
|
Title of Each Class
|
Name of Each Exchange on Which Registered
|
|
|
Common Stock, par value $.01 per share
|
New York Stock Exchange
|
|
|
2.00% Convertible Senior Notes due 2014
|
New York Stock Exchange
|
|
Securities registered pursuant to Section 12(g) of the Act: None
Indicate by check mark if the registrant is a well-known seasoned issuer, as defined in Rule 405 of the Securities Act. Yes
x
No
¨
Indicate by check mark if the registrant is not required to file reports pursuant to Section 13 or Section 15(d) of the Act. Yes
¨
No
x
Indicate by check mark whether the registrant (1) has filed all reports required to be filed by Section 13 or 15(d) of the Securities Exchange Act of 1934 during the preceding 12 months (or for such shorter period that the registrant was required to file such reports), and (2) has been subject to such filing requirements for the past 90 days. Yes
x
No
¨
Indicate by check mark whether the registrant has submitted electronically and posted on its corporate Web site, if any, every Interactive Data File required to be submitted and posted pursuant to Rule 405 of Regulation S-T (§ 232.405 of this chapter) during the preceding 12 months (or for such shorter period that the registrant was required to submit and post such files). Yes
x
No
¨
Indicate by check mark if disclosure of delinquent filers pursuant to Item 405 of Regulation S-K is not contained herein, and will not be contained, to the best of registrant’s knowledge, in definitive proxy or information statements incorporated by reference in Part III of this Form 10-K or any amendment to this Form 10-K.
¨
Indicate by check mark whether the registrant is a large accelerated filer, an accelerated filer, a non-accelerated filer, or a smaller reporting company. See the definitions of “large accelerated filer,” “accelerated filer” and “smaller reporting company” in Rule 12b-2 of the Exchange Act.
|
Large accelerated filer
x
|
Accelerated filer
¨
|
Non-accelerated filer
¨
(Do not check if a smaller reporting company)
|
Smaller reporting company
¨
|
|||
Indicate by check mark whether the registrant is a shell company (as defined in Rule 12b-2 of the Exchange Act). Yes
¨
No
x
As of
March 31, 2012
, the aggregate market value of the registrant’s common stock held by non-affiliates of the registrant was approximately
$4,399,754,000
based on the closing price as reported on the New York Stock Exchange.
As of
November 9, 2012
, there we
re
328,166,547
shares of the registrant’s common stock, par value $.01 per share, issued and
320,966,476
shares outstanding.
DOCUMENTS INCORPORATED BY REFERENCE
Portions of the registrant’s definitive Proxy Statement for the
2013
Annual Meeting of Stockholders are incorporated herein by reference (to the extent indicated) in Part III.
D.R. HORTON, INC. AND SUBSIDIARIES
2012 ANNUAL REPORT ON FORM 10-K
TABLE OF CONTENTS
|
ITEM 1.
|
BUSINESS
|
D.R. Horton, Inc. is one of the largest homebuilding companies in the United States. We construct and sell homes through our operating divisions in
26
states and
77
metropolitan markets of the United States, primarily under the name of D.R. Horton,
America’s Builder
. Our common stock is included in the S&P 500 Index and listed on the New York Stock Exchange under the ticker symbol “DHI.” Unless the context otherwise requires, the terms “D.R. Horton,” the “Company,” “we” and “our” used herein refer to D.R. Horton, Inc., a Delaware corporation, and its predecessors and subsidiaries.
Donald R. Horton began our homebuilding business in 1978. In 1991, we were incorporated in Delaware to acquire the assets and businesses of our predecessor companies, which were residential home construction and development companies owned or controlled by Mr. Horton. In 1992, we completed our initial public offering of our common stock. Our company’s growth over the years was achieved by investing available capital into our existing homebuilding markets and into start-up operations in new markets. Additionally, we acquired other homebuilding companies, which strengthened our position in existing markets and expanded our geographic presence and product offerings in other markets. Our homes generally range in size from
1,000
to
4,000
square feet and in price from
$100,000
to
$600,000
. For the year ended
September 30, 2012
, we closed
18,890
homes with an average sales price of approximately
$223,300
.
Through our financial services operations, we provide mortgage financing and title agency services to homebuyers in many of our homebuilding markets. DHI Mortgage, our 100% owned subsidiary, provides mortgage financing services primarily to our homebuilding customers and generally sells the mortgages it originates and the related servicing rights to third-party purchasers. DHI Mortgage originates loans in accordance with purchaser guidelines and historically has sold most of its mortgage production within 30 days of origination. Our subsidiary title companies serve as title insurance agents by providing title insurance policies, examination and closing services, primarily to our homebuilding customers.
Our financial reporting segments consist of six homebuilding segments and a financial services segment. Our homebuilding operations are the most substantial part of our business, comprising approximately
97%
of consolidated revenues, which totaled
$4.4 billion
in fiscal
2012
. Our homebuilding operations generate most of their revenues from the sale of completed homes, with a lesser amount from the sale of land and lots. In addition to building traditional single-family detached homes, we also build attached homes, such as town homes, duplexes, triplexes and condominiums. The sale of detached homes generated approximately
90%
of home sales revenues in fiscal
2012
. Our financial services segment generates its revenues from originating and selling mortgages and collecting fees for title insurance agency and closing services.
Available Information
We make available, as soon as reasonably practicable, on our Internet website all of our reports required to be filed with the Securities and Exchange Commission (SEC). These reports can be found on the “Investors” page of our website under “SEC Filings” and include our annual and quarterly reports on Form 10-K and 10-Q (including related filings in XBRL format), current reports on Form 8-K, beneficial ownership reports on Forms 3, 4, and 5, proxy statements and amendments to such reports. Our SEC filings are also available to the public on the SEC’s website at www.sec.gov, and the public may read and copy any document we file at the SEC’s public reference room located at 100 F Street NE, Washington, D.C. 20549. Further information on the operation of the public reference room can be obtained by calling the SEC at 1-800-SEC-0330. In addition to our SEC filings, our corporate governance documents, including our Code of Ethical Conduct for the CEO, CFO and Senior Financial Officers, are available on the “Investors” page of our website under “Corporate Governance.” Our stockholders may also obtain these documents in paper format free of charge upon request made to our Investor Relations department.
Our principal executive offices are located at 301 Commerce Street, Suite 500, Fort Worth, Texas 76102. Our telephone number is (817) 390-8200, and our Internet website address is
www.drhorton.com
. Information on or linked to our website is not incorporated by reference into this annual report on Form 10-K unless expressly noted.
1
Operating Strategy and Structure
For a substantial part of our company's existence, we achieved significant growth and profitability through an operating strategy focused on capturing greater market share while maintaining a strong balance sheet. To execute our strategy, we invested available capital in our existing homebuilding markets, opportunistically entered new markets and acquired other homebuilding companies.
During the industry downturn over the last several years, we managed our business to generate a significant amount of cash from operations. We used this cash to reduce our outstanding debt and increase our cash balances, which provided us with a strong liquidity position, lower balance sheet leverage and improved operational flexibility. We also implemented restrictive land and lot inventory investment guidelines and did not increase our inventory levels from 2007 through 2011.
Although new home demand remains at low historical levels, in fiscal 2012 we saw an improvement in demand that has positively impacted our profitability and our confidence in the new home market. We have begun increasing our capital investments in land, lot and home inventories to expand our operations, while controlling our construction costs and selling and overhead expenses to increase our profitability. We expect, however, that the recent improvement in conditions will continue to be uneven across our markets in the near term. Our strong balance sheet and liquidity provide us flexibility to execute the appropriate operating strategy in each of our markets based on the relative strength or weakness of housing conditions in each market.
Geographic Diversity
Our homebuilding business began in the Dallas/Fort Worth area, which is still one of our largest local homebuilding operations and home to our corporate headquarters. We significantly expanded our business across the United States by entering additional markets through start-up operations and acquisitions, and we currently operate in
26
states and
77
markets. This provides us with geographic diversification in our homebuilding inventory investments and our sources of revenues and earnings. We believe our diversification strategy helps to mitigate the effects of local and regional economic cycles and enhances our long-term potential.
Economies of Scale
We are the largest homebuilding company in the United States in terms of number of homes closed in fiscal
2012
. By the same measure, we are also one of the five largest builders in many of our markets in fiscal
2012
. We believe that our national, regional and local scale of operations provides us with benefits that may not be available in the same degree to some other smaller homebuilders, such as:
|
•
|
Greater access to and lower cost of capital, due to our strong balance sheet and our lending and capital markets relationships;
|
|
•
|
Negotiation of volume discounts and rebates from national, regional and local materials suppliers and lower labor rates from certain subcontractors; and
|
|
•
|
Enhanced leverage of our general and administrative activities, which allows us greater flexibility to compete for greater market share in each of our markets.
|
Decentralized Operations
We decentralize our homebuilding activities to give operating flexibility to our local division presidents on certain key operating decisions. At
September 30, 2012
, we had
32
separate homebuilding operating divisions, many of which operate in more than one market area. Generally, each operating division consists of a division president; land entitlement, acquisition and development personnel; a sales manager and sales personnel; a construction manager and construction superintendents; customer service personnel; a controller; a purchasing manager and office staff. We believe that division presidents and their management teams, who are familiar with local conditions, generally have better information on which to base many decisions regarding their operations. Our division presidents receive performance bonuses based upon achieving targeted financial and operating metrics related to their operating divisions.
2
Operating Division Responsibilities
Each operating division is responsible for:
|
•
|
Site selection, which involves
|
— A feasibility study;
— Soil and environmental reviews;
— Review of existing zoning and other governmental requirements; and
— Review of the need for and extent of offsite work required to meet local building codes;
|
•
|
Negotiating lot option, land acquisition and related contracts;
|
|
•
|
Obtaining all necessary land development and home construction approvals;
|
|
•
|
Selecting land development subcontractors and ensuring their work meets our contracted scopes;
|
|
•
|
Selecting building plans and architectural schemes;
|
|
•
|
Selecting construction subcontractors and ensuring their work meets our contracted scopes;
|
|
•
|
Planning and managing homebuilding schedules;
|
|
•
|
Developing and implementing local marketing plans;
|
|
•
|
Determining the pricing for each house plan in a given community; and
|
|
•
|
Coordinating post-closing customer service and warranty repairs.
|
Centralized Controls
We centralize the key risk elements of our homebuilding business through our regional and corporate offices. We have four separate homebuilding regional offices. Generally, each regional office consists of a region president, legal counsel, a chief financial officer and limited office support staff. Each of our region presidents and their management teams are responsible for oversight of the operations of certain homebuilding operating divisions, including:
|
•
|
Review and approval of division business plans and budgets;
|
|
•
|
Review of all land and lot acquisition contracts;
|
|
•
|
Review of all business and financial analysis for potential land and lot inventory investments;
|
|
•
|
Oversight of land and home inventory levels; and
|
|
•
|
Review of major personnel decisions and division incentive compensation plans.
|
3
Our corporate executives and corporate office departments are responsible for establishing our operational policies and internal control standards and for monitoring compliance with established policies and controls throughout our operations. The corporate office also has primary responsibility for direct management of certain key risk elements and initiatives through the following centralized functions:
|
•
|
Financing;
|
|
•
|
Cash management;
|
|
•
|
Risk and litigation management;
|
|
•
|
Allocation of capital;
|
|
•
|
Issuance and monitoring of inventory investment guidelines to our operating divisions;
|
|
•
|
Monitoring and analysis of margins, expenses, profitability and inventory levels;
|
|
•
|
Environmental assessments of land and lot acquisitions;
|
|
•
|
Approval and funding of land and lot acquisitions;
|
|
•
|
Accounting and management reporting;
|
|
•
|
Internal audit;
|
|
•
|
Information technology systems;
|
|
•
|
Administration of payroll and employee benefits;
|
|
•
|
Negotiation of national purchasing contracts;
|
|
•
|
Administration of customer satisfaction surveys and reporting of results; and
|
|
•
|
Approval of major personnel decisions and management incentive compensation plans.
|
Cost Management
We control overhead costs by centralizing certain administrative and accounting functions and by monitoring staffing and compensation levels of administrative and management personnel. We review other general and administrative costs to identify efficiencies and savings opportunities in our operating divisions and our regional and corporate offices. We also direct many of our promotional activities toward local real estate brokers, which we believe is an efficient use of our advertising expenditures.
We control construction costs by striving to design our homes efficiently and by obtaining competitive bids for construction materials and labor. We also seek to negotiate favorable pricing from our primary subcontractors and suppliers based on the volume of services and products we purchase from them on a local, regional and national basis. We compare our land development expenditures to budgeted amounts and monitor our construction costs on each house. We review our overall inventory levels, margins, expenses and profitability through our management information systems.
Acquisitions
We routinely evaluate opportunities to profitably expand our operations, including potential acquisitions of other homebuilding or related businesses. In fiscal 2012, we acquired the homebuilding operations of a company that operates in our Southeast region. Acquisitions of homebuilding businesses can provide us with immediate land and home inventories, as well as control of additional land and lot positions through option contracts. In addition, employees may have specialized knowledge of local market conditions, including existing relationships with municipalities, land owners, developers, subcontractors and suppliers. These inventory positions and local market knowledge and relationships could take us several years to develop through our own start-up efforts. We seek to limit the risks associated with acquiring other companies by conducting extensive operational, financial and legal due diligence on each acquisition and by performing financial analysis to determine that each acquisition will have a positive impact on our earnings within an acceptable period of time.
4
Markets
We conduct our homebuilding operations in the geographic regions, states and markets listed below, and we conduct our mortgage and title operations in many of these markets. Our homebuilding operating divisions are aggregated into six reporting segments, also referred to as reporting regions, which comprise the markets below. Our financial statements contain additional information regarding segment performance.
|
State
|
Reporting Region/Market
|
State
|
Reporting Region/Market
|
|||
|
East Region
|
South Central Region
|
|||||
|
Delaware
|
Central Delaware
|
Louisiana
|
Baton Rouge
|
|||
|
Georgia
|
Savannah
|
Lafayette
|
||||
|
Maryland
|
Baltimore
|
New Mexico
|
Las Cruces
|
|||
|
Suburban Washington, D.C.
|
Oklahoma
|
Oklahoma City
|
||||
|
New Jersey
|
North New Jersey
|
Texas
|
Austin
|
|||
|
South New Jersey
|
Dallas
|
|||||
|
North Carolina
|
Charlotte
|
El Paso
|
||||
|
Fayetteville
|
Fort Worth
|
|||||
|
Greensboro/Winston-Salem
|
Houston
|
|||||
|
Jacksonville
|
Killeen/Temple/Waco
|
|||||
|
Raleigh/Durham
|
Midland/Odessa
|
|||||
|
Wilmington
|
Rio Grande Valley
|
|||||
|
Pennsylvania
|
Lancaster
|
San Antonio
|
||||
|
Philadelphia
|
||||||
|
South Carolina
|
Charleston
|
Southwest Region
|
||||
|
Columbia
|
Arizona
|
Phoenix
|
||||
|
Greenville
|
Tucson
|
|||||
|
Hilton Head
|
New Mexico
|
Albuquerque
|
||||
|
Myrtle Beach
|
||||||
|
Virginia
|
Northern Virginia
|
West Region
|
||||
|
California
|
Bay Area
|
|||||
|
Midwest Region
|
Central Valley
|
|||||
|
Colorado
|
Colorado Springs
|
Imperial Valley
|
||||
|
Denver
|
Los Angeles County
|
|||||
|
Fort Collins
|
Riverside County
|
|||||
|
Illinois
|
Chicago
|
Sacramento
|
||||
|
Minnesota
|
Minneapolis/St. Paul
|
San Bernardino County
|
||||
|
San Diego County
|
||||||
|
Southeast Region
|
Ventura County
|
|||||
|
Alabama
|
Birmingham
|
Hawaii
|
Hawaii
|
|||
|
Huntsville
|
Maui
|
|||||
|
Mobile
|
Oahu
|
|||||
|
Montgomery
|
Idaho
|
Boise
|
||||
|
Tuscaloosa
|
Nevada
|
Las Vegas
|
||||
|
Florida
|
Fort Myers/Naples
|
Reno
|
||||
|
Jacksonville
|
Oregon
|
Portland
|
||||
|
Lakeland
|
Utah
|
Salt Lake City
|
||||
|
Melbourne/Vero Beach
|
Washington
|
Seattle/Tacoma
|
||||
|
Miami/West Palm Beach
|
Vancouver
|
|||||
|
Orlando
|
||||||
|
Pensacola/Panama City
|
||||||
|
Tampa/Sarasota
|
||||||
|
Volusia County
|
||||||
|
Georgia
|
Atlanta
|
|||||
|
Middle Georgia
|
||||||
|
Mississippi
|
Gulf Coast
|
|||||
5
When evaluating new or existing homebuilding markets for purposes of capital allocation, we consider local, market-specific factors, including among others:
|
•
|
Economic conditions;
|
|
•
|
Employment levels and job growth;
|
|
•
|
Income level of potential homebuyers;
|
|
•
|
Local housing affordability and typical mortgage products utilized;
|
|
•
|
Market for homes at our targeted price points;
|
|
•
|
Availability of land and lots on acceptable terms;
|
|
•
|
Land entitlement and development processes;
|
|
•
|
New and secondary home sales activity;
|
|
•
|
Competition; and
|
|
•
|
Prevailing housing products, features, cost and pricing.
|
Land Policies
We acquire land after we have completed due diligence and generally after we have obtained the rights (known as entitlements) to begin development or construction work resulting in an acceptable number of residential lots. Before we acquire lots or tracts of land, we will, among other things, complete a feasibility study, which includes soil tests, independent environmental studies and other engineering work. We also evaluate the status of necessary zoning and other governmental entitlements required to develop and use the property for home construction. Although we purchase and develop land primarily to support our homebuilding activities, we may sell land and lots to other developers and homebuilders where we have excess land and lot positions.
We also enter into land/lot option contracts, in which we obtain the right, but generally not the obligation, to buy land or lots at predetermined prices on a defined schedule commensurate with anticipated home closings or planned development. Our option contracts generally are non-recourse, which limits our financial exposure to our earnest money deposited with land and lot sellers and any pre-acquisition due diligence costs we incurred. This enables us to control land and lot positions with limited capital investment, which substantially reduces the risks associated with land ownership and development.
Almost all of our land and lot positions are acquired directly by us. We are a party to a small number of joint ventures, all of which are consolidated in our financial statements.
We attempt to mitigate our exposure to real estate inventory risks by:
|
•
|
Managing our supply of land/lots controlled (owned and optioned) in each market based on anticipated future home closing levels;
|
|
•
|
Monitoring local market and demographic trends, housing preferences and related economic developments, including the identification of desirable housing submarkets based on the quality of local schools, new job opportunities, local growth initiatives and personal income trends;
|
|
•
|
Utilizing land/lot option contracts, where possible;
|
|
•
|
Seeking to acquire developed lots which are substantially ready for home construction, where possible;
|
|
•
|
Limiting the size of acquired land parcels to smaller tracts, where possible, and controlling our investments in land acquisition, land development and housing inventory to match the expected housing demand in each of our operating markets;
|
|
•
|
Generally commencing construction of custom features or optional upgrades on homes under contract only after the buyer’s receipt of mortgage approval and receipt of satisfactory deposits from the buyer; and
|
|
•
|
Monitoring and managing the number of speculative homes (homes under construction without an executed sales contract) built in each subdivision.
|
6
Construction
Our home designs are selected or prepared in each of our markets to appeal to the tastes and preferences of local homebuyers in each community. We also offer optional interior and exterior features to allow homebuyers to enhance the basic home design and to allow us to generate additional revenues from each home sold. We continually adjust our product offerings to address our customers’ expectations for affordability, home size and features.
Substantially all of our construction work is performed by subcontractors. Subcontractors typically are selected after a competitive bidding process and retained for a specific subdivision or series of house plans pursuant to a contract that obligates the subcontractor to complete construction at an agreed-upon price. Agreements with the subcontractors and suppliers we use generally are negotiated for each subdivision or series of house plans. We employ construction superintendents to monitor homes under construction, participate in major design and building decisions, coordinate the activities of subcontractors and suppliers, review the work of subcontractors for quality and cost controls and monitor compliance with zoning and building codes. In addition, our construction superintendents play a significant role in working with our homebuyers by assisting with option selection and home modification decisions, educating buyers on the construction process and instructing buyers on post-closing home maintenance.
Construction time for our homes depends on the weather, availability of labor, materials and supplies, size of the home, and other factors. We typically complete the construction of a home within three to six months.
We typically do not maintain significant inventories of construction materials, except for work in progress materials for homes under construction. Generally, the construction materials used in our operations are readily available from numerous sources. We have contracts exceeding one year with certain suppliers of our building materials that are cancelable at our option with 30 days notice. As housing demand and activity began to increase in fiscal 2012, we experienced minor shortages and delays of materials and labor in some of our operating markets which we expect to be temporary and which have not had a material effect on our consolidated operating results.
Marketing and Sales
We market and sell our homes through commissioned employees and independent real estate brokers. We typically conduct home sales from sales offices located in furnished model homes in each subdivision, and we typically do not offer our model homes for sale until the completion of a subdivision. Our sales personnel assist prospective homebuyers by providing them with floor plans, price information, tours of model homes and assisting them with the selection of options and other custom features. We train and inform our sales personnel as to the availability of financing, construction schedules, and marketing and advertising plans. As our customers are typically first-time or move-up homebuyers, we attempt to adjust our product mix and pricing within our homebuilding markets to keep our homes affordable. As market conditions warrant, we may provide potential homebuyers with one or more of a variety of incentives, including discounts and free upgrades, to be competitive in a particular market.
We market our homes and communities to prospective homebuyers and real estate brokers in our local markets through electronic media, including email, social networking sites and our company Internet website, as well as brochures, flyers, newsletters and promotional events. We also use billboards, radio, television and newspaper advertising as necessary in each local market. We attempt to position our subdivisions in locations that are desirable to potential homebuyers and convenient to or visible from local traffic patterns, which helps to minimize advertising costs. We believe that model homes play a substantial role in our marketing efforts and therefore expend significant effort to create an attractive atmosphere in our model homes.
We also build speculative homes in most of our subdivisions. These homes enhance our marketing and sales efforts to prospective homebuyers who are relocating to these markets, as well as to independent brokers, who often represent homebuyers requiring a completed home within a short time frame. We determine our speculative homes strategy in each market based on local market factors, such as new job growth, the number of job relocations, housing demand and supply, seasonality, current sales contract cancellation trends and our past experience in the market. We maintain a level of speculative home inventory in each subdivision based on our current and planned sales pace, and we monitor and adjust speculative home inventory on an ongoing basis as conditions warrant. Speculative homes help to provide us with opportunities to sell additional homes at a profit and generate positive returns and cash flows on our inventory of owned lots.
7
Our sales contracts require an earnest money deposit which varies in amount among our markets and subdivisions. Additionally, customers are generally required to pay additional deposits when they select options or upgrade features for their homes. Most of our sales contracts stipulate that when customers cancel their contracts with us, we have the right to retain their earnest money and option deposits; however, our operating divisions often choose to refund the deposit. Our sales contracts also include a financing contingency which permits customers to cancel and receive a refund of their deposit if they cannot obtain mortgage financing at prevailing or specified interest rates within a specified period. Our contracts may include other contingencies, such as the sale of an existing home. As a percentage of gross sales orders, cancellations of sales contracts in fiscal
2012
were
24%
, compared to
27%
in fiscal
2011
. The length of time between the signing of a sales contract for a home and delivery of the home to the buyer (closing) is generally from two to six months.
Customer Service and Quality Control
Our operating divisions are responsible for pre-closing quality control inspections and responding to customers’ post-closing needs. We believe that a prompt and courteous response to homebuyers’ needs during and after construction reduces post-closing repair costs, enhances our reputation for quality and service and ultimately leads to repeat and referral business from the real estate community and homebuyers. We typically provide our homebuyers with a ten-year limited warranty for major defects in structural elements such as framing components and foundation systems, a two-year limited warranty on major mechanical systems, and a one-year limited warranty on other construction components. The subcontractors who perform the actual construction also provide us with warranties on workmanship and are generally prepared to respond to us and the homeowner promptly upon request. In addition, some of our suppliers provide manufacturer’s warranties on specified products installed in the home.
Sales Order Backlog
At
September 30, 2012
, the value of our backlog of sales orders was
$1,667.9 million
(
7,240
homes), an increase of
61%
from
$1,036.2 million
(
4,854
homes) at
September 30, 2011
. The average sales price of homes in backlog was
$230,400
at
September 30, 2012
, up
8%
from the
$213,500
average at
September 30, 2011
. Sales order backlog represents homes under contract but not yet closed at the end of the period. Many of the contracts in our sales order backlog are subject to contingencies, including mortgage loan approval and buyers selling their existing homes, which can result in cancellations. A portion of the contracts in backlog will not result in closings due to cancellations. Substantially all of the homes in our sales backlog at
September 30, 2012
are scheduled to close in fiscal year
2013
. Further discussion of our backlog is provided in Item 7 “Management’s Discussion and Analysis of Financial Condition and Results of Operations” under Part II of this annual report on Form 10-K.
Customer Mortgage Financing
We provide mortgage financing services principally to purchasers of our homes in the majority of our homebuilding markets through our 100% owned subsidiary, DHI Mortgage. DHI Mortgage assists in the sales transaction by coordinating the mortgage application, mortgage commitment and home closing processes to facilitate a timely and efficient home-buying experience for our buyers. DHI Mortgage originates mortgage loans for a substantial portion of our homebuyers. During the year ended
September 30, 2012
, DHI Mortgage provided mortgage financing services for approximately
59%
of our total homes closed, and approximately
84%
of DHI Mortgage’s loan volume related to homes closed by our homebuilding operations.
To limit the risks associated with our mortgage operations, DHI Mortgage originates loan products that we believe can be sold to third-party purchasers. DHI Mortgage generally sells the loans and their servicing rights to third-party purchasers shortly after origination with limited recourse provisions. In markets where we currently do not provide mortgage financing, we work with a variety of mortgage lenders that make available to homebuyers a range of mortgage financing programs.
Title Services
Through our subsidiary title companies, we serve as a title insurance agent in selected markets by providing title insurance policies, examination and closing services primarily to the purchasers of homes we build and sell. We currently assume little or no underwriting risk associated with these title policies.
8
Employees
At
September 30, 2012
, we employed
3,477
persons, of whom
923
were sales and marketing personnel,
1,081
were executive, administrative and clerical personnel,
736
were involved in construction and
737
worked in mortgage and title operations. We believe that our relations with our employees are good.
Competition
The homebuilding industry is highly competitive. We compete with numerous other national, regional and local homebuilders for homebuyers, desirable properties, raw materials, skilled labor, employees, management talent and financing. We also compete with resales of existing homes, foreclosed homes and with the rental housing market. Our homes compete on the basis of quality, price, design, mortgage financing terms and location. Our financial services business competes with other mortgage lenders, including national, regional and local mortgage bankers and other financial institutions, some of which are subject to fewer government regulations or have greater access to capital, different lending criteria and broader product offerings.
Governmental Regulation and Environmental Matters
The homebuilding industry is subject to extensive and complex regulations. We and the subcontractors we use must comply with many federal, state and local laws and regulations, including zoning, density and development requirements, building, environmental, advertising, labor and real estate sales rules and regulations. These regulations and requirements affect the development process, as well as building materials to be used, building designs and minimum elevation of properties. Our homes are inspected by local authorities where required, and homes eligible for insurance or guarantees provided by the Federal Housing Administration (FHA) and the Department of Veteran Affairs (VA) are subject to inspection by them. These regulations often provide broad discretion to the administering governmental authorities. In addition, our new housing developments may be subject to various assessments for schools, parks, streets, utilities and other public improvements.
Our homebuilding operations are also subject to an extensive variety of local, state and federal statutes, ordinances, rules and regulations concerning protection of health, safety and the environment. The particular environmental laws for each site vary greatly according to location, environmental condition and the present and former uses of the site and adjoining properties.
Our mortgage company and title insurance agencies must comply with extensive federal and state laws and regulations as administered by numerous federal and state government agencies. These include eligibility and other requirements for participation in the programs offered by the FHA, VA, Government National Mortgage Association (Ginnie Mae), Federal National Mortgage Association (Fannie Mae), Federal Home Loan Mortgage Corporation (Freddie Mac) and the United States Department of Agriculture (USDA). These laws and regulations also require compliance with consumer lending laws and other regulations governing disclosure requirements, prohibitions against discrimination and real estate settlement procedures. These laws and regulations subject our operations to examination by the applicable agencies.
Seasonality
Prior to the recent downturn in the homebuilding industry which began to affect our seasonal patterns in fiscal 2007, we experienced relatively predictable seasonal variations in our quarterly operating results and capital requirements. We began to experience our normal seasonal pattern again in both fiscal 2011 and 2012. We generally have more homes under construction, close more homes and have greater revenues and operating income in the third and fourth quarters of our fiscal year. The seasonal activity increases our working capital requirements for our homebuilding operations during the third and fourth fiscal quarters and increases our funding requirements for the mortgages we originate in our financial services segment at the end of these quarters. As a result of seasonal activity, our quarterly results of operations and financial position at the end of a particular fiscal quarter are not necessarily representative of the balance of our fiscal year.
9
|
ITEM 1A.
|
RISK FACTORS
|
Discussion of our business and operations included in this annual report on Form 10-K should be read together with the risk factors set forth below. They describe various risks and uncertainties we are or may become subject to, many of which are difficult to predict or beyond our control. These risks and uncertainties, together with other factors described elsewhere in this report, have the potential to affect our business, financial condition, results of operations, cash flows, strategies or prospects in a material and adverse manner.
The homebuilding industry experienced a significant downturn in recent years. Although industry conditions improved during fiscal 2012, the general U.S. economy remains weak. A subsequent deterioration in industry conditions could adversely affect our business or financial results.
We experienced one of the most severe housing downturns in U.S. history from 2006 through 2011. During this downturn, we experienced significant reductions in our home sales and homebuilding revenues, and we incurred substantial asset impairments and write-offs. Our recent results and other national data indicate that the overall demand for new homes improved during fiscal 2012. However, both national new home sales and our company's home sales remain below historical levels due to the current weak U.S. economic conditions, the restrictive mortgage lending environment and variations in local housing market conditions. The U.S. economy could be negatively impacted in the short-term by potential changes in fiscal, tax and monetary policies currently under consideration by the federal government. Therefore, it remains uncertain whether homebuilding industry conditions will continue to improve, remain stable or deteriorate from current levels. A subsequent deterioration in industry conditions could adversely affect our business or financial results.
The homebuilding industry is cyclical and affected by changes in economic, real estate or other conditions that could adversely affect our business or financial results.
The homebuilding industry is cyclical and is significantly affected by changes in general and local economic and real estate conditions, such as:
|
•
|
employment levels;
|
|
•
|
availability of financing for homebuyers;
|
|
•
|
interest rates;
|
|
•
|
consumer confidence;
|
|
•
|
levels and prices of new homes for sale and alternatives to new homes, including foreclosed homes, homes held for sale by investors and speculators, other existing homes and rental properties;
|
|
•
|
demographic trends; and
|
|
•
|
housing demand.
|
Adverse changes in these general and local economic conditions or deterioration in the broader economy could have a negative impact on our business or financial results. Also, changes in these economic conditions may affect some of our regions or markets more than others. If adverse conditions affect any of our larger markets, they could have a proportionately greater impact on us than on some other homebuilding companies.
Weather conditions and natural disasters, such as hurricanes, tornadoes, earthquakes, wildfires, volcanic activity, droughts, and floods, can harm our homebuilding business. These can delay home closings, adversely affect the cost or availability of materials or labor, or damage homes under construction. The climates and geology of many of the states in which we operate, including California, Florida, Texas and other coastal areas, where we have some of our larger operations, present increased risks of adverse weather or natural disasters.
Deployments of U.S. military personnel to foreign regions, terrorist attacks, other acts of violence or threats to national security and any corresponding response by the United States or others, or related domestic or international instability, may adversely affect general economic conditions or cause a slowdown of the economy.
10
As a result of the foregoing matters, potential customers may be less willing or able to buy our homes. In the future, our pricing and product strategies may also be limited by market conditions. We may be unable to change the mix of our home offerings, reduce the costs of the homes we build, offer more affordable homes or satisfactorily address changing market conditions in other ways without adversely affecting our profit margins. In addition, cancellations of home sales contracts in backlog may increase if homebuyers choose to not honor their contracts due to any of the factors discussed above.
Our financial services business is closely related to our homebuilding business, as it originates mortgage loans principally to purchasers of the homes we build. A decrease in the demand for our homes because of the foregoing matters will also adversely affect the financial results of this segment of our business. An increase in the default rate on the mortgages we originate may adversely affect our ability to sell the mortgages or the pricing we receive upon the sale of mortgages or may increase our recourse obligations for previous originations. We establish reserves related to mortgages we have sold; however, actual future obligations related to these mortgages could differ significantly from our currently estimated amounts.
Constriction of the credit markets could limit our ability to access capital and increase our costs of capital.
During the recent industry downturn we generated substantial operating cash flow, and we relied principally on our cash on hand to meet our working capital needs and repay outstanding indebtedness. During much of the downturn, the credit markets constricted and reduced some sources of liquidity that were previously available to us. There likely will be other periods in the future when financial market upheaval will limit our ability to access the public debt markets or obtain bank financing, or doing so will increase our cost of capital.
We recently obtained a revolving credit facility, which provides committed loan financing for
five
years in an amount currently totaling
$600 million
. Also, our mortgage subsidiary, DHI Mortgage, uses a mortgage repurchase facility to finance many of the loans it originates. The mortgage repurchase facility must be renewed annually, and it currently expires in March 2013. Adverse changes in market conditions could make the renewal of these facilities more difficult or could result in an increase in the cost of these facilities or a decrease in their committed availability. Such changes affecting our mortgage repurchase facility may also make it more difficult or costly to sell the mortgages that we originate.
We believe that our existing cash resources, our revolving credit facility and our mortgage repurchase facility provide sufficient liquidity to fund our near-term working capital needs and debt obligations. We regularly assess our projected capital requirements to fund future growth in our business, repay our longer-term debt obligations, and support our other general corporate and operational needs, and we regularly evaluate our opportunities to raise additional capital. As market conditions permit, we may issue new debt or equity securities through the public capital markets or obtain additional bank financing to fund our projected capital requirements or provide additional liquidity. Adverse changes in economic, homebuilding or capital market conditions could negatively impact our business, liquidity and financial results.
Reductions in the availability of mortgage financing and the liquidity provided by government-sponsored enterprises, the effects of government programs, a decrease in our ability to sell mortgage loans on attractive terms or an increase in mortgage interest rates could adversely affect our business or financial results.
During the last six years, the mortgage lending industry has experienced significant change and contraction. Credit requirements have tightened and investor demand for mortgage loans and mortgage-backed securities has been predominantly limited to securities backed by Fannie Mae, Freddie Mac or Ginnie Mae. As a result, it is difficult for some potential buyers to finance the purchase of our homes. Further tightening of credit requirements could adversely affect our business or financial results.
We believe that the liquidity provided by Fannie Mae, Freddie Mac and Ginnie Mae to the mortgage industry has been very important to the housing market. Fannie Mae and Freddie Mac have required substantial injections of capital from the federal government and may require additional government support in the future. There has been ongoing discussion by the government with regard to the long term structure and viability of Fannie Mae and Freddie Mac. These discussions include the downsizing of their portfolios as well as the tightening of guidelines for their loan products. In addition, increased lending volume and losses insured by the FHA have resulted in a reduction of its insurance fund. Any reduction in the availability of the financing or insuring provided by these institutions could adversely affect interest rates, mortgage availability and sales of new homes and mortgage loans. The FHA insures mortgage loans that generally have lower credit requirements and as a result, continue to be a particularly important source for financing the sale of our homes. In recent years, more restrictive guidelines have been placed on FHA insured loans, affecting minimum down payment and availability for condominium financing.
11
Additional future restrictions may negatively affect the availability or affordability of FHA financing, which could adversely affect our ability to sell homes.
While the use of down payment assistance programs by our homebuyers has decreased significantly, some of our customers still utilize 100% financing through programs offered by the VA and United States Department of Agriculture (USDA). These government-sponsored loan programs are subject to changes in regulations, lending standards and government funding levels. There can be no assurances that these programs or other programs will continue to be available in our homebuilding markets or that they will be as attractive to our customers as the programs currently offered, which could negatively affect our sales.
The mortgage loans originated by our financial services operations are generally sold to third-party purchasers. During fiscal 2012, the majority of our mortgage loans were sold to one major financial institution that provided the best pricing and execution relative to other available loan purchasers. On an ongoing basis, we seek to establish additional loan purchase arrangements with multiple institutions. If we are unable to sell mortgage loans to additional purchasers on attractive terms, our ability to originate and sell mortgage loans at competitive prices could be limited, which would negatively affect our profitability.
Even if potential customers do not need financing, changes in the availability of mortgage products may make it more difficult for them to sell their current homes to potential buyers who need financing.
Mortgage rates are currently at historically low levels. If interest rates increase, the costs of owning a home will be affected and could result in a decline in the demand for our homes.
The risks associated with our land and lot inventory could adversely affect our business or financial results.
Inventory risks are substantial for our homebuilding business. We have recently begun to increase our investments in land and lot inventories in response to increased demand for our homes. There are risks inherent in controlling, owning and developing land and if housing demand declines, we may own land or lots at a cost we will not be able to recover fully, or on which we cannot build and sell homes profitably. Also, there can be significant fluctuations in the value of our owned undeveloped land, building lots and housing inventories related to changes in market conditions. As a result, our deposits for building lots controlled under option or similar contracts may be put at risk, we may have to sell homes or land for a lower profit margin or we may have to record inventory impairment charges on our developed and undeveloped land and lots. A significant deterioration in economic or homebuilding industry conditions may result in substantial inventory impairment charges.
Homebuilding is subject to home warranty and construction defect claims in the ordinary course of business that can be significant.
We are subject to home warranty and construction defect claims arising in the ordinary course of our homebuilding business. We rely on subcontractors to perform the actual construction of our homes, and in many cases, to select and obtain construction materials. Despite our detailed specifications and monitoring of the construction process, our subcontractors occasionally use improper construction processes or defective materials in the construction of our homes. When we find these issues, we repair them in accordance with our warranty obligations. We spend significant resources to repair items in homes we have sold to fulfill the warranties we issued to our homebuyers. Additionally, we are subject to construction defect claims which can be costly to defend and resolve in the legal system. Warranty and construction defect matters can also result in negative publicity in the media and on the internet which can damage our reputation and adversely affect our ability to sell homes.
Based on the large number of homes we have sold over the years, our potential liabilities related to warranty and construction defect claims are significant. As a consequence, we maintain product liability insurance, and we obtain indemnities and certificates of insurance from subcontractors covering claims related to their workmanship and materials. We establish warranty and other reserves for the homes we sell based on historical experience in our markets and our judgment of the qualitative risks associated with the types of homes built. Because of the uncertainties inherent to these matters, we cannot provide assurance that our insurance coverage, our subcontractor arrangements and our reserves will be adequate to address all of our future warranty and construction defect claims. Contractual indemnities can be difficult to enforce, we may be responsible for applicable self-insured retentions and some types of claims may not be covered by insurance or may exceed applicable coverage limits. Additionally, the coverage offered by and the availability of product liability insurance for
12
construction defects is limited and costly. We have responded to increases in insurance costs and coverage limitations by increasing our self-insured retentions and claim reserves. There can be no assurance that coverage will not be further restricted or become more costly.
Supply shortages and other risks related to acquiring land, building materials and skilled labor could increase our costs and
delay deliveries.
The homebuilding industry has from time to time experienced significant difficulties that can affect the cost or timing of
construction, including:
|
•
|
difficulty in acquiring land suitable for residential building at affordable prices in desirable locations;
|
|
•
|
shortages of qualified trades people;
|
|
•
|
reliance on local subcontractors, manufacturers and distributors who may be inadequately capitalized;
|
|
•
|
shortages of materials; and
|
|
•
|
volatile increases in the cost of materials, particularly increases in the price of lumber, drywall and cement, which are significant components of home construction costs.
|
These factors may cause us to take longer or incur more costs to build our homes and adversely affect our revenues and margins. If the recent increases in home sales continue or accelerate in future periods, the potential risk of shortages in residential lots, labor and materials available to the homebuilding industry could increase in some markets where we operate.
We are required to obtain performance bonds, the unavailability of which could adversely affect our results of operations and cash flows.
We often are required to provide surety bonds to secure our performance or obligations under construction contracts, development agreements and other arrangements. Our ability to obtain surety bonds primarily depends upon our credit rating, financial condition, past performance and other factors, including the capacity of the surety market and the underwriting practices of surety bond issuers. The ability to obtain surety bonds also can be impacted by the willingness of insurance companies to issue performance bonds for construction and development activities. If we are unable to obtain surety bonds when required, our results of operations and cash flows could be adversely impacted.
Increases in the costs of owning a home could prevent potential customers from buying our homes and adversely affect our business or financial results.
Significant expenses of owning a home, including mortgage interest and real estate taxes, generally are deductible expenses for an individual’s federal, and in some cases state, income taxes, subject to various limitations under current tax law and policy. If the federal government or a state government changes its income tax laws, as has been discussed from time to time, to eliminate or substantially modify these income tax deductions, the after-tax cost of owning a new home would increase for many of our potential customers. The loss or reduction of homeowner tax deductions, if such tax law changes were enacted without offsetting provisions, could adversely impact demand for and sales prices of new homes.
In addition, increases in property tax rates by local governmental authorities, as experienced in some areas in response to reduced federal and state funding, could adversely affect the ability of potential customers to obtain financing or their desire to purchase new homes.
Governmental regulations and environmental matters could increase the cost and limit the availability of our development and homebuilding projects and adversely affect our business or financial results.
We are subject to extensive and complex regulations that affect land development and home construction, including zoning, density restrictions, building design and building standards. These regulations often provide broad discretion to the administering governmental authorities as to the conditions we must meet prior to development or construction being approved, if approved at all. We are subject to determinations by these authorities as to the adequacy of water or sewage facilities, roads or other local services. New housing developments may also be subject to various assessments for schools, parks, streets and other public improvements. In addition, in many markets government authorities have implemented no growth or growth control
13
initiatives. Any of these can limit, delay or increase the costs of development or home construction.
We are also subject to a significant number and variety of local, state and federal laws and regulations concerning protection of health, safety, labor standards and the environment. The impact of environmental laws varies depending upon the prior uses of the building site or adjoining properties and may be greater in areas with less supply where undeveloped land or desirable alternatives are less available. These matters may result in delays, may cause us to incur substantial compliance, remediation, mitigation and other costs, and can prohibit or severely restrict development and homebuilding activity in environmentally sensitive regions or areas. Government agencies also routinely initiate audits, reviews or investigations of our business practices to ensure compliance with these laws and regulations, which can cause us to incur costs or create other disruptions in our business that can be significant.
The subcontractors we rely on to perform the actual construction of our homes are also subject to a significant number of local, state and federal laws and regulations, including laws involving matters that are not within our control. If our subcontractors fail to comply with all applicable laws, we can suffer reputational damage, and may be exposed to possible liability.
We are also subject to an extensive number of laws and regulations because our common stock and debt securities are publicly traded in the capital markets. These regulations govern our communications with our shareholders and the capital markets, our financial statement disclosures and our legal processes, and they also impact the work required to be performed by our independent registered public accounting firm and our legal counsel. Changes in these laws and regulations, including the subsequent implementation of rules by the administering government authorities, can require us to incur additional compliance costs, and such costs can be significant.
In August 2012, the SEC adopted a final rule on conflict minerals as mandated by the Dodd-Frank Wall Street Reform and Consumer Protection Act (Dodd-Frank Act) which was signed into law in July 2010. The rule requires an entity to file a new form to publicly disclose its use of conflict minerals, defined as tantalum, tin, tungsten and gold, if these minerals are necessary to the functionality or production of products it manufactures. Additional reporting is required if it is determined that the conflict minerals were mined from the Democratic Republic of the Congo (DRC) or adjoining countries. This new rule will require us to perform due diligence to determine whether our suppliers use any of these materials in their production processes and the sources of such materials, which will increase our administrative costs. These new requirements could also adversely affect the sourcing, supply and costs of materials used in the construction of our homes.
Governmental regulation of our financial services operations could adversely affect our business or financial results.
Our financial services operations are subject to a significant number of federal, state and local laws and regulations. These include eligibility requirements for participation in federal loan programs, compliance with consumer lending laws and other regulations governing disclosure requirements, prohibitions against discrimination and real estate settlement procedures. Our financial services operations are subject to examination by federal, state and local government agencies. These laws, regulations and examinations may limit our ability to provide mortgage financing or title services to potential purchasers of our homes.
The Dodd-Frank Act provides for a number of new requirements relating to residential mortgage lending practices, many of which are to be developed further by rules enacted by the appropriate government agencies responsible for regulating the mortgage industry. Many of these rules have not yet been finalized or implemented. These include, among others, minimum standards for mortgages and lender practices in making mortgages, limitations on certain fees and incentive arrangements, retention of credit risk and remedies for borrowers in foreclosure proceedings. The effect of such provisions on our financial services business will depend on the rules that are ultimately enacted. Key decisions that have yet to be made concern the characteristics of mortgages that would be exempt from risk retention, how risk retention requirements will be implemented and how derivative trading will be impacted. These factors could restrict the availability of and increase the cost of mortgage credit in addition to increasing the general and administrative costs within our financial services operations.
The turmoil caused by the significant number of defaults and resulting foreclosures during the recent downturn has encouraged consumer lawsuits and the investigation of financial services industry practices by governmental authorities. These investigations may include the examination of consumer lending practices, real estate settlement procedures, foreclosure and servicing policies or other practices in the financial services segments of homebuilding companies. These governmental inquiries could result in changes in regulations or homebuilding industry practices, and they could adversely affect the costs and potential profitability of homebuilding companies. Additionally, if pending legislation is enacted as currently proposed,
14
regulations that favor financial services businesses that are not affiliated with homebuilding companies will place our financial services business at a competitive disadvantage in the marketplace, which would adversely affect its profitability.
Our debt obligations and our ability to comply with related covenants, restrictions or limitations could adversely affect our financial condition.
As of
September 30, 2012
, our consolidated debt was
$2,493.1 million
. We have
$1,147.5 million
principal amount of our debt maturing before the end of fiscal 2014, of which
$500 million
is in the form of convertible senior notes that will mature on May 15, 2014 and are convertible into approximately 38.3 million shares of our common stock at a price of $13.06 per share at maturity. The indentures governing our senior and convertible senior notes do not restrict the incurrence of future unsecured debt by us or our homebuilding subsidiaries or the incurrence of secured or unsecured debt by our financial services subsidiaries, and the agreement governing our revolving credit facility allows us to incur a substantial amount of future unsecured debt. Such instruments also permit us and our homebuilding subsidiaries to incur significant amounts of additional secured debt.
Possible consequences.
The amount and the maturities of our debt could have important consequences. For example, they could:
|
•
|
require us to dedicate a substantial portion of our cash flow from operations to payment of our debt and reduce our ability to use our cash flow for other operating or investing purposes;
|
|
•
|
limit our flexibility in planning for, or reacting to, the changes in our business;
|
|
•
|
limit our ability to obtain future financing for working capital, capital expenditures, acquisitions, debt service requirements or other requirements;
|
|
•
|
place us at a competitive disadvantage if we have more debt than some of our competitors; and
|
|
•
|
make us more vulnerable to downturns in our business or general economic conditions.
|
In addition, the magnitude of our debt and the restrictions imposed by the instruments governing these obligations expose us to additional risks, including:
Dependence on future performance.
Our ability to meet our debt service and other obligations and the financial covenants under our revolving credit facility will depend, in part, upon our future financial performance. Our future results are subject to the risks and uncertainties described in this report. Our revenues and earnings vary with the level of general economic activity in the markets we serve. Our businesses are also affected by financial, political, business and other factors, many of which are beyond our control. The factors that affect our ability to generate cash can also affect our ability to raise additional funds for these purposes through the sale of debt or equity, the refinancing of debt or the sale of assets. Changes in prevailing interest rates may affect our ability to meet our debt service obligations, because borrowings under our revolving credit facility and mortgage repurchase facility bear interest at floating rates.
Revolving credit facility.
Our revolving credit facility contains financial covenants requiring the maintenance of a minimum level of tangible net worth, a maximum allowable leverage ratio and a borrowing base restriction if our leverage ratio exceeds a certain level. A failure to comply with these requirements could allow the lending banks to terminate the availability of funds under the revolving credit facility or cause any outstanding borrowings to become due and payable prior to maturity. Any difficulty experienced in complying with these covenants could make renewal of the facility more difficult or costly.
Mortgage repurchase facility and other restrictions.
The mortgage repurchase facility for our mortgage subsidiary requires the maintenance of a minimum level of tangible net worth, a maximum allowable ratio of debt to tangible net worth and a minimum level of liquidity by our mortgage subsidiary. A failure to comply with these requirements could allow the lending bank to terminate the availability of funds to the mortgage subsidiary or cause its debt to become due and payable prior to maturity. Any difficulty experienced in complying with these covenants could make the renewal of the mortgage repurchase facility more difficult or costly.
15
In addition, although our financial services business is conducted through subsidiaries that are not restricted by our indentures, the ability of our mortgage subsidiary to provide funds to our homebuilding operations would be restricted in the event such distribution of funds would cause an event of default under the mortgage repurchase facility or if an event of default had occurred under this facility. Moreover, our right to receive assets from the mortgage subsidiary upon its liquidation or recapitalization will be subject to the prior claims of its creditors. Any claims we may have to funds from this segment would be subordinate to subsidiary indebtedness to the extent of any security for such indebtedness and to any indebtedness otherwise recognized as senior to our claims.
Changes in debt ratings.
Our senior unsecured debt is currently rated at below investment grade. Any lowering of our debt ratings could make accessing the public capital markets or obtaining additional credit from banks more difficult and/or more expensive.
Change of control purchase options and change of control default.
If a change of control occurs as defined in the indentures governing
$455.5 million
principal amount of our senior notes as of
September 30, 2012
, we would be required to offer to purchase such notes at
101%
of their principal amount, together with all accrued and unpaid interest, if any. In addition, upon the occurrence of both a change of control and a ratings downgrade event, each as defined in the indenture governing
$700 million
principal amount of our senior notes as of
September 30, 2012
, we will be required in certain circumstances to offer to repurchase such notes at
101%
of their principal amount, together with all accrued and unpaid interest, if any. If a fundamental change, including a change of control, occurs as defined in the indenture governing our convertible senior notes, which constituted
$500 million
principal amount as of
September 30, 2012
, we would be required to offer to purchase such notes at par, together with all accrued and unpaid interest, if any. Moreover, a change of control (as defined in the revolving credit facility) would constitute an event of default under the revolving credit facility, which could result in the acceleration of any borrowings outstanding under our revolving credit facility and the termination of the commitments thereunder. If more than $50 million outstanding under the revolving credit facility were accelerated and such acceleration were not rescinded within 30 days, an event of default would result under the indentures governing our senior notes, entitling holders of at least 25 percent in principal amount of the relevant series of notes then outstanding by notice to us and the trustee, to declare all such notes to be due and payable immediately. If purchase offers were required under the indentures for such notes or the borrowings under our revolving credit facility or senior notes were accelerated, we can give no assurance that we would have sufficient funds to pay the amounts that we would be required to purchase.
Homebuilding and financial services are very competitive industries, and competitive conditions could adversely affect our business or financial results.
The homebuilding industry is highly competitive. Homebuilders compete not only for homebuyers, but also for desirable properties, financing, raw materials and skilled labor. We compete with local, regional and national homebuilders, often within larger subdivisions designed, planned and developed by such homebuilders. We also compete with existing home sales, foreclosures and rental properties. The competitive conditions in the homebuilding industry can negatively impact our sales volumes, selling prices and incentive levels, reduce our profit margins, and cause impairments in the value of our inventory or other assets. Competition can also affect our ability to acquire suitable land, raw materials and skilled labor at acceptable prices or terms, or cause delays in the construction of our homes.
Our financial services business competes with other mortgage lenders, including national, regional and local mortgage banks and other financial institutions, some of which are subject to fewer government regulations. Mortgage lenders who are subject to fewer regulations or have greater access to capital or different lending criteria may be able to offer more attractive financing to potential customers.
Our homebuilding and financial services businesses compete with other companies, both from within and outside of these industries, to attract and retain highly skilled and experienced employees, managers and executives. Competition for the services of these individuals will likely increase as business conditions improve in the homebuilding and financial services industries or in the general economy. If we are unable to attract and retain key employees, managers or executives, our business could be adversely impacted.
16
We cannot make any assurances that any future growth strategies will be successful or not expose us to additional risks.
Although we have focused on increasing our market share through internal growth in recent years, we acquired the homebuilding operations of a small company in fiscal 2012 and may make strategic acquisitions of other homebuilding companies or their assets in the future. Successful strategic acquisitions require the integration of operations and management. Although we believe that we have been successful in the past, we can give no assurance that we will be able to successfully identify, acquire and integrate strategic acquisitions in the future. Acquisitions can result in the dilution of existing stockholders if we issue our common stock as consideration, or reduce our liquidity or increase our debt if we fund them with cash. In addition, acquisitions can expose us to valuation risks, including the risk of writing off goodwill or impairing inventory and other assets related to such acquisitions. The risk of goodwill and other asset impairments increases during a cyclical housing downturn when our profitability may decline, as evidenced by the goodwill and other asset impairment charges we recognized during the recent downturn. In addition, we may not be able to successfully implement our operating or internal growth strategies within our existing markets.
Our business and financial results could be adversely affected by significant inflation or deflation.
Inflation can adversely affect us by increasing costs of land, materials and labor. In addition, significant inflation is often accompanied by higher interest rates, which have a negative impact on housing demand. In a highly inflationary environment, depending on industry and other economic conditions, we may be precluded from raising home prices enough to keep up with the rate of inflation, which could reduce our profit margins. Moreover, with inflation, the costs of capital increase and the purchasing power of our cash resources can decline. Current or future efforts by the government to stimulate the economy may increase the risk of significant inflation and its adverse impact on our business or financial results.
Alternatively, a significant period of deflation could cause a decrease in overall spending and borrowing levels. This could lead to a further deterioration in economic conditions, including an increase in the rate of unemployment. Deflation could also cause the value of our inventories to decline or reduce the value of existing homes below the related mortgage loan balance, which could potentially increase the supply of existing homes and have a negative impact on our results of operations.
Our deferred income tax asset may not be fully realizable.
As of
September 30, 2012
, we had a deferred income tax asset, net of deferred tax liabilities, of
$751.4 million
, against which we provided a valuation allowance of
$41.9 million
. The realization of all or a portion of our deferred income tax asset is dependent upon the generation of future taxable income during the statutory carryforward periods and in the jurisdictions in which the related temporary differences become deductible. We have provided the valuation allowance against our net deferred income tax asset because it is more likely than not that a portion of our state net operating loss carryforwards will not be realized due to the more limited carryforward periods that exist in certain states. Our ability to utilize our net operating losses to reduce future income tax obligations would be limited if we experienced an ownership change as defined by Section 382 of the Internal Revenue Code. Under the rules, such an ownership change is generally any change in ownership of more than 50% of its stock within a rolling three-year period, as calculated in accordance with the rules. The rules generally operate by focusing on changes in ownership among stockholders considered by the rules as owning directly or indirectly 5% or more of the stock of the company and any change in ownership arising from new issuances of stock by the company. If we undergo an ownership change for purposes of Section 382 as a result of future transactions involving our common stock, both the amount of and our ability to use any of our net operating loss carryforwards or tax credit carryforwards at the time of ownership change would be subject to the limitations of Section 382. In addition, these limitations may affect the expiration date of any net operating loss carryforwards or tax credit carryforwards, and we may not be able to use them before they expire. This could adversely affect our financial position, results of operations and cash flow. We do not believe we have experienced such an ownership change as of
September 30, 2012
. However, the amount by which our ownership may change in the future is affected by purchases and sales of stock by 5% stockholders, new issuances of stock by us and the potential conversion of our outstanding convertible senior notes and our decision as to whether to settle any such conversions completely or partially in stock. The accounting for deferred income taxes is based upon estimates of future results. Differences between the anticipated and actual outcomes of these future tax consequences could have a material impact on our consolidated results of operations or financial position. Changes in tax laws also affect actual tax results and the valuation of deferred income tax assets over time. Specifically, a decrease in income tax rates would result in a decrease in our deferred tax assets.
17
Information technology failures and data security breaches could harm our business.
We use information technology and other computer resources to carry out important operational and marketing activities and to maintain our business records. These information technology systems are dependent upon global communications providers, web browsers, telephone systems and other aspects of the Internet infrastructure that have experienced security breaches, cyber-attacks, significant systems failures and electrical outages in the past. A material network breach in the security of our information technology systems could include the theft of customer, employee or company data. In February 2012, we experienced a software security breach by unknown external sources in our Internet Loan Prequalification System, which could have resulted in some of our customers’ personal data being compromised. We investigated the breach with the assistance of information technology security experts, and we are working with local and federal law enforcement to aid in their investigation of the breach. Our investigations produced no evidence that any of our customers’ data was actually accessed or exported from our systems. A security breach such as the one we recently experienced or a significant and extended disruption in the functioning of our information technology systems could damage our reputation and cause us to lose customers, adversely impact our sales and revenue and require us to incur significant expense to address and remediate or otherwise resolve these kinds of issues. The release of confidential information as a result of a security breach may also lead to litigation or other proceedings against us by affected individuals or business partners, or by regulators, and the outcome of such proceedings, which could include penalties or fines, could have a significant negative impact on our business. We may also be required to incur significant costs to protect against damages caused by these information technology failures or security breaches in the future. We routinely utilize information technology security experts to assist us in our evaluations of the effectiveness of the security of our information technology systems, and we regularly enhance our security measures to protect our systems and data. However, we cannot provide assurances that a security breach, cyber-attack, data theft or other significant systems failures will not occur in the future, and such occurrences could have a material and adverse effect on our consolidated results of operations or financial position.
18
|
ITEM 1B.
|
UNRESOLVED STAFF COMMENTS
|
None.
|
ITEM 2.
|
PROPERTIES
|
In a
ddition to our inventories of land, lots and homes, we own several office buildings totaling approximately
460,000
square feet, an
d we lease approximately
600,000
square feet of office space under leases expiring through
July 2016
. These properties are located in our various operating markets to house our homebuilding and financial services operating divisions and our regional and corporate offices.
|
ITEM 3.
|
LEGAL PROCEEDINGS
|
We are involved in lawsuits and other contingencies in the ordinary course of business. While the outcome of such contingencies cannot be predicted with certainty, we believe that the liabilities arising from these matters will not have a material adverse effect on our consolidated financial position, results of operations or cash flows. However, to the extent the liability arising from the ultimate resolution of any matter exceeds our estimates reflected in the recorded reserves relating to such matter, we could incur additional charges that could be significant.
In August 2011, the Wage and Hour Division (WHD) of the U.S. Department of Labor notified the Company that it was initiating an investigation to determine the Company's compliance with the Fair Labor Standards Act (FLSA) and, to the extent applicable, other laws enforced by WHD. Subsequently, the WHD reviewed various aspects of our employment processes and practices in our corporate office and some of our operating divisions. To date, the WHD has not communicated any violations of labor laws to the Company. The Company believes that its business practices are in compliance with the FLSA and other applicable laws enforced by WHD. At this time, the Company cannot predict the outcome of this investigation, nor can it reasonably estimate the potential costs that may be associated with its eventual resolution. Consequently, the Company has not recorded any associated liabilities in the accompanying balance sheet.
|
ITEM 4.
|
MINE SAFETY DISCLOSURES
|
Not applicable.
19
|
ITEM 5.
|
MARKET FOR REGISTRANT’S COMMON EQUITY, RELATED STOCKHOLDER MATTERS AND ISSUER PURCHASES OF EQUITY SECURITIES
|
Our common stock is listed on the New York Stock Exchange (NYSE) under the symbol “DHI.” The following table sets forth, for the periods indicated, the range of high and low sales prices for our common stock, as reported by the NYSE, and the quarterly cash dividends declared per common share.
|
|
Year Ended September 30, 2012
|
Year Ended September 30, 2011
|
|||||||||||||||||||||
|
High
|
Low
|
Declared
Dividends
|
High
|
Low
|
Declared
Dividends
|
||||||||||||||||||
|
1st Quarter
|
$
|
12.89
|
|
$
|
8.03
|
|
$
|
0.0375
|
|
$
|
12.30
|
|
$
|
9.77
|
|
$
|
0.0375
|
|
|||||
|
2nd Quarter
|
16.45
|
|
12.74
|
|
0.0375
|
|
13.50
|
|
11.19
|
|
0.0375
|
|
|||||||||||
|
3rd Quarter
|
18.45
|
|
13.80
|
|
0.0375
|
|
12.68
|
|
10.62
|
|
0.0375
|
|
|||||||||||
|
4th Quarter
|
22.46
|
|
16.93
|
|
0.0375
|
|
12.55
|
|
8.82
|
|
0.0375
|
|
|||||||||||
As of
November 9, 2012
, the closing price
of our common stock on the NYSE was
$20.60
, and there were approximately
492
holders of record.
The declaration of future cash dividends is at the discretion of our Board of Directors and will depend upon, among other things, future earnings, cash flows, capital requirements, our financial condition and general business conditions.
The information required by this item with respect to equity compensation plans is set forth under Item 12 of this annual report on Form 10-K and is incorporated herein by reference.
During fiscal years
2012
,
2011
and
2010
, we did not sell any equity securities that were not registered under the Securities Act of 1933, as amended.
Effective
August 1, 2012
, our Board of Directors authorized the repurchase of up to
$100 million
of our common stock effective through
July 31, 2013
. All of the
$100 million
authorization was remaining at
September 30, 2012
, and no common stock has been repurchased subsequent to
September 30, 2012
.
20
Stock Performance Graph
The following graph illustrates the cumulative total stockholder return on D.R. Horton common stock for the last five fiscal years through
September 30, 2012
, compared to the S&P 500 Index and the S&P 500 Homebuilding Index. The comparison assumes a hypothetical investment in D.R. Horton common stock and in each of the foregoing indices of $100 at
September 30, 2007
, and assumes that all dividends were reinvested. Shareholder returns over the indicated period are based on historical data and should not be considered indicative of future shareholder returns. The graph and related disclosure in no way reflect our forecast of future financial performance.
Comparison of Five-Year Cumulative Total Return
Among D.R. Horton, Inc., S&P 500 Index and S&P 500 Homebuilding Index
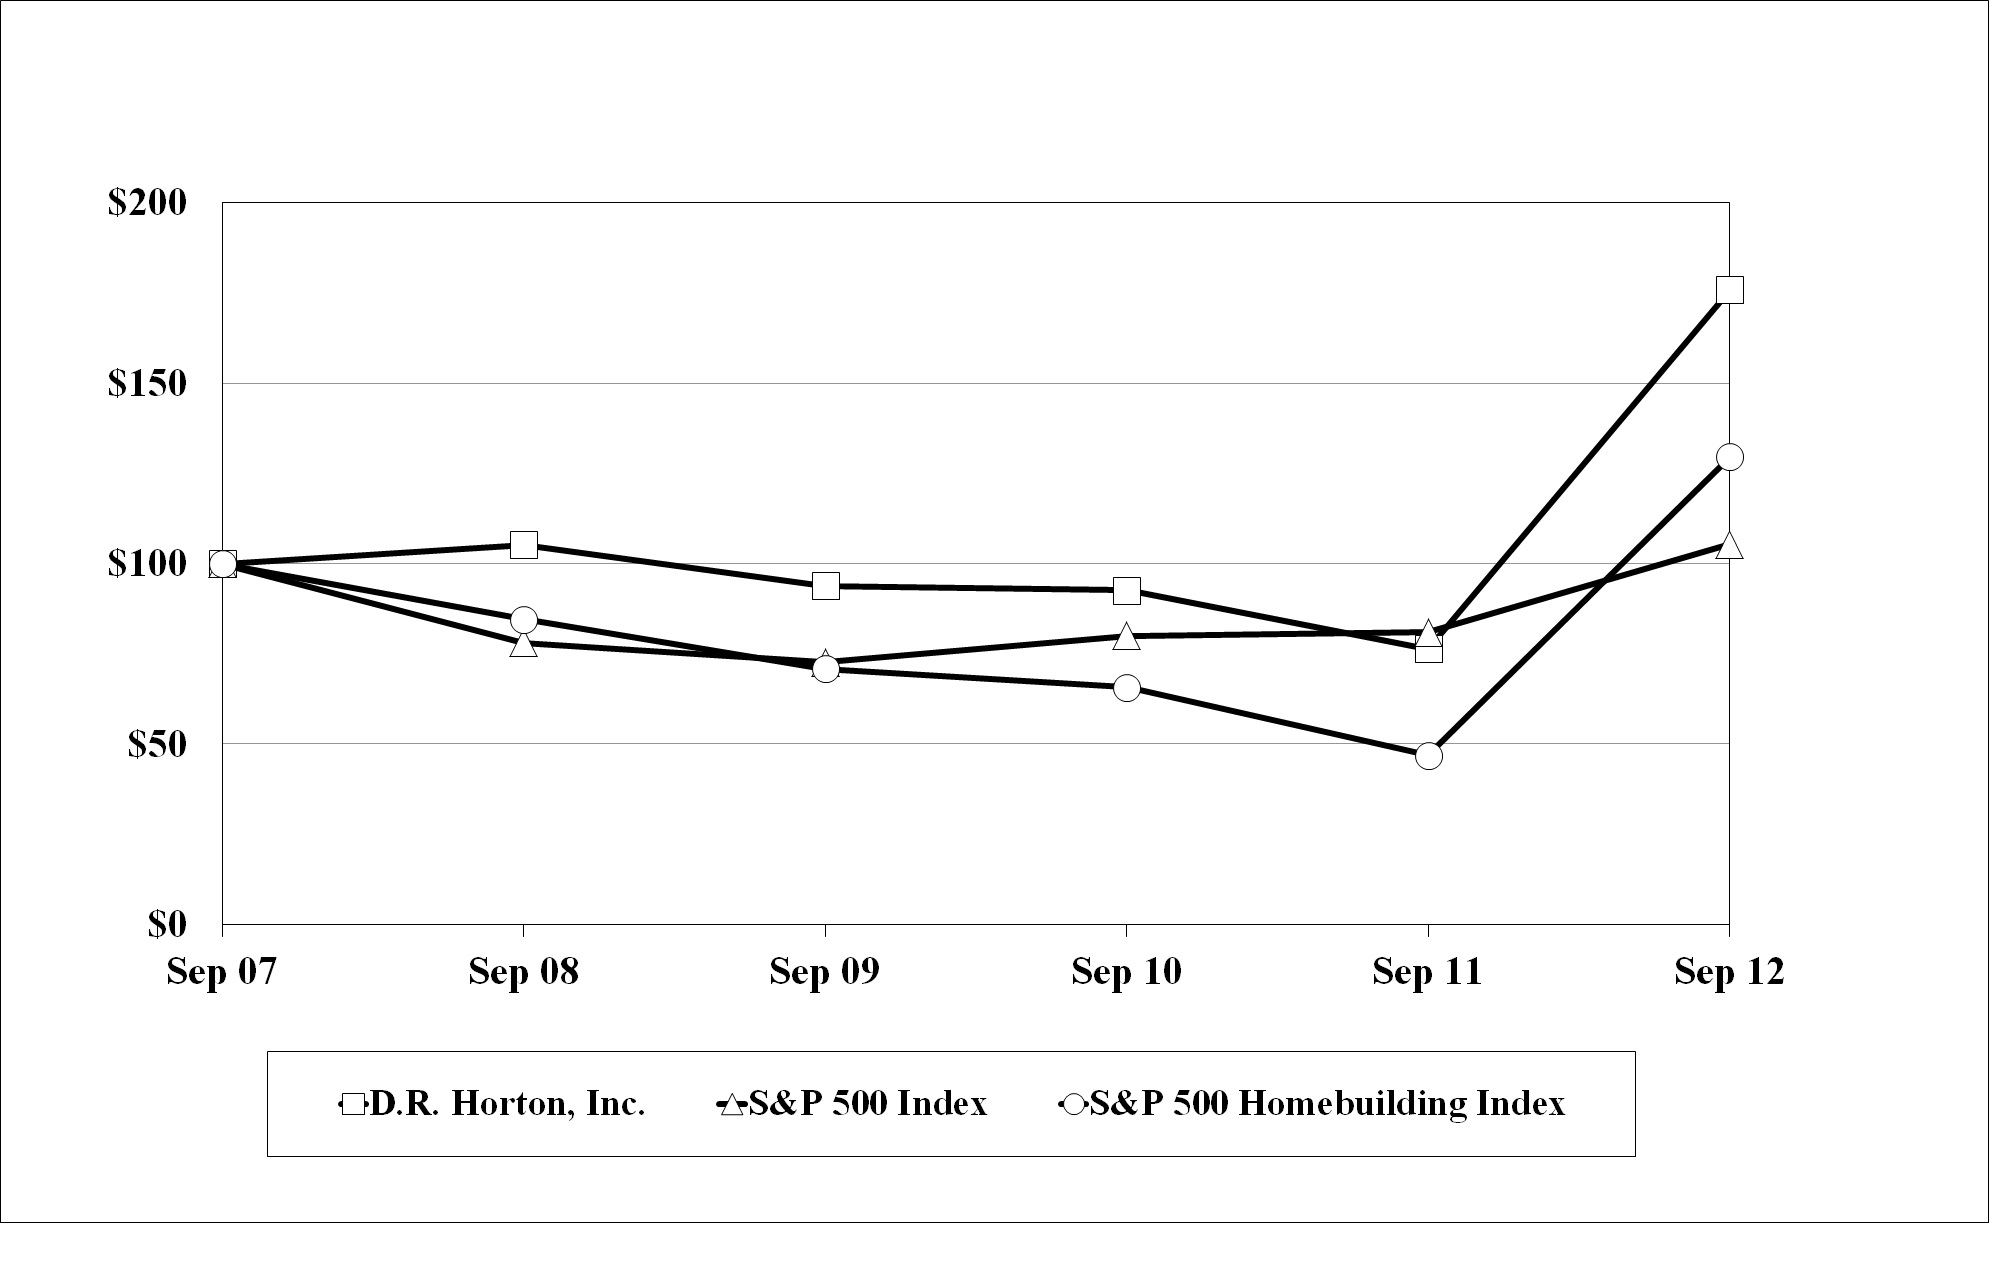
|
|
Year Ended September 30,
|
|||||||||||||||||
|
|
2007
|
2008
|
2009
|
2010
|
2011
|
2012
|
||||||||||||
|
D.R. Horton, Inc.
|
$
|
100.00
|
|
$
|
105.26
|
|
$
|
93.78
|
|
$
|
92.61
|
|
$
|
76.31
|
|
$
|
175.86
|
|
|
S&P 500 Index
|
$
|
100.00
|
|
$
|
78.02
|
|
$
|
72.63
|
|
$
|
80.01
|
|
$
|
80.93
|
|
$
|
105.37
|
|
|
S&P 500 Homebuilding Index
|
$
|
100.00
|
|
$
|
84.62
|
|
$
|
70.88
|
|
$
|
65.75
|
|
$
|
46.87
|
|
$
|
129.62
|
|
This performance graph shall not be deemed to be incorporated by reference into our SEC filings and should not constitute soliciting material or otherwise be considered filed under the Securities Act of 1933, as amended, or the Securities Exchange Act of 1934, as amended.
21
|
ITEM 6.
|
SELECTED FINANCIAL DATA
|
The following selected consolidated financial data are derived from our Consolidated Financial Statements. The data should be read in conjunction with Item 7, “Management’s Discussion and Analysis of Financial Condition and Results of Operations,” Item 1A, “Risk Factors,” Item 8, “Financial Statements and Supplementary Data,” and all other financial data contained in this annual report on Form 10-K. These historical results are not necessarily indicative of the results to be expected in the future.
|
|
Year Ended September 30,
|
||||||||||||||||||
|
|
2012
|
2011
|
2010
|
2009
|
2008
|
||||||||||||||
|
|
|
(In millions, except per share data)
|
|
||||||||||||||||
|
Operating Data:
|
|
|
|
|
|
|
|
|
|
|
|||||||||
|
Revenues:
|
|
|
|
|
|
|
|
|
|
|
|||||||||
|
Homebuilding
|
$
|
4,236.2
|
|
$
|
3,549.6
|
|
$
|
4,309.7
|
|
$
|
3,603.9
|
|
$
|
6,518.6
|
|
||||
|
Financial Services
|
117.8
|
|
87.2
|
|
90.5
|
|
53.7
|
|
127.5
|
|
|||||||||
|
Gross profit (loss) — Homebuilding
|
743.8
|
|
526.3
|
|
682.1
|
|
65.2
|
|
(1,763.2
|
)
|
|||||||||
|
Income (loss) before income taxes:
|
|||||||||||||||||||
|
Homebuilding
|
203.7
|
|
(7.0
|
)
|
78.1
|
|
(541.3
|
)
|
(2,666.9
|
)
|
|||||||||
|
Financial Services
|
39.2
|
|
19.1
|
|
21.4
|
|
(15.5
|
)
|
35.1
|
|
|||||||||
|
Income tax (benefit) expense
|
(713.4
|
)
|
(59.7
|
)
|
(145.6
|
)
|
(7.0
|
)
|
1.8
|
|
|||||||||
|
Net income (loss)
|
956.3
|
|
71.8
|
|
245.1
|
|
(549.8
|
)
|
(2,633.6
|
)
|
|||||||||
|
Net income (loss) per share:
|
|||||||||||||||||||
|
Basic
|
3.01
|
|
0.23
|
|
0.77
|
|
(1.73
|
)
|
(8.34
|
)
|
|||||||||
|
Diluted
|
2.77
|
|
0.23
|
|
0.77
|
|
(1.73
|
)
|
(8.34
|
)
|
|||||||||
|
Cash dividends declared per common share
|
0.15
|
|
0.15
|
|
0.15
|
|
0.15
|
|
0.45
|
|
|||||||||
|
|
September 30,
|
||||||||||||||||||
|
|
2012
|
2011
|
2010
|
2009
|
2008
|
||||||||||||||
|
|
(In millions)
|
||||||||||||||||||
|
Balance Sheet Data:
|
|
|
|
|
|
|
|
|
|
|
|||||||||
|
Cash and cash equivalents and marketable securities
|
$
|
1,345.7
|
|
$
|
1,030.2
|
|
$
|
1,607.0
|
|
$
|
1,957.3
|
|
$
|
1,387.3
|
|
||||
|
Inventories
|
4,165.2
|
|
3,449.7
|
|
3,449.0
|
|
3,666.7
|
|
4,683.2
|
|
|||||||||
|
Total assets
|
7,248.2
|
|
5,358.4
|
|
5,938.6
|
|
6,756.8
|
|
7,950.6
|
|
|||||||||
|
Notes payable (1)
|
2,493.1
|
|
1,704.6
|
|
2,171.8
|
|
3,145.3
|
|
3,748.4
|
|
|||||||||
|
Total equity
|
3,594.7
|
|
2,623.5
|
|
2,622.9
|
|
2,400.6
|
|
2,864.8
|
|
|||||||||
_______________________________________
|
(1)
|
Includes both homebuilding notes payable and the amount outstanding on our mortgage repurchase facility.
|
22
|
ITEM 7.
|
MANAGEMENT’S DISCUSSION AND ANALYSIS OF FINANCIAL CONDITION AND RESULTS OF OPERATIONS
|
Results of Operations — Fiscal Year
2012
Overview
In fiscal
2012
, demand for new homes improved in most of our operating markets, as evidenced by the number and value of our net sales orders increasing
21%
and
29%
compared to the prior year. Revenues from home sales increased
19%
to
$4.2 billion
in fiscal
2012
compared to
$3.5 billion
in fiscal
2011
. The average selling prices of our homes closed increased
5%
and our gross margins on homes closed increased by
160
basis points in fiscal
2012
as compared to fiscal
2011
. Pre-tax income was
$242.9 million
in the current year compared to
$12.1 million
in the prior year. Our sales order backlog of
$1.7 billion
at
September 30, 2012
is up
61%
from a year ago, which positions us for a strong start in fiscal 2013. These results reflect our ability to operate profitably and grow in the current environment through our strategy of investing capital to expand and improve the profitability of our operations, managing inventory levels efficiently and controlling SG&A and interest costs.
Our recent results and other national data indicate that the overall demand for new homes has improved from the prior year. However, both national new home sales and our company's home sales remain below historical levels due to the current weak U.S. economic conditions, the restrictive mortgage lending environment and variations in local housing market conditions. Until there is a more robust U.S. economic recovery, we expect national demand for new homes to remain at historically low levels, with uneven improvement across our operating markets.
We believe our business is well-positioned to benefit from a housing recovery due to our strong balance sheet and liquidity, our finished lot position, our inventory of available homes and our broad geographic operating base, which have allowed us to profitably grow our business in the current market conditions. We have begun increasing our investments in land, lot and home inventories in response to increased demand for our homes and we will continue to adjust our business strategies based on housing demand in each of our markets. Nevertheless, our future results could be negatively impacted by weakening economic conditions, decreases in the level of employment, a significant increase in mortgage interest rates or further tightening of mortgage lending standards.
23
Strategy
While we are encouraged by the recent improvement in new home demand, we are uncertain whether homebuilding industry conditions will continue to improve at the pace we experienced in fiscal 2012. We expect that further improvement in individual markets will be uneven, and will be largely dependent on local economic conditions. However, we believe our strategy through the downturn of generating significant cash flow from operations, increasing our cash balances, reducing our outstanding debt and controlling attractive land and lot positions through option contracts has positioned us to capitalize on improving demand across our markets. In response to increasing new home demand, we are using our liquidity and strong balance sheet to provide the capital and capacity to increase our investments in housing and land inventory, geographically expand our operations, opportunistically pursue business acquisitions and grow our profitability. Our operating strategy includes the following initiatives:
|
•
|
Maintaining a strong cash balance and overall liquidity position.
|
|
•
|
Managing the sales prices and level of sales incentives on our homes to optimize the balance of sales volumes, profits, returns on inventory investments and cash flows.
|
|
•
|
Entering into lot option contracts to purchase finished lots, where possible, which mitigates many of the risks of land ownership.
|
|
•
|
Investing in land acquisition, land development and housing inventory opportunities to meet housing demand and expand our operations in desirable markets.
|
|
•
|
Managing our inventory of homes under construction relative to demand in each of our markets, including starting construction on unsold homes to capture new home demand, monitoring the number and aging of unsold homes and aggressively marketing unsold, completed homes in inventory.
|
|
•
|
Controlling the cost of goods purchased from both vendors and subcontractors.
|
|
•
|
Modifying product offerings and pricing to meet consumer demand in each of our markets.
|
|
•
|
Controlling our SG&A infrastructure to match production levels.
|
Our operating strategy produced positive results in fiscal 2012. However, we cannot provide any assurances that the initiatives listed above will continue to be successful, and we may need to adjust components of our strategy to meet future market conditions. If market conditions do not deteriorate from current levels, we expect that our operating strategy will allow us to grow our profitability while maintaining a strong balance sheet and liquidity position in fiscal 2013.
24
Key Results
Key financial results as of and for our fiscal year ended
September 30, 2012
, as compared to fiscal
2011
, were as follows:
Homebuilding Operations:
|
•
|
Homebuilding revenues
increased
19%
to
$4.2 billion
.
|
|
•
|
Homes closed increased
13%
to
18,890
homes, and the average selling price of those homes increased
5%
to
$223,300
.
|
|
•
|
Net sales orders increased
21%
to
21,048
homes, and the value of net sales orders increased
29%
to
$4.8 billion
.
|
|
•
|
Sales order backlog increased
61%
to
$1.7 billion
.
|
|
•
|
Home sales gross margins increased
160
basis points to
17.7%
.
|
|
•
|
Inventory impairments and land option cost write-offs were
$6.2 million
, compared to
$45.4 million
.
|
|
•
|
Homebuilding SG&A expenses
decreased
as a percentage of homebuilding revenues by
100
basis points to
12.5%
.
|
|
•
|
Interest expensed directly
decreased
53%
to
$23.6 million
.
|
|
•
|
Interest amortized to cost of sales declined to
2.7%
of total home and land/lot cost of sales, from
3.0%
.
|
|
•
|
Homebuilding pre-tax income was
$203.7 million
, compared to a pre-tax loss of
$7.0 million
.
|
|
•
|
Homes in inventory totaled
13,000
, compared to
10,500
.
|
|
•
|
Owned and optioned lots totaled
152,700
, compared to
112,700
.
|
|
•
|
Homebuilding debt was
$2.3 billion
, compared to
$1.6 billion
.
|
|
•
|
Net homebuilding debt to total capital was
21.4%
, up
340
basis points, and gross homebuilding debt to total capital was
39.1%
, up
140
basis points.
|
|
•
|
Homebuilding cash and marketable securities totaled
$1.3 billion
, compared to
$1.0 billion
.
|
|
•
|
Homebuilding inventory totaled
$4.2 billion
, compared to
$3.4 billion
.
|
Financial Services Operations:
|
•
|
Total financial services revenues, net of recourse and reinsurance expenses,
increased
35%
to
$117.8 million
.
|
|
•
|
Financial services pre-tax income
increased
105%
to
$39.2 million
.
|
Consolidated Results:
|
•
|
Consolidated pre-tax income was
$242.9 million
, compared to
$12.1 million
.
|
|
•
|
Income tax benefit was
$713.4 million
, primarily due to the reduction in the valuation allowance on our deferred tax asset in the third quarter of fiscal 2012.
|
|
•
|
Net income was
$956.3 million
, compared to
$71.8 million
.
|
|
•
|
Diluted earnings per share was
$2.77
, compared to
$0.23
.
|
|
•
|
Total equity was
$3.6 billion
, compared to
$2.6 billion
.
|
|
•
|
Net cash used in operations was
$298.1 million
, compared to
$14.9 million
provided by operations.
|
25
Results of Operations — Homebuilding
Our operating segments are our
32
homebuilding operating divisions, which we aggregate into
six
reporting segments. These reporting segments, which we also refer to as reporting regions, have homebuilding operations located in the following states:
|
East:
|
Delaware, Georgia (Savannah only), Maryland, New Jersey, North Carolina, Pennsylvania,
South Carolina and Virginia
|
||
|
Midwest:
|
Colorado, Illinois and Minnesota
|
||
|
Southeast:
|
Alabama, Florida, Georgia and Mississippi
|
||
|
South Central:
|
Louisiana, New Mexico (Las Cruces only), Oklahoma and Texas
|
||
|
Southwest:
|
Arizona and New Mexico
|
||
|
West:
|
California, Hawaii, Idaho, Nevada, Oregon, Utah and Washington
|
||
Fiscal Year Ended
September 30, 2012
Compared to Fiscal Year Ended
September 30, 2011
The following tables and related discussion set forth key operating and financial data for our homebuilding operations by reporting segment as of and for the fiscal years ended
2012
and
2011
.
|
Net Sales Orders (1)
|
|||||||||||||||||||||||||||||
|
Fiscal Year Ended September 30,
|
|||||||||||||||||||||||||||||
|
|
Net Homes Sold
|
Value (In millions)
|
Average Selling Price
|
||||||||||||||||||||||||||
|
2012
|
2011
|
%
Change
|
2012
|
2011
|
%
Change
|
2012
|
2011
|
%
Change
|
|||||||||||||||||||||
|
East
|
2,244
|
2,066
|
9
|
%
|
$
|
565.3
|
|
$
|
482.6
|
|
17
|
%
|
$
|
251,900
|
|
$
|
233,600
|
|
8
|
%
|
|||||||||
|
Midwest
|
1,301
|
1,005
|
29
|
%
|
386.2
|
|
272.0
|
|
42
|
%
|
296,800
|
|
270,600
|
|
10
|
%
|
|||||||||||||
|
Southeast
|
5,378
|
4,019
|
34
|
%
|
1,101.9
|
|
776.1
|
|
42
|
%
|
204,900
|
|
193,100
|
|
6
|
%
|
|||||||||||||
|
South Central
|
6,822
|
6,169
|
11
|
%
|
1,282.3
|
|
1,092.2
|
|
17
|
%
|
188,000
|
|
177,000
|
|
6
|
%
|
|||||||||||||
|
Southwest
|
1,715
|
1,284
|
34
|
%
|
327.7
|
|
239.6
|
|
37
|
%
|
191,100
|
|
186,600
|
|
2
|
%
|
|||||||||||||
|
West
|
3,588
|
2,878
|
25
|
%
|
1,139.9
|
|
865.1
|
|
32
|
%
|
317,700
|
|
300,600
|
|
6
|
%
|
|||||||||||||
|
|
21,048
|
17,421
|
21
|
%
|
$
|
4,803.3
|
|
$
|
3,727.6
|
|
29
|
%
|
$
|
228,200
|
|
$
|
214,000
|
|
7
|
%
|
|||||||||
|
Sales Order Cancellations
|
||||||||||||||||||
|
Fiscal Year Ended September 30,
|
||||||||||||||||||
|
Cancelled Sales Orders
|
Value (In millions)
|
Cancellation Rate (2)
|
||||||||||||||||
|
|
2012
|
2011
|
2012
|
2011
|
2012
|
2011
|
||||||||||||
|
East
|
655
|
689
|
$
|
147.7
|
|
$
|
146.7
|
|
23
|
%
|
25
|
%
|
||||||
|
Midwest
|
192
|
177
|
53.9
|
|
45.9
|
|
13
|
%
|
15
|
%
|
||||||||
|
Southeast
|
1,851
|
1,531
|
351.6
|
|
275.1
|
|
26
|
%
|
28
|
%
|
||||||||
|
South Central
|
2,426
|
2,763
|
436.4
|
|
470.3
|
|
26
|
%
|
31
|
%
|
||||||||
|
Southwest
|
705
|
639
|
120.0
|
|
109.9
|
|
29
|
%
|
33
|
%
|
||||||||
|
West
|
828
|
769
|
256.3
|
|
233.5
|
|
19
|
%
|
21
|
%
|
||||||||
|
|
6,657
|
6,568
|
$
|
1,365.9
|
|
$
|
1,281.4
|
|
24
|
%
|
27
|
%
|
||||||
______________
|
(1)
|
Net sales orders represent the number and dollar value of new sales contracts executed with customers (gross sales orders), net of cancelled sales orders.
|
|
(2)
|
Cancellation rate represents the number of cancelled sales orders divided by gross sales orders.
|
26
Net Sales Orders
The value of net sales orders increased
29%
, to
$4,803.3 million
(
21,048
homes) in
2012
from
$3,727.6 million
(
17,421
homes) in
2011
. The number of net sales orders increased
21%
in fiscal
2012
compared to fiscal
2011
, reflecting an increase in sales demand for our homes. While the improvement in our sales as compared to the prior year reflects improvement in new home demand and market conditions, overall demand for new homes remains at a historically low level.
In comparing fiscal
2012
to fiscal
2011
, the volume of net sales orders increased in all six of our market regions. The largest percentage increases occurred in our Southeast and Southwest regions as a result of improved market conditions in the majority of our Florida markets and in our Phoenix market. Sales orders in our Southeast region were also positively impacted by our acquisition of the homebuilding operations of Breland Homes during the fourth quarter of fiscal 2012, which added
118
homes and
$24.3 million
to our net sales in fiscal 2012 subsequent to the acquisition date. Changes in the value of net sales orders were generally due to the change in the number of homes sold in each respective region and, to a lesser extent, to increases in the average selling price of those homes, reflective of improving market conditions. Our future sales volumes will depend on the strength of the overall economy, employment levels and our ability to successfully implement our operating strategies in each of our markets.
The average price of our net sales orders increased
7%
to
$228,200
in
2012
, from
$214,000
in
2011
. The increase reflects slight increases in the average size and amenity levels of our homes sold, as well as small price increases we have been able to implement recently in some of our communities as demand for new homes has improved.
Our sales order cancellation rate (cancelled sales orders divided by gross sales orders for the period) was
24%
in fiscal
2012
, compared to
27%
in fiscal
2011
. While our cancellation rates have improved, they remain slightly higher than they were prior to the recent housing downturn, and are mainly reflective of tight mortgage lending standards.
|
Sales Order Backlog
|
|||||||||||||||||||||||||||||
|
As of September 30,
|
|||||||||||||||||||||||||||||
|
|
Homes in Backlog
|
Value (In millions)
|
Average Selling Price
|
||||||||||||||||||||||||||
|
2012
|
2011
|
%
Change
|
2012
|
2011
|
%
Change
|
2012
|
2011
|
%
Change
|
|||||||||||||||||||||
|
East
|
663
|
606
|
9
|
%
|
$
|
170.5
|
|
$
|
147.6
|
|
16
|
%
|
$
|
257,200
|
|
$
|
243,600
|
|
6
|
%
|
|||||||||
|
Midwest
|
425
|
288
|
48
|
%
|
127.4
|
|
80.6
|
|
58
|
%
|
299,800
|
|
279,900
|
|
7
|
%
|
|||||||||||||
|
Southeast
|
2,209
|
1,285
|
72
|
%
|
465.0
|
|
246.9
|
|
88
|
%
|
210,500
|
|
192,100
|
|
10
|
%
|
|||||||||||||
|
South Central
|
2,232
|
1,710
|
31
|
%
|
433.5
|
|
309.5
|
|
40
|
%
|
194,200
|
|
181,000
|
|
7
|
%
|
|||||||||||||
|
Southwest
|
699
|
426
|
64
|
%
|
134.9
|
|
76.6
|
|
76
|
%
|
193,000
|
|
179,800
|
|
7
|
%
|
|||||||||||||
|
West
|
1,012
|
539
|
88
|
%
|
336.6
|
|
175.0
|
|
92
|
%
|
332,600
|
|
324,700
|
|
2
|
%
|
|||||||||||||
|
|
7,240
|
4,854
|
49
|
%
|
$
|
1,667.9
|
|
$
|
1,036.2
|
|
61
|
%
|
$
|
230,400
|
|
$
|
213,500
|
|
8
|
%
|
|||||||||
Sales Order Backlog
Sales order backlog represents homes under contract but not yet closed at the end of the period. Many of the contracts in our sales order backlog are subject to contingencies, including mortgage loan approval and buyers selling their existing homes, which can result in cancellations. A portion of the contracts in backlog will not result in closings due to cancellations. Our homes in backlog at
September 30, 2012
increased
49%
from the prior year, with significant increases in most regions due to increases in net sales orders as compared with the prior year. The sales order backlog in the Southeast region at September 30, 2012 included the impact of our acquisition of the homebuilding operations of Breland Homes during the fourth quarter of fiscal 2012.
27
|
Homes Closed and Home Sales Revenue
|
|||||||||||||||||||||||||||||
|
Fiscal Year Ended September 30,
|
|||||||||||||||||||||||||||||
|
|
Homes Closed
|
Value (In millions)
|
Average Selling Price
|
||||||||||||||||||||||||||
|
2012
|
2011
|
%
Change
|
2012
|
2011
|
%
Change
|
2012
|
2011
|
%
Change
|
|||||||||||||||||||||
|
East
|
2,187
|
1,932
|
13
|
%
|
$
|
542.4
|
|
$
|
438.4
|
|
24
|
%
|
$
|
248,000
|
|
$
|
226,900
|
|
9
|
%
|
|||||||||
|
Midwest
|
1,164
|
964
|
21
|
%
|
339.3
|
|
261.5
|
|
30
|
%
|
291,500
|
|
271,300
|
|
7
|
%
|
|||||||||||||
|
Southeast
|
4,682
|
3,546
|
32
|
%
|
930.7
|
|
691.8
|
|
35
|
%
|
198,800
|
|
195,100
|
|
2
|
%
|
|||||||||||||
|
South Central
|
6,300
|
6,150
|
2
|
%
|
1,158.4
|
|
1,080.0
|
|
7
|
%
|
183,900
|
|
175,600
|
|
5
|
%
|
|||||||||||||
|
Southwest
|
1,442
|
1,263
|
14
|
%
|
269.4
|
|
234.8
|
|
15
|
%
|
186,800
|
|
185,900
|
|
—
|
%
|
|||||||||||||
|
West
|
3,115
|
2,840
|
10
|
%
|
978.2
|
|
835.8
|
|
17
|
%
|
314,000
|
|
294,300
|
|
7
|
%
|
|||||||||||||
|
|
18,890
|
16,695
|
13
|
%
|
$
|
4,218.4
|
|
$
|
3,542.3
|
|
19
|
%
|
$
|
223,300
|
|
$
|
212,200
|
|
5
|
%
|
|||||||||
Home Sales Revenue
Revenues from home sales increased
19%
, to
$4,218.4 million
(
18,890
homes closed) in
2012
from
$3,542.3 million
(
16,695
homes closed) in
2011
. The average selling price of homes closed during
2012
was
$223,300
, up
5%
from the
$212,200
average in
2011
, reflecting slight increases in the average size and amenity levels of our homes closed, as well as small price increases we have been able to implement recently in some of our communities as demand for new homes has improved. During fiscal
2012
, home sales revenues increased in all of our market regions, resulting from increases in the number of homes closed and increases in average selling prices.
The number of homes closed in fiscal
2012
increased
13%
from
2011
due to increases in all of our market regions. The most significant percentage increase in the current year occurred in our Southeast region, with the Florida markets contributing the most to the increase. Home closings in the Southeast region also benefited from our acquisition of the homebuilding operations of Breland Homes during the fourth quarter of fiscal 2012, which added
114
home closings and
$22.4 million
to our home sales revenue in fiscal 2012 subsequent to the acquisition date.
Homebuilding Operating Margin Analysis
|
Percentages of
Related Revenues
|
||||||
|
Fiscal Year Ended
September 30,
|
||||||
|
|
2012
|
2011
|
||||
|
Gross profit — Home sales
|
17.7
|
%
|
16.1
|
%
|
||
|
Gross profit — Land/lot sales and other
|
25.3
|
%
|
5.5
|
%
|
||
|
Effect of inventory impairments and land option cost write-offs
on total homebuilding gross profit
|
(0.1
|
)%
|
(1.3
|
)%
|
||
|
Gross profit — Total homebuilding
|
17.6
|
%
|
14.8
|
%
|
||
|
Selling, general and administrative expense
|
12.5
|
%
|
13.5
|
%
|
||
|
Interest expense
|
0.6
|
%
|
1.4
|
%
|
||
|
Loss on early retirement of debt, net
|
—
|
%
|
0.3
|
%
|
||
|
Other (income)
|
(0.3
|
)%
|
(0.2
|
)%
|
||
|
Income (loss) before income taxes
|
4.8
|
%
|
(0.2
|
)%
|
||
28
Home Sales Gross Profit
Gross profit from home sales increased by
30%
, to
$745.5 million
in
2012
, from
$571.3 million
in
2011
, and, as a percentage of home sales revenues,
increased
160
basis points, to
17.7%
. Approximately
130
basis points of the increase in the home sales gross profit percentage was a result of the average selling price of our homes increasing by more than the average cost, reflecting improved market conditions from the prior year. Approximately
40
basis points of the increase was due to a decrease in the amortization of capitalized interest and property taxes as a percentage of homes sales revenues, resulting from reductions in our interest and property taxes incurred and capitalized and more closings occurring on recently acquired finished lots. These increases were partially offset by a
10
basis point decrease due to a $5.3 million out-of-period adjustment in the prior year period related to an error in recording the loss reserves of our 100% owned captive insurance subsidiary that increased gross profit in 2011.
Land Sales and Other Revenues
Land sales and other revenues increased to
$17.8 million
in
2012
, from
$7.3 million
in
2011
. Fluctuations in revenues from land sales are a function of how we manage our inventory levels in various markets. We generally purchase land and lots with the intent to build and sell homes on them; however, we occasionally purchase land that includes commercially zoned parcels which we typically sell to commercial developers, and we also sell residential lots or land parcels to manage our land and lot supply. Land and lot sales occur at unpredictable intervals and varying degrees of profitability. Therefore, the revenues and gross profit from land sales fluctuate from period to period. As of
September 30, 2012
, we had
$32.6 million
of land held for sale that we expect to sell in the next twelve months.
Included in land sales and other revenues, is revenue from a single long-term construction project in which we serve as the general contractor. Revenue is recognized on a percentage-of-completion basis as the construction is completed. In fiscal 2012, the revenue and gross profit related to this project was
$6.5 million
and
$1.2 million
, respectively.
Inventory Impairments and Land Option Cost Write-offs
During fiscal
2012
, we performed our quarterly inventory impairment analyses by reviewing the performance and outlook for all of our land inventories and communities under development for indicators of potential impairment. Based on this review as of
September 30, 2012
, we then performed impairment evaluations of communities with a combined carrying value of
$216.9 million
. Through these evaluations, we determined that communities with a carrying value of
$1.8 million
as of
September 30, 2012
, were impaired. As a result, during the three months ended
September 30, 2012
, we recorded impairment charges of
$0.6 million
to reduce the carrying value of the impaired communities to their estimated fair value, as compared to
$10.2 million
of impairment charges in the same period of
2011
. During fiscal
2012
and
2011
, impairment charges totaled
$3.2 million
and
$37.3 million
, respectively. The decrease in the amount of impairment charges in fiscal
2012
reflects the overall improvement of housing industry conditions and our increased profitability compared to the prior year, which has significantly reduced the number of our communities and carrying value of inventories that have indicators of potential impairment.
It is possible that our estimate of undiscounted cash flows from these communities may change and could result in a future need to record impairment charges to adjust the carrying value of these assets to their estimated fair value. If conditions in the broader economy, homebuilding industry or specific markets in which we operate worsen, and as we re-evaluate specific community pricing and incentives, construction and development plans, and our overall land sale strategies, we may be required to evaluate additional communities or re-evaluate previously impaired communities for potential impairment. These evaluations may result in additional impairment charges.
During fiscal
2012
and
2011
, we wrote off
$3.0 million
and
$8.1 million
, respectively, of earnest money deposits and land option costs related to land option contracts which are not expected to be acquired. At
September 30, 2012
, outstanding earnest money deposits associated with our portfolio of land and lot option purchase contracts totaled
$35.0 million
.
The inventory impairment charges and write-offs of earnest money deposits and land option costs reduced total homebuilding gross profit as a percentage of homebuilding revenues by approximately
10
basis points in fiscal
2012
, compared to
130
basis points in fiscal
2011
.
29
Selling, General and Administrative (SG&A) Expense
SG&A expense from homebuilding activities
increased
10%
to
$528.7 million
in
2012
from
$480.0 million
in
2011
. As a percentage of homebuilding revenues, SG&A expense
decreased
100
basis points, to
12.5%
in
2012
from
13.5%
in
2011
. The largest component of our homebuilding SG&A expense is employee compensation and related costs, which represented
63%
and
60%
of SG&A costs in
2012
and
2011
, respectively. These costs
increased
by
17%
, to
$335.6 million
in
2012
from
$286.5 million
in
2011
, primarily due to an increase in the level of incentive compensation related to the significant increases in revenues, profitability and the price of our common stock in the current year as compared to the prior year. Our homebuilding operations employed approximately
2,740
and
2,380
employees at
September 30, 2012
and
2011
, respectively.
Interest Incurred
Homebuilding interest costs are incurred on our homebuilding debt outstanding during the period. Comparing fiscal
2012
with fiscal
2011
, interest incurred related to homebuilding debt
decreased
7%
to
$120.8 million
, corresponding to a
7%
decrease
in our average homebuilding debt.
We capitalize homebuilding interest to inventory during active development and construction. Our inventory under active development and construction is currently lower than our debt level; therefore, a portion of our interest incurred is expensed. We expensed
$23.6 million
of homebuilding interest during fiscal
2012
, compared to
$50.5 million
of interest during
2011
. The reduction in interest expensed during the current year is a result of an increase in our inventory under active development and construction as well as the decline in interest incurred. Interest amortized to cost of sales, excluding interest written off with inventory impairment charges, declined to
2.7%
of total home and land/lot cost of sales in fiscal
2012
from
3.0%
in fiscal
2011
as a result of more home closings on recently acquired finished lots and decreases in construction times over the past year.
During fiscal
2012
, we retired
$10.8 million
principal amount of our senior notes prior to their maturity. During fiscal
2011
, in addition to repaying
$176.2 million
principal amount of maturing senior notes, we retired
$319.2 million
principal amount of our senior notes prior to their maturity. As a result of the early retirement of these notes, we recognized a net gain of
$0.1 million
and a net loss of
$10.8 million
in fiscal
2012
and
2011
, respectively. These amounts represent the difference between the principal amount of the notes and the aggregate purchase price, after the write-off of any unamortized discounts and fees.
Other Income
Other income, net of other expenses, included in our homebuilding operations was
$12.1 million
in
2012
, compared to
$8.0 million
in
2011
. Other income consists of interest income, rental income and various other types of income not directly associated with our core homebuilding activities. The largest component of other income in both years was interest income.
Acquisitions
In August 2012, we acquired the homebuilding operations of Breland Homes for
$105.9 million
in cash, of which
$9.4 million
was paid subsequent to September 30, 2012. Breland Homes operates in Huntsville and Mobile in Alabama and along the gulf coast of Mississippi. The assets acquired primarily included approximately
300
homes in inventory,
1,000
finished lots and control of approximately
3,700
additional lots through option contracts. We also acquired a sales order backlog of
228
homes valued at
$46.9 million
. The acquisition of the homebuilding operations of Breland Homes was not material to our results of operations or financial condition.
30
Homebuilding Results by Reporting Region
|
|
Fiscal Year Ended September 30,
|
|||||||||||||||||||||
|
|
2012
|
2011
|
||||||||||||||||||||
|
Homebuilding
Revenues
|
Homebuilding
Income Before
Income Taxes (1)
|
% of
Region
Revenues
|
Homebuilding
Revenues
|
Homebuilding
Income (Loss)
Before
Income Taxes (1)
|
% of
Region
Revenues
|
|||||||||||||||||
|
|
|
|
(In millions)
|
|
|
|||||||||||||||||
|
East
|
$
|
542.4
|
|
$
|
16.0
|
|
2.9
|
%
|
$
|
438.5
|
|
$
|
(13.5
|
)
|
(3.1
|
)%
|
||||||
|
Midwest
|
339.3
|
|
1.1
|
|
0.3
|
%
|
261.5
|
|
(13.7
|
)
|
(5.2
|
)%
|
||||||||||
|
Southeast
|
934.6
|
|
38.0
|
|
4.1
|
%
|
696.8
|
|
(19.9
|
)
|
(2.9
|
)%
|
||||||||||
|
South Central
|
1,158.4
|
|
80.6
|
|
7.0
|
%
|
1,081.0
|
|
52.4
|
|
4.8
|
%
|
||||||||||
|
Southwest
|
270.7
|
|
16.8
|
|
6.2
|
%
|
234.8
|
|
(3.8
|
)
|
(1.6
|
)%
|
||||||||||
|
West
|
990.8
|
|
51.2
|
|
5.2
|
%
|
837.0
|
|
(8.5
|
)
|
(1.0
|
)%
|
||||||||||
|
|
$
|
4,236.2
|
|
$
|
203.7
|
|
4.8
|
%
|
$
|
3,549.6
|
|
$
|
(7.0
|
)
|
(0.2
|
)%
|
||||||
_______________
|
(1)
|
Expenses maintained at the corporate level consist primarily of interest and property taxes, which are capitalized and amortized to cost of sales or expensed directly, and the expenses related to operating our corporate office. The amortization of capitalized interest and property taxes is allocated to each segment based on the segment’s revenue, while interest expense and those expenses associated with the corporate office are allocated to each segment based on the segment’s inventory balances.
|
East Region
— Homebuilding revenues
increased
24%
in
2012
compared to
2011
, due to an increase in the number of homes closed as well as an increase in the average selling price in the majority of the region’s markets. The largest increases in closings volume occurred in our Greenville, Charlotte and Raleigh/Durham markets. The region reported pre-tax income of
$16.0 million
in
2012
, compared to a pre-tax loss of
$13.5 million
in
2011
, primarily as a result of increases in revenues and gross profit. Gross profit from home sales as a percentage of home sales revenue (home sales gross profit percentage) increased 240 basis points in fiscal
2012
, compared to fiscal
2011
. As a percentage of homebuilding revenues, SG&A expenses decreased by 160 basis points in
2012
due to the increase in revenues.
Midwest Region
— Homebuilding revenues
increased
30%
in
2012
compared to
2011
, due to an increase in the number of homes closed as well as an increase in the average selling price in the majority of the region’s markets. The largest increases in closings volume occurred in our Denver and Chicago markets. The region reported pre-tax income of
$1.1 million
in
2012
, compared to a pre-tax loss of
$13.7 million
in
2011
, primarily as a result of increases in revenues and gross profit. Home sales gross profit percentage increased 150 basis points in fiscal
2012
, compared to fiscal
2011
. As a percentage of homebuilding revenues, SG&A expenses decreased by 240 basis points in fiscal
2012
due to the increase in revenues.
Southeast Region
— Homebuilding revenues
increased
34%
in
2012
compared to
2011
, primarily due to an increase in the number of homes closed in the majority of the region’s markets. The largest increases in closings volume occurred in our Florida markets. The region reported pre-tax income of
$38.0 million
in
2012
, compared to a pre-tax loss of
$19.9 million
in
2011
, primarily as a result of increases in revenues and gross profit. Home sales gross profit percentage increased 140 basis points in fiscal
2012
, compared to fiscal
2011
. Total gross profit in the prior year was reduced by inventory impairment charges and earnest money and land option cost write-offs totaling $17.4 million. As a percentage of homebuilding revenues, SG&A expenses decreased by 170 basis points in fiscal
2012
due to the increase in revenues.
South Central Region
— Homebuilding revenues
increased
7%
in
2012
compared to
2011
, due to an increase in the average selling price in the majority of the region’s markets. The region reported pre-tax income of
$80.6 million
in 2012, compared to
$52.4 million
in
2011
, primarily as a result of increases in revenues and gross profit. Home sales gross profit percentage increased 170 basis points in fiscal
2012
, compared to fiscal
2011
. As a percentage of homebuilding revenues, SG&A expenses increased by 50 basis points in fiscal
2012
as a result of higher employee incentive compensation costs.
31
Southwest Region
— Homebuilding revenues
increased
15%
in
2012
compared to
2011
, primarily due to an increase in the number of homes closed in the Phoenix market. The region reported pre-tax income of
$16.8 million
in
2012
, compared to a pre-tax loss of
$3.8 million
in
2011
, primarily as a result of increases in revenues and gross profit. Home sales gross profit percentage increased 270 basis points in fiscal
2012
, compared to fiscal
2011
. As a percentage of homebuilding revenues, SG&A expenses decreased by 220 basis points in fiscal
2012
due to the increase in revenues and the reduction in total SG&A expenses.
West Region
— Homebuilding revenues
increased
18%
in
2012
compared to
2011
, due to an increase in the number of homes closed as well as an increase in the average selling price in the majority of the region's markets. The largest increases in closings volume occurred in our Seattle, Salt Lake City and Portland markets. The region reported pre-tax income of
$51.2 million
in
2012
, compared to a pre-tax loss of
$8.5 million
in
2011
, primarily as a result of increases in revenues and gross profit. The improvement in gross profit was the result of fewer inventory impairment charges and earnest money and land option cost write-offs, and an increase in the home sales gross profit percentage of 120 basis points in fiscal
2012
, compared to fiscal
2011
. As a percentage of homebuilding revenues, SG&A expenses decreased by 140 basis points in fiscal
2012
due to the increase in revenues.
32
Land and Lot Position and Homes in Inventory
Our inventory investment strategy includes entering into new lot option contracts to purchase finished lots in our operating markets, where possible, and we attempt to renegotiate existing lot option contracts when necessary to reduce our lot costs and better match the scheduled lot purchases with new home demand in each community. We are also increasing our investments in land acquisition, land development and housing inventory to meet housing demand and expand our operations in desirable markets. We manage our inventory of homes under construction relative to demand in each of our markets, including starting construction on unsold homes to capture new home demand, monitoring the number and aging of unsold homes and aggressively marketing our unsold, completed homes in inventory.
The following is a summary of our land and lot position and homes in inventory at
September 30, 2012
and
2011
:
|
|
As of September 30,
|
|||||||||||||||||||||
|
|
2012
|
2011
|
||||||||||||||||||||
|
Land/Lots
Owned
|
Lots
Controlled
Under Lot
Option and
Similar
Contracts (1)
|
Total
Land/Lots
Owned and
Controlled
|
Homes
in
Inventory
|
Land/Lots
Owned
|
Lots
Controlled
Under Lot
Option and
Similar
Contracts (1)
|
Total
Land/Lots
Owned and
Controlled
|
Homes
in
Inventory
|
|||||||||||||||
|
East
|
11,600
|
|
7,100
|
|
18,700
|
|
1,500
|
9,900
|
|
4,700
|
|
14,600
|
|
1,300
|
||||||||
|
Midwest
|
5,000
|
|
1,100
|
|
6,100
|
|
800
|
5,300
|
|
500
|
|
5,800
|
|
600
|
||||||||
|
Southeast
|
24,900
|
|
20,500
|
|
45,400
|
|
3,400
|
22,500
|
|
9,200
|
|
31,700
|
|
2,600
|
||||||||
|
South Central
|
25,700
|
|
22,300
|
|
48,000
|
|
4,200
|
21,700
|
|
9,700
|
|
31,400
|
|
3,500
|
||||||||
|
Southwest
|
5,200
|
|
4,200
|
|
9,400
|
|
1,000
|
5,300
|
|
1,100
|
|
6,400
|
|
900
|
||||||||
|
West
|
22,200
|
|
2,900
|
|
25,100
|
|
2,100
|
21,100
|
|
1,700
|
|
22,800
|
|
1,600
|
||||||||
|
|
94,600
|
|
58,100
|
|
152,700
|
|
13,000
|
85,800
|
|
26,900
|
|
112,700
|
|
10,500
|
||||||||
|
|
62
|
%
|
38
|
%
|
100
|
%
|
|
76
|
%
|
24
|
%
|
100
|
%
|
|
||||||||
_______________
|
(1)
|
Excludes approximately
5,200
and
8,000
lots at
September 30, 2012
and
2011
, respectively, representing lots controlled under lot option contracts for which we do not expect to exercise our option to purchase the land or lots, but the underlying contracts have yet to be terminated. We have reserved the deposits related to these contracts.
|
At
September 30, 2012
, we owned or controlled approximately
152,700
lots, compared to approximately
112,700
lots at
September 30, 2011
. Of the
152,700
total lots, we controlled approximately
58,100
lots (
38%
), with a total remaining purchase price of approximately
$1.7 billion
, through land and lot option purchase contracts with a total of
$35.0 million
in earnest money deposits. At
September 30, 2012
, approximately
24,700
of our owned lots were finished.
We had a total of approximately
13,000
homes in inventory, including approximately
1,100
model homes at
September 30, 2012
, compared to approximately
10,500
homes in inventory, including approximately
1,100
model homes at
September 30, 2011
. Of our total homes in inventory, approximately
6,400
and
5,600
were unsold at
September 30, 2012
and
2011
, respectively. At
September 30, 2012
, approximately
2,100
of our unsold homes were completed, of which approximately
400
homes had been completed for more than six months. At
September 30, 2011
, approximately
2,800
of our unsold homes were completed, of which approximately
600
homes had been completed for more than six months.
33
Fiscal Year Ended
September 30, 2011
Compared to Fiscal Year Ended
September 30, 2010
The following tables and related discussion set forth key operating and financial data for our homebuilding operations by reporting segment as of and for the fiscal years ended
September 30, 2011
and
2010
.
|
Net Sales Orders (1)
|
|||||||||||||||||||||||||||||||
|
Fiscal Year Ended September 30,
|
|||||||||||||||||||||||||||||||
|
|
Net Homes Sold
|
Value (In millions)
|
Average Selling Price
|
||||||||||||||||||||||||||||
|
2011
|
2010
|
%
Change
|
2011
|
2010
|
%
Change
|
2011
|
2010
|
%
Change
|
|||||||||||||||||||||||
|
East
|
2,066
|
|
2,027
|
|
2
|
%
|
$
|
482.6
|
|
$
|
469.0
|
|
3
|
%
|
$
|
233,600
|
|
$
|
231,400
|
|
1
|
%
|
|||||||||
|
Midwest
|
1,005
|
|
1,045
|
|
(4
|
)%
|
272.0
|
|
296.0
|
|
(8
|
)%
|
270,600
|
|
283,300
|
|
(4
|
)%
|
|||||||||||||
|
Southeast
|
4,019
|
|
3,892
|
|
3
|
%
|
776.1
|
|
728.7
|
|
7
|
%
|
193,100
|
|
187,200
|
|
3
|
%
|
|||||||||||||
|
South Central
|
6,169
|
|
7,375
|
|
(16
|
)%
|
1,092.2
|
|
1,273.4
|
|
(14
|
)%
|
177,000
|
|
172,700
|
|
2
|
%
|
|||||||||||||
|
Southwest
|
1,284
|
|
1,785
|
|
(28
|
)%
|
239.6
|
|
315.3
|
|
(24
|
)%
|
186,600
|
|
176,600
|
|
6
|
%
|
|||||||||||||
|
West
|
2,878
|
|
3,251
|
|
(11
|
)%
|
865.1
|
|
928.6
|
|
(7
|
)%
|
300,600
|
|
285,600
|
|
5
|
%
|
|||||||||||||
|
|
17,421
|
|
19,375
|
|
(10
|
)%
|
$
|
3,727.6
|
|
$
|
4,011.0
|
|
(7
|
)%
|
$
|
214,000
|
|
$
|
207,000
|
|
3
|
%
|
|||||||||
|
Sales Order Cancellations
|
||||||||||||||||||||
|
Fiscal Year Ended September 30,
|
||||||||||||||||||||
|
|
Cancelled Sales Orders
|
Value (In millions)
|
Cancellation Rate (2)
|
|||||||||||||||||
|
|
2011
|
2010
|
2011
|
2010
|
2011
|
2010
|
||||||||||||||
|
East
|
689
|
|
581
|
|
$
|
146.7
|
|
$
|
127.2
|
|
25
|
%
|
22
|
%
|
||||||
|
Midwest
|
177
|
|
250
|
|
45.9
|
|
68.7
|
|
15
|
%
|
19
|
%
|
||||||||
|
Southeast
|
1,531
|
|
1,409
|
|
275.1
|
|
250.0
|
|
28
|
%
|
27
|
%
|
||||||||
|
South Central
|
2,763
|
|
3,076
|
|
470.3
|
|
514.1
|
|
31
|
%
|
29
|
%
|
||||||||
|
Southwest
|
639
|
|
677
|
|
109.9
|
|
115.1
|
|
33
|
%
|
27
|
%
|
||||||||
|
West
|
769
|
|
789
|
|
233.5
|
|
227.3
|
|
21
|
%
|
20
|
%
|
||||||||
|
|
6,568
|
|
6,782
|
|
$
|
1,281.4
|
|
$
|
1,302.4
|
|
27
|
%
|
26
|
%
|
||||||
______________
|
(1)
|
Net sales orders represent the number and dollar value of new sales contracts executed with customers (gross sales orders), net of cancelled sales orders.
|
|
(2)
|
Cancellation rate represents the number of cancelled sales orders divided by gross sales orders.
|
Net Sales Orders
The value of net sales orders decreased
7%
, to
$3,727.6 million
(
17,421
homes) in
2011
from
$4,011.0 million
(
19,375
homes) in
2010
. The number of net sales orders decreased
10%
in fiscal
2011
compared to fiscal
2010
. Sales order volume during the first part of fiscal
2010
benefited from the federal homebuyer tax credit. During the last half of fiscal
2011
, the number and value of our net sales orders were 2% and 8% higher, respectively, than in the last half of fiscal
2010
.
In comparing fiscal
2011
to fiscal
2010
, the value and volume of net sales orders decreased in most of our market regions, with much of the volume decrease resulting from the expiration of the federal homebuyer tax credit. The volume decline in our Southwest region also reflected weaker market conditions in all of its markets, combined with a reduction in the number of active communities during fiscal
2011
. Our East and Southeast regions experienced slight increases in net sales orders as a result of operating more communities during fiscal
2011
. Fluctuations in the value of net sales orders were primarily due to the change in the number of homes sold in each respective region and, to a lesser extent, to small fluctuations in the average selling price of those homes.
34
The average price of our net sales orders in
2011
was
$214,000
, an increase of
3%
from the
$207,000
average in
2010
. The largest percentage increases were in our Southwest and West regions and were primarily due to opening new communities and adjusting our product mix, with higher priced communities representing more of our sales.
Our annual sales order cancellation rate was
27%
in fiscal
2011
, compared to
26%
in fiscal
2010
. These cancellation rates were above historical levels, reflecting the challenges in most of our homebuilding markets.
|
Sales Order Backlog
|
|||||||||||||||||||||||||||||||
|
As of September 30,
|
|||||||||||||||||||||||||||||||
|
|
Homes in Backlog
|
Value (In millions)
|
Average Selling Price
|
||||||||||||||||||||||||||||
|
2011
|
2010
|
%
Change
|
2011
|
2010
|
%
Change
|
2011
|
2010
|
%
Change
|
|||||||||||||||||||||||
|
East
|
606
|
|
472
|
|
28
|
%
|
$
|
147.6
|
|
$
|
103.4
|
|
43
|
%
|
$
|
243,600
|
|
$
|
219,100
|
|
11
|
%
|
|||||||||
|
Midwest
|
288
|
|
247
|
|
17
|
%
|
80.6
|
|
70.1
|
|
15
|
%
|
279,900
|
|
283,800
|
|
(1
|
)%
|
|||||||||||||
|
Southeast
|
1,285
|
|
812
|
|
58
|
%
|
246.9
|
|
162.5
|
|
52
|
%
|
192,100
|
|
200,100
|
|
(4
|
)%
|
|||||||||||||
|
South Central
|
1,710
|
|
1,691
|
|
1
|
%
|
309.5
|
|
297.3
|
|
4
|
%
|
181,000
|
|
175,800
|
|
3
|
%
|
|||||||||||||
|
Southwest
|
426
|
|
405
|
|
5
|
%
|
76.6
|
|
71.9
|
|
7
|
%
|
179,800
|
|
177,500
|
|
1
|
%
|
|||||||||||||
|
West
|
539
|
|
501
|
|
8
|
%
|
175.0
|
|
145.6
|
|
20
|
%
|
324,700
|
|
290,600
|
|
12
|
%
|
|||||||||||||
|
|
4,854
|
|
4,128
|
|
18
|
%
|
$
|
1,036.2
|
|
$
|
850.8
|
|
22
|
%
|
$
|
213,500
|
|
$
|
206,100
|
|
4
|
%
|
|||||||||
Sales Order Backlog
Our homes in backlog at
September 30, 2011
increased
18%
from the prior year, with significant increases in our East, Midwest and Southeast regions. The number of homes in backlog in these regions benefited from more active communities and improved third and fourth quarter sales as compared with the same periods of the prior year.
|
Homes Closed and Home Sales Revenue
|
|||||||||||||||||||||||||||||||
|
Fiscal Year Ended September 30,
|
|||||||||||||||||||||||||||||||
|
|
Homes Closed
|
Value (In millions)
|
Average Selling Price
|
||||||||||||||||||||||||||||
|
2011
|
2010
|
%
Change
|
2011
|
2010
|
%
Change
|
2011
|
2010
|
%
Change
|
|||||||||||||||||||||||
|
East
|
1,932
|
|
2,114
|
|
(9
|
)%
|
$
|
438.4
|
|
$
|
492.2
|
|
(11
|
)%
|
$
|
226,900
|
|
$
|
232,800
|
|
(3
|
)%
|
|||||||||
|
Midwest
|
964
|
|
1,187
|
|
(19
|
)%
|
261.5
|
|
330.9
|
|
(21
|
)%
|
271,300
|
|
278,800
|
|
(3
|
)%
|
|||||||||||||
|
Southeast
|
3,546
|
|
4,049
|
|
(12
|
)%
|
691.8
|
|
745.2
|
|
(7
|
)%
|
195,100
|
|
184,000
|
|
6
|
%
|
|||||||||||||
|
South Central
|
6,150
|
|
8,046
|
|
(24
|
)%
|
1,080.0
|
|
1,378.8
|
|
(22
|
)%
|
175,600
|
|
171,400
|
|
2
|
%
|
|||||||||||||
|
Southwest
|
1,263
|
|
1,872
|
|
(33
|
)%
|
234.8
|
|
329.7
|
|
(29
|
)%
|
185,900
|
|
176,100
|
|
6
|
%
|
|||||||||||||
|
West
|
2,840
|
|
3,607
|
|
(21
|
)%
|
835.8
|
|
1,025.5
|
|
(18
|
)%
|
294,300
|
|
284,300
|
|
4
|
%
|
|||||||||||||
|
|
16,695
|
|
20,875
|
|
(20
|
)%
|
$
|
3,542.3
|
|
$
|
4,302.3
|
|
(18
|
)%
|
$
|
212,200
|
|
$
|
206,100
|
|
3
|
%
|
|||||||||
Home Sales Revenue
Revenues from home sales decreased
18%
, to
$3,542.3 million
(
16,695
homes closed) in
2011
from
$4,302.3 million
(
20,875
homes closed) in
2010
. The average selling price of homes closed during
2011
was
$212,200
, up
3%
from the
$206,100
average in
2010
which reflected a change in product mix rather than broad price appreciation. During fiscal
2011
, home sales revenues decreased in all of our market regions, resulting from decreases in the number of homes closed.
The number of homes closed in fiscal
2011
decreased
20%
due to decreases in all of our market regions. The federal homebuyer tax credit helped stimulate demand for new homes during fiscal
2010
and following its expiration we experienced a significant decline in demand for our homes that extended into fiscal 2011.
35
|
Homebuilding Operating Margin Analysis
|
||||||
|
|
Percentages of
Related Revenues
|
|||||
|
|
Fiscal Year Ended
September 30,
|
|||||
|
|
2011
|
2010
|
||||
|
Gross profit — Home sales
|
16.1
|
%
|
17.3
|
%
|
||
|
Gross profit — Land/lot sales and other
|
5.5
|
%
|
37.8
|
%
|
||
|
Effect of inventory impairments and land option cost write-offs
on total homebuilding gross profit
|
(1.3
|
)%
|
(1.5
|
)%
|
||
|
Gross profit — Total homebuilding
|
14.8
|
%
|
15.8
|
%
|
||
|
Selling, general and administrative expense
|
13.5
|
%
|
12.1
|
%
|
||
|
Interest expense
|
1.4
|
%
|
2.0
|
%
|
||
|
Loss on early retirement of debt, net
|
0.3
|
%
|
0.1
|
%
|
||
|
Other (income)
|
(0.2
|
)%
|
(0.2
|
)%
|
||
|
Income (loss) before income taxes
|
(0.2
|
)%
|
1.8
|
%
|
||
Home Sales Gross Profit
Gross profit from home sales
decreased
by
23%
, to
$571.3 million
in
2011
, from
$744.0 million
in
2010
, and, as a percentage of home sales revenues,
decreased
120
basis points, to
16.1%
. The reduction in gross profit from home sales was primarily due to the increased levels of incentives and discounts needed to sell homes in fiscal
2011
, which narrowed the range between our selling prices and costs of our homes in most of our markets. Fiscal
2010
benefited from the federal homebuyer tax credit, which created demand for our homes without the need for us to provide as many incentives and discounts
Inventory Impairments and Land Option Cost Write-offs
As of
September 30, 2011
, we evaluated communities with a combined carrying value of
$391.5 million
for impairment. Through this evaluation process, we determined that communities with a carrying value of
$37.1 million
as of
September 30, 2011
, were impaired. As a result, during the three months ended
September 30, 2011
, we recorded impairment charges of
$10.2 million
to reduce the carrying value of the impaired communities to their estimated fair value, as compared to
$29.1 million
in the same period of
2010
. During fiscal
2011
and
2010
, impairment charges totaled
$37.3 million
and
$62.3 million
, respectively.
During fiscal
2011
and
2010
, we wrote off
$8.1 million
and
$2.4 million
, respectively, of earnest money deposits and costs related to land option contracts. The inventory impairment charges and write-offs of earnest money deposits and land option costs reduced total homebuilding gross profit as a percentage of homebuilding revenues by approximately
130
basis points in fiscal
2011
, compared to
150
basis points in fiscal
2010
.
Selling, General and Administrative (SG&A) Expense
SG&A expense from homebuilding activities
decreased
8%
to
$480.0 million
in
2011
from
$523.2 million
in
2010
. As a percentage of homebuilding revenues, SG&A expense
increased
140
basis points, to
13.5%
in
2011
from
12.1%
in
2010
. The largest component of our homebuilding SG&A expense is employee compensation and related costs, which represented
60%
and
58%
of SG&A costs in
2011
and
2010
, respectively. These costs
decreased
by
6%
, to
$286.5 million
in
2011
from
$304.0 million
in
2010
, primarily due to a decline in the level of incentive compensation and to a lesser extent, to a decline in the number of employees. Our homebuilding operations employed approximately
2,380
and
2,500
employees at
September 30, 2011
and
2010
, respectively. A reduction in advertising costs also contributed to the decline in SG&A expense.
36
Interest Incurred
Comparing fiscal
2011
with fiscal
2010
, interest incurred related to homebuilding debt decreased
25%
to
$130.2 million
, primarily due to a
26%
decrease
in our average homebuilding debt. We expensed
$50.5 million
of homebuilding interest during fiscal
2011
, compared to
$86.3 million
of interest during fiscal
2010
. The reduction in interest expensed is a result of a decline in interest incurred. Interest amortized to cost of sales, excluding interest written off with inventory impairment charges, declined to
3.0%
of total home and land/lot cost of sales in fiscal
2011
from
3.4%
in
2010
as a result of more home closings on acquired finished lots and decreases in construction times.
Loss on Early Retirement of Debt
During fiscal
2011
, in addition to repaying maturing senior notes, we retired
$319.2 million
principal amount of our senior notes prior to their maturity, compared to
$822.2 million
in fiscal
2010
. Related to the early retirement of these notes, we recognized a net loss of
$10.8 million
and
$4.9 million
in fiscal
2011
and
2010
, respectively. The net loss in fiscal
2011
includes a loss of $6.3 million for the call premium and write-off of unamortized fees related to the early redemption of our 5.375% senior notes due 2012. The net loss in fiscal
2010
includes a loss of $2.0 million for the call premium and write-off of unamortized fees related to the early redemption of the 5.875% senior notes due 2013.
Other Income
Other income, net of other expenses, associated with homebuilding activities was
$8.0 million
in
2011
, compared to
$10.4 million
in
2010
. The largest component of other income in both years was interest income.
37
Homebuilding Results by Reporting Region
|
|
Fiscal Year Ended September 30,
|
|||||||||||||||||||||
|
|
2011
|
2010
|
||||||||||||||||||||
|
Homebuilding
Revenues
|
Homebuilding
Income (Loss)
Before
Income Taxes (1)
|
% of
Region
Revenues
|
Homebuilding
Revenues
|
Homebuilding
Income (Loss)
Before
Income Taxes (1)
|
% of
Region
Revenues
|
|||||||||||||||||
|
|
|
|
(In millions)
|
|
|
|||||||||||||||||
|
East
|
$
|
438.5
|
|
$
|
(13.5
|
)
|
(3.1
|
)%
|
$
|
492.3
|
|
$
|
(6.3
|
)
|
(1.3
|
)%
|
||||||
|
Midwest
|
261.5
|
|
(13.7
|
)
|
(5.2
|
)%
|
331.0
|
|
(31.3
|
)
|
(9.5
|
)%
|
||||||||||
|
Southeast
|
696.8
|
|
(19.9
|
)
|
(2.9
|
)%
|
747.6
|
|
(7.5
|
)
|
(1.0
|
)%
|
||||||||||
|
South Central
|
1,081.0
|
|
52.4
|
|
4.8
|
%
|
1,383.5
|
|
83.4
|
|
6.0
|
%
|
||||||||||
|
Southwest
|
234.8
|
|
(3.8
|
)
|
(1.6
|
)%
|
329.7
|
|
12.0
|
|
3.6
|
%
|
||||||||||
|
West
|
837.0
|
|
(8.5
|
)
|
(1.0
|
)%
|
1,025.6
|
|
27.8
|
|
2.7
|
%
|
||||||||||
|
|
$
|
3,549.6
|
|
$
|
(7.0
|
)
|
(0.2
|
)%
|
$
|
4,309.7
|
|
$
|
78.1
|
|
1.8
|
%
|
||||||
_______________
|
(1)
|
Expenses maintained at the corporate level consist primarily of interest and property taxes, which are capitalized and amortized to cost of sales or expensed directly, and the expenses related to operating our corporate office. The amortization of capitalized interest and property taxes is allocated to each segment based on the segment’s revenue, while interest expense and those expenses associated with the corporate office are allocated to each segment based on the segment’s inventory balances.
|
East Region
— Homebuilding revenues decreased 11% in 2011 compared to 2010, primarily due to decreases in the number of homes closed in the majority of the region’s markets. The largest decrease in closings volume occurred in our New Jersey and Charlotte markets. The region reported a pre-tax loss of $13.5 million in 2011, compared to a loss of $6.3 million in 2010, primarily as a result of declines in revenues and gross profit. Inventory impairment charges and earnest money and land option cost write-offs were $4.6 million and $8.6 million in fiscal 2011 and 2010, respectively. Gross profit from home sales as a percentage of home sales revenue (home sales gross profit percentage) decreased 200 basis points in fiscal 2011 compared to fiscal 2010 due to the increased use of incentives to sell homes and weakening market conditions during fiscal 2011. Although total SG&A expenses in fiscal 2011 decreased from the prior year, they increased as a percentage of homebuilding revenues by 120 basis points in 2011.
Midwest Region
— Homebuilding revenues decreased 21% in 2011 compared to 2010, primarily due to decreases in the number of homes closed in all of the region’s markets. The region reported a pre-tax loss of $13.7 million in 2011, compared to a loss of $31.3 million in 2010. The improvement in fiscal 2011 was primarily a result of fewer inventory impairment charges and earnest money and land option cost write-offs, which were $0.9 million in fiscal 2011, compared to $22.0 million in fiscal 2010. However, weak conditions in the Chicago market contributed substantially to the region’s loss. Home sales gross profit percentage decreased 190 basis points in fiscal 2011 compared to fiscal 2010 due to weakening market conditions compared to the prior year. Although total SG&A expenses in fiscal 2011 decreased from the prior year, they increased as a percentage of homebuilding revenues by 110 basis points in 2011.
Southeast Region
— Homebuilding revenues decreased 7% in 2011 compared to 2010, due to a decrease in the number of homes closed, partially offset by an increase in the average selling price of those homes. The region reported a pre-tax loss of $19.9 million in fiscal 2011 compared to a loss of $7.5 million in fiscal 2010, primarily as a result of declines in revenue and gross profit. These results generally reflected softening across most markets from the expiration of the federal homebuyer tax credit, as well as more challenging conditions in the Orlando market. Inventory impairment charges and earnest money and land option cost write-offs were $17.4 million and $17.5 million in fiscal 2011 and 2010, respectively. Home sales gross profit percentage decreased 110 basis points in fiscal 2011 compared to fiscal 2010 due to increased warranty costs in our Orlando and Pensacola markets. As a percentage of homebuilding revenues, total SG&A expenses increased 110 basis points in fiscal 2011.
38
South Central Region
— Homebuilding revenues decreased 22% in 2011 compared to 2010, primarily due to decreases in the number of homes closed in all of the region’s markets, partially offset by an increase in the average selling prices of those homes. While we continued to be profitable in all markets in the region, overall the region reported a decline in pre-tax income to $52.4 million in fiscal 2011, from $83.4 million in fiscal 2010. The reduced income was the result of closing fewer homes with the expiration of the federal homebuyer tax credit, leading to declines in revenue and gross profit. Inventory impairment charges and earnest money and land option cost write-offs were $0.7 million and $14.0 million in fiscal 2011 and 2010, respectively. Home sales gross profit percentage decreased 100 basis points in fiscal 2011 compared to fiscal 2010 due to lower margins in the majority of the region’s markets, caused by an increase in construction and lot costs as a percentage of revenues. Although total SG&A expenses in fiscal 2011 decreased from the prior year, they increased as a percentage of homebuilding revenues by 150 basis points in 2011. Our central Texas, Dallas and Houston markets continued to be the most profitable in the region.
Southwest Region
— Homebuilding revenues decreased 29% in 2011 compared to 2010, due to decreases in the number of homes closed in all of the region’s markets, partially offset by an increase in the average selling price of those homes. The region reported a pre-tax loss of $3.8 million fiscal 2011, compared to pre-tax income of $12.0 million in fiscal 2010, primarily as a result of declines in revenue and gross profit in all of its markets, with Phoenix experiencing the worst conditions. Home sales gross profit percentage decreased 200 basis points in fiscal 2011 compared to fiscal 2010, primarily as a result of the increased use of incentives to sell homes and weakening market conditions in all of the region’s markets. Also contributing to the decrease in gross profit percentage in fiscal 2011, inventory impairment charges and earnest money and land option cost write-offs increased to $4.7 million, from $0.6 million in the prior year. Although total SG&A expenses in fiscal 2011 decreased from the prior year, they increased as a percentage of homebuilding revenues by 170 basis points in 2011.
West Region
— Homebuilding revenues decreased 18% in 2011 compared to 2010, due to decreases in the number of homes closed in all of the region’s markets, partially offset by an increase in the average selling price of those homes. The Seattle market continued to generate the highest profits, while the inland, central California markets again did not achieve profitability. The region reported a pre-tax loss of $8.5 million in fiscal 2011, compared to pre-tax income of $27.8 million in fiscal 2010, primarily as a result of a decline in revenue and increased impairment charges. Inventory impairment charges and earnest money and land option cost write-offs were $17.1 million in fiscal 2011, compared to $2.0 million in fiscal 2010. Home sales gross profit percentage decreased 40 basis points in fiscal 2011 compared to fiscal 2010. Although total SG&A expenses in fiscal 2011 decreased from the prior year, they increased as a percentage of homebuilding revenues by 150 basis points in 2011.
39
Results of Operations — Financial Services
Fiscal Year Ended
September 30, 2012
Compared to Fiscal Year Ended
September 30, 2011
The following tables set forth key operating and financial data for our financial services operations, comprising DHI Mortgage and our subsidiary title companies, for the fiscal years ended
September 30, 2012
and
2011
:
|
|
Fiscal Year Ended September 30,
|
||||||||
|
|
2012
|
2011
|
% Change
|
||||||
|
Number of first-lien loans originated or brokered by
DHI Mortgage for D.R. Horton homebuyers
|
11,228
|
|
10,262
|
|
9
|
%
|
|||
|
Number of homes closed by D.R. Horton
|
18,890
|
|
16,695
|
|
13
|
%
|
|||
|
DHI Mortgage capture rate
|
59
|
%
|
61
|
%
|
|
|
|||
|
Number of total loans originated or brokered by
DHI Mortgage for D.R. Horton homebuyers
|
11,283
|
|
10,343
|
|
9
|
%
|
|||
|
Total number of loans originated or brokered by DHI Mortgage
|
13,499
|
|
12,118
|
|
11
|
%
|
|||
|
Captive business percentage
|
84
|
%
|
85
|
%
|
|
|
|||
|
Loans sold by DHI Mortgage to third parties
|
13,397
|
|
11,888
|
|
13
|
%
|
|||
|
|
Fiscal Year Ended September 30,
|
||||||||||
|
|
2012
|
2011
|
% Change
|
||||||||
|
|
|
(In millions)
|
|
||||||||
|
Loan origination fees
|
$
|
18.9
|
|
$
|
18.3
|
|
3
|
%
|
|||
|
Sale of servicing rights and gains from sale of mortgages
|
73.9
|
|
53.2
|
|
39
|
%
|
|||||
|
Recourse expense
|
(4.7
|
)
|
(11.6
|
)
|
(59
|
)%
|
|||||
|
Sale of servicing rights and gains from sale of mortgages, net
|
69.2
|
|
41.6
|
|
66
|
%
|
|||||
|
Other revenues
|
7.5
|
|
9.2
|
|
(18
|
)%
|
|||||
|
Reinsurance expense
|
(1.5
|
)
|
(1.8
|
)
|
(17
|
)%
|
|||||
|
Other revenues, net
|
6.0
|
|
7.4
|
|
(19
|
)%
|
|||||
|
Total mortgage operations revenues
|
94.1
|
|
67.3
|
|
40
|
%
|
|||||
|
Title policy premiums, net
|
23.7
|
|
19.9
|
|
19
|
%
|
|||||
|
Total revenues
|
117.8
|
|
87.2
|
|
35
|
%
|
|||||
|
General and administrative expense
|
85.5
|
|
76.3
|
|
12
|
%
|
|||||
|
Interest expense
|
3.3
|
|
1.4
|
|
136
|
%
|
|||||
|
Interest and other (income)
|
(10.2
|
)
|
(9.6
|
)
|
6
|
%
|
|||||
|
Income before income taxes
|
$
|
39.2
|
|
$
|
19.1
|
|
105
|
%
|
|||
Financial Services Operating Margin Analysis
|
Percentages of
Financial Services Revenues (1)
|
||||||
|
|
Fiscal Year Ended September 30,
|
|||||
|
|
2012
|
2011
|
||||
|
Recourse and reinsurance expense
|
5.0
|
%
|
13.3
|
%
|
||
|
General and administrative expense
|
69.0
|
%
|
75.8
|
%
|
||
|
Interest expense
|
2.7
|
%
|
1.4
|
%
|
||
|
Interest and other (income)
|
(8.2
|
)%
|
(9.5
|
)%
|
||
|
Income before income taxes
|
31.6
|
%
|
19.0
|
%
|
||
_______________________________________
|
(1)
|
Excludes the effects of recourse and reinsurance charges on financial services revenues
|
40
Mortgage Loan Activity
The volume of loans originated and brokered by our mortgage operations is directly related to the number of homes closed by our homebuilding operations. In fiscal
2012
, total first-lien loans originated or brokered by DHI Mortgage for our homebuyers increased by
9%
, reflective of the
13%
increase in the number of homes closed by our homebuilding operations. The percentage increase in loans originated was lower than the percentage increase in the number of homes closed due to a slight decrease in our mortgage capture rate (the percentage of total home closings by our homebuilding operations for which DHI Mortgage handled the homebuyers’ financing) to
59%
in fiscal
2012
, from
61%
in fiscal
2011
.
Home closings from our homebuilding operations constituted
84%
of DHI Mortgage loan originations in
2012
, compared to
85%
in
2011
, reflecting DHI Mortgage’s continued focus on the captive business provided by our homebuilding operations.
The number of loans sold to third-party purchasers increased by
13%
in
2012
compared to
2011
, corresponding to the
11%
increase in the number of loans originated between the years. Virtually all of the mortgage loans originated during fiscal
2012
and mortgage loans held for sale on
September 30, 2012
were eligible for sale to the Federal National Mortgage Association (Fannie Mae), Federal Home Loan Mortgage Corporation (Freddie Mac) or Government National Mortgage Association (Ginnie Mae). Approximately
73%
of the mortgage loans sold by DHI Mortgage during fiscal
2012
were sold to one major financial institution that provided better pricing and execution than other available loan purchasers. On an ongoing basis, we seek to establish additional loan purchase arrangements with multiple institutions. If we are unable to sell mortgage loans to additional purchasers on attractive terms, our ability to originate and sell mortgage loans at competitive prices could be limited, which would negatively affect profitability.
Financial Services Revenues and Expenses
Revenues from the financial services segment increased
35%
, to
$117.8 million
in fiscal
2012
from
$87.2 million
in fiscal
2011
. The volume of loans sold increased
13%
while revenues from the sale of servicing rights and gains from sale of mortgages increased
39%
. Loan sale revenue increased at a higher rate than loan sale volume primarily due to improved loan sale execution in the secondary market. Loan origination fees increased
3%
, compared to an
11%
increase in the number of loans originated. The percentage increase in loan origination fees was lower than the percentage increase in the number of loans originated due to pricing changes in some of our markets and was generally offset by improved loan sale execution.
Charges related to recourse obligations were
$4.7 million
in fiscal
2012
, compared to
$11.6 million
in fiscal
2011
. The calculation of our required repurchase loss reserve is based upon an analysis of repurchase requests received, our actual repurchases and losses through the disposition of such loans or requests, discussions with our mortgage purchasers and analysis of the mortgages we originated. While we believe that we have adequately reserved for losses on known and projected repurchase requests, if either actual repurchases or the losses incurred resolving those repurchases exceed our expectations, additional recourse expense may be incurred. Additionally, a subsidiary of ours reinsured a portion of the private mortgage insurance written on loans originated by DHI Mortgage in prior years. Charges to increase reserves for expected losses on the reinsured loans were
$1.5 million
and
$1.8 million
during fiscal
2012
and
2011
, respectively.
Financial services general and administrative (G&A) expense increased
12%
, to
$85.5 million
in
2012
from
$76.3 million
in
2011
. As a percentage of financial services revenues (excluding the effects of recourse and reinsurance expense), G&A expense decreased to
69.0%
in
2012
, from
75.8%
in
2011
, primarily due to the increase in loan origination volume and revenues. Fluctuations in financial services G&A expense as a percentage of revenues can be expected to occur as some expenses are not directly related to mortgage loan volume or to changes in the amount of revenue earned.
41
Fiscal Year Ended
September 30, 2011
Compared to Fiscal Year Ended
September 30, 2010
The following tables set forth key operating and financial data for our financial services operations, comprising DHI Mortgage and our subsidiary title companies, for the fiscal years ended
September 30, 2011
and
2010
:
|
|
Fiscal Year Ended September 30,
|
||||||||
|
|
2011
|
2010
|
% Change
|
||||||
|
Number of first-lien loans originated or brokered by
DHI Mortgage for D.R. Horton homebuyers
|
10,262
|
|
12,679
|
|
(19
|
)%
|
|||
|
Number of homes closed by D.R. Horton
|
16,695
|
|
20,875
|
|
(20
|
)%
|
|||
|
DHI Mortgage capture rate
|
61
|
%
|
61
|
%
|
|
|
|||
|
Number of total loans originated or brokered by
DHI Mortgage for D.R. Horton homebuyers
|
10,343
|
|
12,754
|
|
(19
|
)%
|
|||
|
Total number of loans originated or brokered by DHI Mortgage
|
12,118
|
|
14,146
|
|
(14
|
)%
|
|||
|
Captive business percentage
|
85
|
%
|
90
|
%
|
|
|
|||
|
Loans sold by DHI Mortgage to third parties
|
11,888
|
|
14,001
|
|
(15
|
)%
|
|||
|
|
Fiscal Year Ended September 30,
|
||||||||||
|
|
2011
|
2010
|
% Change
|
||||||||
|
|
|
(In millions)
|
|
||||||||
|
Loan origination fees
|
$
|
18.3
|
|
$
|
17.7
|
|
3
|
%
|
|||
|
Sale of servicing rights and gains from sale of mortgages
|
53.2
|
|
59.6
|
|
(11
|
)%
|
|||||
|
Recourse expense
|
(11.6
|
)
|
(13.7
|
)
|
(15
|
)%
|
|||||
|
Sale of servicing rights and gains from sale of mortgages, net
|
41.6
|
|
45.9
|
|
(9
|
)%
|
|||||
|
Other revenues
|
9.2
|
|
6.8
|
|
35
|
%
|
|||||
|
Reinsurance expense
|
(1.8
|
)
|
(1.9
|
)
|
(5
|
)%
|
|||||
|
Other revenues, net
|
7.4
|
|
4.9
|
|
51
|
%
|
|||||
|
Total mortgage operations revenues
|
67.3
|
|
68.5
|
|
(2
|
)%
|
|||||
|
Title policy premiums, net
|
19.9
|
|
22.0
|
|
(10
|
)%
|
|||||
|
Total revenues
|
87.2
|
|
90.5
|
|
(4
|
)%
|
|||||
|
General and administrative expense
|
76.3
|
|
77.2
|
|
(1
|
)%
|
|||||
|
Interest expense
|
1.4
|
|
1.9
|
|
(26
|
)%
|
|||||
|
Interest and other (income)
|
(9.6
|
)
|
(10.0
|
)
|
(4
|
)%
|
|||||
|
Income before income taxes
|
$
|
19.1
|
|
$
|
21.4
|
|
(11
|
)%
|
|||
Financial Services Operating Margin Analysis
|
Percentages of
Financial Services Revenues (1)
|
||||||
|
|
Fiscal Year Ended September 30,
|
|||||
|
|
2011
|
2010
|
||||
|
Recourse and reinsurance expense
|
13.3
|
%
|
14.7
|
%
|
||
|
General and administrative expense
|
75.8
|
%
|
72.8
|
%
|
||
|
Interest expense
|
1.4
|
%
|
1.8
|
%
|
||
|
Interest and other (income)
|
(9.5
|
)%
|
(9.4
|
)%
|
||
|
Income before income taxes
|
19.0
|
%
|
20.2
|
%
|
||
_______________________________________
|
(1)
|
Excludes the effects of recourse and reinsurance charges on financial services revenues
|
42
Mortgage Loan Activity
Total first-lien loans originated or brokered by DHI Mortgage for our homebuyers decreased by
19%
in fiscal
2011
compared to fiscal
2010
, corresponding to the
20%
decrease in the number of homes closed. Our mortgage capture rate was
61%
in both years.
Home closings from our homebuilding operations constituted
85%
of DHI Mortgage loan originations in
2011
, compared to
90%
in
2010
, reflecting DHI Mortgage’s continued focus on the captive business provided by our homebuilding operations. The relatively lower captive percentage in
2011
reflects a higher level of refinancing and new mortgage loan originations from non-homebuilding sources than in
2010
.
The number of loans sold to third-party purchasers decreased by
15%
in
2011
compared to
2010
, corresponding to the
14%
decrease in the number of loans originated between the years. Virtually all of the mortgage loans originated during fiscal
2011
and mortgage loans held for sale on
September 30, 2011
were eligible for sale to Fannie Mae, Freddie Mac or Ginnie Mae. Approximately
89%
of the mortgage loans sold by DHI Mortgage during fiscal
2011
were sold to two major financial institutions pursuant to their loan purchase agreements.
Financial Services Revenues and Expenses
Revenues from the financial services segment decreased
4%
, to
$87.2 million
in fiscal
2011
from
$90.5 million
in fiscal
2010
. Revenues from the sale of servicing rights and gains from sale of mortgages decreased
11%
as a result of a
15%
decrease in the volume of loans sold. Loan origination fees increased
3%
, despite a
14%
decrease in loans originated, due to small changes in pricing structure implemented during fiscal
2011
. Charges related to recourse obligations were
$11.6 million
in fiscal
2011
, compared to
$13.7 million
in fiscal
2010
. Charges to increase reserves for expected losses on the reinsured loans were
$1.8 million
and
$1.9 million
during fiscal
2011
and
2010
, respectively.
Financial services G&A expense was
$76.3 million
in
2011
, decreasing slightly from
$77.2 million
in
2010
. As a percentage of financial services revenues (excluding the effects of recourse and reinsurance expense), G&A expense increased to
75.8%
in
2011
, from
72.8%
in
2010
. The increase was due to the reduction in revenues resulting from the decrease in mortgage loan volume compared to fiscal
2010
.
43
Results of Operations — Consolidated
Fiscal Year Ended
September 30, 2012
Compared to Fiscal Year Ended
September 30, 2011
Income before Income Taxes
Income before income taxes for fiscal
2012
was
$242.9 million
, compared to
$12.1 million
for fiscal
2011
. The difference in our operating results for the current year compared to a year ago is primarily due to higher revenues from increased home closings, a higher gross profit margin and lower interest expense.
Income Taxes
In fiscal
2012
, our income tax benefit was
$713.4 million
, compared to a benefit of
$59.7 million
in
2011
. The income tax benefit in fiscal
2012
was due primarily to a significant reduction of our deferred tax asset valuation allowance during the three months ended June 30, 2012. The income tax benefit in fiscal
2011
was due to us receiving a favorable result from the Internal Revenue Service (IRS) on a ruling request concerning capitalization of inventory costs. We do not have meaningful effective tax rates in these years because our net deferred tax assets were fully offset by a valuation allowance until the third quarter of fiscal
2012
when we reduced the valuation allowance on our deferred tax asset. Based on current income tax laws, we expect our effective tax rate in fiscal 2013 to be approximately
38.5%
.
At
September 30, 2012
, we had federal net operating loss (NOL) carryforwards of
$310.5 million
that expire in fiscal 2030 and 2031 and tax benefits for state NOL carryforwards of
$85.2 million
that expire (beginning at various times depending on the tax jurisdiction) from fiscal 2013 to fiscal 2031. At
September 30, 2012
, we had federal tax credit carryforwards of
$4.4 million
that expire in fiscal years 2029 through 2032 and a minimum tax credit carryforward of
$2.6 million
.
At
September 30, 2012
and
2011
, we had deferred tax assets, net of deferred tax liabilities, of
$751.4 million
and
$848.5 million
, respectively, offset by valuation allowances of
$41.9 million
and
$848.5 million
, respectively. The realization of our deferred tax assets depends upon the existence of sufficient taxable income in future periods. We have a valuation allowance of
$41.9 million
at
September 30, 2012
because it is more likely than not that a portion of our state NOL carryforwards will not be realized due to the more limited carryforward periods that exist in certain states.
At June 30, 2012, we evaluated both positive and negative evidence and determined it was more likely than not that the substantial majority of our deferred tax assets would be realized, which resulted in a significant reduction of the valuation allowance on our deferred tax assets.
In our evaluation of the need for and level of a valuation allowance on our deferred tax assets at June 30, 2012, the most significant piece of evidence considered was the objective, direct positive evidence related to our recent financial results, including our positive and growing levels of pre-tax income and our strong growth in net sales orders and sales order backlog. These positive pre-tax income, sales and backlog levels and trends continued through September 30, 2012. We believe we will continue to increase our pre-tax income in future years, as we are utilizing our balance sheet and liquidity position to invest in opportunities to sustain and grow our operations. If industry conditions weaken from current levels, we expect to be able to adjust our operations to maintain long-term profitability. While our expectations are that annual pre-tax income will grow from the fiscal 2012 level, if annual pre-tax income in future years remains flat with the current level, we estimate that we will realize all of our current federal net operating losses in less than five years and will be able to absorb all federal deductible temporary differences as they reverse in future years.
Prior to the quarter ended June 30, 2012, a significant part of the negative evidence we considered was our three-year cumulative pre-tax loss position, which had become a cumulative pre-tax income position at June 30, 2012, and was no longer considered to be as significant. Other negative evidence we considered was our previous losses incurred during the housing market decline, the current overall weakness in the economy and the housing market, the restrictive mortgage lending environment and our gross margins, which are currently lower than historical levels before the housing downturn. Based on our evaluation of both positive and negative evidence at June 30, 2012, we concluded that the objective, direct positive evidence related to our operating results achieved during the recent challenging economic and housing market conditions and the sustainability of current pre-tax income levels outweighed the negative evidence and that it was more likely than not that the substantial majority of our deferred tax assets will be realized.
44
The accounting for deferred taxes is based upon estimates of future results. Differences between the anticipated and actual outcomes of these future results could have a material impact on our consolidated results of operations or financial position. Changes in existing tax laws and tax rates also affect actual tax results and the valuation of deferred tax assets over time.
Unrecognized tax benefits are the differences between tax positions taken or expected to be taken in a tax return and the benefits recognized for accounting purposes. Included in the balance of unrecognized tax benefits as of
September 30, 2012
are
$11.8 million
of tax benefits that, if recognized, would reduce our income tax expense. Also included in the balance of unrecognized tax benefits as of
September 30, 2012
are
$2.3 million
of tax benefits that, if recognized, would result in an adjustment to deferred income taxes. At
September 30, 2011
all tax positions, if recognized, would have reduced our income tax expense because of the full valuation allowance that existed on our deferred tax assets.
We classify interest expense and penalties on income taxes as income tax expense. During fiscal
2012
and
2011
, we recognized interest benefits related to unrecognized tax benefits of
$0.1 million
and
$12.7 million
, respectively, in our consolidated statements of operations. At both
September 30, 2012
and
2011
, our total accrued interest expense relating to unrecognized tax benefits was
$5.1 million
and there were
no
accrued penalties.
A reduction of
$9.9 million
in the amount of unrecognized tax benefits and
$3.1 million
of accrued interest is reasonably possible within the next 12 months, of which
$11.0 million
would be reflected as an income tax benefit in our consolidated statement of operations and
$2.0 million
would result in an adjustment to deferred income taxes.
We are subject to federal income tax and to income tax in multiple states. The statute of limitations for our major tax jurisdictions remains open for examination for fiscal years 2004 to 2006 and from 2008 through 2012. We are currently being audited by various states.
At
September 30, 2012
and
2011
, we had income taxes receivable of
$14.4 million
and
$12.4 million
, respectively, for expected federal tax refunds related to our 2006 and 2007 tax returns. During fiscal 2012, the IRS concluded its audit of our 2006 and 2007 tax returns, and the U.S. Congressional Joint Committee on Taxation concluded its review of the tax refunds requested by us. In October 2012, we received the
$14.4 million
tax refund.
Fiscal Year Ended
September 30, 2011
Compared to Fiscal Year Ended
September 30, 2010
Income before Income Taxes
Income before income taxes for fiscal
2011
was
$12.1 million
, compared to
$99.5 million
for fiscal
2010
. The difference in our operating results for
2011
compared to
2010
is primarily due to a lower volume of homes closed which resulted in lower revenues.
Income Taxes
In fiscal
2011
, our income tax benefit was
$59.7 million
, compared to a benefit of
$145.6 million
in
2010
. The income tax benefit in fiscal
2011
was due to the reduction of our accrual for unrecognized tax benefits and corresponding interest by $61.4 million, partially offset by an accrual for state income taxes of $1.7 million. In fiscal
2010
, a tax law change regarding net operating loss (NOL) carrybacks resulted in an income tax benefit of
$208.3 million
, which was partially offset by an increase in unrecognized tax benefits and state income tax expense. We did not have meaningful effective tax rates in these years because our net deferred tax assets were fully offset by a valuation allowance.
At
September 30, 2011
and
2010
, we had income taxes receivable of
$12.4 million
and
$16.0 million
, respectively. We had deferred tax assets, net of deferred tax liabilities, of
$848.5 million
and
$902.6 million
, respectively, offset by valuation allowances of
$848.5 million
and
$902.6 million
, respectively. In determining the continued need for a valuation allowance with respect to our deferred tax assets, a significant part of the negative evidence we considered came from our three-year cumulative pre-tax loss position, which was
$445 million
at the end of fiscal
2011
.
At
September 30, 2011
and
2010
, the total amount of our unrecognized tax benefits was
$16.3 million
and
$65.0 million
, respectively. The decrease in unrecognized tax benefits resulted from us receiving a favorable result from the IRS on a ruling request concerning the capitalization of inventory costs and a reduction in our accrual for state income tax issues. Related to unrecognized tax benefits, we recognized an interest benefit of
$12.7 million
and interest expense of
$11.6 million
during fiscal
45
2011
and
2010
, respectively. At
September 30, 2011
and
2010
, our total accrued interest expense relating to unrecognized tax benefits was $5.1 million and $17.8 million, respectively, and there were no accrued penalties.
Overview of Capital Resources and Liquidity
We have historically funded our homebuilding and financial services operations with cash flows from operating activities, borrowings under bank credit facilities and the issuance of new debt securities. During the industry downturn from 2007 to 2011, we generated substantial cash flows primarily through reductions in assets and income tax refunds, which allowed us to increase our liquidity and reduce our debt. This has provided us with the operational flexibility to adjust to changing homebuilding market conditions. In response to increased demand for our homes, we have recently increased our investments in housing and land inventory opportunities to expand our operations and grow our profitability. We intend to maintain adequate liquidity and balance sheet strength, and we regularly evaluate opportunities to access the capital markets as they become available.
At
September 30, 2012
, our ratio of net homebuilding debt to total capital was
21.4%
, an increase of
340
basis points from
18.0%
at
September 30, 2011
. Net homebuilding debt to total capital consists of homebuilding notes payable net of cash and marketable securities divided by total capital net of cash and marketable securities (homebuilding notes payable net of cash and marketable securities plus total equity). In the near term, we intend to maintain a ratio of net homebuilding debt to total capital below our historic target operating range of
40%
to
45%
. However, future net homebuilding debt to total capital ratios may be higher than current levels.
We believe that the ratio of net homebuilding debt to total capital is useful in understanding the leverage employed in our homebuilding operations and comparing our capital structure with other homebuilders. We exclude the debt of our financial services business because it is separately capitalized and its obligation under its repurchase agreement is substantially collateralized and not guaranteed by our parent company or any of our homebuilding entities. Because of their capital function, we include our homebuilding cash and marketable securities as a reduction of our homebuilding debt and total capital. For comparison to our ratios of net homebuilding debt to capital above, at
September 30, 2012
and
2011
, our ratios of homebuilding debt to total capital, without netting cash and marketable securities balances, were
39.1%
and
37.7%
, respectively.
We believe that our existing cash resources, our revolving credit facility and our mortgage repurchase facility provide sufficient liquidity to fund our near-term working capital needs and debt obligations. We regularly assess our projected capital requirements to fund future growth in our business, repay our longer-term debt obligations, and support our other general corporate and operational needs, and we regularly evaluate our opportunities to raise additional capital. We have an automatically effective universal shelf registration statement filed with the SEC in September 2012, registering debt and equity securities which we may issue from time to time in amounts to be determined. As market conditions permit, we may issue new debt or equity securities through the public capital markets or obtain additional bank financing to fund our projected capital requirements or provide additional liquidity.
Homebuilding Capital Resources
Cash and Cash Equivalents
— At
September 30, 2012
, we had available homebuilding cash and cash equivalents of
$1.0 billion
.
Marketable Securities
— At
September 30, 2012
, we had marketable securities of
$298.0 million
. Our marketable securities consist of U.S. Treasury securities, government agency securities, corporate debt securities and certificates of deposit.
Recently Issued Public Unsecured Debt
- In May 2012, we issued
$350 million
principal amount of 4.75% senior notes due
May 15, 2017
, with interest payable semi-annually. The annual effective interest rate of the notes, after giving effect to the amortization of deferred financing costs is
5.0%
.
In September 2012, we issued
$350 million
principal amount of 4.375% senior notes due
September 15, 2022
, with interest payable semi-annually. The annual effective interest rate of the notes, after giving effect to the amortization of deferred financing costs is
4.5%
.
46
Bank Credit Facility
— In
September 2012
, we entered into a
five
-year,
$125 million
senior unsecured revolving credit facility with a major bank. As of September 30, 2012, the facility had an uncommitted
$375 million
accordion feature which could increase the size of the facility, subject to certain conditions and availability of additional bank commitments. Borrowings bear interest at rates based upon the London Interbank Offered Rate (LIBOR) plus an applicable margin as determined by our leverage ratio as defined in the credit agreement governing the facility. The facility also provided for the issuance of letters of credit equal to
50%
of the revolving credit commitment through a letter of credit sublimit. At
September 30, 2012
, we had
no
borrowings outstanding and
$0.4 million
in letters of credit outstanding under the revolving credit facility. On November 1, 2012, we increased the capacity of the credit facility to
$600 million
by obtaining additional lending commitments from banks, and increased the accordion feature available under the facility to allow us to increase the size of the facility to
$1.0 billion
, subject to certain conditions and availability of additional bank commitments. The amended sublimit for the issuance of letters of credit is now
$300 million
.
Our revolving credit facility imposes restrictions on our operations and activities, including requiring the maintenance of a minimum level of tangible net worth, a maximum allowable leverage ratio and a borrowing base restriction if our leverage ratio exceeds a certain level. These covenants are measured as defined in the credit facility and are reported to our lenders quarterly. In addition, our credit facility and the indentures governing the senior notes impose restrictions on the creation of secured debt and liens. At
September 30, 2012
, we were in compliance with all of the covenants, limitations and restrictions of our revolving credit facility and public debt obligations. A failure to comply with these financial covenants could allow the lending banks to terminate the availability of funds under the revolving credit facility or cause any outstanding borrowings to become due and payable prior to maturity.
Secured Letter of Credit Agreements
— We have secured letter of credit agreements which require us to deposit cash, in an amount approximating the balance of letters of credit outstanding, as collateral with the issuing banks. At
September 30, 2012
and
2011
, the amount of cash restricted for this purpose totaled
$47.2 million
and
$47.5 million
, respectively, and is included in homebuilding restricted cash on our consolidated balance sheets. The amount of cash restricted at
September 30, 2012
includes cash collateral related to the letters of credit outstanding under the revolving credit facility.
Financial Services Capital Resources
Cash and Cash Equivalents
— At
September 30, 2012
, the amount of financial services cash and cash equivalents was
$17.3 million
.
Mortgage Repurchase Facility
— Our mortgage subsidiary, DHI Mortgage, has a mortgage repurchase facility that is accounted for as a secured financing. The mortgage repurchase facility provides financing and liquidity to DHI Mortgage by facilitating purchase transactions in which DHI Mortgage transfers eligible loans to the counterparties against the transfer of funds by the counterparties, thereby becoming purchased loans. DHI Mortgage then has the right and obligation to repurchase the purchased loans upon their sale to third-party purchasers in the secondary market or within specified time frames from 45 to 120 days in accordance with the terms of the mortgage repurchase facility. In
March 2012
, the mortgage repurchase facility was amended and renewed through
March 3, 2013
. The committed capacity of the facility remains at
$180 million
; however, the capacity can be increased up to
$225 million
as needed. Increases in borrowing capacity in excess of
$180 million
are provided on an uncommitted basis and at a higher borrowing cost than committed borrowings.
As of
September 30, 2012
,
$278.6 million
of mortgage loans held for sale with a collateral value of
$263.9 million
were pledged under the mortgage repurchase facility. As a result of advance paydowns totaling
$76.1 million
, DHI Mortgage had an obligation of
$187.8 million
outstanding under the mortgage repurchase facility at
September 30, 2012
at a
2.8%
annual interest rate.
The mortgage repurchase facility is not guaranteed by either D.R. Horton, Inc. or any of the subsidiaries that guarantee our homebuilding debt. The facility contains financial covenants as to the mortgage subsidiary’s minimum required tangible net worth, its maximum allowable ratio of debt to tangible net worth and its minimum required liquidity. These covenants are measured and reported monthly. At
September 30, 2012
, DHI Mortgage was in compliance with all of the conditions and covenants of the mortgage repurchase facility.
In the past, our mortgage subsidiary has been able to renew or extend its mortgage credit facility on satisfactory terms prior to its maturity, and obtain temporary additional commitments through amendments to the credit agreement during periods of higher than normal volumes of mortgages held for sale. The liquidity of our financial services business depends upon its
47
continued ability to renew and extend the mortgage repurchase facility or to obtain other additional financing in sufficient capacities.
Operating Cash Flow Activities
In fiscal
2012
, we used
$298.1 million
of cash in our operating activities, compared to
$14.9 million
provided by our operating activities in fiscal
2011
, which reflects cash used to invest in additional land and lot inventory and homes under construction as market conditions improved during 2012, offset by cash provided by net income and increases in payables and other liabilities.
We have a substantial amount of liquidity which has given us the flexibility to invest capital to grow our operations. As our sales demand and profitability has improved, we have used cash from operating activities to increase our homes in inventory and invest in land acquisition, land development and housing inventory opportunities to meet housing demand and expand our operations in desirable markets. Over the past several years, our land investments had been primarily purchases of finished lots in most of our markets. In fiscal 2012, we began increasing our investments in undeveloped land and land development spending as the supply of finished lots declined in many of our markets. We expect a larger portion of our investments will shift from finished lot purchases to land acquisition and development, which will result in increased inventory levels.
Investing Cash Flow Activities
In fiscal
2012
, net cash used in our investing activities was
$138.3 million
, compared to
$19.3 million
in fiscal
2011
. The most significant investing use of cash in fiscal
2012
relative to fiscal
2011
was the purchase of the homebuilding operations of Breland Homes, whereby
$96.5 million
of the purchase price was paid during the year. Also, purchases of property and equipment to support our operations, including model home furniture, office and technology equipment and office buildings, were
$33.6 million
in fiscal
2012
as compared to
$16.3 million
in fiscal
2011
.
Financing Cash Flow Activities
During the past few years, most of our short-term financing needs have been funded with cash generated from operations and borrowings available under our financial services credit facility. Long-term financing needs of our homebuilding operations have historically been funded with the issuance of senior unsecured debt securities through the public capital markets. Going forward, the short-term financing needs of our homebuilding operations will be funded with existing cash, cash generated from profits and borrowings available under our new revolving credit facility.
During fiscal
2012
, financing activities provided
$751.5 million
of cash, primarily from our issuances of
$350 million
principal amount of 4.75% senior notes and
$350 million
of 4.375% senior notes, and our borrowing of
$71.3 million
under our mortgage repurchase facility. During fiscal
2011
, we used
$572.3 million
in financing activities, as we repaid, through maturities, redemptions and repurchases, a total of
$495.4 million
principal amount of various issues of senior notes for an aggregate purchase price of
$505.3 million
, plus accrued interest. During fiscal
2011
, we also used cash to repurchase
3,544,838
shares of our common stock at a total cost of
$38.6 million
.
Consistent with dividends paid in fiscal
2010
and
2011
, our Board of Directors approved four quarterly cash dividends of
$0.0375
per common share during fiscal
2012
. The last of these was paid on
August 24, 2012
to stockholders of record on
August 13, 2012
. On
November 8, 2012
, our Board of Directors approved a cash dividend of
$0.0375
per common share, payable on
December 17, 2012
, to stockholders of record on
December 3, 2012
. The declaration of future cash dividends is at the discretion of our Board of Directors and will depend upon, among other things, future earnings, cash flows, capital requirements, our financial condition and general business conditions.
48
Changes in Capital Structure
Effective
August 1, 2012
, our Board of Directors authorized the repurchase of up to
$500 million
of debt securities and
$100 million
of our common stock effective through
July 31, 2013
. The full amount of each of these authorizations was remaining at
September 30, 2012
.
In May 2012, we issued
$350 million
principal amount of 4.75% senior notes due May 15, 2017, and in
September 2012
, we issued
$350 million
principal amount of 4.375% senior notes due
September 15, 2022
.
In recent years, our primary non-operating use of available capital has been to repay debt, and in fiscal 2011 we also made limited stock repurchases. As our sales demand and profitability improved in fiscal 2012, our operating and investing uses of capital increased and our debt repayments decreased as compared to the past several years.
We regularly assess our projected capital requirements to fund future growth in our business, repay our longer-term debt obligations, and support our other general corporate and operational needs, and we regularly evaluate our opportunities to raise additional capital. As market conditions permit, we may issue new debt or equity securities through the public capital markets or obtain additional bank financing to fund our projected capital requirements or provide additional liquidity.
Contractual Cash Obligations, Commercial Commitments and Off-Balance Sheet Arrangements
Our primary contractual cash obligations for our homebuilding and financial services segments are payments under our debt agreements and lease payments under operating leases. We expect to fund our contractual obligations in the ordinary course of business through a combination of our existing cash resources; cash flows generated from profits; renewed, amended or new revolving credit facilities, mortgage repurchase facilities or other bank financing; and the issuance of new debt or equity securities through the public capital markets as market conditions may permit.
Our future cash requirements for contractual obligations as of
September 30, 2012
are presented below:
|
|
Payments Due by Period
|
||||||||||||||||||
|
Total
|
Less Than
1 Year
|
1 - 3 Years
|
3 - 5 Years
|
More Than
5 Years
|
|||||||||||||||
|
|
(In millions)
|
||||||||||||||||||
|
Homebuilding:
|
|
|
|
|
|
|
|
|
|
|
|||||||||
|
Notes Payable — Principal (1)
|
$
|
2,360.3
|
|
$
|
175.9
|
|
$
|
941.5
|
|
$
|
892.9
|
|
$
|
350.0
|
|
||||
|
Notes Payable — Interest (1)
|
416.6
|
|
107.9
|
|
159.2
|
|
73.6
|
|
75.9
|
|
|||||||||
|
Operating Leases
|
22.6
|
|
10.5
|
|
11.5
|
|
0.6
|
|
—
|
|
|||||||||
|
Purchase Obligations
|
24.1
|
|
17.1
|
|
5.1
|
|
1.8
|
|
0.1
|
|
|||||||||
|
Totals
|
$
|
2,823.6
|
|
$
|
311.4
|
|
$
|
1,117.3
|
|
$
|
968.9
|
|
$
|
426.0
|
|
||||
|
Financial Services:
|
|
|
|
|
|
|
|
|
|
|
|||||||||
|
Notes Payable — Principal (2)
|
$
|
187.8
|
|
$
|
187.8
|
|
$
|
—
|
|
$
|
—
|
|
$
|
—
|
|
||||
|
Notes Payable — Interest (2)
|
5.2
|
|
5.2
|
|
—
|
|
—
|
|
—
|
|
|||||||||
|
Operating Leases
|
0.7
|
|
0.5
|
|
0.2
|
|
—
|
|
—
|
|
|||||||||
|
Totals
|
$
|
193.7
|
|
$
|
193.5
|
|
$
|
0.2
|
|
$
|
—
|
|
$
|
—
|
|
||||
_______________________________________
|
(1)
|
Homebuilding notes payable represent principal and interest payments due on our senior, convertible senior and secured notes.
|
|
(2)
|
Financial services notes payable represent principal and interest payments due on our mortgage subsidiary’s repurchase facility. The interest obligation associated with this variable rate facility is based on its annual effective rate of
2.8%
and principal balance outstanding at
September 30, 2012
.
|
49
At
September 30, 2012
, our homebuilding operations had outstanding letters of credit of
$46.6 million
, all of which were cash collateralized, and surety bonds of
$698.4 million
, issued by third parties, to secure performance under various contracts. We expect that our performance obligations secured by these letters of credit and bonds will generally be completed in the ordinary course of business and in accordance with the applicable contractual terms. When we complete our performance obligations, the related letters of credit and bonds are generally released shortly thereafter, leaving us with no continuing obligations. We have no material third-party guarantees.
Our mortgage subsidiary enters into various commitments related to the lending activities of our mortgage operations. Further discussion of these commitments is provided in Item 7A “Quantitative and Qualitative Disclosures About Market Risk” under Part II of this annual report on Form 10-K.
We enter into land and lot option purchase contracts to acquire land or lots for the construction of homes. Lot option contracts enable us to control significant lot positions with limited capital investment and substantially reduce the risks associated with land ownership and development. Within the land and lot option purchase contracts at
September 30, 2012
, there were a limited number of contracts, representing
$24.1 million
of remaining purchase price, subject to specific performance clauses which may require us to purchase the land or lots upon the land sellers meeting their obligations. Further discussion of our land option contracts is provided in the “Land and Lot Position and Homes in Inventory” section included herein.
Seasonality
Prior to the recent downturn in the homebuilding industry which began to affect our seasonal patterns in fiscal 2007, we experienced relatively predictable seasonal variations in our quarterly operating results and capital requirements. We began to experience our normal seasonal pattern again in both fiscal 2011 and 2012. We generally have more homes under construction, close more homes and have greater revenues and operating income in the third and fourth quarters of our fiscal year. The seasonal activity increases our working capital requirements for our homebuilding operations during the third and fourth fiscal quarters and increases our funding requirements for the mortgages we originate in our financial services segment at the end of these quarters. As a result of seasonal activity, our quarterly results of operations and financial position at the end of a particular fiscal quarter are not necessarily representative of the balance of our fiscal year.
Inflation
We may be adversely affected during periods of high inflation, primarily because of higher land, financing, labor and material construction costs. In addition, higher mortgage interest rates significantly affect the affordability of mortgage financing to prospective homebuyers. We attempt to pass through to our customers any increases in our costs through increased sales prices. However, during periods when housing market conditions are challenging, we may not be able to offset our cost increases with higher selling prices.
50
Forward-Looking Statements
Some of the statements contained in this report, as well as in other materials we have filed or will file with the Securities and Exchange Commission, statements made by us in periodic press releases and oral statements we make to analysts, stockholders and the press in the course of presentations about us, may be construed as “forward-looking statements” within the meaning of Section 27A of the Securities Act of 1933, Section 21E of the Securities Exchange Act of 1934 and the Private Securities Litigation Reform Act of 1995. Forward-looking statements are based on management’s beliefs as well as assumptions made by, and information currently available to, management. These forward-looking statements typically include the words “anticipate,” “believe,” “consider,” “estimate,” “expect,” “forecast,” “goal,” “intend,” “objective,” “plan,” “predict,” “projection,” “seek,” “strategy,” “target,” “will” or other words of similar meaning. Any or all of the forward-looking statements included in this report and in any other of our reports or public statements may not approximate actual experience, and the expectations derived from them may not be realized, due to risks, uncertainties and other factors. As a result, actual results may differ materially from the expectations or results we discuss in the forward-looking statements. These risks, uncertainties and other factors include, but are not limited to:
|
•
|
potential deterioration in homebuilding industry conditions and the current weak U.S. economy;
|
|
•
|
the cyclical nature of the homebuilding industry and changes in general economic, real estate and other conditions;
|
|
•
|
constriction of the credit markets, which could limit our ability to access capital and increase our costs of capital;
|
|
•
|
reductions in the availability of mortgage financing and the liquidity provided by government-sponsored enterprises, the effects of government programs, a decrease in our ability to sell mortgage loans on attractive terms or an increase in mortgage interest rates;
|
|
•
|
the risks associated with our land and lot inventory;
|
|
•
|
home warranty and construction defect claims;
|
|
•
|
supply shortages and other risks for acquiring land, building materials and skilled labor;
|
|
•
|
reductions in the availability of performance bonds;
|
|
•
|
increases in the costs of owning a home;
|
|
•
|
the effects of governmental regulations and environmental matters on our homebuilding operations;
|
|
•
|
the effects of governmental regulation on our financial services operations;
|
|
•
|
our debt obligations and our ability to comply with related debt covenants, restrictions and limitations;
|
|
•
|
competitive conditions within our industry;
|
|
•
|
our ability to effect any future growth strategies successfully;
|
|
•
|
the impact of an inflationary or deflationary environment;
|
|
•
|
our ability to realize the full amount of our deferred income tax asset; and
|
|
•
|
information technology failures and data security breaches.
|
We undertake no obligation to publicly update or revise any forward-looking statements, whether as a result of new information, future events or otherwise. However, any further disclosures made on related subjects in subsequent reports on Forms 10-K, 10-Q and 8-K should be consulted. Additional information about issues that could lead to material changes in performance and risk factors that have the potential to affect us is contained in Item 1A, “Risk Factors” under Part I of this annual report on Form 10-K.
51
Critical Accounting Policies
General
— A comprehensive enumeration of the significant accounting policies of D.R. Horton, Inc. and subsidiaries is presented in Note A to the accompanying financial statements as of September 30, 2012 and 2011, and for the years ended September 30, 2012, 2011 and 2010. Each of our accounting policies has been chosen based upon current authoritative literature that collectively comprises U.S. Generally Accepted Accounting Principles (GAAP). In instances where alternative methods of accounting are permissible under GAAP, we have chosen the method that most appropriately reflects the nature of our business, the results of our operations and our financial condition, and have consistently applied those methods over each of the periods presented in the financial statements. The Audit Committee of our Board of Directors has reviewed and approved the accounting policies selected.
Revenue Recognition
— We generally recognize homebuilding revenue and related profit at the time of the closing of a sale, when title to and possession of the property are transferred to the buyer. In situations where the buyer’s financing is originated by DHI Mortgage, our 100% owned mortgage subsidiary, and the buyer has not made an adequate initial or continuing investment, the profit is deferred until the sale of the related mortgage loan to a third-party purchaser has been completed. Any profit on land sales is deferred until the full accrual method criteria are met. When appropriate, revenue and profit on long-term construction projects are recognized under the percentage-of-completion method.
We include proceeds from home closings held for our benefit at title companies in homebuilding cash. When we execute sales contracts with our homebuyers, or when we require advance payment from homebuyers for custom changes, upgrades or options related to their homes, we record the cash deposits received as liabilities until the homes are closed or the contracts are canceled. We either retain or refund to the homebuyer deposits on canceled sales contracts, depending upon the applicable provisions of the contract or other circumstances.
We recognize financial services revenues associated with our title operations as closing services are rendered and title insurance policies are issued, both of which generally occur simultaneously as each home is closed. We transfer substantially all underwriting risk associated with title insurance policies to third-party insurers. We typically elect the fair value option for our mortgage loan originations. Mortgage loans held for sale are initially recorded at fair value based on either sale commitments or current market quotes and are adjusted for subsequent changes in fair value until the loan is sold. Net origination costs and fees associated with mortgage loans are recognized at the time of origination. The expected net future cash flows related to the associated servicing of a loan are included in the measurement of all written loan commitments that are accounted for at fair value through earnings at the time of commitment. We generally sell the mortgages we originate and the related servicing rights to third-party purchasers. Interest income is earned from the date a mortgage loan is originated until the loan is sold.
Some mortgage loans are sold with limited recourse provisions. Based on historical experience, discussions with our mortgage purchasers, analysis of the mortgages we originated and current housing and credit market conditions, we estimate and record a loss reserve for mortgage loans held in portfolio and mortgage loans held for sale, as well as known and projected mortgage loan repurchase requests. A 20% or 40% increase in the amount of expected mortgage loan repurchases and expected losses on mortgage loan repurchases would result in an increase of approximately
$0.8 million
or
$2.6 million
, respectively, in our reserve for expected mortgage loan repurchases.
Marketable Securities
— We invest a portion of our cash on hand by purchasing marketable securities with maturities in excess of three months. These securities are held in the custody of a single financial institution. We consider our investment portfolio to be available-for-sale. Accordingly, these investments are recorded at fair value. At the end of a reporting period, unrealized gains and losses on these investments, net of tax, are recorded in accumulated other comprehensive income (loss) on the consolidated balance sheet. Gains and losses realized upon the sale of marketable securities are determined by specific identification and are included in homebuilding other income.
Inventories and Cost of Sales
— Inventory includes the costs of direct land acquisition, land development and home construction, capitalized interest, real estate taxes and direct overhead costs incurred during development and home construction. Costs that we incur after development projects or homes are substantially complete, such as utilities, maintenance, and cleaning, are charged to SG&A expense as incurred. All indirect overhead costs, such as compensation of sales personnel, division and region management, and the costs of advertising and builder’s risk insurance are charged to SG&A expense as incurred.
52
Land and development costs are typically allocated to individual residential lots on a pro-rata basis, and the costs of residential lots are transferred to construction in progress when home construction begins. We use the specific identification method for the purpose of accumulating home construction costs. Cost of sales for homes closed includes the specific construction costs of each home and all applicable land acquisition, land development and related costs (both incurred and estimated to be incurred) allocated to each residential lot based upon the total number of homes expected to be closed in each community. Any changes to the estimated total development costs subsequent to the initial home closings in a community are allocated on a pro-rata basis to the homes in the community benefiting from the relevant development activity, which generally relates to the remaining homes in the community.
When a home is closed, we generally have not paid all incurred costs necessary to complete the home. We record as a liability and as a charge to cost of sales the amount we determine will ultimately be paid related to completed homes that have been closed. We compare our home construction budgets to actual recorded costs to determine the additional costs remaining to be paid on each closed home. We monitor the accrual by comparing actual costs incurred on closed homes in subsequent months to the amount previously accrued. Although actual costs to be paid in the future on previously closed homes could differ from our current accruals, differences in amounts historically have not been significant.
Each quarter, the performance and outlook of land inventory and communities under development are reviewed for indicators of potential impairment. If indicators of impairment are present for a community, we perform an impairment evaluation of the community, which generally includes an analysis to determine if the undiscounted cash flows estimated to be generated by those assets are less than their carrying amounts, and if so, impairment charges are recorded to cost of sales if the fair value of such assets is less than their carrying amounts.
We generally review our inventory for impairment indicators at the community level and the inventory within each community is categorized as land held for development, residential land and lots developed and under development, and/or construction in progress and finished homes, based on the stage of production or plans for future development. A particular community often includes inventory in more than one category. In certain situations, inventory may be analyzed separately for impairment purposes based on its product type (e.g. single family homes evaluated separately from condominium parcels). In reviewing each of our communities, we determine if impairment indicators exist on inventory held and used by analyzing a variety of factors including, but not limited to, the following:
|
•
|
gross margins on homes closed in recent months;
|
|
•
|
projected gross margins on homes sold but not closed;
|
|
•
|
projected gross margins based on community budgets;
|
|
•
|
trends in gross margins, average selling prices or cost of sales;
|
|
•
|
sales absorption rates; and
|
|
•
|
performance of other communities in nearby locations.
|
If indicators of impairment are present for a community, we perform an impairment evaluation of the community, which generally includes an analysis to determine if the undiscounted cash flows estimated to be generated by those assets are less than their carrying amounts, and if so, impairment charges are recorded to cost of sales if the fair value of such assets is less than their carrying amounts. These estimates of cash flows are significantly impacted by community specific factors including estimates of the amounts and timing of future revenues and estimates of the amount of land development, materials and labor costs which, in turn, may be impacted by the following local market conditions:
|
•
|
supply and availability of new and existing homes;
|
|
•
|
location and desirability of our communities;
|
|
•
|
variety of product types offered in the area;
|
|
•
|
pricing and use of incentives by us and our competitors;
|
|
•
|
alternative uses for our land or communities such as the sale of land, finished lots or home sites to third parties;
|
|
•
|
amount of land and lots we own or control in a particular market or sub-market; and
|
|
•
|
local economic and demographic trends.
|
53
For those assets deemed to be impaired, the impairment to be recognized is measured as the amount by which the carrying amount of the assets exceeds the fair value of the assets. Our determination of fair value is primarily based on discounting the estimated cash flows at a rate commensurate with the inherent risks associated with the assets and related estimated cash flow streams. When an impairment charge for a community is determined, the charge is then allocated to each lot in the community in the same manner as land and development costs are allocated to each lot. The inventory within each community is categorized as construction in progress and finished homes, residential land and lots developed and under development, and land held for development, based on the stage of production or plans for future development. Impairment charges are also recorded on finished homes in substantially completed communities when events or circumstances indicate that the carrying values are greater than the fair values less estimated costs to sell these homes.
For the inventory impairment analyses we performed during fiscal 2012, we assumed that for the majority of communities, sales prices in future periods will be equal to or lower than current sales order prices in each community, or in comparable communities, in order to generate an acceptable absorption rate. For a minority of communities that we do not intend to develop or operate in current market conditions, some increases over current sales prices were assumed. The remaining lives of the communities evaluated were estimated to be in a range from six months to in excess of ten years, and we utilized a range of discount rates for communities from
12%
to
16%
.
We typically do not purchase land for resale. However, when we own land or communities under development that do not fit into our development and construction plans and we determine to sell the asset, the project is accounted for as land held for sale. We record land held for sale at the lesser of its carrying value or fair value less estimated costs to sell. In performing the impairment evaluation for land held for sale, we consider several factors including, but not limited to, prices for land in recent comparable sales transactions, market analysis studies, which include the estimated price a willing buyer would pay for the land and recent legitimate offers received. If the estimated fair value less costs to sell an asset is less than the current carrying value, the asset is written down to its estimated fair value less costs to sell.
The key assumptions relating to inventory valuations are impacted by local market economic conditions and the actions of competitors, and are inherently uncertain. Due to uncertainties in the estimation process, actual results could differ from such estimates. Our quarterly assessments reflect management’s estimates and we continue to monitor the fair value of held-for-sale assets through the disposition date.
Land and Lot Option Purchase Contracts
— We enter into land and lot option purchase contracts to acquire land or lots for the construction of homes. Under these contracts, we will fund a stated deposit in consideration for the right, but not the obligation, to purchase land or lots at a future point in time with predetermined terms. Under the terms of the option purchase contracts, many of our option deposits are not refundable at our discretion.
Option deposits and pre-acquisition costs we incur related to land and lot option purchase contracts are capitalized if all of the following conditions have been met: (1) the costs are directly identifiable with the specific property; (2) the costs would be capitalized if the property were already acquired; and (3) acquisition of the property is probable, meaning we are actively seeking and have the ability to acquire the property, and there is no indication that the property is not available for sale. We consider the following when determining if the acquisition of the property is probable: (1) changes in market conditions subsequent to contracting for the purchase of the land; (2) current contract terms, including per lot price and required purchase dates; and (3) our current land position in the given market or sub-market. Option deposits and capitalized pre-acquisition costs are expensed to cost of sales when we believe it is probable that we will no longer acquire the property under option and will not be able to recover these costs through other means.
Occasionally, an option purchase contract can result in the creation of a variable interest in the entity holding the land parcel under option. We determine if we are the primary beneficiary of the variable interest entity based on our ability to control both (1) the activities of a variable interest entity that most significantly impact the entity’s economic performance and (2) the obligation to absorb losses of the entity or the right to receive benefits from the entity. Based on this evaluation, if we are the primary beneficiary of an entity with which we have entered into a land or lot option purchase contract, the variable interest entity is consolidated. Creditors, if any, of these variable interest entities have no recourse against us.
54
Fair Value Measurements
— The FASB’s authoritative guidance for fair value measurements establishes a three-level hierarchy based upon the inputs to the valuation model of an asset or liability. The fair value hierarchy and its application to our assets and liabilities, is as follows:
|
•
|
Level 1 — Valuation is based on quoted prices in active markets for identical assets and liabilities.
|
|
•
|
Level 2 — Valuation is determined from quoted prices for similar assets or liabilities in active markets, quoted prices for identical or similar instruments in markets that are not active, or by model-based techniques in which all significant inputs are observable in the market.
|
|
•
|
Level 3 — Valuation is derived from model-based techniques in which at least one significant input is unobservable and based on our own estimates about the assumptions that market participants would use to value the asset or liability.
|
When available, we use quoted market prices in active markets to determine fair value. We consider the principal market and nonperformance risk associated with our counterparties when determining the fair value measurements, if applicable. Fair value measurements are used for our marketable securities, mortgage loans held for sale, interest rate lock commitments (IRLCs) and other derivative instruments on a recurring basis, and are used for inventories, other mortgage loans and real estate owned on a nonrecurring basis, when events and circumstances indicate that the carrying value may not be recoverable.
Goodwill
— We record goodwill associated with our acquisitions of businesses when the consideration paid exceeds the fair value of the net tangible and identifiable intangible assets acquired. We evaluate our goodwill balances for potential impairment on an annual basis. The current guidance allows an entity to assess qualitatively whether it is necessary to perform step one of a prescribed two-step annual goodwill impairment test. If an entity believes, as a result of its qualitative assessment, that it is more likely than not that the fair value of a reporting unit exceeds its carrying amount, the two-step goodwill impairment test is not required. We performed a qualitative assessment of our goodwill balances of
$38.9 million
and
$15.9 million
at
September 30, 2012
and
2011
, respectively, and determined that the two-step process was not necessary.
Warranty Claims
— We typically provide our homebuyers with a ten-year limited warranty for major defects in structural elements such as framing components and foundation systems, a two-year limited warranty on major mechanical systems, and a one-year limited warranty on other construction components. Since we subcontract our construction work to subcontractors who typically provide an indemnity and a certificate of insurance prior to receiving payments for their work, claims relating to workmanship and materials are generally the primary responsibility of the subcontractors. Warranty liabilities are established by charging cost of sales for each home delivered. The amounts charged are based on management’s estimate of expected warranty-related costs under all unexpired warranty obligation periods. Our warranty liability is based upon historical warranty cost experience in each market in which we operate, and is adjusted as appropriate to reflect qualitative risks associated with the types of homes we build and the geographic areas in which we build them. Actual future warranty costs could differ from our currently estimated amounts. A 10% change in the historical warranty rates used to estimate our warranty accrual would not result in a material change in our accrual.
Legal Claims and Insurance
— We are named as a defendant in various claims, complaints and other legal actions in the ordinary course of business. At any point in time, we are managing several hundred individual claims related to construction defect matters, personal injury claims, employment matters, land development issues and contract disputes. We have established reserves for these contingencies based on the estimated costs of pending claims and the estimated costs of anticipated future claims related to previously closed homes. At both September 30, 2012 and 2011,
99%
of these reserves related to construction defect matters.
Our reserves for construction defect claims include the estimated costs of both known claims and anticipated future claims. As of September 30, 2012, we have reserves for approximately
170
pending construction defect claims, and no individual existing claim was material to our financial statements. The majority of our total construction defect reserves consists of the estimated exposure to future claims on previously closed homes. We have closed a significant number of homes during recent years, and as a result we may be subject to future construction defect claims on these homes. Although regulations vary from state to state, construction defect issues can generally be reported for up to ten years after the home has closed in many states in which we operate. Historical data and trends regarding the frequency of claims incurred and the costs to resolve claims relative to the types of products and markets where we operate are used to estimate the construction defect liabilities for both existing and anticipated future claims. These estimates are subject to ongoing revision as the circumstances of individual pending claims and historical data and trends change. Adjustments to estimated reserves are recorded in the accounting period in which the change in estimate occurs.
55
Historical trends in construction defect claims have been inconsistent, and we believe they may continue to fluctuate over the next several years. Housing market conditions have been volatile across most of our markets over the past ten years, and we believe such conditions can affect the frequency and cost of construction defect claims. We closed a significant number of homes during our peak operating years from 2003 to 2007. If the ultimate resolution of construction defect claims resulting from closings in our peak operating years varies from current expectations, it could significantly change our estimates regarding the frequency and timing of claims incurred and the costs to resolve existing and anticipated future claims, which would impact the construction defect reserves in the future. If the frequency of claims incurred or costs of existing and future legal claims significantly exceed our current estimates, they will have a significant negative impact on our future earnings and liquidity.
We estimate and record receivables under applicable insurance policies related to our estimated contingencies for known claims and anticipated future construction defect claims on previously closed homes and other legal claims and lawsuits incurred in the ordinary course of business when recovery is probable. Additionally, we may have the ability to recover a portion of our losses from our subcontractors and their insurance carriers when we have been named as an additional insured on their insurance policies.
The estimation of losses related to these reserves and the related estimates of receivables from insurance policies are subject to a high degree of variability due to uncertainties such as trends in construction defect claims relative to our markets and the types of products built, claim frequency, claim settlement costs and patterns, insurance industry practices and legal interpretations, among others. Due to the high degree of judgment required in establishing reserves for these contingencies, actual future costs and recoveries from insurance could differ significantly from current estimated amounts. A 10% increase in the claim frequency and the average cost per claim used to estimate the reserves would result in an increase of approximately
$137.7 million
in our reserves and a
$73.3 million
increase in our receivable, resulting in additional expense of
$64.4 million
. A 10% decrease in the claim frequency and the average cost per claim would result in a decrease of approximately
$96.0 million
in our reserves and a
$58.1 million
decrease in our receivable, resulting in a reduction in expense of
$37.9 million
.
Income Taxes
— We calculate our income tax expense (benefit) using the asset and liability method, under which deferred tax assets and liabilities are recorded based on the tax consequences of temporary differences between the financial statement amounts of assets and liabilities and their tax bases, and of tax loss and credit carryforwards. In assessing the realizability of deferred tax assets, we consider whether it is more likely than not that some portion or all of the deferred tax assets will not be realized. The realization of deferred tax assets is primarily dependent upon the generation of sufficient taxable income in future periods and in the jurisdictions in which those temporary differences become deductible. We record a valuation allowance when we determine it is more likely than not that a portion of our deferred tax assets will not be realized. In determining the future tax consequences of events that have been recognized in our financial statements or tax returns, judgment is required. The accounting for deferred taxes is based upon an estimate of future results. Differences between the anticipated and actual outcomes of these future tax consequences could have a material impact on our consolidated results of operations or financial position. Changes in existing tax laws and tax rates also affect actual tax results and the valuation of deferred tax assets over time.
Interest and penalties related to unrecognized tax benefits are recognized in the financial statements as a component of income tax expense. Significant judgment is required to evaluate uncertain tax positions. We evaluate our uncertain tax positions on a quarterly basis. Our evaluations are based upon a number of factors, including changes in facts or circumstances, changes in tax law, correspondence with tax authorities during the course of audits and effective settlement of audit issues. Changes in the recognition or measurement of uncertain tax positions could result in material increases or decreases in our income tax expense in the period in which we make the change.
56
Stock-based Compensation
— From time to time, the compensation committee of our board of directors authorizes the issuance of stock-based compensation to our employees and directors. The committee approves grants out of amounts remaining available for grant from amounts formally authorized by the common stockholders. Options are granted at exercise prices which equal the market value of our common stock at the date of the grant. The options vest over periods of
2
to
9.75 years
and expire 10 years after the dates on which they were granted.
We measure and recognize compensation expense at an amount equal to the fair value of share-based payments granted under compensation arrangements for all awards granted or modified after October 1, 2005, using the modified prospective method. Compensation expense for any unvested stock option awards outstanding as of October 1, 2005 is recognized on a straight-line basis over the remaining vesting period. We calculate the fair values of stock options using the Black-Scholes option pricing model. Determining the fair value of share-based awards at the grant date requires judgment in developing assumptions, which involve a number of variables. These variables include, but are not limited to, the expected stock price volatility over the term of the awards, the expected dividend yield and expected stock option exercise behavior. In addition, we also use judgment in estimating the number of share-based awards that are expected to be forfeited.
Recent Accounting Pronouncements
In December 2011, the FASB issued ASU 2011-11, “Disclosures about Offsetting Assets and Liabilities,” which requires entities to disclose information about offsetting and related arrangements of financial instruments and derivative instruments. The guidance is effective for us beginning October 1, 2013 and is to be applied retrospectively. The adoption of this guidance, which is related to disclosure only, is not expected to have a material impact on our consolidated financial position, results of operations or cash flows.
In July 2012, the FASB issued ASU 2012-02, “Intangibles - Goodwill and Other,” which provides the option to perform a qualitative, rather than quantitative, assessment to determine whether it is more likely than not an indefinite-lived intangible asset is impaired. If the asset is considered impaired, an entity is required to perform the quantitative assessment under the existing guidance. The guidance is effective for our interim and annual impairment tests beginning in fiscal 2013. The adoption of this guidance, which is intended to simplify the impairment testing, is not expected to impact our consolidated financial position, results of operations or cash flows.
57
|
ITEM 7A.
|
QUANTITATIVE AND QUALITATIVE DISCLOSURES ABOUT MARKET RISK
|
We are subject to interest rate risk on our long-term debt. We monitor our exposure to changes in interest rates and utilize both fixed and variable rate debt. For fixed rate debt, changes in interest rates generally affect the value of the debt instrument, but not our earnings or cash flows. Conversely, for variable rate debt, changes in interest rates generally do not impact the fair value of the debt instrument, but may affect our future earnings and cash flows. Except in very limited circumstances, we do not have an obligation to prepay fixed-rate debt prior to maturity and, as a result, interest rate risk and changes in fair value would not have a significant impact on our cash flows related to our fixed-rate debt until such time as we are required to refinance, repurchase or repay such debt.
We are exposed to interest rate risk associated with our mortgage loan origination services. We manage interest rate risk through the use of forward sales of mortgage-backed securities (MBS), Eurodollar Futures Contracts (EDFC) and put options on MBS and EDFC. Use of the term “hedging instruments” in the following discussion refers to these securities collectively, or in any combination. We do not enter into or hold derivatives for trading or speculative purposes.
Interest rate lock commitments (IRLCs) are extended to borrowers who have applied for loan funding and who meet defined credit and underwriting criteria. Typically, the IRLCs have a duration of less than six months. Some IRLCs are committed immediately to a specific purchaser through the use of best-efforts whole loan delivery commitments, while other IRLCs are funded prior to being committed to third-party purchasers. The hedging instruments related to IRLCs are classified and accounted for as derivative instruments in an economic hedge, with gains and losses recognized in current earnings. Hedging instruments related to funded, uncommitted loans are accounted for at fair value, with changes recognized in current earnings, along with changes in the fair value of the funded, uncommitted loans. The fair value change related to the hedging instruments generally offsets the fair value change in the uncommitted loans, and the fair value change, which for the years ended
September 30, 2012
and
2011
was not significant, is recognized in current earnings. At
September 30, 2012
, hedging instruments used to mitigate interest rate risk related to uncommitted mortgage loans held for sale and uncommitted IRLCs totaled a notional amount of
$366.5 million
. Uncommitted IRLCs totaled a notional amount of approximately
$287.1 million
and uncommitted mortgage loans held for sale totaled a notional amount of approximately
$109.1 million
at
September 30, 2012
.
The following table sets forth principal cash flows by scheduled maturity, effective weighted average interest rates and estimated fair value of our debt obligations as of
September 30, 2012
. The interest rate for our variable rate debt represents the interest rate on our mortgage repurchase facility. Because the mortgage repurchase facility is effectively secured by certain mortgage loans held for sale which are typically sold within 60 days, its outstanding balance is included as a variable rate maturity in the most current period presented.
|
|
Fiscal Year Ending September 30,
|
Fair Value at September 30, 2012
|
||||||||||||||||||||||||||||||
|
|
2013
|
2014
|
2015
|
2016
|
2017
|
Thereafter
|
Total
|
|||||||||||||||||||||||||
|
|
($ in millions)
|
|||||||||||||||||||||||||||||||
|
Debt:
|
||||||||||||||||||||||||||||||||
|
Fixed rate
|
$
|
175.9
|
|
$
|
783.8
|
|
$
|
157.7
|
|
$
|
542.9
|
|
$
|
350.0
|
|
$
|
350.0
|
|
$
|
2,360.3
|
|
$
|
2,799.2
|
|
||||||||
|
Average interest rate
|
7.1
|
%
|
8.3
|
%
|
5.4
|
%
|
6.4
|
%
|
5.0
|
%
|
4.5
|
%
|
6.5
|
%
|
||||||||||||||||||
|
Variable rate
|
$
|
187.8
|
|
$
|
—
|
|
$
|
—
|
|
$
|
—
|
|
$
|
—
|
|
$
|
—
|
|
$
|
187.8
|
|
$
|
187.8
|
|
||||||||
|
Average interest rate
|
2.8
|
%
|
—
|
|
—
|
|
—
|
|
—
|
|
—
|
|
2.8
|
%
|
||||||||||||||||||
58
REPORT OF INDEPENDENT REGISTERED PUBLIC ACCOUNTING FIRM
To the Board of Directors and Stockholders of D.R. Horton, Inc.
In our opinion, the accompanying consolidated balance sheets and the related consolidated statements of operations and comprehensive income, total equity and cash flows present fairly, in all material respects, the financial position of D.R. Horton, Inc. and its subsidiaries at
September 30, 2012
and
2011
and the results of their operations and their cash flows for each of the three years in the period ended
September 30, 2012
in conformity with accounting principles generally accepted in the United States of America. Also in our opinion, the Company maintained, in all material respects, effective internal control over financial reporting as of
September 30, 2012
, based on criteria established in
Internal Control — Integrated Framework
issued by the Committee of Sponsoring Organizations of the Treadway Commission (COSO). The Company’s management is responsible for these financial statements, for maintaining effective internal control over financial reporting and for its assessment of the effectiveness of internal control over financial reporting, included in Management’s Report on Internal Control over Financial Reporting appearing under Item 9A. Our responsibility is to express opinions on these financial statements and on the Company’s internal control over financial reporting based on our integrated audits. We conducted our audits in accordance with the standards of the Public Company Accounting Oversight Board (United States). Those standards require that we plan and perform the audits to obtain reasonable assurance about whether the financial statements are free of material misstatement and whether effective internal control over financial reporting was maintained in all material respects. Our audits of the financial statements included examining, on a test basis, evidence supporting the amounts and disclosures in the financial statements, assessing the accounting principles used and significant estimates made by management, and evaluating the overall financial statement presentation. Our audit of internal control over financial reporting included obtaining an understanding of internal control over financial reporting, assessing the risk that a material weakness exists, and testing and evaluating the design and operating effectiveness of internal control based on the assessed risk. Our audits also included performing such other procedures as we considered necessary in the circumstances. We believe that our audits provide a reasonable basis for our opinions.
A company’s internal control over financial reporting is a process designed to provide reasonable assurance regarding the reliability of financial reporting and the preparation of financial statements for external purposes in accordance with generally accepted accounting principles. A company’s internal control over financial reporting includes those policies and procedures that (i) pertain to the maintenance of records that, in reasonable detail, accurately and fairly reflect the transactions and dispositions of the assets of the company; (ii) provide reasonable assurance that transactions are recorded as necessary to permit preparation of financial statements in accordance with generally accepted accounting principles, and that receipts and expenditures of the company are being made only in accordance with authorizations of management and directors of the company; and (iii) provide reasonable assurance regarding prevention or timely detection of unauthorized acquisition, use, or disposition of the company’s assets that could have a material effect on the financial statements.
Because of its inherent limitations, internal control over financial reporting may not prevent or detect misstatements. Also, projections of any evaluation of effectiveness to future periods are subject to the risk that controls may become inadequate because of changes in conditions, or that the degree of compliance with the policies or procedures may deteriorate.
/s/ PricewaterhouseCoopers LLP
Fort Worth, Texas
November 16, 2012
59
|
ITEM 8.
|
FINANCIAL STATEMENTS AND SUPPLEMENTARY DATA
|
D.R. HORTON, INC. AND SUBSIDIARIES
|
|
September 30,
|
||||||
|
|
2012
|
2011
|
|||||
|
|
(In millions)
|
||||||
|
ASSETS
|
|||||||
|
Homebuilding:
|
|
|
|
|
|||
|
Cash and cash equivalents
|
$
|
1,030.4
|
|
$
|
715.5
|
|
|
|
Marketable securities, available-for-sale
|
298.0
|
|
297.6
|
|
|||
|
Restricted cash
|
49.3
|
|
49.1
|
|
|||
|
Inventories:
|
|
|
|
|
|||
|
Construction in progress and finished homes
|
1,682.7
|
|
1,369.2
|
|
|||
|
Residential land and lots — developed and under development
|
1,838.4
|
|
1,370.7
|
|
|||
|
Land held for development
|
644.1
|
|
709.8
|
|
|||
|
|
4,165.2
|
|
3,449.7
|
|
|||
|
Income taxes receivable
|
14.4
|
|
12.4
|
|
|||
|
Deferred income taxes, net of valuation allowance of $41.9 million
and $848.5 million at September 30, 2012 and 2011, respectively
|
709.5
|
|
—
|
|
|||
|
Property and equipment, net
|
72.6
|
|
57.6
|
|
|||
|
Other assets
|
456.8
|
|
398.4
|
|
|||
|
Goodwill
|
38.9
|
|
15.9
|
|
|||
|
|
6,835.1
|
|
4,996.2
|
|
|||
|
Financial Services:
|
|
|
|
|
|||
|
Cash and cash equivalents
|
17.3
|
|
17.1
|
|
|||
|
Mortgage loans held for sale
|
345.3
|
|
294.1
|
|
|||
|
Other assets
|
50.5
|
|
51.0
|
|
|||
|
|
413.1
|
|
362.2
|
|
|||
|
Total assets
|
$
|
7,248.2
|
|
$
|
5,358.4
|
|
|
|
LIABILITIES
|
|||||||
|
Homebuilding:
|
|
|
|
|
|||
|
Accounts payable
|
$
|
216.2
|
|
$
|
154.0
|
|
|
|
Accrued expenses and other liabilities
|
893.8
|
|
829.8
|
|
|||
|
Notes payable
|
2,305.3
|
|
1,588.1
|
|
|||
|
|
3,415.3
|
|
2,571.9
|
|
|||
|
Financial Services:
|
|
|
|
|
|||
|
Accounts payable and other liabilities
|
50.4
|
|
46.5
|
|
|||
|
Mortgage repurchase facility
|
187.8
|
|
116.5
|
|
|||
|
|
238.2
|
|
163.0
|
|
|||
|
Total liabilities
|
3,653.5
|
|
2,734.9
|
|
|||
|
Commitments and contingencies (Note
K)
|
|
|
|
|
|||
|
EQUITY
|
|||||||
|
Preferred stock, $.10 par value, 30,000,000 shares authorized, no shares issued
|
—
|
|
—
|
|
|||
|
Common stock, $.01 par value, 1,000,000,000 shares authorized,
328,092,047 shares issued and 320,891,976 shares outstanding at September 30, 2012
and 323,243,170 shares issued and 316,043,099 shares outstanding at September 30, 2011
|
3.3
|
|
3.2
|
|
|||
|
Additional paid-in capital
|
1,979.8
|
|
1,917.0
|
|
|||
|
Retained earnings
|
1,743.1
|
|
834.6
|
|
|||
|
Treasury stock, 7,200,071 shares at September 30, 2012 and 2011, at cost
|
(134.3
|
)
|
(134.3
|
)
|
|||
|
Accumulated other comprehensive income
|
0.2
|
|
0.1
|
|
|||
|
Total stockholders’ equity
|
3,592.1
|
|
2,620.6
|
|
|||
|
Noncontrolling interests
|
2.6
|
|
2.9
|
|
|||
|
Total equity
|
3,594.7
|
|
2,623.5
|
|
|||
|
Total liabilities and equity
|
$
|
7,248.2
|
|
$
|
5,358.4
|
|
|
See accompanying notes to consolidated financial statements.
60
D.R. HORTON, INC. AND SUBSIDIARIES
|
|
Year Ended September 30,
|
||||||||||
|
|
2012
|
2011
|
2010
|
||||||||
|
|
(In millions, except per share data)
|
||||||||||
|
Homebuilding:
|
|
|
|
|
|
|
|||||
|
Revenues:
|
|
|
|
|
|
|
|||||
|
Home sales
|
$
|
4,218.4
|
|
$
|
3,542.3
|
|
$
|
4,302.3
|
|
||
|
Land/lot sales and other
|
17.8
|
|
7.3
|
|
7.4
|
|
|||||
|
|
4,236.2
|
|
3,549.6
|
|
4,309.7
|
|
|||||
|
Cost of sales:
|
|
|
|
|
|
|
|||||
|
Home sales
|
3,472.9
|
|
2,971.0
|
|
3,558.3
|
|
|||||
|
Land/lot sales and other
|
13.3
|
|
6.9
|
|
4.6
|
|
|||||
|
Inventory impairments and land option cost write-offs
|
6.2
|
|
45.4
|
|
64.7
|
|
|||||
|
|
3,492.4
|
|
3,023.3
|
|
3,627.6
|
|
|||||
|
Gross profit:
|
|
|
|
|
|
|
|||||
|
Home sales
|
745.5
|
|
571.3
|
|
744.0
|
|
|||||
|
Land/lot sales and other
|
4.5
|
|
0.4
|
|
2.8
|
|
|||||
|
Inventory impairments and land option cost write-offs
|
(6.2
|
)
|
(45.4
|
)
|
(64.7
|
)
|
|||||
|
|
743.8
|
|
526.3
|
|
682.1
|
|
|||||
|
Selling, general and administrative expense
|
528.7
|
|
480.0
|
|
523.2
|
|
|||||
|
Interest expense
|
23.6
|
|
50.5
|
|
86.3
|
|
|||||
|
(Gain) loss on early retirement of debt, net
|
(0.1
|
)
|
10.8
|
|
4.9
|
|
|||||
|
Other (income)
|
(12.1
|
)
|
(8.0
|
)
|
(10.4
|
)
|
|||||
|
|
203.7
|
|
(7.0
|
)
|
78.1
|
|
|||||
|
Financial Services:
|
|
|
|
|
|
|
|||||
|
Revenues, net of recourse and reinsurance expense
|
117.8
|
|
87.2
|
|
90.5
|
|
|||||
|
General and administrative expense
|
85.5
|
|
76.3
|
|
77.2
|
|
|||||
|
Interest expense
|
3.3
|
|
1.4
|
|
1.9
|
|
|||||
|
Interest and other (income)
|
(10.2
|
)
|
(9.6
|
)
|
(10.0
|
)
|
|||||
|
|
39.2
|
|
19.1
|
|
21.4
|
|
|||||
|
Income before income taxes
|
242.9
|
|
12.1
|
|
99.5
|
|
|||||
|
Income tax benefit
|
(713.4
|
)
|
(59.7
|
)
|
(145.6
|
)
|
|||||
|
Net income
|
$
|
956.3
|
|
$
|
71.8
|
|
$
|
245.1
|
|
||
|
Other comprehensive income (loss), net of income tax:
|
|
|
|
|
|
|
|||||
|
Unrealized gain (loss) related to available-for-sale securities
|
0.1
|
|
(0.2
|
)
|
0.3
|
|
|||||
|
Comprehensive income
|
$
|
956.4
|
|
$
|
71.6
|
|
$
|
245.4
|
|
||
|
Basic net income per common share
|
$
|
3.01
|
|
$
|
0.23
|
|
$
|
0.77
|
|
||
|
Net income per common share assuming dilution
|
$
|
2.77
|
|
$
|
0.23
|
|
$
|
0.77
|
|
||
|
Cash dividends declared per common share
|
$
|
0.15
|
|
$
|
0.15
|
|
$
|
0.15
|
|
||
See accompanying notes to consolidated financial statements.
61
D.R. HORTON, INC. AND SUBSIDIARIES
CONSOLIDATED STATEMENTS OF TOTAL EQUITY
|
Common
Stock
|
Additional
Paid-in
Capital
|
Retained
Earnings
|
Treasury
Stock
|
Accumulated
Other
Comprehensive
Income
|
Non-controlling
Interests
|
Total
Equity
|
|||||||||||||||||||||
|
|
(In millions, except common stock share data)
|
||||||||||||||||||||||||||
|
Balances at September 30, 2009 (317,480,886 shares)
|
$
|
3.2
|
|
$
|
1,871.1
|
|
$
|
613.2
|
|
$
|
(95.7
|
)
|
$
|
—
|
|
$
|
8.8
|
|
$
|
2,400.6
|
|
||||||
|
Net income
|
—
|
|
—
|
|
245.1
|
|
—
|
|
—
|
|
—
|
|
245.1
|
|
|||||||||||||
|
Issuances under employee benefit plans (107,952 shares)
|
—
|
|
1.1
|
|
—
|
|
—
|
|
—
|
|
—
|
|
1.1
|
|
|||||||||||||
|
Exercise of stock options (1,234,396 shares)
|
—
|
|
9.3
|
|
—
|
|
—
|
|
—
|
|
—
|
|
9.3
|
|
|||||||||||||
|
Stock based compensation expense
|
—
|
|
13.3
|
|
—
|
|
—
|
|
—
|
|
—
|
|
13.3
|
|
|||||||||||||
|
Cash dividends declared
|
—
|
|
—
|
|
(47.7
|
)
|
—
|
|
—
|
|
—
|
|
(47.7
|
)
|
|||||||||||||
|
Other comprehensive income
|
—
|
|
—
|
|
—
|
|
—
|
|
0.3
|
|
—
|
|
0.3
|
|
|||||||||||||
|
Noncontrolling interests
|
—
|
|
—
|
|
—
|
|
—
|
|
—
|
|
0.9
|
|
0.9
|
|
|||||||||||||
|
Balances at September 30, 2010 (318,823,234 shares)
|
$
|
3.2
|
|
$
|
1,894.8
|
|
$
|
810.6
|
|
$
|
(95.7
|
)
|
$
|
0.3
|
|
$
|
9.7
|
|
$
|
2,622.9
|
|
||||||
|
Net income
|
—
|
|
—
|
|
71.8
|
|
—
|
|
—
|
|
—
|
|
71.8
|
|
|||||||||||||
|
Issuances under employee benefit plans (91,350 shares)
|
—
|
|
0.9
|
|
—
|
|
—
|
|
—
|
|
—
|
|
0.9
|
|
|||||||||||||
|
Exercise of stock options (303,535 shares)
|
—
|
|
2.5
|
|
—
|
|
—
|
|
—
|
|
—
|
|
2.5
|
|
|||||||||||||
|
Stock issued under Performance Unit Plan (369,818 shares)
|
—
|
|
4.6
|
|
—
|
|
—
|
|
—
|
|
—
|
|
4.6
|
|
|||||||||||||
|
Stock based compensation expense
|
—
|
|
14.2
|
|
—
|
|
—
|
|
—
|
|
—
|
|
14.2
|
|
|||||||||||||
|
Cash dividends declared
|
—
|
|
—
|
|
(47.8
|
)
|
—
|
|
—
|
|
—
|
|
(47.8
|
)
|
|||||||||||||
|
Treasury stock purchases (3,544,838 shares)
|
—
|
|
—
|
|
—
|
|
(38.6
|
)
|
—
|
|
—
|
|
(38.6
|
)
|
|||||||||||||
|
Other comprehensive loss
|
—
|
|
—
|
|
—
|
|
—
|
|
(0.2
|
)
|
—
|
|
(0.2
|
)
|
|||||||||||||
|
Noncontrolling interests
|
—
|
|
—
|
|
—
|
|
—
|
|
—
|
|
(6.8
|
)
|
(6.8
|
)
|
|||||||||||||
|
Balances at September 30, 2011 (316,043,099 shares)
|
$
|
3.2
|
|
$
|
1,917.0
|
|
$
|
834.6
|
|
$
|
(134.3
|
)
|
$
|
0.1
|
|
$
|
2.9
|
|
$
|
2,623.5
|
|
||||||
|
Net income
|
—
|
|
—
|
|
956.3
|
|
—
|
|
—
|
|
—
|
|
956.3
|
|
|||||||||||||
|
Issuances under employee benefit plans (79,455 shares)
|
—
|
|
0.9
|
|
—
|
|
—
|
|
—
|
|
—
|
|
0.9
|
|
|||||||||||||
|
Exercise of stock options (4,493,797 shares)
|
0.1
|
|
40.7
|
|
—
|
|
—
|
|
—
|
|
—
|
|
40.8
|
|
|||||||||||||
|
Stock issued under Performance Unit Plan (275,625 shares)
|
—
|
|
3.1
|
|
—
|
|
—
|
|
—
|
|
—
|
|
3.1
|
|
|||||||||||||
|
Stock based compensation expense
|
—
|
|
18.1
|
|
—
|
|
—
|
|
—
|
|
—
|
|
18.1
|
|
|||||||||||||
|
Cash dividends declared
|
—
|
|
—
|
|
(47.8
|
)
|
—
|
|
—
|
|
—
|
|
(47.8
|
)
|
|||||||||||||
|
Other comprehensive income
|
—
|
|
—
|
|
—
|
|
—
|
|
0.1
|
|
—
|
|
0.1
|
|
|||||||||||||
|
Noncontrolling interests
|
—
|
|
—
|
|
—
|
|
—
|
|
—
|
|
(0.3
|
)
|
(0.3
|
)
|
|||||||||||||
|
Balances at September 30, 2012 (320,891,976 shares)
|
$
|
3.3
|
|
$
|
1,979.8
|
|
$
|
1,743.1
|
|
$
|
(134.3
|
)
|
$
|
0.2
|
|
$
|
2.6
|
|
$
|
3,594.7
|
|
||||||
See accompanying notes to consolidated financial statements.
62
D.R. HORTON, INC. AND SUBSIDIARIES
|
|
Year Ended September 30,
|
||||||||||
|
|
2012
|
2011
|
2010
|
||||||||
|
|
(In millions)
|
||||||||||
|
OPERATING ACTIVITIES
|
|
|
|
|
|
|
|||||
|
Net income
|
$
|
956.3
|
|
$
|
71.8
|
|
$
|
245.1
|
|
||
|
Adjustments to reconcile net income to net cash
(used in) provided by operating activities:
|
|
|
|
|
|
|
|||||
|
Depreciation
|
18.8
|
|
19.9
|
|
18.4
|
|
|||||
|
Amortization of discounts and fees
|
40.4
|
|
37.2
|
|
30.8
|
|
|||||
|
Stock based compensation expense
|
18.1
|
|
14.2
|
|
13.3
|
|
|||||
|
Income tax benefit from stock option exercises
|
—
|
|
—
|
|
(2.8
|
)
|
|||||
|
Deferred income taxes
|
(709.5
|
)
|
—
|
|
—
|
|
|||||
|
(Gain) loss on early retirement of debt, net
|
(0.1
|
)
|
10.8
|
|
4.9
|
|
|||||
|
Gain on sale of marketable securities
|
(0.2
|
)
|
(0.1
|
)
|
—
|
|
|||||
|
Inventory impairments and land option cost write-offs
|
6.2
|
|
45.4
|
|
64.7
|
|
|||||
|
Changes in operating assets and liabilities:
|
|
|
|
|
|
|
|||||
|
(Increase) decrease in construction in progress and finished homes
|
(275.4
|
)
|
(91.4
|
)
|
156.0
|
|
|||||
|
(Increase) decrease in residential land and lots —
developed, under development, and held for development
|
(371.0
|
)
|
16.9
|
|
(11.2
|
)
|
|||||
|
(Increase) decrease in other assets
|
(42.1
|
)
|
28.7
|
|
2.5
|
|
|||||
|
(Increase) decrease in income taxes receivable
|
(2.0
|
)
|
3.6
|
|
277.1
|
|
|||||
|
Increase in mortgage loans held for sale
|
(51.2
|
)
|
(40.3
|
)
|
(33.0
|
)
|
|||||
|
Increase (decrease) in accounts payable, accrued expenses and other liabilities
|
113.6
|
|
(101.8
|
)
|
(56.4
|
)
|
|||||
|
Net cash (used in) provided by operating activities
|
(298.1
|
)
|
14.9
|
|
709.4
|
|
|||||
|
INVESTING ACTIVITIES
|
|
|
|
|
|
|
|||||
|
Purchases of property and equipment
|
(33.6
|
)
|
(16.3
|
)
|
(19.2
|
)
|
|||||
|
Purchases of marketable securities
|
(240.8
|
)
|
(300.1
|
)
|
(328.0
|
)
|
|||||
|
Proceeds from the sale or maturity of marketable securities
|
232.8
|
|
292.5
|
|
27.7
|
|
|||||
|
(Increase) decrease in restricted cash
|
(0.2
|
)
|
4.6
|
|
1.5
|
|
|||||
|
Acquisition of a business
|
(96.5
|
)
|
—
|
|
—
|
|
|||||
|
Net cash used in investing activities
|
(138.3
|
)
|
(19.3
|
)
|
(318.0
|
)
|
|||||
|
FINANCING ACTIVITIES
|
|
|
|
|
|
|
|||||
|
Proceeds from notes payable
|
765.9
|
|
30.0
|
|
17.8
|
|
|||||
|
Repayment of notes payable
|
(17.5
|
)
|
(519.3
|
)
|
(1,019.9
|
)
|
|||||
|
Proceeds from stock associated with certain employee benefit plans
|
50.9
|
|
3.4
|
|
7.6
|
|
|||||
|
Income tax benefit from stock option exercises
|
—
|
|
—
|
|
2.8
|
|
|||||
|
Cash dividends paid
|
(47.8
|
)
|
(47.8
|
)
|
(47.7
|
)
|
|||||
|
Purchase of treasury stock
|
—
|
|
(38.6
|
)
|
—
|
|
|||||
|
Net cash provided by (used in) financing activities
|
751.5
|
|
(572.3
|
)
|
(1,039.4
|
)
|
|||||
|
INCREASE (DECREASE) IN CASH AND CASH EQUIVALENTS
|
315.1
|
|
(576.7
|
)
|
(648.0
|
)
|
|||||
|
Cash and cash equivalents at beginning of year
|
732.6
|
|
1,309.3
|
|
1,957.3
|
|
|||||
|
Cash and cash equivalents at end of year
|
$
|
1,047.7
|
|
$
|
732.6
|
|
$
|
1,309.3
|
|
||
|
Supplemental cash flow information:
|
|
|
|
|
|
|
|||||
|
Interest paid, net of amounts capitalized
|
$
|
19.5
|
|
$
|
66.3
|
|
$
|
101.8
|
|
||
|
Income taxes paid (refunded), net
|
$
|
6.1
|
|
$
|
(1.9
|
)
|
$
|
(485.4
|
)
|
||
|
Supplemental disclosures of non-cash activities:
|
|
|
|
|
|
|
|||||
|
Notes payable issued for inventory
|
$
|
4.1
|
|
$
|
1.9
|
|
$
|
2.8
|
|
||
|
Stock issued under Performance Unit Plan
|
$
|
3.1
|
|
$
|
4.6
|
|
$
|
—
|
|
||
|
Accrual for holdback payment related to acquisition
|
$
|
9.4
|
|
$
|
—
|
|
$
|
—
|
|
||
See accompanying notes to consolidated financial statements.
63
D.R. HORTON, INC. AND SUBSIDIARIES
NOTES TO CONSOLIDATED FINANCIAL STATEMENTS
NOTE A – SUMMARY OF SIGNIFICANT ACCOUNTING POLICIES
Basis of Presentation
The consolidated financial statements have been prepared in accordance with U.S. Generally Accepted Accounting Principles (GAAP) and include the accounts of D.R. Horton, Inc. and all of its 100% owned, majority-owned and controlled subsidiaries (which are referred to as the Company, unless the context otherwise requires). All significant intercompany accounts, transactions and balances have been eliminated in consolidation.
Use of Estimates
The preparation of financial statements in conformity with GAAP requires management to make estimates and assumptions that affect the amounts reported in the financial statements and accompanying notes. Actual results could differ materially from those estimates.
Revenue Recognition
Homebuilding revenue and related profit are generally recognized at the time of the closing of a sale, when title to and possession of the property are transferred to the buyer. In situations where the buyer’s financing is originated by DHI Mortgage, the Company’s 100% owned mortgage subsidiary, and the buyer has not made an adequate initial or continuing investment, the profit is deferred until the sale of the related mortgage loan to a third-party purchaser has been completed. At
September 30, 2012
and
2011
, the Company had deferred profit on these home sales in the amounts of
$1.3 million
and
$1.5 million
, respectively. Any profit on land sales is deferred until the full accrual method criteria are met. When appropriate, revenue and profit on long-term construction projects are recognized under the percentage-of-completion method.
Financial services revenues associated with the Company’s title operations are recognized as closing services are rendered and title insurance policies are issued, both of which generally occur simultaneously as each home is closed. The Company transfers substantially all underwriting risk associated with title insurance policies to third-party insurers. The Company typically elects the fair value option for its mortgage loan originations. Mortgage loans held for sale are initially recorded at fair value based on either sale commitments or current market quotes and are adjusted for subsequent changes in fair value until the loan is sold. Net origination costs and fees associated with mortgage loans are recognized at the time of origination. The expected net future cash flows related to the associated servicing of a loan are included in the measurement of all written loan commitments that are accounted for at fair value through earnings at the time of commitment. The Company generally sells the mortgages it originates and the related servicing rights to third-party purchasers. Interest income is earned from the date a mortgage loan is originated until the loan is sold.
Cash and Cash Equivalents
The Company considers all highly liquid investments with an initial maturity of
three months or less
when purchased to be cash equivalents. Proceeds from home closings held for the Company’s benefit at title companies are included in homebuilding cash on the consolidated balance sheet.
Marketable Securities
The Company invests a portion of its cash on hand by purchasing marketable securities with maturities in excess of three months, and considers its investment portfolio to be available-for-sale. Accordingly, these investments are recorded at fair value. At the end of a reporting period, unrealized gains and losses on these investments, net of tax, are recorded in accumulated other comprehensive income (loss) on the consolidated balance sheet. Gains and losses realized upon the sale of marketable securities are determined by specific identification and are included in homebuilding other income. See Note B.
64
D.R. HORTON, INC. AND SUBSIDIARIES
NOTES TO CONSOLIDATED FINANCIAL STATEMENTS – (Continued)
Restricted Cash
The Company has cash that is restricted as to its use. Restricted cash related to homebuilding operations includes cash used as collateral for outstanding letters of credit and customer deposits that are temporarily restricted in accordance with regulatory requirements.
Inventories and Cost of Sales
Inventory includes the costs of direct land acquisition, land development and home construction, capitalized interest, real estate taxes and direct overhead costs incurred during development and home construction. Costs incurred after development projects or homes are substantially complete, such as utilities, maintenance, and cleaning, are charged to selling, general and administrative (SG&A) expense as incurred. All indirect overhead costs, such as compensation of sales personnel, division and region management, and the costs of advertising and builder’s risk insurance are charged to SG&A expense as incurred.
Land and development costs are typically allocated to individual residential lots on a pro-rata basis, and the costs of residential lots are transferred to construction in progress when home construction begins. The specific identification method is used for the purpose of accumulating home construction costs. Cost of sales for homes closed includes the specific construction costs of each home and all applicable land acquisition, land development and related costs (both incurred and estimated to be incurred) allocated to each residential lot based upon the total number of homes expected to be closed in each community. Any changes to the estimated total development costs subsequent to the initial home closings in a community are allocated on a pro-rata basis to the homes in the community benefiting from the relevant development activity, which generally relates to the remaining homes in the community.
When a home is closed, the Company generally has not paid all incurred costs necessary to complete the home. A liability and a charge to cost of sales are recorded for the amount that is determined will ultimately be paid related to completed homes that have been closed. The home construction budgets are compared to actual recorded costs to determine the additional costs remaining to be paid on each closed home. The accrual is monitored by comparing actual costs incurred on closed homes in subsequent months to the amount previously accrued.
The Company typically does not purchase land for resale. However, when the Company owns land or communities under development that do not fit into its development and construction plans and determines to sell the asset, the project is accounted for as land held for sale. The Company records land held for sale at the lesser of its carrying value or fair value less estimated costs to sell.
Each quarter, the performance and outlook of land inventory and communities under development are reviewed for indicators of potential impairment. If indicators of impairment are present for a community, the Company performs an impairment evaluation of the community, which generally includes an analysis to determine if the undiscounted cash flows estimated to be generated by those assets are less than their carrying amounts, and if so, impairment charges are recorded to cost of sales if the fair value of such assets is less than their carrying amounts. Impairment charges are also recorded on finished homes in substantially completed communities when events or circumstances indicate that the carrying values are greater than the fair values less estimated costs to sell these homes. The key assumptions relating to asset valuations are impacted by local market economic conditions and the actions of competitors, and are inherently uncertain. Due to uncertainties in the estimation process, actual results could differ from such estimates. See Note C.
Homebuilding Interest
The Company capitalizes homebuilding interest to inventory during active development and construction. Capitalized interest is charged to cost of sales as the related inventory is delivered to the buyer. Additionally, the Company writes off a portion of the capitalized interest related to communities for which inventory impairments are recorded. The Company’s inventory under active development and construction was lower than its debt level during fiscal
2012
,
2011
and
2010
; therefore, a portion of the interest incurred is reflected as interest expense.
65
D.R. HORTON, INC. AND SUBSIDIARIES
NOTES TO CONSOLIDATED FINANCIAL STATEMENTS – (Continued)
The following table summarizes the Company’s homebuilding interest costs incurred, capitalized, expensed as interest expense, charged to cost of sales and written off during the years ended
September 30, 2012
,
2011
and
2010
:
|
|
Year Ended September 30,
|
||||||||||
|
|
2012
|
2011
|
2010
|
||||||||
|
|
(In millions)
|
||||||||||
|
Capitalized interest, beginning of year
|
$
|
79.2
|
|
$
|
91.5
|
|
$
|
128.8
|
|
||
|
Interest incurred
|
120.8
|
|
130.2
|
|
173.2
|
|
|||||
|
Interest expensed:
|
|||||||||||
|
Directly to interest expense
|
(23.6
|
)
|
(50.5
|
)
|
(86.3
|
)
|
|||||
|
Amortized to cost of sales
|
(94.0
|
)
|
(90.8
|
)
|
(122.1
|
)
|
|||||
|
Written off with inventory impairments
|
(0.1
|
)
|
(1.2
|
)
|
(2.1
|
)
|
|||||
|
Capitalized interest, end of year
|
$
|
82.3
|
|
$
|
79.2
|
|
$
|
91.5
|
|
||
Land and Lot Option Purchase Contracts
The Company enters into land and lot option purchase contracts to acquire land or lots for the construction of homes. Under these contracts, the Company will fund a stated deposit in consideration for the right, but not the obligation, to purchase land or lots at a future point in time with predetermined terms. Under the terms of the option purchase contracts, many of the option deposits are not refundable at the Company’s discretion.
Option deposits and pre-acquisition costs incurred related to land and lot option purchase contracts are capitalized if all of the following conditions have been met: (1) the costs are directly identifiable with the specific property; (2) the costs would be capitalized if the property were already acquired; and (3) acquisition of the property is probable, meaning the Company is actively seeking and has the ability to acquire the property, and there is no indication that the property is not available for sale. The Company considers the following when determining if the acquisition of the property is probable: (1) changes in market conditions subsequent to contracting for the purchase of the land; (2) current contract terms, including per lot price and required purchase dates; and (3) the Company’s current land position in the given market or sub-market. Option deposits and capitalized pre-acquisition costs are expensed to cost of sales when the Company believes it is probable that it will no longer acquire the property under option and will not be able to recover these costs through other means.
Option purchase contracts can result in the creation of a variable interest in the entity holding the land parcel under option. There were no variable interest entities reported in the consolidated balance sheets at
September 30, 2012
and
2011
because the Company determined it did not control the activities that most significantly impact the variable interest entity’s economic performance and it did not have an obligation to absorb losses of or the right to receive benefits from the entity. The maximum exposure to loss related to the Company’s variable interest entities is limited to the amounts of the Company’s related option deposits. At
September 30, 2012
and
2011
, the amount of option deposits related to these contracts totaled
$32.0 million
and
$13.2 million
, respectively, and are included in homebuilding other assets on the consolidated balance sheets.
Property and Equipment
Property and equipment is stated at cost less accumulated depreciation. Repairs and maintenance costs are expensed as incurred. Depreciation generally is recorded using the straight-line method over the estimated useful life of the asset. The depreciable life of model home furniture is
2
years, depreciable lives of office furniture and equipment typically range from
2
to
5
years, and depreciable lives of buildings and improvements typically range from
5
to
20
years. Accumulated depreciation was
$121.6 million
and
$129.2 million
as of
September 30, 2012
and
2011
, respectively. Depreciation expense was
$18.8 million
,
$19.9 million
and
$18.4 million
in fiscal
2012
,
2011
and
2010
, respectively.
66
D.R. HORTON, INC. AND SUBSIDIARIES
NOTES TO CONSOLIDATED FINANCIAL STATEMENTS – (Continued)
Fair Value Measurements
The Financial Accounting Standards Board’s (FASB) authoritative guidance for fair value measurements establishes a three-level hierarchy based upon the inputs to the valuation model of an asset or liability. The fair value hierarchy and its application to the Company’s assets and liabilities, is as follows:
|
•
|
Level 1 — Valuation is based on quoted prices in active markets for identical assets and liabilities.
|
|
•
|
Level 2 — Valuation is determined from quoted prices for similar assets or liabilities in active markets, quoted prices for identical or similar instruments in markets that are not active, or by model-based techniques in which all significant inputs are observable in the market.
|
|
•
|
Level 3 — Valuation is derived from model-based techniques in which at least one significant input is unobservable and based on the Company’s own estimates about the assumptions that market participants would use to value the asset or liability.
|
When available, the Company uses quoted market prices in active markets to determine fair value. The Company considers the principal market and nonperformance risk associated with the Company’s counterparties when determining the fair value measurements, if applicable. Fair value measurements are used for the Company’s marketable securities, mortgage loans held for sale, interest rate lock commitments (IRLCs) and other derivative instruments on a recurring basis, and are used for inventories, other mortgage loans and real estate owned on a nonrecurring basis, when events and circumstances indicate that the carrying value may not be recoverable. See Note F.
Acquisitions
In
August 2012
, the Company acquired the homebuilding operations of Breland Homes for
$105.9 million
in cash, of which
$9.4 million
was paid subsequent to September 30, 2012. Breland Homes operates in Huntsville and Mobile in Alabama and along the gulf coast of Mississippi. The assets acquired primarily included approximately
300
homes in inventory,
1,000
finished lots and control of approximately
3,700
additional lots through option contracts. The Company also acquired a sales order backlog of
228
homes valued at
$46.9 million
. All of the assets acquired were recorded at their fair values by the Company. The acquisition of the homebuilding operations of Breland Homes was not material to the Company's results of operations or its financial condition.
Goodwill
The Company records goodwill associated with its acquisitions of businesses when the consideration paid exceeds the fair value of the net tangible and identifiable intangible assets acquired. Goodwill balances are evaluated for potential impairment on an annual basis. The current guidance allows an entity to assess qualitatively whether it is necessary to perform step one of a prescribed two-step annual goodwill impairment test. If an entity believes, as a result of its qualitative assessment, that it is more likely than not that the fair value of a reporting unit exceeds its carrying amount, the two-step goodwill impairment test is not required. The Company performed a qualitative assessment of goodwill at
September 30, 2012
, and determined that the two-step process was not necessary. The Company's goodwill balance at
September 30, 2012
was
$38.9 million
, of which
$15.9 million
related to its South Central reporting segment and
$23.0 million
related to its Southeast reporting segment as a result of the Breland acquisition. The Company's goodwill balance at
September 30, 2011
was
$15.9 million
, all of which related to its South Central reporting segment.
Warranty Claims
The Company typically provides its homebuyers with a
ten
-year limited warranty for major defects in structural elements such as framing components and foundation systems, a
two
-year limited warranty on major mechanical systems, and a
one
-year limited warranty on other construction components. Since the Company subcontracts its construction work to subcontractors who typically provide it with an indemnity and a certificate of insurance prior to receiving payments for their work, claims relating to workmanship and materials are generally the primary responsibility of the subcontractors. Warranty liabilities have been established by charging cost of sales for each home delivered. The amounts charged are based on management’s estimate of expected warranty-related costs under all unexpired warranty obligation periods. The Company’s warranty liability is based upon historical warranty cost experience in each market in which it operates, and is adjusted as appropriate to reflect qualitative risks associated with the types of homes built and the geographic areas in which they are built. See Note K.
67
D.R. HORTON, INC. AND SUBSIDIARIES
NOTES TO CONSOLIDATED FINANCIAL STATEMENTS – (Continued)
Legal Claims and Insurance
The Company records expenses and liabilities for contingencies for legal claims related to construction defect matters, personal injury claims, employment matters, land development issues and contract disputes. The amounts recorded for these contingencies are based on the estimated costs of pending claims and the estimated costs of anticipated future claims related to previously closed homes. The Company estimates and records receivables under applicable insurance policies related to its estimated contingencies when recovery is probable. Additionally, the Company may have the ability to recover a portion of its losses from its subcontractors and their insurance carriers when the Company has been named as an additional insured on their insurance policies. The estimation of losses related to these contingencies and the related estimates of recoveries from insurance policies are subject to a high degree of variability due to uncertainties such as trends in construction defect claims relative to the Company's markets and the types of products built, claim frequency, claim settlement costs and patterns, insurance industry practices and legal interpretations, among others. See Note K.
Advertising Costs
The Company expenses advertising costs as incurred. Advertising expense was approximately
$24.4 million
,
$29.5 million
and
$39.3 million
in fiscal
2012
,
2011
and
2010
, respectively.
Income Taxes
The Company’s income tax expense (benefit) is calculated using the asset and liability method, under which deferred tax assets and liabilities are recorded based on the tax consequences of temporary differences between the financial statement amounts of assets and liabilities and their tax bases, and of tax loss and credit carryforwards. In assessing the realizability of deferred tax assets, management considers whether it is more likely than not that some portion or all of the deferred tax assets will not be realized. The realization of deferred tax assets is primarily dependent upon the generation of sufficient taxable income in future periods and in the jurisdictions in which those temporary differences become deductible. The Company records a valuation allowance when it determines it is more likely than not that a portion of the deferred tax assets will not be realized. In determining the future tax consequences of events that have been recognized in the Company’s financial statements or tax returns, judgment is required. Differences between the anticipated and actual outcomes of these future tax consequences could have a material impact on the Company’s consolidated results of operations or financial position.
Interest and penalties related to unrecognized tax benefits are recognized in the financial statements as a component of income tax expense. Significant judgment is required to evaluate uncertain tax positions. The Company evaluates its uncertain tax positions on a quarterly basis. The evaluations are based upon a number of factors, including changes in facts or circumstances, changes in tax law, correspondence with tax authorities during the course of audits and effective settlement of audit issues. Changes in the recognition or measurement of uncertain tax positions could result in material increases or decreases in the Company’s income tax expense in the period in which the change is made. See Note G.
Earnings Per Share
Basic earnings per share is based on the weighted average number of shares of common stock outstanding during each year. Diluted earnings per share is based on the weighted average number of shares of common stock and dilutive securities outstanding during each year. See Note H.
Stock-Based Compensation
From time to time, the compensation committee of the Company’s board of directors authorizes the issuance of stock-based compensation to the Company’s employees and directors. The committee approves grants out of amounts remaining available for grant from amounts formally authorized by the common stockholders.
The Company measures and recognizes compensation expense at an amount equal to the fair value of share-based payments granted under compensation arrangements for all awards granted or modified after October 1, 2005, using the modified prospective method. Compensation expense for any unvested stock option awards outstanding as of October 1, 2005 is recognized on a straight-line basis over the remaining vesting period. The fair values of options granted are calculated on the date of grant using a Black-Scholes option pricing model. The benefits of tax deductions in excess of recognized compensation expense are reported in the Statement of Cash Flows as a financing cash flow. See Note J.
68
D.R. HORTON, INC. AND SUBSIDIARIES
NOTES TO CONSOLIDATED FINANCIAL STATEMENTS – (Continued)
Recent Accounting Pronouncements
In December 2011, the FASB issued ASU 2011-11, “Disclosures about Offsetting Assets and Liabilities,” which requires entities to disclose information about offsetting and related arrangements of financial instruments and derivative instruments. The guidance is effective for the Company beginning October 1, 2013 and is to be applied retrospectively. The adoption of this guidance, which is related to disclosure only, is not expected to have a material impact on the Company’s consolidated financial position, results of operations or cash flows.
In July 2012, the FASB issued ASU 2012-02, “Intangibles - Goodwill and Other,” which provides the option to perform a qualitative, rather than quantitative, assessment to determine whether it is more likely than not an indefinite-lived intangible asset is impaired. If the asset is considered impaired, an entity is required to perform the quantitative assessment under the existing guidance. The guidance is effective for the Company's interim and annual impairment tests beginning in fiscal 2013. The adoption of this guidance, which is intended to simplify the impairment testing, is not expected to impact the Company’s consolidated financial position, results of operations or cash flows.
NOTE B – MARKETABLE SECURITIES
The Company invests a portion of its cash on hand by purchasing marketable securities with maturities in excess of three months. These securities are held in the custody of a single financial institution. The Company considers its investment portfolio to be available-for-sale. Accordingly, these securities are recorded at fair value. The Company’s investment portfolio consisted of the following marketable securities at
September 30, 2012
and
2011
:
|
|
September 30, 2012
|
|||||||||||||||
|
|
Amortized
Cost
|
Gross
Unrealized
Gains
|
Gross
Unrealized
Losses
|
Fair Value
|
||||||||||||
|
|
(In millions)
|
|||||||||||||||
|
Type of security:
|
||||||||||||||||
|
U.S. Treasury securities
|
$
|
75.7
|
|
$
|
—
|
|
$
|
—
|
|
$
|
75.7
|
|
||||
|
Obligations of U.S. government agencies
|
58.1
|
|
—
|
|
—
|
|
58.1
|
|
||||||||
|
Corporate debt securities issued under the
FDIC Temporary Liquidity Guarantee Program
|
39.2
|
|
—
|
|
—
|
|
39.2
|
|
||||||||
|
Corporate debt securities
|
114.8
|
|
0.2
|
|
—
|
|
115.0
|
|
||||||||
|
Total debt securities
|
287.8
|
|
0.2
|
|
—
|
|
288.0
|
|
||||||||
|
Certificates of deposit
|
10.0
|
|
—
|
|
—
|
|
10.0
|
|
||||||||
|
Total marketable securities, available-for-sale
|
$
|
297.8
|
|
$
|
0.2
|
|
$
|
—
|
|
$
|
298.0
|
|
||||
|
|
September 30, 2011
|
|||||||||||||||
|
|
Amortized
Cost
|
Gross
Unrealized
Gains
|
Gross
Unrealized
Losses
|
Fair Value
|
||||||||||||
|
|
(In millions)
|
|||||||||||||||
|
Type of security:
|
||||||||||||||||
|
U.S. Treasury securities
|
$
|
16.3
|
|
$
|
—
|
|
$
|
—
|
|
$
|
16.3
|
|
||||
|
Obligations of U.S. government agencies
|
73.7
|
|
0.1
|
|
—
|
|
73.8
|
|
||||||||
|
Corporate debt securities issued under the
FDIC Temporary Liquidity Guarantee Program
|
103.7
|
|
0.1
|
|
—
|
|
103.8
|
|
||||||||
|
Corporate debt securities
|
98.8
|
|
—
|
|
(0.1
|
)
|
98.7
|
|
||||||||
|
Total debt securities
|
292.5
|
|
0.2
|
|
(0.1
|
)
|
292.6
|
|
||||||||
|
Certificates of deposit
|
5.0
|
|
—
|
|
—
|
|
5.0
|
|
||||||||
|
Total marketable securities, available-for-sale
|
$
|
297.5
|
|
$
|
0.2
|
|
$
|
(0.1
|
)
|
$
|
297.6
|
|
||||
69
D.R. HORTON, INC. AND SUBSIDIARIES
NOTES TO CONSOLIDATED FINANCIAL STATEMENTS – (Continued)
Of the
$298.0 million
in marketable securities,
$207.9 million
mature in the next twelve months and
$90.1 million
mature in one to two years. Proceeds from the sale or maturity of securities during fiscal
2012
,
2011
and
2010
were
$232.8 million
,
$292.5 million
and
$27.7 million
, respectively, and the realized gains related to these sales were
$0.2 million
,
$0.1 million
and
$0
, respectively.
NOTE C – INVENTORY IMPAIRMENTS AND LAND OPTION COST WRITE-OFFS
During fiscal
2012
, the Company reviewed the performance and outlook for all of its land inventory and communities under development each quarter for indicators of potential impairment and performed impairment evaluations and analyses when necessary. As of
September 30, 2012
, the Company performed impairment evaluations of communities with a combined carrying value of
$216.9 million
and determined that communities with a carrying value of
$1.8 million
were impaired. As a result, during the three months ended
September 30, 2012
, impairment charges of
$0.6 million
were recorded to reduce the carrying value of the impaired communities to their estimated fair value, as compared to
$10.2 million
in the same period of
2011
. During fiscal
2012
,
2011
and
2010
, impairment charges totaled
$3.2 million
,
$37.3 million
and
$62.3 million
, respectively.
During fiscal
2012
,
2011
and
2010
, the Company wrote off
$3.0 million
,
$8.1 million
and
$2.4 million
, respectively, of earnest money deposits and land option costs related to land option contracts which are not expected to be acquired.
At
September 30, 2012
and
2011
, the Company had
$32.6 million
and
$26.3 million
, respectively, of land held for sale, consisting of land held for development and land under development that met the criteria of land held for sale.
NOTE D – NOTES PAYABLE
The Company’s notes payable at their principal amounts, net of any unamortized discounts, consist of the following:
|
|
September 30,
|
||||||
|
|
2012
|
2011
|
|||||
|
|
(In millions)
|
||||||
|
Homebuilding:
|
|
|
|
|
|||
|
Unsecured:
|
|
|
|
|
|||
|
Revolving credit facility, maturing 2017
|
$
|
—
|
|
$
|
—
|
|
|
|
6.875% senior notes due 2013
|
171.7
|
|
171.7
|
|
|||
|
6.125% senior notes due 2014, net
|
145.5
|
|
145.2
|
|
|||
|
2% convertible senior notes due 2014, net
|
447.0
|
|
418.1
|
|
|||
|
5.625% senior notes due 2014, net
|
137.6
|
|
137.5
|
|
|||
|
5.25% senior notes due 2015, net
|
157.4
|
|
157.3
|
|
|||
|
5.625% senior notes due 2016, net
|
169.6
|
|
169.5
|
|
|||
|
6.5% senior notes due 2016, net
|
372.4
|
|
383.1
|
|
|||
|
4.75% senior notes due 2017
|
350.0
|
|
—
|
|
|||
|
4.375% senior notes due 2022
|
350.0
|
|
—
|
|
|||
|
Other secured
|
4.1
|
|
5.7
|
|
|||
|
|
$
|
2,305.3
|
|
$
|
1,588.1
|
|
|
|
Financial Services:
|
|
|
|
|
|||
|
Mortgage repurchase facility, maturing 2013
|
$
|
187.8
|
|
$
|
116.5
|
|
|
As of
September 30, 2012
, maturities of consolidated notes payable, assuming the mortgage repurchase facility is not extended or renewed, are
$363.7 million
in fiscal
2013
,
$783.8 million
in fiscal
2014
,
$157.7 million
in fiscal
2015
,
$542.9 million
in fiscal
2016
,
$350.0 million
in fiscal
2017
and
$350.0 million
in maturities thereafter.
The Company has an automatically effective universal shelf registration statement filed with the Securities and Exchange Commission (SEC) in September 2012, registering debt and equity securities that the Company may issue from time to time in amounts to be determined.
70
D.R. HORTON, INC. AND SUBSIDIARIES
NOTES TO CONSOLIDATED FINANCIAL STATEMENTS – (Continued)
Homebuilding:
In
September 2012
, the Company entered into a
five
-year,
$125 million
senior unsecured revolving credit facility with a major bank. As of September 30, 2012, the facility had an uncommitted
$375 million
accordion feature which could increase the size of the facility, subject to certain conditions and availability of additional bank commitments. Borrowings bear interest at rates based upon the London Interbank Offered Rate (LIBOR) plus an applicable margin as determined by the Company's leverage ratio as defined in the credit agreement governing the facility. The facility also provided for the issuance of letters of credit equal to
50%
of the revolving credit commitment through a letter of credit sublimit. At
September 30, 2012
, the Company had
no
borrowings outstanding and
$0.4 million
in letters of credit outstanding under the revolving credit facility. On November 1, 2012, the Company increased the capacity of the credit facility to
$600 million
by obtaining additional lending commitments from banks, and increased the accordion feature available under the facility to allow us to increase the size of the facility to
$1.0 billion
, subject to certain conditions and availability of additional bank commitments. The amended sublimit for the issuance of letters of credit is now
$300 million
.
In
May 2012
, the Company issued
$350 million
principal amount of
4.75%
senior notes due
May 15, 2017
, and in
September 2012
, the Company issued
$350 million
principal amount of
4.375%
senior notes due
September 15, 2022
. The key terms of each of the Company’s senior notes outstanding as of
September 30, 2012
are summarized below.
|
Note Payable
|
Principal
Amount
|
Date Issued
|
Date Due
|
Redeemable
Prior to
Maturity
|
Effective
Interest Rate (1)
|
||||||
|
|
(In millions)
|
|
|
|
|
||||||
|
6.875% senior
|
$171.7
|
April 2003
|
May 1, 2013
|
No
|
7.0%
|
||||||
|
6.125% senior
|
$145.9
|
July 2004
|
January 15, 2014
|
No
|
6.3%
|
||||||
|
2% convertible senior (3)
|
$500.0
|
May 2009
|
May 15, 2014
|
No
|
9.7%
|
||||||
|
5.625% senior
|
$137.9
|
September 2004
|
September 15, 2014
|
No
|
5.8%
|
||||||
|
5.25% senior
|
$157.7
|
February 2005
|
February 15, 2015
|
Yes
|
(2)
|
5.4%
|
|||||
|
5.625% senior
|
$170.2
|
December 2004
|
January 15, 2016
|
Yes
|
(2)
|
5.8%
|
|||||
|
6.5% senior
|
$372.7
|
April 2006
|
April 15, 2016
|
Yes
|
(2)
|
6.6%
|
|||||
|
4.75% senior
|
$350.0
|
May 2012
|
May 15, 2017
|
Yes
|
(2)
|
5.0%
|
|||||
|
4.375% senior
|
$350.0
|
September 2012
|
September 15, 2022
|
Yes
|
(2)
|
4.5%
|
|||||
_____________________________________
|
(1)
|
Interest is payable semi-annually on each of the series of senior and convertible senior notes. The annual effective interest rate is calculated after giving effect to the amortization of the deferred financing costs and any discount associated with the note issuance.
|
|
(2)
|
The Company may redeem the notes in whole at any time or in part from time to time, at a redemption price equal to the greater of
100%
of their principal amount or the present value of the remaining scheduled payments on the redemption date, plus accrued interest.
|
|
(3)
|
Holders of the 2% convertible senior notes may convert all or any portion of their notes at their option at any time prior to maturity. The initial conversion rate for the notes is
76.5697
shares of the Company’s common stock per
$1,000
principal amount of senior notes, equivalent to an initial conversion price of approximately
$13.06
per share of common stock. The conversion rate is subject to adjustment in certain events but will not be adjusted for accrued interest, including any additional interest. Upon conversion of a 2% senior note, the Company will pay or deliver, as the case may be, cash, shares of its common stock or a combination thereof at its election. The Company may not redeem the notes prior to the maturity date.
|
All series of senior notes and borrowings under the revolving credit facility are senior obligations and rank
pari passu
in right of payment to all existing and future unsecured indebtedness, and senior to all existing and future indebtedness expressly subordinated to them. The senior notes and borrowings under the revolving credit facility are guaranteed by substantially all of the Company’s homebuilding subsidiaries. If a change of control of the Company occurs, as defined in the indentures governing
$455.5 million
principal amount of its senior notes as of
September 30, 2012
, the Company would be required to offer to purchase these notes at a price of
101% of their principal amount, along with accrued and unpaid interest
. In addition, upon the occurrence of both a change of control and a ratings downgrade event, as defined in the indentures governing
$700 million
71
D.R. HORTON, INC. AND SUBSIDIARIES
NOTES TO CONSOLIDATED FINANCIAL STATEMENTS – (Continued)
principal amount of its senior notes as of
September 30, 2012
, the Company would be required in certain circumstances to offer to repurchase these notes at
101%
of their principal amount, along with accrued and unpaid interest. If a fundamental change, including a change in control, occurs as defined in the indenture governing the convertible senior notes, which constituted
$500 million
principal amount as of
September 30, 2012
, the Company would be required to offer to purchase these notes at par, along with accrued and unpaid interest. Also, a change of control as defined in the revolving credit facility would constitute an event of default under the revolving credit facility, which could result in the acceleration of any borrowings outstanding under the facility and the termination of the commitments thereunder.
The revolving credit facility imposes restrictions on the Company's operations and activities, including requiring the maintenance of a minimum level of tangible net worth, a maximum allowable leverage ratio and a borrowing base restriction if the Company's leverage ratio exceeds a certain level. A failure to comply with these financial covenants could allow the lending banks to terminate the availability of funds under the revolving credit facility or cause any outstanding borrowings to become due and payable prior to maturity. In addition, the credit facility and the indentures governing the senior notes impose restrictions on the creation of secured debt and liens. At
September 30, 2012
, the Company was in compliance with all of the covenants, limitations and restrictions of its revolving credit facility and public debt obligations.
During fiscal
2012
, through unsolicited transactions, the Company repurchased
$10.8 million
principal amount of its 6.5% senior notes due 2016 for an aggregate purchase price of
$10.6 million
, plus accrued interest. During fiscal
2011
, in addition to repaying
$176.2 million
principal amount of maturing senior notes, the Company retired
$319.2 million
principal amount of senior notes prior to their maturity. As a result of the early retirement of these notes, the Company recognized a net gain of
$0.1 million
and a net loss of
$10.8 million
in fiscal
2012
and
2011
, respectively.
Effective
August 1, 2012
, the Board of Directors authorized the repurchase of up to
$500 million
of the Company’s debt securities effective through
July 31, 2013
. All of the
$500 million
authorization was remaining at
September 30, 2012
.
Financial Services:
The Company’s mortgage subsidiary, DHI Mortgage, has a mortgage repurchase facility that is accounted for as a secured financing. The mortgage repurchase facility provides financing and liquidity to DHI Mortgage by facilitating purchase transactions in which DHI Mortgage transfers eligible loans to the counterparties against the transfer of funds by the counterparties, thereby becoming purchased loans. DHI Mortgage then has the right and obligation to repurchase the purchased loans upon their sale to third-party purchasers in the secondary market or within specified time frames from
45
to
120 days
in accordance with the terms of the mortgage repurchase facility. The total capacity of the facility is
$180 million
; however, the capacity can be increased up to
$225 million
as needed. Increases in borrowing capacity in excess of
$180 million
are provided on an uncommitted basis and at a higher borrowing cost than committed borrowings. The maturity date of the facility is
March 3, 2013
.
As of
September 30, 2012
,
$278.6 million
of mortgage loans held for sale with a collateral value of
$263.9 million
were pledged under the mortgage repurchase facility. As a result of advance paydowns totaling
$76.1 million
, DHI Mortgage had an obligation of
$187.8 million
outstanding under the mortgage repurchase facility at
September 30, 2012
at a
2.8%
annual interest rate.
The mortgage repurchase facility is not guaranteed by either D.R. Horton, Inc. or any of the subsidiaries that guarantee the Company’s homebuilding debt. The facility contains financial covenants as to the mortgage subsidiary’s minimum required tangible net worth, its maximum allowable ratio of debt to tangible net worth and its minimum required liquidity. At
September 30, 2012
, DHI Mortgage was in compliance with all of the conditions and covenants of the mortgage repurchase facility.
72
D.R. HORTON, INC. AND SUBSIDIARIES
NOTES TO CONSOLIDATED FINANCIAL STATEMENTS – (Continued)
NOTE E – MORTGAGE LOANS
To manage the interest rate risk inherent in its mortgage operations, the Company hedges its risk using various derivative instruments, which include forward sales of mortgage-backed securities (MBS), Eurodollar Futures Contracts (EDFC) and put options on both MBS and EDFC. Use of the term “hedging instruments” in the following discussion refers to these securities collectively, or in any combination. The Company does not enter into or hold derivatives for trading or speculative purposes.
Mortgage Loans Held for Sale
Mortgage loans held for sale consist primarily of single-family residential loans collateralized by the underlying property. At
September 30, 2012
, mortgage loans held for sale had an aggregate fair value of
$345.3 million
and an aggregate outstanding principal balance of
$332.9 million
. At
September 30, 2011
, mortgage loans held for sale had an aggregate fair value of
$294.1 million
and an aggregate outstanding principal balance of
$284.6 million
. During the years ended
September 30, 2012
,
2011
and
2010
, the Company had net gains on sales of loans of
$69.2 million
,
$41.6 million
and
$45.9 million
, respectively, which includes the effect of recording recourse expense of
$4.7 million
,
$11.6 million
and
$13.7 million
, respectively, as discussed below in “Other Mortgage Loans and Loss Reserves.” Net gains on sales of loans are included in financial services revenues on the consolidated statements of operations. Approximately
73%
of the mortgage loans sold by DHI Mortgage during fiscal
2012
were sold to one major financial institution.
Newly originated loans that have been closed but not committed to third-party purchasers are hedged to mitigate the risk of changes in their fair value. Hedged loans are committed to third-party purchasers typically within
three days
after origination. The notional amounts of the hedging instruments used to hedge mortgage loans held for sale vary in relationship to the underlying loan amounts, depending on the movements in the value of each hedging instrument relative to the value of the underlying mortgage loans. The fair value change related to the hedging instruments generally offsets the fair value change in the mortgage loans held for sale, which for the years ended
September 30, 2012
,
2011
and
2010
was not significant, and is recognized in current earnings. As of
September 30, 2012
, the Company had a notional amount of
$109.1 million
in mortgage loans held for sale not committed to third-party purchasers and the notional amounts of the hedging instruments related to those loans totaled
$108.5 million
.
Other Mortgage Loans and Loss Reserves
Mortgage loans are sold with limited recourse provisions which include industry-standard representations and warranties, primarily involving the absence of misrepresentations by the borrower or other parties, insurability if applicable and, depending on the agreement, may include requiring a minimum number of payments to be made by the borrower. The Company generally does not retain any other continuing interest related to mortgage loans sold in the secondary market. Other mortgage loans generally consist of loans repurchased due to these limited recourse obligations. Typically, these loans are impaired and often become real estate owned through the foreclosure process. At
September 30, 2012
and
2011
, the Company’s total other mortgage loans and real estate owned, before loss reserves were as follows:
|
|
September 30,
|
||||||
|
|
2012
|
2011
|
|||||
|
|
(In millions)
|
||||||
|
Other mortgage loans
|
$
|
38.1
|
|
$
|
42.8
|
|
|
|
Real estate owned
|
1.3
|
|
0.9
|
|
|||
|
|
$
|
39.4
|
|
$
|
43.7
|
|
|
73
D.R. HORTON, INC. AND SUBSIDIARIES
NOTES TO CONSOLIDATED FINANCIAL STATEMENTS – (Continued)
Based on historical performance and current housing and credit market conditions, the Company has recorded reserves for estimated losses on other mortgage loans, real estate owned and future loan repurchase obligations due to the limited recourse provisions, all of which are recorded as reductions of financial services revenue. The reserve balances at
September 30, 2012
and
2011
were as follows:
|
|
September 30,
|
||||||
|
|
2012
|
2011
|
|||||
|
|
(In millions)
|
||||||
|
Loss reserves related to:
|
|
|
|
|
|||
|
Other mortgage loans
|
$
|
5.0
|
|
$
|
6.2
|
|
|
|
Real estate owned
|
0.4
|
|
0.4
|
|
|||
|
Loan repurchase and settlement obligations — known and expected
|
25.5
|
|
26.4
|
|
|||
|
|
$
|
30.9
|
|
$
|
33.0
|
|
|
Other mortgage loans and real estate owned and the related loss reserves are included in financial services other assets, while loan repurchase obligations are included in financial services accounts payable and other liabilities in the accompanying consolidated balance sheets.
A subsidiary of the Company reinsured a portion of the private mortgage insurance written on loans originated by DHI Mortgage in prior years. At
September 30, 2012
and
2011
, reserves for expected future losses under the reinsurance program totaled
$2.0 million
and
$0.9 million
, respectively, and are included in financial services accounts payable and other liabilities in the accompanying consolidated balance sheets.
Loan Commitments and Related Derivatives
The Company is party to interest rate lock commitments (IRLCs) which are extended to borrowers who have applied for loan funding and meet defined credit and underwriting criteria. At
September 30, 2012
, the notional amount of IRLCs, which are accounted for as derivative instruments recorded at fair value, totaled
$303.1 million
.
The Company manages interest rate risk related to its IRLCs through the use of best-efforts whole loan delivery commitments and hedging instruments. These instruments are considered derivatives in an economic hedge and are accounted for at fair value with gains and losses recognized in current earnings. As of
September 30, 2012
, the Company had a notional amount of approximately
$16.0 million
of best-efforts whole loan delivery commitments and a notional amount of
$258.0 million
of hedging instruments related to IRLCs not yet committed to purchasers.
74
D.R. HORTON, INC. AND SUBSIDIARIES
NOTES TO CONSOLIDATED FINANCIAL STATEMENTS – (Continued)
NOTE F – FAIR VALUE MEASUREMENTS
The Company’s marketable securities consist of U.S. Treasury securities, government agency securities, corporate debt securities and certificates of deposit. The fair value of U.S. Treasury securities is based on quoted prices for identical assets and therefore, they have been classified as a Level 1 valuation. Obligations of government agencies, corporate debt securities and certificates of deposit are valued using quoted market prices of recent transactions or quoted market prices of transactions in very similar securities and therefore, are classified as Level 2 valuations.
The fair value of mortgage loans held for sale is generally calculated by reference to quoted prices in secondary markets for commitments to sell mortgage loans with similar characteristics; therefore, they have been classified as a Level 2 valuation. After consideration of nonperformance risk, no additional adjustments have been made to the fair value measurement of mortgage loans held for sale. Closed mortgage loans are typically sold within
30 days
of origination, which limits exposure to nonperformance by loan buyer counterparties to a short time period. In addition, the Company actively monitors the financial strength of its counterparties.
The hedging instruments utilized to manage interest rate risk and hedge the changes in the fair value of mortgage loans held for sale are publicly traded derivatives with fair value measurements based on quoted market prices. Exchange-traded derivatives are considered Level 1 valuations because quoted prices for identical assets are used for fair value measurements. Over-the-counter derivatives, such as forward sales of MBS, are classified as Level 2 valuations because quoted prices for similar assets are used for fair value measurements. The Company mitigates exposure to nonperformance risk associated with over-the-counter derivatives by limiting the number of counterparties and actively monitoring their financial strength and creditworthiness while requiring them to be well-known institutions with credit ratings equal to or better than AA- or equivalent. Further, the Company’s derivative contracts typically have short-term durations with maturities from one to four months. Accordingly, the Company’s risk of nonperformance relative to its derivative positions is not significant. Nonperformance risk associated with exchange-traded derivatives is considered minimal as these items are traded on the Chicago Mercantile Exchange. After consideration of nonperformance risk, no additional adjustments have been made to the fair value measurement of hedging instruments.
The fair values of IRLCs are also calculated by reference to quoted prices in secondary markets for commitments to sell mortgage loans with similar characteristics; therefore, they have been classified as Level 2 valuations. These valuations do not contain adjustments for expirations as any expired commitments are excluded from the fair value measurement. After consideration of nonperformance risk, no additional adjustments have been made to the fair value measurements of IRLCs. The Company generally only issues IRLCs for products that meet specific purchaser guidelines. Should any purchaser become insolvent, the Company would not be required to close the transaction based on the terms of the commitment. Since not all IRLCs will become closed loans, the Company adjusts its fair value measurements for the estimated amount of IRLCs that will not close.
Homebuilding inventory held and used is reported at the lower of carrying value or fair value on a nonrecurring basis. The factors considered in determining fair values of the Company’s communities are described in the discussion of the Company’s inventory impairment analysis (see Note C), and are classified as Level 3 valuations. Inventory held and used measured at fair value represents those communities for which the Company has recorded impairments during the current period.
Real estate owned and the majority of other mortgage loans are measured at the lower of carrying value or fair value on a nonrecurring basis. Other mortgage loans include performing and nonperforming mortgage loans. The fair values of other mortgage loans and real estate owned are determined based on the Company’s assessment of the value of the underlying collateral and are classified as Level 3 valuations.
75
D.R. HORTON, INC. AND SUBSIDIARIES
NOTES TO CONSOLIDATED FINANCIAL STATEMENTS – (Continued)
The following tables summarize the Company’s assets and liabilities at
September 30, 2012
and
2011
measured at fair value on a recurring basis. There were no transfers of assets or liabilities between any levels of the fair value hierarchy during fiscal 2012 or 2011.
|
|
|
Fair Value at September 30, 2012
|
|||||||||||
|
|
Balance Sheet Location
|
Level 1
|
Level 2
|
Total
|
|||||||||
|
|
|
(In millions)
|
|||||||||||
|
Homebuilding:
|
|
|
|
|
|
|
|
||||||
|
Marketable securities, available-for-sale
|
|
|
|||||||||||
|
U.S. Treasury securities
|
Marketable securities
|
$
|
75.7
|
|
$
|
—
|
|
$
|
75.7
|
|
|||
|
Government agency and corporate debt securities
|
Marketable securities
|
—
|
|
212.3
|
|
212.3
|
|
||||||
|
Certificates of deposit
|
Marketable securities
|
—
|
|
10.0
|
|
10.0
|
|
||||||
|
Financial Services:
|
|
|
|
|
|
|
|
||||||
|
Mortgage loans held for sale (a)
|
Mortgage loans held for sale
|
—
|
|
345.3
|
|
345.3
|
|
||||||
|
Derivatives not designated as
hedging instruments (b):
|
|
|
|
|
|
|
|
||||||
|
Interest rate lock commitments
|
Other assets
|
—
|
|
6.1
|
|
6.1
|
|
||||||
|
Forward sales of MBS
|
Other liabilities
|
—
|
|
(6.9
|
)
|
(6.9
|
)
|
||||||
|
Best-efforts and mandatory commitments
|
Other liabilities
|
—
|
|
(0.8
|
)
|
(0.8
|
)
|
||||||
|
|
|
Fair Value at September 30, 2011
|
|||||||||||
|
|
Balance Sheet Location
|
Level 1
|
Level 2
|
Total
|
|||||||||
|
|
|
(In millions)
|
|||||||||||
|
Homebuilding:
|
|
|
|
|
|
|
|
||||||
|
Marketable securities, available-for-sale
|
|
|
|||||||||||
|
U.S. Treasury securities
|
Marketable securities
|
$
|
16.3
|
|
$
|
—
|
|
$
|
16.3
|
|
|||
|
Government agency and corporate debt securities
|
Marketable securities
|
—
|
|
276.3
|
|
276.3
|
|
||||||
|
Certificates of deposit
|
Marketable securities
|
—
|
|
5.0
|
|
5.0
|
|
||||||
|
Financial Services:
|
|
|
|
|
|
|
|
||||||
|
Mortgage loans held for sale (a)
|
Mortgage loans held for sale
|
—
|
|
294.1
|
|
294.1
|
|
||||||
|
Derivatives not designated as
hedging instruments (b):
|
|
|
|
|
|
|
|
||||||
|
Interest rate lock commitments
|
Other assets
|
—
|
|
3.9
|
|
3.9
|
|
||||||
|
Forward sales of MBS
|
Other liabilities
|
—
|
|
(4.0
|
)
|
(4.0
|
)
|
||||||
|
Best-efforts and mandatory commitments
|
Other liabilities
|
—
|
|
(0.9
|
)
|
(0.9
|
)
|
||||||
_______________________________________
|
(a)
|
Mortgage loans held for sale are reflected at fair value. Interest income earned on mortgage loans held for sale is based on contractual interest rates and included in financial services interest and other income.
|
|
(b)
|
Fair value measurements of these derivatives represent changes in fair value since inception. These changes are reflected in the balance sheet and included in financial services revenues on the consolidated statement of operations.
|
76
D.R. HORTON, INC. AND SUBSIDIARIES
NOTES TO CONSOLIDATED FINANCIAL STATEMENTS – (Continued)
The following table summarizes the Company’s assets at
September 30, 2012
and
2011
measured at fair value on a nonrecurring basis:
|
Fair Value at September 30, 2012
|
Fair Value at September 30, 2011
|
||||||||
|
|
Balance Sheet Location
|
Level 3
|
Level 3
|
||||||
|
|
|
(In millions)
|
|||||||
|
Homebuilding:
|
|
|
|
||||||
|
Inventory held and used (a) (b)
|
Inventories
|
$
|
1.2
|
|
$
|
26.9
|
|
||
|
Financial Services:
|
|
|
|
|
|
||||
|
Other mortgage loans (a)
|
Other assets
|
25.8
|
|
28.9
|
|
||||
|
Real estate owned (a)
|
Other assets
|
0.9
|
|
0.5
|
|
||||
_______________________________________
|
(a)
|
The fair values included in the table above represent only those assets whose carrying values were adjusted to fair value in the current quarter.
|
|
(b)
|
In performing its impairment analysis, the Company used discount rates ranging from
12%
to
20%
during fiscal
2012
and
2011
.
|
The following tables present the Company's financial assets and liabilities at both their respective carrying value and fair value:
|
Carrying Value
|
Fair Value at September 30, 2012
|
||||||||||||||||||
|
Level 1
|
Level 2
|
Level 3
|
Total
|
||||||||||||||||
|
(In millions)
|
|||||||||||||||||||
|
Homebuilding:
|
|||||||||||||||||||
|
Cash and cash equivalents (a)
|
$
|
1,030.4
|
|
$
|
1,030.4
|
|
$
|
—
|
|
$
|
—
|
|
$
|
1,030.4
|
|
||||
|
Restricted cash (a)
|
49.3
|
|
49.3
|
|
—
|
|
—
|
|
49.3
|
|
|||||||||
|
Senior notes (b)
|
1,854.2
|
|
—
|
|
1,973.9
|
|
—
|
|
1,973.9
|
|
|||||||||
|
Convertible senior notes (b)
|
447.0
|
|
—
|
|
821.2
|
|
—
|
|
821.2
|
|
|||||||||
|
Financial Services:
|
|
||||||||||||||||||
|
Cash and cash equivalents (a)
|
17.3
|
|
17.3
|
|
—
|
|
—
|
|
17.3
|
|
|||||||||
|
Mortgage repurchase facility (a)
|
187.8
|
|
—
|
|
—
|
|
187.8
|
|
187.8
|
|
|||||||||
|
Carrying Value
|
Fair Value at September 30, 2011
|
||||||||||||||||||
|
Level 1
|
Level 2
|
Level 3
|
Total
|
||||||||||||||||
|
(In millions)
|
|||||||||||||||||||
|
Homebuilding:
|
|||||||||||||||||||
|
Cash and cash equivalents (a)
|
$
|
715.5
|
|
$
|
715.5
|
|
$
|
—
|
|
$
|
—
|
|
$
|
715.5
|
|
||||
|
Restricted cash (a)
|
49.1
|
|
49.1
|
|
—
|
|
—
|
|
49.1
|
|
|||||||||
|
Senior notes (b)
|
1,164.3
|
|
—
|
|
1,156.2
|
|
—
|
|
1,156.2
|
|
|||||||||
|
Convertible senior notes (b)
|
418.1
|
|
—
|
|
511.9
|
|
—
|
|
511.9
|
|
|||||||||
|
Financial Services:
|
|||||||||||||||||||
|
Cash and cash equivalents (a)
|
17.1
|
|
17.1
|
|
—
|
|
—
|
|
17.1
|
|
|||||||||
|
Mortgage repurchase facility (a)
|
116.5
|
|
—
|
|
—
|
|
116.5
|
|
116.5
|
|
|||||||||
_______________________________________
|
(a)
|
The fair value approximates carrying value due to its short-term nature, short maturity or floating interest rate terms, as applicable.
|
|
(b)
|
The fair value is determined based on quoted market prices of recent transactions, which is classified as Level 2 within the fair value hierarchy.
|
77
D.R. HORTON, INC. AND SUBSIDIARIES
NOTES TO CONSOLIDATED FINANCIAL STATEMENTS – (Continued)
NOTE G – INCOME TAXES
The components of the Company’s income tax expense (benefit) attributable to continuing operations are as follows:
|
|
Year Ended September 30,
|
||||||||||
|
|
2012
|
2011
|
2010
|
||||||||
|
|
(In millions)
|
||||||||||
|
Current tax expense (benefit):
|
|
|
|
|
|
|
|||||
|
Federal
|
$
|
(7.0
|
)
|
$
|
(53.6
|
)
|
$
|
(153.1
|
)
|
||
|
State
|
3.1
|
|
(6.1
|
)
|
7.5
|
|
|||||
|
|
(3.9
|
)
|
(59.7
|
)
|
(145.6
|
)
|
|||||
|
Deferred tax expense (benefit):
|
|
|
|
|
|
|
|||||
|
Federal
|
(616.1
|
)
|
—
|
|
—
|
|
|||||
|
State
|
(93.4
|
)
|
—
|
|
—
|
|
|||||
|
|
(709.5
|
)
|
—
|
|
—
|
|
|||||
|
Total income tax benefit
|
$
|
(713.4
|
)
|
$
|
(59.7
|
)
|
$
|
(145.6
|
)
|
||
The income tax benefit of
$713.4 million
in fiscal
2012
was due primarily to a significant reduction of the Company's deferred tax asset valuation allowance during the three months ended June 30, 2012. The income tax benefit in fiscal
2011
was due to the Company receiving a favorable result from the Internal Revenue Service (IRS) on a ruling request concerning capitalization of inventory costs. In fiscal
2010
, a tax law change regarding net operating loss (NOL) carrybacks resulted in an income tax benefit of
$208.3 million
, which was partially offset by an increase in unrecognized tax benefits and state income tax expense.
The Company does not have meaningful effective tax rates in fiscal years
2012
,
2011
and
2010
because its net deferred tax assets were fully offset by a valuation allowance until the third quarter of fiscal 2012 when the Company significantly reduced the valuation allowance on its deferred tax asset. The difference between income tax benefit and tax computed by applying the federal statutory rate of
35%
to income before income taxes during each year is due to the following:
|
|
Year Ended September 30,
|
||||||||||
|
|
2012
|
2011
|
2010
|
||||||||
|
|
(In millions)
|
||||||||||
|
Income taxes at federal statutory rate
|
$
|
85.0
|
|
$
|
4.2
|
|
$
|
34.8
|
|
||
|
Increase (decrease) in tax resulting from:
|
|||||||||||
|
State income taxes, net of federal benefit
|
12.1
|
|
2.4
|
|
9.8
|
|
|||||
|
Domestic production activities deduction
|
—
|
|
—
|
|
(6.2
|
)
|
|||||
|
Uncertain tax positions, net of deferred tax
|
(2.3
|
)
|
(11.2
|
)
|
13.5
|
|
|||||
|
Valuation allowance
|
(806.6
|
)
|
(54.1
|
)
|
(170.6
|
)
|
|||||
|
Tax credits
|
(1.3
|
)
|
(2.2
|
)
|
(30.0
|
)
|
|||||
|
Other
|
(0.3
|
)
|
1.2
|
|
3.1
|
|
|||||
|
Total income tax benefit
|
$
|
(713.4
|
)
|
$
|
(59.7
|
)
|
$
|
(145.6
|
)
|
||
78
D.R. HORTON, INC. AND SUBSIDIARIES
NOTES TO CONSOLIDATED FINANCIAL STATEMENTS – (Continued)
Deferred tax assets and liabilities reflect the tax consequences of temporary differences between the financial statement amounts of assets and liabilities and their tax bases, and of tax loss and credit carryforwards. Components of deferred income taxes are summarized as follows:
|
|
September 30,
|
||||||
|
|
2012
|
2011
|
|||||
|
|
(In millions)
|
||||||
|
Deferred tax assets:
|
|
|
|
|
|||
|
Inventory costs
|
$
|
68.4
|
|
$
|
66.3
|
|
|
|
Inventory impairments
|
323.4
|
|
387.3
|
|
|||
|
Warranty and construction defect costs
|
116.7
|
|
111.4
|
|
|||
|
Net operating loss carryforwards
|
188.9
|
|
238.2
|
|
|||
|
Tax credit carryforwards
|
7.0
|
|
3.2
|
|
|||
|
Incentive compensation plans
|
53.1
|
|
51.4
|
|
|||
|
Deferral of profit on home sales
|
1.7
|
|
0.6
|
|
|||
|
Goodwill impairment
|
—
|
|
3.4
|
|
|||
|
Other
|
31.8
|
|
34.3
|
|
|||
|
Total deferred tax assets
|
791.0
|
|
896.1
|
|
|||
|
Valuation allowance
|
(41.9
|
)
|
(848.5
|
)
|
|||
|
Total deferred tax assets, net of valuation allowance
|
749.1
|
|
47.6
|
|
|||
|
Deferred tax liabilities
|
39.6
|
|
47.6
|
|
|||
|
Deferred income taxes, net
|
$
|
709.5
|
|
$
|
—
|
|
|
Deferred tax assets of
$193.9 million
for NOL carryforwards as of
September 30, 2012
were reduced by
$5.0 million
for excess tax benefits related to the exercise of stock options. The excess tax benefits from the exercise of stock options will result in an increase to additional paid-in capital when the excess tax benefits reduce current income taxes payable.
At
September 30, 2012
, the Company had federal NOL carryforwards of
$310.5 million
that expire in fiscal 2030 and 2031. Also at
September 30, 2012
, the Company had tax benefits for state NOL carryforwards of
$85.2 million
that expire (beginning at various times depending on the tax jurisdiction) from fiscal 2013 to fiscal 2031. At
September 30, 2012
, the Company had federal tax credit carryforwards of
$4.4 million
that expire in fiscal years 2029 through 2032 and a minimum tax credit carryforward of
$2.6 million
.
At
September 30, 2012
and
2011
, the Company had deferred tax assets, net of deferred tax liabilities, of
$751.4 million
and
$848.5 million
, respectively, offset by valuation allowances of
$41.9 million
and
$848.5 million
, respectively. The realization of the Company's deferred tax assets depends upon the existence of sufficient taxable income in future periods. The Company has a valuation allowance of
$41.9 million
at
September 30, 2012
because it is more likely than not that a portion of its state NOL carryforwards will not be realized due to the more limited carryforward periods that exist in certain states.
At June 30, 2012, the Company evaluated both positive and negative evidence and determined it was more likely than not that the substantial majority of the Company's deferred tax assets would be realized, which resulted in a significant reduction of the valuation allowance on its deferred tax assets.
In the Company's evaluation of the need for and level of a valuation allowance on its deferred tax assets at June 30, 2012, the most significant piece of evidence considered was the objective, direct positive evidence related to its recent financial results, including its positive and growing levels of pre-tax income and its strong growth in net sales orders and sales order backlog. These positive pre-tax income, sales and backlog levels and trends continued through September 30, 2012. The Company believes it will continue to increase its pre-tax income in future years, as the Company is utilizing its balance sheet and liquidity position to invest in opportunities to sustain and grow its operations. If industry conditions weaken from current levels, the Company expects to be able to adjust its operations to maintain long-term profitability. While the Company's expectations are that annual pre-tax income will grow from the fiscal
2012
level, if annual pre-tax income in future years remains flat with the current level, the Company estimates that it will realize all of its current federal net operating losses in less than
five years
and will be able to absorb all federal deductible temporary differences as they reverse in future years.
79
D.R. HORTON, INC. AND SUBSIDIARIES
NOTES TO CONSOLIDATED FINANCIAL STATEMENTS – (Continued)
Prior to the quarter ended June 30, 2012, a significant part of the negative evidence the Company considered was its three-year cumulative pre-tax loss position, which had become a cumulative pre-tax income position at June 30, 2012, and was no longer considered to be as significant. Other negative evidence the Company considered was its previous losses incurred during the housing market decline, the current overall weakness in the economy and the housing market, the restrictive mortgage lending environment and the Company's gross margins, which are currently lower than historical levels before the housing downturn. Based on its evaluation of both positive and negative evidence at June 30, 2012, the Company concluded that the objective, direct positive evidence related to its operating results achieved during the recent challenging economic and housing market conditions and the sustainability of current pre-tax income levels outweighed the negative evidence and that it was more likely than not that the substantial majority of the Company's deferred tax assets will be realized.
The accounting for deferred taxes is based upon estimates of future results. Differences between the anticipated and actual outcomes of these future results could have a material impact on the Company’s consolidated results of operations or financial position.
Unrecognized tax benefits are the differences between tax positions taken or expected to be taken in a tax return and the benefits recognized for accounting purposes. A reconciliation of the beginning and ending amounts of unrecognized tax benefits is as follows:
|
|
Year Ended September 30,
|
||||||||||
|
|
2012
|
2011
|
2010
|
||||||||
|
|
(In millions)
|
||||||||||
|
Unrecognized tax benefits, beginning of year
|
$
|
16.3
|
|
$
|
65.0
|
|
$
|
17.8
|
|
||
|
Additions attributable to tax positions taken in the current year
|
—
|
|
—
|
|
—
|
|
|||||
|
Additions attributable to tax positions taken in prior years
|
—
|
|
—
|
|
49.8
|
|
|||||
|
Reductions attributable to tax positions taken in prior years
|
(1.6
|
)
|
(48.7
|
)
|
(2.6
|
)
|
|||||
|
Reductions attributable to lapse of statute of limitations
|
(0.6
|
)
|
—
|
|
—
|
|
|||||
|
Settlements
|
—
|
|
—
|
|
—
|
|
|||||
|
Unrecognized tax benefits, end of year
|
$
|
14.1
|
|
$
|
16.3
|
|
$
|
65.0
|
|
||
Included in the balance of unrecognized tax benefits as of
September 30, 2012
are
$11.8 million
of tax benefits that, if recognized, would reduce the Company’s income tax expense. Also included in the balance of unrecognized tax benefits as of
September 30, 2012
are
$2.3 million
of tax benefits that, if recognized, would result in an adjustment to deferred income taxes. At
September 30, 2011
and
2010
all tax positions, if recognized, would have reduced the Company's income tax expense because of the full valuation allowance that existed on its deferred tax assets.
The Company classifies interest expense and penalties on income taxes as income tax expense. During fiscal
2012
,
2011
and
2010
, the Company recognized interest benefits of
$0.1 million
and
$12.7 million
and interest expense of
$11.6 million
, respectively, related to unrecognized tax benefits in its consolidated statements of operations. At both
September 30, 2012
and
2011
, the Company’s total accrued interest expense relating to unrecognized tax benefits was
$5.1 million
and there were
no
accrued penalties.
A reduction of
$9.9 million
in the amount of unrecognized tax benefits and
$3.1 million
of accrued interest is reasonably possible within the next 12 months, of which
$11.0 million
would be reflected as an income tax benefit in the consolidated statement of operations and
$2.0 million
would result in an adjustment to deferred income taxes.
The Company is subject to federal income tax and to income tax in multiple states. The statute of limitations for the Company's major tax jurisdictions remains open for examination for fiscal years 2004 to 2006 and from 2008 through 2012. The Company is currently being audited by various states.
At September 30, 2012 and 2011, the Company had income taxes receivable of
$14.4 million
and
$12.4 million
, respectively, for expected federal tax refunds related to its 2006 and 2007 tax returns. During fiscal 2012, the IRS concluded its audit of the Company's 2006 and 2007 tax returns, and the U.S. Congressional Joint Committee on Taxation concluded its review of the tax refunds requested by the Company. In October 2012, the Company received the
$14.4 million
tax refund.
80
D.R. HORTON, INC. AND SUBSIDIARIES
NOTES TO CONSOLIDATED FINANCIAL STATEMENTS – (Continued)
NOTE H – EARNINGS PER SHARE
The following table sets forth the numerators and denominators used in the computation of basic and diluted earnings per share. Options to purchase
6.4 million
,
9.9 million
and
10.2 million
shares of common stock were excluded from the computation of diluted earnings per share for fiscal
2012
,
2011
and
2010
, respectively, because the exercise price of the options was greater than the average market price of the common shares and, therefore, their effect would have been antidilutive. Additionally, the convertible senior notes were excluded from the computation of diluted earnings per share for fiscal
2011
and
2010
because their effect would have been antidilutive.
|
Year Ended September 30,
|
||||||||||||
|
|
2012
|
2011
|
2010
|
|||||||||
|
|
(In millions)
|
|||||||||||
|
Numerator:
|
||||||||||||
|
Net income
|
$
|
956.3
|
|
$
|
71.8
|
|
$
|
245.1
|
|
|||
|
Effect of dilutive securities:
|
||||||||||||
|
Interest expense and amortization of issuance costs
associated with convertible senior notes
|
36.8
|
|
—
|
|
—
|
|
||||||
|
Numerator for diluted earnings per share after assumed conversions
|
$
|
993.1
|
|
$
|
71.8
|
|
$
|
245.1
|
|
|||
|
Denominator:
|
||||||||||||
|
Denominator for basic earnings per share—
weighted average common shares
|
318.1
|
|
318.3
|
|
318.1
|
|
||||||
|
Effect of dilutive securities:
|
||||||||||||
|
Employee stock awards
|
2.6
|
|
0.2
|
|
0.5
|
|
||||||
|
Convertible senior notes
|
38.3
|
|
—
|
|
—
|
|
||||||
|
Denominator for diluted earnings per share—
adjusted weighted average common shares
|
359.0
|
|
318.5
|
|
318.6
|
|
||||||
NOTE I – STOCKHOLDERS’ EQUITY
The Company has an automatically effective universal shelf registration statement filed with the SEC in September 2012, registering debt and equity securities that it may issue from time to time in amounts to be determined. At
September 30, 2012
, the Company had
328,092,047
shares of Common Stock issued and
320,891,976
shares outstanding. No shares of Preferred Stock were issued or outstanding. At
September 30, 2012
, the Company had
29.0 million
and
3.6 million
shares of Common Stock reserved for issuance pursuant to the D.R. Horton, Inc. Stock Incentive Plans and Employee Stock Purchase Plan, respectively.
Effective
August 1, 2012
, the Board of Directors authorized the repurchase of up to
$100 million
of the Company’s common stock effective through
July 31, 2013
. All of the
$100 million
authorization was remaining at
September 30, 2012
.
During each of fiscal
2012
and
2011
, the Board of Directors approved and paid four quarterly cash dividends of
$0.0375
per common share
. On
November 8, 2012
, the Board of Directors approved a cash dividend of
$0.0375
per common share, payable on
December 17, 2012
, to stockholders of record on
December 3, 2012
.
81
D.R. HORTON, INC. AND SUBSIDIARIES
NOTES TO CONSOLIDATED FINANCIAL STATEMENTS – (Continued)
NOTE J – EMPLOYEE BENEFIT PLANS
Deferred Compensation
The Company has a 401(k) plan for all employees who have been with the Company for a period of six months or more. The Company matches portions of employees’ voluntary contributions. Additional employer contributions in the form of profit sharing may also be made at the Company’s discretion. Expenses for the plan were
$5.6 million
,
$3.9 million
and
$4.8 million
in fiscal
2012
,
2011
and
2010
respectively.
The Company’s Supplemental Executive Retirement Plan (SERP) is a non-qualified deferred compensation program that provides benefits payable to certain management employees upon retirement, death, or termination of employment. Under the SERP, the Company accrues an unfunded benefit based on a percentage of the eligible employees’ salaries, as well as an interest factor based upon a predetermined formula. The Company’s liabilities related to the SERP were
$19.4 million
and
$17.3 million
at
September 30, 2012
and
2011
, respectively. The Company recorded
$3.1 million
,
$2.9 million
and
$2.7 million
of expense for this plan in fiscal
2012
,
2011
and
2010
, respectively.
The Company has a deferred compensation plan available to a select group of employees. The participating employees designate investments for their contributions; however, the Company is not required to invest the contributions in the designated investments. The Company’s net liabilities related to the deferred compensation plan were
$23.4 million
and
$23.3 million
at
September 30, 2012
and
2011
, respectively. The Company records as expense the amount that the employee contributions would have earned had the funds been invested in the designated investments. In fiscal
2012
and
2010
, the Company recorded an expense of
$1.6 million
and
$2.1 million
, respectively, for this plan, and in fiscal
2011
, it recorded a reduction in expense of
$0.7 million
.
Employee Stock Purchase Plan
The Company’s Employee Stock Purchase Plan provides eligible employees the opportunity to purchase common stock of the Company at a discounted price of
85%
of the fair market value of the stock on the designated dates of purchase. The price to eligible employees may be further discounted depending on the average fair market value of the stock during the period and certain other criteria. Under the terms of the plan, the total fair market value of the common stock that an eligible employee may purchase each year is limited to the lesser of
15%
of the employee’s annual compensation or
$25,000
. Under the plan, employees purchased
79,455
shares for
$0.9 million
in fiscal
2012
,
91,350
shares for
$0.9 million
in fiscal
2011
and
107,952
shares for
$1.1 million
in fiscal
2010
.
Stock Options
The Company’s 2006 Stock Incentive Plan provides for the granting of stock options to certain key employees to purchase shares of common stock. Options are granted at exercise prices which equal the market value of the Company’s common stock at the date of the grant. The options vest over periods of
2
to
9.75 years
and expire
10 years
after the dates on which they were granted.
No stock options were granted by the Company during fiscal
2012
or
2010
. During fiscal
2011
, stock options were granted to purchase a total of
6.2 million
shares of common stock at the closing market price on the date of the grant. The Compensation Committee of the Company’s Board of Directors granted stock options to executive officers, other officers and certain employees, and the Company’s Board of Directors granted stock options to its outside directors. At
September 30, 2012
, there were
11.5 million
shares available for future grants under the Plan.
82
D.R. HORTON, INC. AND SUBSIDIARIES
NOTES TO CONSOLIDATED FINANCIAL STATEMENTS – (Continued)
The Company measures and recognizes compensation expense at an amount equal to the fair value of share-based payments granted under compensation arrangements. The following table provides additional information related to activity under the Company’s Stock Incentive Plan.
|
|
Year Ended September 30,
|
|||||||||||||||||||
|
|
2012
|
2011
|
2010
|
|||||||||||||||||
|
Options
|
Weighted
Average
Exercise
Price
|
Options
|
Weighted
Average
Exercise
Price
|
Options
|
Weighted
Average
Exercise
Price
|
|||||||||||||||
|
Stock Options
|
|
|
|
|
|
|
|
|
|
|
|
|
||||||||
|
Outstanding at beginning of year
|
22,705,963
|
|
$
|
13.63
|
|
17,658,872
|
|
$
|
14.87
|
|
19,479,417
|
|
$
|
14.31
|
|
|||||
|
Granted
|
—
|
|
—
|
|
6,172,500
|
|
9.97
|
|
—
|
|
—
|
|
||||||||
|
Exercised
|
(4,493,797
|
)
|
11.13
|
|
(303,535
|
)
|
8.36
|
|
(1,234,396
|
)
|
5.36
|
|
||||||||
|
Canceled or expired
|
(632,135
|
)
|
14.46
|
|
(821,874
|
)
|
14.92
|
|
(586,149
|
)
|
16.27
|
|
||||||||
|
Outstanding at end of year
|
17,580,031
|
|
$
|
14.24
|
|
22,705,963
|
|
$
|
13.63
|
|
17,658,872
|
|
$
|
14.87
|
|
|||||
|
Exercisable at end of year
|
5,815,913
|
|
$
|
18.55
|
|
7,540,704
|
|
$
|
16.53
|
|
6,143,532
|
|
$
|
16.76
|
|
|||||
The total intrinsic value of options exercised during fiscal
2012
,
2011
and
2010
was
$26.4 million
,
$0.9 million
and
$7.6 million
, respectively. The intrinsic value of a stock option is the amount by which the market value of the underlying stock exceeds the option exercise price.
The aggregate intrinsic value of options outstanding and exercisable at
September 30, 2012
was
$131.4 million
and
$25.1 million
, respectively. Exercise prices for options outstanding at
September 30, 2012
, ranged from
$9.03
to
$36.92
. The weighted average remaining contractual lives of options outstanding and exercisable at
September 30, 2012
were
6.1
years and
4.5
years, respectively.
The weighted average fair value of options granted in fiscal
2011
was
$3.98
per share. The fair values of the options granted were estimated on the date of their grant using the Black-Scholes option pricing model based on the following weighted average assumptions:
|
|
Year Ended September 30,
|
|||||||
|
|
2012
|
2011
|
2010
|
|||||
|
Risk free interest rate
|
—
|
|
1.26
|
%
|
—
|
|
||
|
Expected life (in years)
|
—
|
|
6.46
|
|
—
|
|
||
|
Expected volatility
|
—
|
|
46.40
|
%
|
—
|
|
||
|
Expected dividend yield
|
—
|
|
1.50
|
%
|
—
|
|
||
For fiscal
2012
,
2011
and
2010
, the Company’s compensation expense related to stock option grants was
$18.1 million
,
$14.2 million
and
$13.3 million
, respectively, and at
September 30, 2012
, there was
$46.6 million
of total unrecognized compensation expense related to unvested stock option awards. This expense is expected to be recognized over a weighted average period of
4.4
years.
Incentive Bonus Plan
The Company's Incentive Bonus Plan provides for the Compensation Committee to award short-term performance bonuses to senior management based upon the level of achievement of certain criteria. For fiscal
2012
, the Compensation Committee approved an award whereby senior management could earn a semi-annual performance bonus based upon a certain percentage of the Company's pre-tax income. Compensation expense related to this plan was
$4.9 million
in fiscal
2012
.
83
D.R. HORTON, INC. AND SUBSIDIARIES
NOTES TO CONSOLIDATED FINANCIAL STATEMENTS – (Continued)
Restricted Stock Unit Agreement
In
September 2010
, the Compensation Committee of the Board of Directors adopted and approved a form of Restricted Stock Unit Agreement (RSU Agreement) for awards to executive officers and other key employees pursuant to the 2006 Stock Incentive Plan. Under the form of RSU Agreement, the Compensation Committee may award performance or service (time) based restricted stock units subject to the terms and conditions of the RSU Agreement and the 2006 Stock Incentive Plan.
In
September 2010
, the Compensation Committee approved and granted awards of
200,000
performance based restricted stock units (Performance RSUs) that vested at the end of a
two
-year performance period that ended
September 30, 2012
. The number of units that vested depended on the Company's relative position as compared to its peers at the end of the two-year period in achieving certain performance criteria and ranged from
0%
to
200%
of the number of units granted. The performance criteria were total shareholder return, return on investment, SG&A expense containment and gross profit. Each Performance RSU represented the contingent right to receive one share of the Company's common stock if the vesting conditions are satisfied. The Performance RSUs had no dividend or voting rights during the performance period. The fair value of these awards on the date of grant was
$11.53
per unit. Based on the achievement of the performance criteria,
325,000
Performance RSUs were earned and vested on
September 30, 2012
. Compensation expense for these awards was based on the Company's performance against the peer group, the elapsed portion of the performance period and the grant date fair value of the award. Compensation expense was
$2.6 million
and
$1.2 million
in fiscal
2012
and
2011
, respectively.
In November 2010, the Compensation Committee approved and granted awards of
300,000
performance based units (Performance Units) that will vest at the end of a
three
-year performance period ending September 30, 2013. The number of units that ultimately vest depends on the Company's relative position as compared to its peers at the end of the three-year period in achieving certain performance criteria and can range from
0%
to
200%
of the number of units granted. The performance criteria are total shareholder return, return on investment, SG&A expense containment and gross profit. The earned awards will have a value equal to the number of earned units multiplied by the closing price of the Company's common stock at the end of the performance period and may be paid in cash, equity or a combination of both. The Compensation Committee has the discretion to reduce the final payout on the Performance Units from the amount earned. The Performance Units have no dividend or voting rights during the performance period. The fair value of these awards on the date of grant was
$12.69
per unit. The liability for these awards of
$6.7 million
at
September 30, 2012
and
$1.0 million
at
September 30, 2011
was based on the Company's performance against the peer group, the elapsed portion of the performance period and the Company's stock price at the end of each period. Compensation expense related to these grants was
$5.7 million
and
$1.0 million
in fiscal
2012
and fiscal
2011
, respectively.
In November 2011, the Compensation Committee of the Company's Board of Directors approved and granted awards of
350,000
Performance Units that will vest at the end of a
three
-year performance period ending September 30, 2014. The number of units that ultimately vest depends on the Company's relative position as compared to its peers at the end of the three-year period in achieving certain performance criteria and can range from
0%
to
200%
of the number of units granted. The performance criteria are total shareholder return, return on investment, SG&A expense containment and gross profit. The earned awards will have a value equal to the number of earned units multiplied by the closing price of the Company's common stock at the end of the performance period and may be paid in cash, equity or a combination of both. The Compensation Committee has the discretion to reduce the final payout on the Performance Units from the amount earned. The Performance Units have no dividend or voting rights during the performance period. The fair value of these awards on the date of grant was
$11.79
per unit. The liability for these awards of
$4.1 million
at
September 30, 2012
was based on the Company's performance against the peer group, the elapsed portion of the performance period and the Company's stock price at the end of the period. Compensation expense related to this grant was
$4.1 million
in fiscal
2012
.
Performance Unit Plan
The Company's Performance Unit Plan provides for the Compensation Committee to award performance units to senior management based upon the level of achievement of certain criteria. In fiscal 2009, performance units were granted with a
33
-month performance period ending on September 30, 2011. The actual number of performance units earned was based upon the Company's level of achievement on defined performance metrics as compared to its peer group. The earned award had a value equal to the number of earned units multiplied by the closing price of the Company's common stock at the end of the performance period and was payable in cash, equity or a combination of both. The Compensation Committee had the discretion to reduce the final payout on the performance units from the amount earned.
84
D.R. HORTON, INC. AND SUBSIDIARIES
NOTES TO CONSOLIDATED FINANCIAL STATEMENTS – (Continued)
Subsequent to September 30, 2011, the Compensation Committee exercised its discretion and reduced the amount earned under the 2009 performance unit grant to
551,250
performance units which had a value of
$5.0 million
based on the Company's stock price at September 30, 2011. In November 2011, the Company paid cash and issued shares of its common stock to satisfy the award.
NOTE K – COMMITMENTS AND CONTINGENCIES
Warranty Claims
The Company provides its homebuyers with warranties on the homes it sells for defects in structural components, mechanical systems and other construction components of the home. Warranty liabilities are established by charging cost of sales for each home delivered based on management's estimate of expected warranty-related costs and by accruing for existing warranty claims. The Company's warranty liability is based upon historical warranty cost experience and is adjusted to reflect qualitative risks associated with the types of homes built and the geographic areas where the homes are built.
Changes in the Company’s warranty liability during fiscal
2012
and
2011
were as follows:
|
|
September 30,
|
||||||
|
|
2012
|
2011
|
|||||
|
|
(In millions)
|
||||||
|
Warranty liability, beginning of year
|
$
|
46.2
|
|
$
|
46.2
|
|
|
|
Warranties issued
|
18.7
|
|
15.8
|
|
|||
|
Changes in liability for pre-existing warranties
|
15.1
|
|
11.5
|
|
|||
|
Settlements made
|
(23.2
|
)
|
(27.3
|
)
|
|||
|
Warranty liability, end of year
|
$
|
56.8
|
|
$
|
46.2
|
|
|
At
September 30, 2012
, the Company had liabilities of
$0.5 million
for the remaining repair costs of homes which contain or are suspected to contain allegedly defective drywall manufactured in China (Chinese Drywall) that was responsible for accelerated corrosion of certain metals in the home. During fiscal
2012
, the Company received payments of
$6.4 million
from third-parties for the reimbursement of costs paid in prior years to repair homes with Chinese Drywall. These reimbursements were recorded as a reduction of warranty expense, which is a component of home sales cost of sales.
Legal Claims and Insurance
The Company is named as a defendant in various claims, complaints and other legal actions in the ordinary course of business. At any point in time, the Company is managing several hundred individual claims related to construction defect matters, personal injury claims, employment matters, land development issues and contract disputes. The Company has established reserves for these contingencies based on the estimated costs of pending claims and the estimated costs of anticipated future claims related to previously closed homes. The estimated liabilities for these contingencies were
$544.9 million
and
$529.6 million
at
September 30, 2012
and
2011
, respectively, and are included in homebuilding accrued expenses and other liabilities in the consolidated balance sheets. At both
September 30, 2012
and
2011
,
99%
of these reserves related to construction defect matters. Expenses related to the Company’s legal contingencies were approximately
$41.2 million
,
$28.1 million
and
$43.2 million
in fiscal
2012
,
2011
and
2010
, respectively.
The Company’s reserves for construction defect claims include the estimated costs of both known claims and anticipated future claims. As of
September 30, 2012
, no individual existing claim was material to the Company’s financial statements, and the majority of the Company’s total construction defect reserves consisted of the estimated exposure to future claims on previously closed homes. The Company has closed a significant number of homes during recent years, and as a result the Company may be subject to future construction defect claims on these homes. Although regulations vary from state to state, construction defect issues can generally be reported for up to ten years after the home has closed in many states in which the Company operates. Historical data and trends regarding the frequency of claims incurred and the costs to resolve claims relative to the types of products and markets where the Company operates are used to estimate the construction defect liabilities for both existing and anticipated future claims. These estimates are subject to ongoing revision as the circumstances of individual pending claims and historical data and trends change. Adjustments to estimated reserves are recorded in the accounting period in which the change in estimate occurs.
85
D.R. HORTON, INC. AND SUBSIDIARIES
NOTES TO CONSOLIDATED FINANCIAL STATEMENTS – (Continued)
Historical trends in construction defect claims have been inconsistent, and the Company believes they may continue to fluctuate over the next several years. Housing market conditions have been volatile across most of the Company's markets over the past ten years, and the Company believes such conditions can affect the frequency and cost of construction defect claims. The Company closed a significant number of homes during its peak operating years from 2003 to 2007. If the ultimate resolution of construction defect claims resulting from closings in the Company's peak operating years varies from current expectations, it could significantly change the Company's estimates regarding the frequency and timing of claims incurred and the costs to resolve existing and anticipated future claims, which would impact the construction defect reserves in the future. If the frequency of claims incurred or costs of existing and future legal claims significantly exceed the Company's current estimates, they will have a significant negative impact on its future earnings and liquidity.
The Company's reserves for legal claims increased from
$529.6 million
at
September 30, 2011
to
$544.9 million
at
September 30, 2012
primarily due to an increase in the number of closed homes that are subject to possible future construction defect claims and a slight increase in the estimated frequency of claims incurred. These increases were partially offset by payments made for legal claims. Following is a rollforward of the balance of the reserves for fiscal
2012
:
|
Fiscal Year Ended
|
|||
|
September 30, 2012
|
|||
|
(In millions)
|
|||
|
Reserves for legal claims, beginning of period
|
$
|
529.6
|
|
|
Payments
|
(35.9
|
)
|
|
|
Increase in reserves
|
51.2
|
|
|
|
Reserves for legal claims, end of period
|
$
|
544.9
|
|
The Company has, and requires the majority of the subcontractors it uses to have, general liability insurance which includes construction defect coverage. The Company's general liability insurance policies protect it against a portion of its risk of loss from construction defect and other claims and lawsuits, subject to self-insured retentions and other coverage limits. For policy years ended June 30, 2004 through 2012, the Company is self-insured for up to
$22.5 million
of the aggregate indemnity claims incurred, at which point the excess loss insurance begins, depending on the policy year. Once the Company has satisfied the annual aggregate limits, it is self-insured for the first
$0.25 million
to
$1.0 million
of indemnity for each claim occurrence, depending on the policy year. For policy years 2011, 2012 and 2013, the Company is self-insured for up to
$15.0 million
of the aggregate indemnity claims incurred and for up to
$0.5 million
of each claim occurrence thereafter.
In some states where the Company believes it is too difficult or expensive for its subcontractors to obtain general liability insurance, the Company has waived its normal subcontractor general liability insurance requirements to obtain lower costs from subcontractors. In these states, the Company purchases insurance policies from either third-party carriers or its 100% owned captive insurance subsidiary, and names certain subcontractors as additional insureds. The policies issued by the captive insurance subsidiary represent self-insurance of these risks by the Company and are considered in the self-insured amounts above. For policy years after April 2007, the captive insurance subsidiary has
$15.0 million
of risk transfer with a third-party insurer.
The Company is self-insured for the deductible amounts under its workers' compensation insurance policies. The deductibles vary by policy year, but in no years exceed
$0.5 million
per occurrence. The deductible for the 2012 and 2013 policy years is
$0.5 million
per occurrence.
The Company estimates and records receivables under applicable insurance policies related to its estimated contingencies for known claims and anticipated future construction defect claims on previously closed homes and other legal claims and lawsuits incurred in the ordinary course of business when recovery is probable. Additionally, the Company may have the ability to recover a portion of its losses from its subcontractors and their insurance carriers when the Company has been named as an additional insured on their insurance policies. The Company's receivables related to its estimates of insurance recoveries from estimated losses from pending legal claims and anticipated future claims related to previously closed homes totaled
$225.0 million
and
$218.3 million
at
September 30, 2012
and
2011
, respectively, and are included in homebuilding other assets in the consolidated balance sheets.
86
D.R. HORTON, INC. AND SUBSIDIARIES
NOTES TO CONSOLIDATED FINANCIAL STATEMENTS – (Continued)
The estimation of losses related to these reserves and the related estimates of recoveries from insurance policies are subject to a high degree of variability due to uncertainties such as trends in construction defect claims relative to the Company's markets and the types of products built, claim frequency, claim settlement costs and patterns, insurance industry practices and legal interpretations, among others. Due to the high degree of judgment required in establishing reserves for these contingencies, actual future costs and recoveries from insurance could differ significantly from current estimated amounts, and it is not possible for the Company to make a reasonable estimate of the possible loss or range of loss in excess of its reserves.
Land and Lot Option Purchase Contracts
The Company enters into land and lot option purchase contracts to acquire land or lots for the construction of homes. At
September 30, 2012
, the Company had total deposits of
$35.0 million
, consisting of cash deposits of
$31.4 million
and promissory notes and surety bonds of
$3.6 million
, to purchase land and lots with a total remaining purchase price of
$1.7 billion
. Within the land and lot option purchase contracts at
September 30, 2012
, there were a limited number of contracts, representing
$24.1 million
of remaining purchase price, subject to specific performance clauses which may require the Company to purchase the land or lots upon the land sellers meeting their obligations. The majority of land and lots under contract are currently expected to be purchased within
three years
.
Other Commitments
To secure performance under various contracts, the Company had outstanding letters of credit of
$46.6 million
and surety bonds of
$698.4 million
at
September 30, 2012
. The Company has secured letter of credit agreements for
$46.2 million
of its outstanding letters of credit that require it to deposit cash, in an amount approximating the balance of letters of credit outstanding, as collateral with the issuing banks. The Company has
$0.4 million
of outstanding letters of credit under its revolving credit facility which were also cash collateralized to receive better pricing. At
September 30, 2012
and
2011
, the amount of cash restricted for this purpose totaled
$47.2 million
and
$47.5 million
, respectively, and is included in homebuilding restricted cash on the Company’s consolidated balance sheets.
The Company leases office space and equipment under non-cancelable operating leases. At
September 30, 2012
, the future minimum annual lease payments under these agreements are as follows (in millions):
|
2013
|
$
|
11.0
|
|
|
2014
|
8.3
|
|
|
|
2015
|
3.4
|
|
|
|
2016
|
0.6
|
|
|
|
2017
|
—
|
|
|
|
Thereafter
|
—
|
|
|
|
|
$
|
23.3
|
|
Rent expense was
$18.5 million
,
$20.6 million
and
$24.9 million
for fiscal
2012
,
2011
and
2010
, respectively.
87
D.R. HORTON, INC. AND SUBSIDIARIES
NOTES TO CONSOLIDATED FINANCIAL STATEMENTS – (Continued)
NOTE L – OTHER ASSETS AND ACCRUED EXPENSES AND OTHER LIABILITIES
The Company’s homebuilding other assets at
September 30, 2012
and
2011
were as follows:
|
|
September 30,
|
||||||
|
|
2012
|
2011
|
|||||
|
|
(In millions)
|
||||||
|
Insurance receivables
|
$
|
225.0
|
|
$
|
218.3
|
|
|
|
Earnest money and refundable deposits
|
80.0
|
|
59.1
|
|
|||
|
Accounts and notes receivable
|
21.9
|
|
19.1
|
|
|||
|
Prepaid assets
|
29.4
|
|
24.7
|
|
|||
|
Other assets
|
100.5
|
|
77.2
|
|
|||
|
|
$
|
456.8
|
|
$
|
398.4
|
|
|
The Company’s homebuilding accrued expenses and other liabilities at
September 30, 2012
and
2011
were as follows:
|
|
September 30,
|
||||||
|
|
2012
|
2011
|
|||||
|
|
(In millions)
|
||||||
|
Reserves for legal claims
|
$
|
544.9
|
|
$
|
529.6
|
|
|
|
Employee compensation and related liabilities
|
106.4
|
|
85.8
|
|
|||
|
Warranty liability
|
56.8
|
|
46.2
|
|
|||
|
Accrued interest
|
32.6
|
|
25.3
|
|
|||
|
Federal and state income tax liabilities
|
21.6
|
|
22.5
|
|
|||
|
Other liabilities
|
131.5
|
|
120.4
|
|
|||
|
|
$
|
893.8
|
|
$
|
829.8
|
|
|
88
D.R. HORTON, INC. AND SUBSIDIARIES
NOTES TO CONSOLIDATED FINANCIAL STATEMENTS – (Continued)
NOTE M – SEGMENT INFORMATION
The Company’s
32
homebuilding operating divisions and its financial services operation are its operating segments. The homebuilding operating segments are aggregated into
six
reporting segments and the financial services operating segment is its own reporting segment. The Company’s reportable homebuilding segments are: East, Midwest, Southeast, South Central, Southwest and West. These reporting segments have homebuilding operations located in the following states:
|
East:
|
Delaware, Georgia (Savannah only), Maryland, New Jersey, North Carolina, Pennsylvania,
South Carolina and Virginia
|
||
|
Midwest:
|
Colorado, Illinois and Minnesota
|
||
|
Southeast:
|
Alabama, Florida, Georgia and Mississippi
|
||
|
South Central:
|
Louisiana, New Mexico (Las Cruces only), Oklahoma and Texas
|
||
|
Southwest:
|
Arizona and New Mexico
|
||
|
West:
|
California, Hawaii, Idaho, Nevada, Oregon, Utah and Washington
|
||
Homebuilding is the Company’s core business, generating
97%
of consolidated revenues in fiscal
2012
and
98%
of consolidated revenues in fiscal
2011
and
2010
. The Company’s homebuilding segments are primarily engaged in the acquisition and development of land and the construction and sale of residential homes on the land, in
26
states and
77
markets in the United States. The homebuilding segments generate most of their revenues from the sale of completed homes, and to a lesser extent from the sale of land and lots.
The Company’s financial services segment provides mortgage financing and title agency services primarily to the Company’s homebuilding customers. The Company generally sells the mortgages it originates and the related servicing rights to third-party purchasers. The financial services segment generates its revenues from originating and selling mortgages and collecting fees for title insurance agency and closing services.
89
D.R. HORTON, INC. AND SUBSIDIARIES
NOTES TO CONSOLIDATED FINANCIAL STATEMENTS – (Continued)
The accounting policies of the reporting segments are described throughout Note A.
|
|
Year Ended September 30,
|
||||||||||
|
|
2012
|
2011
|
2010
|
||||||||
|
|
|
(In millions)
|
|
||||||||
|
Revenues
|
|
|
|
|
|
|
|||||
|
Homebuilding revenues:
|
|
|
|
|
|
|
|||||
|
East
|
$
|
542.4
|
|
$
|
438.5
|
|
$
|
492.3
|
|
||
|
Midwest
|
339.3
|
|
261.5
|
|
331.0
|
|
|||||
|
Southeast
|
934.6
|
|
696.8
|
|
747.6
|
|
|||||
|
South Central
|
1,158.4
|
|
1,081.0
|
|
1,383.5
|
|
|||||
|
Southwest
|
270.7
|
|
234.8
|
|
329.7
|
|
|||||
|
West
|
990.8
|
|
837.0
|
|
1,025.6
|
|
|||||
|
Total homebuilding revenues
|
4,236.2
|
|
3,549.6
|
|
4,309.7
|
|
|||||
|
Financial services revenues
|
117.8
|
|
87.2
|
|
90.5
|
|
|||||
|
Consolidated revenues
|
$
|
4,354.0
|
|
$
|
3,636.8
|
|
$
|
4,400.2
|
|
||
|
Inventory Impairments
|
|
|
|
|
|
|
|||||
|
East
|
$
|
1.0
|
|
$
|
3.5
|
|
$
|
9.0
|
|
||
|
Midwest
|
—
|
|
0.1
|
|
21.9
|
|
|||||
|
Southeast
|
1.6
|
|
15.8
|
|
17.0
|
|
|||||
|
South Central
|
0.1
|
|
0.2
|
|
13.3
|
|
|||||
|
Southwest
|
0.5
|
|
4.4
|
|
0.6
|
|
|||||
|
West
|
—
|
|
13.3
|
|
0.5
|
|
|||||
|
Total inventory impairments
|
$
|
3.2
|
|
$
|
37.3
|
|
$
|
62.3
|
|
||
|
Income (Loss) Before Income Taxes(1)
|
|
|
|
|
|
|
|||||
|
Homebuilding income (loss) before income taxes:
|
|
|
|
|
|
|
|||||
|
East
|
$
|
16.0
|
|
$
|
(13.5
|
)
|
$
|
(6.3
|
)
|
||
|
Midwest
|
1.1
|
|
(13.7
|
)
|
(31.3
|
)
|
|||||
|
Southeast
|
38.0
|
|
(19.9
|
)
|
(7.5
|
)
|
|||||
|
South Central
|
80.6
|
|
52.4
|
|
83.4
|
|
|||||
|
Southwest
|
16.8
|
|
(3.8
|
)
|
12.0
|
|
|||||
|
West
|
51.2
|
|
(8.5
|
)
|
27.8
|
|
|||||
|
Total homebuilding income (loss) before income taxes
|
203.7
|
|
(7.0
|
)
|
78.1
|
|
|||||
|
Financial services income before income taxes
|
39.2
|
|
19.1
|
|
21.4
|
|
|||||
|
Consolidated income before income taxes
|
$
|
242.9
|
|
$
|
12.1
|
|
$
|
99.5
|
|
||
____________________________________
|
(1)
|
Expenses maintained at the corporate level consist primarily of interest and property taxes, which are capitalized and amortized to cost of sales or expensed directly, and the expenses related to operating the Company’s corporate office. The amortization of capitalized interest and property taxes is allocated to each segment based on the segment’s revenue, while interest expense and those expenses associated with the corporate office are allocated to each segment based on the segment’s inventory balances.
|
90
D.R. HORTON, INC. AND SUBSIDIARIES
NOTES TO CONSOLIDATED FINANCIAL STATEMENTS – (Continued)
|
|
September 30,
|
||||||
|
|
2012
|
2011
|
|||||
|
|
(In millions)
|
||||||
|
Homebuilding Inventories (1):
|
|
|
|
|
|||
|
East
|
$
|
572.7
|
|
$
|
497.3
|
|
|
|
Midwest
|
318.1
|
|
268.5
|
|
|||
|
Southeast
|
905.0
|
|
692.9
|
|
|||
|
South Central
|
935.2
|
|
768.5
|
|
|||
|
Southwest
|
188.6
|
|
193.6
|
|
|||
|
West
|
1,151.3
|
|
938.4
|
|
|||
|
Corporate and unallocated (2)
|
94.3
|
|
90.5
|
|
|||
|
Total homebuilding inventory
|
$
|
4,165.2
|
|
$
|
3,449.7
|
|
|
____________________________________
|
(1)
|
Homebuilding inventories are the only assets included in the measure of segment assets used by the Company’s chief operating decision maker, its CEO.
|
|
(2)
|
Corporate and unallocated consists primarily of capitalized interest and property taxes.
|
91
D.R. HORTON, INC. AND SUBSIDIARIES
NOTES TO CONSOLIDATED FINANCIAL STATEMENTS – (Continued)
NOTE N– SUPPLEMENTAL GUARANTOR INFORMATION
All of the Company's senior and convertible senior notes and the unsecured revolving credit facility are fully and unconditionally guaranteed, on a joint and several basis, by substantially all of the Company's homebuilding subsidiaries (collectively, Guarantor Subsidiaries). Each of the Guarantor Subsidiaries is 100% owned. The Company's subsidiaries engaged in the financial services segment and certain other subsidiaries do not guarantee the Company's senior and convertible senior notes and the unsecured revolving credit facility (collectively, Non-Guarantor Subsidiaries). In lieu of providing separate financial statements for the Guarantor Subsidiaries, consolidating condensed financial statements are presented below. Separate financial statements and other disclosures concerning the Guarantor Subsidiaries are not presented because management has determined that they are not material to investors.
The guarantees by a Guarantor Subsidiary will be automatically and unconditionally released and discharged upon: (1) the sale or other disposition of its common stock whereby it is no longer a subsidiary of the Company; (2) the sale or other disposition of all or substantially all of its assets (other than to the Company or another Guarantor); (3) its merger or consolidation with an entity other than the Company or another Guarantor; or (4) depending on the provisions of the applicable indenture, either (a) its proper designation as an unrestricted subsidiary, (b) its ceasing to guarantee any of the Company's publicly traded debt securities, or (c) its ceasing to guarantee any of the Company's obligations under the revolving credit facility.
Consolidating Balance Sheet
September 30, 2012
|
D.R.
Horton, Inc.
|
Guarantor
Subsidiaries
|
Non-Guarantor
Subsidiaries
|
Eliminations
|
Total
|
|||||||||||||||
|
|
(In millions)
|
||||||||||||||||||
|
ASSETS
|
|
|
|
|
|
|
|
|
|
|
|||||||||
|
Cash and cash equivalents
|
$
|
968.9
|
|
$
|
56.3
|
|
$
|
22.5
|
|
$
|
—
|
|
$
|
1,047.7
|
|
||||
|
Marketable securities, available-for-sale
|
298.0
|
|
—
|
|
—
|
|
—
|
|
298.0
|
|
|||||||||
|
Restricted cash
|
48.7
|
|
0.5
|
|
0.1
|
|
—
|
|
49.3
|
|
|||||||||
|
Investments in subsidiaries
|
2,120.8
|
|
—
|
|
—
|
|
(2,120.8
|
)
|
—
|
|
|||||||||
|
Inventories
|
1,375.1
|
|
2,770.6
|
|
19.5
|
|
—
|
|
4,165.2
|
|
|||||||||
|
Income taxes receivable
|
14.4
|
|
—
|
|
—
|
|
—
|
|
14.4
|
|
|||||||||
|
Deferred income taxes
|
227.6
|
|
481.9
|
|
—
|
|
—
|
|
709.5
|
|
|||||||||
|
Property and equipment, net
|
20.7
|
|
20.7
|
|
31.2
|
|
—
|
|
72.6
|
|
|||||||||
|
Other assets
|
127.8
|
|
271.1
|
|
108.4
|
|
—
|
|
507.3
|
|
|||||||||
|
Mortgage loans held for sale
|
—
|
|
—
|
|
345.3
|
|
—
|
|
345.3
|
|
|||||||||
|
Goodwill
|
—
|
|
38.9
|
|
—
|
|
—
|
|
38.9
|
|
|||||||||
|
Intercompany receivables
|
1,022.6
|
|
—
|
|
—
|
|
(1,022.6
|
)
|
—
|
|
|||||||||
|
Total Assets
|
$
|
6,224.6
|
|
$
|
3,640.0
|
|
$
|
527.0
|
|
$
|
(3,143.4
|
)
|
$
|
7,248.2
|
|
||||
|
LIABILITIES & EQUITY
|
|
|
|
|
|
|
|
|
|
|
|||||||||
|
Accounts payable and other liabilities
|
$
|
329.8
|
|
$
|
700.0
|
|
$
|
130.6
|
|
$
|
—
|
|
$
|
1,160.4
|
|
||||
|
Intercompany payables
|
—
|
|
986.8
|
|
35.8
|
|
(1,022.6
|
)
|
—
|
|
|||||||||
|
Notes payable
|
2,302.7
|
|
2.6
|
|
187.8
|
|
—
|
|
2,493.1
|
|
|||||||||
|
Total Liabilities
|
2,632.5
|
|
1,689.4
|
|
354.2
|
|
(1,022.6
|
)
|
3,653.5
|
|
|||||||||
|
Total stockholders’ equity
|
3,592.1
|
|
1,950.6
|
|
170.2
|
|
(2,120.8
|
)
|
3,592.1
|
|
|||||||||
|
Noncontrolling interests
|
—
|
|
—
|
|
2.6
|
|
—
|
|
2.6
|
|
|||||||||
|
Total Equity
|
3,592.1
|
|
1,950.6
|
|
172.8
|
|
(2,120.8
|
)
|
3,594.7
|
|
|||||||||
|
Total Liabilities & Equity
|
$
|
6,224.6
|
|
$
|
3,640.0
|
|
$
|
527.0
|
|
$
|
(3,143.4
|
)
|
$
|
7,248.2
|
|
||||
92
D.R. HORTON, INC. AND SUBSIDIARIES
NOTES TO CONSOLIDATED FINANCIAL STATEMENTS – (Continued)
Consolidating Balance Sheet
September 30, 2011
|
D.R.
Horton, Inc.
|
Guarantor
Subsidiaries
|
Non-Guarantor
Subsidiaries
|
Eliminations
|
Total
|
|||||||||||||||
|
|
(In millions)
|
||||||||||||||||||
|
ASSETS
|
|
|
|
|
|
|
|
|
|
|
|||||||||
|
Cash and cash equivalents
|
$
|
681.3
|
|
$
|
31.3
|
|
$
|
20.0
|
|
$
|
—
|
|
$
|
732.6
|
|
||||
|
Marketable securities, available-for-sale
|
297.6
|
|
—
|
|
—
|
|
—
|
|
297.6
|
|
|||||||||
|
Restricted cash
|
48.7
|
|
0.4
|
|
—
|
|
—
|
|
49.1
|
|
|||||||||
|
Investments in subsidiaries
|
1,452.3
|
|
—
|
|
—
|
|
(1,452.3
|
)
|
—
|
|
|||||||||
|
Inventories
|
1,100.6
|
|
2,329.6
|
|
19.5
|
|
—
|
|
3,449.7
|
|
|||||||||
|
Income taxes receivable
|
12.4
|
|
—
|
|
—
|
|
—
|
|
12.4
|
|
|||||||||
|
Property and equipment, net
|
18.0
|
|
21.7
|
|
17.9
|
|
—
|
|
57.6
|
|
|||||||||
|
Other assets
|
98.7
|
|
259.2
|
|
91.5
|
|
—
|
|
449.4
|
|
|||||||||
|
Mortgage loans held for sale
|
—
|
|
—
|
|
294.1
|
|
—
|
|
294.1
|
|
|||||||||
|
Goodwill
|
—
|
|
15.9
|
|
—
|
|
—
|
|
15.9
|
|
|||||||||
|
Intercompany receivables
|
748.3
|
|
—
|
|
—
|
|
(748.3
|
)
|
—
|
|
|||||||||
|
Total Assets
|
$
|
4,457.9
|
|
$
|
2,658.1
|
|
$
|
443.0
|
|
$
|
(2,200.6
|
)
|
$
|
5,358.4
|
|
||||
|
LIABILITIES & EQUITY
|
|
|
|
|
|
|
|
|
|
|
|||||||||
|
Accounts payable and other liabilities
|
$
|
252.3
|
|
$
|
662.7
|
|
$
|
115.3
|
|
$
|
—
|
|
$
|
1,030.3
|
|
||||
|
Intercompany payables
|
—
|
|
717.6
|
|
30.7
|
|
(748.3
|
)
|
—
|
|
|||||||||
|
Notes payable
|
1,585.0
|
|
3.1
|
|
116.5
|
|
—
|
|
1,704.6
|
|
|||||||||
|
Total Liabilities
|
1,837.3
|
|
1,383.4
|
|
262.5
|
|
(748.3
|
)
|
2,734.9
|
|
|||||||||
|
Total stockholders’ equity
|
2,620.6
|
|
1,274.7
|
|
177.6
|
|
(1,452.3
|
)
|
2,620.6
|
|
|||||||||
|
Noncontrolling interests
|
—
|
|
—
|
|
2.9
|
|
—
|
|
2.9
|
|
|||||||||
|
Total Equity
|
2,620.6
|
|
1,274.7
|
|
180.5
|
|
(1,452.3
|
)
|
2,623.5
|
|
|||||||||
|
Total Liabilities & Equity
|
$
|
4,457.9
|
|
$
|
2,658.1
|
|
$
|
443.0
|
|
$
|
(2,200.6
|
)
|
$
|
5,358.4
|
|
||||
93
D.R. HORTON, INC. AND SUBSIDIARIES
NOTES TO CONSOLIDATED FINANCIAL STATEMENTS – (Continued)
Consolidating Statement of Operations
Year Ended September 30, 2012
|
D.R.
Horton, Inc.
|
Guarantor
Subsidiaries
|
Non-Guarantor
Subsidiaries
|
Eliminations
|
Total
|
|||||||||||||||
|
|
(In millions)
|
||||||||||||||||||
|
Homebuilding:
|
|
|
|
|
|
|
|
|
|
|
|||||||||
|
Revenues
|
$
|
1,400.3
|
|
$
|
2,828.0
|
|
$
|
7.9
|
|
$
|
—
|
|
$
|
4,236.2
|
|
||||
|
Cost of sales
|
1,130.9
|
|
2,341.5
|
|
20.0
|
|
—
|
|
3,492.4
|
|
|||||||||
|
Gross profit (loss)
|
269.4
|
|
486.5
|
|
(12.1
|
)
|
—
|
|
743.8
|
|
|||||||||
|
Selling, general and administrative expense
|
243.6
|
|
277.5
|
|
7.6
|
|
—
|
|
528.7
|
|
|||||||||
|
Equity in (income) of subsidiaries
|
(235.7
|
)
|
—
|
|
—
|
|
235.7
|
|
—
|
|
|||||||||
|
Interest expense
|
23.6
|
|
—
|
|
—
|
|
—
|
|
23.6
|
|
|||||||||
|
Loss on early retirement of debt, net
|
(0.1
|
)
|
—
|
|
—
|
|
—
|
|
(0.1
|
)
|
|||||||||
|
Other (income)
|
(4.9
|
)
|
(2.2
|
)
|
(5.0
|
)
|
—
|
|
(12.1
|
)
|
|||||||||
|
|
242.9
|
|
211.2
|
|
(14.7
|
)
|
(235.7
|
)
|
203.7
|
|
|||||||||
|
Financial Services:
|
|
|
|
|
|
|
|
|
|
|
|||||||||
|
Revenues, net of recourse and reinsurance expense
|
—
|
|
—
|
|
117.8
|
|
—
|
|
117.8
|
|
|||||||||
|
General and administrative expense
|
—
|
|
—
|
|
85.5
|
|
—
|
|
85.5
|
|
|||||||||
|
Interest expense
|
—
|
|
—
|
|
3.3
|
|
—
|
|
3.3
|
|
|||||||||
|
Interest and other (income)
|
—
|
|
—
|
|
(10.2
|
)
|
—
|
|
(10.2
|
)
|
|||||||||
|
|
—
|
|
—
|
|
39.2
|
|
—
|
|
39.2
|
|
|||||||||
|
Income before income taxes
|
242.9
|
|
211.2
|
|
24.5
|
|
(235.7
|
)
|
242.9
|
|
|||||||||
|
Income tax benefit
|
(713.4
|
)
|
(463.4
|
)
|
(20.6
|
)
|
484.0
|
|
(713.4
|
)
|
|||||||||
|
Net income
|
$
|
956.3
|
|
$
|
674.6
|
|
$
|
45.1
|
|
$
|
(719.7
|
)
|
$
|
956.3
|
|
||||
|
Comprehensive income
|
$
|
956.4
|
|
$
|
674.6
|
|
$
|
45.1
|
|
$
|
(719.7
|
)
|
$
|
956.4
|
|
||||
94
D.R. HORTON, INC. AND SUBSIDIARIES
NOTES TO CONSOLIDATED FINANCIAL STATEMENTS – (Continued)
Consolidating Statement of Operations
Year Ended September 30, 2011
|
D.R.
Horton, Inc.
|
Guarantor
Subsidiaries
|
Non-Guarantor
Subsidiaries
|
Eliminations
|
Total
|
|||||||||||||||
|
|
(In millions)
|
||||||||||||||||||
|
Homebuilding:
|
|
|
|
|
|
|
|
|
|
|
|||||||||
|
Revenues
|
$
|
1,021.4
|
|
$
|
2,516.4
|
|
$
|
11.8
|
|
$
|
—
|
|
$
|
3,549.6
|
|
||||
|
Cost of sales
|
840.1
|
|
2,169.3
|
|
13.9
|
|
—
|
|
3,023.3
|
|
|||||||||
|
Gross profit (loss)
|
181.3
|
|
347.1
|
|
(2.1
|
)
|
—
|
|
526.3
|
|
|||||||||
|
Selling, general and administrative expense
|
209.3
|
|
270.1
|
|
0.6
|
|
—
|
|
480.0
|
|
|||||||||
|
Equity in (income) of subsidiaries
|
(98.2
|
)
|
—
|
|
—
|
|
98.2
|
|
—
|
|
|||||||||
|
Interest expense
|
50.5
|
|
—
|
|
—
|
|
—
|
|
50.5
|
|
|||||||||
|
Loss on early retirement of debt, net
|
10.8
|
|
—
|
|
—
|
|
—
|
|
10.8
|
|
|||||||||
|
Other (income)
|
(3.2
|
)
|
(1.1
|
)
|
(3.7
|
)
|
—
|
|
(8.0
|
)
|
|||||||||
|
|
12.1
|
|
78.1
|
|
1.0
|
|
(98.2
|
)
|
(7.0
|
)
|
|||||||||
|
Financial Services:
|
|
|
|
|
|
|
|
|
|
|
|||||||||
|
Revenues, net of recourse and reinsurance expense
|
—
|
|
—
|
|
87.2
|
|
—
|
|
87.2
|
|
|||||||||
|
General and administrative expense
|
—
|
|
—
|
|
76.3
|
|
—
|
|
76.3
|
|
|||||||||
|
Interest expense
|
—
|
|
—
|
|
1.4
|
|
—
|
|
1.4
|
|
|||||||||
|
Interest and other (income)
|
—
|
|
—
|
|
(9.6
|
)
|
—
|
|
(9.6
|
)
|
|||||||||
|
|
—
|
|
—
|
|
19.1
|
|
—
|
|
19.1
|
|
|||||||||
|
Income before income taxes
|
12.1
|
|
78.1
|
|
20.1
|
|
(98.2
|
)
|
12.1
|
|
|||||||||
|
Income tax benefit
|
(59.7
|
)
|
(41.4
|
)
|
(1.5
|
)
|
42.9
|
|
(59.7
|
)
|
|||||||||
|
Net income
|
$
|
71.8
|
|
$
|
119.5
|
|
$
|
21.6
|
|
$
|
(141.1
|
)
|
$
|
71.8
|
|
||||
|
Comprehensive income
|
$
|
71.6
|
|
$
|
119.5
|
|
$
|
21.6
|
|
$
|
(141.1
|
)
|
$
|
71.6
|
|
||||
95
D.R. HORTON, INC. AND SUBSIDIARIES
NOTES TO CONSOLIDATED FINANCIAL STATEMENTS – (Continued)
Consolidating Statement of Operations
Year Ended September 30, 2010
|
D.R.
Horton, Inc.
|
Guarantor
Subsidiaries
|
Non-Guarantor
Subsidiaries
|
Eliminations
|
Total
|
|||||||||||||||
|
|
(In millions)
|
||||||||||||||||||
|
Homebuilding:
|
|
|
|
|
|
|
|
|
|
|
|||||||||
|
Revenues
|
$
|
1,103.3
|
|
$
|
3,199.8
|
|
$
|
6.6
|
|
$
|
—
|
|
$
|
4,309.7
|
|
||||
|
Cost of sales
|
888.0
|
|
2,736.5
|
|
3.1
|
|
—
|
|
3,627.6
|
|
|||||||||
|
Gross profit
|
215.3
|
|
463.3
|
|
3.5
|
|
—
|
|
682.1
|
|
|||||||||
|
Selling, general and administrative expense
|
206.4
|
|
309.2
|
|
7.6
|
|
—
|
|
523.2
|
|
|||||||||
|
Equity in (income) of subsidiaries
|
(177.9
|
)
|
—
|
|
—
|
|
177.9
|
|
—
|
|
|||||||||
|
Interest expense
|
86.3
|
|
—
|
|
—
|
|
—
|
|
86.3
|
|
|||||||||
|
Loss on early retirement of debt, net
|
4.9
|
|
—
|
|
—
|
|
—
|
|
4.9
|
|
|||||||||
|
Other (income)
|
(3.9
|
)
|
(2.7
|
)
|
(3.8
|
)
|
—
|
|
(10.4
|
)
|
|||||||||
|
|
99.5
|
|
156.8
|
|
(0.3
|
)
|
(177.9
|
)
|
78.1
|
|
|||||||||
|
Financial Services:
|
|
|
|
|
|
|
|
|
|
|
|||||||||
|
Revenues, net of recourse and reinsurance expense
|
—
|
|
—
|
|
90.5
|
|
—
|
|
90.5
|
|
|||||||||
|
General and administrative expense
|
—
|
|
—
|
|
77.2
|
|
—
|
|
77.2
|
|
|||||||||
|
Interest expense
|
—
|
|
—
|
|
1.9
|
|
—
|
|
1.9
|
|
|||||||||
|
Interest and other (income)
|
—
|
|
—
|
|
(10.0
|
)
|
—
|
|
(10.0
|
)
|
|||||||||
|
|
—
|
|
—
|
|
21.4
|
|
—
|
|
21.4
|
|
|||||||||
|
Income before income taxes
|
99.5
|
|
156.8
|
|
21.1
|
|
(177.9
|
)
|
99.5
|
|
|||||||||
|
Income tax benefit
|
(145.6
|
)
|
(109.7
|
)
|
(2.9
|
)
|
112.6
|
|
(145.6
|
)
|
|||||||||
|
Net income
|
$
|
245.1
|
|
$
|
266.5
|
|
$
|
24.0
|
|
$
|
(290.5
|
)
|
$
|
245.1
|
|
||||
|
Comprehensive income
|
$
|
245.4
|
|
$
|
266.5
|
|
$
|
24.0
|
|
$
|
(290.5
|
)
|
$
|
245.4
|
|
||||
96
D.R. HORTON, INC. AND SUBSIDIARIES
NOTES TO CONSOLIDATED FINANCIAL STATEMENTS – (Continued)
Consolidating Statement of Cash Flows
Year Ended September 30, 2012
|
D.R.
Horton, Inc.
|
Guarantor
Subsidiaries
|
Non-Guarantor
Subsidiaries
|
Eliminations
|
Total
|
|||||||||||||||
|
|
(In millions)
|
||||||||||||||||||
|
OPERATING ACTIVITIES
|
|
|
|
|
|
|
|
|
|
|
|||||||||
|
Net cash (used in) provided by operating activities
|
$
|
(115.2
|
)
|
$
|
(126.3
|
)
|
$
|
(5.5
|
)
|
$
|
(51.1
|
)
|
$
|
(298.1
|
)
|
||||
|
INVESTING ACTIVITIES
|
|
|
|
|
|
|
|
|
|
|
|||||||||
|
Purchases of property and equipment
|
(10.2
|
)
|
(7.6
|
)
|
(15.8
|
)
|
—
|
|
(33.6
|
)
|
|||||||||
|
Purchases of marketable securities
|
(240.8
|
)
|
—
|
|
—
|
|
—
|
|
(240.8
|
)
|
|||||||||
|
Proceeds from the sale or maturity of marketable securities
|
232.8
|
|
—
|
|
—
|
|
—
|
|
232.8
|
|
|||||||||
|
Decrease in restricted cash
|
—
|
|
(0.1
|
)
|
(0.1
|
)
|
—
|
|
(0.2
|
)
|
|||||||||
|
Acquisition of a business
|
(96.5
|
)
|
—
|
|
—
|
|
—
|
|
(96.5
|
)
|
|||||||||
|
Net cash used in investing activities
|
(114.7
|
)
|
(7.7
|
)
|
(15.9
|
)
|
—
|
|
(138.3
|
)
|
|||||||||
|
FINANCING ACTIVITIES
|
|
|
|
|
|
|
|
|
|
|
|||||||||
|
Net change in notes payable
|
682.7
|
|
(5.6
|
)
|
71.3
|
|
—
|
|
748.4
|
|
|||||||||
|
Net change in intercompany receivables/payables
|
(168.3
|
)
|
164.6
|
|
3.7
|
|
—
|
|
—
|
|
|||||||||
|
Proceeds from stock associated with certain employee benefit plans
|
50.9
|
|
—
|
|
—
|
|
—
|
|
50.9
|
|
|||||||||
|
Cash dividends paid
|
(47.8
|
)
|
—
|
|
(51.1
|
)
|
51.1
|
|
(47.8
|
)
|
|||||||||
|
Net cash (used in) provided by financing activities
|
517.5
|
|
159.0
|
|
23.9
|
|
51.1
|
|
751.5
|
|
|||||||||
|
Increase in cash and cash equivalents
|
287.6
|
|
25.0
|
|
2.5
|
|
—
|
|
315.1
|
|
|||||||||
|
Cash and cash equivalents at beginning of year
|
681.3
|
|
31.3
|
|
20.0
|
|
—
|
|
732.6
|
|
|||||||||
|
Cash and cash equivalents at end of year
|
$
|
968.9
|
|
$
|
56.3
|
|
$
|
22.5
|
|
$
|
—
|
|
$
|
1,047.7
|
|
||||
97
D.R. HORTON, INC. AND SUBSIDIARIES
NOTES TO CONSOLIDATED FINANCIAL STATEMENTS – (Continued)
Consolidating Statement of Cash Flows
Year Ended September 30, 2011
|
D.R.
Horton, Inc.
|
Guarantor
Subsidiaries
|
Non-Guarantor
Subsidiaries
|
Eliminations
|
Total
|
|||||||||||||||
|
|
(In millions)
|
||||||||||||||||||
|
OPERATING ACTIVITIES
|
|
|
|
|
|
|
|
|
|
|
|||||||||
|
Net cash (used in) provided by operating activities
|
$
|
(104.4
|
)
|
$
|
151.2
|
|
$
|
(31.9
|
)
|
$
|
—
|
|
$
|
14.9
|
|
||||
|
INVESTING ACTIVITIES
|
|
|
|
|
|
|
|
|
|
|
|||||||||
|
Purchases of property and equipment
|
(6.7
|
)
|
(9.3
|
)
|
(0.3
|
)
|
—
|
|
(16.3
|
)
|
|||||||||
|
Purchases of marketable securities
|
(300.1
|
)
|
—
|
|
—
|
|
—
|
|
(300.1
|
)
|
|||||||||
|
Proceeds from the sale or maturity of marketable securities
|
292.5
|
|
—
|
|
—
|
|
—
|
|
292.5
|
|
|||||||||
|
Decrease in restricted cash
|
4.6
|
|
—
|
|
—
|
|
—
|
|
4.6
|
|
|||||||||
|
Net cash used in investing activities
|
(9.7
|
)
|
(9.3
|
)
|
(0.3
|
)
|
—
|
|
(19.3
|
)
|
|||||||||
|
FINANCING ACTIVITIES
|
|
|
|
|
|
|
|
|
|
|
|||||||||
|
Net change in notes payable
|
(518.4
|
)
|
(0.9
|
)
|
30.0
|
|
—
|
|
(489.3
|
)
|
|||||||||
|
Net change in intercompany receivables/payables
|
161.9
|
|
(155.0
|
)
|
(6.9
|
)
|
—
|
|
—
|
|
|||||||||
|
Proceeds from stock associated with certain employee benefit plans
|
3.4
|
|
—
|
|
—
|
|
—
|
|
3.4
|
|
|||||||||
|
Cash dividends paid
|
(47.8
|
)
|
—
|
|
—
|
|
—
|
|
(47.8
|
)
|
|||||||||
|
Purchase of treasury stock
|
(38.6
|
)
|
—
|
|
—
|
|
—
|
|
(38.6
|
)
|
|||||||||
|
Net cash (used in) provided by financing activities
|
(439.5
|
)
|
(155.9
|
)
|
23.1
|
|
—
|
|
(572.3
|
)
|
|||||||||
|
Decrease in cash and cash equivalents
|
(553.6
|
)
|
(14.0
|
)
|
(9.1
|
)
|
—
|
|
(576.7
|
)
|
|||||||||
|
Cash and cash equivalents at beginning of year
|
1,234.9
|
|
45.3
|
|
29.1
|
|
—
|
|
1,309.3
|
|
|||||||||
|
Cash and cash equivalents at end of year
|
$
|
681.3
|
|
$
|
31.3
|
|
$
|
20.0
|
|
$
|
—
|
|
$
|
732.6
|
|
||||
98
D.R. HORTON, INC. AND SUBSIDIARIES
NOTES TO CONSOLIDATED FINANCIAL STATEMENTS – (Continued)
Consolidating Statement of Cash Flows
Year Ended September 30, 2010
|
D.R.
Horton, Inc.
|
Guarantor
Subsidiaries
|
Non-Guarantor
Subsidiaries
|
Eliminations
|
Total
|
|||||||||||||||
|
|
(In millions)
|
||||||||||||||||||
|
OPERATING ACTIVITIES
|
|
|
|
|
|
|
|
|
|
|
|||||||||
|
Net cash provided by (used in) operating activities
|
$
|
344.9
|
|
$
|
380.0
|
|
$
|
(15.5
|
)
|
$
|
—
|
|
$
|
709.4
|
|
||||
|
INVESTING ACTIVITIES
|
|
|
|
|
|
|
|
|
|
|
|||||||||
|
Purchases of property and equipment
|
(7.9
|
)
|
(11.0
|
)
|
(0.3
|
)
|
—
|
|
(19.2
|
)
|
|||||||||
|
Purchases of marketable securities
|
(328.0
|
)
|
—
|
|
—
|
|
—
|
|
(328.0
|
)
|
|||||||||
|
Proceeds from the sale of marketable securities
|
27.7
|
|
—
|
|
—
|
|
—
|
|
27.7
|
|
|||||||||
|
Decrease in restricted cash
|
1.2
|
|
0.3
|
|
—
|
|
—
|
|
1.5
|
|
|||||||||
|
Net cash used in investing activities
|
(307.0
|
)
|
(10.7
|
)
|
(0.3
|
)
|
—
|
|
(318.0
|
)
|
|||||||||
|
FINANCING ACTIVITIES
|
|
|
|
|
|
|
|
|
|
|
|||||||||
|
Net change in notes payable
|
(1,019.9
|
)
|
—
|
|
17.8
|
|
—
|
|
(1,002.1
|
)
|
|||||||||
|
Net change in intercompany receivables/payables
|
383.0
|
|
(372.3
|
)
|
(10.7
|
)
|
—
|
|
—
|
|
|||||||||
|
Proceeds from stock associated with certain employee benefit plans
|
7.6
|
|
—
|
|
—
|
|
—
|
|
7.6
|
|
|||||||||
|
Income tax benefit from stock option exercises
|
2.8
|
|
—
|
|
—
|
|
—
|
|
2.8
|
|
|||||||||
|
Cash dividends paid
|
(47.7
|
)
|
—
|
|
—
|
|
—
|
|
(47.7
|
)
|
|||||||||
|
Net cash (used in) provided by financing activities
|
(674.2
|
)
|
(372.3
|
)
|
7.1
|
|
—
|
|
(1,039.4
|
)
|
|||||||||
|
Decrease in cash and cash equivalents
|
(636.3
|
)
|
(3.0
|
)
|
(8.7
|
)
|
—
|
|
(648.0
|
)
|
|||||||||
|
Cash and cash equivalents at beginning of year
|
1,871.2
|
|
48.3
|
|
37.8
|
|
—
|
|
1,957.3
|
|
|||||||||
|
Cash and cash equivalents at end of year
|
$
|
1,234.9
|
|
$
|
45.3
|
|
$
|
29.1
|
|
$
|
—
|
|
$
|
1,309.3
|
|
||||
99
D.R. HORTON, INC. AND SUBSIDIARIES
NOTES TO CONSOLIDATED FINANCIAL STATEMENTS – (Continued)
NOTE O – QUARTERLY RESULTS OF OPERATIONS (UNAUDITED)
Quarterly results of operations were (in millions, except per share amounts):
|
Fiscal 2012
|
|||||||||||||||
|
Three Months Ended
|
|||||||||||||||
|
|
September 30
|
June 30
|
March 31
|
December 31
|
|||||||||||
|
Revenues
|
$
|
1,336.2
|
|
$
|
1,150.0
|
|
$
|
961.2
|
|
$
|
906.6
|
|
|||
|
Gross profit
|
232.5
|
|
198.3
|
|
164.4
|
|
148.6
|
|
|||||||
|
Income before income taxes
|
99.2
|
|
72.2
|
|
42.3
|
|
29.2
|
|
|||||||
|
Income tax (benefit) expense
|
(0.9
|
)
|
(715.6
|
)
|
1.7
|
|
1.5
|
|
|||||||
|
Net income
|
100.1
|
|
787.8
|
|
40.6
|
|
27.7
|
|
|||||||
|
Basic net income per common share
|
0.31
|
|
2.47
|
|
0.13
|
|
0.09
|
|
|||||||
|
Diluted net income per common share
|
0.30
|
|
2.22
|
|
0.13
|
|
0.09
|
|
|||||||
|
Fiscal 2011
|
|||||||||||||||
|
Three Months Ended
|
|||||||||||||||
|
|
September 30
|
June 30
|
March 31
|
December 31
|
|||||||||||
|
Revenues
|
$
|
1,098.3
|
|
$
|
999.2
|
|
$
|
751.1
|
|
$
|
788.2
|
|
|||
|
Gross profit
|
160.0
|
|
151.3
|
|
104.8
|
|
110.2
|
|
|||||||
|
Income (loss) before income taxes
|
33.8
|
|
28.9
|
|
(30.8
|
)
|
(19.9
|
)
|
|||||||
|
Income tax (benefit) expense
|
(1.9
|
)
|
0.2
|
|
(58.6
|
)
|
0.5
|
|
|||||||
|
Net income (loss)
|
35.7
|
|
28.7
|
|
27.8
|
|
(20.4
|
)
|
|||||||
|
Basic net income (loss) per common share
|
0.11
|
|
0.09
|
|
0.09
|
|
(0.06
|
)
|
|||||||
|
Diluted net income (loss) per common share
|
0.11
|
|
0.09
|
|
0.09
|
|
(0.06
|
)
|
|||||||
The Company experiences variability in its results of operations from quarter to quarter due to the seasonal nature of its homebuilding business. The Company generally has more homes under construction, closes more homes and has greater revenues and operating income in the third and fourth quarters (June and September) than in the first and second quarters (December and March) of its fiscal year.
Gross profit during fiscal
2012
was reduced by inventory impairment charges and write-offs of earnest money deposits and land option costs of
$1.4 million
,
$0.8 million
,
$2.5 million
and
$1.5 million
in the first, second, third and fourth quarters, respectively. Gross profit during fiscal
2011
was reduced by inventory impairment charges and write-offs of earnest money deposits and land option costs of
$8.4 million
,
$14.3 million
,
$9.9 million
and
$12.8 million
in the first, second, third and fourth quarters, respectively.
During the second quarter of fiscal 2011, the Company recorded an out-of-period adjustment of
$5.9 million
, which increased home sales gross profit and net income while decreasing accrued expenses. The adjustment related to an error in recording the loss reserves of the Company’s 100% owned captive insurance subsidiary. The unadjusted amounts from prior periods, which included
$0.6 million
from the first quarter of fiscal 2011, were considered to be immaterial to the prior periods.
The income tax benefit in the third quarter of fiscal 2012 was the result of a
$716.7 million
reduction of the Company's deferred tax asset valuation allowance in that quarter.
100
|
ITEM 9.
|
CHANGES IN AND DISAGREEMENTS WITH ACCOUNTANTS ON ACCOUNTING AND FINANCIAL DISCLOSURE
|
None.
|
ITEM 9A.
|
CONTROLS AND PROCEDURES
|
Evaluation of Disclosure Controls and Procedures
As of the end of the period covered by this report, an evaluation was performed under the supervision and with the participation of the Company’s management, including the Chief Executive Officer (CEO) and Chief Financial Officer (CFO), of the effectiveness of the Company’s disclosure controls and procedures as defined in Rule 13a-15(e) and 15d-15(e) under the Securities Exchange Act of 1934. Based on that evaluation, the CEO and CFO concluded that the Company’s disclosure controls and procedures as of
September 30, 2012
were effective in providing reasonable assurance that information required to be disclosed in the reports the Company files, furnishes, submits or otherwise provides the Securities and Exchange Commission under the Exchange Act is recorded, processed, summarized and reported, within the time periods specified in the SEC’s rules and forms, and that information required to be disclosed in reports filed by the Company under the Exchange Act is accumulated and communicated to the Company’s management, including the CEO and CFO, in such a manner as to allow timely decisions regarding the required disclosure.
There have been no changes in the Company’s internal controls over financial reporting during the quarter ended
September 30, 2012
that have materially affected, or are reasonably likely to materially affect, our internal control over financial reporting.
MANAGEMENT’S REPORT ON INTERNAL CONTROL OVER FINANCIAL REPORTING
Our management is responsible for establishing and maintaining adequate internal control over financial reporting, as defined in Rule 13a-15(f) under the Securities Exchange Act of 1934, as amended. Internal control over financial reporting is a process to provide reasonable assurance regarding the reliability of our financial reporting and the preparation of financial statements for external purposes in accordance with U.S. generally accepted accounting principles. Because of its inherent limitations, internal control over financial reporting may not prevent or detect misstatements. Also, projections of any evaluation of effectiveness to future periods are subject to the risk that controls may become inadequate because of changes in conditions, or that the degree of compliance with the policies or procedures may deteriorate.
Management conducted an evaluation of the effectiveness of our internal control over financial reporting based on the framework in
Internal Control — Integrated Framework
issued by the Committee of Sponsoring Organizations of the Treadway Commission. Based on this evaluation, management concluded that the Company’s internal control over financial reporting was effective as of
September 30, 2012
.
PricewaterhouseCoopers LLP, an independent registered public accounting firm, has audited the effectiveness of our internal control over financial reporting as of
September 30, 2012
, as stated in their report included herein.
|
ITEM 9B.
|
OTHER INFORMATION
|
None.
101
|
ITEM 10.
|
DIRECTORS, EXECUTIVE OFFICERS AND CORPORATE GOVERNANCE
|
The information required by this item is set forth under the captions
“Proposal One — Election of Directors,” “Corporate Governance and Board Matters,”
“Section 16(a) Beneficial Ownership Reporting Compliance”
and
“Requesting Documents from the Company”
in the registrant’s definitive Proxy Statement for the
2013
Annual Meeting of Stockholders and incorporated herein by reference.
|
ITEM 11.
|
EXECUTIVE COMPENSATION
|
The information required by this item is set forth under the caption
“Executive Compensation”
in the registrant’s definitive Proxy Statement for the
2013
Annual Meeting of Stockholders and incorporated herein by reference.
|
ITEM 12.
|
SECURITY OWNERSHIP OF CERTAIN BENEFICIAL OWNERS AND MANAGEMENT AND RELATED STOCKHOLDER MATTERS
|
Securities Authorized for Issuance under Equity Compensation Plans
The following table summarizes our equity compensation plans as of
September 30, 2012
:
|
(a)
Number of Shares to
be Issued Upon
Exercise of
Outstanding Options,
Warrants and Rights
|
(b)
Weighted-Average
Exercise Price of
Outstanding Options,
Warrants and Rights
|
(c)
Number of Securities
Remaining Available for
Future Issuance Under
Equity Compensation Plans
(Excluding Securities
Reflected in Column (a))
|
||||||||
|
Plan Category
|
|
|
|
|
|
|
||||
|
Equity compensation plans approved
by stockholders
|
17,580,031
|
|
$
|
14.24
|
|
15,090,086
|
|
(1)
|
||
|
Equity compensation plans not approved
by stockholders
|
—
|
|
n/a
|
|
—
|
|
||||
|
Total
|
17,580,031
|
|
$
|
14.24
|
|
15,090,086
|
|
(1)
|
||
________________________
|
(1)
|
Includes
3,639,026
shares reserved for issuance under the Company’s Employee Stock Purchase Plan. Under this Employee Stock Purchase Plan, employees purchased
79,455
shares of common stock in fiscal
2012
.
|
The remaining information required by this item is set forth under the caption
“Beneficial Ownership of Common Stock”
in the registrant’s definitive Proxy Statement for the
2013
Annual Meeting of Stockholders and incorporated herein by reference.
|
ITEM 13.
|
CERTAIN RELATIONSHIPS AND RELATED TRANSACTIONS, AND DIRECTOR INDEPENDENCE
|
The information required by this item is set forth under the captions
“Certain Relationships and Related Person Transactions”
and
“Corporate Governance and Board Matters”
in the registrant’s definitive Proxy Statement for the
2013
Annual Meeting of Stockholders and incorporated herein by reference.
|
ITEM 14.
|
PRINCIPAL ACCOUNTANT FEES AND SERVICES
|
The information required by this item is set forth under the caption
“Independent Registered Public Accountants”
in the registrant’s definitive Proxy Statement for the
2013
Annual Meeting of Stockholders and incorporated herein by reference.
102
|
ITEM 15.
|
EXHIBITS AND FINANCIAL STATEMENT SCHEDULES
|
(a) The following documents are filed as part of this report:
(1). Financial Statements:
See Item 8 above.
(2). Financial Statement Schedules:
Schedules for which provision is made in the applicable accounting regulations of the Securities and Exchange Commission are omitted because they are not required under the related instructions or are not applicable, or because the required information is shown in the consolidated financial statements or notes thereto.
(3). and (b) Exhibits:
|
Exhibit
Number
|
Exhibit
|
||
|
3.1
|
Certificate of Amendment of the Amended and Restated Certificate of Incorporation, as amended, of the Registrant, dated January 31, 2006, and the Amended and Restated Certificate of Incorporation, as amended, of the Registrant dated March 18, 1992 (3)
|
||
|
3.2
|
Amended and Restated Bylaws (4)
|
||
|
4.1
|
See Exhibit 3.1
|
||
|
4.2
|
Indenture, dated as of June 9, 1997, among the Registrant, the Guarantors named therein and American Stock Transfer & Trust Company, as Trustee (5)
|
||
|
4.3
|
Second Supplemental Indenture, dated as of September 30, 1997, among the Registrant, the Guarantors named therein and American Stock Transfer & Trust Company, as Trustee (6)
|
||
|
4.4
|
Third Supplemental Indenture, dated as of April 17, 1998, among the Registrant, the Guarantors named therein and American Stock Transfer & Trust Company, as Trustee (7)
|
||
|
4.5
|
Fourth Supplemental Indenture, dated as of April 20, 1998, among the Registrant, the Guarantors named therein and American Stock Transfer & Trust Company, as Trustee (8)
|
||
|
4.6
|
Fifth Supplemental Indenture, dated as of August 31, 1998, among the Registrant, the Guarantors named therein and American Stock Transfer & Trust Company, as Trustee (9)
|
||
|
4.7
|
Seventh Supplemental Indenture, dated as of August 31, 1999, among the Registrant, the Guarantors named therein and American Stock Transfer & Trust Company, as Trustee (10)
|
||
|
4.8
|
Ninth Supplemental Indenture, dated as of March 31, 2000, among the Registrant, the Guarantors named therein and American Stock Transfer & Trust Company, as Trustee (11)
|
||
|
4.9
|
Twelfth Supplemental Indenture, dated as of May 21, 2001, among the Registrant, the Guarantors named therein and American Stock Transfer & Trust Company, as Trustee (12)
|
||
|
4.10
|
Fourteenth Supplemental Indenture, dated as of February 21, 2002, among the Registrant, the Guarantors named therein and American Stock Transfer & Trust Company, as Trustee (20)
|
||
|
4.11
|
Sixteenth Supplemental Indenture, dated as of April 17, 2003, by and among the Registrant, the Guarantors named therein and American Stock Transfer & Trust Company, as Trustee, relating to the 6.875% Senior Notes due 2013 issued by the Registrant (22)
|
||
|
4.12
|
Seventeenth Supplemental Indenture, dated as of June 25, 2003, by and among the Registrant, the Guarantors named therein and American Stock Transfer & Trust Company, as Trustee, relating to the 5.875% Senior Notes due 2013 issued by the Registrant (23)
|
||
|
4.13
|
Nineteenth Supplemental Indenture, dated as of July 12, 2004, by and among the Registrant, the Guarantors named therein and American Stock Transfer & Trust Company, as Trustee, relating to the 6.125% Senior Notes due 2014 issued by the Registrant (26)
|
||
|
4.14
|
Twentieth Supplemental Indenture, dated as of September 21, 2004, by and among the Registrant, the Guarantors named therein and American Stock Transfer & Trust Company, as Trustee, relating to the 5.625% Senior Notes due 2014 issued by the Registrant (27)
|
||
103
|
4.15
|
Twenty-Second Supplemental Indenture, dated as of December 15, 2004, by and among the Registrant, the Guarantors named therein and American Stock Transfer & Trust Company, as Trustee, relating to the 5.625% Senior Notes due 2016 issued by the Registrant (28)
|
||
|
4.16
|
Twenty-Third Supplemental Indenture, dated as of February 11, 2005, by and among the Registrant, the Guarantors named therein and American Stock Transfer & Trust Company, as Trustee, relating to the 5.25% Senior Notes due 2015 issued by the Registrant (29)
|
||
|
4.17
|
Twenty-Fourth Supplemental Indenture, dated as of July 7, 2005, by and among the Registrant, the Guarantors named therein and American Stock Transfer & Trust Company, as Trustee, relating to the 5.375% Senior Notes due 2012 issued by the Registrant (30)
|
||
|
4.18
|
Twenty-Fifth Supplemental Indenture, dated as of January 23, 2006, by and among the Registrant, the Guarantors named therein and American Stock Transfer & Trust Company, as Trustee (34)
|
||
|
4.19
|
Twenty-Seventh Supplemental Indenture, dated as of April 17, 2006, by and among the Registrant, the Guarantors named therein and American Stock Transfer & Trust Company, as Trustee, relating to the 6.5% Senior Notes due 2016 issued by the Registrant (36)
|
||
|
4.20
|
Twenty-Eighth Supplemental Indenture, dated as of June 13, 2006, by and among the Registrant, the Guarantors named therein and American Stock Transfer & Trust Company, as Trustee (39)
|
||
|
4.21
|
Thirtieth Supplemental Indenture, dated as of May 13, 2009, by and among the Registrant, the Guarantors named therein and American Stock Transfer & Trust Company, LLC, as Trustee, relating to the 2.00% Convertible Senior Notes due 2014 issued by the Registrant (24)
|
||
|
4.22
|
Senior Debt Securities Indenture, dated as of May 1, 2012, between Registrant and American Stock Transfer & Trust Company, LLC, as Trustee (60)
|
||
|
4.23
|
Supplemental Indenture, dated as of May 1, 2012, among the Registrant, the Guarantors named therein and American Stock Transfer & Trust Company, LLC, as Trustee, relating to the 4.750% Senior Notes due 2017 issued by the Registrant (61)
|
||
|
4.24
|
Second Supplemental Indenture, dated as of September 14, 2012, among the Registrant, the Guarantors named therein and American Stock Transfer & Trust Company, LLC, as Trustee, relating to the 4.375% Senior Notes due 2022 issued by the Registrant (63)
|
||
|
10.1
|
Form of Indemnification Agreement between the Registrant and each of its directors and executive officers and schedules of substantially identical documents (13)
|
||
|
10.2
|
†
|
D.R. Horton, Inc. 1991 Stock Incentive Plan, as amended and restated (14)
|
|
|
10.3
|
†
|
Amendment No. 1 to 1991 Stock Incentive Plan, as amended and restated (15)
|
|
|
10.4
|
†
|
Form of Non-Qualified Stock Option Agreement under the D.R. Horton, Inc. 1991 Stock Incentive Plan (Term Vesting) (16)
|
|
|
10.5
|
†
|
D.R. Horton, Inc. 2006 Stock Incentive Plan (35)
|
|
|
10.6
|
†
|
D.R. Horton, Inc. 2006 Stock Incentive Plan, as amended and restated (54)
|
|
|
10.7
|
†
|
Form of Non-Qualified Stock Option Agreement under the D.R. Horton, Inc. 2006 Stock Incentive Plan (Employee - Term Vesting 2006 Form) (37)
|
|
|
10.8
|
†
|
Form of Non-Qualified Stock Option Agreement under the D.R. Horton, Inc. 2006 Stock Incentive Plan (Director - Term Vesting 2006 Form) (38)
|
|
|
10.9
|
†
|
Form of Non-Qualified Stock Option Agreement (Employee-Term Vesting 2008 Form) pursuant to the Registrant's 2006 Stock Incentive Plan (40)
|
|
|
10.10
|
†
|
Form of Non-Qualified Stock Option Agreement (Outside Director-Term Vesting 2008 Form) pursuant to the Registrant's 2006 Stock Incentive Plan (42)
|
|
|
10.11
|
†
|
Form of Restricted Stock Unit Agreement pursuant to the Registrant's 2006 Stock Incentive Plan (55)
|
|
|
10.12
|
†
|
Form of Restricted Stock Unit Agreement pursuant to the Registrant's 2006 Stock Incentive Plan, as amended and restated (1)
|
|
|
10.13
|
†
|
Form of Stock Award Agreement pursuant to the Registrant's 2006 Stock Incentive Plan (56)
|
|
|
10.14
|
†
|
D.R. Horton, Inc. Supplemental Executive Retirement Plan No. 1 (17)
|
|
|
10.15
|
†
|
D.R. Horton, Inc. Supplemental Executive Retirement Trust No. 1 (18)
|
|
|
10.16
|
†
|
D.R. Horton, Inc. Amended and Restated Supplemental Executive Retirement Plan No. 2 (50)
|
|
|
10.17
|
†
|
D.R. Horton, Inc. Amended and Restated 2000 Incentive Bonus Plan (19)
|
|
104
|
10.18
|
†
|
D.R. Horton, Inc. 2008 Performance Unit Plan (44)
|
|
|
10.19
|
†
|
Form of Performance Unit Award pursuant to the Registrant's 2008 Performance Unit Plan (25)
|
|
|
10.20
|
†
|
Executive Compensation Notification (fiscal 2012) - Chairman and CEO (43)
|
|
|
10.21
|
†
|
Executive Compensation Notification (fiscal 2013) - Chairman and CEO (31)
|
|
|
10.22
|
†
|
Executive Compensation Summary - Other Executive Officers (fiscal 2012) (52)
|
|
|
10.23
|
†
|
Executive Compensation Summary - Other Executive Officers (fiscal 2013) (32)
|
|
|
10.24
|
†
|
Director Compensation Summary (fiscal 2012) (53)
|
|
|
10.25
|
†
|
Director Compensation Summary (fiscal 2013) (33)
|
|
|
10.26
|
†
|
D.R. Horton, Inc. Amended and Restated Deferred Compensation Plan (51)
|
|
|
10.27
|
Grantor Trust Agreement, dated June 21, 2002, by and between the Registrant and Wachovia Bank, National Association, as Trustee (21)
|
||
|
10.28
|
Master Repurchase Agreement, dated March 27, 2008, among DHI Mortgage Company, Ltd., U.S. Bank National Association, as Administrative Agent and a Buyer, JP Morgan Chase Bank, National Association, as Syndication Agent, J.P. Morgan Securities, Inc., as Lead Arranger and Sole Bookrunner, and other parties named therein (45)
|
||
|
10.29
|
Custody Agreement, dated March 27, 2008, by and between DHI Mortgage Company, Ltd. and U.S. Bank National Association, as Administrative Agent and representative of certain Buyers (46)
|
||
|
10.30
|
First Amendment to Master Repurchase Agreement, dated March 5, 2009, among DHI Mortgage Company, Ltd., U.S. Bank National Association, as Administrative Agent, Syndication Agent and a Buyer, and other parties named therein (47)
|
||
|
10.31
|
Second Amendment to Master Repurchase Agreement, dated September 23, 2009, among DHI Mortgage Company, Ltd., U.S. Bank National Association, as Administrative Agent, Syndication Agent and a Buyer, and other parties named therein (48)
|
||
|
10.32
|
Third Amendment to Master Repurchase Agreement, dated March 4, 2010, among DHI Mortgage Company, Ltd., U.S. Bank National Association, as Administrative Agent, Syndication Agent and a Buyer (41)
|
||
|
10.33
|
Fourth Amendment to Master Repurchase Agreement, dated July 30, 2010, among DHI Mortgage Company, Ltd., U.S. Bank National Association, as Administrative Agent, Syndication Agent and a Buyer (49)
|
||
|
10.34
|
Fifth Amendment to Master Repurchase Agreement, dated March 4, 2011, among DHI Mortgage Company, Ltd., U.S. Bank National Association, as Administrative Agent, Syndication Agent and a Buyer (57)
|
||
|
10.35
|
Sixth Amendment to Master Repurchase Agreement, dated June 29, 2011, among DHI Mortgage Company, Ltd., U.S. Bank National Association, as Administrative Agent, Syndication Agent and a Buyer (2)
|
||
|
10.36
|
Seventh Amendment to Master Repurchase Agreement, dated November 29, 2011, among DHI Mortgage Company, Ltd., U.S. Bank National Association, as Administrative Agent, Syndication Agent and a Buyer (58)
|
||
|
10.37
|
Eighth Amendment to Master Repurchase Agreement, dated March 2, 2012, among DHI Mortgage Company, Ltd., U.S. Bank National Association, as Administrative Agent, Syndication Agent and a Buyer (59)
|
||
|
10.38
|
Credit Agreement, dated September 7, 2012, among the Registrant, the Guarantors named therein and RBS Securities Inc., as representative of the Underwriters named therein (62)
|
||
|
10.39
|
First Amendment to Credit Agreement, dated November 1, 2012, among the Registrant, The Royal Bank of Scotland plc, as Administrative Agent, and the Lenders named therein (64)
|
||
|
12.1
|
Statement of Computation of Ratio of Earnings to Fixed Charges (*)
|
||
|
14.1
|
Code of Ethical Conduct for the CEO, CFO and Senior Financial Officers (**)
|
||
|
21.1
|
Subsidiaries of D.R. Horton, Inc. (*)
|
||
|
23.1
|
Consent of PricewaterhouseCoopers LLP, Fort Worth, Texas (*)
|
||
|
31.1
|
Certificate of Chief Executive Officer provided pursuant to Section 302(a) of the Sarbanes-Oxley Act of 2002 (*)
|
||
|
31.2
|
Certificate of Chief Financial Officer provided pursuant to Section 302(a) of the Sarbanes-Oxley Act of 2002 (*)
|
||
|
32.1
|
Certificate provided pursuant to 18 U.S.C. Section 1350, as adopted pursuant to Section 906 of the Sarbanes-Oxley Act of 2002, by the Registrant's Chief Executive Officer (*)
|
||
|
32.2
|
Certificate provided pursuant to 18 U.S.C. Section 1350, as adopted pursuant to Section 906 of the Sarbanes-Oxley Act of 2002, by the Registrant's Chief Financial Officer (*)
|
||
105
|
101
|
The following financial statements from D.R. Horton, Inc.'s Annual Report on Form 10-K for the year ended September 30, 2012, filed on November
16, 2012, formatted in XBRL (Extensible Business Reporting Language); (i) Consolidated Balance Sheets, (ii) Consolidated Statements of Operations and Comprehensive Income, (iii) Consolidated Statements of Total Equity, (iv) Consolidated Statements of Cash Flows and (v) the Notes to Consolidated Financial Statements.
|
||
* Filed herewith.
** Posted to the Registrant's website at
www.drhorton.com
under the Investors and Corporate Governance links.
† Management contract or compensatory plan arrangement.
|
(1
|
)
|
Incorporated herein by reference from Exhibit 10.2 to the Registrant's Current Report on Form 8-K dated November 9, 2011, filed with the SEC on November 16, 2011.
|
|
|
(2
|
)
|
Incorporated herein by reference from Exhibit 10.1 to the Registrant's Current Report on Form 8-K dated June 29, 2011, filed with the SEC on July 6, 2011.
|
|
|
(3
|
)
|
Incorporated herein by reference from Exhibit 3.1 to the Registrant's Quarterly Report on Form 10-Q for the quarterly period ended December 31, 2005, filed with the SEC on February 2, 2006.
|
|
|
(4
|
)
|
Incorporated herein by reference from Exhibit 3.1 to the Registrant's Current Report on Form 8-K, dated July 30, 2009, filed with the SEC on August 5, 2009.
|
|
|
(5
|
)
|
Incorporated herein by reference from Exhibit 4.1(a) to the Registrant's Registration Statement on Form S-3 (No. 333-27521), filed with the SEC on May 21, 1997.
|
|
|
(6
|
)
|
Incorporated herein by reference from Exhibit 4.4 to the Registrant's Annual Report on Form 10-K for the fiscal year ended September 30, 1997, filed with the SEC on December 8, 1997.
|
|
|
(7
|
)
|
Incorporated herein by reference from Exhibit 4.3 to the Registrant's Quarterly Report on Form 10-Q for the quarterly period ended March 31, 1998, filed with SEC on May 14, 1998.
|
|
|
(8
|
)
|
Incorporated herein by reference from Exhibit 4.4 to the Registrant's Quarterly Report on Form 10-Q for the quarterly period ended March 31, 1998, filed with SEC on May 14, 1998.
|
|
|
(9
|
)
|
Incorporated herein by reference from Exhibit 4.7 to the Registrant's Annual Report on Form 10-K for the fiscal year ended September 30, 1998, filed with the SEC on December 10, 1998.
|
|
|
(10
|
)
|
Incorporated herein by reference from Exhibit 4.9 to the Registrant's Annual Report on Form 10-K for the fiscal year ended September 30, 1999, filed with the SEC on December 10, 1999.
|
|
|
(11
|
)
|
Incorporated herein by reference from Exhibit 4.5 to the Registrant's Quarterly Report on Form 10-Q for the quarterly period ended March 31, 2000, filed with the SEC on May 12, 2000.
|
|
|
(12
|
)
|
Incorporated herein by reference from Exhibit 4.5 to the Registrant's Quarterly Report on Form 10-Q for the quarterly period ended June 30, 2001, filed with the SEC on August 14, 2001.
|
|
|
(13
|
)
|
Incorporated herein by reference from Exhibit 10.1 to the Registrant's Annual Report on Form 10-K for the fiscal year ended September 30, 1995, filed with the SEC on November 22, 1995 (file number 1-14122); Exhibit 10.2 to the Registrant's Quarterly Report on Form 10-Q for the quarterly period ended June 30, 1998, filed with the SEC on August 6, 1998; and Exhibit 10.4 to the Registrant's Quarterly Report on Form 10-Q for the quarterly period ended March 31, 2001, filed with the SEC on May 15, 2001.
|
|
|
(14
|
)
|
Incorporated herein by reference from Exhibit 10.2 to the Registrant's Quarterly Report on Form 10-Q for the quarterly period ended June 30, 2002, filed with the SEC on August 13, 2002.
|
|
|
(15
|
)
|
Incorporated herein by reference from Exhibit 10.3 to the Registrant's Quarterly Report on Form 10-Q for the quarterly period ended June 30, 2002, filed with the SEC on August 13, 2002.
|
|
|
(16
|
)
|
Incorporated herein by reference from Exhibit 10.3 to the Registrant's Registration Statement on Form S-1 (Registration No. 3-81856), filed with the SEC on July 22, 1994.
|
|
|
(17
|
)
|
Incorporated herein by reference from the Registrant's Transitional Report on Form 10-K for the period from January 1, 1993 to September 30, 1993, filed with the SEC on December 28, 1993 (file number 1-14122).
|
|
|
(18
|
)
|
Incorporated herein by reference from the Registrant's Transitional Report on Form 10-K for the period from January 1, 1993 to September 30, 1993, filed with the SEC on December 28, 1993 (file number 1-14122).
|
|
|
(19
|
)
|
Incorporated herein by reference from Exhibit 10.4 to the Registrant's Quarterly Report on Form 10-Q for the quarterly period ended December 31, 2007, filed with the SEC on February 7, 2008.
|
|
106
|
(20
|
)
|
Incorporated herein by reference from Exhibit 4.13 to the Registrant's Quarterly Report on Form 10-Q for the quarterly period ended March 31, 2002, filed with the SEC on May 15, 2002.
|
|
|
(21
|
)
|
Incorporated herein by reference from Exhibit 10.34 to the Registrant's Annual Report on Form 10-K for the fiscal year ended September 30, 2002, filed with the SEC on December 13, 2002.
|
|
|
(22
|
)
|
Incorporated herein by reference from Exhibit 4.1 to the Registrant's Current Report on Form 8-K, dated April 11, 2003, filed with the SEC on April 17, 2003.
|
|
|
(23
|
)
|
Incorporated herein by reference from Exhibit 4.1 to the Registrant's Current Report on Form 8-K, dated June 18, 2003, filed with the SEC on June 24, 2003.
|
|
|
(24
|
)
|
Incorporated herein by reference from Exhibit 4.1 to the Registrant's Current Report on Form 8-K dated May 13, 2009, filed with the SEC on May 14, 2009.
|
|
|
(25
|
)
|
Incorporated herein by reference from Exhibit 10.1 (2008 Form) to the Registrant's Current Report on Form 8-K dated February 11, 2008, filed with the SEC on February 15, 2008; and Exhibit 10.4 (2009 Form) to the Registrant's Current Report on Form 8-K dated November 20, 2008, filed with the SEC on November 26, 2008.
|
|
|
(26
|
)
|
Incorporated herein by reference from Exhibit 4.1 to the Registrant's Current Report on Form 8-K, dated July 6, 2004, filed with the SEC on July 9, 2004.
|
|
|
(27
|
)
|
Incorporated herein by reference from Exhibit 4.1 to the Registrant's Current Report on Form 8-K, dated September 14, 2004, filed with the SEC on September 17, 2004.
|
|
|
(28
|
)
|
Incorporated herein by reference from Exhibit 4.1 to the Registrant's Current Report on Form 8-K, dated December 8, 2004, filed with the SEC on December 14, 2004.
|
|
|
(29
|
)
|
Incorporated herein by reference from Exhibit 4.1 to the Registrant's Current Report on Form 8-K, dated February 4, 2005, filed with the SEC on February 10, 2005.
|
|
|
(30
|
)
|
Incorporated herein by reference from Exhibit 4.1 to the Registrant's Current Report on Form 8-K, dated June 29, 2005, filed with the SEC on July 6, 2005.
|
|
|
(31
|
)
|
Incorporated herein by reference from Exhibit 10.1 to the Registrant's Current Report on Form 8-K, dated November 8, 2012, filed with the SEC on November 15, 2012.
|
|
|
(32
|
)
|
Incorporated herein by reference from Exhibit 10.2 to the Registrant's Current Report on Form 8-K, dated November 8, 2012, filed with the SEC on November 15, 2012.
|
|
|
(33
|
)
|
Incorporated herein by reference from Exhibit 10.3 to the Registrant's Current Report on Form 8-K, dated November 8, 2012, filed with the SEC on November 15, 2012.
|
|
|
(34
|
)
|
Incorporated herein by reference from Exhibit 4.1 to the Registrant's Quarterly Report on Form 10-Q for the quarterly period ended December 31, 2005, filed with the SEC on February 2, 2006.
|
|
|
(35
|
)
|
Incorporated herein by reference from Exhibit 10.6 to the Registrant's Quarterly Report on Form 10-Q for the quarterly period ended December 31, 2005, filed with the SEC on February 2, 2006.
|
|
|
(36
|
)
|
Incorporated herein by reference from Exhibit 4.2 to the Registrant's Current Report on Form 8-K, dated April 11, 2006, filed with the SEC on April 13, 2006.
|
|
|
(37
|
)
|
Incorporated herein by reference from Exhibit 10.2 to the Registrant's Quarterly Report on Form 10-Q for the quarterly period ended March 31, 2006, filed with the SEC on May 8, 2006.
|
|
|
(38
|
)
|
Incorporated herein by reference from Exhibit 10.3 to the Registrant's Quarterly Report on Form 10-Q for the quarterly period ended March 31, 2006, filed with the SEC on May 8, 2006.
|
|
|
(39
|
)
|
Incorporated herein by reference from Exhibit 4.2 to the Registrant's Registration Statement on Form S-3, filed with the SEC on June 13, 2006.
|
|
|
(40
|
)
|
Incorporated herein by reference from Exhibit 10.2 to the Registrant's Current Report on Form 8-K dated February 11, 2008, filed with the SEC on February 15, 2008.
|
|
|
(41
|
)
|
Incorporated herein by reference from Exhibit 10.1 to the Registrant's Current Report on Form 8-K dated March 4, 2010, filed with the SEC on March 5, 2010.
|
|
|
(42
|
)
|
Incorporated herein by reference from Exhibit 10.3 to the Registrant's Current Report on Form 8-K dated February 11, 2008, filed with the SEC on February 15, 2008.
|
|
|
(43
|
)
|
Incorporated herein by reference from Exhibit 10.1 to the Registrant's Current Report on Form 8-K dated November 9, 2011, filed with the SEC on November 16, 2011.
|
|
|
(44
|
)
|
Incorporated herein by reference from Exhibit 10.5 to the Registrant's Quarterly Report on Form 10-Q for the quarterly period ended December 31, 2007, filed with the SEC on February 7, 2008.
|
|
107
|
(45
|
)
|
Incorporated herein by reference from Exhibit 10.1 to the Registrant's Current Report on Form 8-K dated March 28, 2008, filed with the SEC on April 3, 2008.
|
|
|
(46
|
)
|
Incorporated herein by reference from Exhibit 10.2 to the Registrant's Current Report on Form 8-K dated March 28, 2008, filed with the SEC on April 3, 2008.
|
|
|
(47
|
)
|
Incorporated herein by reference from Exhibit 10.1 to the Registrant's Current Report on Form 8-K dated March 5, 2009, filed with the SEC on March 10, 2009.
|
|
|
(48
|
)
|
Incorporated herein by reference from Exhibit 10.1 to the Registrant's Current Report on Form 8-K dated September 23, 2009, filed with the SEC on September 24, 2009.
|
|
|
(49
|
)
|
Incorporated herein by reference from Exhibit 10.1 to the Registrant's Quarterly Report on Form 10-Q for the quarterly period ended June 30, 2010, filed with the SEC on August 3, 2010.
|
|
|
(50
|
)
|
Incorporated herein by reference from Exhibit 10.2 to the Registrant's Current Report on Form 8-K dated December 10, 2008, filed with the SEC on December 16, 2008.
|
|
|
(51
|
)
|
Incorporated herein by reference from Exhibit 10.1 to the Registrant's Current Report on Form 8-K dated December 10, 2008, filed with the SEC on December 16, 2008.
|
|
|
(52
|
)
|
Incorporated herein by reference from Exhibit 10.4 to the Registrant's Current Report on Form 8-K dated November 9, 2011, filed with the SEC on November 16, 2011.
|
|
|
(53
|
)
|
Incorporated herein by reference from Exhibit 10.5 to the Registrant's Current Report on Form 8-K dated November 9, 2011, filed with the SEC on November 16, 2011.
|
|
|
(54
|
)
|
Incorporated herein by reference from Exhibit 10.1 to the Registrant's Current Report on Form 8-K dated January 20, 2011, filed with the SEC on January 26, 2011.
|
|
|
(55
|
)
|
Incorporated herein by reference from Exhibit 10.1 to the Registrant's Current Report on Form 8-K dated September 30, 2010, filed with the SEC on October 6, 2010.
|
|
|
(56
|
)
|
Incorporated herein by reference from Exhibit 10.2 to the Registrant's Current Report on Form 8-K dated September 30, 2010, filed with the SEC on October 6, 2010.
|
|
|
(57
|
)
|
Incorporated herein by reference from Exhibit 10.1 to the Registrant's Current Report on Form 8-K dated March 4, 2011, filed with the SEC on March 9, 2011.
|
|
|
(58
|
)
|
Incorporated herein by reference from Exhibit 10.1 to the Registrant's Current Report on Form 8-K dated November 29, 2011, filed with the SEC on December 1, 2011.
|
|
|
(59
|
)
|
Incorporated herein by reference from Exhibit 10.1 to the Registrant's Current Report on Form 8-K dated March 2, 2012, filed with the SEC on March 8, 2012.
|
|
|
(60
|
)
|
Incorporated herein by reference from Exhibit 4.1 to the Registrant's Current Report on Form 8-K dated May 1, 2012, filed with the SEC on May 4, 2012.
|
|
|
(61
|
)
|
Incorporated herein by reference from Exhibit 4.2 to the Registrant's Current Report on Form 8-K dated May 1, 2012, filed with the SEC on May 4, 2012.
|
|
|
(62
|
)
|
Incorporated herein by reference from Exhibit 10.1 to the Registrant's Current Report on Form 8-K dated September 7, 2012, filed with the SEC on September 10, 2012.
|
|
|
(63
|
)
|
Incorporated herein by reference from Exhibit 4.1 to the Registrant's Current Report on Form 8-K dated September 14, 2012, filed with the SEC on September 17, 2012.
|
|
|
(64
|
)
|
Incorporated herein by reference from Exhibit 10.1 to the Registrant's Current Report on Form 8-K dated November 1, 2012, filed with the SEC on November 5, 2012.
|
|
108
SIGNATURES
Pursuant to the requirements of Section 13 or 15(d) of the Securities Exchange Act of 1934, the registrant has duly caused this report to be signed on its behalf by the undersigned, thereunto duly authorized.
|
D.R. Horton, Inc.
|
|||
|
Date:
|
November 16, 2012
|
By:
/s/ Donald J. Tomnitz
|
|
|
Donald J. Tomnitz,
Vice Chairman, Chief Executive Officer
and President
|
|||
Pursuant to the requirements of the Securities Exchange Act of 1934, this report has been signed below by the following persons on behalf of the registrant and in the capacities and on the dates indicated.
|
Signature
|
Title
|
Date
|
||||
|
/s/ Donald R. Horton
|
Chairman of the Board
|
November 16, 2012
|
||||
|
Donald R. Horton
|
||||||
|
|
|
|||||
|
/s/ Donald J. Tomnitz
|
Vice Chairman, Chief Executive Officer, President, and Director
(Principal Executive Officer)
|
November 16, 2012
|
||||
|
Donald J. Tomnitz
|
||||||
|
|
|
|||||
|
/s/ Bill W. Wheat
|
Chief Financial Officer and Executive Vice President (Principal Financial Officer and Principal Accounting Officer)
|
November 16, 2012
|
||||
|
Bill W. Wheat
|
||||||
|
|
|
|||||
|
/s/ Bradley S. Anderson
|
Director
|
November 16, 2012
|
||||
|
Bradley S. Anderson
|
||||||
|
|
|
|||||
|
/s/ Michael R. Buchanan
|
Director
|
November 16, 2012
|
||||
|
Michael R. Buchanan
|
||||||
|
|
|
|||||
|
/s/ Michael W. Hewatt
|
Director
|
November 16, 2012
|
||||
|
Michael W. Hewatt
|
||||||
|
|
|
|||||
|
/s/ Bob G. Scott
|
Director
|
November 16, 2012
|
||||
|
Bob G. Scott
|
||||||
109
TABLE OF CONTENTS
Part IItem 1. BusinessItem 1A. Risk FactorsItem 1B. Unresolved Staff CommentsItem 2. PropertiesItem 3. Legal ProceedingsItem 4. Mine Safety DisclosuresPart IIItem 5. Market For Registrant S Common Equity, Related Stockholder Matters and Issuer Purchases Of Equity SecuritiesItem 6. Selected Financial DataItem 7. Management S Discussion and Analysis Of Financial Condition and Results Of OperationsItem 7A. Quantitative and Qualitative Disclosures About Market RiskItem 8. Financial Statements and Supplementary DataItem 9. Changes in and Disagreements with Accountants on Accounting and Financial DisclosureItem 9A. Controls and ProceduresItem 9B. Other InformationPart IIIItem 10. Directors, Executive Officers and Corporate GovernanceItem 11. Executive CompensationItem 12. Security Ownership Of Certain Beneficial Owners and Management and Related Stockholder MattersItem 13. Certain Relationships and Related Transactions, and Director IndependenceItem 14. Principal Accountant Fees and ServicesPart IVItem 15. Exhibits and Financial Statement Schedules