DHI GROUP, INC.
10-Ks and 10-Qs
|
|
|
|
|
|
|
|
|
|
|
|
|
|
|
|
|
|
|
|
|
|
|
|
|
|
|
|
|
|
|
|
|
|
|
|
|
|
|
|
|
|
|
|
|
|
|
|
|
|
|
|
|
|
|
|
|
|
|
|
|
|
UNITED STATES
SECURITIES AND EXCHANGE COMMISSION
WASHINGTON, D.C. 20549
______________________________________________
FORM 10-K
______________________________________________
(Mark One)
|
R
|
ANNUAL REPORT PURSUANT TO SECTION 13 OR 15(d) OF THE SECURITIES EXCHANGE ACT OF 1934
|
For the fiscal year ended
December 31, 2015
______________________________________________
OR
|
£
|
TRANSITION PERIOD PURSUANT TO SECTION 13 OR 15(d) OF THE SECURITIES EXCHANGE ACT OF 1934
|
FOR THE TRANSITION PERIOD FROM TO
Commission File Number: 001-33584
______________________________________________
DHI Group, Inc.
(Exact name of Registrant as specified in its Charter)
______________________________________________
|
Delaware
|
|
20-3179218
|
|
(State or other jurisdiction of
incorporation or organization)
|
|
(I.R.S. Employer
Identification No.)
|
|
1040 Avenue of the Americas, 8
th
Floor
|
|
|
|
New York, New York
|
|
10018
|
|
(Address of principal executive offices)
|
|
(Zip Code)
|
(212) 725-6550
(Registrant’s telephone number, including area code)
Securities registered pursuant to Section 12(b) of the Act:
______________________________________________
|
Title of each class
|
|
Name of exchange on which registered
|
|
Common Stock, par value $0.01 per share
|
|
New York Stock Exchange
|
Securities registered pursuant to Section 12(g) of the Act:
None
Indicate by check mark if the registrant is a well-known seasoned issuer, as defined in Rule 405 of the Securities Act. Yes
£
No
R
Indicate by check mark if the registrant is not required to file reports pursuant to Section 13 or Section 15(d) of the Act. Yes
£
No
R
Indicate by check mark whether the registrant (1) has filed all reports required to be filed by Section 13 or 15(d) of the Securities Exchange Act of 1934 during the preceding 12 months (or for such shorter period that the registrant was required to file such reports), and (2) has been subject to such filing requirements for the past 90 days. Yes
R
No
£
Indicate by check mark whether the registrant has submitted electronically and posted on its corporate Web site, if any, every Interactive Data File required to be submitted and posted pursuant to Rule 405 of Regulation S-T (§232.405 of this chapter) during the preceding 12 months (or for such shorter period that the registrant was required to submit and post such files). Yes
R
No
£
Indicate by check mark if disclosure of delinquent filers pursuant to Item 405 of Regulation S-K is not contained herein, and will not be contained, to the best of registrant’s knowledge, in definitive proxy or information statements incorporated by reference in Part III of this Form 10-K or any amendment to this Form 10-K.
£
Indicate by check mark whether the registrant is a large accelerated filer, an accelerated filer, a non-accelerated filer or a smaller reporting company. See definition of “large accelerated filer,” “accelerated filer” and “smaller reporting company in Rule 12b-2 of the Exchange Act.
Large accelerated filer
£
Accelerated filer
R
Non-accelerated filer
£
Smaller Reporting Company
£
Indicate by check mark whether the registrant is a shell company (as defined in Rule 12b-2 of the Exchange Act). Yes
£
No
R
The aggregate market value of common stock held by non-affiliates of the registrant was approximately
$396,000,000
as of June 30, 2015, the last business day of the registrant’s second fiscal quarter of 2015.
As of February 5, 2016, there were
51,959,055
shares of the registrant’s common stock, par value $.01 per share, outstanding.
DOCUMENTS INCORPORATED BY REFERENCE
Part III incorporates information from certain portions of the registrant’s definitive proxy statement to be filed with the Securities and Exchange Commission within 120 days after the fiscal year end of
December 31, 2015
.
DHI GROUP, INC.
TABLE OF CONTENTS
|
|
|
|
Page
|
|
PART I.
|
|||
|
Item 1.
|
|||
|
Item 1A.
|
|||
|
Item 1B.
|
|||
|
Item 2.
|
|||
|
Item 3.
|
|||
|
Item 4.
|
|||
|
PART II.
|
|||
|
Item 5.
|
|||
|
Item 6.
|
|||
|
Item 7.
|
|||
|
Item 7A.
|
|||
|
Item 8.
|
|||
|
Item 9.
|
|||
|
Item 9A.
|
|||
|
Item 9B.
|
|||
|
PART III.
|
|||
|
Item 10.
|
|||
|
Item 11.
|
|||
|
Item 12.
|
|||
|
Item 13.
|
|||
|
Item 14.
|
|||
|
PART IV.
|
|||
|
Item 15.
|
|||
1
NOTE CONCERNING FORWARD-LOOKING STATEMENTS
Information contained herein contains forward-looking statements. You should not place undue reliance on those statements because they are subject to numerous uncertainties and factors relating to our operations and business environment, all of which are difficult to predict and many of which are beyond our control. Forward-looking statements include information concerning our possible or assumed future results of operations, and descriptions of our business strategy. These statements often include words such as “may,” “will,” “should,” “believe,” “expect,” “anticipate,” “intend,” “plan,” “estimate” or similar expressions. These statements are based on assumptions that we have made in light of our experience in the industry as well as our perceptions of historical trends, current conditions, expected future developments and other factors we believe are appropriate under the circumstances. Although we believe that these forward-looking statements are based on reasonable assumptions, you should be aware that many factors could affect our actual financial results or results of operations and could cause actual results to differ materially from those in the forward-looking statements. These factors include, but are not limited to:
|
•
|
increases in the unemployment rate, cyclicality or downturns in the United States or worldwide economy or the industries we serve, labor shortages, or job shortages;
|
|
•
|
concerns regarding the global economic climate and European debt crisis and market perceptions concerning the instability of the Euro;
|
|
•
|
competition from existing and future competitors;
|
|
•
|
changes in the recruiting and career services business and technologies, and the development of new products and services;
|
|
•
|
decreases or delays in business-to-business technology advertising spending could harm our ability to generate advertising revenue;
|
|
•
|
failure to develop and maintain our reputation and brand recognition;
|
|
•
|
failure to increase or maintain the number of customers who purchase recruitment packages;
|
|
•
|
failure to attract qualified professionals or grow the number of qualified professionals who use our websites;
|
|
•
|
failure to timely and efficiently scale and adapt our existing technology and network infrastructure;
|
|
•
|
capacity constraints, systems failures or breaches of network security;
|
|
•
|
compliance with laws and regulations concerning collection, storage and use of professionals’ professional and personal information;
|
|
•
|
our indebtedness;
|
|
•
|
inability to borrow funds under our Credit Agreement (as defined below) or refinance our debt;
|
|
•
|
results of operations fluctuate on a quarterly and annual basis;
|
|
•
|
periods of operating and net losses and history of bankruptcy;
|
|
•
|
covenants in our Credit Agreement;
|
|
•
|
inability to successfully integrate recent and future acquisitions or identify and consummate future acquisitions;
|
|
•
|
strain on our resources due to future growth;
|
|
•
|
misappropriation or misuse of our intellectual property, claims against us for intellectual property infringement or the failure to enforce our ownership or use of intellectual property;
|
|
•
|
compliance with certain corporate governance requirements and costs incurred in connection with being a public company;
|
|
•
|
compliance with the continued listing standards of the New York Stock Exchange (the “NYSE”);
|
|
•
|
volatility in our stock price;
|
|
•
|
failure to maintain internal controls over financial reporting;
|
|
•
|
loss of key executives and technical personnel;
|
|
•
|
U.S. and foreign government regulation of the Internet and taxation;
|
|
•
|
changes in foreign currency exchange rates;
|
|
•
|
failure to realize the full potential of our network;
|
|
•
|
decrease in user engagement;
|
|
•
|
failure to halt the operations of websites that aggregate our data, as well as data from other companies;
|
|
•
|
failure of our businesses to attract, retain and engage users;
|
|
•
|
our foreign operations;
|
|
•
|
inability to expand into international markets;
|
|
•
|
unfavorable decisions in proceedings related to future tax assessments;
|
|
•
|
taxation risks in various jurisdictions for past or future sales;
|
|
•
|
write-offs of goodwill and intangible assets;
|
|
•
|
volatility in and direction of oil and related commodity prices; and
|
|
•
|
significant downturn not immediately reflected in our operating results.
|
2
NON-GAAP FINANCIAL MEASURES
Information contained herein contains certain non-GAAP financial measures. These measures are not in accordance with, or an alternative for, generally accepted accounting principles in the United States (“GAAP”). Such measures presented herein include adjusted earnings before interest, taxes, depreciation, amortization, non-cash stock based compensation expense, and other income or expense (“Adjusted EBITDA”), Net Income Excluding Impairment Charge, Diluted Earnings per Share Excluding Impairment Charge, Adjusted Revenues, Adjusted EBITDA Margin, Adjusted Revenues Excluding Slashdot Media, Adjusted EBITDA Excluding Slashdot Media, Adjusted EBITDA Margin Excluding Slashdot Media, Revenue Growth in Constant Currency, and Free Cash Flow. See Item 7 “Management’s Discussion and Analysis of Financial Condition and Results of Operations” for definitions of these measures.
3
|
Item 1.
|
Business
|
Information Availability
Our Annual Report on Form 10-K, Quarterly Reports on Form 10-Q, Current Reports on Form 8-K, proxy and information statements and other material information concerning us are available free of charge on the Investors page of our website at www.dhigroupinc.com. Our reports filed with the SEC are also available at the SEC’s Public Reference Room at 100 F Street, NE, Washington, DC 20549, by calling 1-800-SEC-0330, or by visiting http://www.sec.gov.
Introduction and Summary
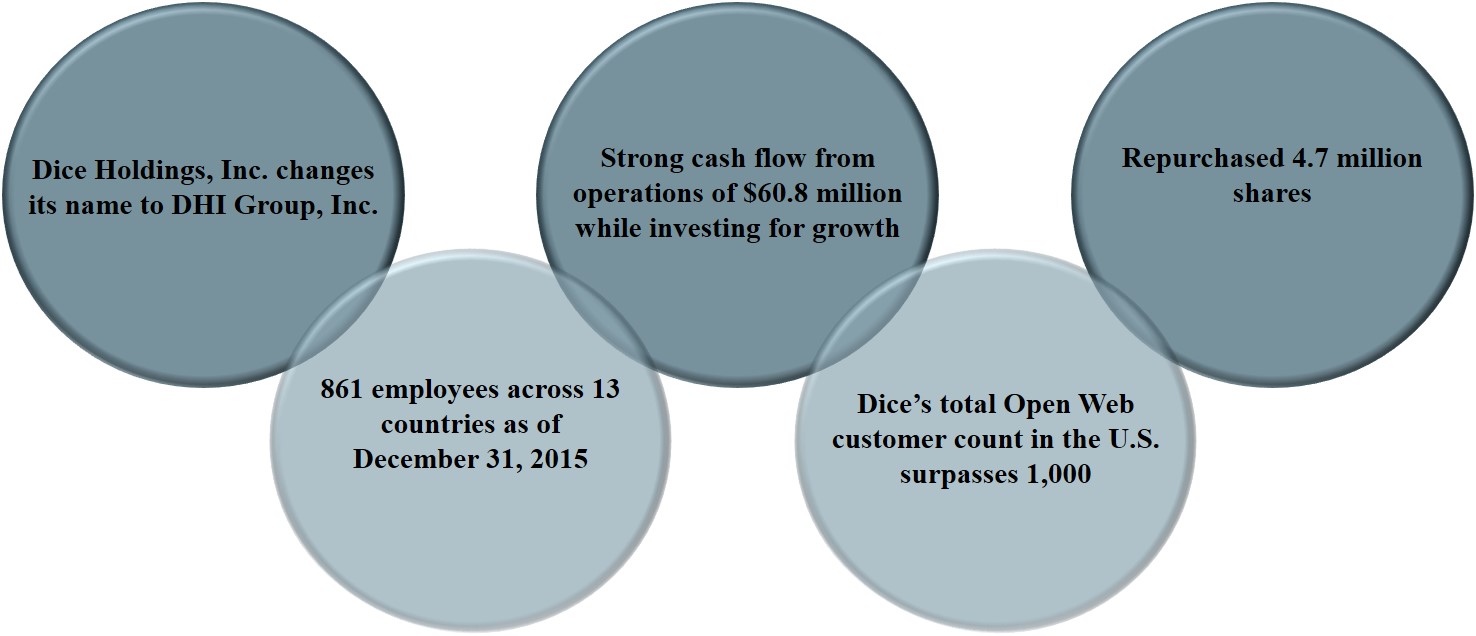
This section provides an overview of DHI Group, Inc. (the “Company” or “DHI”). 2015 includes a non-cash impairment charge of approximately $34.8 million ($34.2 million, net of income taxes) and $0.67 diluted loss per share, net of income taxes, related to the partial write-down of Energy segment goodwill. Excluding this charge, net income for 2015 totaled $23.3 million or $0.46 diluted earnings per share.
|
FY 2015
|
FY 2014
|
YoY % Change
|
||||||||||
|
Revenues
|
$
|
259,769
|
|
$
|
262,615
|
|
(1
|
)%
|
*
|
|||
|
Operating income
|
$
|
6,355
|
|
$
|
46,604
|
|
(86
|
)%
|
||||
|
Income before income taxes
|
$
|
3,041
|
|
$
|
42,849
|
|
(93
|
)%
|
||||
|
Net income (loss)
|
$
|
(10,968
|
)
|
$
|
27,612
|
|
(140
|
)%
|
||||
|
Diluted earnings (loss) per share
|
$
|
(0.21
|
)
|
$
|
0.51
|
|
(141
|
)%
|
||||
|
Net cash provided by operating activities
|
$
|
60,809
|
|
$
|
55,543
|
|
9
|
%
|
||||
|
Adjusted Revenues
|
$
|
259,769
|
|
$
|
265,502
|
|
(2
|
)%
|
||||
|
Adjusted EBITDA
|
$
|
74,550
|
|
$
|
84,343
|
|
(12
|
)%
|
||||
|
Adjusted EBITDA Margin
|
29
|
%
|
32
|
%
|
n.m.
|
|
||||||
|
Adjusted Revenues, excluding Slashdot Media
|
$
|
244,950
|
|
$
|
247,262
|
|
(1
|
)%
|
*
|
|||
|
Adjusted EBITDA, excluding Slashdot Media
|
$
|
72,887
|
|
$
|
78,954
|
|
(8
|
)%
|
||||
|
Adjusted EBITDA margin, excluding Slashdot Media
|
30
|
%
|
32
|
%
|
n.m.
|
|
||||||
|
* Excluding the negative impact of currency translation, revenues increased 1%. Adjusted Revenues, excluding Slashdot Media, increased 1%, year-over-year on a constant currency basis.
|
||||||||||||
For a description of these non-GAAP measures and reasons why management believes they provide useful information to investors, please see “Management’s Discussion and Analysis of Financial Condition and Results of Operations-Liquidity and Capital Resources-Non-GAAP Measures” located elsewhere in this report.
4
2015 Highlights
2015 Progress on Key Strategic Goals: Path of Innovation, Integration and Evolution
In 2015, we made significant progress against our key strategic goals. Our path of innovation, integration and evolution continues, and many of our new and emerging products and services are gaining traction. Across all of our businesses we’ve made great strides in elevating our product, our people and our processes, which are leading to increased engagement with our customers and professionals, greater affinity with our brands, and deeper client relationships.
Company Profile
DHI was incorporated in Delaware on June 28, 2005. DHI is a leading provider of data, insights and employment connections through our specialized services for professional communities including technology and security clearance, financial services, energy, healthcare and hospitality. Each of our services is tailored for the specific industry or profession it serves. We focus on delivering three key value propositions:
|
•
|
Providing the most efficient solution for recruiters and employers;
|
|
•
|
Delivering the most relevant career content in our verticals; and
|
|
•
|
Utilizing data and analytics to deliver specialized insights.
|
5
The majority of our revenues today are generated through the sale of recruitment packages, which allow customers to post jobs and source candidates through our resume databases and, in the case of Dice, Dice Europe and eFinancialCareers to utilize our Open Web service for an additional fee. Recruitment packages are typically provided through contractual arrangements with annual, monthly or interim terms.
Our Products and Services
We help organizations find the best talent, and we help professionals find the best jobs and advance their careers. We do this through a number of products, including:
|
•
|
Resume databases.
Each of our brands provides powerful, detailed searches of a large number of candidate resumes. Showing customers the right talent makes their recruiting efforts more efficient.
|
|
•
|
Job postings.
Because our job collections are focused on specific verticals, professionals searching for jobs can easily find jobs that are most relevant to them. In turn, the applications received by our customers are more likely to be relevant and qualified compared to applications received from generalist sites. Thus, showing professionals the right job postings benefits both the talent and the recruiting organization.
|
|
•
|
Open Web.
Our Open Web product searches over 190 social and professional sources to create an aggregated profile of a candidate’s professional experience, contributions, history and capabilities (as well as their passions and interests). This allows our customers to build broader pools of talent from across the web, gives them deeper insights into talent they discover, and allows them to engage prospective candidates with a differentiated message.
|
|
•
|
Content and data.
Each of our services provides tailored content to help professionals manage their careers and provide employers insight into recruiting strategies and trends. In addition, some of our brands offer data products specific to their industries.
|
Industry and Skill Focused Brands
We offer our talent acquisition and career development products and tools through the following key brands:
|
Service
|
Yrs. in Operation
|
Specialized Focus
|
Primary Source of Revenues
|
|
Dice
|
25
|
Technology and engineering in the U.S.
|
Recruitment packages¹
|
|
Dice Europe
|
13
|
Technology and engineering in the U.K., Germany, Belgium and the Netherlands
|
Job postings and advertising
|
|
ClearanceJobs
|
13
|
Security-cleared professionals
|
Recruitment packages¹
|
|
Targeted Job Fairs
|
27
|
Technology, energy and security cleared professionals
|
Career fairs and open houses
|
|
eFinancialCareers
|
15
|
Financial services
|
Recruitment packages¹
and job postings
|
|
Rigzone
|
17
|
Oil and gas
|
Recruitment packages¹
and advertising
|
|
BioSpace
|
30
|
Biotechnology
|
Job postings and advertising
|
|
Hcareers
|
18
|
Hospitality
|
Job postings
|
|
Health eCareers
|
20
|
Healthcare
|
Job postings
|
|
¹ Recruitment packages are a combination of job posting slots and access to our searchable database of candidates (in the case of Dice and Dice Europe, this includes our Open Web Service). Job posting slots allow the customer to post up to a specified number of jobs at a single time.
|
|||
Dice
has been a go-to destination for technology and engineering talent in the United States for the past 25 years. The job postings available on Dice, from both technology and non-technology companies across many industries, include positions for software engineers, big data professionals, systems administrators, database specialists, project managers, and a variety of other technology and engineering professionals. Dice had approximately 77,000 job postings as of December 31, 2015. During 2015, Dice in North America had on average 2.3 million monthly unique visitors.
Customers can purchase recruitment packages, job postings or advertisements. Approximately 87% of Dice revenue was derived from recruitment packages in 2015. Recruitment packages offer our customers the ability to access the candidate resume database, post up to a specified number of jobs at a single time and utilize our Open Web product for an additional fee. Customers are incentivized to purchase our recruitment packages on an annual basis.
6
Professionals can post their resumes, search jobs and access our career-related content, news and tools. Dice recently launched Skill Center, a tool that uses data aggregated from across the web to show skill trends, giving professionals insights into potential skills gaps and development areas.
Dice entered the European market in 2013 through the acquisition of The IT Job Board, a leading technology career site for the UK and Continental Europe. In 2015, we rebranded The IT Job Board to Dice. Our Open Web service is available to Dice Europe customers for an additional fee. In Europe, Dice had approximately 19,000 job postings as of December 31, 2015. During 2015, Dice Europe had on average 375,000 monthly unique visitors.
ClearanceJobs
is a leading Internet-based career network dedicated to matching security-cleared professionals with the best hiring companies searching for employees. Authorized U.S. government contractors, federal agencies, national laboratories and universities utilize The Cleared Network to quickly and easily find candidates with specific, active security clearance requirements to fill open jobs in a range of disciplines. The majority of candidates with resumes in our database have high-level security clearance. ClearanceJobs had approximately 11,500 job postings as of December 31, 2015. During 2015, ClearanceJobs had on average 305,000 monthly unique visitors.
eFinancialCareers
is the world’s leading financial services careers website, operating websites in multiple markets in four languages mainly across the United Kingdom, Continental Europe, Asia, Australia, the Middle East and North America. Professionals from across many sectors of the financial services industry, including asset management, risk, investment banking, and information technology, use eFinancialCareers to advance their careers. eFinancialCareers extends its global footprint beyond its own sites through job posting distribution agreements with more than 40 finance and business websites around the world, including well-known publications and organizations. Recruitment package customers may purchase Open Web for an additional fee. eFinancialCareers had approximately 9,300 job postings as of December 31, 2015. During 2015, eFinancialCareers had on average 1.5 million monthly unique visitors.
Rigzone
is a leading website dedicated to delivering online content, data, and career services in the oil and gas industry in North America, Europe and Asia Pacific. Oil and gas companies, as well as companies that serve the energy industry, use Rigzone to find talent for roles such as petroleum engineers, sales professionals with energy industry expertise and skilled tradesmen. In addition to recruitment packages and advertising, Rigzone provides a number of data services products including Riglogix, RigVantage and RigOutlook. OilCareers, a leading recruitment site for oil and gas professionals in Europe, was integrated into Rigzone in March 2015. Rigzone had approximately 3,000 job postings as of December 31, 2015. During 2015, Rigzone had on average 1.4 million monthly unique visitors.
Hcareers
is the number one source for hospitality jobs across North America and is the largest provider of job postings for the hotel, restaurant, food service, casino and assisted living industries. Hospitality professionals like general managers, sales directors, and executive chefs use Hcareers to advance their careers. As of December 31, 2015, Hcareers had approximately 19,000 job postings. During 2015, Hcareers had on average 1.1 million monthly unique visitors.
BioSpace
is a leading resource for biotechnology careers, news and resources and has helped recruitment, communication and discovery among business and scientific leaders within the life sciences. In addition to recruitment packages, customers can purchase BioSpace’s HotBeds campaigns, a unique branding and advertising product to assist regional clusters of companies with high demands for biotech talent. BioSpace had approximately 1,200 job postings as of December 31, 2015. During 2015, BioSpace had on average 400,000 monthly unique visitors.
Health eCareers
is a leading website dedicated to providing career services across many disciplines and specialties within the healthcare industry, including physicians, nurses, and a broad spectrum of allied health professions. Health eCareers powers the career centers for over 100 healthcare associations, extending its reach to professionals across the healthcare industry. Health eCareers had approximately 14,500 job postings as of December 31, 2015. During 2015, Health eCareers had on average 495,000 monthly unique visitors.
BrightMatter
was formed in October 2015 as a new division focusing on a number of next-generation recruitment products and services that will be applicable across DHI brands. This division brought together the operations of WorkDigital and getTalent as well as other product initiatives. WorkDigital is the technology group that developed the underlying technology for our Open Web products, and it is currently developing new applications of that technology, including the FreshUp service as well as workforce analytics products for our talent acquisition brands. getTalent is a Software as a Service (“SaaS”) talent sourcing management and engagement tool. getTalent expands the overall market opportunity for DHI brands beyond traditional Talent Acquisition products and services.
7
Our Industry
We primarily operate in the talent discovery and acquisition segment of the broader market for human capital management services through vertically-oriented career sites. We believe that the overall demand for talent acquisition and career development products and services has significant long-term growth potential. Over the next decade, the aging labor force of the United States is expected to lead to a labor supply-demand imbalance as baby-boomers retire. We believe that international economies show similar trends, with an aging labor force in Europe and shortages of skilled professionals to meet the demand of developing economies in Asia.
We also believe that certain industries that employ highly-skilled and highly-paid professionals will experience particularly strong demand for effective recruiting solutions due to the scarcity of such professionals. For example, as of December 2015, the seasonally unadjusted U.S. unemployment rate was 2.6% for computer-related occupations, 2.6% in the finance sector, and 3.2% in the healthcare sector, as compared to the overall national average of 5.0%, seasonally adjusted. Historically, the unemployment rate for college graduates has been lower than the unemployment rate for the U.S. overall. As of December 2015, the seasonally adjusted unemployment rate for college graduates was 2.3%.
We believe that there are five major trends that will continue to shape demand for talent acquisition services:
|
•
|
Greater competition for professional talent
.
The candidate-employer relationship has changed, with the balance of power shifting towards the candidates. The length of time to fill positions is an indicator of the availability of qualified talent in the labor market. Our proprietary indicator of time to fill an open position, the DHI-DFH Vacancy Duration Measure, indicates that the mean time to fill a position was 27.6 working days in October 2015, up from 22.1 in October 2012. In addition, our December 2015 Hiring Survey found that 47% of hiring managers cannot fill spots due to salary requirements.
|
|
•
|
Sourcing of talent will become more mainstream.
Companies are increasingly engaging in ongoing sourcing to build robust candidate pools for both “just in time” candidates as well as future hiring needs. This means recruiters must proactively identify and build relationships with professionals ahead of the creation of a specific job opening. Our December 2015 Hiring Survey shows that nearly three-quarters (74%) of companies say sourcing and building a bench of talent is more important today than a year ago. Complementing this trend is an increased interest in sourcing analytics, recruiting marketing, and employment branding.
|
|
•
|
Continued professional interest in career brands specific to industry and skills.
Our services focus on domains or industries that require specialized skills and knowledge and, thus, customized content, profiles and search parameters. In addition, the professionals in our verticals often share a sense of personal identity and community that goes beyond the confines of their careers. We believe that both specialized skills and the sense of personal identity and community lead professionals in our verticals to prefer specialized career brands over generalist ones.
|
|
•
|
Talent attraction and retention becoming more of a strategic priority for companies.
According to the Aberdeen Group, in 2014, 79% of companies identify their main talent acquisition pressure as a shortage of critical skills available in the labor pool, up from 55% in 2012. Similarly, the
PWC 2015 US CEO Survey
found that 34% of U.S. CEOs are ‘extremely concerned’ about the availability of key skills as a threat to their organizations’ growth prospects (an additional 44% are ‘somewhat concerned’). In this environment where top talent is hard to find, organizations are increasingly prioritizing retention of talent. According to Deloitte’s
Global Human Capital Trends 2015
, 66% of human resources respondents reported that they are updating their engagement and retention strategies.
|
|
•
|
Increased
use of data and analytics in human capital management and increased need for insights.
As many companies prove the power of analytics in marketing and other business domains, organizations are seeking to gain a competitive advantage by applying data-driven insights to improve their hiring, retention and leadership capabilities. According to Deloitte’s
Global Human Capital Trends 2015
, 75% of surveyed companies believe that using people analytics is ‘important’.
|
In this environment, we believe there is an opportunity for career management and talent acquisition tools that leverage the common interests, goals and skills of select professional communities. We believe that a focus on professional communities allows organizations to more efficiently identify talent, with more complete data and insights about that talent.
Our Value Proposition
We have become a leading provider of data, insights and employment connections by focusing on professional communities that share common interests, goals and skills. We believe that this focus has allowed us to build valuable talent pools with the most complete and relevant information. In turn, that means organizations can get to that talent faster, more efficiently and with better data and insights about that talent. By providing a large number of employment opportunities and original and community-shared career-related content for professionals, we encourage the use of our websites and continue to
8
attract professionals to our services. We believe these factors have helped us to achieve a critical mass of both customers and professionals, contributing to the attractiveness and efficiency of our online marketplaces.
Benefits we provide to Professionals
Relevant employment connections
.
When professionals post their resumes or apply for jobs on our websites, they can make valuable connections with organizations who prize their skills and expertise. Professionals can avoid having to “sort through the clutter” on generalist career sites, and get the most out of their time by using our more focused services.
Skills/industry-specific career management tools, information and insights
.
We provide professionals with targeted and relevant career development tools, content and news. For example, Dice and ClearanceJobs provide professionals with market and salary information and local market trends. In addition, Dice’s new Skill Center tool provides data-driven insights on current skills trends by analyzing skills data collected from across the web. eFinancialCareers provides industry-specialized online career content, as well as print and online career guides targeted to college and graduate students. The Rigzone services provide energy industry news from around the globe, detailed salary information, and data services related to the worldwide offshore rig fleet. We believe our career development services and tools provide professionals with the insights they need to propel their careers forward, and thus increase the engagement of professionals with our sites.
Benefits we provide to our Customers
Large pools of qualified and hard-to-reach professionals
. We seek to improve the efficiency of the recruiting process for our customers by providing quick and easy access to large and fresh pools of highly qualified and hard-to-reach professionals. Because the communities of professionals who visit our websites are highly-skilled and specialized within specific industries, we believe our customers who post jobs receive applications from candidates who are better qualified for the positions, and that they receive fewer irrelevant applications than when using generalist sites. In addition, since our resume data and resume search functions are highly tailored by specialty, we believe that our customers can identify talent using our resume databases more quickly and easily than by using broader services.
Relevant information on prospective candidates
. We believe that the specialized nature of our job posting and resume search products makes them inherently more relevant and efficient for recruiting. In addition, our new Open Web product creates an aggregated profile of a professional’s experience, contributions, and capabilities as well as their passions and interests. Using all of these products together gives our customers the most complete view of a prospective candidate, and allows them to not only identify the best talent but also tailor their recruiting approach to each individual.
Our Strategic Goals
Our goal is to be the leading provider of data, insights and connections through our specialized services for select professional communities. Our primary objective is to maximize the long-term potential of our websites and services. We continue to pursue our goals by pursuing the following strategies:
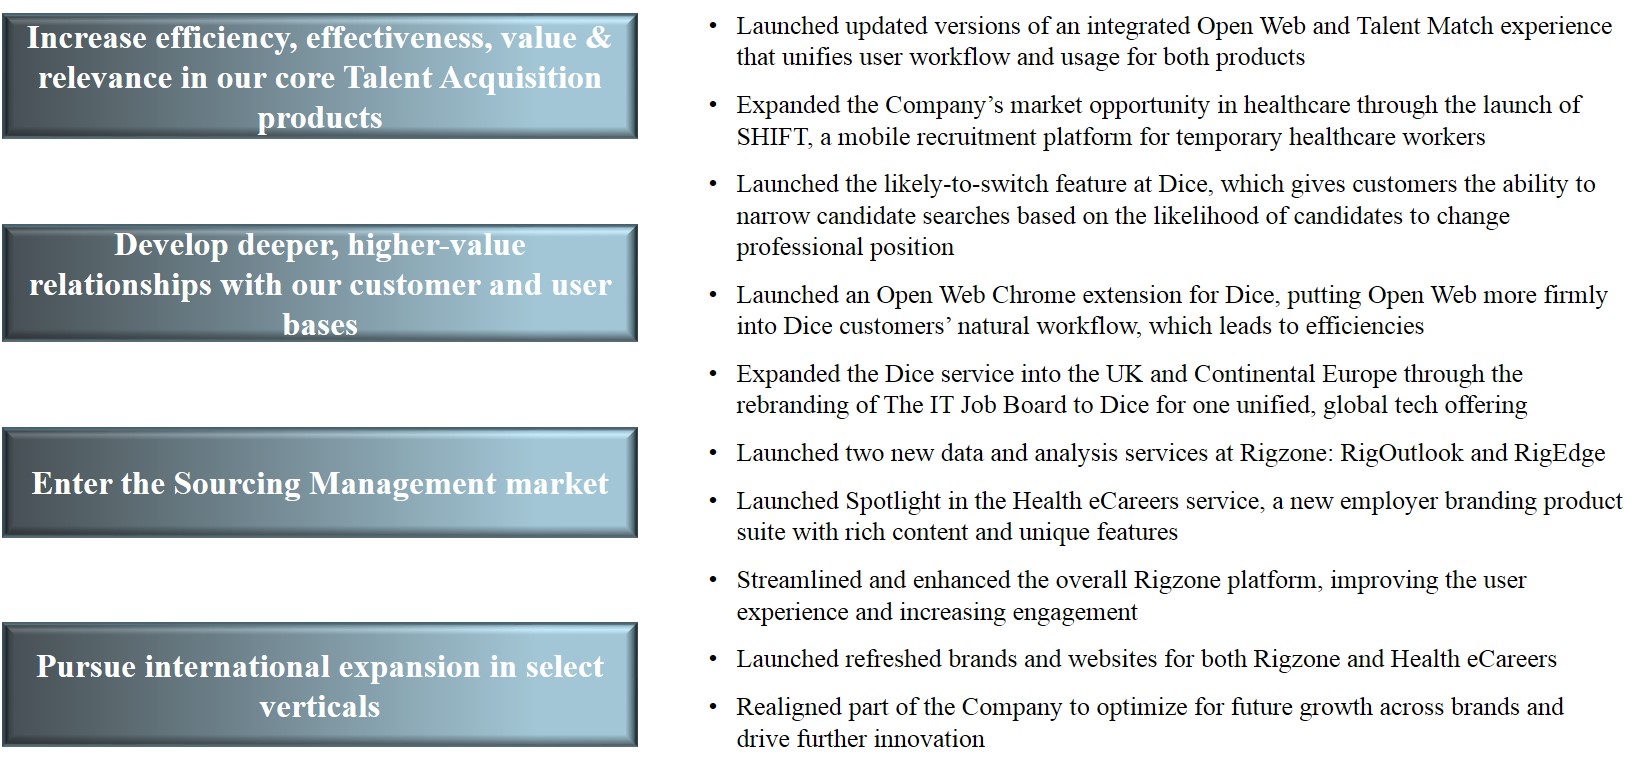
Increase the Efficiency, Effectiveness, Value and Relevance in our Core Talent Acquisition Products.
In the dynamic and competitive environment in which we operate, we must continuously enhance the value of our marketplaces through both audience growth and product innovation.
|
•
|
Reach new customers and professionals through continued branding, direct marketing and direct sales activities;
|
|
•
|
Enhance, expand and develop additional content, community and career-management features across our websites to increase engagement among professionals; and
|
|
•
|
Build new features and greater efficiencies into our online services through ongoing innovation.
|
Develop Deeper, Higher-value Relationships with our Customer and User Bases.
We believe our existing installed base of clients and users offer substantial opportunity for growth and, in an effort to leverage this opportunity for growth, will focus on selling additional products to existing clients and fostering client success to drive higher retention. In addition, we believe there is opportunity to foster repeat visitation, improved loyalty and deeper engagement with the professionals who already use our services.
|
•
|
Enhance current product offerings with more actionable data and greater depth of analysis;
|
|
•
|
Deepen our relationships with and expand the services - such as Open Web, Sourcing Concierge and Branding products - we sell to our existing customers;
|
|
•
|
Offer new products and services that make recruiters more effective; and
|
9
|
•
|
Help professionals throughout their career lifecycle by creating new products and services geared towards personalized career management.
|
Enter the Sourcing Management Market with a Unique Combination of Acquisition, Sourcing and Management, and Pipelining.
We believe we can add more value to the sourcing and recruiting process by extending our offerings so that they allow organizations not only to discover and access professional talent, but also interact and maintain relationships with prospective candidates over time.
|
•
|
Plan to launch in 2016, the next generation version of getTalent, a strategic talent pipelining, engagement and analytics SaaS solution that was in beta testing throughout 2015; and
|
|
•
|
Launch versions of Open Web in other verticals.
|
Pursue International Expansion in Select Verticals.
We believe that recruiting is increasingly becoming global, and we intend to continue to evaluate and selectively pursue international opportunities to better serve our existing customers and to further expand our business outside of the United States.
Marketing and Sales
We focus our long-term marketing efforts on growing the number of professionals who visit and engage with our websites, which we believe increases the attractiveness of our websites to our customers. We use a combination of direct marketing, branding and communications initiatives to increase our brand awareness, traffic, new resumes posted and applications to job postings. We primarily engage in search engine marketing, online advertising, participation in industry events, social media marketing and content marketing. Many of our brands use strategic alliances with relevant publishers, trade associations and industry groups to increase reach and traffic. Many of our brands have also invested in broader awareness campaigns that include outdoor advertising in select cities where competition for their respective specializations is high.
Our customer marketing efforts are primarily focused on lead generation activities, such as email and direct mail campaigns and participation in industry events. We also use marketing communications, such as media relations, social media, and thought leadership content, to enhance brand awareness and client relationships.
We sell our products primarily through our direct sales force. We have a number of direct sales teams organized by brand, market segment, and geography. Our field sales groups target Fortune 1000 companies, large staffing and recruiting firms and other large and mid-size businesses. Our in-house sales teams focus on generating new business from recruiters and small- and mid-size companies, renewing customer contracts, increasing the service levels customers purchase and servicing the needs of our largest clients. As of December 31, 2015, we employed approximately 190 sales personnel in the United States and approximately 80 in the rest of the world. In addition to our internal sales organization, we also use ad networks to help generate ad sales.
We also maintain teams of account managers and customer support specialists who work to ensure customers get the most from our products and services by providing training and assistance. In addition, our customer support departments perform some compliance functions, such as reviewing the websites for false or inaccurate job postings.
Customers
We currently serve a diversified customer base consisting of over 16,000 customers in total. No one customer accounted for more than 1% of our revenues in 2015. Our customers include small, mid-sized and large direct employers, staffing companies, recruiting agencies, consulting firms and marketing departments of companies. As of December 31, 2015, notable customers of the Tech & Clearance segment included AT&T, Adecco, Salesforce, Cisco, Apple, Oracle, IBM, Kforce, NCI, Manpower, Microsoft, Charles Schwab, Starbucks, Robert Half, Yahoo, Symantec, and Hewlett Packard. Notable customers of the Finance segment included Robert Half, Moody’s Investors Service, JP Morgan Chase, Bloomberg, Michael Page International, UBS, Morgan Stanley and Standard Chartered Bank. Notable customers of the Energy segment included Schlumberger, Petronas, Saudi Aramco, Shell, Wood Group, Inpex, China Petroleum and Chevron. Notable customers of the Healthcare segment included Mayo Clinic, Vanderbilt University Medical Center and St Jude Children’s Research Hospital. Notable customers of the Hospitality segment included Hilton, Hyatt, Marriott and Four Seasons. See item 7 for a description of the segments.
10
Technology
We use a variety of technologies to support our websites. Each of our systems is designed so that it can be scaled by provisioning additional resources, adding additional hardware and increasing network capacity. Whenever possible, we host our applications on clustered, high-availability hardware and cloud platforms. Our applications and data connections are monitored 24/7 for performance, responsiveness and stability.
Currently, our primary technology operations facilities are in co-location data centers in limited access, temperature-controlled environments with emergency power generation capability and service from multiple telecommunications providers, as well as with top-tier cloud providers. Beginning in 2016, we will begin moving our technology operations to a cloud-hosted infrastructure model, which will provide greater business agility and flexibility, improved global delivery capabilities, and improved disaster recovery protection across all services.
In the current operational model, we maintain backup systems for website operations within our geographically separate recovery data center. We replicate website data at various times throughout the day from the production co-location facility to the recovery data center. In the event of a loss of a data center, we have business resumption technology and offsite data storage capabilities in place. Additionally, we have robust firewalls and switchgear to provide network security, and have used substantial expert assistance in their configuration and testing.
Competition
The market for talent acquisition services is highly competitive with multiple online and offline competitors. With the evolution of the online recruiting model, there has been an increasing need to provide ease-of-use and relevance to professionals, as well as an efficient and cost-effective recruitment method for direct employers, recruiters and staffing companies. Additionally, further technological advancements have made it easier for new competitors to emerge with minimal barriers to entry, and advertisers have many alternatives available to reach their target audiences. Our ability to maintain our existing customer base and generate new customers depends to a significant degree on the quality of our candidate bases and audiences, the quality of our services, our ability to enhance our websites and the underlying technology of our websites to meet the needs of a rapidly-evolving marketplace, our pricing strategy and ability to introduce value-added products and services, and our reputation among our customers and potential customers, who are increasingly-sophisticated and demanding. Our competitors include:
|
•
|
social and professional networking sites, such as LinkedIn, Facebook, Twitter and Google;
|
|
•
|
generalist job boards, some of which have substantially greater resources and brand recognition than we do, such as CareerBuilder, Monster, StepStone, and Seek which, unlike specialized job boards, permit customers to enter into a single contract to find professionals across multiple occupational categories and attempt to fill all of their hiring needs through a single website;
|
|
•
|
aggregators and distributors of job postings and profiles, including SimplyHired, Indeed (owned by Recruit), Talent Bin (owned by Monster Worldwide), Entelo, Gild, ZipRecruiter, Google and Craigslist;
|
|
•
|
career-focused community sites such as Glassdoor;
|
|
•
|
newspaper and magazine publishers, national and regional advertising agencies, executive search firms and search and selection firms that carry classified advertising, many of whom have developed, begun developing or acquired new media capabilities, such as recruitment websites, or have partnered with generalist job boards;
|
|
•
|
specialized services focused specifically on the industries we service, such as FT.com, Oilandgasjobsearch.com (owned by CareerBuilder), Doximity, Upwork, JobServe and Stack Overflow;
|
|
•
|
talent relationship management software providers such as Avature and SmashFly;
|
|
•
|
new and emerging competitors with new business models and products;
|
|
•
|
our customers, who seek to recruit candidates directly by using their own resources, including corporate websites; and
|
|
•
|
general business sites and print publications, as well as technology news and information community sites, such as news.google.com, Digg.com and Reddit.com.
|
Intellectual Property
We seek to protect our intellectual property through a combination of service marks, trademarks, copyrights and other methods of restricting disclosure of our proprietary or confidential information. We have one or more patent applications pending for some of our current services. As we continue to develop and improve our technology, patents may become a more significant part of our intellectual property in the foreseeable future. We generally enter into confidentiality agreements with our employees, consultants and vendors. We also seek to control access to and distribution of our technology, documentation and other proprietary information.
11
We generally pursue the registration of the material service marks we own in the United States and internationally, as applicable. We own a number of registered, applied for and/or unregistered trademarks and service marks that we use in connection with our businesses. Our trademarks and registered trademarks in the United States and other countries include DICE, CLEARANCEJOBS.COM, RIGZONE.COM, EFINANCIALCAREERS, HEALTHECAREERS NETWORK, and HCAREERS.COM. Registrations for trademarks may be maintained indefinitely, as long as the trademark owner continues to use and police the trademarks and timely renews registrations with the applicable governmental office. Although we generally pursue the registration of our material service marks and other material intellectual property we own, where applicable, we have trademarks and/or service marks that have not been registered in the United States and/or other jurisdictions. We have not registered the copyrights in the content of our websites, and do not intend to register such copyrights.
The steps we have taken to protect our copyrights, trademarks, service marks and other intellectual property may not be adequate, and third parties could infringe, misappropriate or misuse our intellectual property. If this were to occur, it could harm our reputation and affect our competitive position. See Item 1A. “Risk Factors-Misappropriation or misuse of our intellectual property could harm our reputation, affect our competitive position and cost us money.”
Strategic Investments
DHI has made investments through the following acquisitions during the past five years:
|
Oil Careers Ltd.
|
onTargetjobs, Inc.
|
JobBoard Enterprises Ltd.
|
WorkDigital Ltd.
|
|
|
Date Acquired
|
March 2014
|
November 2013
|
July 2013
|
October 2012
|
|
Description
|
Leading recruitment site for oil and gas professionals in Europe
|
Leading vertical recruiting service in healthcare and hospitality
|
Online recruitment company in the technology industry and the corporate owner of The IT Job Board
|
Technology company focused on the recruitment industry
|
|
Brands Included
|
OilCareers.com
|
Health eCareers, BioSpace and Hcareers
|
The IT Job Board
|
WorkDigital
|
|
Strategic Rationale
|
Expansion of Rigzone’s presence in non-U.S. markets
|
Expansion into healthcare and hospitality verticals
|
Scale Dice into international markets
|
Technology platform and foundation for Open Web
|
|
Purchase Price
|
$26.1 mm in cash at closing and $0.3 mm paid for working capital
|
$46.3 mm net of cash acquired plus payment of $0.6 mm for working capital
|
£8.0 mm net of cash acquired plus deferred payments made totaling £3.0 mm
|
$10.0 mm in cash plus deferred payments made totaling an additional $10.0 mm
|
Regulation and Legislation
User Privacy
We collect, store and use a variety of information about both professionals and customers on our website properties. Within the websites, the information that is collected, stored and used has been provided by the professionals or customers with the intent of making it publicly available. We do not ask professionals or customers to supply social security numbers. Our business data is separated from website operations by a variety of security layers including network segmentation, physical and logical access controls, firewalls, and many industry-accepted, best-practice information security controls.
We post our privacy policies on our websites so that our users can access and understand the terms and conditions applicable to the collection, storage and use of information collected from users. Our privacy policies also disclose the types of information we gather, how we use it and how a user can correct or change their information. Our privacy policies also explain the circumstances under which we share this information and with whom. Professionals who register for our websites have the option of indicating specific areas of interest in which they are willing to receive offers via email or postal mail. These offers contain content created either by us or our third-party partners.
To protect confidential information and to comply with our obligations to our users, we impose constraints on our customers to whom we provide user data, which are consistent with our commitments to our users. Additionally, when we provide lists to third parties, including to our advertiser customers, it is under contractual terms that are consistent with our obligations to our users and with applicable laws and regulations.
12
U.S. and Foreign Government Regulation
We are subject to a number of government regulations, both domestic and foreign, that regulate our products and online service offerings, including content, copyright infringement, user privacy, advertising and promotional activities, taxation, access charges, liability for third-party activities and jurisdiction. In addition, federal, state, local and foreign governmental organizations have enacted and also are considering, and may consider in the future, other legislative and regulatory proposals that would regulate the Internet. Areas of potential regulation include, but are not limited to, libel, electronic contracting, pricing, quality of products and services and intellectual property ownership.
There are a number of U.S. and foreign laws and regulations that affect companies conducting business online. Certain laws regulate commercial electronic messages. Such laws frequently provide a right on the part of the recipient to request the sender to stop sending messages, and establish penalties for the sending of email messages that are not compliant with such laws, including messages that are intended to deceive the recipient as to source or content or that do not provide an electronic method of informing the sender of the recipient’s decision not to receive further commercial emails.
We are subject to domestic and foreign laws and regulations regarding privacy and protection of data. Our privacy policies and terms of use agreements describe our practices concerning the use, storage, transmission and disclosure of user data. Any failure by us to comply with our privacy policies or terms of use agreements, or privacy-related laws and regulations, could result in proceedings against us by governmental authorities or others, which could harm our business. The interpretation of these privacy and data protection laws and various regulators’ approach to their enforcement, as well as our products and services, continue to evolve over time. We face the risk that these laws may be interpreted and applied in conflicting ways in different jurisdictions or in a manner that is not consistent with our current data protection practices, or that new and unclear laws will be enacted. Complying with these varying domestic and foreign requirements could cause us to incur additional costs and change our business practices. Further, any failure by us to adequately protect our users’ privacy and data could result in a loss of confidence in our products and services and, ultimately, in a loss of customers, which could have an adverse effect on our business.
The application of laws and regulations affecting online business to our products and services is often unclear, and these laws and how various jurisdictions interpret these laws continue to evolve. Compliance with these laws may be expensive and could harm our business. Any failure by the Company to comply with these laws and regulations could result in actions against us by governmental authorities or other entities, which could harm our business, including governmental or court orders that we cease certain activities.
See Item 1A. “Risk Factors-Our business is subject to U.S. and foreign government regulation of the Internet and taxation, which may have a material adverse effect on our business.”
Employees
As of December 31, 2015, we had
861
employees. Our employees are not represented by any union and are not the subject of a collective bargaining agreement. We believe that we have a good relationship with our employees.
|
Item 1A.
|
Risk Factors
|
We may be adversely affected by cyclicality, volatility or an extended downturn in the United States or worldwide economy, or in or related to the industries we serve.
Our revenues are generated primarily from servicing customers seeking to hire qualified professionals in the technology, healthcare, hospitality and finance sectors and the energy industry. Demand for these professionals tends to be tied to economic and business cycles. Increases in the unemployment rate, specifically in the technology, healthcare, finance and other vertical industries we serve, cyclicality or an extended downturn in the economy could cause our revenues to decline. For example, during the recession in 2001, employers reduced or postponed their recruiting efforts, including their recruitment of professionals in certain of the vertical industries we serve, such as technology. The 2001 economic recession, coupled with the substantial indebtedness incurred by our predecessor, Dice Inc., resulted in Dice Inc. filing for Chapter 11 protection in 2003. As of December 2015, the seasonally unadjusted U.S. unemployment rate was 2.6% for computer-related occupations, 2.6% in the finance sector, and 3.2% in the healthcare sector, as compared to the overall national average of 5.0%, seasonally adjusted. The increase in unemployment and decrease in recruitment activity experienced during 2008 and 2009 resulted in decreased demand for our services. During 2009, we experienced a 29% decline in revenues compared to 2008. If the economic environment experienced during 2008 and 2009 returns, our ability to generate revenue may be adversely affected.
13
In addition, the general level of economic activity in the regions and industries in which we operate significantly affects demand for our services. When economic activity slows, many companies hire fewer employees. Therefore, our operating results, business and financial condition could be significantly harmed by an extended economic downturn or future downturns, especially in regions or industries where our operations are heavily concentrated. Further, we may face increased pricing pressures during such periods as customers seek to use lower cost or fee services. Additionally, the labor market and certain of the industries we serve have historically experienced short term cyclicality. It is difficult to estimate the total number of passive or active job seekers or available job openings in the United States or abroad during any given period. If there is a labor shortage, qualified professionals may be less likely to seek our services, which could cause our customers to look elsewhere for attractive employees. Such labor shortages would require us to intensify our marketing efforts toward professionals so that professionals who post their resumes on our websites remain relevant to our customers, which would increase our expenses. Furthermore, if there is a shortage of available job openings in a particular region or sector we serve, the number of job postings on our websites could decrease, causing our business to be adversely affected. For example, the continued decline of oil prices has led to decreased demand for energy professionals worldwide. Oil prices have reached decade lows in 2016 and there continues to be downward pricing pressure. This decline in demand has significantly decreased the sales of our energy industry job postings and the use of related services. As a result, we recorded a $34.8 million impairment of goodwill at our Energy segment for the fiscal year ended December 31, 2015. The continued decline of oil prices and any future declines in demand for energy professionals could continue to adversely affect our financial condition and results of operations.
Any economic downturn or recession in the United States or abroad for an extended period of time could have a material adverse effect on our business, financial condition, results of operations and liquidity. Based on historical trends, improvements in labor markets and the need for our services generally lag behind overall economic improvements. Additionally, there has historically been a lag from the time customers begin to increase purchases of our services and the impact to our revenues due to the recognition of revenue occurring over the length of the contract, which can be several months to a year.
Volatility in global financial markets may also limit our ability to access the capital markets at a time when we would like, or need, to raise capital, which could have an impact on our ability to react to changing economic and business conditions. Accordingly, if the economy does not fully recover or worsens, our business, results of operations and financial condition could be materially and adversely affected.
Concerns regarding the global economic climate and European debt crisis and market perceptions concerning the instability of the Euro could adversely impact our business.
Concerns persist regarding the global economic climate, the debt burden of certain Eurozone countries and their ability to meet future financial obligations, the overall stability of the euro and the suitability of the euro as a single currency given the diverse economic and political circumstances in individual Eurozone countries. These concerns, or market perceptions concerning these and related issues, could adversely affect demand for our services in the European market and our business, results of operations, financial condition and liquidity.
We operate in a highly competitive developing market and we may be unable to compete successfully against existing and future competitors.
The market for career services is highly competitive and barriers to entry in the market are relatively low. For example, there are tens of thousands of job boards currently operating on the Internet, and new competitors may emerge. We do not own any patented technology that would preclude or inhibit competitors from entering the recruiting and career development services market. We compete with other companies that direct all or portions of their websites toward certain segments or sub- segments of the industries we serve. We compete with generalist job boards, some of which have substantially greater resources and brand recognition than we do, such as CareerBuilder and Monster.com, which, unlike specialist job boards, permit customers to enter into a single contract to find professionals across multiple occupational categories and attempt to fill all of their hiring needs through a single website, as well as job boards focused specifically on the industries we service, such as FT.com, JobServe and Oilandgasjobsearch.com. We also compete with newspaper and magazine publishers, national and regional advertising agencies, executive search firms and search and selection firms that carry classified advertising, many of whom have developed, begun developing or acquired new media capabilities, such as recruitment websites, or have recently partnered with generalist job boards. In addition, we face competition from aggregators of classified advertising, including SimplyHired, Indeed, Google, and Craigslist. Social and professional networking sites, such as LinkedIn, Facebook, Twitter and Google compete with us in providing professional services. Our Open Web service competes with Entelo, Gild and Talent Bin. We also compete with new and emerging competitors with new business models and products that customers are more willing to trial during periods when talent is scarce. In addition, many of our customers also seek to recruit candidates directly by using their own resources, including corporate websites. Existing or future competitors may develop or offer services that are comparable or superior to ours at a lower price, which could cause our customers to stop using our services or put pressure on
14
us to decrease our prices. If our current or potential customers, or the qualified professionals who use our websites, choose to use these websites rather than ours, demand for our services could decline and our revenues could be reduced. Additionally, job postings and resume posting in the career services industry are not marketed exclusively through any single channel, and accordingly, our competition could aggregate a set of postings similar to ours. Our inability to compete successfully against present or future competitors could materially adversely affect our business, results of operations, financial condition and liquidity.
We must adapt our business model to keep pace with rapid changes in the recruiting and career services business, including rapidly changing technologies and the development of new products and services.
Providing online recruiting and career development services is a rapidly evolving business, and we will not be successful if our business model does not keep pace with new trends and developments. The adoption of recruiting and job seeking, particularly among those who have historically relied on traditional recruiting methods, requires acceptance of a new way of conducting business, exchanging information and applying for jobs. If we are unable to adapt our business model to keep pace with changes in the recruiting business, or if we are unable to continue to demonstrate the value of our online services to our customers, our business, results of operations, financial condition and liquidity could be materially adversely affected. Our success is also dependent on our ability to adapt to rapidly changing technology and to make investments to develop new products and services. Accordingly, to maintain our competitive position and our revenue base, we must continually modernize and improve the features, reliability and functionality of our service offerings and related products in response to our competitors. Future technological advances in the career services industry may result in the availability of new recruiting and career development offerings. Some of our competitors have longer operating histories, larger client bases, longer relationships with clients, greater brand or name recognition, or significantly greater financial, technical, marketing and public relations resources than we do. As a result, they may be in a position to respond more quickly to new or emerging technologies and changes in customer requirements, and to develop and promote their products and services more effectively than we can. We may not be able to adapt to such technological changes or offer new products on a timely or cost-effective basis or establish or maintain competitive positions. If we are unable to develop and introduce new products and services, or enhancements to existing products and services, in a timely and successful manner, our business, results of operations, financial condition and liquidity could be materially and adversely affected.
Trends that could have a critical impact on our success include:
|
•
|
rapidly changing technology in online recruiting;
|
|
•
|
evolving industry standards relating to online recruiting;
|
|
•
|
developments and changes relating to the Internet and mobile devices;
|
|
•
|
evolving government regulations;
|
|
•
|
competing products and services that offer increased functionality;
|
|
•
|
changes in requirements for customers and professionals; and
|
|
•
|
privacy protection concerning data available and transactions conducted over the Internet.
|
Many individuals are using devices other than personal computers to access the Internet. If users of these devices do not widely adopt solutions we develop for these devices, our business could be adversely affected.
The number of people who access the Internet through devices other than personal computers, including smart phones and handheld tablets or computers, has increased dramatically in the past few years and is projected to continue to increase. If we are unable to develop mobile solutions to meet the needs of our users, our business could suffer. Additionally, as new devices and new platforms are continually being released, it is difficult to predict the problems we may encounter in developing versions of our solutions for use on these alternative devices, and we may need to devote significant resources to the creation, support, and maintenance of such devices.
If we fail to develop and maintain our reputation and brand recognition our business could be adversely affected.
We believe that establishing and maintaining the identity of our key brands, such as Dice, eFinancialCareers, Rigzone, Health eCareers, Hcareers and ClearanceJobs, is critical in attracting and maintaining the number of professionals and customers using our services, and that the importance of brand recognition will increase due to the growing number of Internet services similar to ours and relatively low barriers to entry. Promotion and enhancement of our brands will depend largely on our success in continuing to provide high quality recruiting and career development services. If users do not perceive our existing career and recruiting services to be of high quality, or if we introduce new services or enter into new business ventures that are not favorably received by users, the uniqueness of our brands could be diminished and accordingly the attractiveness of our websites to professionals and customers could be reduced. We may also find it necessary to increase substantially our financial commitment to creating and maintaining a distinct brand loyalty among users. If we cannot provide high quality career services, fail to protect, promote and maintain our brands or incur excessive expenses in an attempt to improve our career
15
services or promote or maintain our brands, our business, results of operations, financial condition and liquidity could be materially adversely affected.
Our business is largely based on customers who purchase monthly or annual recruitment packages. Any failure to increase or maintain the number of customers who purchase recruitment packages could adversely impact our revenues.
Our customers typically include recruiters, staffing firms, consulting firms and direct hiring companies. Customers can choose to purchase recruitment packages, classified postings or advertisements. Most of our revenues are generated by the fees we earn from our customers who purchase monthly or long-term recruitment packages. Our growth depends on our ability to retain our existing monthly and annual recruitment package customers and to increase the number of customers who purchase recruitment packages. Any of our customers may decide not to continue to use our services in favor of alternate services, lack of need, or because of budgetary constraints or other reasons. We cannot assure you that we will be successful in continuing to attract new customers or retaining existing customers or that our future sales efforts in general will be effective. If our existing customers choose not to use our services, decrease their use of our services, or change from being recruitment package customers to purchasing individual classified postings, our services, job postings and resumes posted on our websites could be reduced, search activity on our websites could decline, the usefulness of our services to customers could be diminished, and we could experience declining revenues and/or incur significant expenses.
If we fail to attract qualified professionals to our websites or grow the number of qualified professionals who use our websites, our revenues could decline.
The value of our websites to our customers is dependent on our ability to continuously attract professionals with the experience, education and skill-set our customers seek. For example, the professionals who post their resumes on Dice.com are highly educated, with approximately 79% having a bachelor’s degree or higher, as of January 2016. Our online surveys indicate that over 70% of professionals who use Dice.com have more than five years of experience, over half have greater than 10 years of experience, and the majority are currently employed. To grow our businesses, we must continue to convince qualified professionals that our services will assist them in finding employment, so that customers will choose to use our services to find employees. We do not know the extent to which we have penetrated the market of qualified professionals in the industries we serve or the extent to which we will be able to grow the number of qualified professionals who use our websites. If we are unable to increase the number of professionals using our websites, or if the professionals who use our websites are viewed as unattractive by our customers, our customers could seek to list jobs and search for professionals elsewhere, which could cause our revenues to decline.
We may not timely and effectively scale and adapt our existing technology and network infrastructure to ensure that our websites are accessible within an acceptable load time.
A key element to our continued growth is the ability of our users (whom we define as anyone who visits our website, regardless of whether or not they are a customer), enterprises and professional organizations in all geographies to access our website within acceptable load times. We call this “website performance.” We have experienced, and may in the future experience, website disruptions, outages and other performance problems due to a variety of factors, including infrastructure changes, human or software errors, capacity constraints due to an overwhelming number of users accessing our website simultaneously, and denial of service or fraud or security attacks. In some instances, we may not be able to identify the cause or causes of these website performance problems within an acceptable period of time. It may become increasingly difficult to maintain and improve the performance of our websites, especially during peak usage times and as our solutions become more complex and our user traffic increases. If our websites are unavailable when users attempt to access them or do not load as quickly as they expect, users may seek other websites to obtain the information for which they are looking, and may not return to our websites as often in the future, or at all. This would negatively impact our ability to attract customers, enterprises and professional organizations and increase engagement on our websites. We expect to continue to make significant investments to maintain and improve website performance and to enable rapid releases of new features and products. To the extent that we do not effectively address capacity constraints, upgrade our systems as needed and continually develop our technology and network architecture to accommodate actual and anticipated changes in technology, our business and operating results may be harmed.
Capacity constraints, systems failures or breaches of our network security could materially and adversely affect our business.
We derive almost all of our revenues from the purchase of recruitment products and services and employment advertising offered on our websites. As a result, our operations depend on our ability to maintain and protect our computer systems, most of which are located in redundant and independent systems and with cloud providers. Any system failure, including network, software or hardware failure that causes interruption or an increase in response time of our services, could substantially decrease usage of our services and could reduce the attractiveness of our services to both our customers and professionals. An
16
increase in the volume of queries conducted through our services could strain the capacity of the software or hardware we employ. This could lead to slower response times or system failures and prevent users from accessing our websites for extended periods of time, thereby decreasing usage and attractiveness of our services. Our operations are dependent in part on our ability to protect our operating systems against:
|
•
|
physical damage from acts of God;
|
|
•
|
terrorist attacks or other acts of war;
|
|
•
|
power loss;
|
|
•
|
telecommunications failures;
|
|
•
|
network, hardware or software failures;
|
|
•
|
physical and electronic break-ins;
|
|
•
|
hacker attacks;
|
|
•
|
computer viruses or worms; and
|
|
•
|
similar events.
|
Although we maintain insurance against fires, floods and general business interruptions, the amount of coverage may not be adequate in any particular case. Furthermore, the occurrence of any of these events could result in interruptions, delays or cessations in service to users of our services, which could materially impair or prohibit our ability to provide our services and significantly impact our business.
Additionally, overall Internet usage could decline if any well-publicized compromise of security occurs or if there is a perceived lack of security of personal and corporate information that is stored within our systems to facilitate hiring and recruitment business processes. “Hacking” involves efforts to gain unauthorized access to information or systems or to cause intentional malfunctions or loss or corruption of data, software, hardware or other computer equipment and online job boards, in particular, have been targeted by hackers who seek to gain unauthorized access to job seeker and customer data for purposes of implementing “phishing” or other schemes. Despite our implementation of firewalls, switchgear and other network security measures, our websites, servers, databases and other systems may be vulnerable to computer hackers, physical or electronic break-ins, sabotage, computer viruses, worms and similar disruptions from unauthorized tampering with our computer systems. Our systems, like the systems of many other websites, have been targeted in the past in cyber attacks and hacks and may continue to be subject to such attacks. Because the techniques used to obtain unauthorized access, disable or degrade service, or sabotage systems change frequently, such techniques often are not recognized until launched against a target and may originate from less regulated and remote areas around the world, we may be unable to proactively address these techniques or to implement adequate preventative measures. We will continue to review and enhance our computer systems to try to prevent unauthorized and unlawful intrusions, but in the future it is possible that we may not be able to prevent all intrusions and such intrusions could result in our network security or computer systems being compromised and possibly result in the misappropriation or corruption of proprietary or personal information or cause disruptions in our services. We might be required to expend significant capital and resources to protect against, remediate or alleviate problems caused by such intrusions. We may also not have a timely remedy against a hacker who is able to penetrate our network security. Our networks could also be affected by computer viruses or other similar disruptive problems and we could inadvertently transmit viruses across our networks to our users or other third parties. Our hardware and back-up systems could fail causing our services to be interrupted. Any of these occurrences, and negative publicity arising from any such occurrences, could harm our business or give rise to a cause of action against us. Our general business interruption insurance policies have limitations with respect to covering interruptions caused by computer viruses or hackers. We have not added specific insurance coverage to protect against these risks. Our activities and the activities of third party contractors involve the storage, use and transmission of proprietary and personal information, including personal information collected from professionals who use our websites. Accordingly, security breaches could expose us to a risk of loss or litigation and possibly liabilities. We cannot assure you that contractual provisions attempting to limit our liability in these areas will be successful or enforceable, or that other parties will accept such contractual provisions as part of our agreements. Any security breaches or our inability to provide users with continuous access to our networks could materially impact our ability to provide our services as well as materially impact the confidence of our customers in our services, either of which could have a material adverse effect on our business.
We may be liable with respect to the collection, storage and use of the personal and professional information of our professionals and our current practices may not be in compliance with proposed new laws and regulations.
Our business depends on our ability to collect, store, use and disclose personal and professional data from the professionals who use our websites. Our policies concerning the collection, use and disclosure of personally identifiable information are described on our websites. In recent years, class action lawsuits have been filed and the Federal Trade Commission and state agencies have commenced investigations with respect to the collection, use, sale and storage by various Internet companies of users’ personal and professional information. While we believe we are in compliance with current law,
17
we cannot ensure that we will not be subject to lawsuits or investigations for violations of law. Moreover, our current practices regarding the collection, storage and use of user information may not be in compliance with currently pending legislative and regulatory proposals by the United States federal government and various state and foreign governments intended to limit the collection and use of user information. While we have implemented and intend to implement additional programs designed to enhance the protection of the privacy of our users, these programs may not conform to all or any of these laws or regulations and we may consequently incur civil or criminal liability for failing to conform. As a result, we may be forced to change our current practices relating to the collection, storage and use of user information. Our failure or our perceived failure to comply with laws and regulations could also lead to adverse publicity and a loss of consumer confidence if it were known that we did not take adequate measures to assure the confidentiality of the personally identifiable information that our users had given to us. This could result in a loss of customers and revenue and materially adversely impact the success of our business. Concern among prospective customers and professionals regarding our use of personal information collected on our websites, such as credit card numbers, email addresses, phone numbers and other personal information, could keep prospective customers from using our career services websites. Internet-wide incidents or incidents with respect to our websites, including misappropriation of our users’ personal information, penetration of our network security, or changes in industry standards, regulations or laws could deter people from using the Internet or our websites to conduct transactions that involve confidential information, which could have a material adverse impact on our business. We generally comply with industry standards and are subject to the terms of our privacy policies and privacy-related obligations to third parties (including voluntary third-party certification bodies such as TRUSTe). We strive to comply with all applicable laws, policies, legal obligations and industry codes of conduct relating to privacy and data protection, to the extent possible. However, it is possible that these obligations may be interpreted and applied in new ways and/or in a manner that is inconsistent from one jurisdiction to another and may conflict with other rules or our practices or that new regulations could be enacted.
The use and transfer of personal data in EU member states is currently governed under Directive 95/46/EC (which is commonly referred to as the “Data Protection Directive”) as well as legislation adopted in the member states to implement the Data Protection Directive. The transfer of what is deemed to be personal data of EU subjects to countries (like the United States) that are determined to have inadequate privacy protections for such data was previously permitted under, among other methods, a process agreed to by the EU and the United States known as the EU-U.S. Safe Harbor Framework, pursuant to which U.S. businesses committed to treat the personal data of EU residents in accordance with privacy principles promulgated by the Data Protection Directive, and could self-certify their compliance with the Safe Harbor Framework. We previously relied upon the Safe Harbor Framework to allow us to conduct certain transfers of personal data of EU Subjects. Recent developments, however, no longer allow us to rely on the Safe Harbor Framework to support our data transfers. In particular, the Court of Justice of the European Union (“CJEU”) recently issued an opinion concluding that the Safe Harbor Framework is not sufficient to allow transfers of personal data of EU subjects to the United States.
Given the CJEU’s opinion, we can no longer rely on the Safe Harbor Framework to justify the transfer of personal data of EU subjects to the United States. Instead, we may have to rely on alternative compliance measures, which are complex, which may be subject to legal challenge, and which, unlike the Safe Harbor Framework, directly subject us to regulatory enforcement by data protection authorities located in the European Union. As a result, by relying on these alternative compliance measures, we risk becoming the subject of regulatory investigations in any of the individual jurisdictions in which we operate. Each such investigation could cost us significant time and resources, and could potentially result in fines, criminal prosecution, or other penalties. Being forced to rely on alternative compliance measures could also affect the market for our products and services, as EU customers may choose to do business with EU-based companies or other competitors that do not need to transfer personal data to the United States in order to avoid the above-identified risks and legal issues.
On February 2, 2016, the European Commission and the United States agreed on a new framework for the transfer of the personal data of EU subjects. The new arrangement will provide stronger obligations on U.S. companies (including strict standards regarding how personal data of EU individuals is processed and individual rights are guaranteed) and stronger monitoring and enforcement by the U.S. Department of Commerce and Federal Trade Commission. The implementation of this new framework (and our corresponding efforts to facilitate compliance) subjects us to substantial operational and regulatory uncertainty. Furthermore, the new framework is subject to final European Commission approval of an adequacy decision, resulting in substantial additional uncertainty regarding its implementation. This continued evolution of the regulation of data privacy subjects us to substantial operational and compliance risk, the result of which could be a material adverse effect on our financial condition and results of operations.
18
We have indebtedness which could affect our financial condition, and, if adverse changes in the credit markets occur, we may not be able to borrow funds under our revolving credit facility or refinance our indebtedness.
As of
December 31, 2015
, we had
$101.0 million
of outstanding indebtedness under our credit agreement dated November 24, 2015 (the “Credit Agreement”) and we had the ability to borrow an additional
$149.0 million
. If we cannot generate sufficient cash flow from operations to service our debt, we may need to further refinance our debt, dispose of assets or issue equity to obtain necessary funds. We do not know whether we will be able to take any of these actions, if necessary, on a timely basis or on terms satisfactory to us or at all.
Our Credit Agreement consists of a revolving facility. The funding of the revolving facility is dependent on a number of financial institutions. It is possible that one or more of the lenders will refuse or be unable to satisfy their commitment to lend to us should we need to borrow funds under the revolving credit facility. If borrowings are unavailable to us and we cannot generate sufficient revenues to fund our operations, our business will be adversely affected. In addition, the inability to borrow could hinder growth if we need funds to complete an acquisition.
Our indebtedness could limit our ability to:
|
•
|
obtain necessary additional financing for working capital, capital expenditures or other purposes in the future;
|
|
•
|
plan for, or react to, changes in our business and the industries in which we operate;
|
|
•
|
make future acquisitions or pursue other business opportunities; and
|
|
•
|
react in an extended economic downturn.
|
The terms of our Credit Agreement may restrict our current and future operations, which would adversely affect our ability to respond to changes in our business and to manage our operations.
Our Credit Agreement contains, and any future indebtedness of ours would likely contain, a number of restrictive covenants that impose significant operating and financial restrictions on us, including restrictions on our ability to, among other things:
|
•
|
incur additional debt;
|
|
•
|
pay dividends and make other restricted payments;
|
|
•
|
repurchase our own shares;
|
|
•
|
create liens;
|
|
•
|
make investments and acquisitions;
|
|
•
|
engage in sales of assets and subsidiary stock;
|
|
•
|
enter into sale-leaseback transactions;
|
|
•
|
enter into transactions with affiliates;
|
|
•
|
transfer all or substantially all of our assets or enter into merger or consolidation transactions; and
|
|
•
|
make capital expenditures.
|
Our Credit Agreement also requires us to maintain certain financial ratios. A failure by us to comply with the covenants or financial ratios contained in our Credit Agreement could result in an event of default under our Credit Agreement which could adversely affect our ability to respond to changes in our business and manage our operations. In the event of any default under our Credit Agreement, the lenders under our Credit Agreement will not be required to lend any additional amounts to us. Our lenders also could elect to declare all amounts outstanding to be due and payable and require us to apply all of our available cash to repay these amounts. If the indebtedness under our Credit Agreement were to be accelerated, there can be no assurance that our assets would be sufficient to repay this indebtedness in full.
We expect our operating results to fluctuate on a quarterly and annual basis.
Our revenue and operating results could vary significantly from quarter-to-quarter and year-to-year and may fail to match our past performance because of a variety of factors, some of which are outside of our control. Any of these events could cause the market price of our common stock to fluctuate. Factors that may contribute to the variability of our operating results include:
|
•
|
the size and seasonal variability of our customers’ recruiting and marketing budgets;
|
|
•
|
the emergence of new competitors in our market whether by established companies or the entrance of new companies;
|
|
•
|
the cost of investing in our technology infrastructure may be greater than we anticipate;
|
|
•
|
our ability to increase our customer base and customer and professional engagement;
|
|
•
|
disruptions or outages in the availability of our websites, actual or perceived breaches of privacy and compromises of our customers’ or professionals’ data;
|
|
•
|
changes in our pricing policies or those of our competitors;
|
19
|
•
|
macroeconomic changes, in particular, deterioration in labor markets, which would adversely impact sales of our hiring solutions, or economic growth that does not lead to job growth, for instance increases in productivity;
|
|
•
|
the timing and costs of expanding our organization and delays or inability in achieving expected productivity;
|
|
•
|
the timing of certain expenditures, including hiring of employees and capital expenditures;
|
|
•
|
our ability to increase sales of our products and solutions to new customers and expand sales of additional products and solutions to our existing customers;
|
|
•
|
the extent to which existing customers renew their agreements with us and the timing and terms of those renewals; and
|
|
•
|
general industry and macroeconomic conditions.
|
Our history of operations includes periods of operating and net losses, and we may incur operating and net losses in the future. Our significant net losses in periods prior to 2003 and the significant amount of indebtedness incurred by our predecessor led us to declare bankruptcy in early 2003.
Our history of operations includes periods of operating and net losses. Our significant net losses in periods prior to 2003 and the significant amount of indebtedness incurred by our predecessor led us to declare bankruptcy in early 2003. Although we have managed to achieve an increase in revenues since Dice Inc. emerged from bankruptcy, we have also increased our operating expenses significantly, expanded our net sales and marketing operations, made significant acquisitions and have continued to develop and extend our online career services with the expectation that our revenues will grow in the future. We may not generate sufficient revenues to pay for all of these operating or other expenses, which could have a material adverse effect on our business, results of operations and financial condition.
If we are not able to successfully identify or integrate recent or future acquisitions our management’s attention could be diverted, and our efforts to integrate future acquisitions could consume significant resources.
An important component of our strategy is to expand the geographic markets and the vertical sectors we serve and diversify the products and services we offer through the acquisition of other complementary businesses and technologies (such as the 2014 OilCareers acquisition, the 2013 acquisitions of The IT Job Board and onTargetjobs, the 2012 Slashdot Media and WorkDigital acquisitions, the 2010 WorldwideWorker and Rigzone acquisitions, the 2009 Health Callings acquisition and the 2006 eFinancialGroup acquisition). Our further growth may depend in part on our ability to identify additional suitable acquisition opportunities or consummate such acquisitions on terms that are beneficial to us. We may not be able to identify suitable acquisition opportunities or consummate such acquisitions on favorable terms or at all. In addition, the anticipated results or operational benefits of any businesses we acquire may not be realized and we may not be successful in integrating other acquired businesses into our operations. Failure to manage and successfully integrate acquired businesses could harm our business. Even if we are successful in making an acquisition, we may encounter numerous risks, including the following:
|
•
|
expenses, delays and difficulties in integrating the operations, technologies and products of acquired companies;
|
|
•
|
potential disruption of our ongoing operations;
|
|
•
|
diversion of management’s attention from normal daily operations of our business;
|
|
•
|
inability to maintain key business relationships and the reputations of acquired businesses;
|
|
•
|
the difficulty of integrating acquired technology and rights into our services and unanticipated expenses related to such integration;
|
|
•
|
the impairment of relationships with customers and partners of the acquired companies or our customers and partners as a result of the integration of acquired operations;
|
|
•
|
the impairment of relationships with employees of the acquired companies or our employees as a result of integration of new management personnel;
|
|
•
|
entry into markets in which we have limited or no prior experience and in which our competitors have stronger market positions;
|
|
•
|
dependence on unfamiliar employees, affiliates and partners;
|
|
•
|
the amortization of acquired companies’ intangible assets;
|
|
•
|
insufficient revenues to offset increased expenses associated with the acquisition;
|
|
•
|
inability to maintain our internal standards, controls, procedures and policies;
|
|
•
|
reduction or replacement of the sales of existing services by sales of products and services from acquired business lines;
|
|
•
|
potential loss of key employees of the acquired companies;
|
|
•
|
difficulties integrating the personnel and cultures of the acquired companies into our operations;
|
|
•
|
in the case of foreign acquisitions, uncertainty regarding foreign laws and regulations and difficulty integrating operations and systems as a result of cultural, systems and operational differences; and
|
|
•
|
the impact of potential liabilities or unknown liabilities of the acquired businesses.
|
20
If any of these risks materialize, they could have a material adverse effect on our business, results of operations, financial condition and liquidity.
In addition, any acquisition of other businesses or technologies may require us to seek debt or equity financing. Such financing might not be available to us on acceptable terms or at all. The global financial markets have recently experienced declining equity valuations and disruptions in the credit markets due to liquidity imbalances and repricing of risk, which may impact our ability to obtain additional financing on reasonable terms or at all.
Our potential future growth may strain our resources.
As our operations have expanded, we have experienced a rapid growth in our headcount. We grew from 169 employees at December 31, 2005 to
861
employees at
December 31, 2015
. Our rapid growth has demanded and will continue to demand substantial resources and attention from our management, including improving our operational and financial systems and expanding, training, retaining and managing our employee base. If we do not effectively manage our growth and expand, train, retain and manage our employee base, our customer service and responsiveness could suffer and our costs could increase, which could harm our brand, increase our expenses and reduce our profitability.
Misappropriation or misuse of our intellectual property could harm our reputation, affect our competitive position and cost us money.
Our success and ability to compete are dependent in part on the strength of our intellectual property rights, the content included on our websites, the goodwill associated with our trademarks, trade names and service marks, and on our ability to use U.S. and foreign laws to protect them. Our intellectual property includes, among other things, the content included on our websites, our logos, brands, domain names, the technology that we use to deliver our products and services, the various databases of information that we maintain and make available and the appearance of our websites. We claim common law protection on certain names and marks that we have used in connection with our business activities and the content included on our websites. We also own a number of registered or applied-for trademarks and service marks that we use in connection with our business, including DICE, CLEARANCEJOBS.COM, EFINANCIALCAREERS, RIGZONE.COM, HEALTHECAREERS NETWORK, and HCAREERS.COM, some of which we have acquired through business acquisitions. Although we generally pursue the registration of material service marks and other material intellectual property we own, where applicable, we have copyrights, trademarks and/or service marks that have not been registered in the United States and/or other jurisdictions. We generally enter into confidentiality and work-for-hire agreements with our employees, consultants, and vendors to protect our intellectual property rights. We also seek to control access to and distribution of our technology, documentation and other proprietary information as well as proprietary information licensed from third parties. Policing our intellectual property rights worldwide is a difficult task, and we may not be able to identify infringing users. The steps we have taken to protect our proprietary rights may not be adequate, and third parties could infringe, misappropriate or misuse our intellectual property rights. If this were to occur, it could harm our reputation and affect our competitive position. It could also require us to spend significant time and money in litigation. In addition, the laws of foreign countries do not necessarily protect intellectual property rights to the same extent as the laws of the United States. We have licensed in the past (on a royalty free basis), and expect to license in the future, various elements of our distinctive trademarks, service marks, trade dress, content and similar proprietary rights to third parties. We enter into strategic marketing arrangements with certain third-party web site operators pursuant to which we license our trademarks, service marks and content to such third parties in order to promote our brands and services and to generate leads to our websites. While we attempt to ensure that the quality of our brands is maintained by these licensees, we cannot assure you that third-party licensees of our proprietary rights will always take actions to protect the value of our intellectual property and reputation, and if they fail to do so, such failure could adversely affect our business and reputation.
We could be subject to infringement and other claims relating to our services or the content on our websites that may result in costly litigation, the payment of damages or the need to revise the way we conduct business.
We cannot be certain that our technology, offerings, services or content do not or will not infringe upon the intellectual property or other proprietary rights of third parties, or otherwise violate laws. From time to time we receive notices alleging potential infringement of intellectual property or other proprietary rights of third parties or non-compliance with applicable laws. In seeking to protect our marks, copyrights, domain names and other intellectual property rights, or in defending ourselves against claims of infringement or non-compliance that may or may not be without merit, we could face costly litigation and the diversion of our management’s attention and resources. Claims against us could result in the need to develop alternative trademarks, content, technology or other intellectual property or enter into costly royalty or licensing agreements, or substantially modify or cease to offer one or more of our services, which could have a material adverse effect on our business, results of operations, financial condition and liquidity. If we were found to have infringed on a third party’s intellectual property or other proprietary rights, or failed to comply with applicable laws, among other things, the value of our brands and our business reputation could be impaired, and our business could suffer.
21
If we are unable to enforce or defend our ownership or use of intellectual property, our business, competitive position and operating results could be harmed.
The success of our business depends in large part on our intellectual property rights, including existing and future trademarks and copyrights, which are and will continue to be valuable and important assets of our business. Our business could be harmed if we are not able to protect the content of our databases and our other intellectual property. We have taken measures to protect our intellectual property, such as requiring our employees and consultants with access to our proprietary information to execute confidentiality agreements. In the future, we may sue competitors or other parties who we believe to be infringing our intellectual property. We may in the future also find it necessary to assert claims regarding our intellectual property. These measures may not be sufficient or effective to protect our intellectual property. We also rely on laws, including those regarding copyrights and trademarks to protect our intellectual property rights. Current laws, or the enforceability of such laws, specifically in foreign jurisdictions, may not adequately protect our intellectual property or our databases and the data contained in them. In addition, legal standards relating to the validity, enforceability and scope of protection of intellectual property rights in Internet related businesses are uncertain and evolving, and we cannot assure you of the future viability or value of any of our proprietary rights. Others may develop technologies similar or superior to our technology. A significant impairment of our intellectual property rights could require us to develop alternative intellectual property, incur licensing or other expenses or limit our product and service offerings.
We have incurred increased costs and will continue to incur these costs as a result of being a public company.
As a public company, we have incurred and will continue to incur significant levels of legal, accounting and other expenses. The Sarbanes Oxley Act of 2002 (“Sarbanes Oxley”), the Dodd-Frank Act and related rules of the Securities and Exchange Commission (the “SEC”) and the NYSE regulate corporate governance practices of public companies and impose significant requirements relating to disclosure controls and procedures and internal control over financial reporting. Compliance with these public company requirements has increased our costs, required additional resources and made some activities more time consuming. We are required to expend considerable time and resources complying with public company regulations.
If we do not meet the continued listing requirements of the NYSE our common stock may be delisted.
Our common stock is listed on the NYSE. The NYSE requires us to continue to meet certain listing standards, including standards related to the trading price of our common stock, as well as our global market capitalization. While we are currently in compliance with the NYSE continued listing requirements, we cannot assure you that we will remain in compliance. If we do not meet the NYSE’s continued listing standards, we will be notified by the NYSE and we will be required to take corrective action to meet the continued listing standards; otherwise our common stock will be delisted from the NYSE. A delisting of our common stock on the NYSE would reduce the liquidity and market price of our common stock and the number of investors willing to hold or acquire our common stock, which could negatively impact our ability to access the public capital markets. A delisting would also reduce the value of our equity compensation plans, which could negatively impact our ability to retain key employees.
Our stock price has been volatile in the past and may be subject to volatility in the future.
The trading price of our common stock has been volatile in the past, and could be subject to fluctuations in response to various factors, some of which are beyond our control. Factors such as announcements of variations in our quarterly financial results and fluctuations in revenue could cause the market price of our common stock to fluctuate. Fluctuations in the valuation of companies perceived by investors to be comparable to us or in valuation metrics, such as our price to earnings ratio, could impact our stock price. Additionally, the stock markets have at times experienced price and volume fluctuations that have affected and might in the future affect the market prices of equity securities of many companies. These fluctuations have, in some cases, been unrelated or disproportionate to the operating performance of these companies. Further, the trading prices of publicly traded shares of companies in our industry have been particularly volatile and may be very volatile in the future. These broad market and industry fluctuations, as well as general economic, political and market conditions such as recessions, interest rate changes, international currency fluctuations or political unrest, may negatively impact the market price of our common stock.
Failure to maintain effective internal control over financial reporting could have a material adverse effect on our business, operating results and stock price.
Maintaining effective internal control over financial reporting is necessary for us to produce reliable financial reports and is important in helping to prevent financial fraud. If we are unable to maintain adequate internal controls, our business and operating results could be harmed. We are required to satisfy the requirements of Section 404 of Sarbanes Oxley and the related rules of the SEC, which require, among other things, our management to assess annually the effectiveness of our internal control over financial reporting and our independent registered public accounting firm to issue a report on that assessment. We
22
may be unable to remedy deficiencies before the requisite deadlines for those reports. Any failure to remediate deficiencies noted by our independent registered public accounting firm or to implement required new or improved controls or difficulties encountered in their implementation could cause us to fail to meet our reporting obligations or result in material misstatements in our financial statements. If our management or our independent registered public accounting firm were to conclude in their reports that our internal control over financial reporting was not effective, investors could lose confidence in our reported financial information, and the trading price of our stock could drop significantly.
We are dependent on the continued service of key executives and technical personnel whose expertise would be difficult to replace and, if we fail to retain key executives and personnel, there could be a material adverse effect on our business.
Our performance is substantially dependent on the performance of senior management and key technical personnel. We have employment agreements, which include non-compete provisions, with all members of senior management and certain key technical personnel. However, we cannot assure you that any of these senior managers or others will remain with us or that they will not compete with us in the event they cease to be employees, which could have a material adverse effect on our business, results of operations, financial condition and liquidity. In addition, we have not purchased key person life insurance on any members of our senior management. Our future success also depends upon our continuing ability to identify, attract, hire and retain highly qualified personnel, including skilled technical, management, product and technology, and sales and marketing personnel, all of whom are in high demand and are often subject to competing offers. There has in the past been, and there may in the future be, a shortage of qualified personnel in the career services market. We also compete for qualified personnel with other companies. A loss of a substantial number of qualified employees, or an inability to attract, retain and motivate additional highly skilled employees required for expansion of our business, could have a material adverse effect on our business.
Our business is subject to U.S. and foreign government regulation of the Internet and taxation, which may have a material adverse effect on our business.
Congress and various state and local governments, as well as the EU, have passed legislation that regulates various aspects of the Internet, including content, copyright infringement, user privacy, taxation, access charges, liability for third-party activities and jurisdiction. In addition, federal, state, local and foreign governmental organizations are also considering legislative and regulatory proposals that would regulate the Internet. Areas of potential regulation include libel, pricing, quality of products and services and intellectual property ownership. A number of proposals have been made at the state and local level that would impose taxes on the sale of goods and services through the Internet. Such proposals, if adopted, could substantially impair the growth of commerce over the Internet and could adversely affect our business, future results of operations, financial condition and liquidity. A law imposing a three-year moratorium on new taxes on Internet based transactions was enacted by Congress in October 1998. The moratorium has been extended by Congress several times with the expiration now being in
October 2016. This moratorium relates to new taxes on Internet access fees and state taxes on commerce that discriminate against out-of-state websites. Sales or use taxes imposed upon the sale of products or services over the Internet are not affected by this moratorium. We may be subject to restrictions on our ability to communicate with our customers through email and phone calls. Several jurisdictions have proposed or adopted privacy related laws that restrict or prohibit unsolicited email or “spam.” These laws may impose significant monetary penalties for violations. For example, the CAN-SPAM Act of 2003, or “CAN-SPAM,” imposes complex and often burdensome requirements in connection with sending commercial email. Key provisions of CAN-SPAM have yet to be interpreted by the courts. Depending on how it is interpreted, CAN-SPAM may impose burdens on our email marketing practices or services we offer or may offer. Although CAN-SPAM is thought to have preempted state laws governing unsolicited email, the effectiveness of that preemption is likely to be tested in court challenges. If any of those challenges are successful, our business may be subject to state laws and regulations that may further restrict our email marketing practices and the services we may offer. The scope of those regulations is unpredictable. Because a number of these laws are relatively new and still in the process of being implemented, we do not know how courts will interpret these laws. Therefore, we are uncertain as to how new laws or the application of existing laws will affect our business. Increased regulation of the Internet may therefore reduce the use of the Internet, which could decrease demand for our services, increase our cost of doing business or otherwise have a material adverse effect on our business, results of operations, financial condition and liquidity.
We post our privacy policy and practices concerning the use and disclosure of user data on our websites. Any failure by us to comply with our posted privacy policy or other privacy-related laws and regulations could result in proceedings which could potentially harm our business, results of operations and financial condition. In this regard, there are a large number of legislative proposals before the United States Congress, various state legislative bodies, as well as various European Union institutions, bodies and agencies regarding privacy issues related to our business. It is not possible to predict whether or when such legislation may be adopted, and certain proposals, if adopted, could significantly harm our business, financial condition
23
and results of operations through a decrease in user registrations and revenues. This could be caused by, among other possible provisions, the required use of disclaimers or other requirements before users can utilize our services.
Due to the global nature of the Internet, it is possible that the governments of other states and foreign countries might attempt to regulate its transmissions or prosecute us for violations of their laws. We might unintentionally violate such laws or such laws may be modified and new laws may be enacted in the future. Any such developments (or developments stemming from enactment or modification of other laws) may significantly harm our business, operating results and financial condition.
If our users or customers do not find our candidate profiles useful, it could adversely impact demand for our products and services and the growth of our business.
Our Open Web product searches publicly available data on the internet to create aggregated profiles of prospective candidates’ professional experience and other employment-related data. These profiles are made available to our customers to help them identify targeted prospective candidates in a way that reduces their need to search multiple websites, while delivering more relevant candidates and information to the recruiters and employers that use it. While we have invested substantial resources into the development of our Open Web product, there can be no assurance that we will continue to be able to access the data that is necessary to create the candidate profiles used in this product. Technology companies, social and professional networking websites or other companies may develop technology which competes with our Open Web product or we may be prevented from aggregating the data we need to make this product useful, which could decrease the demand for this product. Moreover, candidates sought out through Open Web may not be interested in the opportunities presented to them by the recruiters and employers who use the product, which could decrease its demand. Any decrease in demand for our Open Web product may adversely affect our ability to differentiate ourselves from our competitors, which would have a material adverse effect on our business and operating results.
If Internet search engines’ methodologies are modified or our search result page rankings decline for other reasons, our user engagement could decline.
We depend in part on various Internet search engines, such as Google, Bing and Yahoo!, to direct a significant amount of traffic to our websites. Our ability to maintain the number of visitors directed to our websites is not entirely within our control. Our competitors’ search engine optimization, or SEO, efforts may result in their websites receiving a higher search result page ranking than ours, or Internet search engines could revise their methodologies in an attempt to improve their search results, which could adversely affect the placement of our search result page ranking. If search engine companies modify their search algorithms in ways that are detrimental to our new user growth or in ways that make it harder for our users to use our websites, or if our competitors’ SEO efforts are more successful than ours, overall growth in our user base could slow, user engagement could decrease, and we could lose existing users. These modifications may be prompted by search engine companies entering the online professional networking market or aligning with competitors. Our websites have experienced fluctuations in search result rankings in the past, and we anticipate similar fluctuations in the future. Any reduction in the number of users directed to our websites would harm our business and operating results.
We may not be able to halt the operations of websites that aggregate our data as well as data from other companies, including social networks, or copycat websites that have misappropriated our data in the past or may misappropriate our data in the future. These activities could harm our brand and our business.
From time to time, third parties have misappropriated our data through website scraping, robots or other means and aggregated this data on their websites with data from other companies. In addition, “copycat” websites have misappropriated data on our network and attempted to imitate our brand or the functionality of our websites. These activities could degrade our brands and harm our business. When we have become aware of such websites, we have employed technological or legal measures in an attempt to halt their operations. However, we may not be able to detect all such websites in a timely manner and, even if we could, technological and legal measures may be insufficient to stop their operations. In some cases, particularly in the case of websites operating outside of the United States, our available remedies may not be adequate to protect us against such websites. Regardless of whether we can successfully enforce our rights against these websites, any measures that we may take could require us to expend significant financial or other resources.
24
If our business fails to attract and retain users, particularly users who create and post original content on our web properties, our financial results will be adversely affected.
Our reliance upon user-generated content requires that we develop and maintain tools and services designed to facilitate:
|
•
|
creation of user-generated content
|
|
•
|
participation in discussion surrounding such user-generated content
|
|
•
|
evaluation of user-generated content
|
|
•
|
distribution of user-generated content.
|
If our development efforts fail to facilitate such activities on our web properties, the level of user engagement and interaction will not increase and may decline. Even if we succeed in facilitating such activities on our sites, there can be no assurance that such improvements will be deployed in a timely or cost-effective manner.
If we fail to increase user engagement and interaction on our web properties, we will not attract and retain a loyal user base or the advertisers who desire to reach them, which will adversely affect our business and our ability to maintain or grow our revenue.
We face risks relating to our foreign operations.
We operate websites serving numerous markets around the world. For the year ended
December 31, 2015
, approximately
28%
of our total revenues were generated outside of the United States. Such amounts are collected in local currency. As a result of operating outside the United States, we are at risk for exchange rate fluctuations between such local currencies and the United States dollar. To date, we have not engaged in exchange rate hedging activities. Even if we were to implement hedging strategies to mitigate this risk, these strategies might not eliminate our exposure to foreign exchange rate fluctuations and would involve costs and risks of their own, such as ongoing management time and expertise, external costs to implement the strategies and potential accounting implications. We are also subject to taxation in foreign jurisdictions. In addition, transactions between our foreign subsidiaries and us may be subject to United States and foreign withholding taxes. Applicable tax rates in foreign jurisdictions differ from those of the United States, and change periodically. The extent, if any, to which we will receive credit in the United States for taxes we pay in foreign jurisdictions will depend upon the application of limitations set forth in the U.S. Internal Revenue Code of 1986, as amended, as well as the provisions of any tax treaties that may exist between the United States and such foreign jurisdictions. Our current or future international operations might not succeed for a number of reasons including:
|
•
|
difficulties in staffing and managing foreign operations;
|
|
•
|
competition from local recruiting services or employment advertising agencies;
|
|
•
|
operational issues, such as longer customer payment cycles and greater difficulties in collecting accounts receivable;
|
|
•
|
seasonal reductions in business activity;
|
|
•
|
language and cultural differences;
|
|
•
|
taxation issues;
|
|
•
|
foreign exchange controls that might prevent us from repatriating income earned in countries outside the United States;
|
|
•
|
credit risk;
|
|
•
|
higher levels of payment fraud;
|
|
•
|
multiple and conflicting laws and regulations, including complications due to unexpected changes in these laws and regulations;
|
|
•
|
the burdens of complying with a wide variety of foreign laws and regulations;
|
|
•
|
difficulties in enforcing intellectual property rights in countries other than the United States; and
|
|
•
|
general political and economic trends.
|
Our future growth depends on our ability to expand operations in international markets. We may have limited experience or we may need to rely on business partners in these markets, and our future growth will be materially adversely affected if we are unsuccessful in our international expansion efforts.
We operate local websites in numerous markets around the world. Our future growth will depend significantly on our ability to expand our brands and product offerings in additional international markets. As we expand into new international markets, we may have only limited experience in marketing and operating our products and services in such markets. In other instances, we may have to rely on the efforts and abilities of foreign business partners in such markets. Certain international markets may be slower than domestic markets in adopting the online recruitment and advertising industry medium and, as a result, our operations in international markets may not develop at a rate that supports our level of investment. In addition,
25
business practices in these new international markets may be unlike those in the other markets we serve and we may face increased exposure to fines and penalties under U.S. laws, such as the Foreign Corrupt Practices Act, the U.K. Anti-Bribery Act and local laws prohibiting corrupt payments to governmental officials. Although we have implemented policies and procedures designed to ensure compliance with these laws, we cannot be sure that our employees, contractors or agents will not violate our policies. Any such violations could materially damage our reputation, our brand, our international expansion efforts, our business and our operating results.
We may be impacted by unfavorable decisions in proceedings related to future tax assessments.
We operate in a number of jurisdictions and are from time to time subject to audits and reviews by various taxation authorities with respect to income, payroll, sales and use and other taxes and remittances, for current, as well as past periods. We may become subject to future tax assessments by various authorities. The determination of our worldwide provision for income taxes and current and deferred tax assets and liabilities requires judgment and estimation. There are many transactions and calculations where the ultimate tax determination is uncertain. Although we believe our tax estimates are reasonable, the ultimate tax outcome may differ materially from the tax amounts recorded in our consolidated financial statements. Any amount we might be required to pay in connection with an ongoing audit or review or a future tax assessment may have a material adverse effect on our financial position, cash flows or overall results of operations.
Taxation risks could subject us to liability for past sales and cause our future sales to decrease.
We do not collect sales or other taxes in certain jurisdictions on the services we provide in the United States. Our operations, and any future expansion of them, along with other aspects of our evolving business, may result in additional sales and other tax obligations.
Currently, the individual states’ sales and use tax regulations determine which services performed over the Internet are subject to sales and use tax. A number of states have been considering or have adopted initiatives that could impose sales and use taxes on certain services delivered over the Internet. If these initiatives are successful, we could be required to collect sales and use taxes in additional states. Also, a state may take the position under existing tax regulations that certain services we provide are subject to sales tax under current regulations. The imposition by state and local governments of various taxes upon certain services delivered over the Internet could create administrative burdens for us, put us at a competitive disadvantage if they do not impose similar obligations on all of our online competitors and potentially decrease our future sales.
We collect consumption tax (including value added tax, goods and services tax, and provincial sales tax) as applicable on services sold by us on some of our international sites. Additional foreign countries may seek to impose sales or other tax collection obligations on us.
A successful assertion by one or more states or foreign countries that we should collect sales or other taxes on the sale of services could result in substantial tax liabilities for past sales, decrease our ability to compete, and otherwise harm our business.
A write-off of all or a part of our goodwill would hurt our operating results and reduce our net worth.
We have significant intangible assets related to goodwill, which represents the excess of the total purchase price of our acquisitions over the estimated fair value of the net assets acquired. As of
December 31, 2015
, we had
$198.6 million
of goodwill on our balance sheet, which represented approximately
54%
of our total assets. We do not amortize goodwill under U.S. GAAP and instead are required to review goodwill at least annually for impairment. During 2015, goodwill of
$34.8 million
related to the Energy segment was written off. During 2013, goodwill of $7.7 million related to Slashdot Media and Health Callings was written off. During 2008, goodwill of $7.2 million related to eFinancialCareers’ North American operations was written off. In the event impairment is identified again in the future for any of our reporting units, a charge to earnings would be recorded. Although it would not affect our cash flow or financial position, a write-off in future periods of all or a part of our goodwill would have a material adverse effect on our overall results of operations. See Item 7. “Management’s Discussion and Analysis of Financial Condition and Results of Operations—Critical Accounting Policies—Goodwill.”
Because we recognize most of our revenue from our contracts over the term of the agreement, a significant downturn in these businesses may not be immediately reflected in our operating results.
We recognize revenue from sales of our recruiting contracts over the terms of the agreements, which, on average, is approximately 12 months. As a result, a significant portion of the revenue we report in each quarter is generated from agreements entered into during previous quarters. Consequently, a decline in new or renewed agreements in any one quarter may not significantly impact our revenue in that quarter but may, instead, negatively affect our revenue in future quarters. In addition, we may be unable to adjust our fixed costs in response to reduced revenue. Accordingly, the effect of significant declines in the sales of these offerings may not be reflected in our short-term results of operations.
26
|
Item 1B.
|
Unresolved Staff Comments
|
None.
|
Item 2.
|
Properties
|
We do not own any properties. Our corporate headquarters are located at 1040 Avenue of the Americas, New York, New York, where we lease approximately 13,000 square feet. We lease approximately 35,000 square feet of office space in Urbandale, Iowa; 28,000 square feet of office space in Denver, Colorado; 17,000 square feet of office space in London, England; and 16,000 square feet of office space in San Jose, California. In addition, we have small offices in Cincinnati, Ohio; Houston, Texas; Vancouver, British Columbia, Canada; Singapore; Frankfurt, Germany; Amsterdam, Netherlands; Dubai, United Arab Emirates; Perth, Australia; Hong Kong; Beijing, China; Aberdeen, Scotland; Shanghai, China; and Dublin, Ireland. Our small offices are used across multiple segments.
We believe that our facilities are generally adequate for current and anticipated future use, although we may from time to time lease additional facilities as operations require.
|
Item 3.
|
Legal Proceedings
|
From time to time we may be involved in disputes or litigation relating to claims arising out of our operations. We are currently not a party to any material pending legal proceedings.
|
Item 4.
|
Mine Safety Disclosures
|
None.
27
|
Item 5.
|
Market for Registrant’s Common Equity, Related Stockholder Matters and Issuer Purchases of Equity Securities
|
Market Information
Our common stock is listed on the NYSE under the ticker symbol “DHX”. We have not listed our stock on any other markets or exchanges. Prior to July 18, 2007, there was no public market for our common stock. The high and low quarterly closing sales prices for the common stock for
2015
and
2014
were as follows:
|
|
2015
|
2014
|
|||||||||||||||||||||||||||||
|
First
Quarter
|
Second
Quarter
|
Third
Quarter
|
Fourth
Quarter
|
First
Quarter
|
Second
Quarter
|
Third
Quarter
|
Fourth
Quarter
|
||||||||||||||||||||||||
|
Low
|
$
|
8.23
|
|
$
|
7.60
|
|
$
|
7.14
|
|
$
|
7.38
|
|
$
|
6.68
|
|
$
|
6.82
|
|
$
|
7.53
|
|
$
|
8.07
|
|
|||||||
|
High
|
$
|
10.08
|
|
$
|
9.18
|
|
$
|
9.12
|
|
$
|
9.99
|
|
$
|
7.56
|
|
$
|
7.65
|
|
$
|
9.16
|
|
$
|
11.40
|
|
|||||||
As of December 31,
2015
, the last reported sale price of our stock as reported by the NYSE was $9.17.
Holders
As of December 31,
2015
, there were 38 stockholders of record of our common stock. A significant number of the outstanding shares of common stock which are beneficially owned by individuals and entities are registered in the name of Cede & Co. Cede & Co. is a nominee of The Depository Trust Company, a securities depository for banks and brokerage firms.
Dividend Policy
We have not declared or paid any cash dividends on our stock as a public company. We currently anticipate that all future earnings will be retained by the Company to support our long-term growth strategy. Accordingly, we do not anticipate paying periodic cash dividends on our stock for the foreseeable future.
Furthermore, we are restricted by our Credit Agreement in the amount of cash dividends that we can pay.
The payment of any future dividends will be at the discretion of our board of directors and subject to the Credit Agreement and will depend upon, among other things, future earnings, operations, capital requirements, our general financial condition, contractual restrictions and general business conditions.
Repurchases of Equity Securities
Our board of directors approved a stock repurchase program that permitted the Company to repurchase our common stock. The following table summarizes the stock repurchase plans approved by the board of directors:
|
III
|
IV
|
V
|
VI
|
|
|
Approval Date
|
January 2013
|
December 2013
|
December 2014
|
December 2015
|
|
Authorized Repurchase Amount of Common Stock
|
$50 million
|
$50 million
|
$50 million
|
$50 million
|
|
Effective Dates
|
April 2013 to December 2013
|
December 2013 to December 2014
|
December 2014 to December 2015
|
December 2015 to December 2016
|
The Company is currently under Stock Repurchase Plan VI, which will be in effect for up to one year. Under each plan, management has discretion in determining the conditions under which shares may be purchased from time to time.
28
During the three months ended
December 31, 2015
, purchases of our common stock pursuant to the Stock Repurchase Plans were as follows:
|
Period
|
(a) Total Number of Shares Purchased [1]
|
|
(b) Average Price Paid per Share
|
|
(c) Total Number of Shares Purchased as Part of Publicly Announced Plans or Programs
|
|
(d) Approximate Dollar Value of Shares that May Yet Be Purchased Under the Plans or Programs
|
||||||||||||||
|
October 1 through October 31, 2015
|
590,000
|
|
|
|
$
|
7.87
|
|
|
590,000
|
|
|
|
$
|
14,692,000
|
|
|
|||||
|
November 1 through November 30, 2015
|
160,006
|
|
|
|
8.72
|
160,006
|
|
13,297,000
|
|
||||||||||||
|
December 1 through December 31, 2015 [2]
|
250,000
|
|
9.48
|
250,000
|
|
47,629,000
|
|
||||||||||||||
|
Total
|
1,000,006
|
|
$
|
8.41
|
1,000,006
|
|
|||||||||||||||
[1] No shares of our common stock were purchased other than through a publicly announced plan or program.
[2] The Stock Repurchase Plan V concluded on December 11, 2015, and the Stock Repurchase Plan VI commenced on such date.
Securities Authorized for Issuance under Equity Compensation Plans
The following table sets forth information required by this item as of
December 31, 2015
regarding compensation plans under which the Company’s equity securities are authorized for issuance:
|
(a)
|
(b)
|
(c)
|
|||||||
|
Number of
Securities to
be Issued
upon
Exercise of
Outstanding
Options
|
Weighted-
Average
Exercise
Price of
Outstanding
Options ($)
|
Number of
Securities
Remaining
Available for
Future
Issuance
Under Equity
Compensation
Plans
(Excluding
Securities
Reflected in
Column (a))
|
|||||||
|
Plan Category
|
|||||||||
|
Equity compensation plans approved by security holders
|
2,673,512
|
|
$
|
7.46
|
|
3,019,185
|
|
||
|
Equity compensation plans not approved by security holders
|
n/a
|
|
n/a
|
|
n/a
|
|
|||
|
Total
|
2,673,512
|
|
$
|
7.46
|
|
3,019,185
|
|
||
For material features of the plans, see Item 7. “Management’s Discussion and Analysis of Financial Condition and Results of Operations—Critical Accounting Policies—Stock and Stock-Based Compensation.”
29
Performance Graph
The following graph shows the total shareholder return of an investment of $100 in cash on December 31, 2010 through
December 31, 2015
(the last trading day of our common stock on the NYSE in
2015
) for (i) our common stock, (ii) the Russell 2000 and (iii) the Dow Jones Internet Composite Index, at the closing price on December 31, 2015. All values assume reinvestment of the full amount of all dividends, if any.
Comparative Returns
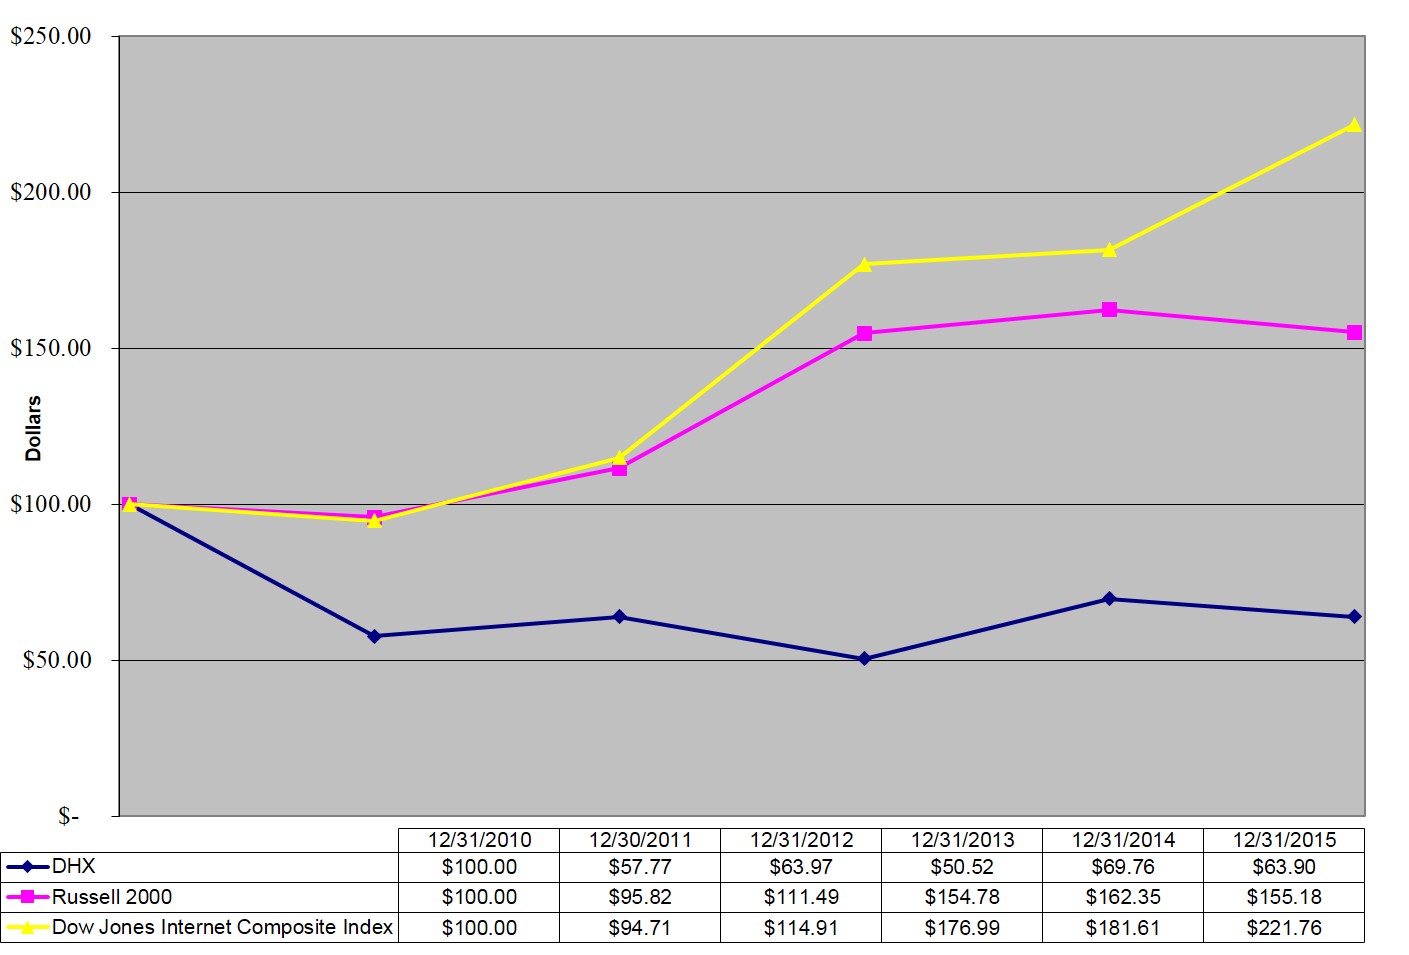
The returns shown on the graph do not necessarily predict future performance. The performance graph is not deemed “filed” with the SEC.
|
Item 6.
|
Selected Financial Data
|
The information set forth below should be read in conjunction with “Management’s Discussion and Analysis of Financial Condition and Results of Operations” and our consolidated financial statements and related notes included elsewhere in this Annual Report on Form 10-K (this “Annual Report”).
The following consolidated statements of operations data for the years ended
December 31, 2015
,
2014
and
2013
and the consolidated balance sheet data as of
December 31, 2015
and
2014
have been derived from the audited consolidated financial statements and related notes of DHI Group, Inc., which are included elsewhere in this Annual Report. The consolidated statements of operations data for the years ended December 31, 2012 and 2011 and the consolidated balance sheet data as of December 31, 2013, 2012 and 2011 have been derived from the audited consolidated financial statements and related notes of DHI Group, Inc., which are not included in this Annual Report.
30
|
|
For the year ended December 31,
|
||||||||||||||||||
|
|
2015 (4)
|
2014 (3)
|
2013 (2)
|
2012 (1)
|
2011
|
||||||||||||||
|
|
(in thousands, except per share information)
|
||||||||||||||||||
|
Revenues
|
$
|
259,769
|
|
$
|
262,615
|
|
$
|
213,482
|
|
$
|
195,363
|
|
$
|
179,130
|
|
||||
|
Operating expenses
|
253,414
|
|
216,011
|
|
184,276
|
|
136,467
|
|
124,183
|
|
|||||||||
|
Operating income
|
6,355
|
|
46,604
|
|
29,206
|
|
58,896
|
|
54,947
|
|
|||||||||
|
Income from operations before income taxes
|
3,041
|
|
42,849
|
|
27,295
|
|
56,838
|
|
53,489
|
|
|||||||||
|
Net income (loss)
|
$
|
(10,968
|
)
|
$
|
27,612
|
|
$
|
16,246
|
|
$
|
38,087
|
|
$
|
34,100
|
|
||||
|
Basic earnings (loss) per share
|
$
|
(0.21
|
)
|
$
|
0.53
|
|
$
|
0.29
|
|
$
|
0.62
|
|
$
|
0.52
|
|
||||
|
Diluted earnings (loss) per share
|
$
|
(0.21
|
)
|
$
|
0.51
|
|
$
|
0.27
|
|
$
|
0.59
|
|
$
|
0.49
|
|
||||
|
Weighted average shares outstanding:
|
|||||||||||||||||||
|
Basic
|
51,402
|
|
52,328
|
|
56,473
|
|
61,192
|
|
65,809
|
|
|||||||||
|
Diluted
|
51,402
|
|
54,410
|
|
59,476
|
|
64,604
|
|
70,053
|
|
|||||||||
|
|
For the year ended December 31,
|
||||||||||||||||||
|
|
2015 (4)
|
2014 (3)
|
2013 (2)
|
2012 (1)
|
2011
|
||||||||||||||
|
Other Financial Data:
|
(in thousands)
|
||||||||||||||||||
|
Net cash from operating activities
|
$
|
60,809
|
|
$
|
55,543
|
|
$
|
49,365
|
|
$
|
54,661
|
|
$
|
64,494
|
|
||||
|
Depreciation and amortization
|
23,192
|
|
27,201
|
|
17,401
|
|
12,311
|
|
14,801
|
|
|||||||||
|
Capital expenditures
|
(9,078
|
)
|
(8,710
|
)
|
(10,555
|
)
|
(5,902
|
)
|
(7,776
|
)
|
|||||||||
|
Net cash from investing activities
|
(9,078
|
)
|
(35,711
|
)
|
(66,967
|
)
|
(33,939
|
)
|
(10,614
|
)
|
|||||||||
|
Net cash from financing activities
|
(44,662
|
)
|
(31,413
|
)
|
16,439
|
|
(36,829
|
)
|
(41,595
|
)
|
|||||||||
|
|
At December 31,
|
||||||||||||||||||
|
|
2015 (4)
|
2014 (3)
|
2013 (2)
|
2012 (1)
|
2011
|
||||||||||||||
|
Balance Sheet Data:
|
(in thousands)
|
||||||||||||||||||
|
Cash and cash equivalents
|
$
|
34,050
|
|
$
|
26,777
|
|
$
|
39,351
|
|
$
|
40,013
|
|
$
|
55,237
|
|
||||
|
Acquired intangible assets, net
|
65,292
|
|
81,345
|
|
84,905
|
|
62,755
|
|
56,471
|
|
|||||||||
|
Goodwill
|
198,598
|
|
239,256
|
|
230,190
|
|
202,944
|
|
176,365
|
|
|||||||||
|
Total assets
|
370,499
|
|
427,247
|
|
420,641
|
|
354,230
|
|
326,378
|
|
|||||||||
|
Deferred revenue
|
83,316
|
|
86,444
|
|
77,394
|
|
69,404
|
|
60,887
|
|
|||||||||
|
Long-term debt, including current portion
|
101,000
|
|
110,500
|
|
119,000
|
|
46,000
|
|
15,000
|
|
|||||||||
|
Total stockholders’ equity
|
138,613
|
|
177,798
|
|
167,812
|
|
190,638
|
|
209,216
|
|
|||||||||
____________________
|
(1)
|
Reflects the FINS.com acquisition in June 2012, Slashdot Media acquisition in September 2012 and the WorkDigital acquisition in October 2012.
|
|
(2)
|
Reflects The IT Job Board acquisition in July 2013 and the onTargetjobs acquisition in November 2013. Includes impairment charges of $15.9 million related to Slashdot Media and Health Callings.
|
|
(3)
|
Reflects the OilCareers acquisition in March 2014.
|
|
(4)
|
Reflects impairment of goodwill of
$34.8 million
related to the Energy segment.
|
|
Item 7.
|
Management’s Discussion and Analysis of Financial Condition and Results of Operations
|
The following discussion should be read in conjunction with our consolidated financial statements and the related notes included elsewhere in this Annual Report. See also “Note Concerning Forward-Looking Statements.”
You should keep in mind that any forward-looking statement made by us herein, or elsewhere, speaks only as of the date on which it is made. New risks and uncertainties come up from time to time, and it is impossible to predict these events or how they may affect us. We have no obligation to update any forward-looking statements after the date hereof, except as required by applicable law.
31
Overview
We are a leading provider of data, insights and connections through our specialized services for professional communities including technology and security clearance, financial services, energy, healthcare and hospitality. Our mission is to empower professionals and organizations to compete and win through specialized insights and relevant employment connections. Employers and recruiters use our websites and services to source and hire the most qualified professionals in select and highly-skilled occupations, while professionals use our websites and services to find the best employment opportunities in and the most timely news and information about their respective areas of expertise.
In online recruitment, we target employment categories in which there has been a long-term scarcity of highly skilled, highly qualified professionals relative to market demand. Our websites serve as online marketplaces where employers and recruiters find and recruit prospective employees, and where professionals find relevant job opportunities and information to further their careers.
Our websites offer job postings, news and content, career development and recruiting services tailored to the specific needs of the professional community that each website serves.
Through our predecessors, we have been in the recruiting and career development business for more than 25 years. Based on our operating structure, we have identified five reportable segments under the Segment Reporting topic of the FASB Accounting Standards Codification (ASC).
Our reportable segments include:
|
•
|
Tech & Clearance— Dice, ClearanceJobs, Dice Europe and career fairs
|
|
•
|
Finance— eFinancialCareers
|
|
•
|
Energy— Rigzone, OilCareers (acquired March 2014 and merged into Rigzone March 2015) and career fairs
|
|
•
|
Healthcare— Health eCareers and BioSpace
|
|
•
|
Hospitality— Hcareers
|
We have other services and activities that individually are not more than 10% of consolidated revenues, operating income or total assets. These include Slashdot Media, WorkDigital, BrightMatter and IT Media and are reported in the “Corporate & Other” category, along with corporate-related costs which are not considered in a segment.
Our Revenues and Expenses
We derive the majority of our revenues from customers who pay fees, either annually, quarterly or monthly, to post jobs on our websites and to access our searchable databases of resumes. Our fees vary by customers based on the number of individual users of our databases of resumes, the number and type of job postings purchased and the terms of the package purchased. Our Tech & Clearance segment sells recruitment packages that can include both access to our databases of resumes and Open Web profiles, as well as job posting capabilities. Our Finance, Energy, Healthcare and Hospitality segments sell job postings and access to our resume databases either as part of a package or individually. We believe the key metrics that are material to an analysis of our businesses are our total number of recruitment package customers and the revenue, on average, that these customers generate. At
December 31, 2015
and
2014
, Dice had approximately 7,600 and 7,800 total recruitment package customers, respectively. Our customers’ usage of our websites increased, as demonstrated through an increase in average monthly revenue per recruitment package customer of
$1,044
for the year ended
December 31, 2014
to
$1,094
for the year ended
December 31, 2015
. Deferred revenue is a key metric of our business as it indicates a level of sales already made that will be recognized as revenue in the future. Deferred revenue reflects the impact of our ability to sign customers to longer term contracts. We recorded deferred revenue of
$84.3 million
at
December 31, 2015
, including
$969,000
of Slashdot Media deferred revenue classified as held for sale as of
December 31, 2015
, and
$86.4 million
at December 31,
2014
.
We also generate revenue from advertising on our various websites or from lead generation and marketing solutions provided to our customers. Advertisements include various forms of rich media and banner advertising, text links, sponsorships, and custom content marketing solutions. Lead generation information utilizes advertising and other methods to deliver leads to a customer.
Our ability to continue to grow our revenues will largely depend on our ability to grow our customer bases in the markets in which we operate by acquiring new recruitment package customers and advertisers while retaining a high proportion of the customers we currently serve, and to expand the breadth of services our customers purchase from us. We continue to make investments in our business and infrastructure to help us achieve our long-term growth objectives.
32
Other material factors that may affect our results of operations include our ability to attract qualified professionals that become engaged with our websites and our ability to attract customers with relevant job opportunities. The more qualified professionals that use our websites, the more attractive our websites become to employers and advertisers, which in turn makes them more likely to become our customers, resulting positively on our results of operations. If we are unable to continue to attract qualified professionals to engage with our websites, our customers may no longer find our services attractive, which could have a negative impact on our results of operations. Additionally, we need to ensure that our websites remain relevant in order to attract qualified professionals to our websites and to engage them in high-valued tasks, such as posting resumes and/or applying to jobs.
The largest components of our expenses are personnel costs and marketing and sales expenditures. Personnel costs consist of salaries, benefits, and incentive compensation for our employees, including commissions for salespeople. Personnel costs are categorized in our statement of operations based on each employee’s principal function. Marketing expenditures primarily consist of online advertising, brand promotion and lead generation to employers and job seekers.
Critical Accounting Policies
This discussion of our financial condition and results of operations is based upon our consolidated financial statements, which have been prepared in accordance with U.S. GAAP. The preparation of these financial statements requires us to make estimates, judgments and assumptions that affect the reported amount of assets, liabilities, revenues and expenses and related disclosure of contingent assets and liabilities. On an ongoing basis, we evaluate our estimates, including those related to revenue, goodwill and intangible assets, stock-based compensation and income taxes. We based our estimates of the carrying value of certain assets and liabilities on historical experience and on various other assumptions that we believe are reasonable. In many cases, we could reasonably have used different accounting policies and estimates. In some cases, changes in the accounting estimates are reasonably likely to occur from period to period. Our actual results may differ from these estimates under different assumptions or conditions. We believe the following critical accounting policies affect our more significant judgments used in the preparation of our consolidated financial statements.
Revenue Recognition
We recognize revenues when persuasive evidence of an agreement exists, delivery of service has occurred, the sales price is fixed or determinable and collectability is reasonably assured. Payments received in advance of services being rendered are recorded as deferred revenue and recognized generally on a straight-line basis over the service period. We generate a majority of our revenue from the sale of recruitment packages.
Recruitment package revenues are derived from the sale to recruiters and employers a combination of job postings and access to a searchable database of candidates on our Dice, Rigzone, eFinancialCareers, ClearanceJobs, Health eCareers, BioSpace and Hcareers websites. Certain of our arrangements include multiple deliverables, which consist of the ability to post jobs and access to a searchable database of candidates. We determine the units of accounting for multiple element arrangements in accordance with the Multiple-Deliverable Revenue Arrangements subtopic of the FASB ASC. Specifically, we consider a delivered item as a separate unit of accounting if it has value to the customer on a standalone basis. Our arrangements do not include a general right of return. Services to customers buying a package of available job postings and access to the database are delivered over the same period and revenue is recognized ratably over the length of the underlying contract, typically from one to twelve months. The separation of the package into two deliverables results in no change in revenue recognition since delivery of the two services occurs over the same time period. Revenue from the sale of classified job postings and data services is recognized ratably over the length of the contract or the period of actual usage. Revenue from recruitment events is recognized when the event is held. Advertising revenue is recognized over the period in which the advertisements are displayed on the websites or at the time leads are delivered to our customers.
Goodwill
As a result of our various acquisitions, we have recorded goodwill. We record goodwill when the purchase price paid for an acquisition exceeds the estimated fair value of the net identified tangible and intangible assets acquired.
We determine whether the carrying value of recorded goodwill is impaired on an annual basis or more frequently if indicators of potential impairment exist. In testing goodwill for impairment, a qualitative assessment can be performed and if it is determined that the fair value of the reporting unit is more likely than not less than the carrying amount, the two step impairment test is required. The first step of the impairment review process compares the fair value of the reporting unit in which the goodwill resides to the carrying value of that reporting unit. The second step measures the amount of impairment loss, if any, by comparing the implied fair value of the reporting unit goodwill with its carrying amount. Our annual impairment test for the goodwill is performed on October 1 on the following reporting units:
33
|
Reporting Unit
|
Impairment Indicated
|
|
|
Dice
|
No
|
|
|
Dice Europe
|
No
|
|
|
Energy
|
Yes
|
|
|
Finance
|
No
|
|
|
Healthcare
|
No
|
|
|
Hospitality
|
No
|
|
|
WorkDigital
|
No
|
|
The fair value of each reporting unit was in excess of the carrying value during the year ended December 31, 2015, with the exception of the Energy reporting unit. Goodwill impairment of
$34.8 million
was recorded during the year ended December 31, 2015 at the Energy reporting unit. The fair value of this reporting unit was determined by a combination of a discounted cash flow methodology and market comparable method. Cash flow projections for this reporting unit decreased during the fourth quarter of 2015 due to a decline in financial performance resulting from declining oil prices. The charge is reflected as Impairment of Goodwill on the Consolidated Statements of Operations.
During the year ended December 31, 2013, an impairment loss of $6.3 million was recorded for the Slashdot Media reporting unit. The fair value of this reporting unit was determined by a discounted cash flow methodology. Cash flow projections for this reporting unit decreased during the fourth quarter of 2013 due to a decline in financial performance and expectations for the business. During the year ended December 31, 2013, an impairment loss of $1.4 million was recorded for the Health Callings reporting unit. The fair value of this reporting unit was determined by a discounted cash flow methodology. During the fourth quarter of 2013, the Company determined that the Health Callings brand and website would be merged into the recently acquired Health eCareers
website. Cash flow projections for Health Callings as a separate reporting unit were not sufficient to support the goodwill recorded. The losses are recorded as Impairment of Goodwill on the Consolidated Statements of Operations.
The determination of whether or not goodwill has become impaired involves a significant level of judgment in the assumptions underlying the approach used to determine the value of our reporting units. Fair values are determined either by using a discounted cash flow methodology or by using a combination of a discounted cash flow methodology and a market comparable method. The discounted cash flow methodology is based on projections of the amounts and timing of future revenues and cash flows, assumed discount rates and other assumptions as deemed appropriate. We consider factors such as historical performance, anticipated market conditions, operating expense trends and capital expenditure requirements. Additionally, the discounted cash flows analysis takes into consideration cash expenditures for product development, other technological updates and advancements to our websites and investments to improve our candidate databases. The market comparable method indicates the fair value of a business by comparing it to publicly traded companies in similar lines of business or to comparable transactions or assets. Considerations for factors such as size, growth, profitability, risk and return on investment are analyzed and compared to the comparable businesses and adjustments are made. A market value of invested capital of the publicly traded companies is calculated and then applied to the entity’s operating results to arrive at an estimate of value. Changes in our strategy and/or market conditions could significantly impact these judgments and require adjustments to recorded amounts of goodwill.
Indefinite-Lived Acquired Intangible Assets
The indefinite-lived acquired intangible assets include the Dice trademarks and brand name. The Dice.com trademark, trade name and domain name is one of the most recognized names of online job boards. Since Dice’s inception in 1991, the brand has been recognized as a leader in recruiting and career development services for technology and engineering professionals. Currently, the brand is synonymous with the most specialized online marketplace for industry-specific talent. The brand has a significant online and offline presence in online recruiting and career development services. Considering the recognition and the awareness of the Dice brand in the talent acquisition and staffing services market, Dice’s long operating history and the intended use of the Dice brand, the remaining useful life of the Dice.com trademark, trade name and domain name was determined to be indefinite.
We determine whether the carrying value of recorded indefinite-lived acquired intangible assets is impaired on an annual basis or more frequently if indicators of potential impairment exist. The impairment review process compares the fair value of the indefinite-lived acquired intangible assets to its carrying value. If the carrying value exceeds the fair value, an impairment loss is recorded. The impairment test performed as of October 1 resulted in no impairment.
34
The determination of whether or not indefinite-lived acquired intangible assets have become impaired involves a significant level of judgment in the assumptions underlying the approach used to determine the value of the indefinite-lived acquired intangible assets. Fair values are determined using a profit allocation methodology which estimates the value of the trademark and brand name by capitalizing the profits saved because the company owns the asset. We consider factors such as historical performance, anticipated market conditions, operating expense trends and capital expenditure requirements. Changes in our strategy and/or market conditions could significantly impact these judgments and require adjustments to recorded amounts of intangible assets.
Income Taxes
We utilize the asset and liability method of accounting for income taxes. Under this method, deferred income taxes are recognized for differences between the financial statement and tax bases of assets and liabilities at enacted statutory tax rates in effect for the years in which the differences are expected to reverse. Valuation allowances are established when necessary to reduce deferred tax assets to the amounts expected to be realized. The calculation of our tax liabilities involves dealing with uncertainties in applying tax laws and regulations in numerous jurisdictions. Tax benefits from uncertain tax positions are recognized when it is more likely than not that the positions will be sustained upon examination, including resolutions of any related appeals or litigation processes, based on the technical merits. Because of the complexity of some of these uncertainties, the ultimate resolution could result in a payment that is materially different from our current estimate of the accrual for unrecognized tax benefits.
Stock and Stock Based Compensation
Under our 2012 Omnibus Equity Award Plan, we have granted stock options, restricted stock and Performance-Based Restricted Stock Units (“PSUs”) to certain of our employees and directors. Compensation expense is recorded for stock awards made to employees and directors in return for service to the Company. The expense is measured at the fair value of the award on the date of grant and recognized as compensation expense on a straight-line basis over the service period, which is the vesting period. The fair value of options granted during the years ended December 31, 2014 and 2013 was estimated on the grant date using Black-Scholes option-pricing model. No options were granted during the year ended December 31, 2015. The use of an option valuation model includes highly subjective assumptions based on long-term predictions, including the expected stock price volatility and average life of each grant. The fair value of PSUs is measured using the Monte Carlo pricing model. The expense related to the PSUs is recorded over the vesting period.
Recent Developments
Declines in oil prices have decreased demand for energy professionals worldwide. This decline in demand for energy professionals has significantly decreased the use of our energy industry job posting websites and related services. As a result, we recorded an impairment of goodwill of
$34.8 million
at the Energy segment.
The Company sold its Slashdot and SourceForge businesses (together referred to as “Slashdot Media”) to BIZX, LLC in a transaction that closed on January 27, 2016.
Cyclicality
The labor market and certain of the industries that we serve have historically experienced short-term cyclicality. However, we believe that the economic and strategic value provided by online career websites has led to an overall increase in the use of these services during the most recent labor market cycle. That increased usage has somewhat lessened the impact of cyclicality on our businesses as compared to traditional offline competitors.
Any slowdown in recruitment activity that occurs will negatively impact our revenues and results of operations. Alternatively, a decrease in the unemployment rate or a labor shortage, including as a result of an increase in job turnover, generally means that employers (including our customers) are seeking to hire more individuals, which would generally lead to more job postings and database licenses and have a positive impact on our revenues and results of operations. Based on historical trends, improvements in labor markets and the need for our services generally lag behind overall economic improvements. Additionally, there has historically been a lag from the time customers begin to increase purchases of our recruitment services and the impact to our revenues due to the recognition of revenue occurring over the length of the contract, which can be several months to a year.
Declines in oil prices in 2014 and 2015 is an example of how economic conditions can negatively impact our revenues and results of operations. As a result, we have seen decreased demand for energy professionals worldwide. This decline in demand and any future declines in demand for energy professionals could further decrease the use of our energy industry job
35
posting websites and related services. From the second half of 2011 into 2014, we saw tougher market conditions in our finance segment and a less urgent recruiting environment for technology professionals. If recruitment activity continues to be slow in the industries in which we operate during 2016 and beyond, our revenues and results of operations will be negatively impacted.
Results of Operations
Our historical financial information discussed in this Annual Report has been derived from the Company’s financial statements and accounting records for the years ended December 31, 2015, 2014 and 2013. Consolidated operating results as a percent of revenue follows:
|
|
For the year ended December 31,
|
|||||||
|
2015
|
2014
|
2013
|
||||||
|
Revenues
|
100.0
|
%
|
100.0
|
%
|
100.0
|
%
|
||
|
Operating expenses:
|
||||||||
|
Cost of revenues
|
15.1
|
%
|
14.2
|
%
|
11.0
|
%
|
||
|
Product development
|
11.5
|
%
|
9.9
|
%
|
10.5
|
%
|
||
|
Sales and marketing
|
31.5
|
%
|
31.7
|
%
|
32.2
|
%
|
||
|
General and administrative
|
17.2
|
%
|
16.0
|
%
|
16.9
|
%
|
||
|
Depreciation
|
3.6
|
%
|
4.2
|
%
|
3.8
|
%
|
||
|
Amortization of intangible assets
|
5.3
|
%
|
6.2
|
%
|
4.4
|
%
|
||
|
Impairment of goodwill
|
13.4
|
%
|
—
|
%
|
3.6
|
%
|
||
|
Impairment of intangible and fixed assets
|
—
|
%
|
—
|
%
|
3.8
|
%
|
||
|
Change in acquisition related contingencies
|
—
|
%
|
0.1
|
%
|
0.1
|
%
|
||
|
Total operating expenses
|
97.6
|
%
|
82.3
|
%
|
86.3
|
%
|
||
|
Operating income
|
2.4
|
%
|
17.7
|
%
|
13.7
|
%
|
||
|
Interest expense and other
|
(1.3
|
)%
|
(1.4
|
)%
|
(0.9
|
)%
|
||
|
Income before income taxes
|
1.2
|
%
|
16.3
|
%
|
12.8
|
%
|
||
|
Income tax expense
|
5.4
|
%
|
5.8
|
%
|
5.2
|
%
|
||
|
Net income (loss)
|
(4.2
|
)%
|
10.5
|
%
|
7.6
|
%
|
||
Comparison of Years Ended
December 31, 2015
and
2014
Revenues
|
|
Year Ended December 31,
|
Increase (Decrease)
|
Percent
Change
|
|||||||||||
|
2015
|
2014
|
|||||||||||||
|
|
(in thousands, except percentages)
|
|||||||||||||
|
Tech & Clearance
|
$
|
138,553
|
|
$
|
133,609
|
|
$
|
4,944
|
|
3.7
|
%
|
|||
|
Finance
|
36,408
|
|
36,661
|
|
(253
|
)
|
(0.7
|
)%
|
||||||
|
Energy
|
21,036
|
|
30,449
|
|
(9,413
|
)
|
(30.9
|
)%
|
||||||
|
Healthcare
|
30,762
|
|
26,913
|
|
3,849
|
|
14.3
|
%
|
||||||
|
Hospitality
|
15,954
|
|
13,656
|
|
2,298
|
|
16.8
|
%
|
||||||
|
Corporate & Other
|
17,056
|
|
21,327
|
|
(4,271
|
)
|
(20.0
|
)%
|
||||||
|
Total revenues
|
$
|
259,769
|
|
$
|
262,615
|
|
$
|
(2,846
|
)
|
(1.1
|
)%
|
|||
We experienced an increase in the Tech & Clearance segment revenue of
$4.9 million
, or
3.7%
. Revenues for related career fairs and ClearanceJobs increased by $2.3 million for the year ended
December 31, 2015
as compared to the same period in
2014
, primarily due to ClearanceJobs as a result of improved market conditions and enhanced product offerings. Revenue at Dice increased by $1.6 million compared to the same period in 2014. Our customers’ usage of our websites increased, as demonstrated through an increase in average monthly revenue per recruitment package customer of approximately
5%
from the year ended
December 31, 2014
to the year ended
December 31, 2015
. Recruitment package customer count decreased from
36
7,800
at
December 31, 2014
to
7,600
at
December 31, 2015
. Dice Europe revenue increased by $1.0 million as compared to the same period in 2014.
The Finance segment experienced a decrease in revenue of
$253,000
, or
0.7%
. Currency impact for the year ended
December 31, 2015
decreased revenue by approximately $2.6 million. In constant currency, revenues would have increased by approximately $2.3 million. In functional currency, revenue increased 12% in the Asia Pacific region, 8% in the UK, 7% in Continental Europe and 5% in North America.
Revenues for the Energy segment totaled
$21.0 million
for the year ended
December 31, 2015
, a decrease of
$9.4 million
, or
30.9%
, from the comparable
2014
period. The decrease was a result of declines in the Rigzone business due to difficult macro-environment conditions in the energy market.
The Healthcare segment, consisting of Health eCareers and BioSpace, increased revenue by
$3.8 million
, or
14.3%
from the comparable 2014 period, as a result of increased utilization by customers and enhanced product offerings. The fair value adjustment to deferred revenue decreased revenue by
$855,000
for the year ended
December 31, 2014
and did not recur in the current period.
Revenues for the Hospitality segment, which represents Hcareers, increased
$2.3 million
, or
16.8%
, primarily due to increased usage by customers. The fair value adjustment to deferred revenue decreased revenue by
$1.0 million
for the year ended
December 31, 2014
and did not recur in the current period.
Revenues from the Corporate & Other segment, which consists of revenue from Slashdot Media, WorkDigital and IT Media, decreased by
$4.3 million
or
20.0%
reflecting a decline in certain revenue streams at Slashdot Media.
Cost of Revenues
|
|
Year Ended December 31,
|
Increase
|
Percent
Change
|
|||||||||||
|
2015
|
2014
|
|||||||||||||
|
|
(in thousands, except percentages)
|
|||||||||||||
|
Cost of revenues
|
$
|
39,147
|
|
$
|
37,212
|
|
$
|
1,935
|
|
5.2
|
%
|
|||
|
Percentage of revenues
|
15.1
|
%
|
14.2
|
%
|
||||||||||
The Tech & Clearance segment experienced an increase of $1.7 million attributed to consulting, data hosting and compensation related costs. The Corporate & Other segment increased by $724,000 due to web hosting costs and additional headcount at WorkDigital of $381,000. The remaining increase in cost of revenues at the Corporate & Other segment was due to approximately $400,000 at Slashdot Media as a result of increased spending with external partners for lead generation, partially offset by a discontinued equipment lease and savings due to contract renegotiations. The Finance segment increased by $232,000 due to increased compensation costs, partially offset by savings in web hosting. The Energy segment decreased by $330,000 primarily due to fewer recruitment events in the year ended
December 31, 2015
, partially offset by increased compensation costs as a result of additional headcount. The Hospitality segment decreased $229,000 as a result of decreased compensation costs and software expenses.
Product Development Expenses
|
Year Ended December 31,
|
Increase
|
Percent
Change
|
||||||||||||
|
2015
|
2014
|
|||||||||||||
|
|
(in thousands, except percentages)
|
|||||||||||||
|
Product development
|
$
|
29,863
|
|
$
|
26,087
|
|
$
|
3,776
|
|
14.5
|
%
|
|||
|
Percentage of revenues
|
11.5
|
%
|
9.9
|
%
|
||||||||||
An increase of $2.2 million was experienced in the Tech & Clearance segment, primarily driven by additional salaries and related costs of $2.0 million for the increased number of employees. The Healthcare segment increased by $798,000 as a result of increased headcount and related compensation costs. These increases reflect our increased investment in new products and services and improving our current offerings.
Energy increased $479,000 due to additional salaries and related costs from integrating OilCareers into the Rigzone website. These increases in headcount and additional compensation-related costs reflect our increased investment in new products and technology. The Corporate & Other segment experienced an increase of $371,000 attributable primarily to
37
additional headcount of $719,000, increased salaries and related costs of approximately $560,000 due to the BrightMatter Group, partially offset by a decrease of $458,000 due to lower headcount at Corporate and decreased consulting costs of $288,000 at WorkDigital. Product development expenses at Slashdot Media decreased by approximately $200,000 as a result of lower salaries and related costs.
Sales and Marketing Expenses
|
|
Year Ended December 31,
|
Decrease
|
Percent
Change
|
|||||||||||
|
2015
|
2014
|
|||||||||||||
|
|
(in thousands, except percentages)
|
|||||||||||||
|
Sales and marketing
|
$
|
81,755
|
|
$
|
83,299
|
|
$
|
(1,544
|
)
|
(1.9
|
)%
|
|||
|
Percentage of revenues
|
31.5
|
%
|
31.7
|
%
|
||||||||||
Sales and marketing costs for the Finance segment decreased by $2.0 million. Marketing costs at the Finance segment decreased by $1.2 million primarily due to lower discretionary marketing spend of $616,000 and lower compensation-related expenses of $497,000. Sales expense at the Finance segment decreased $820,000 due to decreased employee-related expenses of $470,000 and a $350,000 decrease in commissions costs. The Energy segment sales and marketing expense decreased by $1.4 million primarily due to decreased employee-related expenses of $700,000 and decreased commissions of $675,000 as a result of lower billings. The Corporate & Other segment decreased $550,000 due to decreased salaries and related costs and commissions costs at WorkDigital of approximately $500,000, delayed hiring and turnover and lower commissions at Slashdot Media of approximately $350,000, partially offset by increased sales costs at Corporate due to overall company sales training and recognition expenses of $200,000.
The Tech & Clearance segment experienced an increase in sales and marketing expense of $1.6 million. Sales expense increased by $1.6 million primarily due to increased employee-related expenses of $1.2 million and increased commissions costs of $288,000 as a result of higher billings. Marketing costs increased $1.3 million at Dice Europe as a result of increased spending on search engine optimization, aggregators, and rebranding initiatives and decreased $1.2 million at Dice primarily due to decreased spending on advertising. The Healthcare segment experienced an increase in overall sales and marketing expense of $645,000 for the year ended
December 31, 2015
, due to increased marketing and branding initiatives.
General and Administrative Expenses
|
|
Year Ended December 31,
|
Increase
|
Percent
Change
|
|||||||||||
|
2015
|
2014
|
|||||||||||||
|
|
(in thousands, except percentages)
|
|||||||||||||
|
General and administrative
|
$
|
44,639
|
|
$
|
42,059
|
|
$
|
2,580
|
|
6.1
|
%
|
|||
|
Percentage of revenues
|
17.2
|
%
|
16.0
|
%
|
||||||||||
Stock-based compensation expense was
$10.2 million
, an increase of $2.7 million compared to the same period in
2014
. The increase was primarily due to 415,000 PSUs issued in 2015 as described in Note 12 to the Consolidated Financial Statements.
General and administrative expense for the Tech & Clearance segment decreased $1.9 million in the year ended
December 31, 2015
, as compared to the same period in
2014
, of which Dice Europe decreased $1.5 million primarily attributable to decreased compensation-related costs and lower rent expense in the current year. The remaining decrease in general and administrative expense for the Tech & Clearance segment was due to lower compensation related expenses, partially offset by increased rent and relocation costs. The $506,000 decrease in general and administrative expense for the Energy segment was primarily attributable to decreased compensation-related costs.
The Corporate & Other segment increased by $1.1 million primarily due to increased bad debt expense of $600,000 related to one customer at Slashdot Media and $439,000 related to increased professional fees. The Finance segment increased $650,000 due primarily to increased compensation-related expenses, audit fees and communication costs, partially offset by lower recruitment fees. The Healthcare segment increased by $626,000, primarily due to bad debt expense and facilities-related costs.
38
Depreciation
|
|
Year Ended December 31,
|
Decrease
|
Percent
Change
|
|||||||||||
|
2015
|
2014
|
|||||||||||||
|
(in thousands, except percentages)
|
||||||||||||||
|
Depreciation
|
$
|
9,298
|
|
$
|
10,944
|
|
$
|
(1,646
|
)
|
(15.0
|
)%
|
|||
|
Percentage of revenues
|
3.6
|
%
|
4.2
|
%
|
||||||||||
Depreciation expense for the year ended
December 31, 2015
was
$9.3 million
compared to
$10.9 million
for the same period of
2014
, a decrease of
$1.6 million
or
15.0%
. The decrease was due to lower depreciable fixed assets in the current period.
Amortization of Intangible Assets
|
|
Year Ended December 31,
|
Decrease
|
Percent
Change
|
|||||||||||
|
2015
|
2014
|
|||||||||||||
|
|
(in thousands, except percentages)
|
|||||||||||||
|
Amortization
|
$
|
13,894
|
|
$
|
16,257
|
|
$
|
(2,363
|
)
|
(14.5
|
)%
|
|||
|
Percentage of revenues
|
5.3
|
%
|
6.2
|
%
|
||||||||||
Amortization expense for the year ended
December 31, 2015
was
$13.9 million
compared to
$16.3 million
for the same period in
2014
, a decrease of
$2.4 million
or
14.5%
. Amortization expense for the year ended
December 31, 2015
decreased by $1.9 million, $709,000 and $379,000 due to certain intangible assets at Health eCareers, Rigzone and Dice Europe, respectively, becoming fully amortized. This decrease in amortization expense was partially offset by an increase of $1.3 million due to the OilCareers acquisition, accelerated due to OilCareers’ rebranding to Rigzone.
Impairment of goodwill
During the fourth quarter of 2015, we determined that the goodwill at the Energy reporting unit was impaired. The fair value of this reporting unit was determined by a combination of a discounted cash flow methodology and market comparable method. Cash flow projections for this reporting unit decreased significantly during the fourth quarter of 2015 due to the decline in demand for energy professionals, which has significantly decreased the use of our energy industry job posting websites and related services. As a result,
$34.8 million
was recorded for the impairment of goodwill.
Operating Income
Operating income for the year ended
December 31, 2015
was
$6.4 million
compared to
$46.6 million
for the same period in
2014
, a decrease of
$40.2 million
or
86.4%
. The decrease was primarily driven by the impairment of goodwill recorded at Energy of
$34.8 million
in 2015. Also contributing to the decrease was decreased revenue related to declines in the Rigzone business due to difficult macro-environment conditions in the energy market and decreased revenue related to certain revenue streams at Slashdot Media. Partially offsetting this decrease in revenue was an increase at the Healthcare and Hospitality segments as a result of increased revenues and lower amortization and depreciation expense. Additionally, the increase in headcount and compensation-related costs contributed to the decrease in operating income.
Interest Expense
|
|
Year Ended December 31,
|
Decrease
|
Percent
Change
|
|||||||||||
|
2015
|
2014
|
|||||||||||||
|
|
(in thousands, except percentages)
|
|||||||||||||
|
Interest expense
|
$
|
3,289
|
|
$
|
3,744
|
|
$
|
(455
|
)
|
(12.2
|
)%
|
|||
|
Percentage of revenues
|
1.3
|
%
|
(1.4
|
)%
|
||||||||||
Interest expense for the year ended
December 31, 2015
was
$3.3 million
compared to
$3.7 million
for the same period in
2014
, an decrease of
$0.5 million
or
12.2%
. The weighted-average debt outstanding was lower in the year ended
December 31, 2015
as compared to the same period in
2014
, resulting in lower interest expense.
39
Income Taxes
|
|
Year Ended December 31,
|
||||||
|
2015
|
2014
|
||||||
|
(in thousands, except
percentages)
|
|||||||
|
Income before income taxes
|
$
|
3,041
|
|
$
|
42,849
|
|
|
|
Income tax expense
|
14,009
|
|
15,237
|
|
|||
|
Effective tax rate
|
460.7
|
%
|
35.6
|
%
|
|||
A reconciliation of the federal statutory tax rate to the effective tax rate on continuing operations applicable to income before income tax expense follows:
|
Year Ended December 31,
|
|||||
|
2015
|
2014
|
||||
|
Federal statutory rate
|
35.0
|
%
|
35.0
|
%
|
|
|
Permanent items excluding nondeductible impairment
|
0.6
|
%
|
0.8
|
%
|
|
|
Nondeductible impairment
|
302.5
|
%
|
—
|
%
|
|
|
State taxes, net of federal effect
|
47.2
|
%
|
2.4
|
%
|
|
|
Difference between foreign and U.S. rates
|
77.8
|
%
|
(1.7
|
)%
|
|
|
Change in unrecognized tax benefits
|
1.5
|
%
|
1.8
|
%
|
|
|
Recognition of tax loss carryforwards
|
—
|
%
|
(4.3
|
)%
|
|
|
Other
|
(3.9
|
)%
|
1.6
|
%
|
|
|
Effective tax rate
|
460.7
|
%
|
35.6
|
%
|
|
The effective income tax rate was
460.7%
and
35.6%
for the years ended
December 31, 2015
and
December 31, 2014
, respectively. The tax rate was higher in the current year because the Company recorded a
$34.8 million
charge for impairment of goodwill. Of the total impairment, $33.6 million related to goodwill for which the Company had zero tax basis, and thus represented a permanent non-deductible amount for tax purposes. Based on the statutory tax rates in the jurisdictions where the impairment was recorded, the
$33.6 million
non-deductible amount resulted in tax expense of
$9.2 million
.
The impairment caused the Company’s 2015 state tax rate to differ significantly from 2014. U.S. income before taxes for the year ended December 31, 2015 included a non-deductible impairment charge of
$15.3 million
. Excluding the non-deductible impairment, the Company had U.S. income before taxes of
$34.1 million
, which resulted in state tax expense of
$1.4 million
.
The Company’s 2015 allocation of income (loss) between the U.S. and foreign jurisdictions differed significantly from 2014 due to the impact of the impairment. Income (loss) before taxes for the year ended December 31, 2015 was
$18.8 million
in the U.S. and
$(15.8) million
in foreign jurisdictions. The foreign loss included a non-deductible impairment charge of
$18.3 million
. Excluding the impairment, the Company had foreign income before taxes of
$2.5 million
, which resulted in foreign tax expense of
$914,000
.
Earnings per Share
Basic earnings (loss) per share was
$(0.21)
and
$0.53
for the years ended
December 31, 2015
and
December 31, 2014
, respectively, a decrease of
$0.74
. Diluted earnings (loss) per share was
$(0.21)
and
$0.51
, respectively, a decrease of
$0.72
. The decreases were primarily due to a decrease in net income, partially offset by decreased weighted-average shares outstanding due to stock repurchases. We recorded an impairment of goodwill of
$34.8 million
or $0.67 per diluted share related to the Energy segment.
40
Comparison of Years Ended December 31, 2014 and 2013
Revenues
|
|
Year Ended December 31,
|
Increase
|
Percent
Change
|
|||||||||||
|
2014
|
2013
|
|||||||||||||
|
|
(in thousands, except percentages)
|
|||||||||||||
|
Tech & Clearance
|
$
|
133,609
|
|
$
|
130,969
|
|
$
|
2,640
|
|
2.0
|
%
|
|||
|
Finance
|
36,661
|
|
34,997
|
|
1,664
|
|
4.8
|
%
|
||||||
|
Energy
|
30,449
|
|
23,503
|
|
6,946
|
|
29.6
|
%
|
||||||
|
Healthcare
|
26,913
|
|
5,563
|
|
21,350
|
|
N/A
|
|
||||||
|
Hospitality
|
13,656
|
|
1,389
|
|
12,267
|
|
N/A
|
|
||||||
|
Corporate & Other
|
21,327
|
|
17,061
|
|
4,266
|
|
25.0
|
%
|
||||||
|
Total revenues
|
$
|
262,615
|
|
$
|
213,482
|
|
$
|
49,133
|
|
23.0
|
%
|
|||
Our revenues were $262.6 million for the year ended December 31, 2014 compared to $213.5 million for the same period in 2013, an increase of $49.1 million, or 23.0%.
We experienced an increase in the Tech & Clearance segment revenue of $2.6 million, or 2.0%, of which the acquisition of The IT Job Board contributed $4.5 million to the increase. Revenue at Dice.com decreased by $2.1 million compared to the same period in 2013. Recruitment package customer count decreased from 8,100 at December 31, 2013 to 7,800 at December 31, 2014. Our customers’ usage of our websites increased, as demonstrated through an increase in average monthly revenue per recruitment package customer of approximately 4% from the year ended December 31, 2013 to the year ended December 31, 2014. Revenues for related career fairs and ClearanceJobs increased by $241,000 for the year ended December 31, 2014 as compared to the same period in 2013.
The Finance segment experienced an increase in revenue of $1.7 million, or 4.8%. Currency impact for the year ended December 31, 2014 increased revenue by approximately $1.6 million. In originating currency, revenue increased 3% in Continental Europe, increased 4% in the UK, decreased 4% in the Asia Pacific region (principally Australia) and decreased 8% in North America.
Revenues for the Energy segment totaled $30.4 million for the year ended December 31, 2014, an increase of $6.9 million or 29.6% from the comparable 2013 period. The acquisition of OilCareers in March 2014 contributed $6.1 million of the increase. The remaining increase was a result of increased usage of our advertising products and data services, offset by a decrease in events revenue due to a biennial industry event that did not occur in 2014.
The Healthcare segment, consisting of Health eCareers, BioSpace and Health Callings, increased revenue by $21.4 million. The acquisitions of Health eCareers and BioSpace on November 7, 2013 provided the increase.
Revenues for the Hospitality segment, which represents Hcareers, totaled $13.7 million. Hcareers was acquired on November 7, 2013. Revenues from the Corporate & Other segment, which consists of revenue from Slashdot Media and WorkDigital, increased by $4.3 million or 25.0% due to an improvement in the operations of Slashdot Media and a full year of operations of IT Media in 2014.
Cost of Revenues
|
|
Year Ended December 31,
|
Increase
|
Percent
Change
|
|||||||||||
|
2014
|
2013
|
|||||||||||||
|
|
(in thousands, except percentages)
|
|||||||||||||
|
Cost of revenues
|
$
|
37,212
|
|
$
|
23,429
|
|
$
|
13,783
|
|
58.8
|
%
|
|||
|
Percentage of revenues
|
14.2
|
%
|
11.0
|
%
|
||||||||||
Our cost of revenues for the year ended December 31, 2014 was $37.2 million compared to $23.4 million for the same period in 2013, an increase of $13.8 million, or 58.8%. The Healthcare segment increased $9.1 million due to the acquisitions of Health eCareers and BioSpace. Health eCareers has relationships with various healthcare associations which provide traffic and jobs to the website. Royalties paid to these associations are driving $5.8 million of the increase at the Healthcare segment. The Tech & Clearance segment experienced an increase of $3.1 million. Approximately $2.3 million of the $3.1 million increase was attributed to additional compensation and software subscriptions. The acquisition of The IT Job Board added
41
$770,000 to the remainder of the increase at the Tech & Clearance segment. The Hospitality segment increased $1.4 million due to the acquisition of Hcareers.
Product Development Expenses
|
Year Ended December 31,
|
Increase
|
Percent
Change
|
||||||||||||
|
2014
|
2013
|
|||||||||||||
|
|
(in thousands, except percentages)
|
|||||||||||||
|
Product Development
|
$
|
26,087
|
|
$
|
22,437
|
|
$
|
3,650
|
|
16.3
|
%
|
|||
|
Percentage of revenues
|
9.9
|
%
|
10.5
|
%
|
||||||||||
Product development expenses for the year ended December 31, 2014 were $26.1 million compared to $22.4 million for the same period in 2013, an increase of $3.7 million or 16.3%. The Healthcare segment increased by $1.9 million; the acquisition of Health eCareers and BioSpace contributed to the increase. An increase of $1.3 million was experienced in the Tech & Clearance segment, primarily driven by additional salaries and related costs of $1.5 million for the increased number of employees, partially offset by increased capitalized development costs. This increase was partially offset by decreased training, software and testing expenses of $335,000. The acquisition of The IT Job Board added the remaining $227,000 of the increase.
Product development costs for the Hospitality segment increased $1.2 million due to the acquisition of Hcareers. The Finance segment increased by $486,000 primarily driven by additional salaries and related costs related to an increased number of employees, as well as consulting fees of $260,000, and product initiatives and system upgrades totaling $250,000. Energy increased $418,000, of which the acquisition of OilCareers contributed $217,000 of the increase. The remainder of the increase in product development expenses at the Energy segment was due to salaries and related costs. The Corporate & Other segment experienced a decrease of $1.7 million attributable primarily to a decrease of $1.4 due to lower headcount at Slashdot Media, offset by $336,000 in consulting fees and a decrease of $814,000 due to lower consulting expenses in IT at Corporate.
Sales and Marketing Expenses
|
|
Year Ended December 31,
|
Increase
|
Percent
Change
|
|||||||||||
|
2014
|
2013
|
|||||||||||||
|
|
(in thousands, except percentages)
|
|||||||||||||
|
Sales and Marketing
|
$
|
83,299
|
|
$
|
68,799
|
|
$
|
14,500
|
|
21.1
|
%
|
|||
|
Percentage of revenues
|
31.7
|
%
|
32.2
|
%
|
||||||||||
Sales and marketing expenses for the year ended December 31, 2014 were $83.3 million compared to $68.8 million for the same period in 2013, an increase of $14.5 million or 21.1%. The Healthcare segment experienced an increase in overall sales and marketing expense of $5.2 million to $9.2 million for the year ended December 31, 2014, of which $7.0 million was related to the acquisition of Health eCareers and BioSpace. This $7.0 million increase was offset by decreased sales and marketing expenses at Health Callings of $1.8 million. Sales and marketing expenses for the Hospitality segment increased by $3.3 million due to increased costs related to the acquisition of Hcareers. The Energy segment sales and marketing expense increased by $2.3 million due to increased costs related to the acquisition of OilCareers.
The Tech & Clearance segment experienced an increase in sales and marketing expense of $2.0 million. The acquisition of The IT Job Board added $2.9 million to the increase in sales and marketing costs at the Tech & Clearance segment. This $2.9 million increase was partially offset by decreased marketing costs of $3.0 million due to reallocation of marketing initiatives and reduction in email campaigns at Dice.com. Sales expense increased by $2.0 million due to increased commissions costs as a result of higher billings, additional headcount and increased employee-related expenses. Sales and marketing costs for the Finance segment increased by $1.2 million primarily due to a $1.3 million increase in commissions costs as a result of higher billings and increased employee-related expenses. Marketing costs at the Finance segment decreased by $184,000 due to timing of marketing spend.
42
General and Administrative Expenses
|
|
Year Ended December 31,
|
Increase
|
Percent
Change
|
|||||||||||
|
2014
|
2013
|
|||||||||||||
|
|
(in thousands, except percentages)
|
|||||||||||||
|
General and administrative
|
$
|
42,059
|
|
$
|
36,129
|
|
$
|
5,930
|
|
16.4
|
%
|
|||
|
Percentage of revenues
|
16.0
|
%
|
16.9
|
%
|
||||||||||
General and administrative expenses for the year ended December 31, 2014 were $42.1 million compared to $36.1 million for the same period in 2013, an increase of $5.9 million or 16.4%.
Stock-based compensation expense was $7.5 million, a decrease of approximately $630,000 compared to the same period in 2013. The decrease was due to the lower value of equity awards recognized in the current period.
General and administrative expense for the Tech & Clearance segment increased $2.3 million in the year ended December 31, 2014, as compared to the same period in 2013 due to increases of $1.2 million related to recruitment fees, employee-related expenses, additional headcount and additional office space, a majority of which was related to the expansion of Dice.com’s presence in Silicon Valley. The remaining increase of approximately $1.1 million at the Tech & Clearance segment was due to costs related to The IT Job Board business. The Healthcare and Hospitality segments increased by $2.1 million and $919,000, respectively, due to the acquisitions of Health eCareers and BioSpace and Hcareers, respectively. The $1.2 million increase in general and administrative expense for the Energy segment was primarily attributable to costs related to the OilCareers acquisition. The Finance segment increased $459,000 due primarily to increased recruiting fees.
Depreciation
|
|
Year Ended December 31,
|
Increase
|
Percent
Change
|
|||||||||||
|
2014
|
2013
|
|||||||||||||
|
(in thousands, except percentages)
|
||||||||||||||
|
Depreciation
|
$
|
10,944
|
|
$
|
8,065
|
|
$
|
2,879
|
|
35.7
|
%
|
|||
|
Percentage of revenues
|
4.2
|
%
|
3.8
|
%
|
||||||||||
Depreciation expense for the year ended December 31, 2014 was $10.9 million compared to $8.1 million for the same period of 2013, an increase of $2.9 million or 35.7%. The increase was primarily related to the addition of onTargetjobs and The IT Job Board assets, which increased depreciation expense by $2.4 million and $361,000, respectively. The remaining increase in depreciation was the result of other capital additions to hardware, software, and web development costs in the Tech & Clearance segment.
Amortization of Intangible Assets
|
|
Year Ended December 31,
|
Increase
|
Percent
Change
|
|||||||||||
|
2014
|
2013
|
|||||||||||||
|
|
(in thousands, except percentages)
|
|||||||||||||
|
Amortization
|
$
|
16,257
|
|
$
|
9,336
|
|
$
|
6,921
|
|
74.1
|
%
|
|||
|
Percentage of revenues
|
6.2
|
%
|
4.4
|
%
|
||||||||||
Amortization expense for the year ended December 31, 2014 was $16.3 million compared to $9.3 million for the same period in 2013, an increase of $6.9 million or 74.1%. Amortization expense for the year ended December 31, 2014 increased due to the onTargetjobs, The IT Job Board and OilCareers acquisitions of $4.3 million, $2.1 million and $2.9 million, respectively. This increase was offset by decreased amortization expense due to the write off of intangible assets at Slashdot Media at December 31, 2013 and certain intangible assets at Rigzone and WorkDigital becoming fully amortized.
Impairment of goodwill
The goodwill of $6.3 million related to Slashdot Media was written off in the fourth quarter of 2013 as a result of the decline in the financial performance of the business and expectations of future performance in line with 2013 results. The fair value of this reporting unit was determined by a discounted cash flow methodology.
43
During the fourth quarter of 2013, we determined that the goodwill at Health Callings’ reporting unit was impaired. The fair value of this reporting unit was determined by a discounted cash flow methodology. Cash flow projections for this reporting unit decreased significantly during the fourth quarter of 2013 due to the acquisition of the healthcare recruiting website, Health eCareers. As a result, $1.4 million was recorded for the impairment of goodwill.
Impairment of intangible and fixed assets
The unamortized intangible assets of $7.2 million related to Slashdot Media were written off in the fourth quarter of 2013 as a result of the decline in the financial performance of the business and expectations of future performance in line with 2013 results. Fixed assets of $916,000 related to Slashdot Media and Health Callings were written off in the fourth quarter of 2013. These fixed assets consisted of website development costs, which were determined to have no future value.
Change in Acquisition Related Contingencies
The change in acquisition related contingencies was an expense of $153,000 for the year ended December 31, 2014 due to The IT Job Board and WorkDigital acquisitions, compared to $197,000 of expense in the prior year period due to The IT Job Board and WorkDigital acquisitions. In January 2014, a payment of $824,000 related to The IT Job Board was made to the seller. In October 2014, a final deferred purchase price payment of $5.0 million related to the WorkDigital acquisition was made to the seller. We expect deferred purchase price payments totaling approximately $4 million to be paid in the first quarter of 2015 related to The IT Job Board.
Operating Income
Operating income for the year ended December 31, 2014 was $46.6 million compared to $29.2 million for the same period in 2013, an increase of $17.4 million or 59.6%. The increase was the result of the increase in revenues, primarily related to the acquired businesses of onTargetjobs, OilCareers and The IT Job Board and offset by increased expenses due to these acquired businesses. Additionally, there was a write off of goodwill and intangibles and fixed assets of Slashdot Media and Health Callings of $15.9 million in 2013.
Interest Expense
|
|
Year Ended December 31,
|
Increase
|
Percent
Change
|
|||||||||||
|
2014
|
2013
|
|||||||||||||
|
|
(in thousands, except percentages)
|
|||||||||||||
|
Interest expense
|
$
|
3,744
|
|
$
|
1,906
|
|
$
|
1,838
|
|
96.4
|
%
|
|||
|
Percentage of revenues
|
1.4
|
%
|
0.9
|
%
|
||||||||||
Interest expense for the year ended December 31, 2014 was $3.7 million compared to $1.9 million for the same period in 2013, an increase of $1.8 million or 96.4%. The weighted-average debt outstanding was higher in the period ended December 31, 2014 as compared to the same period in 2013 due to additional borrowings for the onTargetjobs acquisition.
Income Taxes
|
|
Year Ended December 31,
|
||||||
|
2014
|
2013
|
||||||
|
(in thousands, except
percentages)
|
|||||||
|
Income before income taxes
|
$
|
42,849
|
|
$
|
27,295
|
|
|
|
Income tax expense
|
15,237
|
|
11,049
|
|
|||
|
Effective tax rate
|
35.6
|
%
|
40.5
|
%
|
|||
The effective income tax rate was 35.6% and 40.5% for the year ended December 31, 2014 and December 31, 2013, respectively. The tax rate was lower in the current period because the Company recognized a benefit related to tax loss carryovers obtained in the onTargetjobs acquisition. The effective tax rate may increase or decrease due to many factors including the mix in the allocation of income between states within the U.S. or between the U.S and other jurisdictions.
44
A reconciliation of the federal statutory tax rate to the effective tax rate on continuing operations applicable to income before income tax expense follows:
|
Year Ended December 31,
|
|||||
|
2014
|
2013
|
||||
|
Federal statutory rate
|
35.0
|
%
|
35.0
|
%
|
|
|
Tax effect of permanent items
|
0.8
|
%
|
0.8
|
%
|
|
|
State taxes, net of federal effect
|
2.4
|
%
|
4.0
|
%
|
|
|
Difference between foreign and U.S. rates
|
(1.7
|
)%
|
(0.5
|
)%
|
|
|
Change in unrecognized tax benefits
|
1.8
|
%
|
1.1
|
%
|
|
|
Recognition of tax loss carryforwards
|
(4.3
|
)%
|
—
|
%
|
|
|
Other
|
1.6
|
%
|
0.1
|
%
|
|
|
Effective tax rate
|
35.6
|
%
|
40.5
|
%
|
|
Earnings per Share
Basic earnings per share was $0.53 and $0.29 for the year ended December 31, 2014 and December 31, 2013, respectively, an increase of $0.24 or 83%. Diluted earnings per share was $0.51 and $0.27, respectively, an increase of $0.24 or 89%. The increases were primarily due to an increase in net income and decreased weighted-average shares outstanding due to stock repurchases.
Liquidity and Capital Resources
Non-GAAP Measures
We have provided certain non-GAAP financial information as additional information for our operating results. These measures are not in accordance with, or an alternative for measures in accordance with GAAP and may be different from similarly titled non-GAAP measures reported by other companies. We believe the presentation of non-GAAP measures, such as Adjusted EBITDA, and free cash flow, provides useful information to management and investors regarding certain financial and business trends relating to our financial condition and results of operations.
Adjusted EBITDA
Adjusted EBITDA is a non-GAAP metric used by management to measure operating performance. Management uses Adjusted EBITDA as a performance measure for internal monitoring and planning, including preparation of annual budgets, analyzing investment decisions and evaluating profitability and performance comparisons between us and our competitors. We also use this measure to calculate amounts of performance based compensation under the senior management incentive bonus program. Adjusted EBITDA, as defined in our Credit Agreement as “Consolidated EBITDA”, represents net income plus (to the extent deducted in calculating such net income) interest expense, income tax expense, depreciation and amortization, non-cash stock option expenses, losses resulting from certain dispositions outside the ordinary course of business, certain writeoffs in connection with indebtedness, impairment charges with respect to long-lived assets, expenses incurred in connection with an equity offering or any other offering of securities by the Company, extraordinary or non-recurring non-cash expenses or losses, transaction costs in connection with the Credit Agreement up to $250,000, deferred revenues written off in connection with acquisition purchase accounting adjustments, writeoff of non-cash stock compensation expense, and business interruption insurance proceeds, minus (to the extent included in calculating such net income) non-cash income or gains, interest income, and any income or gain resulting from certain dispositions outside of the ordinary course of business.
We also consider Adjusted EBITDA, as defined above, to be an important indicator to investors because it provides information related to our ability to provide cash flows to meet future debt service, capital expenditures and working capital requirements and to fund future growth, as well as to monitor compliance with financial covenants. We present Adjusted EBITDA as a supplemental performance measure because we believe that this measure provides our board of directors, management and investors with additional information to measure our performance, provide comparisons from period to period and company to company by excluding potential differences caused by variations in capital structures (affecting interest expense) and tax positions (such as the impact on periods or companies of changes in effective tax rates or net operating losses), and to estimate our value.
45
We present Adjusted EBITDA because covenants in our Credit Agreement contain ratios based on this measure. Our Credit Agreement is material to us because it is one of our primary sources of liquidity. If our Adjusted EBITDA were to decline below certain levels, covenants in our Credit Agreement that are based on Adjusted EBITDA may be violated and could cause a default and acceleration of payment obligations under our Credit Agreement. See Note 8 “Indebtedness” for additional information on the covenants for our Credit Agreement.
Adjusted EBITDA is not a measurement of our financial performance under GAAP and should not be considered as an alternative to net income, operating income or any other performance measures derived in accordance with GAAP or as an alternative to cash flow from operating activities as a measure of our profitability or liquidity.
We understand that although Adjusted EBITDA is frequently used by securities analysts, lenders and others in their evaluation of companies, Adjusted EBITDA has limitations as an analytical tool, and you should not consider it in isolation, or as a substitute for analysis of our liquidity or results as reported under GAAP. Some limitations are:
|
•
|
Adjusted EBITDA does not reflect our cash expenditures, or future requirements for capital expenditures or contractual commitments;
|
|
•
|
Adjusted EBITDA does not reflect changes in, or cash requirements for, our working capital needs;
|
|
•
|
Adjusted EBITDA does not reflect the significant interest expense, or the cash requirements necessary to service interest or principal payments on your debt;
|
|
•
|
Although depreciation and amortization are non-cash charges, the assets being depreciated and amortized often will have to be replaced in the future, and Adjusted EBITDA does not reflect any cash requirements for such replacements; and
|
|
•
|
Other companies in our industry may calculate Adjusted EBITDA differently than we do, limiting its usefulness as a comparative measure.
|
To compensate for these limitations, management evaluates our liquidity by considering the economic effect of excluded expense items independently, as well as in connection with its analysis of cash flows from operations and through the use of other financial measures, such as capital expenditure budget variances, investment spending levels and return on capital analysis.
46
A reconciliation of Adjusted EBITDA for the years ending
December 31, 2015
,
2014
and
2013
(in thousands) follows:
|
Year ended December 31,
|
|||||||||||
|
2015
|
2014
|
2013
|
|||||||||
|
Reconciliation of Net Income (loss) to Adjusted EBITDA:
|
|||||||||||
|
Net income (loss)
|
$
|
(10,968
|
)
|
$
|
27,612
|
|
$
|
16,246
|
|
||
|
Interest expense
|
3,289
|
|
3,744
|
|
1,906
|
|
|||||
|
Interest income
|
—
|
|
—
|
|
(30
|
)
|
|||||
|
Income tax expense
|
14,009
|
|
15,237
|
|
11,049
|
|
|||||
|
Depreciation
|
9,298
|
|
10,944
|
|
8,065
|
|
|||||
|
Amortization of intangible assets
|
13,894
|
|
16,257
|
|
9,336
|
|
|||||
|
Change in acquisition related contingencies
|
—
|
|
153
|
|
197
|
|
|||||
|
Impairment of goodwill
|
34,818
|
|
—
|
|
7,728
|
|
|||||
|
Non-cash stock compensation expense
|
10,185
|
|
7,498
|
|
8,131
|
|
|||||
|
Deferred revenue adjustment
|
—
|
|
2,887
|
|
1,773
|
|
|||||
|
Impairment of intangible and fixed assets
|
—
|
|
—
|
|
8,156
|
|
|||||
|
Other
|
25
|
|
11
|
|
35
|
|
|||||
|
Adjusted EBITDA
|
$
|
74,550
|
|
$
|
84,343
|
|
$
|
72,592
|
|
||
|
Reconciliation of Operating Cash Flows to Adjusted EBITDA:
|
|||||||||||
|
Net cash provided by operating activities
|
$
|
60,809
|
|
$
|
55,543
|
|
$
|
49,365
|
|
||
|
Interest expense
|
3,289
|
|
3,744
|
|
1,906
|
|
|||||
|
Amortization of deferred financing costs
|
(402
|
)
|
(365
|
)
|
(264
|
)
|
|||||
|
Interest income
|
—
|
|
—
|
|
(30
|
)
|
|||||
|
Income tax expense
|
14,009
|
|
15,237
|
|
11,049
|
|
|||||
|
Deferred income taxes
|
989
|
|
3,698
|
|
7,482
|
|
|||||
|
Change in accrual for unrecognized tax benefits
|
(44
|
)
|
(774
|
)
|
(116
|
)
|
|||||
|
Change in accounts receivable
|
2,140
|
|
9,709
|
|
1,438
|
|
|||||
|
Change in deferred revenue
|
571
|
|
(8,767
|
)
|
(2,378
|
)
|
|||||
|
Deferred revenue adjustment
|
—
|
|
2,887
|
|
1,773
|
|
|||||
|
Changes in working capital and other
|
(6,811
|
)
|
3,431
|
|
2,367
|
|
|||||
|
Adjusted EBITDA
|
$
|
74,550
|
|
$
|
84,343
|
|
$
|
72,592
|
|
||
Net Income Excluding Impairment Charge
Net Income excluding impairment charge is a non-GAAP metric used by management to measure operating performance after removing the impact of the non-cash impairment charge. Net Income excluding impairment charge is defined as Net Income less impairment charge, net of income taxes. A reconciliation of Net Income excluding impairment charge for the years ending
December 31, 2015
,
2014
and
2013
(in thousands) follows:
|
Year ended December 31,
|
|||||||||||
|
2015
|
2014
|
2013
|
|||||||||
|
Net income (loss)
|
$
|
(10,968
|
)
|
$
|
27,612
|
|
$
|
16,246
|
|
||
|
Less impact of impairment charge, net of taxes
|
34,246
|
|
—
|
|
10,317
|
|
|||||
|
Net income, excluding impairment charge
|
$
|
23,278
|
|
$
|
27,612
|
|
$
|
26,563
|
|
||
47
Diluted Earnings per Share Excluding Impairment Charge
Diluted earnings per share excluding impairment charge is a non-GAAP metric used by management to measure operating performance after removing the impact of the non-cash impairment charge. Diluted earnings per share excluding impairment charge is defined as diluted earnings (loss) per share less impact per share of impairment charge. A reconciliation of Diluted Earnings per Share excluding impairment charge for the years ending
December 31, 2015
,
2014
and
2013
(in thousands) follows:
|
Year ended December 31,
|
|||||||||||
|
2015
|
2014
|
2013
|
|||||||||
|
Diluted Earnings (Loss) per Share
|
$
|
(0.21
|
)
|
$
|
0.51
|
|
$
|
0.27
|
|
||
|
Less impact per share of impairment charge
|
0.67
|
|
—
|
|
0.18
|
|
|||||
|
Diluted Earnings per Share, excluding impairment charge
|
$
|
0.46
|
|
$
|
0.51
|
|
$
|
0.45
|
|
||
Adjusted Revenues
Adjusted Revenues is a non-GAAP metric used by management to measure the operating performance of our acquisitions. Adjusted Revenues represents Revenues plus the add back of the fair value adjustment to deferred revenue related to purchase accounting of acquisitions.
Adjusted EBITDA Margin
Adjusted EBITDA Margin is a non-GAAP metric used by management to measure the operating performance. Adjusted EBITDA Margin is computed as Adjusted EBITDA divided by Adjusted Revenues. A reconciliation of Adjusted Revenues and Adjusted EBITDA Margin for the years ending
December 31, 2015
,
2014
and
2013
(in thousands) follows:
|
Year ended December 31,
|
|||||||||||
|
2015
|
2014
|
2013
|
|||||||||
|
Revenues
|
$
|
259,769
|
|
$
|
262,615
|
|
$
|
213,482
|
|
||
|
Add back fair value adjustment to deferred revenue
|
—
|
|
2,887
|
|
1,773
|
|
|||||
|
Adjusted Revenues
|
$
|
259,769
|
|
$
|
265,502
|
|
$
|
215,255
|
|
||
|
Adjusted EBITDA
|
$
|
74,550
|
|
$
|
84,343
|
|
$
|
72,592
|
|
||
|
Adjusted EBITDA Margin
|
29
|
%
|
32
|
%
|
34
|
%
|
|||||
Adjusted Revenues Excluding Slashdot Media
Adjusted Revenues excluding Slashdot Media is a non-GAAP metric used by management to measure operating performance going forward given our sale of Slashdot Media. Adjusted Revenues excluding Slashdot Media represents Adjusted Revenues as defined above less Slashdot Media revenue.
Adjusted EBITDA Excluding Slashdot Media
Adjusted EBITDA excluding Slashdot Media is a non-GAAP metric used by management to measure operating performance going forward given our sale of Slashdot Media. Adjusted EBITDA excluding Slashdot Media, represents Adjusted EBITDA as defined above, less Slashdot Media EBITDA
.
48
Adjusted EBITDA Margin Excluding Slashdot Media
Adjusted EBITDA Margin excluding Slashdot Media is a non-GAAP metric used by management to measure operating performance going forward given our sale of Slashdot Media. Adjusted EBITDA Margin excluding Slashdot Media is computed as Adjusted EBITDA, excluding Slashdot Media, divided by Adjusted Revenues, excluding Slashdot Media. A reconciliation of Adjusted Revenues excluding Slashdot Media, Adjusted EBITDA excluding Slashdot Media and Adjusted EBITDA Margin excluding Slashdot Media for the years ending
December 31, 2015
,
2014
and
2013
(in thousands) follows:
|
Year ended December 31,
|
|||||||||||
|
2015
|
2014
|
2013
|
|||||||||
|
Adjusted Revenues
|
$
|
259,769
|
|
$
|
265,502
|
|
$
|
215,255
|
|
||
|
Less impact of Slashdot Media
|
14,819
|
|
18,240
|
|
15,918
|
|
|||||
|
Adjusted Revenues, excluding Slashdot Media
|
$
|
244,950
|
|
$
|
247,262
|
|
$
|
199,337
|
|
||
|
Adjusted EBITDA
|
$
|
74,550
|
|
$
|
84,343
|
|
$
|
72,592
|
|
||
|
Less impact of Slashdot Media
|
1,663
|
|
5,389
|
|
1,204
|
|
|||||
|
Adjusted EBITDA, excluding Slashdot Media
|
$
|
72,887
|
|
$
|
78,954
|
|
$
|
71,388
|
|
||
|
Adjusted EBITDA Margin, excluding Slashdot Media
|
30
|
%
|
32
|
%
|
36
|
%
|
|||||
Revenue Growth in Constant Currency
Revenue growth in constant currency is a non-GAAP metric used by management to measure operating performance excluding the impact of the change in foreign currency exchange rates. To measure revenue growth in constant currency, we remove the impact of changes in foreign currency exchange rates that affect the comparability and trend of revenue. Revenue growth in constant currency is calculated by translating current year results at prior year average foreign currency exchange rates. A reconciliation of revenue growth in constant currency (in thousands) follows:
|
|
Year ended December 31,
|
|||||||||||||
|
2015
|
2014
|
Increase (Decrease)
|
Percent Change
|
|||||||||||
|
Finance segment revenues
|
$
|
36,408
|
|
$
|
36,661
|
|
$
|
(253
|
)
|
(0.7
|
)%
|
|||
|
Currency impact
|
2,565
|
|
—
|
|
N/A
|
|
N/A
|
|
||||||
|
Finance segment revenues, in constant currency
|
$
|
38,973
|
|
$
|
36,661
|
|
$
|
2,312
|
|
6.3
|
%
|
|||
Free Cash Flow
We define free cash flow as net cash provided by operating activities minus capital expenditures. We believe free cash flow is an important non-GAAP measure for management and investors as it provides useful cash flow information regarding our ability to service, incur or pay down indebtedness or repurchase our common stock. We use free cash flow as a measure to reflect cash available to service our debt as well as to fund our expenditures. A limitation of using free cash flow versus the GAAP measure of net cash provided by operating activities is free cash flow does not represent the total increase or decrease in the cash balance from operations for the period since it includes cash used for capital expenditures during the period.
We have summarized our free cash flow for the years ended
December 31, 2015
,
2014
and
2013
(in thousands).
|
|
Year ended December 31,
|
||||||||||
|
2015
|
2014
|
2013
|
|||||||||
|
Cash from operating activities
|
$
|
60,809
|
|
$
|
55,543
|
|
$
|
49,365
|
|
||
|
Purchases of fixed assets
|
(9,078
|
)
|
(8,710
|
)
|
(10,555
|
)
|
|||||
|
Free cash flow
|
$
|
51,731
|
|
$
|
46,833
|
|
$
|
38,810
|
|
||
49
Cash Flows
We have summarized our cash flows for the years ended
December 31, 2015
,
2014
and
2013
(in thousands).
|
|
Year Ended December 31,
|
||||||||||
|
2015
|
2014
|
2013
|
|||||||||
|
Cash from operating activities
|
$
|
60,809
|
|
$
|
55,543
|
|
$
|
49,365
|
|
||
|
Cash from investing activities
|
(9,078
|
)
|
(35,711
|
)
|
(66,967
|
)
|
|||||
|
Cash from financing activities
|
(44,662
|
)
|
(31,413
|
)
|
16,439
|
|
|||||
We have financed our operations primarily through cash provided by operating activities and borrowings under our revolving credit facility. At
December 31, 2015
, we had cash of
$34.1 million
compared to
$26.8 million
at
December 31, 2014
. Cash held in non-United States jurisdictions totaled approximately $25.8 million at
December 31, 2015
. This cash is indefinitely reinvested in those jurisdictions. Cash balances and cash generation in the United States, along with the unused portion of our revolving credit facility, is sufficient to maintain liquidity and meet our obligations without being dependent on our foreign cash and earnings.
Liquidity
Our principal internal sources of liquidity is cash, as well as the cash flow that we generate from our operations. In addition, externally, we had
$149.0 million
in borrowing capacity under our Credit Agreement at
December 31, 2015
. We believe that our existing cash, cash generated from operations and available borrowings under our Credit Agreement will be sufficient to satisfy our currently anticipated cash requirements through at least the next 12 months and the foreseeable future thereafter. However, it is possible that one or more lenders under the revolving credit facility may refuse or be unable to satisfy their commitment to lend to us or we may need to refinance our debt and be unable to do so. In addition, our liquidity could be negatively affected by a decrease in demand for our products and services. We may also make acquisitions and may need to raise additional capital through future debt financings or equity offerings to the extent necessary to fund such acquisitions, which we may not be able to do on a timely basis or on terms satisfactory to us or at all.
Comparison of Years Ended December 31, 2015 and 2014
Operating Activities
Net cash flows from operating activities primarily consists of net income adjusted for certain non-cash items, including depreciation, amortization, changes in deferred tax assets and liabilities, stock based compensation, impairment of goodwill and the effect of changes in working capital. Net cash flows from operating activities were
$60.8 million
and
$55.5 million
for the years ended
December 31, 2015
and
2014
, respectively. Cash inflow from operations is driven by earnings and is dependent on the amount and timing of billings and cash collection from our customers. Additionally, the timing of tax payments impacted cash flows from operations in the years ended
December 31, 2015
and
2014
.
Investing Activities
During the year ended
December 31, 2015
, cash used by investing activities was
$9.1 million
compared to cash used of
$35.7 million
in the year ended
December 31, 2014
. Cash used by investing activities in the year ended
December 31, 2015
was attributable to the
$9.1 million
used to purchase fixed assets. Cash used by investing activities in the year ended
December 31, 2014
was primarily attributable to the
$27.0 million
used to purchase the business of OilCareers and
$8.7 million
used to purchase fixed assets.
Financing Activities
Cash used for financing activities during the year ended
December 31, 2015
was
$44.7 million
compared to cash used of
$31.4 million
in the year ended
December 31, 2014
. The cash used during the current period was primarily due to
$38.2 million
of payments to repurchase the Company’s common stock,
$9.5 million
used in net repayments on long-term debt, and
$3.8 million
in payment of acquisition related contingencies related to The IT Job Board acquisition, partially offset by
$7.0 million
in proceeds from stock option exercises. During the year ended
December 31, 2014
, the cash provided was primarily due to $33.0 million of payments to repurchase the Company’s common stock,
$8.5 million
used in net repayments of long-term debt, and $5.8 million in payment of acquisition related contingencies related to the IT Job Board and WorkDigital, partially offset by $14.1 million in proceeds from stock option exercises.
50
Comparison of Years Ended December 31, 2014 and 2013
Operating Activities
Net cash flows from operating activities primarily consists of net income adjusted for certain non-cash items, including depreciation, amortization, changes in deferred tax assets and liabilities, stock based compensation, and the effect of changes in working capital. Net cash flows from operating activities were $55.5 million and $49.4 million for the years ended December 31, 2014 and 2013, respectively. Cash inflow from operations is driven by earnings and is dependent on the amount and timing of billings and cash collection from our customers. Additionally, the timing of tax payments impacted cash flows from operations.
Investing Activities
During the year ended December 31, 2014, cash used by investing activities was $35.7 million compared to cash used of $67.0 million in the year ended December 31, 2013. Cash used by investing activities in the year ended December 31, 2014 was attributable to the $26.4 million in cash used to purchase the business of OilCareers and $0.6 million was paid to settle certain working capital requirements related to the onTargetjobs acquisition. Cash used by investing activities in the year ended December 31, 2013 was primarily attributable to the $58.6 million used to purchase the businesses of onTargetjobs and The IT Job Board.
Financing Activities
Cash used for financing activities during the year ended December 31, 2014 was $31.4 million compared to cash provided of $16.4 million in the year ended December 31, 2013. The cash used during the current period was primarily due to $33.0 million of payments to repurchase the Company’s common stock, $37.5 million used in repayment of long-term debt, and $5.8 million in payments of acquisition related contingencies related to The IT Job Board and WorkDigital, offset by $29.0 million in proceeds from long-term debt and $14.1 million in proceeds from stock option exercises. During the year ended December 31, 2013, the cash provided was primarily due to $103.0 million in proceeds from long-term debt, partially offset by $55.7 million of payments to repurchase the Company’s common stock and $30.0 million used in repayment of long-term debt.
Financings and Capital Requirements
Credit Agreement
In November 2015, we entered into a new Credit Agreement, which provides for a revolving loan facility of $250.0 million, maturing in November 2020. The Company borrowed $105.0 million under the new Credit Agreement to repay in full all outstanding indebtedness under the previously existing credit agreement dated October 2013, terminating that agreement. A portion of the proceeds was also used to pay certain costs associated with the Credit Agreement and for working capital purposes.
Borrowings under the Credit Agreement bear interest, at the Company’s option, at a LIBOR rate or base rate plus a margin. The margin ranges from 1.75% to 2.50% on LIBOR loans and 0.75% to 1.50% on base rate loans, determined by the Company’s most recent consolidated leverage ratio.
The facility may be prepaid at any time without penalty.
The Credit Agreement contains various customary affirmative and negative covenants and also contains certain financial covenants, including a consolidated leverage ratio and a consolidated interest coverage ratio. As of December 31, 2015, our consolidated leverage ratio was 1.35 to 1.0 and was required to be less than 3.0 to 1.0. Our consolidated interest coverage ratio was 22.4 to 1.0 and was required to be greater than 3.5 to 1.0. Negative covenants include restrictions on incurring certain liens; making certain payments, such as stock repurchases and dividend payments; making certain investments; making certain acquisitions; and incurring additional indebtedness. Restricted payments are allowed under the Credit Agreement to the extent the consolidated leverage ratio, calculated on a pro forma basis, is equal to or less than 2.0 to 1.0, plus an additional $5.0 million of restricted payments. The Credit Agreement also provides that the payment of obligations may be accelerated upon the occurrence of customary events of default, including, but not limited to, non-payment, change of control, or insolvency. As of December 31, 2015, the Company was in compliance with all of the financial covenants under the Credit Agreement. Refer to Note 8 in the Notes to the Consolidated Financial Statements included in Item 8 of this Annual Report.
Offerings of Stock
In October 2013, we filed a registration statement on Form S-3 (File No. 333-191962) with the SEC, as amended by Amendment No. 1 to Form S-3 dated December 13, 2013, that allows the Company to offer, from time to time, up to an
51
aggregate of $50,000,000 in shares of the Company’s common stock or preferred stock, or any combination thereof, in one or more offerings in amounts, at prices and on terms that the Company determines at the time of the offering.
In addition, we registered an aggregate of up to 21,543,135 shares of the Company’s common stock for resale by certain selling stockholders (including stockholders affiliated with General Atlantic LLC and Quadrangle Group LLC) from time to time in one or more offerings. In September 2014, we completed a public offering, whereby certain selling stockholders affiliated with General Atlantic LLC sold 2,500,000 shares of common stock registered pursuant to such registration statement. Based solely on a review of public filings, as of December 31, 2015, the General Atlantic LLC stockholders no longer beneficially owned any shares of our common stock. On November 12, 2015 and December 8, 2015, stockholders affiliated with Quadrangle Group LLC distributed 3,700,000 shares and 2,500,000 shares respectively to their investors. Such distributions were not registered offerings. Based solely on a review of public filings, as of December 31, 2015, the Quadrangle Group LLC stockholders beneficially owned 2,483,661 shares of our common stock. We did not receive any proceeds relating to any foregoing offering or distribution by stockholders affiliated with General Atlantic LLC or Quadrangle Group LLC.
Other Capital Requirements
We anticipate capital expenditures in 2016 to be approximately $10 million to $12 million. We intend to use operating cash flows to fund capital expenditures.
Off-Balance Sheet Arrangements
We have no off-balance sheet arrangements that have or are reasonably likely to have a current or future effect on our financial condition, changes in financial condition, revenues or expenses, results of operations, liquidity, capital expenditures or capital resources that is material to investors.
Commitments and Contingencies
The following table presents certain minimum payments due and the estimated timing under contractual obligations with minimum firm commitments as of
December 31, 2015
:
|
|
Payments due by period
|
||||||||||||||||||
|
Total
|
Less Than 1 Year
|
2-3 Years
|
4-5 Years
|
More Than 5 Years
|
|||||||||||||||
|
|
(in thousands)
|
||||||||||||||||||
|
Credit Agreement
|
$
|
101,000
|
|
$
|
—
|
|
$
|
—
|
|
$
|
101,000
|
|
$
|
—
|
|
||||
|
Operating lease obligations
|
25,682
|
|
4,182
|
|
7,608
|
|
6,686
|
|
7,206
|
|
|||||||||
|
Total contractual obligations
|
$
|
126,682
|
|
$
|
4,182
|
|
$
|
7,608
|
|
$
|
107,686
|
|
$
|
7,206
|
|
||||
We make commitments to purchase advertising from online vendors which we pay for on a monthly basis. We have no significant long-term obligations to purchase a fixed or minimum amount with these vendors.
Our principal commitments consist of obligations under operating leases for office space and equipment and long-term debt. As of
December 31, 2015
, we had
$101.0 million
outstanding under our Credit Agreement. Interest payments are due quarterly or at varying, specified periods (to a maximum of three months) based on the type of loan (LIBOR or base rate loan) we choose. See Note 8 “Indebtedness” in our consolidated financial statements for additional information related to our Credit Agreement.
Future interest payments on our Credit Agreement are variable due to our interest rate being based on a LIBOR rate or a base rate. Assuming an interest rate of 2.25% (the rate in effect on
December 31, 2015
) on our current borrowings, interest payments are expected to be $5.6 million for both 2016-2017 and 2018-2019, and $2.6 million in 2020.
As of
December 31, 2015
, we recorded approximately
$3.4 million
of unrecognized tax benefits as liabilities, and we are uncertain if or when such amounts may be settled. Related to the unrecognized tax benefits considered permanent differences, we have also recorded a liability for potential penalties and interest. Included in the balance of unrecognized tax benefits at
December 31, 2015
are
$3.4 million
of tax benefits that if recognized, would affect the effective tax rate. The Company believes it is reasonably possible that as much as $829,000 of its unrecognized tax benefits may be recognized in the next twelve months as a result of a lapse of the statute of limitations.
52
Recent Accounting Pronouncements
For a discussion of new accounting pronouncements affecting the Company, refer to Note 2 of Notes to Consolidated Financial Statements included in Item 8 of this Annual Report.
|
Item 7A.
|
Quantitative and Qualitative Disclosures about Market Risk
|
We have exposure to financial market risks, including changes in foreign currency exchange rates, interest rates, and other relevant market prices.
Foreign Exchange Risk
We conduct business serving multiple markets, in four languages, mainly across Europe, Asia, Australia, and North America using the eFinancialCareers name. Rigzone, Slashdot Media, Dice Europe and Hcareers also conduct business outside the United States. For the years ended
December 31, 2015
and
2014
, approximately
28%
and
29%
of our revenues, respectively, were earned outside the United States and collected in local currency. We are subject to risk for exchange rate fluctuations between such local currencies and the pound sterling and between local currencies and the United States dollar and the subsequent translation of the pound sterling to United States dollars. We currently do not hedge currency risk. A decrease in foreign exchange rates during a period would result in decreased amounts reported in our Consolidated Balance Sheets, Consolidated Statements of Operations, Comprehensive Income, and of Cash Flows. For example, if foreign exchange rates between the pound sterling and United States dollar decreased by 1.0%, the impact on our revenues during
2015
would have been a decrease of approximately $353,000.
The financial statements of our non-United States subsidiaries are translated into United States dollars using current exchange rates, with gains or losses included in the cumulative translation adjustment account, which is a component of stockholders’ equity. As of
December 31, 2015
and December 31,
2014
, our translation adjustment, net of tax, decreased stockholders’ equity by
$20.5 million
and
$13.9 million
, respectively. The change from December 31,
2014
to
December 31, 2015
is primarily attributable to the position of the United States dollar against the pound sterling.
Interest Rate Risk
We have interest rate risk primarily related to borrowings under our Credit Agreement. Borrowings under our Credit Agreement bear interest, at our option, at a LIBOR rate or base rate plus a margin. The margin ranges from 1.75% to 2.50% on the LIBOR loans and 0.75% to 1.50% on the base rate, as determined by our most recent consolidated leverage ratio. As of
December 31, 2015
, we had outstanding borrowings of
$101.0 million
under our Credit Agreement. If interest rates increased by 1.0%, interest expense in 2016 on our current borrowings would increase by approximately $1.0 million.
53
|
Item 8.
|
Financial Statements and Supplementary Data
|
|
|
|
Page
|
|
DHI Group, Inc.
|
|
|
|
|
||
|
|
||
|
|
||
|
|
||
|
|
||
|
|
||
|
|
||
54
REPORT OF INDEPENDENT REGISTERED PUBLIC ACCOUNTING FIRM
To the Board of Directors and Stockholders of
DHI Group, Inc.
New York, New York
We have audited the accompanying consolidated balance sheets of DHI Group, Inc. and subsidiaries (the
“
Company
”
) as of December 31, 2015 and 2014, and the related consolidated statements of operations, comprehensive income (loss), stockholders' equity, and cash flows for each of the three years in the period ended December 31, 2015. Our audits also included the financial statement schedule listed in the Index at Item 15. These financial statements and financial statement schedule are the responsibility of the Company's management. Our responsibility is to express an opinion on the financial statements and financial statement schedule based on our audits.
We conducted our audits in accordance with the standards of the Public Company Accounting Oversight Board (United States). Those standards require that we plan and perform the audit to obtain reasonable assurance about whether the financial statements are free of material misstatement. An audit includes examining, on a test basis, evidence supporting the amounts and disclosures in the financial statements. An audit also includes assessing the accounting principles used and significant estimates made by management, as well as evaluating the overall financial statement presentation. We believe that our audits provide a reasonable basis for our opinion.
In our opinion, such consolidated financial statements present fairly, in all material respects, the financial position of DHI Group, Inc. and subsidiaries as of December 31, 2015 and 2014, and the results of their operations and their cash flows for each of the three years in the period ended December 31, 2015, in conformity with accounting principles generally accepted in the United States of America. Also, in our opinion, such financial statement schedule, when considered in relation to the basic consolidated financial statements taken as a whole, presents fairly, in all material respects, the information set forth therein.
We have also audited, in accordance with the standards of the Public Company Accounting Oversight Board (United States), the Company's internal control over financial reporting as of December 31, 2015, based on the criteria established in
Internal Control-Integrated Framework
(2013)
issued by the Committee of Sponsoring Organizations of the Treadway Commission and our report dated
February 9, 2016
expressed an unqualified opinion on the Company's internal control over financial reporting.
/s/ Deloitte & Touche LLP
Des Moines, Iowa
February 9, 2016
55
DHI GROUP, INC.
As of December 31, 2015 and 2014
(in thousands, except per share data)
|
|
December 31,
2015 |
December 31, 2014
|
|||||
|
ASSETS
|
|||||||
|
Current assets
|
|||||||
|
Cash
|
$
|
34,050
|
|
$
|
26,777
|
|
|
|
Accounts receivable, net of allowance for doubtful accounts of $2,887 and $2,888
|
46,380
|
|
49,048
|
|
|||
|
Income taxes receivable
|
916
|
|
3,973
|
|
|||
|
Prepaid and other current assets
|
3,072
|
|
4,764
|
|
|||
|
Assets held for sale
|
4,265
|
|
—
|
|
|||
|
Total current assets
|
88,683
|
|
84,562
|
|
|||
|
Fixed assets, net
|
15,255
|
|
16,066
|
|
|||
|
Acquired intangible assets, net
|
65,292
|
|
81,345
|
|
|||
|
Goodwill
|
198,598
|
|
239,256
|
|
|||
|
Deferred financing costs, net of accumulated amortization of $1,163 and $761
|
1,564
|
|
1,320
|
|
|||
|
Deferred income taxes
|
322
|
|
481
|
|
|||
|
Other assets
|
785
|
|
926
|
|
|||
|
Total assets
|
$
|
370,499
|
|
$
|
423,956
|
|
|
|
LIABILITIES AND STOCKHOLDERS’ EQUITY
|
|||||||
|
Current liabilities
|
|||||||
|
Accounts payable and accrued expenses
|
$
|
23,883
|
|
$
|
25,714
|
|
|
|
Deferred revenue
|
83,316
|
|
86,444
|
|
|||
|
Current portion of acquisition related contingencies
|
—
|
|
3,883
|
|
|||
|
Current portion of long-term debt
|
—
|
|
2,500
|
|
|||
|
Income taxes payable
|
4,006
|
|
1,205
|
|
|||
|
Liabilities held for sale
|
2,334
|
|
—
|
|
|||
|
Total current liabilities
|
113,539
|
|
119,746
|
|
|||
|
Long-term debt
|
101,000
|
|
108,000
|
|
|||
|
Deferred income taxes
|
10,849
|
|
12,190
|
|
|||
|
Accrual for unrecognized tax benefits
|
3,436
|
|
3,392
|
|
|||
|
Other long-term liabilities
|
3,062
|
|
2,830
|
|
|||
|
Total liabilities
|
231,886
|
|
246,158
|
|
|||
|
Commitments and contingencies (Note 9)
|
|
|
|||||
|
Stockholders’ equity
|
|||||||
|
Convertible preferred stock, $.01 par value, authorized 20,000 shares; no shares issued and outstanding
|
—
|
|
—
|
|
|||
|
Common stock, $.01 par value, authorized 240,000; issued 80,717 and 77,366 shares, respectively; outstanding: 52,622 and 54,142 shares, respectively
|
807
|
|
774
|
|
|||
|
Additional paid-in capital
|
352,208
|
|
332,985
|
|
|||
|
Accumulated other comprehensive loss
|
(20,468
|
)
|
(13,906
|
)
|
|||
|
Accumulated earnings
|
49,476
|
|
60,444
|
|
|||
|
Treasury stock, 28,095 and 23,224 shares, respectively
|
(243,410
|
)
|
(202,499
|
)
|
|||
|
Total stockholders’ equity
|
138,613
|
|
177,798
|
|
|||
|
Total liabilities and stockholders’ equity
|
$
|
370,499
|
|
$
|
423,956
|
|
|
See accompanying notes to the consolidated financial statements.
56
DHI GROUP, INC.
For the years ended December 31, 2015, 2014, and 2013
(in thousands, except per share amounts)
|
For the year ended December 31,
|
|||||||||||
|
2015
|
2014
|
2013
|
|||||||||
|
Revenues
|
$
|
259,769
|
|
$
|
262,615
|
|
$
|
213,482
|
|
||
|
Operating expenses:
|
|||||||||||
|
Cost of revenues
|
39,147
|
|
37,212
|
|
23,429
|
|
|||||
|
Product development
|
29,863
|
|
26,087
|
|
22,437
|
|
|||||
|
Sales and marketing
|
81,755
|
|
83,299
|
|
68,799
|
|
|||||
|
General and administrative
|
44,639
|
|
42,059
|
|
36,129
|
|
|||||
|
Depreciation
|
9,298
|
|
10,944
|
|
8,065
|
|
|||||
|
Amortization of intangible assets
|
13,894
|
|
16,257
|
|
9,336
|
|
|||||
|
Impairment of goodwill
|
34,818
|
|
—
|
|
|
7,728
|
|
||||
|
Impairment of intangible and fixed assets
|
—
|
|
—
|
|
|
8,156
|
|
||||
|
Change in acquisition related contingencies
|
—
|
|
153
|
|
197
|
|
|||||
|
Total operating expenses
|
253,414
|
|
216,011
|
|
184,276
|
|
|||||
|
Operating income
|
6,355
|
|
46,604
|
|
29,206
|
|
|||||
|
Interest expense
|
(3,289
|
)
|
(3,744
|
)
|
(1,906
|
)
|
|||||
|
Interest income
|
—
|
|
—
|
|
30
|
|
|||||
|
Other expense
|
(25
|
)
|
(11
|
)
|
(35
|
)
|
|||||
|
Income before income taxes
|
3,041
|
|
42,849
|
|
27,295
|
|
|||||
|
Income tax expense
|
14,009
|
|
15,237
|
|
11,049
|
|
|||||
|
Net income (loss)
|
$
|
(10,968
|
)
|
$
|
27,612
|
|
$
|
16,246
|
|
||
|
Basic earnings per share
|
$
|
(0.21
|
)
|
$
|
0.53
|
|
$
|
0.29
|
|
||
|
Diluted earnings per share
|
$
|
(0.21
|
)
|
$
|
0.51
|
|
$
|
0.27
|
|
||
|
Weighted-average basic shares outstanding
|
51,402
|
|
52,328
|
|
56,473
|
|
|||||
|
Weighted-average diluted shares outstanding
|
51,402
|
|
54,410
|
|
59,476
|
|
|||||
See accompanying notes to the consolidated financial statements.
57
DHI GROUP, INC.
CONSOLIDATED STATEMENTS OF COMPREHENSIVE INCOME (LOSS)
For the years ended December 31, 2015, 2014, and 2013
(in thousands)
|
For the year ended December 31,
|
|||||||||||
|
2015
|
2014
|
2013
|
|||||||||
|
Net income (loss)
|
$
|
(10,968
|
)
|
$
|
27,612
|
|
$
|
16,246
|
|
||
|
Foreign currency translation adjustment
|
(6,559
|
)
|
(7,792
|
)
|
3,186
|
|
|||||
|
Unrealized losses on investments, net of tax of $0, $0 and ($3)
|
(3
|
)
|
—
|
|
(6
|
)
|
|||||
|
Total other comprehensive income (loss)
|
(6,562
|
)
|
(7,792
|
)
|
3,180
|
|
|||||
|
Comprehensive income (loss)
|
$
|
(17,530
|
)
|
$
|
19,820
|
|
$
|
19,426
|
|
||
See accompanying notes to the consolidated financial statements.
58
DHI GROUP, INC.
CONSOLIDATED STATEMENTS OF STOCKHOLDERS’ EQUITY
For the years ended December 31, 2015, 2014, and 2013
(in thousands)
|
|
Convertible
Preferred Stock
|
Common Stock
|
Additional
Paid-in
Capital
|
Treasury Stock
|
Accumulated
Earnings
|
Accumulated
Other
Comprehensive
Income (Loss)
|
Total
|
||||||||||||||||||||||||||
|
Shares Issued
|
Amount
|
Shares Issued
|
Amount
|
||||||||||||||||||||||||||||||
|
Balance at January 1, 2013
|
—
|
|
$
|
—
|
|
71,047
|
|
$
|
710
|
|
$
|
294,747
|
|
$
|
(112,111
|
)
|
$
|
16,586
|
|
$
|
(9,294
|
)
|
$
|
190,638
|
|
||||||||
|
Net income
|
16,246
|
|
16,246
|
|
|||||||||||||||||||||||||||||
|
Other comprehensive income
|
3,180
|
|
3,180
|
|
|||||||||||||||||||||||||||||
|
Stock based compensation
|
8,131
|
|
8,131
|
|
|||||||||||||||||||||||||||||
|
Excess tax benefit over book expense from stock options exercised
|
2,868
|
|
2,868
|
|
|||||||||||||||||||||||||||||
|
Restricted stock issued
|
1,116
|
|
11
|
|
11
|
|
|||||||||||||||||||||||||||
|
Restricted stock forfeited or withheld to satisfy tax obligations
|
(438
|
)
|
(4
|
)
|
(1,200
|
)
|
(1,204
|
)
|
|||||||||||||||||||||||||
|
Purchase of treasury stock under stock repurchase plan
|
(55,416
|
)
|
(55,416
|
)
|
|||||||||||||||||||||||||||||
|
Exercise of common stock options
|
1,689
|
|
17
|
|
3,341
|
|
3,358
|
|
|||||||||||||||||||||||||
|
Balance at December 31, 2013
|
—
|
|
—
|
|
73,414
|
|
734
|
|
309,087
|
|
(168,727
|
)
|
32,832
|
|
(6,114
|
)
|
167,812
|
|
|||||||||||||||
|
Net income
|
27,612
|
|
27,612
|
|
|||||||||||||||||||||||||||||
|
Other comprehensive loss
|
(7,792
|
)
|
(7,792
|
)
|
|||||||||||||||||||||||||||||
|
Stock based compensation
|
7,498
|
|
7,498
|
|
|||||||||||||||||||||||||||||
|
Excess tax benefit over book expense from stock options exercised
|
2,318
|
|
2,318
|
|
|||||||||||||||||||||||||||||
|
Restricted stock issued
|
1,114
|
|
11
|
|
11
|
|
|||||||||||||||||||||||||||
|
Restricted stock forfeited or withheld to satisfy tax obligations
|
(288
|
)
|
(2
|
)
|
(1,317
|
)
|
(1,319
|
)
|
|||||||||||||||||||||||||
|
Purchase of treasury stock under stock repurchase plan
|
(32,455
|
)
|
(32,455
|
)
|
|||||||||||||||||||||||||||||
|
Exercise of common stock options
|
3,126
|
|
31
|
|
14,082
|
|
14,113
|
|
|||||||||||||||||||||||||
|
Balance at December 31, 2014
|
—
|
|
—
|
|
77,366
|
|
774
|
|
332,985
|
|
(202,499
|
)
|
60,444
|
|
(13,906
|
)
|
177,798
|
|
|||||||||||||||
|
Net loss
|
(10,968
|
)
|
(10,968
|
)
|
|||||||||||||||||||||||||||||
|
Other comprehensive loss
|
(6,562
|
)
|
(6,562
|
)
|
|||||||||||||||||||||||||||||
|
Stock based compensation
|
10,185
|
|
10,185
|
|
|||||||||||||||||||||||||||||
|
Excess tax benefit over book expense from stock options exercised
|
2,050
|
|
2,050
|
|
|||||||||||||||||||||||||||||
|
Restricted stock issued
|
1,262
|
|
12
|
|
12
|
|
|||||||||||||||||||||||||||
|
Restricted stock forfeited or withheld to satisfy tax obligations
|
(245
|
)
|
(2
|
)
|
(1,836
|
)
|
(1,838
|
)
|
|||||||||||||||||||||||||
|
Purchase of treasury stock under stock repurchase plan
|
(39,075
|
)
|
(39,075
|
)
|
|||||||||||||||||||||||||||||
|
Exercise of common stock options
|
1,836
|
|
18
|
|
6,988
|
|
7,006
|
|
|||||||||||||||||||||||||
|
Performance-Based Restricted Stock Units eligible to vest
|
498
|
|
5
|
|
5
|
|
|||||||||||||||||||||||||||
|
Balance at December 31, 2015
|
—
|
|
$
|
—
|
|
80,717
|
|
$
|
807
|
|
$
|
352,208
|
|
$
|
(243,410
|
)
|
$
|
49,476
|
|
$
|
(20,468
|
)
|
$
|
138,613
|
|
||||||||
See accompanying notes to the consolidated financial statements.
59
DHI GROUP, INC.
For the years ended December 31, 2015, 2014, and 2013
(in thousands)
|
|
For the year ended December 31,
|
||||||||||
|
2015
|
2014
|
2013
|
|||||||||
|
Cash flows from operating activities:
|
|||||||||||
|
Net income (loss)
|
$
|
(10,968
|
)
|
$
|
27,612
|
|
$
|
16,246
|
|
||
|
Adjustments to reconcile net income (loss) to net cash flows from operating activities:
|
|||||||||||
|
Depreciation
|
9,298
|
|
10,944
|
|
8,065
|
|
|||||
|
Amortization of intangible assets
|
13,894
|
|
16,257
|
|
9,336
|
|
|||||
|
Deferred income taxes
|
(989
|
)
|
(3,698
|
)
|
(7,482
|
)
|
|||||
|
Amortization of deferred financing costs
|
402
|
|
365
|
|
264
|
|
|||||
|
Stock based compensation
|
10,185
|
|
7,498
|
|
8,131
|
|
|||||
|
Change in acquisition related contingencies
|
—
|
|
153
|
|
197
|
|
|||||
|
Impairment of goodwill
|
34,818
|
|
—
|
|
7,728
|
|
|||||
|
Impairment of intangible and fixed assets
|
—
|
|
—
|
|
8,156
|
|
|||||
|
Loss on disposal of fixed assets
|
—
|
|
22
|
|
319
|
|
|||||
|
Change in accrual for unrecognized tax benefits
|
44
|
|
774
|
|
116
|
|
|||||
|
Changes in operating assets and liabilities, net of the effects of acquisitions:
|
|||||||||||
|
Accounts receivable
|
(2,140
|
)
|
(9,709
|
)
|
(1,438
|
)
|
|||||
|
Prepaid expenses and other assets
|
1,734
|
|
(1,142
|
)
|
884
|
|
|||||
|
Accounts payable and accrued expenses
|
(1,054
|
)
|
(1,069
|
)
|
2,662
|
|
|||||
|
Income taxes receivable/payable
|
5,906
|
|
(1,626
|
)
|
(6,207
|
)
|
|||||
|
Deferred revenue
|
(571
|
)
|
8,767
|
|
2,378
|
|
|||||
|
Other, net
|
250
|
|
395
|
|
10
|
|
|||||
|
Net cash flows from operating activities
|
60,809
|
|
55,543
|
|
49,365
|
|
|||||
|
Cash flows from investing activities:
|
|||||||||||
|
Payments for acquisitions, net of cash acquired
|
—
|
|
(27,001
|
)
|
(58,603
|
)
|
|||||
|
Purchases of fixed assets
|
(9,078
|
)
|
(8,710
|
)
|
(10,555
|
)
|
|||||
|
Purchases of investments
|
—
|
|
—
|
|
(3
|
)
|
|||||
|
Maturities and sales of investments
|
—
|
|
—
|
|
2,194
|
|
|||||
|
Net cash flows from investing activities
|
(9,078
|
)
|
(35,711
|
)
|
(66,967
|
)
|
|||||
|
Cash flows from financing activities:
|
|||||||||||
|
Payments on long-term debt
|
(138,500
|
)
|
(37,500
|
)
|
(30,000
|
)
|
|||||
|
Proceeds from long-term debt
|
129,000
|
|
29,000
|
|
103,000
|
|
|||||
|
Payments under stock repurchase plan
|
(38,212
|
)
|
(33,007
|
)
|
(55,711
|
)
|
|||||
|
Payment of acquisition related contingencies
|
(3,829
|
)
|
(5,825
|
)
|
(5,000
|
)
|
|||||
|
Proceeds from stock option exercises
|
7,010
|
|
14,113
|
|
3,358
|
|
|||||
|
Purchase of treasury stock related to vested restricted stock
|
(1,835
|
)
|
(1,319
|
)
|
(1,204
|
)
|
|||||
|
Excess tax benefit over book expense from stock based compensation
|
2,350
|
|
3,125
|
|
2,868
|
|
|||||
|
Financing costs paid
|
(646
|
)
|
—
|
|
(872
|
)
|
|||||
|
Net cash flows from financing activities
|
(44,662
|
)
|
(31,413
|
)
|
16,439
|
|
|||||
|
Effect of exchange rate changes
|
204
|
|
(993
|
)
|
501
|
|
|||||
|
Net change in cash for the period
|
7,273
|
|
(12,574
|
)
|
(662
|
)
|
|||||
|
Cash, beginning of period
|
26,777
|
|
39,351
|
|
40,013
|
|
|||||
|
Cash, end of period
|
$
|
34,050
|
|
$
|
26,777
|
|
$
|
39,351
|
|
||
See accompanying notes to the consolidated financial statements.
60
1. ORGANIZATION AND PRINCIPAL ACTIVITIES
DHI Group, Inc. (“DHI” or the “Company”), a Delaware corporation, was incorporated on June 28, 2005. Through predecessor companies, DHI has been in the recruiting and career development business for more than
25
years. The Company is a leading provider of specialized websites focused on select professional communities. Through the Company’s online communities, professionals can manage their careers by finding relevant job opportunities and by building their knowledge through original and community-shared content, while employers, recruiters, staffing agencies, consulting firms and marketing professionals can effectively target and reach highly-valued audiences. The Company operates career management services for technology, engineering, financial services, healthcare, hospitality and security-cleared professionals, as well as career management and information and data services for the energy industry.
2. SIGNIFICANT ACCOUNTING POLICIES
Principles of Consolidation
—
The consolidated financial statements include the accounts of DHI and its wholly-owned subsidiaries. All intercompany balances and transactions have been eliminated in consolidation.
Revenue Recognition
—
The Company recognizes revenue when persuasive evidence of an arrangement exists, delivery of service has occurred, the sales price is fixed or determinable and collectability is reasonably assured. Revenue is recognized net of customer discounts ratably over the service period. Payments received in advance of services being rendered are recorded as deferred revenue and recognized over the service period. The Company generates revenue from the following sources:
Recruitment packages
. Recruitment package revenues are derived from the sale to recruiters and employers a combination of job postings and access to a searchable database of candidates on the Dice, ClearanceJobs, eFinancialCareers, Rigzone, Healthecareers, Biospace and Hcareers websites. Certain of the Company’s arrangements include multiple deliverables, which consist of the ability to post jobs and access to a searchable database of candidates. The Company determines the units of accounting for multiple element arrangements in accordance with the Multiple-Deliverable Revenue Arrangements subtopic of the FASB ASC. Specifically, the Company will consider a delivered item as a separate unit of accounting if it has value to the customer on a standalone basis. The Company’s arrangements do not include a general right of return. Services to customers buying a package of available job postings and access to the database are delivered over the same period and revenue is recognized ratably over the length of the underlying contract, typically from one to 12 months. The separation of the package into two deliverables results in no change in revenue recognition since delivery of the two services occurs over the same time period.
Advertising revenue.
Advertising revenue is recognized over the period in which the advertisements are displayed on the websites or at the time an e-mail is sent to registered members.
Classified revenue.
Classified job posting revenues are derived from the sale of job postings to recruiters and employers. A job posting is the ability to list a job on the website for a specified time period. Revenue from the sale of classified job postings is recognized ratably over the length of the contract or the period of actual usage.
Data services revenue.
Access to the Company’s database of energy industry data is provided to customers for a fee. Data services revenue is recognized ratably over the length of the underlying contract, typically from one to 12 months.
Career fair and recruitment event booth rentals
. Career fair and recruitment event revenues are derived from renting booth space to recruiters and employers. Revenue from these sales is recognized when the career fair or recruitment event is held. Certain customers purchase access to resumes obtained at these career fairs, which revenue is recognized on a per event basis over the period of the contract.
Concentration of Credit Risk—
Cash is maintained with several financial institutions. Deposits held with banks may exceed the amount of insurance provided on such deposits. These deposits may be redeemed upon demand. The Company believes it is not exposed to any significant credit risk.
The Company performs ongoing credit evaluations of its customers’ financial condition and generally does not require collateral on accounts receivable. No single customer represents 10% or more of revenues for the years ended
December 31, 2015
,
2014
and
2013
.
Allowance for Doubtful Accounts—
The Company maintains allowances for doubtful accounts for estimated losses resulting from the inability of its customers to make required payments. If the financial condition of DHI’s customers were to deteriorate, resulting in an impairment of their ability to make payments, additional allowances may be required.
61
Statements of Cash Flows—
All bank deposits are considered cash and cash equivalents.
The supplemental disclosures to the accompanying consolidated statements of cash flows are as follows (in thousands):
|
|
2015
|
2014
|
2013
|
||||||||
|
Supplemental cash flow information:
|
|||||||||||
|
Interest paid
|
$
|
2,937
|
|
$
|
3,420
|
|
$
|
1,615
|
|
||
|
Taxes paid
|
6,853
|
|
16,513
|
|
21,395
|
|
|||||
|
Non-cash investing and financing activities:
|
|||||||||||
|
Contingent consideration to be paid in cash for acquisitions
|
—
|
|
—
|
|
4,474
|
|
|||||
|
Capital expenditures on fixed assets included in accounts payable and accrued expenses
|
431
|
|
284
|
|
510
|
|
|||||
|
Share repurchases included in accounts payable and accrued expenses
|
863
|
|
—
|
|
553
|
|
|||||
Fixed Assets—
Depreciation of equipment, furniture and fixtures, computer software and capitalized website development costs are provided under the straight-line method over estimated useful lives ranging from two to five years. Amortization of leasehold improvements is provided over the shorter of the term of the related lease or the estimated useful life of the improvement. The cost of additions and betterments is capitalized, and repairs and maintenance costs are charged to operations in the periods incurred.
Capitalized Software Costs—
Capitalized software costs consist of costs to purchase and develop software for internal use. The Company capitalizes certain incurred software development costs in accordance with the Internal Use Software subtopic of the FASB ASC. Costs incurred during the application-development stage for software bought and further customized by outside vendors for the Company’s use and software developed by a vendor for the Company’s proprietary use have been capitalized.
Website Development Costs—
The Company capitalizes certain costs incurred in designing, developing, testing and implementing enhancements to its websites. These costs are amortized over the enhancement’s estimated useful life, which generally approximates two years. Costs related to the planning and post implementation phases of website development efforts are expensed as incurred.
Goodwill and Indefinite-Lived Acquired Intangible Assets—
Goodwill is recorded when the purchase price paid for an acquisition exceeds the estimated fair value of the net identified tangible and intangible assets acquired. The indefinite-lived acquired intangible assets include the Dice trademarks and brand name. The Company performs a test for impairment of goodwill and indefinite-lived intangible assets annually on October 1, or more frequently if indicators of potential impairment exist, to determine if the carrying value of the recorded asset is impaired. The impairment review process for goodwill compares the fair value of the reporting unit in which goodwill resides to its carrying value. The impairment review process for indefinite-lived intangible assets compares the fair value of the assets to their carrying value. The determination of whether or not the asset has become impaired involves a significant level of judgment in the assumptions underlying the approach used to determine the value of the Company’s reporting units or the intangible asset. Changes in the Company’s strategy and/or market conditions could significantly impact these judgments and require adjustments to recorded amounts of goodwill or indefinite-lived intangible assets. See Note 5 for discussion of impairment charges.
Foreign Currency Translation—
For the Company’s foreign operations whose functional currency is not the U.S. dollar, the assets and liabilities are translated into U.S. dollars at current exchange rates. Resulting translation adjustments are reflected as Other Comprehensive Income (Loss). Revenue and expenses are translated at average exchange rates for the period. Transaction gains and losses that arise from exchange rate fluctuations on transactions denominated in a currency other than the functional currency are charged to operations as incurred.
Advertising Costs—
The Company expenses advertising costs as they are incurred. Advertising expense for the years ended
December 31, 2015
,
2014
and
2013
was
$33.2 million
,
$29.9 million
and
$31.1 million
, respectively.
Income Taxes—
The Company recognizes deferred taxes by the asset and liability method. Under this method, deferred income taxes are recognized for differences between the financial statement and tax bases of assets and liabilities at enacted statutory tax rates in effect for the years in which the differences are expected to reverse. Valuation allowances are established
62
when necessary to reduce deferred tax assets to the amounts expected to be realized. The primary sources of temporary differences are stock-based compensation, amortization of intangible assets, and depreciation of fixed assets.
Stock-Based Compensation—
The Company has a plan to grant equity awards to certain employees and directors of the Company and its subsidiaries. See Note 12.
Fair Value of Financial Instruments—
The carrying amounts reported in the consolidated balance sheet for cash, accounts receivable, and accounts payable and accrued expenses approximate their fair values. The Company’s long-term debt consists of borrowings under its credit facility. See Note 5 for fair value disclosures.
Risks and Uncertainties—
The Company is subject to the risks, expenses and uncertainties frequently encountered by companies in the new and rapidly evolving markets for internet products and services. These risks include the failure to develop and extend the Company’s online service brands, the rejection of the Company’s services by consumers, vendors and/or advertisers, the inability of the Company to maintain and increase the levels of traffic on its online services, as well as other risks and uncertainties. In the event that the Company does not successfully execute its business plan, certain assets may not be recoverable.
Use of Estimates—
The preparation of financial statements in conformity with accounting principles generally accepted in the United States of America requires management to make estimates and assumptions that affect the reported amounts of assets and liabilities, disclosure of contingent assets and liabilities as of the date of the financial statements, and reported amounts of revenues and expenses during the reporting period. Actual results could differ from these estimates. DHI’s significant estimates include the useful lives and valuation of fixed assets and intangible assets, goodwill, the income tax valuation allowance, the assumptions used to value the stock options of the Company, and the valuation of assets acquired and liabilities assumed from acquisitions.
Net Income per Common and Common Equivalent Share—
The Company follows the Earnings Per Share topic of the FASB ASC in computing earnings per share (“EPS”). The two-class method establishes the computation of EPS by companies that have issued securities other than common stock that contractually entitle the holder to participate in dividends and earnings of the company. Earnings available to common shareholders for the period, after deduction of convertible preferred stock dividends, are allocated between the common and convertible preferred shareholders based on their respective rights to receive dividends. Basic EPS is then calculated by dividing income allocable to common shareholders (including the reduction for any undeclared, preferred stock dividends assuming current income for the period had been distributed) by the weighted average number of shares outstanding. The Company calculates diluted EPS under the if-converted method unless the conversion of the convertible preferred stock is anti-dilutive to basic EPS. To the extent convertible preferred stock is anti-dilutive, the Company calculates diluted EPS under the two-class method to include the effect of potential common shares. See Note 16.
New Accounting Pronouncements—
In April 2015, the Financial Accounting Standards Board (the “FASB”) issued Accounting Standards Update (ASU) No. 2015-03,
Simplifying the Presentation of Debt Issuance Costs
. The new standard requires that debt issuance costs be presented on the balance sheet as a direct deduction from the carrying amount of the related debt liability. The recognition and measurement for debt issuance costs is not affected by this standard. The updated standard becomes effective for reporting periods (interim and annual) beginning after December 15, 2015, with early adoption permitted. The new standard must be applied retrospectively to all periods presented in the financial statements. The Company does not expect this standard to have a material impact on its financial statements.
In August 2015, the FASB issued ASU No. 2015-14,
Revenue from Contracts with Customers
. The new standard outlines the principles an entity must apply to measure and recognize revenue and the related cash flows it expects to be entitled for the transfer of promised goods or services to customers. The updated standard will replace most existing revenue recognition guidance in U.S. GAAP. The updated standard becomes effective for reporting periods (interim and annual) beginning after December 15, 2017, with no early adoption permitted. The new standard can be applied retrospectively to each prior reporting period presented or retrospectively with the cumulative effect of the change recognized at the date of the initial application. The Company is assessing the potential impact of the new standard on its consolidated financial statements and has not yet selected a transition method.
In November 2015, the FASB issued ASU No. 2015-17,
Balance Sheet Classification of Deferred Taxes.
The new standard simplifies the presentation of deferred tax assets and deferred tax liabilities and requires deferred taxes to be classified as non-current. The updated standard becomes effective for reporting periods (interim and annual) beginning after December 15, 2016, with early adoption permitted and can be applied prospectively or retrospectively. The Company has chosen to adopt early and apply the pronouncement retrospectively. The pronouncement was adopted early to simplify the presentation of
63
deferred tax assets and deferred tax liabilities on the balance sheet. The impact on December 31, 2014 balance sheet amounts was to reclassify $3.4 million of current deferred tax assets and $3,000 of current deferred tax liabilities as non-current deferred income taxes.
3. ASSETS HELD FOR SALE
The Company initiated the process to sell the Slashdot and SourceForge businesses (together referred to as “Slashdot Media”). Slashdot Media was added to the Company’s portfolio in 2012 to provide the Dice business with broader reach to millions of engaged tech professionals globally. The Board of Directors and management decided to divest the business because it does not fit within the Company’s strategic initiatives.
The Slashdot Media business has been classified as “held for sale.” As such, the assets of Slashdot Media are shown on the Consolidated Balance Sheets under the heading of “Assets Held for Sale” and the liabilities are shown under “Liabilities Held for Sale.” Operating results are included in the Corporate & Other segment in Segment Information, Note 15.
Assets held for sale are required to be measured at the lower of carrying value or fair value, less costs to sell. No impairment has been recognized related to Slashdot Media for the year ended December 31, 2015.
The following table presents the aggregate carrying amount of the major classes of assets and liabilities related to the Slashdot Media business held for sale as of December 31, 2015 (in thousands):
|
ASSETS
|
|||
|
Accounts receivable, net of allowance for doubtful accounts of $58
|
$
|
3,625
|
|
|
Other assets
—
current
|
29
|
|
|
|
Fixed assets, net
|
594
|
|
|
|
Other assets
—
non-current
|
17
|
|
|
|
Total assets
|
$
|
4,265
|
|
|
|
|||
|
LIABILITIES
|
|
||
|
Accounts payable and accrued expenses
|
$
|
1,342
|
|
|
Deferred revenue
|
969
|
|
|
|
Income taxes payable
|
23
|
|
|
|
Total liabilities
|
$
|
2,334
|
|
Revenue for Slashdot Media was
$14.8 million
,
$18.2 million
, and
$15.9 million
for the years ended
December 31, 2015
,
2014
, and
2013
, respectively. There was income (loss) before incomes taxes for Slashdot of
$1.1 million
,
$4.3 million
, and (
$16.1 million
) for the years ended
December 31, 2015
,
2014
, and
2013
, respectively.
The Company sold Slashdot Media on January 27, 2016 for
$2.8 million
, subject to certain working capital settlements within 60 days of close, and incurred approximately
$0.8 million
of selling costs. The assets were held for sale as of December 31, 2015.
4. ACQUISITIONS
OilCareers
—In March 2014, the Company acquired from the Daily Mail and General Trust PLC all of the issued and outstanding shares of OilCareers Limited, OilCareers.com, Inc. and OilCareers Pty Limited (collectively, “OilCareers”), a leading recruitment site for oil and gas professionals in Europe. The purchase price consisted of
$26.1 million
, paid in cash at closing, and
$0.3 million
paid in the second quarter of 2014 to settle certain working capital requirements. The valuation of assets and liabilities was completed during the second quarter of 2014. The OilCareers acquisition is not deemed significant to the Company’s financial results, thus limited disclosures are presented herein.
64
The final valuation of assets and liabilities recognized as of the acquisition date for OilCareers include (in thousands):
|
OilCareers Acquisition
|
|||||
|
Assets:
|
|||||
|
Accounts receivable
|
$
|
1,082
|
|
||
|
Acquired intangible assets
|
14,508
|
|
|||
|
Goodwill
|
15,078
|
|
|||
|
Fixed assets
|
98
|
|
|||
|
Other assets
|
196
|
|
|||
|
Assets acquired
|
30,962
|
|
|||
|
Liabilities:
|
|||||
|
Accounts payable and accrued expenses
|
$
|
567
|
|
||
|
Deferred revenue
|
1,081
|
|
|||
|
Deferred income taxes
|
2,916
|
|
|||
|
Liabilities assumed
|
4,564
|
|
|||
|
Net Assets Acquired
|
$
|
26,398
|
|
||
Goodwill results from the expansion of the Company’s market share in the Energy vertical, from intangible assets that do not qualify for separate recognition, including an assembled workforce and site traffic, and from expected synergies from combining operations of OilCareers into the Company’s existing operations. The amount of goodwill from the OilCareers acquisition deductible for tax purposes is
$1.2 million
. See Note 5 regarding goodwill impairment recognized within the Energy reporting segment in 2015.
2013 Acquisitions
onTargetjobs
—In November 2013, the Company acquired all of the issued and outstanding shares of onTargetjobs, Inc., a leading vertical recruiting service in healthcare and hospitality. The purchase price consisted of $
46.3 million
, net of cash acquired. In the first quarter of 2014,
$0.6 million
was paid to settle certain working capital requirements. The Company borrowed $
54.0 million
under the then existing credit agreement to fund this acquisition. The acquisition resulted in recording intangible assets of $
27.6 million
and goodwill of $
23.8 million
. The assets acquired and liabilities assumed were recorded at fair value as of the acquisition date. The acquired accounts receivable of $
6.3 million
were recorded at fair value of $
6.3 million
. The Company incurred transaction costs related to the acquisition of
$1.2 million
, which were included in General and Administrative expense on the Consolidated Statements of Operations in the year ended December 31, 2013.
The IT Job Board
—In July 2013, the Company expanded its online tech recruiting business to Europe by
acquiring all of the issued and outstanding shares of JobBoard Enterprises Limited, an online recruitment company in the technology industry, that operates The IT Job Board business (“The IT Job Board”). The purchase price consisted of
£8.0 million
(
$12.2 million
), net of cash acquired, plus deferred payments totaling
£3.0 million
(
$4.6 million
) in the aggregate, payable upon the achievement of certain operating and financial goals ending in 2014. The final deferred payment was made in February 2015. The Company borrowed
$15.0 million
under the then credit agreement to fund this acquisition. The acquisition resulted in recording intangible assets of
$10.8 million
and goodwill of
$9.1 million
. The assets acquired and liabilities assumed were recorded at fair value as of the acquisition date. The acquired accounts receivable of
$1.2 million
were recorded at fair value of
$1.2 million
. The IT Job Board acquisition is not deemed significant to the Company’s financial results, thus limited disclosures are presented herein.
65
The assets and liabilities recognized as of the acquisition dates for onTargetjobs and The IT Job Board include (in thousands):
|
onTargetjobs and The IT Job Board Acquisitions
|
|||||
|
Assets:
|
|||||
|
Cash and cash equivalents
|
$
|
8,200
|
|
||
|
Accounts receivable
|
7,558
|
|
|||
|
Acquired intangible assets
|
38,410
|
|
|||
|
Goodwill
|
32,935
|
|
|||
|
Fixed assets
|
5,688
|
|
|||
|
Other assets
|
1,195
|
|
|||
|
Assets acquired
|
93,986
|
|
|||
|
Liabilities:
|
|||||
|
Accounts payable and accrued expenses
|
$
|
9,577
|
|
||
|
Deferred revenue
|
5,465
|
|
|||
|
Deferred income taxes
|
7,160
|
|
|||
|
Fair value of contingent consideration
|
4,474
|
|
|||
|
Liabilities assumed
|
26,676
|
|
|||
|
Net Assets Acquired
|
$
|
67,310
|
|
||
Goodwill results from the entrance or expansion of the Company’s market share in the Healthcare, Hospitality and Tech & Clearance verticals, from intangible assets that do not qualify for separate recognition, including an assembled workforce and site traffic, and from expected synergies from combining operations of The IT Job Board and onTargetjobs into the Company’s existing operations. The amount of goodwill from The IT Job Board and onTargetjobs acquisitions deductible for tax purposes is
$3.9 million
.
5. FAIR VALUE MEASUREMENTS
The FASB ASC topic on Fair Value Measurements and Disclosures defines fair value, establishes a framework for measuring fair value and requires certain disclosures for each major asset and liability category measured at fair value on either a recurring or nonrecurring basis. As a basis for considering assumptions, a three-tier fair value hierarchy is used, which prioritizes the inputs used in measuring fair value as follows:
|
•
|
Level 1 – Quoted prices for identical instruments in active markets.
|
|
•
|
Level 2 – Quoted prices for similar instruments in active markets, quoted prices for identical or similar instruments in markets that are not active and model-derived valuations, in which all significant inputs are observable in active markets.
|
|
•
|
Level 3 – Unobservable inputs in which there is little or no market data, which require the reporting entity to develop its own assumptions.
|
The carrying amounts reported in the Consolidated Balance Sheets for cash, accounts receivable, accounts payable and accrued expenses and long-term debt approximate their fair values. The fair value of the long-term debt was estimated using present value techniques and market based interest rates and credit spreads.
The Company historically had obligations, to be paid in cash, related to its acquisitions if certain future operating and financial goals are met. The fair value of this contingent consideration is determined using expected cash flows and present value technique. Expected cash flows are determined using the probability weighted-average of possible outcomes that would occur should delivery of certain product enhancements occur. There is no market data available to use in valuing the contingent consideration; therefore, the Company developed its own assumptions related to the expected future delivery of product enhancements to estimate the fair value of these liabilities. A
2%
discount rate is used to fair value the expected
66
payments. The liabilities for the contingent consideration were established at the time of acquisition and are evaluated at each reporting period. The expense is included in “Change in Acquisition Related Contingencies” on the Consolidated Statements of Operations.
The assets and liabilities measured at fair value on a recurring basis are as follows (in thousands):
|
|
December 31, 2014
|
||||||||||||||
|
|
Fair Value Measurements Using
|
Total
|
|||||||||||||
|
|
Quoted Prices in
Active Markets for
Identical Assets
(Level 1)
|
Significant Other
Observable
Inputs
(Level 2)
|
Significant
Unobservable
Inputs
(Level 3)
|
||||||||||||
|
Contingent consideration to be paid in cash for the acquisitions
|
$
|
—
|
|
$
|
—
|
|
$
|
3,883
|
|
$
|
3,883
|
|
|||
Reconciliations of liabilities measured and carried at fair value on a recurring basis with the use of significant unobservable inputs (Level 3) are as follows (in thousands):
|
For the year ended December 31,
|
|||||||||||
|
2015
|
2014
|
2013
|
|||||||||
|
Contingent consideration for acquisitions
|
|||||||||||
|
Balance at beginning of period
|
$
|
3,883
|
|
$
|
9,793
|
|
$
|
9,756
|
|
||
|
Additions for acquisitions
|
—
|
|
—
|
|
4,474
|
|
|||||
|
Cash payments
|
(3,829
|
)
|
(5,825
|
)
|
(5,000
|
)
|
|||||
|
Change in estimates included in earnings
|
—
|
|
153
|
|
197
|
|
|||||
|
Change due to foreign exchange rate changes
|
(54
|
)
|
(238
|
)
|
366
|
|
|||||
|
Balance at end of period
|
$
|
—
|
|
$
|
3,883
|
|
$
|
9,793
|
|
||
Certain assets and liabilities are measured at fair value on a non-recurring basis. These assets include goodwill and intangible assets which result as acquisitions occur. Items valued using such internally generated valuation techniques are classified according to the lowest level input or value driver that is significant to the valuation. Thus, an item may be classified in Level 3 even though there may be some significant inputs that are readily observable. Such instruments are not measured at fair value on an ongoing basis but are subject to fair value adjustments in certain circumstances, for example, when there is evidence of impairment.
Goodwill
—The Company determines whether the carrying value of recorded goodwill is impaired for each reporting unit on an annual basis or more frequently if indicators of potential impairment exist for each reporting unit. In testing goodwill for impairment, a qualitative assessment can be performed and if it is determined that the fair value of the reporting unit is more likely than not less than the carrying amount, the two step impairment test is required. The first step of the impairment review process compares the fair value of the reporting unit in which the goodwill resides to the carrying value of that reporting unit. The second step measures the amount of impairment loss, if any, by comparing the implied fair value of the reporting unit goodwill with its carrying amount. The determination of whether or not goodwill has become impaired involves a significant level of judgment in the assumptions underlying the approach used to determine the value of the reporting units. Fair values of each reporting unit are determined either by using a discounted cash flow methodology or by using a combination of a discounted cash flow methodology and a market comparable method. The discounted cash flow methodology is based on projections of the amounts and timing of future revenues and cash flows, assumed discount rates and other assumptions as deemed appropriate. Factors such as historical performance, anticipated market conditions, operating expense trends and capital expenditure requirements are considered. Additionally, the discounted cash flows analysis takes into consideration cash expenditures for product development, other technological updates and advancements to the websites and investments to improve the candidate databases. The market comparable method indicates the fair value of a business by comparing it to publicly traded companies in similar lines of business or to comparable transactions or assets. Considerations for factors such as size, growth, profitability, risk and return on investment are analyzed and compared to the comparable businesses and adjustments are made. A market value of invested capital of the publicly traded companies is calculated and then applied to the entity’s operating results to arrive at an estimate of value.
Impairment
—Goodwill at the Energy reporting unit with a carrying value of
$50.2 million
was written down to
$15.4 million
. In order to arrive at the
$15.4 million
implied fair value of goodwill, the Company calculated the fair value of all the assets and liabilities of the reporting unit as if it had been acquired in a business combination. After assigning fair value to the
67
assets and liabilities of the reporting unit, the implied fair value of goodwill resulted in an impairment of
$34.8 million
in the year ended December 31, 2015. The goodwill balance represented a Level 3 asset measured at fair value on a nonrecurring basis subsequent to its original recognition.
The fair value of the assets and liabilities of this reporting unit was determined by a combination of a discounted cash flow methodology and market comparable method. Cash flow projections for this reporting unit decreased due to a decline in financial performance resulting from declining oil prices. The charge is reflected as Impairment of Goodwill on the Consolidated Statements of Operations.
As required under FASB ASC 360,
Impairment or Disposal of Long-Lived Assets
, an impairment loss shall be recognized only if the carrying amount of the long-lived asset is not recoverable and exceeds its fair value. The long-lived assets of the Energy reporting unit were tested for recoverability due to the downturn in the current and expected future financial performance of the reporting unit and no impairment of long-lived assets was identified during the years ended December 31, 2015 and 2014.
Indefinite-lived Intangible Assets
—The indefinite-lived acquired intangible assets include the Dice trademarks and brand name. The Company determines whether the carrying value of recorded indefinite-lived acquired intangible assets is impaired on an annual basis or more frequently if indicators of potential impairment exist. The impairment test performed as of October 1 last resulted in no impairment. The impairment review process compares the fair value of the indefinite-lived acquired intangible assets to its carrying value. If the carrying value exceeds the fair value, an impairment loss is recorded. The determination of whether or not indefinite-lived acquired intangible assets have become impaired involves a significant level of judgment in the assumptions underlying the approach used to determine the value of the indefinite-lived acquired intangible assets. Fair values are determined using a profit allocation methodology, which estimates the value of the trademark and brand name by capitalizing the profits saved because the Company owns the asset. Factors such as historical performance, anticipated market conditions, operating expense trends and capital expenditure requirements are considered. Changes in Company strategy and/or market conditions could significantly impact these judgments and require adjustments to recorded amounts of intangible assets.
6. FIXED ASSETS, NET
Fixed assets, net consist of the following as of
December 31, 2015
and
2014
(in thousands):
|
|
2015
|
2014
|
|||||
|
Computer equipment and software
|
$
|
16,817
|
|
$
|
21,152
|
|
|
|
Furniture and fixtures
|
3,424
|
|
3,592
|
|
|||
|
Leasehold improvements
|
3,624
|
|
2,095
|
|
|||
|
Capitalized website development costs
|
14,816
|
|
12,900
|
|
|||
|
38,681
|
|
39,739
|
|
||||
|
Less: Accumulated depreciation and amortization
|
(22,832
|
)
|
(23,673
|
)
|
|||
|
Fixed assets, net
|
$
|
15,849
|
|
$
|
16,066
|
|
|
7. ACQUIRED INTANGIBLE ASSETS, NET
Below is a summary of the major acquired intangible assets and the weighted-average amortization period for the acquired identifiable intangible assets (in thousands):
|
|
As of and for the year ended December 31, 2015
|
||||||||||||||||
|
|
Total Cost
|
Accumulated
Amortization
|
Foreign
Currency
Translation
Adjustment
|
Acquired
Intangible
Assets, Net
|
Weighted-
Average
Amortization
Period
|
||||||||||||
|
Technology
|
$
|
10,308
|
|
$
|
(8,831
|
)
|
$
|
(615
|
)
|
$
|
862
|
|
3.8 years
|
||||
|
Trademarks and brand names—Dice
|
39,000
|
|
—
|
|
—
|
|
39,000
|
|
Indefinite
|
||||||||
|
Trademarks and brand names—Other
|
23,419
|
|
(13,156
|
)
|
(2,238
|
)
|
8,025
|
|
6.1 years
|
||||||||
|
Customer lists
|
63,373
|
|
(42,808
|
)
|
(5,068
|
)
|
15,497
|
|
5.5 years
|
||||||||
|
Candidate and content database
|
24,888
|
|
(22,088
|
)
|
(892
|
)
|
1,908
|
|
2.4 years
|
||||||||
|
Acquired intangible assets, net
|
$
|
160,988
|
|
$
|
(86,883
|
)
|
$
|
(8,813
|
)
|
$
|
65,292
|
|
|||||
68
|
|
As of and for the year ended December 31, 2014
|
||||||||||||||||||||
|
|
Total Cost
|
Accumulated
Amortization
|
Foreign
Currency
Translation
Adjustment
|
Accumulated Impairment
|
Acquired
Intangible
Assets, Net
|
Weighted-
Average
Amortization
Period
|
|||||||||||||||
|
Technology
|
$
|
25,194
|
|
$
|
(20,481
|
)
|
$
|
(211
|
)
|
$
|
(1,374
|
)
|
$
|
3,128
|
|
3.5 years
|
|||||
|
Trademarks and brand names—Dice
|
39,000
|
|
—
|
|
—
|
|
—
|
|
39,000
|
|
Indefinite
|
||||||||||
|
Trademarks and brand names—Other
|
26,889
|
|
(12,802
|
)
|
(855
|
)
|
(1,929
|
)
|
11,303
|
|
6.1 years
|
||||||||||
|
Customer lists
|
69,116
|
|
(43,774
|
)
|
(1,817
|
)
|
(3,281
|
)
|
20,244
|
|
5.5 years
|
||||||||||
|
Candidate and content database
|
44,670
|
|
(36,371
|
)
|
27
|
|
(656
|
)
|
7,670
|
|
2.7 years
|
||||||||||
|
Order backlog
|
2,718
|
|
(2,718
|
)
|
—
|
|
—
|
|
—
|
|
0.5 years
|
||||||||||
|
Acquired intangible assets, net
|
$
|
207,587
|
|
$
|
(116,146
|
)
|
$
|
(2,856
|
)
|
$
|
(7,240
|
)
|
$
|
81,345
|
|
||||||
During the first quarter of 2015, the Company retired certain fully amortized acquired intangible assets no longer in service.
OilCareers was acquired in March 2014 and the valuation of assets and liabilities was completed during the second quarter of 2014. Identifiable intangible assets for the OilCareers acquisition are included in the total cost as of December 31, 2014. The weighted-average amortization period for the technology, trademarks and brand names, customer lists and candidate and content database are
0.8 years
,
2.0 years
,
7.0 years
and
2.0 years
, respectively, related to the OilCareers acquisition. The weighted-average amortization period for the OilCareers trademarks and brand names was changed during the first quarter of 2015 due to the integration of the OilCareers brand with the Rigzone brand during 2015. The change in amortization period resulted in $721,000 of amortization accelerated and recognized during 2015.
Identifiable intangible assets for The IT Job Board and onTargetjobs acquisitions are included in the total cost as of December 31, 2013. The weighted-average amortization period for the technology, trademarks and brand names, customer lists, candidate and content database and order backlog are
3.0 years
,
6.9 years
,
8.0 years
,
2.8 years
and
0.5 years
, respectively, related to these acquisitions.
Based on the carrying value of the acquired finite-lived intangible assets recorded as of
December 31, 2015
, and assuming no subsequent impairment of the underlying assets, the estimated future amortization expense is as follows (in thousands):
|
2016
|
$
|
7,424
|
|
|
2017
|
4,484
|
|
|
|
2018
|
3,946
|
|
|
|
2019
|
3,641
|
|
|
|
2020
|
3,261
|
|
|
|
2021 and thereafter
|
3,536
|
|
|
|
Total
|
$
|
26,292
|
|
Indefinite Life on Trade Name
The Dice.com trademarks and brand name is one of the most recognized names of online job boards. Since Dice’s inception in 1991, the brand has been recognized as a leader in recruiting and career development services for technology and engineering professionals. Currently, the brand is synonymous with the most specialized online marketplace for technology industry-specific talent. The brand has significant online and offline presence in online recruiting and career development services. Considering the recognition of the brand, its long history, awareness in the talent acquisition and staffing services market, and the intended use, the remaining useful life of the Dice.com trademarks and brand name was determined to be indefinite.
Credit Agreement
—In November 2015, the Company, together with Dice Inc. (a wholly-owned subsidiary of the Company) and its wholly-owned subsidiary, Dice Career Solutions, Inc. (collectively, the “Borrowers”) entered into an Amended and Restated Credit Agreement (the “Credit Agreement”), which provides for a revolving loan facility of
$250.0 million
maturing in November 2020. The Company borrowed
$105.0 million
under the new Credit Agreement to repay all outstanding indebtedness, including accrued interest and fees, under the previously existing credit agreement dated October 2013, terminating that agreement.
69
Borrowings under the Credit Agreement bear interest at the Company’s option, at a LIBOR rate or a base rate plus a margin. The margin ranges from
1.75%
to
2.50%
on LIBOR loans and
0.75%
to
1.50%
on base rate loans, determined by the Company’s most recent consolidated leverage ratio. The facility may be prepaid at any time without penalty.
The Credit Agreement contains various customary affirmative and negative covenants and also contains certain financial covenants, including a consolidated leverage ratio and a consolidated interest coverage ratio. Negative covenants include restrictions on incurring certain liens; making certain payments, such as stock repurchases and dividend payments; making certain investments; making certain acquisitions; and incurring additional indebtedness. Restricted payments are allowed under the Credit Agreement to the extent the consolidated leverage ratio, calculated on a pro forma basis, is equal to or less than
2.0
to 1.0, plus an additional
$5.0 million
of restricted payments. The Credit Agreement also provides that the payment of obligations may be accelerated upon the occurrence of customary events of default, including, but not limited to, non-payment, change of control, or insolvency. As of
December 31, 2015
, the Company was in compliance with all of the financial covenants under the Credit Agreement.
The obligations under the Credit Agreement are guaranteed by
four
of the Company’s wholly-owned subsidiaries, eFinancialCareers, Inc., Targeted Job Fairs, Inc., Rigzone.com, Inc. and onTargetJobs, Inc., and secured by substantially all of the assets of the Borrowers and the guarantors and stock pledges from certain of the Company’s foreign subsidiaries.
Debt issuance costs of
$646,000
were incurred and are being amortized over the life of the loan. These costs are included in interest expense. Unamortized deferred financing costs from the previous credit facility of
$973,000
are being amortized over the life of the new Credit Agreement.
Previous Credit Agreement
—In October 2013, the Company entered into an agreement which provided for a
$50.0 million
term loan facility and a revolving loan facility of
$200.0 million
, with both facilities maturing in October 2018. The Company borrowed
$65.0 million
to repay all outstanding indebtedness under the previously existing credit agreement dated June 2012, terminating that agreement.
Borrowings bore interest at the Company’s option, at a LIBOR rate or a base rate plus a margin. The margin ranges from
1.75%
to
2.50%
on LIBOR loans and
0.75%
to
1.50%
on base rate loans, determined by the Company’s most recent consolidated leverage ratio.
The amounts borrowed as of
December 31, 2015
and
December 31, 2014
are as follows (dollars in thousands):
|
|
December 31,
2015 |
|
December 31,
2014 |
||||
|
Amounts borrowed:
|
|||||||
|
Term loan facility
|
$
|
—
|
|
$
|
47,500
|
|
|
|
Revolving credit facility
|
101,000
|
|
63,000
|
|
|||
|
Total borrowed
|
$
|
101,000
|
|
$
|
110,500
|
|
|
|
Available to be borrowed under revolving facility
|
$
|
149,000
|
|
$
|
137,000
|
|
|
|
Interest rates:
|
|||||||
|
LIBOR rate loans:
|
|||||||
|
Interest margin
|
2.00
|
%
|
2.00
|
%
|
|||
|
Actual interest rates
|
2.25
|
%
|
2.19
|
%
|
|||
There are no scheduled payments for the revolving loan facility of
$250.0 million
until maturity of the Credit Agreement in November 2020.
9. COMMITMENTS AND CONTINGENCIES
Leases
The Company leases equipment and office space under operating leases expiring at various dates through December 2025. Future minimum lease payments under non-cancellable operating leases as of
December 31, 2015
are as follows (in thousands):
70
|
2016
|
$
|
4,182
|
|
|
2017
|
3,802
|
|
|
|
2018
|
3,806
|
|
|
|
2019
|
3,564
|
|
|
|
2020
|
3,122
|
|
|
|
2021 and thereafter
|
7,206
|
|
|
|
Total minimum payments
|
$
|
25,682
|
|
Rent expense was
$4.5 million
,
$4.1 million
and
$3.2 million
for the years ended
December 31, 2015
,
2014
, and
2013
, respectively, and is included in General and Administrative expense in the Consolidated Statements of Operations.
Litigation
The Company is subject to various claims from taxing authorities, lawsuits and other complaints arising in the ordinary course of business. The Company records provisions for losses when claims become probable and the amounts are reasonably estimable. Although the outcome of these legal matters cannot be determined, it is the opinion of management that the final resolution of these matters will not have a material effect on the Company’s financial condition, operations or liquidity.
Tax Contingencies
The Company operates in a number of tax jurisdictions and is routinely subject to examinations by various tax authorities with respect to income taxes and indirect taxes. The determination of the Company’s worldwide provision for taxes requires judgment and estimation. The Company has reserved for potential examination adjustments to our provision for income taxes and accrual of indirect taxes in amounts which we believe are reasonable.
10. EQUITY TRANSACTIONS
Stock Repurchase Plans
—The Company’s board of directors approved a stock repurchase program that permits the Company to repurchase its common stock. The following table summarizes the Stock Repurchase Plans approved by the board of directors:
|
III
|
IV
|
V
|
VI
|
|
|
Approval Date
|
January 2013
|
December 2013
|
December 2014
|
December 2015
|
|
Authorized Repurchase Amount of Common Stock
|
$50 million
|
$50 million
|
$50 million
|
$50 million
|
|
Effective Dates
|
April 2013 to December 2013
|
December 2013 to December 2014
|
December 2014 to December 2015
|
December 2015 to December 2016
|
The Company is currently under Stock Repurchase Plan VI, which will expire no later than December 2016. Under each plan, management has discretion in determining the conditions under which shares may be purchased from time to time.
During the years ended
December 31, 2015
,
2014
and
2013
purchases of the Company’s common stock pursuant to Stock Repurchase Plans were as follows:
|
Period
|
Total Number of Shares Purchased
|
Average Price Paid per Share
|
|
Approximate Dollar Value of Shares Purchased
|
Approximate Dollar Value of Shares that May Yet Be Purchased Under the Plans or Programs
|
||||||||||
|
Year Ended December 31, 2015
|
4,661,528
|
|
|
$
|
8.38
|
|
|
$
|
39,075,000
|
|
$
|
47,629,000
|
|
||
|
Year Ended December 31, 2014
|
4,265,895
|
|
|
7.61
|
|
32,455,000
|
|
50,000,000
|
|
||||||
|
Year Ended December 31, 2013
|
6,561,747
|
|
8.45
|
|
55,416,000
|
|
48,849,000
|
|
|||||||
Approximately
$0.9 million
of share repurchases had not settled as of
December 31, 2015
and are included in accounts payable and accrued expenses in the accompanying Consolidated Balance Sheets. There were
no
unsettled share repurchases as of
December 31, 2014
.
71
Convertible Preferred Stock—
The Company has
20 million
shares of convertible preferred stock authorized, with a
$0.01
par value.
No
shares have been issued and outstanding since prior to our initial public offering in 2007. The rights, preferences, privileges and restrictions granted to and imposed on the convertible preferred stock are as set forth below. These provisions are related to the preferred stock that was outstanding during the period. The Company currently has no preferred stock outstanding. The Company’s amended and restated certificate of incorporation permits the terms of any preferred stock to be determined at the time of issuance.
Dividend provisions
The preferred stockholders are entitled to dividends only when dividends were paid to common shareholders. In the event of a dividend, the holders of the preferred shares are entitled to share in the dividend on a pro rata basis, as if their shares had been converted into shares of common stock.
Conversion rights
Any holder of preferred stock has the right, at its option, to convert the preferred shares into shares of common stock at a ratio of one preferred stock share for one common stock share. The holders of 66
2
/
3
% of all outstanding preferred stock have the right at any time to require all the outstanding shares of preferred stock to be converted into an equal number of shares of common stock. Voting rights include the right to vote at a special or annual meeting of stockholders on all matters entitled to be voted on by holders of common stock, voting together as a single class with the common stock. There are no redemption rights associated with the preferred stock.
Liquidation rights
Upon the occurrence of liquidation, the holders of the preferred shares shall be paid in cash for each share of preferred stock held, out of, but only to the extent of, the assets of the Company legally available for distribution to its stockholders, before any payment or distribution is made to any shareholders of common stock
.
The liquidation value is $2.17 per share, subject to adjustments for stock splits, stock dividends, combinations, or other recapitalizations of the preferred stock.
Dividends—
No dividends have been declared in
2015
,
2014
or
2013
. Our Credit Agreement limits our ability to issue dividends. Refer to Note 8 “Indebtedness”.
11. ACCUMULATED OTHER COMPREHENSIVE LOSS
FASB ASC topic on Comprehensive Income establishes standards for the reporting and display of comprehensive income (loss) and its components in a full set of general-purpose financial statements. This statement requires that all items that are required to be recognized as components of comprehensive income (loss) be reported in a financial statement with the same prominence as other financial statements. The Company had $3,000 reclassified out of accumulated other comprehensive income for the year ended December 31, 2015 and no amounts reclassified out of accumulated other comprehensive income for the years ended December 31, 2014 and 2013. The unrealized gain (loss) on investments available-for-sale and foreign currency translation adjustments impact comprehensive income (loss). Accumulated other comprehensive income (loss), net consists of the following components, net of tax (in thousands):
72
|
Year ended December 31,
|
|||||||||||
|
|
2015
|
2014
|
2013
|
||||||||
|
Unrealized gains (losses) on securities:
|
|||||||||||
|
Balance at beginning of year
|
$
|
3
|
|
$
|
3
|
|
$
|
9
|
|
||
|
Unrealized losses for the year, net of tax
|
(3
|
)
|
—
|
|
(6
|
)
|
|||||
|
Balance at end of year
|
$
|
—
|
|
$
|
3
|
|
$
|
3
|
|
||
|
Foreign currency translation:
|
|||||||||||
|
Balance at beginning of year
|
$
|
(13,909
|
)
|
$
|
(6,117
|
)
|
$
|
(9,303
|
)
|
||
|
Translation adjustments
|
(6,559
|
)
|
(7,792
|
)
|
3,186
|
|
|||||
|
Balance at end of year
|
$
|
(20,468
|
)
|
$
|
(13,909
|
)
|
$
|
(6,117
|
)
|
||
|
Total:
|
|||||||||||
|
Balance at beginning of year
|
$
|
(13,906
|
)
|
$
|
(6,114
|
)
|
$
|
(9,294
|
)
|
||
|
Total adjustments for the year
|
(6,562
|
)
|
(7,792
|
)
|
3,180
|
|
|||||
|
Balance at end of year
|
$
|
(20,468
|
)
|
$
|
(13,906
|
)
|
$
|
(6,114
|
)
|
||
12. STOCK BASED COMPENSATION
Under the 2012 Omnibus Equity Award Plan, the Company has granted stock options, restricted stock and Performance-Based Restricted Stock Units (“PSUs”) to certain employees and directors. Compensation expense for stock-based awards made to employees and directors in return for service is recorded in accordance with Compensation-Stock Compensation of the FASB ASC. The Company estimates forfeitures that it expects will occur and records expense based upon the number of awards expected to vest.
The Company recorded total stock based compensation expense of
$10.2 million
,
$7.5 million
, and
$8.1 million
during the years ended
December 31, 2015
,
2014
, and
2013
respectively. At
December 31, 2015
, there was
$16.9 million
of unrecognized compensation expense related to unvested awards, which is expected to be recognized over a weighted-average period of approximately
1.6
years.
PSUs—
PSUs are granted to employees of the Company and its subsidiaries. These shares are part of the compensation plan for services provided by the employees. The fair value of PSUs is measured using the Monte Carlo pricing model. The expense related to the PSUs is recorded over the vesting period. There was no cash flow impact resulting from the grants.
During the
year
ended
December 31, 2015
, the Company granted
415,000
PSUs. These shares will vest on the dates the Compensation Committee certifies the Company’s achievement of stock price performance relative to the Russell 2000 Index, provided that the recipient remains employed through such date. Performance will be measured over three separate measurement periods: a one-year measurement period, a two-year measurement period and a three-year measurement period. For performance periods one and two, vesting is not to exceed total grant divided by three. For performance period three, vesting is no less than zero and no greater than 150% of initial grant less shares vested in performance periods one and two. The fair value of PSUs is measured using the Monte Carlo pricing model using the following assumptions:
|
|
Year Ended December 31,
|
|||
|
2015
|
||||
|
Weighted average fair value of PSUs granted
|
$
|
9.25
|
|
|
|
Dividend yield
|
—
|
%
|
||
|
Risk free interest rate
|
1.1
|
%
|
||
|
Expected volatility
|
33.6
|
%
|
||
During the year ended
December 31, 2015
, there were no PSUs forfeited.
Restricted Stock—
Restricted stock is granted to employees of the Company and its subsidiaries, and to non-employee members of the Company’s Board. These shares are part of the compensation plan for services provided by the employees or Board members. The closing price of the Company’s stock on the date of grant is used to determine the fair value of the grants. The expense related to the restricted stock grants is recorded over the vesting period. There was no cash flow impact resulting from the grants.
73
The restricted stock vests in various increments on the anniversaries of each grant, subject to the recipient’s continued employment or service through each applicable vesting date. Vesting occurs over one year for Board members and over four years for employees.
A summary of the status of restricted stock awards as of
December 31, 2015
,
2014
, and
2013
and the changes during the periods then ended is presented below:
|
Year Ended December 31,
|
|||||||||||||||||||||
|
2015
|
2014
|
2013
|
|||||||||||||||||||
|
Shares
|
Weighted- Average Fair Value at Grant Date
|
Shares
|
Weighted- Average Fair Value at Grant Date
|
Shares
|
Weighted- Average Fair Value at Grant Date
|
||||||||||||||||
|
Non-vested at beginning of the period
|
1,786,581
|
|
$
|
8.45
|
|
1,560,375
|
|
$
|
9.81
|
|
1,305,369
|
|
$
|
10.09
|
|
||||||
|
Granted—Restricted Stock
|
1,261,600
|
|
$
|
8.83
|
|
1,114,700
|
|
$
|
7.39
|
|
1,116,000
|
|
$
|
9.67
|
|
||||||
|
Forfeited during the period
|
(245,312
|
)
|
$
|
8.34
|
|
(288,450
|
)
|
$
|
8.72
|
|
(437,813
|
)
|
$
|
9.99
|
|
||||||
|
Vested during the period
|
(680,644
|
)
|
$
|
8.91
|
|
(600,044
|
)
|
$
|
9.87
|
|
(423,181
|
)
|
$
|
10.15
|
|
||||||
|
Non-vested at end of period
|
2,122,225
|
|
$
|
8.54
|
|
1,786,581
|
|
$
|
8.45
|
|
1,560,375
|
|
$
|
9.81
|
|
||||||
Stock Options—
The fair value of each option grant is estimated using the Black-Scholes option-pricing model using the weighted-average assumptions in the table below. This valuation model requires the Company to make assumptions and judgments about the variables used in the calculation, including the fair value of the Company’s common stock, the expected life (the period of time that the options granted are expected to be outstanding), the volatility of the Company’s common stock, a risk-free interest rate and expected dividends. The expected life of options granted is derived from historical exercise behavior. The risk-free rate for periods within the expected life of the option is based on the U.S. Treasury rates in effect at the time of grant. The stock options vest 25% after one year, beginning on the first anniversary date of the grant, and 6.25% each quarter following the first anniversary. There was no cash flow impact resulting from the grants. No stock options were granted during the year ended
December 31, 2015
.
|
|
Year Ended December 31,
|
||||||
|
2014
|
2013
|
||||||
|
The weighted average fair value of options granted
|
$
|
2.62
|
|
$
|
3.51
|
|
|
|
Dividend yield
|
—
|
%
|
—
|
%
|
|||
|
Weighted average risk free interest rate
|
1.56
|
%
|
1.03
|
%
|
|||
|
Weighted average expected volatility
|
40.16
|
%
|
42.29
|
%
|
|||
|
Expected life (in years)
|
4.6
|
|
4.6
|
|
|||
A summary of the status of options granted as of
December 31, 2015
,
2014
, and
2013
, and the changes during the periods then ended is presented below:
|
|
Year Ended December 31, 2015
|
|||||||||
|
|
Options
|
Weighted-Average Exercise Price
|
Aggregate Intrinsic Value
|
|||||||
|
Options outstanding at January 1
|
4,667,738
|
|
$
|
6.14
|
|
$
|
19,357,512
|
|
||
|
Exercised
|
(1,802,913
|
)
|
$
|
3.92
|
|
$
|
9,162,469
|
|
||
|
Forfeited
|
(191,313
|
)
|
$
|
10.76
|
|
—
|
|
|||
|
Options outstanding at December 31
|
2,673,512
|
|
$
|
7.46
|
|
$
|
5,485,248
|
|
||
|
Exercisable at December 31
|
2,037,318
|
|
$
|
7.19
|
|
$
|
4,832,280
|
|
||
|
Options expected to vest at December 31
|
625,741
|
|
$
|
8.31
|
|
|||||
74
|
Year Ended December 31, 2014
|
||||||||||
|
Options
|
Weighted-Average Exercise Price
|
Aggregate Intrinsic Value
|
||||||||
|
Options outstanding at January 1
|
7,536,601
|
|
$
|
5.53
|
|
$
|
17,493,907
|
|
||
|
Granted
|
659,500
|
|
$
|
7.32
|
|
—
|
|
|||
|
Exercised
|
(3,126,522
|
)
|
$
|
4.51
|
|
$
|
13,035,677
|
|
||
|
Forfeited
|
(401,841
|
)
|
$
|
9.33
|
|
—
|
|
|||
|
Options outstanding at December 31
|
4,667,738
|
|
$
|
6.14
|
|
$
|
19,357,512
|
|
||
|
Exercisable at December 31
|
3,513,920
|
|
$
|
5.43
|
|
$
|
17,239,884
|
|
||
|
|
Year Ended December 31, 2013
|
|||||||||
|
|
Options
|
Weighted-Average Exercise Price
|
Aggregate Intrinsic Value
|
|||||||
|
Options outstanding at January 1
|
8,780,400
|
|
$
|
4.67
|
|
$
|
41,236,574
|
|
||
|
Granted
|
1,087,000
|
|
$
|
9.59
|
|
$
|
—
|
|
||
|
Exercised
|
(1,688,079
|
)
|
$
|
1.99
|
|
$
|
12,042,458
|
|
||
|
Forfeited
|
(642,720
|
)
|
$
|
9.90
|
|
—
|
|
|||
|
Options outstanding at December 31
|
7,536,601
|
|
$
|
5.53
|
|
$
|
17,493,907
|
|
||
|
Exercisable at December 31
|
6,275,243
|
|
$
|
4.77
|
|
$
|
17,413,337
|
|
||
The weighted-average remaining contractual term of options exercisable at
December 31, 2015
is
2.4
years. The following table summarizes information about options outstanding as of
December 31, 2015
:
|
|
Options Outstanding
|
Options
Exercisable
|
||||||
|
Exercise Price
|
Number
Outstanding
|
Weighted-
Average
Remaining
Contractual
Life
|
Number
Exercisable
|
|||||
|
|
|
(in years)
|
|
|||||
|
$ 1.00 - $ 3.99
|
168,000
|
|
0.1
|
|
168,000
|
|
||
|
$ 4.00 - $ 5.99
|
325,070
|
|
0.9
|
|
325,070
|
|
||
|
$ 6.00 - $ 8.99
|
1,461,604
|
|
3.2
|
|
1,051,036
|
|
||
|
$ 9.00 - $ 14.50
|
718,838
|
|
4.0
|
|
493,212
|
|
||
|
2,673,512
|
|
2,037,318
|
|
|||||
13. INCOME TAXES
Deferred tax assets (liabilities) included in the balance sheet as of
December 31, 2015
and
2014
are as follows (in thousands):
75
|
|
2015
|
2014
|
|||||
|
Deferred tax assets:
|
|||||||
|
Net operating loss carryforward
|
$
|
523
|
|
$
|
1,831
|
|
|
|
Allowance for doubtful accounts
|
671
|
|
728
|
|
|||
|
Provision for accrued expenses and other, net
|
2,412
|
|
1,938
|
|
|||
|
Stock based compensation
|
4,825
|
|
4,516
|
|
|||
|
Deferred revenue
|
173
|
|
82
|
|
|||
|
Tax credit carryforward
|
1,443
|
|
1,467
|
|
|||
|
10,047
|
|
10,562
|
|
||||
|
Less valuation allowance
|
1,746
|
|
1,793
|
|
|||
|
Deferred tax asset, net of valuation allowance
|
8,301
|
|
8,769
|
|
|||
|
Deferred tax liabilities:
|
|||||||
|
Acquired intangibles
|
(15,264
|
)
|
(18,672
|
)
|
|||
|
Depreciation of fixed assets
|
(3,564
|
)
|
(1,806
|
)
|
|||
|
Deferred tax liabilities
|
(18,828
|
)
|
(20,478
|
)
|
|||
|
Net deferred tax liability
|
$
|
(10,527
|
)
|
$
|
(11,709
|
)
|
|
|
Recognized in Consolidated Balance Sheets:
|
|||||||
|
Deferred tax asset
|
322
|
|
481
|
|
|||
|
Deferred tax liability
|
(10,849
|
)
|
(12,190
|
)
|
|||
|
Net deferred tax liability
|
$
|
(10,527
|
)
|
$
|
(11,709
|
)
|
|
At
December 31, 2015
and
2014
, the Company had deferred tax assets of
$523,000
and
$1.8 million
, respectively, related to net operating loss carryforwards and
$1.4 million
and
$1.5 million
, respectively, related to tax credit carryforwards. The net operating losses expire in various years through 2030, and the tax credits expire in various years through 2023. The Company has recorded valuation allowances of
$1.7 million
and
$1.8 million
, respectively, at
December 31, 2015
and
2014
in order to measure only the portion of the deferred tax assets which are more likely than not to be realized.
Tax expense (benefit) for the years ended
December 31, 2015
,
2014
and
2013
is as follows (in thousands):
|
|
2015
|
2014
|
2013
|
||||||||
|
Current income tax expense (benefit):
|
|||||||||||
|
Federal
|
$
|
10,201
|
|
$
|
13,184
|
|
$
|
16,372
|
|
||
|
State
|
1,491
|
|
1,948
|
|
1,511
|
|
|||||
|
Foreign
|
3,500
|
|
3,753
|
|
(2,528
|
)
|
|||||
|
Current income tax expense (benefit)
|
15,192
|
|
18,885
|
|
15,355
|
|
|||||
|
Deferred income tax expense (benefit):
|
|||||||||||
|
Federal
|
998
|
|
(1,048
|
)
|
(4,735
|
)
|
|||||
|
State
|
405
|
|
(448
|
)
|
(350
|
)
|
|||||
|
Foreign
|
(2,586
|
)
|
(2,152
|
)
|
779
|
|
|||||
|
Deferred income tax expense (benefit)
|
(1,183
|
)
|
(3,648
|
)
|
(4,306
|
)
|
|||||
|
Income tax expense
|
$
|
14,009
|
|
$
|
15,237
|
|
$
|
11,049
|
|
||
76
A reconciliation of the federal statutory tax rate to the effective tax rate on continuing operations applicable to income before income tax expense (benefit) follows:
|
|
Year Ended December 31,
|
|||||||
|
|
2015
|
2014
|
2013
|
|||||
|
Federal statutory rate
|
35.0
|
%
|
35.0
|
%
|
35.0
|
%
|
||
|
Permanent items excluding nondeductible impairment
|
0.6
|
%
|
0.8
|
%
|
0.8
|
%
|
||
|
Nondeductible impairment
|
302.5
|
%
|
—
|
%
|
—
|
%
|
||
|
State taxes, net of federal effect
|
47.2
|
%
|
2.4
|
%
|
4.0
|
%
|
||
|
Difference between foreign and U.S. rates
|
77.8
|
%
|
(1.7
|
)%
|
(0.5
|
)%
|
||
|
Change in unrecognized tax benefits
|
1.5
|
%
|
1.8
|
%
|
1.1
|
%
|
||
|
Recognition of tax loss carryforwards
|
—
|
%
|
(4.3
|
)%
|
—
|
%
|
||
|
Other
|
(3.9
|
)%
|
1.6
|
%
|
0.1
|
%
|
||
|
Effective tax rate
|
460.7
|
%
|
35.6
|
%
|
40.5
|
%
|
||
The Company recorded an impairment charge of
$34.8 million
in 2015, of which
$33.6 million
related to goodwill for which the Company had zero tax basis, and thus represented a permanent non-deductible amount for tax purposes. Based on the statutory tax rates in the jurisdictions where the impairment was recorded, the
$33.6 million
non-deductible amount resulted in tax expense of
$9.2 million
.
The impairment caused the Company’s 2015 state tax rate to differ significantly from 2014 and 2013. U.S. income before taxes for the year ended December 31, 2015 included a non-deductible impairment charge of
$15.3 million
. Excluding the non-deductible impairment, the Company had U.S. income before taxes of
$34.1 million
, which resulted in state tax expense of
$1.4 million
.
The Company’s 2015 allocation of income (loss) between the U.S. and foreign jurisdictions differed significantly from 2014 and 2013 due to the impact of the impairment. Income (loss) before taxes for the year ended December 31, 2015 was
$18.8 million
in the U.S. and
$(15.8) million
in foreign jurisdictions. The foreign loss included a non-deductible impairment charge of
$18.3 million
. Excluding the impairment, the Company had foreign income before taxes of
$2.5 million
, which resulted in foreign tax expense of
$914,000
.
The Company’s income (loss) before tax from foreign entities was
$(15.8) million
,
$2.9 million
and
$(5.7) million
for the years ended
December 31, 2015
,
2014
and
2013
, respectively. The Company plans to continue to finance expansion and operating requirements of subsidiaries outside the U.S. through reinvestment of the undistributed earnings of these subsidiaries (approximately
$28 million
at
December 31, 2015
), and taxes that would result from potential distributions have not been provided. If earnings were distributed, additional taxes payable would be reduced by available tax credits arising from taxes paid outside the U.S.
An uncertain tax position represents the Company’s expected treatment of a tax position taken in a filed tax return, or planned to be taken in a tax return not yet filed, that has not been reflected in measuring income tax expense for financial reporting purposes. At both
December 31, 2015
and
2014
, the Company has recorded a liability of
$3.4 million
which consists of unrecognized tax benefits of
$3.0 million
and
$3.1 million
, respectively, and estimated accrued interest and penalties of
$447,000
and
$270,000
, respectively. The Company recognizes interest and penalties related to uncertain tax positions in income tax expense. During the years ended
December 31, 2015
,
2014
and
2013
, interest and penalties recorded in the Consolidated Statements of Operations were
$177,000
,
$11,000
and
$(52,000)
, respectively. Following is a reconciliation of the amounts of unrecognized tax benefits for the year ended
December 31, 2015
,
2014
and
2013
(in thousands):
|
|
2015
|
2014
|
2013
|
||||||||
|
Unrecognized tax benefits—beginning of period
|
$
|
3,122
|
|
$
|
2,359
|
|
$
|
2,191
|
|
||
|
Gross increases in tax positions related to current year
|
169
|
|
608
|
|
453
|
|
|||||
|
Gross increases in tax positions related to prior year
|
76
|
|
201
|
|
233
|
|
|||||
|
Settlements with taxing authorities
|
—
|
|
—
|
|
(301
|
)
|
|||||
|
Lapse of statute of limitations
|
(378
|
)
|
(46
|
)
|
(217
|
)
|
|||||
|
Unrecognized tax benefits—end of period
|
$
|
2,989
|
|
$
|
3,122
|
|
$
|
2,359
|
|
||
77
The balance of unrecognized tax benefits of
$3.4 million
as of both
December 31, 2015
and
2014
if recognized, would affect the effective tax rate.
The Company files income tax returns in the U.S. federal jurisdiction, and various state, local and foreign jurisdictions. The Company is generally no longer subject to examinations by tax authorities for its U.S. federal and foreign tax returns for years prior to 2012; or for its U.S. state and local tax returns for years prior to 2010. The Company believes it is reasonably possible that as much as
$829,000
of its unrecognized tax benefits may be recognized by the end of 2016 as a result of a lapse of the statute of limitations.
14. EMPLOYEE SAVINGS PLAN
The Company has a savings plan (the “Savings Plan”) that qualifies as a deferred salary arrangement under Section 401(k) of the Internal Revenue Code. Under the Savings Plan, participating employees may defer a portion of their pretax earnings, up to the Internal Revenue Service annual contribution limit. The Company contributed
$1.6 million
,
$1.4 million
, and
$1.2 million
for the years ended
December 31, 2015
,
2014
and
2013
, respectively, to match employee contributions to the Savings Plan.
15. SEGMENT INFORMATION
The Company changed its reportable segments during the first quarter of 2015 to reflect the current operating structure. Accordingly, all prior periods have been recast to reflect the current segment presentation.
The Company has
five
reportable segments: Tech & Clearance, Finance, Energy, Healthcare and Hospitality. The Tech & Clearance reportable segment includes the Dice, ClearanceJobs, and Dice Europe services, as well as career fairs. The Finance reportable segment includes the eFinancialCareers service worldwide. The Energy reportable segment includes the Rigzone service, OilCareers service (from the date of acquisition through March 2015, when the OilCareers recruitment site was merged into Rigzone) and career fairs. The Healthcare reportable segment includes Health eCareers and BioSpace services. The Hospitality reportable segment includes Hcareers. Management has organized its reportable segments based upon the industry verticals served. Each of the reportable segments generates significant revenue from sales of recruitment packages and related services.
The Company has other services and activities that individually are not more than
10%
of consolidated revenues, operating income or total assets. These include Slashdot Media, WorkDigital, BrightMatter and IT Media and are reported in the “Corporate & Other” category, along with corporate-related costs which are not considered in a segment.
The Company’s foreign operations are comprised of the Dice Europe operations and a portion of the eFinancialCareers and Rigzone services, which operate in Europe, the financial centers of the gulf region of the Middle East and Asia Pacific. The Company’s foreign operations also include Hcareers, which operates in Canada. Revenue by geographic region, as shown in the table below, is based on the location of the Company’s subsidiary.
The following table shows the segment information (in thousands):
78
|
|
2015
|
2014
|
2013
|
||||||||
|
By Segment:
|
|||||||||||
|
Revenues:
|
|||||||||||
|
Tech & Clearance
|
$
|
138,553
|
|
$
|
133,609
|
|
$
|
130,969
|
|
||
|
Finance
|
36,408
|
|
36,661
|
|
34,997
|
|
|||||
|
Energy
|
21,036
|
|
30,449
|
|
23,503
|
|
|||||
|
Healthcare
|
30,762
|
|
26,913
|
|
5,563
|
|
|||||
|
Hospitality
|
15,954
|
|
13,656
|
|
1,389
|
|
|||||
|
Corporate & Other
|
17,056
|
|
21,327
|
|
17,061
|
|
|||||
|
Total revenues
|
$
|
259,769
|
|
$
|
262,615
|
|
$
|
213,482
|
|
||
|
Depreciation:
|
|||||||||||
|
Tech & Clearance
|
$
|
6,495
|
|
$
|
6,280
|
|
$
|
5,254
|
|
||
|
Finance
|
548
|
|
578
|
|
523
|
|
|||||
|
Energy
|
192
|
|
178
|
|
119
|
|
|||||
|
Healthcare
|
1,599
|
|
2,639
|
|
729
|
|
|||||
|
Hospitality
|
175
|
|
261
|
|
45
|
|
|||||
|
Corporate & Other
|
289
|
|
1,008
|
|
1,395
|
|
|||||
|
Total depreciation
|
$
|
9,298
|
|
$
|
10,944
|
|
$
|
8,065
|
|
||
|
Amortization:
|
|||||||||||
|
Tech & Clearance
|
$
|
3,460
|
|
$
|
3,838
|
|
$
|
1,703
|
|
||
|
Finance
|
38
|
|
76
|
|
425
|
|
|||||
|
Energy
|
6,211
|
|
5,767
|
|
3,100
|
|
|||||
|
Healthcare
|
1,758
|
|
3,665
|
|
1,285
|
|
|||||
|
Hospitality
|
1,930
|
|
2,273
|
|
389
|
|
|||||
|
Corporate & Other
|
497
|
|
638
|
|
2,434
|
|
|||||
|
Total amortization
|
$
|
13,894
|
|
$
|
16,257
|
|
$
|
9,336
|
|
||
79
|
|
2015
|
2014
|
2013
|
||||||||
|
Operating income (loss):
|
|||||||||||
|
Tech & Clearance
|
$
|
49,888
|
|
$
|
48,441
|
|
$
|
59,526
|
|
||
|
Finance
|
7,419
|
|
6,523
|
|
6,790
|
|
|||||
|
Energy
|
(36,727
|
)
|
6,214
|
|
6,275
|
|
|||||
|
Healthcare
|
(150
|
)
|
(4,817
|
)
|
(4,773
|
)
|
|||||
|
Hospitality
|
4,917
|
|
2,258
|
|
(1,036
|
)
|
|||||
|
Corporate & Other
|
(18,992
|
)
|
(12,015
|
)
|
(37,576
|
)
|
|||||
|
Operating income
|
6,355
|
|
46,604
|
|
29,206
|
|
|||||
|
Interest expense
|
(3,289
|
)
|
(3,744
|
)
|
(1,906
|
)
|
|||||
|
Interest income
|
—
|
|
—
|
|
30
|
|
|||||
|
Other income (expense)
|
(25
|
)
|
(11
|
)
|
(35
|
)
|
|||||
|
Income before income taxes
|
$
|
3,041
|
|
$
|
42,849
|
|
$
|
27,295
|
|
||
|
Capital expenditures:
|
|||||||||||
|
Tech & Clearance
|
$
|
5,652
|
|
$
|
5,611
|
|
$
|
8,183
|
|
||
|
Finance
|
608
|
|
671
|
|
314
|
|
|||||
|
Energy
|
354
|
|
157
|
|
403
|
|
|||||
|
Healthcare
|
2,350
|
|
1,548
|
|
701
|
|
|||||
|
Hospitality
|
66
|
|
42
|
|
—
|
|
|||||
|
Corporate & Other
|
208
|
|
513
|
|
1,527
|
|
|||||
|
Total capital expenditures
|
$
|
9,238
|
|
$
|
8,542
|
|
$
|
11,128
|
|
||
|
By Geography:
|
|||||||||||
|
Revenues:
|
|||||||||||
|
United States
|
$
|
185,847
|
|
$
|
187,427
|
|
$
|
169,662
|
|
||
|
EMEA
(1)
|
46,139
|
|
52,446
|
|
33,651
|
|
|||||
|
APAC and Canada
(2)
|
27,783
|
|
22,742
|
|
10,169
|
|
|||||
|
Non-United States
|
73,922
|
|
75,188
|
|
43,820
|
|
|||||
|
Total revenues
|
$
|
259,769
|
|
$
|
262,615
|
|
$
|
213,482
|
|
||
|
(1) Europe, the Middle East and Africa (“EMEA”)
|
|||||||||||
|
(2) Asia-Pacific (“APAC”)
|
|||||||||||
|
|
December 31,
2015 |
December 31,
2014 |
December 31,
2013 |
||||||||
|
Total assets:
|
|||||||||||
|
Tech & Clearance
|
$
|
177,519
|
|
$
|
185,547
|
|
$
|
180,366
|
|
||
|
Finance
|
75,191
|
|
69,960
|
|
89,213
|
|
|||||
|
Energy
|
34,406
|
|
85,042
|
|
52,374
|
|
|||||
|
Healthcare
|
19,669
|
|
20,794
|
|
28,679
|
|
|||||
|
Hospitality
|
38,979
|
|
33,742
|
|
38,600
|
|
|||||
|
Corporate & Other
|
24,735
|
|
28,871
|
|
31,409
|
|
|||||
|
Total assets
|
$
|
370,499
|
|
$
|
423,956
|
|
$
|
420,641
|
|
||
80
The following table shows the carrying amount of goodwill by reportable segment as of
December 31, 2015
and
2014
and the changes in goodwill for the years ended (in thousands):
|
|
Tech & Clearance
|
Finance
|
Energy
|
Healthcare
|
Hospitality
|
Corporate & Other
|
Total
|
||||||||||||||||||||
|
Goodwill at January 1, 2014
|
|||||||||||||||||||||||||||
|
Goodwill
|
$
|
96,519
|
|
$
|
63,467
|
|
$
|
35,104
|
|
$
|
7,714
|
|
$
|
17,456
|
|
$
|
24,871
|
|
$
|
245,131
|
|
||||||
|
Accumulated impairment losses
|
—
|
|
(7,213
|
)
|
—
|
|
(1,445
|
)
|
—
|
|
(6,283
|
)
|
(14,941
|
)
|
|||||||||||||
|
$
|
96,519
|
|
$
|
56,254
|
|
$
|
35,104
|
|
$
|
6,269
|
|
$
|
17,456
|
|
$
|
18,588
|
|
$
|
230,190
|
|
|||||||
|
Goodwill acquired during the year
|
—
|
|
—
|
|
15,078
|
|
—
|
|
—
|
|
—
|
|
15,078
|
|
|||||||||||||
|
Foreign currency translation adjustment
|
(573
|
)
|
(2,781
|
)
|
5
|
|
—
|
|
(1,585
|
)
|
(1,078
|
)
|
(6,012
|
)
|
|||||||||||||
|
Goodwill at December 31, 2014
|
|||||||||||||||||||||||||||
|
Goodwill
|
$
|
95,946
|
|
$
|
60,686
|
|
$
|
50,187
|
|
$
|
7,714
|
|
$
|
15,871
|
|
$
|
23,793
|
|
$
|
254,197
|
|
||||||
|
Accumulated impairment losses
|
—
|
|
(7,213
|
)
|
—
|
|
(1,445
|
)
|
—
|
|
(6,283
|
)
|
(14,941
|
)
|
|||||||||||||
|
$
|
95,946
|
|
$
|
53,473
|
|
$
|
50,187
|
|
$
|
6,269
|
|
$
|
15,871
|
|
$
|
17,510
|
|
$
|
239,256
|
|
|||||||
|
Impairment losses
|
—
|
|
—
|
|
(34,818
|
)
|
—
|
|
—
|
|
—
|
|
(34,818
|
)
|
|||||||||||||
|
Foreign currency translation adjustment
|
(423
|
)
|
(2,058
|
)
|
—
|
|
—
|
|
(2,559
|
)
|
(800
|
)
|
(5,840
|
)
|
|||||||||||||
|
Goodwill at December 31, 2015
|
|||||||||||||||||||||||||||
|
Goodwill
|
$
|
95,523
|
|
$
|
58,628
|
|
$
|
50,187
|
|
$
|
7,714
|
|
$
|
13,312
|
|
$
|
22,993
|
|
$
|
248,357
|
|
||||||
|
Accumulated impairment losses
|
—
|
|
(7,213
|
)
|
(34,818
|
)
|
(1,445
|
)
|
—
|
|
(6,283
|
)
|
(49,759
|
)
|
|||||||||||||
|
$
|
95,523
|
|
$
|
51,415
|
|
$
|
15,369
|
|
$
|
6,269
|
|
$
|
13,312
|
|
$
|
16,710
|
|
$
|
198,598
|
|
|||||||
Goodwill impairment of
$34.8 million
was recorded during the year ended December 31, 2015 at the Energy segment. Goodwill acquired during the year ended December 31, 2014 was the result of the OilCareers acquisition.
16. EARNINGS PER SHARE
Basic earnings per share (“EPS”) is computed based on the weighted-average number of shares of common stock outstanding. Diluted EPS is computed based on the weighted-average number of shares of common stock outstanding plus common stock equivalents assuming exercise of stock options, where dilutive. In 2015, shares issuable upon exercise of stock options of
1.3 million
were excluded from the computation of shares contingently issuable upon exercise as we recognized a net loss. Options to purchase approximately
2.5 million
and
2.7 million
shares were outstanding during the years ended
December 31, 2014
and
2013
respectively, but were excluded from the calculation of diluted EPS for the periods then ended because the options’ exercise price was greater than the average market price of the common shares. The following is a calculation of basic and diluted earnings per share and weighted-average shares outstanding (in thousands, except per share amounts):
|
|
2015
|
2014
|
2013
|
||||||||
|
Income (loss) from continuing operations—basic and diluted
|
$
|
(10,968
|
)
|
$
|
27,612
|
|
$
|
16,246
|
|
||
|
Weighted-average shares outstanding—basic
|
51,402
|
|
52,328
|
|
56,473
|
|
|||||
|
Add shares issuable upon exercise of stock options
|
—
|
|
2,082
|
|
3,003
|
|
|||||
|
Weighted-average shares outstanding—diluted
|
51,402
|
|
54,410
|
|
59,476
|
|
|||||
|
Basic earnings (loss) per share
|
$
|
(0.21
|
)
|
$
|
0.53
|
|
$
|
0.29
|
|
||
|
Diluted earnings (loss) per share
|
$
|
(0.21
|
)
|
$
|
0.51
|
|
$
|
0.27
|
|
||
81
17. QUARTERLY RESULTS OF OPERATIONS (UNAUDITED)
The following is a summary of unaudited quarterly results of operations for
2015
and
2014
:
|
|
For the Three Months Ended
|
|||||||||||||||
|
|
March 31
|
June 30
|
September 30
|
December 31
|
||||||||||||
|
|
(in thousands, except per share amounts)
|
|||||||||||||||
|
2015
|
||||||||||||||||
|
Revenues
|
$
|
63,770
|
|
$
|
65,802
|
|
$
|
65,138
|
|
$
|
65,059
|
|
||||
|
Total operating expenses
|
54,610
|
|
55,286
|
|
54,180
|
|
89,338
|
|
||||||||
|
Operating income (loss)
|
$
|
9,160
|
|
$
|
10,516
|
|
$
|
10,958
|
|
$
|
(24,279
|
)
|
[1]
|
|||
|
Net income (loss)
|
$
|
5,092
|
|
$
|
5,678
|
|
$
|
6,511
|
|
$
|
(28,249
|
)
|
||||
|
Basic earnings (loss) per common share
|
$
|
0.10
|
|
$
|
0.11
|
|
$
|
0.13
|
|
$
|
(0.56
|
)
|
[2]
|
|||
|
Diluted earnings (loss) per common share
|
$
|
0.09
|
|
$
|
0.11
|
|
$
|
0.12
|
|
$
|
(0.56
|
)
|
||||
|
2014
|
||||||||||||||||
|
Revenues
|
$
|
60,690
|
|
$
|
66,544
|
|
$
|
67,615
|
|
$
|
67,766
|
|
||||
|
Total operating expenses
|
52,814
|
|
53,556
|
|
54,183
|
|
55,458
|
|
||||||||
|
Operating income
|
$
|
7,876
|
|
$
|
12,988
|
|
$
|
13,432
|
|
$
|
12,308
|
|
||||
|
Net income
|
$
|
4,395
|
|
$
|
7,208
|
|
$
|
9,493
|
|
$
|
6,516
|
|
||||
|
Basic earnings per common share
|
$
|
0.08
|
|
$
|
0.14
|
|
$
|
0.18
|
|
$
|
0.13
|
|
||||
|
Diluted earnings per common share
|
$
|
0.08
|
|
$
|
0.13
|
|
$
|
0.18
|
|
$
|
0.12
|
|
||||
____________________
|
[1]
|
Impairment of goodwill of
$34.8 million
was recorded during the three months ended December 31, 2015 related to the Energy segment.
|
|
[2]
|
Due to rounding, the sum of the quarters may not equal the full year amount.
|
82
None.
|
Item 9A.
|
Controls and Procedures
|
Evaluation of Disclosure Controls and Procedures
Our management, with the participation of our Chief Executive Officer (“CEO”) and Chief Financial Officer (“CFO”), has evaluated the effectiveness of the Company’s disclosure controls and procedures (as defined in Rules 13a-15(e) and 15d-15(e) under the Exchange Act) as of the end of the fiscal period covered by this report.
Based on such evaluations, the CEO and CFO have concluded that the disclosure controls and procedures are effective to provide reasonable assurance that information required to be disclosed in our Exchange Act reports is recorded, processed, summarized and reported within the time periods specified by the SEC, and that such information is accumulated and communicated to management, including the CEO and CFO, as appropriate, to allow timely decisions regarding required disclosure.
Management’s Report on Internal Control Over Financial Reporting
Our management is responsible for establishing and maintaining adequate internal control over financial reporting (as defined in Rules 13a-15(f) and 15d-15(f) under the Exchange Act).
Management conducted an evaluation of the effectiveness of our internal control over financial reporting based on the framework in
Internal Control—Integrated Framework (1992)
issued by the Committee of Sponsoring Organizations of the Treadway Commission. Based on this evaluation, management concluded that the Company’s internal control over financial reporting was effective as of
December 31, 2015
.
Because of its inherent limitations, internal control over financial reporting may not prevent or detect misstatements. Projections of any evaluation of effectiveness to future periods are subject to the risks that controls may become inadequate because of changes in conditions, or that the degree of compliance with the policies or procedures may deteriorate.
Deloitte & Touche LLP has audited the Company’s internal control over financial reporting as of
December 31, 2015
and has issued an attestation report regarding its assessment included herein.
Changes in Internal Controls
No change in our internal control over financial reporting (as defined in Rules 13a-15(f) under the Exchange Act) occurred during the quarter ended
December 31, 2015
that has materially affected, or is reasonably likely to materially affect, our internal control over financial reporting.
|
Item 9B.
|
Other Information
|
None.
83
REPORT OF INDEPENDENT REGISTERED PUBLIC ACCOUNTING FIRM
To the Board of Directors and Stockholders of
DHI Group, Inc.
New York, New York
We have audited the internal control over financial reporting of DHI Group, Inc. and subsidiaries (the "Company") as of December 31, 2015, based on criteria established in
Internal Control - Integrated Framework (2013)
issued by the Committee of Sponsoring Organizations of the Treadway Commission. The Company's management is responsible for maintaining effective internal control over financial reporting and for its assessment of the effectiveness of internal control over financial reporting, included in the accompanying Management’s Report on Internal Control over Financial Reporting. Our responsibility is to express an opinion on the Company's internal control over financial reporting based on our audit.
We conducted our audit in accordance with the standards of the Public Company Accounting Oversight Board (United States). Those standards require that we plan and perform the audit to obtain reasonable assurance about whether effective internal control over financial reporting was maintained in all material respects. Our audit included obtaining an understanding of internal control over financial reporting, assessing the risk that a material weakness exists, testing and evaluating the design and operating effectiveness of internal control based on the assessed risk, and performing such other procedures as we considered necessary in the circumstances. We believe that our audit provides a reasonable basis for our opinion.
A company's internal control over financial reporting is a process designed by, or under the supervision of, the company's principal executive and principal financial officers, or persons performing similar functions, and effected by the company's board of directors, management, and other personnel to provide reasonable assurance regarding the reliability of financial reporting and the preparation of financial statements for external purposes in accordance with generally accepted accounting principles. A company's internal control over financial reporting includes those policies and procedures that (1) pertain to the maintenance of records that, in reasonable detail, accurately and fairly reflect the transactions and dispositions of the assets of the company; (2) provide reasonable assurance that transactions are recorded as necessary to permit preparation of financial statements in accordance with generally accepted accounting principles, and that receipts and expenditures of the company are being made only in accordance with authorizations of management and directors of the company; and (3) provide reasonable assurance regarding prevention or timely detection of unauthorized acquisition, use, or disposition of the company's assets that could have a material effect on the financial statements.
Because of the inherent limitations of internal control over financial reporting, including the possibility of collusion or improper management override of controls, material misstatements due to error or fraud may not be prevented or detected on a timely basis. Also, projections of any evaluation of the effectiveness of the internal control over financial reporting to future periods are subject to the risk that the controls may become inadequate because of changes in conditions, or that the degree of compliance with the policies or procedures may deteriorate.
In our opinion, the Company maintained, in all material respects, effective internal control over financial reporting as of December 31, 2015, based on the criteria established in
Internal Control - Integrated Framework (2013)
issued by the Committee of Sponsoring Organizations of the Treadway Commission.
We have also audited, in accordance with the standards of the Public Company Accounting Oversight Board (United States), the consolidated financial statements and financial statement schedule as of and for the year ended December 31, 2015 of the Company and our report dated
February 9, 2016
expressed an unqualified opinion on those financial statements and financial statement schedule.
/s/ Deloitte & Touche LLP
Des Moines, Iowa
February 9, 2016
84
|
Item 10.
|
Directors, Executive Officers and Corporate Governance
|
Except as set forth below, the information called for by Item 10 will be set forth in our definitive proxy statement relating to our 2016 Annual Meeting of Stockholders (“the Proxy Statement”) to be filed within 120 days of the Company’s fiscal year end of December 31, 2015 and which is incorporated herein by reference.
Executive Officers of the Company
Set forth below is information relating to the Company’s executive officers as of January 31, 2016.
|
Name
|
Age
|
Position
|
|
|
Michael P. Durney
|
53
|
President and Chief Executive Officer
|
|
|
John J. Roberts
|
49
|
Chief Financial Officer
|
|
|
Klavs Miller
|
46
|
Chief Technology Officer
|
|
|
Pam Bilash
|
57
|
Senior Vice President, Human Resources
|
|
|
John Benson
|
54
|
Chief Strategy Officer
|
|
|
Brian P. Campbell
|
51
|
Vice President, Business and Legal Affairs, General Counsel and Secretary
|
|
|
Shravan Goli
|
45
|
President, BrightMatter Group
|
|
|
James Bennett
|
45
|
Managing Director, Global Industry Brands
|
|
Michael P. Durney
has been President and Chief Executive Officer, as well as a director of the Company since September 2013. Mr. Durney joined our predecessor, Dice Inc., in May 2000 as the Company’s Chief Financial Officer and held that position, as well as other operating roles until he became President and CEO. Previously, Mr. Durney had strategic and operational leadership responsibility for all of our industry-focused services, including eFinancialCareers, Health Callings and Rigzone, the latter of which he led since the acquisitions in 2010. Prior to joining the Company, he held the position of Vice President and Controller of USA Networks, Inc. (now known as IAC/InterActiveCorp.) from 1998 to 2000. Mr. Durney’s previous experience includes being the Chief Financial Officer of Newport Media, Inc. from 1996 to 1998, Executive Vice President, Finance of Hallmark Entertainment, Inc. from 1994 to 1996 and Vice President, Controller of Univision Television Group, Inc. from 1989 to 1994. Mr. Durney started his finance career at the accounting firm of Arthur Young & Company in 1983 and is a licensed Certified Public Accountant in the state of New York. Mr. Durney holds a B.S. degree in accounting from the State University of New York in Oswego, where he is the Chair of the Advisory Council of the School of Business and Vice Chair of the Board of Directors of the Oswego College Foundation.
John Roberts
has been Chief Financial Officer since joining the Company in October 2013. He has responsibility for the Company’s financial organization, including financial and strategic planning, corporate development, accounting, financial reporting, investor relations, treasury, internal audit and tax, as well as the Company’s legal organization. Prior to joining the Company, Mr. Roberts was CFO of BrightLine, a provider of interactive television solutions, as well as CFO of OpenSky, Inc. and Mformation, Inc. Mr. Roberts served as the CFO of each of Right Media, Inc., an online advertising exchange until it was acquired by Yahoo! in 2007, Arbinet-thexchange, Inc., during its initial public offering and Razorfish, Inc. Mr. Roberts started his career at PricewaterhouseCoopers LLP where he served for more than a decade ultimately becoming Audit Partner. He graduated from Boston College with a B.S. degree in Accounting.
Klavs Miller
has been Senior Vice President, Technology since January 2014, after joining the Company through its acquisition of onTargetjobs where Mr. Miller served as the Chief Information Officer since 2011. He oversees the Company’s technology-related functions, including enterprise R&D, operations, support and infrastructure. Mr. Miller started his career as a software engineer in the early 1990s, followed by various technical and management positions with international ERP company, Baan. Since then, he has held a number of senior management positions with various technology and software companies, such as InfoNow, Vericept and Quark. He holds a B.S. in Electrical Engineering from Vestjysk Teknikum, Denmark.
Pam Bilash
has been the Senior Vice President, Human Resources since January 2014, having joined the Company through its acquisition of onTargetjobs where she led the Human Resources team as Executive Vice President since 2009. Ms. Bilash worked for Thomson Reuters in roles of increasing responsibility, culminating as Senior Vice President of human resources for the healthcare group. Ms. Bilash is a graduate of the University of Hartford.
85
John Benson
is our Chief Strategy Officer and focuses on the overall strategic direction of the company, new areas of growth and the prioritizing of resources for new initiatives. Prior to his current role, Mr. Benson was the Managing Director of Dice International where he was responsible for developing new business opportunities outside the U.S. Mr. Benson joined the Company when we acquired the eFinancialGroup in October 2006. As a founder of eFinancialCareers in 2000 and its CEO until 2010, Mr. Benson developed the leading global career site network for financial services. He has over 20 years’ experience in the publishing and finance industries and worked in the United Kingdom, Asia and the United States. Mr. Benson holds an M.A. from Edinburgh University in Scotland.
Brian P. Campbell
has been our Vice President, General Counsel and Corporate Secretary since joining our predecessor, Dice Inc., in January 2000 and has been Vice President, Business and Legal Affairs since June 2003. Mr. Campbell is responsible for managing our legal affairs, including intellectual property, mergers and acquisitions, strategic alliances, corporate securities, real estate, litigation and employment law, as well as supervising outside counsel. Mr. Campbell also oversees our privacy initiatives. Prior to joining the Company, Mr. Campbell served as Vice President, General Counsel and Corporate Secretary at CMP Media, where he worked since 1995. From 1988 to 1995, Mr. Campbell worked as a Corporate Associate at the law firm of Mudge, Rose, Guthrie, Alexander and Ferdon. Mr. Campbell is the President of the New York City Chapter of the Association of Corporate Counsel, where he has served on the Board of Directors for three years and has been a member for over twenty years. He earned a J.D. from St. John’s University School of Law and a B.A. from the University of Virginia.
Shravan Goli
is the President of BrightMatter Group. He was named to his current position in October 2015 and is responsible for executing on the innovation strategy for the WorkDigital, getTalent and ClearanceJobs brands. Prior to becoming President of BrightMatter Group, he was President of Dice since joining the Company in March 2013. Before joining the Company, Mr. Goli served as Chief Executive Officer of Dictionary.com which he joined in late 2009 as President. Earlier in 2009, Mr. Goli was General Manager (“GM”) for Social Media Business at Slide, Inc. and at Yahoo!, Mr. Goli served as GM for Yahoo! Video and as Head of Products for Yahoo! Finance from 2005 to 2009. Earlier in his career, Mr. Goli was at Microsoft from 1995 to 2005, where he started out as an early member of the MSN.com team and led the launch of several MSN services and subsequently held roles of increasing responsibility in the home and entertainment division and the business solutions group. In addition, Mr. Goli was a co-founder of Corners.in, a content-centric social networking service. Mr. Goli holds an M.B.A. from the University of Washington and an M.S. in Computer Science from the University of Maryland.
James Bennett
is the Managing Director of our Global Industry Brands group. He was named to his current position in October 2015 and is responsible for charting and executing the global growth strategy of the eFinancialCareers, Rigzone, Hcareers and BioSpace brands. Since joining the Company in 2004, Mr. Bennett has held roles of increasing responsibility, including the heads of development, sales, customer relationship teams and general management in Europe and Asia-Pacific during his first eight years with the Company. He joined eFinancialCareers as COO in October 2004, became Managing Director for EMEA in January 2006, assumed responsibility for Asia-Pacific in January 2008 and then all of eFinancialCareers in 2012. In 2014, he took on the added responsibility of the data services business. Prior to joining the Company, Mr. Bennett served as CTO of Virgin Wines (part of the Virgin group), Operations Director at Thestreet.co.uk and Ecommerce Manager at UBS. Mr. Bennett holds a BA in Accounting and Finance from the University of the West of England and a Post Graduate Diploma in Law from The College of Law.
We have adopted a code of conduct and ethics that applies to all of our directors, officers and employees, including or chief executive officer, chief financial officer and persons performing similar functions. Our code of conduct and ethics is posted on the investors section of our website at www.dhigroupinc.com.
|
Item 11.
|
Executive Compensation
|
The information called for by Item 11 pertaining to executive compensation will be set forth in the Proxy Statement and is incorporated herein by reference.
|
Item 12.
|
Security Ownership of Certain Beneficial Owners and Management and Related Stockholder Matters
|
The information called for by Item 12 pertaining to security ownership of certain beneficial owners and management will be set forth in the Proxy Statement and is incorporated herein by reference.
|
Item 13.
|
Certain Relationships and Related Transactions, and Director Independence
|
The information called for by Item 13 pertaining to certain relationships and related transactions will be set forth in the Proxy Statement and is incorporated herein by reference.
86
|
Item 14.
|
Principal Accounting Fees and Services
|
The information called for by Item 14 pertaining to principal accounting fees and services will be set forth in the Proxy Statement and is incorporated herein by reference.
87
|
(a)
|
1.
|
Financial Statement Schedules
|
|
|
The consolidated financial statements are listed under Item 8 of this Annual Report.
|
|||
|
2.
|
Financial Statement Schedules.
|
||
|
See (b) below.
|
|||
|
3.
|
Exhibits.
|
||
|
3.1
|
Amended and Restated Certificate of Incorporation (incorporated by reference from Exhibit 3.1 to the Company’s Current Report on Form 8-K (File No. 001-33584) filed on July 23, 2007).
|
|
|
3.2
|
Amended and Restated By-laws (incorporated by reference from Exhibit 3.2 to the Company’s Current Report on Form 8-K (File No. 001-33584) filed on July 23, 2007).
|
|
|
3.3
|
Certificate of Amendment to the Amended and Restated Certificate of Incorporation of Dice Holdings, Inc., effective April 21, 2015.
|
|
|
4.1
|
Specimen Stock Certificate (incorporated by reference from Exhibit 4.1 to Amendment No. 4 to the Company’s Registration Statement on Form S-1 (File No. 333-141876) filed on June 22, 2007).
|
|
|
4.2
|
Second Amended and Restated Shareholders Agreement, dated as of July 23, 2007, by and between DHI Group, Inc. and the eFG Shareholders named therein (incorporated by reference from Exhibit 4.1 to the Company’s Current Report on Form 8-K (File No. 001-33584) filed on July 23, 2007).
|
|
|
4.3
|
Institutional and Management Shareholders Agreement, dated as of July 23, 2007, by and among DHI Group, Inc., the Quadrangle Entities named therein, the General Atlantic Entities named therein and the Management Shareholders named therein (incorporated by reference from Exhibit 4.2 to the Company’s Current Report on Form 8-K (File No. 001-33584) filed on July 23, 2007).
|
|
|
4.4
|
Amendment No. 1 to Second Amended and Restated Shareholders Agreement, dated as of February 4, 2008, by and among DHI Group, Inc. and the eFG Shareholders named therein (incorporated by reference from Exhibit 4.4 to the Company’s Annual Report on Form 10-K (File No. 001-33584) filed on March 25, 2008).
|
|
|
10.1†
|
The DHI Group, Inc. 2005 Omnibus Stock Plan (the “2005 Stock Plan”) (incorporated by reference from Exhibit 10.14 to Amendment No. 1 to the Company’s Registration Statement on Form S-1 (File No. 333-141876) filed on May 18, 2007).
|
|
|
10.2†
|
Form of Stock Option Award Agreement under the 2005 Stock Plan (incorporated by reference from Exhibit 10.15 to Amendment No. 1 to the Company’s Registration Statement on Form S-1 (File No. 333-141876) filed on May 18, 2007).
|
|
|
10.3†
|
The DHI Group, Inc. 2007 Equity Award Plan (the “2008 Equity Plan”) (incorporated by reference from Exhibit 10.16 to Amendment No. 1 to the Company’s Registration Statement on Form S-1 (File No. 333- 141876) filed on May 18, 2007).
|
|
|
10.4†
|
Form of Stock Award Agreement under the 2007 Equity Plan (incorporated by reference from Exhibit 10.11 to Amendment No. 2 to the Company’s Registration Statement on Form S-1 (File No. 333-141876) filed on June 8, 2007).
|
|
|
10.5†
|
The DHI Group, Inc. 2012 Omnibus Equity Award Plan (the “2012 Equity Plan”) (incorporated by reference from Exhibit 10.1 to the Company’s Registration Statement on Form S-8 (File No. 333-182756) filed on July 19, 2012).
|
|
|
10.6†
|
Form of Stock Option Award Agreement under the 2012 Equity Plan (incorporated by reference from Exhibit 10.2 to the Company’s Registration Statement on Form S-8 (File No. 333-182756) filed on July 19, 2012).
|
|
|
10.7†
|
Form of Restricted Stock Award Agreement under the 2012 Equity Plan (incorporated by reference from Exhibit 10.3 to the Company’s Registration Statement on Form S-8 (File No. 333-182756) filed on July 19, 2012).
|
|
|
10.8†
|
The DHI Group, Inc. Executive Cash Incentive Plan (incorporated by reference from Exhibit 10.12 to Amendment No. 2 to the Company’s Registration Statement on Form S-1 (File No. 333-141876) filed on June 8, 2007).
|
|
88
|
10.9†
|
Employment Agreement, dated as of October 25, 2002, and amended as of July 1, 2003 and July 9, 2005, between Dice Inc. and Scot W. Melland (incorporated by reference from Exhibit 10.3 to Amendment No. 6 to the Company’s Registration Statement on Form S-1 (File No. 333-141876) filed on July 11, 2007).
|
|
|
10.10†
|
Employment Agreement, dated as of April 20, 2000, and amended as of March 1, 2001, between Earthweb Inc. and Michael P. Durney (incorporated by reference from Exhibit 10.4 to Amendment No. 6 to the Company’s Registration Statement on Form S-1 (File No. 333-141876) filed on July 11, 2007).
|
|
|
10.11†
|
Employment Agreement, dated as of January 31, 2000, and amended as of March 1, 2001, between Earthweb Inc. and Brian Campbell (incorporated by reference from Exhibit 10.7 to Amendment No. 6 to the Company’s Registration Statement on Form S-1 (File No. 333-141876) filed on July 11, 2007).
|
|
|
10.12†
|
Employment Agreement, dated as of June 20, 2005 between eFinancialCareers Limited and John Benson (incorporated by reference from Exhibit 10.1 to the Company’s Quarterly Report on Form 10-Q for the quarterly period ended on March 31, 2008 (File No. 001-33584) filed on May 7, 2008).
|
|
|
10.13†
|
Employment Agreement dated as of February 27, 2012 between Dice Inc. and Bennett Smith (incorporated by reference from Exhibit 10.1 to the Company’s Quarterly Report on Form 10-Q (File No. (001-33584) filed on April 25, 2012 with the Securities and Exchange Commission).
|
|
|
10.14†
|
Employment Agreement dated as of November 16, 2004, and amended as of July 1, 2011 between eFinancialCareers Limited and James Bennett (incorporated by reference from Exhibit 10.2 to the Company’s Quarterly Report on Form 10-Q (File No. (001-33584) filed on April 25, 2012 with the Securities and Exchange Commission).
|
|
|
10.15†
|
Separation Agreement dated as of July 29, 2013 between DHI Group, Inc., Dice Inc. and Scot W. Melland (incorporated by reference from Exhibit 10.1 to the Company’s Quarterly Report on Form 10-Q for the quarter ended September 30, 2013 (File No. 001-33584) filed on October 29, 2013).
|
|
|
10.16†
|
Amendment to Employment Agreement dated as of July 29, 2013 between Dice Inc., DHI Group, Inc. and Michael P. Durney (incorporated by reference from Exhibit 10.1 to the Company’s Quarterly Report on Form 10-Q for the quarter ended September 30, 2013 (File No. 001-33584) filed on October 29, 2013).
|
|
|
10.17†
|
Employment Agreement dated as of October 9, 2013 between Dice Inc. and John Roberts (incorporated by reference from Exhibit 10.1 to the Company’s Quarterly Report on Form 10-Q for the quarter ended September 30, 2013 (File No. 001-33584) filed on October 29, 2013).
|
|
|
10.18†
|
Employment Agreement dated as of January 1, 2014 between Dice Inc. and Pamela Bilash (incorporated by reference from Exhibit 10.1 to the Company’s Quarterly Report on Form 10-Q for the quarter ended March 31, 2014 (File No. 001-33584) filed on April 30, 2014).
|
|
|
10.19†
|
Employment Agreement dated as of January 1, 2014 between Dice Inc. and Klavs Miller (incorporated by reference from Exhibit 10.2 to the Company’s Quarterly Report on Form 10-Q for the quarter ended March 31, 2014 (File No. 001-33584) filed on April 30, 2014).
|
|
|
10.20
|
Purchase Agreement dated as of September 5, 2014, between DHI Group, Inc. as purchaser and the General Atlantic entities (incorporated by reference from Exhibit 10.01 to the Company’s Quarterly Report on Form 10-Q for the quarter ended September 30, 2014 (File No. 001-33584) filed on October 30, 2014.
|
|
|
10.21
|
Amended and Restated Credit Agreement dated as of November 24, 2015, among DHI Group, Inc., Dice Inc. and Dice Career Solutions, Inc., as Borrowers, the various lenders party thereto, JPMorgan Chase Bank, N.A., as administrative agent, Bank of America, N.A., as syndication agent and Keybank National Association, as documentation agent.
|
|
|
21.1*
|
Subsidiaries of the Registrant.
|
|
|
23.1*
|
Consent of Deloitte & Touche LLP, independent registered public accounting firm.
|
|
|
31.1*
|
Certifications of Michael Durney, Chief Executive Officer, pursuant to Section 302 of the Sarbanes-Oxley Act of 2002.
|
|
|
31.2*
|
|
Certifications of John Roberts, Chief Financial Officer, pursuant to Section 302 of the Sarbanes-Oxley Act of 2002.
|
|
32.1*
|
|
Certifications of Michael Durney, Chief Executive Officer, pursuant to Section 906 of the Sarbanes-Oxley Act of 2002.
|
|
32.2*
|
|
Certifications of John Roberts, Chief Financial Officer, pursuant to Section 906 of the Sarbanes-Oxley Act of 2002.
|
|
101.INS
|
|
XBRL Instance Document.
|
|
101.SCH
|
|
XBRL Taxonomy Extension Schema Document.
|
89
|
101.CAL
|
|
XBRL Taxonomy Extension Calculation Linkbase Document.
|
|
101.DEF
|
|
XBRL Taxonomy Extension Definition Linkbase Document.
|
|
101.LAB
|
|
XBRL Taxonomy Extension Label Linkbase Document.
|
|
101.PRE
|
|
XBRL Taxonomy Extension Presentation Linkbase Document.
|
________________
|
*
|
Filed herewith.
|
|
†
|
Identifies a management contract or compensatory plan or arrangement.
|
|
(b)
|
Financial Statement Schedules.
|
90
SCHEDULE II
DHI GROUP, INC.
CONSOLIDATED VALUATION AND QUALIFYING ACCOUNTS
As of December 31, 2013, 2014 and 2015
(in thousands)
|
Column A
|
Column B
|
Column C
|
Column D
|
Column E
|
|||||||||||
|
|
Balance at
Beginning
of Period
|
Charged
to Income
|
Deductions (1)
|
Balance
at End of
Period
|
|||||||||||
|
Description
|
|
|
|
|
|||||||||||
|
Reserves Deducted From Assets to Which They Apply:
|
|||||||||||||||
|
Reserve for uncollectible accounts receivable:
|
|||||||||||||||
|
Year ended December 31, 2013
|
$
|
2,095
|
|
$
|
1,892
|
|
$
|
(1,268
|
)
|
$
|
2,719
|
|
|||
|
Year ended December 31, 2014
|
2,719
|
|
1,035
|
|
(866
|
)
|
2,888
|
|
|||||||
|
Year ended December 31, 2015
|
2,888
|
|
1,718
|
|
(1,661
|
)
|
2,945
|
|
|||||||
|
Reserve for deferred tax assets:
|
|||||||||||||||
|
Year ended December 31, 2013
|
$
|
807
|
|
$
|
(807
|
)
|
$
|
—
|
|
$
|
—
|
|
|||
|
Year ended December 31, 2014
|
—
|
|
1,793
|
|
—
|
|
1,793
|
|
|||||||
|
Year ended December 31, 2015
|
1,793
|
|
(47
|
)
|
—
|
|
1,746
|
|
|||||||
____________________
|
(1)
|
Includes an adjustment for changes in exchange rates during the year
|
See notes to the DHI Group, Inc. consolidated financial statements included elsewhere herein.
91
SIGNATURES
Pursuant to the requirements of Section 13 or 15(d) of the Securities Exchange Act of 1934, as amended, the Registrant has duly caused this Annual Report on Form 10-K to be signed on its behalf by the undersigned hereunto duly authorized.
|
Date:
|
February 9, 2016
|
DHI Group, Inc.
|
||
|
By:
|
/S/ Michael P. Durney
|
|||
|
Michael P. Durney
President and Chief Executive Officer
|
||||
Pursuant to the requirements of the Securities Exchange Act of 1934, this report has been signed by the following persons in the capacities and on the dates indicated.
|
Signature
|
|
Title
|
|
Date
|
|
/S/ Michael P. Durney
|
President, Chief Executive Officer and Director
|
February 9, 2016
|
||
|
Michael P. Durney
|
|
(Principal Executive Officer)
|
|
|
|
/S/ John J. Roberts
|
Chief Financial Officer
|
February 9, 2016
|
||
|
John J. Roberts
|
|
(Principal Financial and Accounting Officer)
|
|
|
|
/S/ John W. Barter
|
Chairman and Director
|
|
February 9, 2016
|
|
|
John W. Barter
|
|
|||
|
/S/ David S. Gordon
|
Director
|
|
February 9, 2016
|
|
|
David S. Gordon
|
|
|||
|
/S/ Carol Carpenter
|
Director
|
|
February 9, 2016
|
|
|
Carol Carpenter
|
|
|||
|
/S/ Golnar Sheikholeslami
|
Director
|
|
February 9, 2016
|
|
|
Golnar Sheikholeslami
|
|
|||
|
/S/ Scot W. Melland
|
Director
|
|
February 9, 2016
|
|
|
Scot W. Melland
|
|
|||
|
/S/ Brian Schipper
|
Director
|
|
February 9, 2016
|
|
|
Brian Schipper
|
|
|||
|
/S/ Burton Goldfield
|
Director
|
|
February 9, 2016
|
|
|
Burton Goldfield
|
|
|||
|
/S/ Jim Friedlich
|
Director
|
|
February 9, 2016
|
|
|
Jim Friedlich
|
|
|||
92
EXHIBIT INDEX
|
3.1
|
Amended and Restated Certificate of Incorporation (incorporated by reference from Exhibit 3.1 to the Company’s Current Report on Form 8-K (File No. 001-33584) filed on July 23, 2007).
|
|
|
3.2
|
Amended and Restated By-laws (incorporated by reference from Exhibit 3.2 to the Company’s Current Report on Form 8-K (File No. 001-33584) filed on July 23, 2007).
|
|
|
3.3
|
Certificate of Amendment to the Amended and Restated Certificate of Incorporation of Dice Holdings, Inc., effective April 21, 2015.
|
|
|
4.1
|
Specimen Stock Certificate (incorporated by reference from Exhibit 4.1 to Amendment No. 4 to the Company’s Registration Statement on Form S-1 (File No. 333-141876) filed on June 22, 2007).
|
|
|
4.2
|
Second Amended and Restated Shareholders Agreement, dated as of July 23, 2007, by and between DHI Group, Inc. and the eFG Shareholders named therein (incorporated by reference from Exhibit 4.1 to the Company’s Current Report on Form 8-K (File No. 001-33584) filed on July 23, 2007).
|
|
|
4.3
|
Institutional and Management Shareholders Agreement, dated as of July 23, 2007, by and among DHI Group, Inc., the Quadrangle Entities named therein, the General Atlantic Entities named therein and the Management Shareholders named therein (incorporated by reference from Exhibit 4.2 to the Company’s Current Report on Form 8-K (File No. 001-33584) filed on July 23, 2007).
|
|
|
4.4
|
Amendment No. 1 to Second Amended and Restated Shareholders Agreement, dated as of February 4, 2008, by and among DHI Group, Inc. and the eFG Shareholders named therein (incorporated by reference from Exhibit 4.4 to the Company’s Annual Report on Form 10-K (File No. 001-33584) filed on March 25, 2008).
|
|
|
10.1†
|
The DHI Group, Inc. 2005 Omnibus Stock Plan (the “2005 Stock Plan”) (incorporated by reference from Exhibit 10.14 to Amendment No. 1 to the Company’s Registration Statement on Form S-1 (File No. 333-141876) filed on May 18, 2007).
|
|
|
10.2†
|
Form of Stock Option Award Agreement under the 2005 Stock Plan (incorporated by reference from Exhibit 10.15 to Amendment No. 1 to the Company’s Registration Statement on Form S-1 (File No. 333-141876) filed on May 18, 2007).
|
|
|
10.3†
|
The DHI Group, Inc. 2007 Equity Award Plan (the “2008 Equity Plan”) (incorporated by reference from Exhibit 10.16 to Amendment No. 1 to the Company’s Registration Statement on Form S-1 (File No. 333- 141876) filed on May 18, 2007).
|
|
|
10.4†
|
Form of Stock Award Agreement under the 2007 Equity Plan (incorporated by reference from Exhibit 10.11 to Amendment No. 2 to the Company’s Registration Statement on Form S-1 (File No. 333-141876) filed on June 8, 2007).
|
|
|
10.5†
|
The DHI Group, Inc. 2012 Omnibus Equity Award Plan (the “2012 Equity Plan”) (incorporated by reference from Exhibit 10.1 to the Company’s Registration Statement on Form S-8 (File No. 333-182756) filed on July 19, 2012).
|
|
|
10.6†
|
Form of Stock Option Award Agreement under the 2012 Equity Plan (incorporated by reference from Exhibit 10.2 to the Company’s Registration Statement on Form S-8 (File No. 333-182756) filed on July 19, 2012).
|
|
|
10.7†
|
Form of Restricted Stock Award Agreement under the 2012 Equity Plan (incorporated by reference from Exhibit 10.3 to the Company’s Registration Statement on Form S-8 (File No. 333-182756) filed on July 19, 2012).
|
|
|
10.8†
|
The DHI Group, Inc. Executive Cash Incentive Plan (incorporated by reference from Exhibit 10.12 to Amendment No. 2 to the Company’s Registration Statement on Form S-1 (File No. 333-141876) filed on June 8, 2007).
|
|
|
10.9†
|
Employment Agreement, dated as of October 25, 2002, and amended as of July 1, 2003 and July 9, 2005, between Dice Inc. and Scot W. Melland (incorporated by reference from Exhibit 10.3 to Amendment No. 6 to the Company’s Registration Statement on Form S-1 (File No. 333-141876) filed on July 11, 2007).
|
|
|
10.10†
|
Employment Agreement, dated as of April 20, 2000, and amended as of March 1, 2001, between Earthweb Inc. and Michael P. Durney (incorporated by reference from Exhibit 10.4 to Amendment No. 6 to the Company’s Registration Statement on Form S-1 (File No. 333-141876) filed on July 11, 2007).
|
|
|
10.11†
|
Employment Agreement, dated as of January 31, 2000, and amended as of March 1, 2001, between Earthweb Inc. and Brian Campbell (incorporated by reference from Exhibit 10.7 to Amendment No. 6 to the Company’s Registration Statement on Form S-1 (File No. 333-141876) filed on July 11, 2007).
|
|
93
|
10.12†
|
Employment Agreement, dated as of June 20, 2005 between eFinancialCareers Limited and John Benson (incorporated by reference from Exhibit 10.1 to the Company’s Quarterly Report on Form 10-Q for the quarterly period ended on March 31, 2008 (File No. 001-33584) filed on May 7, 2008).
|
|
|
10.13†
|
Employment Agreement dated as of February 27, 2012 between Dice Inc. and Bennett Smith (incorporated by reference from Exhibit 10.1 to the Company’s Quarterly Report on Form 10-Q (File No. (001-33584) filed on April 25, 2012 with the Securities and Exchange Commission).
|
|
|
10.14†
|
Employment Agreement dated as of November 16, 2004, and amended as of July 1, 2011 between eFinancialCareers Limited and James Bennett (incorporated by reference from Exhibit 10.2 to the Company’s Quarterly Report on Form 10-Q (File No. (001-33584) filed on April 25, 2012 with the Securities and Exchange Commission).
|
|
|
10.15†
|
Separation Agreement dated as of July 29, 2013 between DHI Group, Inc., Dice Inc. and Scot W. Melland (incorporated by reference from Exhibit 10.1 to the Company’s Quarterly Report on Form 10-Q for the quarter ended September 30, 2013 (File No. 001-33584) filed on October 29, 2013).
|
|
|
10.16†
|
Amendment to Employment Agreement dated as of July 29, 2013 between Dice Inc., DHI Group, Inc. and Michael P. Durney (incorporated by reference from Exhibit 10.1 to the Company’s Quarterly Report on Form 10-Q for the quarter ended September 30, 2013 (File No. 001-33584) filed on October 29, 2013).
|
|
|
10.17†
|
Employment Agreement dated as of October 9, 2013 between Dice Inc. and John Roberts (incorporated by reference from Exhibit 10.1 to the Company’s Quarterly Report on Form 10-Q for the quarter ended September 30, 2013 (File No. 001-33584) filed on October 29, 2013).
|
|
|
10.18†
|
Employment Agreement dated as of January 1, 2014 between Dice Inc. and Pamela Bilash (incorporated by reference from Exhibit 10.1 to the Company’s Quarterly Report on Form 10-Q for the quarter ended March 31, 2014 (File No. 001-33584) filed on April 30, 2014).
|
|
|
10.19†
|
Employment Agreement dated as of January 1, 2014 between Dice Inc. and Klavs Miller (incorporated by reference from Exhibit 10.2 to the Company’s Quarterly Report on Form 10-Q for the quarter ended March 31, 2014 (File No. 001-33584) filed on April 30, 2014).
|
|
|
10.20
|
Purchase Agreement dated as of September 5, 2014, between DHI Group, Inc. as purchaser and the General Atlantic entities (incorporated by reference from Exhibit 10.01 to the Company’s Quarterly Report on Form 10-Q for the quarter ended September 30, 2014 (File No. 001-33584) filed on October 30, 2014.
|
|
|
10.21
|
Amended and Restated Credit Agreement dated as of November 24, 2015, among DHI Group, Inc., Dice Inc. and Dice Career Solutions, Inc., as Borrowers, the various lenders party thereto, JPMorgan Chase Bank, N.A., as administrative agent, Bank of America, N.A., as syndication agent and Keybank National Association, as documentation agent.
|
|
|
21.1*
|
Subsidiaries of the Registrant.
|
|
|
23.1*
|
Consent of Deloitte & Touche LLP, independent registered public accounting firm.
|
|
|
31.1*
|
Certifications of Michael Durney, Chief Executive Officer, pursuant to Section 302 of the Sarbanes-Oxley Act of 2002.
|
|
|
31.2*
|
Certifications of John Roberts, Chief Financial Officer, pursuant to Section 302 of the Sarbanes-Oxley Act of 2002.
|
|
|
32.1*
|
Certifications of Michael Durney, Chief Executive Officer, pursuant to Section 906 of the Sarbanes-Oxley Act of 2002.
|
|
|
32.2*
|
Certifications of John Roberts, Chief Financial Officer, pursuant to Section 906 of the Sarbanes-Oxley Act of 2002.
|
|
|
101.INS
|
XBRL Instance Document.
|
|
|
101.SCH
|
XBRL Taxonomy Extension Schema Document.
|
|
|
101.CAL
|
XBRL Taxonomy Extension Calculation Linkbase Document.
|
|
|
101.DEF
|
XBRL Taxonomy Extension Definition Linkbase Document.
|
|
|
101.LAB
|
XBRL Taxonomy Extension Label Linkbase Document.
|
|
|
101.PRE
|
XBRL Taxonomy Extension Presentation Linkbase Document.
|
|
____________________
|
*
|
Filed herewith
|
|
|
†
|
Identifies a management contract or compensatory plan or arrangement.
|
|
94
TABLE OF CONTENTS
Part IItem 1. BusinessItem 1A. Risk FactorsItem 1B. Unresolved Staff CommentsItem 2. PropertiesItem 3. Legal ProceedingsItem 4. Mine Safety DisclosuresPart IIItem 5. Market For Registrant S Common Equity, Related Stockholder Matters and Issuer Purchases Of Equity SecuritiesItem 6. Selected Financial DataItem 7. Management S Discussion and Analysis Of Financial Condition and Results Of OperationsItem 7A. Quantitative and Qualitative Disclosures About Market RiskItem 8. Financial Statements and Supplementary DataItem 9. Changes in and Disagreements with Accountants on Accounting and Financial DisclosuresItem 9A. Controls and ProceduresItem 9B. Other InformationPart IIIItem 10. Directors, Executive Officers and Corporate GovernanceItem 11. Executive CompensationItem 12. Security Ownership Of Certain Beneficial Owners and Management and Related Stockholder MattersItem 13. Certain Relationships and Related Transactions, and Director IndependenceItem 14. Principal Accounting Fees and ServicesPart IVItem 15. Exhibits and Financial Statement Schedules