UNITED STATES
SECURITIES AND EXCHANGE COMMISSION
Washington, D.C. 20549
Form 10-K
(Mark One)
|
þ
|
|
ANNUAL REPORT PURSUANT TO SECTION 18 OR 15(d) OF THE SECURITIES EXCHANGE ACT OF 1934
|
||
|
For the Fiscal Year Ended December 31, 2017
|
||||
OR
|
o
|
|
TRANSITION REPORT PURSUANT TO SECTION 13 OR 15(d) OF THE SECURITIES EXCHANGE ACT OF 1934
|
||
|
For the transition period from to
|
||||
Commission file number 001-38142
DELEK US HOLDINGS, INC.
(Exact name of registrant as specified in its charter)
|
Delaware
|
|
32-2581557
|
|
(State or other jurisdiction of
|
|
(I.R.S. Employer
|
|
incorporation or organization)
|
|
Identification No.)
|
|
|
|
|
|
7102 Commerce Way
|
|
|
|
Brentwood, Tennessee
|
|
37027
|
|
(Address of principal executive offices)
|
|
(Zip Code)
|
(615) 771-6701
(Registrant’s telephone number, including area code
)
Securities registered pursuant to Section 12(b) of the Act:
|
Title of each class
|
Name of each exchange on which registered
|
|
|
Common Stock, $.01 par value
|
New York Stock Exchange
|
|
Securities registered pursuant to Section 12(g) of the Act:
None
Indicate by check mark if the registrant is a well-known seasoned issuer, as defined in Rule 405 of the Securities Act. Yes
þ
No
o
Indicate by check mark if the registrant is not required to file reports pursuant to Section 13 or Section 15(d) of the Act. Yes
o
No
þ
Indicate by check mark whether the registrant (1) has filed all reports required to be filed by Section 13 or 15(d) of the Securities Exchange Act of 1934 during the preceding 12 months (or for such shorter period that the registrant was required to file such reports), and (2) has been subject to such filing requirements for the past 90 days. Yes
þ
No
o
Indicate by check mark whether the registrant has submitted electronically and posted on its corporate Web site, if any, every Interactive Data File required to be submitted and posted pursuant to Rule 405 of Regulation S-T (Section 232.405 of this chapter) during the preceding 12 months (or for such shorter period that the registrant was required to submit and post such files). Yes
þ
No
o
Indicate by check mark if disclosure of delinquent filers pursuant to Item 405 of Regulation S-K (section 232.405 of this chapter) is not contained herein, and will not be contained, to the best of registrant's knowledge, in definitive proxy or information statements incorporated by reference in Part III of this Form 10-K or any amendments of this Form 10-K.
o
Indicate by check mark whether the registrant is a large accelerated filer, an accelerated filer, a non-accelerated filer, smaller reporting company, or an emerging growth company. See the definitions of "large accelerated filer," "accelerated filer," "smaller reporting company," and "emerging growth company" in Rule 12b-2 of the Exchange Act.:
Large accelerated filer
þ
Accelerated filer
o
Non-accelerated filer
o
Smaller reporting company
o
Emerging growth company
o
(Do not check if a smaller reporting company)
If an emerging growth company, indicate by check mark if the registrant has elected not to use the extended transition period for complying with any new or revised financial accounting standards provided pursuant to Section 13(a) of the Exchange Act.
o
Indicate by check mark whether the registrant is a shell company (as defined in Rule 12b-2 of the Act). Yes
o
No
þ
The aggregate market value of the common stock held by non-affiliates as of
June 30, 2017
was approximately
$1,623,844,116
, based upon the closing sale price of the registrant's common stock on the New York Stock Exchange on that date. For purposes of this calculation only, all directors, officers subject to Section 16(b) of the Securities Exchange Act of 1934, and 10% stockholders are deemed to be affiliates.
At
February 26, 2018
, there were
83,919,132
shares of the registrant's common stock, $.01 par value, outstanding (excluding securities held by, or for the account of, the Company or its subsidiaries).
Documents incorporated by reference
Portions of the registrant's definitive Proxy Statement to be delivered to stockholders in connection with the
2018
Annual Meeting of Stockholders, which will be filed with the Securities and Exchange Commission within 120 days after
December 31, 2017
, are incorporated by reference into Part III of this Form 10-K.
TABLE OF CONTENTS
|
|
|
|
|
|
||
2
Unless otherwise indicated or the context requires otherwise, the disclosures and financial information included in this report for the periods prior to July 1, 2017 reflect that of Old Delek (as defined in "Company Overview" in Items I and 2, Business and Properties, of this Annual Report on Form 10-K), and the disclosures and financial information included in this report for the periods beginning July 1, 2017, reflect that of New Delek (as defined in "Company Overview" in Items I and 2, Business and Properties, of this Annual Report on Form 10-K). The terms "we," "our," "us," "Delek" and the "Company" are used in this report to refer to Old Delek and its consolidated subsidiaries for the periods prior to July 1, 2017, and New Delek and its consolidated subsidiaries for the periods beginning July 1, 2017, unless otherwise noted. See also "Glossary of Terms" included in Items 1 and 2, Business and Properties, of this Annual Report on Form 10-K for definitions of certain business and industry terms used herein.
Statements in this Annual Report on Form 10-K, other than purely historical information, including statements regarding our plans, strategies, objectives, beliefs, expectations and intentions are forward-looking statements. These forward-looking statements generally are identified by the words "may," "will," "should," "could," "would," "predicts," "intends," "believes," "expects," "plans," "scheduled," "goal," "anticipates," "estimates" and similar expressions. Forward-looking statements are based on current expectations and assumptions that are subject to risks and uncertainties, including those discussed below and in Item 1A, Risk Factors, which may cause actual results to differ materially from the forward-looking statements. See also "Forward-Looking Statements" included in Item 7, Management's Discussion and Analysis of Financial Condition and Results of Operations, of this Annual Report on Form 10-K.
ITEMS 1 and 2.
BUSINESS and PROPERTIES
Company Overview
We are an integrated downstream energy business focused on petroleum refining, the transportation, storage and wholesale distribution of crude oil, intermediate and refined products and convenience store retailing. Delek US Holdings, Inc. ("Holdings"), a Delaware corporation formed in 2016, is the sole shareholder or owner of membership interests of Delek US Energy, Inc. (and its wholly-owned subsidiaries Delek Refining, Inc. ("Refining"), Delek Finance, Inc., Delek Marketing & Supply, LLC, Lion Oil Company ("Lion Oil"), Delek Renewables, LLC, Delek Rail Logistics, Inc., Delek Logistics Services Company, Delek Helena, LLC, and Delek Land Holdings, LLC) and Alon USA Energy, Inc. ("Alon") (and its wholly-owned subsidiaries).
Effective July 1, 2017 (the "Effective Time"), we acquired the outstanding common stock of Alon (previously listed under NYSE: ALJ) (the "Delek/Alon Merger", as further discussed in Note
3
of the consolidated financial statements included in Item 8, Financial Statements and Supplementary Data, of this Annual Report on Form 10-K ), resulting in a new post-combination consolidated registrant renamed as Delek US Holdings, Inc. (“New Delek”), with Alon and the previous Delek US Holdings, Inc. (“Old Delek”) surviving as wholly-owned subsidiaries. New Delek is the successor issuer to Old Delek and Alon pursuant to Rule 12g-3(c) under the Securities Exchange Act of 1934, as amended (the "Exchange Act"). In addition, as a result of the Delek/Alon Merger, the shares of common stock of Old Delek and Alon were delisted from the New York Stock Exchange in July 2017, and their respective reporting obligations under the Exchange Act were terminated.
As of
December 31, 2017
, we owned a
61.5%
limited partner interest in Delek Logistics Partners, LP ("Delek Logistics"), a publicly traded master limited partnership that we formed in April 2012, and a
94.6%
interest in Delek Logistics GP, LLC ("Logistics GP"), which owns the entire
2.0%
general partner interest in Delek Logistics. Additionally, as of
December 31, 2017
, we owned an
81.6%
limited partner interest in Alon USA Partners, LP (the "Alon Partnership"), a publicly-traded limited partnership that we acquired in the merger with Alon on July 1, 2017. The limited partner interests of the Alon Partnership are represented as common units outstanding. Alon USA Partners GP, LLC (the “Alon General Partner”), our wholly-owned subsidiary, owns 100% of the general partner interest in the Alon Partnership, which is a non-economic interest. On November 8, 2017, Delek and the Alon Partnership entered into a definitive merger agreement under which Delek agreed to acquire all of the outstanding limited partner units which Delek did not already own in an all-equity transaction. This transaction was approved by all voting members of the board of directors of the general partner of the Alon Partnership upon the recommendation from its conflicts committee and by the board of directors of Delek. This transaction closed on February 7, 2018. Under terms of the merger agreement, the owners of the remaining outstanding units in the Alon Partnership that Delek did not currently own immediately prior to the transaction date received a fixed exchange ratio of
0.49
shares of Delek Common Stock for each limited partner unit of the Alon Partnership.
Unless otherwise noted or the context requires otherwise, the disclosures and financial information included in this report for the periods prior to July 1, 2017 reflect that of Old Delek, and the disclosures and financial information included in this report for the periods beginning July 1, 2017 reflect that of New Delek. The terms "we," "our," "us," "Delek" and the "Company" are used in this report to refer to Old Delek and its consolidated subsidiaries for the periods prior to July 1, 2017, and New Delek and its consolidated subsidiaries for the periods on or after July 1, 2017, unless otherwise noted. Our business consists of three operating segments: refining, logistics and retail.
3
The refining segment processes crude oil and other purchased feedstocks for the manufacture of transportation motor fuels, including various grades of gasoline, diesel fuel, aviation fuel, asphalt and other petroleum-based products that are distributed through owned and third-party product terminals. Prior to the Delek/Alon Merger, the refining segment had a combined nameplate capacity of
155,000
bpd, including the
75,000
bpd refinery in Tyler, Texas (the "Tyler refinery") and the
80,000
bpd refinery in El Dorado, Arkansas (the "El Dorado refinery"). The Tyler refinery sells the majority of its production over a refinery truck rack owned and operated by our logistics segment to supply the local market in the east Texas area. The El Dorado refinery sells a portion of its production at the refinery truck rack, which is owned and operated by our logistics segment, but the majority of the refinery's production is shipped into the Enterprise Pipeline System and our logistics segment's El Dorado Pipeline system to supply a combination of pipeline bulk sales and wholesale rack sales at terminal locations along the pipeline in Louisiana, Arkansas, Tennessee, Missouri and Indiana. The refining segment also owns and operates two biodiesel facilities involved in the production of biodiesel fuels and related activities located in Crossett, Arkansas and Cleburne, Texas. Effective with the Delek/Alon Merger, our refining segment now also includes the operations of a crude oil refinery located in Big Spring, Texas with a nameplate capacity of
73,000
bpd (the "Big Spring refinery"), and a oil refinery located in Krotz Springs, Louisiana with a nameplate capacity of
74,000
bpd (the "Krotz Springs refinery"). The Big Spring refinery sells a portion of its production across the refinery truck terminal into local markets and by pipeline through various terminals to supply Alon branded retail sites, including our retail segment convenience stores. Our distribution of transportation fuels produced at our Big Spring refinery is focused on central and west Texas, Oklahoma, New Mexico and Arizona. The Krotz Springs refinery sells the majority of its product through pipeline and barge bulk sales and wholesale rack sales at terminals located on the Colonial Pipeline system in the southeastern United States. In addition, we also acquired as part of the Delek/Alon Merger (and have included in our refining segment) an idled crude oil refinery located in Bakersfield, California (the "Bakersfield refinery") which has not produced product since 2012 due to insufficient product margins. At December 31, 2017, our aggregate crude throughput capacity of our four operational refineries was
302,000
barrels per day.
Our logistics segment gathers, transports and stores crude oil and markets, distributes, transports and stores refined products in select regions of the southeastern United States and west Texas for both our refining segment and third parties. The logistics segment's pipelines and transportation business owns or leases capacity on approximately
461
miles of crude oil transportation pipelines, approximately
406
miles of refined product pipelines, an approximately
600
-mile crude oil gathering system and associated crude oil storage tanks with an aggregate of approximately
7.3 million
barrels of active shell capacity. Our logistics segment owns and operates nine light product terminals and markets light products using third-party terminals.
Effective with the Delek/Alon Merger July 1, 2017, Delek's retail segment now includes the operations of Alon's
302
owned and leased convenience store sites located primarily in central and west Texas and New Mexico. Our convenience stores typically offer various grades of gasoline and diesel under the Alon brand name and food products, food service, tobacco products, non-alcoholic and alcoholic beverages, general merchandise as well as money orders to the public, primarily under the 7-Eleven and Alon brand names. We are the largest 7-Eleven licensee in the United States and have the exclusive right to use the 7-Eleven trade name in substantially all of our existing retail markets and many surrounding areas. We are party to a license agreement with 7-Eleven, Inc. which gives us a perpetual license to use the 7-Eleven trademark, service name and trade name in west Texas and a majority of the counties in New Mexico in connection with our retail store operations. Substantially all of the merchandise sales at our convenience store sites are sold under the 7-Eleven brand name.
4
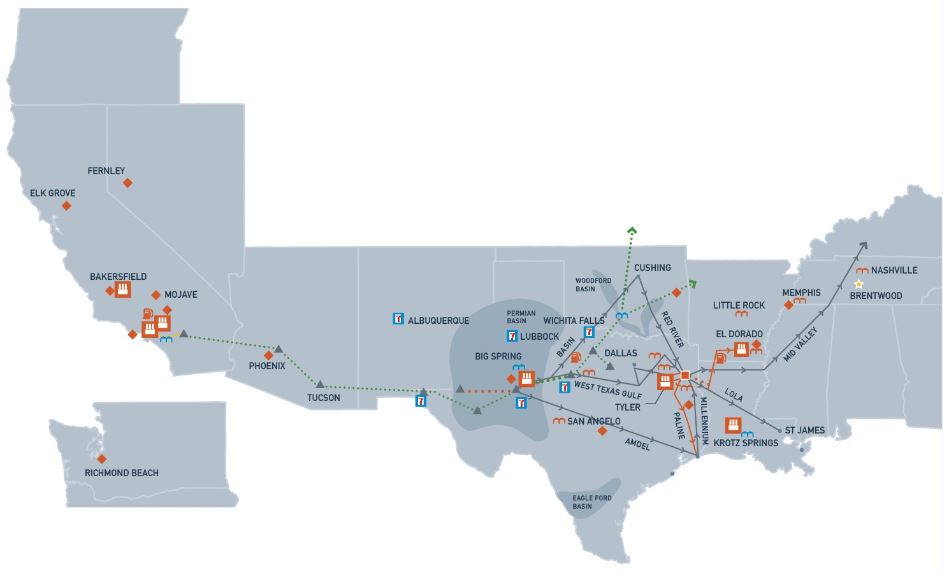
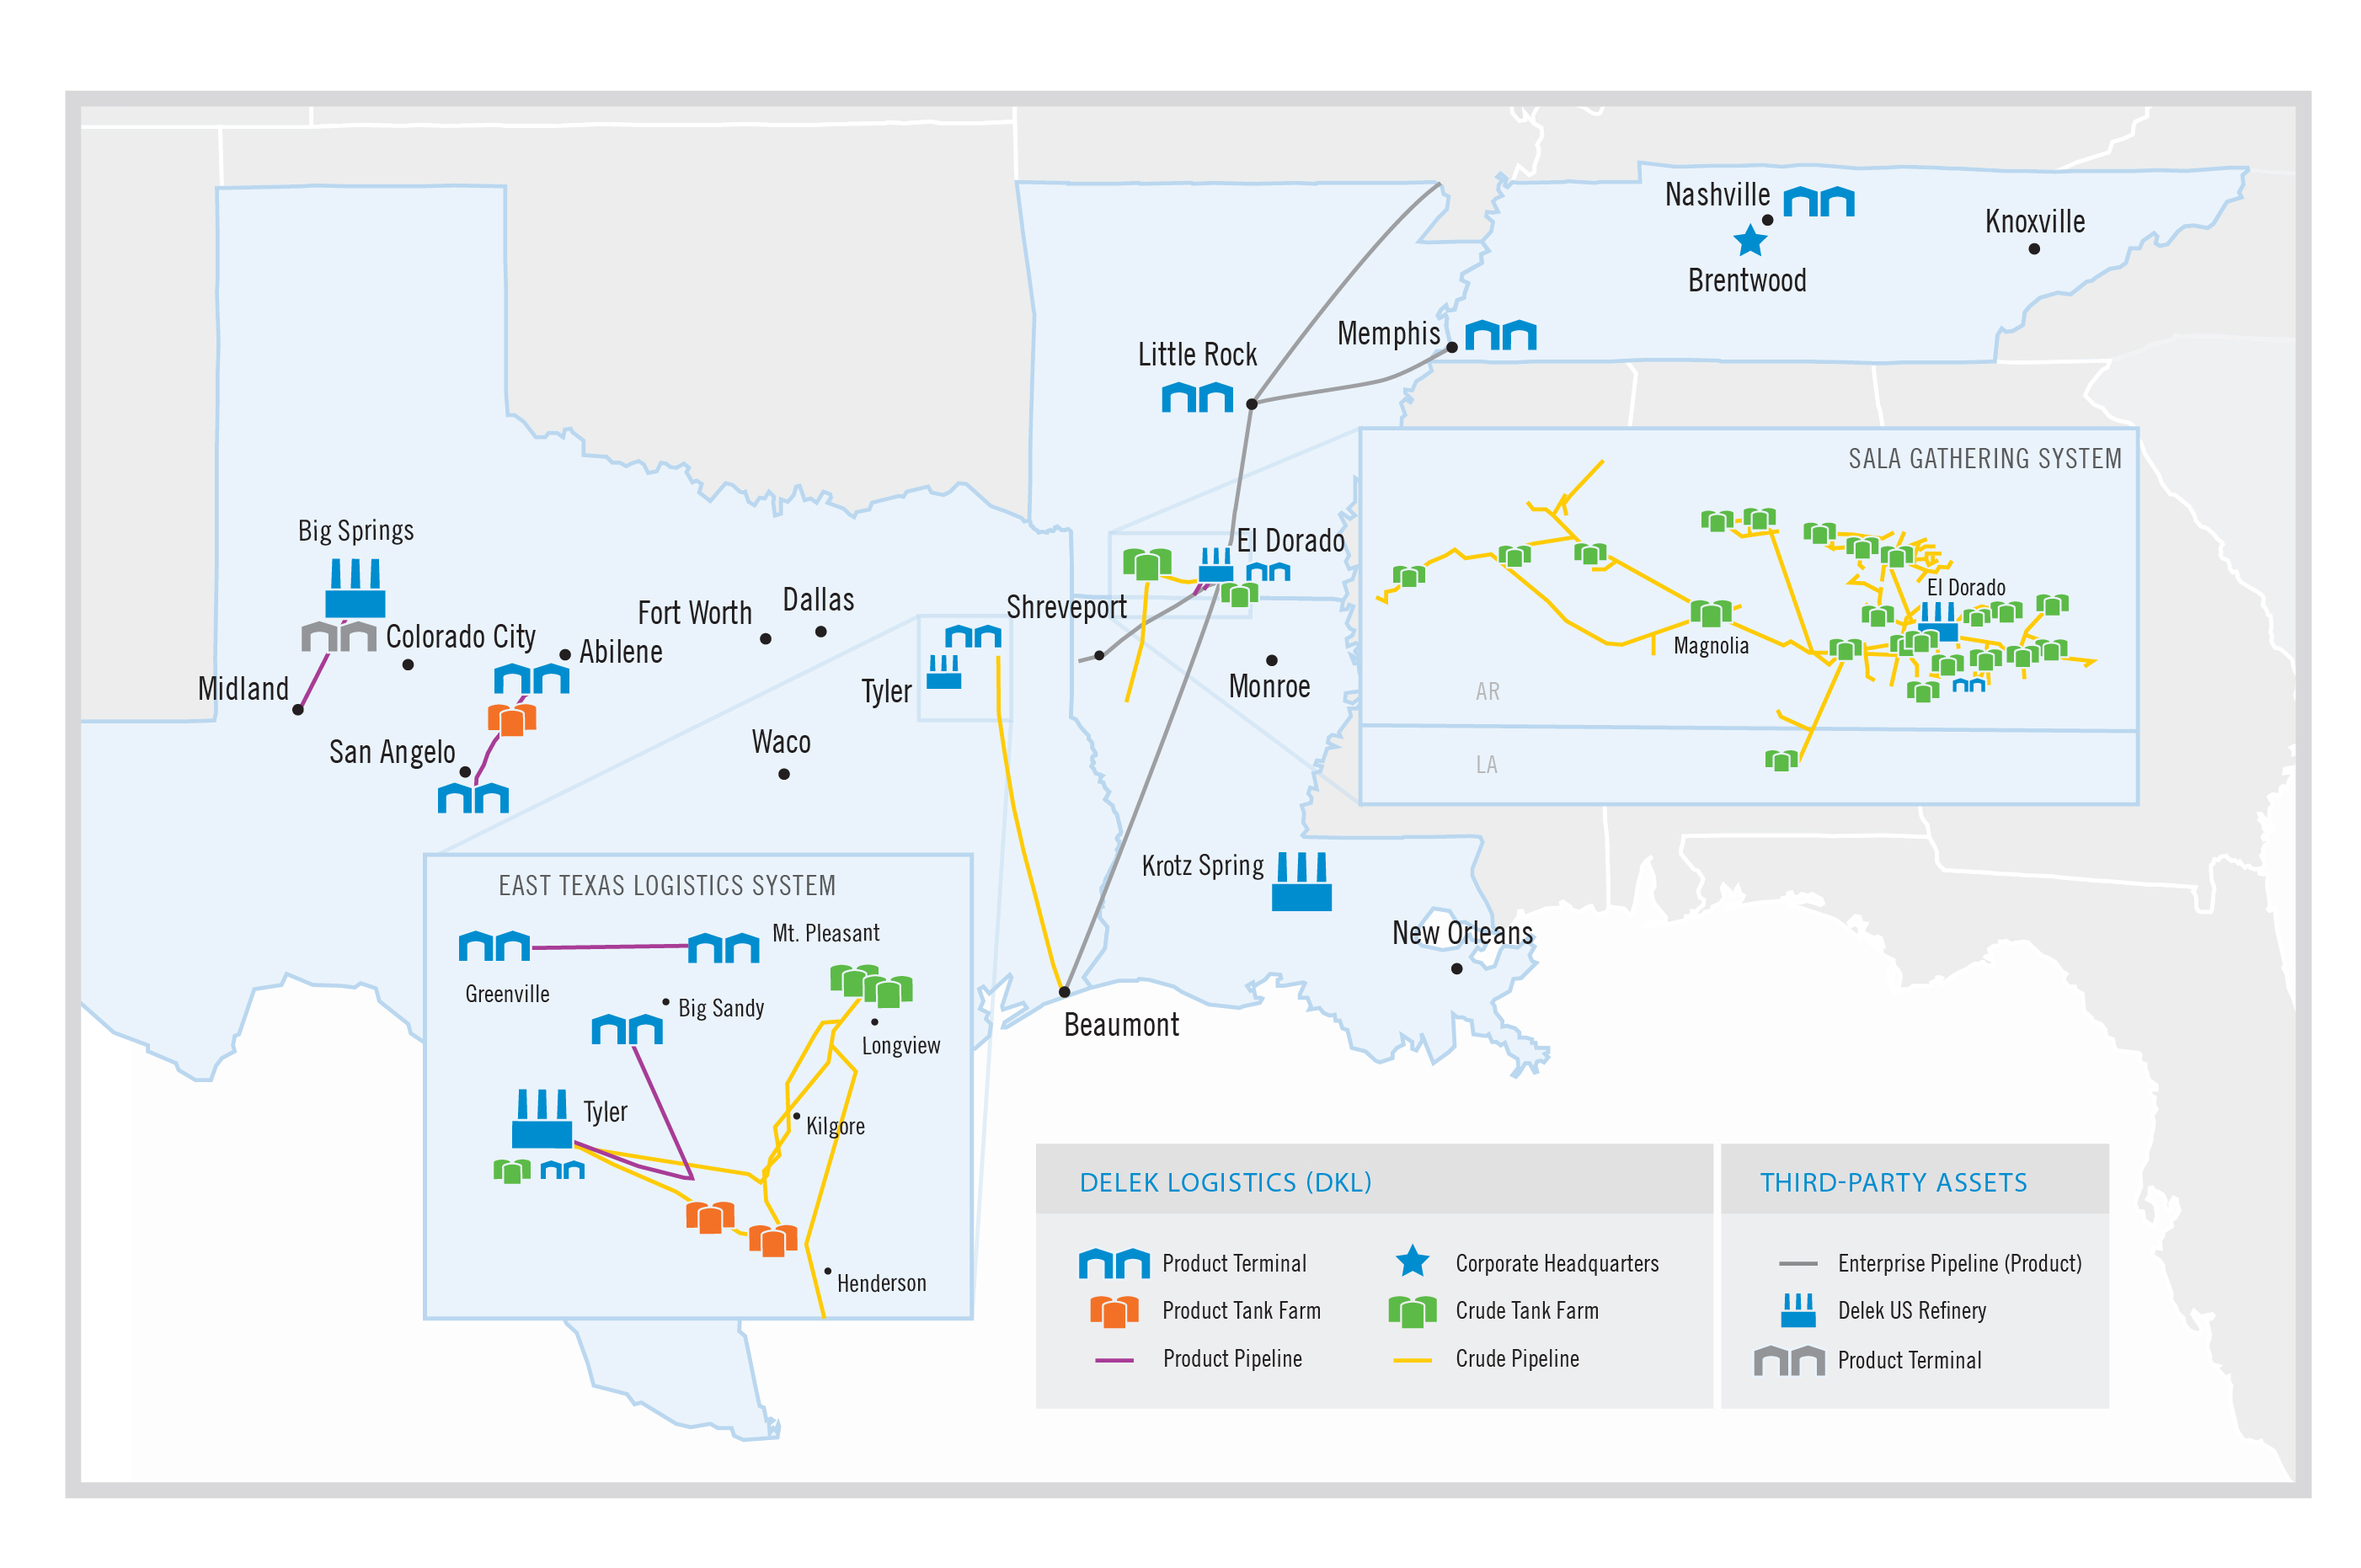
The following map outlines the geography of our integrated downstream energy structure as of December 31, 2017:
Subsequent to the Delek/Alon Merger, we also own heavy crude oil refineries located on 63 acres in Paramount, California (the "Paramount refinery") and on 19 acres in Long Beach, California (the "Long Beach refinery'), which have not processed crude oil since 2012, and a renewable fuels facility located at the Paramount refinery (in which we have a controlling interest), which has a throughput capacity of 3,000 bpd and converts tallow and vegetable oils into renewable fuels. The produced renewable fuels are drop-in replacements for petroleum-based fuels. The renewable fuels facility generates both state and federal environmental credits, as well as the federal blender’s tax credit, when effective. See
Note 25
of the consolidated financial statements included in Item 8, Financial Statements and Supplementary Data, of this Annual Report on Form 10-K for further information regarding the extension of this tax credit. As a result of Delek management's committing to a plan to sell certain assets associated with our Paramount and Long Beach refineries and our California renewable fuels facility (collectively, the "California Discontinued Entities"), we met the requirements under Accounting Standards Codification ("ASC") 205-20, Presentation of Financial Statements - Discontinued Operations ("ASC 205-20") and ASC 360, Property, Plant and Equipment ("ASC 360") to report the results of those operations as discontinued operations and to classify the applicable assets of the California Discontinued Entities as a group of assets held for sale.
Corporate Headquarters
We lease our corporate headquarters at 7102 Commerce Way, Brentwood, Tennessee. The lease is for
54,000
square feet of office space. The lease term expires in May 2022.
5
Liens and Encumbrances
The majority of the assets described in this Form 10-K are pledged under and encumbered by certain of our debt facilities. See
Note 12
of the consolidated financial statements included in Item 8, Financial Statements and Supplementary Data, of this Annual Report on Form 10-K for further information.
Business Strategy
Historically, we have grown through acquisitions in all of our segments. Our business strategy is focused on growing our integrated business model that allows us to participate in all phases of the downstream production process, from transporting crude oil to our refineries for processing into refined products to selling fuel to customers. This growth may come from acquisitions as well as investments in our existing businesses, as we continue to broaden our existing geographic presence and integrated business model. Below is a tabular summary of our acquisitions over the last five years and
2018
to date.
|
Date
|
Acquired Company/Assets
|
Acquired From
|
Approximate
Purchase Price
(1)
|
|||
|
January 2013
|
The Beacon Facility, a biodiesel facility in Cleburne, Texas, involved in the production of biodiesel fuels and related activities.
|
Beacon Energy (Texas) Corp.
|
$5.3 million
|
|||
|
July 2013
|
The Hopewell Pipeline, a 13.5-mile pipeline that originates at the Tyler refinery and terminates at the Hopewell delivery yard.
|
Enterprise TE Products Pipeline Company, LLC
|
$5.7 million
|
|||
|
October 2013
|
The North Little Rock terminal, a refined products terminal in Little Rock, Arkansas
|
Enterprise Refined Products Pipeline Company, LLC
|
$7.2 million
|
|||
|
December 2013
|
The Helena Assets, a 149-mile pipeline that connects El Dorado, Arkansas to Helena, Arkansas and a crude oil and/or refined products terminal located on the Mississippi River in Helena, Arkansas
|
Enterprise Product Partners L.P.
|
$5.0 million
|
|||
|
February 2014
|
The Crossett Facility, a biodiesel plant in Crossett, Arkansas
|
Pinnacle Biofuels, Inc.
|
$11.1 million
|
|||
|
October 2014
|
The Greenville-Mount Pleasant Assets, a light products terminal in Mount Pleasant, Texas, a light products storage facility in Greenville, Texas and a 76-mile pipeline connecting the locations.
|
An affiliate of Magellan Midstream Partners, L.P.
|
$11.1 million
|
|||
|
December 2014
|
FTT, a transport company that primarily hauls crude oil and asphalt by truck, including 130 trucks and 210 trailers.
|
Frank Thompson Transport, Inc.
|
$12.0 million
|
|||
|
May 2015
|
33.7 million shares of common stock of Alon, representing approximately 48% of the outstanding common stock of Alon at the time of investment.
|
Alon Israel Oil Company, Ltd.
|
$575.8 million
|
|||
|
July 2017
|
Purchased the remaining 53% ownership in Alon, that Delek did not already own, in an all-stock transaction.
|
Shareholders of Alon
|
$530.7 million
|
|||
|
February 2018
|
Purchased the remaining 18.4% ownership in the Alon Partnership that Delek did not already own, in an all-equity transaction.
|
Limited partner unit holders of the Alon Partnership
|
$184.7 million
|
|||
|
(1)
|
Excludes transaction costs
|
Recent Strategic Developments
Delek/Alon Merger
In January 2017, we announced that Old Delek (and various related entities) entered into a Merger Agreement with Alon, as subsequently amended on February 27 and April 21, 2017. The Delek/Alon Merger was effective July 1, 2017, resulting in a new post-combination consolidated registrant New Delek, with Alon and Old Delek surviving as wholly-owned subsidiaries of New Delek. The Merger resulted in total stock consideration paid of approximately $509.0 million consisting of approximately 19.3 million incremental shares of common stock of New Delek ("New Delek Common Stock").
6
Subject to the terms and conditions of the Merger Agreement, at the Effective Time, each issued and outstanding share of common stock of Alon ("Alon Common Stock"), other than shares owned by Old Delek and its subsidiaries or held in the treasury of Alon, was converted into the right to receive 0.504 of a share of New Delek Common Stock, or, in the case of fractional shares of New Delek Common Stock, cash (without interest) in an amount equal to the product of (i) such fractional part of a share of New Delek Common Stock multiplied by (ii) $25.96 per share, which was the volume weighted average price of the Old Delek Common Stock, par value $0.01 per share as reported on the NYSE Composite Transactions Reporting System for the twenty consecutive NYSE full trading days ending on June 30, 2017. Each outstanding share of restricted Alon Common Stock was assumed by New Delek and converted into restricted stock denominated in shares of New Delek Common Stock. Committed but unissued share-based awards were exchanged and converted into rights to receive share-based awards indexed to New Delek Common Stock. Conversions of restricted shares and unissued share-based awards were also subject to the exchange ratio.
In addition, subject to the terms and conditions of the Merger Agreement, each share of Old Delek Common Stock or fraction thereof issued and outstanding immediately prior to the Effective Time (other than Old Delek Common Stock held in the treasury of Old Delek) was converted at the Effective Time into the right to receive one validly issued, fully paid and assessable share of New Delek Common Stock or such fraction thereof equal to the fractional share of New Delek Common Stock. All existing Old Delek stock options, restricted stock awards and stock appreciation rights were converted into equivalent rights with respect to New Delek Common Stock.
In connection with the Merger, Alon, New Delek and U.S. Bank National Association, as trustee (the “Trustee”) entered into a First Supplemental Indenture (the “Supplemental Indenture”), effective as of July 1, 2017, supplementing the Indenture, dated as of September 16, 2013 (the “Indenture”), pursuant to which Alon issued its 3.00% Convertible Senior Notes due 2018 (the “Notes”), which were convertible into shares of Alon’s Common Stock, par value $0.01 per share or cash or a combination of cash and Alon Common Stock, all as provided in the Indenture. The Supplemental Indenture provides that, as of the Effective Time, the right to convert each $1,000 principal amount of the Notes based on a number of shares of Alon Common Stock equal to the Conversion Rate (as defined in the Indenture) in effect immediately prior to the Merger was changed into a right to convert each $1,000 principal amount of Notes into or based on a number of shares of New Delek Common Stock (at the exchange ratio of 0.504), par value $0.01 per share, equal to the Conversion Rate in effect immediately prior to the Merger. In addition, the Supplemental Indenture provides that, as of the Effective Time, New Delek fully and unconditionally guaranteed, on a senior basis, Alon’s obligations under the Notes.
Share Repurchase from Alon Israel
On January 23, 2018, Delek repurchased 2.0 million shares of its common stock from Alon Israel in connection with Delek’s rights pursuant to a Stock Purchase Agreement dated April 14, 2015 by and between Delek and Alon Israel. Alon Israel delivered a right of first offer notice to Delek on January 16, 2018, informing Delek of Alon Israel’s intention to sell the 2.0 million shares, and Delek accepted such offer on January 17, 2018. The total purchase price was approximately $75.3 million, or $37.64 per share.
As of February 25, 2018, there was approximately
$32.2 million
remaining under Delek's $150.0 million December 2016 share repurchase authorization, taking into account the share repurchase from Alon Israel discussed above. On February 26, 2018, the Board of Directors approved a new $150.0 million authorization to repurchase Delek common stock. This amount has no expiration date and is in addition to any remaining amounts previously authorized.
Acquisition of Non-controlling Interest in Alon Partnership
On November 8, 2017, Delek and the Alon Partnership entered into a definitive merger agreement under which Delek agreed to acquire all of the outstanding limited partner units which Delek did not already own in an all-equity transaction. This transaction was approved by all voting members of the board of directors of the general partner of the Alon Partnership upon the recommendation from its conflicts committee and by the board of directors of Delek. This transaction closed on February 7, 2018. Delek owned approximately
51.0 million
limited partner units of the Alon Partnership, or approximately
81.6%
of the outstanding units immediately prior to the transaction date. Under terms of the merger agreement, the owners of the remaining outstanding units in the Alon Partnership that Delek did not currently own immediately prior to the transaction date received a fixed exchange ratio of
0.49
shares of New Delek common stock for each limited partner unit of the Alon Partnership, resulting in the issuance of approximately
5.6 million
shares of New Delek Common Stock to the public unitholders of the Alon Partnership.
Agreement to Sale of Asphalt Terminals
On February 12, 2018, Delek announced it had reached a definitive agreement to sell four asphalt terminals (included in Delek's corporate/other segment) to an affiliate of Andeavor. This transaction includes asphalt terminal assets in Bakersfield, Mojave and Elk Grove, California and Phoenix, Arizona, as well as Delek’s 50 percent equity interest in the Paramount-Nevada Asphalt Company, LLC joint venture that operates an asphalt terminal located in Fernley, Nevada. The total cash consideration is $75.0 million plus a working capital adjustment. Subject to customary closing conditions, certain preferential rights under the joint venture arrangement and regulatory approvals, this transaction is expected to close in the first half of 2018. These assets did not meet the definition of held for sale pursuant to ASC 360 as of
December 31, 2017
and therefore
7
were not reflected as held for sale nor as discontinued operations in the consolidated financial statements as of and for the year ended
December 31, 2017
.
8
Transaction with Delek Logistics
On February 26, 2018, Delek and Delek Logistics entered into a definitive agreement whereby Delek Logistics will acquire the Big Spring logistics assets. These assets consist of storage tanks and terminals that support our Big Spring, Texas refinery. In addition, a new marketing agreement was entered into between the companies for product sales from Big Spring. The expected purchase price is approximately
$315.0 million
in cash. This dropdown is expected to be financed by Delek Logistics through a combination of cash on hand and borrowings on the revolving credit facility, and this transaction is expected to close in March 2018.
Information About Our Segments
Prior to August 2016, we aggregated our operating units into three reportable segments: refining, logistics and retail. However, in August 2016, we entered into a definitive equity purchase agreement (the "Purchase Agreement") with Compañía de Petróleos de Chile COPEC S.A. and its subsidiary, Copec Inc., a Delaware corporation (collectively, "COPEC"). Under the terms of the Purchase Agreement, Delek agreed to sell, and COPEC agreed to purchase, 100% of the equity interests in Delek's wholly-owned subsidiaries MAPCO Express, Inc. ("MAPCO Express"), MAPCO Fleet, Inc., Delek Transportation, LLC, NTI Investments, LLC and GDK Bearpaw, LLC (collectively, the “Retail Entities”) for cash consideration of
$535 million
, subject to customary adjustments (the “ Retail Transaction”). The Retail Transaction closed in November 2016. As a result of the Purchase Agreement, we met the requirements under the provisions of ASC 205-20 and ASC 360 to report the results of the Retail Entities as discontinued operations and to classify the Retail Entities as a group of assets held for sale. The operating results for the Retail Entities, in all periods presented, were reclassified to discontinued operations, and the segment was disposed in a sale transaction where we received net cash consideration of
$378.9 million
, net of debt repayments and transaction costs, and retained approximately
$62.8 million
of net liabilities, resulting in a gain on sale of the Retail Entities, before income tax, of
$134.1 million
in November 2016. Following the Delek/Alon Merger of July 1, 2017, Delek's business again includes retail operations.
Additional segment and financial information is contained in our segment results included in Item 6, Selected Financial Data, Item 7, Management's Discussion and Analysis of Financial Condition and Results of Operations, and in
Note 15
, Segment Data, of our consolidated financial statements included in Item 8, Financial Statements and Supplementary Data, of this Annual Report on Form 10-K.
Refining Segment
Overview
We own and operate four independent refineries located in Tyler, Texas, El Dorado, Arkansas, Big Spring, Texas and Krotz Springs, Louisiana, currently representing a combined
302,000
bpd of crude throughput capacity. Our refining system produces a variety of petroleum-based products used in transportation and industrial markets, which are sold to a wide range of customers located principally in inland, domestic markets.
All of these four refineries are located in the U.S. Gulf Coast ("Gulf Coast") Region (PADD 3), which is one of the five Petroleum Administration for Defense District ("PADD") regional zones established by the U.S. Department of Energy where refined products are produced and sold. Refined product prices generally differ among each of the five PADDs.
Our refining segment also includes two biodiesel facilities we own and operate that are engaged in the production of biodiesel fuels and related activities, located in Crossett, Arkansas and Cleburne, Texas, and a heavy crude oil refinery located in Bakersfield, California. The Bakersfield, California refinery has the capability to produce gasoline, distillates, vacuum gas oil and asphalt, but has not processed crude oil since 2012 due to the high cost of crude oil relative to product yield and low asphalt demand.
Refining System Feedstock Purchases
Our refining system purchases crude oil and other feedstocks through short-term agreements, some of which include renewal provisions, and through spot market transactions. The majority of the crude oil we purchase is sourced from inland domestic sources, primarily originating in areas of Texas, Arkansas and Louisiana. Of these inland domestic sources, we have access to approximately 200,000 barrels per day from the Permian Basin in west Texas. We also have the ability to purchase crude delivered by rail car that originates primarily in other parts of the United States and Canada. Approximately 262,000 barrels per day of the crude oil currently purchased at our four operating refineries is priced at a differential to the price per barrel of WTI. In most cases, this differential is established during the month prior to the month in which the crude oil is processed at our refineries.
Refining System Production Slate
Our refining system processes a combination of light sweet and medium sour crude oils, which, when refined, results in a product mix consisting principally of higher-value transportation fuels such as gasoline, distillate and jet fuel. A lesser portion of our overall production consists of residual products, including paving asphalt, roofing flux and other products with industrial applications.
Refined Product Sales and Distribution
Our refineries sell products on a wholesale and branded basis to inter-company and third-party customers located in Texas, Oklahoma, New Mexico, Arizona, Arkansas, Tennessee and the Ohio River Valley, including Gulf Coast markets and areas along the Enterprise Pipeline System and along the Colonial Pipeline System, through terminals and exchanges.
Refining Segment Seasonality
Demand for gasoline and asphalt products is generally higher during the summer months than during the winter months due to seasonal increases in motor vehicle traffic and road and home construction. Varying vapor pressure requirements between the summer and winter months also tighten summer gasoline supply. As a result, the operating results of our refining segment are generally lower for the first and fourth quarters of the calendar year.
Refining Segment Competition
The refining industry is highly competitive and includes fully integrated national and multinational oil companies engaged in many segments of the petroleum business, including exploration, production, transportation, refining, marketing and retail fuel and convenience stores. Our principal competitors are petroleum refiners in the Mid-Continent and Gulf Coast Regions, in addition to wholesale distributors operating in these markets.
The principal competitive factors affecting our refinery operations are crude oil and other feedstock costs, the differential in price between various grades of crude oil, refinery product margins, refinery reliability and efficiency, refinery product mix, and distribution and transportation costs.
Tyler Refinery
Our Tyler refinery has a nameplate crude throughput capacity of
75,000
bpd. The refinery is situated on approximately 100, out of a total of approximately 600, contiguous acres of land that we own in Tyler, Texas and adjacent areas.
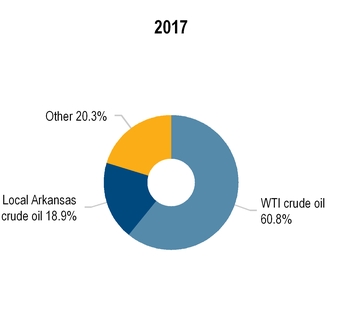
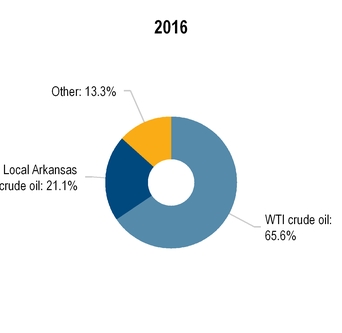
The Tyler refinery is currently the only major distributor of a full range of refined petroleum products within a radius of approximately 100 miles of its location. The Tyler refinery is designed to process mainly light, sweet crude oil, which is typically of a higher quality than heavier sour crudes. The Tyler refinery has access to crude oil pipeline systems that allow us access to east Texas, west Texas and limited Gulf of Mexico and foreign crude oils. Most of the crude supplied to the Tyler refinery is delivered by third-party pipelines and through pipelines owned by our logistics segment.
9
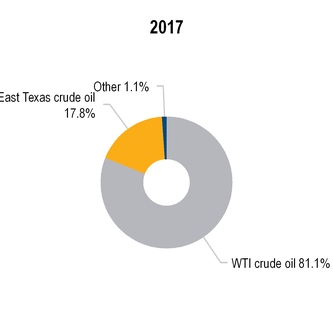
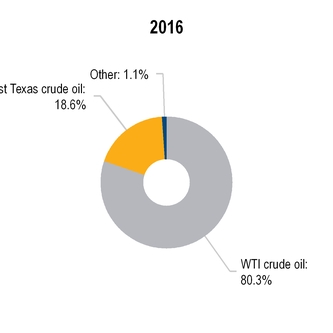
The charts below set forth information concerning crude oil received at the Tyler refinery for the years ended
December 31, 2017
and
2016
:
Major processes at our Tyler refinery include crude distillation, vacuum distillation, naphtha reforming, naphtha and diesel hydrotreating, fluid catalytic cracking, alkylation, and delayed coking. The Tyler refinery has a Complexity Index of 8.7.
The chart below sets forth information concerning the throughput at the Tyler refinery:
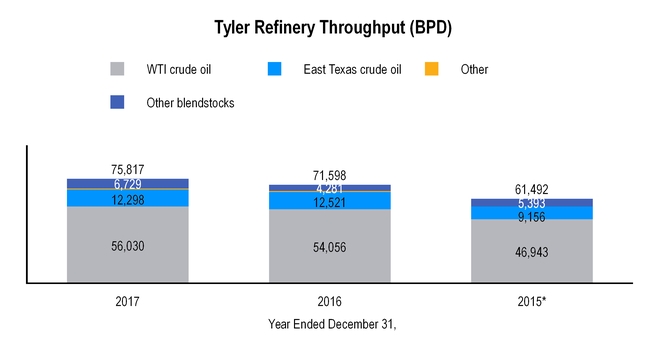
* In the first quarter of 2015, we completed a scheduled turnaround and an expansion project at the Tyler refinery. Total throughputs for the period from April 1, 2015 through December 31, 2015 were
75,058
bpd.
10
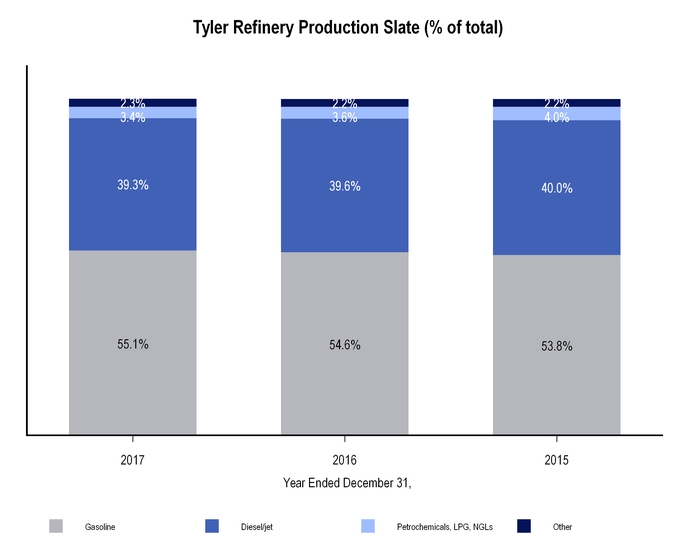
The Tyler refinery primarily produces two grades of gasoline (E10 premium - 93 octane and E10 regular - 87 octane), as well as aviation gasoline. Diesel and jet fuel products produced at the Tyler refinery include military specification jet fuel, commercial jet fuel and ultra-low sulfur diesel. The Tyler refinery offers both E-10 and biodiesel blended products. In addition to higher-value gasoline and distillate fuels, the Tyler refinery produces small quantities of propane, refinery grade propylene and butanes, petroleum coke, slurry oil, sulfur and other blendstocks. The Tyler refinery produces both low-sulfur gasoline and ultra-low sulfur diesel fuel, in compliance with current EPA clean fuels standards.
The chart below sets forth information concerning the Tyler refinery's production slate:
The vast majority of our transportation fuels and other products produced at the Tyler refinery are sold directly from a refined products terminal owned by Delek Logistics and located at the refinery. We believe this allows our customers to benefit from lower transportation costs compared to alternative sources. Our customers include major oil companies, independent refiners and marketers, jobbers, distributors, utility and transportation companies, the U.S. government and independent retail fuel operators.
Taking into account the Tyler refinery's crude and refined product slate, as well as the refinery's location near the Gulf Coast Region, we apply the Gulf Coast 5-3-2 crack spread to calculate the approximate gross margin resulting from processing one barrel of crude oil into three-fifths of a barrel of gasoline and two-fifths of a barrel of high sulfur diesel. We calculate the Gulf Coast 5-3-2 crack spread using the market values of Gulf Coast Pipeline CBOB and Gulf Coast Pipeline No. 2 Heating Oil (high-sulfur diesel) and the market value of WTI crude oil. Gulf Coast Pipeline CBOB and Gulf Coast Pipeline No. 2 Heating Oil are prices for which the products trade in the Gulf Coast Region. Gulf Coast Pipeline CBOB is a grade of gasoline commonly blended with biofuels and marketed as Regular Unleaded at retail locations. Gulf Coast Pipeline No. 2 Heating Oil is a petroleum distillate that can be used as either a diesel fuel or a fuel oil. This is the standard by which other distillate products (such as ultra-low sulfur diesel) are priced. The NYMEX is a commodities trading exchange where contracts for the future delivery of petroleum products are bought and sold.
11
El Dorado Refinery
Our El Dorado refinery has a crude throughput capacity of
80,000
bpd. The El Dorado site consists of approximately 460 acres, of which the main plant and associated tank farms adjacent to the refinery sit on approximately 335 acres of land that we own in El Dorado, Arkansas. The El Dorado refinery is the largest refinery in Arkansas, and represents more than 90% of state-wide refining capacity.
The El Dorado refinery is designed mainly to process a wide variety of crude oil, ranging from light sweet to heavy sour. The refinery receives crude by several delivery points, including local crude and other third-party pipelines that connect directly into Delek Logistics' El Dorado Pipeline System, which runs from Magnolia, Arkansas, to the El Dorado refinery (the "El Dorado Pipeline System"), and rail at third-party terminals.
We also purchase crude oil for the El Dorado refinery from inland sources in east and west Texas, south Arkansas and north Louisiana through a crude oil gathering system owned and operated by Delek Logistics (the "SALA Gathering System").
The charts below set forth information concerning crude oil received at the El Dorado refinery for the years ended
December 31, 2017
and
2016
:
Major processes at our El Dorado refinery include crude distillation, vacuum distillation, naphtha isomerization and reforming, naphtha and diesel hydrotreating, gas oil hydrotreating, fluid catalytic cracking and alkylation. The El Dorado refinery has a Complexity Index of 10.2.
12
The chart below sets forth information concerning the throughput at the El Dorado refinery:
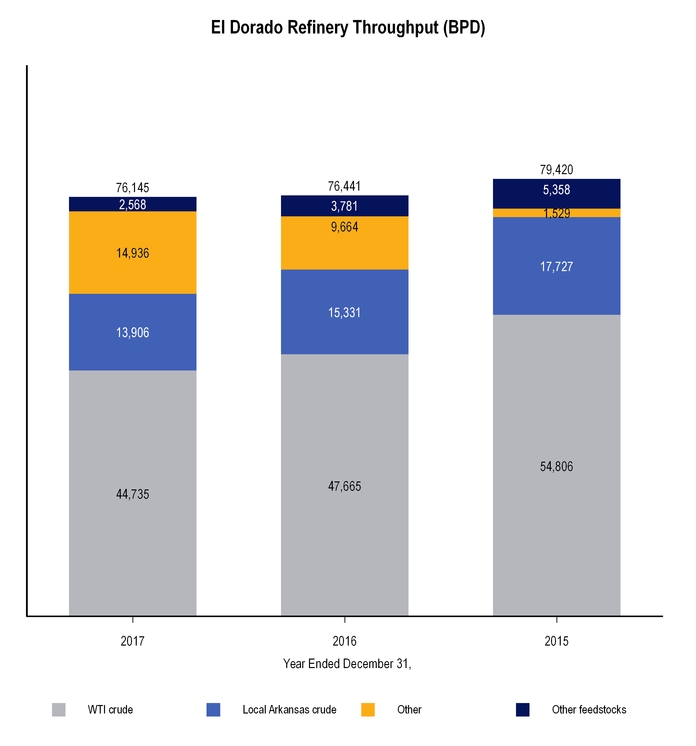
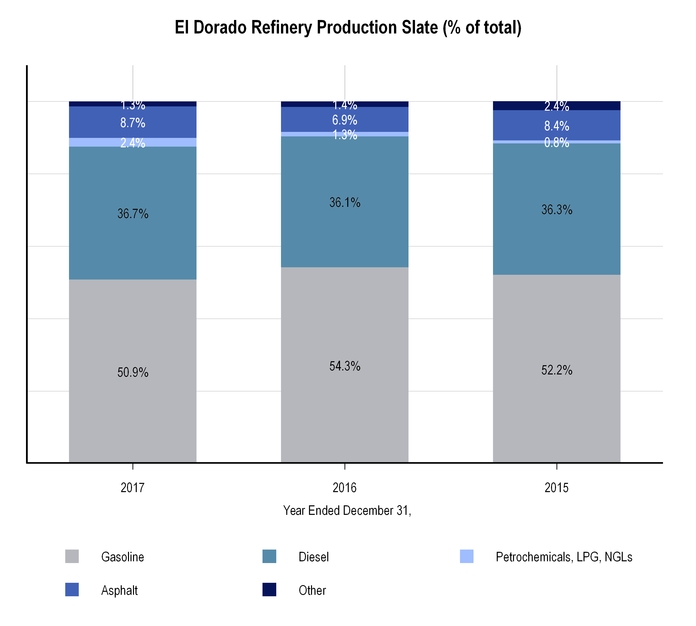
The El Dorado refinery produces a wide range of refined products, from multiple grades of gasoline and ultra-low sulfur diesel fuels, LPGs, refinery grade propylene and a variety of asphalt products, including paving grade asphalt and roofing flux. The El Dorado refinery produces both low-sulfur gasoline and ultra-low sulfur diesel fuel, in compliance with current EPA clean fuels standards. The El Dorado refinery offers both E-10 and biodiesel blended products.
13
The chart below sets forth information concerning the El Dorado refinery's production slate:
Products manufactured at the El Dorado refinery are sold to wholesalers and retailers through spot sales, commercial contracts and exchange agreements in markets in Arkansas, Memphis, Tennessee and north into the Ohio River Valley region. The El Dorado refinery connection via the logistics segment to the Enterprise Pipeline System is a key means of product distribution for the refinery, because it provides access to third-party terminals in multiple Mid-Continent markets located adjacent to the system, including Shreveport, Louisiana, North Little Rock, Arkansas, Memphis, Tennessee, and Cape Girardeau, Missouri. The El Dorado refinery also supplies products to these markets through product exchanges on the Colonial Pipeline.
The crude oil and product slate flexibility of the El Dorado refinery allows us to take advantage of changes in the crude oil and product markets; therefore, we anticipate that the quantities and varieties of crude oil processed and products manufactured at the El Dorado refinery will continue to vary. Thus, we do not believe that it is possible to develop a reasonable refined product margin benchmark that would accurately portray our refined product margins at the El Dorado refinery.
14
Big Spring Refinery
Our Big Spring refinery has a crude throughput capacity of
73,000
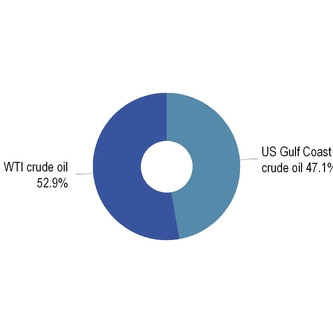
bpd, is located on 1,306 acres of land that we own in the Permian Basin in west Texas, and is the closest refinery to Midland, Texas ("Midland"), which allows us to efficiently source WTS and WTI Midland crudes. Additionally, the Big Spring refinery has the ability to source locally-trucked crudes, which enables us to better control quality and eliminate the cost of transporting the crude supply from Midland.
The Big Spring refinery is designed to process a variety of crudes, ranging from light sweet to medium sour, with the flexibility to convert its production to one or the other based on market pricing conditions. Our Big Spring refinery receives WTS and WTI crudes by truck from local gathering systems and regional common carrier pipelines. Other feedstocks, including butane, isobutane and asphalt blending components, are delivered by truck and railcar. A majority of the natural gas we use to run the refinery is delivered by a pipeline in which we own a majority interest.
The charts below set forth information concerning crude oil received at the Big Spring refinery for the six months ended December 31, 2017, the period since the Delek/Alon Merger:

Major processes at our Big Spring refinery include crude distillation, vacuum distillation, naphtha reforming, naphtha and diesel hydrotreating, aromatic extraction, propane deasphalting, fluid catalytic cracking, and alkylation. The Big Spring refinery has a Complexity Index of 10.5.
15
The chart below sets forth information concerning the throughput at the Big Spring refinery for the six months ended December 31, 2017, the period since the Delek/Alon Merger:

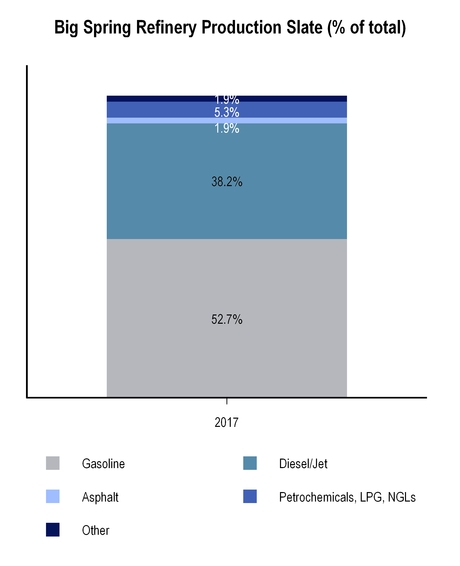
The Big Spring refinery produces a wide range of refined products, from ultra-low sulfur gasoline, ultra-low sulfur diesel, jet fuel, petrochemicals, liquefied petroleum gas, asphalt and other petroleum products. We produce various grades of gasoline in compliance with current EPA clean fuels standards including boutique fuels supplied to the El Paso, Texas, and Phoenix, Arizona, markets. We produce both on-road and off-road diesel in compliance with current EPA clean fuels standards. Our jet fuel production conforms to the military grade specifications. We produce propane, propylene, certain aromatics, specialty solvents and benzene for use as petrochemical feedstocks, and asphalt along with other by-products such as sulfur and carbon black oil.
16
The chart below sets forth information concerning the Big Spring refinery's production slate for the six months ended December 31, 2017, the period since the Delek/Alon Merger:
Our Big Spring refinery sells products in both the wholesale rack and bulk markets. We sell motor fuels under both the Alon brand and on an unbranded basis through various terminals to supply numerous locations, including the convenience stores in Delek's retail segment. We sell transportation fuel production in excess of our branded and unbranded marketing needs through bulk sales and exchange channels entered into with various oil companies and trading companies which are transported through a product pipeline network or truck deliveries, depending on location, and through terminals located in Texas (Abilene, Wichita Falls, El Paso), Arizona (Tuscon, Phoenix), and New Mexico (Albuquerque, Moriarty).
For our Big Spring refinery, we compare our per barrel refined product margin to the Gulf Coast 3-2-1 crack spread. The Gulf Coast 3-2-1 crack spread is calculated assuming that three barrels of WTI Cushing crude oil are converted, or cracked, into two barrels of Gulf Coast conventional gasoline and one barrel of Gulf Coast ultra-low sulfur diesel. Our Big Spring refinery is capable of processing substantial volumes of sour crude oil, which has historically cost less than intermediate, and/or substantial volumes of sweet crude oils, based on price differentials. We measure the cost advantage of refining sour crude oil by calculating the difference between the price of WTI Cushing crude oil and the price of West Texas Sour ("WTS"), a medium, sour crude oil, taking into account differences in production yield. We refer to this differential as the WTI Cushing/WTS, or sweet/sour, spread. A widening of the sweet/sour spread can favorably influence the operating margin for our Big Spring refinery. The WTI Cushing less WTI Midland spread represents the differential between the average per barrel price of WTI Cushing crude oil and the average per barrel price of WTI Midland crude oil.
17
Krotz Springs Refinery
Our Krotz Springs refinery has a crude throughput capacity of
74,000
bpd, and is located on 381 acres of land that we own on the Atchafalaya River in central Louisiana. This location provides access to crude from barge, pipeline, railcar and truck. This combination of logistics assets provides us with diversified access to locally-sourced, domestic and foreign crudes.
The Krotz Springs refinery is designed mainly to process light sweet, crude oil. We are capable of receiving WTI Midland, Light Louisiana Sweet (“LLS”), Heavy Louisiana Sweet (“HLS”) and foreign crudes from the EMPCo “Northline System.” The Northline System delivers LLS, HLS and foreign crude oils from the St. James, Louisiana, crude oil terminalling complex. Additionally, the Krotz Springs refinery has the ability to receive crude oil sourced from west Texas. WTI crude oil is transported through the Energy Transfer Partners ("ETP") Amdel pipeline to the Nederland terminal located near the Gulf Coast and from there is transported to the Krotz Springs refinery by barge via the Intracoastal Canal and the Atchafalaya River. The Krotz Springs refinery also receives approximately 20% of its crude by barge and truck from inland Louisiana and Mississippi and other locations.
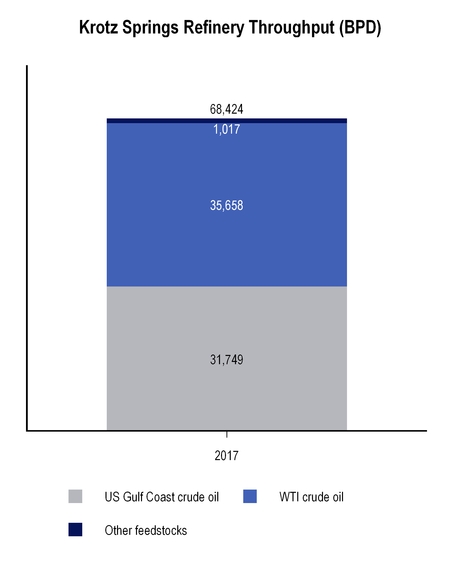
The charts below set forth information concerning crude oil received at the Krotz Springs refinery for the six months ended December 31, 2017, the period since the Delek/Alon Merger:
Major processes at the Krotz Springs refinery include crude distillation, vacuum distillation, naphtha hydrotreating, naphtha isomerization and reforming, and gas oil/residual catalytic cracking to minimize low quality black oil production and to produce higher light product yields. The Krotz Springs refinery has a Complexity Index of 8.4.
18
The chart below sets forth information concerning the throughput at the Krotz Springs refinery for the six months ended December 31, 2017, the period since the Delek/Alon Merger:
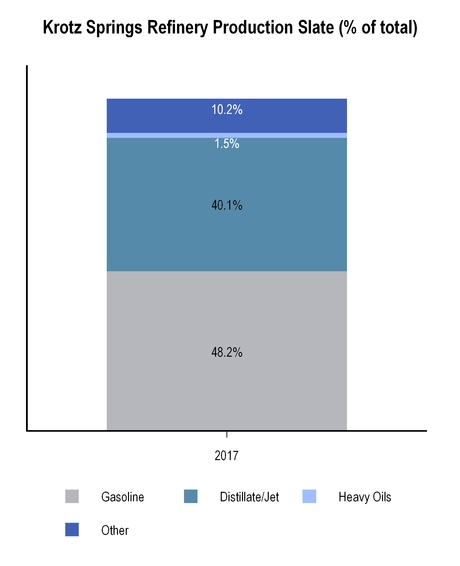
The Krotz Springs refinery produces ultra low sulfur gasoline in compliance with current EPA standards, high sulfur diesel, light cycle oil, jet fuel, petrochemical feedstocks, LPG and slurry oil.
19
The chart below sets forth information concerning the Krotz Springs refinery's production slate for the six months ended December 31, 2017, the period since the Delek/Alon Merger:
The Krotz Springs refinery markets transportation fuel production substantially through bulk sales and exchange channels. These bulk sales and exchange arrangements are entered into with various oil companies and trading companies and are transported to markets on the Mississippi River and the Atchafalaya River as well as to the Colonial Pipeline.
For our Krotz Springs refinery, we compare our per barrel refined product margin to the Gulf Coast 2-1-1 high sulfur diesel crack spread. A Gulf Coast 2-1-1 high sulfur diesel crack spread is calculated assuming that two barrels of LLS crude oil are converted into one barrel of Gulf Coast conventional gasoline and one barrel of Gulf Coast high sulfur diesel. The Krotz Springs refinery has the capability to process substantial volumes of sweet, crude oils to produce a high percentage of refined light products.
Logistics Segment
Overview
Our logistics segment consists of Delek Logistics, a publicly traded master limited partnership, and its subsidiaries. Our consolidated financial statements include its consolidated financial results. As of
December 31, 2017
, we owned a
61.5%
limited partner interest in Delek Logistics, and a
94.6%
interest in Logistics GP, which owns both the entire
2.0%
general partner interest in Delek Logistics and all of the incentive distribution rights.
Our logistics segment generates revenue and contribution margin, which we define as net sales less cost of goods sold and operating expenses, by charging fees for gathering, transporting, offloading and storing crude oil; for storing intermediate products and feedstocks; for
20
distributing, transporting and storing refined products; and for wholesale marketing. A substantial majority of the logistics segment's existing assets are both integral to and dependent on the successful operation of our refining segment's assets, as the logistics segment gathers, transports and stores crude oil and markets, distributes, transports and stores refined products in select regions of the southeastern United States and east Texas primarily in support of the Tyler and El Dorado refineries. In addition to intercompany services, the logistics segment also provides some crude oil, intermediate and refined products transportation services for, and terminalling and marketing services to, third parties primarily in Texas, Tennessee and Arkansas.
The logistics segment owns nine light product distribution terminals, one in each of Nashville and Memphis, Tennessee; Tyler, Big Sandy, San Angelo, Abilene and Mount Pleasant, Texas; and North Little Rock and El Dorado, Arkansas. All of the above properties are located on real property owned by Delek and its subsidiaries. The logistics segment also owns the El Dorado Pipeline System, the Magnolia Pipeline System and 600 miles of crude oil gathering lines, which are located in Louisiana and Arkansas. The logistics segment owns the McMurrey Pipeline System, the Nettleton Pipeline, the Tyler-Big Sandy Product Pipeline, the Paline Pipeline System, the Greenville-Mount Pleasant Pipeline and the Big Spring Pipeline which are located in Texas. All of the pipeline systems set forth above run across fee owned land, leased land, easements and rights-of-way. The logistics segment also owns storage tanks in El Dorado and North Little Rock, Arkansas; Memphis and Nashville, Tennessee; and Tyler, Greenville, Big Sandy, San Angelo, Abilene and Mount Pleasant, Texas and a fleet of trucks and trailers used to transport crude oil, asphalt and other hydrocarbon products.
The following provides an overview of our logistics segment assets and operations:
Logistics Segment - Wholesale Marketing and Terminalling
The logistics segment's wholesale marketing and terminalling business provides wholesale marketing and terminalling services to the refining segment and to independent third parties from whom it receives fees for marketing, transporting, storing and terminalling refined products and to whom it wholesale markets refined products. It generates revenue by (i) providing marketing services for the refined products output of the Tyler refinery, (ii) engaging in wholesale activity at owned terminals in Abilene and San Angelo, Texas, as well as at terminals owned by third parties in Texas, whereby it purchases light products for sale and exchange to third parties, and (iii) providing terminalling services to independent third parties and the refining segment. Three terminals, located in El Dorado, Arkansas, Memphis, Tennessee and North Little Rock, Arkansas, throughput refined product produced at the El Dorado refinery. Three terminals, located in Tyler, Big Sandy and Mount Pleasant Texas, throughput refined product produced at the Tyler refinery.
21
Logistics Segment - Pipelines and Transportation
The logistics segment's pipelines and transportation business owns or leases capacity on approximately
461
miles of operable crude oil transportation pipelines, approximately
406
miles of refined product pipelines, an approximately
600
-mile crude oil gathering system and associated crude oil storage tanks with an aggregate of approximately
7.3 million
barrels of active shell capacity. These assets are primarily divided into the following operating systems:
|
•
|
the Lion Pipeline System, which transports crude oil to, and refined products from, the El Dorado refinery (the "Lion Pipeline System");
|
|
•
|
the SALA Gathering System, which gathers and transports crude oil production in southern Arkansas and northern Louisiana, primarily for the El Dorado refinery;
|
|
•
|
the Paline Pipeline System, which primarily transports crude oil from Longview, Texas to third-party facilities in Nederland, Texas;
|
|
•
|
the East Texas Crude Logistics System, which currently transports a portion of the crude oil delivered to the Tyler refinery (the "East Texas Crude Logistics System");
|
|
•
|
the Tyler-Big Sandy Product Pipeline, which is a pipeline between the Tyler refinery and the Big Sandy Terminal;
|
|
•
|
the Tyler Tank Assets;
|
|
•
|
the El Dorado Tank Assets;
|
|
•
|
the Greenville-Mount Pleasant Pipeline and Greenville Storage Facility;
|
|
•
|
the North Little Rock Tanks;
|
|
•
|
the El Dorado Rail Offloading Racks;
|
|
•
|
the Tyler Crude Tank;
|
|
•
|
the Talco Crude Pipeline; and
|
|
•
|
the Big Spring Pipeline and Big Spring Truck Unloading Station
|
In addition to these operating systems, the logistics segment owns approximately 95 tractors and 231 trailers used to haul primarily crude oil, finished products and other hydrocarbon products for us and for third parties.
Joint Ventures
The logistics segment owns a portion of two joint ventures (accounted for as equity method investments) that have constructed logistics assets, which serve third parties and the refining segment. These assets include the following:
|
•
|
a 50% interest in an 80-mile crude oil pipeline with a capacity of 80,000 bpd that originates in Longview, Texas, with destinations in the Shreveport, Louisiana area (the "Caddo Pipeline") and;
|
|
•
|
a 33% interest in a 107-mile crude oil pipeline with an initial capacity of 55,000 bpd, with the capability to expand to 85,000 bpd, that originates in north Loving County, Texas near the Texas-New Mexico border and terminates in Midland, Texas ("the RIO Pipeline").
|
The RIO Pipeline project began operations in September 2016 and the Caddo Pipeline began operations in January 2017.
Logistics Segment Supply Agreement
A large portion of the petroleum products for sale by the logistics segment in west Texas were purchased from Noble Petro, Inc. ("Noble Petro") during 2017. Under the terms of a supply contract (the "Abilene Contract") with Noble Petro, which expired December 31, 2017, we had the right to purchase up to
20,350
bpd of petroleum products. Under the Abilene Contract, we purchased petroleum products based on monthly average prices from Noble Petro immediately prior to our resale of such products to customers at our San Angelo and Abilene, Texas terminals, which we leased to Noble Petro. Under this arrangement, we had limited direct exposure to risks associated with fluctuating prices for these refined products due to the short period of time between the purchase and resale of these refined products. As of January 2018, we began replacing the product supplied under the Abilene Contract with product purchased from Delek, which is produced by the Big Spring refinery and from third parties that may continue to include Noble Petro. Products purchased from Delek or other third parties are generally based on daily market prices at the time of purchase requiring price hedging risk management activities between the time of purchase and sale. Existing price risk hedging programs have been expanded to correspond to the higher volume of product purchased from Delek and third parties.
Logistics Segment Operating Agreements With Delek
Delek Logistics has a number of long-term, fee-based commercial agreements with Delek and its subsidiaries that, among other things, establish fees for certain administrative and operational services provided by Delek and its subsidiaries to Delek Logistics, provide certain indemnification obligations and establish terms for fee-based commercial agreements for Delek Logistics to provide certain pipeline transportation, terminal throughput, finished product marketing and storage services to Delek. Most of these agreements have an initial term ranging from five to ten years, which may be extended for various renewal terms at the option of Delek. The current terms for agreements effective in November 2012 extend through November 2022. In the case of our marketing agreement with Delek, the initial term has been extended through 2026. Each of these agreements requires Delek or a Delek subsidiary to pay for certain minimum volume commitments or certain minimum storage
22
capacities. Delek Logistics is a variable interest entity as defined under United States generally accepted accounting principles ("GAAP") and is consolidated into our consolidated financial statements. Intercompany transactions with Delek Logistics and its subsidiaries are eliminated in our consolidated financial statements.
Logistics Segment Customers
In addition to certain of our subsidiaries, our logistics segment has various types of customers, including major oil companies, independent refiners and marketers, jobbers, distributors, utility and transportation companies and independent retail fuel operators.
Logistics Segment Seasonality
The volume and throughput of crude oil and refined products transported through our pipelines and sold through our terminals and to third parties is directly affected by the level of supply and demand for all of such products in the markets served directly or indirectly by our assets. Supply and demand for such products fluctuates during the calendar year. Demand for gasoline, for example, is generally higher during the summer months than during the winter months due to seasonal increases in motor vehicle traffic. Varying vapor pressure requirements between the summer and winter months also tighten summer gasoline supply. In addition, our refining segment often performs planned maintenance during the winter, when demand for their products is lower. Accordingly, these factors can diminish the demand for crude oil or finished products by our customers, and therefore limit our volumes or throughput during these periods, and we expect that our operating results will generally be lower during the first and fourth quarters of the calendar year.
Logistics Segment Competition
Our logistics segment faces competition for the transportation of crude oil from other pipeline owners whose pipelines (i) may have a location advantage over our pipelines, (ii) may be able to transport more desirable crude oil to third parties, (iii) may be able to transport crude oil or finished product at a lower tariff, or (iv) may be able to store more crude oil or finished product. In addition, the wholesale marketing and terminalling business in general is also very competitive. Our owned refined product terminals, as well as the other third-party terminals we use to sell refined products, compete with other independent terminal operators as well as integrated oil companies on the basis of terminal location, price, versatility and services provided. The costs associated with transporting products from a loading terminal to end users limit the geographic size of the market that can be competitively served by any terminal.
Logistics Segment Activity
The following table summarizes our activity in the wholesale marketing and terminalling portion of our logistics segment:
|
Year Ended December 31,
|
|||||||||
|
2017
|
|
2016
|
|
2015
|
|||||
|
Operating Information:
|
|||||||||
|
West Texas marketing throughputs (average bpd)
|
13,817
|
|
13,257
|
|
16,357
|
|
|||
|
Terminalling throughputs (average bpd)
(1)
|
124,488
|
|
122,350
|
|
106,514
|
|
|||
|
East Texas marketing throughputs (average bpd)
|
73,655
|
|
68,131
|
|
59,174
|
|
|||
|
(1)
|
Consists of terminalling throughputs at our Tyler, Big Sandy and Mount Pleasant, Texas, El Dorado and North Little Rock, Arkansas and Memphis and Nashville, Tennessee terminals.
|
23
The following table summarizes our activity in the pipelines and transportation portion of our logistics segment:
|
Year Ended December 31,
|
|||||||||
|
2017
|
2016
|
2015
|
|||||||
|
Throughputs (average bpd)
|
|||||||||
|
Lion Pipeline System:
|
|||||||||
|
Crude pipelines (non-gathered)
|
59,362
|
|
56,555
|
|
54,960
|
|
|||
|
Refined products pipelines to Enterprise Systems
|
51,927
|
|
52,071
|
|
57,366
|
|
|||
|
SALA Gathering System
|
15,871
|
|
17,756
|
20,673
|
|
||||
|
East Texas Crude Logistics System
|
15,780
|
|
12,735
|
|
18,828
|
|
|||
Retail Segment
Overview
In August 2016, Delek entered into a Purchase Agreement to sell the Retail Entities, which consisted of all of the retail segment at that time and a portion of the corporate, other and eliminations segment, to COPEC. As a result of the Purchase Agreement, we met the requirements of ASC 205-20 and ASC 360 to report the results of the Retail Entities as discontinued operations and to classify the Retail Entities as a group of assets held for sale. The Retail Entities were sold in November 2016. The operating results for the Retail Entities, in all periods up until and including the date of the sale, were reclassified to discontinued operations and are no longer reported as part of Delek's retail segment.
Effective with the Delek/Alon Merger July 1, 2017, Delek's retail segment now includes the operations of Alon's
302
owned and leased convenience store sites located primarily in central and west Texas and New Mexico, of which
141
locations are leased, with approximately
$5.8 million
of minimum lease payments due during
2018
. Our convenience stores typically offer various grades of gasoline and diesel under the Alon brand name and food products, food service, tobacco products, non-alcoholic and alcoholic beverages, general merchandise as well as money orders to the public, primarily under the 7-Eleven and Alon brands.
We believe that we have established strong brand recognition and market presence in the major retail markets in which we operate. Our retail strategy employs localized marketing tactics that account for the unique demographic characteristics of each region that we serve. We introduce customized product offerings and promotional strategies to address the unique tastes and preferences of our customers on a market-by-market basis.
Fuel Operations
Since the Delek/Alon Merger in
2017
, our fuel sales were
59.1%
of total net sales for our retail segment.
The following table highlights certain information regarding our fuel operations for the six months ended December 31, 2017, the period since the Delek/Alon Merger:
|
Number of fuel stores (end of period)
|
293
|
|
||
|
Average number of fuel stores (during period)
|
293
|
|
||
|
Retail fuel sales (thousands of gallons)
|
107,599
|
|
||
|
Average retail gallons per store (based on average number of stores) (thousands of gallons)
|
367
|
|
||
|
Retail fuel margin ($ per gallon)
|
$
|
0.192
|
|
|
Substantially all of the motor fuel sold through our retail segment is supplied by our Big Spring refinery, which is transferred to the retail segment at prices substantially determined by reference to published commodity pricing information.
24
Merchandise Operations
Since the Delek/Alon Merger in
2017
, our merchandise sales were
40.9%
of total net sales for our retail segment.
The following table highlights certain information regarding our merchandise operations for the six months ended December 31, 2017, the period since the Delek/Alon Merger:
|
Number of merchandise stores (end of period)
|
302
|
|
||
|
Merchandise margin
|
30.7
|
%
|
||
|
Total merchandise sales (in thousands)
|
$
|
174,600
|
|
|
|
Average number of merchandise stores (during period)
|
302
|
|
||
|
Average merchandise sales per store (in thousands)
|
$
|
578
|
|
|
Retail Segment Seasonality
Demand for gasoline and convenience merchandise is generally higher during the summer months than during the winter months due to seasonal increases in motor vehicle traffic. As a result, the operating results of our retail segment are generally lower for the first quarter of the calendar year. Weather conditions in our operating area also have a significant effect on our operating results. Customers are more likely to purchase higher profit margin items at our retail fuel and convenience stores, such as fast foods, fountain drinks and other beverages and more gasoline during the spring and summer months. Unfavorable weather conditions during these months and a resulting lack of the expected seasonal upswings in traffic and sales could have a negative impact on our results of operations.
Retail Segment Competition
The retail fuel and convenience store business is highly competitive. We compete on a store-by-store basis with other independent convenience store chains, independent owner-operators, major petroleum companies, supermarkets, drug stores, discount stores, club stores, mass merchants, fast food operations and other retail outlets. Major competitive factors affecting us include location, ease of access, pricing, timely deliveries, product and service selections, customer service, fuel brands, store appearance, cleanliness and safety. We believe we are able to compete effectively in the markets in which we operate because our geographic concentration allows us to improve buying power with our vendors. Our retail segment strategy centers on operating a high concentration of sites in a similar geographic region to promote operational efficiencies. Finally, we believe that leveraging the integration between our retail and refining segments provides advantageous fuel supply to our retail stores. Our major retail competitors include Chevron, Murphy USA, Sunoco LP (Stripes® brand), Alimentation Couche-Tard Inc. (Circle K® brand and CST brand), Andeavor and various other independent operators.
Information Technology
In 2017, we continued our efforts to improve several areas of IT, including infrastructure, security and enterprise software systems. Much of the effort was dictated by merger and acquisition activity that took place beginning in late 2016, with the divestiture of the Retail Entities' assets, and again in mid-year with the merger of Alon. With the divestiture of the Retail Entities (as previously defined, which included MAPCO), the opportunity was taken to reduce network complexity, as well as the elimination/consolidation of obsolete software applications. Following the Delek/Alon Merger, we undertook the opportunity to consolidate the financial systems into SAP. The project scope included order processing and plant procurement processes. We expect to undertake additional work in 2018 to continuously improve on the work that was completed in 2017. In addition, significant steps were undertaken to consolidate and move toward a consistent IT security architecture. This was coupled with actions to unite the corporate networks at the various locations. We also leveraged our retail experience to initiate activities to improve our store security posture and improve our ability to meet Payment Card Industry requirements, while adding new functionality to support enhanced store performance reporting. While work associated with the Delek/Alon Merger is expected to continue through 2018, we believe significant steps have been taken that will help us maintain adequate data security.
25
Governmental Regulation and Environmental Matters
Rate Regulation of Petroleum Pipelines
The rates and terms and conditions of service on certain of our pipelines are subject to regulation by the Federal Energy Regulatory Commission ("FERC"), under the Interstate Commerce Act (the “ICA”), and by the state regulatory commissions in the states in which we transport crude oil, intermediate and refined products. Certain of our pipeline systems are subject to such regulation and have filed tariffs with the appropriate authorities. We also comply with the reporting requirements for these pipelines. Other of our pipelines have received a waiver from application of the FERC's tariff requirements, but comply with other applicable regulatory requirements.
The FERC regulates interstate transportation under the ICA, the Energy Policy Act of 1992 and the rules and regulations promulgated under those laws. The ICA, and its implementing regulations, require that tariff rates for interstate service on oil pipelines, including pipelines that transport crude oil, intermediate and refined products in interstate commerce (collectively referred to as “petroleum pipelines”), be just and reasonable and non-discriminatory, and that such rates and terms and conditions of service be filed with the FERC. Under the ICA, shippers may challenge new or existing rates or services. The FERC is authorized to suspend the effectiveness of a challenged rate for up to seven months, though rates are typically not suspended for the maximum allowable period. Our tariff rates are typically contractually subject to increase or decrease on July 1 of each year, by the amount of any change in various inflation-based indices, including the FERC oil pipeline index, the consumer price index and the producer price index; provided, however, that in no event will the fees be adjusted below the amount initially set forth in the applicable agreement.
Environmental Health and Safety
We are subject to extensive federal, state and local environmental and safety laws and regulations enforced by various agencies, including the EPA, the United States Department of Transportation, the Occupational Safety and Health Administration, as well as numerous state, regional and local environmental, safety and pipeline agencies.
These laws and regulations govern the discharge of materials into the environment, waste management practices, pollution prevention measures and the composition of the fuels we produce, as well as the safe operation of our plants, pipelines and trucks, and the safety of our workers and the public. Numerous permits or other authorizations are required under these laws and regulations for the operation of our refineries, renewable fuel facilities, terminals, pipelines, underground storage tanks ("USTs"), trucks, rail cars and related operations, and may be subject to revocation, modification and renewal.
These laws and permits raise potential exposure to future claims and lawsuits involving environmental and safety matters, which could include soil and water contamination, air pollution, personal injury and property damage allegedly caused by substances which we manufactured, handled, used, released or disposed of, transported, or that relate to pre-existing conditions for which we have assumed responsibility. We believe that our current operations are in substantial compliance with existing environmental and safety requirements. However, there have been and will continue to be ongoing discussions about environmental and safety matters between us and federal and state authorities, including notices of violations, citations and other enforcement actions, some of which have resulted, or may result in, changes to operating procedures and in capital expenditures. While it is often difficult to quantify future environmental or safety related expenditures, we anticipate that continuing capital investments and changes in operating procedures will be required for the foreseeable future to comply with existing and new requirements, as well as evolving interpretations and more strict enforcement of existing laws and regulations. We anticipate that compliance with environmental, health and safety regulations will require us to spend approximately
$41.0 million
in capital costs in
2018
and approximately
$302.6 million
during the next five years. These estimates do not include amounts related to capital investments that management has deemed to be strategic investments. These amounts could materially change as a result of governmental and regulatory actions.
We generate wastes that may be subject to the RCRA and comparable state and local requirements. The EPA and various state agencies have limited the approved methods of managing, transporting, recycling and disposal of hazardous and certain non-hazardous wastes. Our refineries are large quantity generators of hazardous waste and require hazardous waste permits issued by EPA or state agencies. Our other facilities, such as terminals and renewable fuel plants, generate lesser quantities of hazardous wastes.
The Comprehensive Environmental Response, Compensation and Liability Act, also known as Superfund, imposes liability, without regard to fault or the legality of the original conduct, on certain classes of persons who are considered to be responsible for the release of a hazardous substance into the environment. Analogous state laws impose similar responsibilities and liabilities on responsible parties. In the course of our ordinary operations, our various businesses generate waste, some of which falls within the statutory definition of a hazardous substance and some of which may have been disposed of at sites that may require future cleanup under Superfund. At this time, our El Dorado refinery has been named as a minor potentially responsible party at one site, for which we believe future costs will not be material.
As of
December 31, 2017
, we have recorded an environmental liability of approximately
$76.1 million
, primarily related to the estimated probable costs of remediating, or otherwise addressing, certain environmental issues of a non-capital nature at the Tyler, El Dorado, Big Spring, Krotz Springs and California refineries as well as terminals, some of which we no longer own. This liability includes estimated costs for ongoing investigation and remediation efforts, which were already being performed by the former operators of the refineries and terminals prior to our
26
acquisition of those facilities, for known contamination of soil and groundwater, as well as estimated costs for additional issues which have been identified subsequent to the acquisitions. We expect approximately
$0.2 million
of this amount to be reimbursable by a prior owner of the El Dorado refinery, which we have recorded in other current assets in our consolidated balance sheet as of
December 31, 2017
. We expect approximately
$2.3 million
of this amount to be reimbursable by a prior owner of certain assets associated with the Paramount, California refinery, and have recorded
$0.1 million
in other current assets and
$2.2 million
in other non-current assets in our consolidated balance sheet as of
December 31, 2017
.
Approximately
$7.2 million
of the total liability is expected to be expended over the next 12 months, with most of the balance expended by 2032, although some costs may extend up to 30 years. In the future, we could be required to extend the expected remediation period or undertake additional investigations of our refineries, pipelines and terminal facilities, which could result in additional remediation liabilities.
Our operations are subject to certain requirements of the Federal Clean Air Act (“CAA”), as well as related state and local laws and regulations governing air emission. Certain CAA regulatory programs applicable to our refineries, terminals and other operations require capital expenditures for the installation of air pollution control devices, operational procedures to minimize emissions and monitoring and reporting of emissions. Our recently acquired Big Spring refinery has been negotiating an agreement with EPA for over 10 years under EPA’s National Petroleum Refinery Initiative regarding alleged historical violations of the CAA. A Consent Decree resolving these alleged historical violations for the Big Spring refinery was lodged with the United States District Court for the Northern District of Texas on June 6, 2017, and we expect that Consent Decree to become final in 2018. If finalized as lodged, the Consent Decree will require payment of a $0.5 million civil penalty and capital expenditures for pollution control equipment that may be significant over the next 5 years.
In 2015, EPA finalized reductions in the National Ambient Air Quality Standard (NAAQS) for ozone, from 75 ppb to 70 ppb. Our Tyler refinery is located in an area that may be reclassified as non-attainment with the new standard. While we do not yet know what specific actions we will be required to take or when, it is possible we will have to install additional air pollution control equipment for ozone forming emissions or change the formulation of gasoline we make for use in some areas. We do not believe such capital expenditures, or the changes in our operation, will result in a material adverse effect on our business, financial condition or results of operations.
On December 1, 2015, the EPA published final rules under the Risk and Technology Review provisions of the Clean Air Act to further regulate refinery air emissions through additional New Source Performance Standard ("NSPS") and Maximum Achievable Control Technology requirements (the “Refinery Sector Rules”). Refineries have up to three years from the effective date of the final rule to come into compliance with certain requirements of the rule, while other aspects of the rule require compliance to be achieved at a sooner date. The final rules will require capital expenditures for additional controls on the Tyler refinery’s coker and for the relief systems, flares, tanks and other sources at our refineries, as well as requiring changes to the way we operate, start up and maintain some process units. The final rule also requires that we monitor property line benzene concentrations beginning in January 2018 and provide the results to the EPA quarterly, which will make the results available to the public beginning in 2019. Even though the concentrations are not expected to exceed regulatory or health based standards, the availability of such data may increase the likelihood of lawsuits against our refineries by the local public or organized public interest groups. In July 2016, the EPA issued a final rule providing refiners an additional 18 months to comply with a small subset of the rules related to air emissions resulting from startup, shutdown and maintenance events. More recently, in December 2016, the EPA granted petitions for reconsideration from industry and environmental organizations on aspects of the rule related to work practice standards, as well as fence line monitoring requirements. To date, EPA has not published revised rules. These new rules, as well as subsequent rulemaking under the CAA or similar laws, or new agency interpretations of existing laws and regulations, may necessitate additional expenditures in future years and result in increased costs on our operations. We do not anticipate that the required capital and operating costs will be material, and do not believe compliance will affect our production capacities or have a material adverse effect upon our business, financial condition or results of operations.
On November 30, 2017, the EPA finalized the renewable fuel obligation for 2018 at essentially the same percentage standards as 2017. The required ethanol volumes exceed the 10% ethanol “blendwall”, requiring increased usage of higher ethanol blends such as E15 and E85. The EPA has historically used its waiver authority to establish volumes lower than the statutory volumes required by the Energy Independence and Security Act ("EISA"), with the exception of the volumes for biomass-based diesel and for ethanol in 2017, but the EPA's interpretation of its waiver authority has been challenged in federal court.
We are unable to blend sufficient quantities of ethanol and biodiesel to meet our renewable fuel obligations and have to purchase RINs, primarily for our El Dorado and Krotz Springs refineries. In early 2017, EPA granted hardship waiver petitions for the El Dorado and Krotz Springs refineries exempting them from the requirements of the renewable fuel standard for the 2016 calendar year. We have applied for a waiver from the 2017 requirements for these refineries but there is no assurance EPA will grant such a waiver.
The EPA issued final rules for gasoline formulation that required the reduction of annual average benzene content by July 1, 2012. It has been necessary for us to purchase credits in the past to fully comply with these content requirements for the Tyler refinery. However, with the addition of the Big Spring and Krotz Springs refineries, we believe we will self-generate most, if not all, credits that are required.
The EPA finalized Tier 3 gasoline rules in March 2014. The final Tier 3 rule requires a reduction in annual average gasoline sulfur content from 30 ppm to 10 ppm and retains the current maximum per-gallon sulfur content of 80 ppm. Larger refineries must comply with the 10 ppm sulfur
27
standard by January 1, 2017, but the final rule provides a three-year waiver period, to January 1, 2020, for small volume refineries that processed less than 75,000 bpd in 2012. All of our refineries met this waiver provision. We anticipate that capital spending at our refineries over the next two to three years to meet these new limits when they become effective will be significant. Some loss of octane may occur as a result of changes in operation of the gasoline desulfurization units but we anticipate this loss will be mitigated through operational adjustments and modifications to other gasoline processes in the refineries. Compliance is not expected to have a material adverse effect on our business, financial condition or results of operations. In April 2016, the EPA issued a final rule requiring small volume refineries that increase their annual average crude processing rate above 75,000 bpd to meet the Tier 3 sulfur limits 30 months from that “disqualifying” date. We do not anticipate that this rule will affect our refineries.
Our operations are also subject to the Federal Clean Water Act (“CWA”), the Oil Pollution Act of 1990 (“OPA-90”) and comparable state and local requirements. The CWA, and similar laws, prohibit any discharge into surface waters, ground waters, injection wells and publicly-owned treatment works, except as allowed by pre-treatment permits and National Pollutant Discharge Elimination System (“NPDES”) permits issued by federal, state and local governmental agencies. The OPA-90 prohibits the discharge of oil into "Waters of the U.S." and requires that affected facilities have plans in place to respond to spills and other discharges. The CWA also regulates filling or discharges to wetlands and other "Waters of the U.S." In 2015, the EPA, in conjunction with the Army Corps of Engineers, issued a final rule regarding the definition of “Waters of the U.S.,” which expanded the regulatory reach of the existing clean water regulations. Although the final rule is currently stayed pending litigation, if the rule becomes enforceable, it could increase costs for expanding our facilities or constructing new facilities, including pipelines. In accordance with a Presidential directive, in June 2017, the EPA and the Department of the Army published a proposal to repeal the 2015 Clean Water Rule.
In recent years, various legislative and regulatory measures to address climate change and greenhouse gas ("GHG") emissions (including carbon dioxide, methane and nitrous oxides) have been discussed or implemented. They include proposed and enacted federal regulation and state actions to develop statewide, regional or nationwide programs designed to control and reduce GHG emissions from fixed sources, such as our refineries, power plants and oil and gas production operations, as well as mobile transportation sources and fuels. EPA rules require us to report GHG emissions from our refinery operations and use of fuel products produced at our refineries on an annual basis. While the cost of compliance with the reporting rule is not material, data gathered under the rule may be used in the future to support additional regulation of GHG. Moreover, the EPA directly regulates GHG emissions from refineries and other major sources through the Prevention of Significant Deterioration (“PSD”) and Federal Operating Permit programs and may require Best Available Control Technology (“BACT”) for GHG emissions above a certain threshold if emissions of other pollutants would otherwise require PSD permitting. While this does not impose any limits or controls on GHG emissions from current operations, GHG emission increases from future projects or operational changes, such as capacity increases, may be impacted and required to meet emission limits or technological requirements pertaining to GHG emissions, such as BACT. We are not aware of any state or regional initiatives, outside of California where we have limited operations, for controlling existing GHG emissions that would affect our refineries.
Although it is not possible to predict the requirements of any GHG legislation that may be enacted, any laws or regulations that may be adopted to restrict or reduce GHG emissions will likely require us to incur increased operating and capital costs and result in decreased demand for our petroleum fuels. In August 2015, the EPA finalized the “Clean Power Plan” requiring states to reduce carbon dioxide emissions from coal fired power plants through a combination of plant closures, switching to renewable energy and natural gas and demand reduction. The Clean Power Plan is currently being litigated in various courts, and the U.S. Supreme Court has stayed implementation pending the outcome of those legal challenges. In October 2017, the EPA proposed to repeal the Clean Power Plan. If ultimately upheld, this rule will not directly affect our operations but could affect the reliability of electricity supply and increase its cost. In prior years, the EPA indicated that it intends to regulate refinery GHG emissions from new and existing sources through a NSPS. However, there is no firm proposal or date for such regulation, and the EPA has said that such a performance standard is not imminent.
The Pipeline and Hazardous Materials Safety Administration ("PHMSA") of the United States Department of Transportation ("DOT") regulates the design, construction, testing, operation, maintenance, reporting and emergency response of crude oil, petroleum product and other hazardous liquids pipelines and other facilities, including certain tank facilities used in the transportation of such liquids. These requirements are complex, subject to change and, in certain cases, can be costly to comply with. We believe our operations are in substantial compliance with these regulations, but cannot be certain that substantial expenditures will not be required to remain in compliance. Moreover, certain of these rules are difficult to insure adequately, and we cannot assure that we will have adequate insurance to address costs and damages from any noncompliance.
The United States Pipeline Safety, Regulatory Certainty and Job Creation Act of 2011 (“Pipeline Safety Act”), finalized in January 2012, increased the maximum civil penalties for certain violations from $100,000 to $200,000 per violation per day and from a total cap of $1 million to $2 million. A number of the provisions of the Pipeline Safety Act have the potential to cause owners and operators of pipeline facilities to incur significant capital expenditures and/or operating costs. In January 2017, PHMSA finalized a new regulation that, once effective, will impose additional responsibilities concerning the operation, maintenance, and inspection of hazardous liquid pipelines; the reporting of pipeline incidents; reference standards for in-line pipeline inspection and the direct assessment of stress corrosion cracking; and other requirements. We intend to adjust our operations, to the extent necessary, in order to comply with the regulations upon their effective date.
28
The DOT has issued guidelines with respect to securing regulated facilities such as our bulk terminals against terrorist attack. We have instituted security measures and procedures in accordance with such guidelines to enhance the protection of certain of our facilities. We cannot provide any assurance that these security measures would fully protect our facilities from an attack.
The Federal Motor Carrier Safety Administration of the DOT regulates safety standards and monitors drivers and equipment of commercial motor carrier fleets. Such standards include vehicle and maintenance inspection requirements, limitations on the number of hours drivers may operate vehicles and financial responsibility requirements. We believe that the operations of our fleet of crude oil and finished products truck transports are substantially in compliance with these regulations and safety requirements.
We have experienced several crude oil releases from pipelines owned by our logistics segment, including, but not limited to, a release at Magnolia Station in March 2013, a release near Fouke, Arkansas in April 2015 and a release near Woodville, Texas in January 2016. In June 2015, the United States Department of Justice notified Delek Logistics that they were pursuing an enforcement action on behalf of the EPA with regard to potential CWA violations arising from the March 2013 Magnolia Station release. We are currently attempting to negotiate a resolution to this matter with the EPA and the ADEQ, which may include monetary penalties and/or other relief. Based on current information available to us, we do not believe the total costs associated with these events, whether alone or in the aggregate, including any fines or penalties, will have a material adverse effect upon our business, financial condition or results of operations.
29
Working Capital
We fund our business operations through cash generated from our operating activities, borrowings under our debt facilities and potential issuances of additional equity and debt securities. For additional information, see Item 7, Management's Discussion and Analysis of Financial Condition and Results of Operations, of this Annual Report on Form 10-K.
Employees
As of
December 31, 2017
, we had
3,941
employees, of whom
1,356
were employed in our refining segment,
304
were employed by Delek for the benefit of our logistics segment,
1,989
were employed in our retail segment and
240
were employed at our corporate office. As of
December 31, 2017
,
176
operations, maintenance and warehouse hourly employees and
38
truck drivers at the Tyler refinery were represented by the United Steel, Paper and Forestry, Rubber, Manufacturing, Energy, Allied Industrial and Service Workers International Union and its Local 202. The Tyler operations, maintenance and warehouse hourly employees are currently covered by a collective bargaining agreement that expires
January 31, 2019
. The Tyler truck drivers are currently covered by a collective bargaining agreement that expires
March 1, 2018
. As of
December 31, 2017
,
175
operations and maintenance hourly employees at the El Dorado refinery were represented by the International Union of Operating Engineers and its Local 381. These employees are covered by a collective bargaining agreement which expires on
August 1, 2021
. As of
December 31, 2017
,
37
of our El Dorado based drivers for Lion Oil Company were represented by the United Steel, Paper and Forestry, Rubber, Manufacturing, Energy, Allied Industrial and Service Workers International Union, American Federation of Labor and Congress of Industrial Organizations ("AFL-CIO"),
29
of our Texas based drivers for Lion Oil Company were represented by the United Steel, Paper and Forestry, Rubber, Manufacturing, Energy, Allied Industrial and Service Workers International Union, AFL - CIO and
4
of our El Dorado refinery warehouse hourly employees were represented by the International Union of Operating Engineers and its Local 381 (but none are currently covered by a collective bargaining agreement). Negotiations toward collective bargaining agreements with the new bargaining units are underway. As of
December 31, 2017
, approximately
138
employees who work at our Big Spring refinery are covered by a collective bargaining agreement that expires
April 1, 2019
. None of our employees in our logistics segment, retail segment or in our corporate office are represented by a union. We consider our relations with our employees to be satisfactory.
Available Information
Our Internet website address is
www.DelekUS.com
. Information contained on our website is not part of this Annual Report on Form 10-K. Our annual reports on Form 10-K, quarterly reports on Form 10-Q, current reports on Form 8-K and any amendments to such reports filed with or furnished to the Securities and Exchange Commission ("SEC") are available on our Internet website in the "Investor Relations" section, free of charge, as soon as reasonably practicable after we file or furnish such material to the SEC. We also post our Corporate Governance Guidelines, Code of Business Conduct & Ethics and the charters of our Board of Directors' committees in the "Corporate Governance" section of our website, accessible by navigating to the "About Us" section on our Internet website. Our governance documents are available in print to any stockholder that makes a written request to the Secretary, Delek US Holdings, Inc., 7102 Commerce Way, Brentwood, Tennessee 37027.
30
Glossary of Terms
The following are definitions of certain industry terms used in this Annual Report on Form 10-K:
Alkylation Unit
- A refinery unit utilizing an acid catalyst to combine smaller hydrocarbon molecules to form larger molecules in the gasoline boiling range to produce a high octane gasoline blendstock, which is referred to as alkylate.
Barrel
- A unit of volumetric measurement equivalent to 42 U.S. gallons.
Biodiesel
- A renewable fuel produced from vegetable oils or animal fats that can be blended with petroleum-derived diesel to produce biodiesel blends for use in diesel engines. Pure biodiesel is referred to as B100, whereas blends of biodiesel are referenced by how much biodiesel is in the blend (e.g., a B5 blend contains five volume percent biodiesel and 95 volume percent ULSD).
Blendstocks
- Various products or intermediate streams that are combined with other components of similar type and distillation range to produce finished gasoline, diesel fuel or other refined products. Blendstocks may include natural gasoline, hydrotreated Fluid Catalytic Cracking Unit gasoline, alkylate, ethanol, reformate, butane, diesel, biodiesel, kerosene, light cycle oil or slurry, among others.
Bpd/bpd
- Barrels per calendar day.
Brent Crude
(Brent)
- a light, sweet crude oil, though not as light as WTI. Brent is the leading global price benchmark for Atlantic basin crude oils.
CBOB
- Motor gasoline blending components intended for blending with oxygenates, such as ethanol, to produce finished conventional motor gasoline.
CERCLA
- Comprehensive Environmental Response, Compensation and Liability Act
Complexity Index
- A measure of secondary conversion capacity of a refinery relative to its primary distillation capacity. Generally, more complex refineries have a higher index number.
Crude Distillation Capacity, Nameplate Capacity or Production Capacity
- The maximum sustainable capacity for a refinery or process unit for a given feedstock quality and severity level, measured in barrels per day.
Cushing
- Cushing, Oklahoma
Delayed Coking Unit (Coker)
- A refinery unit that processes ("cracks") heavy oils, such as the bottom cuts of crude oil from the crude or vacuum units, to produce blendstocks for light transportation fuels or feedstocks for other units and petroleum coke.
Direct operating expenses -
operating expenses attributed to the respective segment.
EISA
- Energy Independence and Security Act of 2007.
Enterprise Pipeline System
- a major product pipeline transport system that reaches from the Gulf Coast into the northeastern United States.
EPA -
The Environmental Protection Agency.
Ethanol
- An oxygenated blendstock that is blended with sub-grade (CBOB) or conventional gasoline to produce a finished gasoline.
E-10
- A 90% gasoline-10% ethanol blend.
E-15
- An 85% gasoline-15% ethanol blend.
E-85
- A blend of gasoline and 70%-85% ethanol.
FERC -
The Federal Energy Regulatory Commission.
FIFO
- First-in, first-out inventory accounting method.
31
Fluid Catalytic Cracking Unit or FCC Unit
- A refinery unit that uses fluidized catalyst at high temperatures to crack large hydrocarbon molecules into smaller, higher-valued molecules (LPG, gasoline, LCO, etc.).
Feedstocks
- Crude oil and petroleum products used as inputs in refining processes.
Gulf Coast 2-1-1 crack spread
- A crack spread reflecting the approximate gross margin resulting from processing one barrel of crude oil into one-half of a barrel of gasoline and one-half of a barrel of high sulfur diesel, utilizing the market prices of LLS crude oil, Gulf Coast Pipeline conventional gasoline and Gulf Coast Pipeline No. 2 Heating Oil.
Gulf Coast 3-2-1 crack spread
- A crack spread reflecting the approximate gross margin resulting from processing one barrel of crude oil into two-thirds of a barrel of gasoline and one-third of a barrel of ultra-low sulfur diesel, utilizing the market prices of WTI crude oil, Gulf Coast Pipeline conventional gasoline and Gulf Coast Pipeline ultra-low sulfur diesel.
Gulf Coast 5-3-2 crack spread
- A crack spread reflecting the approximate gross margin resulting from processing one barrel of crude oil into three-fifths of a barrel of gasoline and two-fifths of a barrel of high sulfur diesel, utilizing the market prices of WTI crude oil, Gulf Coast Pipeline CBOB and Gulf Coast Pipeline No. 2 Heating Oil.
Gulf Coast Pipeline CBOB
- A grade of gasoline blendstock that must be blended with 10% biofuels in order to be marketed as Regular Unleaded at retail locations.
Gulf Coast Pipeline No. 2 Heating Oil -
A petroleum distillate that can be used as either a diesel fuel or a fuel oil. This is the standard by which other Gulf Coast distillate products (such as ultra-low sulfur diesel) are priced.
Gulf Coast Region
- Commonly referred to as PADD III, includes the states of Texas, Arkansas, Louisiana, Mississippi, Alabama and New Mexico.
HLS
- Heavy Louisiana Sweet crude oil; typical API gravity of 33° and sulfur content of 0.35%.
Hydrotreating Unit
- A refinery unit that removes sulfur and other contaminants from hydrocarbons at high temperatures and moderate to high pressure in the presence of catalysts and hydrogen. When used to process fuels, this unit reduces the sulfur dioxide emissions from these fuels.
Isomerization Unit -
A refinery unit altering the arrangement of a molecule in the presence of a catalyst and hydrogen to produce a more valuable molecule, typically used to increase the octane of gasoline blendstocks.
Jobbers
- Retail stations owned by third parties that sell products purchased from or through us.
LPG
- Liquefied petroleum gas.
Light/Medium/Heavy Crude Oil
- Terms used to describe the relative densities of crude oil, normally represented by their API gravities. Light crude oils (those having relatively high API gravities) may be refined into a greater amount of valuable products and are typically more expensive than a heavier crude oil.
LLS
- Light Louisiana Sweet crude oil; typical API gravity of 38° and sulfur content of 0.34%.
LSR -
Light straight run naphtha.
LIFO
- Last-in, first-out inventory accounting method.
Mid-Continent Region
- Commonly referred to as PADD II, includes the states of North Dakota, South Dakota, Nebraska, Kansas, Oklahoma, Minnesota, Iowa, Missouri, Wisconsin, Illinois, Michigan, Indiana, Ohio, Kentucky and Tennessee.
Midland
- Midland, Texas
MSCF/d -
Abbreviation for a thousand standard cubic feet per day, a common measure for volume of natural gas.
Naphtha
- A hydrocarbon fraction that is used as a gasoline blending component, a feedstock for reforming and as a petrochemical feedstock.
NGL
- Natural gas liquids.
32
New York Mercantile Exchange (NYMEX) -
A commodities futures exchange.
Operating margin
- net sales less cost of goods sold.
OSHA -
the Occupational Safety and Health Administration.
Petroleum Administration for Defense District
(PADD)
- Any of five regions in the United States as set forth by the Department of Energy and used throughout the oil industry for geographic reference. Our refineries operate in PADD III, commonly referred to as the Gulf Coast Region.
Petroleum Coke
- A coal-like substance produced as a byproduct during the Delayed Coking refining process.
Per barrel of sales -
calculated by dividing the applicable income statement line item (operating margin or operating expenses) by the total barrels sold during the period.
PPB -
parts per billion.
PPM -
parts per million.
RCRA
- Resource Conservation and Recovery Act.
Refining margin, refined product margin or crack spread -
A metric used in the refining industry to assess a refinery's product margins by comparing the difference between the price of refined products produced at the refinery and the price of crude oil required to produce those products.
Reforming Unit -
A refinery unit that uses high temperature, moderate pressure and catalyst to create petrochemical feedstocks, high octane gasoline blendstocks and hydrogen.
Renewable Fuels Standard 2 (RFS-2)
- An EPA regulation promulgated pursuant to the EISA, which requires most refineries to blend increasing amounts of renewable fuels (including biodiesel and ethanol) with refined products.
Renewable Identification Number (RIN) -
a renewable fuel credit used to satisfy requirements for blending renewable fuels under RFS-2.
Roofing flux -
An asphalt-like product used to make roofing shingles for the housing industry.
Straight run -
product produced off of the crude or vacuum unit and not further processed.
Sweet/Sour crude oil
- Terms used to describe the relative sulfur content of crude oil. Sweet crude oil is relatively low in sulfur content; sour crude oil is relatively high in sulfur content. Sweet crude oil requires less processing to remove sulfur and is typically more expensive than sour crude oil.
Throughput
- The quantity of crude oil and feedstocks processed through a refinery or a refinery unit.
Turnaround
- A periodic shutdown of refinery process units to perform routine maintenance to restore the operation of the equipment to its former level of performance. Turnaround activities normally include cleaning, inspection, refurbishment, and repair and replacement of equipment and piping. It is also common to use turnaround periods to change catalysts or to implement capital project improvements.
Ultra-Low Sulfur Diesel (ULSD)
- Diesel fuel produced with a lower sulfur content (15 ppm) to reduce sulfur dioxide emissions. ULSD is the only diesel fuel that may be used for on-road and most other applications in the U.S.
UST
- Underground storage tank.
Vacuum Distillation Unit
- A refinery unit that distills heavy crude oils under deep vacuum to allow their separation without coking.
West Texas Intermediate Crude Oil (WTI)
- A light, sweet crude oil characterized by an API gravity between 38 and 44 and a sulfur content of less than 0.4 weight percent that is used as a benchmark for other crude oils.
West Texas Sour Crude Oil (WTS)
- A sour crude oil, characterized by an API gravity between 30° and 33° and a sulfur content of approximately 1.28 weight percent that is used as a benchmark for other sour crudes.
33
ITEM 1A.
RISK FACTORS
We are subject to numerous known and unknown risks, many of which are presented below and elsewhere in this Annual Report on Form 10-K. You should carefully consider each of the following risks and all of the other information contained in this Annual Report on Form 10-K in evaluating us and our common stock. Any of the risk factors described below, or additional risks and uncertainties not presently known to us, or that we currently deem immaterial, could have a material adverse effect on our business, financial condition and results of operations. The headings provided in this Item 1A are for convenience and reference purposes only and shall not limit or otherwise affect the extent or interpretation of the risk factors.
Risks Relating to Our Industries
Our refining margins have been volatile and are likely to remain volatile, which may have a material adverse effect on our earnings and cash flows.
Our earnings, cash flow and profitability from our refining operations are substantially determined by the difference between the market price of refined products and the market price of crude oil, which is referred to as the crack spread, refining margin or refined products margin. Refining margins historically have been volatile, and are likely to continue to be volatile, as a result of numerous factors beyond our control, including volatility in the prices of the various types of crude oil and other feedstocks purchased by our refineries, volatility in the costs of natural gas and electricity used by our refineries, and volatility in the prices of gasoline and other refined petroleum products sold by our refineries. Although we monitor our refinery operating margins and seek to optimize results by adjusting throughput volumes, throughput types and product slates, there are inherent limitations on our ability to offset the effects of adverse market conditions.
For example, although there are differences between published prices and margins and those realized in our operations, certain published data illustrate the volatility we encounter. The NYMEX price for domestic light sweet crude oil (NYMEX: CL), the Argus price for WTI Midland crude oil, the Gulf Coast price for unleaded gasoline (Platts Gulf Coast CBOB), the Gulf Coast price for high sulfur diesel (Platts Gulf Coast Pipeline High Sulfur No. 2 Diesel), the Gulf Coast 5-3-2 crack spread and the differential between the price of NYMEX crude oil and Intercontinental Exchange ("ICE") Brent Crude Oil (ICE: B) have fluctuated between the following daily highs and lows during the preceding three calendar years:
|
Year Ended
|
||||||||||||||||||
|
December 31, 2017
|
December 31, 2016
|
December 31, 2015
|
||||||||||||||||
|
Low
|
High
|
Low
|
High
|
Low
|
High
|
|||||||||||||
|
NYMEX crude oil (per barrel)
|
$
|
42.37
|
|
$
|
60.42
|
|
$
|
26.21
|
|
$
|
54.06
|
|
$
|
34.73
|
|
$
|
61.43
|
|
|
WTI — Midland crude oil (per barrel)
|
$
|
41.56
|
|
$
|
61.03
|
|
$
|
26.45
|
|
$
|
54.77
|
|
$
|
35.17
|
|
$
|
61.23
|
|
|
Gulf Coast CBOB (per gallon)
|
$
|
1.31
|
|
$
|
2.03
|
|
$
|
0.75
|
|
$
|
1.65
|
|
$
|
1.07
|
|
$
|
2.01
|
|
|
Gulf Coast High Sulfur Diesel (per gallon)
|
$
|
1.18
|
|
$
|
1.86
|
|
$
|
0.74
|
|
$
|
1.53
|
|
$
|
0.82
|
|
$
|
1.84
|
|
|
Gulf Coast crack spread (per barrel)
|
$
|
7.67
|
|
$
|
30.44
|
|
$
|
4.38
|
|
$
|
14.16
|
|
$
|
3.46
|
|
$
|
23.55
|
|
|
WTI — Cushing/Brent crude oil differential (per barrel)
|
$
|
2.45
|
|
$
|
6.60
|
|
$
|
1.67
|
|
$
|
2.76
|
|
$
|
1.38
|
|
$
|
6.34
|
|
Such volatility is affected by, among other things:
|
•
|
changes in global and local economic conditions;
|
|
•
|
domestic and foreign supply and demand for crude oil and refined products;
|
|
•
|
the level of foreign and domestic production of crude oil and refined petroleum products;
|
|
•
|
increased regulation of feedstock production activities, such as hydraulic fracturing;
|
|
•
|
infrastructure limitations that restrict, or events that disrupt, the distribution of crude oil, other feedstocks and refined petroleum products;
|
|
•
|
an increase or decrease of infrastructure limitations (or the perception that such an increase or decrease could occur) on the distribution of crude oil, other feedstocks or refined products;
|
|
•
|
investor speculation in commodities;
|
|
•
|
worldwide political conditions, particularly in significant oil producing regions such as the Middle East, Africa, the former Soviet Union and South America;
|
|
•
|
the ability of the members of the Organization of Petroleum Exporting Countries to maintain oil price and production controls;
|
|
•
|
pricing and other actions taken by competitors that impact the market;
|
|
•
|
the level of crude oil, other feedstocks and refined petroleum products imported into and exported out of the United States;
|
|
•
|
excess capacity and utilization rates of refineries worldwide;
|
|
•
|
development and marketing of alternative and competing fuels, such as ethanol and biodiesel;
|
34
|
•
|
changes in fuel specifications required by environmental and other laws, particularly with respect to oxygenates and sulfur content;
|
|
•
|
local factors, including market conditions, adverse weather conditions and the level of operations of other refineries and pipelines in our markets;
|
|
•
|
accidents, interruptions in transportation, inclement weather or other events that can cause unscheduled shutdowns or otherwise adversely affect our refineries or the supply and delivery of crude oil from third parties; and
|
|
•
|
United States government regulations.
|
The crude oil we purchase, and the refined products we sell, are commodities whose prices are mainly determined by market forces beyond our control. While an increase or decrease in the price of crude oil will often result in a corresponding increase or decrease in the wholesale price of refined products, a change in the price of one commodity does not always result in a corresponding change in the other. A substantial or prolonged increase in crude oil prices without a corresponding increase in refined product prices, or a substantial or prolonged decrease in refined product prices without a corresponding decrease in crude oil prices, could also have a significant negative effect on our results of operations and cash flows. This is especially true for non-transportation refined products, such as asphalt, butane, coke, sulfur, propane and slurry, whose prices are less likely to correlate to fluctuations in the price of crude oil, all of which we produce at our refineries.
Also, the price for a significant portion of the crude oil processed at our refineries is based upon the WTI benchmark for such oil rather than the Brent benchmark. While the prices for WTI and Brent historically correlate to one another, elevated supply of WTI-priced crude oil in the Mid-Continent region has caused WTI prices to fall significantly below Brent prices at different points in time in recent years. During the years ended
December 31, 2016
and
December 31, 2017
, this daily differential ranged from highs of
$2.76
and
$6.60
, respectively, to lows of
$1.67
and
$2.45
, respectively. Our ability to purchase and process favorably priced crude oils has allowed us to achieve higher net income and cash flow in recent years; however, we cannot assure that these favorable conditions will continue. A substantial or prolonged narrowing in (or inversion to) the price differential between the WTI and Brent benchmarks for any reason, including, without limitation, increased crude oil distribution capacity from the Permian Basin, crude oil exports from the United States or actual or perceived reductions in Mid-Continent crude oil inventories, could negatively impact our earnings and cash flows. In addition, because the premium or discount we pay for a portion of the crude oil processed at our refineries is established based upon this differential during the month prior to the month in which the crude oil is processed, rapid decreases in the differential may negatively affect our results of operations and cash flows.
We operate in a highly regulated industry and increased costs of compliance with, or liability for violation of, existing or future laws, regulations and other requirements could significantly increase our costs of doing business, thereby adversely affecting our profitability.
Our industry is subject to extensive laws, regulations, permits and other requirements including, but not limited to, those relating to the environment, fuel composition, safety, transportation, pipeline tariffs, employment, labor, immigration, minimum wages, overtime pay, health care benefits, working conditions, public accessibility, retail fuel pricing, the sale of alcohol and tobacco and other requirements. These permits, laws and regulations are enforced by federal agencies including the EPA, United States Department of Transportation, Pipeline and Hazardous Materials Safety Administration, Federal Motor Carrier Safety Administration, Federal Railroad Administration, OSHA, National Labor Relations Board, Equal Employment Opportunity Commission, Federal Trade Commission and FERC, and numerous other state and federal agencies. We anticipate that compliance with environmental, health and safety regulations could require us to spend significant amounts in capital costs during the next five years. These estimates do not include amounts related to capital investments that management has deemed to be strategic investments. These amounts could materially change as a result of governmental and regulatory actions.
Various permits, licenses, registrations and other authorizations are required under these laws for the operation of our refineries, terminals, pipelines, retail locations and related operations, and these permits are subject to renewal and modification that may require operational changes involving significant costs. If key permits cannot be renewed or are revoked, the ability to continue operation of the affected facilities could be threatened.
Ongoing compliance with, or violation of, laws, regulations and other requirements could also have a material adverse effect on our business, financial condition and results of operations. We face potential exposure to future claims and lawsuits involving environmental matters, including, but not limited to, soil, groundwater and waterway contamination, air pollution, personal injury and property damage allegedly caused by substances we manufactured, handled, used, released or disposed. We are, and have been, the subject of various state, federal and private proceedings relating to environmental regulations, conditions and inquiries.
In addition, new legal requirements, new interpretations of existing legal requirements, increased legislative activity and governmental enforcement and other developments could require us to make additional unforeseen expenditures. Companies in the petroleum industry, such as us, are often the target of activist and regulatory activity regarding pricing, safety, environmental compliance, derivatives trading and other business practices, which could result in price controls, fines, increased taxes or other actions affecting the conduct of our business. For example, consumer activists are lobbying various authorities to enact laws and regulations mandating the removal of tetra-ethyl lead from aviation gasoline. Other activists seek to require reductions in GHG emissions from our refineries and fuel products, and are increasingly protesting new energy infrastructure projects, such as pipelines and crude by rail facilities. The specific impact of laws and regulations or other actions may vary depending
35
on a number of factors, including the age and location of operating facilities, marketing areas, crude oil and feedstock sources and production processes.
We generate wastes that may be subject to RCRA and comparable state and local requirements. The EPA and various state agencies have limited the approved methods of managing, transporting, recycling and disposal of hazardous and certain non-hazardous wastes. Our refineries are large quantity generators of hazardous waste and require hazardous waste permits issued by the EPA or state agencies. Additionally, certain of our other facilities, such as terminals and biodiesel plants, generate lesser quantities of hazardous wastes.
Under RCRA, CERCLA and other federal, state and local environmental laws, as the owner or operator of refineries, biodiesel plants, bulk terminals, pipelines, tank farms, rail cars, trucks and retail locations, we may be liable for the costs of removal or remediation of contamination at our existing or former locations, whether we knew of, or were responsible for, the presence of such contamination. We have incurred such liability in the past, and several of our current and former locations are the subject of ongoing remediation projects. The failure to timely report and properly remediate contamination may subject us to liability to third parties and may adversely affect our ability to sell or rent our property or to borrow money using our property as collateral. Additionally, persons who arrange for the disposal or treatment of hazardous substances also may be liable for the costs of removal or remediation of these substances at sites where they are located, regardless of whether the site is owned or operated by that person. We typically arrange for the treatment or disposal of hazardous substances generated by our refining and other operations. Therefore, we may be liable for removal or remediation costs associated with releases of these substances at third party locations, as well as other related costs, including fines, penalties and damages resulting from injuries to persons, property and natural resources. Our El Dorado refinery is a minor potentially responsible party at a Superfund site, for which we expect our costs to be non-material. In the future, we may incur substantial expenditures for investigation or remediation of contamination that has not been discovered at our current or former locations or locations that we may acquire or at third party sites where hazardous substances from these locations have been treated or disposed.
Our operations are subject to certain requirements of the federal Clean Air Act (“CAA”), as well as related state and local laws and regulations governing air emissions. Certain CAA regulatory programs applicable to our refineries, terminals and other operations require capital expenditures for the installation of air pollution control devices, operational procedures to minimize emissions and monitoring and reporting of emissions. In 2012, the EPA announced an industry-wide enforcement initiative directed at flaring operations and performance at refineries and petrochemical plants and finalized revisions to NSPS Subpart Ja that primarily affects flares and process heaters. We completed capital and other projects at our refineries related to flare compliance with NSPS Ja in 2015 and 2016.
Our recently acquired Big Spring refinery has been negotiating an agreement with the EPA for over 10 years under EPA’s National Petroleum Refinery Initiative, regarding alleged historical violations of the CAA. A Consent Decree resolving these alleged historical violations for the Big Spring refinery was lodged with the United States District Court for the Northern District of Texas on June 6, 2017, and we expect that Consent Decree to become final in 2018. If finalized as originally lodged, the Consent Decree will require payment of a $456,250 civil penalty and capital expenditures for pollution control equipment that may be significant over the next 5 years. According to the EPA, approximately 95% of the nation's refining capacity has entered into "global" settlements under the EPA National Refinery Initiative. Our El Dorado and Tyler refineries entered into similar global settlements in 2002 and 2009. A similar Consent Decree covering the Krotz Springs refinery entered into in 2005 by a previous owner was terminated by the court in October 2017.
In 2015, the EPA finalized reductions in the National Ambient Air Quality Standard ("NAAQS") for ozone, from 75 ppb to 70 ppb. Our Tyler refinery is likely to be located in an area likely to be reclassified as non-attainment with the new standard. While we do not yet know what specific actions we will be required to take or when, it is possible we will have to install additional air pollution control equipment for ozone forming emissions or change the formulation of gasoline we make for use in some areas. We do not believe such capital expenditures or the changes in our operation will result in a material adverse effect on our business.
In late 2015, the EPA finalized additional rules regulating refinery air emissions from a variety of sources (such as cokers, flares, tanks and other process units) through additional NSPS and National Emission Standards for Hazardous Air Pollutants and changing the way emissions from startup, shutdown and malfunction operations are regulated (the "Refinery Risk and Technology Review Rules" or “RTR”). The RTR rule also requires that, starting in January 2018, we monitor property line benzene concentrations at our refineries, and, starting in 2019, report those concentrations quarterly to the EPA, which will make the results available to the public. Even though the concentrations are not expected to exceed regulatory or health based standards, the availability of such data may increase the likelihood of lawsuits against our refineries by the local public or organized public interest groups. Compliance with the RTR rules will require additional capital projects and changes in the way we operate some equipment over the next three years, but is not expected to have a material adverse effect on our business, financial condition or results of operations.
In addition to our operations, many of the fuel products we manufacture are subject to requirements of the CAA, as well as related state and local laws and regulations. The EPA has the authority, under the CAA, to modify the formulation of the refined transportation fuel products we manufacture, in order to limit the emissions associated with their final use.
In 2007, the EPA issued final Mobile Source Air Toxic II rules for gasoline formulation that required the reduction of annual average benzene content by July 1, 2012. We have purchased credits in the past to comply with
36
these content requirements for two of our refineries. Although credits have been readily available, there can be no assurance that such credits will continue to be available for purchase at reasonable prices, or at all, and we could have to implement capital projects in the future to reduce benzene levels.
In March 2014, the EPA issued final Tier 3 gasoline rules that require a reduction in annual average gasoline sulfur content from 30 ppm to 10 ppm by January 1, 2017 for "large refineries" and retains the current maximum per-gallon sulfur content limit of 80 ppm. Under the final rules, all of our refineries are considered “small refineries” and are exempt from complying with the rules' requirements until January 1, 2020. We anticipate that our refineries will meet these new limits when they become effective and that capital spending at our refineries over the next two to three years to achieve compliance by the effective date may be significant. In April 2016, the EPA finalized a change to the Tier 3 standard, requiring small volume refineries that increase their annual average crude processing rate above 75,000 bpd to meet the Tier 3 sulfur limits 30 months from that “disqualifying” date. We do not anticipate that this rule change will affect our refineries.
Our operations are also subject to the federal Clean Water Act (“CWA”), the Oil Pollution Act of 1990 (“OPA-90”) and comparable state and local requirements. The CWA and similar laws prohibit any discharge into surface waters, ground waters, injection wells and publicly-owned treatment works, except as allowed by pre-treatment permits and National Pollutant Discharge Elimination System (“NPDES”) permits, issued by federal, state and local governmental agencies. The OPA-90 prohibits the discharge of oil into "Waters of the U.S." and requires that affected facilities have plans in place to respond to spills and other discharges. The CWA also regulates filling or discharges to wetlands and other "Waters of the U.S." In 2015, the EPA, in conjunction with the Army Corps of Engineers, issued a final rule regarding the definition of “Waters of the U.S.,” which expanded the regulatory reach of the existing clean water regulations. The agencies adopted a rule on February 6, 2018 delaying the applicability of the rule nationwide until February 6, 2020, while the agencies consider redefining the scope of CWA jurisdiction through additional rulemaking as directed in an Executive Order released February 28, 2017. The rule delaying applicability until 2020, however, has been challenged in federal courts. Although whether and when this final rule will take effect is currently the subject of this and other pending litigation, if the rule becomes enforceable, it could increase costs for expanding our facilities or constructing new facilities, including pipelines.
We are subject to regulation by the United States Department of Transportation and various state agencies in connection with our pipeline, trucking and rail transportation operations. These regulatory authorities exercise broad powers, governing activities such as the authorization to operate hazardous materials pipelines and engage in motor carrier operations. There are additional regulations specifically relating to the transportation industry, including integrity management of pipelines, testing and specification of equipment, product handling and labeling requirements and personnel qualifications. The transportation industry is subject to possible regulatory and legislative changes that may affect the economics of our business by requiring changes in operating practices or pipeline construction or by changing the demand for common or contract carrier services or the cost of providing trucking services. Possible changes include, among other things, increasingly stringent environmental regulations, increased frequency and stringency for testing and repairing pipelines, replacement of older pipelines, changes in the hours of service regulations that govern the amount of time a driver may drive in any specific period, on-board black box recorder devices or limits on vehicle weight and size and properties of the materials that can be shipped. Required changes to the specifications governing rail cars carrying crude oil will eliminate the most commonly used tank car or require that such cars be upgraded. In January 2017, PHMSA announced they were considering limits on the volatility of crude oil that could be shipped by rail and other modes of transportation. These rules could limit the availability of tank cars to transport crude to our refineries and increase the cost of crude oil transported by rail or truck. In addition to the substantial remediation costs that could be caused by leaks or spills from our pipelines, regulators could prohibit our use of affected portions of the pipeline for extended periods, thereby interrupting the delivery of crude oil to, or the distribution of refined products from, our refineries.
Our operations are subject to various laws and regulations relating to occupational health and safety and process safety administered by OSHA, EPA and various state equivalent agencies. We maintain safety, training, design standards, mechanical integrity and maintenance programs as part of our ongoing efforts to ensure compliance with applicable laws and regulations and protect the safety of our workers and the public. More stringent laws or regulations or adverse changes in the interpretation of existing laws or regulations by government agencies could have an adverse effect on our financial position and the results of our operations and could require substantial expenditures for the installation and operation of systems and equipment.
Health and safety legislation and regulations change frequently. We cannot predict what additional health and safety legislation or regulations will be enacted or become effective in the future or how existing or future laws or regulations will be administered or interpreted with respect to our operations. Compliance with applicable health and safety laws and regulations has required, and continues to require, substantial expenditures. Future process safety rules could also mandate changes to the way we operate, the processes and chemicals we use and the materials from which our process units are constructed. Such regulations could have a significant negative effect on our operations and profitability. For example, in response to Executive Order 13650, Improving Chemical Facility Safety and Security, OSHA announced it intends to propose comprehensive changes to the process safety requirements, although they have not yet formally proposed any revisions. In January 2017, the EPA finalized changes to process safety requirements in its Risk Management Program rules that require evaluation of safer alternatives and technologies, expanded routine audits, independent third-party audits following certain process safety events and increased sharing of information with the public and emergency response organizations. Pending reconsideration of this rule, the EPA has subsequently delayed the effective date until 2019. In January 2017, OSHA announced changes to its National Emphasis Program, and specifically identified oil refineries as facilities for increased
37
inspections. The changes also instruct inspectors to use data gathered from EPA Risk Management Plan inspections to identify refiners for additional Process Safety Management inspections.
Environmental regulations are becoming more stringent, and new environmental and safety laws and regulations are continuously being enacted or proposed. Compliance with any future legislation or regulation of our produced fuels, including renewable fuel or carbon content; GHG emissions; sulfur, benzene or other toxic content; vapor pressure; octane; or other fuel characteristics, may result in increased capital and operating costs and may have a material adverse effect on our results of operations and financial condition. While it is impractical to predict the impact that potential regulatory and activist activity may have, such future activity may result in increased costs to operate and maintain our facilities, as well as increased capital outlays to improve our facilities. Such future activity could also adversely affect our ability to expand production, result in damaging publicity about us, or reduce demand for our products. Our need to incur costs associated with complying with any resulting new legal or regulatory requirements that are substantial and not adequately provided for, could have a material adverse effect on our business, financial condition and results of operations.
Our operating responsibility for bulk product terminals and refined product pipelines includes responsibility to ensure the quality and purity of the products loaded at our loading racks. If our quality control measures were to fail, we may have contaminated or off-specification products in pipelines and storage tanks or off-specification product could be sent to public gasoline stations. These types of incidents could result in product liability claims from our customers, as well as negative publicity. Product liability is a significant commercial risk. Substantial damage awards have been made in certain jurisdictions against manufacturers and resellers based upon claims for injuries caused by the use of or exposure to various products. There can be no assurance that product liability claims against us would not have a material adverse effect on our business or results of operations or our ability to maintain existing customers or retain new customers.
The Dodd-Frank Wall Street Reform and Consumer Protection Act (the "Dodd-Frank Act") is comprehensive financial reform legislation that, among other things, establishes comprehensive federal oversight and regulation of over-the-counter derivatives and many of the entities that participate in that market. Although the Dodd-Frank Act was enacted on July 21, 2010, the Commodity Futures Trading Commission, or CFTC, and the SEC, along with certain other regulators, must promulgate final rules and regulations to implement many of the Dodd-Frank Act's provisions relating to over-the-counter derivatives. While some of these rules have been finalized, others have not; and, as a result, the final form and timing of the implementation of the new regulatory regime affecting commodity derivatives remains uncertain.
Finally, the Patient Protection and Affordable Care Act (the “ACA”), as well as other health care reform legislation being considered by Congress and state legislatures, may have an impact on our business. Although many of the rules, reforms and regulations required to implement the ACA have not yet been adopted, and consequently the precise costs of complying with the ACA remain unknown, an increase in our employee healthcare-related costs appears likely and that increase could be extensive and changes to our healthcare cost structure could have a significant, negative impact on our business.
Increased supply of and demand for alternative transportation fuels, increased fuel economy standards and increased use of alternative means of transportation could lead to a decrease in transportation fuel prices and/or a reduction in demand for petroleum-based transportation fuels. A shortage of RINs could require that our refineries operate at reduced production rates or require us to incur a high cost to meet our RINs obligations that might not be recoverable in the price of our products.
Pursuant to the EISA, the EPA promulgated RFS-2 requiring refiners to blend "renewable fuels", such as ethanol, biodiesel and other advanced biofuels, with their petroleum fuels or purchase RINs in lieu of blending. The volume of renewable fuels required by the EISA increased from 9 billion gallons in 2008 to 22 billion gallons in 2016 and to 36 billion gallons in 2022. The EPA has set annual volumes beneath these statutory levels each year because of the unavailability of certain advanced biofuels and to avoid exceeding 10% ethanol in the gasoline supply (the "blendwall"), but this decision has been challenged in federal court. Annually, the EPA establishes the volume of renewable fuels that refineries must blend into their finished petroleum fuels, as a percentage of their domestic gasoline and diesel sales, based on estimated demand for gasoline and diesel and the final biofuel volumes established by the EPA each year. Meeting RFS-2 requires displacing increasing amounts of petroleum-based transportation fuels with biofuels, beginning with approximately 7.8% in 2011, 10.1% in 2016 and 10.7% in 2017 and 2018.
While we are able to obtain many of the RINs required for compliance by blending renewable fuels manufactured by third parties or by our own biodiesel plants, we must also purchase RINs on the open market. If we are unable to pass the costs of compliance with RFS-2 on to our customers, our profits will be adversely impacted. Moreover, the market prices for RINs have been volatile. If we have to pay a significantly higher price for RINs, if sufficient RINs are unavailable for purchase or if we are otherwise unable to meet the RFS-2 mandates, our business, financial condition and results of operations could be materially adversely affected.
Meeting the RFS-2 volume requirements will require more ethanol to be blended than can be achieved with 10% ethanol gasoline blends (E-10). Since 2016, the volumes of ethanol required to meet the requirements exceed 10% ethanol in the nationwide gasoline pool. In 2011, the EPA approved E-15 for use in model year 2001 and later vehicles. However, studies show that E-15 may cause engine and fuel system damage, and most vehicle manufacturers do not recommend using E-15 in vehicles manufactured prior to 2013 or 2014, other than "Flex Fuel" vehicles.
38
In addition, most existing underground storage tanks and retail dispenser systems are not certified by Underwriters Laboratory, local fire codes or the EPA for use with gasoline blends containing more than 10% ethanol. Flex Fuel vehicles can utilize higher ethanol blends up to E-85, but there are relatively few such vehicles on the road, there are few E-85 retail locations and the use of E-85 results in significant reductions in fuel economy. Because of its volatility, there are restrictions on selling E-15 during the summer months. These and other impediments may present challenges to blending the required volumes of ethanol. If adequate supplies of the required types of biofuels are unavailable in volumes sufficient to meet our requirement, if we are unable to physically blend the required biofuel volumes without exceeding 10% ethanol or if RINs are not available in sufficient volumes or at economical prices, refinery production or profitability could be negatively affected.
In addition, as regulatory initiatives have required an increase in the consumption of renewable transportation fuels, such as ethanol and biodiesel, consumer acceptance of electric, hybrid and other alternative vehicles is increasing. Increased use of renewable fuels and alternative vehicles may result in a decrease in demand for petroleum-based transportation fuels. Increased use of renewable fuels may also result in an increase in transportation fuel supply relative to decreased demand and a corresponding decrease in margins. A significant decrease in transportation fuel margins or demand for petroleum-based transportation fuels could have an adverse impact on our financial results. As described above, RFS-2 requires replacement of increasing amounts of petroleum-based transportation fuels with biofuels through 2022. RFS-2 and widespread use of E-15 or E-85 could cause decreased crude runs and materially affect our profitability, unless fuel demand rises at a comparable rate or other outlets are found for the displaced petroleum products.
In September 2012, the EPA and the National Highway Traffic Safety Administration ("NHTSA") finalized rules raising the required Corporate Average Fuel Economy ("CAFE") and GHG standards for passenger vehicles beginning with 2017 model year vehicles and increasing to the equivalent of 54.5 mpg by 2025. These standards were reaffirmed by the EPA in January 2017, although the EPA is currently reviewing that decision. Additional increases in fuel efficiency standards for medium and heavy duty vehicles were finalized in August 2016. Such increases in fuel economy standards and potential electrification of the vehicle fleet, along with mandated increases in use of renewable fuels discussed above, could result in decreasing demand for petroleum fuels, which, in turn, could materially affect profitability at our refineries.
To meet higher fuel efficiency and GHG emission standards for passenger vehicles, automobile manufacturers are increasingly using technologies, such as turbocharging, direct injection and higher compression ratios that require high octane gasoline. Many auto manufacturers have expressed a desire that only a high-octane grade of gasoline be allowed in order to maximize fuel efficiency, rather than the three octane grades common now. Regulatory changes allowing only one high-octane grade, or significant increases in market demand for high-octane fuel, could result in a shift to high-octane ethanol blends containing 25% - 30% ethanol, the need for capital expenditures at our refineries to increase octane or reduced demand for petroleum fuels, which could materially affect profitability of our refineries.
We operate independent refineries which may not be able to withstand volatile market conditions, compete on the basis of price or obtain sufficient quantities of crude oil in times of shortage to the same extent as integrated, multinational oil companies.
We compete with a broad range of companies in our refining and petroleum product marketing operations. Many of these competitors are integrated, multinational oil companies that are substantially larger than us. Because of their diversity, integration of operations, larger capitalization, larger and more complex refineries and greater resources, these companies may be better able to withstand volatile market conditions relating to crude oil and refined product pricing, to compete on the basis of price and to obtain crude oil in times of shortage.
We do not engage in petroleum exploration or production, and therefore do not produce any of our crude oil feedstocks. Certain of our competitors, however, obtain a portion of their feedstocks from company-owned production activities. Competitors that have their own crude oil production are at times able to offset losses from refining operations with profits from producing operations, and may be better positioned to withstand periods of depressed refining margins or feedstock shortages. If we are unable to compete effectively with these competitors, there could be a material adverse effect on our business, financial condition and results of operations.
Our retail segment is subject to loss of market share or pressure to reduce prices in order to compete effectively with a changing group of competitors in a fragmented retail industry.
The markets in which we operate our retail fuel and convenience stores are highly competitive and characterized by ease of entry and constant change in the number and type of retailers offering the products and services found in our stores. We compete with other convenience store chains, gas stations, supermarkets, drug stores, discount stores, dollar stores, club stores, mass merchants, fast food operations, independent owner-operators and other retail outlets. In some of our markets, our competitors have been in existence longer and have greater financial, marketing and other resources than us. In addition, independent owner-operators can generally operate stores with lower overhead costs than ours. As a result, our competitors may be able to respond better to changes in the economy and new opportunities within the industry.
Several non-traditional retailers, such as supermarkets, club stores and mass merchants, have affected the convenience store industry by entering the retail fuel business and/or selling merchandise traditionally found in convenience stores. Many of these competitors are substantially larger than we are. Because of their diversity, integration of operations and greater resources, these companies may be better able to withstand
39
volatile market conditions or levels of low or no profitability. In addition, these retailers may use promotional pricing or discounts, both at the pump and in the store, to encourage in-store merchandise sales. These activities by our competitors could adversely affect our profit margins. Additionally, our convenience stores could lose market share, relating to both gasoline and merchandise, to these and other retailers, which could adversely affect our business, results of operations and cash flows. Our convenience stores compete in large part based on their ability to offer convenience to customers. Consequently, changes in traffic patterns and the type, number and location of competing stores could result in the loss of customers and reduced sales and profitability at affected stores. These non-traditional gasoline and/or convenience merchandise retailers may obtain a significant share of the retail fuels market, may obtain a significant share of the convenience store merchandise market and their market share in each market is expected to grow.
We may seek to diversify our retail fuel and convenience store operations by entering new geographic areas, which may present operational and competitive challenges.
We may seek to grow by selectively operating stores in geographic areas other than those in which we currently operate, or in which we currently have a relatively small number of stores. This growth strategy would present numerous operational and competitive challenges to our senior management and employees and would place significant pressure on our operating systems. In addition, we cannot assure that consumers located in the regions in which we may expand our operations would be as receptive to our stores as consumers in our existing markets. The success of any such growth plans will depend in part upon our ability to:
|
•
|
select, and compete successfully in, new markets;
|
|
•
|
obtain suitable sites at acceptable costs;
|
|
•
|
identify and contract with financially stable developers;
|
|
•
|
realize an acceptable return on the capital invested in new facilities;
|
|
•
|
hire, train, and retain qualified personnel;
|
|
•
|
integrate new retail fuel and convenience stores into our existing distribution, inventory control, and information systems;
|
|
•
|
expand relationships with our suppliers or develop relationships with new suppliers; and
|
|
•
|
secure adequate financing, to the extent required.
|
We cannot assure that we will achieve our development goals, manage our growth effectively, or operate our existing and new retail fuel and convenience stores profitability. The failure to achieve any of the foregoing could have a material adverse effect on our business, financial condition and results of operations.
Decreases in commodity prices may lessen our borrowing capacities, increase collateral requirements for derivative instruments or cause a write-down of inventory.
The nature of our business requires us to maintain substantial quantities of crude oil, refined petroleum product and blendstock inventories. Because these inventories are commodities, we have no control over their changing market value. For example, reductions in the value of our inventories or accounts receivable as a result of lower commodity prices could result in a reduction in our borrowing base calculations and a reduction in the amount of financial resources available to meet the refineries' credit requirements. Further, if at any time our availability under certain of our revolving credit facilities falls below certain thresholds, we may be required to take steps to reduce our utilization under those credit facilities. In addition, changes in commodity prices may require us to utilize substantial amounts of cash to settle or cash collateralize some or all of our existing commodity hedges. Finally, because our inventory is valued at the lower of cost or market value, we would record a write-down of inventory and a non-cash charge to cost of sales if the market value of the inventory were to decline to an amount below our cost.
A terrorist attack on our assets, or threats of war or actual war, may hinder or prevent us from conducting our business.
Terrorist attacks (including cyber-attacks) in the United States, as well as events occurring in response to or in connection with them, including political instability in various Middle Eastern countries, may harm our business. Energy-related assets (which could include refineries, pipelines and terminals such as ours) may be at greater risk of future terrorist attacks than other possible targets in the United States.
A direct attack on our assets, or the assets of others used by us, could have a material adverse effect on our business, financial condition and results of operations. In addition, any terrorist attack or continued political instability in the Middle East could have an adverse impact on energy prices, including prices for crude oil, other feedstocks and refined petroleum products, and an adverse impact on the margins from our refining and petroleum product marketing operations. Disruption or significant increases in energy prices could also result in government-imposed price controls.
40
Legislative and regulatory measures to address climate change and GHG emissions could increase our operating costs or decrease demand for our refined products.
Various legislative and regulatory measures to address climate change and GHG emissions (including carbon dioxide, methane and nitrous oxides) are in various phases of discussion or implementation, and could affect our operations. They include proposed and recently enacted federal regulation and state actions to develop statewide, regional or nationwide programs designed to control and reduce GHG emissions from fixed sources, such as our refineries, coal-fired power plants and oil and gas production operations, as well as mobile transportation sources and fuels. Many states and regions have implemented, or are in the process of implementing, measures to reduce emissions of GHGs, primarily through cap and trade programs or low carbon fuel standards, but other than in California where we have limited operations, we do not currently operate in states that have their own GHG reduction programs.
In December 2009, the EPA published its findings that emissions of greenhouse gases, or GHGs, present a danger to public health and the environment because emissions of such gases are, according to the EPA, contributing to the warming of the Earth’s atmosphere and other climatic conditions. Based on these findings, the EPA adopted two sets of regulations that restrict emissions of GHGs under existing provisions of the federal Clean Air Act, including one that requires a reduction in emissions of GHGs from motor vehicles and another that regulates GHG emissions from certain large stationary sources under the Clean Air Act Prevention of Significant Deterioration (“PSD”) and Title V permitting programs. Congress has also from time to time considered legislation to reduce emissions of GHGs. Efforts have been made, and continue to be made, in the international community toward the adoption of international treaties or protocols that would address global climate change issues. In April 2016, the United States became a signatory to the 2015 United Nations Conference on Climate Change, which led to the creation of the Paris Agreement. The Paris Agreement, which became effective by its terms on November 4, 2016, will require countries to review and "represent a progression" in their intended nationally determined contributions, which set GHG emission reduction goals, every five years, beginning in 2020. On August 4, 2017, the United States formally communicated to the United Nations its intent to withdraw from participating in the Paris Agreement, which entails a four year process. In response to the announced withdrawal plan, a number of state and local governments in the United States have expressed intentions to take GHG-related actions.
Although it is not possible to predict the requirements of any GHG legislation that may be enacted, any laws or regulations that have been or may be adopted to restrict or reduce GHG emissions will likely require us to incur increased operating and capital costs and/or increased taxes on GHG emissions and petroleum fuels, and result in reduced demand for our petroleum fuels. If we are unable to maintain sales of our refined products at a price that reflects such increased costs, there could be a material adverse effect on our business, financial condition and results of operations. Further, any increase in the prices of refined products resulting from such increased costs, GHG cap and trade programs or taxes on GHGs, could have a material adverse effect on our business, financial condition or results of operations. GHG regulation, including taxes on the GHG content of fuels, could also impact the consumption of refined products, thereby affecting our refinery operations.
Risks Relating to Our Business
We are particularly vulnerable to disruptions to our refining operations because our refining operations are concentrated in four facilities.
Because all of our refining operations are concentrated in the Tyler, El Dorado, Big Spring and Krotz Springs refineries, significant disruptions at one of these facilities could have a material adverse effect on our business, financial condition or results of operations. Refining segment contribution margin comprised approximately
88.3%
,
78.1%
and
70.1%
of our consolidated contribution margin for the
2017
,
2016
and
2015
fiscal years, respectively.
Our refineries consist of many processing units, a number of which have been in operation for many years. These processing units undergo periodic shutdowns, known as turnarounds, during which routine maintenance is performed to restore the operation of the equipment to its former level of performance. Depending on which units are affected, all or a portion of a refinery's production may be halted or disrupted during a maintenance turnaround. We completed maintenance turnarounds at our El Dorado refinery in 2014 and our Tyler refinery in 2015. Turnaround planning at our El Dorado refinery in 2018 is underway. In addition, even if properly maintained, equipment may require significant capital expenditures to maintain desired efficiencies. One or more of the units may require additional unscheduled down time for unanticipated maintenance or repairs that are more frequent than our scheduled turnarounds.
Refinery operations may also be disrupted by external factors, such as a suspension of feedstock deliveries or an interruption of electricity, natural gas, water treatment or other utilities. Other potentially disruptive factors discussed elsewhere in these risk factors include natural disasters, severe weather conditions, workplace or environmental accidents, interruptions of supply, work stoppages, losses of permits or authorizations or acts of terrorism. Disruptions to our refining operations could reduce our revenues during the period of time that our processing units are not operating.
41
The dangers inherent in transporting, storing and processing crude oil and intermediate and finished petroleum products could cause disruptions and expose us to potentially significant costs and liabilities.
Our refining and logistics operations are subject to significant hazards and risks inherent in transporting, storing and processing crude oil and intermediate and finished petroleum products. These hazards and risks include, but are not limited to, natural or weather-related disasters, fires, explosions, pipeline ruptures and spills, trucking accidents, train derailments, third-party interference, mechanical failure of equipment and other events beyond our control. The occurrence of any of these events could result in production and distribution difficulties and disruptions, personal injury or death, environmental pollution and other damage to our properties and the properties of others. For example, we have experienced several crude oil releases from pipelines owned by our logistics segment. Each of these releases resulted in the need for clean-up and remediation efforts.
Because of these inherent dangers, our refining and logistics operations are subject to various laws and regulations relating to occupational health and safety, process and operating safety, environmental protection and transportation safety. Continued efforts to comply with applicable laws and regulations related to health, safety and the environment, or a finding of non-compliance with current regulations, could result in additional capital expenditures or operating expenses, as well as fines and penalties.
In addition, our refineries, pipelines and terminals are located in populated areas and any release of hazardous material, or catastrophic event, could affect our employees and contractors, as well as persons outside our property. Our pipelines, trucks and rail cars carry flammable and toxic materials on public railways and roads and across populated and/or environmentally sensitive areas and waterways that could be severely impacted in the event of a release. An accident could result in significant personal injuries and/or cause a release that results in damage to occupied areas, as well as damage to natural resources. It could also affect deliveries of crude oil to our refineries, resulting in a curtailment of operations. The costs to remediate such an accidental release and address other potential liabilities, as well as the costs associated with any interruption of operations, could be substantial. Although we maintain significant insurance coverage for such events, it may not cover all potential losses or liabilities.
In the event that personal injuries or deaths result from such events, or there are natural resource damages, we would likely incur substantial legal costs and liabilities. The extent of these costs and liabilities could exceed the limits of our available insurance. As a result, any such event could have a material adverse effect on our business, results of operations and cash flows.
The costs, scope, timelines and benefits of our refining projects may deviate significantly from our original plans and estimates.
We may experience unanticipated increases in the cost, scope and completion time for our improvement, maintenance and repair projects at our refineries. Refinery projects are generally initiated to increase the yields of higher-value products, increase our ability to process a variety of crude oils, increase production capacity, meet new regulatory requirements or maintain the safe and reliable operations of our existing assets. Equipment that we require to complete these projects may be unavailable to us at expected costs or within expected time periods. Additionally, employee or contractor labor expense may exceed our expectations. Due to these or other factors beyond our control, we may be unable to complete these projects within anticipated cost parameters and timelines.
In addition, the benefits we realize from completed projects may take longer to achieve and/or be less than we anticipated. Large-scale capital projects are typically undertaken in anticipation of achieving an acceptable level of return on the capital to be employed in the project. We base these forecasted project economics on our best estimate of future market conditions that are not within our control. Most large-scale projects take many years to complete, and during this multi-year period, market and other business conditions can change from those we forecast. Our inability to complete, and/or realize the benefits of refinery projects in a cost-efficient and timely manner, could have a material adverse effect on our business, financial condition and results of operations.
We depend upon our logistics segment for a substantial portion of the crude oil supply and refined product distribution networks that serve our Tyler and El Dorado refineries.
Our logistics segment consists of Delek Logistics, a publicly traded master limited partnership, and our consolidated financial statements include its consolidated financial results. As of
December 31, 2017
, we owned a
61.5%
limited partner interest in Delek Logistics, and a
94.6%
interest in Logistics GP, which owns the entire
2.0%
general partner interest in Delek Logistics. Delek Logistics operates a system of crude oil and refined product pipelines, distribution terminals and tankage in Arkansas, Louisiana, Tennessee and Texas. Delek Logistics generates revenues by charging tariffs for transporting crude oil and refined products through its pipelines, by leasing pipeline capacity to third parties, by charging fees for terminalling refined products and other hydrocarbons and storing and providing other services at its terminals.
Our Tyler and El Dorado refineries are substantially dependent upon Delek Logistics' assets and services under several long-term pipeline and terminal, tankage and throughput agreements expiring in 2022 through 2030. Delek Logistics is subject to its own operating and regulatory risks, including, but not limited to:
42
|
•
|
its reliance on significant customers, including us;
|
|
•
|
macroeconomic factors, such as commodity price volatility that could affect its customers' utilization of its assets;
|
|
•
|
its reliance on us for near-term growth;
|
|
•
|
sufficiency of cash flow for required distributions;
|
|
•
|
counterparty risks, such as creditworthiness and force majeure;
|
|
•
|
competition from third-party pipelines and terminals and other competitors in the transportation and marketing industries;
|
|
•
|
environmental regulations;
|
|
•
|
operational hazards and risks;
|
|
•
|
pipeline tariff regulations;
|
|
•
|
limitations on additional borrowings and other restrictions in its debt agreements; and
|
|
•
|
other financial, operational and legal risks.
|
The occurrence of any of these risks could directly or indirectly affect Delek Logistics' financial condition, results of operations and cash flows. Because Delek Logistics is our consolidated subsidiary, the occurrence of any of these risks could also affect our financial condition, results of operations and cash flows. Additionally, if any of these risks affect Delek Logistics' viability, its ability to serve our supply and distribution needs may be jeopardized.
For additional information about Delek Logistics, see "Logistics Segment" under Item 1 & 2, Business and Properties, of this Annual Report on Form 10-K.
Interruptions or limitations in the supply and delivery of crude oil, or the supply and distribution of refined products, may negatively affect our refining operations and inhibit the growth of our refining operations.
We rely on Delek Logistics and third-party transportation systems for the delivery of crude oil to our refineries. For example, during the year ended
December 31, 2017
, we relied upon the West Texas Gulf pipeline for the delivery of approximately
70.5%
of the crude oil processed by our Tyler and El Dorado refineries. We could experience an interruption or reduction of supply and delivery, or an increased cost of receiving crude oil, if the ability of these systems to transport crude oil is disrupted because of accidents, adverse weather conditions, governmental regulation, terrorism, maintenance or failure of pipelines or other delivery systems, other third-party action or other events beyond our control. The unavailability for our use, for a prolonged period of time, of any system of delivery of crude oil could have a material adverse effect on our business, financial condition or results of operations. Pipeline suspensions like these could require us to operate at reduced throughput rates.
Moreover, interruptions in delivery or limitations in delivery capacity may not allow our refining operations to draw sufficient crude oil to support current refinery production or increases in refining output. In order to maintain or materially increase refining output, existing crude delivery systems may require upgrades or supplementation, which may require substantial additional capital expenditures.
In addition, the El Dorado, Big Spring and Krotz Springs refineries distribute most of their light product production through a third-party pipeline system. An interruption to, or change in, the operation of the third-party pipeline system may result in a material restriction to our distribution channels. Because demand in the local markets is limited, a material restriction to each of the refinery's distribution channels may cause us to reduce production and may have a material adverse effect on our business, financial condition and results of operations.
We could experience an interruption or reduction of supply or delivery of refined products if our suppliers partially or completely ceased operations, temporarily or permanently. The ability of these refineries and our suppliers to supply refined products to us could be temporarily disrupted by anticipated events, such as scheduled upgrades or maintenance, as well as events beyond their control, such as unscheduled maintenance, fires, floods, storms, explosions, power outages, accidents, acts of terrorism or other catastrophic events, labor difficulties and work stoppages, governmental or private party litigation, or legislation or regulation that adversely impacts refinery operations. In addition, any reduction in capacity of other pipelines that connect with our suppliers' pipelines or our pipelines due to testing, line repair, reduced operating pressures, or other causes could result in reduced volumes of refined product supplied to our West Texas terminals. A reduction in the volume of refined products supplied to our West Texas terminals could adversely affect our sales and earnings.
Our retail segment is dependent on fuel sales, which makes us susceptible to increases in the cost of gasoline and interruptions in fuel supply.
Our dependence on fuel sales makes us susceptible to increases in the cost of gasoline and diesel fuel, and fuel profit margins have a significant impact on our earnings. The volume of fuel sold by us, and our fuel profit margins, are affected by numerous factors beyond our control, including the supply and demand for fuel, volatility in the wholesale fuel market and the pricing policies of competitors in local markets. Although we can rapidly adjust our pump prices to reflect higher fuel costs, a material increase in the price of fuel could adversely affect demand. A material, sudden increase in the cost of fuel that causes our fuel sales to decline could have a material adverse effect on our business, financial
43
condition and results of operations.
In addition, credit card interchange fees are typically calculated as a percentage of the transaction amount rather than a percentage of gallons sold. Higher refined product prices often result in negative consequences for our retail operations, such as higher credit card expenses, lower retail fuel gross margin per gallon and reduced demand for gasoline and diesel. These conditions could result in fewer retail gallons sold and fewer retail merchandise transactions, which could have a material adverse effect on our business, financial condition and results of operations.
Our dependence on fuel sales also makes us susceptible to interruptions in fuel supply. Gasoline sales generate customer traffic to our retail fuel and convenience stores, and any decrease in gasoline sales, whether due to shortage or otherwise, could adversely affect our merchandise sales. A serious interruption in the supply of gasoline to our retail fuel and convenience stores could have a material adverse effect on our business, financial condition and results of operations.
General economic conditions may adversely affect our business, operating results and financial condition.
Economic slowdowns may have serious negative consequences for our business and operating results, because our performance is subject to domestic economic conditions and their impact on levels of consumer spending. Some of the factors affecting consumer spending include general economic conditions, unemployment, consumer debt, reductions in net worth based on declines in equity markets and residential real estate values, adverse developments in mortgage markets, taxation, energy prices, interest rates, consumer confidence and other macroeconomic factors. During a period of economic weakness or uncertainty, current or potential customers may travel less, reduce or defer purchases, go out of business or have insufficient funds to buy or pay for our products and services. Moreover, a financial market crisis may have a material adverse impact on financial institutions and limit access to capital and credit. This could, among other things, make it more difficult for us to obtain (or increase our cost of obtaining) capital and financing for our operations. Our access to additional capital may not be available on terms acceptable to us or at all.
Also, because all of our operating refineries are located in the Gulf Coast Region, we primarily market our refined products in a relatively limited geographic area. As a result, we are more susceptible to regional economic conditions compared to our more geographically diversified competitors, and any unforeseen events or circumstances that affect the Gulf Coast Region could also materially and adversely affect our revenues and cash flows. The primary factors include, among other things, changes in the economy, weather conditions, demographics and population, increased supply of refined products from competitors and reductions in the supply of crude oil or other feedstocks. In the event of a shift in the supply/demand balance in the Gulf Coast Region due to changes in the local economy, an increase in aggregate refining capacity or other reasons, resulting in supply exceeding the demand in the region, our refineries may have to deliver refined products to more customers outside of the Gulf Coast Region and thus incur considerably higher transportation costs, resulting in lower refining margins, if any.
From time to time, our cash and credit needs may exceed our internally generated cash flow and available credit, and our business could be materially and adversely affected if we are not able to obtain the necessary cash or credit from financing sources.
We have significant short-term cash needs to satisfy working capital requirements, such as crude oil purchases which fluctuate with the pricing and sourcing of crude oil. We rely in part on our access to credit to purchase crude oil for our refineries. If the price of crude oil increases significantly, we may not have sufficient available credit, and may not be able to sufficiently increase such availability, under our existing credit facilities or other arrangements, to purchase enough crude oil to operate our refineries at desired capacities. Our failure to operate our refineries at desired capacities could have a material adverse effect on our business, financial condition and results of operations. We also have significant long-term needs for cash, including any capital expenditures for refinery expansion and upgrade projects, as well as projects necessary for regulatory compliance.
Depending on the conditions in credit markets, it may become more difficult to obtain cash or credit from third-party sources. If we cannot generate cash flow or otherwise secure sufficient liquidity to support our short-term and long-term capital requirements, we may not be able to comply with regulatory deadlines or pursue our business strategies, in which case our operations may not perform as well as we currently expect.
Our debt levels may limit our flexibility in obtaining additional financing and in pursuing other business opportunities.
As of
December 31, 2017
, we had total debt of
$1,465.6 million
, including current maturities of
$590.2 million
. In addition to our outstanding debt, as of
December 31, 2017
, our letters of credit issued under our various credit facilities were
$125.8 million
. Our borrowing availability under our various credit facilities as of
December 31, 2017
was
$933.2 million
.
44
Our level of debt could have important consequences for us. For example, it could:
|
•
|
increase our vulnerability to general adverse economic and industry conditions;
|
|
•
|
require us to dedicate a substantial portion of our cash flow from operations to service our debt and lease obligations, thereby reducing the availability of our cash flow to fund working capital, capital expenditures and other general corporate purposes;
|
|
•
|
limit our flexibility in planning for, or reacting to, changes in our business and the industry in which we operate;
|
|
•
|
place us at a disadvantage relative to our competitors that have less indebtedness or better access to capital by, for example, limiting our ability to enter into new markets, upgrade our refining assets or pursue acquisitions or other business opportunities;
|
|
•
|
limit our ability to borrow additional funds in the future; and
|
|
•
|
increase interest costs for our borrowed funds and letters of credit.
|
In addition, a substantial portion of our debt has a variable rate of interest, which increases our exposure to interest rate fluctuations, to the extent we elect not to hedge such exposures.
If we are unable to meet our principal and interest obligations under our debt and lease agreements, we could be forced to restructure or refinance our obligations, seek additional equity financing or sell assets, which we may not be able to do on satisfactory terms or at all. Our default on any of those agreements could have a material adverse effect on our business, financial condition and results of operations. In addition, if new debt is added to our current debt levels, the related risks that we now face could intensify.
Our debt agreements contain operating and financial restrictions that might constrain our business and financing activities.
The operating and financial restrictions and covenants in our credit facilities and any future financing agreements could adversely affect our ability to finance future operations or capital needs or to engage in, expand or pursue our business activities. For example, to varying degrees our credit facilities restrict our ability to:
|
•
|
declare dividends and redeem or repurchase capital stock;
|
|
•
|
prepay, redeem or repurchase debt;
|
|
•
|
make loans and investments, issue guaranties and pledge assets;
|
|
•
|
incur additional indebtedness or amend our debt and other material agreements;
|
|
•
|
make capital expenditures;
|
|
•
|
engage in mergers, acquisitions and asset sales; and
|
|
•
|
enter into certain intercompany arrangements or make certain intercompany payments, which in some instances could restrict our ability to use the assets, cash flows or earnings of one operating segment to support another operating segment or Holdings.
|
Other restrictive covenants require that we meet certain financial covenants, including leverage coverage, fixed charge coverage and net worth tests, as described in the applicable credit agreements. In addition, the covenant requirements of our various credit agreements require us to make many subjective determinations pertaining to our compliance thereto and exercise good faith judgment in determining our compliance.
Our ability to comply with the covenants and restrictions contained in our debt instruments may be affected by events beyond our control, including prevailing economic, financial and industry conditions. If market or other economic conditions deteriorate, our ability to comply with these covenants and restrictions may be impaired. If we breach any of the restrictions or covenants in our debt agreements, a significant portion of our indebtedness may become immediately due and payable, and our lenders' commitments to make further loans to us may terminate. We might not have, or be able to obtain, sufficient funds to make these immediate payments. In addition, our obligations under our credit facilities are secured by substantially all of our assets. If we are unable to timely repay our obligations under our credit facilities, the lenders could seek to foreclose on the assets, or we may be required to contribute additional capital to our subsidiaries. Any of these outcomes could have a material adverse effect on our business, financial condition and results of operations.
Changes in our credit profile could affect our relationships with our suppliers, which could have a material adverse effect on our liquidity and our ability to operate our refineries at full capacity.
Changes in our credit profile could affect the way crude oil, feedstock and refined product suppliers view our ability to make payments. As a result, suppliers could shorten the payment terms of their invoices with us, or require us to provide significant collateral to them that we do not currently provide. Due to the large dollar amounts and volume of our crude oil and other petroleum product purchases, as well as the historical volatility of crude oil pricing, any imposition by our suppliers of more burdensome payment terms, or collateral requirements, may have a material adverse effect on our liquidity and our ability to make payments to our suppliers. This, in turn, could cause us to be unable to operate our refineries at desired capacities. A failure to operate our refineries at desired capacities could adversely affect our profitability and cash flows.
45
The termination or expiration of our supply and offtake agreements could have a material adverse effect on our liquidity.
Our supply and offtake agreements with J. Aron & Company ("J. Aron") have expiration dates ranging from May 2019 to May 2021, but we have given early termination notice to J Aron in regards to Alon Supply Inc.'s agreement, so that agreement will terminate in May 2018. Pursuant to the agreements, J. Aron purchases a substantial portion of the crude oil and refined products in our refineries' inventory at market prices. Upon any termination of the agreements, including at expiration or in connection with a force majeure or default, the parties are required to negotiate with third parties for the assignment to us of certain contracts, commitments and arrangements, including procurement contracts, commitments for the sale of product and pipeline, terminalling, storage and shipping arrangements. Additionally, upon any termination, we will be required to repurchase or refinance the consigned crude oil and refined products from J. Aron at then market prices, which may have a material impact on our working capital needs.
We conduct our convenience store business under a license agreement with 7-Eleven, and the loss of this license could adversely affect the results of operations of our retail segment.
Our convenience store operations are primarily conducted under the 7-Eleven name pursuant to a license agreement between 7-Eleven, Inc. and Alon. 7-Eleven may terminate the agreement if Alon defaults on its obligations under the agreement. This termination would result in our convenience stores losing the use of the 7-Eleven brand name, the accompanying 7-Eleven advertising and certain other brand names and products used exclusively by 7-Eleven. Termination of the license agreement could have a material adverse effect on our retail operations.
If there is negative publicity concerning our brand names or the brand names of our suppliers, fuel and merchandise sales in our retail segment may suffer.
Negative publicity, regardless of whether the concerns are valid, concerning food, beverage, fuel or other product quality, food, beverage or other product safety or other health concerns, facilities, employee relations or other matters may materially and adversely affect demand for products offered at our stores and could result in a decrease in customer traffic to our stores. We offer food products in our stores that are marketed under our brand names and certain nationally recognized brands. These nationally recognized brands have significant operations at facilities owned and operated by third parties and negative publicity concerning these brands as a result of events that occur at facilities that we do not control could also adversely affect customer traffic to our stores. Additionally, we may be the subject of complaints or litigation arising from food or beverage-related illness or injury in general which could have a negative impact on our business. Health concerns, poor food, beverage, fuel or other product quality or operating issues stemming from one store or a limited number of stores can materially and adversely affect the operating results of some or all of our stores and harm our proprietary brands.
Wholesale cost increases, vendor pricing programs and tax increases applicable to tobacco products, as well as campaigns to discourage their use, could adversely impact our results of operations in our retail segment.
Increases in the retail price of tobacco products as a result of increased taxes or wholesale costs could materially impact our cigarette sales volume and/or revenues, merchandise gross profit and overall customer traffic. Cigarettes are subject to substantial and increasing excise taxes at both a state and federal level. In addition, national and local campaigns to discourage the use of tobacco products may have an adverse effect on demand for these products. A reduction in cigarette sales volume and/or revenues, merchandise gross profit from tobacco products or overall customer demand for tobacco products could have a material adverse effect on the business, financial condition and results of operations of our retail segment.
Major cigarette manufacturers currently offer substantial rebates to us; however, there can be no assurance that such rebate programs will continue. We include these rebates as a component of our gross margin from sales of cigarettes. In the event these rebates are decreased or eliminated, our wholesale cigarette costs will increase. For example, certain major cigarette manufacturers have offered rebate programs that provide rebates only if we follow the manufacturer's retail pricing guidelines. If we do not receive the rebates, because we do not participate in the program or if the rebates we receive by participating in the program do not offset or surpass the revenue lost as a result of complying with the manufacturer's pricing guidelines, our cigarette gross margin will be adversely impacted. In general, we attempt to pass wholesale price increases on to our customers. However, competitive pressures in our markets may adversely impact our ability to do so. In addition, reduced retail display allowances on cigarettes offered by cigarette manufacturers negatively impact gross margins. These factors could materially impact our retail price of cigarettes, cigarette sales volume and/or revenues, merchandise gross profit and overall customer traffic, which could in turn have a material adverse effect on our business, financial condition and results of operations.
Our insurance policies do not cover all losses, costs or liabilities that we may experience, and insurance companies that currently insure companies in the energy industry may cease to do so or substantially increase premiums.
We carry property, business interruption, pollution and casualty insurance, but we do not maintain insurance coverage against all potential losses, costs or liabilities. We could suffer losses for uninsurable, or uninsured, risks or in amounts in excess of existing insurance coverage. In
46
addition, we purchase insurance programs with large self-insured retentions and large deductibles. For example, we retain a short period of our business interruption losses. Therefore, a significant part, or all, of a business interruption loss or other types of loss could be retained by us. The occurrence of a loss that is retained by us, or not fully covered by insurance, could have a material adverse effect on our business, financial condition and results of operations.
The energy industry is highly capital intensive, and the entire or partial loss of individual facilities or multiple facilities can result in significant costs to both energy industry companies, such as us, and their insurance carriers. Historically, large energy industry claims have resulted in significant increases in the level of premium costs and deductible periods for participants in the energy industry. For example, hurricanes have caused significant damage to energy companies operating along the Gulf Coast, in addition to numerous oil and gas production facilities and pipelines in that region. Insurance companies that have historically participated in underwriting energy-related risks may discontinue that practice, may reduce the insurance capacity they are willing to offer or demand significantly higher premiums or deductible periods to cover these risks. If significant changes in the number, or financial solvency, of insurance underwriters for the energy industry occur, or if other adverse conditions over which we have no control prevail in the insurance market, we may be unable to obtain and maintain adequate insurance at reasonable cost.
In addition, we cannot assure that our insurers will renew our insurance coverage on acceptable terms, if at all, or that we will be able to arrange for adequate alternative coverage in the event of non-renewal. The unavailability of full insurance coverage to cover events in which we suffer significant losses could have a material adverse effect on our business, financial condition and results of operations.
We may not be able to successfully execute our strategy of growth through acquisitions.
A significant part of our growth strategy is to acquire assets, such as refineries, pipelines, terminals, and retail fuel and convenience stores that complement our existing assets and/or broaden our geographic presence. If attractive opportunities arise, we may also acquire assets in new lines of business that are complementary to our existing businesses. We have acquired Alon and the Tyler and El Dorado refineries, and we have developed our logistics segment through the acquisition of transportation and marketing assets. We expect to continue to acquire assets that complement our existing assets and/or broaden our geographic presence as a major element of our growth strategy. However, the occurrence of any of the following factors could adversely affect our growth strategy:
|
•
|
We may not be able to identify suitable acquisition candidates or acquire additional assets on favorable terms;
|
|
•
|
We usually compete with others to acquire assets, which competition may increase, and any level of competition could result in decreased availability or increased prices for acquisition candidates;
|
|
•
|
We may experience difficulty in anticipating the timing and availability of acquisition candidates;
|
|
•
|
We may not be able to obtain the necessary financing, on favorable terms or at all, to finance any of our potential acquisitions; and
|
|
•
|
As a public company, we are subject to reporting obligations, internal controls and other accounting requirements with respect to any business we acquire, which may prevent or negatively affect the valuation of some acquisitions we might otherwise deem favorable or increase our acquisition costs.
|
Acquisitions involve risks that could cause our actual growth or operating results to differ adversely compared with our expectations.
Due to our emphasis on growth through acquisitions, we are particularly susceptible to transactional risks that could cause our actual growth or operating results to differ adversely compared with our expectations. For example:
|
•
|
during the acquisition process, we may fail, or be unable, to discover some of the liabilities of companies or businesses that we acquire;
|
|
•
|
we may assume contracts or other obligations in connection with particular acquisitions on terms that are less favorable or desirable than the terms that we would expect to obtain if we negotiated the contracts or other obligations directly;
|
|
•
|
we may fail to successfully integrate or manage acquired assets;
|
|
•
|
acquired assets may not perform as we expect, or we may not be able to obtain the cost savings and financial improvements we anticipate;
|
|
•
|
acquisitions may require us to incur additional debt or issue additional equity;
|
|
•
|
acquired assets may suffer a diminishment in fair value as a result of which we may need to record a write-down or impairment;
|
|
•
|
we may fail to grow our existing systems, financial controls, information systems, management resources and human resources in a manner that effectively supports our growth;
|
|
•
|
to the extent that we acquire assets in new lines of business, we may become subject to additional regulatory requirements and additional risks that are characteristic or typical of these lines of business; and
|
|
•
|
to the extent that we acquire equity interests in entities that control assets (rather than acquiring the assets directly), we may become subject to liabilities that predate our ownership and control of the assets.
|
The occurrence of any of these factors could adversely affect our business, financial condition or results of operations.
47
We may be unable to integrate successfully the businesses of Old Delek and Alon and realize the anticipated benefits of the Delek/ Alon Merger.
The Delek/Alon Merger involve the combination of two companies which, prior to July 1, 2017, operated as independent public companies. We must devote significant management attention and resources to integrating the business practices and operations of Old Delek and Alon. We may fail to realize some or all of the anticipated benefits of the Delek/Alon Merger if the integration process takes longer than expected or is more costly than expected. Potential difficulties we may encounter in the integration process include the following:
|
•
|
the inability to successfully combine the businesses of Old Delek and Alon in a manner that permits us to achieve the synergies anticipated to result from the Delek/Alon Merger, which would result in the anticipated benefits of the Delek/Alon Merger not being realized partly or wholly in the time frame currently anticipated or at all;
|
|
•
|
lost sales and customers as a result of certain customers of either of the two companies deciding not to do business with us;
|
|
•
|
complexities associated with managing the combined businesses;
|
|
•
|
integrating personnel from the two companies;
|
|
•
|
challenges in the creation of uniform standards, controls, procedures, policies and information systems;
|
|
•
|
potential unknown liabilities and unforeseen increased expenses, delays or regulatory conditions associated with the Delek/ Alon Merger; and
|
|
•
|
performance shortfalls as a result of the diversion of management’s attention caused by completing the Delek/Alon Merger and integrating the companies’ operations.
|
We are expected to incur substantial expenses related to the integration of Old Delek and Alon.
We are expected to incur substantial expenses in connection with the integration of the business, policies, procedures, operations, technologies and systems of Alon with those of Old Delek. There are a large number of systems that must be integrated, including management information, purchasing, administrative, accounting and finance, sales, marketing, billing, payroll and benefits, installation, engineering, infrastructure and regulatory compliance, among others. While we have assumed that a certain level of expenses would be incurred, there are a number of factors beyond our control that could affect the total amount or the timing of all of the expected integration expenses. Moreover, many of the expenses that will be incurred are, by their nature, difficult to estimate. These integration expenses likely will result in us taking significant charges against earnings, but the amount and timing of such charges is uncertain, and if such charges are greater than expected, they could offset the cost synergies that New Delek expects to achieve from the Delek/Alon Merger.
We may refinance a significant amount of indebtedness and otherwise require additional financing; we cannot guarantee that we will be able to obtain the necessary funds on favorable terms or at all.
We may elect to refinance certain of our indebtedness, even if not required to do so by the terms of such indebtedness. In addition, we may need, or want, to raise additional funds for our operations. We have been, and may continue to be, engaged in discussions with certain potential financing sources, which could provide a source of additional funds and liquidity for our operations. However, our ability to obtain such financing will depend on, among other factors, prevailing market conditions at the time of the proposed financing and other factors beyond our control. There is no assurance that we will be able to obtain additional financing on terms acceptable to us, or at all.
Our future results will suffer if we do not effectively manage our expanded operations following the Delek/Alon Merger.
The size and scope of operations of our business have increased beyond the current size and scope of operations of either Old Delek’s or Alon’s businesses prior to the Delek/Alon Merger. In addition, we may continue to expand our size and operations through additional acquisitions or other strategic transactions. Our future success depends, in part, upon our ability to manage our expanded business, which may pose substantial challenges for management, including challenges related to the management and monitoring of new operations and associated increased costs and complexity. There can be no assurance that we will be successful, or that we will realize the expected economies of scale, synergies and other benefits currently anticipated from the Delek/Alon Merger or anticipated from any additional acquisitions or strategic transactions.
The Delek/Alon Merger could adversely affect our relationships with employees, customers, commercial partners, financing parties and other third parties.
Uncertainty about the effect of the Delek/Alon Merger on employees, customers, commercial partners and other third parties may have an adverse effect on us. These uncertainties may cause customers, suppliers, commercial partners, financing parties and others that dealt with Alon or Old Delek to seek to change, delay or defer decisions with respect to existing or future business relationships. These uncertainties may impair our ability to retain, hire and motivate certain current and prospective employees. If key employees, customers, suppliers, commercial
48
partners, financing parties and other third parties terminate or change, or seek to terminate or change, their existing relationships with us, our business could be harmed.
We will record goodwill and other intangible assets that could become impaired and result in material non-cash charges to our results of operations in the future.
The Delek/Alon Merger has been accounted for as an acquisition, by us, of Alon in accordance with accounting principles generally accepted in the United States. Under the acquisition method of accounting, the assets and liabilities of Alon and its subsidiaries have been recorded, as of the completion of the Delek/Alon Merger, at their respective fair values. Under the acquisition method of accounting, the total purchase price has been preliminarily allocated to Alon’s tangible assets and liabilities and identifiable intangible assets based on their estimated fair values as of the date of completion of the Delek/Alon Merger. The excess of the purchase price over those estimated fair values has been recorded as goodwill. To the extent the value of goodwill or intangibles becomes impaired, we may be required to incur material non-cash charges relating to such impairment. Our operating results may be significantly impacted from both the impairment and the underlying trends in the business that triggered the impairment.
Our sale of the Retail Entities to COPEC involves risks related to our continuing obligations under the Purchase Agreement and the effect of the disposition of the Retail Entities.
In November 2016, we closed the Retail Transaction, pursuant to which we sold the Retail Entities to COPEC, which comprised our retail segment, at that time, and a portion of our corporate, other and eliminations segment. In connection with the closing of the Retail Transaction, we and our stockholders are subject to several risks, including the following:
|
•
|
any event that results in a right for COPEC to seek indemnity from us could result in a substantial payment from us to COPEC and could adversely affect our business, financial condition, and results of operations; and
|
|
•
|
certain terms of the Purchase Agreement may preclude us from engaging in or pursuing certain business opportunities.
|
We may incur significant costs and liabilities with respect to investigation and remediation of environmental conditions at our refineries.
Prior to our purchase of our refineries and terminals, the previous owners had been engaged for many years in the investigation and remediation of hydrocarbons and other materials which contaminated soil and groundwater at the purchased facilities. Upon purchase of the facilities, we became responsible and liable for certain costs associated with the continued investigation and remediation of known and unknown impacted areas at the refineries. In the future, it may be necessary to conduct further assessments and remediation efforts at impacted areas at our refinery, pipeline, tank, terminal and store locations and elsewhere. In addition, we have identified and self-reported certain other environmental matters subsequent to our purchase of the refineries.
Based upon environmental evaluations performed internally and by third parties, we recorded and periodically update environmental liabilities and accrued amounts we believe are sufficient to complete remediation. We expect remediation of soil, sediment and groundwater at some properties to continue for the foreseeable future. The need to make future expenditures for these purposes that exceed the amounts we estimated and accrued for could have a material adverse effect on our business, financial condition and results of operations.
Alon indemnified certain parties, to which they sold assets, for costs and liabilities that may be incurred as a result of environmental conditions existing at the time of the sale. As a result of our purchase of Alon, if we are forced to incur costs or pay liabilities in connection with these indemnifications, such costs and payments could be significant.
In the future, we may incur substantial expenditures for investigation or remediation of contamination that has not been discovered at our current or former locations or locations that we may acquire or at third party sites where hazardous substances from these locations have been treated or disposed. Our handling and storage of petroleum and hazardous substances may lead to additional contamination at our facilities or along our pipelines and at facilities to which we send or have sent wastes or by-products for treatment of disposal. In addition, new legal requirements, new interpretations of existing legal requirements, increased legislative activity and governmental enforcement and other developments could require us to make additional unforeseen expenditures. As a result, we may be subject to additional investigation and cleanup costs, governmental penalties and third party suits alleging personal injury and property damage. Joint and several strict liability may be incurred in connection with releases of petroleum hydrocarbons, hazardous substances and/or wastes. Liabilities for future remediation costs are recorded when environmental assessments and/or remedial efforts are probable and the costs can be reasonably estimated as material. Other than for assessments, the timing and magnitude of these accruals generally are based on the completion of investigations or other studies or a commitment to a formal plan of action.
49
We could incur substantial costs or disruptions in our business if we cannot obtain or maintain necessary permits and authorizations or otherwise comply with health, safety, environmental and other laws and regulations.
Our operations require numerous permits and authorizations under various laws and regulations. These authorizations and permits are subject to revocation, renewal or modification, and can require operational changes to limit impacts or potential impacts on the environment and/or health and safety. A violation of authorization or permit conditions or other legal or regulatory requirements could result in substantial fines, criminal sanctions, permit revocations, injunctions and/or facility shutdowns. In addition, major modifications of our operations could require modifications to our existing permits or upgrades to our existing pollution control equipment. Any, or all, of these matters could have a negative effect on our business, results of operations and cash flows.
Our Tyler refinery currently has limited ability to economically distribute refined petroleum products outside the northeast Texas market.
In recent years, we have expanded our refined product distribution capacities in northeast Texas with our acquisition of refined product terminals located in Big Sandy, Texas and Mount Pleasant, Texas. However, unlike most other refineries, the Tyler refinery currently has a limited ability to distribute refined products outside the northeast Texas market. For the year ended
December 31, 2017
, nearly all of the refinery sales volume in Tyler was completed through a rack system located at the Tyler refinery, which is owned by our logistics segment. The Tyler refinery's limited distribution capabilities may continue to limit its ability to increase its production, attract new customers for its refined petroleum products or increase sales of the Tyler refinery products. In addition, if demand for the Tyler refinery's products diminishes within the northeast Texas market, its production may be reduced and our financial results would be adversely affected, unless additional distribution capabilities are identified.
An increase in competition, and/or reduction in demand in the markets in which we purchase feedstocks and sell our refined products, could increase our costs and/or lower prices and adversely affect our sales and profitability.
Certain of our refineries operate in a localized or niche markets. If competitors commence operations within these niche markets, we could lose our niche market advantage, which could have a material adverse effect on our business, financial condition and results of operations. Additionally, where feedstocks are purchased in a localized market, disruptions in supply channels could significantly impact our ability to meet production demands in those facilities.
In addition, the maintenance, or replacement, of our existing customers depends on a number of factors outside of our control, including increased competition from other suppliers and demand for refined products in the markets we serve. The market for distribution of wholesale motor fuel is highly competitive and fragmented. Some of our competitors have significantly greater resources and name recognition than us. The loss of major customers, or a reduction in amounts purchased by major customers, could have an adverse effect on us to the extent that we are not able to correspondingly increase sales to other purchasers.
Compliance with and changes in tax laws could adversely affect our performance.
We are subject to extensive tax liabilities, including federal and state income taxes and transactional taxes, such as excise, sales/use, payroll, franchise, withholding and ad valorem taxes. New tax laws and regulations, and changes in existing tax laws and regulations, are continuously being enacted or proposed that could result in increased expenditures for tax liabilities in the future. Certain of these liabilities are subject to periodic audits by the respective taxing authority, which could increase or otherwise alter our tax liabilities. Subsequent changes to our tax liabilities as a result of these audits may also subject us to interest and penalties, and could have a material adverse effect on our business, financial condition and results of operations.
For example, the tax treatment of our logistics segment depends on its status as a partnership for federal income tax purposes. If a change in law, our failure to comply with existing law or other factors were to cause our logistics segment to be treated as a corporation for federal income tax purposes, it would become subject to entity-level taxation. As a result, our logistics segment would pay federal income tax on all of its taxable income at regular corporate income tax rates (subject to corporate alternative minimum tax for years ended prior to 2018), would likely pay additional state and local income taxes at varying rates, and distributions to unitholders, including us, would be generally treated as taxable dividends from a corporation. In such case, the logistics segment would likely experience a material reduction in its anticipated cash flow and after-tax return to its unitholders, and we would likely experience a substantial reduction in its value.
In addition, recent regulatory proposals in the United States could effectively limit, or even eliminate, use of the LIFO inventory method for financial purposes. Although the final outcome of these proposals cannot be ascertained at this time, the ultimate impact to us of the transition from LIFO to another inventory method could be material. We use the LIFO method with respect to our inventories at the Tyler refinery.
On December 22, 2017, tax legislation commonly known as the Tax Cuts and Jobs Act ("TCJA") was enacted. Among other things, the TCJA reduces the U.S. corporate income tax rate from 35% to 21% (beginning in 2018). Beginning in 2018, the TCJA also generally will (i) limit our annual deductions for interest expense to no more than 30% of our "adjusted taxable income" (plus 100% of our business interest income) for the year and (ii) permit us to offset only 80% (rather than 100%) of our taxable income with any net operating losses we generate after 2017. While
50
we are currently evaluating the effects of the TCJA, including the re-measurement of our deferred tax assets and liabilities, we do not expect that the provisions of the TCJA, taken as a whole, will have any adverse impact on our cash tax liabilities, results of operations, or financial condition. In the absence of guidance on various uncertainties and ambiguities in the application of certain provisions of the TCJA, we will use what we believe are reasonable interpretations and assumptions in applying the TCJA, but it is possible that the IRS could issue subsequent guidance or take positions on audit that differ from our prior interpretations and assumptions, which could adversely impact our cash tax liabilities, results of operations, and financial condition.
Our commodity and interest rate derivative activity may limit potential gains, increase potential losses, result in earnings volatility and involve other risks.
At times, we enter into commodity derivative contracts to manage our price exposure to our inventory positions, future purchases of crude oil, ethanol and other feedstocks, future sales of refined products, manage our RINs exposure or to secure margins on future production. At times we also enter into interest rate swap and cap agreements to manage our market exposure to changes in interest rates related to our floating rate borrowings. We expect to continue to enter into these types of transactions from time to time and have increased our use of commodity risk management activities in recent years.
While these transactions are intended to limit our exposure to the adverse effects of fluctuations in crude oil prices, refined products prices, RIN prices and interest rates, they may also limit our ability to benefit from favorable changes in market conditions, and may subject us to period-by-period earnings volatility in the instances where we do not seek hedge accounting for these transactions. Further, because the volume of commodity derivative activity is less than our actual use of crude oil, production of refined products or total RINs exposure, our risk management activity only partially limits our exposure to market volatility. Also, in connection with such derivative transactions, we may be required to make cash payments to maintain margin accounts and to settle the contracts at their value upon termination. Finally, this activity exposes us to potential risk of counterparties to our derivative contracts failing to perform under the contracts. As a result, the effectiveness of our risk management policies could have a material adverse impact on our business, results of operations and cash flows. For additional information about the nature and volume of these transactions, see Item 7A, Quantitative and Qualitative Disclosures about Market Risk, of this Annual Report on Form 10-K.
We are exposed to certain counterparty risks which may adversely impact our results of operations.
We evaluate the creditworthiness of each of our various counterparties, but we may not always be able to fully anticipate or detect deterioration in a counterparty's creditworthiness and overall financial condition. The deterioration of creditworthiness or overall financial condition of a material counterparty (or counterparties) could expose us to an increased risk of nonpayment or other default under our contracts with them. If a material counterparty (or counterparties) defaults on their obligations to us, this could materially adversely affect our financial condition, results of operations or cash flows. For example, under the terms of the supply and offtake agreements with J. Aron, we grant J. Aron the exclusive right to store and withdraw crude and certain products in the tanks associated with the El Dorado and Alon refineries. These agreements also provide that the ownership of substantially all crude oil and certain other refined products in the tanks associated with these refineries will be retained by J. Aron, and that J. Aron will purchase substantially all of the specified refined products processed at these refineries. An adverse change in J. Aron's business, results of operations, liquidity or financial condition could adversely affect its ability to timely discharge its obligations to us, which could consequently have a material adverse effect on our business, results of operations or liquidity.
Adverse weather conditions or other unforeseen developments could damage our facilities, reduce customer traffic and impair our ability to produce and deliver refined petroleum products or receive supplies for our retail fuel and convenience stores.
The regions in which we operate are susceptible to severe storms, including hurricanes, thunderstorms, tornadoes, floods, extended periods of rain, ice storms and snow, all of which we have experienced in the past few years. Our refineries located in California and the related pipeline and asphalt terminals are located in areas with a history of earthquakes, some of which have been quite severe. In addition, for a variety of reasons, many members of the scientific community believe that climate changes are occurring that could have significant physical effects, such as increased frequency and severity of storms, droughts and floods and other climatic events. If any such effects were to occur, they could have an adverse effect on our assets and operations.
Inclement weather conditions, earthquakes or other unforeseen developments could damage our facilities, interrupt production, adversely impact consumer behavior, travel and retail fuel and convenience store traffic patterns or interrupt or impede our ability to operate our locations. If such conditions prevail near our refineries, they could interrupt or undermine our ability to produce and transport products from our refineries and receive and distribute products at our terminals. Regional occurrences, such as energy shortages or increases in energy prices, fires and other natural disasters, could also hurt our business. The occurrence of any of these developments could have a material adverse effect on our business, financial condition and results of operations.
51
Our operating results are seasonal and generally lower in the first and fourth quarters of the year for our refining and logistics segments and in the first quarter of the year for our retail segment. We depend on favorable weather conditions in the spring and summer months.
Demand for gasoline, convenience merchandise and asphalt products is generally higher during the summer months than during the winter months due to seasonal increases in motor vehicle traffic and road and home construction. Varying vapor pressure requirements between the summer and winter months also tighten summer gasoline supply. As a result, the operating results of our refining segment and logistics segment are generally lower for the first and fourth quarters of each year. Seasonal fluctuations in traffic also affect sales of motor fuels and merchandise in our retail fuel and convenience stores. As a result, the operating results of our retail segment are generally lower for the first quarter of the year.
Weather conditions in our operating area also have a significant effect on our operating results in our retail segment. Customers are more likely to purchase more gasoline and higher profit margin items such as fast foods, fountain drinks and other beverages during the spring and summer months. Unfavorable weather conditions during these months and a resulting lack of the expected seasonal upswings in traffic and sales could have a material adverse effect on our business, financial condition and results of operations.
A substantial portion of the workforce at our refineries is unionized, and we may face labor disruptions that would interfere with our operations.
As of
December 31, 2017
,
176
operations, maintenance and warehouse hourly employees and
38
truck drivers at the Tyler refinery were represented by the United Steel, Paper and Forestry, Rubber, Manufacturing, Energy, Allied Industrial and Service Workers International Union and its Local 202. The Tyler operations, maintenance and warehouse hourly employees are currently covered by a collective bargaining agreement that expires
January 31, 2019
. The Tyler truck drivers are currently covered by a collective bargaining agreement that expires
March 1, 2018
. As of
December 31, 2017
,
175
operations and maintenance hourly employees at the El Dorado refinery were represented by the International Union of Operating Engineers and its Local 381. These employees are covered by a collective bargaining agreement which expires on
August 1, 2021
. As of
December 31, 2017
,
37
of our El Dorado based drivers for Lion Oil Company were represented by the United Steel, Paper and Forestry, Rubber, Manufacturing, Energy, Allied Industrial and Service Workers International Union, AFL - CIO,
29
of our Texas based drivers for Lion Oil Company were represented by the United Steel, Paper and Forestry, Rubber, Manufacturing, Energy, Allied Industrial and Service Workers International Union, AFL - CIO and
4
of our El Dorado refinery warehouse hourly employees were represented by the International Union of Operating Engineers and its Local 381, but none are currently covered by a collective bargaining agreement. Negotiations toward collective bargaining agreements with the new bargaining units are underway. As of
December 31, 2017
, approximately
138
employees who work at our Big Spring refinery are covered by a collective bargaining agreement that expires
April 1, 2019
. Although these collective bargaining agreements contain provisions to discourage strikes or work stoppages, we cannot assure that strikes or work stoppages will not occur. A strike or work stoppage could have a material adverse effect on our business, financial condition and results of operations.
We rely on information technology in our operations, and any material failure, inadequacy, interruption or security failure of that technology could harm our business.
We rely on information technology systems across our operations, including management of our supply chain, point of sale processing at our retail sites and various other processes and transactions. We rely on commercially available systems, software, tools and monitoring to provide security for processing, transmission and storage of confidential customer information, such as payment card and personal credit information.
In addition, the systems currently used for certain transmission and approval of payment card transactions, and the technology utilized in payment cards themselves, may put certain payment card data at risk. These standards for determining the required controls applicable to these systems are mandated by credit card issuers and administered by the Payment Card Industry Security Standards Counsel and not by us. The regulatory environment surrounding information security and privacy is increasingly demanding, with the frequent imposition of new and constantly changing requirements. We have taken the necessary steps to comply with the Payment Card Industry Data Security Standards (PCI-DSS) at all of our locations. However, compliance with these requirements may result in cost increases due to necessary systems changes and the development of new administrative processes.
In recent years, several retailers have experienced data breaches, resulting in the exposure of sensitive customer data, including payment card information. A breach could also originate from, or compromise, our customers' and vendors' or other third-party networks outside of our control. Any compromise or breach of our information and payment technology systems could cause interruptions in our operations, damage our reputation, reduce our customers' willingness to visit our sites and conduct business with them, or expose us to litigation from customers or sanctions for violations of the PCI-DSS. In addition, a compromise of our internal data network at any of our refining or terminal locations may have disruptive impacts similar to that of our retail operations. These disruptions could range from inconvenience in accessing business information to a disruption in our refining operations. Cost increases may be incurred in this area to combat the continued escalation of cyber-attacks and/or disruptive criminal activity.
Also, we utilize information technology systems and controls that monitor the movement of petroleum products through our pipelines and
52
terminals. An undetected failure of these systems could result in environmental damage, operational disruptions, regulatory enforcement or private litigation. Further, the failure of any of our systems to operate effectively, or problems we may experience with transitioning to upgraded or replacement systems, could significantly harm our business and operations and cause us to incur significant costs to remediate such problems.
If we lose any of our key personnel, our ability to manage our business and continue our growth could be negatively impacted.
Our future performance depends to a significant degree upon the continued contributions of our senior management team and key technical personnel. We do not currently maintain key person life insurance policies for any of our senior management team. The loss or unavailability to us of any member of our senior management team or a key technical employee could significantly harm us. We face competition for these professionals from our competitors, our customers and other companies operating in our industry. To the extent that the services of members of our senior management team and key technical personnel would be unavailable to us for any reason, we would be required to hire other personnel to manage and operate our company and to develop our products and technology. We cannot assure that we would be able to locate or employ such qualified personnel on acceptable terms or at all.
If we are, or become, a United States real property holding corporation, special tax rules may apply to a sale, exchange or other disposition of common stock, and non-U.S. holders may be less inclined to invest in our stock, as they may be subject to United States federal income tax in certain situations.
A non-U.S. holder of our common stock may be subject to United States federal income tax with respect to gain recognized on the sale, exchange or other disposition of our common stock if we are, or were, a "U.S. real property holding corporation" ("USRPHC") at any time during the shorter of the five-year period ending on the date of the sale or other disposition and the period such non-U.S. holder held our common stock (the shorter period referred to as the "lookback period"). In general, we would be a USRPHC if the fair market value of our "U.S. real property interests," as such term is defined for United States federal income tax purposes, equals or exceeds 50% of the sum of the fair market value of our worldwide real property interests and our other assets used or held for use in a trade or business. The test for determining USRPHC status is applied on certain specific determination dates and is dependent upon a number of factors, some of which are beyond our control (including, for example, fluctuations in the value of our assets). If we are or become a USRPHC, so long as our common stock is regularly traded on an established securities market such as the NYSE, only a non-U.S. holder who, actually or constructively, holds or held during the lookback period more than five percent of our common stock will be subject to United States federal income tax on the disposition of our common stock.
Loss of or reductions to tax incentives for biodiesel production may have a material adverse effect on earnings, profitability and cash flows relating to our California renewable fuels facility.
The biodiesel industry has historically been substantially aided by federal and state tax incentives. One tax incentive program that has been significant to our California renewable fuels facility is the federal blender's tax credit. The blender's tax credit provided a $1.00 refundable tax credit per gallon of pure biodiesel, or B100, to the first blender of biodiesel with petroleum-based diesel fuel. The blender's tax credit has expired on several occasions, only to be reinstated on a retroactive basis. Most recently, the blender's tax credit expired on December 31, 2016, but was retroactively reinstated through December 31, 2017. See
Note 25
of the consolidated financial statements included in Item 8, Financial Statements and Supplementary Data, of this Annual Report on Form 10-K for further information regarding the extension of this tax credit.
It is uncertain what action, if any, Congress may take with respect to reinstating the blender's tax credit or when such action might be effective. If Congress does not reinstate the credit for future years, it may result in a material adverse effect on the earnings, profitability and cash flows relating to our California renewable fuels facility.
Risks Related to Our Common Stock
The price of our common stock may fluctuate significantly, and you could lose all or part of your investment.
The market price of our common stock may be influenced by many factors, some of which may be beyond our control, including:
|
•
|
our quarterly or annual earnings, or those of other companies in our industry;
|
|
•
|
inaccuracies in, and changes to, our previously published quarterly or annual earnings;
|
|
•
|
changes in accounting standards, policies, guidance, interpretations or principles;
|
|
•
|
economic conditions within our industry, as well as general economic and stock market conditions;
|
|
•
|
the failure of securities analysts to cover our common stock, or the cessation of such coverage;
|
|
•
|
changes in financial estimates by securities analysts and the frequency and accuracy of such reports;
|
|
•
|
future issuance or sales of our common stock;
|
|
•
|
announcements by us or our competitors of significant contracts or acquisitions;
|
|
•
|
sales of common stock by our senior officers or our affiliates; and
|
53
|
•
|
the other factors described in these "Risk Factors."
|
In recent years, the stock market has experienced extreme price and volume fluctuations. This volatility has had a significant impact on the market price of securities issued by many companies, including companies in our industry. The changes often occur without any apparent regard to the operating performance of these companies. The price of our common stock could fluctuate based upon factors that have little or nothing to do with our company performance, and these fluctuations could materially reduce our stock price. In addition, recent distress in the credit and financial markets resulted in extreme volatility in trading prices of securities and diminished liquidity, and we cannot assure that our liquidity will not be affected by changes in the financial markets and the global economy.
In the past, some companies that have experienced volatile market prices for their securities have been subject to securities class action suits filed against them. The filing of a lawsuit against us, regardless of the outcome, could have a material adverse effect on our business, financial condition and results of operations, as it could result in substantial legal costs and a diversion of our management's attention and resources.
The trading price of our common stock is likely to be volatile.
The trading price of Delek common stock and, prior to the Delek/Alon Merger, Old Delek common stock and Alon common stock has historically been highly volatile. The trading price of our common stock could be subject to wide fluctuations in response to various factors, many of which are beyond our control. The stock market in general, and the market for energy companies in particular, has experienced extreme price and volume fluctuations that have often been unrelated or disproportionate to the operating performance of those companies. Broad market and industry factors may seriously affect the market price of companies’ stock, including ours, regardless of actual operating performance. In addition, in the past, following periods of volatility in the overall market and the market price of a particular company’s securities, securities class action litigation has often been instituted against these companies. Any such stockholder litigation could result in substantial costs and a diversion of the attention and resources of our management.
Shareholder litigation against us and certain of our current or former directors could divert management time and result in the payment of damages if the plaintiffs are successful.
As more fully described in a Form 8-K filed by Old Delek on June 19, 2017, the Arkansas Teacher Retirement System filed a lawsuit in the Delaware Court of Chancery (Arkansas Teacher Retirement System v. Alon USA Energy, Inc., et al., Case No. 2017-0453), alleging breach of fiduciary duty claims. Specifically, it alleges that Old Delek used its position as a purportedly controlling stockholder of Alon’s to obtain buyout terms from Alon at an unfairly discounted price, and that the defendant Alon directors breached their fiduciary duties allegedly owed to the plaintiff stockholder and purported class by engaging in conduct that led to the sale of Alon’s shares at an unfairly discounted price. The plaintiff has asked the Delaware Chancery Court to, among other things, award damages to the plaintiff and purported class in an amount to be determined at trial, award additional shares of our common stock to the plaintiff and purported class and award the plaintiff attorneys’ and experts’ fees. Although we believe the plaintiff’s claims are without merit, we cannot predict the outcome of or estimate the possible loss or range of loss from this litigation.
The defense or settlement of the shareholder action disclosed above could be time-consuming and expensive, and divert the attention of our management away from operating the business. If any one or more of these legal proceedings is adversely resolved against us, it could have an adverse effect on our financial condition, results of operations or liquidity.
Stockholder activism may negatively impact the price of our common stock.
Our stockholders may from time to time engage in proxy solicitations, advance stockholder proposals or otherwise attempt to effect changes or acquire control over us. Campaigns by stockholders to effect changes at publicly traded companies are sometimes led by investors seeking to increase short-term stockholder value through actions such as financial restructuring, increased debt, special dividends, stock repurchases or sales of assets or the entire company. Responding to proxy contests and other actions by activist stockholders can be costly and time-consuming, disrupting our operations and diverting the attention of our Board of Directors and senior management from the pursuit of business strategies. As a result, stockholder campaigns could adversely affect our results of operations, financial condition and cash flows.
Future sales of shares of our common stock could depress the price of our common stock.
The market price of our common stock could decline as a result of the introduction of a large number of shares of our common stock into the market or the perception that these sales could occur. The introduction of these shares into the market (or the perception that sales of these shares could occur) could have an adverse impact on the market price of our common stock. Sales of a large number of shares of our common stock, or the possibility that these sales may occur, also might make it more difficult for us to sell equity securities in the future at a time and at a price that we deem appropriate.
54
Our stockholders may suffer substantial dilution.
We may sell securities in the public or private equity markets, if and when conditions are favorable, even if we do not have an immediate need for capital. In addition, if we have an immediate need for capital, we may sell securities in the public or private equity markets even when conditions are not otherwise favorable. Our stockholders will suffer dilution if we issue currently unissued shares of our stock or sell our treasury holdings in the future. Our stockholders will also suffer dilution as stock, restricted stock units, stock options, stock appreciation rights, warrants or other equity awards, whether currently outstanding or subsequently granted, are exercised.
We depend upon our subsidiaries for cash to meet our obligations and pay any dividends.
We are a holding company. Our subsidiaries conduct substantially all of our operations and own substantially all of our assets. Consequently, our cash flow and our ability to meet our obligations or pay dividends to our stockholders depend upon the cash flow of our subsidiaries and the payment of funds by our subsidiaries to us in the form of dividends, tax sharing payments or otherwise. Our subsidiaries' ability to make any payments will depend on many factors, including their earnings, cash flows, the terms of their credit facilities, tax considerations and legal restrictions.
We may be unable to pay future regular dividends in the anticipated amounts and frequency set forth herein.
We will only be able to pay regular dividends from our available cash on hand and funds received from our subsidiaries. Our ability to receive dividends and other cash payments from our subsidiaries is restricted under the terms of their respective credit facilities. For example, under the terms of their credit facilities, our subsidiaries are subject to certain customary covenants that limit their ability to, subject to certain exceptions as defined in their respective credit agreements, remit cash to, distribute assets to, or make investments in us as the parent company. Specifically, these covenants limit the payment, in the form of cash or other assets, of dividends or other cash payments to us. The declaration of future regular dividends on our common stock will be at the discretion of our Board of Directors and will depend upon many factors, including our results of operations, financial condition, earnings, capital requirements, restrictions in our debt agreements and legal requirements. Although we currently intend to pay regular quarterly cash dividends on our common stock, we cannot provide any assurances that any regular dividends will be paid in the anticipated amounts and frequency set forth herein, if at all.
Provisions of Delaware law and our organizational documents may discourage takeovers and business combinations that our stockholders may consider in their best interests, which could negatively affect our stock price.
Provisions of Delaware law, our Amended and Restated Certificate of Incorporation and our Amended and Restated Bylaws may have the effect of delaying or preventing a change in control of our company or deterring tender offers for our common stock that other stockholders may consider in their best interests. For example, our Amended and Restated Certificate of Incorporation provides that:
|
•
|
stockholder actions may only be taken at annual or special meetings of stockholders;
|
|
•
|
members of our Board of Directors can be removed with or without cause by a supermajority vote of stockholders;
|
|
•
|
the Court of Chancery of the State of Delaware is, with certain exceptions, the exclusive forum for certain legal actions;
|
|
•
|
our bylaws, as may be in effect from time to time, can be amended only by a supermajority vote of stockholders; and
|
|
•
|
certain provisions of our certificate of incorporation, as may be in effect from time to time, can be amended only by a supermajority vote of stockholders.
|
In addition, our Amended and Restated Certificate of Incorporation authorizes us to issue up to 10,000,000 shares of preferred stock in one or more different series, with terms to be fixed by our Board of Directors. Stockholder approval is not necessary to issue preferred stock in this manner. Issuance of these shares of preferred stock could have the effect of making it more difficult and more expensive for a person or group to acquire control of us and could effectively be used as an anti-takeover device. On the date of this report, no shares of our preferred stock are outstanding.
Finally, our Amended and Restated Bylaws provide for an advance notice procedure for stockholders to nominate director candidates for election or to bring business before an annual meeting of stockholders and require that special meetings of stockholders be called only by our chairman of the Board of Directors, president or secretary after written request of a majority of our Board of Directors. The advance notice provision requires disclosure of derivative positions, hedging transactions, short interests, rights to dividends and other similar positions of any stockholder proposing a director nomination, in order to promote full disclosure of such stockholder's economic interest in us.
The anti-takeover provisions of Delaware law and provisions in our organizational documents may prevent our stockholders from receiving the benefit from any premium to the market price of our common stock offered by a bidder in a takeover context. Even in the absence of a takeover attempt, the existence of these provisions may adversely affect the prevailing market price of our common stock if they are viewed as discouraging takeover attempts in the future.
55
We are exposed to risks relating to evaluations of internal controls required by Section 404 of Sarbanes-Oxley.
To comply with the management certification and auditor attestation requirements of Section 404 of Sarbanes-Oxley, we are required to evaluate our internal controls systems to allow management to report on, and our independent auditors to audit, our internal controls over financial reporting. During this process, we may identify control deficiencies of varying degrees of severity under applicable SEC and Public Company Accounting Oversight Board rules and regulations that remain un-remediated. As a public company, we are required to report, among other things, control deficiencies that constitute a "material weakness" or changes in internal controls that, or are reasonably likely to, materially affect internal controls over financial reporting. A "material weakness" is a deficiency, or combination of deficiencies, in internal control over financial reporting, such that there is a reasonable possibility that a material misstatement of the Company's annual or interim financial statements will not be prevented or detected on a timely basis.
If we fail to comply with the requirements of Section 404, we may be subject to sanctions or investigation by regulatory authorities, such as the SEC or the NYSE. Additionally, failure to comply with Section 404, or the report by us of a material weakness, may cause investors to lose confidence in our financial statements, and our stock price may be adversely affected. If we fail to remedy any material weakness, our financial statements may be inaccurate, we may face restricted access to the capital markets and our stock price may decline.
ITEM 1B.
UNRESOLVED STAFF COMMENTS
None.
ITEM 3.
LEGAL PROCEEDINGS
In the ordinary conduct of our business, we are from time to time subject to lawsuits, investigations and claims, including, environmental claims and employee-related matters.
Although we cannot predict with certainty the ultimate resolution of lawsuits, investigations and claims asserted against us, including civil penalties or other enforcement actions, we do not believe that any currently pending legal proceeding or proceedings to which we are a party will have a material adverse effect on our business, financial condition or results of operations.
We are reporting the following proceedings to comply with SEC regulations which require disclosure of proceedings arising under federal, state or local provisions regulating the discharge of materials into the environment or protecting the environment, if we reasonably believe that such proceedings may result in monetary sanctions of $100,000 or more.
In June 2015, the United States Department of Justice notified Delek Logistics that they were pursuing an enforcement action on behalf of the EPA with regard to potential Clean Water Act violations arising from a release in March 2013 at its Magnolia Station located west of the El Dorado Refinery. We are currently attempting to negotiate a resolution to this matter with the EPA and the ADEQ, which may include monetary penalties and/or other relief.
The Big Spring refinery has been negotiating an agreement with the EPA for over 10 years under the EPA’s National Petroleum Refinery Initiative regarding alleged historical violations of the federal Clean Air Act related to emissions and emissions control equipment. A Consent Decree resolving these alleged historical violations for the Big Spring refinery was lodged with the United States District Court for the Northern District of Texas on June 6, 2017, and we expect that Consent Decree to become final in 2018. If finalized as lodged, the Consent Decree will require payment of a $0.5 million civil penalty and capital expenditures for pollution control equipment that may be significant over the next 5 years.
The Big Spring refinery has been in discussions with the EPA since March 2016 to resolve alleged violations regarding six batches of gasoline produced in 2012-2013 that exceeded the applicable Reid Vapor Pressure standard. The issue was resolved in January 2018, resulting in payment of a penalty of $372,611.
The Paramount refinery has been in discussions with the State of California since December 2016 regarding alleged violations of the state's Low Carbon Fuel Standard ("LCFS") program related to recordkeeping, reporting and the retirement of LCFS credits. During October 2017, an agreement in principal was reached to settle the matter in which Paramount will pay a $300,000 penalty and retire 350 tons of California LCFS credits.
56
ITEM 4.
MINE SAFETY DISCLOSURES
Not applicable.
57
|
ITEM 5.
|
MARKET FOR REGISTRANT'S COMMON EQUITY, RELATED STOCKHOLDER
MATTERS AND ISSUER PURCHASES OF EQUITY SECURITIES
|
Market Information and Dividends
Our common stock is traded on the New York Stock Exchange under the symbol "DK." The following table sets forth the quarterly high and low sales prices of our common stock for each quarterly period indicated and dividends issued since January 1,
2016
:
|
Period
|
High Sales Price
|
Low Sales Price
|
Regular Dividends
Per Common Share
|
Special Dividends
Per Common Share
|
||||||||||||
|
2016
|
||||||||||||||||
|
First Quarter
|
$
|
24.74
|
|
$
|
12.54
|
|
$
|
0.15
|
|
$
|
—
|
|
||||
|
Second Quarter
|
$
|
17.39
|
|
$
|
11.41
|
|
$
|
0.15
|
|
$
|
—
|
|
||||
|
Third Quarter
|
$
|
18.57
|
|
$
|
11.66
|
|
$
|
0.15
|
|
$
|
—
|
|
||||
|
Fourth Quarter
|
$
|
25.14
|
|
$
|
14.76
|
|
$
|
0.15
|
|
$
|
—
|
|
||||
|
2017
|
||||||||||||||||
|
First Quarter
|
$
|
26.06
|
|
$
|
21.30
|
|
$
|
0.15
|
|
$
|
—
|
|
||||
|
Second Quarter
|
$
|
27.82
|
|
$
|
21.22
|
|
$
|
0.15
|
|
$
|
—
|
|
||||
|
Third Quarter
|
$
|
27.85
|
|
$
|
20.65
|
|
$
|
0.15
|
|
$
|
—
|
|
||||
|
Fourth Quarter
|
$
|
35.38
|
|
$
|
25.02
|
|
$
|
0.15
|
|
$
|
—
|
|
||||
The dividends paid in
2017
and
2016
totaled approximately
$44.0 million
and
$37.5 million
, respectively. As of the date of this filing, we intend to continue to pay regular quarterly cash dividends on our common stock at an increased annual rate of $0.80 per share. The declaration and payment of future regular and/or special dividends to holders of our common stock will be at the discretion of our Board of Directors and will depend upon many factors, including our financial condition, earnings, legal requirements, restrictions in our debt agreements and other factors our Board of Directors deems relevant. Except as represented in the table above, we have paid no other cash dividends on our common stock during the two most recent fiscal years.
Holders
As of
February 26, 2018
, there were approximately
33
common stockholders of record. This number does not include beneficial owners of our common stock whose stock is held in nominee or "street name" accounts through brokers.
58
Purchases of Equity Securities by the Issuer and Affiliated Purchasers
In December 2016, our Board of Directors authorized a share repurchase program for up to
$150.0 million
of Delek common stock. Any share repurchases under the repurchase program may be implemented through open market transactions or in privately negotiated transactions, in accordance with applicable securities laws. The timing, price, and size of repurchases will be made at the discretion of management and will depend on prevailing market prices, general economic and market conditions and other considerations. The repurchase program does not obligate us to acquire any particular amount of stock, does not expire and, prior to December 5, 2017, this repurchase authorization had not been utilized. The following table sets forth information with respect to the purchase of shares of our common stock made during the three months ended
December 31, 2017
by or on behalf of us or any “affiliated purchaser,” as defined by Rule 10b-18 of the Exchange Act:
|
Period
|
Total Number of Shares Purchased
|
Average Price Paid per Share
|
Total Number of Shares Purchased as Part of Publicly Announced Plans or Programs
(1)
|
Approximate Dollar Value of Shares that May Yet Be Purchased Under the Plans
or Programs
(1)
|
||||||||||
|
October 1 - October 31, 2017
|
—
|
|
—
|
|
—
|
|
$
|
150,000,000
|
|
|||||
|
November 1 - November 30, 2017
|
—
|
|
—
|
|
—
|
|
150,000,000
|
|
||||||
|
December 1 - December 31, 2017
|
762,623
|
|
32.78
|
|
762,623
|
|
$
|
125,000,015
|
|
|||||
|
Total
|
762,623
|
|
$
|
32.78
|
|
762,623
|
|
N/A
|
||||||
|
(1)
|
762,623
shares were repurchased pursuant to the repurchase program authorized by the Board of Directors in December 2016 for up to
$150.0 million
of Delek common stock, which was announced on January 3, 2017.
|
On February 26, 2018, the Board of Directors approved a new $150.0 million authorization to repurchase Delek common stock, which was announced on February 26, 2018. This amount has no expiration date and is in addition to any remaining amounts previously authorized.
See Note
25
of the consolidated financial statements included in Item 8, Financial Statements and Supplementary Data, of this Annual Report on Form 10-K regarding Delek's repurchase of 2.0 million shares of its common stock from Alon Israel on January 23, 2018.
59
Performance Graph
The following Performance Graph and related information shall not be deemed
"
soliciting material" or to be "filed" with the SEC,
nor shall such information be incorporated by reference into any future filing under
the Securities Act of 1933 or Securities Exchange Act of 1934, each as amended,
except to the extent that we specifically incorporate it by reference into such
filing.
The following graph compares cumulative total returns for our stockholders to the Standard and Poor's 500 Stock Index and a market capitalization weighted peer group selected by management for the five-year period commencing
December 31, 2012
and ending
December 31, 2017
. The graph assumes a $100 investment made on
December 31, 2012
. Each of the three measures of cumulative total return assumes reinvestment of dividends. The current peer group is comprised of CVR Energy, Inc. (NYSE: CVI), HollyFrontier Corporation (NYSE: HFC), Marathon Petroleum Corporation (NYSE: MPC), Phillips 66 (NYSE: PSX), Andeavor (previously known as Tesoro Corporation; NYSE: ANDW), and Valero Energy Corporation (NYSE: VLO). The Company's previous peer group also included Alon USA Energy, Inc., which was acquired by the Company in the Delek/Alon Merger and Western Refining, Inc., which was acquired by Andeavor during 2017 (no full year trading exists for either of these previous peers). The stock performance shown on the graph below is not necessarily indicative of future price performance.
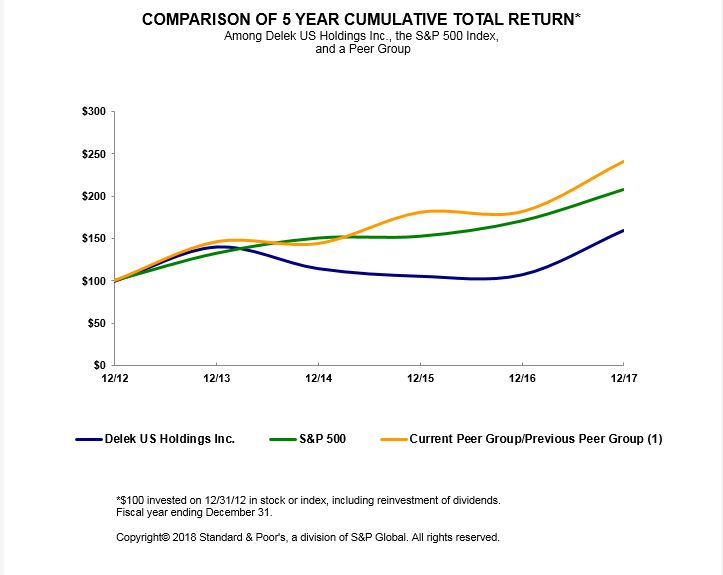
|
(1)
|
The stock performance results of our prior peer group included Alon prior to being acquired by Delek on July 1, 2017, and Western Refining, Inc. prior to being acquired by Andeavor on June 1, 2017. Thus, the peer group line in the graph above includes those two companies prior to those dates.
|
60
ITEM 6.
SELECTED FINANCIAL DATA
The following selected financial data should be read in conjunction with Item 7, Management's Discussion and Analysis of Financial Condition and Results of Operations, and Item 8, Financial Statements and Supplementary Data, of this Annual Report on Form 10-K.
|
Year Ended December 31,
|
||||||||||||||||||||
|
2017
(2)
|
2016
|
2015
(1)
|
2014
(1)
|
2013
(1)
|
||||||||||||||||
|
Statement of Operations Data:
|
(In millions, except share and per share data)
|
|||||||||||||||||||
|
Net sales
|
$
|
7,267.1
|
|
$
|
4,197.9
|
|
$
|
4,782.0
|
|
$
|
7,019.2
|
|
$
|
7,184.2
|
|
|||||
|
Operating costs and expenses:
|
||||||||||||||||||||
|
Cost of goods sold
|
6,327.6
|
|
3,812.9
|
|
4,236.9
|
|
6,213.3
|
|
6,536.9
|
|
||||||||||
|
Operating expenses
|
429.0
|
|
249.3
|
|
270.3
|
|
258.7
|
|
257.5
|
|
||||||||||
|
Insurance proceeds — business interruption
|
—
|
|
(42.4
|
)
|
—
|
|
—
|
|
—
|
|
||||||||||
|
General and administrative expenses
|
169.8
|
|
106.1
|
|
100.6
|
|
105.2
|
|
86.2
|
|
||||||||||
|
Depreciation and amortization
|
153.3
|
|
116.4
|
|
106.0
|
|
83.2
|
|
64.6
|
|
||||||||||
|
Other operating expense (income), net
|
1.0
|
|
4.8
|
|
(0.5
|
)
|
0.1
|
|
1.7
|
|
||||||||||
|
Total operating costs and expenses
|
7,080.7
|
|
4,247.1
|
|
4,713.3
|
|
6,660.5
|
|
6,946.9
|
|
||||||||||
|
Operating income (loss)
|
186.4
|
|
(49.2
|
)
|
68.7
|
|
|
358.7
|
|
|
237.3
|
|
||||||||
|
Interest expense
|
93.8
|
|
54.4
|
|
52.1
|
|
33.5
|
|
31.4
|
|
||||||||||
|
Interest income
|
(4.0
|
)
|
(1.5
|
)
|
(1.1
|
)
|
(0.8
|
)
|
(0.3
|
)
|
||||||||||
|
(Income) loss from equity method investments
|
(12.6
|
)
|
43.4
|
|
(2.0
|
)
|
—
|
|
—
|
|
||||||||||
|
Loss on impairment of equity method investment
|
—
|
|
245.3
|
|
—
|
|
—
|
|
—
|
|
||||||||||
|
Gain on remeasurement of equity method investment
|
(190.1
|
)
|
—
|
|
—
|
|
—
|
|
—
|
|
||||||||||
|
Other expense (income), net
|
—
|
|
0.4
|
|
(1.6
|
)
|
(0.9
|
)
|
(6.3
|
)
|
||||||||||
|
Total non-operating (income) expenses, net
|
(112.9
|
)
|
342.0
|
|
47.4
|
|
31.8
|
|
24.8
|
|
||||||||||
|
Income (loss) from continuing operations before income tax benefit
|
299.3
|
|
(391.2
|
)
|
21.3
|
|
326.9
|
|
212.5
|
|
||||||||||
|
Income tax benefit
|
(29.2
|
)
|
(171.5
|
)
|
(15.8
|
)
|
101.6
|
|
76.1
|
|
||||||||||
|
Income (loss) from continuing operations
|
|
328.5
|
|
(219.7)
|
|
37.1
|
|
225.3
|
|
136.4
|
|
|||||||||
|
Discontinued operations:
|
||||||||||||||||||||
|
(Loss) income from discontinued operations
|
(8.6
|
)
|
144.2
|
|
5.7
|
|
0.6
|
|
(5.9
|
)
|
||||||||||
|
Income tax (benefit) expense
|
(2.7
|
)
|
57.9
|
|
(0.9
|
)
|
(0.1
|
)
|
(5.2
|
)
|
||||||||||
|
(Loss) income from discontinued operations, net of tax
|
(5.9
|
)
|
86.3
|
|
6.6
|
|
0.7
|
|
(0.7
|
)
|
||||||||||
|
Net income (loss)
|
322.6
|
|
(133.4
|
)
|
43.7
|
|
226.0
|
|
135.7
|
|
||||||||||
|
Net income attributed to non-controlling interests
|
33.8
|
|
20.3
|
|
24.3
|
|
27.4
|
|
18.0
|
|
||||||||||
|
Net income (loss) attributable to Delek
|
|
$
|
288.8
|
|
$
|
(153.7
|
)
|
|
$
|
19.4
|
|
|
$
|
198.6
|
|
|
$
|
117.7
|
|
|
|
Basic income (loss) per share:
|
||||||||||||||||||||
|
Income (loss) from continuing operations
|
$
|
4.12
|
|
$
|
(3.88
|
)
|
$
|
0.21
|
|
$
|
3.37
|
|
$
|
2.00
|
|
|||||
|
(Loss) income from discontinued operations
|
$
|
(0.08
|
)
|
$
|
1.39
|
|
$
|
0.11
|
|
$
|
0.01
|
|
$
|
(0.01
|
)
|
|||||
|
Total basic income (loss) per share
|
$
|
4.04
|
|
$
|
(2.49
|
)
|
$
|
0.32
|
|
$
|
3.38
|
|
$
|
1.99
|
|
|||||
|
Diluted earnings per share:
|
||||||||||||||||||||
|
Diluted income (loss) per share:
|
$
|
4.08
|
|
$
|
(3.88
|
)
|
$
|
0.21
|
|
$
|
3.33
|
|
$
|
1.97
|
|
|||||
|
Income (loss) from continuing operations
|
$
|
(0.08
|
)
|
$
|
1.39
|
|
$
|
0.11
|
|
$
|
0.01
|
|
$
|
(0.01
|
)
|
|||||
|
(Loss) income from discontinued operations
|
$
|
4.00
|
|
$
|
(2.49
|
)
|
$
|
0.32
|
|
$
|
3.34
|
|
$
|
1.96
|
|
|||||
|
Total diluted income (loss) per share
|
||||||||||||||||||||
|
Basic
|
71,566,225
|
|
61,921,787
|
|
60,819,771
|
|
58,780,947
|
|
59,186,921
|
|
||||||||||
|
Diluted
|
72,303,083
|
|
61,921,787
|
|
61,320,570
|
|
59,355,120
|
|
60,047,138
|
|
||||||||||
|
Dividends declared per common share outstanding
|
0.60
|
|
0.60
|
|
0.60
|
|
1.00
|
|
0.95
|
|
||||||||||
61
|
Year Ended December 31,
|
||||||||||||||||||||
|
|
2017
(2)
|
2016
|
2015
(1)
|
2014
(1)
|
2013
(1)
|
|||||||||||||||
|
Balance Sheet Data:
|
(In millions)
|
|
||||||||||||||||||
|
Cash and cash equivalents
|
$
|
931.8
|
|
$
|
689.2
|
|
$
|
287.2
|
|
$
|
429.8
|
|
$
|
383.2
|
|
|||||
|
Assets of discontinued operations held for sale
|
160.0
|
|
—
|
|
478.8
|
|
485.9
|
|
480.6
|
|
||||||||||
|
Total current assets
|
2,611.8
|
|
1,396.9
|
|
1,389.4
|
|
1,656.0
|
|
1,810.3
|
|
||||||||||
|
Property, plant and equipment, net
|
2,140.8
|
|
1,103.3
|
|
1,177.4
|
|
1,099.2
|
|
944.3
|
|
||||||||||
|
Total assets
|
5,935.2
|
|
2,979.8
|
|
3,316.8
|
|
2,888.7
|
|
2,840.4
|
|
||||||||||
|
Liabilities of discontinued operations held for sale
|
105.9
|
|
—
|
|
302.8
|
|
259.1
|
|
235.5
|
|
||||||||||
|
Total current liabilities
|
2,671.7
|
|
935.2
|
|
996.0
|
|
1,057.5
|
|
1,250.3
|
|
||||||||||
|
Total debt, including current maturities
|
1,465.6
|
|
832.9
|
|
805.2
|
|
464.8
|
|
313.1
|
|
||||||||||
|
Total non-current liabilities
|
1,299.3
|
|
862.1
|
|
966.9
|
|
632.8
|
|
469.7
|
|
||||||||||
|
Total stockholders' equity
|
1,964.2
|
|
1,182.5
|
|
1,353.9
|
|
1,198.4
|
|
1,120.4
|
|
||||||||||
|
Total liabilities and stockholders' equity
|
5,935.2
|
|
2,979.8
|
|
3,316.8
|
|
2,888.7
|
|
2,840.4
|
|
||||||||||
|
(1)
|
In August 2016, Delek entered into the Purchase Agreement to sell the Retail Entities, which consist of all of the retail segment and a portion of the corporate, other and eliminations segment, to COPEC. As a result of the Purchase Agreement, we met the requirements of ASC 205-20,
Presentation of Financial Statements - Discontinued Operations
and ASC 360,
Property, Plant and Equipment,
to report the results of the Retail Entities as discontinued operations and to classify the Retail Entities as a group of assets held for sale. The operating results for the Retail Entities have been reclassified to discontinued operations.
|
|
(2)
|
Statement of operations data for the year ended December 31, 2017 reflects six months of incremental results of operations resulting from the Delek/Alon Merger, which was effective July 1, 2017. Additionally, the balance sheet date as of December 31, 2017 reflects the assets and liabilities of Alon as a result of the Delek/Alon Merger.
|
ITEM 7.
MANAGEMENT’S DISCUSSION AND ANALYSIS OF FINANCIAL CONDITION AND RESULTS OF OPERATIONS
Forward-Looking Statements
This Annual Report on Form 10-K contains "forward-looking statements" within the meaning of Section 27A of the Securities Act of 1933, as amended, and Section 21E of the Securities Exchange Act of 1934, as amended (the "Exchange Act"). These forward-looking statements reflect our current estimates, expectations and projections about our future results, performance, prospects and opportunities. Forward-looking statements include, among other things, the information concerning our possible future results of operations, business and growth strategies, financing plans, expectations that regulatory developments or other matters will or will not have a material adverse effect on our business or financial condition, our competitive position and the effects of competition, the projected growth of the industry in which we operate, and the benefits and synergies to be obtained from our completed and any future acquisitions, statements of management’s goals and objectives, and other similar expressions concerning matters that are not historical facts. Words such as "may," "will," "should," "could," "would," "predicts," "potential," "continue," "expects," "anticipates," "future," "intends," "plans," "believes," "estimates," "appears," "projects" and similar expressions, as well as statements in future tense, identify forward-looking statements.
Forward-looking statements should not be read as a guarantee of future performance or results, and will not necessarily be accurate indications of the times at, or by, which such performance or results will be achieved. Forward-looking information is based on information available at the time and/or management’s good faith belief with respect to future events, and is subject to risks and uncertainties that could cause actual performance or results to differ materially from those expressed in the statements. Important factors that, individually or in the aggregate, could cause such differences include, but are not limited to:
|
•
|
volatility in our refining margins or fuel gross profit as a result of changes in the prices of crude oil, other feedstocks and refined petroleum products;
|
|
•
|
risk factors relating to the Delek/Alon Merger, including but not limited to risks surrounding the combining of operations, financial position and cash flows as well as systems, processes and controls going forward, as further discussed in Part I, Item 1A, "Risk Factors";
|
|
•
|
our ability to execute our strategy of growth through acquisitions and the transactional risks inherent in such acquisitions;
|
62
|
•
|
acquired assets may suffer a diminishment in fair value, which may require us to record a write-down or impairment;
|
|
•
|
liabilities related to, and the effects of, the sale of the Retail Entities (as defined below);
|
|
•
|
reliability of our operating assets;
|
|
•
|
competition;
|
|
•
|
changes in, or the failure to comply with, the extensive government regulations applicable to our industry segments;
|
|
•
|
changes in interpretations, assumptions and expectations regarding the Tax Cuts and Jobs Act, including additional guidance that may be issued by federal and state taxing authorities;
|
|
•
|
diminution in value of long-lived assets may result in an impairment in the carrying value of the assets on our balance sheet and a resultant loss recognized in the statement of operations;
|
|
•
|
general economic and business conditions affecting the southern, southwestern and western United States, particularly levels of spending related to travel and tourism;
|
|
•
|
volatility under our derivative instruments;
|
|
•
|
deterioration of creditworthiness or overall financial condition of a material counterparty (or counterparties);
|
|
•
|
unanticipated increases in cost or scope of, or significant delays in the completion of, our capital improvement and periodic turnaround projects;
|
|
•
|
risks and uncertainties with respect to the quantities and costs of refined petroleum products supplied to our pipelines and/or held in our terminals;
|
|
•
|
operating hazards, natural disasters, casualty losses and other matters beyond our control;
|
|
•
|
increases in our debt levels or costs;
|
|
•
|
changes in our ability to continue to access the credit markets;
|
|
•
|
compliance, or failure to comply, with restrictive and financial covenants in our various debt agreements;
|
|
•
|
the inability of our subsidiaries to freely make dividends, loans or other cash distributions to us;
|
|
•
|
seasonality;
|
|
•
|
acts of terrorism aimed at either our facilities or other facilities that could impair our ability to produce or transport refined products or receive feedstocks;
|
|
•
|
changes in the cost or availability of transportation for feedstocks and refined products; and
|
|
•
|
other factors discussed under Item 1A, Risk Factors and Item 7, Management’s Discussion and Analysis of Financial Condition and Results of Operations and in our other filings with the SEC.
|
In light of these risks, uncertainties and assumptions, our actual results of operations and execution of our business strategy could differ materially from those expressed in, or implied by, the forward-looking statements, and you should not place undue reliance upon them. In addition, past financial and/or operating performance is not necessarily a reliable indicator of future performance, and you should not use our historical performance to anticipate future results or period trends. We can give no assurances that any of the events anticipated by any forward-looking statements will occur or, if any of them do, what impact they will have on our results of operations and financial condition.
Forward-looking statements speak only as of the date the statements are made. We assume no obligation to update forward-looking statements to reflect actual results, changes in assumptions or changes in other factors affecting forward-looking information, except to the extent required by applicable securities laws. If we do update one or more forward-looking statements, no inference should be drawn that we will make additional updates with respect thereto or with respect to other forward-looking statements.
63
Executive Summary and Strategic Overview
Business Overview
We are an integrated downstream energy business focused on petroleum refining, the transportation, storage and wholesale distribution of crude oil, intermediate and refined products and convenience store retailing. Prior to August 2016, we aggregated our operating units into three reportable segments: refining, logistics and retail. However, in August 2016, we entered into a definitive equity purchase agreement to sell 100% of the equity interests in Delek's wholly-owned subsidiaries MAPCO Express, Inc., MAPCO Fleet, Inc., Delek Transportation, LLC, NTI Investments, LLC and GDK Bearpaw, LLC (collectively, the “Retail Entities”), the assets of which comprised our retail segment at that time (the "Retail Transaction"). The Retail Transaction closed in November 2016.
Effective with the Delek/Alon Merger July 1, 2017, Delek's retail segment now includes the operations of Alon's
302
owned and leased convenience store sites located primarily in central and west Texas and New Mexico. These convenience stores typically offer various grades of gasoline and diesel under the Alon brand name and food products, food service, tobacco products, non-alcoholic and alcoholic beverages, general merchandise as well as money orders to the public, primarily under the 7-Eleven and Alon brand names. Substantially all of the motor fuel sold through our retail segment is supplied by our Big Spring refinery, which is transferred to the retail segment at prices substantially determined by reference to published commodity pricing information.
Our corporate activities, results of certain immaterial operating segments (including our asphalt terminal operations effective with the Delek/ Alon Merger), our non-controlling equity interest of approximately 47% of the outstanding shares in Alon (which was accounted for as an equity method investment) prior to the Delek/Alon Merger and intercompany eliminations are reported in the corporate, other and eliminations segment.
We own or operate asphalt terminals located in Texas (Big Spring), Washington (Richmond Beach), California (Elk Grove, Bakersfield and Mojave), Arizona (Phoenix), Arkansas (El Dorado), Tennessee (Memphis) and Oklahoma (Muskogee), and we also have involvement in two additional asphalt terminals in which we own a 50% interest located in Fernley, Nevada, and Brownwood, Texas. The operations in which we have a 50% interest represent joint ventures and are recorded under the equity method of accounting. We purchase non-blended asphalt from third parties in addition to non-blended asphalt produced at the Big Spring refinery. We market asphalt through our terminals as blended and non-blended asphalt. Sales of asphalt are seasonal with the majority of sales occurring between May and October.
Prior to the Delek/Alon Merger, the refining segment operated refineries in Tyler, Texas (the "Tyler refinery") and El Dorado, Arkansas (the "El Dorado refinery") with a combined design crude throughput (nameplate) capacity of
155,000
barrels per day ("bpd"), including the
75,000
bpd Tyler refinery and the
80,000
bpd El Dorado refinery. Our refining segment also included two biodiesel facilities we own and operate that are engaged in the production of biodiesel fuels and related activities, located in Crossett, Arkansas and Cleburne, Texas. Effective with the Delek/Alon Merger, our refining segment now also includes a crude oil refinery located in Big Spring, Texas with a nameplate capacity of
73,000
bpd, a crude oil refinery located in Krotz Springs, Louisiana with a nameplate capacity of
74,000
bpd, and a heavy crude oil refinery located in Bakersfield, California. The Bakersfield, California refinery has not processed crude oil since 2012 due to the high cost of crude oil relative to product yield and low asphalt demand. Total operating crude throughput for our operational refineries is
302,000
barrels per day at December 31, 2017.
Our corporate, other and eliminations category in the segment footnote tables in Note
15
of the consolidated financial statements included in Item 8, Financial Statements and Supplementary Data, of this Annual Report on Form 10-K , subsequent to the Delek/Alon Merger, includes our Paramount, California and Long Beach, California refineries, which have not processed crude oil since 2012, and a renewable fuels facility located at the Paramount refinery (in which we have a controlling interest), which has a throughput capacity of 3,000 bpd and converts tallow and vegetable oils into renewable fuels. As a result of Delek management's committing to a plan to sell certain assets associated with our Paramount and Long Beach refineries and our California renewable fuels facility, which were acquired as part of the Delek/Alon Merger (collectively, the "California Discontinued Entities"), we met the requirements under Accounting Standards Codification ("ASC") 205-20, Presentation of Financial Statements - Discontinued Operations ("ASC 205-20") and ASC 360, Property, Plant and Equipment ("ASC 360") to report the results of those operations as discontinued operations and to classify the applicable assets of the California Discontinued Entities as a group of assets held for sale.
We own the Big Spring refinery and its integrated wholesale marketing operations through Alon USA Partners, LP (the "Alon Partnership") - see Note
25
of the consolidated financial statements included in Item 8, Financial Statements and Supplementary Data, of this Annual Report on Form 10-K regarding Delek's acquisition of the outstanding limited partner units which Delek did not already own in an all-equity transaction on February 7, 2018. Our marketing of transportation fuels produced at the Big Spring refinery is focused on central and west Texas, Oklahoma, New Mexico and Arizona. We provide substantially all of our branded customers motor fuels, brand support and payment processing services in addition to the license of the Alon brand name and associated trade dress. We market transportation fuel production from our Krotz Springs refinery substantially through bulk sales and exchange channels. These bulk sales and exchange arrangements are entered into with various oil companies and trading companies and are transported to markets on the Mississippi River and the Atchafalaya River, as well as to the Colonial Pipeline.
64
Our logistics segment gathers, transports and stores crude oil and markets, distributes, transports and stores refined products in select regions of the southeastern United States and west Texas for our refining segment and third parties.
At
December 31, 2017
, we owned a
61.5%
limited partner interest in Delek Logistics Partners, LP ("Delek Logistics") and a
94.6%
interest in the entity that owns the entire
2.0%
general partner interest in Delek Logistics and all of the incentive distribution rights. Delek Logistics was formed by Delek in 2012 to own, operate, acquire and construct crude oil and refined products logistics and marketing assets. Delek Logistics' initial assets were contributed by us and included certain assets formerly owned or used by certain of our subsidiaries. A substantial majority of Delek Logistics' assets are currently integral to our refining and marketing operations.
Our profitability in the refining segment is substantially determined by the difference between the cost of the crude oil feedstocks we purchase and the price of the refined products we sell, referred to as the "crack spread", "refining margin" or "refined product margin". The cost to acquire feedstocks and the price of the refined petroleum products we ultimately sell from our refineries depend on numerous factors beyond our control, including the supply of, and demand for, crude oil, gasoline and other refined petroleum products which, in turn, depend on, among other factors, changes in domestic and foreign economies, weather conditions such as hurricanes or tornadoes, local, domestic and foreign political affairs, global conflict, production levels, the availability of imports, the marketing of competitive fuels and government regulation. Other significant factors that influence our results in the refining segment include operating costs (particularly the cost of natural gas used for fuel and the cost of electricity), seasonal factors, refinery utilization rates and planned or unplanned maintenance activities or turnarounds. Moreover, while the fluctuations in the cost of crude oil are typically reflected in the prices of light refined products, such as gasoline and diesel fuel, the price of other residual products, such as asphalt, coke, carbon black oil and LPG are less likely to move in parallel with crude cost. This could cause additional pressure on our realized margin during periods of rising or falling crude oil prices. Additionally, our margins are impacted by the pricing differentials of the various types and sources of crude oil we use at our refineries and their relation to product pricing, such as the differentials between WTI Midland and WTI Cushing or WTI Midland and Brent crude oil.
With respect to measuring our refining margins at our refineries, we consider the following:
|
•
|
For our Tyler refinery, we compare our per barrel refined product margin to the Gulf Coast 5-3-2 crack spread. The Gulf Coast 5-3-2 crack spread is used as a benchmark for measuring a refinery's product margins by measuring the difference between the market price of light products and crude oil, and represents the approximate gross margin resulting from processing one barrel of crude oil into three-fifths of a barrel of gasoline and two-fifths of a barrel of high-sulfur diesel.
|
|
•
|
For our Big Spring refinery, we compare our per barrel refined product margin to the Gulf Coast 3-2-1 crack spread. The Gulf Coast 3-2-1 crack spread is calculated assuming that three barrels of WTI Cushing crude oil are converted, or cracked, into two barrels of Gulf Coast conventional gasoline and one barrel of Gulf Coast ultra-low sulfur diesel. Our Big Spring refinery is capable of processing substantial volumes of sour crude oil, which has historically cost less than intermediate, and/or substantial volumes of sweet crude oils, and therefore the WTI Cushing/WTS price differential, taking into account differences in production yield, is an important measure for helping us make strategic, market-respondent production decisions.
|
|
•
|
For our Krotz Springs refinery, we compare our per barrel refined product margin to the Gulf Coast 2-1-1 high sulfur diesel crack spread, which is calculated assuming that two barrels of LLS crude oil are converted into one barrel of Gulf Coast conventional gasoline and one barrel of Gulf Coast high sulfur diesel. The Krotz Springs refinery has the capability to process substantial volumes of light sweet, crude oils to produce a high percentage of refined light products.
|
|
•
|
The crude oil and product slate flexibility of the El Dorado refinery allows us to take advantage of changes in the crude oil and product markets; therefore, we anticipate that the quantities and varieties of crude oil processed and products manufactured at the El Dorado refinery by processing a variety of feedstocks into a number of refined product types will continue to vary. Thus, we do not believe that it is possible to develop a reasonable refined product margin benchmark that would accurately portray our refined product margins at the El Dorado refinery.
|
A widening of the WTI Cushing less WTI Midland spread will favorably influence the operating margin for our refineries. Alternatively, a narrowing of this differential will have an adverse effect on our operating margins. Global product prices are influenced by the price of Brent crude which is a global benchmark crude. Global product prices influence product prices in the U.S. As a result, our refineries are influenced by the spread between Brent crude and WTI Midland. The Brent less WTI Midland spread represents the differential between the average per barrel price of Brent crude oil and the average per barrel price of WTI Cushing crude oil. A widening of the spread between Brent and WTI Cushing will favorably influence our refineries' operating margins. Also, the Krotz Springs refinery is influenced by the spread between Brent crude and LLS. The Brent less LLS spread represents the differential between the average per barrel price of Brent crude oil and the average per barrel price of LLS crude oil. A discount in LLS relative to Brent will favorably influence the Krotz Springs refinery operating margin.
The cost to acquire the refined fuel products we sell to our wholesale customers in our logistics segment and at our convenience stores in our retail segment depends on numerous factors beyond our control, including the supply of, and demand for, crude oil, gasoline and other refined petroleum products which, in turn, depend on, among other factors, changes in domestic and foreign economies, weather conditions, domestic
65
and foreign political affairs, production levels, the availability of imports, the marketing of competitive fuels and government regulation. Our retail merchandise sales are driven by convenience, customer service, competitive pricing and branding. Motor fuel margin is sales less the delivered cost of fuel and motor fuel taxes, measured on a cents per gallon basis. Our motor fuel margins are impacted by local supply, demand, weather, competitor pricing and product brand.
As part of our overall business strategy, we regularly evaluate opportunities to expand our portfolio of businesses and may at any time be discussing or negotiating a transaction that, if consummated, could have a material effect on our business, financial condition, liquidity or results of operations.
2018
Strategic Goals
|
•
|
Maintain and continue to enhance our safe operations.
As we invest in and grow our business, we remain focused on safe and compliant operations for the benefit of our employees, communities, customers and shareholders.
|
|
•
|
Successful integration of the Alon transaction.
We made great progress during 2017 to integrate the Alon organization. Our goal is to complete this process in 2018, as we apply best practices to improve performance of a larger organization. We are continuing to realize synergies that are expected to have a positive effect on our combined operations.
|
|
•
|
Build on a winning culture.
In 2017, we believe our team responded well to our larger scale, as steps were taken to integrate the two companies following the acquisition of Alon in July 2017. We are now a larger and more diverse company, but our focus is to foster a culture that has the ability to act quickly in a changing environment to take advantage of opportunities. In order to support this operation, we are focused on expanding our team, developing systems and providing the resources to position the organization for success in the future.
|
|
•
|
Enhance our position in the Permian Basin.
Our 300,000 barrels per day of crude throughput capacity is primarily a WTI-linked crude oil slate that is weighted to supply from the Permian Basin through our access to approximately 200,000 barrels per day. In addition, we have complementary retail and logistics presence in the area. Our strategic focus will be to evaluate options to utilize our position to create additional growth across our businesses.
|
|
•
|
Grow our logistics operations.
The combination of our access to the Permian Basin and larger refining operation should allow us to continue to grow our logistics footprint. We will look for opportunities to capitalize on this position to increase our crude gathering operations, support the refining system and third party customers. This includes exploring opportunities for continued development through joint ventures and opportunities to acquire assets in markets that are complementary to our existing geographic footprint.
|
|
•
|
Optimization of our refining system.
We have doubled the size of our refining system since 2016. This gives us the opportunities to utilize the best practices from each location to improve reliability, efficiencies and yields in an effort to maximize performance. This should enhance our competitive position and free cash flow potential.
|
|
•
|
Use our financial flexibility and cash flow to create shareholder value.
We are focused on managing the cash flow in our business to support our capital allocation program that includes: 1) returning cash to shareholders through dividends and share repurchases, 2) investing in our business and 3) growing through acquisitions - all of which combine to serve our central goal of increasing long-term value for our shareholders.
|
Recent Strategic Developments
Delek/Alon Merger
In January 2017, we announced that Old Delek (and various related entities) entered into a Merger Agreement with Alon, as subsequently amended on February 27 and April 21, 2017. The related mergers (the "Merger" or the "Delek/Alon Merger") were effective July 1, 2017 (as previously defined, the “Effective Time”), resulting in a new post-combination consolidated registrant renamed as Delek US Holdings, Inc. (as previously defined, “New Delek”), with Alon and Old Delek surviving as wholly-owned subsidiaries of New Delek. New Delek is the successor issuer to Old Delek and Alon pursuant to Rule 12g-3(c) under the Exchange Act, as amended. In addition, as a result of the Delek/Alon Merger, the shares of common stock of Old Delek and Alon were delisted from the New York Stock Exchange in July 2017, and their respective reporting obligations under the Exchange Act were terminated. The Merger resulted in total stock consideration paid of approximately $509.0 million consisting of approximately 19.3 million incremental shares of New Delek Common Stock.
Subject to the terms and conditions of the Merger Agreement, at the Effective Time, each issued and outstanding share of Alon Common Stock, other than shares owned by Old Delek and its subsidiaries or held in the treasury of Alon, was converted into the right to receive 0.504 of a share of New Delek Common Stock, or, in the case of fractional shares of New Delek Common Stock, cash (without interest) in an amount equal to the product of (i) such fractional part of a share of New Delek Common Stock multiplied by (ii) $25.96 per share, which was the volume weighted average price of the Old Delek Common Stock, par value $0.01 per share as reported on the NYSE Composite Transactions Reporting
66
System for the twenty consecutive NYSE full trading days ending on June 30, 2017. Each outstanding share of restricted Alon Common Stock was assumed by New Delek and converted into restricted stock denominated in shares of New Delek Common Stock. Committed but unissued share-based awards were exchanged and converted into rights to receive share-based awards indexed to New Delek Common Stock. Conversions of restricted shares and unissued share-based awards were also subject to the exchange ratio.
In addition, subject to the terms and conditions of the Merger Agreement, each share of Old Delek Common Stock or fraction thereof issued and outstanding immediately prior to the Effective Time (other than Old Delek Common Stock held in the treasury of Old Delek) was converted at the Effective Time into the right to receive one validly issued, fully paid and assessable share of New Delek Common Stock or such fraction thereof equal to the fractional share of New Delek Common Stock. All existing Old Delek stock options, restricted stock awards and stock appreciation rights were converted into equivalent rights with respect to New Delek Common Stock.
In connection with the Merger, Alon, New Delek and U.S. Bank National Association, as trustee (the “Trustee”), entered into a First Supplemental Indenture (the “Supplemental Indenture”), effective as of July 1, 2017, supplementing the Indenture, dated as of September 16, 2013 (the “Original Indenture”; the Original Indenture, as amended by the Supplemental Indenture, is referred to as the "Indenture"), pursuant to which Alon issued its 3.00% Convertible Senior Notes due 2018 (the “Convertible Notes”), which were convertible into shares of Alon’s Common Stock, par value $0.01 per share or cash or a combination of cash and Alon Common Stock, all as provided in the Indenture. The Supplemental Indenture provides that, as of the Effective Time, the right to convert each $1,000 principal amount of the Notes based on a number of shares of Alon Common Stock equal to the Conversion Rate (as defined in the Indenture) in effect immediately prior to the Merger was changed into a right to convert each $1,000 principal amount of Notes into or based on a number of shares of New Delek Common Stock (at the exchange ratio of 0.504), par value $0.01 per share, equal to the Conversion Rate in effect immediately prior to the Merger. In addition, the Supplemental Indenture provides that, as of the Effective Time, New Delek fully and unconditionally guaranteed, on a senior basis, Alon’s obligations under the Notes.
The primary purpose of the Merger was to enter into a strategic combination that has resulted in a larger, more diverse company that we believe is well positioned to take advantage of opportunities in the market and better navigate the cyclical nature of the business. The combination is also expected to provide opportunities for synergies across the organization as well as create a refining system that enhances its position as a significant buyer of crude from the Permian Basin among the independent refiners.
California Discontinued Entities
During the third quarter 2017, we committed to a plan to sell certain assets associated with our Paramount and Long Beach, California refineries and our California renewable fuels facility, which were acquired as part of the Delek/Alon Merger (collectively, the "California Discontinued Entities"). As a result of this decision and commitment to a plan, and because it was made within three months of the Delek/Alon Merger, we met the requirements under ASC 205-20 and ASC 360 to report the results of the California Discontinued Entities as discontinued operations and to classify the California Discontinued Entities as a group of assets held for sale. The sale of all the assets of the California Discontinued Entities is currently anticipated to occur within the next 6-9 months. The property, plant and equipment of the California Discontinued Entities were recorded at fair value as part of the Delek/Alon Merger, and we did not record any depreciation of these assets since the Delek/Alon Merger.
Acquisition of Non-controlling Interest in Alon Partnership
On November 8, 2017, Delek and the Alon Partnership entered into a definitive merger agreement under which Delek agreed to acquire all of the outstanding limited partner units which Delek did not already own in an all-equity transaction. This transaction was approved by all voting members of the board of directors of the general partner of the Alon Partnership upon the recommendation from its conflicts committee and by the board of directors of Delek. This transaction closed on February 7, 2018. Delek owned approximately
51.0 million
limited partner units of the Alon Partnership, or approximately
81.6%
of the outstanding units immediately prior to the transaction date. Under terms of the merger agreement, the owners of the remaining outstanding units in the Alon Partnership that Delek did not currently own immediately prior to the transaction date received a fixed exchange ratio of
0.49
shares of New Delek common stock for each limited partner unit of the Alon Partnership, resulting in the issuance of approximately
5.6 million
shares to the public unitholders of the Alon Partnership.
El Dorado Refinery RIN Waiver
In March 2017, the El Dorado refinery received approval from the Environmental Protection Agency for a small refinery exemption from the requirements of the renewable fuel standard for the 2016 calendar year. This waiver resulted in approximately
$47.5 million
of Renewable Identification Number ("RIN") expense reduction during 2017, based on an aggregated average price of $0.45 per RIN.
Return to Shareholders
67
Dividends
On
December 15, 2017
, we paid a regular quarterly dividend of
$0.15
per share of our common stock, declared on
November 7, 2017
to shareholders of record on
August 23, 2017
. On
February 26, 2018
, Delek's Board of Directors voted to declare a quarterly cash dividend of
$0.20
per share, payable on
March 26, 2018
, to stockholders of record on
March 12, 2018
.
Share Repurchase Program
In December 2016, our Board of Directors authorized a share repurchase program for up to $150.0 million of Delek common stock. Any share repurchases under the repurchase program may be implemented through open market transactions or in privately negotiated transactions, in accordance with applicable securities laws. The timing, price, and size of repurchases will be made at the discretion of management and will depend on prevailing market prices, general economic and market conditions and other considerations. The repurchase program does not obligate us to acquire any particular amount of stock and does not expire. There were no shares repurchased prior to December 5, 2017 under this program. During the period from December 5, 2017 to
December 31, 2017
, we repurchased
762,623
shares of our common stock under the repurchase authorization, for a total expenditure of approximately
$25.0 million
.
As of February 25, 2018, there was approximately
$32.2 million
remaining under Delek's $150.0 million December 2016 share repurchase authorization, taking into account the share repurchase from Alon Israel discussed below. On February 26, 2018, the Board of Directors approved a new $150.0 million authorization to repurchase Delek common stock. This amount has no expiration date and is in addition to any remaining amounts previously authorized.
Share Repurchase from Alon Israel
On January 23, 2018, Delek repurchased 2.0 million shares of its common stock from Alon Israel Oil Company, Ltd. (“Alon Israel”) in connection with Delek’s rights pursuant to a Stock Purchase Agreement dated April 14, 2015 (the “SPA”), by and between Delek and Alon Israel. Alon Israel delivered a right of first offer notice to Delek on January 16, 2018, informing Delek of Alon Israel’s intention to sell the 2.0 million shares, and Delek accepted such offer on January 17, 2018. The total purchase price was approximately $75.3 million, or $37.64 per share.
68
Market Trends
Our results of operations are significantly affected by fluctuations in the prices of certain commodities, including, but not limited to, crude oil, gasoline, distillate fuel, biofuels and natural gas and electricity, among others. Historically, our profitability has been affected by commodity price volatility, specifically as it relates to the price of crude oil and refined products.
The table below reflects the quarterly high, low and average prices of WTI Cushing crude oil for each of the quarterly periods over the past three years.

As US crude oil production has increased, we have seen the discount for WTI Cushing widen compared to Brent. This generally leads to higher margins in our refineries as refined product prices are influenced by Brent crude prices and the majority of our crude supply is WTI-linked. The discount for WTI Cushing compared to Brent increased to
$3.95
during
2017
from
$1.85
during
2016
. We note similar historical trends when reviewing the discount for LLS compared to WTI Cushing, where the discount increased to
$3.23
during
2017
from
$1.69
during
2016
. Additionally, our refineries continue to have greater access to WTI Midland and WTI Midland-linked crude feedstocks compared to certain of our competitors. The discount for WTI Midland compared to WTI Cushing increased to
$0.34
during
2017
from
$0.08
during
2016
. As these price discounts increase, so does our competitive advantage, created by our access to WTI-linked crude oil. The chart below illustrates the differentials of both Brent crude oil and WTI Midland crude oil as compared to WTI Cushing crude oil over the past three years.
69
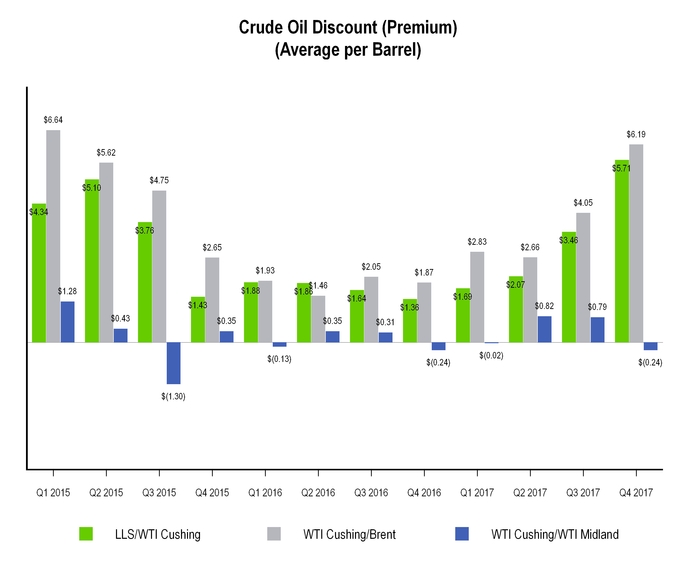
70
The table below reflects the quarterly high, low and average Gulf Coast 5-3-2 crack spread (Tyler benchmark) for each of the quarterly periods over the past three years.

The table below reflects the quarterly high, low and average Gulf Coast 3-2-1 crack spread (Big Spring benchmark) for the past three years, where we have owned the Big Spring refinery only since the Delek/Alon Merger.
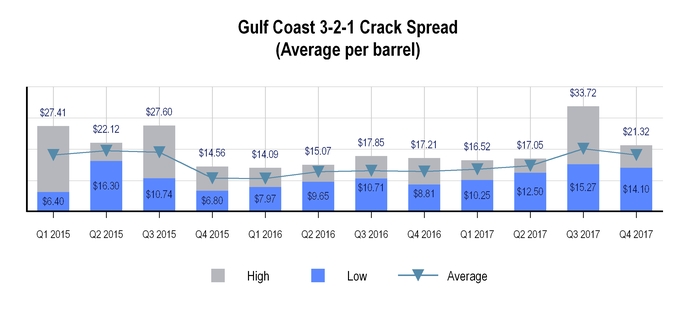
71
The table below reflects the quarterly high, low and average Gulf Coast 2-1-1 crack spread (Krotz Springs benchmark) for the past three years, where we have owned the Krotz Springs refinery only since the Delek/Alon Merger.
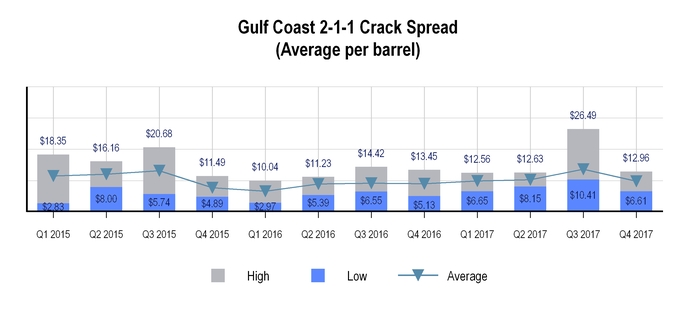
The market price of refined products contributed to the increase in the average Gulf Coast 5-3-2 crack spread to
$13.01
in
2017
from
$9.19
in
2016
, with the Gulf Coast price of gasoline (CBOB) increasing
19.2%
, from an average of
$1.30
per gallon in
2016
to
$1.55
per gallon in
2017
and the Gulf Coast price of High Sulfur Diesel increased
24.6%
, from an average of
$1.18
per gallon in
2016
to
$1.47
per gallon in
2017
. The charts below illustrate the quarterly high, low and average prices of Gulf Coast Gasoline and U.S. High Sulfur Diesel over the past three years.
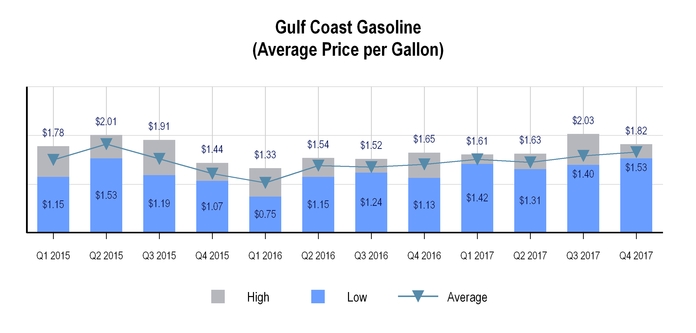
72
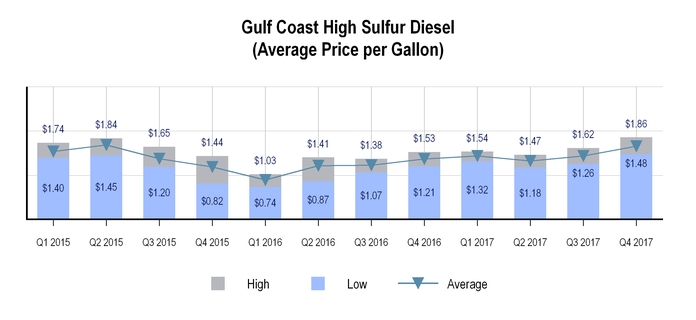
Environmental
regulations continue to affect our margins in the form of the increasing cost of RINs
. On a consolidated basis, we work to balance our RINs obligations in order to minimize the effect of RINs on our results. While we generate RINs in both of our refining and logistics segments through our ethanol blending and biodiesel production, our refining segment needs to purchase additional RINs to satisfy its obligations. As a result, increases in the price of RINs generally adversely affect our results of operations. It is not possible at this time to predict with certainty what future volumes or costs may be, but given the increase in required volumes and the volatile price of RINs, the cost of purchasing sufficient RINs could have an adverse impact on our results of operations if we are unable to recover those costs in the price of our refined products. The chart below illustrates the volatile nature of the price for RINs over the past three years.
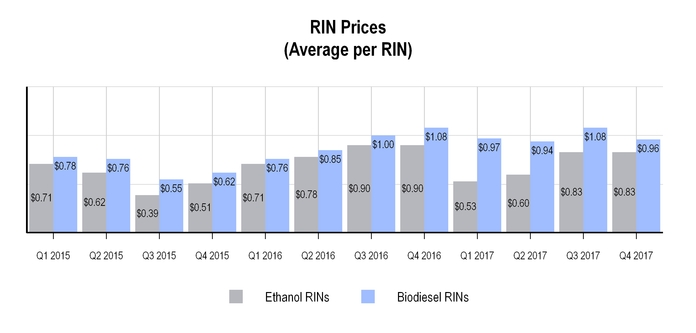
73
Results of Operations
The following table provides summary financial data for Delek (in millions):
|
Year Ended December 31,
|
||||||||||||
|
2017
|
2016
|
2015
|
||||||||||
|
Net sales
|
$
|
7,267.1
|
|
$
|
4,197.9
|
|
$
|
4,782.0
|
|
|||
|
Operating costs and expenses:
|
|
|||||||||||
|
Cost of goods sold
|
6,327.6
|
|
3,812.9
|
|
4,236.9
|
|
||||||
|
Operating expenses
|
429.0
|
|
249.3
|
|
270.3
|
|
||||||
|
Insurance proceeds — business interruption
|
—
|
|
(42.4
|
)
|
—
|
|
||||||
|
General and administrative expenses
|
169.8
|
|
106.1
|
|
100.6
|
|
||||||
|
Depreciation and amortization
|
153.3
|
|
116.4
|
|
106.0
|
|
||||||
|
Other operating expense (income), net
|
1.0
|
|
4.8
|
|
(0.5
|
)
|
||||||
|
Total operating costs and expenses
|
7,080.7
|
|
4,247.1
|
|
4,713.3
|
|
||||||
|
Operating income (loss)
|
186.4
|
|
(49.2
|
)
|
68.7
|
|
||||||
|
Interest expense
|
93.8
|
|
54.4
|
|
52.1
|
|
||||||
|
Interest income
|
(4.0
|
)
|
(1.5
|
)
|
(1.1
|
)
|
||||||
|
(Income) loss from equity method investments
|
(12.6
|
)
|
43.4
|
|
(2.0
|
)
|
||||||
|
Loss on impairment of equity method investment
|
—
|
|
245.3
|
|
—
|
|
||||||
|
Gain on remeasurement of equity method investment
|
(190.1
|
)
|
—
|
|
—
|
|
||||||
|
Other expense (income), net
|
—
|
|
0.4
|
|
(1.6
|
)
|
||||||
|
Total non-operating (income) expenses, net
|
(112.9
|
)
|
342.0
|
|
47.4
|
|
||||||
|
Income (loss) from continuing operations before income tax benefit
|
299.3
|
|
(391.2
|
)
|
21.3
|
|
||||||
|
Income tax benefit
|
(29.2
|
)
|
(171.5
|
)
|
(15.8
|
)
|
||||||
|
Income (loss) from continuing operations
|
328.5
|
|
(219.7
|
)
|
37.1
|
|
||||||
|
Discontinued operations:
|
||||||||||||
|
(Loss) income from discontinued operations
|
(8.6
|
)
|
144.2
|
|
5.7
|
|
||||||
|
Income tax (benefit) expense
|
(2.7
|
)
|
57.9
|
|
(0.9
|
)
|
||||||
|
(Loss) income from discontinued operations, net of tax
|
(5.9
|
)
|
86.3
|
|
6.6
|
|
||||||
|
Net income (loss)
|
322.6
|
|
(133.4
|
)
|
43.7
|
|
||||||
|
Net income attributed to non-controlling interests
|
33.8
|
|
20.3
|
|
24.3
|
|
||||||
|
Net income (loss) attributable to Delek
|
$
|
288.8
|
|
$
|
(153.7
|
)
|
$
|
19.4
|
|
|||
74
Consolidated Results of Operations — Comparison of the
Year Ended
December 31, 2017
versus the
Year Ended
December 31, 2016
and the Year Ended
December 31, 2016
versus the Year Ended
December 31, 2015
Net Sales
We generated net sales of
$7,267.1 million
and
$4,197.9 million
during the years ended
December 31, 2017
and
2016
, respectively, an increase of
$3,069.2 million
, or
73.1%
. The increase in net sales was primarily due to the addition of Alon financial results as a result of the Delek/Alon Merger, which contributed net sales of
$1,867.6 million
during
2017
, and the effects of increases in the price of finished petroleum products at our refineries, combined with increases in sales volumes in our refining and logistics segments during
2017
, compared to
2016
.
We generated net sales of
$4,197.9 million
and
$4,782.0 million
during the years ended
December 31, 2016
and
2015
, respectively, a decrease of
$584.1 million
, or
12.2%
. The decrease in net sales was primarily attributable to decreases in refined product sales prices across both our refining and logistics segments, as well as decreased sales volumes attributed to our west Texas operations in the logistics segment for
2016
, as compared to 2015. These decreases were partially offset by an increase in sales volumes at the Tyler refinery, attributable to lower volumes in 2015 due to downtime at the Tyler refinery related to the turnaround and expansion project completed in the first quarter of 2015.
Cost of Goods Sold
Cost of goods sold was
$6,327.6 million
for the year ended
December 31, 2017
, compared to
$3,812.9 million
for
2016
, an increase of
$2,514.7 million
, or
66.0%
. The increase in cost of goods sold primarily related to the addition of Alon financial results as a result of the Delek/Alon Merger, which contributed cost of goods sold of
$1,493.1 million
during
2017
, and the increase in the cost of both crude oil feedstocks at the refineries and refined products in the logistics segment, as well as increases in sales volumes in our refining and logistics segments, partially offset by the $47.5 million reduction in RINs expense associated with the RINs waiver received by the El Dorado refinery in the first quarter of
2017
.
Cost of goods sold was
$3,812.9 million
for the year ended
December 31, 2016
, compared to
$4,236.9 million
for
2015
, a decrease of
$424.0 million
, or
10.0%
. The decrease in cost of goods sold was primarily due to a decrease in the average cost of refined products in the logistics segment, a decrease in the cost of crude oil in the refining segment and a decrease in sales volumes in the west Texas operations in the logistics segment and a decrease in throughputs at the El Dorado refinery. Partially offsetting these decreases were losses associated with our hedging program of $45.6 million for the year ended December 31, 2016, compared to losses of $10.2 million for the year ended December 31, 2015
.
Operating Expenses
Operating expenses were
$429.0 million
for the
year ended
December 31, 2017
compared to
$249.3 million
in
2016
, an increase of
$179.7 million
, or
72.1%
. The increase in operating expenses was primarily due to the addition of Alon financial results as a result of the Delek/Alon Merger, which contributed operating expenses of
$172.6 million
during
2017
.
Operating expenses were
$249.3 million
for the
year ended
December 31, 2016
compared to
$270.3 million
in
2015
, a decrease of
$21.0 million
, or
7.8%
. The decrease in operating expenses is primarily attributable to decreases in utilities and oil spill remediation expenses in the refining segment, reduced maintenance expenses in the logistics segment and cost reduction initiatives at both the refining and logistics segments. These decreases were partially offset by a full year of operating expenses at the Tyler refinery for the
year ended
December 31, 2016
, as compared to reduced expenses resulting from the downtime associated with the turnaround and an expansion project during the first quarter of 2015, and increased expenses associated with an internal tank contamination at one of our terminal locations in the logistics segment.
Insurance proceeds — business interruption
We recognized proceeds from business interruption insurance claims of
$42.4 million
for the
year ended
December 31, 2016
, associated with a litigation settlement. We did not record any insurance proceeds for the years ended
December 31, 2017
or
2015
.
General and Administrative Expenses
General and administrative expenses were
$169.8 million
for the year ended
December 31, 2017
compared to
$106.1 million
in
2016
, an increase of
$63.7 million
, or
60.0%
. The increase was primarily due to the addition of Alon financial results as a result of the Delek/Alon Merger, which contributed general and administrative expenses of
$37.4 million
during
2017
, as well as additional absorbed overhead cost, integration costs and related transaction costs incurred during
2017
. Transaction costs related to the Delek/Alon Merger incurred by the Company totaled approximately
$24.7 million
, inclusive of
$10.0 million
of merger costs and
$14.7 million
of non-recurring costs associated with the transaction for the year ended
December 31, 2017
, and
$3.0 million
of merger costs for the year ended
December 31, 2016
.
General and administrative expenses were
$106.1 million
for the year ended
December 31, 2016
compared to
$100.6 million
in
2015
, an increase of
$5.5 million
, or
5.5%
. The overall increase was primarily due to expenses associated with the Retail Transaction and the Delek/Merger, as well as a decrease in expenses in 2015 due to a reimbursement of expenses associated with the insurance proceeds mentioned above. These increases were partially offset by a decrease in expenses associated with a new payroll system project initiated in 2015.
75
Depreciation and Amortization
Depreciation and amortization was
$153.3 million
and
$116.4 million
for the years ended
December 31, 2017
and
2016
, respectively, an increase of
$36.9 million
, or
31.7%
. The increase in depreciation expense was primarily attributable due to the addition of Alon property, plant and equipment of
$1,130.5 million
(at preliminary fair value) and amortizable intangibles of
$51.0 million
(at preliminary fair value) as a result of the Delek/Alon Merger and other capital expenditures and acquisitions completed in
2017
as compared to
2016
. The acquisition of Alon contributed
$34.4 million
in additional depreciation and amortization during
2017
.
Depreciation and amortization was
$116.4 million
and
$106.0 million
for the years ended
December 31, 2016
and
2015
, respectively, an increase of
$10.4 million
, or
9.8%
.This increase was primarily attributable to the turnaround and expansion of the Tyler refinery completed in the first quarter of 2015, as well as other capital expenditures and acquisitions completed in 2015.
Other Operating (Income) Expense, Net
Other operating expense, net for the year ended
December 31, 2017
was
$1.0 million
and primarily related to losses on asset disposals in
2017
. Other operating expense, net for the year ended
December 31, 2016
was
$4.8 million
, and primarily related to losses on asset disposals in 2016. Other operating income, net for the year ended
December 31, 2015
was
$0.5 million
, and primarily related to settlement of certain sales and use tax overpayments from prior years, partially offset by a
$2.2 million
impairment of certain equipment assets in our refining segment.
Interest Expense
Interest expense was
$93.8 million
in the year ended
December 31, 2017
, compared to
$54.4 million
for
2016
, an increase of
$39.4 million
, or
72.4%
. The increase was primarily attributable to the addition of assumed debt totaling
$568.0 million
(at fair value) in connection with the Delek/Alon Merger and increases in the weighted average interest rate, including LIBOR interest rates, under our credit facilities.
Interest expense was
$54.4 million
in the year ended
December 31, 2016
, compared to
$52.1 million
for
2015
, an increase of
$2.3 million
, or
4.4%
. The increase was primarily attributable to interest costs associated with increased debt levels related to the investment in Alon as well as increases in LIBOR interest rates. The increase was partially offset by $3.9 million in one-time fees associated with the amendment of the Lion Term Loan in the second quarter of 2015.
Results from Equity Method Investments
We recognized income from equity method investments of
$12.6 million
in the year ended
December 31, 2017
, compared to loss of
$43.4 million
for
2016
. Changes in the results from equity method investments for
2017
and
2016
were primarily attributable to the fact that we did not have an equity method investment in Alon during the last half of
2017
. We recognized our proportionate share of the net income from our investment in Alon of
$4.5 million
, net of
$1.3 million
in amortization of the excess of our investment over our equity in the underlying net assets of Alon for
2017
, as compared to our proportionate share of the net loss from our investment in Alon of
$39.6 million
and
$2.6 million
in amortization of the excess of our investment over our equity in the underlying net assets of Alon for
2016
. Additionally, the increase is also attributable to our proportionate share of net income for equity method investments owned by Alon and acquired by Delek in connection with the Merger.
Loss from equity method investments was
$43.4 million
in the year ended
December 31, 2016
, compared to income of
$2.0 million
for
2015
. The change was primarily attributable to our proportionate share of the net (loss) income from our investment in Alon of
$(39.6) million
in the year ended
December 31, 2016
compared to
$4.1 million
for
2015
, which included a reduction of
$18.7 million
associated with an impairment of goodwill taken by Alon in the fourth quarter of
2015
. (Loss) income from equity method investments is net of
$2.6 million
and
$1.5 million
in amortization of the excess of our investment over our equity in the underlying net assets of Alon for the years ended
December 31, 2016
and
2015
, respectively.
Other Expense (Income), Net
Other expense (income), net was a
nominal
amount,
$0.4 million
and
$(1.6) million
in the years ended
December 31, 2017
,
2016
and
2015
, respectively, and was primarily attributable to changes in foreign currency gains/losses and miscellaneous other income/expense in all three years.
Income Taxes (Benefit) Expense
Income tax benefit was
$29.2 million
and
$171.5 million
during the years ended
December 31, 2017
and
2016
, respectively, a decrease of
$142.3 million
. The decrease in benefit was primarily attributable to pre-tax income of
$299.3 million
compared to pre- tax loss of
$391.2 million
for the years
2017
and
2016
, respectively, which resulted in income tax expense for
2017
as compared to benefit for
2016
, offset in
2017
by a
$166.9 million
benefit attributable to the impact of the 2017 Tax Cuts and Jobs Act . Our effective tax rate was
(9.8)%
for
2017
, compared to
43.8%
for
2016
. The decrease in our effective tax rate was primarily due to the impact of the 2017 Tax Cuts and Jobs Act .
Income tax benefit was
$171.5 million
and
$15.8 million
during the years ended
December 31, 2016
and
2015
, respectively, an increase of
$155.7 million
. Our effective tax rate was
43.8%
for
2016
, compared to
(74.2)%
for
2015
. The change in our effective tax rate for
2016
was primarily due to a decrease in state income taxes and lower pre-tax income for
2016
as compared to
2015
.
76
Operating Segments
We report operating results in three reportable segments: refining, logistics and retail. Decisions concerning the allocation of resources and assessment of operating performance are made based on this segmentation. Management measures the operating performance of each of its reportable segments based on the segment contribution margin.
Refining Segment
The tables and charts below set forth certain information concerning our refining segment operations ($ in millions, except per barrel amounts):
|
Year Ended December 31,
|
||||||||||||
|
2017
|
2016
|
2015
|
||||||||||
|
Net sales
|
$
|
6,620.6
|
|
$
|
3,923.2
|
|
$
|
4,440.2
|
|
|||
|
Cost of goods sold
|
5,852.2
|
|
3,614.1
|
|
4,022.2
|
|
||||||
|
Gross Margin
|
768.4
|
|
309.1
|
|
418
|
|
||||||
|
Operating expenses
|
317.7
|
|
212.4
|
|
225.4
|
|
||||||
|
Insurance proceeds - business interruption
|
—
|
|
(42.4
|
)
|
—
|
|
||||||
|
Contribution margin
|
$
|
450.7
|
|
$
|
139.1
|
|
$
|
192.6
|
|
|||
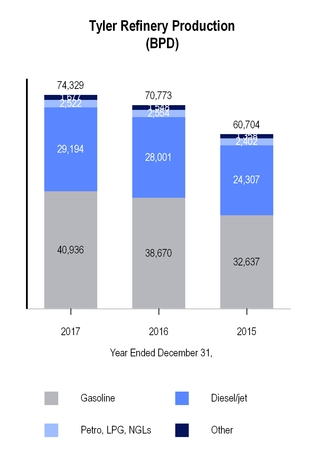

|
1
|
Sales volume includes
1,592
bpd,
622
bpd and
3,693
bpd of finished product sold to the logistics segment during the years ended
December 31, 2017
,
2016
and
2015
, respectively. Sales volume also includes sales of
129
bpd,
510
bpd and
1,800
bpd of intermediate and finished products to the El Dorado refinery during the years ended
December 31, 2017
,
2016
and
2015
, respectively. Sales volume also includes
138
bpd of produced finished product sold to the Alon Partnership during the last half of
2017
. Sales volume excludes
4,209
bpd and
1,008
bpd of wholesale activity during the years ended
December 31, 2017
and
2016
, respectively.
|

77
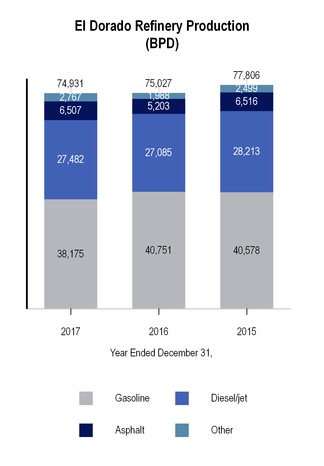
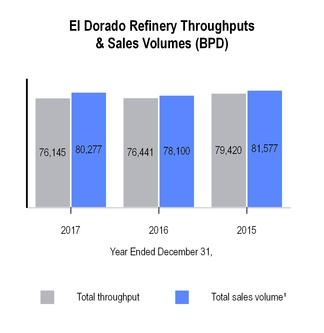
|
1
|
Sales volume includes
514
bpd,
102
bpd and
1,744
bpd of produced finished product sold to the Tyler refinery during the years ended
December 31, 2017
,
2016
and
2015
, respectively, and includes
566
bpd of produced finished product sold to Alon Asphalt Company during the last half of
2017
. Sales volume excludes
25,750
bpd,
20,465
bpd and
28,057
bpd of wholesale
|
activity during the years ended
December 31, 2017
,
2016
and
2015
, respectively.
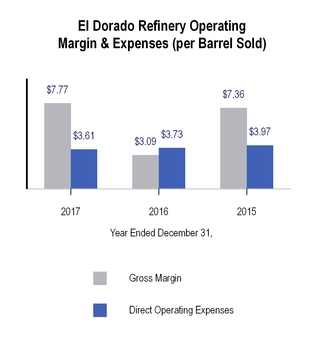
78

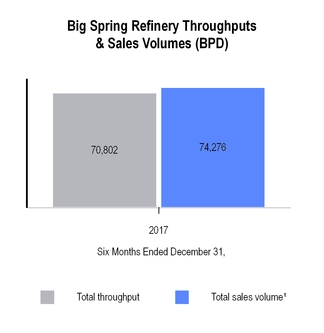
|
1
|
Sales volume includes
15,190
bpd sold to the retail segment,
1,510
bpd sold to Alon Asphalt Company and
176
bpd sold to the logistics segment during the last half of
2017
.
|
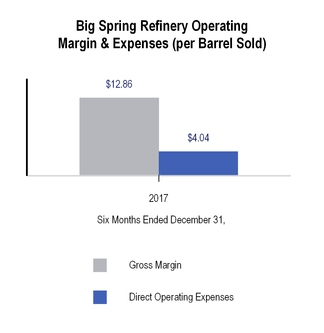
79
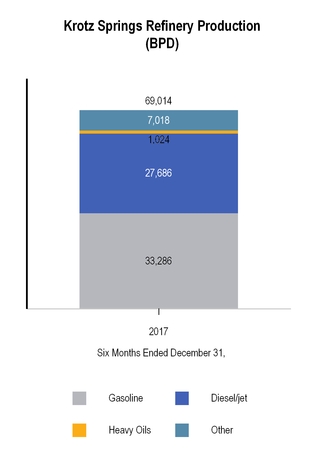
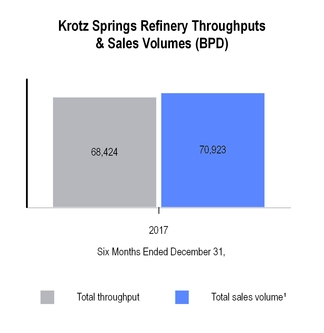
|
1
|
Sales volume includes
728
bpd sold to the El Dorado refinery and
60
bpd sold to the Tyler refinery during the last half of
2017
.
|
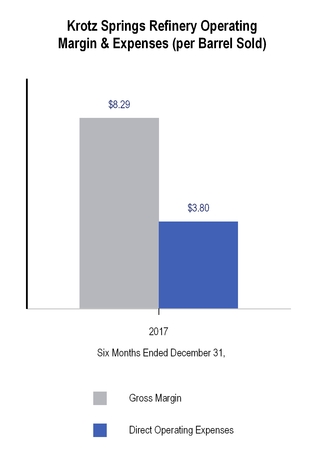
80
Refining Segment Operational Comparison of the
Year Ended
December 31, 2017
versus the
Year Ended
December 31, 2016
and the
Year Ended
December 31, 2016
versus the
Year Ended
December 31, 2015
Net Sales
Net sales for the refining segment were
$6,620.6 million
and
$3,923.2 million
during the years ended
December 31, 2017
and
2016
, respectively, an increase of
$2,697.4 million
, or
68.8%
. Significant contributors to the increase in net sales included the addition of the Big Spring and Krotz Springs refineries in connection with the Delek/Alon Merger in the second half of
2017
, as well as increases in the price of U.S. Gulf Coast gasoline, ULSD and HSD.
Net sales for the refining segment were
$3,923.2 million
and
$4,440.2 million
during the years ended
December 31, 2016
and
2015
, respectively, a decrease of
$517.0 million
, or
11.6%
. The decrease in net sales was primarily due to declines in the average price of Gulf Coast gasoline and diesel and a
4.3%
decrease in sales volumes at the El Dorado refinery. These declines were partially offset by an
18.1%
increase in net sales volume at the Tyler refinery. The increase in sales volume at the Tyler refinery was attributable to lower volumes in
2015
due to downtime at the Tyler refinery related to the turnaround and an expansion project completed in the first quarter of
2015
.
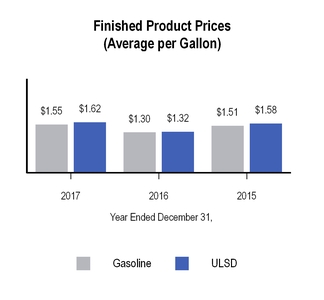
Cost of Goods Sold
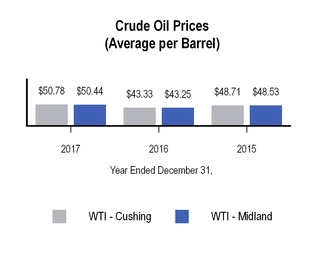
Cost of goods sold for the
year ended
December 31, 2017
was
$5,852.2 million
compared to
$3,614.1 million
for the
year ended
December 31, 2016
, an increase of
$2,238.1 million
, or
61.9%
. This increase was primarily attributable to the addition of the Big Spring and Krotz Springs refineries in connection with the Delek/Alon Merger in the second half of 2017, combined with an increase in the cost of WTI- Cushing crude oil from an average of
$43.33
per barrel for
2016
to an average of
$50.78
during 2017, and an increase in the cost of WTI - Midland crude oil, from an average of
$43.25
per barrel for 2016 to an average of
$50.44
during 2017. These increases were partially offset by a $47.5 million reduction in RINs expense associated with the RINs waiver received by the El Dorado refinery in the first quarter of
2017
.
Cost of goods sold for the
year ended
December 31, 2016
was
$3,614.1 million
compared to
$4,022.2 million
for the
year ended
December 31, 2015
, a decrease of
$408.1 million
, or
10.1%
. The decrease in cost of goods sold was primarily a result of the decrease in the cost of WTI crude oil, as well as the decrease in throughputs at the El Dorado refinery. These decreases were partially offset by an increase in throughputs at the Tyler refinery, as well as hedging losses associated with our hedging program of $43.5 million in
2016
, compared to losses of $10.7 million in
2015
.
Our refining segment has multiple service agreements with our logistics segment, which, among other things, require the refining segment to pay terminalling and storage fees based on the throughput volume of crude and finished product in the logistics segment pipelines and the volume of crude and finished product stored in the logistics segment storage tanks, subject to certain minimum volume commitments. These fees were
$129.6 million
,
$123.2 million
and
$121.6 million
during the years ended
December 31, 2017
,
2016
and
2015
, respectively, and are included in cost of goods sold for the refining segment. We eliminate these intercompany fees in consolidation.
81
Operating Expenses
Operating expenses were
$317.7 million
for the
year ended
December 31, 2017
, compared to
$212.4 million
in
2016
, an increase of
$105.3 million
, or
49.6%
. The increase in operating expenses was primarily due to the addition of the Big Spring and Krotz Springs refineries in connection with the Delek/Alon Merger in the second half of
2017
.
Operating expenses were
$212.4 million
for the
year ended
December 31, 2016
, compared to
$225.4 million
in
2015
, a decrease of
$13.0 million
, or
5.8%
. The decrease in operating expenses was primarily due to decreases in utilities expenses, primarily due to a reduction in natural gas prices and consumption, a decrease in oil spill remediation costs and certain cost reduction initiatives at both refineries. These were partially offset by a full year of operating expenses at the Tyler refinery f
or
the
year ended
December 31, 2016
, as compared to reduced expenses resulting from downtime associated with the turnaround and an expansion project completed in the first quarter of
2015
.
Contribution Margin
The refining segment contribution margin increase was primarily attributable to the addition of the Big Spring and Krotz Springs refineries in connection with the Delek/Alon Merger in the second half of 2017, combined with the
41.6%
improvement in the average Gulf Coast 5-3-2 crack spread in
2017
as compared to
2016
, which favorably impacted the period-over- period margins at all refineries, offset by business interruption insurance proceeds of
$42.4 million
associated with a settlement of litigation received in the first quarter of
2016
that did not recur in
2017
. This increase was also favorably impacted by a reduction in RINs expense, primarily associated with the $47.5 million reduction in RINs expense associated with the RINs waiver received by the El Dorado refinery in the first quarter of
2017
. Partially offsetting our refining segment contribution margin for
2017
was the recognition of the inventory fair value adjustment associated with purchase accounting as an increase in cost of goods sold during
2017
totaling $33.2 million, as the inventory acquired was sold.
Contribution margin for the refining segment for the year ended
December 31, 2016
was
$139.1 million
, or
78.1%
of our consolidated contribution margin, compared to
$192.6 million
, or
70.1%
of our consolidated segment contribution margin, for the year ended
December 31, 2015
. The decrease to the refining segment contribution margin was primarily attributable to a decline in operating margins at both refineries, which were partially offset by business interruption insurance proceeds of
$42.4 million
associated with a settlement of litigation received in the first quarter of 2016, as well as an increase in sales volumes at the Tyler refinery in the
year ended
December 31, 2016
, attributable to lower volumes in
2015
due to downtime at the Tyler refinery related to the turnaround and an expansion project completed in the first quarter of
2015
.

For the
year ended
December 31, 2016
as compared to 2015, margins at both the Tyler and El Dorado refineries were negatively impacted by the decline in the average differential between WTI Midland crude oil and WTI Cushing crude oil and a decline in the Gulf Coast 5-3-2 crack spread, which was driven by declines in the US Gulf Coast price of gasoline and High Sulfur Diesel of
13.9%
and
18.6%
, respectively, coupled with a lower decline in the cost of WTI crude oil of
11.0%
. In the Tyler refinery, Midland crude oil accounted for
81.7%
and
77.5%
of the crude slate in
2016
and
2015
, respectively. In the El Dorado refinery, Midland crude oil accounted for
70.6%
and
62.8%
of the crude slate in
2016
and
2015
, respectively. Further contributing to the decline in margins was an increase in consolidated RINs costs, net of benefits from our biodiesel facilities, for the refining segment, to
$40.4 million
in
2016
, from
$19.6 million
in
2015
.
82
Logistics Segment
The table below sets forth certain information concerning our logistics segment operations ($ in millions, except per barrel amounts):
|
Year Ended December 31,
|
||||||||||||
|
2017
|
2016
|
2015
|
||||||||||
|
Net sales
|
$
|
538.1
|
|
448.1
|
|
$
|
589.7
|
|
||||
|
Cost of goods sold
|
372.9
|
|
302.2
|
|
436.3
|
|
||||||
|
Gross Margin
|
165.2
|
|
145.9
|
|
153.4
|
|
||||||
|
Operating expenses
|
43.3
|
|
37.2
|
|
44.9
|
|
||||||
|
Contribution margin
|
$
|
121.9
|
|
$
|
108.7
|
|
$
|
108.5
|
|
|||
|
Operating Information:
|
||||||||||||
|
East Texas - Tyler Refinery sales volumes (average bpd)
(1)
|
73,655
|
|
68,131
|
|
59,174
|
|
||||||
|
West Texas wholesale marketing throughputs (average bpd)
|
13,817
|
|
13,257
|
|
16,357
|
|
||||||
|
West Texas wholesale marketing margin per barrel
|
$
|
4.03
|
|
$
|
1.43
|
|
$
|
1.35
|
|
|||
|
Terminalling throughputs (average bpd)
(2)
|
124,488
|
|
122,350
|
|
106,514
|
|
||||||
|
Throughputs (average bpd):
|
||||||||||||
|
Lion Pipeline System:
|
||||||||||||
|
Crude pipelines (non-gathered)
|
59,362
|
|
56,555
|
|
54,960
|
|
||||||
|
Refined products pipelines to Enterprise Systems
|
51,927
|
|
52,071
|
|
57,366
|
|
||||||
|
SALA Gathering System
|
15,871
|
|
17,756
|
20,673
|
|
|||||||
|
East Texas Crude Logistics System
|
15,780
|
|
12,735
|
18,828
|
||||||||
|
(1)
|
Excludes jet fuel and petroleum coke.
|
|
(2)
|
Consists of terminalling throughputs at our Tyler, Big Sandy and Mount Pleasant, Texas, El Dorado and North Little Rock, Arkansas and Memphis and Nashville, Tennessee terminals.
|
Logistics Segment Operational Comparison of the
Year Ended
December 31, 2017
versus the
Year Ended
December 31, 2016
and the
Year Ended
December 31, 2016
versus the
Year Ended
December 31, 2015
Net Sales
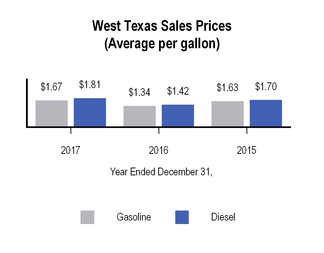
Net sales for the logistics segment were
$538.1 million
and
$448.1 million
during the years ended
December 31, 2017
and
2016
, respectively, an increase of
$90.0 million
, or
20.1%
. The increase was primarily attributable to increases in the average sales prices per gallon of gasoline and diesel and in volumes sold in our west Texas marketing operations. The average sales prices per gallon of gasoline and diesel sold increased
$0.33
per gallon and
$0.39
per gallon, respectively, during
2017
compared to average sales prices during
2016
. The net increase of gasoline and diesel gallons sold in west Texas was
8.0 million
gallons during
2017
compared to gallons sold during
2016
. Also contributing to the increase in net sales were increased fees associated with the marketing agreement between the logistics segment and the refining segment as a result of increased throughput due to higher demand following product supply disruptions associated with Hurricane Harvey. Partially offsetting the increase was a decline in fees on our Paline Pipeline System. During
2017
, the Paline Pipeline System was a FERC regulated pipeline with a tariff established for potential shippers, compared to
2016
, when the pipeline capacity was under contract with two third parties for a monthly fee.
Net sales included
$20.4 million
and
$16.9 million
of net service fees paid by our refining segment to our logistics segment during
2017
and
2016
, respectively. These service fees are based on the number of gallons sold and a shared portion of the margin achieved in return for providing sales and customer support services. Net sales also include crude and refined product transportation, terminalling and storage fees paid by our refining segment to our logistics segment. These fees were
$129.6 million
and
$123.2 million
in
2017
and
2016
, respectively. The logistics segment also sold
$5.6 million
and
$6.7 million
of RINs to the refining segment during
2017
and
2016
, respectively. These intercompany sales and fees are eliminated in consolidation.
83
The logistics segment generated net sales of
$448.1 million
and
$589.7 million
during the years ended
December 31, 2016
and
2015
, respectively, a decrease of
$141.6 million
, or
24.0%
. The decrease was primarily attributable to decreases in both the average sales prices per gallon of gasoline and diesel and in volumes sold in our west Texas marketing operations. The average sales prices per gallon of gasoline and diesel sold decreased
$0.29
per gallon and
$0.28
per gallon, respectively, during the year ended
December 31, 2016
, compared to average sales prices during
2015
. Volumes of gasoline and diesel sold in west Texas during 2016 decreased
33.5 million
gallons and
13.9 million
gallons, respectively, compared to gallons sold during 2015. Further contributing to the decrease were declines in fees on our Paline Pipeline System as a result of lower contractual volumes and declines in fuel surcharge revenues and lower asphalt hauling associated with our trucking assets. Partially offsetting the decreases were increased throughput at most of our terminals, the majority of which occurred at our terminals in El Dorado, Arkansas and Tyler, Texas, as operations matched commercial demand, and the effects of the throughput and tankage agreements for certain logistic assets in El Dorado and Tyler, pursuant to which we generated revenue on those assets during all periods for the year ended
December 31, 2016
, with no comparable revenue earned during the first quarter of
2015
. Also offsetting the decreases were increases in volumes and fees associated with the marketing agreement between the logistics segment and the refining segment, which increased primarily as a result of the turnaround that occurred at the Tyler Refinery in the first quarter of
2015
, during which the refinery was not fully operational.
Net sales included
$16.9 million
and
$15.2 million
of net service fees in our east Texas marketing business, paid by our refining segment during
2016
and
2015
, respectively. These service fees are based on the number of gallons sold and a shared portion of the margin achieved in return for providing sales and customer support services. Net sales also include crude, intermediate and refined product transportation, terminalling and storage fees paid by our refining segment. These fees were
$123.2 million
and
$121.6 million
in
2016
and
2015
, respectively. The logistics segment also sold
$6.7 million
and
$5.8 million
of RINs, at market prices, to the refining segment during
2016
and
2015
, respectively. These intercompany sales and fees are eliminated in consolidation.
Cost of Goods Sold
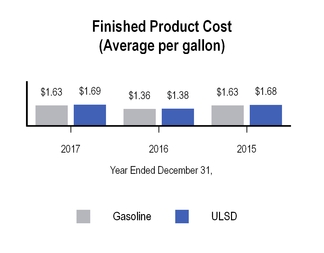
Cost of goods sold was
$372.9 million
for the
year ended
December 31, 2017
, compared to
$302.2 million
for
2016
, an increase of
$70.7 million
, or
23.4%
. The increase in cost of goods sold was primarily attributable to increases in the average cost per gallon of gasoline and diesel and in volumes purchased in our west Texas marketing operations. The average cost per gallon of gasoline and diesel purchased increased
$0.27
per gallon and
$0.31
per gallon, respectively, during
2017
, compared to average cost during
2016
. The net increase of gasoline and diesel gallons purchased in west Texas was
8.0 million
gallons during the year ended
December 31, 2017
, compared to gallons purchased during
2016
.
Cost of goods sold was
$302.2 million
for the
year ended
December 31, 2016
, compared to
$436.3 million
for
2015
, a decrease of
$134.1 million
, or
30.7%
. The decrease in cost of goods sold was primarily attributable to decreases in both the average cost per gallon of gasoline and diesel and in volumes purchased in our west Texas marketing operations. Gallons of gasoline and diesel purchased in west Texas decreased
33.5 million
gallons and
13.9 million
gallons, respectively, during the year ended
December 31, 2016
, compared to gallons purchased during
2015
.
Operating Expenses
Operating expenses were
$43.3 million
for the
year ended
December 31, 2017
compared to
$37.2 million
for the comparable period of
2016
, an increase of
$6.1 million
, or
16.4%
. The increase in operating expenses during the
year ended
December 31, 2017
, compared to
2016
was primarily due to increases in labor and utilities costs associated with certain of our pipelines as a result of increased usage and higher maintenance costs associated with certain of our tanks at our tank farms. Partially offsetting these increases were a reduction in operating expenses for one of our terminal locations at which we incurred increased costs related to internal tank contamination during
2016
that were not incurred during
2017
.
Operating expenses were
$37.2 million
for the
year ended
December 31, 2016
compared to
$44.9 million
for the comparable period of
2015
, a decrease of
$7.7 million
, or
17.1%
. The decrease in operating expenses during the year ended
December 31, 2016
,
84
compared to
2015
was due to cost saving initiatives taken during
2016
, which resulted in decreases in maintenance costs and supplies expenses associated with our terminals, including tanks at those terminals, and the SALA Gathering System. Partially offsetting these decreases were increases in operating expenses related to internal tank contamination at one of our terminals and hydro testing on our Paline Pipeline System.
Contribution Margin
Contribution margin for the logistics segment for the
year ended
December 31, 2017
was
$121.9 million
, or
23.9%
of our consolidated contribution margin, compared to
$108.7 million
, or
61.0%
of our consolidated contribution margin, for the
year ended
December 31, 2016
, an increase of
$13.2 million
, or
12.1%
. The increase in contribution margin was primarily attributable to improved contribution margin in our west Texas operations as a result of increased drilling activity in the region, which has improved market conditions and increased demand. Additionally, contribution margin in our west Texas operations benefited from higher margins during a period of product supply disruptions associated with Hurricane Harvey. Also contributing to the increase were increased fees associated with the marketing agreement as described above. Partially offsetting these increases was a decline in fees on our Paline Pipeline System as described above.
Contribution margin for the logistics segment for the
year ended
December 31, 2016
was
$108.7 million
, or
61.0%
of our consolidated contribution margin, compared to
$108.5 million
, or
39.5%
of our consolidated contribution margin, for the
year ended
December 31, 2015
, an increase of
$0.2 million
, or
0.2%
. The increase in contribution margin was primarily attributable to increased throughput at most of our terminals and increased fees associated with the Logistics Assets and marketing agreement as discussed above. Also contributing to the increase were improvements in our west Texas wholesale marketing margin per barrel as a result of improving market conditions in the region. Our contribution margin in our west Texas operations during the year ended December 31, 2015 was impacted by lower crude oil prices that reduced demand in the region and lowered throughput in our west Texas operations. Partially offsetting the increases were declines in fees on our Paline Pipeline System and declines in fuel surcharge revenues and lower asphalt hauling associated with our trucking assets as discussed above.
85
Retail Segment
The Retail Segment was not reported for the years ended
December 31, 2016
and
2015
, or for periods in
2017
prior to July 1, 2017 (the date of the Delek/Alon Merger), as our previous Retail Entities were discontinued, and the new Retail Segment was not acquired until July 1, 2017. The table below sets forth certain information concerning our retail segment operations ($ in millions):
|
Six Months Ended December 31,
|
||||
|
|
2017
|
|||
|
Net sales
|
$
|
426.7
|
|
|
|
Cost of goods sold
|
350.3
|
|
||
|
Gross Margin
|
76.4
|
|
||
|
Operating expenses
|
49.6
|
|
||
|
Contribution margin
|
$
|
26.8
|
|
|
|
Operating Information:
|
||||
|
Number of stores (end of period)
|
302
|
|
||
|
Average number of stores
|
302
|
|
||
Retail Segment Operational Comparison of the
Year Ended
December 31, 2017
versus the
Year Ended
December 31, 2016
Net Sales
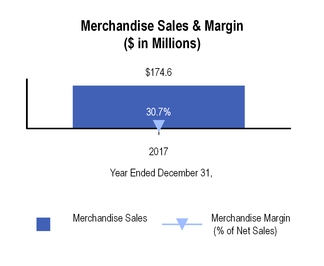
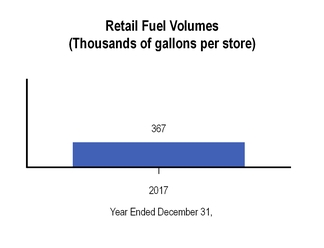
Net sales for the retail segment in the second half of
2017
were
$426.7 million
. The net sales were due to the addition of
302
convenience stores which market motor fuels in central and west Texas and New Mexico in connection with the Delek/Alon Merger. Retail fuel gallons sold for the retail segment were
107.6 million
gallons for the second half of
2017
, and total fuel sales, including wholesale dollars, were
$252.1 million
in the second half of
2017
. Merchandise sales for the retail segment were
$174.6 million
in the second half of
2017
.
Cost of Goods Sold
Cost of goods sold for the retail segment was
$350.3 million
in the second half of
2017
and was attributable to the addition of
302
convenience stores which market motor fuels in central and west Texas and New Mexico in connection with the Delek/Alon Merger.
Operating Expenses
Operating expenses for the retail segment were
$49.6 million
in the second half of
2017
and was attributable to the addition of
302
convenience stores which market motor fuels in central and west Texas and New Mexico in connection with the Delek/Alon Merger.
86
Contribution Margin
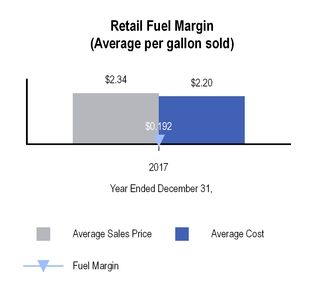
Contribution margin for the retail segment was
$26.8 million
, or
5.2%
of our consolidated segment contribution margin and was attributable to the addition of
302
convenience stores which market motor fuels in central and west Texas and New Mexico in connection with the Delek/Alon Merger.
87
Liquidity and Capital Resources
Our primary sources of liquidity are cash generated from our operating activities, borrowings under our debt facilities and potential issuances of additional equity and debt securities. We believe that cash generated from these sources will be sufficient to satisfy the anticipated cash requirements associated with our existing operations and capital expenditures for at least the next 12 months.
Cash Flows
The following table sets forth a summary of our consolidated cash flows (in millions):
|
|
Year Ended December 31,
|
|||||||||||
|
|
2017
|
2016
|
2015
|
|||||||||
|
Cash Flow Data:
|
|
|
||||||||||
|
Operating activities
|
$
|
332.1
|
|
$
|
268.2
|
|
$
|
180.0
|
|
|||
|
Investing activities
|
25.2
|
|
180.5
|
|
(460.4
|
)
|
||||||
|
Financing activities
|
(104.6
|
)
|
(61.7
|
)
|
138.5
|
|
||||||
|
Net increase (decrease)
|
$
|
252.7
|
|
$
|
387.0
|
|
$
|
(141.9
|
)
|
|||
Cash Flows from Operating Activities
Net cash provided by operating activities was
$332.1 million
for the year ended
December 31, 2017
, compared to
$268.2 million
for
2016
. The increase in cash flows from operations was primarily due to an increase in net income for
2017
of
$322.6 million
, compared to net loss of
$133.4 million
in
2016
and a decrease in cash used to pay the obligation under the supply and offtake agreements with J. Aron of
$113.0 million
, partially offset by the non-cash gain on the remeasurement of the equity method investment in Alon of
$190.1 million
and increases in accounts receivable and inventory and other non-current assets. The net loss in 2016 included a non-cash impairment in our equity method investment in Alon USA of
$245.3 million
. Additionally, the disposed retail segment provided
$13.3
million
of cash flows from operations in
2016
that was not recurring in
2017
.
Net cash provided by operating activities was
$268.2 million
for the year ended
December 31, 2016
, compared to
$180.0 million
for
2015
. Net income attributable to Delek decreased in
2016
, to a loss of
$153.7 million
, compared to income of
$19.4 million
in
2015
. The net loss in
2016
included a non-cash impairment in our equity method investment in Alon of
$245.3 million
and
$42.4 million
of business interruption proceeds associated with a litigation settlement. Further contributing to the increase in cash provided by operating activities was the collection of $88.6 million of prior period tax related receivables in
2016
, and an increase in accounts payable and other current liabilities, primarily due to an increase in accounts payable associated with an increase in volumes and the price of crude oil in
2016
, as compared to
2015
, an increase in income taxes payable primarily as a result of the sale of the Retail Entities in the fourth quarter of
2016
and an increase in our RINs obligations in
2016
as compared to
2015
. These increases were partially offset by an increase in inventories and other current assets, associated with an increase in inventory volumes and an increase in the price of crude oil in
2016
, as compared to
2015
.
Cash Flows from Investing Activities
Net cash provided by investing activities was
$25.2 million
for the year ended
December 31, 2017
, compared to
$180.5 million
in
2016
. This decrease in cash flows from investing activities was primarily due to an increase in cash purchases of property, plant and equipment, which increased from
$46.3 million
in
2016
to
$172.0 million
in
2017
. Additionally, the disposed retail segment provided
$288.9 million
of cash flows from investing activities in 2016 that was not recurring in 2017 while the California Discontinued Entities provided
$12.2 million
of cash flows from investing activities in 2017. This decrease was partially offset by the the cash acquired in the Delek/Alon Merger of
$200.5 million
(excluding the cash acquired attributable to the California Discontinued Entities) and a decrease in equity method contributions of
$55.8 million
.
Net cash provided by investing activities was
$180.5 million
for the year ended
December 31, 2016
, compared to cash used of
$460.4 million
in
2015
.This increase in cash provided was primarily due to
$378.9 million
in proceeds from the sale of the Retail Entities in the fourth quarter of
2016
and decreases in cash contributions to our equity method investments, to
$61.6 million
in
2016
versus
$240.9 million
in 2015, and capital expenditures, to
$46.3 million
in
2016
versus
$187.7 million
in 2015.
Cash used in investing activities for the year ended
December 31, 2016
included the cash portion of our capital expenditures of approximately
$46.3 million
. Total capital expenditures for
2016
were
$46.3 million
, of which
$27.9 million
was spent on projects in the refining segment,
$11.8 million
was spent in our logistics segment and
$6.6 million
was spent at the holding company level.
88
Cash Flows from Financing Activities
Net cash used in financing activities was
$104.6 million
for the year ended
December 31, 2017
, compared to
$61.7 million
for
2016
. The increase in cash used in financing activities was primarily attributable to net repayments under our revolving credit facilities of
$117.7 million
in
2017
, compared to
$41.1 million
in
2016
, an increase in repurchases of common stock of
$19.0 million
, an increase in distributions to non-controlling interest of
$11.6 million
, an increase in dividends paid of
$6.5 million
, and an increase in deferred financing costs paid of
$4.4 million
, offset by net borrowings under our term loans of
$182.6 million
during
2017
compared to net repayments of
$14.7 million
in
2016
and an increase in proceeds net of repayments associated with product financing agreements of
$52.3 million
. Additionally, the disposed retail segment used
$17.5 million
of cash flows from financing activities associated with debt repayments in 2016 that was not recurring in 2017.
Net cash used in financing activities was
$61.7 million
for the year ended
December 31, 2016
, compared to cash provided of
$138.5 million
for
2015
. The increase in cash used in financing activities for
2016
primarily consisted of a decrease in net borrowings under our revolving credit facilities, to
$41.1 million
in
2016
, compared to
$99.8 million
in 2015 and net repayments under our term loans of
$14.7 million
, compared to net borrowings of
$97.0 million
in 2015. Partially offsetting the increase in cash used in financing activities was a decrease in stock repurchases, to
$6.0 million
in 2016, compared to
$42.2 million
in 2015.
As of
December 31, 2017
, our total cash and cash equivalents were
$931.8 million
and we had total indebtedness of approximately
$1,465.6 million
. Total unused credit commitments or borrowing base availability, as applicable, under our five separate revolving credit facilities was approximately
$933.2 million
, and we had letters of credit issued of approximately
$125.8 million
. We believe we were in compliance with our covenants in all debt facilities as of
December 31, 2017
.
See
Note 12
to the consolidated financial statements in Item 8, Financial Statements and Supplementary Data, of this Annual Report on Form 10-K for additional information about our revolving credit facilities.
89
Capital Spending
A key component of our long-term strategy is our capital expenditure program. Our capital expenditures for the year ended
December 31, 2017
were
$177.5 million
(excluding capital spending associated with the California Discontinued Entities of
$2.6 million
), of which approximately
$128.2 million
was spent in our refining segment,
$18.4 million
in our logistics segment,
$11.7 million
in our retail segment and
$19.2 million
at the holding company level. The following table summarizes our actual capital expenditures for 2017 (including Alon capital expenditures since the Delek/Alon Merger of
$86.0 million
) and planned capital expenditures for 2018 by operating segment and major category (in millions):
|
Year Ended December 31,
|
||||||||
|
2018 Forecast
|
2017
Actual
|
|||||||
|
Refining:
|
|
|
||||||
|
Sustaining maintenance, including turnaround activities
|
$
|
70.7
|
|
$
|
67.2
|
|
||
|
Regulatory
|
36.2
|
|
20.1
|
|
||||
|
Discretionary projects
|
56.1
|
|
40.9
|
|
||||
|
Refining segment total
|
163.0
|
|
128.2
|
|
||||
|
Logistics:
|
|
|
||||||
|
Regulatory
|
3.8
|
|
3.2
|
|
||||
|
Sustaining maintenance
|
8.8
|
|
7.9
|
|
||||
|
Discretionary projects
|
4.9
|
|
7.3
|
|
||||
|
Logistics segment total
|
17.5
|
|
18.4
|
|
||||
|
Retail:
|
|
|
||||||
|
Regulatory
|
0.5
|
|
—
|
|
||||
|
Sustaining maintenance
|
4.8
|
|
0.4
|
|
||||
|
Discretionary projects
|
14.7
|
|
11.3
|
|
||||
|
Retail segment total
|
20.0
|
|
11.7
|
|
||||
|
Other
|
||||||||
|
Regulatory
|
0.5
|
|
0.5
|
|
||||
|
Sustaining maintenance
|
3.3
|
|
2.8
|
|
||||
|
Discretionary projects
|
7.2
|
|
15.9
|
|
||||
|
Other total
|
11.0
|
|
19.2
|
|
||||
|
Total capital spending
|
$
|
211.5
|
|
$
|
177.5
|
|
||
The amount of our capital expenditure budget is subject to change due to unanticipated increases in the cost, scope and completion time for our capital projects. The forecast amount for 2018 in the table above does not include midstream projects to enhance our position in the Permian Basin, for which the amount is estimated to be approximately
$39 million
. For further information, please refer to our discussion in Item 1A, Risk Factors, of this Annual Report on Form 10-K.
90
Contractual Obligations and Commitments
Information regarding our known contractual obligations of the types described below as of
December 31, 2017
, is set forth in the following table (in millions):
|
Payments Due by Period
|
||||||||||||||||||||
|
<
1 Year
|
1-3 Years
|
3-5 Years
|
>5 Years
|
Total
|
||||||||||||||||
|
Long term debt and notes payable obligations
|
$
|
597.7
|
|
$
|
548.7
|
|
$
|
86.7
|
|
$
|
250.0
|
|
$
|
1,483.1
|
|
|||||
|
Interest
(1)
|
78.9
|
|
68.8
|
|
37.4
|
|
42.2
|
|
227.3
|
|
||||||||||
|
Operating lease commitments
(2)
|
52.8
|
|
78.0
|
|
49.6
|
|
102.5
|
|
282.9
|
|
||||||||||
|
Purchase commitments
(3)
|
267.6
|
|
—
|
|
—
|
|
—
|
|
267.6
|
|
||||||||||
|
Transportation agreements
(4)
|
114.4
|
|
212.8
|
|
118.9
|
|
162.6
|
|
608.7
|
|
||||||||||
|
Total
|
$
|
1,111.4
|
|
$
|
908.3
|
|
$
|
292.6
|
|
$
|
557.3
|
|
$
|
2,869.6
|
|
|||||
|
(1)
|
Expected interest payments on debt outstanding at
December 31, 2017
. Floating interest rate debt is calculated using
December 31, 2017
rates. For additional information, see Note
12
to the consolidated financial statements in Item 8, Financial Statements and Supplementary Data, of this Annual Report on Form 10-K.
|
|
(2)
|
Amounts reflect future estimated lease payments under operating leases having remaining non-cancelable terms in excess of one year as of
December 31, 2017
.
|
|
(3)
|
We have supply agreements to secure certain quantities of crude oil, finished product and other resources used in production at both fixed and market prices. We have estimated future payments under the market based agreements using current market rates.
|
|
(4)
|
Balances consist of contractual obligations under agreements with third parties (not including Delek Logistics) for the transportation of crude oil to our refineries.
|
Off-Balance Sheet Arrangements
We have no off-balance sheet arrangements through the date of this Annual Report on Form 10-K.
Critical Accounting Policies and Estimates
The fundamental objective of financial reporting is to provide useful information that allows a reader to comprehend our business activities. We prepare our consolidated financial statements in conformity with GAAP, and in the process of applying these principles, we must make judgments, assumptions and estimates based on the best available information at the time. To aid a reader's understanding, management has identified our critical accounting policies. These policies are considered critical because they are both most important to the portrayal of our financial condition and results, and require our most difficult, subjective or complex judgments. Often they require judgments and estimation about matters which are inherently uncertain and involve measuring at a specific point in time, events which are continuous in nature. Actual results may differ based on the accuracy of the information utilized and subsequent events, some over which we may have little or no control.
LIFO Inventory
The Tyler refinery's inventory consists of crude oil, refined petroleum products and blendstocks which are stated at the lower of cost or market. Cost is determined under the last-in, first-out LIFO valuation method. The LIFO method requires management to make estimates on an interim basis of the anticipated year-end inventory quantities, which could differ from actual quantities.
We believe the accounting estimate related to the establishment of anticipated year-end LIFO inventory is a critical accounting estimate, because it requires management to make assumptions about future production rates in the Tyler refinery, the future buying patterns of our customers, as well as numerous other factors beyond our control, including the economic viability of the general economy, weather conditions, the availability of imports, the marketing of competitive fuels and government regulation. The impact of changes in actual performance versus these estimates could be material to the inventories reported on our quarterly balance sheets, and the impact on the results reported in our quarterly statements of income could be material. In selecting assumed inventory levels, we use historical trending of production and sales, recognition of current market indicators of future pricing and value and new regulatory requirements which might impact inventory levels. Management's assumptions require significant judgment because actual year-end inventory levels have fluctuated in the past and may continue to do so.
At each year-end, actual physical inventory levels are used to calculate both ending inventory balances and final cost of goods sold for the year.
91
Property, Plant and Equipment and Definite Life Intangibles Impairment
Property, plant and equipment and definite life intangibles are evaluated for impairment whenever indicators of impairment exist. Accounting standards require that if an impairment indicator is present, we must assess whether the carrying amount of the asset is unrecoverable by estimating the sum of the future cash flows expected to result from the asset, undiscounted and without interest charges. We derive the required undiscounted cash flow estimates from our historical experience and our internal business plans. We use quoted market prices when available and our internal cash flow estimates discounted at an appropriate interest rate to determine fair value, as appropriate. If the carrying amount is more than the recoverable amount, an impairment charge must be recognized based on the fair value of the asset. We recognized an impairment charge of
$2.2 million
in
2015
related to the write-down of certain idle refining equipment in our refining segment to net realizable value. This impairment charge is included in other operating income in our consolidated statement of income for the period. There were no such impairment charges in
2017
and
2016
.
Goodwill and Potential Impairment
Goodwill is reviewed at least annually for impairment, or more frequently if indicators of impairment exist. Goodwill is tested by comparing net book value of the reporting unit to its estimated fair value. In assessing the recoverability of goodwill, assumptions are made with respect to future business conditions and estimated expected future cash flows to determine the fair value of a reporting unit. We use a market participant weighted average cost of capital, estimated minimal growth rates for revenue, gross profit and capital expenditures based on history and our best estimate of future forecasts. We also estimate the fair values of the reporting units using a multiple of expected future cash flows, such as those used by third-party analysts. If these estimates and assumptions change in the future, due to such factors as a decline in general economic conditions, competitive pressures on sales and margins and other economic and industry factors beyond management's control, an impairment charge may be required. Our annual assessment of goodwill did not result in impairment during the years ended
December 31, 2017
,
2016
or
2015
. Details of remaining goodwill balances by segment are included in
Note 10
to the consolidated financial statements in Item 8, Financial Statements and Supplementary Data, of this Annual Report on Form 10-K.
Environmental Liabilities
It is our policy to accrue environmental and clean-up related costs of a non-capital nature when it is both probable that a liability has been incurred and the amount can be reasonably estimated. Environmental liabilities represent the current estimated costs to investigate and remediate contamination at our properties. This estimate is based on internal and third-party assessments of the extent of the contamination, the selected remediation technology and review of applicable environmental regulations. Accruals for estimated costs from environmental remediation obligations generally are recognized no later than completion of the remedial feasibility study, and include, but are not limited to, costs to perform remedial actions and costs of machinery and equipment that is dedicated to the remedial actions and that does not have an alternative use. Such accruals are adjusted as further information develops or circumstances change. We discount environmental liabilities to their present value if payments are fixed and determinable. Expenditures for equipment necessary for environmental issues relating to ongoing operations are capitalized.
Changes in laws and regulations and actual remediation expenses compared to historical experience could significantly impact our results of operations and financial position. We believe the estimates selected, in each instance, represent our best estimate of future outcomes, but the actual outcomes could differ from the estimates selected.
New Accounting Pronouncements
See
Note 2
to the consolidated financial statements in Item 8, Financial Statements and Supplementary Data, of this Annual Report on Form 10-K for a discussion of new accounting pronouncements applicable to us.
92
ITEM 7A.
QUANTITATIVE AND QUALITATIVE DISCLOSURES ABOUT MARKET RISK
Changes in commodity prices (mainly crude oil and unleaded gasoline) and interest rates are our primary sources of market risk. When we make the decision to manage our market exposure, our objective is generally to avoid losses from adverse price changes, realizing we will not obtain the gains of beneficial price changes.
Commodity Price Risk
Impact of Changing Prices.
Our revenues and cash flows, as well as estimates of future cash flows, are sensitive to changes in energy prices. Major shifts in the cost of crude oil, the prices of refined products and the cost of ethanol can generate large changes in the operating margin in each of our segments.
We maintain, at both company-owned and third-party facilities, inventories of crude oil, feedstocks and refined petroleum products, the values of which are subject to wide fluctuations in market prices driven by world economic conditions, regional and global inventory levels and seasonal conditions. At
December 31, 2017
and
2016
, we held approximately
3.1 million
and
2.6 million
barrels, respectively, of crude and product inventories associated with the Tyler refinery valued under the LIFO valuation method, with an average cost of
$64.89
and
$59.01
per barrel, respectively. At
December 31, 2017
and
2016
, the excess of replacement cost (FIFO) over the carrying value (LIFO) of refinery inventories was
$9.0 million
and
$3.5 million
, respectively. We refer to this excess as our LIFO reserve. At
December 31, 2017
, we held approximately
7.8 million
barrels of crude and product inventories associated with the El Dorado, Big Spring and Krotz Springs refineries valued under the FIFO valuation method, with an average cost of
$60.03
per barrel. At December 31, 2016, we held approximately
4 million
barrels of crude and product inventories associated with the El Dorado refinery valued under the FIFO valuation method, with an average cost of
$53.19
per barrel. Due to a lower crude oil and refined product pricing environment experienced since the end of 2014, market prices have declined to a level below the average cost of our inventories. At
December 31, 2017
, we recorded a pre-tax inventory valuation reserve of
$2.4 million
,
$1.5 million
of which related to LIFO inventory, which is subject to reversal in subsequent periods, not to exceed LIFO cost, should market prices recover. At
December 31, 2016
, we recorded a pre-tax lower of cost or market reserve of
$16.0 million
, of which
$16.0 million
related to LIFO inventory, which reversed in the first quarter of
2017
, as the inventories associated with the valuation adjustment at the end of
2016
were sold or used. For the years ended
December 31, 2017
,
2016
and
2015
, we recognized net inventory valuation gains of
$14.0 million
,
$33.8 million
and
$4.3 million
, respectively, which were recorded as a component of cost of goods sold in the consolidated statements of income.
Price Risk Management Activities.
At times, we enter into commodity derivative contracts to manage our price exposure to our inventory positions, future purchases of crude oil and ethanol, future sales of refined products or to fix margins on future production. We also enter into future commitments to purchase or sell RINs at fixed prices and quantities, which are used to manage the costs associated with our RINs obligations. These future RIN commitments meet the definition of derivative instruments under ASC 815,
Derivatives and Hedging
("ASC 815"). In accordance with ASC 815, all of these commodity contracts and future purchase commitments are recorded at fair value, and any change in fair value between periods has historically been recorded in the profit and loss section of our consolidated financial statements. Occasionally, at inception, the Company will elect to designate the commodity derivative contracts as cash flow hedges under ASC 815. Gains or losses on commodity derivative contracts accounted for as cash flow hedges are recognized in other comprehensive income on the consolidated balance sheets and, ultimately, when the forecasted transactions are completed in net sales or cost of goods sold in the consolidated statements of income.
93
The following table sets forth information relating to our open commodity derivative contracts as of
December 31, 2017
($ in millions).
|
Total Outstanding
|
Notional Contract Volume by
Year of Maturity
|
|||||||||||||||
|
Contract Description
|
Fair Value
|
Notional Contract Volume
|
2018
|
2019
|
2020
|
|||||||||||
|
Contracts not designated as hedging instruments:
|
||||||||||||||||
|
Crude oil price swaps - long
(1)
|
$
|
3.1
|
|
4,085,000
|
|
4,085,000
|
|
—
|
|
—
|
|
|||||
|
Crude oil price swaps - short
(1)
|
(12.5
|
)
|
4,810,000
|
|
4,810,000
|
|
—
|
|
—
|
|
||||||
|
Inventory, refined product and crack spread swaps - long
(1)
|
16.4
|
|
15,308,000
|
|
15,308,000
|
|
—
|
|
—
|
|
||||||
|
Inventory, refined product and crack spread swaps - short
(1)
|
(19.3
|
)
|
11,200,000
|
|
11,200,000
|
|
—
|
|
—
|
|
||||||
|
RIN commitment contracts - long
(2)
|
(23.8
|
)
|
144,886,320
|
|
144,886,320
|
|
—
|
|
—
|
|
||||||
|
RIN commitment contracts - short
(2)
|
1.2
|
|
18,475,000
|
|
18,475,000
|
|
—
|
|
—
|
|
||||||
|
Total
|
$
|
(34.9
|
)
|
198,764,320
|
|
198,764,320
|
|
—
|
|
—
|
|
|||||
|
Contracts designated as cash flow hedging instruments:
|
||||||||||||||||
|
Crude oil price swaps - long
(1)
|
$
|
(13.6
|
)
|
575,000
|
|
575,000
|
|
—
|
|
—
|
|
|||||
|
Total
|
$
|
(13.6
|
)
|
575,000
|
|
575,000
|
|
—
|
|
—
|
|
|||||
(1)
Volume in barrels
(2)
Volume in RINs
Interest Rate Risk
We have market exposure to changes in interest rates relating to our outstanding floating rate borrowings, which totaled approximately
$971.0 million
as of
December 31, 2017
.
We help manage this risk through interest rate swap and cap agreements that we may periodically enter into in order to modify the interest rate characteristics of our outstanding long-term debt. In accordance with ASC 815, all interest rate hedging instruments are recorded at fair value and any changes in the fair value between periods are recognized in earnings. The fair values of our interest rate swaps and cap agreements are obtained from dealer quotes. These values represent the estimated amount that we would receive or pay to terminate the agreements taking into account the difference between the contract rate of interest and rates currently quoted for agreements of similar terms and maturities. We expect that any interest rate derivatives held would reduce our exposure to short-term interest rate movements. As of
December 31, 2017
, we had four floating-to-fixed interest rate derivative agreements in place for a notional amount of
$68.3 million
, which all mature in March 2019. The estimated fair value of our interest rate derivative liability was
$0.9 million
as of
December 31, 2017
.
The annualized impact of a hypothetical one percent change in interest rates on our floating rate debt, after considering the interest rate swaps, outstanding as of
December 31, 2017
would be to change interest expense by approximately
$9.0 million
.
ITEM 8.
FINANCIAL STATEMENTS AND SUPPLEMENTARY DATA
The information required by Item 8 is incorporated by reference to the section beginning on page F-1.
ITEM 9.
CHANGES IN AND DISAGREEMENTS WITH ACCOUNTANTS ON ACCOUNTING AND FINANCIAL DISCLOSURE
None.
94
ITEM 9A.
CONTROLS AND PROCEDURES
Disclosure Controls and Procedures
We maintain disclosure controls and procedures (as defined in Rule 13a-15(e) and 15d-15(e)) under the Securities Exchange Act of 1934, as amended ("Exchange Act") that are designed to provide reasonable assurance that the information that we are required to disclose in the reports we file or submit under the Exchange Act is recorded, processed, summarized and reported within the time periods specified in the SEC's rules and forms, and such information is accumulated and communicated to our management, including our Chief Executive Officer and Chief Financial Officer, as appropriate, to allow timely decisions regarding required disclosure. It should be noted that, because of inherent limitations, our disclosure controls and procedures, however well designed and operated, can provide only reasonable, and not absolute, assurance that the objectives of the disclosure controls and procedures are met.
As required by paragraph (b) of Rules 13a-15 and 15d-15 under the Exchange Act, our Chief Executive Officer and our Chief Financial Officer have evaluated the effectiveness of our disclosure controls and procedures (as such term is defined in Rules 13a-15(e) and 15d-15(e) under the Exchange Act) as of the end of the period covered by this report. Based on such evaluation, our Chief Executive Officer and our Chief Financial Officer have concluded, as of the end of the period covered by this report, that our disclosure controls and procedures were effective at a reasonable assurance level to ensure that the information that we are required to disclose in the reports we file or submit under the Exchange Act is recorded, processed, summarized and reported within the time periods specified in SEC rules and forms, and such information is accumulated and communicated to our management, including our Chief Executive Officer and Chief Financial Officer, as appropriate, to allow timely decisions regarding required disclosure.
Management's Annual Report on Internal Control over Financial Reporting
Our management is responsible for establishing and maintaining adequate internal control over financial reporting. Our internal control over financial reporting is a process that is designed under the supervision of our Chief Executive Officer and Chief Financial Officer, and effected by our Board of Directors, management and other personnel, to provide reasonable assurance regarding the reliability of financial reporting and the preparation of financial statements for external purposes in accordance with GAAP. Our internal control over financial reporting includes those policies and procedures that:
|
i.
|
Pertain to the maintenance of records that, in reasonable detail, accurately and fairly reflect the transactions and dispositions of our assets;
|
|
ii.
|
Provide reasonable assurance that transactions are recorded as necessary to permit preparation of financial statements in accordance with GAAP and that receipts and expenditures recorded by us are being made only in accordance with authorizations of our management and Board of Directors; and
|
|
iii.
|
Provide reasonable assurance regarding prevention or timely detection of unauthorized acquisition, use or disposition of our assets that could have a material effect on our financial statements.
|
Because of its inherent limitations, internal control over financial reporting may not prevent or detect misstatements. Also, projections of any evaluation of effectiveness to future periods are subject to the risk that controls may become inadequate because of changes in conditions, or that the degree of compliance with the policies and procedures may deteriorate.
Effective July 1, 2017, we acquired the outstanding common stock of Alon USA Energy, Inc. ("Alon") (previously listed under NYSE: ALJ) (the "Delek/Alon Merger", as previously defined in Item 1 and further discussed in Note
3
of the consolidated financial statements included in Item 8, Financial Statements and Supplementary Data, of this Annual Report on Form 10-K ). Alon's total assets and revenues constituted
51%
and
27%
, respectively, of Delek's consolidated total assets and net sales included in our consolidated financial statements as of and for the year ended
December 31, 2017
. We have excluded Alon's internal control over financial reporting from the scope of management's 2017 annual assessment of the effectiveness of Delek's internal control over financial reporting. This exclusion is in accordance with the general guidance issued by the staff of the SEC that an assessment of a recent business combination may be omitted from management's report on internal control over financial reporting in the first year of consolidation.
Management has conducted its evaluation of the effectiveness of internal control over financial reporting as of
December 31, 2017
, based on the framework in Internal Control - Integrated Framework (2013) issued by the Committee of Sponsoring Organizations of the Treadway Commission. Management's assessment included an evaluation of the design of our internal control over financial reporting and testing the operational effectiveness of our internal control over financial reporting. Management reviewed the results of the assessment with the Audit Committee of the Board of Directors. Based on its assessment and review with the Audit Committee, management concluded that, at
December 31, 2017
, we maintained effective internal control over financial reporting.
95
Report of Independent Registered Public Accounting Firm
Our independent registered public accounting firm, Ernst & Young LLP, has audited the effectiveness of our internal control over financial reporting as of
December 31, 2017
, as stated in their report, which is included in the section beginning on page F-1.
The information required by Item 8 is incorporated by reference to the section beginning on page F-1.
Changes in Internal Control over Financial Reporting
In connection with the Delek/Alon Merger, we are continuing to integrate Alon's internal controls over financial reporting into our financial reporting framework. Such changes have resulted, and may continue to result, in changes in our internal control over financial reporting (as described in Rule 13a-15(f) and 15d-15(f) under the Exchange Act) that materially affect our internal control over financial reporting. Other than the changes that have and may continue to result from such integration, there has been no change in our internal control over financial reporting (as described in Rule 13a-15(f) and 15d-15(f) under the Exchange Act) during the quarter ended
December 31, 2017
that has materially affected, or is reasonably likely to materially affect, our internal control over financial reporting.
ITEM 9B.
OTHER INFORMATION
Dividend Declaration
On
February 26, 2018
, Delek's Board of Directors voted to declare a quarterly cash dividend of
$0.20
per share, payable on
March 26, 2018
, to stockholders of record on
March 12, 2018
.
96
ITEM 10.
DIRECTORS, EXECUTIVE OFFICERS AND CORPORATE GOVERNANCE
Our Board Governance Guidelines, our charters for our Audit, Compensation, Nominating and Corporate Governance and Environmental, Health and Safety Committees and our Code of Business Conduct & Ethics covering all employees, including our principal executive officer, principal financial officer, principal accounting officer and controllers, are available on our website, www.DelekUS.com, under the "About Us - Corporate Governance" caption. A copy of any of these documents will be mailed upon request made to Investor Relations, Delek US Holdings, Inc. or ir@delekus.com. We intend to disclose any amendments to or waivers of the Code of Business Conduct & Ethics on behalf of our Chief Executive Officer, Chief Financial Officer and persons performing similar functions on our website, at www.DelekUS.com, under the "Investor Relations" caption, promptly following the date of any such amendment or waiver.
The information required by Item 401 of Regulation S-K regarding directors will be included under "Election of Directors" in the definitive Proxy Statement for our Annual Meeting of Stockholders to be held
May 9, 2018
(the "Definitive Proxy Statement"), and is incorporated herein by reference. The information required by Item 401 of Regulation S-K regarding executive officers will be included under "Corporate Governance" in the Definitive Proxy Statement and is incorporated herein by reference. The information required by Item 405 of Regulation S-K will be included under "Section 16(a) Beneficial Ownership Reporting Compliance" in the Definitive Proxy Statement and is incorporated herein by reference. The information required by Items 406, 407(c)(3), (d)(4), and (d)(5) of Regulation S-K will be included under "Corporate Governance" in the Definitive Proxy Statement and is incorporated herein by reference.
ITEM 11.
EXECUTIVE COMPENSATION
The information required by Item 402 and paragraphs (e)(4) and (e)(5) of Item 407 of Regulation S-K will be included under "Executive Compensation" and "Corporate Governance" in the Definitive Proxy Statement and is incorporated herein by reference.
ITEM 12.
SECURITY OWNERSHIP OF CERTAIN BENEFICIAL OWNERS AND MANAGEMENT AND RELATED STOCKHOLDER MATTERS
The information required by Item 201(d) and Item 403 of Regulation S-K will be included under "Equity Compensation Plan Information" and "Security Ownership of Certain Beneficial Owners and Management" in the Definitive Proxy Statement and is incorporated herein by reference.
ITEM 13.
CERTAIN RELATIONSHIPS AND RELATED TRANSACTIONS AND DIRECTOR
INDEPENDENCE
The information required by Item 404 of Regulation S-K will be included under "Certain Relationships and Related Transactions" in the Definitive Proxy Statement and is incorporated herein by reference.
The information required by Item 407(a) of Regulation S-K will be included under "Election of Directors" and "Corporate Governance" in the Definitive Proxy Statement and is incorporated herein by reference.
ITEM 14.
PRINCIPAL ACCOUNTANT FEES AND SERVICES
The information required by this item will be included under “Independent Public Accountants” in the Definitive Proxy Statement and is incorporated herein by reference.
97
ITEM 15.
EXHIBITS AND FINANCIAL STATEMENT SCHEDULES
(a) Certain Documents Filed as Part of this Annual Report on Form 10-K:
|
1.
|
Financial Statements. The accompanying Index to Financial Statements and Schedule on page F-1 of this Annual Report on Form 10-K is provided in response to this item.
|
|
2.
|
List of Financial Statement Schedules:
|
Schedule I - Condensed financial information of Registrant as of
December 31, 2017
,
2016
and
2015
|
3.
|
Exhibits - See below.
|
98
EXHIBIT INDEX
|
Exhibit No.
|
Description
|
|||
|
2.1
|
||||
|
2.2
|
^
|
|||
|
2.3
|
^
|
|||
|
2.4
|
||||
|
2.5
|
||||
|
2.6
|
||||
|
3.1
|
||||
|
3.2
|
||||
|
4.1
|
||||
|
4.2
|
||||
|
4.3
|
||||
|
10.1
|
*
|
|||
|
10.2(a)
|
*
|
|||
|
10.2(b)
|
*
|
|||
|
10.2(c)
|
*
|
|||
|
10.2(d)
|
*
|
|||
|
10.2(e)
|
*
|
|||
|
10.2(f)
|
*
|
|||
|
10.2(g)
|
*
|
|||
|
10.3
|
||||
|
10.4
|
||||
|
10.5
|
||||
|
10.6
|
‡
|
|||
99
|
10.7(a)
|
||||
|
10.7(b)
|
||||
|
10.7(c)
|
||||
|
10.8(a)
|
*
|
|||
|
10.8(b)
|
*
|
|||
|
10.9
|
||||
|
10.10(a)
|
||||
|
10.10(b)
|
||||
|
10.11(a)
|
||||
|
10.11(b)
|
|
|||
|
10.12(a)
|
*
|
|||
|
10.12(b)
|
*
|
|||
|
10.12(c)
|
*
|
|||
|
10.12(d)
|
*
|
|||
|
10.12(e)
|
*
|
|||
|
10.13(a)
|
*
|
|
||
|
10.13(b)
|
*
|
|||
|
10.13(c)
|
*
|
|||
100
|
10.13(d)
|
*
|
|||
|
10.13(e)
|
*
|
|||
|
10.13(f)
|
*
|
|||
|
10.13(g)
|
*
|
|||
|
10.13(h)
|
*
|
|||
|
10.14(a)
|
*
|
|||
|
10.14(b)
|
*
|
|||
|
10.14(c)
|
*
|
|||
|
10.14(d)
|
*
|
|||
|
10.15
|
||||
|
10.16
|
||||
|
10.17
|
||||
|
10.18(a)
|
||||
|
10.18(b)
|
||||
|
10.19
|
||||
|
10.20(a)
|
‡
|
|||
|
10.20(b)
|
||||
|
10.21
|
‡
|
|||
|
10.22
|
‡
|
|||
101
|
10.23(a)
|
||||
|
10.23(b)
|
||||
|
10.24(a)
|
||||
|
10.24(b)
|
||||
|
10.25
|
*
|
|||
|
10.26
|
*
|
|||
|
10.27
|
*
|
|||
|
10.28
|
*
|
|||
|
10.29
|
*
|
|||
|
10.30
|
*
|
|||
|
10.31
|
*
|
|||
|
10.32
|
*
|
|||
|
10.33
|
*
|
|||
|
10.34
|
*
|
|||
|
10.35
|
*
|
|||
|
10.36
|
*
|
|||
|
10.37
|
*
|
|||
|
21.1
|
§
|
|||
|
23.1
|
§
|
|||
|
23.2
|
§
|
|||
|
24.1
|
§
|
|||
|
31.1
|
§
|
|||
|
31.2
|
§
|
|||
|
32.1
|
§§
|
|||
|
32.2
|
§§
|
|||
|
99.1
|
||||
102
|
101
|
The following materials from Delek US Holdings, Inc.’s Annual Report on Form 10-K for the annual period ended December 31, 2017, formatted in XBRL (eXtensible Business Reporting Language): (i) Consolidated Balance Sheets as of December 31, 2017 and 2016, (ii) Consolidated Statements of Income for the years ended December 31, 2017, 2016 and 2015, (iii) Consolidated Statements of Comprehensive Income for the years ended December 31, 2017, 2016 and 2015, (iv) Consolidated Statements of Changes in Stockholders’ Equity for the years ended December 31, 2017, 2016 and 2015, (v) Consolidated Statements of Cash Flows for the years ended December 31, 2017, 2016 and 2015 and (vi) Notes to Consolidated Financial Statements.
|
|||
_______________
|
*
|
Management contract or compensatory plan or arrangement.
|
|
§
|
Filed herewith.
|
|
§§
|
Furnished herewith.
|
|
^
|
Certain schedules have been omitted pursuant to Item 601(b)(2) of Regulation S-K. The Company agrees to supplementally furnish a copy of any of the omitted schedules to the United States Securities and Exchange Commission upon request.
|
|
‡
|
Confidential treatment has been requested and granted with respect to certain portions of this exhibit pursuant to Rule 24b-2 of the Securities Exchange Act of 1934, as amended. Omitted portions have been filed separately with the United States Securities and Exchange Commission.
|
103
Delek US Holdings, Inc.
Consolidated Financial Statements
As of
December 31, 2017
and
2016
and
For Each of the Three Years Ended
December 31, 2017
,
2016
and
2015
INDEX TO FINANCIAL STATEMENTS AND SCHEDULE
|
Audited Financial Statements:
|
|
All other financial schedules are not required under related instructions, or are inapplicable and therefore have been omitted.
F-1
Report of Independent Registered Public Accounting Firm
The Board of Directors and Stockholders of
Delek US Holdings, Inc.
Opinion on Internal Control over Financial Reporting
We have audited Delek US Holdings, Inc.’s internal control over financial reporting as of December 31, 2017, based on criteria established in Internal Control-Integrated Framework issued by the Committee of Sponsoring Organizations of the Treadway Commission (2013 framework) (the COSO criteria). In our opinion, Delek US Holdings, Inc. (the Company) maintained, in all material respects, effective internal control over financial reporting as of December 31, 2017, based on the COSO criteria.
As indicated in the accompanying Management’s Annual Report on Internal Control over Financial Reporting, management’s assessment of and conclusion on the effectiveness of internal control over financial reporting did not include the internal controls of Alon USA Energy, Inc. and subsidiaries, which is included in the 2017 consolidated financial statements of the Company and constituted
51%
and
27%
of total assets and net sales, respectively, as of and for the year ended December 31, 2017. Our audit of internal control over financial reporting of the Company also did not include an evaluation of the internal control over financial reporting of Alon USA Energy, Inc. and subsidiaries.
We also have audited, in accordance with the standards of the Public Company Accounting Oversight Board (United States) (PCAOB), the consolidated balance sheets of Delek US Holdings, Inc. as of December 31, 2017 and 2016, the related consolidated statements of income, comprehensive income, changes in stockholders' equity, and cash flows for each of the three years in the period ended December 31, 2017, and the related notes and financial statement schedule of the Company and our report dated February 28, 2018 expressed an unqualified opinion thereon.
Basis for Opinion
The Company’s management is responsible for maintaining effective internal control over financial reporting, and for its assessment of the effectiveness of internal control over financial reporting included in the accompanying Management’s Annual Report on Internal Control over Financial Reporting. Our responsibility is to express an opinion on the Company’s internal control over financial reporting based on our audit. We are a public accounting firm registered with the PCAOB and are required to be independent with respect to the Company in accordance with the U.S. federal securities laws and the applicable rules and regulations of the Securities and Exchange Commission and the PCAOB.
We conducted our audit in accordance with the standards of the PCAOB. Those standards require that we plan and perform the audit to obtain reasonable assurance about whether effective internal control over financial reporting was maintained in all material respects.
Our audit included obtaining an understanding of internal control over financial reporting, assessing the risk that a material weakness exists, testing and evaluating the design and operating effectiveness of internal control based on the assessed risk, and performing such other procedures as we considered necessary in the circumstances. We believe that our audit provides a reasonable basis for our opinion.
Definition and Limitations of Internal Control Over Financial Reporting
A company’s internal control over financial reporting is a process designed to provide reasonable assurance regarding the reliability of financial reporting and the preparation of financial statements for external purposes in accordance with generally accepted accounting principles. A company’s internal control over financial reporting includes those policies and procedures that (1) pertain to the maintenance of records that, in reasonable detail, accurately and fairly reflect the transactions and dispositions of the assets of the company; (2) provide reasonable assurance that transactions are recorded as necessary to permit preparation of financial statements in accordance with generally accepted accounting principles, and that receipts and expenditures of the company are being made only in accordance with authorizations of management and directors of the company; and (3) provide reasonable assurance regarding prevention or timely detection of unauthorized acquisition, use, or disposition of the company’s assets that could have a material effect on the financial statements.
Because of its inherent limitations, internal control over financial reporting may not prevent or detect misstatements. Also, projections of any evaluation of effectiveness to future periods are subject to the risk that controls may become inadequate because of changes in conditions, or that the degree of compliance with the policies or procedures may deteriorate.
/s/ Ernst & Young LLP
Nashville, Tennessee
February 28, 2018
F-2
Report of Independent Registered Public Accounting Firm
The Board of Directors and Stockholders of
Delek US Holdings, Inc.
Opinion on the Financial Statements
We have audited the accompanying consolidated balance sheets of Delek US Holdings, Inc. as of December 31, 2017 and 2016, and the related consolidated statements of income, comprehensive income, changes in stockholders' equity, and cash flows for each of the three years in the period ended December 31, 2017, and the related notes and financial statement schedule listed in the Index at Item 15(a) (collectively referred to as the “financial statements”). In our opinion, the financial statements referred to above present fairly, in all material respects, the consolidated financial position of the Company at December 31, 2017 and 2016, and the consolidated results of its operations and its cash flows for each of the three years in the period ended December 31, 2017, in conformity with U.S. generally accepted accounting principles.
We also have audited, in accordance with the standards of the Public Company Accounting Oversight Board (United States) (PCAOB), Delek US Holdings, Inc.’s internal control over financial reporting as of December 31, 2017, based on criteria established in Internal Control-Integrated Framework issued by the Committee of Sponsoring Organizations of the Treadway Commission (2013 framework) and our report dated February 28, 2018 expressed an unqualified opinion thereon.
Basis for Opinion
These financial statements and schedule are the responsibility of the Company's management. Our responsibility is to express an opinion on these financial statements and schedule based on our audits. We are a public accounting firm registered with the PCAOB and are required to be independent with respect to the Company in accordance with the U.S. federal securities laws and the applicable rules and regulations of the Securities and Exchange Commission and the PCAOB.
We conducted our audits in accordance with the standards of the PCAOB. Those standards require that we plan and perform the audit to obtain reasonable assurance about whether the financial statements are free of material misstatement, whether due to error or fraud. Our audits included performing procedures to assess the risks of material misstatement of the financial statements, whether due to error or fraud, and performing procedures that respond to those risks. Such procedures included examining, on a test basis, evidence regarding the amounts and disclosures in the financial statements. Our audits also included evaluating the accounting principles used and significant estimates made by management, as well as evaluating the overall presentation of the financial statements. We believe that our audits provide a reasonable basis for our opinion.
/s/ Ernst & Young LLP
We have served as the Company’s auditor since 2002.
Nashville, Tennessee
February 28, 2018
F-3
Delek US Holdings, Inc.
(In millions, except share and per share data)
|
December 31,
|
||||||||
|
2017
|
2016
|
|||||||
|
ASSETS
|
|
|
||||||
|
Current assets:
|
|
|||||||
|
Cash and cash equivalents
|
$
|
931.8
|
|
$
|
689.2
|
|
||
|
Accounts receivable, net
|
579.6
|
|
265.9
|
|
||||
|
Accounts receivable from related parties
|
2.1
|
|
0.1
|
|
||||
|
Inventories, net of inventory valuation reserves
|
808.4
|
|
392.4
|
|
||||
|
Assets of discontinued operations held for sale
|
160.0
|
|
—
|
|
||||
|
Other current assets
|
129.9
|
|
49.3
|
|
||||
|
Total current assets
|
2,611.8
|
|
1,396.9
|
|
||||
|
Property, plant and equipment:
|
|
|
||||||
|
Property, plant and equipment
|
2,772.5
|
|
1,587.6
|
|
||||
|
Less: accumulated depreciation
|
(631.7
|
)
|
(484.3
|
)
|
||||
|
Property, plant and equipment, net
|
2,140.8
|
|
1,103.3
|
|
||||
|
Goodwill
|
816.6
|
|
12.2
|
|
||||
|
Other intangibles, net
|
101.1
|
|
26.7
|
|
||||
|
Equity method investments
|
138.1
|
|
360.0
|
|
||||
|
Other non-current assets
|
126.8
|
|
80.7
|
|
||||
|
Total assets
(1)
|
$
|
5,935.2
|
|
$
|
2,979.8
|
|
||
|
LIABILITIES AND STOCKHOLDERS’ EQUITY
|
|
|
||||||
|
Current liabilities:
|
|
|
||||||
|
Accounts payable
|
$
|
973.4
|
|
$
|
494.6
|
|
||
|
Accounts payable to related parties
|
1.7
|
|
1.8
|
|
||||
|
Current portion of long-term debt
|
590.2
|
|
84.4
|
|
||||
|
Obligation under Supply and Offtake Agreements
|
435.6
|
|
124.6
|
|
||||
|
Liabilities of discontinued operations held for sale
|
105.9
|
|
—
|
|
||||
|
Accrued expenses and other current liabilities
|
564.9
|
|
229.8
|
|
||||
|
Total current liabilities
|
2,671.7
|
|
935.2
|
|
||||
|
Non-current liabilities:
|
|
|
||||||
|
Long-term debt, net of current portion
|
875.4
|
|
748.5
|
|
||||
|
Environmental liabilities, net of current portion
|
68.9
|
|
6.2
|
|
||||
|
Asset retirement obligations
|
72.1
|
|
5.2
|
|
||||
|
Deferred tax liabilities
|
199.9
|
|
76.2
|
|
||||
|
Other non-current liabilities
|
83.0
|
|
26.0
|
|
||||
|
Total non-current liabilities
|
1,299.3
|
|
862.1
|
|
||||
|
Stockholders’ equity:
|
|
|
||||||
|
Preferred stock, $0.01 par value, 10,000,000 shares authorized, no shares issued and outstanding
|
—
|
|
—
|
|
||||
|
Common stock, $0.01 par value, 110,000,000 shares authorized, 81,533,548 shares and 67,150,352 shares issued at December 31, 2017 and December 31, 2016, respectively
|
0.8
|
|
0.7
|
|
||||
|
Additional paid-in capital
|
900.1
|
|
650.5
|
|
||||
|
Accumulated other comprehensive income (loss)
|
6.9
|
|
(20.8
|
)
|
||||
|
Treasury stock, 762,623 shares and 5,195,791 shares, at cost, as of December 31, 2017 and 2016, respectively
|
(25.0
|
)
|
(160.8
|
)
|
||||
|
Retained earnings
|
767.8
|
|
522.3
|
|
||||
|
Non-controlling interests in subsidiaries
|
313.6
|
|
190.6
|
|
||||
|
Total stockholders’ equity
|
1,964.2
|
|
1,182.5
|
|
||||
|
Total liabilities and stockholders’ equity
|
$
|
5,935.2
|
|
$
|
2,979.8
|
|
||
See accompanying notes to the consolidated financial statements
|
(1)
|
All but approximately
$20.0 million
of the assets of the Alon Partnership (a consolidated variable interest entity, as discussed in Note
2
)
are restricted for the use of settlement of the obligations of the Alon Partnership. See
Note 4
for further information regarding assets and liabilities of the Alon Partnership and Note
25
regarding acquisition of the non-controlling interest in the Alon Partnership on February 7, 2018.
|
.
F-4
Delek US Holdings, Inc.
(In millions, except share and per share data)
|
Year Ended December 31,
|
||||||||||||
|
|
2017
|
2016
|
2015
|
|||||||||
|
Net sales
|
$
|
7,267.1
|
|
$
|
4,197.9
|
|
$
|
4,782.0
|
|
|||
|
Operating costs and expenses:
|
|
|||||||||||
|
Cost of goods sold
|
6,327.6
|
|
3,812.9
|
|
4,236.9
|
|
||||||
|
Operating expenses
|
429.0
|
|
249.3
|
|
270.3
|
|
||||||
|
Insurance proceeds — business interruption
|
—
|
|
(42.4
|
)
|
—
|
|
||||||
|
General and administrative expenses
|
169.8
|
|
106.1
|
|
100.6
|
|
||||||
|
Depreciation and amortization
|
153.3
|
|
116.4
|
|
106.0
|
|
||||||
|
Other operating expense (income), net
|
1.0
|
|
4.8
|
|
(0.5
|
)
|
||||||
|
Total operating costs and expenses
|
7,080.7
|
|
4,247.1
|
|
4,713.3
|
|
||||||
|
Operating income (loss)
|
186.4
|
|
(49.2
|
)
|
68.7
|
|
||||||
|
Interest expense
|
93.8
|
|
54.4
|
|
52.1
|
|
||||||
|
Interest income
|
(4.0
|
)
|
(1.5
|
)
|
(1.1
|
)
|
||||||
|
(Income) loss from equity method investments
|
(12.6
|
)
|
43.4
|
|
(2.0
|
)
|
||||||
|
Loss on impairment of equity method investment
|
—
|
|
245.3
|
|
—
|
|
||||||
|
Gain on remeasurement of equity method investment
|
(190.1
|
)
|
—
|
|
—
|
|
||||||
|
Other expense (income), net
|
—
|
|
0.4
|
|
(1.6
|
)
|
||||||
|
Total non-operating (income) expenses, net
|
(112.9
|
)
|
342.0
|
|
47.4
|
|
||||||
|
Income (loss) from continuing operations before income tax benefit
|
299.3
|
|
(391.2
|
)
|
21.3
|
|
||||||
|
Income tax benefit
|
(29.2
|
)
|
(171.5
|
)
|
(15.8
|
)
|
||||||
|
Income (loss) from continuing operations
|
328.5
|
|
(219.7
|
)
|
37.1
|
|
||||||
|
Discontinued operations:
|
||||||||||||
|
(Loss) income from discontinued operations
|
(8.6
|
)
|
144.2
|
|
5.7
|
|
||||||
|
Income tax (benefit) expense
|
(2.7
|
)
|
57.9
|
|
(0.9
|
)
|
||||||
|
(Loss) income from discontinued operations, net of tax
|
(5.9
|
)
|
86.3
|
|
6.6
|
|
||||||
|
Net income (loss)
|
322.6
|
|
(133.4
|
)
|
43.7
|
|
||||||
|
Net income attributed to non-controlling interests
|
33.8
|
|
20.3
|
|
24.3
|
|
||||||
|
Net income (loss) attributable to Delek
|
$
|
288.8
|
|
$
|
(153.7
|
)
|
$
|
19.4
|
|
|||
|
Basic income (loss) per share:
|
||||||||||||
|
Income (loss) from continuing operations
|
$
|
4.12
|
|
$
|
(3.88
|
)
|
$
|
0.21
|
|
|||
|
(Loss) income from discontinued operations
|
(0.08
|
)
|
1.39
|
|
0.11
|
|
||||||
|
Total basic income (loss) per share
|
$
|
4.04
|
|
$
|
(2.49
|
)
|
$
|
0.32
|
|
|||
|
Diluted income (loss) per share:
|
||||||||||||
|
Income (loss) from continuing operations
|
$
|
4.08
|
|
$
|
(3.88
|
)
|
$
|
0.21
|
|
|||
|
(Loss) income from discontinued operations
|
(0.08
|
)
|
1.39
|
|
0.11
|
|
||||||
|
Total diluted income (loss) per share
|
$
|
4.00
|
|
$
|
(2.49
|
)
|
$
|
0.32
|
|
|||
|
Weighted average common shares outstanding:
|
|
|
||||||||||
|
Basic
|
71,566,225
|
|
61,921,787
|
|
60,819,771
|
|
||||||
|
Diluted
|
72,303,083
|
|
61,921,787
|
|
61,320,570
|
|
||||||
|
Dividends declared per common share outstanding
|
$
|
0.60
|
|
$
|
0.60
|
|
$
|
0.60
|
|
|||
See accompanying notes to the consolidated financial statements
F-5
Delek US Holdings, Inc.
Consolidated Statements of Comprehensive Income
(In millions)
|
Year Ended December 31,
|
||||||||||||
|
|
2017
|
2016
|
2015
|
|||||||||
|
Net income (loss) attributable to Delek
|
$
|
288.8
|
|
$
|
(153.7
|
)
|
$
|
19.4
|
|
|||
|
Other comprehensive income (loss):
|
|
|
||||||||||
|
Commodity contracts designated as cash flow hedges:
|
||||||||||||
|
Unrealized gains (losses), net of ineffectiveness (gains) losses of $(0.5) million, $(3.1) million and $21.5 million for the years ended December 31, 2017, 2016 and 2015, respectively
|
(2.0
|
)
|
8.4
|
|
(41.4
|
)
|
||||||
|
Realized (gains) losses reclassified to cost of goods sold
|
38.6
|
|
27.8
|
|
(0.7
|
)
|
||||||
|
Increase (decrease) related to commodity cash flow hedges, net
|
36.6
|
|
36.2
|
|
(42.1
|
)
|
||||||
|
Income tax (expense) benefit
|
(12.8
|
)
|
(12.7
|
)
|
14.7
|
|
||||||
|
Net comprehensive income (loss) on commodity contracts designated as cash flow hedges
|
23.8
|
|
23.5
|
|
(27.4
|
)
|
||||||
|
Interest rate contracts designated as cash flow hedges:
|
||||||||||||
|
Unrealized gains
|
0.3
|
|
—
|
|
—
|
|
||||||
|
Realized losses reclassified to interest expense
|
0.3
|
|
—
|
|
—
|
|
||||||
|
Increase related to interest rate cash flow hedges, net
|
0.6
|
|
—
|
|
—
|
|
||||||
|
Income tax expense
|
(0.2
|
)
|
—
|
|
—
|
|
||||||
|
Net comprehensive income on interest rate contracts designated as cash flow hedges
|
0.4
|
|
—
|
|
—
|
|
||||||
|
Foreign currency translation gain
|
0.1
|
|
0.2
|
|
(0.3
|
)
|
||||||
|
Other comprehensive income (loss) from equity method investments, net of tax (expense) benefit of $(2.2) million, $(0.4) million, and $2.7 million for the years ended December 31, 2017, 2016 and 2015, respectively
|
4.1
|
|
0.8
|
|
(5.0
|
)
|
||||||
|
Postretirement benefit plans:
|
||||||||||||
|
Unrealized gain arising during the year related to:
|
||||||||||||
|
Net actuarial gain
|
(0.8
|
)
|
—
|
|
—
|
|
||||||
|
Curtailment gain
|
6.3
|
|
—
|
|
—
|
|
||||||
|
Gain reclassified to earnings:
|
||||||||||||
|
Recognized due to curtailment
|
(6.1
|
)
|
—
|
|
—
|
|
||||||
|
Decrease related to postretirement benefit plans, net
|
(0.6
|
)
|
—
|
|
—
|
|
||||||
|
Income tax benefit
|
—
|
|
—
|
|
—
|
|
||||||
|
Net comprehensive loss on postretirement benefit plans
|
(0.6
|
)
|
—
|
|
—
|
|
||||||
|
Total other comprehensive income (loss)
|
27.8
|
|
24.5
|
|
(32.7
|
)
|
||||||
|
Comprehensive income (loss) attributable to Delek
|
$
|
316.6
|
|
$
|
(129.2
|
)
|
$
|
(13.3
|
)
|
|||
See accompanying notes to the consolidated financial statements
F-6
Delek US Holdings, Inc.
Consolidated Statements of Changes in Stockholders' Equity
(In millions, except share and per share data)
|
Common Stock
|
Additional Paid-in Capital
|
Accumulated Other Comprehensive Income
|
Retained Earnings
|
Treasury Stock
|
Non-Controlling Interest in Subsidiaries
|
Total Stockholders' Equity
|
||||||||||||||||||||||||||||
|
Shares
|
Amount
|
Shares
|
Amount
|
|||||||||||||||||||||||||||||||
|
Balance at
|
December 31, 2014
|
60,637,525
|
|
$
|
0.6
|
|
$
|
395.1
|
|
$
|
(12.6
|
)
|
$
|
731.2
|
|
(3,365,561
|
)
|
$
|
(112.6
|
)
|
$
|
196.7
|
|
$
|
1,198.4
|
|
||||||||
|
Net income
|
—
|
|
—
|
|
—
|
|
—
|
|
19.4
|
|
—
|
|
—
|
|
24.3
|
|
43.7
|
|
||||||||||||||||
|
Unrealized loss on cash flow hedges, net of income tax benefit of $14.7 million and ineffectiveness loss of $21.5 million
|
—
|
|
—
|
|
—
|
|
(27.4
|
)
|
—
|
|
—
|
|
—
|
|
—
|
|
(27.4
|
)
|
||||||||||||||||
|
Other comprehensive loss from equity method investments, net of income tax benefit of $2.7 million
|
—
|
|
—
|
|
—
|
|
(5.0
|
)
|
(5.0
|
)
|
||||||||||||||||||||||||
|
Foreign currency translation loss
|
—
|
|
—
|
|
—
|
|
(0.3
|
)
|
—
|
|
—
|
|
—
|
|
—
|
|
(0.3
|
)
|
||||||||||||||||
|
Common stock dividends ($0.60 per share)
|
—
|
|
—
|
|
—
|
|
—
|
|
(37.1
|
)
|
—
|
|
—
|
|
—
|
|
(37.1
|
)
|
||||||||||||||||
|
Equity-based compensation expense
|
—
|
|
—
|
|
15.9
|
|
—
|
|
—
|
|
—
|
|
—
|
|
0.9
|
|
16.8
|
|
||||||||||||||||
|
Distribution to non-controlling interest
|
—
|
|
—
|
|
—
|
|
—
|
|
—
|
|
—
|
|
—
|
|
(20.9
|
)
|
(20.9
|
)
|
||||||||||||||||
|
Repurchase of common stock
|
—
|
|
—
|
|
—
|
|
—
|
|
|
—
|
|
(1,444,140
|
)
|
(42.2
|
)
|
—
|
|
(42.2
|
)
|
|||||||||||||||
|
Income tax benefit from equity-based compensation expense
|
—
|
|
—
|
|
1.3
|
|
—
|
|
—
|
|
—
|
|
—
|
|
—
|
|
1.3
|
|
||||||||||||||||
|
Stock issued in connection with the Alon Acquisition
|
6,000,000
|
|
0.1
|
|
230.7
|
|
—
|
|
—
|
|
—
|
|
—
|
|
—
|
|
230.8
|
|
||||||||||||||||
|
Taxes paid due to the net settlement of equity-based compensation
|
—
|
|
—
|
|
(4.4
|
)
|
—
|
|
—
|
|
—
|
|
—
|
|
—
|
|
(4.4
|
)
|
||||||||||||||||
|
Exercise of equity-based awards
|
309,196
|
|
—
|
|
0.2
|
|
—
|
|
—
|
|
—
|
|
—
|
|
—
|
|
0.2
|
|
||||||||||||||||
|
Other
|
—
|
|
—
|
|
0.4
|
|
—
|
|
—
|
|
—
|
|
—
|
|
(0.4
|
)
|
—
|
|
||||||||||||||||
|
Balance at
|
December 31, 2015
|
66,946,721
|
|
$
|
0.7
|
|
$
|
639.2
|
|
$
|
(45.3
|
)
|
$
|
713.5
|
|
(4,809,701
|
)
|
$
|
(154.8
|
)
|
$
|
200.6
|
|
$
|
1,353.9
|
|
||||||||
F-7
Delek US Holdings, Inc.
Consolidated Statements of Changes in Stockholders' Equity (Continued)
(In millions, except share and per share data)
|
Common Stock
|
Additional Paid-in Capital
|
Accumulated Other Comprehensive Income
|
Retained Earnings
|
Treasury Stock
|
Non-Controlling Interest in Subsidiaries
|
Total Stockholders' Equity
|
||||||||||||||||||||||||||||
|
Shares
|
Amount
|
Shares
|
Amount
|
|||||||||||||||||||||||||||||||
|
Balance at
|
December 31, 2015
|
66,946,721
|
|
$
|
0.7
|
|
$
|
639.2
|
|
$
|
(45.3
|
)
|
$
|
713.5
|
|
(4,809,701
|
)
|
$
|
(154.8
|
)
|
$
|
200.6
|
|
$
|
1,353.9
|
|
||||||||
|
Net (loss) income
|
—
|
|
—
|
|
—
|
|
—
|
|
(153.7
|
)
|
—
|
|
—
|
|
20.3
|
|
(133.4
|
)
|
||||||||||||||||
|
Net unrealized gain on cash flow hedges, net of income tax expense of $12.7 million and ineffectiveness gain of $3.1 million
|
—
|
|
—
|
|
—
|
|
23.5
|
|
—
|
|
—
|
|
—
|
|
—
|
|
23.5
|
|
||||||||||||||||
|
Other comprehensive loss from equity method investments, net of income tax expense of $0.4 million
|
0.8
|
|
—
|
|
—
|
|
—
|
|
—
|
|
0.8
|
|
||||||||||||||||||||||
|
Foreign currency translation gain
|
—
|
|
—
|
|
—
|
|
0.2
|
|
—
|
|
—
|
|
—
|
|
—
|
|
0.2
|
|
||||||||||||||||
|
Common stock dividends ($0.60 per share)
|
—
|
|
—
|
|
—
|
|
|
(37.5
|
)
|
—
|
|
—
|
|
—
|
|
(37.5
|
)
|
|||||||||||||||||
|
Equity-based compensation expense
|
—
|
|
—
|
|
15.7
|
|
—
|
|
—
|
|
—
|
|
—
|
|
0.7
|
|
16.4
|
|
||||||||||||||||
|
Distribution to non-controlling interest
|
—
|
|
—
|
|
—
|
|
—
|
|
—
|
|
—
|
|
—
|
|
(24.1
|
)
|
(24.1
|
)
|
||||||||||||||||
|
Repurchase of common stock
|
—
|
|
—
|
|
—
|
|
—
|
|
—
|
|
(386,090
|
)
|
(6.0
|
)
|
—
|
|
(6.0
|
)
|
||||||||||||||||
|
Repurchase of non-controlling interest
|
—
|
|
—
|
|
—
|
|
—
|
|
—
|
|
—
|
|
—
|
|
(6.9
|
)
|
(6.9
|
)
|
||||||||||||||||
|
Income tax benefit from equity-based compensation expense
|
—
|
|
—
|
|
(2.9
|
)
|
—
|
|
—
|
|
—
|
|
—
|
|
—
|
|
(2.9
|
)
|
||||||||||||||||
|
Taxes paid due to the net settlement of equity-based compensation
|
—
|
|
—
|
|
(1.5
|
)
|
—
|
|
—
|
|
—
|
|
—
|
|
—
|
|
(1.5
|
)
|
||||||||||||||||
|
Exercise of equity-based awards
|
203,631
|
|
—
|
|
—
|
|
—
|
|
—
|
|
—
|
|
—
|
|
—
|
|
—
|
|
||||||||||||||||
|
Balance at
|
December 31, 2016
|
67,150,352
|
|
$
|
0.7
|
|
$
|
650.5
|
|
$
|
(20.8
|
)
|
$
|
522.3
|
|
(5,195,791
|
)
|
$
|
(160.8
|
)
|
$
|
190.6
|
|
$
|
1,182.5
|
|
||||||||
F-8
Delek US Holdings, Inc.
Consolidated Statements of Changes in Stockholders' Equity (Continued)
(In millions, except share and per share data)
|
Common Stock
|
Additional Paid-in Capital
|
Accumulated Other Comprehensive Income
|
Retained Earnings
|
Treasury Stock
|
Non-Controlling Interest in Subsidiaries
|
Total Stockholders' Equity
|
||||||||||||||||||||||||||||
|
Shares
|
Amount
|
Shares
|
Amount
|
|||||||||||||||||||||||||||||||
|
Balance at
|
December 31, 2016
|
67,150,352
|
|
$
|
0.7
|
|
$
|
650.5
|
|
$
|
(20.8
|
)
|
$
|
522.3
|
|
(5,195,791
|
)
|
$
|
(160.8
|
)
|
$
|
190.6
|
|
$
|
1,182.5
|
|
||||||||
|
Net income
|
—
|
|
—
|
|
—
|
|
—
|
|
288.8
|
|
—
|
|
—
|
|
33.8
|
|
322.6
|
|
||||||||||||||||
|
Net unrealized gain on cash flow hedges, net of income tax expense of $12.8 million and ineffectiveness gain of $0.5 million
|
—
|
|
—
|
|
—
|
|
23.8
|
|
—
|
|
—
|
|
—
|
|
—
|
|
23.8
|
|
||||||||||||||||
|
Other comprehensive income from equity method investments, net of income tax expense of $2.2 million
(1)
|
—
|
|
—
|
|
—
|
|
4.1
|
|
—
|
|
—
|
|
—
|
|
—
|
|
4.1
|
|
||||||||||||||||
|
Other comprehensive income related to postretirement benefit plans
|
—
|
|
—
|
|
—
|
|
(0.6
|
)
|
—
|
|
—
|
|
—
|
|
—
|
|
(0.6
|
)
|
||||||||||||||||
|
Other comprehensive income related to interest rate contracts
|
—
|
|
—
|
|
—
|
|
0.4
|
|
—
|
|
—
|
|
—
|
|
—
|
|
0.4
|
|
||||||||||||||||
|
Foreign currency translation gain
|
—
|
|
—
|
|
—
|
|
0.1
|
|
—
|
|
—
|
|
—
|
|
—
|
|
0.1
|
|
||||||||||||||||
|
Common stock dividends ($0.60 per share)
|
—
|
|
—
|
|
—
|
|
—
|
|
(44.0
|
)
|
—
|
|
—
|
|
—
|
|
(44.0
|
)
|
||||||||||||||||
|
Issuance of equity in connection with Delek/Alon Merger
|
19,250,795
|
|
0.1
|
|
399.0
|
|
—
|
|
—
|
|
—
|
|
—
|
|
131.6
|
|
530.7
|
|
||||||||||||||||
|
Retirement of Treasury shares in connection with Delek/Alon Merger
|
(5,195,791
|
)
|
—
|
|
(160.8
|
)
|
—
|
|
—
|
|
5,195,791
|
|
160.8
|
|
—
|
|
—
|
|
||||||||||||||||
|
Distributions to non-controlling interests
|
—
|
|
—
|
|
—
|
|
—
|
|
—
|
|
—
|
|
—
|
|
(35.7
|
)
|
(35.7
|
)
|
||||||||||||||||
|
Equity-based compensation expense
|
—
|
|
—
|
|
16.9
|
|
—
|
|
—
|
|
—
|
|
—
|
|
0.6
|
|
17.5
|
|
||||||||||||||||
|
Repurchase of common stock
|
—
|
|
—
|
|
—
|
|
—
|
|
—
|
|
(762,623
|
)
|
(25.0
|
)
|
(7.3
|
)
|
(32.3
|
)
|
||||||||||||||||
|
Issuance costs in connection with Delek/Alon Merger
|
—
|
|
—
|
|
(0.2
|
)
|
—
|
|
—
|
|
—
|
|
—
|
|
—
|
|
(0.2
|
)
|
||||||||||||||||
|
Taxes due to the net settlement of equity-based compensation
|
—
|
|
—
|
|
(5.0
|
)
|
—
|
|
—
|
|
—
|
|
—
|
|
—
|
|
(5.0
|
)
|
||||||||||||||||
|
Exercise of equity-based awards
|
328,192
|
|
—
|
|
|
—
|
|
—
|
|
—
|
|
—
|
|
—
|
|
—
|
|
|||||||||||||||||
|
Other
|
—
|
|
—
|
|
(0.3
|
)
|
(0.1
|
)
|
0.7
|
|
—
|
|
—
|
|
—
|
|
0.3
|
|
||||||||||||||||
|
Balance at
|
December 31, 2017
|
81,533,548
|
|
$
|
0.8
|
|
$
|
900.1
|
|
$
|
6.9
|
|
$
|
767.8
|
|
(762,623
|
)
|
$
|
(25.0
|
)
|
$
|
313.6
|
|
$
|
1,964.2
|
|
||||||||
(1)
Includes reversal of $4.1 million of accumulated other comprehensive loss related to the pre-Merger equity method investment in Alon.
See accompanying notes to the consolidated financial statements
F-9
Delek US Holdings, Inc.
(In millions, except per share data )
|
Year Ended December 31,
|
||||||||||||
|
2017
|
2016
|
2015
|
||||||||||
|
Cash flows from operating activities:
|
|
|||||||||||
|
Net income (loss)
|
$
|
322.6
|
|
$
|
(133.4
|
)
|
$
|
43.7
|
|
|||
|
Adjustments to reconcile net income (loss) to net cash (used in) provided by operating activities:
|
||||||||||||
|
Depreciation and amortization
|
153.3
|
|
116.4
|
|
106.0
|
|
||||||
|
Amortization of deferred financing costs and debt discount
|
8.3
|
|
4.4
|
|
4.1
|
|
||||||
|
Accretion of environmental liabilities asset retirement obligations
|
1.2
|
|
0.3
|
|
0.4
|
|
||||||
|
Amortization of unfavorable contract liability
|
(5.8
|
)
|
(0.7
|
)
|
—
|
|
||||||
|
Deferred income taxes
|
(48.0
|
)
|
(153.2
|
)
|
19.0
|
|
||||||
|
(Income) loss from equity method investments
|
(12.6
|
)
|
43.4
|
|
(2.0
|
)
|
||||||
|
Dividends from equity method investments
|
18.3
|
|
20.2
|
|
15.1
|
|
||||||
|
Loss on disposal of assets
|
1.0
|
|
4.8
|
|
0.3
|
|
||||||
|
Impairment of fixed assets
|
—
|
|
—
|
|
2.2
|
|
||||||
|
Impairment of equity method investment
|
—
|
|
245.3
|
|
—
|
|
||||||
|
Gain on remeasurement of equity method investment
|
(190.1
|
)
|
—
|
|
—
|
|
||||||
|
Equity-based compensation expense
|
17.5
|
|
16.4
|
|
16.8
|
|
||||||
|
Income tax benefit of equity-based compensation
|
(1.4
|
)
|
(1.2
|
)
|
(1.3
|
)
|
||||||
|
Loss (income) from discontinued operations
|
5.9
|
|
(86.3
|
)
|
(6.6
|
)
|
||||||
|
Changes in assets and liabilities, net of acquisitions:
|
||||||||||||
|
Accounts receivable
|
(155.8
|
)
|
(48.1
|
)
|
(36.9
|
)
|
||||||
|
Inventories and other current assets
|
(191.1
|
)
|
(56.5
|
)
|
119.8
|
|
||||||
|
Fair value of derivatives
|
39.2
|
|
44.2
|
|
32.9
|
|
||||||
|
Accounts payable and other current liabilities
|
290.9
|
|
223.8
|
|
(82.2
|
)
|
||||||
|
Obligation under Supply and Offtake Agreement
|
113.0
|
|
12.8
|
|
(68.9
|
)
|
||||||
|
Non-current assets and liabilities, net
|
(32.2
|
)
|
2.3
|
|
(18.4
|
)
|
||||||
|
Cash provided by operating activities - continuing operations
|
334.2
|
|
254.9
|
|
144.0
|
|
||||||
|
Cash (used in) provided by operating activities - discontinued operations
|
(2.1
|
)
|
13.3
|
|
36.0
|
|
||||||
|
Net cash provided by operating activities
|
332.1
|
|
268.2
|
|
180.0
|
|
||||||
|
Cash flows from investing activities:
|
|
|
|
|||||||||
|
Business combinations, net of cash acquired
|
196.2
|
|
—
|
|
(0.4
|
)
|
||||||
|
Equity method investment contributions
|
(5.8
|
)
|
(61.6
|
)
|
(240.9
|
)
|
||||||
|
Purchases of property, plant and equipment
|
(172.0
|
)
|
(46.3
|
)
|
(187.7
|
)
|
||||||
|
Purchase of intangible assets
|
(5.5
|
)
|
(0.7
|
)
|
(7.2
|
)
|
||||||
|
Proceeds from sales of assets
|
0.1
|
|
0.2
|
|
1.2
|
|
||||||
|
Cash provided by (used in) investing activities - continuing operations
|
13.0
|
|
(108.4
|
)
|
(435.0
|
)
|
||||||
|
Cash provided by (used in) investing activities - discontinued operations
|
12.2
|
|
288.9
|
|
(25.4
|
)
|
||||||
|
Net cash provided by (used in) investing activities
|
25.2
|
|
180.5
|
|
(460.4
|
)
|
||||||
|
Cash flows from financing activities:
|
|
|
|
|||||||||
|
Proceeds from long-term revolvers
|
1,122.1
|
|
369.0
|
|
436.9
|
|
||||||
|
Payments on long-term revolvers
|
(1,239.8
|
)
|
(327.9
|
)
|
(337.1
|
)
|
||||||
|
Proceeds from term debt
|
286.2
|
|
40.3
|
|
174.6
|
|
||||||
|
Payments on term debt
|
(103.6
|
)
|
(55.0
|
)
|
(77.6
|
)
|
||||||
|
Proceeds from exercise of stock options
|
—
|
|
—
|
|
0.2
|
|
||||||
|
Proceeds from product financing agreements
|
52.5
|
|
56.5
|
|
—
|
|
||||||
|
Repayments of product financing agreements
|
(98.7
|
)
|
(50.4
|
)
|
—
|
|
||||||
|
Taxes paid due to the net settlement of equity-based compensation
|
(5.0
|
)
|
(1.5
|
)
|
(4.4
|
)
|
||||||
|
Income tax benefit expense of equity-based compensation
|
—
|
|
1.2
|
|
1.3
|
|
||||||
|
Repurchase of common stock
|
(25.0
|
)
|
(6.0
|
)
|
(42.2
|
)
|
||||||
|
Repurchase of non-controlling interest
|
(7.3
|
)
|
(6.9
|
)
|
—
|
|
||||||
|
Distribution to non-controlling interest
|
(35.7
|
)
|
(24.1
|
)
|
(20.9
|
)
|
||||||
|
Dividends paid
|
(44.0
|
)
|
(37.5
|
)
|
(37.1
|
)
|
||||||
|
Deferred financing costs paid
|
(6.3
|
)
|
(1.9
|
)
|
(2.7
|
)
|
||||||
|
Cash (used in) provided by financing activities - continuing operations
|
(104.6
|
)
|
(44.2
|
)
|
91.0
|
|
||||||
|
Cash (used in) provided by financing activities - discontinued operations
|
—
|
|
(17.5
|
)
|
47.5
|
|
||||||
|
Net cash (used in) provided by financing activities
|
(104.6
|
)
|
(61.7
|
)
|
138.5
|
|
||||||
|
Net increase in cash and cash equivalents
|
252.7
|
|
387.0
|
|
(141.9
|
)
|
||||||
|
Cash and cash equivalents at the beginning of the period
|
689.2
|
|
302.2
|
|
444.1
|
|
||||||
|
Cash and cash equivalents at the end of the period
|
941.9
|
|
689.2
|
|
302.2
|
|
||||||
|
Less cash and cash equivalents of discontinued operations at the end of the period
|
10.1
|
|
—
|
|
15.0
|
|
||||||
|
Cash and cash equivalents of continuing operations at the end of the period
|
$
|
931.8
|
|
$
|
689.2
|
|
$
|
287.2
|
|
|||
|
Supplemental disclosures of cash flow information:
|
|
|
||||||||||
|
Cash paid during the period for:
|
|
|
||||||||||
|
Interest, net of capitalized interest of $0.3 million, $0.2 million and $0.6 million in 2017, 2016 and 2015, respectively
|
$
|
82.1
|
|
$
|
51.9
|
|
$
|
48.9
|
|
|||
|
Income taxes
|
$
|
70.5
|
|
$
|
1.7
|
|
$
|
5.1
|
|
|||
|
Non-cash investing activities:
|
||||||||||||
|
Equity method investments
|
$
|
—
|
|
$
|
—
|
|
$
|
8.8
|
|
|||
|
Increase (decrease) in accrued capital expenditures
|
$
|
9.4
|
|
$
|
(3.7
|
)
|
$
|
4.5
|
|
|||
|
Non-cash financing activities:
|
||||||||||||
|
Common stock issued in connection with the Delek/Alon Merger
|
$
|
509.0
|
|
$
|
—
|
|
$
|
—
|
|
|||
|
Equity instruments issued in connection with the Alon Acquisition
|
$
|
—
|
|
$
|
—
|
|
$
|
230.8
|
|
|||
|
Note payable issued in connection with the Alon Acquisition
|
$
|
—
|
|
$
|
—
|
|
$
|
145.0
|
|
|||
|
Equity instruments issued in connection with the Delek/Alon Merger
|
$
|
21.7
|
|
$
|
—
|
|
||||||
See accompanying notes to the consolidated financial statements
F-10
Delek US Holdings, Inc.
Notes to Consolidated Financial Statements
1
. General
Delek US Holdings, Inc. is the sole shareholder or owner of membership interests of Delek US Energy, Inc. (and its wholly-owned subsidiaries, Delek Refining, Inc. ("Refining"), Delek Finance, Inc., Delek Marketing & Supply, LLC, Lion Oil Company ("Lion Oil"), Delek Renewables, LLC, Delek Rail Logistics, Inc., Delek Logistics Services Company, Delek Helena, LLC, Delek Land Holdings, LLC)) and Alon USA Energy, Inc. ("Alon") (and its wholly-owned subsidiaries).
Effective July 1, 2017 (the "Effective Time"), we acquired the outstanding common stock of Alon (previously listed under NYSE: ALJ) (the "Delek/Alon Merger", as further discussed in Note
3
), resulting in a new post-combination consolidated registrant renamed as Delek US Holdings, Inc. (“New Delek”), with Alon and the previous Delek US Holdings, Inc. (“Old Delek”) surviving as wholly-owned subsidiaries. New Delek is the successor issuer to Old Delek and Alon pursuant to Rule 12g-3(c) under the Securities Exchange Act of 1934, as amended (the "Exchange Act"). In addition, as a result of the Delek/Alon Merger, the shares of common stock of Old Delek and Alon were delisted from the New York Stock Exchange in July 2017, and their respective reporting obligations under the Exchange Act were terminated.
Unless otherwise indicated or the context requires otherwise, the disclosures and financial information included in this report for the periods prior to July 1, 2017 reflect that of Old Delek, and the disclosures and financial information included in this report for the periods beginning July 1, 2017 reflect that of New Delek. The terms "we," "our," "us," "Delek" and the "Company" are used in this report to refer to Old Delek and its consolidated subsidiaries for the periods prior to July 1, 2017, and New Delek and its consolidated subsidiaries for the periods on or after July 1, 2017, unless otherwise noted. New Delek's Common Stock is listed on the New York Stock Exchange under the symbol "DK."
2
. Accounting Policies
Basis of Presentation
Our consolidated financial statements include the accounts of Delek and its subsidiaries. All significant intercompany transactions and account balances have been eliminated in consolidation. We have evaluated subsequent events through the filing of this Form 10-K. Any material subsequent events that occurred during this time have been properly recognized or disclosed in our financial statements.
In August 2016, we entered into a definitive equity purchase agreement (the "Purchase Agreement") with Compañía de Petróleos de Chile COPEC S.A. and its subsidiary, Copec Inc., a Delaware corporation (collectively, "COPEC"). Under the terms of the Purchase Agreement, Delek agreed to sell, and COPEC agreed to purchase, 100% of the equity interests in Delek's wholly-owned subsidiaries MAPCO Express, Inc. ("MAPCO Express"), MAPCO Fleet, Inc., Delek Transportation, LLC, NTI Investments, LLC and GDK Bearpaw, LLC (collectively, the “Retail Entities”) for cash consideration of
$535 million
, subject to customary adjustments (the “ Retail Transaction”). The Retail Transaction closed in November 2016. As a result of the Purchase Agreement, we met the requirements under the provisions of Accounting Standards Codification ("ASC") 205-20,
Presentation of Financial Statements - Discontinued Operations
("ASC 205-20") and ASC 360,
Property, Plant and Equipment
("ASC 360")
,
to report the results of the Retail Entities as discontinued operations and to classify the Retail Entities as a group of assets held for sale. See Note
6
for further information regarding the Retail Entities.
During the third quarter 2017, we committed to a plan to sell certain assets associated with our Paramount and Long Beach, California refineries and Alon's California renewable fuels facility (collectively, the "California Discontinued Entities"), which were acquired as part of the Delek/Alon Merger. As a result of this decision and commitment to a plan, and because it was made within three months of the Delek/Alon Merger, we met the requirements under ASC 205-20 and ASC 360 to report the results of the California Discontinued Entities as discontinued operations and to classify the California Discontinued Entities as a group of assets held for sale. The sale of the California Discontinued Entities is currently anticipated to occur within the next 6-9 months. See Note
6
for further information regarding the California Discontinued Entities.
Our consolidated financial statements include Delek Logistics Partners, LP ("Delek Logistics"), Alon USA Partners, LP (the "Alon Partnership") and AltAir Paramount LLC ("AltAir"), all variable interest entities. See Note
25
regarding acquisition of the non-controlling interest in the Alon Partnership on February 7, 2018. As the indirect owner of the general partners of Delek Logistics and the Alon Partnership and the managing member of AltAir, we have the ability to direct the activities of these entities that most significantly impact their economic performance. We are also considered to be the primary beneficiary for accounting purposes for all of these entities and are Delek Logistics' primary customer. As Delek Logistics does not derive an amount of gross margin material to us from third parties, there is limited risk to Delek associated with Delek Logistics' operations. However, in the event that Delek Logistics, the Alon Partnership or AltAir incurs a loss, our operating results will reflect their loss, net of intercompany eliminations, to the extent of our ownership interest in these entities. AltAir's results are included in discontinued operations - see Note
6
.
F-11
The preparation of financial statements in conformity with U.S. generally accepted accounting principles ("GAAP") and in accordance with the rules and regulations of the Securities and Exchange Commission ("SEC") requires management to make estimates and assumptions that affect the reported amounts of assets and liabilities and disclosure of contingent assets and liabilities at the date of the financial statements and the reported amounts of revenues and expenses during the reporting period. Actual results could differ from those estimates.
Reclassifications
Certain prior period amounts have been reclassified in order to conform to the current year presentation.
Segment Reporting
Delek is an integrated downstream energy business focused on petroleum refining, the transportation, storage and wholesale distribution of crude oil, intermediate and refined products and convenience store retailing. Prior to August 2016, we aggregated our operating units into three reportable segments: refining, logistics and retail. However, in August 2016, Delek entered into the Purchase Agreement pursuant to which it agreed to sell the Retail Entities, which consist of all of the retail segment and a portion of the corporate, other and eliminations segment, to COPEC, and in November 2016, the Retail Transaction closed. As a result of the Purchase Agreement, we met the requirements of ASC 205-20
and ASC 360 to report the results of the Retail Entities as discontinued operations and to classify the Retail Entities as a group of assets held for sale. The operating results for the Retail Entities, in all periods presented, have been reclassified to discontinued operations. Following the Delek/Alon Merger of July 1, 2017, Delek's business again includes retail operations.
Our corporate activities, results of certain immaterial operating segments (including our asphalt terminal operations effective with the Delek/ Alon Merger), our non-controlling equity interest of approximately
47%
of the outstanding shares in Alon (which was accounted for as an equity method investment) prior to the Delek/Alon Merger and intercompany eliminations are reported in corporate, other and eliminations segment. Decisions concerning the allocation of resources and assessment of operating performance are made based on this segmentation. Management measures the operating performance of each of the reportable segments based on the segment contribution margin.
Prior to the Delek/Alon Merger, the refining segment operated high conversion, independent refineries in Tyler, Texas (the "Tyler refinery") and El Dorado, Arkansas (the "El Dorado refinery") and biodiesel facilities in Cleburne, Texas and Crossett, Arkansas. Effective with the Delek/Alon Merger, the refining segment now also includes the operations of high conversion, independent refineries in Big Spring, Texas (the "Big Spring refinery"), Krotz Springs, Louisiana (the "Krotz Springs refinery") and in Bakersfield, California (the "Bakersfield refinery"). The Bakersfield refinery has not processed crude oil since 2012 due to the high cost of crude oil relative to product yield and low asphalt demand. The logistics segment owns and operates crude oil and refined products logistics and marketing assets. The retail segment markets gasoline, diesel and other refined petroleum products, and convenience merchandise through a network of company-operated retail fuel and convenience stores. Segment reporting is more fully discussed in
Note 15
.
Cash and Cash Equivalents
Delek maintains cash and cash equivalents in accounts with large, U.S. or multi-national financial institutions. All highly liquid investments purchased with a term of three months or less are considered to be cash equivalents. As of
December 31, 2017
and
2016
, these cash equivalents consisted primarily of bank certificates of deposit and bank money market accounts, as well as overnight investments in U.S. Government obligations and bank repurchase obligations collateralized by U.S. Government obligations.
Accounts Receivable
Accounts receivable primarily consists of trade receivables generated in the ordinary course of business. Delek recorded an allowance for doubtful accounts related to trade receivables of
$4.4 million
as of
December 31, 2017
. Delek had
no
allowance for doubtful accounts as of December 31, 2016.
Credit is extended based on evaluation of the customer’s financial condition. We perform ongoing credit evaluations of our customers and require letters of credit, prepayments or other collateral or guarantees as management deems appropriate. Allowance for doubtful accounts is based on a combination of current sales and specific identification methods.
Credit risk is minimized as a result of the ongoing credit assessment of our customers and a lack of concentration in our customer base. Credit losses are charged to allowance for doubtful accounts when deemed uncollectible. Our allowance for doubtful accounts is reflected as a reduction of accounts receivable in the consolidated balance sheets.
No
customer accounted for more than 10% of our consolidated accounts receivable balance as of both
December 31, 2017
and
2016
.
No
customer accounted for more than 10% of consolidated net sales for the years ended
December 31, 2017
,
2016
or
2015
.
F-12
Inventory
Refinery crude oil, work-in-process, refined products, blendstocks and asphalt inventory for all of our operations, excluding the refinery located in Tyler, Texas (the "Tyler refinery") and merchandise inventory in our Retail segment, are stated at the lower of cost determined using the first-in, first-out (“FIFO”) basis or net realizable value. Cost of all inventory at the Tyler refinery is determined using the last-in, first-out (“LIFO”) inventory valuation method and inventory is stated at the lower of LIFO cost or market. Retail merchandise inventory consists of cigarettes, beer, convenience merchandise and food service merchandise and is stated at estimated cost as determined by the retail inventory method. We are not subject to concentration risk with specific suppliers, since our crude oil and refined products inventory purchases are commodities that are readily available from a large selection of suppliers.
Property, Plant and Equipment
Assets acquired by Delek in conjunction with business acquisitions are recorded at estimated fair value at the acquisition date in accordance with the purchase method of accounting as prescribed in ASC 805,
Business Combinations
("ASC 805"). Other acquisitions of property and equipment are carried at cost. Betterments, renewals and extraordinary repairs that extend the life of an asset are capitalized. Maintenance and repairs are charged to expense as incurred. Delek owns certain fixed assets on leased locations and depreciates these assets and asset improvements over the lesser of management's estimated useful lives of the assets or the remaining lease term.
Depreciation is computed using the straight-line method over management's estimated useful lives of the related assets, which are as follows:
|
Years
|
|
|
Building and building improvements
|
15-40
|
|
Refinery machinery and equipment
|
5-40
|
|
Pipelines and terminals
|
15-40
|
|
Retail store equipment and site improvements
|
7-40
|
|
Refinery turnaround costs
|
4-6
|
|
Automobiles
|
3-5
|
|
Computer equipment and software
|
3-10
|
|
Furniture and fixtures
|
5-15
|
|
Asset retirement obligation assets
|
15-50
|
Other Intangible Assets
Delek has intangible assets associated with third-party fuel supply agreements, fuel trade name, liquor licenses, refinery permits and below market leases subsequent to the Delek/Alon Merger, in addition to a long-term supply contract, capacity contracts, line space history and rights of way. We amortize the definite-lived intangible assets on straight-line bases over the estimated useful lives of
five
to
15
years. The amortization expense is included in depreciation and amortization on the accompanying consolidated statements of income.
Property, Plant and Equipment and Other Intangibles Impairment
Property, plant and equipment and definite life intangibles are evaluated for impairment whenever indicators of impairment exist. In accordance with ASC 360 and ASC 350,
Intangibles - Goodwill and Other
, Delek evaluates the realizability of these long-lived assets as events occur that might indicate potential impairment. In doing so, Delek assesses whether the carrying amount of the asset is unrecoverable by estimating the sum of the future cash flows expected to result from the asset, undiscounted and without interest charges. If the carrying amount is more than the recoverable amount, an impairment charge must be recognized based on the fair value of the asset. These impairment charges are included in other operating income in our consolidated statements of income. We recognized an impairment charge of
$2.2 million
for the year ended
December 31, 2015
, related to the write-down of certain idle refining equipment in our refining segment to net realizable value. There were
no
impairment charges identified for the years ended
December 31, 2017
or
2016
.
Equity Method Investments
For equity investments that are not required to be consolidated under the variable or voting interest model, we evaluate the level of influence we are able to exercise over an entity’s operations to determine whether to use the equity method of accounting. Our judgment regarding the level of influence over an equity method investment includes considering key factors such as our ownership interest, participation in policy-making and other significant decisions and material intercompany transactions. Equity investments for which we determine we have significant influence are accounted for as equity method investments. Amounts recognized for equity method investments are included in equity method investments in our consolidated balance sheets and adjusted for our share of the net earnings and losses of the investee and cash distributions, which are
F-13
separately stated in our consolidated statements of income and our consolidated statements of cash flows. We evaluate our equity method investments for impairment whenever events or changes in circumstances indicate that the carrying amounts of such investments may be impaired. Based on our evaluations, it was necessary to record an impairment charge of
$245.3 million
on our investment in Alon based on the quoted market price of our ALJ Shares as of September 30, 2016, during the
year ended
December 31, 2016
. This impairment is reflected in the loss on impairment of equity method investment in our consolidated statements of income for the
year ended
December 31, 2016
. There were
no
impairment losses recorded on equity method investments for the year ended
December 31, 2017
or 2015. See
Note 5
for further information on our equity method investments.
Capitalized Interest
Delek capitalizes interest on capital projects associated with the refining and logistics segments. For the years ended
December 31, 2017
,
2016
and
2015
, interest of
$0.3 million
,
$0.2 million
and
$0.6 million
, respectively, was capitalized relating to these projects.
Refinery Turnaround Costs
Refinery turnaround costs are incurred in connection with planned shutdowns and inspections of our refineries' major units to perform necessary repairs and replacements. Refinery turnaround costs are deferred when incurred, classified as property, plant and equipment and amortized on a straight-line basis over that period of time estimated to lapse until the next planned turnaround occurs. Refinery turnaround costs include, among other things, the cost to repair, restore, refurbish or replace refinery equipment such as vessels, tanks, reactors, piping, rotating equipment, instrumentation, electrical equipment, heat exchangers and fired heaters.
Goodwill and Potential Impairment
Goodwill in an acquisition represents the excess of the aggregate purchase price over the fair value of the identifiable net assets. Delek's goodwill, all of which was acquired in various business combinations, is recorded at original fair value and is not amortized. Goodwill is subject to annual assessment to determine if an impairment of value has occurred, and Delek performs this review annually in the fourth quarter. We could also be required to evaluate our goodwill if, prior to our annual assessment, we experience disruptions in our business, have unexpected significant declines in operating results or sustain a permanent market capitalization decline. If a reporting unit's carrying amount exceeds its fair value, the impairment assessment leads to the testing of the implied fair value of the reporting unit's goodwill to its carrying amount. If the implied fair value is less than the carrying amount, a goodwill impairment charge is recorded. Our annual assessment of goodwill did not result in impairment during the years ended
December 31, 2017
,
2016
or
2015
.
Renewable Identification Numbers
The U.S. Environmental Protection Agency (“EPA”) requires certain refiners to blend biofuels into the fuel products they produce pursuant to the EPA’s Renewable Fuel Standard - 2 ("RFS-2"). Alternatively, credits, called Renewable Identification Numbers ("RINs"), which may be generated and/or purchased, can be used to satisfy this obligation instead of physically blending biofuels ("RINs Obligation"). All of our refineries are obligated parties to the RFS-2 (see
Note 21
for further discussion of these requirements). To the extent that any of our refineries is unable to blend biofuels at the required rate, it must purchase RINs in the open market to satisfy its annual requirement. Our RINs Obligation is based on the amount of RINs we must purchase and the price of those RINs as of the balance sheet date. The cost of RINs used each period is charged to cost of goods sold in the consolidated statements of income. We recognize a liability at the end of each reporting period in which we do not have sufficient RINs to cover the RINs Obligation. The liability is calculated by multiplying the RINs shortage (based on actual results) by the period end RIN spot price. From time to time, we may hold RINs generated or acquired in excess of our current obligations. We recognize an asset at the end of each reporting period in which we have generated or acquired RINs in excess of our RINs Obligation. The asset is calculated by multiplying the RINs surplus (based on actual results) by the period end RIN spot price. The value of RINs in excess of our RINs Obligation, if any, would be reflected in other current assets on the consolidated balance sheets. RINs generated in excess of our current RINs Obligation may be sold or held to offset future RINs Obligations. Any such sales of excess RINs are recorded in cost of goods sold on the consolidated statements of income. The assets and liabilities associated with our RINs Obligation are considered recurring fair value measurements. See
Note 16
for further information.
From time to time, Delek enters into future commitments to purchase or sell RINs at fixed prices and quantities, which are used to manage the costs associated with our RINs Obligation. These future RIN commitment contracts meet the definition of derivative instruments under ASC 815 and are measured at fair value based on quoted prices from an independent pricing service. Changes in the fair value of these future RIN commitment contracts are recorded in cost of goods sold on the consolidated statements of income. See
Note 17
for further information.
F-14
Derivatives
Delek records all derivative financial instruments, including any interest rate swap and cap agreements, fuel-related derivatives, over the counter ("OTC") future swaps, forward contracts and future RIN purchase and sales commitments that qualify as derivative instruments, at estimated fair value in accordance with the provisions of ASC 815,
Derivatives and Hedging
("ASC 815"). Changes in the fair value of the derivative instruments are recognized in operations, unless we elect to apply and qualify for the hedging treatment permitted under the provisions of ASC 815 allowing such changes to be classified as other comprehensive income for cash flow hedges. We validate the fair value of all derivative financial instruments on a periodic basis, utilizing exchange pricing and/or price index developers such as Platts, Argus or OPIS. On a regular basis, Delek enters into commodity contracts with counterparties for the purchase or sale of crude oil, blendstocks, and various finished products. These contracts usually qualify for the normal purchase / normal sale exemption under ASC 815 and, as such, are not measured at fair value.
Delek's policy under the guidance of ASC 815-10-45,
Derivatives and
Hedging - Other Presentation Matters
("ASC 815-10-45"), is to net the fair value amounts recognized for multiple derivative instruments executed with the same counterparty and offset these values against the cash collateral arising from these derivative positions.
Fair Value of Financial Instruments
The fair values of financial instruments are estimated based upon current market conditions and quoted market prices for the same or similar instruments. Management estimates that the carrying value approximates fair value for all of Delek's assets and liabilities that fall under the scope of ASC 825,
Financial Instruments
("ASC 825").
Delek applies the provisions of ASC 820,
Fair Value Measurements and Disclosure
("ASC 820"), which defines fair value, establishes a framework for its measurement and expands disclosures about fair value measurements. ASC 820 applies to our commodity and interest rate derivatives that are measured at fair value on a recurring basis. ASC 820 also applies to the measurement of our equity method investment, goodwill and long-lived tangible and intangible assets when determining whether or not an impairment exists, when circumstances require evaluation. See
Note 5
for further information. This standard also requires that we assess the impact of nonperformance risk on our derivatives. Nonperformance risk is not considered material to our financial statements at this time.
Delek also applies the provisions of ASC 825 as it pertains to the fair value option. This standard permits the election to carry financial instruments and certain other items similar to financial instruments at fair value on the balance sheet, with all changes in fair value reported in earnings. By electing the fair value option, we can achieve an accounting result similar to a fair value hedge without having to follow the complex hedge accounting rules. As of both
December 31, 2017
and
2016
, we elected to account for the step-out liabilities associated with our applicable Master Supply and Offtake Agreements (the "Supply and Offtake Agreements") with J. Aron & Company ("J. Aron") at fair value and recognize all changes in the fair value of the step-out liabilities in cost of goods sold in the accompanying statements of income. See Notes
8
and
16
for further discussion.
Self-Insurance Reserves
Delek has varying deductibles or self-insured retentions on our workers’ compensation, general liability, automobile liability insurance and medical claims for certain employees with coverage above the deductibles or self-insured retentions in amounts management considers adequate. We maintain an accrual for these costs based on claims filed and an estimate of claims incurred but not reported. Differences between actual settlements and recorded accruals are recorded in the period identified.
Environmental Expenditures
It is Delek's policy to accrue environmental and clean-up related costs of a non-capital nature when it is both probable that a liability has been incurred and the amount can be reasonably estimated. Environmental liabilities represent the current estimated costs to investigate and remediate contamination at our properties. This estimate is based on internal and third-party assessments of the extent of the contamination, the selected remediation technology and review of applicable environmental regulations, typically considering estimated activities and costs for 15 years, and up to 30 years if a longer period is believed reasonably necessary. Accruals for estimated costs from environmental remediation obligations generally are recognized no later than completion of the remedial feasibility study and include, but are not limited to, costs to perform remedial actions and costs of machinery and equipment that are dedicated to the remedial actions and that do not have an alternative use. Such accruals are adjusted as further information develops or circumstances change. We discount environmental liabilities to their present value if payments are fixed and determinable. Expenditures for equipment necessary for environmental issues relating to ongoing operations are capitalized.
F-15
Asset Retirement Obligations
Delek recognizes liabilities which represent the fair value of a legal obligation to perform asset retirement activities, including those that are conditional on a future event, when the amount can be reasonably estimated. If a reasonable estimate cannot be made at the time the liability is incurred, we record the liability when sufficient information is available to estimate the liability’s fair value.
In the refining segment, we have asset retirement obligations with respect to our refineries due to various legal obligations to clean and/or dispose of these assets at the time they are retired. However, the majority of these assets can be used for extended and indeterminate periods of time provided that they are properly maintained and/or upgraded. It is our practice and intent to continue to maintain these assets and make improvements based on technological advances. In the logistics segment, these obligations relate to the required cleanout of the pipeline and terminal tanks and removal of certain above-grade portions of the pipeline situated on right-of-way property. In the retail segment, we have asset retirement obligations related to the removal of underground storage tanks and the removal of brand signage at owned and leased retail sites which are legally required under the applicable leases. The asset retirement obligation for storage tank removal on leased retail sites is accreted over the expected life of the owned retail site or the average retail site lease term.
The reconciliation of the beginning and ending carrying amounts of asset retirement obligations is as follows (in millions):
|
December 31,
|
||||||||
|
2017
|
2016
|
|||||||
|
Beginning balance
|
$
|
5.2
|
|
$
|
5.3
|
|
||
|
Liabilities identified
(1)
|
66.2
|
|
—
|
|
||||
|
Liabilities settled
|
—
|
|
(0.4
|
)
|
||||
|
Accretion expense
|
0.7
|
|
0.3
|
|
||||
|
Ending balance
|
$
|
72.1
|
|
$
|
5.2
|
|
||
(1)
All asset retirement obligations were assumed in the Delek/Alon Merger.
In order to determine fair value, management must make certain estimates and assumptions including, among other things, projected cash flows, a credit-adjusted risk-free rate and an assessment of market conditions that could significantly impact the estimated fair value of the asset retirement obligations.
Revenue Recognition
Revenues for products sold are recorded at the point of sale upon delivery of product, which is the point at which title to the product is transferred and when payment has either been received or collection is reasonably assured.
Delek derives third-party service revenue in the logistics segment as crude oil, intermediate and refined products are shipped through, delivered by or stored in our pipelines, trucks, terminals and storage facility assets, as applicable. We do not recognize product sales revenues for the logistics segment service revenues, as title on the product never passes to us. The majority of logistics segment service revenues are based on regulated tariff rates or contractual rates. We record service revenue and related costs at gross amounts when Delek is the primary obligor, is subject to inventory risk, has latitude in establishing prices and selecting suppliers, influences product or service specifications or has several but not all of these indicators. When Delek is not the primary obligor and does not possess other indicators of gross reporting as discussed previously, we record net service revenue.
In the retail segment, we derive service revenues from the sale of lottery tickets, money orders, car washes and other ancillary product and service offerings. Retail segment service revenue and related costs are recorded at gross amounts and net amounts, as appropriate, in accordance with the provisions of ASC 605-45, Revenue Recognition - Principal Agent Considerations ("ASC 605-45").
Cost of Goods Sold and Operating Expenses
For the refining segment, cost of goods sold includes all the costs of crude oil, feedstocks and external costs. Operating expenses include the costs associated with the actual operations of the refineries and biodiesel facilities.
For the logistics segment, cost of goods sold includes all costs of refined products, additives and related transportation. It also includes costs associated with the operation of our trucking assets. Operating expenses include the costs associated with the actual operation of owned terminals, terminalling expense at third-party locations and pipeline maintenance costs.
F-16
For the retail segment, cost of goods sold comprises the costs of specific products sold. Retail cost of sales includes motor fuels and merchandise. Retail fuel cost of sales represents the cost of purchased fuel, including transportation costs. Merchandise cost of sales includes the delivered cost of merchandise purchases, net of merchandise rebates and commissions. Operating expenses include costs such as wages of employees, lease expense, utility expense and other costs of operating the stores.
Asphalt cost of sales includes costs of purchased asphalt, blending materials and transportation costs.
Interest Expense
Interest expense includes interest expense on debt, letters of credit, financing fees (including J Aron fees associated with our Supply and Offtake Agreements), the amortization, net of accretion, of debt discounts or premium and amortization of deferred debt issuance costs, and interest rate swap settlements, but excludes capitalized interest. Original issuance discount and debt issuance costs are amortized ratably over the term of the related debt.
Sales, Use and Excise Taxes
Delek's policy is to exclude sales, use and excise taxes from revenue when we are an agent of the taxing authority, in accordance with ASC 605-45,
Revenue Recognition - Principal Agent Considerations
.
Deferred Financing Costs
Deferred financing costs associated with our revolving credit facilities are included in other non-current assets in the accompanying consolidated balance sheets. Deferred financing costs associated with our term loan facilities are included as a reduction to the associated debt balance in the accompanying consolidated balance sheets. These costs represent expenses related to issuing our long-term debt and obtaining our lines of credit and are amortized ratably over the remaining term of the respective financing and included in interest expense in the accompanying consolidated statements of income. See
Note 12
for further information.
Advertising Costs
Delek expenses advertising costs as the advertising space is utilized. Advertising expense for the years ended
December 31, 2017
,
2016
and
2015
was
$1.3 million
,
$0.2 million
and
$0.3 million
, respectively.
Operating Leases
Delek leases land, buildings and various equipment under various operating lease arrangements, most of which provide the option, after the initial lease term, to renew the leases. Some of these lease arrangements include fixed rental rate increases, while others include rental rate increases based upon such factors as changes, if any, in defined inflationary indices.
In accordance with ASC 840-20,
Leases - Operating Leases
, for all leases that include fixed rental rate increases, Delek calculates the total rent expense for the entire lease period, considering renewals for all periods for which failure to renew the lease imposes economic penalty, and records rental expense on a straight-line basis in the accompanying consolidated statements of income. See
Note 21
for further information.
Income Taxes
Income taxes are accounted for under the provisions of ASC 740,
Income Taxes
("ASC 740"). This statement generally requires Delek to record deferred income taxes for the differences between the book and tax bases of its assets and liabilities, which are measured using enacted tax rates and laws that will be in effect when the differences are expected to reverse. Deferred income tax expense or benefit represents the net change during the year in our deferred income tax assets and liabilities, exclusive of the amounts held in other comprehensive income.
ASC 740 also prescribes a comprehensive model for how companies should recognize, measure, present and disclose in their financial statements uncertain tax positions taken or expected to be taken on a tax return and prescribes the minimum recognition threshold a tax position is required to meet before being recognized in the financial statements. Finally, ASC 740 requires an annual tabular roll-forward of unrecognized tax benefits.
The Tax Cuts and Jobs Act (the "Act") was enacted on December 22, 2017. The Act reduces the US federal corporate tax rate from 35% to 21%, provides for immediate deduction of qualified capital assets placed in service, requires companies to pay a one-time transition tax on earnings of certain foreign subsidiaries that were previously tax deferred and creates new taxes on certain foreign sourced earnings. At
December 31, 2017
, we have made a reasonable estimate of the effects on our existing deferred tax balances which includes the determination of a provisional adjustment amount to be reflected in income tax expense (benefit) from continuing operations based on adoption of the Act. See
Note 18
for discussion regarding the impact of adopting the provisions of the Act.
F-17
Equity-Based Compensation
ASC 718,
Compensation - Stock Compensation
("ASC 718"), requires the cost of all share-based payments to employees, including grants of employee stock options, to be recognized in the income statement and establishes fair value as the measurement objective in accounting for share-based payment arrangements. ASC 718 requires the use of a valuation model to calculate the fair value of stock-based awards on the date of grant. Delek uses the Black-Scholes-Merton option-pricing model to determine the fair value of stock option and stock appreciation right (SAR) awards.
Restricted stock units ("RSUs") are valued based on the fair market value of the underlying stock on the date of grant. Performance-based RSUs ("PRSUs") include a market condition based on the Company's total shareholder return over the performance period and are valued using a Monte-Carlo simulation model. We record compensation expense for these awards based on the grant date fair value of the award, recognized ratably over the measurement period. Vested RSUs and PRSUs are not issued until the minimum statutory withholding requirements have been remitted to us for payment to the taxing authority. As a result, the actual number of shares accounted for as issued may be less than the number of RSUs vested, due to any withholding amounts which have not been remitted.
We generally recognize compensation expense related to stock-based awards with graded or cliff vesting on a straight-line basis over the vesting period. It is our practice to issue new shares when share-based awards are exercised. Our equity-based compensation expense includes estimates for forfeitures and volatility based on our historical experience. If actual forfeitures differ from our estimates, we adjust equity-based compensation expense accordingly.
Postretirement Benefits
In connection with the Delek/Alon Merger, we now have defined benefit pension and postretirement medical plans for certain former Alon employees. We recognize the underfunded status of our defined benefit pension and postretirement medical plans as a liability. Changes in the funded status of our defined benefit pension and postretirement medical plans are recognized in other comprehensive income in the period when the changes occur. The funded status represents the difference between the projected benefit obligation and the fair value of the plan assets. The projected benefit obligation is the present value of benefits earned to date by plan participants, including the effect of assumed future salary increases. Plan assets are measured at fair value. We use December 31, of each year, as the measurement date for plan assets and obligations for all of our defined benefit pension and postretirement medical plans. We straight-line amortize prior service costs and actuarial gains and losses over the average future service of members expected to receive benefits and use a 10% corridor in regards to the actuarial gains and losses. See Note
22
for more information regarding our postretirement benefits.
New Accounting Pronouncements
In August 2017, the Financial Accounting Standards Board (the "FASB") issued guidance to better align financial reporting for hedging activities with the economic objectives of those activities for both financial (e.g., interest rate) and commodity risks. The guidance was intended to create more transparency in the presentation of financial results, both on the face of the financial statements and in the footnotes, and simplify the application of hedge accounting guidance. This amendment is effective for fiscal years beginning after December 15, 2018, and interim periods within those fiscal years. Companies are required to apply the amendment on a modified retrospective transition method in which the cumulative effect of the change will be recognized within equity in the consolidated balance sheet as of the date of adoption. Early adoption is permitted, including in an interim period. If a company early adopts in an interim period, any adjustments should be reflected as of the beginning of the fiscal year that includes the interim period. We expect to adopt this guidance on or before the effective date and are currently evaluating the impact that adopting this new guidance will have on our business, financial condition and results of operations.
In May 2017, the FASB issued guidance that clarifies when changes to the terms or conditions of a share-based payment award must be accounted for as modifications. The modification accounting guidance applies if the value, vesting conditions or classification of the award changes. This guidance is effective for fiscal years beginning after December 15, 2017, and interim periods within those fiscal years, and can be early adopted for any interim or annual financial statements that have not yet been issued. We expect to adopt this guidance on the effective date and are currently evaluating the impact that adopting this new guidance will have on our business, financial condition and results of operations.
In March 2017, the FASB issued guidance that will require that an employer disaggregate the service cost component from the other components of net benefit cost with respect to defined benefit postretirement employee benefit plans. Service cost is required to be reported in the same line item or items as other compensation costs arising from services rendered by the pertinent employees during the period. The other components of net periodic benefit cost are required to be reported outside the subtotal for operating income. Additionally, only the service cost component of net benefit costs are eligible for capitalization. The guidance is effective January 1, 2018, with early adoption permitted. We will adopt this guidance on January 1, 2018, and we are currently evaluating the impact adoption is expected to have no impact on our business, financial condition or results of operations. As a practical expedient, we will use the amounts disclosed regarding our pension and other postretirement benefit plans for the prior comparative periods as the estimation basis for applying the retrospective presentation requirements.
F-18
In January 2017, the FASB issued guidance concerning the goodwill impairment test that eliminates Step 2, which required a comparison of the implied fair value of goodwill of the reporting unit with the carrying amount of that goodwill for that reporting unit. It also eliminates the requirements for any reporting unit with a zero or negative carrying amount to perform a qualitative assessment and, if it fails that qualitative assessment, to perform Step 2 of the goodwill impairment test. An entity still has the option to perform the qualitative assessment for a reporting unit to determine if the quantitative impairment test is necessary. This guidance is effective for annual or any interim goodwill impairment tests in fiscal years beginning after December 15, 2019. Early adoption is permitted for interim or annual goodwill impairment tests performed on testing dates after January 1, 2017. We expect to adopt this guidance on the effective date and are currently evaluating the impact that adopting this new guidance will have on our business, financial condition and results of operations.
In January 2017, the FASB issued guidance clarifying the definition of a business in order to assist entities with evaluating when a set of transferred assets and activities is considered a business. In general, we expect that the revised definition will result in fewer acquisitions being accounted for as business combinations than under the current guidance. This guidance is effective for fiscal years beginning after December 15, 2017, and interim periods within those fiscal years. Early adoption is permitted under certain circumstances. We early adopted this guidance in the third quarter of 2017 and, as a result, accounted for two immaterial acquisitions occurring during that quarter as asset acquisitions rather than business combinations. The adoption did not have a material impact on our business, financial condition and results of operations.
In October 2016, the FASB issued guidance that requires an entity to recognize the income tax consequences of an intra-entity transfer of an asset other than inventory when the transfer occurs. This guidance is effective for fiscal years beginning after December 15, 2017, and interim periods within those fiscal years. Early adoption is permitted for any interim or annual financial statements that have not yet been issued. We expect to adopt this guidance on the effective date and are currently evaluating the impact that adopting this new guidance will have on our business, financial condition and results of operations.
In August 2016, the FASB issued guidance that clarifies eight cash flow classification issues pertaining to cash receipts and cash payments. This guidance is effective for fiscal years beginning after December 15, 2017, and interim periods within those fiscal years. Early adoption is permitted for any interim or annual financial statements that have not yet been issued. We expect to adopt this guidance on the effective date and are currently evaluating the impact that adopting this new guidance will have on our business, financial condition and results of operations.
In June 2016, the FASB issued guidance requiring the measurement of all expected credit losses for financial assets held at the reporting date based on historical experience, current conditions, and reasonable and supportable forecasts. Financial institutions and other organizations will now use forward-looking information to better inform their credit loss estimates. This guidance is effective for interim and annual periods beginning after December 15, 2019. We expect to adopt this guidance on or before the effective date and are currently evaluating the impact that adopting this new guidance will have on our business, financial condition and results of operations.
In March 2016, the FASB issued guidance that simplifies several aspects of the accounting for share-based payment award transactions, including the accounting for excess tax benefits and deficiencies, classification of awards as either equity or liabilities and classification of excess tax benefits on the statement of cash flows. This guidance is effective for fiscal years beginning after December 15, 2016, and interim periods within those fiscal years and can be early adopted for any interim or annual financial statements that have not yet been issued. We prospectively adopted this guidance on January 1, 2017, and the adoption did not have a material impact on our business, financial condition or results of operations.
In February 2016, the FASB issued guidance that requires the recognition of a lease liability and a right-of-use asset, initially measured at the present value of the lease payments, in the statement of financial condition for all leases previously accounted for as operating leases. This guidance is effective for fiscal years beginning after December 15, 2018, including interim periods within those fiscal years. Early adoption is permitted. We expect to adopt this guidance on or before the effective date and are currently evaluating the impact adopting this new guidance will have on our business, financial condition and results of operations.
In January 2016, the FASB issued guidance that affects the accounting for equity investments, financial liabilities accounted for under the fair value option and the presentation and disclosure requirements for financial instruments. Under the new guidance, all equity investments in unconsolidated entities (other than those accounted for using the equity method of accounting) will generally be measured at fair value through earnings. There will no longer be an available-for-sale classification for equity securities with readily determinable fair values. For financial liabilities when the fair value option has been elected, changes in fair value due to instrument-specific credit risk will be recognized separately in other comprehensive income. It will require public business entities to use the exit price notion when measuring the fair value of financial instruments for disclosure purposes and separate presentation of financial assets and financial liabilities by measurement category and form of financial asset, and will eliminate the requirement for public business entities to disclose the method and significant assumptions used to estimate the fair value that is required to be disclosed for financial instruments measured at amortized cost. The new guidance is effective for annual reporting periods beginning after December 15, 2017, including interim reporting periods within that reporting period. We expect to adopt this guidance on the effective date and are currently evaluating the impact that adopting this new guidance will have on our business, financial condition and results of operations.
F-19
In July 2015, the FASB issued guidance requiring entities to measure FIFO or average cost inventory at the lower of cost and net realizable value. Net realizable value is the estimated selling prices in the ordinary course of business, less reasonably predictable costs of completion, disposal and transportation. This guidance does not change the measurement of inventory measured using LIFO or the retail inventory method. This guidance is effective for fiscal years beginning after December 15, 2016, and interim periods within those fiscal years. We adopted this guidance on January 1, 2017 and the adoption did not have a material impact on our business, financial condition or results of operations.
In May 2014, the FASB issued guidance regarding “Revenue from Contracts with Customers,” to clarify the principles for recognizing revenue. The core principle of the new guidance is that an entity should recognize revenue to depict the transfer of promised goods or services to customers in an amount that reflects the consideration to which the entity expects to be entitled in exchange for those goods or services. The guidance also requires improved interim and annual disclosures that enable the users of financial statements to better understand the nature, amount, timing, and uncertainty of revenues and cash flows arising from contracts with customers. The new guidance is effective for annual reporting periods beginning after December 15, 2017, including interim reporting periods within that reporting period, and can be adopted retrospectively. The Company expects to adopt the new standard in the first quarter of 2018 using the modified retrospective transition method. Based on the analysis performed to date, we do not expect the adoption of the standard to have a material impact on the timing or pattern of revenue recognition.
3
. Acquisitions
Alon
In January 2017, we announced that Old Delek (and various related entities) entered into the Merger Agreement with Alon, as subsequently amended on February 27 and April 21, 2017. The related Merger (the "Merger" or the "Delek/Alon Merger") was effective July 1, 2017 (as previously defined, the “Effective Time”), resulting in a new post-combination consolidated registrant renamed as Delek US Holdings, Inc. (as previously defined, “New Delek”), with Alon and Old Delek surviving as wholly-owned subsidiaries of New Delek. New Delek is the successor issuer to Old Delek and Alon pursuant to Rule 12g-3(c) under the Exchange Act, as amended. In addition, as a result of the Delek/Alon Merger, the shares of common stock of Old Delek and Alon were delisted from the New York Stock Exchange in July 2017, and their respective reporting obligations under the Exchange Act were terminated. Prior to the Merger, Old Delek owned a non-controlling equity interest of approximately
47%
of the outstanding shares of Alon, which was accounted for under the equity method of accounting (See Note
5
).
Subject to the terms and conditions of the Merger Agreement, at the Effective Time, each issued and outstanding share of Alon Common Stock, other than shares owned by Old Delek and its subsidiaries or held in the treasury of Alon, was converted into the right to receive
0.504
of a share of New Delek Common Stock, or, in the case of fractional shares of New Delek Common Stock, cash (without interest) in an amount equal to the product of (i) such fractional part of a share of New Delek Common Stock multiplied by (ii)
$25.96
per share, which was the volume weighted average price of the Old Delek Common Stock, par value
$0.01
per share as reported on the NYSE Composite Transactions Reporting System for the twenty consecutive New York Stock Exchange (“NYSE”) full trading days ending on June 30, 2017. Each outstanding share of restricted Alon Common Stock was assumed by New Delek and converted into restricted stock denominated in shares of New Delek Common Stock, using the conversion rate applicable to the Merger. Committed but unissued share-based awards were exchanged and converted into rights to receive share-based awards indexed to New Delek Common Stock.
In addition, subject to the terms and conditions of the Merger Agreement, each share of Old Delek Common Stock or fraction thereof issued and outstanding immediately prior to the Effective Time (other than Old Delek Common Stock held in the treasury of Old Delek, which was retired in connection with the Merger) was converted at the Effective Time into the right to receive one validly issued, fully paid and non‑assessable share of New Delek Common Stock or such fraction thereof equal to the fractional share of New Delek Common Stock. All existing Old Delek stock options, restricted stock awards and stock appreciation rights were converted into equivalent rights with respect to New Delek Common Stock.
In connection with the Merger, Alon, New Delek and U.S. Bank National Association, as trustee (the “Trustee”), entered into a First Supplemental Indenture (the “Supplemental Indenture”), effective as of July 1, 2017, supplementing the Indenture, dated as of September 16, 2013 (the “Original Indenture”; the Original Indenture, as amended by the Supplemental Indenture, is referred to as the "Indenture"), pursuant to which Alon issued its
3.00%
Convertible Senior Notes due 2018 (the “Convertible Notes”), which were convertible into shares of Alon’s Common Stock, par value
$0.01
per share or cash or a combination of cash and Alon Common Stock, all as provided in the Indenture. The Supplemental Indenture provides that, as of the Effective Time, the right to convert each
$1,000
principal amount of the Notes based on a number of shares of Alon Common Stock equal to the Conversion Rate (as defined in the Indenture) in effect immediately prior to the Merger was changed into a right to convert each
$1,000
principal amount of Notes into or based on a number of shares of New Delek Common Stock (at the exchange rate of
0.504
), par value
$0.01
per share, equal to the Conversion Rate in effect immediately prior to the Merger. In addition, the Supplemental Indenture provides that, as of the Effective Time, New Delek fully and unconditionally guaranteed, on a senior basis, Alon’s obligations under the Convertible Notes.
F-20
In connection with the Indenture, Alon also entered into equity instruments, including Purchased Options and Warrants, designed, in combination, to hedge the risk associated with the potential exercise of the conversion feature of the Convertible Notes and to minimize the dilutive effect of such potential conversion. These equity instruments, in addition to the conversion feature, represent equity instruments originally indexed to Alon Common Stock that were exchanged for instruments with terms designed to preserve the original economic intent of such instruments and indexed to New Delek Common Stock in connection with the Merger. See Note
12
for further discussion.
Alon is a refiner and marketer of petroleum products, operating primarily in the south central, southwestern and western regions of the United States. As of
December 31, 2017
, Alon owned
100%
of the general partner and
81.6%
of the limited partner interests in the Alon Partnership, which owns a crude oil refinery in Big Spring, Texas with a crude oil throughput capacity of
73,000
bpd and an integrated wholesale marketing business. In addition, Alon directly owns a crude oil refinery in Krotz Springs, Louisiana with a crude oil throughput capacity of
74,000
bpd. Alon also owns crude oil refineries in California, which have not processed crude oil since 2012. Alon is a marketer of asphalt, which it distributes through asphalt terminals located predominantly in the southwestern and western United States. Alon is the largest 7-Eleven licensee in the United States and operates approximately
300
convenience stores which market motor fuels in central and west Texas and New Mexico.
Transaction costs incurred by the Company totaled approximately
$24.7 million
and
$3.0 million
for the years ended
December 31, 2017
and 2016, respectively. Such costs were included in general and administrative expenses in the accompanying consolidated statements of income.
The Merger is accounted for using the acquisition method of accounting, which requires, among other things, that assets acquired at their fair values and liabilities assumed be recognized on the balance sheet as of the acquisition date.
The components of the consideration transferred were as follows (dollars in millions, except per share amounts):
|
Delek common stock issued
|
19,250,795
|
|
||||
|
Ending price per share of Delek Common Stock immediately before the Effective Time
|
$
|
26.44
|
|
|||
|
Total value of common stock consideration
|
$
|
509.0
|
|
|||
|
Additional consideration
(1)
|
21.7
|
|
||||
|
Fair value of Delek's pre-existing equity method investment in Alon
(2)
|
449.0
|
|
||||
|
Total consideration
|
$
|
979.7
|
|
|||
F-21
The preliminary allocation of the aggregate purchase price as of
December 31, 2017
is summarized as follows (in millions), and is inclusive of the California Discontinued Entities discussed in Note
6
:
|
Cash
|
$
|
215.3
|
|
|
|
Receivables
|
166.1
|
|
||
|
Inventories
|
266.8
|
|
||
|
Prepaids and other current assets
|
29.0
|
|
||
|
Property, plant and equipment
(3)
|
1,130.5
|
|
||
|
Equity method investments
|
31.0
|
|
||
|
Acquired intangible assets
(4)
|
79.0
|
|
||
|
Goodwill
(5)
|
804.4
|
|
||
|
Other non-current assets
|
37.0
|
|
||
|
Accounts payable
|
(257.4
|
)
|
||
|
Obligation under Supply & Offtake Agreements
|
(198.0
|
)
|
||
|
Current portion of environmental liabilities
|
(7.5
|
)
|
||
|
Other current liabilities
|
(286.3
|
)
|
||
|
Environmental liabilities and asset retirement obligations, net of current portion
|
(161.4
|
)
|
||
|
Deferred income taxes
|
(202.4
|
)
|
||
|
Debt
|
(568.0
|
)
|
||
|
Other non-current liabilities
(6)
|
(98.4
|
)
|
||
|
Fair value of net assets acquired
|
$
|
979.7
|
|
|
(1)
Additional consideration includes the fair value of certain equity instruments originally indexed to Alon stock that were exchanged for instruments indexed to New Delek's stock, as well as the fair value of certain share-based payments that were required to be exchanged for awards indexed to New Delek's stock in connection with the Delek/Alon Merger.
(2)
The fair value of Delek's pre-existing equity method investment in Alon was based on the quoted market price of shares of Alon.
(3)
This preliminary fair value of property, plant and equipment is based on a valuation using a combination of the income, cost and market approaches. The useful lives are based upon guidelines for similar equipment, chronological age since installation and consideration of costs spent on upgrades, repairs, turnarounds and rebuilds.
(4)
The acquired intangible assets amount includes the following identified intangibles:
|
•
|
Third-party fuel supply agreement intangible that is subject to amortization with a preliminary fair value of
$49.0 million
, which will be amortized over a
10
-year useful life. We recognized amortization expense for the year ended
December 31, 2017
of
$2.4 million
. The estimated amortization is
$4.9 million
for each of the five succeeding fiscal years.
|
|
•
|
Fuel trade name intangible valued at
$4.0 million
, which will be amortized over
5
years. We recognized amortization expense for the year ended
December 31, 2017
of
$0.4 million
. The estimated amortization is
$0.8 million
for each of the four succeeding fiscal years, with
$0.4 million
the fifth year.
|
|
•
|
License agreements intangible valued at
$2.6 million
, which will be amortized over
8.7 years
. We recognized amortization expense for the year ended
December 31, 2017
of
$0.1 million
. The estimated amortization is
$0.3 million
for each of the five succeeding fiscal years.
|
|
•
|
Rights-of-way intangible valued at
$9.5 million
, which has an indefinite life.
|
|
•
|
Liquor license intangible valued at
$8.5 million
, which has an indefinite life.
|
|
•
|
Colonial Pipeline shipping rights intangible valued at
$1.7 million
, which has an indefinite life.
|
F-22
|
•
|
Refinery permits valued at
$3.1 million
, which have an indefinite life.
|
|
•
|
Below-market lease intangible valued at
$0.6 million
, which will be amortized over the remaining lease term (excludes certain leases that are still being evaluated for above or below market considerations).
|
(5)
Goodwill generated, as a result of the Merger, consists of the value of expected synergies from combining operations, the acquisition of an existing integrated refining, marketing and retail business located in areas with access to cost–advantaged feedstocks with an assembled workforce that cannot be duplicated at the same costs by a new entrant and the strategic advantages of having a larger market presence. The total amount of goodwill that is expected to be deductible for tax purposes is
$15.5 million
. Goodwill has been preliminarily allocated to reportable segments based on various factors that are still being evaluated. Accordingly, such allocations are considered preliminary and may change within the permissible measurement period, not to exceed one year. The preliminary allocation of goodwill to reportable segments is as follows: Refining -
$750.9 million
and Retail -
$30.8 million
. The remainder relates to the asphalt operations, which is included in the corporate, other and eliminations segment.
(6)
The assumed other non-current liabilities include liabilities related to above-market leases preliminarily fair valued at
$15.8 million
, which will be amortized over the remaining lease term (excludes certain leases that are still being evaluated for above or below market considerations).
The following unaudited pro forma financial information presents the condensed combined results of operations of Delek and Alon for the years ended
December 31, 2017
and
2016
, as if the Delek/Alon Merger had occurred on January 1, 2016. The unaudited pro forma financial information is not intended to represent or be indicative of the consolidated results of operations that would have been reported had the Delek/Alon merger been completed as of January 1, 2016, and should not be taken as indicative of New Delek's future consolidated results of operations. In addition, the unaudited pro forma condensed combined results of operations do not reflect any cost savings or associated costs to achieve such savings from operating efficiencies, synergies, debt refinancing or other restructuring that may result from the Delek/Alon Merger. The pro forma financial information also does not reflect certain non-recurring adjustments that have been, or are expected to be, recorded in connection with the Delek/Alon Merger, including any accrual for integration costs or transactions costs or additional transaction costs related to the Merger, nor any retrospective adjustments related to the conforming of Alon's accounting policies to Delek's accounting policies, as such adjustments are impracticable to determine, and such adjustments are not expected to be indicative of on-going operations of the combined company. Finally, the pro forma presentation of net sales and net income is inclusive of the sales and net income (loss) attributable to the California Discontinued Entities (which are generally not material as the majority of the California Discontinued Entities were non-operating during the pro forma period). Pro forma adjustments are tax-effected at the Company's estimated statutory tax rates.
|
Year Ended
|
|||||||
|
December 31,
|
|||||||
|
(in millions, except per share data)
|
2017
|
2016
|
|||||
|
(unaudited)
|
|||||||
|
Net sales
|
$
|
9,448.7
|
|
$
|
8,100.9
|
|
|
|
Net income attributable to Delek
|
223.2
|
|
16.3
|
|
|||
|
Earnings per share:
|
|||||||
|
Basic
|
$
|
2.75
|
|
$
|
0.20
|
|
|
|
Diluted
|
2.73
|
|
0.20
|
|
|||
F-23
The unaudited pro forma statements of operations reflect the following adjustments:
|
•
|
To eliminate transactions between Delek and Alon for purchases and sales of refined products, reducing revenue and the associated cost of goods sold. Such pro forma eliminations resulted in a decrease to combined pro forma sales by
$59.0 million
and
$10.4 million
for the years ended
December 31, 2017
and
2016
, respectively.
|
|
•
|
To eliminate non-recurring transaction costs incurred during the historical periods. Such adjustments to general and administrative expense have been estimated to result in an increase to pro forma pre-tax income attributable to Delek totaling
$32.2 million
and
$13.7 million
for the years ended
December 31, 2017
and
2016
.
|
|
•
|
To retrospectively reflect depreciation and amortization of intangibles based on the preliminary fair value of the assets as of the acquisition date, as if that fair value had been reflected beginning January 1, 2016, and to retrospectively eliminate the amortization of any previously recorded intangibles. Such adjustments to depreciation and amortization have been estimated to result in an increase to pro forma pre-tax income attributable to Delek totaling
$34.7 million
and
$66.5 million
for the years ended
December 31, 2017
and
2016
, respectively.
|
|
•
|
To retrospectively reflect the accretion of asset retirement obligations and certain environmental liabilities. Such adjustments to general and administrative expense have been estimated to result in a decrease to pro forma pre-tax income attributable to Delek totaling
$0.8 million
and
$1.5 million
for the years ended
December 31, 2017
and
2016
, respectively.
|
|
•
|
To retrospectively reflect adjustments to interest expense, including the impact of discounts or premiums created by the difference in fair value and outstanding amounts as of the acquisition date (collectively, the “new effective yield”), by applying the new effective yield to historical outstanding amounts in the pro forma period and reversing previously recognized interest expense. Such net adjustments to interest expense have been estimated to result in an increase to pro forma pre-tax income attributable to Delek totaling
$8.8 million
and
$20.7 million
for the years ended
December 31, 2017
and
2016
, respectively.
|
|
•
|
To eliminate Delek’s equity income previously recorded on its equity method investment in Alon, prior to the Merger. Such pro forma elimination resulted in an increase (decrease) to pro forma pre-tax income totaling
$(3.2) million
and
$42.2 million
for the years ended
December 31, 2017
and
2016
, respectively.
|
|
•
|
To eliminate the impairment charge on the equity method investment in Alon totaling
$245.3 million
recognized in the year ended
December 31, 2016
, and to eliminate the gain on remeasurement of the equity method investment in Alon totaling
$190.1 million
recognized during the year ended
December 31, 2017
.
|
|
•
|
To record the tax effect on pro forma adjustments and additional tax benefit associated with dividends received from Alon at a combined U.S. (federal and state) income tax statutory blended rate of approximately
37%
for the year ended
December 31, 2017
, and approximately
35%
for the year ended
December 31, 2016
.
|
|
•
|
To adjust the weighted average number of shares outstanding based on
0.504
of a share of Delek common stock for each share of Alon common stock outstanding as of
December 31, 2017
, reflecting the elimination of Alon historical weighted average shares outstanding and the addition of the estimated New Delek incremental shares issued.
|
As of June 30, 2017, the carrying value of Delek's equity method investment in Alon was
$252.6 million
. During the year ended
December 31, 2017
, we recognized a gain of
$196.4 million
as a result of remeasuring the
47%
equity method investment in Alon at its fair value as of the Effective Time of the Delek/Alon Merger, in accordance with ASC 805,
Business Combinations,
net of a
$6.3 million
loss to record the reversal of accumulated other comprehensive income. This net gain of
$190.1 million
was recognized in the line item entitled Gain on remeasurement of equity method investment in Alon in the consolidated statements of income. The acquisition-date fair value of the pre-existing non-controlling interest in Alon was
$449.0 million
and is included in the measurement of the consideration transferred.
Delek began consolidating Alon's results of operations on July 1, 2017. Alon operations contributed
$1,950.0 million
to net sales and
$151.0 million
to net income for the year ended
December 31, 2017
, inclusive of the contribution of the California Discontinued Entities.
F-24
Updates to the Preliminary Purchase Price Allocation
During the three months ended
December 31, 2017
, we continued our procedures to determine the fair value of assets and liabilities assumed in the Delek/Alon Merger, as anticipated and disclosed in our Quarterly Report on Form 10-Q filed on November 11, 2017. As a result, the following changes were made to the preliminary purchase price allocation disclosed in our Quarterly Report on Form 10-Q filed on November 11, 2017:
|
Subsequent changes to initial allocation of fair value of net assets acquired:
|
||||
|
Cash
|
$
|
—
|
|
|
|
Receivables
(1)
|
(10.8
|
)
|
||
|
Inventories
(2)
|
11.3
|
|
||
|
Prepaids and other current assets
|
(2.4
|
)
|
||
|
Property, plant and equipment
(3)
|
(52.6
|
)
|
||
|
Equity method investments
|
—
|
|
||
|
Acquired intangible assets
(4)
|
14.0
|
|
||
|
Other non-current assets
|
—
|
|
||
|
Accounts payable
(5)
|
2.3
|
|
||
|
Obligation under Supply & Offtake Agreements
|
—
|
|
||
|
Current portion of environmental liabilities
|
—
|
|
||
|
Other current liabilities
(6)
|
(19.8
|
)
|
||
|
Environmental liabilities and asset retirement obligations, net of current portion
(7)
|
(19.7
|
)
|
||
|
Deferred income taxes
(8)
|
78.0
|
|
||
|
Debt
|
—
|
|
||
|
Other non-current liabilities
(9)
|
(19.9
|
)
|
||
|
Resulting adjustment to goodwill
|
$
|
19.6
|
|
|
(1)
Change primarily relates to a reclassification of intercompany accounts receivable against intercompany accounts payable during the fourth quarter 2017 to properly reflect the net amounts receivable and payable from third parties.
(2)
Change is is related to adjustments for inventory that was used in production but not yet purchased. These adjustments resulted in corresponding increases in accounts payable.
(3)
Change is due to continued valuation procedures around property, plant and equipment acquired.
(4)
Change is primarily due to revised estimates for the fair value of the third-party fuel agreements intangible and the fuel trade name intangible, as well as the addition of an intangible for license agreements and right-of-way intangible.
(5)
Change is primarily due to the accrual of amounts identified as owed for inventory used by but not yet purchased, as well as other amounts identified as owed subsequent to our initial purchase price allocation, net of a reclassification of intercompany accounts receivable against intercompany accounts payable during the fourth quarter 2017 to properly reflect the net amounts receivable and payable from third parties.
(6)
Change is primarily due to an increase in current income taxes payable recorded in connection with our continued evaluation of income taxes associated with the acquisition, an increase to record a pre-acquisition contingent liability related to litigation, as well as adjustments to record tank inspection and above-market rail car lease liabilities not previously valued.
(7)
Change is to record the long-term portion of additional asset retirement obligations and environmental liabilities identified based on preliminary estimates and/or to update preliminary estimates based on additional information.
(8)
Change is related to adjustments to net deferred tax liabilities based on the updated purchase price allocation and revisions of preliminary tax estimates.
(9)
Change is primarily to record the long-term portion of above-market lease liabilities related to rail cars and tank inspection liabilities not previously valued.
F-25
The allocation of the purchase price continues to be based upon a preliminary valuation. Our estimates and assumptions are subject to change during the purchase price allocation measurement period, not to exceed one year from the acquisition date. The primary areas of the purchase price allocation that are not yet finalized relate to the following:
|
•
|
finalizing the valuation and assignment of remaining useful lives associated with property, plant and equipment acquired in the retail segment;
|
|
•
|
finalizing our review of certain current and non-current assets acquired and liabilities assumed in the retail segment;
|
|
•
|
finalizing the valuation of certain in-place contracts or contractual relationships (including but not limited to leases), including determining the appropriate amortization period;
|
|
•
|
finalizing the review and valuation of environmental liabilities and asset retirement obligations (see
Note 21
);
|
|
•
|
finalizing the evaluation and valuation of certain legal matters and/or other loss contingencies, including those that we may not yet be aware of but that meet the requirement to qualify as a pre-acquisition contingency (see
Note 21
); and
|
|
•
|
finalizing our estimate of the impact of purchase accounting on deferred income tax assets or liabilities.
|
To the extent possible, estimates have been considered and recorded, as appropriate, for the items above based on the information available as of
December 31, 2017
. We will continue to evaluate these items until they are satisfactorily resolved and adjust our purchase price allocation accordingly, within the allowable measurement period (not to exceed one year from the date of acquisition), as defined by ASC 805.
Pipeline Assets
During the year ended
December 31, 2017
, Delek made
two
pipeline asset acquisitions, for a total purchase price of
$13.0 million
. Such acquisitions were accounted for as asset acquisitions, and therefore the cost of the acquisition has been allocated to the cost of the assets acquired on a relative fair value basis.
The following table summarizes the allocation of the relative fair value assigned to the asset groups for the acquisitions (in millions):
|
Land
|
$
|
0.2
|
|
|
|
Property, plant and equipment
|
6.4
|
|
||
|
Intangible assets
(1)
|
6.4
|
|
||
|
Total
|
$
|
13.0
|
|
|
(1)
Intangible assets acquired represent rights-of-way assets with indefinite useful lives. Rights-of-way assets are not subject to amortization.
4
. Delek Logistics and the Alon Partnership
Delek Logistics
Delek Logistics is a publicly traded limited partnership that was formed by Delek in 2012 to own, operate, acquire and construct crude oil and refined products logistics and marketing assets. A substantial majority of Delek Logistics' assets are integral to Delek’s refining and marketing operations. As of
December 31, 2017
, we owned a
61.5%
limited partner interest in Delek Logistics, consisting of
15,294,046
common units, and a
94.6%
interest in Logistics GP, which owns both the entire
2.0%
general partner interest, consisting of
497,604
general partner units, in Delek Logistics and all of the incentive distribution rights.
In March 2015, a subsidiary of Delek Logistics completed the acquisition from Lion Oil of two crude oil rail offloading racks at the El Dorado refinery and related ancillary assets adjacent to the El Dorado refinery (the "El Dorado Offloading Racks Acquisition"). The cash paid for the assets acquired was approximately
$42.5 million
, financed with borrowings under the DKL Revolver (as defined in
Note 12
).
In March 2015, a subsidiary of Delek Logistics completed the acquisition from refining of a crude oil storage tank with
350,000
barrels of shell capacity that supports the Tyler refinery and related ancillary assets adjacent to our Tyler refinery (the "Tyler Crude Tank Acquisition"). The purchase price paid for the assets acquired was
$19.4 million
in cash, financed with borrowings under the DKL Revolver (as defined in
Note 12
).
The El Dorado Offloading Racks Acquisition and the Tyler Crude Tank Acquisition are each considered a transfer of a business between entities under common control. As such, the assets acquired and liabilities assumed were transferred to Delek Logistics at historical basis instead of fair value.
We have agreements with Delek Logistics that, among other things, establish fees for certain administrative and operational services provided by us and our subsidiaries to Delek Logistics, provide certain indemnification obligations and establish terms for fee-based commercial logistics and marketing services provided by Delek Logistics and its subsidiaries to us. The revenues and expenses associated with these agreements are eliminated in consolidation.
Delek Logistics is a variable interest entity, as defined under GAAP, and is consolidated into our consolidated financial statements, representing our logistics segment. With the exception of intercompany balances which are eliminated in consolidation, the Delek Logistics consolidated balance sheets as of
December 31, 2017
and
2016
, as presented below, are included in the consolidated balance sheets of Delek (in millions).
|
December 31,
|
||||||||
|
2017
|
2016
|
|||||||
|
ASSETS
|
|
|
||||||
|
Cash and cash equivalents
|
$
|
4.7
|
|
$
|
0.1
|
|
||
|
Accounts receivable
|
23.0
|
|
19.2
|
|
||||
|
Accounts receivable from related parties
|
1.1
|
|
2.8
|
|
||||
|
Inventory
|
20.9
|
|
8.9
|
|
||||
|
Other current assets
|
0.7
|
|
1.1
|
|
||||
|
Property, plant and equipment, net
|
255.1
|
|
251.0
|
|
||||
|
Equity method investments
|
106.5
|
|
101.1
|
|
||||
|
Goodwill
|
12.2
|
|
12.2
|
|
||||
|
Intangible assets, net
|
15.9
|
|
14.4
|
|
||||
|
Other non-current assets
|
3.4
|
|
4.7
|
|
||||
|
Total assets
|
$
|
443.5
|
|
$
|
415.5
|
|
||
|
LIABILITIES AND DEFICIT
|
||||||||
|
Accounts payable
|
$
|
19.1
|
|
$
|
10.9
|
|
||
|
Accrued expenses and other current liabilities
|
12.6
|
|
9.8
|
|
||||
|
Long-term debt
|
422.6
|
|
392.6
|
|
||||
|
Asset retirement obligations
|
4.1
|
|
3.8
|
|
||||
|
Other non-current liabilities
|
14.3
|
|
11.7
|
|
||||
|
Deficit
|
(29.2
|
)
|
(13.3
|
)
|
||||
|
Total liabilities and deficit
|
$
|
443.5
|
|
$
|
415.5
|
|
||
F-26
Alon Partnership
As of
December 31, 2017
, the Alon Partnership was a publicly-traded limited partnership that owns the assets and conducts the operations of the Big Spring refinery and the associated integrated wholesale marketing operations. The limited partner interests of the Alon Partnership were represented as common units outstanding. As of
December 31, 2017
, the
11,492,800
common units held by the public represented
18.4%
of the Alon Partnership’s common units outstanding. We owned the remaining
81.6%
of the Alon Partnership’s common units and Alon USA Partners GP, LLC (the “Alon General Partner”), our wholly-owned subsidiary, owned
100%
of the general partner interest in the Alon Partnership, which is a non-economic interest. See Note
25
regarding acquisition of the non-controlling interest in the Alon Partnership on February 7, 2018.
The limited partner interests in the Alon Partnership not owned by us are reflected in net income attributable to non-controlling interest in the accompanying consolidated statements of income and in non-controlling interest in subsidiaries in the accompanying consolidated balance sheets.
We have agreements with the Alon Partnership, under which the Alon Partnership has agreed to reimburse us for certain administrative and operational services provided by us and our subsidiaries to the Alon Partnership, indemnify us with respect to certain matters and establish terms for the supply of products by the Alon Partnership to us.
As of
December 31, 2017
, the Alon Partnership was a variable interest entity, as defined under GAAP, and is consolidated into our consolidated financial statements as part of the refining segment. We have elected to push down purchase accounting to the Alon Partnership, which resulted in the push-down of the preliminary fair value of equity as purchase price consideration based on the market value of the Alon Partnership partnership units as of the Merger Date ), and the preliminary fair values of assets and liabilities as of the Merger date. Such push-down purchase accounting also resulted in a preliminary determination of the fair value of our non-controlling interest in the Alon Partnership, which is estimated to be
$120.6 million
. With the exception of intercompany balances, which are eliminated in consolidation, the Alon Partnership consolidated balance sheet as of
December 31, 2017
, as presented below, is included in the consolidated balance sheets of Delek (in millions).
|
ASSETS
|
|
|||
|
Cash and cash equivalents
|
$
|
252.8
|
|
|
|
Accounts receivable
|
96.7
|
|
||
|
Accounts receivable from related parties
|
640.0
|
|
||
|
Inventories
|
133.2
|
|
||
|
Prepaid expenses and other current assets
|
5.9
|
|
||
|
Property, plant and equipment, net
|
413.3
|
|
||
|
Goodwill
|
576.6
|
|
||
|
Other non-current assets
|
59.2
|
|
||
|
Total assets
|
$
|
2,177.7
|
|
|
|
LIABILITIES AND EQUITY
|
||||
|
Accounts payable
|
$
|
44.5
|
|
|
|
Accounts payable to related parties, net of related receivables
|
794.2
|
|
||
|
Accrued expenses and other current liabilities
|
161.9
|
|
||
|
Current portion of long-term debt
|
337.4
|
|
||
|
Obligation under Supply and Offtake Agreement
|
120.1
|
|
||
|
Deferred income tax liability
|
1.3
|
|
||
|
Other non-current liabilities
|
34.5
|
|
||
|
Equity
|
683.8
|
|
||
|
Total liabilities and equity
|
$
|
2,177.7
|
|
|
5
. Equity Method Investments
On May 14, 2015, Delek acquired from Alon Israel Oil Company, Ltd. ("Alon Israel") approximately
33.7 million
shares of common stock (the "ALJ Shares") of Alon pursuant to the terms of a stock purchase agreement with Alon Israel dated April 14, 2015 (the "Alon Acquisition"). The ALJ Shares represented an equity interest in Alon of approximately
48%
at the time of acquisition. We acquired the ALJ Shares with a combination of cash, Delek stock and seller-financed debt.
|
•
|
Delek issued
6,000,000
restricted shares of its common stock, par value
$0.01
per share, to Alon Israel;
|
|
•
|
Delek issued an unsecured
$145.0 million
term promissory note payable to Alon Israel (the "Alon Israel Note") (See
Note 12
for further information);
|
|
•
|
Delek paid Alon Israel
$200.0 million
in cash at closing funded with a combination of cash on hand and borrowings under the Lion Term Loan (as defined in
Note 12
); and
|
|
•
|
Delek agreed to pay Alon Israel
$5.0 million
of additional consideration, to be paid ratably in annual installments over a period of five years.
|
Delek also agreed to issue an additional
200,000
restricted shares of its common stock to Alon Israel if the closing price of Delek's common stock was greater than
$50.00
per share for at least
30
consecutive trading days that end on or before May 14, 2017.
As of December 31, 2016, our investment balance in Alon was
$259.0 million
(our equity method investment in Alon prior to the Delek/Alon Merger was reported in the corporate, other and eliminations segment) and the excess of our initial investment over our net equity in the underlying net assets of Alon was approximately
$11.9 million
. This excess was included in equity method investments in our consolidated balance sheet and a portion had been attributed to property, plant and equipment and definite lived intangible assets. These portions of the excess were amortized as a reduction to earnings from equity method investments on a straight-line basis over the lives of the related assets. The earnings from this equity method investment reflected in our consolidated statements of income include our share of net earnings or losses directly attributable to this equity method investment, and amortization of the excess of our investment balance over the underlying net assets of Alon prior to the Delek/Alon Merger. We evaluated our investment in Alon as of September 30, 2016, and determined that the decline in the market value of the ALJ
F-27
Shares was other than temporary and, therefore, it was necessary to record an impairment charge of
$245.3 million
on our investment based on the quoted market price of our ALJ Shares, which is a Level 1 fair value measurement. Our decision that the decline in market value of the ALJ shares was other than temporary was primarily based on the following factors: the duration of the period in which the fair market value had been below our investment balance and the decreased possibility of a recovery in the near term as a result of Alon's year-end financial performance, as well as expectations of Alon's future operating performance. This impairment is reflected in the loss on impairment of equity method investment in our consolidated statements of income for the
year ended
December 31, 2016.
Effective July 1, 2017, Alon became a wholly-owned subsidiary of New Delek in connection with the Delek/Alon Merger. In connection with the acquisition, we recognized a gain of
$196.4 million
as a result of remeasuring the
47%
equity method investment in Alon at its fair value as of the Effective Time of the Delek/Alon Merger, in accordance with ASC 805,
Business Combinations,
net of a
$6.3 million
loss to record the reversal of accumulated other comprehensive income. This net gain of
$190.1 million
was recognized in the line item entitled Gain on remeasurement of equity method investment in Alon in the consolidated statements of income. The acquisition-date fair value of the pre-existing non-controlling interest in Alon was
$449.0 million
and is included in the measurement of the consideration transferred. See Note
3
for further discussion.
Below is summarized financial information of the financial position and results of operations of Alon (in millions) for the previous periods when Alon was accounted for as an equity method investment:
|
Balance Sheet Information
|
Year Ended December 31, 2016
|
|||
|
Current assets
|
$
|
471.3
|
|
|
|
Non-current assets
|
1,624.0
|
|
||
|
Current liabilities
|
445.5
|
|
||
|
Non-current liabilities
|
1,067.4
|
|
||
|
Non-controlling interests
|
61.3
|
|
||
|
Income Statement Information
|
For the period January 1, 2017 to June 30, 2017
|
Year Ended December 31, 2016
|
||||||
|
Net sales
|
$
|
2,269.7
|
|
$
|
3,913.4
|
|
||
|
Gross profit
|
351.2
|
|
536.6
|
|
||||
|
Pre-tax income (loss)
|
20.0
|
|
(126.6
|
)
|
||||
|
Net income (loss)
|
15.0
|
|
(79.8
|
)
|
||||
|
Net income (loss) attributable to Alon
|
9.5
|
|
(82.8
|
)
|
||||
In March 2015, Delek Logistics entered into two joint ventures which own and operate logistics assets, and which serve third parties and subsidiaries of Delek. Delek Logistics' investment in these joint ventures was financed through a combination of cash from operations and borrowings under the DKL Revolver (as defined in
Note 12
). As of
December 31, 2017
, Delek Logistics' investment balance in these joint ventures was
$106.5 million
and was accounted for using the equity method. One of the joint venture projects was completed and began operations in September 2016. The other was completed and began operations in January 2017.
In July 2017, Delek Renewables, LLC invested in a joint venture with an unrelated third party that was formed to plan, develop, construct, own, operate and maintain a terminal consisting of an ethanol unit train facility with an ethanol tank in North Little Rock, Arkansas. This investment was financed through cash from operations. As of
December 31, 2017
, Delek Renewables, LLC's investment balance in this joint venture was
$2.2 million
and was accounted for using the equity method. The investment in this joint venture is reflected in the refining segment.
Effective with the Delek/Alon Merger, we own a
50%
interest in
two
joint ventures that own asphalt terminals located in Fernley, Nevada, and Brownwood, Texas. As of
December 31, 2017
, Delek's investment balance in these joint ventures was
$29.4 million
and are accounted for using the equity method. These investments are included as part of total assets in the corporate, other and eliminations segment.
6
. Discontinued Operations and Assets Held for Sale
Retail Entities
In August 2016, Delek entered into a Purchase Agreement to sell the Retail Entities to COPEC. As a result of the Purchase Agreement, we met the requirements of ASC 205-20 and ASC 360 to report the results of the Retail Entities as discontinued operations and to classify the Retail
F-28
Entities as a group of assets held for sale. The fair value assessment of the Retail Entities as of August 27, 2016 did not result in an impairment. We ceased depreciation of these assets as of August 27, 2016. The Retail Transaction closed in November 2016, and we received net cash consideration of
$378.9 million
, net of debt repayments and transaction costs, and retained approximately
$62.8 million
of net liabilities from the Retail Entities. The Retail Transaction resulted in a gain on sale of the Retail Entities, before income tax, of
$134.1 million
in 2016.
Under the terms of the Purchase Agreement, Lion Oil and MAPCO Express entered into a supply agreement at the closing of the Retail Transaction pursuant to which Lion Oil will supply fuel to retail locations owned by MAPCO Express for a period of
18 months
following the closing of the Retail Transaction (the "Fuel Supply Agreement"). We recorded net revenues of
$410.5 million
and
$54.3 million
and net cash inflows of
$411.5 million
and
$43.5 million
for the years ended
December 31, 2017
and
2016
, respectively, associated with the Fuel Supply Agreement.
Once the Retail Entities were identified as assets held for sale, the operations associated with these properties qualified for reporting as discontinued operations. Accordingly, the operating results, net of tax, from discontinued operations are presented separately in Delek’s consolidated statements of income and the notes to the consolidated financial statements have been adjusted to exclude the discontinued operations. Components of amounts reflected in income from discontinued operations are as follows (in millions):
|
Year Ended
|
||||||||
|
December 31, 2016
|
December 31, 2015
|
|||||||
|
Net sales
|
$
|
1,216.3
|
|
$
|
1,495.1
|
|
||
|
Cost of goods sold
|
(1,041.2
|
)
|
(1,293.8
|
)
|
||||
|
Operating expenses
|
(116.4
|
)
|
(136.3
|
)
|
||||
|
General and administrative expenses
|
(21.8
|
)
|
(25.5
|
)
|
||||
|
Depreciation and amortization
|
(20.4
|
)
|
(28.0
|
)
|
||||
|
Other operating income, net
|
—
|
|
0.4
|
|
||||
|
Interest expense
|
(6.4
|
)
|
(6.2
|
)
|
||||
|
Gain on sale of Retail Entities
|
134.1
|
|
—
|
|
||||
|
Income from discontinued operations before taxes
|
144.2
|
|
5.7
|
|
||||
|
Income tax expense
|
57.9
|
|
(0.9
|
)
|
||||
|
Income from discontinued operations, net of tax
|
$
|
86.3
|
|
$
|
6.6
|
|
||
California Discontinued Entities
During the third quarter 2017, we committed to a plan to sell certain assets associated with our Paramount and Long Beach, California refineries and our California renewable fuels facility (AltAir Paramount, LLC), which were acquired as part of the Delek/Alon Merger. As a result of this decision and commitment to a plan, and because it was made within three months of the Delek/Alon Merger, we met the requirements under ASC 205-20 and ASC 360 to report the results of the California Discontinued Entities as discontinued operations and to classify the California Discontinued Entities as a group of assets held for sale as of July 1, 2017. The sale of the California Discontinued Entities is currently anticipated to occur within the next 6-9 months. The property, plant and equipment of the California Discontinued Entities were recorded at fair value as part of the Delek/Alon Merger, and we did not record any depreciation of these assets since the Delek/Alon Merger.
The carrying amount of the major classes of assets and liabilities of the California Discontinued Entities included in assets held for sale and liabilities associated with assets held for sale are as follows (in millions):
F-29
|
December 31, 2017
|
||||
|
Assets held for sale:
|
||||
|
Cash and cash equivalents
|
$
|
10.1
|
|
|
|
Accounts receivable
|
7.9
|
|
||
|
Inventory
|
1.9
|
|
||
|
Other current assets
|
1.3
|
|
||
|
Property, plant & equipment, net
|
130.0
|
|
||
|
Other intangibles, net
|
6.6
|
|
||
|
Other non-current assets
|
2.2
|
|
||
|
Assets held for sale
|
$
|
160.0
|
|
|
|
Liabilities associated with assets held for sale:
|
||||
|
Accounts payable
|
$
|
—
|
|
|
|
Accrued expenses and other current liabilities
|
9.5
|
|
||
|
Deferred tax liabilities
|
63.9
|
|
||
|
Other non-current liabilities
|
32.5
|
|
||
|
Liabilities associated with assets held for sale
|
$
|
105.9
|
|
|
Once the operating assets of the California Discontinued Entities met the criteria to be classified as assets held for sale, the operations associated with these properties qualified for reporting as discontinued operations. Accordingly, the operating results, net of tax, from discontinued operations are presented separately in Delek’s condensed consolidated statements of income and the notes to the condensed consolidated financial statements have been adjusted to exclude the discontinued operations. Classification as discontinued operations requires retrospective reclassification of the associated assets, liabilities and results of operations for all periods presented, beginning (in this case) as of the date of acquisition, which was July 1, 2017. Components of amounts reflected in income from discontinued operations are as follows (in millions):
|
Year Ended
|
||||
|
December 31, 2017
|
||||
|
Net sales
|
$
|
82.4
|
|
|
|
Cost of goods sold
|
(68.7
|
)
|
||
|
Operating expenses
|
(14.4
|
)
|
||
|
General and administrative expenses
|
(6.0
|
)
|
||
|
Other operating expense, net
|
(0.2
|
)
|
||
|
Interest expense
|
(1.7
|
)
|
||
|
Interest income
|
—
|
|
||
|
Other expense, net
|
—
|
|
||
|
Loss from discontinued operations before taxes
|
(8.6
|
)
|
||
|
Income tax benefit
|
(2.7
|
)
|
||
|
Loss from discontinued operations, net of tax
|
$
|
(5.9
|
)
|
|
The net assets of the California Discontinued Entities include a non-controlling interest totaling
$10.5 million
as of
December 31, 2017
, and the net loss attributable to the California Discontinued Entities includes a net loss attributable to the non-controlling interest totaling
$0.6 million
for the for the period July 1, 2017 through
December 31, 2017
.
7
. Inventory
Crude oil, work-in-process, refined products, blendstocks and asphalt inventory for all of our operations, excluding the Tyler refinery and merchandise inventory in our Retail segment, are stated at the lower of cost determined using the FIFO basis or net realizable value. Cost of all inventory at the Tyler refinery is determined using the LIFO inventory valuation method and inventory is stated at the lower of LIFO cost or market. Retail merchandise inventory consists of cigarettes, beer, convenience merchandise and food service merchandise and is stated at estimated cost as determined by the retail inventory method.
F-30
Carrying value of inventories consisted of the following (in millions):
|
December 31,
2017 |
December 31,
2016 |
|||||||
|
Refinery raw materials and supplies
|
$
|
308.0
|
|
$
|
145.6
|
|
||
|
Refinery work in process
|
79.2
|
|
37.6
|
|
||||
|
Refinery finished goods
|
366.4
|
|
200.3
|
|
||||
|
Retail fuel
|
8.3
|
|
—
|
|
||||
|
Retail merchandise
|
25.6
|
|
—
|
|
||||
|
Logistics refined products
|
20.9
|
|
8.9
|
|
||||
|
Total inventories
|
$
|
808.4
|
|
$
|
392.4
|
|
||
Due to a lower crude oil and refined product pricing environment experienced since the end of 2014, market prices have declined to a level below the average cost of our inventories. At
December 31, 2017
, we recorded a pre-tax inventory valuation reserve of
$2.4 million
,
$1.5 million
of which related to LIFO inventory, which is subject to reversal in subsequent periods, not to exceed LIFO cost, should market prices recover. At
December 31, 2016
, we recorded a pre-tax inventory valuation reserve of
$16.0 million
, all of which related to LIFO inventory, which reversed in the first quarter of
2017
, as the inventories associated with the valuation adjustment at the end of
2016
were sold or used. For the years ended
December 31, 2017
,
2016
and
2015
, we recognized net LIFO inventory valuation gains of
$14.5 million
,
$33.8 million
and
$4.3 million
, respectively, which were recorded as a component of cost of goods sold in the accompanying consolidated statements of income.
At
December 31, 2017
and
2016
, the excess of replacement cost (FIFO) over the carrying value (LIFO) of the Tyler refinery inventories was
$9.0 million
and
$3.5 million
, respectively.
Permanent Liquidations
We incurred a permanent reduction in a LIFO layer resulting in liquidation gain (loss) in our refinery inventory of
$0.9 million
,
$(2.2) million
and
$(34.5) million
during the years ended
December 31, 2017
,
2016
and
2015
, respectively. These liquidation gains (losses) were recognized as a component of cost of goods sold in the accompanying consolidated statements of income.
8
. Crude Oil Supply and Inventory Purchase Agreements
El Dorado refinery operations
Throughout the term of the Supply and Offtake Agreement that supports the operations of our El Dorado refinery (the "El Dorado Supply and Offtake Agreement"), which was amended on February 27, 2017 to change, among other things, certain terms related to pricing and an extension of the maturity date to April 30, 2020, Lion Oil and J. Aron will identify mutually acceptable contracts for the purchase of crude oil from third parties and J. Aron will supply up to
100,000
barrels per day ("bpd") of crude oil to the El Dorado refinery. Crude oil supplied to the El Dorado refinery by J. Aron will be purchased daily at an estimated average monthly market price by Lion Oil. J. Aron will also purchase all refined products from the El Dorado refinery at an estimated daily market price, as they are produced. These daily purchases and sales are trued-up on a monthly basis in order to reflect actual average monthly prices. We have recorded a receivable related to this monthly settlement of
$0.3 million
and
$6.9 million
as of
December 31, 2017
and
2016
, respectively. Also pursuant to the El Dorado Supply and Offtake Agreement and other related agreements, Lion Oil will endeavor to arrange potential sales by either Lion Oil or J. Aron to third parties of the products produced at the El Dorado refinery or purchased from third parties. In instances where Lion Oil is the seller to such third parties, J. Aron will first transfer title to the applicable products to Lion Oil.
This arrangement is accounted for as a product financing arrangement. Delek incurred fees payable to J. Aron of
$9.7 million
,
$9.7 million
and
$10.5 million
during the years ended
December 31, 2017
,
2016
and
2015
, respectively. These amounts are included as a component of interest expense in the condensed consolidated statements of income. Upon any termination of the El Dorado Supply and Offtake Agreement, including in connection with a force majeure event, the parties are required to negotiate with third parties for the assignment to us of certain contracts, commitments and arrangements, including procurement contracts, commitments for the sale of product, and pipeline, terminalling, storage and shipping arrangements.
Upon the expiration of the El Dorado Supply and Offtake Agreement on April 30, 2020, or upon any earlier termination, Delek will be required to repurchase the consigned crude oil and refined products from J. Aron at then prevailing market prices. At
December 31, 2017
and
2016
, Delek had
3.0 million
barrels and
2.6 million
barrels, respectively, of inventory consigned from J. Aron, and we have recorded liabilities associated with this consigned inventory of
$181.9 million
and
$124.6 million
, respectively, in the consolidated balance sheets, net of a current deposit of
$20.2 million
as of
December 31, 2016
.
F-31
Alon refinery operations
Effective with the Delek/Alon Merger, we assumed Alon's existing Supply and Offtake Agreements and other associated agreements with J. Aron, to support the operations of our Big Spring, Krotz Springs and California refineries (as further defined in Note
15
) and certain of our asphalt terminals (together, the “Alon Supply and Offtake Agreements”). Pursuant to the Alon Supply and Offtake Agreements, (i) J. Aron agreed to sell to us, and we agreed to buy from J. Aron, at market prices, crude oil for processing at these refineries and (ii) we agreed to sell, and J. Aron agreed to buy, at market prices, certain refined products produced at these refineries. The Alon Supply and Offtake Agreements also provide for the sale, at market prices, of our crude oil and certain refined product inventories to J. Aron, the lease to J. Aron of crude oil and refined product storage facilities and the identification of prospective purchasers of refined products on J. Aron’s behalf. The Supply and Offtake Agreements for the Big Spring and Krotz Springs refineries have initial terms that expire in May 2021, and the Supply and Offtake Agreement for the California refineries has initial terms that expire in May 2019. J. Aron may elect to terminate the Supply and Offtake Agreements for the Big Spring and Krotz Springs refineries prior to the expiration of the initial term beginning in May 2018 and upon each anniversary thereof, on
six months
prior notice. We may elect to terminate at the Big Spring and Krotz Springs refineries in May 2020 on
six months
prior notice. J. Aron may elect to terminate the Supply and Offtake Agreement for the California refineries prior to the expiration of the initial term beginning in May 2017 and upon each anniversary thereof, on
six months
prior notice. We may elect to terminate at the California refineries in May 2018 on
six months
prior notice, which notice has been provided by us, and the agreement for the California refineries will terminate on May 31, 2018.
These daily purchases and sales are trued-up on a monthly basis in order to reflect actual average monthly prices. We have recorded a net payable related to this monthly settlement of
$4.4 million
as of
December 31, 2017
.
These arrangements are accounted for as product financing arrangements. Delek incurred fees payable to J. Aron of
$7.1 million
during the year ended
December 31, 2017
. These amounts are included as a component of interest expense in the consolidated statements of income. Upon any termination of the Alon Supply and Offtake Agreement, including in connection with a force majeure event, the parties are required to negotiate with third parties for the assignment to us of certain contracts, commitments and arrangements, including procurement contracts, commitments for the sale of product, and pipeline, terminalling, storage and shipping arrangements.
Upon the expiration of the Alon Supply and Offtake Agreements, or upon any earlier termination, Delek will be required to repurchase the consigned crude oil and refined products from J. Aron at then prevailing market prices. At
December 31, 2017
, Delek had
3.5 million
barrels of inventory consigned from J. Aron, and we have recorded liabilities associated with this consigned inventory of
$253.7 million
in the consolidated balance sheet.
In connection with the Alon Supply and Offtake Agreement for our Krotz Springs refinery, we have granted a security interest to J. Aron in all of its accounts receivable and inventory to secure its obligations to J. Aron. In addition, we have granted a security interest in all of the Krotz Springs refinery's real property and equipment to J. Aron to secure our obligations under a commodity hedge and sale agreement in lieu of posting cash collateral and being subject to cash margin calls.
9
. Property, Plant and Equipment
Property, plant and equipment, at cost, consist of the following (in millions):
|
December 31,
|
||||||||
|
2017
|
2016
|
|||||||
|
Land
|
$
|
54.0
|
|
$
|
12.4
|
|
||
|
Building and building improvements
|
67.9
|
|
32.1
|
|
||||
|
Refinery machinery and equipment
|
1,823.4
|
|
982.5
|
|
||||
|
Pipelines and terminals
|
314.3
|
|
302.5
|
|
||||
|
Retail store equipment and site improvements
|
75.5
|
|
10.7
|
|
||||
|
Refinery turnaround costs
|
124.8
|
|
124.2
|
|
||||
|
Other equipment
|
108.2
|
|
89.1
|
|
||||
|
Construction in progress
|
204.4
|
|
34.1
|
|
||||
|
2,772.5
|
|
1,587.6
|
|
|||||
|
Less: accumulated depreciation
|
(631.7
|
)
|
(484.3
|
)
|
||||
|
$
|
2,140.8
|
|
$
|
1,103.3
|
|
|||
F-32
Property, plant and equipment, accumulated depreciation and depreciation expense by reporting segment are as follows (in millions):
|
As of and For the Year Ended December 31, 2017
|
||||||||||||||||||||
|
Refining
|
Logistics
|
Retail
|
Corporate,
Other and Eliminations |
Consolidated
|
||||||||||||||||
|
Property, plant and equipment
|
$
|
2,112.2
|
|
$
|
367.2
|
|
$
|
141.9
|
|
$
|
151.2
|
|
$
|
2,772.5
|
|
|||||
|
Less: Accumulated depreciation
|
(474.8
|
)
|
(112.1
|
)
|
(6.7
|
)
|
(38.1
|
)
|
(631.7
|
)
|
||||||||||
|
Property, plant and equipment, net
|
$
|
1,637.4
|
|
$
|
255.1
|
|
$
|
135.2
|
|
$
|
113.1
|
|
$
|
2,140.8
|
|
|||||
|
Depreciation expense
|
$
|
106.8
|
|
$
|
20.9
|
|
$
|
6.6
|
|
$
|
15.2
|
|
$
|
149.5
|
|
|||||
|
As of and For the Year Ended December 31, 2016
|
||||||||||||||||||||
|
Refining
|
Logistics
|
Retail
|
Corporate,
Other and Eliminations |
Consolidated
|
||||||||||||||||
|
Property, plant and equipment
|
$
|
1,202.9
|
|
$
|
342.4
|
|
$
|
—
|
|
$
|
42.3
|
|
$
|
1,587.6
|
|
|||||
|
Less: Accumulated depreciation
|
(370.0
|
)
|
(91.4
|
)
|
—
|
|
(22.9
|
)
|
(484.3
|
)
|
||||||||||
|
Property, plant and equipment, net
|
$
|
832.9
|
|
$
|
251.0
|
|
$
|
—
|
|
$
|
19.4
|
|
$
|
1,103.3
|
|
|||||
|
Depreciation expense
|
$
|
88.0
|
|
$
|
19.7
|
|
$
|
—
|
|
$
|
7.4
|
|
$
|
115.1
|
|
|||||
10
. Goodwill
Goodwill represents the excess of the aggregate purchase price over the fair value of the identifiable net assets acquired. Goodwill acquired in a business combination is recorded at fair value and is not amortized.
Delek performs an annual assessment of whether goodwill retains its value. This assessment is done more frequently if indicators of potential impairment exist. We performed our annual goodwill impairment review in the fourth quarter of
2017
,
2016
and
2015
. This review was performed on reporting units at a level below our reportable segment level. We performed a discounted cash flows test to estimate the value of each of our reporting units using a market participant weighted average cost of capital, estimated minimal growth rates for revenue, gross profit and capital expenditures based on history and our best estimate of future forecasts. We also estimated the fair values of the reporting units using a multiple of expected future cash flows, such as those used by third-party analysts. With respect to the goodwill associated with the Delek/Alon Merger, we performed a qualitative assessment. At
December 31, 2017
,
2016
and
2015
, the annual impairment review resulted in the determination that
no
impairment of goodwill had occurred, and we had
no
accumulated goodwill impairment losses as of
December 31, 2017
.
A summary of our goodwill by segment is as follows (in millions):
|
Refining
|
Logistics
|
Retail
|
Corporate, Other and Eliminations
|
Total
|
|||||||||||||
|
Balance,
|
December 31, 2014
|
$
|
—
|
|
$
|
11.7
|
|
$
|
—
|
|
$
|
—
|
|
$
|
11.7
|
|
|
|
Acquisitions
|
—
|
|
0.5
|
|
—
|
|
—
|
|
0.5
|
|
|||||||
|
Balance,
|
December 31, 2015
|
—
|
|
12.2
|
|
—
|
|
—
|
|
12.2
|
|
||||||
|
Acquisitions
|
—
|
|
—
|
|
—
|
|
—
|
|
—
|
|
|||||||
|
Balance,
|
December 31, 2016
|
—
|
|
12.2
|
|
—
|
|
—
|
|
12.2
|
|
||||||
|
Acquisitions
|
750.9
|
|
—
|
|
30.8
|
|
22.7
|
|
804.4
|
|
|||||||
|
Balance,
|
December 31, 2017
|
$
|
750.9
|
|
$
|
12.2
|
|
$
|
30.8
|
|
$
|
22.7
|
|
$
|
816.6
|
|
|
Goodwill associated with the Delek/Alon Merger, included in the increase in goodwill due to acquisitions during the year ended
December 31, 2017
above, is preliminary, as is the allocation between segments. See Note 3 for further discussion regarding the preliminary nature of the goodwill and inter-segment allocations. There was no goodwill allocated to the California Discontinued Entities as of
December 31, 2017
F-33
11
. Other Intangible Assets
A summary of our identifiable intangible assets are as follows (in millions):
|
As of December 31, 2017
|
Useful Life
|
Gross
|
Accumulated Amortization
|
Net
|
|||||||||||
|
Intangible Assets subject to amortization:
|
|||||||||||||||
|
Supply contract
|
11.5 years
|
12.2
|
|
$
|
(12.2
|
)
|
$
|
—
|
|
||||||
|
Third-party fuel supply agreement
|
10 years
|
49.0
|
|
(2.4
|
)
|
46.6
|
|
||||||||
|
Capacity contract
|
8 years
|
9.3
|
|
(9.2
|
)
|
0.1
|
|
||||||||
|
Fuel trade name
|
8.7 years
|
4.0
|
|
(0.4
|
)
|
3.6
|
|
||||||||
|
Below market leases
|
13 - 15 years
|
0.6
|
|
(0.1
|
)
|
0.5
|
|
||||||||
|
Intangible assets not subject to amortization:
|
|||||||||||||||
|
Rights-of-way
|
Indefinite
|
30.1
|
|
30.1
|
|
||||||||||
|
Line space history
|
Indefinite
|
9.6
|
|
9.6
|
|
||||||||||
|
Liquor licenses
|
Indefinite
|
8.5
|
|
8.5
|
|
||||||||||
|
Refinery permits
|
Indefinite
|
2.1
|
|
2.1
|
|
||||||||||
|
Total
|
$
|
125.4
|
|
$
|
(24.3
|
)
|
$
|
101.1
|
|
||||||
|
As of December 31, 2016
|
Useful Life
|
Gross
|
Accumulated Amortization
|
Net
|
|||||||||||
|
Intangible Assets subject to amortization:
|
|||||||||||||||
|
Supply contract
|
11.5 years
|
$
|
12.2
|
|
$
|
(11.0
|
)
|
$
|
1.2
|
|
|||||
|
Capacity contract
|
8 years
|
9.3
|
|
(9.0
|
)
|
0.3
|
|
||||||||
|
Intangible assets not subject to amortization:
|
|||||||||||||||
|
Rights-of-way
|
Indefinite
|
17.3
|
|
17.3
|
|
||||||||||
|
Line space history
|
Indefinite
|
7.9
|
|
7.9
|
|
||||||||||
|
Total
|
$
|
46.7
|
|
$
|
(20.0
|
)
|
$
|
26.7
|
|
||||||
Amortization of intangible assets was
$3.8 million
during the year ended
December 31, 2017
, and
$1.3 million
during each of the years ended
2016
and
2015
, and is included in depreciation and amortization on the accompanying consolidated statements of income.
Amortization expense for the next five years is estimated to be as follows:
|
2018
|
$
|
6.1
|
|
|
|
2019
|
6.0
|
|
||
|
2020
|
6.0
|
|
||
|
2021
|
6.0
|
|
||
|
2022
|
5.6
|
|
||
F-34
12
. Long-Term Obligations and Notes Payable
Outstanding borrowings, net of unamortized debt discounts and certain deferred financing costs, under Delek’s existing debt instruments are as follows (in millions):
|
December 31,
2017 |
December 31,
2016 |
|||||||
|
DKL Revolver
|
$
|
179.9
|
|
$
|
392.6
|
|
||
|
DKL Notes
(1)
|
242.7
|
|
—
|
|
||||
|
Wells Term Loan
(2)
|
40.5
|
|
63.6
|
|
||||
|
Wells Revolving Loan
|
45.0
|
|
—
|
|
||||
|
Reliant Bank Revolver
|
17.0
|
|
17.0
|
|
||||
|
Promissory Notes
|
95.1
|
|
130.0
|
|
||||
|
Lion Term Loan
(3)
|
203.4
|
|
229.7
|
|
||||
|
Alon Partnership Credit Facility
|
100.0
|
|
—
|
|
||||
|
Alon Partnership Term Loan
|
237.5
|
|
—
|
|
||||
|
Convertible Notes
(4)
|
146.0
|
|
—
|
|
||||
|
Alon Term Loan Credit Facilities
(5)
|
72.4
|
|
—
|
|
||||
|
Alon Retail Credit Facilities
(6)
|
86.1
|
|
—
|
|
||||
|
|
1,465.6
|
|
832.9
|
|
||||
|
Less: Current portion of long-term debt and notes payable
|
590.2
|
|
84.4
|
|
||||
|
|
$
|
875.4
|
|
$
|
748.5
|
|
||
|
(1)
|
The DKL Notes are net of deferred financing costs of
$5.6 million
and debt discount of
$1.7 million
at
December 31, 2017
.
|
|
(2)
|
The Wells Term Loan is net of deferred financing costs of a nominal amount and
$0.1 million
as of
December 31, 2017
and
2016
, and debt discount of
$0.3 million
and
$0.5 million
as of
December 31, 2017
and
2016
, respectively.
|
|
(3)
|
The Lion Term Loan is net of deferred financing cost of
$2.1 million
and
$3.0 million
as of
December 31, 2017
and
2016
, respectively, and debt discount of
$0.8 million
and
$1.1 million
, as of
December 31, 2017
and
2016
, respectively.
|
|
(4)
|
The Convertible Notes are net of debt discount of
$4.0 million
at
December 31, 2017
|
|
(5)
|
The Alon Term Loan Credit Facilities are net of debt discount of
$0.6 million
at
December 31, 2017
.
|
|
(6)
|
The Alon Retail Credit Facilities are net of debt discount of
$2.4 million
at
December 31, 2017
.
|
Principal maturities of Delek's existing third-party debt instruments for the next five years and thereafter are as follows as of
December 31, 2017
(in millions):
|
2018
|
2019
|
2020
|
2021
|
2022
|
Thereafter
|
Total
|
||||||||||||||||||||||
|
DKL Revolver
|
$
|
—
|
|
$
|
179.9
|
|
$
|
—
|
|
$
|
—
|
|
$
|
—
|
|
$
|
—
|
|
$
|
179.9
|
|
|||||||
|
DKL Notes
|
—
|
|
—
|
|
—
|
|
—
|
|
—
|
|
250.0
|
|
250.0
|
|
||||||||||||||
|
Wells Term Loan
|
23.3
|
|
17.5
|
|
—
|
|
—
|
|
—
|
|
—
|
|
40.8
|
|
||||||||||||||
|
Wells Revolving Loan
|
—
|
|
—
|
|
—
|
|
45.0
|
|
—
|
|
—
|
|
45.0
|
|
||||||||||||||
|
Reliant Bank Revolver
|
17.0
|
|
—
|
|
—
|
|
—
|
|
—
|
|
—
|
|
17.0
|
|
||||||||||||||
|
Promissory Notes
|
25.0
|
|
25.1
|
|
25.0
|
|
20.0
|
|
—
|
|
—
|
|
95.1
|
|
||||||||||||||
|
Lion Term Loan
|
27.5
|
|
27.5
|
|
151.3
|
|
—
|
|
—
|
|
—
|
|
206.3
|
|
||||||||||||||
|
Alon Partnership Credit Facility
|
100.0
|
|
—
|
|
—
|
|
—
|
|
—
|
|
—
|
|
100.0
|
|
||||||||||||||
|
Alon Partnership Term Loan
|
237.5
|
|
—
|
|
—
|
|
—
|
|
—
|
|
—
|
|
237.5
|
|
||||||||||||||
|
Convertible Notes
|
150.0
|
|
—
|
|
—
|
|
—
|
|
—
|
|
—
|
|
150.0
|
|
||||||||||||||
|
Alon Term Loan Credit Facilities
|
9.3
|
|
21.0
|
|
21.0
|
|
5.4
|
|
16.3
|
|
—
|
|
73.0
|
|
||||||||||||||
|
Alon Retail Credit Facilities
|
8.1
|
|
80.4
|
|
—
|
|
—
|
|
—
|
|
—
|
|
88.5
|
|
||||||||||||||
|
Total
|
$
|
597.7
|
|
$
|
351.4
|
|
$
|
197.3
|
|
$
|
70.4
|
|
$
|
16.3
|
|
$
|
250.0
|
|
$
|
1,483.1
|
|
|||||||
F-35
DKL Revolver
Delek Logistics has a
$700.0 million
senior secured revolving credit agreement with Fifth Third Bank, as administrative agent, and a syndicate of lenders (the "DKL Revolver"). Delek Logistics and all of its wholly-owned subsidiaries are borrowers or guarantors under the DKL Revolver. The DKL Revolver contains a dual currency borrowing tranche that permits draw downs in U.S. or Canadian dollars and an accordion feature whereby Delek Logistics can increase the size of the credit facility to an aggregate of
$800.0 million
, subject to receiving increased or new commitments from lenders and the satisfaction of certain other conditions precedent.
The obligations under the DKL Revolver are secured by a first priority lien on substantially all of Delek Logistics' tangible and intangible assets. Additionally, a subsidiary of Delek provides a limited guaranty of Delek Logistics' obligations under the DKL Revolver. The guaranty is (i) limited to an amount equal to the principal amount, plus unpaid and accrued interest, of a promissory note made by Delek in favor of the subsidiary guarantor (the "Holdings Note") and (ii) secured by the subsidiary guarantor's pledge of the Holdings Note to the DKL Revolver lenders. As of
December 31, 2017
, the principal amount of the Holdings Note was
$102.0 million
.
The DKL Revolver will mature on
December 30, 2019
. Borrowings under the DKL Revolver bear interest at either a U.S. base rate, Canadian prime rate, LIBOR, or a Canadian Dealer Offered Rate, in each case plus applicable margins, at the election of the borrowers and as a function of draw down currency. The applicable margin, in each case, varies based upon Delek Logistics' leverage ratio, which is defined as the ratio of total funded debt to EBITDA for the most recently ended four fiscal quarters. At
December 31, 2017
, the weighted average borrowing rate was approximately
4.3%
. Additionally, the DKL Revolver requires Delek Logistics to pay a leverage ratio dependent quarterly fee on the average unused revolving commitment. As of
December 31, 2017
, this fee was
0.50%
per year. As of
December 31, 2017
, Delek Logistics had
$179.9 million
of outstanding borrowings under the credit facility, as well as letters of credit issued of
$9.0 million
. Unused credit commitments available under the DKL Revolver, as of
December 31, 2017
, were
$511.1 million
.
DKL Notes
On May 23, 2017, Delek Logistics and Finance Corp. (collectively, the “Issuers”), issued
$250.0 million
in aggregate principal amount of
6.75%
senior notes due 2025 (the “DKL Notes”) at a discount. The DKL Notes are general unsecured senior obligations of the Issuers. The DKL Notes are unconditionally guaranteed jointly and severally on a senior unsecured basis by Delek Logistics' existing subsidiaries (other than Finance Corp., the "Guarantors") and will be unconditionally guaranteed on the same basis by certain of Delek Logistics' future subsidiaries. The DKL Notes rank equal in right of payment with all existing and future senior indebtedness of the Issuers, and senior in right of payment to any future subordinated indebtedness of the Issuers. Interest on the DKL Notes is payable semi-annually in arrears on each May 15 and November 15, commencing November 15, 2017.
At any time prior to May 15, 2020, the Issuers may redeem up to
35%
of the aggregate principal amount of the DKL Notes with the net cash proceeds of one or more equity offerings by Delek Logistics at a redemption price of
106.750%
of the redeemed principal amount, plus accrued and unpaid interest, if any, subject to certain conditions and limitations. Prior to May 15, 2020, the Issuers may redeem all or part of the DKL Notes at a redemption price of the principal amount plus accrued and unpaid interest, if any, plus a "make whole" premium, subject to certain conditions and limitations. In addition, beginning on May 15, 2020, the Issuers may, subject to certain conditions and limitations, redeem all or part of the DKL Notes, at a redemption price of
105.063%
of the redeemed principal for the twelve-month period beginning on May 15, 2020,
103.375%
for the twelve-month period beginning on May 15, 2021,
101.688%
for the twelve-month period beginning on May 15, 2022, and
100.00%
beginning on May 15, 2023 and thereafter, plus accrued and unpaid interest, if any.
In the event of a change of control, accompanied or followed by a ratings downgrade within a certain period of time, subject to certain conditions and limitations, the Issuers will be obligated to make an offer for the purchase the DKL Notes from holders at a price equal to
101%
of the principal amount thereof, plus accrued and unpaid interest.
In connection with the issuance of the 2025 Notes, the Issuers and the Guarantors entered into a registration rights agreement, whereby the Issuers and the Guarantors are required to exchange the 2025 Notes for new notes with terms substantially identical in all material respects with the 2025 Notes (except the new notes will not contain terms with respect to transfer restrictions). The Issuers and the Guarantors will use their commercially reasonable efforts to cause the exchange offer to be consummated not later than 365 days after May 23, 2017.
As of
December 31, 2017
, we had
$250.0 million
in outstanding principal amount under the 2025 Notes.
F-36
Wells ABL
Our subsidiary, Delek Refining, Ltd., has an asset-based loan credit facility with Wells Fargo Bank, National Association, as administrative agent, and a syndicate of lenders, which was amended and restated on September 29, 2016 (the "Wells ABL") and was most recently amended on May 17, 2017 to incorporate technical modifications related to the Delek/Alon Merger. The Wells ABL consists of (i) a
$450.0 million
revolving loan (the "Wells Revolving Loan"), which includes a
$45.0 million
swing line loan sub-limit and a
$200.0 million
letter of credit sub-limit, (ii) a
$70.0 million
term loan (the "Wells Term Loan"), and (iii) an accordion feature that permits an increase in the size of the revolving credit facility to an aggregate of
$725.0 million
, subject to additional lender commitments and the satisfaction of certain other conditions precedent. The Wells Revolving Loan matures on
September 29, 2021
and the Wells Term Loan matures on
September 29, 2019
. The Wells Term Loan is subject to repayment in level principal installments of approximately
$5.8 million
per quarter, with the final installment due on
September 29, 2019
. As of
December 31, 2017
, under the Wells ABL, we had letters of credit issued totaling
$96.5 million
,
$45.0 million
in borrowings outstanding under the Wells Revolving Loan and
$40.8 million
outstanding under the Wells Term Loan. The obligations under the Wells ABL are secured by (i) substantially all the assets of Refining and its subsidiaries, with certain limitations, (ii) guaranties provided by the general partner of Delek Refining, Ltd., as well as by the parent of Delek Refining, Ltd., Delek Refining, Inc. (iii) a limited guarantee provided jointly and severally by Old and New Delek in an amount up to
$15.0 million
in the aggregate and (iv) a limited guarantee provided by Lion Oil in an amount equal to the sum of the face amount of all letters of credit issued on behalf of Lion Oil under the Wells ABL and any loans made by Refining or its subsidiaries to Lion Oil. Under the facility, revolving loans and letters of credit are provided subject to availability requirements, which are determined pursuant to a borrowing base calculation as defined in the credit agreement. The borrowing base, as calculated, is primarily supported by cash, certain accounts receivable and certain inventory. Borrowings under the Wells Revolving Loan and Wells Term Loan bear interest based on separate predetermined pricing grids which allow us to choose between
base rate
loans or
LIBOR rate
loans. At
December 31, 2017
, the weighted average borrowing rate was approximately
5.3%
under the Wells Term Loan and
5.0%
under the Wells Revolving Loan. Additionally, the Wells ABL requires us to pay a quarterly unused credit commitment fee. As of
December 31, 2017
, this fee was approximately
0.38%
per year. Unused borrowing base availability, as calculated and reported under the terms of the Wells ABL credit facility, as of
December 31, 2017
, was approximately
$308.5 million
.
Reliant Bank Revolver
We have a revolving credit agreement with Reliant Bank, which was amended on May 26, 2016 (the "Reliant Bank Revolver") and was most recently amended on May 23, 2017 to incorporate technical modifications related to the Delek/Alon Merger. The Reliant Bank Revolver provides for unsecured loans of up to
$17.0 million
. As of
December 31, 2017
, we had
$17.0 million
outstanding under this facility. The Reliant Bank Revolver matures on
June 28, 2018
, and bears interest at a fixed rate of
5.25%
per annum. The Reliant Bank Revolver requires us to pay a quarterly fee of
0.50%
per year on the average available revolving commitment. As of
December 31, 2017
, we had
no
unused credit commitments under the Reliant Bank Revolver.
Promissory Notes
On April 29, 2011, Delek entered into a
$50.0 million
promissory note (the "Ergon Note") with Ergon, Inc. ("Ergon") in connection with the closing of our acquisition of Lion Oil. The Ergon Note required Delek to make annual amortization payments of
$10.0 million
each, commencing
April 29, 2013
. The Ergon Note matured on
April 29, 2017
and was paid in full. Interest under the Ergon Note was computed at a fixed rate equal to
4.0%
per annum.
On May 14, 2015, in connection with the Company’s closing of the Alon Acquisition, the Company issued the Alon Israel Note in the amount of
$145.0 million
, which was payable to Alon Israel. The Alon Israel Note bears interest at a fixed rate of
5.5%
per annum and requires five annual principal amortization payments of
$25.0 million
beginning in January 2016 followed by a final principal amortization payment of
$20.0 million
at maturity on
January 4, 2021
. In October, 2015, we prepaid the first annual principal amortization payment in the amount of
$25.0 million
, along with all interest due on the prepaid amount. On December 22, 2015, Alon Israel assigned the remaining
$120.0 million
of principal and all accrued interest due under the Alon Israel Note to assignees under four new notes in substantially the same form and on the same terms as the Alon Israel Note (collectively, the "Alon Successor Notes"). The
$120.0 million
total principal of the four Alon Successor Notes collectively require the same principal amortization payments and schedule as under the Alon Israel Note, with payments due under each Alon Successor Note commensurate to such note's pro rata share of
$120.0 million
in assigned principal. As of
December 31, 2017
, a total principal amount of
$95.0 million
was outstanding under the Alon Successor Notes.
As of
December 31, 2017
, one of our retail companies had a loan that matures in 2019 with an outstanding balance of
$0.1 million
and the interest rate was fixed at
9.7%
.
F-37
Lion Term Loan
Our subsidiary, Lion Oil, has a term loan credit facility with Fifth Third Bank, as administrative agent, and a syndicate of lenders, which was amended and restated on May 14, 2015 in connection with the Company’s closing of the Alon Acquisition to, among other things, increase the total loan size from
$99.0 million
to
$275.0 million
(the "Lion Term Loan"), and was most recently amended on April 13, 2017 to incorporate technical modifications related to the Delek/Alon Merger. The Lion Term Loan requires Lion Oil to make quarterly principal amortization payments of approximately
$6.9 million
each, commencing on
September 30, 2015
, with a final balloon payment due at maturity on
May 14, 2020
. The Lion Term Loan is secured by, among other things, (i) substantially all the assets of Lion Oil and its subsidiaries (excluding inventory and accounts receivable), (ii) all shares in Lion Oil, (iii) any subordinated and common units of Delek Logistics held by Lion Oil, and (iv) the ALJ Shares. Additionally, the Lion Term Loan is guaranteed by Old and New Delek and the subsidiaries of Lion Oil. Interest on the unpaid balance of the Lion Term Loan is computed at a rate per annum equal to
LIBOR
or a
base rate
, at our election, plus the applicable margins, subject in each case to an all-in
interest rate floor
of
5.5%
per annum. As of
December 31, 2017
,
$206.3 million
was outstanding under the Lion Term Loan and the weighted average borrowing rate was
6.2%
.
Alon Partnership
Revolving Credit Facility
Alon USA, LP, a wholly-owned subsidiary of the Alon Partnership, has a
$240.0 million
asset-based revolving credit facility with Israel Discount Bank of New York, as administrative agent (the “Alon Partnership Credit Facility”) that currently matures on May 26, 2018. The Alon Partnership Credit Facility is guaranteed by the Alon Partnership and Alon and certain of their subsidiaries. The Alon Partnership Credit Facility can be used both for borrowings and the issuance of letters of credit subject to a limit of the lesser of the facility amount or the borrowing base amount under the facility. Borrowings under the Alon Partnership Credit Facility bear interest at LIBOR or base rate, at our election, plus the applicable margins.
The Alon Partnership Credit Facility is secured by a first priority lien on the Alon Partnership’s cash, accounts receivables, inventories and related assets and a second priority lien on the Alon Partnership’s fixed assets and other specified property.
At
December 31, 2017
, the weighted average borrowing rate was approximately
5.5%
. Additionally, the Alon Partnership Credit Facility requires the payment of a quarterly fee on the average unused revolving commitment. As of
December 31, 2017
, this fee was
0.65%
per year. As of
December 31, 2017
, the Alon Partnership had
$100.0 million
of outstanding borrowings under the credit facility, as well as letters of credit issued of
$11.9 million
. Unused borrowing base availability under the Alon Partnership Credit Facility, as of
December 31, 2017
, was approximately
$103.6 million
.
Partnership Term Loan Credit Facility
The Alon Partnership has a
$250.0 million
term loan with Credit Suisse AG, as administrative agent (the “Alon Partnership Term Loan”). The Alon Partnership Term Loan requires principal payments of
$2.5 million
per annum paid in equal quarterly installments until maturity in November 2018, at which time a balloon payment is due for any remaining principal outstanding. The Alon Partnership Term Loan bears interest at a rate equal to the sum of (i) the Eurodollar rate (with a floor of
1.25%
per annum) plus (ii) a margin of
8.0%
per annum. At
December 31, 2017
, the weighted average borrowing rate was approximately
9.6%
under the Alon Partnership Term Loan. As of
December 31, 2017
, the Alon Partnership Term Loan had an outstanding principal balance of
$237.5 million
.
The Alon Partnership Term Loan is guaranteed by certain subsidiaries of the Alon USA Partners GP, LLC, Alon Assets, Inc. and certain subsidiaries of the Alon Partnership, and is secured by a first priority lien on all of the Alon Partnership’s fixed assets and other specified property, as well as on the general partner interest in the Alon Partnership held by the Alon General Partner, and a second priority lien on the Alon Partnership’s cash, accounts receivables, inventories and related assets.
Alon Convertible Senior Notes
(share values in dollars)
In connection with the Delek/Alon Merger, Alon, New Delek and U.S. Bank National Association, as trustee (the “Trustee”), entered into a First Supplemental Indenture (the “Supplemental Indenture”), effective as of July 1, 2017, supplementing the Indenture, dated as of September 16, 2013 (the “Original Indenture”; the Original Indenture, as amended by the Supplemental Indenture, is referred to as the "Indenture"), pursuant to which Alon issued its
3.00%
Convertible Senior Notes due 2018 (the “ Convertible Notes”) in the aggregate principal amount of
$150.0 million
, which were convertible into shares of Alon’s Common Stock, par value
$0.01
per share or cash or a combination of cash and Alon Common Stock, at Alon's election, all as provided in the Indenture. The Supplemental Indenture provides that, as of the Effective Time, the right to convert each
$1,000
principal amount of the Notes based on a number of shares of Alon Common Stock equal to the Conversion Rate (as defined in the Indenture) in effect immediately prior to the Merger was changed into a right to convert each
$1,000
principal amount of Notes into or based on a number of shares of New Delek Common Stock (at the exchange rate of
0.504
), par value
$0.01
per share, equal to the Conversion Rate in effect immediately prior to the Merger. In addition, the Supplemental Indenture provides that, as of the Effective Time, New Delek fully and unconditionally guarantees, on a senior basis, Alon’s obligations under the Convertible Notes.
F-38
Interest on the Convertible Notes is payable in arrears in March and September of each year. The Convertible Notes are not redeemable at our option prior to maturity. Under the terms of the Convertible Notes, the holders of the Convertible Notes cannot require us to repurchase all or part of the notes except for instances of a fundamental change, as defined in the indenture. The Convertible Notes do not contain any maintenance financial covenants.
The holders of the Convertible Notes may convert their notes at any time after June 15, 2018 into a settlement amount determined in accordance with the terms of the Indenture.
Prior to June 15, 2018, holders may convert their Convertible Notes only upon the occurrence of certain triggering events described in the Indenture, none of which has occurred as of
December 31, 2017
. The Convertible Notes may be converted into shares of New Delek Common Stock, into cash, or into a combination of cash and shares of New Delek Common Stock, at our election.
The conversion rate of the Convertible Notes is subject to adjustment upon the occurrence of certain events, including cash dividend adjustments, but will not be adjusted for any accrued and unpaid interest. As of
December 31, 2017
, the adjusted conversion rate was
74.4820
shares of Alon Common Stock per each
$1,000
principal amount of Convertible Notes, equivalent to a per share conversion price for New Delek Common Stock of approximately
$27
, to re
flect cash dividend adjustments and the merger stock exchange rate of
0.504
(for a post-Merger conversion ratio of approximately
37.54
). As of
December 31, 2017
, there have been no conversions of the Convertible Notes.
The fair value of the conversion feature met the definition for recognition as a bifurcated equity instrument. As of
December 31, 2017
, the conversion feature equity instrument totaling
$26.6 million
is included in additional paid-in capital on the accompanying consolidated balance sheets.
Convertible Note Hedge Transactions
In connection with the Convertible Notes offering, Alon entered into convertible note hedge transactions with respect to Alon Common Stock (the “Purchased Options”) with the initial purchasers of the Convertible Notes (the “Hedge Counterparties”). In connection with the Delek/Alon Merger, Alon, Delek and the Hedge Counterparties entered into amended and restated Purchased Options permitting us to purchase up to approximately
5.6 million
shares of New Delek Common Stock, subject to customary anti-dilution adjustments, that underlie the Convertible Notes sold in the offering. As of
December 31, 2017
, the Purchased Options had an adjusted strike price of approximately
$27
per share of New Delek Common Stock. The Purchased Options will expire in September 2018.
The Purchased Options are intended to reduce the potential dilution with respect to our common stock upon conversion of the Convertible Notes, as well as offset any potential cash payments we are required to make in excess of the principal amount upon any conversion of the notes. As of
December 31, 2017
, the Purchased Options balance of
$23.3 million
has been included as a reduction of additional paid-in capital on the consolidated balance sheets.
The Purchased Options are separate transactions and are not part of the terms of the Convertible Notes and are excluded from classification as a derivative as the amount could be settled in our stock. Holders of the Convertible Notes do not have any rights with respect to the Purchased Options.
Warrant Transactions
In connection with the Convertible Notes offering, Alon also entered into warrant transactions (the “Warrants”), with the Hedge Counterparties. In connection with the Delek/Alon Merger, Alon, Delek and the Hedge Counterparties entered into amended and restated Warrants which allow the Hedge Counterparties to purchase up to approximately
5.6 million
shares of New Delek Common Stock, subject to customary anti-dilution adjustments. As of
December 31, 2017
, the Warrants had an adjusted strike price of approximately
$35
per share of New Delek Common Stock. The Warrants will be settled on a net-share basis and will expire in April 2019. As of
December 31, 2017
, Warrants totaling
$14.3 million
have been included in additional paid-in capital on the consolidated balance sheets.
The Warrants are separate transactions and are not part of the terms of the Convertible Notes and are excluded from classification as a derivative as the amount could be settled in our stock. Holders of the Convertible Notes do not have any rights with respect to the Warrants.
Alon Term Loan Credit Facilities
Alon Energy Term Loan
On March 27, 2014, Alon issued a promissory note to Bank Hapoalim B.M. in an original principal amount of
$25.0 million
(“Alon Energy Term Loan”), that was to mature in March 2019, but was refinanced on December 29, 2017. The Alon Energy Term Loan required monthly principal amortization payments of approximately
$0.4 million
each, commencing on June 1, 2014, and incurred interest at a rate equal to LIBOR plus a margin of
3.75%
. The Alon Energy Term Loan was refinanced with the proceeds of a new promissory note to Bank Hapoalim in an original principal amount of
$38.0 million
("New Alon Energy Term Loan"), maturing on December 29, 2022. The New Alon Energy Term Loan requires quarterly principal amortization payments of approximately
$1.4 million
each, commencing on March 30, 2018, and incurs interest at an annual rate equal to LIBOR plus a margin of
3.75%
. Additionally, Delek guarantees all obligations under the New Alon Energy Term Loan.
F-39
At
December 31, 2017
, the borrowing rate was approximately
5.4%
under the New Alon Energy Term Loan, and this loan had an outstanding balance of
$38.0 million
. Under the terms of the New Alon Energy Term Loan, Delek is obligated to pledge as security for the loan certain Alon common stock to Bank Hapoalim B.M. on or before March 29, 2018.
Alon Asphalt Term Loan
Alon has a term loan owing to Export Development Canada secured by liens on certain of our asphalt terminals (“Alon Asphalt Term Loan”) in an original principal amount of
$35.0 million
. The Alon Asphalt Term Loan is guaranteed by Delek and certain subsidiaries of Alon and is also secured by pledges of equity of certain subsidiaries of Alon. The Alon Asphalt Term Loan requires quarterly principal amortization payments of approximately
$3.9 million
, commencing December 2018 until maturity in December 2020. The Alon Asphalt Term Loan bears interest at a rate equal to LIBOR plus a margin of
3.75%
per annum. At
December 31, 2017
, the borrowing rate under this loan was approximately
5.2%
, and the loan had an outstanding balance of
$35.0 million
. The Alon Asphalt Term Loan was most recently amended on June 14, 2017 to incorporate modifications related to the Delek/Alon Merger.
Alon Energy Letter of Credit Facility
Alon has a Letter of Credit Facility with Israel Discount Bank of New York (the “Alon Energy Letter of Credit Facility”) that is used for the issuance of standby letters of credit. The facility was amended on November 30, 2017, to, among other things, extend the maturity date of the facility to February 28, 2018 and to reduce the maximum commitment under the facility from
$60.0 million
to
$45.0 million
effective December 31, 2017, and was again amended on February 27, 2018 to extend the maturity date to March 29, 2018. As collateral for the Alon Energy Letter of Credit Facility, we are required to pledge sufficient Alon Partnership common units with an initial collateral value of at least
$100.0 million
. Additionally, Alon Assets, Inc. (“Alon Assets”) is a guarantor under the Alon Energy Letter of Credit Facility.
At
December 31, 2017
, we had outstanding letters of credit under this facility of approximately
$6.5 million
. Additionally, the Alon Energy Letter of Credit Facility requires the payment of a quarterly fee on the average unused commitment. As of
December 31, 2017
, this fee was
0.85%
per year.
Retail Credit Facility
Alon Retail Credit Agreement
Alon wholly-owned subsidiaries Southwest Convenience Stores, LLC and Skinny’s LLC, (collectively, “Alon Retail”), have a credit agreement (“Alon Retail Credit Agreement”), maturing in March 2019, with Wells Fargo Bank, National Association, as administrative agent. The Alon Retail Credit Agreement includes a term loan in an original principal amount of
$110.0 million
and a
$10.0 million
revolving credit facility. The Alon Retail Credit Agreement also includes an accordion feature that provides for incremental term loans up to
$30.0 million
. In August 2015, Alon borrowed
$11.0 million
using the accordion feature and amended the Alon Retail Credit Agreement to restore the undrawn amount of the accordion feature back to
$30.0 million
. The
$11.0 million
incremental term loan was used to fund Alon's acquisition of
14
convenience retail stores in New Mexico.
Borrowings under the Alon Retail Credit Agreement bear interest at LIBOR or base rate, at our election, plus an applicable margin, determined quarterly based upon Alon Retail’s leverage ratio. Principal payments on the term loan borrowings are made in quarterly installments based on a
15
-year amortization schedule.
Obligations under the Alon Retail Credit Agreement are secured by a first priority lien on substantially all of the assets of Alon Retail and its subsidiaries.
The Alon Retail Credit Agreement requires us to pay a leverage ratio dependent quarterly fee on the average unused revolving commitment. As of
December 31, 2017
, this fee was
0.40%
per year. As of and during the period from the Delek/Alon Merger through
December 31, 2017
, Alon had
no
outstanding borrowings under the revolving portion of the credit facility. Unused credit commitments under the revolving credit line, as of
December 31, 2017
, were
$10.0 million
.
At
December 31, 2017
, the borrowing rate was approximately
3.8%
under the term loan, and this loan had an outstanding balance of approximately
$88.5 million
.
Restrictive Covenants
Under the terms of our Wells ABL, DKL Revolver, DKL Notes, Reliant Bank Revolver, Lion Term Loan, Alon Partnership Credit Facility, Alon Partnership Term Loan, Alon Energy Term Loan, Alon Asphalt Term Loan, Alon Energy Letter of Credit Facility and Alon Retail Credit Agreement, we are required to comply with certain usual and customary financial and non-financial covenants. Further, although we were not required to comply with separate fixed charge coverage ratio financial covenants under the Wells ABL and the Lion Term Loan during the year ended
December 31, 2017
, we may be required to comply with these covenants at times when certain trigger thresholds are met, as defined in each of the Wells ABL and Lion Term Loan agreements. We believe we were in compliance with all covenant requirements under each of our credit facilities as of
December 31, 2017
.
F-40
Certain of our debt facilities contain limitations on the incurrence of additional indebtedness, making of investments, creation of liens, dispositions and acquisitions of assets, and making of restricted payments and transactions with affiliates. Specifically, these covenants may limit the payment, in the form of cash or other assets, of dividends or other distributions, or the repurchase of shares with respect to the equity of our subsidiaries. Additionally, certain of our debt facilities limit our ability to make investments, including extensions of loans or advances to, or acquisitions of equity interests in, or guarantees of obligations of, any other entities.
Restricted Net Assets
Some of Delek's subsidiaries have restrictions in their respective credit facilities limiting their use of assets, as has been discussed above. The total amount of our subsidiaries' restricted net assets as of
December 31, 2017
was
$1,753.0 million
.
Interest-Rate Derivative Instruments
Delek had an interest rate cap agreement in place for a notional amount of
$45.0 million
, which matured in February 2016. This agreement, and similar interest rate hedge agreements in place that matured during 2015, were intended to economically hedge floating interest rate risk related to a portion of our existing debt. However, as we have elected not to apply the permitted hedge accounting treatment, including formal hedge designation and documentation, in accordance with the provisions of ASC 815, the fair value of the derivatives was recorded in other current assets in the accompanying consolidated balance sheets with the offset recognized in interest expense in the accompanying consolidated statements of income.
Effective with the Delek/Alon Merger, we have assumed Alon's interest rate swap agreements, maturing March 2019, that effectively fix the variable LIBOR interest component of the term loans within the Alon Retail Credit Agreement. These interest rate swaps are accounted for as cash flow hedges. As of
December 31, 2017
, the aggregate notional amount under these agreements of $
68.3 million
covers approximately
77.2%
of the outstanding principal of these term loans throughout the duration of the interest rate swaps. As of
December 31, 2017
, the outstanding principal of these term loans was approximately
$88.5 million
. See Note
16
for further information regarding the interest rate swap agreements.
We recorded expense representing cash settlements and changes in estimated fair value of our interest rate derivative agreements of
$0.3 million
and
$0.1 million
for the years ended
December 31, 2017
and
2015
, respectively. These amounts are included in interest expense in the accompanying consolidated statements of income. There were no interest rate derivative agreements in place as of December 31, 2016, and we recognized
no
expense related to interest rate derivative agreements during the year ended December 31, 2016.
13
. Other Assets and Liabilities
The detail of other current assets is as follows (in millions):
|
Other Current Assets
|
December 31,
2017 |
December 31,
2016 |
|||||
|
Prepaid expenses
|
17.6
|
|
$
|
14.0
|
|
||
|
Short-term derivative assets (see Note 17)
|
15.9
|
|
6.8
|
|
|||
|
Income and other tax receivables
|
75.7
|
|
19.2
|
|
|||
|
RINs Obligation surplus (see Note 16)
|
1.1
|
|
4.9
|
|
|||
|
Other
|
19.6
|
|
4.4
|
|
|||
|
Total
|
$
|
129.9
|
|
$
|
49.3
|
|
|
The detail of other non-current assets is as follows (in millions):
|
Other Non-Current Assets
|
December 31,
2017 |
December 31,
2016 |
|||||
|
Prepaid tax asset
|
$
|
56.2
|
|
$
|
59.5
|
|
|
|
Deferred financing costs
|
5.9
|
|
8.2
|
|
|||
|
Long-term income tax receivables
|
2.1
|
|
7.5
|
|
|||
|
Supply and Offtake receivable
|
46.3
|
|
—
|
|
|||
|
Other
|
16.3
|
|
5.5
|
|
|||
|
Total
|
$
|
126.8
|
|
$
|
80.7
|
|
|
F-41
The detail of accrued expenses and other current liabilities is as follows (in millions):
|
Accrued Expenses and Other Current Liabilities
|
December 31,
2017 |
December 31,
2016 |
|||||
|
Income and other taxes payable
|
$
|
154.1
|
|
$
|
115.7
|
|
|
|
Short-term derivative liabilities (see Note 17)
|
54.4
|
|
26.1
|
|
|||
|
Interest payable
|
13.0
|
|
9.6
|
|
|||
|
Employee costs
|
46.6
|
|
7.3
|
|
|||
|
Environmental liabilities (see Note 21)
|
7.2
|
|
1.0
|
|
|||
|
Product financing agreements
|
72.3
|
|
6.0
|
|
|||
|
RINs Obligation deficit (see Note 16)
|
130.8
|
|
25.6
|
|
|||
|
Accrued utilities
|
9.4
|
|
4.2
|
|
|||
|
Tank inspection liabilities
|
10.7
|
|
1.0
|
|
|||
|
Other
|
66.4
|
|
33.3
|
|
|||
|
Total
|
$
|
564.9
|
|
$
|
229.8
|
|
|
The detail of other non-current liabilities is as follows (in millions):
|
Other Non-Current Liabilities
|
December 31,
2017 |
December 31,
2016 |
|||||
|
Pension and other postemployment benefit liabilities, net
(see Note 22) |
$
|
37.0
|
|
$
|
—
|
|
|
|
Long-term derivative liabilities (see Note 17)
|
0.9
|
|
17.3
|
|
|||
|
Liability for unrecognized tax benefits
|
6.1
|
|
1.7
|
|
|||
|
Above-market lease
|
11.2
|
|
—
|
|
|||
|
Tank inspection liabilities
|
11.7
|
|
1.3
|
|
|||
|
Other
|
16.1
|
|
5.7
|
|
|||
|
Total
|
$
|
83.0
|
|
$
|
26.0
|
|
|
14
. Equity Based Compensation
Delek US Holdings, Inc. 2006 Long-Term Incentive Plan
The Delek US Holdings, Inc. 2006 Long-Term Incentive Plan, as amended (the "2006 Plan"), allows Delek to grant stock options, SARs, restricted stock, RSUs, performance awards and other stock-based awards of up to
5,053,392
shares of Delek's common stock to certain directors, officers, employees, consultants and other individuals who perform services for Delek or its affiliates. Stock options and SARs granted under the 2006 Plan were generally granted at market price or higher. The vesting of all outstanding awards is subject to continued service to Delek or its affiliates except that vesting of awards granted to certain executive employees could, under certain circumstances, accelerate upon termination of their employment and the vesting of all outstanding awards could accelerate upon the occurrence of an Exchange Transaction (as defined in the 2006 Plan). In the second quarter of 2010, Delek's Board of Directors and its Incentive Plan Committee began using stock-settled SARs, rather than stock options, as the primary form of appreciation award under the 2006 Plan. The 2006 Plan expired in April 2016.
Delek US Holdings, Inc. 2016 Long-Term Incentive Plan
On May 5, 2016, our stockholders approved our 2016 Long-Term Incentive Plan (the “2016 Plan”). The 2016 Plan succeeds our 2006 Plan, which expired in April 2016. The 2016 Plan allows Delek to grant stock options, SARs, restricted stock, RSUs, performance awards and other stock-based awards of up to
4,400,000
shares of Delek's common stock to certain directors, officers, employees, consultants and other individuals who perform services for Delek or its affiliates. Stock options and SARs issued under the 2016 Plan are granted at prices equal to (or greater than) the fair market value of Delek's common stock on the grant date and are generally subject to a vesting period of one year or more. No awards will be made under the 2016 Plan after May 5, 2026.
F-42
Alon USA Energy, Inc. 2005 Long-Term Incentive Plan
In connection with the Delek/Alon Merger, Delek assumed the Alon USA Energy, Inc. Second Amended and Restated 2005 Incentive Compensation Plan (“the Alon 2005 Plan” and, collectively with the 2006 Plan and the 2016 Plan, the "Incentive Plans" ) as a component of its overall executive incentive compensation program. The Alon 2005 Plan permits the granting of awards to Alon's officers and key employees in the form of options to purchase common stock, stock appreciation rights, restricted shares of common stock, restricted common stock units, performance shares, performance units and senior executive plan bonuses. Effective with the Delek/Alon Merger, all contractually unvested share-based awards were converted into share-based awards denominated in New Delek Common Stock. Committed but unissued share-based awards were exchanged and converted into rights to receive share-based awards indexed to New Delek Common Stock.
Option and SAR Assumptions
The table below provides the assumptions used in estimating the fair values of our outstanding stock options and SARs under the Incentive Plans. For all awards granted, we calculated volatility using historical volatility and implied volatility of a peer group of public companies using weekly stock prices.
|
2017 Grants
|
2016 Grants
|
2015 Grants
|
||||||||||
|
(Graded Vesting)
|
(Graded Vesting)
|
(Graded Vesting)
|
||||||||||
|
4 years
|
4 years
|
4 years
|
||||||||||
|
Expected volatility
|
47.49%-49.18%
|
|
51.31%-54.12%
|
|
48.94%-52.15%
|
|
||||||
|
Dividend yield
|
2.41%-3.72%
|
|
1.84%-3.72%
|
|
2.01%-2.49%
|
|
||||||
|
Expected term
|
4.37-4.82 years
|
|
4.75-4.87 years
|
|
4.69-4.87 years
|
|
||||||
|
Risk free rate
|
0.60%-2.58%
|
|
0.18%-2.47%
|
|
0.01%-2.50%
|
|
||||||
|
Fair value per share
|
$
|
8.08
|
|
$
|
5.67
|
|
$
|
11.72
|
|
|||
Stock Option and SAR Activity
The following table summarizes the stock option and SAR activity under the Incentive Plans for the years ended
December 31, 2017
,
2016
and
2015
:
|
Number of Options
|
Weighted-Average Strike Price
|
Weighted-Average Contractual Term (in years)
|
Average Intrinsic Value
(in millions) |
||||||||||
|
Options outstanding, December 31, 2014
|
2,696,586
|
|
$
|
25.61
|
|
||||||||
|
Granted
|
953,850
|
|
$
|
34.42
|
|
||||||||
|
Exercised
|
(344,193
|
)
|
$
|
18.89
|
|
||||||||
|
Forfeited
|
(274,100
|
)
|
$
|
31.64
|
|
||||||||
|
Options and SARs outstanding, December 31, 2015
|
3,032,143
|
|
$
|
28.60
|
|
||||||||
|
Granted
|
347,800
|
|
$
|
16.26
|
|
||||||||
|
Exercised
|
(68,510
|
)
|
$
|
14.69
|
|
||||||||
|
Forfeited
|
(743,050
|
)
|
$
|
31.17
|
|
||||||||
|
Options and SARs outstanding, December 31, 2016
|
2,568,383
|
|
$
|
26.56
|
|
||||||||
|
Granted
|
2,460,500
|
|
$
|
25.95
|
|
||||||||
|
Exercised
|
(303,049
|
)
|
$
|
17.04
|
|
||||||||
|
Forfeited
|
(534,827
|
)
|
$
|
28.00
|
|
||||||||
|
Options and SARs outstanding, December 31, 2017
|
4,191,007
|
|
$
|
26.71
|
|
7.9
|
$
|
5.8
|
|
||||
|
Vested options and SARs exercisable, December 31, 2017
|
1,480,182
|
|
$
|
25.44
|
|
5.4
|
$
|
14.1
|
|
||||
F-43
Restricted Stock Units
The Incentive Plans provide for the award of RSUs and PRSUs to certain employees and non-employee directors. RSUs granted to employees vest ratably over three to five years from the date of grant, and RSUs granted to non-employee directors vest quarterly over the year following the date of grant. The grant date fair value of RSUs is determined based on the closing price of Delek's common stock on the grant date. PRSUs initially granted to employees will typically vest in two tranches, the first of which vests on December 31 of the year following the grant date and the second on the subsequent December 31. PRSUs subsequently granted to employees will typically vest at the end of a three calendar year performance period. The number of PRSUs that will ultimately vest is based on the Company's total shareholder return over the performance period. The grant date fair value of PRSUs is determined using a Monte-Carlo simulation model. We record compensation expense for these awards based on the grant date fair value of the award, recognized ratably over the measurement period.
Performance-Based Restricted Stock Unit Assumptions
The table below provides the assumptions used in estimating the fair values of our outstanding PRSUs under the Plan. For all awards granted, we calculated volatility using historical volatility and implied volatility of a peer group of public companies using weekly stock prices.
|
2017 Grants
|
2016 Grants
|
2015 Grants
|
|||||||||
|
Expected volatility
|
44.03%-46.54%
|
|
41.77
|
%
|
37.19%-39.18%
|
|
|||||
|
Expected term
|
2.06-3.06
|
|
2.81
|
|
2.56-2.81
|
|
|||||
|
Risk free rate
|
1.43%-1.93%
|
|
1.08
|
%
|
0.97%-1.02%
|
|
|||||
|
Fair value per share
|
$
|
37.80
|
|
$
|
14.31
|
|
$
|
52.17
|
|
||
The following table summarizes the RSU and PRSU activity under the Incentive Plans for the years ended
December 31, 2017
,
2016
and
2015
:
|
Number of RSUs
|
Weighted-Average Grant Date Price
|
||||||
|
Balance
|
December 31, 2014
|
416,999
|
|
$
|
23.19
|
|
|
|
Granted
|
192,679
|
|
$
|
41.23
|
|
||
|
Vested
|
(221,687
|
)
|
$
|
20.61
|
|
||
|
Forfeited
|
(3,424
|
)
|
$
|
36.53
|
|
||
|
Balance
|
December 31, 2015
|
384,567
|
|
$
|
33.60
|
|
|
|
Granted
|
858,296
|
|
$
|
12.94
|
|
||
|
Vested
|
(246,657
|
)
|
$
|
21.17
|
|
||
|
Forfeited
|
(114,393
|
)
|
$
|
17.23
|
|
||
|
Balance
|
December 31, 2016
|
881,813
|
|
$
|
19.08
|
|
|
|
Granted
|
614,035
|
|
$
|
31.56
|
|
||
|
Vested
|
(351,713
|
)
|
$
|
21.95
|
|
||
|
Forfeited
|
(78,676
|
)
|
$
|
13.44
|
|
||
|
Performance Not Achieved
|
(5,789
|
)
|
$
|
38.03
|
|
||
|
Balance
|
December 31, 2017
|
1,059,670
|
|
$
|
25.68
|
|
|
Compensation Expense Related to Equity-based Awards Granted Under the Incentive Plans
Compensation expense for Delek equity-based awards amounted to
$15.9 million
(
$10.3 million
, net of taxes),
$14.6 million
(
$9.5 million
, net of taxes) and
$14.7 million
(
$9.6 million
, net of taxes) for the years ended
December 31, 2017
,
2016
and
2015
, respectively. These amounts, excluding amounts related to discontinued operations of
$1.1 million
and
$1.6 million
, for December 31, 2016 and 2015, respectively, are included in general and administrative expenses in the accompanying consolidated statements of income. We recognized income tax benefits for equity-based awards of
$1.4 million
and
$1.3 million
for the years ended
December 31, 2017
and
2015
, respectively, versus income tax expense for equity-based awards of
$2.9 million
for the year ended
December 31, 2016
.
As of
December 31, 2017
, there was
$36.4 million
of total unrecognized compensation cost related to non-vested share-based compensation arrangements, which is expected to be recognized over a weighted-average period of
2.3
years.
F-44
The aggregate intrinsic value, which represents the difference between the underlying stock's market price and the award's exercise price, of the share-based awards exercised or vested during the years ended
December 31, 2017
,
2016
and
2015
was
$12.2 million
,
$4.8 million
and
$13.3 million
, respectively. During the years
December 31, 2017
,
2016
and
2015
, respectively, we issued
332,156
,
203,631
and
309,196
shares of common stock as a result of exercised or vested equity-based awards. These amounts are net of
306,659
,
111,536
and
256,684
shares, respectively, withheld to satisfy employee tax obligations related to the exercises and vestings for the years ended
December 31, 2017
,
2016
and
2015
. Delek paid approximately
$5.0 million
,
$1.5 million
and
$4.4 million
of taxes in connection with the settlement of these awards for the years ended
December 31, 2017
,
2016
and
2015
. We issue new shares of common stock upon exercise or vesting of share-based awards.
Delek Logistics GP, LLC 2012 Long-Term Incentive Plan
Logistics GP maintains a unit-based compensation plan for officers, directors and employees of Logistics GP or its affiliates and certain consultants, affiliates of Logistics GP or other individuals who perform services for Delek Logistics. The Delek Logistics GP, LLC 2012 Long-Term Incentive Plan ("Logistics LTIP") permits the grant of unit options, restricted units, phantom units, unit appreciation rights, distribution equivalent rights, other unit-based awards, and unit awards. The Logistics LTIP limits the number of units that may be delivered pursuant to vested awards to 612,207 common units, subject to proportionate adjustment in the event of unit splits and similar events. Awards granted under the Logistics LTIP will be settled with Delek Logistics units. Compensation expense for awards granted under the Logistics LTIP was
$1.7 million
(
$1.1 million
, net of taxes),
$1.7 million
(
$1.1 million
, net of taxes) and
$1.9 million
(
$1.2 million
, net of taxes) for the years ended
December 31, 2017
,
2016
and
2015
, respectively. These amounts are included in general and administrative expenses in the accompanying consolidated statements of income. As of
December 31, 2017
, there was
$0.4 million
of total unrecognized compensation cost related to non-vested Logistics LTIP awards, which is expected to be recognized over a weighted-average period of
3.4
years.
Alon USA Partners, LP 2012 Long-Term Incentive Plan
Non-employee directors of the Alon Partnership, who are designated by Alon’s directors, are awarded an annual grant of
$25,000
in restricted common units, which vest over a period of three years, assuming continued service at vesting. Compensation expense for the Alon Partnership restricted units amounted to a
nominal
amount for the year ended
December 31, 2017
. These amounts are included in general and administrative expenses in the accompanying consolidated statements of income. As of
December 31, 2017
, there was
$0.1 million
of total unrecognized compensation cost related to non-vested share-based compensation arrangements, which is expected to be recognized over a weighted-average period of
1.1
years.
15
. Segment Data
Prior to August 2016, we aggregated our operating segments into three reportable segments: refining, logistics and retail. However, in August 2016, Delek entered into the Purchase Agreement to sell the Retail Entities, which consisted of all of the retail segment at that time and a portion of the corporate, other and eliminations segment, to COPEC. As a result of the Purchase Agreement, we met the requirements of ASC 205-20
and ASC 360 to report the results of the Retail Entities as discontinued operations and to classify the Retail Entities as a group of assets held for sale. The Retail Entities were sold in November 2016. The operating results for the Retail Entities, in all periods up until and including the date of the sale, were reclassified to discontinued operations and are no longer reported as part of Delek's retail segment.
Effective with the Delek/Alon Merger July 1, 2017 (see Note
3
), Delek's retail segment now includes the operations of Alon's approximately 300 owned and leased convenience store sites located primarily in central and west Texas and New Mexico. These convenience stores typically offer various grades of gasoline and diesel under the Alon brand name and food products, food service, tobacco products, non-alcoholic and alcoholic beverages, general merchandise as well as money orders to the public, primarily under the 7-Eleven and Alon brand names. Substantially all of the motor fuel sold through our retail segment is supplied by our Big Spring refinery (which is owned by the Alon Partnership), which is transferred to the retail segment at prices substantially determined by reference to published commodity pricing information.
Our corporate activities, results of certain immaterial operating segments, including Alon's asphalt terminal operations effective with the Delek/Alon Merger, our equity method investment in Alon prior to the Delek/Alon Merger, as well as discontinued operations and intercompany eliminations are reported in the corporate, other and eliminations segment.
Decisions concerning the allocation of resources and assessment of operating performance are made based on this segmentation. Management measures the operating performance of each of the reportable segments based on the segment contribution margin. Segment contribution margin is defined as net sales less cost of sales and operating expenses, excluding depreciation and amortization. Operations which are not specifically included in the reportable segments are included in the corporate and other category, which primarily consists of operating expenses, depreciation and amortization expense and interest income and expense associated with our discontinued operations and with our corporate headquarters.
The refining segment processes crude oil and other purchased feedstocks for the manufacture of transportation motor fuels, including various grades of gasoline, diesel fuel, aviation fuel, asphalt and other petroleum-based products that are distributed through owned and third-party product terminals. Prior to the Delek/Alon Merger, the refining segment had a combined nameplate capacity of
155,000
bpd, including the
75,000
bpd Tyler refinery and the
80,000
bpd El Dorado refinery. The refining segment also owns and operates two biodiesel facilities involved in the production of biodiesel fuels and related activities. Effective with the Delek/Alon Merger, our refining segment now also includes the operations of a sour crude oil refinery located in Big Spring, Texas with a nameplate capacity of
73,000
bpd, a light sweet crude oil refinery located in Krotz Springs, Louisiana with a nameplate capacity of
74,000
bpd, and a heavy crude oil refinery located in Bakersfield, California. The Bakersfield, California refinery has not processed crude oil since 2012 due to the high cost of crude oil relative to product yield and low asphalt demand. Alon's petroleum-based products are marketed primarily in the South Central, Southwestern and Western regions of the United States and also ships and sells gasoline into wholesale markets in the Southern and Eastern United States. Motor fuels are sold under the Alon brand through various terminals to supply Alon branded retail sites, including our retail segment convenience stores. In addition, Alon sells motor fuels through its wholesale distribution network on an unbranded basis.
Our refining segment has a services agreement with our logistics segment, which, among other things, requires the refining segment to pay service fees based on the number of gallons sold at the Tyler refinery and a sharing of a portion of the margin achieved in return for providing marketing, sales and customer services. This intercompany transaction fee was
$20.4 million
,
$16.9 million
and
$15.2 million
during the years ended
December 31, 2017
,
2016
and
2015
, respectively. Additionally, the refining segment pays crude transportation, terminalling and storage fees to the logistics segment for the utilization of certain pipeline, terminal and storage assets. These fees were
$129.6 million
,
$123.2 million
and
$121.6 million
during the years ended
December 31, 2017
,
2016
and
2015
, respectively. The logistics segment also sold
$5.6 million
,
$6.7 million
and
$5.8 million
of RINs to the refining segment during the year ended
December 31, 2017
,
2016
and
2015
, respectively. The refining segment recorded sales and fee revenues of
$256.1 million
, consisting of
$186.8 million
from the retail segment,
$57.5 million
from the logistics segment and
$11.8 million
from sales of asphalt to our other segment during the year ended
December 31, 2017
, and recorded sales and fee revenues from the logistics segment and the Retail Entities, the operations of which are included in discontinued operations, in the amount of
$318.1 million
F-45
and
$619.4 million
during the years ended
2016
and
2015
, respectively. Refined products purchased from Alon by the logistics segment subsequent to the Delek/Alon Merger totaled
$2.6 million
during the year ended ended
December 31, 2017
. Also subsequent to the Delek/Alon Merger, the logistics segment sold refined products of
$0.2 million
during the year ended ended
December 31, 2017
to Alon. All inter-segment transactions have been eliminated in consolidation.
Our logistics segment owns and operates crude oil and refined products logistics and marketing assets. The logistics segment generates revenue by charging fees for gathering, transporting and storing crude oil and for marketing, distributing, transporting and storing intermediate and refined products and sales of wholesale product in the west Texas market.
Delek's other category in the following tables, subsequent to the Delek/Alon Merger, includes our Paramount, California and Long Beach, California heavy crude oil refineries, which have not processed crude oil since 2012, and a controlling interest in a renewable fuels facility in California, which has a throughput capacity of
3,000
bpd and converts tallow and vegetable oils into renewable fuels. The produced renewable fuels are drop-in replacements for petroleum-based fuels. The renewable fuels facility generates both state and federal environmental credits as well as the federal blender’s tax credit, when effective. See
Note 25
for further information regarding the extension of this tax credit. The renewable fuels facility is inside the Paramount refinery and utilizes the refinery’s infrastructure, including electrical and other utility systems, tanks, and product blending and loading facilities. As a result of Delek management's committing to a plan to sell the assets and operations associated with the California Discontinued Entities, we met the requirements under ASC 205-20 and ASC 360 to report the results of those operations as discontinued operations and to classify the applicable assets as a group of assets held for sale.
F-46
The following is a summary of business segment operating performance as measured by contribution margin for the period indicated (in millions):
|
|
As of and For the Year Ended December 31, 2017
|
|||||||||||||||||||
|
(In millions)
|
Refining
|
Retail
|
Logistics
|
Corporate,
Other and Eliminations |
Consolidated
|
|||||||||||||||
|
Net sales (excluding intercompany fees and sales)
|
$
|
6,364.5
|
|
$
|
426.7
|
|
$
|
382.3
|
|
$
|
93.6
|
|
$
|
7,267.1
|
|
|||||
|
Intercompany fees and sales
|
256.1
|
|
—
|
|
155.8
|
|
(411.9
|
)
|
—
|
|
||||||||||
|
Operating costs and expenses:
|
|
|
|
|
|
|||||||||||||||
|
Cost of goods sold
|
5,852.2
|
|
350.3
|
|
372.9
|
|
(247.8
|
)
|
6,327.6
|
|
||||||||||
|
Operating expenses
|
317.7
|
|
49.6
|
|
43.3
|
|
18.4
|
|
429.0
|
|
||||||||||
|
Segment contribution margin
|
$
|
450.7
|
|
$
|
26.8
|
|
$
|
121.9
|
|
$
|
(88.9
|
)
|
510.5
|
|
||||||
|
General and administrative expenses
|
|
|
|
|
169.8
|
|
||||||||||||||
|
Depreciation and amortization
|
|
|
|
|
153.3
|
|
||||||||||||||
|
Other operating expense
|
|
|
|
|
1.0
|
|
||||||||||||||
|
Operating loss
|
|
|
|
|
$
|
186.4
|
|
|||||||||||||
|
Total assets
(2)
|
$
|
4,846.5
|
|
$
|
331.4
|
|
$
|
443.5
|
|
$
|
313.8
|
|
$
|
5,935.2
|
|
|||||
|
Capital spending (excluding business combinations)
(3)
|
$
|
128.2
|
|
$
|
11.7
|
|
$
|
18.4
|
|
$
|
19.2
|
|
$
|
177.5
|
|
|||||
|
|
As of and For the Year Ended December 31, 2016
|
|||||||||||||||
|
(In millions)
|
Refining
|
Logistics
|
Corporate,
Other and Eliminations |
Consolidated
|
||||||||||||
|
Net sales (excluding intercompany fees and sales)
|
$
|
3,605.1
|
|
$
|
301.3
|
|
$
|
(0.6
|
)
|
$
|
3,905.8
|
|
||||
|
Intercompany fees and sales
(1)
|
318.1
|
|
146.8
|
|
(172.8
|
)
|
292.1
|
|
||||||||
|
Operating costs and expenses:
|
|
|
|
|
||||||||||||
|
Cost of goods sold
|
3,614.1
|
|
302.2
|
|
(103.4
|
)
|
3,812.9
|
|
||||||||
|
Operating expenses
|
212.4
|
|
37.2
|
|
(0.3
|
)
|
249.3
|
|
||||||||
|
Insurance proceeds - business interruption
|
(42.4
|
)
|
—
|
|
—
|
|
(42.4
|
)
|
||||||||
|
Segment contribution margin
|
$
|
139.1
|
|
$
|
108.7
|
|
$
|
(69.7
|
)
|
178.1
|
|
|||||
|
General and administrative expenses
|
|
|
|
106.1
|
|
|||||||||||
|
Depreciation and amortization
|
|
|
|
116.4
|
|
|||||||||||
|
Other operating income
|
|
|
|
4.8
|
|
|||||||||||
|
Operating income
|
|
|
|
$
|
(49.2
|
)
|
||||||||||
|
Total assets
|
$
|
1,942.6
|
|
$
|
415.5
|
|
$
|
621.7
|
|
$
|
2,979.8
|
|
||||
|
Capital spending (excluding business combinations)
(3)
|
$
|
27.9
|
|
$
|
11.8
|
|
$
|
6.6
|
|
$
|
46.3
|
|
||||
F-47
|
|
As of and For the Year Ended December 31, 2015
|
|||||||||||||||
|
(In millions)
|
Refining
|
Logistics
|
Corporate,
Other and Eliminations |
Consolidated
|
||||||||||||
|
Net sales (excluding intercompany fees and sales)
|
$
|
3,820.8
|
|
$
|
447.0
|
|
$
|
2.7
|
|
$
|
4,270.5
|
|
||||
|
Intercompany fees and sales
(1)
|
619.4
|
|
142.7
|
|
(250.6
|
)
|
511.5
|
|
||||||||
|
Operating costs and expenses:
|
|
|
|
|
||||||||||||
|
Cost of goods sold
|
4,022.2
|
|
436.3
|
|
(221.6
|
)
|
4,236.9
|
|
||||||||
|
Operating expenses
|
225.4
|
|
44.9
|
|
—
|
|
270.3
|
|
||||||||
|
Segment contribution margin
|
$
|
192.6
|
|
$
|
108.5
|
|
$
|
(26.3
|
)
|
274.8
|
|
|||||
|
General and administrative expenses
|
|
|
|
100.6
|
|
|||||||||||
|
Depreciation and amortization
|
|
|
|
106.0
|
|
|||||||||||
|
Other operating expense, net
|
|
|
|
(0.5
|
)
|
|||||||||||
|
Operating income
|
|
|
|
$
|
68.7
|
|
||||||||||
|
Capital spending (excluding business combinations)
(3)
|
$
|
164.5
|
|
$
|
18.6
|
|
$
|
7.9
|
|
$
|
191.0
|
|
||||
|
(1)
|
Intercompany fees and sales for the refining segment include revenues from the Retail Entities of
$292.1 million
and
$511.5 million
during the years ended December 31, 2016 and 2015, respectively, the operations of which are reported in discontinued operations.
|
|
(2)
|
Assets held for sale of
$160.0 million
are included in the corporate, other and eliminations segment as of
December 31, 2017
.
|
|
(3)
|
Capital spending excludes capital spending associated with the California Discontinued Entities of
$2.6 million
during the year ended
December 31, 2017
. Capital spending excludes capital spending associated with the Retail Entities of
$14.4 million
and
$27.6 million
during the years ended December 31, 2016 and 2015, respectively.
|
16
. Fair Value Measurements
The fair values of financial instruments are estimated based upon current market conditions and quoted market prices for the same or similar instruments. Management estimates that the carrying value approximates fair value for all of Delek’s assets and liabilities that fall under the scope of ASC 825.
Delek applies the provisions of ASC 820, which defines fair value, establishes a framework for its measurement and expands disclosures about fair value measurements. ASC 820 applies to our commodity and interest rate derivatives that are measured at fair value on a recurring basis. The standard also requires that we assess the impact of nonperformance risk on our derivatives. Nonperformance risk is not considered material to our financial statements at this time.
ASC 820 requires disclosures that categorize assets and liabilities measured at fair value into one of three different levels depending on the observability of the inputs employed in the measurement. Level 1 inputs are quoted prices in active markets for identical assets or liabilities. Level 2 inputs are observable inputs other than quoted prices included within Level 1 for the asset or liability, either directly or indirectly through market-corroborated inputs. Level 3 inputs are unobservable inputs for the asset or liability reflecting our assumptions about pricing by market participants.
OTC commodity swaps, physical commodity purchase and sale contracts and interest rate swaps and caps are generally valued using industry-standard models that consider various assumptions, including quoted forward prices, spot prices, interest rates, time value, volatility factors and contractual prices for the underlying instruments, as well as other relevant economic measures. The degree to which these inputs are observable in the forward markets determines the classification as Level 2 or 3. Our contracts are valued based on exchange pricing and/or price index developers such as Platts or Argus and are, therefore, classified as Level 2.
Our RINs Obligation surplus or deficit is based on the amount of RINs we must purchase, net of amounts internally generated and purchased and the price of those RINs as of the balance sheet date. The RINs Obligation surplus or deficit is categorized as Level 2, and is measured at fair value based on quoted prices from an independent pricing service.
On March 1, 2017, the El Dorado refinery received approval from the EPA for a small refinery exemption from the requirements of the renewable fuel standard for the 2016 calendar year. This waiver resulted in a reduction of our RINs Obligation and related cost of goods sold of approximately
$47.5 million
for the
year ended
December 31, 2017
.
F-48
Our RIN commitment contracts are future commitments to purchase or sell RINs at fixed prices and quantities, which are used to manage the costs associated with our RINs Obligation. These RIN commitment contracts are categorized as Level 2, and are measured at fair value based on quoted prices from an independent pricing service.
We have elected to account for our J. Aron step-out liability at fair value in accordance with ASC 825, as it pertains to the fair value option. This standard permits the election to carry financial instruments and certain other items similar to financial instruments at fair value on the balance sheet, with all changes in fair value reported in earnings. Our J. Aron step-out liability is categorized as Level 2, and is measured at fair value using market prices for the consigned crude oil and refined products we are required to repurchase from J. Aron at the end of the term of the Supply and Offtake Agreement. The J. Aron step-out liability is presented in the Obligation under Supply and Offtake Agreement line item of the our condensed consolidated balance sheet as of
December 31, 2017
. The
December 31, 2016
balance in Obligation under Supply and Offtake Agreement includes the J. Aron step-out liability, net of a
$20.2 million
holdback deposit, which is not eligible for the fair value option. Such deposit was classified as current and presented as an offset to the current liability because the contract had not been renewed as of that date.
The fair value hierarchy for our financial assets and liabilities accounted for at fair value on a recurring basis at
December 31, 2017
and
2016
, was as follows (in millions):
|
|
As of December 31, 2017
|
|||||||||||||||
|
|
Level 1
|
Level 2
|
Level 3
|
Total
|
||||||||||||
|
Assets
|
|
|
|
|
||||||||||||
|
OTC commodity swaps
|
$
|
—
|
|
$
|
178.0
|
|
$
|
—
|
|
$
|
178.0
|
|
||||
|
RIN commitment contracts
|
—
|
|
1.4
|
|
—
|
|
1.4
|
|
||||||||
|
RINs Obligation surplus
|
—
|
|
1.1
|
|
—
|
|
1.1
|
|
||||||||
|
Total assets
|
—
|
|
180.5
|
|
—
|
|
180.5
|
|
||||||||
|
Liabilities
|
|
|
|
|
||||||||||||
|
Interest rate derivatives
|
—
|
|
(0.9
|
)
|
—
|
|
(0.9
|
)
|
||||||||
|
OTC commodity swaps
|
—
|
|
(203.9
|
)
|
—
|
|
(203.9
|
)
|
||||||||
|
RIN commitment contracts
|
—
|
|
(24.0
|
)
|
—
|
|
(24.0
|
)
|
||||||||
|
RINs Obligation deficit
|
—
|
|
(130.8
|
)
|
—
|
|
(130.8
|
)
|
||||||||
|
J. Aron step-out liability
|
—
|
|
(435.6
|
)
|
—
|
|
(435.6
|
)
|
||||||||
|
Total liabilities
|
—
|
|
(795.2
|
)
|
—
|
|
(795.2
|
)
|
||||||||
|
Net liabilities
|
$
|
—
|
|
$
|
(614.7
|
)
|
$
|
—
|
|
$
|
(614.7
|
)
|
||||
|
|
As of December 31, 2016
|
|||||||||||||||
|
|
Level 1
|
Level 2
|
Level 3
|
Total
|
||||||||||||
|
Assets
|
||||||||||||||||
|
OTC commodity swaps
|
$
|
—
|
|
$
|
53.1
|
|
$
|
—
|
|
$
|
53.1
|
|
||||
|
RINs Obligation surplus
|
—
|
|
4.9
|
|
—
|
|
4.9
|
|
||||||||
|
Total assets
|
—
|
|
58.0
|
|
—
|
|
58.0
|
|
||||||||
|
Liabilities
|
|
|
|
|
||||||||||||
|
OTC commodity swaps
|
—
|
|
(103.6
|
)
|
—
|
|
(103.6
|
)
|
||||||||
|
RIN commitment contracts
|
—
|
|
(0.8
|
)
|
—
|
|
(0.8
|
)
|
||||||||
|
RINs Obligation deficit
|
—
|
|
(25.6
|
)
|
—
|
|
(25.6
|
)
|
||||||||
|
J. Aron step-out liability
|
—
|
|
(144.8
|
)
|
—
|
|
(144.8
|
)
|
||||||||
|
Total liabilities
|
—
|
|
(274.8
|
)
|
—
|
|
(274.8
|
)
|
||||||||
|
Net liabilities
|
$
|
—
|
|
$
|
(216.8
|
)
|
$
|
—
|
|
$
|
(216.8
|
)
|
||||
The derivative values above are based on analysis of each contract as the fundamental unit of account as required by ASC 820. In the table above, derivative assets and liabilities with the same counterparty are not netted where the legal right of offset exists. This differs from the presentation in the financial statements which reflects our policy, wherein we have elected to offset the fair value amounts recognized for multiple derivative instruments executed with the same counterparty and where the legal right of offset exists. As of
December 31, 2017
and
2016
,
$10 million
and
F-49
$14.7 million
, respectively, of cash collateral was held by counterparty brokerage firms and has been netted with the net derivative positions with each counterparty. See Note
17
for further information regarding derivative instruments.
17
. Derivative Instruments
We use derivatives to reduce normal operating and market risks with the primary objective of reducing the impact of market price volatility on our results of operations. As such, our use of derivative contracts is aimed at:
|
•
|
limiting the exposure to price fluctuations of commodity inventory above or below target levels at each of our segments;
|
|
•
|
managing our exposure to commodity price risk associated with the purchase or sale of crude oil, feedstocks and finished grade fuel products at each of our segments;
|
|
•
|
manage the cost of our RINs Obligation using future commitments to purchase or sell RINs at fixed prices and quantities; and
|
|
•
|
limiting the exposure to interest rate fluctuations on our floating rate borrowings.
|
We primarily utilize OTC commodity swaps, generally with maturity dates of three years or less, and interest rate swap and cap agreements to achieve these objectives. OTC commodity swap contracts require cash settlement for the commodity based on the difference between a fixed or floating price and the market price on the settlement date. Interest rate swap and cap agreements economically hedge floating rate debt by exchanging interest rate cash flows, based on a notional amount from a floating rate to a fixed rate. Effective with the Delek/Alon Merger, we have interest rate swap agreements, maturing March 2019, that effectively fix the variable LIBOR interest component of the term loans within the Alon Retail Credit Agreement. The aggregate notional amount under these agreements covers approximately
77.2%
of the outstanding principal of these term loans throughout the duration of the interest rate swaps. See Note
12
for further information. At this time, we do not believe there is any material credit risk with respect to the counterparties to these contracts.
From time to time, we also enter into future commitments to purchase or sell RINs at fixed prices and quantities, which are used to manage the costs associated with our RINs Obligation. These future RIN commitment contracts meet the definition of derivative instruments under ASC 815, and are recorded at estimated fair value in accordance with the provisions of ASC 815. Changes in the fair value of these future RIN commitment contracts are recorded in cost of goods sold on the consolidated statements of income.
In accordance with ASC 815, certain of our OTC commodity swap contracts and our interest rate agreements have been designated as cash flow hedges and the effective portion of the change in fair value between the execution date and the end of period has been recorded in other comprehensive income. The effective portion of the fair value of these contracts is recognized in income at the time the positions are closed and the hedged transactions are recognized in income.
From time to time, we also enter into futures contracts with supply vendors that secure supply of product to be purchased for use in the normal course of business at our refining segment. These contracts are priced based on an index that is clearly and closely related to the product being purchased, contain no net settlement provisions and typically qualify under the normal purchase exemption from derivative accounting treatment under ASC 815.
The following table presents the fair value of our derivative instruments as of
December 31, 2017
and
2016
. The fair value amounts below are presented on a gross basis and do not reflect the netting of asset and liability positions permitted under our master netting arrangements, including cash collateral on deposit with our counterparties. We have elected to offset the recognized fair value amounts for multiple derivative instruments executed with the same counterparty in our financial statements. As a result, the asset and liability amounts below differ from the amounts presented in our consolidated balance sheets. See Note
16
for further information regarding the fair value of derivative instruments (in millions):
|
December 31, 2017
|
December 31, 2016
|
||||||||||||||||
|
Derivative Type
|
Balance Sheet Location
|
Assets
|
Liabilities
|
Assets
|
Liabilities
|
||||||||||||
|
Derivatives not designated as hedging instruments:
|
|||||||||||||||||
|
OTC commodity swaps
(1)
|
Other current assets
|
$
|
164.6
|
|
$
|
(162.0
|
)
|
$
|
37.4
|
|
$
|
(30.6
|
)
|
||||
|
OTC commodity swaps
(1)
|
Other current liabilities
|
13.4
|
|
(28.3
|
)
|
14.4
|
|
(35.2
|
)
|
||||||||
|
RIN commitment contracts
(2)
|
Other current assets
|
1.4
|
|
—
|
|
—
|
|
—
|
|
||||||||
|
RIN commitment contracts
(2)
|
Other current liabilities
|
—
|
|
(24.0
|
)
|
—
|
|
(0.8
|
)
|
||||||||
|
Derivatives designated as hedging instruments:
|
|||||||||||||||||
|
OTC commodity swaps
(1)
|
Other current assets
|
—
|
|
—
|
|
0.1
|
|
(2.5
|
)
|
||||||||
|
OTC commodity swaps
(1)
|
Other current liabilities
|
—
|
|
(13.6
|
)
|
1.2
|
|
(18.0
|
)
|
||||||||
|
OTC commodity swaps
(1)
|
Other long-term assets
|
—
|
|
—
|
|
—
|
|
—
|
|
||||||||
|
OTC commodity swaps
(1)
|
Other long-term liabilities
|
—
|
|
—
|
|
—
|
|
(17.3
|
)
|
||||||||
|
Interest rate derivatives
|
Other long-term liabilities
|
—
|
|
(0.9
|
)
|
—
|
|
—
|
|
||||||||
|
Total gross fair value of derivatives
|
179.4
|
|
(228.8
|
)
|
53.1
|
|
(104.4
|
)
|
|||||||||
|
Less: Counterparty netting and cash collateral
(3)
|
163.5
|
|
(173.6
|
)
|
46.3
|
|
(61.0
|
)
|
|||||||||
|
Total net fair value of derivatives
|
$
|
15.9
|
|
$
|
(55.2
|
)
|
$
|
6.8
|
|
$
|
(43.4
|
)
|
|||||
|
(1)
|
As of
December 31, 2017
and
2016
, we had open derivative positions representing
35,978,000
and
9,348,000
barrels, respectively, of crude oil and refined petroleum products. Of these open positions, contracts representing
575,000
and
3,392,000
barrels were designated as cash flow hedging instruments as of
December 31, 2017
and
2016
, respectively.
|
|
(2)
|
As of
December 31, 2017
and
2016
, we had open RIN commitment contracts representing
163,361,320
and
36,750,000
RINs, respectively.
|
|
(3)
|
As of
December 31, 2017
and
2016
,
$10.0 million
and
$14.7 million
, respectively, of cash collateral held by counterparties has been netted with the derivatives with each counterparty.
|
Total losses on our commodity derivatives and RIN commitment contracts recorded in cost of goods sold on the consolidated statements of income are as follows (in millions):
|
Year Ended December 31,
|
||||||||||||
|
2017
|
2016
|
2015
|
||||||||||
|
(Losses) gains on derivatives not designated as hedging instruments
|
$
|
(33.1
|
)
|
$
|
(21.7
|
)
|
$
|
10.6
|
|
|||
|
Realized (losses) gains reclassified out of OCI on commodity derivatives designated as cash flow hedging instruments
|
(38.6
|
)
|
(27.8
|
)
|
0.7
|
|
||||||
|
Gains (losses) recognized on commodity derivatives due to cash flow hedging ineffectiveness
|
0.5
|
|
3.1
|
|
(21.5
|
)
|
||||||
|
Total
|
$
|
(71.2
|
)
|
$
|
(46.4
|
)
|
$
|
(10.2
|
)
|
|||
For cash flow hedges,
no
component of the derivative instruments’ gains or losses was excluded from the assessment of hedge effectiveness for the years ended
December 31, 2017
,
2016
and
2015
. At
December 31, 2017
and
2016
, gains (losses) of
$7.6 million
and
$(16.2) million
, respectively, on cash flow hedges, net of tax, primarily related to future purchases of crude oil and the associated sale of finished grade fuel, remained in accumulated other comprehensive income. (Losses) gains of
$(25.1) million
,
$(18.1) million
and
$0.5 million
, net of tax, on settled commodity contracts were reclassified into cost of goods sold in the consolidated statements of income during the years ended
December 31, 2017
,
2016
and
2015
, respectively. We estimate that
$11.7 million
of deferred losses related to commodity cash flow hedges will be reclassified into cost of goods sold over the next 12 months as a result of hedged transactions that are forecasted to occur. As of
December 31, 2017
, gains of
$0.6 million
, net of tax, related to the interest rate cash flow hedges, remained in accumulated other comprehensive income. We estimate that
$0.3 million
of deferred gains related to interest rate cash flow hedges will be reclassified into interest expense over the next 12 months as a result of hedged transactions that are forecasted to occur. Related to our interest rate swap cash flow hedges, we recognized
$0.3 million
in interest expense on the consolidated statements of income, and there was no cash flow hedge ineffectiveness for the year ended
December 31, 2017
. All Delek interest rate swaps are currently designated as cash flow hedging instruments. For the years ended
December 31, 2017
,
2016
and
2015
, there were
no
amounts reclassified from accumulated other comprehensive income into income as a result of the discontinuation of cash flow hedge accounting.
F-50
18
. Income Taxes
Deferred income taxes reflect the net tax effects of temporary differences between the carrying amounts of assets and liabilities for financial reporting purposes and the amounts used for income tax purposes.
The Tax Cuts and Jobs Act was enacted on December 22, 2017. The Act reduces the US federal corporate tax rate from 35% to 21%. At December 31, 2017, we have made a reasonable estimate of the effects on our existing deferred tax balances, and recognized a provisional benefit of
$166.9 million
which is included as a component of income tax benefit from continuing operations. We remeasured certain deferred tax assets and liabilities based on the rates at which they are expected to reverse in the future, which is generally 21% for federal income taxes purposes. However, we are still analyzing certain aspects of the Act and refining our calculations, which could potentially affect the measurement of these balances.
Significant components of Delek's deferred tax assets (liabilities) reported in the accompanying consolidated financial statements as of
December 31, 2017
and
2016
were as follows (in millions):
|
December 31,
|
|||||||
|
2017
|
2016
|
||||||
|
Non-Current Deferred Taxes:
|
|||||||
|
Property, plant and equipment, and intangibles
|
$
|
(180.9
|
)
|
$
|
(214.2
|
)
|
|
|
Partnership and equity investments
|
(83.7
|
)
|
105.0
|
|
|||
|
Deferred revenues
|
(6.5
|
)
|
(8.4
|
)
|
|||
|
Derivatives and hedging
|
4.8
|
|
18.8
|
|
|||
|
Compensation and employee benefits
|
15.9
|
|
9.8
|
|
|||
|
Net operating loss carryforwards
|
26.5
|
|
5.3
|
|
|||
|
Reserves and accruals
|
40.8
|
|
7.1
|
|
|||
|
Inventories
|
4.4
|
|
7.7
|
|
|||
|
Other
|
—
|
|
—
|
|
|||
|
Valuation allowance
|
(21.2
|
)
|
(7.3
|
)
|
|||
|
Total net deferred tax liabilities
|
$
|
(199.9
|
)
|
$
|
(76.2
|
)
|
|
The difference between the actual income tax expense and the tax expense computed by applying the statutory federal income tax rate to income from continuing operations was attributable to the following (in millions):
|
Year Ended December 31,
|
|||||||||||
|
2017
|
2016
|
2015
|
|||||||||
|
Provision (benefit) for federal income taxes at statutory rate
|
$
|
104.7
|
|
$
|
(137.0
|
)
|
$
|
7.5
|
|
||
|
State income tax expense (benefit), net of federal tax provision
|
4.9
|
|
(10.2
|
)
|
2.4
|
|
|||||
|
Income tax (benefit) expense attributable to non-controlling interest
|
(12.0
|
)
|
(7.1
|
)
|
(8.4
|
)
|
|||||
|
Tax credits and incentives
|
(1.6
|
)
|
(9.7
|
)
|
(10.7
|
)
|
|||||
|
Dividends received deduction
|
(2.8
|
)
|
(5.7
|
)
|
(4.2
|
)
|
|||||
|
Executive compensation limitation
|
1.5
|
|
0.3
|
|
1.0
|
|
|||||
|
Amortization - prepaid taxes
|
(2.4
|
)
|
(3.5
|
)
|
(4.1
|
)
|
|||||
|
Reversal of deferred taxes related to equity method investment in Alon
|
45.3
|
|
—
|
|
—
|
|
|||||
|
Impact of Tax Cuts and Jobs Act
|
(166.9
|
)
|
—
|
|
—
|
|
|||||
|
Other items
|
0.1
|
|
1.4
|
|
0.7
|
|
|||||
|
Income tax benefit
|
$
|
(29.2
|
)
|
$
|
(171.5
|
)
|
$
|
(15.8
|
)
|
||
Tax credits and incentives include work opportunity, research and development, E-85 and blocked pump tax credits, as well as incentives for the Company’s ethanol and biodiesel blending operations.
F-51
Income tax expense (benefit) from continuing operations was as follows (in millions):
|
Year Ended December 31,
|
|||||||||||
|
2017
|
2016
|
2015
|
|||||||||
|
Current
|
$
|
18.8
|
|
$
|
(18.3
|
)
|
$
|
(34.8
|
)
|
||
|
Deferred
|
(48.0
|
)
|
(153.2
|
)
|
19.0
|
|
|||||
|
$
|
(29.2
|
)
|
$
|
(171.5
|
)
|
$
|
(15.8
|
)
|
|||
Deferred income tax expense above was reflective of the changes in deferred tax assets and liabilities during the current period.
We carry valuation allowances against certain state deferred tax assets and net operating losses that may not be recoverable with future taxable income. During the years ended
December 31, 2017
and
2016
, we recorded increases to the valuation allowance related to continuing operations of
$13.9 million
and
$2.8 million
, respectively. The increase in 2017 was primarily to record a valuation allowance for certain state net operating losses of Alon USA Energy, Inc. and subsidiaries.
In assessing the realizability of deferred tax assets, management considers whether it is more likely than not that some portion or all of the deferred tax assets will be realized. The ultimate realization of deferred tax assets is dependent upon the generation of future taxable income during the periods in which those temporary differences become deductible. Management considers the scheduled reversal of deferred tax liabilities, projected future taxable income, and tax planning strategies in making this assessment. Based upon the level of historical taxable income and projections for future taxable income over the periods for which the deferred tax assets are deductible, management believes it is more likely than not Delek will realize the benefits of these deductible differences, net of the existing valuation allowance. The amount of the deferred tax assets considered realizable, however, could be reduced in the near term if estimates of future taxable income during the carryforward period are reduced. Subsequently recognized tax benefit or expense relating to the valuation allowance for deferred tax assets will be reported as an income tax benefit or expense in the consolidated statement of income.
State net operating loss carryforwards at
December 31, 2017
totaled
$615.5 million
, a portion of which was subject to a valuation allowance. State net operating losses will begin expiring in
2019 through 2037
.
Delek files a consolidated U.S. federal income tax return, as well as income tax returns in various state jurisdictions. Delek is no longer subject to U.S. federal income tax examinations by tax authorities for years through 2013. The Internal Revenue Service has examined Delek's income tax returns through the tax year ended 2013. In addition, the Company's federal tax returns for the tax years ended December 31, 2014 are currently subject to Joint Committee on Taxation review. The Company is under audit in the state of Texas for the years ended December 31, 2011 through December 31, 2014. No material adjustments have been identified at this time.
ASC 740 provides a recognition threshold and guidance for measurement of income tax positions taken or expected to be taken on a tax return. ASC 740 requires the elimination of the income tax benefits associated with any income tax position where it is not "more likely than not" that the position would be sustained upon examination by the taxing authorities.
Increases and decreases to the beginning balance of unrecognized tax benefits during the years ended
December 31, 2017
,
2016
, and
2015
were as follows:
|
2017
|
2016
|
2015
|
|||||||||
|
Balance at the beginning of the year
|
$
|
1.7
|
|
$
|
0.2
|
|
$
|
2.7
|
|
||
|
Additions based on tax positions related to current year
|
0.4
|
|
1.5
|
|
—
|
|
|||||
|
Additions for tax positions related to prior years and acquisitions
|
4.2
|
|
—
|
|
—
|
|
|||||
|
Reductions for tax positions related to prior years
|
(0.2
|
)
|
—
|
|
(2.4
|
)
|
|||||
|
Reductions for tax positions related to the lapse of applicable statute of limitations
|
—
|
|
—
|
|
(0.1
|
)
|
|||||
|
Balance at the end of the year
|
$
|
6.1
|
|
$
|
1.7
|
|
$
|
0.2
|
|
||
The amount of the unrecognized benefit above, that if recognized would change the effective tax rate, is
$4.6 million
and
$1.2 million
as of
December 31, 2017
and
2016
, respectively.
F-52
Delek recognizes accrued interest and penalties related to unrecognized tax benefits as an adjustment to the current provision for income taxes.
$0.5 million
of interest was recognized related to unrecognized tax benefits during the year ended
December 31, 2017
and a nominal amount of interest was recognized during the years ended December 31,
2016
and
2015
.
Uncertain tax positions have been examined by Delek for any material changes in the next 12 months, and none are expected.
19
. Earnings Per Share
Basic earnings per share (or "EPS") is computed by dividing net income (loss) by the weighted average common shares outstanding. Diluted earnings per share is computed by dividing net income (loss), as adjusted for changes to income that would result from the assumed settlement of the dilutive equity instruments included in diluted weighted average common shares outstanding, by the diluted weighted average common shares outstanding. For all years presented, we have outstanding various equity-based compensation awards that are considered in our diluted EPS calculation when to do so would not be anti-dilutive, and is inclusive of awards disclosed in
Note 14
to these consolidated financial statements. For those instruments that are indexed to our common stock, they are generally dilutive when the market price of the underlying indexed share of common stock is in excess of the exercise price. Additionally, in connection with the Delek/Alon Merger (disclosed in
Note 3
), we assumed certain equity instruments, including conversion options (associated with Convertible Debt) and Warrants, that may be dilutive (see discussion of these instruments in
Note 12
). The Convertible Debt conversion options are dilutive when the incremental EPS calculated by dividing the increase in income associated with the elimination of interest expense on the convertible debt, net of tax, by the number of shares that would be issued upon conversion using the treasury stock method (which is applicable because of the cash settlement feature associated with the underlying principal) is dilutive to the overall diluted EPS calculation. The Warrants are generally dilutive when the market price of the underlying indexed share of common stock is in excess of the exercise price. All such instruments that may otherwise be dilutive may not be dilutive when there is net loss for the period. We also assumed Purchase Options in connection with the Delek/Alon Merger which are not reflected in the diluted weighted average common shares outstanding because to do so would be antidilutive.
The following table sets forth the computation of basic and diluted earnings per share.
F-53
|
Year Ended December 31,
|
||||||||||||
|
2017
|
2016
|
2015
|
||||||||||
|
Numerator:
|
||||||||||||
|
Numerator for EPS - continuing operations
|
||||||||||||
|
Income (loss) from continuing operations
|
$
|
328.5
|
|
$
|
(219.7
|
)
|
$
|
37.1
|
|
|||
|
Less: Income (loss) from continuing operations attributed to non-controlling interest
|
33.8
|
|
20.3
|
|
24.3
|
|
||||||
|
Income (loss) from continuing operations attributable to Delek (numerator for basic EPS - continuing operations attributable to Delek)
|
294.7
|
|
(240.0
|
)
|
12.8
|
|
||||||
|
Interest on convertible debt, net of tax
|
—
|
|
—
|
|
—
|
|
||||||
|
Numerator for diluted EPS - continuing operations attributable to Delek
|
$
|
294.7
|
|
$
|
(240.0
|
)
|
$
|
12.8
|
|
|||
|
Numerator for EPS - discontinued operations
|
||||||||||||
|
Income (loss) from discontinued operations
|
$
|
(5.9
|
)
|
$
|
86.3
|
|
$
|
6.6
|
|
|||
|
Denominator:
|
||||||||||||
|
Weighted average common shares outstanding (denominator for basic EPS)
|
71,566,225
|
|
61,921,787
|
|
60,819,771
|
|
||||||
|
Dilutive effect of convertible debt
|
—
|
|
—
|
|
—
|
|
||||||
|
Dilutive effect of warrants
|
—
|
|
—
|
|
—
|
|
||||||
|
Dilutive effect of stock-based awards
|
736,858
|
|
—
|
|
500,799
|
|
||||||
|
Weighted average common shares outstanding, assuming dilution
|
72,303,083
|
|
61,921,787
|
|
61,320,570
|
|
||||||
|
EPS:
|
||||||||||||
|
Basic income (loss) per share:
|
||||||||||||
|
Income (loss) from continuing operations
|
$
|
4.12
|
|
$
|
(3.88
|
)
|
$
|
0.21
|
|
|||
|
(Loss) income from discontinued operations
|
$
|
(0.08
|
)
|
1.39
|
|
0.11
|
|
|||||
|
Total basic income (loss) per share
|
$
|
4.04
|
|
$
|
(2.49
|
)
|
$
|
0.32
|
|
|||
|
Diluted income (loss) per share:
|
||||||||||||
|
Income (loss) from continuing operations
|
$
|
4.08
|
|
$
|
(3.88
|
)
|
$
|
0.21
|
|
|||
|
(Loss) income from discontinued operations
|
$
|
(0.08
|
)
|
1.39
|
|
0.11
|
|
|||||
|
Total diluted income (loss) per share
|
$
|
4.00
|
|
$
|
(2.49
|
)
|
$
|
0.32
|
|
|||
|
The following equity instruments were excluded from the diluted weighted average common shares outstanding because their effect would be anti-dilutive:
|
||||||||||||
|
Antidilutive stock-based compensation
|
—
|
|
2,297,127
|
|
2,269,246
|
|
||||||
|
Antidilutive due to loss
|
—
|
|
276,094
|
|
—
|
|
||||||
|
Total antidilutive stock-based compensation
|
—
|
|
2,573,221
|
|
2,269,246
|
|
||||||
|
Antidilutive convertible debt instruments
|
270,606
|
|
—
|
|
—
|
|
||||||
|
Antidilutive due to loss
|
—
|
|
—
|
|
—
|
|
||||||
|
Total antidilutive convertible debt instruments
|
270,606
|
|
—
|
|
—
|
|
||||||
|
Antidilutive warrants
|
2,091,560
|
|
—
|
|
—
|
|
||||||
|
Antidilutive due to loss
|
—
|
|
—
|
|
—
|
|
||||||
|
Total antidilutive warrants
|
2,091,560
|
|
—
|
|
—
|
|
||||||
F-54
20
. Business Interruption Insurance Proceeds
In January 2016, Delek US received an insurance settlement in the amount of
$49.0 million
related to losses stemming from the rupture of an unaffiliated third-party pipeline in 2012 that supplied crude to the El Dorado refinery. Of the total settlement,
$42.4 million
was recognized as business interruption proceeds in the consolidated statements of income during the year ended December 31, 2016. The remainder of the settlement was recorded as a reimbursement of general and administrative expenses in the consolidated statements of income during the year ended December 31, 2015.
21
. Commitments and Contingencies
Litigation
In the ordinary conduct of our business, we are from time to time subject to lawsuits, investigations and claims, including environmental claims and employee-related matters.
Although we cannot predict with certainty the ultimate resolution of lawsuits, investigations and claims asserted against us, including civil penalties or other enforcement actions, we do not believe that any currently pending legal proceeding or proceedings to which we are a party will have a material adverse effect on our business, financial condition or results of operations.
One of our Alon subsidiaries was party to a lawsuit alleging breach of contract pertaining to an asphalt supply agreement. During the year ended
December 31, 2017
, we reached a settlement on this matter which was included in accrued liabilities in purchase accounting as part of the fair value of the liabilities assumed in the Delek/Alon Merger.
We are reporting the following proceedings to comply with SEC regulations which require disclosure of proceedings arising under federal, state or local provisions regulating the discharge of materials into the environment or protecting the environment, if we reasonably believe that such proceedings may result in monetary sanctions of
$0.1 million
or more.
In June 2015, the United States Department of Justice notified Delek Logistics that they were pursuing an enforcement action on behalf of the EPA with regard to potential Clean Water Act violations arising from a release in March 2013 at its Magnolia Station located west of the El Dorado Refinery. We are currently attempting to negotiate a resolution to this matter with the EPA and the ADEQ, which may include monetary penalties and/or other relief.
The Big Spring refinery has been negotiating an agreement with the EPA for over
10
years under the EPA’s National Petroleum Refinery Initiative regarding alleged historical violations of the federal Clean Air Act related to emissions and emissions control equipment. A Consent Decree resolving these alleged historical violations for the Big Spring refinery was lodged with the United States District Court for the Northern District of Texas on June 6, 2017, and we expect that Consent Decree to become final in 2018. If finalized as lodged, the Consent Decree will require payment of a
$0.5 million
civil penalty and capital expenditures for pollution control equipment that may be significant over the next
5
years.
The Big Spring refinery has been in discussions with the EPA since March 2016 to resolve alleged violations regarding six batches of gasoline produced in 2012-2013 that exceeded the applicable Reid Vapor Pressure standard. The issue was resolved in January 2018, resulting in payment of a penalty of approximately
$0.4 million
.
The Paramount refinery has been in discussions with the State of California since December 2016 regarding alleged violations of the state's Low Carbon Fuel Standard ("LCFS") program related to recordkeeping, reporting and the retirement of LCFS credits.. During October 2017, an agreement in principal was reached to settle the matter in which Paramount will pay a
$0.3 million
penalty and retire
350
tons of California LCFS credits.
Self Insurance
Delek records a self-insurance accrual for workers’ compensation claims up to a
$1.0 million
deductible on a per accident basis, general liability claims up to
$4.0 million
on a per occurrence basis, and medical claims for certain employees up to
$0.3 million
on a per claim basis. We
also record a self-insurance accrual for
auto liability up to a
$1.0 million
deductible on a per accident basis for claims incurred in recent periods, and up to a
$4.0 million
deductible for remaining claims from certain prior periods.
F-55
We have umbrella liability insurance available to each of our segments in an amount determined reasonable by management.
Environmental Health and Safety
We are subject to extensive federal, state and local environmental and safety laws and regulations enforced by various agencies, including the EPA, the United States Department of Transportation, the Occupational Safety and Health Administration, as well as numerous state, regional and local environmental, safety and pipeline agencies. These laws and regulations govern the discharge of materials into the environment, waste management practices, pollution prevention measures and the composition of the fuels we produce, as well as the safe operation of our plants and pipelines and the safety of our workers and the public. Numerous permits or other authorizations are required under these laws and regulations for the operation of our refineries, renewable fuel facilities, terminals, pipelines, underground storage tanks, trucks, rail cars and related operations, and may be subject to revocation, modification and renewal.
These laws and permits raise potential exposure to future claims and lawsuits involving environmental and safety matters which could include soil and water contamination, air pollution, personal injury and property damage allegedly caused by substances which we manufactured, handled, used, released or disposed of, transported, or that relate to pre-existing conditions for which we have assumed responsibility. We believe that our current operations are in substantial compliance with existing environmental and safety requirements. However, there have been and will continue to be ongoing discussions about environmental and safety matters between us and federal and state authorities, including notices of violations, citations and other enforcement actions, some of which have resulted or may result in changes to operating procedures and in capital expenditures. While it is often difficult to quantify future environmental or safety related expenditures, we anticipate that continuing capital investments and changes in operating procedures will be required for the foreseeable future to comply with existing and new requirements, as well as evolving interpretations and more strict enforcement of existing laws and regulations.
Our recently acquired Big Spring refinery has been negotiating an agreement with the EPA for over
10
years under the EPA’s National Petroleum Refinery Initiative regarding alleged historical violations of the federal Clean Air Act. A Consent Decree resolving these alleged historical violations for the Big Spring refinery was lodged with the United States District Court for the Northern District of Texas on June 6, 2017, and we expect that Consent Decree to become final in 2018. If finalized as lodged, the Consent Decree will require payment of a
$0.5 million
civil penalty and capital expenditures for pollution control equipment that may be significant over the next
5
years.
As of
December 31, 2017
, we have recorded an environmental liability of approximately
$76.1 million
, primarily related to the estimated probable costs of remediating or otherwise addressing certain environmental issues of a non-capital nature at the Tyler, El Dorado, Big Spring, Krotz Springs and California refineries, as well as terminals, some of which we no longer own. This liability includes estimated costs for ongoing investigation and remediation efforts, which were already being performed by the former operators of the refineries and terminals prior to our acquisition of those facilities, for known contamination of soil and groundwater, as well as estimated costs for additional issues which have been identified subsequent to the acquisitions. We expect approximately
$0.2 million
of this amount to be reimbursable by a prior owner of the El Dorado refinery, which we have recorded in other current assets in our consolidated balance sheet as of
December 31, 2017
. We expect approximately
$2.3 million
of this amount to be reimbursable by a prior owner of certain assets associated with the Paramount refinery, and have recorded $
0.1 million
in other current assets and $
2.2 million
in other non-current assets in our condensed consolidated balance sheet as of
December 31, 2017
. Approximately
$7.2 million
of the total liability is expected to be expended over the next 12 months, with most of the balance expended by 2032, although some costs may extend up to
30
years. In the future, we could be required to extend the expected remediation period or undertake additional investigations of our refineries, pipelines and terminal facilities, which could result in additional remediation liabilities.
Environmental liabilities with payments that are fixed or reliably determinable have been discounted to present value at various rates depending on their expected payment stream. In regards to the environmental liabilities assumed in the Delek/Alon acquisition, the discount rates vary from
2.31%
to
2.84%
. We continue efforts to finalize our estimates of the fair value of the environmental liabilities assumed in the Delek/Alon Merger - see Note
3
for further information. In regards to the environmental liability associated with the Tyler refinery, a discount rate of
9%
has been used.
F-56
The table below summarizes our environmental liability accruals (in millions):
|
December 31,
|
||||||||
|
2017
|
2016
|
|||||||
|
Discounted environmental liabilities
|
$
|
33.7
|
|
$
|
2.2
|
|
||
|
Undiscounted environmental liabilities
|
42.4
|
|
5.0
|
|
||||
|
Total accrued environmental liabilities
|
$
|
76.1
|
|
$
|
7.2
|
|
||
As of
December 31, 2017
, the estimated future payments of environmental obligations for which discounts have been applied are as follows (in millions):
|
2018
|
$
|
1.9
|
|
|
|
2019
|
1.9
|
|
||
|
2020
|
1.9
|
|
||
|
2021
|
1.9
|
|
||
|
2022
|
1.9
|
|
||
|
Thereafter
|
37.7
|
|
||
|
Discounted environmental liabilities, gross
|
47.2
|
|
||
|
Less: Discount applied
|
13.5
|
|
||
|
Discounted environmental liabilities
|
$
|
33.7
|
|
|
We have experienced several crude oil releases from pipelines owned by our logistics segment, including, but not limited to, a release at Magnolia Station in March 2013, a release near Fouke, Arkansas in April 2015 and a release near Woodville, Texas in January 2016. In June 2015, the United States Department of Justice notified Delek Logistics that they were evaluating an enforcement action on behalf of the EPA with regard to potential Clean Water Act violations arising from the March 2013 Magnolia Station release. We are currently attempting to negotiate a resolution to this matter with the EPA and the ADEQ, which may include monetary penalties and/or other relief. Based on current information available to us, we do not believe the total costs associated with these events, whether alone or in the aggregate, including any fines or penalties, will have a material adverse effect upon our business, financial condition or results of operations.
Letters of Credit
As of
December 31, 2017
, we had in place letters of credit totaling approximately
$125.8 million
with various financial institutions securing obligations primarily with respect to our commodity purchases for the refining segment, our gasoline and diesel purchases for the logistics segment and our workers’ compensation and auto liability insurance programs.
No
amounts were drawn by beneficiaries of these letters of credit at
December 31, 2017
.
Operating Leases
Delek leases buildings, equipment and corporate office space under agreements expiring at various dates through 2035 after considering available renewal options. Many of these leases contain renewal options and require Delek to pay executory costs (such as property taxes, maintenance and insurance). Lease expense for all operating leases for the years ended
December 31, 2017
,
2016
and
2015
totaled
$40.9 million
,
$31.1 million
, and
$32.4 million
, respectively.
The following is an estimate of our future minimum lease payments for operating leases having remaining noncancelable terms in excess of one year as of
December 31, 2017
(in millions):
|
2018
|
$
|
52.8
|
|
|
|
2019
|
42.7
|
|
||
|
2020
|
35.3
|
|
||
|
2021
|
27.4
|
|
||
|
2022
|
22.2
|
|
||
|
Thereafter
|
102.5
|
|
||
|
Total future minimum rentals
|
$
|
282.9
|
|
|
F-57
22
. Employees
Workforce
As of
December 31, 2017
,
176
operations, maintenance and warehouse hourly employees and
38
truck drivers at the Tyler refinery were represented by the United Steel, Paper and Forestry, Rubber, Manufacturing, Energy, Allied Industrial and Service Workers International Union and its Local 202. The Tyler operations, maintenance and warehouse hourly employees are currently covered by a collective bargaining agreement that expires
January 31, 2019
. The Tyler truck drivers are currently covered by a collective bargaining agreement that expires
March 1, 2018
. As of
December 31, 2017
,
175
operations and maintenance hourly employees at the El Dorado refinery were represented by the International Union of Operating Engineers and its Local 381. These employees are covered by a collective bargaining agreement which expires on
August 1, 2021
. As of
December 31, 2017
,
37
of our El Dorado based drivers for Lion Oil Company were represented by the United Steel, Paper and Forestry, Rubber, Manufacturing, Energy, Allied Industrial and Service Workers International Union, AFL - CIO,
29
of our Texas based drivers for Lion Oil Company were represented by the United Steel, Paper and Forestry, Rubber, Manufacturing, Energy, Allied Industrial and Service Workers International Union, AFL - CIO and
4
of our El Dorado refinery warehouse hourly employees were represented by the International Union of Operating Engineers and its Local 381 (but none are currently covered by a collective bargaining agreement). Negotiations toward collective bargaining agreements with the new bargaining units are underway. As of
December 31, 2017
, approximately
138
employees who work at our Big Spring refinery are covered by a collective bargaining agreement that expires
April 1, 2019
. None of our employees in our logistics segment, retail segment or in our corporate office are represented by a union. We consider our relations with our employees to be satisfactory.
Postretirement Benefits
Pension Plans
Effective with the Delek/Alon Merger on July 1, 2017 (see Note
3
), we now have four defined benefit pension plans covering substantially all of Alon's employees, excluding employees of the retail segment. The benefits are based on years of service and the employee’s final average monthly compensation. Our funding policy is to contribute annually no less than the minimum required nor more than the maximum amount that can be deducted for federal income tax purposes. Contributions are intended to provide not only for benefits attributed to service to date but also for those benefits expected to be earned in the future. The plans were frozen for non-union employees effective September 30, 2017.
Financial information related to our pension plans is presented below:
|
2017
|
|||
|
Change in projected benefit obligation:
|
|||
|
Benefit obligation at beginning of the period (July 1, 2017 business combination)
|
$
|
145.2
|
|
|
Service cost
|
1.2
|
|
|
|
Interest cost
|
2.7
|
|
|
|
Actuarial (gain) loss
|
6.5
|
|
|
|
Benefits paid
|
(2.4
|
)
|
|
|
Other (effect of curtailment)
|
(6.3
|
)
|
|
|
Projected benefit obligations at end of year
|
$
|
146.9
|
|
|
Change in plan assets:
|
|||
|
Fair value of plan assets at beginning of the period (July 1, 2017 business combination)
|
$
|
96.1
|
|
|
Actual gain on plan assets
|
9.8
|
|
|
|
Employer contribution
|
5.3
|
|
|
|
Benefits paid
|
(2.4
|
)
|
|
|
Fair value of plan assets at end of year
|
$
|
108.8
|
|
|
Reconciliation of funded status:
|
|||
|
Fair value of plan assets at end of year
|
$
|
108.8
|
|
|
Less projected benefit obligations at end of year
|
146.9
|
|
|
|
Under-funded status at end of year
|
$
|
(38.1
|
)
|
The pre-tax amounts related to the defined benefit plans recognized as pension benefit liability in the consolidated balance sheets as of
December 31, 2017
was
$38.1 million
.
F-58
The pre-tax amounts in accumulated other comprehensive loss as of
December 31, 2017
that have not yet been recognized as components of net periodic benefit cost were as follows:
|
Net actuarial gain
|
$
|
(0.8
|
)
|
|
Prior service credit
|
—
|
|
|
|
Projected benefit obligations at end of year
|
$
|
(0.8
|
)
|
As of
December 31, 2017
, the accumulated benefit obligation for each of our pension plans was in excess of the fair value of plan assets. The projected benefit obligation, accumulated benefit obligation and fair value of plan assets for the pension plans were as follows:
|
Projected benefit obligation
|
$
|
146.9
|
|
|
Accumulated benefit obligation
|
$
|
143.8
|
|
|
Fair value of plan assets
|
$
|
108.8
|
|
The weighted-average assumptions used to determine benefit obligations at
December 31, 2017
were as follows:
|
Discount rate
|
3.60
|
%
|
|
Rate of compensation increase
|
3.00
|
%
|
The discount rate used reflects the expected future cash flow based on our funding valuation assumptions and participant data as of the beginning of the plan period. The expected future cash flow is discounted by the Principal Pension Discount Yield Curve for the fiscal year end because it has been specifically designed to help pension funds comply with statutory funding guidelines.
The weighted-average assumptions used to determine net periodic benefit costs for the year ended
December 31, 2017
were as follows:
|
Discount rate
|
3.80
|
%
|
|
Expected long-term rate of return on plan assets
|
7.45
|
%
|
|
Rate of compensation increase
|
3.00
|
%
|
The expected long-term rate of return is based on the portfolio as a whole and not on the sum of the returns on individual asset categories.
The components of net periodic benefit cost related to our benefit plans for the year ended
December 31, 2017
consisted of the following:
|
Components of net periodic benefit cost:
|
||||
|
Service cost
|
$
|
1.2
|
|
|
|
Interest cost
|
2.7
|
|
||
|
Expected return on plan assets
|
(2.7
|
)
|
||
|
Recognition of gain due to curtailment
|
(6.1
|
)
|
||
|
Net periodic benefit cost
|
$
|
(4.9
|
)
|
|
Net periodic benefit costs are included as part of general and administrative expenses in the accompanying consolidated statements of income.
The weighted-average asset allocation of our pension benefits plan assets at
December 31, 2017
was as follows:
|
Asset Category:
|
||
|
Equity securities
|
78.5
|
%
|
|
Debt securities
|
13.0
|
%
|
|
Real estate investment trust
|
8.5
|
%
|
|
Total
|
100.0
|
%
|
The fair value of our pension assets by category as of
December 31, 2017
were as follows:
F-59
|
Quoted Prices in
Active Markets
For Identical
Assets or
Liabilities
(Level 1)
|
Significant
Other
Observable
Inputs
(Level 2)
|
Significant
Unobservable
Inputs
(Level 3)
|
Consolidated
Total
|
||||||||||||
|
Year Ended December 31, 2017
|
|||||||||||||||
|
Equity securities:
|
|||||||||||||||
|
U.S. companies
|
$
|
67.1
|
|
$
|
—
|
|
$
|
—
|
|
$
|
67.1
|
|
|||
|
International companies
|
18.3
|
|
—
|
|
—
|
|
18.3
|
|
|||||||
|
Debt securities:
|
|||||||||||||||
|
Preferred securities
|
4.6
|
|
—
|
|
—
|
|
4.6
|
|
|||||||
|
Bond securities
|
—
|
|
9.5
|
|
—
|
|
9.5
|
|
|||||||
|
Real estate securities
|
9.3
|
|
—
|
|
—
|
|
9.3
|
|
|||||||
|
Total
|
$
|
99.3
|
|
$
|
9.5
|
|
$
|
—
|
|
$
|
108.8
|
|
|||
The investment policies and strategies for the assets of our pension benefits is to, over a five-year period, provide returns in excess of the benchmark. The portfolio is expected to earn long-term returns from capital appreciation and a stable stream of current income. This approach recognizes that assets are exposed to price risk and the market value of the plans’ assets may fluctuate from year to year. Risk tolerance is determined based on our specific risk management policies. In line with the investment return objective and risk parameters, the plans’ mix of assets includes a diversified portfolio of equity, fixed-income and real estate investments. Equity investments include domestic and international stocks of various sizes of capitalization. The asset allocation of the plan is reviewed on at least an annual basis.
We contributed
$5.3 million
to the pension plans for the year ended
December 31, 2017
, and expect to contribute
$8.3 million
to the pension plans in
2018
. There were
no
employee contributions to the plans.
The benefits expected to be paid in each year
2018
–
2022
are
$9.9 million
,
$5.9 million
,
$6.0 million
,
$6.3 million
, and
$6.7 million
, respectively. The aggregate benefits expected to be paid in the five years from
2023
–
2027
are
$36.2 million
. The expected benefits are based on the same assumptions used to measure our benefit obligation at
December 31, 2017
and include estimated future employee service.
401(k) Plans
We sponsor voluntary 401(k) Employee Retirement Savings Plans for eligible employees administered by Wells Fargo Bank, N.A. Employees must be at least 21 years of age and have 45 days of service to be eligible to participate in the plan. Employee contributions are matched on a fully-vested basis by us up to a maximum of
8%
of eligible compensation. Eligibility for the Company matching contribution begins on the first of the month following one year of employment. For the years ended
December 31, 2017
,
2016
and
2015
, the 401(k) plans expense recognized was
$6.5 million
,
$3.8 million
, and
$4.3 million
, respectively.
Postretirement Medical Plan
In addition to providing pension benefits, Alon has an unfunded postretirement medical plan covering certain health care and life insurance benefits for certain employees of Alon that retired prior to January 2, 2017, who met eligibility requirements in the plan documents. This plan is closed to new participants. The health care benefits in excess of certain limits are insured. The accrued benefit liability related to this plan reflected in the consolidated balance sheet was
$3.9 million
at
December 31, 2017
.
23
. Related Party Transactions
Transactions with Alon
For the period from January 1, 2017 through June 30, 2017, the year ended December 31, 2016 and the period from May 14, 2015 through December 31, 2015, respectively, our refining and logistics segments sold
$44.7 million
,
$7.5 million
and
$15.2 million
of refined products to and purchased
$14.3 million
,
$2.9 million
and
$0.3 million
of refined products from Alon. As of
December 31, 2016
, we carried a
$0.1 million
receivable balance from Alon, which is reflected in accounts receivable from related party on our consolidated balance sheet. Alon was not a related party prior to the Alon Acquisition on May 14, 2015. Effective July 1, 2017, Alon became a wholly-owned subsidiary of New Delek in connection with the Delek/Alon Merger.
Transaction with Caddo Pipeline, LLC ("CP LLC")
For the year ended
December 31, 2017
, our refining segment paid pipeline throughput fees of
$1.6 million
to CP LLC. There was no revenue and/or activity for the years ended
December 31, 2016
and
2015
as the Caddo Pipeline construction was completed at the end of December 2016. Delek Logistics owns
50%
of CP LLC, and Plains All American Pipeline, LLC, a third-party, owns the other 50%. CP LLC was not a related party prior to its acquisition in March 2015.
Transactions with Rangeland RIO Pipeline, LLC ("Rangeland RIO")
For the years ended
December 31, 2017
and
2016
, respectively, our refining segment paid pipeline throughput fees of
$13.8 million
and
$3.1 million
to Rangeland RIO. We did not pay any fees to Rangeland RIO for the
year ended
December 31, 2015
. As of
December 31, 2017
and
2016
, respectively, we carried a
$1.2 million
and
$1.8 million
payable balance to Rangeland RIO, which is reflected in accounts payable to related party on our consolidated balance sheets. Delek Logistics owns
33%
of Rangeland RIO, and Rangeland Energy II, LLC, a third-party, owns
67%
. Rangeland RIO was not a related party prior to its acquisition in March 2015.
Transactions with Wright Asphalt Products Company, LLC ("Wright Asphalt")
For the period from the Delek/Alon Merger date of July 1, 2017 through
December 31, 2017
, our refining segment paid throughput fees of
$1.8 million
to Wright Asphalt. In addition, our other segment had related party revenues of
$40.9 million
from Wright Asphalt related to asphalt sales and had purchases from Wright Asphalt of
$9.1 million
. As of
December 31, 2017
, we carried a
$0.5 million
payable balance to Wright Asphalt, which is reflected in accounts payable to related party on our consolidated balance sheets. Alon owns
50%
of Wright Asphalt, and TTRD, Ltd., a third-party, owns the other
50%
.
Transactions with Paramount Nevada Asphalt Company, LLC ("PNAC")
For the period from the Delek/Alon Merger date of July 1, 2017 through
December 31, 2017
our other segment had related party revenues of
$9.6 million
from PNAC related to asphalt sales and had purchases from PNAC of
$6.0 million
. As of
December 31, 2017
, we carried a
$2.1 million
receivable balance from PNAC, which is reflected in accounts receivable from related party on our consolidated balance sheets. Alon owns
50%
of PNAC, and Granite Construction Inc., a third-party, owns the other
50%
.
F-60
24
. Selected Quarterly Financial Data (Unaudited)
Quarterly financial information for the years ended
December 31, 2017
and
2016
is summarized below. The sum of the quarterly results may differ from the annual results presented on our consolidated income statement due to rounding. The quarterly financial information summarized below has been prepared by Delek's management and is unaudited (in millions, except per share data).
|
For the Three Month Periods Ended
|
||||||||||||||||
|
March 31, 2017
|
June 30, 2017
|
September 30, 2017
|
December 31, 2017
|
|||||||||||||
|
Net sales
(1)
|
$
|
1,182.2
|
|
$
|
1,230.7
|
|
$
|
2,370.6
|
|
$
|
2,483.7
|
|
||||
|
Operating income (loss)
|
$
|
29.8
|
|
$
|
(46.5
|
)
|
$
|
90.8
|
|
$
|
112.4
|
|
||||
|
Net income (loss) from continuing operations
|
$
|
15.3
|
|
$
|
(32.2
|
)
|
$
|
118.5
|
|
$
|
226.9
|
|
||||
|
Net income (loss) attributable to Delek
|
$
|
11.2
|
|
$
|
(37.9
|
)
|
$
|
104.4
|
|
$
|
211.1
|
|
||||
|
Basic earnings (loss) per share from continuing operations
|
$
|
0.18
|
|
$
|
(0.61
|
)
|
$
|
1.30
|
|
$
|
2.62
|
|
||||
|
Diluted earnings (loss) per share from continuing operations
|
$
|
0.18
|
|
$
|
(0.61
|
)
|
$
|
1.29
|
|
$
|
2.58
|
|
||||
|
For the Three Month Periods Ended
|
||||||||||||||||
|
March 31, 2016
|
June 30, 2016
|
September 30, 2016
|
December 31, 2016
|
|||||||||||||
|
Net sales
|
$
|
886.1
|
|
$
|
1,147.3
|
|
$
|
1,079.9
|
|
$
|
1,084.6
|
|
||||
|
Operating (loss) income
|
$
|
(13.6
|
)
|
$
|
11.3
|
|
$
|
(2.8
|
)
|
$
|
(44.1
|
)
|
||||
|
Net (loss) income from continuing operations
|
$
|
(21.5
|
)
|
$
|
(2.5
|
)
|
$
|
(163.7
|
)
|
$
|
(32.0
|
)
|
||||
|
Net (loss) income attributable to Delek
|
$
|
(29.2
|
)
|
$
|
(7.0
|
)
|
$
|
(161.7
|
)
|
$
|
44.2
|
|
||||
|
Basic (loss) earnings per share from continuing operations
|
$
|
(0.43
|
)
|
$
|
(0.14
|
)
|
$
|
(2.71
|
)
|
$
|
(0.59
|
)
|
||||
|
Diluted (loss) earnings per share from continuing operations
|
$
|
(0.43
|
)
|
$
|
(0.14
|
)
|
$
|
(2.71
|
)
|
$
|
(0.59
|
)
|
||||
|
(1)
|
Net sales for the three months ended September 30, 2017 reflects a correction of an intercompany elimination to net sales and cost of sales, which resulted in an increase in net sales and cost of sales of
$29.1 million
not previously reflected on the unaudited consolidated financial statements as of and for the three and nine months ended September 30, 2017 included in our Form 10-Q filed on November 9, 2017.
|
The table above includes the following infrequently occurring items:
|
•
|
Operating loss for the quarter ended March 31, 2016 is net of business interruption insurance proceeds of
$42.4 million
(see Note
20
);
|
|
•
|
Net loss from continuing operations for the quarter ended September 30, 2016 includes loss on impairment of the equity investment in Alon, before tax, of
$245.3 million
(see Note
5
);
|
|
•
|
Net income attributable to Delek for the quarter ended December 31, 2016 includes gain on sale of the Retail Entities, before tax, of
$134.1 million
(see Note
6
);
|
|
•
|
Net income from continuing operations for the quarter ended September 30, 2017 includes gain on remeasurement of the Alon equity method investment, before tax, of
$190.1 million
(see Note
3
) and the income tax effect of the write-off of deferred taxes in connection with the Delek/Alon Merger of
$(46.9) million
;
|
|
•
|
Net income attributable to Delek for the quarter ended December 31, 2017 includes the income tax effect of the new Tax Cuts and Jobs Act of
$166.9 million
.
|
Results subsequent to the Delek/Alon Merger (see Note
3
) include 100% of Alon's various income statement items for the applicable quarters, whereas results for the three months ended June 30, 2017 and prior include Delek's proportionate share of its equity method investment in Alon in (Income) loss from equity method investments in our consolidated statements of income (see Note
5
).
F-61
The quarterly earnings per share calculation for the three months ended
December 31, 2017
reflects the dilutive effect of convertible debt, which has not been dilutive in previous quarters. The dilutive effect of the convertible debt impacts both the numerator and the denominator in the earnings per share calculation for that period (as further discussed in
Note 19
). In other quarters in the historical periods included above, the EPS has been calculated as the net income (loss) from continuing operations divided by weighted average common shares, both including (for basic) and excluding (for diluted) the effect of other dilutive instruments, as presented in our previous quarterly reports on Forms 10-Q. Because the EPS calculation for the three months ended
December 31, 2017
cannot be derived without considering both the impact to the numerator and the denominator of the EPS calculation, we have presented it below for the three months ended
December 31, 2017
, along with the EPS calculation for the three months ended
December 31, 2016
for comparison purposes.
|
Three Months Ended December 31,
|
||||||||
|
2017
|
2016
|
|||||||
|
Numerator:
|
||||||||
|
Numerator for EPS - continuing operations
|
||||||||
|
Income (loss) from continuing operations
|
$
|
226.9
|
|
$
|
(32.0
|
)
|
||
|
Less: Income from continuing operations attributed to non-controlling interest
|
14.0
|
|
4.6
|
|
||||
|
Income (loss) from continuing operations attributable to Delek (numerator for basic EPS - continuing operations attributable to Delek)
|
212.9
|
|
(36.6
|
)
|
||||
|
Interest on convertible debt, net of tax
|
0.7
|
|
—
|
|
||||
|
Numerator for diluted EPS - continuing operations attributable to Delek
|
$
|
213.6
|
|
$
|
(36.6
|
)
|
||
|
Numerator for EPS - discontinued operations
|
||||||||
|
Income (loss) from discontinued operations
|
$
|
(1.8
|
)
|
$
|
80.8
|
|
||
|
Denominator:
|
||||||||
|
Weighted average common shares outstanding (denominator for basic EPS)
|
81,338,755
|
|
61,894,229
|
|
||||
|
Dilutive effect of convertible debt
|
526,464
|
|
—
|
|
||||
|
Dilutive effect of stock-based awards
|
779,841
|
|
—
|
|
||||
|
Weighted average common shares outstanding, assuming dilution
|
82,645,060
|
|
61,894,229
|
|
||||
|
EPS:
|
||||||||
|
Basic income (loss) per share:
|
||||||||
|
Income (loss) from continuing operations
|
$
|
2.62
|
|
$
|
(0.59
|
)
|
||
|
(Loss) income from discontinued operations
|
(0.02
|
)
|
1.31
|
|
||||
|
Total basic income (loss) per share
|
$
|
2.60
|
|
$
|
0.72
|
|
||
|
Diluted income (loss) per share:
|
||||||||
|
Income (loss) from continuing operations
|
$
|
2.58
|
|
$
|
(0.59
|
)
|
||
|
(Loss) income from discontinued operations
|
(0.02
|
)
|
1.31
|
|
||||
|
Total diluted income (loss) per share
|
$
|
2.56
|
|
$
|
0.72
|
|
||
|
The following equity instruments were excluded from the diluted weighted average common shares outstanding because their effect would be anti-dilutive:
|
||||||||
|
Antidilutive stock-based compensation
|
3,660,354
|
|
1,984,575
|
|
||||
|
Antidilutive due to loss
|
—
|
|
527,168
|
|
||||
|
Total antidilutive stock-based compensation
|
3,660,354
|
|
2,511,743
|
|
||||
|
Antidilutive warrants
|
1,049,682
|
|
—
|
|
||||
|
Total antidilutive warrants
|
1,049,682
|
|
—
|
|
||||
F-62
25
. Subsequent Events
Dividend Declaration
On
February 26, 2018
, Delek's Board of Directors voted to declare a quarterly cash dividend of
$0.20
per share, payable on
March 26, 2018
, to stockholders of record on
March 12, 2018
. Our previous quarterly cash dividend amounts were
$0.15
per share.
Share Repurchase from Alon Israel/New Share Repurchase Program
On January 23, 2018, Delek repurchased
2.0 million
shares of its common stock from Alon Israel in connection with Delek’s rights pursuant to a Stock Purchase Agreement dated April 14, 2015, by and between Delek and Alon Israel. Alon Israel delivered a right of first offer notice to Delek on January 16, 2018, informing Delek of Alon Israel’s intention to sell the
2.0 million
shares, and Delek accepted such offer on January 17, 2018. The total purchase price was approximately
$75.3 million
, or $
37.64
per share.
As of February 25, 2018, there was approximately
$32.2 million
remaining under Delek's
$150.0 million
December 2016 share repurchase authorization, taking into account the share repurchase from Alon Israel discussed above. On February 26, 2018, the Board of Directors approved a new
$150.0 million
authorization to repurchase Delek common stock. This amount has no expiration date and is in addition to any remaining amounts previously authorized. These shares will be included in treasury shares in the period in which they were repurchased.
Acquisition of Non-controlling Interest in Alon Partnership
On November 8, 2017, Delek and the Alon Partnership entered into a definitive merger agreement under which Delek agreed to acquire all of the outstanding limited partner units which Delek did not already own in an all-equity transaction. This transaction was approved by all voting members of the board of directors of the general partner of the Alon Partnership upon the recommendation from its conflicts committee and by the board of directors of Delek. This transaction closed on February 7, 2018. Delek owned approximately
51.0 million
limited partner units of the Alon Partnership, or approximately
81.6%
of the outstanding units immediately prior to the transaction date. Under terms of the merger agreement, the owners of the remaining outstanding units in the Alon Partnership that Delek did not currently immediately prior to the transaction date received a fixed exchange ratio of
0.49
shares of New Delek common stock for each limited partner unit of the Alon Partnership, resulting in the issuance of approximately
5.6 million
shares to the public unitholders of the Alon Partnership.
Reenactment of the Blenders Tax Credit
On February 9, 2018, as part of the Bipartisan Budget Act of 2018 (H.R. 1892), an extension to the blenders tax credit for biodiesel and renewable diesel was enacted. This extension is retroactive to January 1, 2017 and is effective for one year. As a result of the retroactive application, we expect to recognize a tax benefit during the first quarter of 2018 related to credits earned upon enactment in 2018 by our renewable fuels refinery (included in the California Discontinued Entities as of December 31, 2017) for refining activities that occurred during 2017, but the amount of the expected credit has not yet been determined.
Agreement to Sale of Asphalt Terminals
On February 12, 2018, Delek announced it has reached a definitive agreement to sell
four
asphalt terminals (included in Delek's corporate/other segment) to an affiliate of Andeavor. This transaction includes asphalt terminal assets in Bakersfield, Mojave and Elk Grove, California and Phoenix, Arizona, as well as Delek’s
50 percent
equity interest in the Paramount-Nevada Asphalt Company, LLC joint venture that operates an asphalt terminal located in Fernley, Nevada. The total cash consideration is
$75.0 million
plus a working capital adjustment. Subject to customary closing conditions, certain preferential rights under the joint venture arrangement and regulatory approvals, this transaction is expected to close in the first half of 2018. These assets did not meet the definition of held for sale pursuant to ASC 360 as of
December 31, 2017
and therefore were not reflected as held for sale nor as discontinued operations in the consolidated financial statements as of and for the year ended
December 31, 2017
.
Transaction with Delek Logistics
On February 26, 2018, Delek and Delek Logistics entered into a definitive agreement whereby Delek Logistics will acquire the Big Spring logistics assets, subject to customary closing conditions. These assets consist of storage tanks and terminals that support our Big Spring, Texas refinery. In addition, a new marketing agreement will be entered into between the companies for product sales from Big Spring. The expected purchase price is approximately
$315.0 million
in cash. This dropdown is expected to be financed by Delek Logistics through a combination of cash on hand and borrowings on the revolving credit facility and is expected to close in March 2018.
F-63
SCHEDULE I
Delek US Holdings, Inc.
Parent Company Only
Condensed Balance Sheets
(In millions, except share and per share data)
|
December 31,
|
||||||||
|
2017
(1)
|
2016
(1)
|
|||||||
|
ASSETS
|
||||||||
|
Current assets:
|
||||||||
|
Cash and cash equivalents
|
$
|
13.0
|
|
$
|
—
|
|
||
|
Total current assets
|
13.0
|
|
—
|
|
||||
|
Investment in subsidiaries
|
1,953.4
|
|
1,183.9
|
|
||||
|
Total assets
|
$
|
1,966.4
|
|
$
|
1,183.9
|
|
||
|
LIABILITIES AND SHAREHOLDERS’ EQUITY
|
||||||||
|
Current liabilities:
|
||||||||
|
Accounts payable to subsidiaries
|
$
|
2.2
|
|
$
|
1.4
|
|
||
|
Total current liabilities
|
2.2
|
|
1.4
|
|
||||
|
Shareholders’ equity:
|
||||||||
|
Preferred stock, $0.01 par value, 10,000,000 shares authorized, no shares issued and outstanding
|
—
|
|
—
|
|
||||
|
Common stock, $0.01 par value, 110,000,000 shares authorized, 81,533,548 shares and 67,150,352 shares issued at December 31, 2017 and December 31, 2016, respectively
|
0.8
|
|
0.7
|
|
||||
|
Additional paid-in capital
|
1,213.7
|
|
841.1
|
|
||||
|
Accumulated other comprehensive income (loss)
|
6.9
|
|
(20.8
|
)
|
||||
|
Treasury stock, 762,623 shares and 5,195,791 shares, at cost, as of December 31, 2017 and December 31, 2016, respectively
|
(25.0
|
)
|
(160.8
|
)
|
||||
|
Retained earnings
|
767.8
|
|
522.3
|
|
||||
|
Total shareholders’ equity
|
1,964.2
|
|
1,182.5
|
|
||||
|
Total liabilities and shareholders’ equity
|
$
|
1,966.4
|
|
$
|
1,183.9
|
|
||
|
(1)
|
Effective July 1, 2017, Delek US Holdings, Inc. acquired the outstanding common stock of Alon USA Energy, Inc., which resulted in a new post-combination consolidated registrant renamed as Delek US Holdings, Inc. (as previously defined, "New Delek"), with Alon and Old Delek surviving as wholly-owned subsidiaries. Based on the substance of the transaction, the creation of New Delek and its acquisition of Alon and Old Delek represented a transaction between entities under common control. Therefore, pursuant to the provisions of ASC 805-50, Business Combinations-Related Issues, the financial statements for prior periods presented within this Schedule I were retrospectively adjusted to furnish comparative information.
|
The "Notes to Consolidated Financial Statements" of Delek US Holdings, Inc., beginning on page F-13 of this
Form 10-K are an integral part of these condensed financial statements.
F-64
Delek US Holdings, Inc.
Parent Company Only
Condensed Statements of Income
(In millions)
|
Year Ended December 31,
|
||||||||||||
|
2017
(1)(2)
|
2016
(1)(2)
|
2015
(1)(2)
|
||||||||||
|
Net sales
|
$
|
—
|
|
$
|
—
|
|
$
|
—
|
|
|||
|
Operating costs and expenses:
|
||||||||||||
|
General and administrative expenses
|
1.2
|
|
1.1
|
|
1.2
|
|
||||||
|
Total operating costs and expenses
|
1.2
|
|
1.1
|
|
1.2
|
|
||||||
|
Operating loss
|
(1.2
|
)
|
(1.1
|
)
|
(1.2
|
)
|
||||||
|
(Income) loss from investment in subsidiaries
|
(289.6
|
)
|
153.0
|
|
(20.2
|
)
|
||||||
|
Total non-operating (income) expenses, net
|
(289.6
|
)
|
153.0
|
|
(20.2
|
)
|
||||||
|
Income (loss) before income tax benefit
|
288.4
|
|
(154.1
|
)
|
19.0
|
|
||||||
|
Income tax benefit
|
(0.4
|
)
|
(0.4
|
)
|
(0.4
|
)
|
||||||
|
Net income (loss)
|
288.8
|
|
$
|
(153.7
|
)
|
$
|
19.4
|
|
||||
|
(1)
|
Effective July 1, 2017, Delek US Holdings, Inc. acquired the outstanding common stock of Alon USA Energy, Inc., which resulted in a new post-combination consolidated registrant renamed as Delek US Holdings, Inc. (as previously defined, "New Delek"), with Alon and Old Delek surviving as wholly-owned subsidiaries. Based on the substance of the transaction, the creation of New Delek and its acquisition of Alon and Old Delek represented a transaction between entities under common control. Therefore, pursuant to the provisions of ASC 805-50, Business Combinations-Related Issues, the financial statements for prior periods presented within this Schedule I were retrospectively adjusted to furnish comparative information.
|
|
(2)
|
Income tax (benefit) / expense for Delek US Holdings, Inc. was estimated utilizing each respective year's applicable statutory tax rate.
|
The "Notes to Consolidated Financial Statements" of Delek US Holdings, Inc., beginning on page F-13 of this
Form 10-K are an integral part of these condensed financial statements.
F-65
Delek US Holdings, Inc.
Parent Company Only
Condensed Consolidated Statements of Comprehensive Income
(In millions)
|
Year Ended December 31,
|
||||||||||||
|
|
2017
(1)
|
2016
(1)
|
2015
(1)
|
|||||||||
|
Net income (loss)
|
$
|
288.8
|
|
$
|
(153.7
|
)
|
$
|
19.4
|
|
|||
|
Other comprehensive income (loss):
|
|
|
||||||||||
|
Parent company portion of other comprehensive income of consolidated subsidiary
|
27.8
|
|
24.5
|
|
(32.7
|
)
|
||||||
|
Total other comprehensive income (loss)
|
27.8
|
|
24.5
|
|
(32.7
|
)
|
||||||
|
Comprehensive income (loss) attributable to Delek
|
$
|
316.6
|
|
$
|
(129.2
|
)
|
$
|
(13.3
|
)
|
|||
|
(1)
|
Effective July 1, 2017, Delek US Holdings, Inc. acquired the outstanding common stock of Alon USA Energy, Inc., which resulted in a new post-combination consolidated registrant renamed as Delek US Holdings, Inc. (as previously defined, "New Delek"), with Alon and Old Delek surviving as wholly-owned subsidiaries. Based on the substance of the transaction, the creation of New Delek and its acquisition of Alon and Old Delek represented a transaction between entities under common control. Therefore, pursuant to the provisions of ASC 805-50, Business Combinations-Related Issues, the financial statements for prior periods presented within this Schedule I were retrospectively adjusted to furnish comparative information.
|
The "Notes to Consolidated Financial Statements" of Delek US Holdings, Inc., beginning on page F-13 of this
Form 10-K are an integral part of these condensed financial statements.
Delek US Holdings, Inc.
Parent Company Only
Condensed Statements of Cash Flows
(In millions)
|
Year Ended December 31,
|
||||||||||||
|
2017
(1)
|
2016
(1)
|
2015
(1)
|
||||||||||
|
Cash flows from operating activities:
|
||||||||||||
|
Net income (loss)
|
$
|
288.8
|
|
$
|
(153.7
|
)
|
$
|
19.4
|
|
|||
|
Adjustments to reconcile net income (loss) to net cash provided by operating activities:
|
||||||||||||
|
Equity-based compensation expense
|
0.6
|
|
0.6
|
|
0.6
|
|
||||||
|
(Income) loss from subsidiaries
|
(289.6
|
)
|
153.0
|
|
(20.2
|
)
|
||||||
|
Changes in assets and liabilities:
|
||||||||||||
|
Receivables and payables from related parties, net
|
0.2
|
|
0.1
|
|
0.2
|
|
||||||
|
Net cash provided by (used in) operating activities
|
—
|
|
—
|
|
—
|
|
||||||
|
Cash flows from investing activities:
|
||||||||||||
|
Dividends from subsidiaries
|
13.0
|
|
—
|
|
—
|
|
||||||
|
Net cash provided by investing activities
|
13.0
|
|
—
|
|
—
|
|
||||||
|
Cash flows from financing activities:
|
||||||||||||
|
Net cash provided by (used in) financing activities
|
—
|
|
—
|
|
—
|
|
||||||
|
Net increase in cash and cash equivalents
|
13.0
|
|
—
|
|
—
|
|
||||||
|
Cash and cash equivalents at the beginning of the period
|
—
|
|
—
|
|
—
|
|
||||||
|
Cash and cash equivalents at the end of the period
|
$
|
13.0
|
|
$
|
—
|
|
$
|
—
|
|
|||
|
Supplemental disclosures of cash flow information:
|
||||||||||||
|
Non-cash operating activity:
|
||||||||||||
|
Parent company portion of other comprehensive income of consolidated subsidiary
|
$
|
27.8
|
|
$
|
24.5
|
|
$
|
(32.7
|
)
|
|||
|
Non-cash financing activities:
|
||||||||||||
|
Payment of common stock dividends by consolidated subsidiary
|
$
|
(44.0
|
)
|
$
|
(37.5
|
)
|
$
|
(37.1
|
)
|
|||
|
Repurchase of common stock by consolidated subsidiary
|
$
|
(25.0
|
)
|
$
|
(6.0
|
)
|
$
|
(42.2
|
)
|
|||
|
Common stock issued in connection with the Delek/Alon Merger
|
$
|
509.0
|
|
$
|
—
|
|
$
|
—
|
|
|||
|
Equity instruments issued in connection with the Delek/Alon Merger
|
$
|
21.7
|
|
$
|
—
|
|
$
|
—
|
|
|||
|
Common stock issued in connection with the Alon Acquisition
|
$
|
—
|
|
$
|
—
|
|
$
|
230.8
|
|
|||
|
Note payable issued in connection with the Alon Acquisition
|
$
|
—
|
|
$
|
—
|
|
$
|
145.0
|
|
|||
|
(1)
|
Effective July 1, 2017, Delek US Holdings, Inc. acquired the outstanding common stock of Alon USA Energy, Inc., which resulted in a new post-combination consolidated registrant renamed as Delek US Holdings, Inc. (as previously defined, "New Delek"), with Alon and Old Delek surviving as wholly-owned subsidiaries. Based on the substance of the transaction, the creation of New Delek and its acquisition of Alon and Old Delek represented a transaction between entities under common control. Therefore, pursuant to the provisions of ASC 805-50, Business Combinations-Related Issues, the financial statements for prior periods presented within this Schedule I were retrospectively adjusted to furnish comparative information.
|
The "Notes to Consolidated Financial Statements" of Delek US Holdings, Inc., beginning on page F-13 of this
Form 10-K are an integral part of these condensed financial statements.
F-66
ITEM 16.
FORM 10-K SUMMARY
None.
103
SIGNATURES
Pursuant to the requirements of Section 13 or 15(d) of the Securities Exchange Act of 1934, the registrant has duly caused this report to be signed on its behalf by the undersigned, thereunto duly authorized.
Delek US Holdings, Inc.
By:
/s/ Kevin L. Kremke
Kevin Kremke
Executive Vice President and Chief Financial Officer
Dated:
February 28, 2018
Pursuant to the requirements of the Securities Exchange Act of 1934, this report has been signed below by or on behalf of the following persons on behalf of the registrant and in the capacities indicated on
February 28, 2018
:
/s/ Ezra Uzi Yemin
Ezra Uzi Yemin
Director (Chairman), President and Chief Executive Officer
(Principal Executive Officer)
/s/ William J. Finnerty*
William J. Finnerty
Director
/s/ Carlos E. Jorda*
Carlos E. Jorda
Director
/s/ Charles H. Leonard*
Charles H. Leonard
Director
/s/ Gary M. Sullivan, Jr*
Gary M. Sullivan, Jr.
Director
/s/ Shlomo Zohar*
Shlomo Zohar
Director
/s/ David Wiessman*
David Wiessman
Director
/s/ Kevin Kremke
Kevin Kremke
Executive Vice President and Chief Financial Officer
(Principal Financial and Accounting Officer)
*By:
/s/ Kevin Kremke
Kevin Kremke
as Attorney-in-Fact
104
TABLE OF CONTENTS
Part IItem 1A. Risk FactorsItem 1B. Unresolved Staff CommentsItem 3. Legal ProceedingsItem 4. Mine Safety DisclosuresPart IIItem 5. Market For Registrant's Common Equity, Related Stockholder Matters and Issuer Purchases Of Equity SecuritiesItem 6. Selected Financial DataItem 7. Management S Discussion and Analysis Of Financial Condition and Results Of OperationsItem 7A. Quantitative and Qualitative Disclosures About Market RiskItem 8. Financial Statements and Supplementary DataItem 9. Changes in and Disagreements with Accountants on Accounting and Financial DisclosureItem 9A. Controls and ProceduresItem 9B. Other InformationPart IIIItem 10. Directors, Executive Officers and Corporate GovernanceItem 11. Executive CompensationItem 12. Security Ownership Of Certain Beneficial Owners and Management and Related Stockholder MattersItem 13. Certain Relationships and Related Transactions and Director IndependenceItem 14. Principal Accountant Fees and ServicesPart IVItem 15. Exhibits and Financial Statement SchedulesItem 16. Form 10-k Summary