DELEK LOGISTICS PARTNERS, LP
UNITED STATES
SECURITIES AND EXCHANGE COMMISSION
Washington, D.C. 20549
Form 10-Q
(Mark One)
|
þ
|
|
QUARTERLY REPORT PURSUANT TO SECTION 13 OR 15(d) OF THE SECURITIES EXCHANGE ACT OF 1934
|
||
|
For the quarterly period ended June 30, 2018
|
||||
or
|
o
|
|
TRANSITION REPORT PURSUANT TO SECTION 13 OR 15(d) OF THE SECURITIES EXCHANGE ACT OF 1934
|
|
For the transition period from to
|
||
Commission file number 001-35721
DELEK LOGISTICS PARTNERS, LP
(Exact name of registrant as specified in its charter)
|
Delaware
|
|
45-5379027
|
|
(State or other jurisdiction of
|
|
(I.R.S. Employer
|
|
incorporation or organization)
|
|
Identification No.)
|
|
|
|
|
|
7102 Commerce Way
|
|
|
|
Brentwood, Tennessee
|
|
37027
|
|
(Address of principal executive offices)
|
|
(Zip Code)
|
(615) 771-6701
(Registrant’s telephone number, including area code)
Not Applicable
(Former name, former address and former fiscal year, if changed since last report)
Indicate by check mark whether the registrant: (1) has filed all reports required to be filed by Section 13 or 15(d) of the Securities Exchange Act of 1934 during the preceding 12 months (or for such shorter period that the registrant was required to file such reports), and (2) has been subject to such filing requirements for the past 90 days. Yes
þ
No
o
Indicate by check mark whether the registrant has submitted electronically every Interactive Data File required to be submitted pursuant to Rule 405 of Regulation S-T during the preceding 12 months (or for such shorter period that the registrant was required to submit such files). Yes
þ
No
o
Indicate by check mark whether the registrant is a large accelerated filer, an accelerated filer, a non-accelerated filer, a smaller reporting company, or an emerging growth company. See the definitions of “large accelerated filer,” “accelerated filer,” “smaller reporting company,” and "emerging growth company" in Rule 12b-2 of the Exchange Act.
|
Large accelerated filer
o
|
|
Accelerated filer
þ
|
|
Non-accelerated filer
o
|
|
Smaller reporting company
o
|
Emerging growth company
o
|
|
If an emerging growth company, indicate by check mark if the registrant has elected not to use the extended transition period for complying with any new or revised financial accounting standards provided pursuant to Section 13(a) of the Exchange Act.
o
Indicate by check mark whether the registrant is a shell company (as defined in Rule 12b-2 of the Exchange Act). Yes
o
No
þ
At
August 3, 2018
, there were
24,395,183
common limited partner units and
497,861
general partner units outstanding.
TABLE OF CONTENTS
|
|
|
|
|
|
|
|
|
|
|
|
|
|
|
|
|
|
|
|
|
|
|
|
|
|
|
|
|
|
|
|
|
|
|
|
2
FINANCIAL INFORMATION
Item 1.
Financial Statements
Delek Logistics Partners, LP
(in thousands, except unit and per unit data)
|
June 30, 2018
|
December 31, 2017
|
|||||||
|
ASSETS
|
||||||||
|
Current assets:
|
|
|
||||||
|
Cash and cash equivalents
|
$
|
5,177
|
|
$
|
4,675
|
|
||
|
Accounts receivable
|
21,881
|
|
23,013
|
|
||||
|
Accounts receivable from related parties
|
9,651
|
|
1,124
|
|
||||
|
Inventory
|
12,715
|
|
20,855
|
|
||||
|
Other current assets
|
697
|
|
783
|
|
||||
|
Total current assets
|
50,121
|
|
50,450
|
|
||||
|
Property, plant and equipment:
|
|
|
||||||
|
Property, plant and equipment
|
446,961
|
|
367,179
|
|
||||
|
Less: accumulated depreciation
|
(127,628
|
)
|
(112,111
|
)
|
||||
|
Property, plant and equipment, net
|
319,333
|
|
255,068
|
|
||||
|
Equity method investments
|
106,432
|
|
106,465
|
|
||||
|
Goodwill
|
12,203
|
|
12,203
|
|
||||
|
Intangible assets, net
|
157,643
|
|
15,917
|
|
||||
|
Other non-current assets
|
4,617
|
|
3,427
|
|
||||
|
Total assets
|
$
|
650,349
|
|
$
|
443,530
|
|
||
|
LIABILITIES AND DEFICIT
|
|
|
||||||
|
Current liabilities:
|
|
|||||||
|
Accounts payable
|
$
|
9,319
|
|
$
|
19,147
|
|
||
|
Excise and other taxes payable
|
4,590
|
|
4,700
|
|
||||
|
Tank inspection liabilities
|
902
|
|
902
|
|
||||
|
Pipeline release liabilities
|
1,037
|
|
1,000
|
|
||||
|
Accrued expenses and other current liabilities
|
5,282
|
|
6,033
|
|
||||
|
Total current liabilities
|
21,130
|
|
31,782
|
|
||||
|
Non-current liabilities:
|
|
|
||||||
|
Long-term debt
|
737,139
|
|
422,649
|
|
||||
|
Asset retirement obligations
|
5,007
|
|
4,064
|
|
||||
|
Other non-current liabilities
|
16,035
|
|
14,260
|
|
||||
|
Total non-current liabilities
|
758,181
|
|
440,973
|
|
||||
|
Deficit:
|
||||||||
|
Common unitholders - public; 9,101,137 units issued and outstanding at June 30, 2018 (9,088,587 at December 31, 2017)
|
173,607
|
|
174,378
|
|
||||
|
Common unitholders - Delek; 15,294,046 units issued and outstanding at June 30, 2018 (15,294,046 at December 31, 2017)
|
(295,247
|
)
|
(197,206
|
)
|
||||
|
General partner - 497,861 units issued and outstanding at June 30, 2018 (497,604 at December 31, 2017)
|
(7,322
|
)
|
(6,397
|
)
|
||||
|
Total deficit
|
(128,962
|
)
|
(29,225
|
)
|
||||
|
Total liabilities and deficit
|
$
|
650,349
|
|
$
|
443,530
|
|
||
See accompanying notes to the condensed consolidated financial statements
3
Delek Logistics Partners, LP
(in thousands, except unit and per unit data)
|
Three Months Ended
|
Six Months Ended
|
|||||||||||||||
|
June 30,
|
June 30,
|
|||||||||||||||
|
2018
|
2017
|
2018
|
2017
|
|||||||||||||
|
Net revenues:
|
||||||||||||||||
|
Affiliates
|
$
|
53,080
|
|
$
|
39,824
|
|
$
|
114,724
|
|
$
|
76,443
|
|
||||
|
Third party
|
113,200
|
|
86,945
|
|
219,477
|
|
179,799
|
|
||||||||
|
Net revenues
|
166,280
|
|
126,769
|
|
334,201
|
|
256,242
|
|
||||||||
|
Operating costs and expenses:
|
|
|||||||||||||||
|
Cost of goods sold
|
106,016
|
|
85,039
|
|
225,048
|
|
177,629
|
|
||||||||
|
Operating expenses
|
14,917
|
|
9,966
|
|
27,494
|
|
20,324
|
|
||||||||
|
General and administrative expenses
|
3,747
|
|
2,656
|
|
6,722
|
|
5,504
|
|
||||||||
|
Depreciation and amortization
|
7,019
|
|
5,742
|
|
13,019
|
|
10,935
|
|
||||||||
|
(Gain) loss on asset disposals
|
(129
|
)
|
(5
|
)
|
(69
|
)
|
7
|
|
||||||||
|
Total operating costs and expenses
|
131,570
|
|
103,398
|
|
272,214
|
|
214,399
|
|
||||||||
|
Operating income
|
34,710
|
|
23,371
|
|
61,987
|
|
41,843
|
|
||||||||
|
Interest expense, net
|
10,926
|
|
5,462
|
|
18,988
|
|
9,533
|
|
||||||||
|
Income from equity method investments
|
(1,899
|
)
|
(1,176
|
)
|
(2,757
|
)
|
(1,421
|
)
|
||||||||
|
Total non-operating expenses, net
|
9,027
|
|
4,286
|
|
16,231
|
|
8,112
|
|
||||||||
|
Income before income tax expense
|
25,683
|
|
19,085
|
|
45,756
|
|
33,731
|
|
||||||||
|
Income tax expense
|
101
|
|
108
|
|
179
|
|
159
|
|
||||||||
|
Net income attributable to partners
|
$
|
25,582
|
|
$
|
18,977
|
|
$
|
45,577
|
|
$
|
33,572
|
|
||||
|
Comprehensive income attributable to partners
|
$
|
25,582
|
|
$
|
18,977
|
|
$
|
45,577
|
|
$
|
33,572
|
|
||||
|
Less: General partner's interest in net income, including incentive distribution rights
|
6,212
|
|
4,552
|
|
11,842
|
|
8,661
|
|
||||||||
|
Limited partners' interest in net income
|
$
|
19,370
|
|
$
|
14,425
|
|
$
|
33,735
|
|
$
|
24,911
|
|
||||
|
Net income per limited partner unit:
|
||||||||||||||||
|
Common units - (basic)
|
$
|
0.79
|
|
$
|
0.59
|
|
$
|
1.38
|
|
$
|
1.02
|
|
||||
|
Common units - (diluted)
|
$
|
0.79
|
|
$
|
0.59
|
|
$
|
1.38
|
|
$
|
1.02
|
|
||||
|
Weighted average limited partner units outstanding:
|
||||||||||||||||
|
Common units - (basic)
|
24,386,031
|
|
24,335,338
|
|
24,384,341
|
|
24,331,991
|
|
||||||||
|
Common units - (diluted)
|
24,394,103
|
|
24,375,946
|
|
24,391,760
|
|
24,371,540
|
|
||||||||
|
Cash distributions per limited partner unit
|
$
|
0.770
|
|
$
|
0.705
|
|
$
|
1.520
|
|
$
|
1.395
|
|
||||
See accompanying notes to the condensed consolidated financial statements
4
Delek Logistics Partners, LP
(in thousands)
|
Six Months Ended June 30,
|
||||||||
|
2018
|
2017
|
|||||||
|
Cash flows from operating activities:
|
||||||||
|
Net income
|
$
|
45,577
|
|
$
|
33,572
|
|
||
|
Adjustments to reconcile net income to net cash provided by operating activities:
|
||||||||
|
Depreciation and amortization
|
13,019
|
|
10,935
|
|
||||
|
Amortization of customer contract intangible assets
|
2,404
|
|
—
|
|
||||
|
Amortization of deferred revenue
|
(723
|
)
|
(601
|
)
|
||||
|
Amortization of deferred financing costs and debt discount
|
1,334
|
|
830
|
|
||||
|
Accretion of asset retirement obligations
|
175
|
|
146
|
|
||||
|
Deferred income taxes
|
—
|
|
119
|
|
||||
|
Income from equity method investments
|
(2,757
|
)
|
(1,421
|
)
|
||||
|
Dividends from equity method investments
|
2,302
|
|
278
|
|
||||
|
(Gain) loss on asset disposals
|
(69
|
)
|
7
|
|
||||
|
Unit-based compensation expense
|
302
|
|
364
|
|
||||
|
Changes in assets and liabilities:
|
|
|
||||||
|
Accounts receivable
|
1,132
|
|
932
|
|
||||
|
Inventories and other current assets
|
8,226
|
|
2,041
|
|
||||
|
Accounts payable and other current liabilities
|
(9,123
|
)
|
1,479
|
|
||||
|
Accounts receivable/payable to related parties
|
(8,446
|
)
|
(1,352
|
)
|
||||
|
Non-current assets and liabilities, net
|
(1,710
|
)
|
(419
|
)
|
||||
|
Net cash provided by operating activities
|
51,643
|
|
46,910
|
|
||||
|
Cash flows from investing activities:
|
|
|
||||||
|
Purchase of Big Spring logistics assets, net of assumed ARO liabilities
|
(72,376
|
)
|
—
|
|
||||
|
Purchases of property, plant and equipment
|
(5,949
|
)
|
(5,867
|
)
|
||||
|
Proceeds from sales of property, plant and equipment
|
356
|
|
—
|
|
||||
|
Purchases of intangible assets
|
(144,219
|
)
|
—
|
|
||||
|
Distributions from equity method investments
|
660
|
|
501
|
|
||||
|
Equity method investment contributions
|
(172
|
)
|
(2,937
|
)
|
||||
|
Net cash used in investing activities
|
(221,700
|
)
|
(8,303
|
)
|
||||
|
Cash flows from financing activities:
|
|
|
||||||
|
Proceeds from issuance of additional units to maintain 2% General Partner interest
|
13
|
|
21
|
|
||||
|
Distributions to general partner
|
(10,810
|
)
|
(8,231
|
)
|
||||
|
Distributions to common unitholders - public
|
(13,463
|
)
|
(12,816
|
)
|
||||
|
Distributions to common unitholders - Delek
|
(22,558
|
)
|
(20,772
|
)
|
||||
|
Distributions to Delek unitholders and general partner related to Big Spring Logistic Assets Acquisition
|
(98,798
|
)
|
—
|
|
||||
|
Proceeds from revolving credit facility
|
517,000
|
|
139,400
|
|
||||
|
Payments of revolving credit facility
|
(203,000
|
)
|
(377,500
|
)
|
||||
|
Proceeds from issuance of senior notes
|
—
|
|
248,112
|
|
||||
|
Deferred financing costs paid
|
(525
|
)
|
(5,816
|
)
|
||||
|
Reimbursement of capital expenditures by Delek
|
2,700
|
|
3,835
|
|
||||
|
Net cash provided by (used in) financing activities
|
170,559
|
|
(33,767
|
)
|
||||
|
Net increase in cash and cash equivalents
|
502
|
|
4,840
|
|
||||
|
Cash and cash equivalents at the beginning of the period
|
4,675
|
|
59
|
|
||||
|
Cash and cash equivalents at the end of the period
|
$
|
5,177
|
|
$
|
4,899
|
|
||
|
Supplemental disclosures of cash flow information:
|
|
|
||||||
|
Cash paid during the period for:
|
|
|
||||||
|
Interest
|
$
|
17,890
|
|
$
|
6,940
|
|
||
|
Income taxes
|
$
|
2
|
|
$
|
29
|
|
||
|
Non-cash investing activities:
|
|
|
|
|
||||
|
Decrease in accrued capital expenditures
|
$
|
(1,529
|
)
|
$
|
(957
|
)
|
||
|
Non-cash financing activities:
|
||||||||
|
Sponsor contribution of fixed assets
|
$
|
—
|
|
$
|
67
|
|
||
See accompanying notes to the condensed consolidated financial statements
5
Delek Logistics Partners, LP
Notes to Condensed Consolidated Financial Statements (Unaudited)
1
. Organization and Basis of Presentation
As used in this report, the terms "Delek Logistics Partners, LP," the "Partnership," "we," "us," or "our" may refer to Delek Logistics Partners, LP, one or more of its consolidated subsidiaries or all of them taken as a whole.
The Partnership is a Delaware limited partnership formed in April 2012 by Old Delek (as defined below) and its subsidiary Delek Logistics GP, LLC, our general partner (our "general partner").
In January 2017, Delek US Holdings, Inc. ("Old Delek") (and various related entities) entered into an Agreement and Plan of Merger with Alon USA Energy, Inc. (NYSE: ALJ) ("Alon USA"), as subsequently amended on February 27 and April 21, 2017 (as so amended, the "Merger Agreement"). The related merger (the "Delek/Alon Merger") was effective July 1, 2017 (the “Effective Time”), resulting in a new post-combination consolidated registrant renamed Delek US Holdings, Inc. (“New Delek”), with Alon USA and Old Delek surviving as wholly-owned subsidiaries. New Delek is the successor issuer to Old Delek and Alon USA pursuant to Rule 12g-3(c) under the Securities Exchange Act of 1934, as amended (the "Exchange Act"). Unless the context otherwise requires, references in this report to "Delek" refer collectively to Old Delek with respect to periods prior to July 1, 2017, or New Delek, with respect to periods on or after July 1, 2017, and any of Old Delek's or New Delek's, as applicable, subsidiaries, other than the Partnership and its subsidiaries and its general partner.
Effective
March 1, 2018
, the Partnership, through its wholly-owned subsidiary DKL Big Spring, LLC, acquired from Delek certain logistics assets primarily located at or adjacent to Delek's refinery near Big Spring, Texas (the "Big Spring Refinery") and Delek's light products distribution terminal located in Stephens County, Oklahoma (collectively, the "Big Spring Logistic Assets"), such transaction the "Big Spring Logistic Assets Acquisition." See
Note 2
for further information regarding the Big Spring Logistic Assets Acquisition.
Certain information and footnote disclosures normally included in annual financial statements prepared in accordance with U.S. generally accepted accounting principles ("U.S. GAAP") have been condensed or omitted, although management believes that the disclosures herein are adequate to make the financial information presented not misleading. Our unaudited condensed consolidated financial statements have been prepared in conformity with U.S. GAAP applied on a consistent basis with those of the annual audited financial statements included in our Annual Report on Form 10-K for the year ended
December 31, 2017
(our "Annual Report on Form 10-K"), filed with the Securities and Exchange Commission (the "SEC") on March 1, 2018. These unaudited condensed consolidated financial statements should be read in conjunction with the audited consolidated financial statements and notes thereto for the year ended
December 31, 2017
included in our Annual Report on Form 10-K.
In the opinion of management, all adjustments necessary for a fair presentation of the financial position and the results of operations for the interim periods presented have been included. All significant intercompany transactions and account balances have been eliminated in the consolidation. Such intercompany transactions do not include those with Delek or our general partner. All adjustments are of a normal, recurring nature. Operating results for the interim period should not be viewed as representative of results that may be expected for any future interim period or for the full year.
New Accounting Pronouncements
In August 2017, the FASB issued guidance to better align financial reporting for hedging activities with the economic objectives of those activities for both financial (e.g., interest rate) and commodity risks. The guidance was intended to create more transparency in the presentation of financial results, both on the face of the financial statements and in the footnotes, and simplify the application of hedge accounting guidance. This guidance is effective for fiscal years beginning after December 15, 2018, and interim periods within those fiscal years. Companies are required to apply the guidance on a modified retrospective transition method in which the cumulative effect of the change will be recognized within equity in the consolidated balance sheet as of the date of adoption. Early adoption is permitted, including in an interim period. If a company early adopts in an interim period, any adjustments should be reflected as of the beginning of the fiscal year that includes the interim period. We expect to adopt this guidance on or before the effective date and are currently evaluating the impact that adopting this new guidance will have on our business, financial condition and results of operations.
In May 2017, the FASB issued guidance that clarifies when changes to the terms or conditions of a share-based payment award must be accounted for as modifications. The modification accounting guidance applies if the value, vesting conditions or classification of the award changes. This guidance is effective for fiscal years beginning after December 15, 2017, and interim periods within those fiscal years. This guidance should be applied prospectively to an award modified on or after the adoption date. We adopted this guidance on January 1, 2018 and the adoption did not have a material impact on our business, financial condition or results of operations.
6
In February 2017, the FASB issued guidance clarifying the scope of asset derecognition guidance and accounting for partial sales of nonfinancial assets. The amendments in this guidance should be applied using either i) a modified retrospective basis through a cumulative-effect adjustment directly to retained earnings as of the beginning of the period of adoption or ii) a retrospective basis to each period presented in the financial statements. This guidance is effective for annual reporting periods beginning after December 15, 2017, including interim reporting periods within that reporting period. We adopted this guidance on January 1, 2018, and the adoption did not have a material impact on our business, financial condition or results of operations.
In January 2017, the FASB issued guidance concerning the goodwill impairment test that eliminates Step 2, which required a comparison of the implied fair value of goodwill of the reporting unit with the carrying amount of that goodwill for that reporting unit. It also eliminates the requirements for any reporting unit with a zero or negative carrying amount to perform a qualitative assessment and, if it fails that qualitative assessment, to perform Step 2 of the goodwill impairment test. An entity still has the option to perform the qualitative assessment for a reporting unit to determine if the quantitative impairment test is necessary. This guidance is effective for annual or any interim goodwill impairment tests in fiscal years beginning after December 15, 2019. Early adoption is permitted for interim or annual goodwill impairment tests performed on testing dates after January 1, 2017. We expect to adopt this guidance on or before the effective date and we do not anticipate that the adoption will have a material impact on our business, financial condition or results of operations.
In August 2016, the FASB issued guidance that clarifies eight cash flow classification issues pertaining to cash receipts and cash payments. This guidance is effective for fiscal years beginning after December 15, 2017, and interim periods within those fiscal years. We adopted this guidance on January 1, 2018 and the adoption did not have a material impact on our business, financial condition or results of operations, except for reclassifications of certain distributions received from equity method investees using the cumulative earnings approach. Under this approach, distributions received are considered returns on investment and classified as cash inflows from operating activities, unless the investor’s cumulative distributions received less distributions received in prior periods that were determined to be returns of investment exceed cumulative equity in earnings (as adjusted for amortization of basis differences) recognized by the investor. When such an excess occurs, the current-period distributions up to this excess should be considered a return of investment and classified as cash inflows from investing activities. This resulted in a reclassification of
$0.5 million
of distributions received in the
six
months ended
June 30, 2017
from the line item entitled dividends from equity method investments in net cash provided by operating activities to the line item entitled distributions from equity method investments in net cash used in investing activities in the condensed consolidated statements of cash flows.
In February 2016, the FASB issued guidance that requires the recognition of a lease liability and a right-of-use asset, initially measured at the present value of the lease payments, in the statement of financial condition for all leases with terms longer than one year. Lessor accounting will remain substantially similar to current guidance. This guidance is effective for fiscal years beginning after December 15, 2018, including interim periods within those fiscal years. Early adoption is permitted. In January 2018, the FASB amended the guidance to provide an optional practical expedient to rights of way. The practical expedient permits an entity to not evaluate under the new lease accounting guidance existing or expired rights of way that were not previously accounted for as leases. However, any new or modified rights of way should be evaluated under the new lease accounting guidance. If not elected, an entity should evaluate all existing or expired rights of way in connection with the adoption of the new lease requirement to assess whether they meet the definition of a lease. In July 2018, the FASB amended the guidance to provide a practical expedient regarding the requirement to recast prior periods for the new lease guidance. If elected, comparative periods in transition are not required to be recast, and a cumulative effect of initially applying the guidance will be recognized to the opening balance of retained earnings in the period of adoption. If not elected, we are required to use the modified retrospective adoption method to apply this guidance, under which the cumulative effect of initially applying the guidance will be recognized as an adjustment to the opening balance of retained earnings in the earliest period presented as of the adoption period. We expect to adopt the new lease standard on January 1, 2019 and elect the practical expedient regarding transition. We are currently evaluating the impact adopting this new guidance will have on our business, financial condition and results of operations. As part of our efforts to prepare for adoption, beginning in 2018, we formed a project implementation team, as well as a project timeline, to evaluate this guidance. We have also reviewed and gained an understanding of the new lease accounting guidance and substantially completed lease classification analysis for existing leases. We continue to perform scoping to identify and evaluate arrangements that will qualify as leases under the new standard, as well as to review industry specific implementation guidance. We are continuing to evaluate the impact of the guidance on our business processes, accounting systems, controls and financial statement disclosures, and expect to implement any changes to accommodate the new accounting and disclosure requirements prior to adoption on January 1, 2019.
In January 2016, the FASB issued guidance that affects the accounting for equity investments, financial liabilities accounted for under the fair value option and the presentation and disclosure requirements for financial instruments. Under the new guidance, all equity investments in unconsolidated entities (other than those accounted for using the equity method of accounting) will generally be measured at fair value through earnings. There will no longer be an available-for-sale classification for equity securities with readily determinable fair values. For financial liabilities when the fair value option has been elected, changes in fair value due to instrument-specific credit risk will be recognized separately in other comprehensive income. It will require public business entities to use the exit price notion when measuring the fair value of financial instruments for disclosure purposes and separate presentation of financial assets and financial liabilities by measurement category and form of financial asset, and will eliminate the requirement for public business entities to disclose the method and significant assumptions used to estimate the fair value that is required to be disclosed for financial instruments measured at amortized cost. The new guidance is effective for annual reporting periods beginning after December 15, 2017, including interim reporting periods within that reporting period. We adopted this guidance on January 1, 2018, and the adoption did not have a material impact on our business, financial condition or results of operations.
7
In May 2014, the FASB issued guidance as codified in Accounting Standards Codification ("ASC") 606, “Revenue from Contracts with Customers ("ASC 606),” to clarify the principles for recognizing revenue. The core principle of the new guidance is that an entity should recognize revenue to depict the transfer of promised goods or services to customers in an amount that reflects the consideration to which the entity expects to be entitled in exchange for those goods or services. The guidance also requires improved interim and annual disclosures that enable the users of financial statements to better understand the nature, amount, timing, and uncertainty of revenues and cash flows arising from contracts with customers. The new guidance is effective for annual reporting periods beginning after December 15, 2017, including interim reporting periods within that reporting period, and can be adopted retrospectively. We adopted this guidance on January 1, 2018, using the modified retrospective transition method applied to contracts which were not completed as of January 1, 2018, and the adoption did not have a material impact on our business, financial condition or results of operations.
The Partnership has updated its policies as it relates to revenue recognition. Revenue is measured based on consideration specified in a contract with a customer. The Partnership recognizes revenue when it satisfies a performance obligation by transferring control over a product or by providing a service to a customer. The adoption of ASC 606 did not materially change our revenue recognition patterns. Revenues for products sold are generally recognized upon delivery of the product, which is when title and control of the product is transferred. Transaction prices for these products are typically at market rates for the product at the time of delivery. Service revenues are recognized as crude oil, intermediate and refined product are shipped through, delivered by or stored in our pipelines, trucks, terminals and storage facility assets, as applicable. We do not recognize product revenues for these services as the product does not represent a promised good in the context of ASC 606. All service revenues are based on regulated tariff rates or contractual rates. Payment terms require customers to pay shortly after delivery and do not contain significant financing components.
Certain agreements for gathering, transportation, storage, terminalling, and offloading with Delek are considered operating leases under ASC 840,
Leases
. We identified the separate lease and service components of our revenues under these leases and applied ASC 606 only to the service component, while the lease component continued to be accounted for under ASC 840. Refer to
Note 4
for further information.
Up-front Payments to Customers
. We record all up-front payments to customers in accordance with the provisions of ASC 606. We evaluate the nature of each payment, the rights and obligations under the related contract, and whether the payment meets the definition of an asset. When an asset is recognized for an up-front payment to a customer, the asset is amortized, as a reduction of revenue, in a manner that reflects the pattern and period over which the asset is expected to provide benefit.
Sales, Use and Excise Taxes
. Upon
the adoption of ASC 606,
we made the accounting policy election to exclude from revenue all taxes assessed by a governmental authority, including sales, use and excise taxes, that are both imposed on and concurrent with a specific revenue-producing transaction and collected from a customer. Historically, we have excluded sales, use and excise taxes from revenue in accordance with the applicable guidance in ASC 605,
Revenue Recognition
.
2
.
Acquisitions
Big Spring Logistic Assets Acquisition
Effective
March 1, 2018
, the Partnership, through its wholly-owned subsidiary DKL Big Spring, LLC, acquired the Big Spring Logistic Assets from Delek, which are primarily located at or adjacent to the Big Spring Refinery. The total purchase price was
$170.8 million
, subject to certain post-closing adjustments, financed through borrowings under the Partnership’s revolving credit facility.
The Big Spring Logistic Assets include:
|
•
|
Approximately
75
storage tanks and certain ancillary assets (such as tank pumps and piping) primarily located adjacent to the Big Spring Refinery;
|
|
•
|
An asphalt terminal and a light products terminal;
|
|
•
|
Certain crude oil and refined product pipelines; and
|
|
•
|
Other logistics assets, such as
four
underground saltwells used for natural gas liquids storage.
|
In connection with the closing of the transaction, Delek, the Partnership and various of their respective subsidiaries entered into and amended certain existing contracts, including entering into new pipelines, storage and throughput facilities and asphalt services agreements. The transaction and related agreements were approved by the Conflicts Committee of the Partnership's general partner, which is comprised solely of independent directors. See
Note 3
for more detailed descriptions of these agreements.
The Big Spring Logistic Assets Acquisition was considered a transaction between entities under common control. Accordingly, the Big Spring Logistic Assets were recorded at amounts based on Delek's historical carrying value as of the acquisition date. The excess of the cash paid over the historical book value of the assets acquired from Delek amounted to
$98.8 million
and was recorded in equity. The carrying value of the Big Spring Logistic Assets as of the acquisition date was
$72.0 million
, which is net of
$0.8 million
of assumed asset retirement obligations liabilities.
8
Prior periods have not been recast, as these assets do not constitute a business in accordance with Accounting Standard Update 2017-01, "Clarifying the Definition of a Business". We capitalized approximately
$0.4 million
of acquisition costs related to the Big Spring Logistic Assets Acquisition during the
six
months ended
June 30, 2018
. We did not capitalize any acquisition costs during the three months ended
June 30, 2018
.
Marketing Contract Intangible Acquisition
Additionally, concurrent with the Big Spring Logistic Assets Acquisition, Delek, the Partnership and various of their respective subsidiaries entered into a new marketing agreement, whereby the Partnership markets certain finished products produced at or sold from the Big Spring Refinery to various customers in return for a marketing fee (the "Marketing Contract Intangible Acquisition"). We recorded a related contract intangible asset in the amount of
$144.2 million
based on the amount paid to enter into the contract, which represents the fair value of the intangible asset. The contract intangible asset will be amortized over a
twenty
year period as a component of net revenues from affiliates. The total consideration paid was financed through borrowings under the Partnership's revolving credit facility. This transaction and related marketing agreement were approved by the Conflicts Committee of the Partnership's general partner, which is comprised solely of independent directors. See
Note 3
for a more detailed description of this marketing agreement.
3
. Related Party Transactions
Commercial Agreements
The Partnership has a number of long-term, fee based commercial agreements with Delek under which we provide various services, including crude oil gathering and crude oil, intermediate and refined products transportation and storage services, and marketing, terminalling and offloading services to Delek. Most of these agreements have an initial term ranging from
five
to
ten
years, which may be extended for various renewal terms at the option of Delek. In November 2017, Delek opted to renew certain of these agreements for subsequent
five
-year terms expiring in November 2022. In the case of our marketing agreement with Delek in respect to the Tyler refinery, the initial term has been extended through 2026. The fees under each agreement are payable to us monthly by Delek or certain third parties to whom Delek has assigned certain of its rights and are generally subject to increase or decrease on July 1 of each year, by the amount of any change in various inflation-based indices, including the Federal Energy Regulatory Commission ("FERC") oil pipeline index or various iterations of the consumer price index ("CPI") and the producer price index ("PPI"); provided, however, that in no event will the fees be adjusted below the amount initially set forth in the applicable agreement. In most circumstances, if Delek or the applicable third party assignee fails to meet or exceed the minimum volume or throughput commitment during any calendar quarter, Delek, and not any third party assignee, will be required to make a quarterly shortfall payment to us equal to the volume of the shortfall multiplied by the applicable fee, subject to certain exceptions as specified in the applicable agreement. Carry-over of any volumes or revenue in excess of such commitment to any subsequent quarter is not permitted.
See our Annual Report on Form 10-K for a more complete description of certain of our commercial agreements and other agreements with Delek.
9
During the
six
months ended
June 30, 2018
, we entered into the following material agreements with Delek:
|
Asset/Operation
|
Initiation Date
|
Initial/Maximum Term (years)
(1)
|
Service
|
Minimum Throughput Commitment (bpd)
|
Fee
(2)
|
|||||
|
Pipelines, Storage and Throughput Facilities Agreement (Big Spring):
|
||||||||||
|
Crude Oil and Refined Products Throughput
|
March 1, 2018
|
10/15
|
Pipeline Throughput
|
104,300
|
$0.05/bbl
|
|||||
|
Rail Offloading
|
March 1, 2018
|
10/15
|
Offloading Services
|
4,500
|
$0.40/bbl
|
|||||
|
Terminalling
|
March 1, 2018
|
10/15
|
Dedicated Terminalling Services
|
29,250
|
$0.66/bbl
|
|||||
|
Storage
|
March 1, 2018
|
10/15
|
Storage
|
N/A
|
$1,374,630/month
|
|||||
|
Asphalt Services Agreement (Big Spring):
|
||||||||||
|
Terminalling
|
March 1, 2018
|
10/15
|
Dedicated Asphalt Terminalling
|
1,020 to 2,380 based on seasonality
|
$8.30/bbl
|
|||||
|
Storage
|
March 1, 2018
|
10/15
|
Storage
|
N/A
|
$456,490/month
|
|||||
|
Marketing Agreement (Big Spring):
|
||||||||||
|
Marketing Services
|
March 1, 2018
|
10/15
|
Dedicated Marketing and Selling
|
65,000
|
$0.50 - $0.71/bbl
|
|||||
(1)
Maximum term gives effect to the extension by (i) the Partnership of the Pipelines, Storage and Throughput Facilities Agreement and Asphalt Services Agreement pursuant to the terms thereof and (ii) Delek of the Marketing Agreement pursuant to the terms thereof. Maximum term excludes the impact of the automatic annual renewal of these agreements, unless terminated by either party, subsequent to the extension.
(2)
Fees payable to the Partnership by Delek.
Big Spring Pipeline, Storage and Throughput Facilities Agreement.
In connection with the Big Spring Logistic Assets Acquisition, Alon USA, LP, a Texas limited partnership and an indirect, wholly-owned subsidiary of Delek (“Alon USA, LP”), and DKL Big Spring, LLC, a Delaware limited liability company and a wholly-owned subsidiary of the Partnership (the "Buyer"), entered into the Pipelines, Storage and Throughput Facilities Agreement (Big Spring Refinery Logistic Assets and Duncan Terminal) (the “Logistics Agreement”). Under the Logistics Agreement, the Buyer will provide storage and throughput services at certain of the Big Spring Logistic Assets for Alon USA, LP. The Buyer will act as bailee of crude oil and refined petroleum products owned by Alon USA, LP or its assignee held in such assets owned and operated by the Buyer. The Buyer will charge fees to Alon USA, LP based on throughput volumes received or delivered ranging from
$0.05
to
$0.66
per barrel and related storage fees depending on the type of service or product. The fees under the Logistics Agreement may be adjusted annually for inflation. The initial term of the Logistics Agreement is
ten
years; the Buyer has a one-time option to extend the Logistics Agreement for up to
five
additional years; and the Logistics Agreement will continue on a year-to-year basis following such renewal term unless terminated by either party.
Big Spring Asphalt Services Agreement.
In connection with the Big Spring Logistic Assets Acquisition, Alon USA, LP and the Buyer entered into the Big Spring Asphalt Services Agreement (the “Asphalt Services Agreement”). Under the Asphalt Services Agreement, the Buyer will provide asphalt storage and handling services at certain of the Big Spring Logistic Assets (such assets, the “Asphalt Facilities”). The Buyer will provide services to Alon USA, LP at the Asphalt Facilities and serve as bailee of all raw materials, and other hydrocarbons, used to make asphalt products owned by Alon USA, LP or its assignee held in the Asphalt Facilities. The Buyer will charge fees to Alon USA, LP based on throughput
10
volumes delivered of
$8.30
per barrel and related storage fees. The fees under the Asphalt Services Agreement may be adjusted annually for inflation. The initial term of the Asphalt Services Agreement is
ten
years; the Buyer has a one-time option to extend the Asphalt Services Agreement for up to
five
additional years; and the Asphalt Services Agreement will continue on a year-to-year basis following such renewal term unless terminated by either party.
Big Spring Marketing Agreement.
Concurrent with the Big Spring Logistic Assets Acquisition, Alon USA, LP and the Buyer entered into the Marketing Agreement (the “Marketing Agreement”). Under the Marketing Agreement, the Buyer will provide Alon USA, LP with services for the marketing and selling of certain refined petroleum products that are produced or sold from the refinery near Big Spring, Texas. The Buyer will charge Alon USA, LP fees for such marketing and selling services of
$0.50
to
$0.71
per barrel depending on the type of product. The fees under the Marketing Agreement may be adjusted annually for inflation. The initial term of the Marketing Agreement is
ten
years; Alon USA, LP has a one-time option to extend the Marketing Agreement for up to
five
additional years; and the Marketing Agreement will continue on a year-to-year basis following such renewal term unless terminated by either party.
Omnibus Agreement.
The Partnership entered into an omnibus agreement with Delek, our general partner, Delek Logistics Operating, LLC, Lion Oil Company and certain of the Partnership's and Delek's other subsidiaries on November 7, 2012, which was subsequently amended and restated on July 26, 2013, February 10, 2014, March 31, 2015 and August 3, 2015 and was further amended effective
March 1, 2018
in connection with the Big Spring Logistic Assets Acquisition (collectively, as amended, the "Omnibus Agreement"). In conjunction with the
March 1, 2018
amendment, our obligation to pay an annual fee to Delek for its provision of centralized corporate services to the Partnership was increased to $
3.9 million
annually.
Pursuant to the terms of the Omnibus Agreement, we were reimbursed by Delek for certain capital expenditures in the amount of
$0.4 million
and
$2.7 million
during the
three and six
months ended
June 30, 2018
, respectively, and
$0.8 million
and
$3.8 million
during the
three and six
months ended
June 30, 2017
, respectively. These amounts are recorded in other long-term liabilities and are amortized to revenue over the life of the underlying revenue agreement corresponding to the asset. Ad
ditionally, we were reimbursed or indemnified, as the case may be, for costs incurred in excess of certain amounts related to certain asset failures, pursuant to the terms of the Omnibus Agreeme
nt. As of
June 30, 2018
, we have recorded an increase to accounts receivable from related parties of
$7.8 million
for these matters for which we were or expect to be reimbursed, which was recorded as a reduction to operating expense. We were reimbursed
$0.1 million
for these matters during each of the
three and six
months ended
June 30, 2018
. We were reimbursed
$0.3 million
and
$0.4 million
for these matters during the
three and six
months ended
June 30, 2017
.
Summary of Transactions
Revenues from affiliates consist primarily of revenues from gathering, transportation, storage, offloading, Renewable Identification Numbers, wholesale marketing and products terminalling services provided primarily to Delek based on regulated tariff rates or contractually based fees and product sales. Affiliate operating expenses are primarily comprised of amounts we reimburse Delek, or our general partner, as the case may be, for the services provided to us under the First Amended and Restated Agreement of Limited Partnership (the "Partnership Agreement"). These expenses could also include reimbursement and indemnification amounts from Delek, as provided under the Omnibus Agreement. Additionally, the Partnership is required to reimburse Delek for direct or allocated costs and expenses incurred by Delek on behalf of the Partnership and for charges Delek incurred for the management and operation of our logistics assets, including an annual fee for various centralized corporate services, which are included in general and administrative services. In addition to these transactions, we purchase finished products and bulk biofuels from Delek, the costs of which are included in cost of goods sold.
A summary of revenue, purchases from affiliates and expense transactions with Delek and its affiliates is as follows (in thousands)
|
Three Months Ended June 30,
|
Six Months Ended June 30,
|
|||||||||||||||
|
2018
|
2017
|
2018
|
2017
|
|||||||||||||
|
Revenues
|
$
|
53,080
|
|
$
|
39,824
|
|
$
|
114,724
|
|
$
|
76,443
|
|
||||
|
Purchases from affiliates
|
$
|
99,515
|
|
$
|
8,252
|
|
$
|
181,715
|
|
$
|
17,180
|
|
||||
|
Operating and maintenance expenses
|
$
|
11,422
|
|
$
|
6,385
|
|
$
|
18,911
|
|
$
|
13,481
|
|
||||
|
General and administrative expenses
|
$
|
2,505
|
|
$
|
1,561
|
|
$
|
3,462
|
|
$
|
3,254
|
|
||||
Quarterly Cash Distributions
Our common and general partner unitholders and the holders of incentive distribution rights ("IDRs") are entitled to receive quarterly distributions of available cash as it is determined by the board of directors of our general partner in accordance with the terms and provisions of our Partnership Agreement. In February and May
2018
, we paid quarterly cash distributions of
$22.8 million
and
$24.0 million
, respectively, of which
$16.2 million
and
$17.2 million
, respectively, were paid to Delek and our general partner. In February and May
2017
, we paid quarterly
11
cash distributions of
$20.5 million
and
$21.0 million
, of which
$14.2 million
and
$14.7 million
, respectively, were paid to Delek and our general partner. On
July 24, 2018
, our general partner's board of directors declared a quarterly cash distribution totaling
$25.0 million
, based on the available cash as of the date of determination for the end of the
second
quarter of
2018
, payable on
August 13, 2018
, of which
$18.0 million
is expected to be paid to Delek and our general partner, including the payment for the IDRs.
4
. Revenues
We generate revenue by charging fees for gathering, transporting, offloading and storing crude oil; for storing intermediate products and feed stocks; for distributing, transporting and storing refined products; for marketing refined products output of Delek's Tyler and Big Spring refineries; and for wholesale marketing in the west Texas area. A significant portion of our revenue is derived from long-term commercial agreements with Delek, which provide for annual fee adjustments for increases or decreases in the CPI, PPI or FERC index (refer to
Note 3
for a more detailed description of these agreements). In addition to the services we provide to Delek, we also generate substantial revenue from crude oil, intermediate and refined products transportation services for, and terminalling and marketing services to, third parties primarily in Texas, Tennessee and Arkansas. Certain of these services are provided pursuant to contractual agreements with third parties. Payment terms require customers to pay shortly after delivery and do not contain significant financing components.
The majority of our commercial agreements with Delek meet the definition of a lease since: (1) performance of the contracts is dependent on specified property, plant or equipment and (2) it is remote that one or more parties other than Delek will take more than a minor amount of the output associated with the specified property, plant or equipment. As part of our adoption of ASC 606, we applied the new revenue recognition standard only to the service component of these leases. The bifurcation of the lease and service components was based on an analysis of lease-related and service-related costs for each contract, adjusted for representative profit margins. The lease component continues to be accounted for under the applicable lease accounting guidance.
The following table represents a disaggregation of revenue for each reportable segment for the periods indicated (in thousands):
|
Three Months Ended June 30, 2018
|
||||||||||||
|
Pipelines and Transportation
|
Wholesale Marketing and Terminalling
|
Consolidated
|
||||||||||
|
Service Revenue - Third Party
|
$
|
3,714
|
|
$
|
493
|
|
$
|
4,207
|
|
|||
|
Service Revenue - Affiliate
(1)
|
23,160
|
|
14,581
|
|
37,741
|
|
||||||
|
Product Revenue - Third Party
|
—
|
|
108,993
|
|
108,993
|
|
||||||
|
Product Revenue - Affiliate
|
—
|
|
794
|
|
794
|
|
||||||
|
Lease Revenue - Affiliate
|
10,870
|
|
3,675
|
|
14,545
|
|
||||||
|
Total Revenue
|
$
|
37,744
|
|
$
|
128,536
|
|
$
|
166,280
|
|
|||
|
Six Months Ended June 30, 2018
|
||||||||||||
|
Pipelines and Transportation
|
Wholesale Marketing and Terminalling
|
Consolidated
|
||||||||||
|
Service Revenue - Third Party
|
$
|
7,965
|
|
$
|
802
|
|
$
|
8,767
|
|
|||
|
Service Revenue - Affiliate
(1)
|
43,057
|
|
24,147
|
|
67,204
|
|
||||||
|
Product Revenue - Third Party
|
—
|
|
210,710
|
|
210,710
|
|
||||||
|
Product Revenue - Affiliate
|
—
|
|
21,028
|
|
21,028
|
|
||||||
|
Lease Revenue - Affiliate
|
20,435
|
|
6,057
|
|
26,492
|
|
||||||
|
Total Revenue
|
$
|
71,457
|
|
$
|
262,744
|
|
$
|
334,201
|
|
|||
_____________________________
(1)
Net of
$1.8 million
and
$2.4 million
of amortization expense for the
three and six
months ended, respectively, related to a customer contract intangible asset recorded in the wholesale marketing and terminalling segment.
As of
June 30, 2018
, we expect to recognize $
1.2 billion
in service and lease revenues related to our unfulfilled performance obligations pertaining to the minimum volume commitments and capacity utilization under the non-cancelable terms of our commercial agreements with Delek. We do not disclose information about remaining performance obligations that have original expected durations of one year or less.
12
Our unfulfilled performance obligations as of
June 30, 2018
were as follows (in millions):
|
Remainder of 2018
|
$
|
87,828
|
|
|||
|
2019
|
164,646
|
|
||||
|
2020
|
164,295
|
|
||||
|
2021
|
153,541
|
|
||||
|
2022 and thereafter
|
635,164
|
|
||||
|
Total expected revenue on remaining performance obligations
|
$
|
1,205,474
|
|
|||
5
. Inventory
Inventories consisted of
$12.7 million
and
$20.9 million
of refined petroleum products as of
June 30, 2018
and
December 31, 2017
, respectively. Inventory is stated at the lower of cost or net realizable value, with cost determined on a first-in, first-out basis. We recognize lower of cost or net realizable value charges as a component of cost of goods sold in the consolidated statements of income and comprehensive income, which amounted to a nominal amount during both
three and six
month periods ended
June 30, 2018
and
2017
.
6
. Long-Term Obligations
DKL Revolver
We have a
$700.0 million
senior secured revolving credit agreement with Fifth Third Bank, as administrative agent, and a syndicate of lenders (the "DKL Revolver"). The DKL Revolver contains a dual currency borrowing tranche that permits draw downs in U.S. or Canadian dollars and an accordion feature whereby the Partnership may increase the size of the credit facility to an aggregate of
$800.0 million
, subject to receiving increased or new commitments from lenders and the satisfaction of certain other conditions precedent.
The obligations under the DKL Revolver are secured by first priority liens on substantially all of the Partnership's and its subsidiaries' tangible and intangible assets. Additionally, Delek Marketing & Supply, LLC ("Delek Marketing"), a wholly-owned subsidiary of Delek, provides a limited guaranty of the Partnership's obligations under the DKL Revolver. Delek Marketing's guaranty is (i) limited to an amount equal to the principal amount, plus unpaid and accrued interest, of a promissory note made by Delek US in favor of Delek Marketing (the "Holdings Note") and (ii) secured by Delek Marketing's pledge of the Holdings Note to the DKL Revolver lenders. As of both
June 30, 2018
and
December 31, 2017
, the principal amount of the Holdings Note was
$102.0 million
.
The DKL Revolver has a maturity date of December 30, 2019. Borrowings denominated in U.S. dollars bear interest at either a
U.S. dollar prime rate
, plus an applicable margin, or the London Interbank Offered Rate ("
LIBOR
"), plus an applicable margin, at the election of the borrowers. Borrowings denominated in Canadian dollars bear interest at either a
Canadian dollar prime rate
, plus an applicable margin, or the
Canadian Dealer Offered Rate
, plus an applicable margin, at the election of the borrowers. The applicable margin in each case varies based upon the Partnership's most recent total leverage ratio calculation delivered to the lenders, as called for and defined under the terms of the credit facility. At
June 30, 2018
, the weighted average interest rate for our borrowings under the facility was approximately
4.9%
. Additionally, the DKL Revolver requires us to pay a leverage ratio dependent quarterly fee on the average unused revolving commitment. As of
June 30, 2018
, this fee was
0.5%
per year.
As of
June 30, 2018
, we had
$493.9 million
of outstanding borrowings under the DKL Revolver, with
no
letters of credit in place. Unused credit commitments under the DKL Revolver as of
June 30, 2018
, were
$206.1 million
.
6.75%
Senior Notes Due 2025
On
May 23, 2017
, the Partnership and Delek Logistics Finance Corp., a Delaware corporation and a wholly-owned subsidiary of the Partnership (“Finance Corp.” and together with the Partnership, the “Issuers”), issued
$250.0 million
in aggregate principal amount of
6.75%
senior notes due 2025 (the “2025 Notes”) at a discount. The 2025 Notes are general unsecured senior obligations of the Issuers. The 2025 Notes are unconditionally guaranteed jointly and severally on a senior unsecured basis by the Partnership's existing subsidiaries (other than Finance Corp., the "Guarantors") and will be unconditionally guaranteed on the same basis by certain of the Partnership’s future subsidiaries. The 2025 Notes rank equal in right of payme
nt with all existing and future senior indebtedness of the Issuers, and senior in right of payment to
13
any
future subordinated indebtedness of the Issuers.
Interest on the 2025 Notes is payable semi-annually in arrears on each May 15 and November 15, commencing November 15, 2017.
At any time prior to May 15, 2020, the Issuers may redeem up to
35%
of the aggregate principal amount of the 2025 Notes with the net cash proceeds of one or more equity offerings by the Partnership at a redemption price of
106.750%
of the redeemed principal amount, plus accrued and unpaid interest, if any, subject to certain conditions and limitations. Prior to May 15, 2020, the Issuers may redeem all or part of the 2025 Notes at a redemption price of the principal amount, plus accrued and unpaid interest, if any, plus a "make whole" premium, subject to certain conditions and limitations. In addition, beginning on May 15, 2020,
th
e Issuers may, subject to certain conditions and limitations, redeem all or part of the 2025 Notes at a redemption price of
105.063%
of the redeemed principal for the twelve-month period beginning on May 15, 2020,
103.375%
for the twelve-month period beginning on May 15, 2021,
101.688%
for the twelve-month period beginning on May 15, 2022 and
100.00%
beginning on May 15, 2023 and thereafter, plus accrued and unpaid interest, if any.
In the event of a change of control, accompanied or followed by a ratings downgrade within a certain period of time, subject to certain conditions and limitations, the Issuers will be obligated to make an offer for the purchase of the 2025 Notes from holders at a price equal to
101%
of the principal amount thereof, plus accrued and unpaid interest.
In connection with the issuance of the 2025 Notes, the Issuers and the Guarantors entered into a registration rights agreement, whereby the Issuers and the Guarantors were required to exchange the 2025 Notes for new notes with terms substantially identical in all material respects with the 2025 Notes (except the new notes do not contain terms with respect to transfer restrictions). On
April 25, 2018
, we made an offer to exchange the 2025 Notes and the related guarantees that were validly tendered and not validly withdrawn for an equal principal amount of exchange notes that are freely tradeable, as required under the terms of the original indenture (the "Exchange Offer"). The Exchange Offer expired on
May 23, 2018
(the "Expiration Date"). The terms of the exchange notes that were issued as a result of the Exchange Offer are substantially identical to the terms of the original 2025 Notes.
As of
June 30, 2018
, we had
$250.0 million
in outstanding principal amount of the 2025 Notes. Outstanding borrowings under the 2025 Notes are net of deferred financing costs and debt discount of
$5.1 million
and
$1.6 million
, respectively, as of
June 30, 2018
, and
$5.5 million
and
$1.7 million
, respectively, as of
December 31, 2017
.
7
. Income Taxes
For tax purposes, each partner of the Partnership is required to take into account its share of income, gain, loss and deduction in computing its federal and state income tax liabilities, regardless of whether cash distributions are made to such partner by the Partnership. The taxable income reportable to each partner takes into account differences between the tax basis and fair market value of our assets, the acquisition price of such partner's units and the taxable income allocation requirements under our Partnership Agreement.
8
. Net Income Per Unit
We use the two-class method when calculating the net income per unit applicable to limited partners because we have more than one participating class of securities. Our participating securities consist of common units, general partner units and IDRs. The two-class method is based on the weighted-average number of common units outstanding during the period. Basic net income per unit applicable to limited partners is computed by dividing limited partners’ interest in net income, after deducting our general partner’s
2%
interest and IDRs, by the weighted-average number of outstanding common units. Our net income is allocated to our general partner and limited partners in accordance with their respective partnership percentages after giving effect to priority income allocations for IDRs, which are held by our general partner pursuant to our Partnership Agreement. The IDRs are paid following the close of each quarter.
Earnings in excess of distributions are allocated to our general partner and limited partners based on their respective ownership interests. Payments made to our unitholders are determined in relation to actual distributions declared and are not based on the net income allocations used in the calculation of net income per unit.
Diluted net income per unit applicable to common limited partners includes the effects of potentially dilutive units on our common units. At present, the only potentially dilutive units outstanding consist of unvested phantom units.
14
Our distributions earned with respect to a given period are declared subsequent to quarter end. Therefore, the table below represents total cash distributions applicable to the period in which the distributions are earned. The expected date of distribution for the distributions earned during the period ended
June 30, 2018
is
August 13, 2018
. The calculation of net income per unit is as follows (dollars in thousands, except units and per unit amounts):
|
Three Months Ended
|
Six Months Ended
|
|||||||||||||||
|
June 30,
|
June 30,
|
|||||||||||||||
|
2018
|
2017
|
2018
|
2017
|
|||||||||||||
|
Net income attributable to partners
|
$
|
25,582
|
|
$
|
18,977
|
|
$
|
45,577
|
|
$
|
33,572
|
|
||||
|
Less: General partner's distribution (including IDRs)
(1)
|
6,200
|
|
4,608
|
|
11,910
|
|
8,845
|
|
||||||||
|
Less: Limited partners' distribution
|
18,784
|
|
17,175
|
|
37,071
|
|
33,962
|
|
||||||||
|
Earnings in excess (deficit) of distributions
|
$
|
598
|
|
$
|
(2,806
|
)
|
$
|
(3,404
|
)
|
$
|
(9,235
|
)
|
||||
|
General partner's earnings:
|
||||||||||||||||
|
Distributions (including IDRs)
(1)
|
$
|
6,200
|
|
$
|
4,608
|
|
$
|
11,910
|
|
$
|
8,845
|
|
||||
|
Allocation of earnings in excess (deficit) of distributions
|
12
|
|
(56
|
)
|
(68
|
)
|
(184
|
)
|
||||||||
|
Total general partner's earnings
|
$
|
6,212
|
|
$
|
4,552
|
|
$
|
11,842
|
|
$
|
8,661
|
|
||||
|
Limited partners' earnings on common units:
|
||||||||||||||||
|
Distributions
|
$
|
18,784
|
|
$
|
17,175
|
|
$
|
37,071
|
|
$
|
33,962
|
|
||||
|
Allocation of earnings in excess (deficit) of distributions
|
586
|
|
(2,750
|
)
|
(3,336
|
)
|
(9,051
|
)
|
||||||||
|
Total limited partners' earnings on common units
|
$
|
19,370
|
|
$
|
14,425
|
|
$
|
33,735
|
|
$
|
24,911
|
|
||||
|
Weighted average limited partner units outstanding
(2)
:
|
||||||||||||||||
|
Common units - (basic)
|
24,386,031
|
|
24,335,338
|
|
24,384,341
|
|
24,331,991
|
|
||||||||
|
Common units - (diluted)
|
24,394,103
|
|
24,375,946
|
|
24,391,760
|
|
24,371,540
|
|
||||||||
|
Net income per limited partner unit
(2)
:
|
||||||||||||||||
|
Common units - (basic)
|
$
|
0.79
|
|
$
|
0.59
|
|
$
|
1.38
|
|
$
|
1.02
|
|
||||
|
Common units - (diluted)
|
$
|
0.79
|
|
$
|
0.59
|
|
$
|
1.38
|
|
$
|
1.02
|
|
||||
(1)
General partner distributions (including IDRs) consist of the
2%
general partner interest and IDRs, which represent the right of the general partner to receive increasing percentages of quarterly distributions of available cash from operating surplus in excess of
$0.43125
per unit per quarter. See
Note 9
for further discussion related to IDRs.
(2)
We base our calculation of net income per unit on the weighted-average number of common limited partner units outstanding during the period.
9
. Equity
We had
9,101,137
common limited partner units held by the public outstanding as of
June 30, 2018
. Additionally, as of
June 30, 2018
, Delek owned a
61.4%
limited partner interest in us, consisting of
15,294,046
common limited partner units and a
94.6%
interest in our general partner, which owns the entire
2.0%
general partner interest consisting of
497,861
general partner units. Affiliates, who are also members of our general partner's management and board of directors, own the remaining
5.4%
interest in our general partner.
15
Equity Activity
The table below summarizes the changes in the number of units outstanding from
December 31, 2017
through
June 30, 2018
.
|
Common - Public
|
Common - Delek
|
General Partner
|
Total
|
|||||||||
|
Balance at December 31, 2017
|
9,088,587
|
|
15,294,046
|
|
497,604
|
|
24,880,237
|
|
||||
|
General partner units issued to maintain 2% interest
|
—
|
|
—
|
|
257
|
|
257
|
|
||||
|
Unit-based compensation awards
(1)
|
12,550
|
|
—
|
|
—
|
|
12,550
|
|
||||
|
Balance at June 30, 2018
|
9,101,137
|
|
15,294,046
|
|
497,861
|
|
24,893,044
|
|
||||
(1)
Unit-based compensation awards are presented net of
598
units withheld for taxes.
The summarized changes in the carrying amount of our equity from
December 31, 2017
through
June 30, 2018
are as follows (in thousands):
|
Common - Public
|
Common - Delek
|
General Partner
|
Total
|
|||||||||||||
|
Balance at December 31, 2017
|
$
|
174,378
|
|
$
|
(197,206
|
)
|
$
|
(6,397
|
)
|
$
|
(29,225
|
)
|
||||
|
Distributions to unitholders and general partner related to Big Spring Logistic Assets Acquisition
|
—
|
|
(96,822
|
)
|
(1,976
|
)
|
(98,798
|
)
|
||||||||
|
Cash distributions
(1)
|
(13,463
|
)
|
(22,558
|
)
|
(10,810
|
)
|
(46,831
|
)
|
||||||||
|
Net income attributable to partners
|
12,581
|
|
21,154
|
|
11,842
|
|
45,577
|
|
||||||||
|
Unit-based compensation
|
111
|
|
185
|
|
6
|
|
302
|
|
||||||||
|
Other
|
—
|
|
—
|
|
13
|
|
13
|
|
||||||||
|
Balance at June 30, 2018
|
$
|
173,607
|
|
$
|
(295,247
|
)
|
$
|
(7,322
|
)
|
$
|
(128,962
|
)
|
||||
(1)
Cash distributions include
$0.1 million
related to distribution equivalents on vested phantom units.
Allocations of Net Income
Our Partnership Agreement contains provisions for the allocation of net income and loss to the unitholders and our general partner. For purposes of maintaining partner capital accounts, the Partnership Agreement specifies that items of income and loss shall be allocated among the partners in accordance with their respective percentage interest. Normal allocations according to percentage interests are made after giving effect to priority income allocations in an amount equal to incentive cash distributions allocated 100% to our general partner.
The following table presents the allocation of the general partner's interest in net income (in thousands, except percentage of ownership interest):
|
Three Months Ended June 30,
|
Six Months Ended June 30,
|
|||||||||||||||
|
2018
|
2017
|
2018
|
2017
|
|||||||||||||
|
Net income attributable to partners
|
$
|
25,582
|
|
$
|
18,977
|
|
$
|
45,577
|
|
$
|
33,572
|
|
||||
|
Less: General partner's IDRs
|
(5,817
|
)
|
(4,258
|
)
|
(11,154
|
)
|
(8,153
|
)
|
||||||||
|
Net income available to partners
|
$
|
19,765
|
|
$
|
14,719
|
|
$
|
34,423
|
|
$
|
25,419
|
|
||||
|
General partner's ownership interest
|
2.0
|
%
|
2.0
|
%
|
2.0
|
%
|
2.0
|
%
|
||||||||
|
General partner's allocated interest in net income
|
$
|
395
|
|
$
|
294
|
|
$
|
688
|
|
$
|
508
|
|
||||
|
General partner's IDRs
|
5,817
|
|
4,258
|
|
11,154
|
|
8,153
|
|
||||||||
|
Total general partner's interest in net income
|
$
|
6,212
|
|
$
|
4,552
|
|
$
|
11,842
|
|
$
|
8,661
|
|
||||
16
Incentive Distribution Rights
The following table illustrates the percentage allocations of available cash from operating surplus between the unitholders and our general partner based on the specified target distribution levels. The amounts set forth under “Marginal Percentage Interest in Distributions” are the percentage interests of our general partner and our unitholders in any available cash from operating surplus that we distribute up to and including the corresponding amount in the column “Total Quarterly Distribution per Unit Target Amount.” The percentage interests shown for our unitholders and our general partner for the minimum quarterly distribution are also applicable to quarterly distribution amounts that are less than the minimum quarterly distribution. The percentage interests set forth below for our general partner include its
2.0%
general partner interest and assume that (i) our general partner has contributed any additional capital necessary to maintain its
2.0%
general partner interest and (ii) our general partner has not transferred its IDRs.
|
Target Quarterly Distribution per Unit
|
Marginal Percentage Interest in Distributions
|
||||||||||
|
Target Amount
|
Unitholders
|
General Partner
|
|||||||||
|
Minimum Quarterly Distribution
|
$
|
0.37500
|
|
98.0
|
%
|
2.0
|
%
|
||||
|
First Target Distribution
|
above
|
$
|
0.37500
|
|
98.0
|
%
|
2.0
|
%
|
|||
|
up to
|
$
|
0.43125
|
|
||||||||
|
Second Target Distribution
|
above
|
$
|
0.43125
|
|
85.0
|
%
|
15.0
|
%
|
|||
|
up to
|
$
|
0.46875
|
|
||||||||
|
Third Target Distribution
|
above
|
$
|
0.46875
|
|
75.0
|
%
|
25.0
|
%
|
|||
|
up to
|
$
|
0.56250
|
|
||||||||
|
Thereafter
|
thereafter
|
$
|
0.56250
|
|
50.0
|
%
|
50.0
|
%
|
|||
Cash Distributions
Our Partnership Agreement sets forth the calculation to be used to determine the amount and priority of available cash distributions that our limited partner unitholders and general partner will receive. Our distributions earned with respect to a given period are declared subsequent to quarter end. The table below summarizes the quarterly distributions related to our quarterly financial results:
|
Quarter Ended
|
Total Quarterly Distribution Per Limited Partner Unit
|
Total Quarterly Distribution Per Limited Partner Unit, Annualized
|
Total Cash Distribution, including general partner interest and IDRs (in thousands)
|
Date of Distribution
|
Unitholders Record Date
|
|||||||||||
|
June 30, 2017
|
$
|
0.705
|
|
$
|
2.82
|
|
$
|
21,783
|
|
August 11, 2017
|
August 4, 2017
|
|||||
|
September 30, 2017
|
$
|
0.715
|
|
$
|
2.86
|
|
$
|
22,270
|
|
November 14, 2017
|
November 7, 2017
|
|||||
|
December 31, 2017
|
$
|
0.725
|
|
$
|
2.90
|
|
$
|
22,777
|
|
February 12, 2018
|
February 2, 2018
|
|||||
|
March 31, 2018
|
$
|
0.750
|
|
$
|
3.00
|
|
$
|
23,997
|
|
May 15, 2018
|
May 7, 2018
|
|||||
|
June 30, 2018
|
$
|
0.770
|
|
$
|
3.08
|
|
$
|
24,984
|
|
August 13, 2018
(1)
|
August 3, 2018
|
|||||
(1)
Expected date of distribution.
17
The allocation of total quarterly cash distributions expected to be made on
August 13, 2018
to general and limited partners for the
three and six
months ended
June 30, 2018
and the allocation of total quarterly cash distributions for the
three and six
months ended
June 30, 2017
are set forth in the table below. Distributions earned with respect to a given period are declared subsequent to quarter end. Therefore, the table below presents total cash distributions applicable to the period in which the distributions are earned (in thousands, except per unit amounts):
|
Three Months Ended June 30,
|
Six Months Ended June 30,
|
|||||||||||||||
|
2018
|
2017
|
2018
|
2017
|
|||||||||||||
|
General partner's distributions:
|
||||||||||||||||
|
General partner's distributions
|
$
|
383
|
|
$
|
350
|
|
$
|
756
|
|
$
|
692
|
|
||||
|
General partner's IDRs
|
5,817
|
|
4,258
|
|
11,154
|
|
8,153
|
|
||||||||
|
Total general partner's distributions
|
6,200
|
|
4,608
|
|
11,910
|
|
8,845
|
|
||||||||
|
Limited partners' distributions:
|
||||||||||||||||
|
Common limited partners' distributions
|
18,784
|
|
17,175
|
|
37,071
|
|
33,962
|
|
||||||||
|
Total cash distributions
|
$
|
24,984
|
|
$
|
21,783
|
|
$
|
48,981
|
|
$
|
42,807
|
|
||||
|
Cash distributions per limited partner unit
|
$
|
0.770
|
|
$
|
0.705
|
|
$
|
1.520
|
|
$
|
1.395
|
|
||||
10
. Equity Based Compensation
We incurred approximately
$0.2 million
and
$0.3 million
of unit-based compensation expense related to the Partnership during the
three and six
months ended
June 30, 2018
, respectively, and
$0.2 million
and
$0.4 million
of unit-based compensation expense related to the Partnership during the
three and six
months ended
June 30, 2017
, respectively. These amounts are included in general and administrative expenses in the accompanying condensed consolidated statements of income and comprehensive income. The fair value of phantom unit awards under the Delek Logistics GP, LLC 2012 Long-Term Incentive Plan (the "LTIP") is determined based on the closing price of our common limited partner units on the grant date of the awards. The estimated fair value of our phantom units is amortized over the vesting period using the straight line method. Awards vest over
one
- to
five
-year service periods, unless such awards are amended in accordance with the LTIP. As of
June 30, 2018
, there was
$0.6 million
of total unrecognized compensation cost related to non-vested equity-based compensation arrangements, which is expected to be recognized over a weighted-average period of
0.9
years.
11
. Equity Method Investments
We have
two
joint ventures that have constructed separate crude oil pipeline systems and related ancillary assets, which are serving third parties and subsidiaries of Delek. We own a
50%
membership interest in the entity formed with an affiliate of Plains All American Pipeline, L.P. ("CP LLC") to operate one of these pipeline systems and a
33%
membership interest in the entity formed with Rangeland Energy II, LLC ("Rangeland RIO") to operate the other pipeline system.
The Partnership's investments in these
two
entities were financed through a combination of cash from operations and borrowings under the DKL Revolver. As of
June 30, 2018
and
December 31, 2017
, the Partnership's investment balance in these joint ventures was
$106.4 million
and
$106.5 million
, respectively.
In
February 2018
, the Partnership and an affiliate of Green Plains Partners LP ("Green Plains") entered into a joint venture engaging in the light products terminalling business. The companies formed DKGP Energy Terminals, LLC ("DKGP Energy"). The Partnership and Green Plains each own a
50%
membership interest in DKGP Energy. DKGP Energy signed a membership interest purchase agreement (the "Membership Interest Purchase Agreement") to acquire
two
light products terminals located in Caddo Mills, Texas and North Little Rock, Arkansas from an affiliate of American Midstream Partners, L.P. ("American Midstream"), subject to certain closing conditions and regulatory approvals (the "DKGP Transaction"). The Membership Interest Purchase Agreement expired on August 1, 2018 pursuant to its terms (primarily due to delays in receiving federal regulatory approval for the acquisition), and the contemplated DKGP Transaction terminated (the "DKGP Termination"). As a result of the DKGP Termination, the contemplated contribution of certain of the Partnership's terminals to DKGP Energy, in connection with the DKGP Transaction, terminated. At this time the Partnership and Green Plains do not have any further transaction or development plans with respect to DKGP Energy.
We do not consolidate any part of the assets or liabilities or operating results of our equity method investees. Our share of net income or loss of the investees will increase or decrease, as applicable, the carrying value of our investments in unconsolidated affiliates. With respect
18
to CP LLC and Rangeland RIO, we determined that these entities do not represent variable interest entities and consolidation is not required. We have the ability to exercise significant influence over each of these joint ventures through our participation in the management committees, which make all significant decisions. However, since all significant decisions require the consent of the other investor(s) without regard to economic interest, we have determined that we have joint control and have applied the equity method of accounting. Our investment in these joint ventures is reflected in our pipelines and transportation segment.
Summarized Financial Information
Combined summarized financial information for our equity method investees is shown below (in thousands):
|
June 30, 2018
|
December 31, 2017
|
|||||||
|
Current assets
|
$
|
18,195
|
|
$
|
12,671
|
|
||
|
Non-current assets
|
$
|
241,564
|
|
$
|
244,329
|
|
||
|
Current liabilities
|
$
|
3,876
|
|
$
|
1,798
|
|
||
|
Three Months Ended June 30,
|
Six Months Ended June 30,
|
|||||||||||||||
|
2018
|
2017
|
2018
|
2017
|
|||||||||||||
|
Revenues
|
$
|
9,886
|
|
$
|
7,022
|
|
$
|
17,876
|
|
$
|
12,693
|
|
||||
|
Gross profit
|
$
|
9,886
|
|
$
|
7,022
|
|
$
|
17,876
|
|
$
|
12,693
|
|
||||
|
Net income
|
$
|
4,800
|
|
$
|
3,379
|
|
$
|
7,512
|
|
$
|
4,392
|
|
||||
12
. Segment Data
We aggregate our operating segments into
two
reportable segments: (i) pipelines and transportation and (ii) wholesale marketing and terminalling:
|
•
|
The assets and investments reported in the pipelines and transportation segment provide crude oil gathering and crude oil, intermediate and finished products transportation and storage services to Delek's refining operations and independent third parties.
|
|
•
|
The wholesale marketing and terminalling segment provides wholesale marketing and terminalling services to Delek's refining operations and independent third parties.
|
Our operating segments adhere to the accounting policies used for our consolidated financial statements. Our operating segments are managed separately because each segment requires different industry knowledge, technology and marketing strategies. Decisions concerning the allocation of resources and assessment of operating performance are made based on this segmentation. Management measures the operating performance of each of its reportable segments based on segment contribution margin. Segment contribution margin is defined as net revenues less cost of goods sold and operating expenses.
19
The following is a summary of business segment operating performance as measured by contribution margin for the periods indicated (in thousands):
|
Three Months Ended
|
Six Months Ended
|
|||||||||||||||
|
June 30,
|
June 30,
|
|||||||||||||||
|
2018
|
2017
|
2018
|
2017
|
|||||||||||||
|
Pipelines and Transportation
|
||||||||||||||||
|
Net revenues:
|
||||||||||||||||
|
Affiliates
|
$
|
34,030
|
|
$
|
27,668
|
|
$
|
63,492
|
|
$
|
54,168
|
|
||||
|
Third party
|
3,714
|
|
2,555
|
|
7,965
|
|
4,732
|
|
||||||||
|
Total pipelines and transportation
|
37,744
|
|
30,223
|
|
71,457
|
|
58,900
|
|
||||||||
|
Operating costs and expenses:
|
||||||||||||||||
|
Cost of goods sold
|
5,195
|
|
4,403
|
|
9,636
|
|
8,808
|
|
||||||||
|
Operating expenses
|
9,933
|
|
7,933
|
|
19,555
|
|
16,088
|
|
||||||||
|
Segment contribution margin
|
$
|
22,616
|
|
$
|
17,887
|
|
$
|
42,266
|
|
$
|
34,004
|
|
||||
|
Capital spending
(1)
|
$
|
826
|
|
$
|
1,660
|
|
$
|
2,234
|
|
$
|
3,797
|
|
||||
|
Wholesale Marketing and Terminalling
|
||||||||||||||||
|
Net revenues:
|
||||||||||||||||
|
Affiliates
(2)
|
$
|
19,050
|
|
$
|
12,156
|
|
$
|
51,232
|
|
$
|
22,275
|
|
||||
|
Third party
|
109,486
|
|
84,390
|
|
211,512
|
|
175,067
|
|
||||||||
|
Total wholesale marketing and terminalling
|
128,536
|
|
96,546
|
|
262,744
|
|
197,342
|
|
||||||||
|
Operating costs and expenses:
|
||||||||||||||||
|
Cost of goods sold
|
100,821
|
|
80,636
|
|
215,412
|
|
168,821
|
|
||||||||
|
Operating expenses
|
4,984
|
|
2,033
|
|
7,939
|
|
4,236
|
|
||||||||
|
Segment contribution margin
|
$
|
22,731
|
|
$
|
13,877
|
|
$
|
39,393
|
|
$
|
24,285
|
|
||||
|
Capital spending
(1)
|
$
|
1,426
|
|
$
|
459
|
|
$
|
2,215
|
|
$
|
1,113
|
|
||||
|
Consolidated
|
||||||||||||||||
|
Net revenues:
|
||||||||||||||||
|
Affiliates
|
$
|
53,080
|
|
$
|
39,824
|
|
$
|
114,724
|
|
$
|
76,443
|
|
||||
|
Third party
|
113,200
|
|
86,945
|
|
219,477
|
|
179,799
|
|
||||||||
|
Total consolidated
|
166,280
|
|
126,769
|
|
334,201
|
|
256,242
|
|
||||||||
|
Operating costs and expenses:
|
||||||||||||||||
|
Cost of goods sold
|
106,016
|
|
85,039
|
|
225,048
|
|
177,629
|
|
||||||||
|
Operating expenses
|
14,917
|
|
9,966
|
|
27,494
|
|
20,324
|
|
||||||||
|
Contribution margin
|
45,347
|
|
31,764
|
|
81,659
|
|
58,289
|
|
||||||||
|
General and administrative expenses
|
3,747
|
|
2,656
|
|
6,722
|
|
5,504
|
|
||||||||
|
Depreciation and amortization
|
7,019
|
|
5,742
|
|
13,019
|
|
10,935
|
|
||||||||
|
Loss (gain) on asset disposals
|
(129
|
)
|
(5
|
)
|
(69
|
)
|
7
|
|
||||||||
|
Operating income
|
$
|
34,710
|
|
$
|
23,371
|
|
$
|
61,987
|
|
$
|
41,843
|
|
||||
|
Capital spending
(1)
|
$
|
2,252
|
|
$
|
2,119
|
|
$
|
4,449
|
|
$
|
4,910
|
|
||||
(1)
Capital spending excludes transaction costs capitalized in the amount of
$0.4 million
that relate to the Big Spring Logistic Assets Acquisition for the
six
months ended
June 30, 2018
. No costs were capitalized during the three months ended
June 30, 2018
.
(2)
Affiliate revenue for the wholesale marketing and terminalling segment is presented net of amortization expense pertaining to the Marketing Contract Intangible Acquisition. See
Note 3
for additional information.
20
The following table summarizes the total assets for each segment as of
June 30, 2018
and
December 31, 2017
(in thousands):
|
June 30, 2018
|
December 31, 2017
|
|||||||
|
Pipelines and transportation
|
$
|
439,311
|
|
$
|
349,351
|
|
||
|
Wholesale marketing and terminalling
|
211,038
|
|
94,179
|
|
||||
|
Total assets
|
$
|
650,349
|
|
$
|
443,530
|
|
||
Property, plant and equipment and accumulated depreciation as of
June 30, 2018
and depreciation expense by reporting segment for the
three and six
months ended
June 30, 2018
were as follows (in thousands):
|
Pipelines and Transportation
|
Wholesale Marketing and Terminalling
|
Consolidated
|
||||||||||
|
Property, plant and equipment
|
$
|
362,128
|
|
$
|
84,833
|
|
$
|
446,961
|
|
|||
|
Less: accumulated depreciation
|
(96,915
|
)
|
(30,713
|
)
|
(127,628
|
)
|
||||||
|
Property, plant and equipment, net
|
$
|
265,213
|
|
$
|
54,120
|
|
$
|
319,333
|
|
|||
|
Depreciation expense for the three months ended June 30, 2018
|
$
|
5,594
|
|
$
|
1,336
|
|
$
|
6,930
|
|
|||
|
Depreciation expense for the six months ended June 30, 2018
|
$
|
10,524
|
|
$
|
2,406
|
|
$
|
12,930
|
|
|||
In accordance with Accounting Standards Codification ("ASC") 360,
Property, Plant & Equipment
, we evaluate the realizability of property, plant and equipment as events occur that might indicate potential impairment. There were no indicators of impairment of our property, plant and equipment as of
June 30, 2018
.
13
. Fair Value Measurements
The fair values of financial instruments are estimated based upon current market conditions and quoted market prices for the same or similar instruments. Management estimates that the carrying value approximates fair value for all of our assets and liabilities that fall under the scope of ASC 825,
Financial Instruments
.
We apply the provisions of ASC 820,
Fair Value Measurements
, which defines fair value, establishes a framework for its measurement and expands disclosures about fair value measurements. ASC 820 applies to commodity and interest rate derivatives that are measured at fair value on a recurring basis. The standard also requires that we assess the impact of nonperformance risk on our derivatives. Nonperformance risk is not considered material to our financial statements at this time.
ASC 820 requires disclosures that categorize assets and liabilities measured at fair value into one of three different levels depending on the observability of the inputs employed in the measurement. Level 1 inputs are quoted prices in active markets for identical assets or liabilities. Level 2 inputs are observable inputs other than quoted prices included within Level 1 for the asset or liability, either directly or indirectly through market-corroborated inputs. Level 3 inputs are unobservable inputs for the asset or liability reflecting our assumptions about pricing by market participants.
Commodity swaps, exchange-traded futures, physical commodity forward purchase and sale contracts and any interest rate swaps are generally valued using industry-standard models that consider various assumptions, including quoted forward prices, spot prices, interest rates, time value, volatility factors and contractual prices for the underlying instruments, as well as other relevant economic measures. The degree to which these inputs are observable in the forward markets determines the classification as Level 2 or 3. Our contracts are valued based on exchange pricing and/or price index developers such as Platts or Argus and are, therefore, classified as Level 2.
21
The fair value hierarchy for our financial assets and liabilities accounted for at fair value on a recurring basis at
June 30, 2018
and
December 31, 2017
was as follows (in thousands):
|
|
As of June 30, 2018
|
|||||||||||||||
|
|
Level 1
|
Level 2
|
Level 3
|
Total
|
||||||||||||
|
Assets
|
|
|
|
|
||||||||||||
|
Commodity derivatives
|
$
|
—
|
|
$
|
2
|
|
$
|
—
|
|
$
|
2
|
|
||||
|
Total assets
|
—
|
|
2
|
|
—
|
|
2
|
|
||||||||
|
Liabilities
|
|
|
||||||||||||||
|
Commodity derivatives
|
—
|
|
(380
|
)
|
—
|
|
(380
|
)
|
||||||||
|
Net liabilities
|
$
|
—
|
|
$
|
(378
|
)
|
$
|
—
|
|
$
|
(378
|
)
|
||||
|
|
As of December 31, 2017
|
|||||||||||||||
|
|
Level 1
|
Level 2
|
Level 3
|
Total
|
||||||||||||
|
Liabilities
|
||||||||||||||||
|
Commodity derivatives
|
—
|
|
(1,087
|
)
|
—
|
|
(1,087
|
)
|
||||||||
|
Net liabilities
|
$
|
—
|
|
$
|
(1,087
|
)
|
$
|
—
|
|
$
|
(1,087
|
)
|
||||
The derivative values above are based on analysis of each contract as the fundamental unit of account as required by ASC 820. In the table above, derivative assets and liabilities with the same counterparty are not netted where the legal right of offset exists. This differs from the presentation in the financial statements which reflects our policy, wherein we have elected to offset the fair value amounts recognized for multiple derivative instruments executed with the same counterparty and where the legal right of offset exists.
As of
June 30, 2018
and
December 31, 2017
, we had cash collateral of
$0.5 million
and
$0.3 million
, respectively, netted with the net derivative position of our counterparty. See
Note 14
for further information regarding derivative instruments.
14
. Derivative Instruments
From time to time, we enter into forward fuel contracts to limit the exposure to price fluctuations for physical purchases of finished products in the normal course of business. We use derivatives to reduce the impact of market price volatility on our results of operations.
Typically, we enter into forward fuel contracts with major financial institutions in which we fix the purchase price of finished grade fuel for a predetermined number of units with fulfillment terms of less than
90
days.
From time to time, we may also enter into interest rate hedging agreements to limit floating interest rate exposure under the DKL Revolver.
22
The following table presents the fair value of our derivative instruments as of
June 30, 2018
and
December 31, 2017
. The fair value amounts below are presented on a gross basis and do not reflect the netting of asset and liability positions permitted under our master netting arrangements, including any cash deficit or collateral on deposit with our counterparties. We have elected to offset the recognized fair value amounts for multiple derivative instruments executed with the same counterparty in our financial statements. As a result, the asset and liability amounts below differ from the amounts presented in our accompanying condensed consolidated balance sheets. During the
three and six
months ended
June 30, 2018
and
2017
, we did not elect hedge accounting treatment for these derivative positions. As a result, all changes in fair value are marked to market in the accompanying condensed consolidated statements of income and comprehensive income. See
Note 13
for further information regarding the fair value of derivative instruments.
|
(in thousands)
|
June 30, 2018
|
December 31, 2017
|
||||||||||||||||
|
Derivative Type
|
Balance Sheet Location
|
Assets
|
Liabilities
|
Assets
|
Liabilities
|
|||||||||||||
|
Derivatives:
|
||||||||||||||||||
|
Commodity derivatives
(1)
|
Accrued expenses and other current liabilities
|
$
|
2
|
|
$
|
(380
|
)
|
$
|
—
|
|
$
|
(1,087
|
)
|
|||||
|
Total gross fair value of derivatives
|
2
|
|
(380
|
)
|
—
|
|
(1,087
|
)
|
||||||||||
|
Less: Counterparty netting and cash collateral (deficit)
(2)
|
(88
|
)
|
(380
|
)
|
—
|
|
(290
|
)
|
||||||||||
|
Total net fair value of derivatives
|
$
|
90
|
|
$
|
—
|
|
$
|
—
|
|
$
|
(797
|
)
|
||||||
(1)
As of
June 30, 2018
and
December 31, 2017
, we had open derivative contracts representing
117,000
barrels and
370,000
barrels, respectively, of refined petroleum products.
(2)
As of
June 30, 2018
and
December 31, 2017
, we had cash collateral of
$0.5 million
and
$0.3 million
, respectively, netted with the net derivative position of our counterparty.
Recognized gains (losses) associated with our derivatives for the
three and six
months ended
June 30, 2018
and
2017
were as follows (in thousands):
|
Three Months Ended June 30,
|
Six Months Ended June 30,
|
||||||||||||||||
|
Derivative Type
|
Income Statement Location
|
2018
|
2017
|
2018
|
2017
|
||||||||||||
|
Commodity derivatives
|
Cost of goods sold
|
$
|
(843
|
)
|
$
|
606
|
|
$
|
740
|
|
$
|
1,116
|
|
||||
15
. Commitments and Contingencies
Litigation
In the ordinary conduct of our business, we are from time to time subject to lawsuits, investigations and claims, including environmental claims and employee-related matters. Although we cannot predict with certainty the ultimate resolution of lawsuits, investigations and claims asserted against us, including civil penalties or other enforcement actions, we do not believe that any currently pending legal proceeding or proceedings to which we are a party will have a material adverse effect on our business, financial condition or results of operations. See "Crude Oil Releases" below for further discussion.
Environmental, Health and Safety
We are subject to extensive federal, state and local environmental and safety laws and regulations enforced by various agencies, including the Environmental Protection Agency (the "EPA"), the United States Department of Transportation, the Occupational Safety and Health Administration, as well as numerous state, regional and local environmental, safety and pipeline agencies. These laws and regulations govern the discharge of materials into the environment, waste management practices, pollution prevention measures, as well as the safe operation of our pipelines and the safety of our workers and the public. Numerous permits or other authorizations are required under these laws and regulations for the operation of our terminals, pipelines, saltwells, trucks, and related operations, and may be subject to revocation, modification and renewal.
These laws and permits raise potential exposure to future claims and lawsuits involving environmental and safety matters which could include soil and water contamination, air pollution, personal injury and property damage allegedly caused by substances which we handled, used, released or disposed of, transported, or that relate to pre-existing conditions for which we have assumed responsibility. We believe that our current operations are in substantial compliance with existing environmental and safety requirements. However, there have been and we
23
expect that there will continue to be ongoing discussions about environmental and safety matters between us and federal and state authorities, including notices of violations, citations and other enforcement actions, some of which have resulted or may result in changes to operating procedures and in capital expenditures. While it is often difficult to quantify future environmental or safety related expenditures, we anticipate that continuing capital investments and changes in operating procedures will be required to comply with existing and new requirements, as well as evolving interpretations and more strict enforcement of existing laws and regulations.
Releases of hydrocarbons or hazardous substances into the environment could, to the extent the event is not insured, or is not a reimbursable event under the Omnibus Agreement, subject us to substantial expenses, including costs to respond to, contain and remediate a release, to comply with applicable laws and regulations and to resolve claims by third parties for personal injury, property damage or natural resources damages.
Crude Oil Releases
We have experienced several crude oil releases involving our assets, including, but not limited to, the following releases:
|
•
|
In February 2018, a release of approximately
203
barrels of crude oil, occurred from our SALA Gathering System near Urbana, Arkansas Station.
|
|
•
|
In March 2013, a release of approximately
5,900
barrels of crude oil, the majority of which was contained on-site, occurred from a pumping facility at our Magnolia Station located west of the El Dorado Refinery (the "Magnolia Release").
|
Cleanup operations and site maintenance and remediation efforts on these and other releases have been substantially completed, although regulatory authorities could require additional remediation based on the results of our remediation efforts. We may incur additional expenses as a result of further scrutiny by regulatory authorities and continued compliance with laws and regulations to which our assets are subject. Expenses incurred for the remediation of these crude oil releases are included in operating expenses in our condensed consolidated statements of income and comprehensive income and are subsequently reimbursed by Delek pursuant to the terms of the Omnibus Agreement. Reimbursements are recorded as a reduction to operating expense. We do not believe the total costs associated with these events, whether alone or in the aggregate, including any fines or penalties and net of available insurance reimbursement, will have a material adverse effect upon our business, financial condition or results of operations as we are reimbursed by Delek for such costs.
During each of the
three and six
months ended
June 30, 2018
, we recorded approximately
$0.1 million
of expense, which is net of total expected reimbursements from Delek pursuant to the terms of the Omnibus Agreement of
$7.8 million
, to cover the cost of certain asset failures that occurred in
2018
.
The United States Department of Justice (the "DOJ"), on behalf of the EPA, and the State of Arkansas, on behalf of the Arkansas Department of Environmental Quality, are currently pursuing an enforcement action against the Partnership with regard to potential violations of the Clean Water Act and certain state laws arising from the Magnolia Release. Although we have been negotiating a resolution to this matter with the EPA and the State of Arkansas, which will include monetary penalties and other relief, on July 13, 2018, the DOJ and the State of Arkansas filed a civil action against two of the Partnership's wholly-owned subsidiaries, Delek Logistics Operations LLC and SALA Gathering Systems LLC, in the United States District Court for the Western District of Arkansas on July 13, 2018. As of
June 30, 2018
, we have accrued
$1.0 million
, which we recorded in pipeline release liabilities in our condensed consolidated balance sheet, for the Magnolia Release in connection with these proceedings. We believe this amount is adequate to cover our expected obligations related to these proceedings and that these proceedings will not have a material adverse effect upon the Partnership's business, financial condition or result of operations.
Contracts and Agreements
The majority of the petroleum products we sold in west Texas prior to
December 31, 2017
were purchased from Noble Petro, Inc. ("Noble Petro"). Under the terms of a supply contract (the "Abilene Contract") with Noble Petro that expired on
December 31, 2017
, we purchased petroleum products at the Abilene, Texas terminal, which we own, for sales and exchange with third parties at the Abilene and San Angelo terminals. We leased the Abilene and San Angelo, Texas terminals to Noble Petro, under a separate Terminal and Pipeline Lease and Operating Agreement, that expired on
December 31, 2017
. In the first half of
2018
, we purchased spot barrels from various third parties and from Delek for sale to wholesale customers in west Texas.
Letters of Credit
At
June 30, 2018
, we had
no
letters of credit in place under the DKL Revolver.
24
16
. Subsequent Events
Distribution Declaration
On
July 24, 2018
, our general partner's board of directors declared a quarterly cash distribution of
$0.77
per limited partner unit, payable on
August 13, 2018
, to unitholders of record on
August 3, 2018
.
25
ITEM 2.
MANAGEMENT’S DISCUSSION AND ANALYSIS OF FINANCIAL CONDITION AND RESULTS OF OPERATIONS
Management’s Discussion and Analysis of Financial Condition and Results of Operations ("MD&A") is management’s analysis of our financial performance and of significant trends that may affect our future performance. The MD&A should be read in conjunction with our condensed consolidated financial statements and related notes included elsewhere in this Quarterly Report on Form 10-Q and in the Annual Report on Form 10-K filed with the Securities and Exchange Commission ("SEC") on
March 1, 2018
(the "Annual Report on Form 10-K"). Those statements in the MD&A that are not historical in nature should be deemed forward-looking statements that are inherently uncertain. See "Forward-Looking Statements" below for a discussion of the factors that could cause actual results to differ materially from those projected in these statements.
In January 2017, Delek US Holdings, Inc. ("Old Delek") (and various related entities) entered into an Agreement and Plan of Merger with Alon USA Energy, Inc. (NYSE: ALJ) ("Alon USA"), as subsequently amended on February 27 and April 21, 2017, (as so amended, the "Merger Agreement"). The related merger (the "Delek/Alon Merger") was effective July 1, 2017 (the “Effective Time”), resulting in a new post-combination consolidated registrant renamed Delek US Holdings, Inc. (“New Delek”), with Alon USA and Old Delek surviving as wholly-owned subsidiaries. New Delek is the successor issuer to Old Delek and Alon USA pursuant to Rule 12g-3(c) under the Securities Exchange Act of 1934, as amended (the "Exchange Act").
Unless the context otherwise requires, references in this report to "Delek Logistics Partners, LP," the "Partnership," "we," "us," "our," or like terms, may refer to Delek Logistics Partners, LP, one or more of its consolidated subsidiaries or all of them taken as a whole. Unless the context otherwise requires, references in this report to "Delek" refer collectively to Old Delek, with respect to periods prior to July 1, 2017, or New Delek, with respect to periods on or after July 1, 2017, and any of Old Delek's or New Delek's, as applicable, subsidiaries, other than the Partnership and its subsidiaries and its general partner.
Effective
March 1, 2018
, the Partnership acquired from Delek certain logistics assets primarily located at or adjacent to Delek's Big Spring, Texas refinery (the "Big Spring Refinery"). See 2018 Developments" for further details.
You should read the following discussion of our financial condition and results of operations in conjunction with our historical condensed consolidated financial statements and notes thereto.
Forward-Looking Statements
This Quarterly Report on Form 10-Q contains “forward-looking statements” within the meaning of Section 27A of the Securities Act of 1933, as amended (the "Securities Act"), and Section 21E of the Exchange Act. These forward-looking statements reflect our current estimates, expectations and projections about our future results, performance, prospects and opportunities. Forward-looking statements include, among other things, the information concerning our possible future results of operations, business and growth strategies, financing plans, expectations that regulatory developments or other matters will not have a material adverse effect on our business or financial condition, our competitive position and the effects of competition, the projected growth of the industry in which we operate, the benefits and synergies to be obtained from our completed and any future acquisitions, statements of management’s goals and objectives, and other similar expressions concerning matters that are not historical facts. Words such as “may,” “will,” “should,” “could,” “would,” “predicts,” “potential,” “continue,” “expects,” “anticipates,” “future,” “intends,” “plans,” “believes,” “estimates,” “appears,” “projects” and similar expressions, as well as statements in future tense, identify forward-looking statements.
Forward-looking statements should not be read as a guarantee of future performance or results, and will not necessarily be accurate indications of the times at, or by, which such performance or results will be achieved. Forward-looking information is based on information available at the time and/or management’s good faith belief with respect to future events, and is subject to risks and uncertainties that could cause actual performance or results to differ materially from those expressed in the statements. Important factors that, individually or in the aggregate, could cause such differences include, but are not limited to:
|
•
|
our substantial dependence on Delek or its assignees and their support of and respective ability to pay us under our commercial agreements;
|
|
•
|
our future coverage, leverage, financial flexibility and growth, and our ability to improve performance and achieve distribution growth at any level or at all;
|
|
•
|
Delek's future growth, financial performance, share repurchases, crude oil supply pricing and flexibility and product distribution;
|
|
•
|
positive industry dynamics, including Permian Basin growth, efficiencies and takeaway capacity;
|
26
|
•
|
the age and condition of our assets and operating hazards and other risks incidental to transporting, storing and gathering crude oil, intermediate and refined products, including, but not limited to, costs, penalties, regulatory or legal actions and other effects related to spills, releases and tank failures;
|
|
•
|
changes in insurance markets impacting costs and the level and types of coverage available;
|
|
•
|
the timing and extent of changes in commodity prices and demand for refined products;
|
|
•
|
the wholesale marketing margins we are able to obtain and the number of barrels of product we are able to purchase and sell in our west Texas wholesale business;
|
|
•
|
the suspension, reduction or termination of Delek's or its assignees' or third-party's obligations under our commercial agreements, including the duration, fees or terms thereof;
|
|
•
|
the results of our investments in joint ventures;
|
|
•
|
the ability to secure commercial agreements with Delek or third parties upon expiration of existing agreements;
|
|
•
|
disruptions due to acts of God, equipment interruption or failure at our facilities, Delek’s facilities or third-party facilities on which our business is dependent;
|
|
•
|
changes in the availability and cost of capital of debt and equity financing;
|
|
•
|
our reliance on information technology systems in our day-to-day operations;
|
|
•
|
changes in general economic conditions;
|
|
•
|
the effects of existing and future laws and governmental regulations, including, but not limited to, the rules and regulations promulgated by the Federal Energy Regulatory Commission ("FERC") and those relating to environmental protection, pipeline integrity and safety;
|
|
•
|
competitive conditions in our industry;
|
|
•
|
actions taken by our customers and competitors;
|
|
•
|
the demand for crude oil, refined products and transportation and storage services;
|
|
•
|
our ability to successfully implement our business plan;
|
|
•
|
an inability to have growth projects completed on time and on budget;
|
|
•
|
an inability of Delek to grow as expected and realize the synergies and the other expected benefits of its merger with Alon USA, which became effective as of July 1, 2017, and Delek's acquisition of the remaining interest in Alon USA Partners, LP that Delek did not already own, which became effective as of February 7, 2018;
|
|
•
|
as it relates to our potential future growth opportunities, including dropdowns, and other potential benefits, the ability to successfully integrate the businesses of Delek and Alon USA;
|
|
•
|
our ability to successfully integrate acquired businesses;
|
|
•
|
natural disasters, weather-related delays, casualty losses and other matters beyond our control;
|
|
•
|
changes or volatility in interest and inflation rates;
|
|
•
|
labor relations;
|
|
•
|
large customer defaults;
|
|
•
|
changes in tax status and regulations;
|
|
•
|
the effects of future litigation; and
|
|
•
|
other factors discussed elsewhere in this Quarterly Report on Form 10-Q and in our Annual Report on Form 10-K.
|
27
In light of these risks, uncertainties and assumptions, our actual results of operations and execution of our business strategy could differ materially from those expressed in, or implied by, the forward-looking statements, and you should not place undue reliance upon them. In addition, past financial and/or operating performance is not necessarily a reliable indicator of future performance, and you should not use our historical performance to anticipate results or future period trends. We can give no assurances that any of the events anticipated by the forward-looking statements will occur or, if any of them do, what impact they will have on our results of operations and financial condition.
Forward-looking statements speak only as of the date the statements are made. We assume no obligation to update forward-looking statements to reflect actual results, changes in assumptions or changes in other factors affecting forward-looking information, except to the extent required by applicable securities laws. If we do update one or more forward-looking statements, no inference should be drawn that we will make additional updates with respect thereto or with respect to other forward-looking statements.
Business Overview
The Partnership primarily owns and operates crude oil, intermediate and refined products logistics and marketing assets. We gather, transport, offload and store crude oil and intermediate products and market, distribute, transport and store refined products primarily in select regions of the southeastern United States and Texas for Delek and third parties. A substantial majority of our existing assets are both integral to and dependent upon the success of Delek’s refining operations, as many of our assets are contracted exclusively to Delek in support of its Tyler, El Dorado and Big Spring refineries.
The Partnership is not a taxable entity for federal income tax purposes or the income taxes of those states that follow the federal income tax treatment of partnerships. Instead, for purposes of such income taxes, each partner of the Partnership is required to take into account its share of items of income, gain, loss and deduction in computing its federal and state income tax liabilities, regardless of whether cash distributions are made to the partner by the Partnership. The taxable income reportable to each partner takes into account differences between the tax basis and the fair market value of our assets and financial reporting bases of assets and liabilities, the acquisition price of the partner's units and the taxable income allocation requirements under the Partnership's First Amended and Restated Agreement of Limited Partnership (the "Partnership Agreement").
Our Reporting Segments and Assets
Our business consists of two reportable segments: (i) pipelines and transportation and (ii) wholesale marketing and terminalling.
The assets and investments in our pipelines and transportation segment consist of and have been made in pipelines, tanks, offloading facilities, trucks and ancillary assets, which provide crude oil gathering and crude oil, intermediate and refined products transportation and storage services primarily in support of Delek's refining operations in Tyler, Texas, El Dorado, Arkansas and Big Spring, Texas. Additionally, the assets in this segment provide crude oil transportation services to certain third parties. In providing these services, we do not take ownership of the products or crude oil that we transport or store; and, therefore, we are not directly exposed to changes in commodity prices with respect to this operating segment.
The assets in our wholesale marketing and terminalling segment consist of refined products terminals and pipelines in Texas, Tennessee, Arkansas and Oklahoma. We generate revenue in our wholesale marketing and terminalling segment by providing marketing services for the refined products output of the Tyler and Big Spring refineries, engaging in wholesale activity at our terminals in west Texas and at terminals owned by third parties, whereby we purchase light products for sale and exchange to third parties, and by providing terminalling services at our refined products terminals to independent third parties and Delek.
2018 Developments
Inflation Adjustments.
On July 1, 2018, the tariffs on our FERC regulated pipelines and the throughput fees and storage fees under certain of our agreements with Delek and third parties that are subject to adjustment using FERC indexing increased by approximately 4.4%, the amount of the change in the FERC oil pipeline index. Under certain of our other agreements with Delek and third parties, the fees increased based on the consumer price index or the producer price index, which increased approximately 2.2% and 6.1%, respectively.
Big Spring Logistic Assets Acquisition.
Effective
March 1, 2018
, the Partnership, through its wholly-owned subsidiary DKL Big Spring, LLC, acquired from Delek certain logistics assets primarily located at or adjacent to Delek's refinery near Big Spring, Texas (the "Big Spring Refinery") and Delek's light products distribution terminal located in Stephens County, Oklahoma (collectively, the "Big Spring Logistic Assets"), such transaction the "Big Spring Logistic Assets Acquisition." The purchase price was
$170.8 million
, financed through borrowings under the Partnership’s revolving credit facility. Refer to
Note 2
to our accompanying condensed consolidated financial statements for additional information.
Marketing Contract Intangible Acquisition.
Effective
March 1, 2018
, concurrent with the Big Spring Logistic Assets Acquisition, Delek, the Partnership and various of their respective subsidiaries entered into a new marketing agreement, whereby the Partnership markets certain
28
finished products produced at the Big Spring Refinery to various customers in return for a marketing fee (the "Big Spring Marketing Agreement"). The purchase price was
$144.2 million
, financed through borrowings under the Partnership's revolving credit facility. Refer to
Note 2
to our accompanying condensed consolidated financial statements for additional information.
Green Plains Joint Venture.
In
February 2018
, the Partnership and an affiliate of Green Plains Partners LP ("Green Plains") entered into a joint venture engaging in the light products terminalling business. The companies formed DKGP Energy Terminals, LLC ("DKGP Energy"). The Partnership and Green Plains each owned a
50%
membership interest in DKGP Energy. DKGP Energy signed a membership interest purchase agreement (the "Membership Interest Purchase Agreement") to acquire
two
light products terminals located in Caddo Mills, Texas and North Little Rock, Arkansas from an affiliate of American Midstream Partners, L.P. ("American Midstream"), subject to certain closing conditions and regulatory approvals (the "DKGP Transaction"). The Membership Interest Purchase Agreement expired on August 1, 2018 pursuant to its terms (primarily due to delays in receiving federal regulatory approval for the acquisition), and the contemplated DKGP Transaction terminated (the "DKGP Termination"). As a result of the DKGP Termination, the contemplated contribution of certain of the Partnership's terminals to DKGP Energy, in connection with the DKGP Transaction, terminated. At this time the Partnership and Green Plains do not have any further transaction or development plans with respect to DKGP Energy.
2025 Notes Offer to Exchange.
On
April 25, 2018
, we made an offer to exchange the 2025 Notes (as defined in
Note 6
to our accompanying condensed consolidated financial statements) and the related guarantees that were validly tendered and not validly withdrawn for an equal principal amount of exchange notes that are freely tradeable, as required under the terms of the original indenture (the "Exchange Offer"). The Exchange Offer expired on
May 23, 2018
(the "Expiration Date"). The terms of the exchange notes that were issued as a result of the Exchange Offer are substantially identical to the terms of the original 2025 Notes.
How We Generate Revenue
The Partnership generates revenue by charging fees to Delek and third parties for gathering, transporting, offloading and storing crude oil and for marketing, distributing, transporting, throughputting and storing intermediate and refined products. We also wholesale market refined products primarily in the west Texas market. A substantial majority of our contribution margin, which we define as net revenues less cost of goods sold and operating expenses, is derived from commercial agreements with Delek with initial terms ranging from five to ten years, which gives us a contractual revenue base that we believe enhances the stability of our cash flows. As more fully described below, our commercial agreements with Delek typically include minimum volume or throughput commitments by Delek, which we believe will provide a stable revenue stream in the future. The fees charged under our agreements with Delek and third parties are indexed to inflation-based indices. In addition, the rates charged with respect to our assets that are subject to inflation indexing may increase or decrease, typically on July 1 of each year, by the amount of any change in various inflation-based indices, including FERC, provided that in no event will the fees be adjusted below the amount initially set forth in the applicable agreement.
Commercial Agreements with Delek
The Partnership has a number of long-term, fee-based commercial agreements with Delek under which we provide various services, including crude oil gathering and crude oil, intermediate and refined products transportation and storage services, and marketing, terminalling and offloading services to Delek, and Delek commits to provide us with minimum monthly throughput volumes of crude oil, intermediate and refined products. Generally, these agreements include minimum quarterly volume, revenue or throughput commitments and have tariffs or fees indexed to inflation-based indices, provided that the tariffs or fees will not be decreased below the initial amount. See our Annual Report on Form 10-K for the year ended
December 31, 2017
(our "Annual Report on Form 10-K"), filed with the Securities and Exchange Commission (the "SEC") on
March 1, 2018
for a discussion of our material commercial agreements with Delek. Additionally, refer to
Note 3
to our accompanying condensed consolidated financial statements for a description of material agreements entered into during the quarter ended
June 30, 2018
.
How We Evaluate Our Operations
We use a variety of financial and operating metrics to analyze our segment performance. These metrics are significant factors in assessing our operating results and profitability and include: (i) volumes (including pipeline throughput and terminal volumes); (ii) contribution margin and gross margin per barrel; (iii) operating and maintenance expenses; and (iv) EBITDA and distributable cash flow (as such terms are defined below).
Volumes.
The amount of revenue we generate primarily depends on the volumes of crude oil, intermediate and refined products that we handle in our pipeline, transportation, terminalling, storage and marketing operations. These volumes are primarily affected by the supply of and demand for crude oil, intermediate and refined products in the markets served directly or indirectly by our assets. Although Delek has committed to minimum volumes under certain of the commercial agreements, as described above, our results of operations will be impacted by:
|
•
|
Delek’s utilization of our assets in excess of its minimum volume commitments;
|
29
|
•
|
our ability to identify and execute acquisitions and organic expansion projects, and capture incremental volume increases from Delek or third parties;
|
|
•
|
our ability to increase throughput volumes at our refined products terminals and provide additional ancillary services at those terminals;
|
|
•
|
our ability to identify and serve new customers in our marketing and trucking operations; and
|
|
•
|
our ability to make connections to third-party facilities and pipelines.
|
Contribution Margin and Gross Margin per Barrel.
Because we do not allocate general and administrative expenses by segment, we measure the performance of our segments by the amount of contribution margin generated in operations. Contribution margin is calculated as net revenues less cost of goods sold and operating expenses.
For our wholesale marketing and terminalling segment, we also measure gross margin per barrel. Gross margin per barrel reflects the gross margin (net revenues less cost of goods sold) of the wholesale marketing operations divided by the number of barrels of refined products sold during the measurement period. Both contribution margin and gross margin per barrel can be affected by fluctuations in the prices and cost of gasoline, distillate fuel, ethanol and Renewable Identification Numbers ("RINs"). Historically, the profitability of our wholesale marketing operations has been affected by commodity price volatility, specifically as it relates to changes in the price of refined products between the time we purchase such products from our suppliers and the time we sell the products to our wholesale customers, and the fluctuation in the value of RINs. Commodity price volatility may also impact our wholesale marketing operations when the selling price of finished products does not adjust as quickly as the purchase price. Our wholesale marketing gross margin can also be impacted by fixed price ethanol agreements that we enter into to fix the price we pay for ethanol.
Operating and Maintenance Expenses.
We seek to maximize the profitability of our operations by effectively managing operating and maintenance expenses. These expenses are comprised primarily of labor expenses, lease costs, utility costs, insurance premiums, repairs and maintenance expenses and property taxes. These expenses generally remain relatively stable across broad ranges of throughput volumes, but can fluctuate from period to period depending on the mix of activities performed during that period and the timing of these expenses. Additionally, compliance with federal, state and local laws and regulations relating to the protection of the environment, health and safety may require us to incur additional expenditures. We will seek to manage our maintenance expenditures on our pipelines and terminals by scheduling maintenance over time to avoid significant variability in our maintenance expenditures and minimize their impact on our cash flow.
EBITDA and Distributable Cash Flow.
We define EBITDA as net income (loss) before net interest expense, income tax expense, depreciation and amortization expense, including amortization of customer contract intangible assets which is included as a component of net revenues in our accompanying condensed consolidated statements of income. Distributable cash flow is derived from net cash flow from operating activities plus or minus changes in assets and liabilities, less maintenance capital expenditures net of reimbursements and other adjustments not expected to settle in cash. We believe this revision is a more appropriate reflection of a liquidity measure by which users of our financial statements can assess our ability to generate cash. Additionally, distributable cash flow and EBITDA are not presentations made in accordance with accounting principles generally accepted in the United States ("U.S. GAAP").
EBITDA and distributable cash flow are non-U.S. GAAP supplemental financial measures that management and external users of our condensed consolidated financial statements, such as industry analysts, investors, lenders and rating agencies, may use to assess:
|
•
|
our operating performance as compared to other publicly traded partnerships in the midstream energy industry, without regard to historical cost basis or, in the case of EBITDA, financing methods;
|
|
•
|
the ability of our assets to generate sufficient cash flow to make distributions to our unitholders;
|
|
•
|
our ability to incur and service debt and fund capital expenditures; and
|
|
•
|
the viability of acquisitions and other capital expenditure projects and the returns on investment of various investment opportunities.
|
We believe that the presentation of EBITDA and distributable cash flow provides information useful to investors in assessing our financial condition and results of operations. EBITDA and distributable cash flow should not be considered alternatives to net income, operating income, cash flow from operating activities or any other measure of financial performance or liquidity presented in accordance with U.S. GAAP. EBITDA and distributable cash flow have important limitations as analytical tools, because they exclude some, but not all, items that affect net income and net cash provided by operating activities. Additionally, because EBITDA and distributable cash flow may be defined differently by other companies in our industry, our definitions of EBITDA and distributable cash flow may not be comparable to similarly titled measures of other companies, thereby diminishing their utility. For a reconciliation of EBITDA and distributable cash flow to their most directly comparable financial measures calculated and presented in accordance with U.S. GAAP, please refer to "Results of Operations" below.
30
Financing.
The Partnership has declared its intent to make a cash distribution to its unitholders at a distribution rate of
0.77
per unit for the quarter ended
June 30, 2018
(
3.08
per unit on an annualized basis). Our Partnership Agreement requires that the Partnership distribute to its unitholders quarterly all of its available cash as defined in the Partnership Agreement. As a result, the Partnership expects to fund future capital expenditures primarily from operating cash flows, borrowings under our senior secured revolving credit agreement and any potential future issuances of equity and debt securities.
Market Trends
Master Limited Partnerships
Fluctuations in crude oil prices and the prices of related refined products impact our operations and the operations of other master limited partnerships in the midstream energy sector. In particular, crude oil prices and the prices of related refined products have the ability to influence drilling activity in many basins and the amounts of capital spending that crude oil exploration companies and smaller producers incur to support future growth. Throughout 2017 and the six months ended
June 30, 2018
, the prices of crude oil and related refined products have increased relative to 2016 levels. Drilling activity has escalated as a result of these increasing crude oil prices, particularly in the Permian basin which has attractive drilling economics supported by improved efficiencies and drilling cost. As market conditions have improved, the demand for our assets has increased and our operations have benefited from this trend, particularly in the west Texas area where our results are most driven by market factors. Additionally, we believe these improving market conditions will facilitate the development of profitable growth projects that are needed to support future distribution growth in the midstream energy sector and for the Partnership.
West Texas Marketing Operations
Overall demand for gathering and terminalling services in a particular area is generally driven by crude oil production in the area, which can be impacted by crude oil prices, refining economics and access to alternate delivery and transportation infrastructure. Additionally, volatility in crude oil, intermediate and refined products prices in the west Texas area and the value attributable to RINs can affect the results of our west Texas operations. For example, as discussed above, drilling activity and the prices of crude oil and related refined products have increased in 2017 and 2018 to date, resulting in higher demand for finished products from our west Texas operations to industries that support crude oil exploration and production. See below for the high, low and average price per barrel of WTI crude oil for each of the quarterly periods in
2017
and for the
six
months ended
June 30, 2018
.
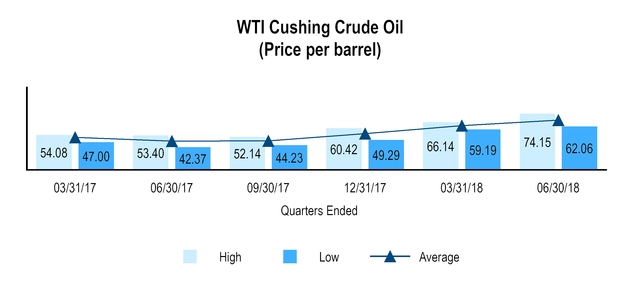
31
Also, the volatility of finished products prices may impact our margin in the west Texas operations when the selling price of finished products does not adjust as quickly as the purchase price. See below for the range of prices per gallon of gasoline and diesel for each of the quarterly periods in
2017
and for the
six
months ended
June 30, 2018
.
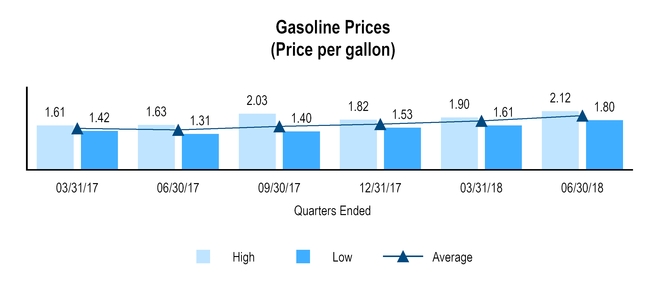
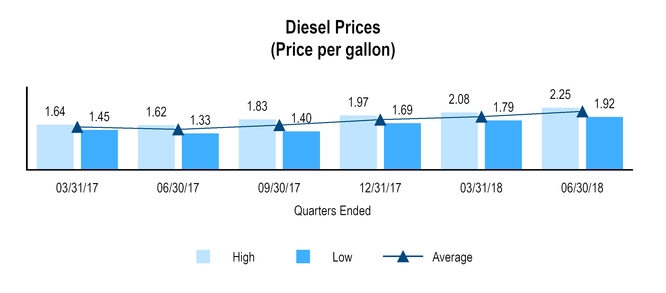
32
Our west Texas operations can benefit from RINs that are generated by ethanol blending activities. As a result, changes in the price of RINs can affect our results of operations. The RINs we generate are sold primarily to Delek at market prices. We sold approximately
$0.8 million
and
$2.0 million
of RINs to Delek during the
three and six
months ended
June 30, 2018
, respectively, and
$1.2 million
and
$2.3 million
during the
three and six
months ended
June 30, 2017
, respectively. See below for the high, low and average prices of RINs for each of the quarterly periods in
2017
and for the
six
months ended
June 30, 2018
.
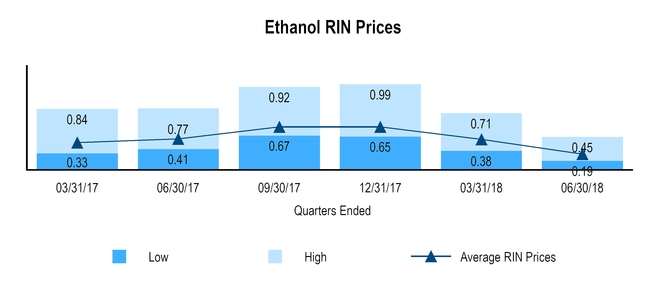
All of these factors are subject to change over time. As part of our overall business strategy, management considers aspects such as location, acquisition and expansion opportunities and factors impacting the utilization of the refineries (and therefore throughput volumes), which may impact our performance in the market.
Seasonality and Customer Maintenance Programs
The volume and throughput of crude oil, intermediate and refined products transported through our pipelines and sold through our terminals and to third parties are directly affected by the level of supply and demand for all such products in the markets served directly or indirectly by our assets or our customers. Supply and demand for such products fluctuates during the calendar year. Demand for gasoline, for example, is generally higher during the summer months than during the winter months due to seasonal increases in motor vehicle traffic. In addition, our refining customers, such as Delek, occasionally reduce or suspend operations to perform planned maintenance during the winter, when demand for their products is lower. Accordingly, these factors affect the need for crude oil or finished products by our customers, and therefore limit our volumes or throughput during these periods, and our operating results will generally be lower during the first and fourth quarters of the year. We believe, however, that many of the potential effects of seasonality on our revenues and contribution margin will be substantially mitigated due to our commercial agreements with Delek that include minimum volume and throughput commitments.
Contractual Obligations
There have been no material changes to our contractual obligations and commercial commitments during the
six
months ended
June 30, 2018
, from those disclosed in our Annual Report on Form 10-K.
33
Critical Accounting Policies
The preparation of our condensed consolidated financial statements requires us to make estimates and judgments that affect the reported amounts of assets, liabilities, revenues and expenses and related disclosure of contingent assets and liabilities. The SEC has defined critical accounting policies as those that are both most important to the portrayal of our financial condition and results of operations and require our most difficult, complex or subjective judgments or estimates. Based on this definition and as further described in our Annual Report on Form 10-K, we believe our critical accounting policies include the following: (i) evaluating impairment for property, plant and equipment and definite life intangibles, (ii) valuing goodwill and evaluating potential impairment, and (iii) estimating environmental expenditures. For all financial statement periods presented, there have been no material modifications to the application of these critical accounting policies or estimates since our Annual Report on Form 10-K, except as detailed in
Note 1
to our accompanying condensed consolidated financial statements relating to our adoption of ASC 606,
Revenue from Contracts with Customers
.
34
Results of Operations
A discussion and analysis of the factors contributing to our results of operations is presented below. The financial statements, together with the following information, are intended to provide investors with a reasonable basis for assessing our historical operations, but should not serve as the only criteria for predicting our future performance.
The following table and discussion present a summary of our consolidated results of operations for the
three and six
months ended
June 30, 2018
and
2017
, including a reconciliation of net income to EBITDA and net cash provided by operating activities to distributable cash flow (in thousands, except unit and per unit amounts).
|
Three Months Ended
|
Six Months Ended
|
|||||||||||||||
|
June 30,
|
June 30,
|
|||||||||||||||
|
2018
|
2017
|
2018
|
2017
|
|||||||||||||
|
Statement of Operations Data:
|
||||||||||||||||
|
Net revenues:
|
|
|
|
|
||||||||||||
|
Pipelines and transportation
|
$
|
37,744
|
|
$
|
30,223
|
|
$
|
71,457
|
|
$
|
58,900
|
|
||||
|
Wholesale marketing and terminalling
|
128,536
|
|
96,546
|
|
262,744
|
|
197,342
|
|
||||||||
|
Total
|
166,280
|
|
126,769
|
|
334,201
|
|
256,242
|
|
||||||||
|
Operating costs and expenses:
|
|
|
|
|
||||||||||||
|
Cost of goods sold
|
106,016
|
|
85,039
|
|
225,048
|
|
177,629
|
|
||||||||
|
Operating expenses
|
14,917
|
|
9,966
|
|
27,494
|
|
20,324
|
|
||||||||
|
General and administrative expenses
|
3,747
|
|
2,656
|
|
6,722
|
|
5,504
|
|
||||||||
|
Depreciation and amortization
|
7,019
|
|
5,742
|
|
13,019
|
|
10,935
|
|
||||||||
|
Loss on asset disposals
|
(129
|
)
|
(5
|
)
|
(69
|
)
|
7
|
|
||||||||
|
Total operating costs and expenses
|
131,570
|
|
103,398
|
|
272,214
|
|
214,399
|
|
||||||||
|
Operating income
|
34,710
|
|
23,371
|
|
61,987
|
|
41,843
|
|
||||||||
|
Interest expense, net
|
10,926
|
|
5,462
|
|
18,988
|
|
9,533
|
|
||||||||
|
Income from equity method investments
|
(1,899
|
)
|
(1,176
|
)
|
(2,757
|
)
|
(1,421
|
)
|
||||||||
|
Total non-operating costs and expenses
|
9,027
|
|
4,286
|
|
16,231
|
|
8,112
|
|
||||||||
|
Income before income tax expense
|
25,683
|
|
19,085
|
|
45,756
|
|
33,731
|
|
||||||||
|
Income tax expense
|
101
|
|
108
|
|
179
|
|
159
|
|
||||||||
|
Net income attributable to partners
|
$
|
25,582
|
|
$
|
18,977
|
|
$
|
45,577
|
|
$
|
33,572
|
|
||||
|
Comprehensive income attributable to partners
|
$
|
25,582
|
|
$
|
18,977
|
|
$
|
45,577
|
|
$
|
33,572
|
|
||||
|
EBITDA
(1)
|
$
|
45,431
|
|
$
|
30,289
|
|
$
|
80,167
|
|
$
|
54,199
|
|
||||
|
|
|
|||||||||||||||
|
Less: General partner's interest in net income, including incentive distribution rights
|
6,212
|
|
4,552
|
|
11,842
|
|
8,661
|
|
||||||||
|
Limited partners' interest in net income
|
$
|
19,370
|
|
$
|
14,425
|
|
$
|
33,735
|
|
$
|
24,911
|
|
||||
|
Net income per limited partner unit
(2)
:
|
||||||||||||||||
|
Common units - (basic)
|
$
|
0.79
|
|
$
|
0.59
|
|
$
|
1.38
|
|
$
|
1.02
|
|
||||
|
Common units - (diluted)
|
$
|
0.79
|
|
$
|
0.59
|
|
$
|
1.38
|
|
$
|
1.02
|
|
||||
|
Weighted average limited partner units outstanding
(2)
:
|
||||||||||||||||
|
Common units - (basic)
|
24,386,031
|
|
24,335,338
|
|
24,384,341
|
|
24,331,991
|
|
||||||||
|
Common units - (diluted)
|
24,394,103
|
|
24,375,946
|
|
24,391,760
|
|
24,371,540
|
|
||||||||
(1)
For a definition of EBITDA, see "How We Evaluate Our Operations—EBITDA and Distributable Cash Flow" above.
(2)
We base our calculation of net income per unit on the weighted-average number of common limited partner units outstanding during the period.
35
|
Three Months Ended
|
Six Months Ended
|
|||||||||||||||
|
June 30,
|
June 30,
|
|||||||||||||||
|
2018
|
2017
|
2018
|
2017
|
|||||||||||||
|
Reconciliation of net income to EBITDA:
|
||||||||||||||||
|
Net income
|
$
|
25,582
|
|
$
|
18,977
|
|
$
|
45,577
|
|
$
|
33,572
|
|
||||
|
Add:
|
||||||||||||||||
|
Income tax expense
|
101
|
|
108
|
|
179
|
|
159
|
|
||||||||
|
Depreciation and amortization
|
7,019
|
|
5,742
|
|
13,019
|
|
10,935
|
|
||||||||
|
Amortization of customer contract intangible assets
|
1,803
|
|
—
|
|
2,404
|
|
—
|
|
||||||||
|
Interest expense, net
|
10,926
|
|
5,462
|
|
18,988
|
|
9,533
|
|
||||||||
|
EBITDA
(1)
|
$
|
45,431
|
|
$
|
30,289
|
|
$
|
80,167
|
|
$
|
54,199
|
|
||||
|
Reconciliation of net cash from operating activities to distributable cash flow:
|
||||||||||||||||
|
Net cash provided by operating activities
|
$
|
27,987
|
|
$
|
23,436
|
|
$
|
51,643
|
|
$
|
46,910
|
|
||||
|
Changes in assets and liabilities
|
6,215
|
|
881
|
|
9,921
|
|
(2,681
|
)
|
||||||||
|
Distributions from equity method investments in investing activities
|
—
|
|
501
|
|
660
|
|
501
|
|
||||||||
|
Maintenance and regulatory capital expenditures
(2)
|
(1,017
|
)
|
(2,070
|
)
|
(1,341
|
)
|
(4,313
|
)
|
||||||||
|
Reimbursement from Delek for capital expenditures
(3) (4)
|
314
|
|
460
|
|
705
|
|
1,338
|
|
||||||||
|
Accretion of asset retirement obligations
|
(97
|
)
|
(73
|
)
|
(175
|
)
|
(146
|
)
|
||||||||
|
Deferred income taxes
|
—
|
|
(94
|
)
|
—
|
|
(119
|
)
|
||||||||
|
Loss on asset disposals
|
129
|
|
5
|
|
69
|
|
(7
|
)
|
||||||||
|
Distributable cash flow
(1)
|
$
|
33,531
|
|
$
|
23,046
|
|
$
|
61,482
|
|
$
|
41,483
|
|
||||
(1)
For a definition of EBITDA and distributable cash flow, please see "How We Evaluate Our Operations—EBITDA and Distributable Cash Flow" above.
(2)
Maintenance and regulatory capital expenditures represent cash expenditures (including expenditures for the addition or improvement to, or the replacement of, our capital assets, and for the acquisition of existing, or the construction or development of new, capital assets) made to maintain our long-term operating income or operating capacity. Examples of maintenance and regulatory capital expenditures are expenditures for the repair, refurbishment and replacement of pipelines and terminals, to maintain equipment reliability, integrity and safety and to address environmental laws and regulations.
(3)
For the
three and six
month periods ended
June 30, 2018
and
2017
, Delek reimbursed us for certain capital expenditures pursuant to the terms of the Omnibus Agreement (as defined in
Note 3
to our accompanying condensed consolidated financial statements).
(4)
During the year ended
December 31, 2017
, the reimbursed capital expenditure amounts in the determination of distributable cash flow were revised to reflect the accrual of reimbursed capital expenditures from Delek rather than the cash amounts received for reimbursed capital expenditures during the
three and six
months period ended
June 30, 2017
. This resulted in decreases to the distributable cash flow of
$0.3 million
and
$2.5 million
from the amounts presented on our Quarterly Report on Form 10-Q for the
three and six
months period ended
June 30, 2017
, respectively.
36
Segment Data:
The following is a summary of business segment capital expenditures for the periods indicated (in thousands):
|
Three Months Ended
|
Six Months Ended
|
|||||||||||
|
June 30,
|
June 30,
|
|||||||||||
|
2018
|
2017
|
2018
|
2017
|
|||||||||
|
Capital spending (excluding business combinations)
|
||||||||||||
|
Pipelines and Transportation
|
826
|
|
1,660
|
|
2,234
|
|
3,797
|
|
||||
|
Wholesale Marketing and Terminalling
|
1,426
|
|
459
|
|
2,215
|
|
1,113
|
|
||||
37
Consolidated Results of Operations — Comparison of the
Three Months Ended
June 30, 2018
compared to the
Three Months Ended
June 30, 2017
The table below presents a summary of our consolidated results of operations and our segment operating performance for the three months ended
June 30, 2018
and
2017
. The discussion immediately following presents the consolidated results of operations (in thousands).
|
Three Months Ended
|
||||||||
|
June 30,
|
||||||||
|
2018
|
2017
|
|||||||
|
Pipelines and Transportation
|
||||||||
|
Net Revenues:
|
||||||||
|
Affiliates
|
34,030
|
|
$
|
27,668
|
|
|||
|
Third-Party
|
3,714
|
|
2,555
|
|
||||
|
Total Pipelines and Transportation
|
37,744
|
|
30,223
|
|
||||
|
Operating costs and expenses:
|
||||||||
|
Cost of goods sold
|
5,195
|
|
4,403
|
|
||||
|
Operating expenses
|
9,933
|
|
7,933
|
|
||||
|
Segment contribution margin
|
$
|
22,616
|
|
$
|
17,887
|
|
||
|
Wholesale Marketing and Terminalling
|
||||||||
|
Net Revenues:
|
||||||||
|
Affiliates
|
19,050
|
|
$
|
12,156
|
|
|||
|
Third-Party
|
109,486
|
|
84,390
|
|
||||
|
Total Wholesale Marketing and Terminalling
|
128,536
|
|
96,546
|
|
||||
|
Operating costs and expenses:
|
||||||||
|
Cost of goods sold
|
100,821
|
|
80,636
|
|
||||
|
Operating expenses
|
4,984
|
|
2,033
|
|
||||
|
Segment contribution margin
|
$
|
22,731
|
|
$
|
13,877
|
|
||
|
Consolidated
|
||||||||
|
Net Revenues:
|
||||||||
|
Affiliates
|
53,080
|
|
$
|
39,824
|
|
|||
|
Third-Party
|
113,200
|
|
86,945
|
|
||||
|
Net revenues
|
166,280
|
|
126,769
|
|
||||
|
Operating costs and expenses:
|
||||||||
|
Cost of goods sold
|
106,016
|
|
85,039
|
|
||||
|
Operating expenses
|
14,917
|
|
9,966
|
|
||||
|
Contribution margin
|
45,347
|
|
31,764
|
|
||||
|
General and administrative expenses
|
3,747
|
|
2,656
|
|
||||
|
Depreciation and amortization
|
7,019
|
|
5,742
|
|
||||
|
Gain on asset disposals
|
(129
|
)
|
(5
|
)
|
||||
|
Operating income
|
$
|
34,710
|
|
$
|
23,371
|
|
||
Net Revenues
We generated net revenues of
$166.3 million
for the
second
quarter of
2018
compared to
$126.8 million
for the
second
quarter of
2017
, an increase of
$39.5 million
, or
31.2%
. The increase was primarily attributable to increases in the average sales prices per gallon of gasoline and diesel sold in our west Texas marketing operations. The average sales prices per gallon of gasoline and diesel sold increased
$0.64
per gallon and
$0.71
per gallon, respectively, during the
second
quarter of
2018
compared to the
second
quarter of
2017
. Also contributing to the increase were net revenues generated under the agreements executed in connection with the Big Spring Logistic Assets Acquisition, which were effective
March 1, 2018
. Refer to
Note 3
to our accompanying condensed consolidated financial statements for additional information about the agreements executed in connection with the Big Spring Logistic Assets Acquisition.
Cost of Goods Sold
Cost of goods sold was
$106.0 million
for the
second
quarter of
2018
compared to
$85.0 million
for the
second
quarter of
2017
, an increase of
$21.0 million
, or
24.7%
. The increase in cost of goods sold was primarily attributable to increases in the average cost per gallon of gasoline and diesel purchased in our west Texas marketing operations. The average cost per gallon of gasoline and diesel purchased increased
$0.48
per gallon and
$0.62
per gallon, respectively, during the
second
quarter of
2018
compared to the
second
quarter of
2017
.
Operating Expenses
Operating expenses were
$14.9 million
for the
second
quarter of
2018
compared to
$10.0 million
for the
second
quarter of
2017
, an increase of
$5.0 million
, or
49.7%
. The increase in operating expenses was primarily due to the operating costs associated with the logistics assets acquired in the Big Spring Logistic Assets Acquisition, including professional services fees incurred in connection with the transaction. Also contributing to the increase were increases in employee costs allocated to us as a result of increases in allocated employee headcount and increases in employee incentive costs.
Contribution Margin
Contribution margin for the
second
quarter of
2018
was
$45.3 million
compared to
$31.8 million
for the
second
quarter of
2017
, an increase of
$13.6 million
, or
42.8%
. The increase in contribution margin was primarily attributable to improved contribution margin in our west Texas operations as a result of
continued increased drilling activity in the region and favorable market price movements. Also contributing to the increase were increases in revenue generated under the agreements executed in connection with the Big Spring Logistic Assets Acquisition as described above.
38
General and Administrative Expenses
General and administrative expenses were
$3.7 million
for the
second
quarter of
2018
compared to
$2.7 million
for the
second
quarter of
2017
, an increase of
$1.1 million
, or
41.1%
. The increase in general and administrative expenses was primarily due to increases in professional services and management fees incurred in connection with the management of various transactions and projects.
Depreciation and Amortization
Depreciation and amortization was
$7.0 million
for the
second
quarter of
2018
compared to
$5.7 million
for the
second
quarter of
2017
, an increase of
$1.3 million
, or
22.2%
. The increase in depreciation and amortization was primarily due to the addition of assets to our asset base as a result of the Big Spring Logistic Assets Acquisition as well as the completion of capital projects that were placed into service throughout
2017
and during the first half of
2018
.
Interest Expense
Interest expense was
$10.9 million
for the
second
quarter of
2018
compared to
$5.5 million
for the
second
quarter of
2017
, an increase of $5.4 million, or
100.0%
. This increase was primarily attributable to higher interest costs associated with increased borrowings under the DKL Revolver as a result of the Big Spring Acquisition and interest payments under the 2025 Notes.
Income Tax Expense
Income tax expense was
$0.1 million
for each of the
second
quarters of
2018
and
2017
. Our effective tax rate was
0.4%
for the
second
quarter of
2018
, compared to
0.6%
for the
second
quarter of
2017
. The Partnership is not subject to federal income taxes as a limited partnership. Accordingly, our taxable income or loss is included in the federal and state income tax returns of our partners. Income tax expense represents amounts incurred for state income taxes.
Consolidated Results of Operations — Comparison of the
Six Months Ended
June 30, 2018
compared to the
Six Months Ended
June 30, 2017
The table below presents a summary of our consolidated results of operations and our segment operating performance for the
six
months ended
June 30, 2018
and
2017
. The discussion immediately following presents the consolidated results of operations.
|
Six Months Ended
|
|||||||
|
June 30,
|
|||||||
|
2018
|
2017
|
||||||
|
Pipelines and Transportation
|
|||||||
|
Net Revenues:
|
|||||||
|
Affiliate
|
$
|
63,492
|
|
$
|
54,168
|
|
|
|
Third-Party
|
7,965
|
|
4,732
|
|
|||
|
Total Pipelines and Transportation
|
71,457
|
|
58,900
|
|
|||
|
Operating costs and expenses:
|
|||||||
|
Cost of goods sold
|
9,636
|
|
8,808
|
|
|||
|
Operating expenses
|
19,555
|
|
16,088
|
|
|||
|
Segment contribution margin
|
$
|
42,266
|
|
$
|
34,004
|
|
|
|
Wholesale Marketing and Terminalling
|
|||||||
|
Net Revenues:
|
|||||||
|
Affiliate
|
$
|
51,232
|
|
$
|
22,275
|
|
|
|
Third-Party
|
211,512
|
|
175,067
|
|
|||
|
Total Wholesale Marketing and Terminalling
|
262,744
|
|
197,342
|
|
|||
|
Operating costs and expenses:
|
|||||||
|
Cost of goods sold
|
215,412
|
|
168,821
|
|
|||
|
Operating expenses
|
7,939
|
|
4,236
|
|
|||
|
Segment contribution margin
|
$
|
39,393
|
|
$
|
24,285
|
|
|
|
Consolidated
|
|||||||
|
Net Revenues:
|
|||||||
|
Affiliate
|
$
|
114,724
|
|
$
|
76,443
|
|
|
|
Third-Party
|
219,477
|
|
179,799
|
|
|||
|
Net revenues
|
334,201
|
|
256,242
|
|
|||
|
Operating costs and expenses:
|
|||||||
|
Cost of goods sold
|
225,048
|
|
177,629
|
|
|||
|
Operating expenses
|
27,494
|
|
20,324
|
|
|||
|
Contribution margin
|
81,659
|
|
58,289
|
|
|||
|
General and administrative expenses
|
6,722
|
|
5,504
|
|
|||
|
Depreciation and amortization
|
13,019
|
|
10,935
|
|
|||
|
Gain on asset disposals
|
(69
|
)
|
7
|
|
|||
|
Operating income
|
$
|
61,987
|
|
$
|
41,843
|
|
|
39
Net Revenues
We generated net revenues of
$334.2 million
for the
six
months ended
June 30, 2018
compared to
$256.2 million
for the
six
months ended
June 30, 2017
, an increase of
$78.0 million
, or
30.4%
. The increase was primarily attributable to increases in the average sales prices per gallon of gasoline and diesel sold in our west Texas marketing operations. The average sales prices per gallon of gasoline and diesel sold increased
$0.43
per gallon and
$0.57
per gallon, respectively, during the
six
months ended
June 30, 2018
compared to the
six
months ended
June 30, 2017
. Also contributing to the increase in net revenues were net revenues generated under the agreements executed in connection with the Big Spring Logistic Assets Acquisition, which were effective
March 1, 2018
, as well as the increased volume related to the east Texas marketing agreement. Refer to
Note 3
to our accompanying condensed consolidated financial statements for additional information about the agreements executed in connection with the Big Spring Logistic Assets Acquisition.
Cost of Goods Sold
Cost of goods sold was
$225.0 million
for the
six
months ended
June 30, 2018
compared to
$177.6 million
for the
six
months ended
June 30, 2017
, an increase of
$47.4 million
, or
26.7%
. The increase in cost of goods sold was primarily attributable to increases in the average cost per gallon of gasoline and diesel purchased in our west Texas marketing operations. The average cost per gallon of gasoline and diesel purchased increased
$0.33
per gallon and
$0.50
per gallon, respectively, during the
six
months ended
June 30, 2018
, compared to the
six
months ended
June 30, 2017
.
Operating Expenses
Operating expenses were
$27.5 million
for the
six
months ended
June 30, 2018
compared to
$20.3 million
for the
six
months ended
June 30, 2017
, an increase of
$7.2 million
, or
35.3%
. The increase in operating expenses was primarily due to the operating costs associated with the logistics assets acquired in the Big Spring Logistic Assets Acquisition, including professional services fees incurred in connection with the transaction. Also contributing to the increase were increases in employee costs allocated to us as a result of increases in allocated employee headcount and increases in employee incentive costs.
Contribution Margin
Contribution margin for the
six
months ended
June 30, 2018
was
$81.7 million
compared to
$58.3 million
for the
six
months ended
June 30, 2017
, an increase of
$23.4 million
, or
40.1%
. The increase in contribution margin was primarily attributable to improved contribution margin in our west Texas operations as a result of
continued increased drilling activity in the region and favorable market price movements. Also contributing to the increase were increases in revenue generated under the agreements executed in connection with the Big Spring Logistic Assets Acquisition and the improved performance related to the east Texas marketing agreement as described above.
General and Administrative Expenses
General and administrative expenses were
$6.7 million
for the
six
months ended
June 30, 2018
compared to
$5.5 million
for the
six
months ended
June 30, 2017
, an increase of
$1.2 million
, or
22.1%
. The increase in general and administrative expenses was primarily due to increases in professional services fees incurred in connection with the Big Spring Logistic Assets Acquisition. Also contributing to the increase were increases in certain direct employee costs allocated to us in connection with an increase in allocated employee headcount and in fees incurred in connection with the management of various projects.
Depreciation and Amortization
Depreciation and amortization was
$13.0 million
for the
six
months ended
June 30, 2018
compared to
$10.9 million
for the
six
months ended
June 30, 2017
, an increase of
$2.1 million
, or
19.1%
. The increase in depreciation and amortization was primarily due to the addition of assets to our asset base as a result of the Big Spring Acquisition as well as the completion of capital projects that were placed in service throughout
2017
and during the
six
months ended
June 30, 2018
.
Interest Expense
Interest expense was
$19.0 million
for the
six
months ended
June 30, 2018
compared to
$9.5 million
for the
six
months ended
June 30, 2017
, an increase of
$9.5 million
, or
99.2%
. This increase was primarily attributable to higher interest costs associated with increased borrowings under the DKL Revolver as a result of the Big Spring Acquisition and interest payments under the 2025 Notes.
40
Income Tax Expense
Income tax expense was
$0.2 million
for each of the
six
months ended
June 30, 2018
and
2017
. Our effective tax rate was
0.4%
for the
six
months ended
June 30, 2018
, compared to
0.5%
for the
six
months ended
June 30, 2017
. The Partnership is not subject to federal income taxes as a limited partnership. Accordingly, our taxable income or loss is included in the federal and state income tax returns of our partners. Income tax expense represents amounts incurred for state income taxes.
41
Operating Segments
We review operating results in two reportable segments: (i) pipelines and transportation and (ii) wholesale marketing and terminalling. Decisions concerning the allocation of resources and assessment of operating performance are made based on this segmentation. Management measures the operating performance of each reportable segment based on the segment contribution margin. Segment contribution margin is defined as net revenues less cost of goods sold and operating expenses, excluding depreciation and amortization. Segment reporting is more fully discussed in
Note 12
to our accompanying condensed consolidated financial statements.
Pipelines and Transportation Segment
Our pipelines and transportation segment assets provide crude oil gathering and crude oil, intermediate and refined products transportation and storage services to Delek and third parties. These assets include the Lion Pipeline System, the SALA Gathering System, the Paline Pipeline System, the East Texas Crude Logistics System, the Tyler-Big Sandy Pipeline, the El Dorado Tank Assets, the Tyler Tank Assets, the Greenville-Mount Pleasant Pipeline and Greenville Storage Facility, the El Dorado Rail Offloading Racks, the Tyler Crude Tank, refined product pipeline capacity leased from Enterprise TE Products Pipeline Company LLC that runs from El Dorado, Arkansas to our Memphis terminal and the Big Spring Pipeline. In addition to these operating systems, we own or lease 133 tractors and 167 trailers used to haul primarily crude oil and other products for related and third parties. Effective
March 1, 2018
, this segment also includes the pipelines and storage assets acquired in the Big Spring Logistic Assets Acquisition.
The following table and discussion present the results of operations and certain operating statistics of the pipelines and transportation segment for the
three and six
months ended
June 30, 2018
and
2017
:
|
Three Months Ended June 30,
|
Six Months Ended June 30,
|
|||||||||||
|
2018
|
2017
|
2018
|
2017
|
|||||||||
|
Throughputs (average bpd)
|
||||||||||||
|
Lion Pipeline System:
|
||||||||||||
|
Crude pipelines (non-gathered)
|
56,088
|
|
59,953
|
|
55,412
|
|
59,351
|
|
||||
|
Refined products pipelines to Enterprise Systems
|
48,013
|
|
49,820
|
|
48,879
|
|
50,583
|
|
||||
|
SALA Gathering System
|
16,738
|
|
15,957
|
|
16,705
|
|
16,242
|
|
||||
|
East Texas Crude Logistics System
|
16,902
|
|
13,591
|
|
17,478
|
|
14,876
|
|
||||
Comparison of the
Three Months Ended
June 30, 2018
compared to the
Three Months Ended
June 30, 2017
Net Revenues
Net revenues for the pipelines and transportation segment were
$37.7 million
for the
second
quarter of
2018
compared to
$30.2 million
for the
second
quarter of
2017
, an increase of
$7.5 million
, or
24.9%
. The increase was primarily attributable to increased revenues generated by the pipelines and storage assets acquired in the Big Spring Logistic Assets Acquisition and increased revenues on our Paline Pipeline. On March 1, 2018, we entered into two agreements pursuant to which the capacity of the Paline Pipeline was contracted to separate parties for a monthly fee, compared to the
second
quarter of
2017
when the Paline Pipeline was a FERC regulated pipeline with a tariff established for potential shippers.
Cost of Goods Sold
Cost of goods sold was
$5.2 million
for the
second
quarter of
2018
compared to
$4.4 million
for the second quarter of
2017
, an increase of
$0.8 million
, or
18.0%
. The increase in cost of goods sold was attributable to increases in transportation costs related to our trucking assets and higher pipeline allowance losses on our Paline Pipeline System during the
second
quarter of
2018
compared to the second quarter of
2017
.
Operating Expenses
Operating expenses were
$9.9 million
for the
second
quarter of
2018
compared to
$7.9 million
for the
second
quarter of
2017
, an increase of
$2.0 million
, or
25.2%
. The increase in operating
42
expenses was primarily due to the operating costs associated with the pipelines and storage assets acquired in the Big Spring Logistic Assets Acquisition, including professional services fees incurred in connection with the transaction. Also contributing to the increase were increases in employee costs allocated to us as a result of increases in allocated employee headcount and increases in employee incentive costs.
Contribution Margin
Contribution margin for the pipelines and transportation segment was
$22.6 million
, or
49.9%
of our consolidated segment contribution margin in the
second
quarter of
2018
, compared to
$17.9 million
, or
56.3%
of our consolidated segment contribution margin, in the
second
quarter of
2017
, an increase of
$4.7 million
, or
26.4%
. The increase in the pipelines and transportation segment contribution margin was primarily attributable to increases in net revenues generated under the agreements executed in connection with the Big Spring Logistic Assets Acquisition and increased revenues on our Paline Pipeline as described above.
Comparison of the
Six Months Ended
June 30, 2018
compared to the
Six Months Ended
June 30, 2017
Net Revenues
Net revenues for the pipelines and transportation segment were
$71.5 million
for the
six
months ended
June 30, 2018
compared to
$58.9 million
for the
six
months ended
June 30, 2017
, an increase of
$12.6 million
, or
21.3%
. The increase was primarily attributable to increased revenues generated by the pipelines and storage assets acquired in the Big Spring Logistic Assets Acquisition and increased revenues on our Paline Pipeline. On March 1, 2018, we entered into two agreements pursuant to which the capacity of the Paline Pipeline was contracted to separate parties for a monthly fee, compared to the
second
quarter of
2017
when the Paline Pipeline was a FERC regulated pipeline with a tariff established for potential shippers.
Cost of Goods Sold
Cost of goods sold was
$9.6 million
for the
six
months ended
June 30, 2018
compared to
$8.8 million
for the
six
months ended
June 30, 2017
, an increase of
$0.8 million
, or
9.4%
. The increase in cost of goods sold was attributable to increases in transportation costs related to our trucking assets.
Operating Expenses
Operating expenses were
$19.6 million
for the
six
months ended
June 30, 2018
compared to
$16.1 million
for the
six
months ended
June 30, 2017
, an increase of
$3.5 million
, or
21.6%
. The increase in operating expenses was primarily due to the operating costs associated with the pipelines and storage assets acquired in the Big Spring Logistic Assets Acquisition, including professional services fees incurred in connection with the transaction. Also contributing to the increase were increases in employee costs allocated to us as a result of increases in allocated employee headcount and increases in employee incentive costs.
Contribution Margin
Contribution margin for the pipelines and transportation segment was
$42.3 million
, or
51.8%
of our consolidated segment contribution margin, in the
six
months ended
June 30, 2018
, compared to
$34.0 million
, or
58.3%
of our consolidated segment contribution margin, in the
six
months ended
June 30, 2017
, an increase of
$8.3 million
, or
24.3%
. The increase in the pipelines and transportation segment contribution margin was primarily attributable to increases in revenue generated under the agreements executed in connection with the Big Spring Logistic Assets Acquisition and increased revenues on our Paline Pipeline System as described above.
Wholesale Marketing and Terminalling Segment
We use our wholesale marketing and terminalling assets to generate revenue by providing wholesale marketing and terminalling services to Delek’s refining operations and to independent third parties. Effective
March 1, 2018
, this segment also includes the wholesale marketing and terminalling assets acquired in the Big Spring Logistic Assets Acquisition.
The table and discussion below present the results of operations and certain operating statistics of the wholesale marketing and terminalling segment for the
three and six
months ended
June 30, 2018
and
2017
:
|
Three Months Ended June 30,
|
Six Months Ended June 30,
|
||||||||||||||
|
2018
|
2017
|
2018
|
2017
|
||||||||||||
|
Operating Information:
|
|||||||||||||||
|
East Texas - Tyler Refinery sales volumes (average bpd)
(1)
|
79,330
|
|
77,878
|
|
76,304
|
|
70,677
|
|
|||||||
|
Big Spring marketing throughputs (average bpd)
(2)
|
80,536
|
|
—
|
|
79,165
|
|
—
|
|
|||||||
|
West Texas marketing throughputs (average bpd)
|
12,261
|
|
13,422
|
|
14,091
|
|
13,942
|
|
|||||||
|
West Texas marketing margin per barrel
|
$
|
8.06
|
|
$
|
4.26
|
|
6.43
|
|
$
|
3.44
|
|
||||
|
Terminalling throughputs (average bpd)
(3)
|
162,383
|
|
128,111
|
|
154,917
|
|
122,026
|
|
|||||||
_____________________________
(1)
Excludes jet fuel and petroleum coke.
(2)
Throughputs for the
six
months ended
June 30, 2018
are for the 122 days we marketed certain finished products produced at or sold from the Big Spring Refinery following the execution of the Big Spring Marketing Agreement, effective
March 1, 2018
, as defined
43
in
Note 3
to our accompanying condensed consolidated financial statements.
(3)
Consists of terminalling throughputs at our Tyler, Big Spring, Big Sandy and Mount Pleasant, Texas, our El Dorado and North Little Rock, Arkansas and our Memphis and Nashville, Tennessee terminals. Throughputs for the Big Spring terminal are for the 122 days we operated the terminal following its acquisition effective
March 1, 2018
. Barrels per day are calculated for only the days we operated each terminal. Total throughput for the
six
months ended
June 30, 2018
was
26.0 million
barrels, which averaged
143,593
bpd for the period.
Comparison of the
Three Months Ended
June 30, 2018
compared to the
Three Months Ended
June 30, 2017
Net Revenues
Net revenues for the wholesale marketing and terminalling segment were
$128.5 million
for the
second
quarter of
2018
compared to
$96.5 million
for the
second
quarter of
2017
, an increase of
$32.0 million
, or
33.1%
. The increase was primarily attributable to increases in the average sales prices per gallon of gasoline and diesel sold in our west Texas marketing operations as well as the revenue generated under the agreements executed in connection with the Big Spring Logistic Assets Acquisition. The following charts show summaries of the average sales prices per gallon of gasoline and diesel and finished products volume impacting our west Texas operations.
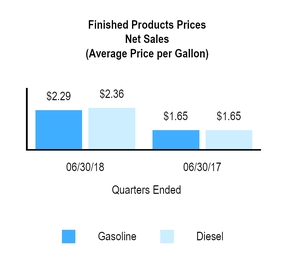
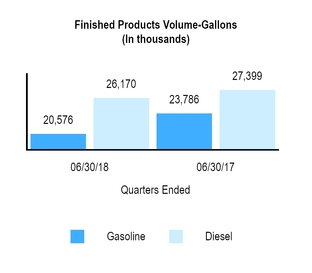
Cost of Goods Sold
Cost of goods sold for our wholesale marketing and terminalling segment was
$100.8 million
in the
second
quarter of
2018
, compared to
$80.6 million
in the
second
quarter of
2017
, an increase of
$20.2
million, or
25.0%
. The increase in cost of goods sold was attributable to increases in the average cost per gallon of gasoline and diesel purchased in our west Texas marketing operations. See the following chart for a summary of the average purchase prices per gallon of gasoline and diesel impacting our west Texas operations.
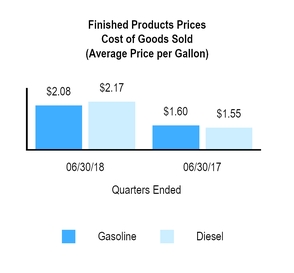
Operating Expenses
Operating expenses were
$5.0 million
in the
second
quarter of
2018
, compared to
$2.0 million
in the
second
quarter of
2017
, an increase of
$3.0 million
, or
145.2%
. The increase in operating expenses was primarily due to the operating costs associated with the wholesale marketing and terminalling assets acquired in the Big Spring Logistic Assets Acquisition.
44
Contribution Margin
Contribution margin for the wholesale marketing and terminalling segment was
$22.7 million
, or
50.1%
of our consolidated contribution margin, in the
second
quarter of
2018
, compared to
$13.9 million
, or
43.7%
of our consolidated contribution margin, in the
second
quarter of
2017
, an increase of
$8.9 million
, or
63.8%
. The increase in contribution margin was primarily attributable to improved contribution margin in our west Texas operations as a result of
continued increased drilling activity in the region and favorable market price movements. Also contributing to the increase was the increase in revenue generated under the agreements executed in connection with the Big Spring Logistic Assets Acquisition as described above.
Comparison of the
Six Months Ended
June 30, 2018
compared to the
Six Months Ended
June 30, 2017
Net Revenues
Net revenues for the wholesale marketing and terminalling segment were
$262.7 million
for the
six
months ended
June 30, 2018
compared to
$197.3 million
for the
six
months ended
June 30, 2017
, an increase of
$65.4 million
, or
33.1%
. The increase was primarily attributable to increases in the average sales prices per gallon of gasoline and diesel sold in our west Texas marketing operations, as well as increased revenue generated under the agreements executed in connection with the Big Spring Logistic Assets Acquisition and the increased volume related to the east Texas marketing agreement. The following charts show summaries of the average sales prices per gallon of gasoline and diesel and finished products volume impacting our west Texas operations.
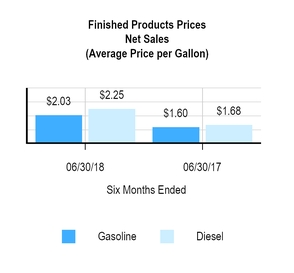
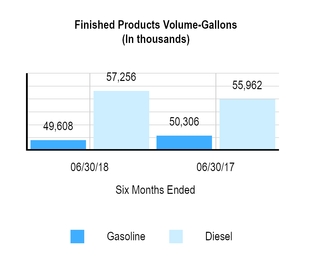
Cost of Goods Sold
Cost of goods sold for our wholesale marketing and terminalling segment was
$215.4 million
for the
six
months ended
June 30, 2018
, compared to
$168.8 million
for the
six
months ended
June 30, 2017
, an increase of
$46.6 million
, or
27.6%
. The increase in cost of goods sold was attributable to increases in the average cost per gallon of gasoline and diesel purchased in our west Texas marketing operations. See the following chart for a summary of the average purchase prices per gallon of gasoline and diesel impacting our west Texas operations.
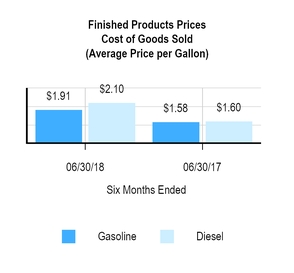
Operating Expenses
Operating expenses were
$7.9 million
in the
six
months ended
June 30, 2018
, compared to
$4.2 million
in the
six
months ended
June 30, 2017
, an increase of
$3.7 million
or
87.4%
. The increase in operating expenses was primarily due to the operating costs associated with the wholesale marketing and terminalling assets acquired in the Big Spring Logistic Assets Acquisition.
45
Contribution Margin
Contribution margin for the wholesale marketing and terminalling segment was
$39.4 million
, or
48.2%
of our consolidated contribution margin, for the
six
months ended
June 30, 2018
, compared to
$24.3 million
, or
41.7%
of our consolidated contribution margin, for the
six
months ended
June 30, 2017
, an increase of
$15.1 million
, or
62.2%
. The increase in contribution margin was primarily attributable to improved contribution margin in our west Texas operations as a result of
continued increased drilling activity in the region and favorable market price movements. Also contributing to the increase were the increase in revenue generated under the agreements executed in connection with the Big Spring Logistic Assets Acquisition and improved performance related to the east Texas marketing agreement as described above.
46
Liquidity and Capital Resources
We expect our ongoing sources of liquidity to include cash generated from operations, borrowings under our revolving credit facility and potential issuances of additional equity and debt securities. We believe that cash generated from these sources will be sufficient to satisfy the anticipated cash requirements associated with our existing operations, including minimum quarterly cash distributions and capital expenditures, for at least the next 12 months.
The table below summarizes the quarterly distributions related to our quarterly financial results:
|
Quarter Ended
|
Total Quarterly Distribution Per Limited Partner Unit
|
Total Quarterly Distribution Per Limited Partner Unit, Annualized
|
Total Cash Distribution, including general partner interest and IDRs (in thousands)
|
Date of Distribution
|
Unitholders Record Date
|
|||||||||||
|
June 30, 2017
|
$
|
0.705
|
|
$
|
2.82
|
|
$
|
21,783
|
|
August 11, 2017
|
August 4, 2017
|
|||||
|
September 30, 2017
|
$
|
0.715
|
|
$
|
2.86
|
|
$
|
22,270
|
|
November 14, 2017
|
November 7, 2017
|
|||||
|
December 31, 2017
|
$
|
0.725
|
|
$
|
2.90
|
|
$
|
22,777
|
|
February 12, 2018
|
February 2, 2018
|
|||||
|
March 31, 2018
|
$
|
0.750
|
|
$
|
3.00
|
|
$
|
23,997
|
|
May 15, 2018
|
May 7, 2018
|
|||||
|
June 30, 2018
|
$
|
0.770
|
|
$
|
3.08
|
|
$
|
24,984
|
|
August 13, 2018
(1)
|
August 3, 2018
|
|||||
(1)
Expected date of distribution.
Cash Flows
The following table sets forth a summary of our consolidated cash flows for the
six
months ended
June 30, 2018
and
2017
(in thousands):
|
|
Six Months Ended June 30,
|
|||||||
|
|
2018
|
2017
|
||||||
|
Cash Flow Data:
|
|
|
||||||
|
Operating activities
|
$
|
51,643
|
|
$
|
46,910
|
|
||
|
Investing activities
|
(221,700
|
)
|
(8,303
|
)
|
||||
|
Financing activities
|
170,559
|
|
(33,767
|
)
|
||||
|
Net increase
|
$
|
502
|
|
$
|
4,840
|
|
||
Cash Flows from Operating Activities
Net cash provided by operating activities was
$51.6 million
for the
six
months ended
June 30, 2018
, compared to cash provided of
$46.9 million
for the
six
months ended
June 30, 2017
. The increase in cash flows provided by operations was due mainly to increases in net income as well as decreases in inventories and other current assets of $
6.2 million
when compared to the
six
months ended
June 30, 2017
. Also contributing to the increase was an increase of
$2.4 million
in the amortization of the customer contract intangible asset related to the Big Spring Acquisition for which there was no amortization in
2017
. The increase in cash flows provided by operations was substantially offset by a decrease in accounts payable and other current liabilities of $
10.6 million
when compared to the
six
months ended
June 30, 2017
.
Cash Flows from Investing Activities
Net cash used in investing activities was
$221.7 million
in the
six
months ended
June 30, 2018
, compared to
$8.3 million
used in the
six
months ended
June 30, 2017
. The increase in cash used in investing activities was primarily due to the logistics assets acquired in the Big Spring Logistic Assets Acquisition and the Marketing Contract Intangible Acquisition. We purchased the assets acquired in the Big Spring Logistic Assets Acquisition for
$72.0 million
. Additionally, we purchased a marketing contract intangible for
$144.2 million
. We did not have any asset acquisitions during the
six
months ended
June 30, 2017
.
47
Cash Flows from Financing Activities
Net cash provided by financing activities was
$170.6 million
in the
six
months ended
June 30, 2018
, compared to cash used of
$33.8 million
in the
six
months ended
June 30, 2017
. The increase in cash provided by financing activities was primarily due to an increase in net proceeds under our revolving credit facility. We received net proceeds of
$314.0 million
under the revolving credit facility during the
six
months ended
June 30, 2018
, compared to net payments of
$238.1 million
under the revolving credit facility during the
six
months ended
June 30, 2017
. Offsetting the net payments under the revolving credit facility were net proceeds of
$248.1 million
under the 2025 Notes during the
six
months ended
June 30, 2017
. The increase in net proceeds under our revolving credit facility was partially offset by increases in distributions. We paid quarterly cash distributions totaling
$46.8 million
during the
six
months ended
June 30, 2018
, compared to quarterly cash distributions totaling
$41.8 million
during the
six
months ended
June 30, 2017
. We also distributed
$98.8 million
related to the Big Spring Logistic Assets Acquisition during the
six
months ended
June 30, 2018
, with no comparable distributions related to asset acquisitions during the
six
months ended
June 30, 2017
.
As of
June 30, 2018
, we had
$5.2 million
cash and cash equivalents and we had total indebtedness of
$737.1 million
. Unused credit commitments under the revolving credit facility were
$206.1 million
, and we had
no
letters of credit in place at
June 30, 2018
. We believe we were in compliance with our covenants in all debt facilities as of
June 30, 2018
. See
Note 6
to our accompanying condensed consolidated financial statements for a complete discussion of our third-party indebtedness.
Agreements Governing Certain Indebtedness of Delek
Although we are not contractually bound by and are not liable for Delek’s debt under its credit arrangements, we are indirectly affected by certain prohibitions and limitations contained therein. Specifically, certain of Delek's credit arrangements require that Delek meet certain minimum levels for (i) consolidated shareholders’ equity and (ii) a ratio of consolidated shareholders’ equity to adjusted total assets. We cannot assure you that such covenants will not impact our ability to use the full capacity under our revolving credit facility in the future. Delek, due to its majority ownership and control of our general partner, has the ability to prevent us from taking actions that would cause Delek to violate any covenant in its credit arrangements or otherwise be in default under any of its credit arrangements.
Capital Spending
A key component of our long-term strategy is our capital expenditure program. Our capital expenditures for the
six
months ended
June 30, 2018
were
$4.4 million
, of which approximately
$2.2 million
was spent in our pipelines and transportation segment and
$2.2 million
was spent in our wholesale marketing and terminalling segment. Our capital expenditure budget is approximately
$19.0 million
for
2018
.
The following table summarizes our actual capital expenditures for the
six
months ended
June 30, 2018
and planned capital expenditures for the full year
2018
by major category (in thousands):
|
Full Year
2018 Forecast |
Six Months Ended June 30, 2018
|
|||||||
|
Regulatory
|
$
|
3,435
|
|
$
|
457
|
|
||
|
Maintenance
(1)
|
8,911
|
|
1,174
|
|
||||
|
Discretionary projects
|
6,623
|
|
2,818
|
|
||||
|
Total capital spending
(2)
|
$
|
18,969
|
|
$
|
4,449
|
|
||
|
(1)
|
Maintenance capital expenditures represent cash expenditures (including expenditures for the addition or improvement to, or the replacement of, our capital assets, and for the acquisition of existing, or the construction or development of new, capital assets) made to maintain our long-term operating income or operating capacity. Examples of maintenance capital expenditures are expenditures for the repair, refurbishment and replacement of pipelines, tanks and terminals, to maintain equipment reliability, integrity and safety and to address environmental laws and regulations. Delek has agreed to reimburse us with respect to certain assets it has transferred to us pursuant to the terms of the Omnibus Agreement (as defined in
Note 3
to our accompanying condensed consolidated financial statements).
|
48
|
(2)
|
Capital spending excludes transaction costs capitalized in the amount of
$0.4 million
that relate to the Big Spring Logistic Assets Acquisition.
|
For the full year
2018
, we plan to spend approximately
$19.0 million
, of which
$12.1 million
is budgeted to the pipelines and transportation segment and
$6.9 million
to the wholesale marketing and terminalling segment. We plan to spend approximately
$6.6 million
for discretionary projects in
2018
, of which
$4.9 million
is expected to be spent in the pipelines and transportation segment and
$1.7 million
in the wholesale marketing and terminalling segment. The majority of the
$4.9 million
budgeted to discretionary projects in the pipelines and transportation segment relates to the construction of a new tank and a pipeline pump expansion. We plan to spend approximately
$8.9 million
for maintenance projects in
2018
, of which
$5.4 million
is expected to be spent in the pipelines and transportation segment and
$3.5 million
in the wholesale marketing and terminalling segment. The majority of the
$5.4 million
budgeted for maintenance projects in the pipelines and transportation segment is expected to be spent on scheduled maintenance and improvements to certain of our tanks and pipelines. The majority of the
$3.5 million
budgeted for maintenance projects in the wholesale marketing and terminalling segment relates to system upgrades at the terminals.
Under the Omnibus Agreement, Delek reimburses us for (i) certain expenses that we incur for inspections, maintenance, repairs and failures of certain assets we acquired from Delek to cause such assets to comply with applicable regulatory and/or industry standards, (ii) certain expenses that we incur for inspections, maintenance, repairs and failures of most of the storage tanks and pipelines contributed to us by Delek (subject to a deductible of $0.5 million per year for certain assets as specified) that are necessary to comply with minimum standards under certain United States Department of Transportation pipeline integrity rules and certain American Petroleum Institute storage tank standards for a period of five years from the date of the purchase of the affected assets, and (iii) for certain non-discretionary maintenance capital expenditures with respect to certain of our assets in excess of specified amounts.
The amount of our capital expenditure budget is subject to change due to unanticipated increases in the cost, scope and completion time for our capital projects. For example, we may experience increases in the cost of and/or timing to obtain necessary equipment required for our continued compliance with government regulations or to complete improvement projects. Additionally, the scope and cost of employee or contractor labor expense related to installation of that equipment could increase from our projections.
Off-Balance Sheet Arrangements
We have no off-balance sheet arrangements through the date of the filing of this Quarterly Report on Form 10-Q.
49
ITEM 3.
QUANTITATIVE AND QUALITATIVE DISCLOSURES ABOUT MARKET RISK
Commodity Price Risk
. Market risk is the risk of loss arising from adverse changes in market rates and prices. As we do not take title to any of the crude oil that we handle, and typically we take title to only limited volumes of light products in our marketing business, we have limited direct exposure to risks associated with fluctuating commodity prices. However, from time to time, we enter into Gulf Coast product swap arrangements with respect to the products we purchase to hedge our exposure to fluctuations in commodity prices for the period between our purchase of products and subsequent sales to our customers. At
June 30, 2018
and
December 31, 2017
, we had open derivative contracts representing
117,000
barrels and
370,000
barrels, respectively, of refined petroleum products. We recognized gains (loss) associated with commodity derivatives not designated as hedging instruments of
$(0.8) million
and
$0.7 million
for the
three and six
months ended
June 30, 2018
, respectively, and
$0.6 million
and
$1.1 million
for the
three and six
months ended
June 30, 2017
. These amounts were recorded to cost of goods sold in the accompanying condensed consolidated statements of income. Refer to
Note 14
to our accompanying condensed consolidated financial statements for additional detail related to our derivative instruments.
Impact of Changing Prices
. Our revenues and cash flows, as well as estimates of future cash flows, are sensitive to changes in energy prices. Shifts in the cost of crude oil, the prices of refined products and the cost of ethanol can generate changes in the operating margin in our wholesale marketing and terminalling segment. A hypothetical ten percent adverse change in year-end market prices of the underlying commodities being hedged by derivative contracts would result in a nominal decrease in market value of the hedge contracts at
June 30, 2018
. This hypothetical loss was estimated by multiplying the difference between the hypothetical and the actual year-end market prices of the underlying commodities by the contract volume amounts.
Interest Rate Risk
. Debt that we incur under our revolving credit facility bears interest at floating rates and will expose us to interest rate risk. The annualized impact of a hypothetical one percent change in interest rates on our floating rate debt outstanding as of
June 30, 2018
would be to change interest expense by approximately
$4.9 million
. From time to time, we may use certain derivative instruments to hedge our exposure to floating interest rates.
ITEM 4.
CONTROLS AND PROCEDURES.
(a) Evaluation of Disclosure Controls and Procedures
Our management has evaluated, with the participation of our principal executive and principal financial officers, the effectiveness of our disclosure controls and procedures (as defined in Rule 13a-15(e) or Rule 15d-15(e) under the Exchange Act) as of the end of the period covered by this report, and has, based on this evaluation, concluded that our disclosure controls and procedures are effective to provide reasonable assurance that information required to be disclosed by us in the reports that we file or submit under the Exchange Act is recorded, processed, summarized and reported, within the time periods specified in the SEC's rules and forms including, without limitation, controls and procedures designed to ensure that information required to be disclosed by us in the reports that we file or submit under the Exchange Act is accumulated and communicated to our management, including our principal executive and principal financial officers, as appropriate to allow timely decisions regarding required disclosures.
(b) Changes in Internal Control over Financial Reporting
There has been no change in our internal control over financial reporting (as defined in Rule 13a-15(f) and 15d-15(f) under the Exchange Act) that occurred during our last fiscal quarter that has materially affected, or is reasonably likely to materially affect, our internal control over financial reporting.
50
OTHER INFORMATION
In the ordinary conduct of our business, we are from time to time subject to lawsuits, investigations and claims, including, environmental claims and employee-related matters. Although we cannot predict with certainty the ultimate resolution of lawsuits, investigations and claims asserted against us, including civil penalties or other enforcement actions, we do not believe that any currently pending legal proceeding or proceedings to which we are a party will have a material adverse effect on our business, financial condition or results of operations and there have been no material developments to the proceedings previously reported in our Form 10-K to comply with certain SEC regulations except as set forth below.
As previously reported, in June 2015, the United States Department of Justice (the “DOJ”), on behalf of the EPA, and the State of Arkansas, on behalf of the Arkansas Department of Environmental Quality (the "ADEQ"), notified the Partnership that they were planning to bring an enforcement action with regard to alleged violations of the Clean Water Act and certain state laws arising from the release of crude oil in March 2013 from our Magnolia Station in Magnolia, Arkansas (the “Magnolia Release”). On July 13, 2018, the DOJ, and the State of Arkansas, brought a civil action in the United States District Court for the Western District of Arkansas against two of the Partnership's wholly-owned subsidiaries, Delek Logistics Operating LLC (“DLO”) and SALA Gathering Systems LLC (“SALA”), with regard to the Magnolia Release seeking monetary penalties and injunctive relief. The complaint alleges that DLO and SALA violated sections of the Clean Water Act, the Arkansas Water and Air Pollution Control Act and their implementing regulations. The complaint does not make a specific demand for monetary damages, but references the statutory maximum civil penalties available for each of the alleged claims. The Partnership is currently attempting to negotiate a resolution to this matter with the EPA and the ADEQ. As of
June 30, 2018
, we have accrued
$1.0 million
in connection with these proceedings. We believe this amount is adequate to cover our expected obligations related to these proceedings and that these proceedings will not have a material adverse effect upon the Partnership's business, financial condition or result of operations.
ITEM 1A.
RISK FACTORS
There have been no material changes in the risk factors previously disclosed in "Item 1A. Risk Factors" of our Annual Report on Form 10-K.
Unregistered Sales of Equity Securities
Pursuant to the terms of our limited Partnership Agreement, our general partner has the right to maintain its proportionate 2% general partner interest in the Partnership. The following table provides information regarding the exercise of such right by our general partner during the three months ended
June 30, 2018
. The sales listed below were exempt from registration under Section 4(a)(2) of the Securities Act.
|
Date of Sale
|
Number of General Partner Units Sold
|
Price per General Partner Unit
|
Consideration Paid to the Partnership
|
|||
|
May 1, 2018
|
30
|
$29.75
|
$892
|
|||
|
June 11, 2018
|
227
|
$28.90
|
$6,564
|
|||
On
July 24, 2018
, our general partner's board of directors declared a quarterly cash distribution of
$0.77
per limited partner unit, payable on
August 13, 2018
, to unitholders of record on
August 3, 2018
.
51
ITEM 6
. EXHIBITS
|
Exhibit No.
|
Description
|
|||
|
|
*
|
|||
|
|
*
|
|||
|
|
**
|
|||
|
|
**
|
|||
|
101
|
|
The following materials from Delek Logistics Partners, LP’s Quarterly Report on Form 10-Q for the quarterly period ended June 30, 2018 formatted in XBRL (eXtensible Business Reporting Language): (i) Condensed Consolidated Balance Sheets as of June 30, 2018 and December 31, 2017 (Unaudited), (ii) Condensed Consolidated Statements of Income and Comprehensive Income for the three and six months ended June 30, 2018 and 2017 (Unaudited), (iii) Condensed Consolidated Statements of Cash Flows for the six months ended June 30, 2018 and 2017 (Unaudited), and (iv) Notes to Condensed Consolidated Financial Statements (Unaudited).
|
||
|
*
|
Filed herewith
|
|
|
**
|
Furnished herewith
|
|
52
SIGNATURES
Pursuant to the requirements of the Securities Exchange Act of 1934, the registrant has duly caused this report to be signed on its behalf by the undersigned, thereunto duly authorized.
|
Delek Logistics Partners, LP
|
|
|
By:
|
Delek Logistics GP, LLC
|
|
Its General Partner
|
|
|
By:
|
/s/ Ezra Uzi Yemin
|
|
|
Ezra Uzi Yemin
|
|
|
Chairman and Chief Executive Officer
(Principal Executive Officer)
|
|
By:
|
/s/ Kevin Kremke
|
|
|
Kevin Kremke
|
|
|
Executive Vice President and Chief Financial Officer (Principal Financial and Accounting Officer)
|
Dated:
August 9, 2018
53
TABLE OF CONTENTS
Part IItem 1. Financial StatementsItem 2. Management S Discussion and Analysis Of Financial Condition and Results Of OperationsItem 3. Quantitative and Qualitative Disclosures About Market RiskItem 4. Controls and ProceduresPart IIItem 1. Legal ProceedingsItem 1A. Risk FactorsItem 2. Unregistered Sales Of Equity Securities and Use Of ProceedsItem 5. Other InformationItem 6 . Exhibits