DICK'S SPORTING GOODS, INC.
10-Ks and 10-Qs
|
|
|
|
|
|
|
|
|
|
|
|
|
|
|
|
|
|
|
|
|
|
|
|
|
|
|
|
|
|
|
|
|
|
|
|
|
|
|
|
|
|
|
|
|
|
|
|
|
|
|
|
|
UNITED STATES
SECURITIES AND EXCHANGE COMMISSION
Washington, D.C. 20549
FORM 10-K
ANNUAL REPORT PURSUANT TO SECTION 13 OR 15(d) OF THE SECURITIES
EXCHANGE ACT OF 1934
For the fiscal year ended
February 2, 2019
Commission File No. 001-31463
DICK'S SPORTING GOODS, INC.
(Exact name of registrant as specified in its charter)
|
Delaware
(State or other jurisdiction of incorporation or organization)
|
|
16-1241537
(I.R.S. Employer Identification No.)
|
345 Court Street, Coraopolis, Pennsylvania 15108
(724) 273-3400
(Address of principal executive offices, zip code, telephone number)
Securities registered pursuant to Section 12(b) of the Act:
|
Title of each class
|
|
Name of Each Exchange on which Registered
|
|
Common Stock, $0.01 par value
|
|
The New York Stock Exchange
|
Securities registered pursuant to Section 12(g) of the Act:
|
None
|
||
Indicate by check mark if the registrant is a well-known seasoned issuer, as defined in Rule 405 of the Securities Act. Yes
þ
No
o
Indicate by check mark if the registrant is not required to file reports pursuant to Section 13 or Section 15(d) of the Act. Yes
o
No
þ
Indicate by check mark whether the registrant (1) has filed all reports required to be filed by Section 13 or 15(d) of the Securities Exchange Act of 1934 during the preceding 12 months (or for such shorter period that the registrant was required to file such reports), and (2) has been subject to such filing requirements for the past 90 days. Yes
þ
No
o
Indicate by check mark whether the registrant has submitted electronically every Interactive Data File required to be submitted pursuant to Rule 405 of Regulation S-T (§232.405 of this chapter) during the preceding 12 months (or for such shorter period that the registrant was required to submit such files). Yes
þ
No
o
Indicate by check mark if disclosure of delinquent filers pursuant to Item 405 of Regulation S-K (§229.405 of this chapter) is not contained herein, and will not be contained, to the best of registrant's knowledge, in definitive proxy or information statements incorporated by reference in Part III of this Form 10-K or any amendment to this Form 10-K.
þ
Indicate by check mark whether the registrant is a large accelerated filer, an accelerated filer, a non-accelerated filer, a smaller reporting company, or an emerging growth company. See the definitions of "large accelerated filer," "accelerated filer," "smaller reporting company," and "emerging growth company" in Rule 12b-2 of the Exchange Act.
|
Large accelerated filer
þ
|
Accelerated filer
o
|
Non-accelerated filer
o
|
Smaller reporting company
o
|
Emerging growth company
o
|
If an emerging growth company, indicate by check mark if the registrant has elected not to use the extended transition period for complying with any new or revised financial accounting standards provided pursuant to Section 13(a) of the Exchange Act.
o
Indicate by check mark whether the registrant is a shell company (as defined in Rule 12b-2 of the Act). Yes
o
No
þ
The aggregate market value of the voting common equity held by non-affiliates of the registrant was
$2,454,907,735
as of
August 3, 2018
based upon the closing price of the registrant's common stock on the New York Stock Exchange reported for
August 3, 2018
.
The number of shares of common stock and Class B common stock of the registrant outstanding as of
March 25, 2019
was
71,762,009
and
24,541,123
, respectively.
Documents Incorporated by Reference: Part III of this Annual Report on Form 10-K incorporates certain information from the registrant's definitive proxy statement for its Annual Meeting of Stockholders to be held on
June 12, 2019
(the "
2019
Proxy Statement").
TABLE OF CONTENTS
|
|
PAGE
|
2
Forward-Looking Statements
We caution that any forward-looking statements (as such term is defined in the Private Securities Litigation Reform Act of 1995) contained in this Annual Report on Form 10-K or made by our management involve risks and uncertainties and are subject to change based on various important factors, many of which may be beyond our control. Accordingly, our future performance and financial results may differ materially from those expressed or implied in any such forward-looking statements. Investors should not place undue reliance on forward-looking statements as a prediction of actual results. These statements can be identified as those that may predict, forecast, indicate or imply future results, performance or advancements and by forward-looking words such as
"believe", "anticipate", "expect", "estimate", "predict", "intend", "plan", "project", "goal", "will", "will be", "will continue", "will result", "could", "may", "might"
or any variations of such words or other words with similar meanings. Forward-looking statements address, among other things, investments to enhance our store experience, to improve our eCommerce fulfillment capabilities, and to implement technology solutions that improve the athlete experience and our teammates’ productivity; the continued improvements to the functionality and performance of our own eCommerce platform, including faster and more reliable delivery, faster and more convenient checkout, improved page responsiveness, and new content development through our Pro Tips platform; plans to invest in the growth and marketing of our private brand business; the opening of two new fulfillment centers during the third quarter of 2019; delivering the majority of our online orders within two business days by the end of 2019; our plans to reduce our store growth rate and leverage our real estate portfolio to capitalize on future opportunities in the near and intermediate term as our existing leases come up for renewal; plans to remove hunt merchandise from approximately 125 Dick's Sporting Goods stores and replace with merchandise that is more relevant to the local market; capturing displaced market share; the potential impact of the continuation of the promotional environment in retail, broadened distribution channels of key vendors, and weak customer demand for firearms and other hunting merchandise across the industry; attracting and retaining knowledgeable and skilled teammates; projections of our future profitability; future results of operations; the effect of new or changes in existing tariffs;
capital expenditures; anticipated store openings and relocations; plans to return capital to stockholders through dividends or share repurchases; and our future financial condition.
Forward-looking statements are based on current expectations and assumptions that are subject to risks and uncertainties, which may cause actual results to differ materially from those expressed or implied in the forward-looking statements. A detailed discussion of risks and uncertainties that could cause actual results and events to differ materially from such forward-looking statements is included in the section titled "Risk Factors" (Item 1A of this Form 10-K). In addition, we operate in a highly competitive and rapidly changing environment; therefore, new risk factors can arise, and it is not possible for management to predict all such risk factors, nor to assess the impact of all such risk factors on our business or the extent to which any individual risk factor, or combination of risk factors, may cause results to differ materially from those contained in any forward-looking statement. The forward-looking statements included in this Annual Report on Form 10-K are made as of this date. We do not assume any obligation and do not intend to update or revise any forward-looking statements whether as a result of new information, future developments or otherwise except as may be required by the securities laws.
PART I
ITEM 1. BUSINESS
General
Dick's Sporting Goods, Inc. (together with its subsidiaries, referred to as "the Company", "we", "us" and "our" unless specified otherwise) is a leading omni-channel sporting goods retailer offering an extensive assortment of authentic, high-quality sports equipment, apparel, footwear and accessories through a blend of dedicated associates, in-store services and unique specialty shop-in-shops. The Company also owns and operates Golf Galaxy and Field & Stream stores, and Dick's Team Sports HQ, an all-in-one youth sports digital platform offering scheduling, communications and live scorekeeping through its GameChanger mobile apps, free league management services, custom uniforms and fan wear, and access to donations and sponsorships. The Company offers its products through a content-rich eCommerce platform that is integrated with its store network and provides customers with the convenience and expertise of a 24-hour storefront.
The Company was founded in 1948 when Richard "Dick" Stack, the father of Edward W. Stack, our Chairman and Chief Executive Officer, opened his original bait and tackle store in Binghamton, New York. Edward W. Stack joined his father's business full-time in 1977 and in 1984 became President and Chief Executive Officer of the then two-store chain. Our vision is to be the best sports company in the world. We create confidence and excitement by personally equipping all athletes to achieve their dreams.
3
We were incorporated in 1948 in New York under the name Dick's Clothing and Sporting Goods, Inc. In November 1997, we reincorporated as a Delaware corporation and in April 1999 we changed our name to Dick's Sporting Goods, Inc. Our executive office is located at 345 Court Street, Coraopolis, Pennsylvania 15108 and our phone number is (724) 273-3400. Our website is located at dicks.com. The information on our website does not constitute a part of this Annual Report on Form 10-K. We include on our website, free of charge, copies of our Annual and Quarterly Reports on Forms 10-K and 10-Q, Current Reports on Form 8-K and amendments to those reports filed or furnished pursuant to the Securities Exchange Act of 1934, as amended (the "Exchange Act").
When used in this Annual Report on Form 10-K, unless the context otherwise requires or unless otherwise specified, any reference to "year" is to the Company's fiscal year.
Business Strategy
The key elements of our business strategy are:
Focus on Our Customer.
Our first priority is to put the customer, to whom we refer as athletes, at the center of everything that we do. We believe that our mindset and our culture must ensure that every decision we make, whether in our stores or at our Customer Support Center ("CSC"), improves the athlete’s experience. We will continue to make investments that enhance our store experience, improve our eCommerce fulfillment capabilities and implement technology solutions that improve the athlete experience as well as teammate productivity.
Our marketing program is designed to build loyalty for the Dick’s Sporting Goods brand while promoting our broad assortment of brand name sporting goods equipment, apparel and footwear in a specialty store environment. Our historical marketing strategy has consisted largely of newspaper advertising supplemented by direct mail and seasonal use of local and national television and radio. While we continue to market through these traditional channels, we have more recently developed brand-building marketing campaigns focused on building passion and loyalty to the Dick’s Sporting Goods brand and have shifted our advertising focus toward digital marketing and personalization. We continue to leverage our extensive and expanding customer relationship marketing database from our ScoreCard Rewards program. The Company continues to grow its community presence through Team Sports HQ and sponsoring thousands of teams at the local level.
We continue to offer our Best Price Guarantee as a promise to our customers that if they find a lower price than ours, we will match it. We also continue to enhance our ScoreCard loyalty program to make it more rewarding to our customers. At the end of fiscal 2017, we discontinued our practice of expiring accrued ScoreCard points at year-end and moved to a rolling 12-month expiration policy. We believe this will reduce customer frustration and will provide us an opportunity to drive customers back to us after they earn points by shopping with us during the holiday season. We also launched a new tier of our ScoreCard loyalty program during 2018 that better rewards our best customers for their loyalty to us.
Authentic Sporting Goods Retailer.
Our history and core foundation is as a retailer of high-quality authentic athletic equipment, apparel and footwear, which is intended to enhance our customers' performance and enjoyment of athletic pursuits, rather than focusing our merchandise selection on the latest fashion trend or style. We believe our customers seek genuine, deep product offerings, and that ultimately this merchandising approach positions us with advantages in the market, which we believe will continue to benefit from new product offerings with enhanced technological features.
Our objective is not only to carry leading brands, but to carry a full range of products within each category, including premium items for the sports enthusiast. We believe that the breadth of our product selections in each category of sporting goods offers our customers a wide range of good, better and best price points and enables us to address the needs of sporting goods consumers, from the beginner to the sports enthusiast, which distinguishes us from other large format sporting goods stores. We also believe that the range of merchandise and extensive in-store support services that we offer allows us to differentiate and compete effectively against all of our competitors, from traditional independent sporting goods stores and specialty shops to other large format sporting goods stores and mass merchant discount retailers to internet-based retailers.
Drive Omni-channel Growth.
At the core of our omni-channel business are our stores. We believe when our customers connect with the Dick's Sporting Goods brand they expect a seamless shopping experience, regardless of the manner in which they choose to shop with us. We continue to see growth in the number of customers who shop with us both online and in our stores and believe these omni-channel customers represent the future of retail.
4
We plan to continue investing to improve the functionality and performance of our eCommerce site, including a faster and more convenient checkout, improved page responsiveness and new content development through our Pro Tips platform. We believe our biggest opportunity to continue improving our online experience is through faster and more reliable delivery. We plan to open two new eCommerce fulfillment centers in New York and California during the third quarter of fiscal 2019, which will enable us to deliver the majority of our online orders within two business days by the end of fiscal 2019. Like our customers, we see retail as an omni-channel experience, where the distinctions between stores and online are becoming increasingly irrelevant.
We believe our store base gives us a competitive advantage over our online-only competitors, as our physical presence allows us to better serve our customers by creating strong engagement through experiential elements, offering the convenience of accepting in-store returns or exchanges and expediting fulfillment of eCommerce orders. We believe that offering support services for the products we sell enhances the credibility of our associates and specialty store concepts with our customers and further differentiates our stores from our competitors.
Differentiating Dick's Sporting Goods.
Our key partners invest in our stores to showcase their brands. We carry a wide variety of well-known brands, including adidas, Asics, Brooks, Callaway Golf, Columbia, Easton, Nike, TaylorMade, The North Face, Titleist, Under Armour and Yeti. We seek to leverage our partnerships to offer authenticity and credibility to our customers, while differentiating ourselves from our competitors. Our brand partnerships also provide us with access to exclusive products and allow us to differentiate our customers' shopping experience through initiatives such as our brand shops, which provide our customers with a wider and deeper selection of products from our key brands.
To provide differentiation in assortment of products when compared to our competitors, we also offer a wide variety of private brand products that are not available from other retailers. Our exclusive private brand offerings include brands that we own such as Alpine Design, CALIA, ETHOS, Field & Stream, Fitness Gear, Lady Hagen, MAXFLI, Nishiki, Quest, Second Skin, Tommy Armour, Top-Flite and Walter Hagen, as well as brands that we license from third parties including adidas baseball and football, Reebok (performance apparel), Slazenger (golf) and Prince (tennis). Our private brands offer exceptional value and quality to our customers, while also providing the Company with higher gross margins than we obtain on sales of comparable third-party branded products. We consider our private brand strategy to be a key area of opportunity to increase productivity in our stores and online, and have invested in a research, development and procurement staff to support our private brand business. Looking forward, we intend to grow the CALIA line of women's athletic apparel and introduce new private brands during fiscal 2019. Private brand sales represented approximately 14%, 12% and 10% of the Company's consolidated net sales during fiscal 2018, 2017 and 2016, respectively.
The Company is also actively involved in local communities, sponsoring thousands of teams in various sports, and supports the philanthropic efforts of its private corporate foundation, The Dick's Sporting Goods Foundation, whose primary mission is to inspire and enable youth sports participation through the Sports Matter program. The Dick's Team Sports HQ business, which is primarily comprised of Blue Sombrero, Affinity Sports, GameChanger and AD Starr, is focused on creating a holistic digital eco-system to support and equip youth sports and establish relationships with millions of players. We plan to use Dick's Team Sports HQ to stay top-of-mind for athletes and their families, and to create a powerful dataset that we will use to develop offers that are tailored and timed to meet the needs of these athletes.
Merchandising
The following table sets forth the approximate percentage of our sales attributable to the hardlines, apparel and footwear categories for the fiscal years presented:
|
|
Fiscal Year
|
||||||||
|
Category
|
2018
|
2017
|
2016
|
||||||
|
Hardlines
(1)
|
43
|
%
|
45
|
%
|
45
|
%
|
|||
|
Apparel
|
35
|
%
|
34
|
%
|
35
|
%
|
|||
|
Footwear
|
20
|
%
|
20
|
%
|
19
|
%
|
|||
|
Other
(2)
|
2
|
%
|
1
|
%
|
1
|
%
|
|||
|
Total
|
100
|
%
|
100
|
%
|
100
|
%
|
|||
|
(1)
|
Includes items such as sporting goods equipment, fitness equipment, golf equipment and hunting and fishing gear.
|
|
(2)
|
Includes the Company's non-merchandise sales categories, including in-store services, shipping revenues and credit card processing revenues.
|
5
Segment information is further described within Note 1 to the Consolidated Financial Statements.
Selling Channels
We offer products to our customers through our retail stores and online. Although we sell through both of these channels, we believe that sales in one channel are not independent of the other. Regardless of the sales channel, we seek to provide our customers with a seamless omni-channel shopping experience.
Retail Stores:
Store Format.
Each of our Dick's Sporting Goods stores unites several sports specialty stores under one roof, and typically contains the following specialty shops: Team Sports, Athletic Apparel, Golf, Outdoor Lodge, Fitness and Footwear. We believe our "store-within-a-store" concept creates a unique shopping environment by combining the convenience, broad assortment and competitive prices of large format stores with the brand names, deep product selection and customer service of a specialty store. Our Dick's Sporting Goods, Golf Galaxy and Field & Stream stores are designed to create an exciting and interactive shopping environment for the sporting enthusiast that highlights our extensive product assortments and value-added services.
We seek to expand our presence through the opening of new stores, and believe that growing our store network and eCommerce business simultaneously will enable us to profitably grow the business by delivering an omni-channel shopping experience for our customers. We plan to continue a reduced rate of store growth compared to historical levels as we monitor the competitive retail landscape and focus our store growth in under-served and under-penetrated markets. In fiscal 2019, we expect to open approximately seven new Dick's Sporting Goods stores and two new Golf Galaxy stores, which represents a slight reduction from 2018. Additionally, we plan to relocate three Dick's Sporting Goods stores and one Golf Galaxy store. We do not plan to open any new Field & Stream stores in 2019. Approximately two-thirds of our Dick’s Sporting Goods stores will be up for lease renewal at our option over the next five years. We plan to leverage the significant flexibility within our existing real estate portfolio to capitalize on future real estate opportunities over the near and intermediate term as these leases come up for renewal.
eCommerce:
Through our websites, we seek to provide our customers with in-depth product information and the ability to shop with us at any time. In recent years, the Company has continued to innovate its eCommerce sites and applications with customer experience enhancements, new releases of its mobile and tablet apps, and the development of omni-channel capabilities that integrate the Company's online presence with its brick and mortar stores to provide our customers with an omni-channel shopping experience. Currently, we have return-to-store capabilities for online orders, the ability to place online orders in our stores if we are out of stock in the retail store and buy online pick-up in-store capabilities. We also have the ability through our websites to ship orders placed online from our retail locations, which reduces delivery times for online orders and improves inventory productivity. In fiscal
2018
, eCommerce accounted for approximately 15% of our total net sales.
Purchasing, Distribution and Customer Fulfillment
During fiscal 2018, we purchased merchandise from approximately
1,200
vendors.
Nike
, our largest vendor, represented approximately
19%
of our merchandise purchases. No other vendor represented 10% or more of our fiscal
2018
merchandise purchases. We do not have long-term purchase contracts with any of our vendors and all of our purchases from vendors are made on a short-term purchase order basis.
We currently operate five regional distribution centers to supply stores with merchandise. Vendors ship floor-ready merchandise to our distribution centers, where it is processed and allocated directly to our stores or to temporary storage at our distribution centers. Our distribution centers are responsible for consolidating damaged or defective merchandise from our stores that is being returned to vendors. We have contracted with common carriers to deliver merchandise from all of our distribution centers to our stores. During fiscal
2018
, our stores received approximately 92% of merchandise through our distribution network with the remaining merchandise being shipped directly to the stores from our vendors. We believe this flow of merchandise facilitates prompt and efficient distribution to our stores in order to enhance in-stocks, minimize freight costs and improve our inventory turns.
6
We leverage our store and distribution center network, a third-party operated fulfillment center and direct shipping capabilities from our vendors to ensure merchandise delivery speed to our customers and to minimize shipping costs.
Competition
The market for sporting goods retailers is highly fragmented and intensely competitive. We compete with many retailing formats, including large format sporting goods stores, traditional sporting goods stores, specialty and vendor stores, mass merchants and department stores, internet and catalog-based retailers, and vendors selling directly to consumers. We seek to attract customers by offering a wide range of products utilizing distinctive marketing in stores to create a unique shopping environment and superior service through an omni-channel experience.
Employees
As of
February 2, 2019
, we employed approximately
15,200
full-time and
25,500
part-time associates. Due to the seasonal nature of our business, total employment figures fluctuate throughout the year and typically peak during the fourth quarter. None of our associates are covered by a collective bargaining agreement. We believe that our relations with our associates are good.
Seasonality
Seasonality of the Company's business is discussed in further detail within Item 1A. "Risk Factors".
Proprietary Rights
The Company has a number of service marks and trademarks registered with the United States Patent and Trademark Office, including various versions of the following: "Alpine Design", "CALIA", "Dick's", "Dick's Sporting Goods", "DSG", "Ethos", "Field & Stream", "Fitness Gear", "Golf Galaxy", "Golfsmith", "Lady Hagen", "MAXFLI", "Nishiki", "Primed", "Quest", "ScoreCard", "ScoreCard Rewards", "Tommy Armour", "Top-Flite", "The Sports Authority" and "Walter Hagen". The Company also has a number of registered domain names, including "dickssportinggoods.com", "dicks.com", "golfgalaxy.com", "fieldandstreamshop.com", "caliastudio.com", "bluesombrero.com", "gamechanger.com" and "affinity-sports.com". Our service marks, trademarks and other intellectual property are subject to risks and uncertainties that are discussed within Item 1A. "Risk Factors". We have also entered into licensing agreements for names that we do not own, which provide for exclusive rights to use names such as "adidas" (baseball and football), "Cobra" (youth golf sets), "Prince" (tennis), "Slazenger" (golf), "Louisville Slugger" (hosiery), and "Reebok" (performance apparel) for specified product categories and, in some cases, specified sales channels. Most of these licenses contemplate long-term business relationships, with substantial initial terms and the opportunity for multi-year extensions. These licenses contain customary termination provisions at the option of the licensor including, in some cases, termination upon our failure to purchase or sell a minimum volume of products and may include early termination fees. Our licenses are also subject to general risks and uncertainties common to licensing arrangements that are described within Item 1A. "Risk Factors".
Governmental Regulations
We must comply with various federal, state and local regulations, including regulations relating to consumer products and consumer protection, advertising and marketing, labor and employment, data protection and privacy, intellectual property, the environment and tax. In addition, in connection with the sale of firearms in our stores, we must comply with a number of federal and state laws and regulations related to the sale of firearms and ammunition, including the federal Brady Handgun Violence Prevention Act. Ensuring our compliance with these various laws and regulations, and keeping abreast of changes to the legal and regulatory landscape present in our industry, requires us to expend considerable resources.
7
Executive Officers of the Company
The following table and accompanying narrative sets forth the name, age and business experience of the current Executive Officers of the Company:
|
Name
|
Age
|
Position
|
|
Edward W. Stack
|
64
|
Chairman and Chief Executive Officer
|
|
Lauren R. Hobart
|
50
|
President
|
|
Lee J. Belitsky
|
58
|
Executive Vice President - Chief Financial Officer
|
|
Paul J. Gaffney
|
52
|
Executive Vice President - Chief Technology Officer
|
|
John E. Hayes III
|
56
|
Senior Vice President - General Counsel and Secretary
|
|
Holly R. Tyson
|
47
|
Senior Vice President - Chief Human Resources Officer
|
Edward W. Stack has served as our Chairman and Chief Executive Officer since 1984 when our founder and Mr. Stack's father, Richard "Dick" Stack, retired from our then two-store chain. Mr. Stack has served us full-time since 1977 in a variety of positions, including President, Store Manager and Merchandise Manager.
Lauren R. Hobart has served as our President since May 2017 and was appointed to the Company's Board of Directors in January 2018. Ms. Hobart joined Dick's Sporting Goods in February 2011 as our Senior Vice President and Chief Marketing Officer. In September 2015, Ms. Hobart was promoted to Executive Vice President and Chief Marketing Officer and was promoted to Executive Vice President - Chief Customer & Digital Officer in April 2017. Prior to joining Dick's Sporting Goods, Ms. Hobart spent 14 years with PepsiCo, Inc., most recently serving as Chief Marketing Officer for its carbonated soft drink portfolio in the United States. During her career at PepsiCo, Ms. Hobart held several other significant marketing roles and also spent several years in strategic planning and finance. Prior to joining PepsiCo, Ms. Hobart worked in commercial banking for JP Morgan Chase and Wells Fargo Bank. Ms. Hobart formerly served as a member of the Board of Directors of Sonic Corp. (Nasdaq: SONC) from 2014 - 2018.
Lee J. Belitsky became our Executive Vice President - Chief Financial Officer in September 2016. Mr. Belitsky joined Dick's Sporting Goods in 1997 as Vice President - Controller and has held a number of roles at Dick's Sporting Goods. From September 2014 to September 2016, Mr. Belitsky served as Executive Vice President - Product Development and Planning, Allocations and Replenishment; from July 2013 to September 2014, Mr. Belitsky served as Senior Vice President - Product Development; from September 2011 to July 2013, he served as Senior Vice President - Chief Risk and Compliance Officer; from January 2010 to September 2011, he served as Senior Vice President - Strategic Planning and Analysis and Treasury Services; from February 2009 to January 2010, he served as Senior Vice President - Store Operations and Distribution / Transportation; from April 2006 to February 2009, he served as Senior Vice President - Distribution and Transportation; from December 2005 to April 2006, he served as Vice President - Treasurer; and from December 1997 to December 2005, he served as Vice President - Controller. Prior to joining Dick's Sporting Goods, Mr. Belitsky was the Chief Financial Officer of Domain, Inc., a Boston-based home furnishings retailer. He also served as Vice President - Controller and Treasurer with Morse Shoe, Inc. and as an Audit Manager with KPMG LLP.
Paul J. Gaffney joined Dick's Sporting Goods as Executive Vice President - Chief Technology Officer in November 2017. Prior to joining Dick's Sporting Goods, Mr. Gaffney served as Senior Vice President of Technology at The Home Depot, Inc. from August 2014 to November 2017. Prior to joining The Home Depot, Inc., Mr. Gaffney was the founding Chief Executive Officer of Keeps, Inc. from January 2014 to August 2014. Mr. Gaffney previously served as Chief Executive Officer of AAA of Northern California, Nevada, and Utah from October 2011 to October 2014, where he also served as Chief Operating Officer from June 2009 to October 2011. Mr. Gaffney held a variety of senior leadership roles in operations and technology at Desktone, Inc., Staples, Inc., Charles Schwab & Co., and Office Depot from 1995 to 2011.
John E. Hayes III became our Senior Vice President - General Counsel and Secretary in January 2015. Prior to joining Dick's Sporting Goods, Mr. Hayes served as Senior Vice President and General Counsel of Coldwater Creek Inc. from February 2009 to September 2014. During his tenure with Coldwater Creek, Mr. Hayes also served as the Company's interim Chief Financial Officer from November 2009 to April 2010 and as Senior Vice President, Human Resources from April 2010 to May 2013. Prior to joining Coldwater Creek, Mr. Hayes was engaged for seventeen years in private law practice, most recently as a partner with Hogan & Hartson, LLP, from March 2003 to February 2009. Prior to his legal career, Mr. Hayes practiced as an accountant with KPMG LLP.
8
Holly R. Tyson joined Dick's Sporting Goods as Senior Vice President - Chief Human Resources Officer in August 2016. Prior to joining Dick's Sporting Goods, Ms. Tyson served as the Chief Human Resources Officer at The Brink's Company from January 2012 to August 2016. Prior to joining The Brink's Company, Ms. Tyson was Vice President Human Resources U.S. Pharmaceuticals at Bristol-Myers Squibb from January 2010 to January 2012. During her tenure there, Ms. Tyson also served as Executive Director Worldwide Pharmaceuticals Talent and U.S. Pharmaceuticals Sales Learning, Director Human Resources U.S. Pharmaceuticals Sales Learning, Director Human Resources Cardiovascular Metabolics and Director Leadership and Change from 2004 to 2010. Prior to her joining Bristol-Myers Squibb, Ms. Tyson held various human resources and organizational development leadership roles at Alliance Consulting, Cigna Corporation and Accenture from 1994 to 2004.
ITEM 1A. RISK FACTORS
Risks and Uncertainties
Intense competition in the sporting goods industry and in retail could limit our growth and reduce our profitability.
The market for sporting goods retailers is highly fragmented and intensely competitive. Our current and prospective competitors include many large companies, some of which have greater market presence (both brick and mortar and online), name recognition and financial, marketing and other resources than we do. Further, the ability of consumers to compare prices in real-time through the use of smartphones and digital technology puts additional pressure on us to maintain competitive pricing. We compete with retailers from multiple categories and in multiple channels, including large formats; traditional and specialty formats; mass merchants; department stores and catalog; internet-based and direct-sell retailers; and vendors that sell directly to customers. Many factors affect the extent to which competition could affect our results, including as it relates to pricing, quality, assortment, advertising, service, locations and reputation, and prolonged competitive pressures could have a material effect on our results of operations.
Omni-channel growth in our business is complex and there are risks associated with operating our own eCommerce platform.
Our business has become increasingly omni-channel as we strive to deliver a seamless shopping experience to our customers through both online and in-store shopping experiences. We utilize our own eCommerce platform that allows us to control our customer experience without relying on a single third-party provider. Maintaining and continuing to improve our eCommerce platform involves substantial investment of capital and resources, integrating a number of information and management systems from different vendors, increasing supply chain and distribution capabilities, attracting, developing and retaining qualified personnel with relevant subject matter expertise, and effectively managing and improving the customer experience. This involves substantial risk, including risk of cost overruns, website downtime and other technology disruptions (including interruptions, delays, or downtime caused by high volumes of users or transactions, deficiencies in design or implementation, platform enhancements, power outages, computer and telecommunications failures, computer viruses, worms, other malicious computer programs, denial-of-service attacks, security breaches through cyber-attacks from cyber-attackers or sophisticated organizations, catastrophic events such as fires, tornadoes, earthquakes and hurricanes, and usage errors by our associates), supply and distribution delays, and other issues that can affect the successful operation of our eCommerce platform. If we are not able to successfully operate or continually improve our eCommerce platform, our reputation, operations, financial results, and future growth could be materially adversely affected.
If we are unable to predict or effectively react to changes in consumer demand or shopping patterns, we may lose customers and our sales may decline.
Our success depends in part on our ability to anticipate and respond in a timely manner to changing consumer demand, consumer preferences, and shopping patterns regarding sporting goods. We must develop and execute merchandising initiatives with marketing programs that appeal to a broad range of consumers and markets throughout the country. Consumer preferences cannot be predicted with certainty and are subject to continual change and evolution. Additionally, our customers may also have expectations about how they shop in stores or through eCommerce or more generally engage with businesses across different channels or media (through online and other digital or mobile channels or particular forms of social media), which may vary across demographics and may evolve rapidly. We often make commitments to purchase products from our vendors several months in advance of the proposed delivery, which may make it more difficult for us to adapt to changes in consumer preferences.
Our sales may decline significantly if we misjudge the market for our new merchandise, which may result in significant merchandise markdowns and lower margins, missed opportunities for other products, or inventory write-downs, and could have a negative impact on our reputation and profitability.
9
Our private brand offerings and new specialty concept stores expose us to increased costs and certain additional risks.
We offer our customers private brand products that are not available from other retailers. We expect to continue to grow our exclusive private brand offerings through a combination of brands that we own and brands that we exclusively license from third parties. From time-to-time, we also evaluate and operate new specialty concept stores, including, for example, our Field & Stream stores. We invest in our research, development and procurement resources and marketing efforts relating to these private brand offerings and new specialty concept stores. There is no assurance that our private brand products or any new specialty concept store will be successful, and we could curtail or abandon any of our private brands or specialty concept stores at any time. Factors that could cause us to curtail or abandon one of our private brands or specialty concept stores include unexpected or increased costs or delays in development of the brand, demands on management resources, legal or regulatory constraints, changes in consumer demands, preferences and shopping patterns regarding sporting goods, or a determination that consumer demand no longer supports the brand or retail concept. Additional risks relating to our private brand offerings include product liability and product recalls; our ability to successfully protect our proprietary rights (e.g., defending against counterfeit or otherwise unauthorized goods); our ability to successfully navigate and avoid claims related to the proprietary rights of third parties; and our ability to successfully administer and comply with obligations under license agreements that we have with third-party licensors of certain brands.
Our business is dependent on consumer discretionary spending and reductions in consumer spending might adversely affect the
Company's business, operations, liquidity, financial results and stock price.
Our business depends on consumer discretionary spending, and as a result, our results are highly dependent on U.S. consumer confidence and the health of the U.S. economy. Consumer spending may be affected by many factors outside of the Company's control, including general economic conditions; consumer disposable income; consumer confidence; unemployment; the availability, cost and level of consumer debt; the costs of basic necessities and other goods; and effects of weather or natural disasters. A decrease in consumer discretionary spending may result in a decrease in customer traffic, same store sales, and average value per transaction and might cause us to increase promotional activities, which will have a negative impact on our gross margins, and all of which could negatively affect the Company's business, operations, liquidity, financial results and/or stock price, particularly if consumer spending levels are depressed for a prolonged period of time.
Harm to our reputation could adversely impact our ability to attract and retain customers and employees.
Negative publicity or perceptions involving the Company or our brands, products, vendors, spokespersons, or marketing and other partners may negatively impact our reputation and adversely impact our ability to attract and retain customers and employees. Failure to detect, prevent, or mitigate issues that might give rise to reputational risk or failure to adequately address negative publicity or perceptions could adversely impact our reputation, business, results of operations, and financial condition. Issues that might pose a reputational risk include an inability to achieve our omni-channel goals, including providing an eCommerce and delivery experience that meets the expectations of consumers; failure of our cyber-security measures to protect against data breaches; product liability and product recalls; our social media activity; failure to comply with applicable laws and regulations; our policies related to the sale of firearms and accessories; public stances on controversial social or political issues; and any of the other risks enumerated in these risk factors. Furthermore, the prevalence of social media may accelerate and increase the potential scope of any negative publicity we might receive and could increase the negative impact of these issues on our reputation, business, results of operations, and financial condition.
For example, after the Company announced changes to its policy relating to the sale of firearms and accessories and announced its support for certain gun reform measures in the first quarter of 2018, the Company’s hunt business experienced an accelerated decline.
An inability to execute our real estate strategy could affect our financial results.
Our financial performance depends on our ability to optimize our store lease portfolio, including opening new stores and relocating existing stores in desirable locations, renewing leases for existing stores, restructuring leases for existing stores to obtain more favorable renewal terms, refreshing and remodeling existing stores, and, if necessary, closing underperforming stores.
10
There is no assurance that we will be able to locate desirable real estate for new stores or relocations of existing stores, or that an existing store will continue to be profitable in its current location. Additionally, our ability to negotiate favorable lease terms on a new store location or a relocation of an existing store, or in connection with an expiring lease, remodel, consolidation, or closing depends on conditions in the real estate market, competition for desirable properties, our relationships with current and prospective landlords, or other factors that are not within our control. We may incur lease costs that are excessive and cause operating margins to be below acceptable levels if we are unable to negotiate appropriate terms for new leases, relocations or extensions. We may also make term commitments that are too long or too short, without the option to exit early or extend.
If an existing store is not profitable, we might be required to record an impairment charge and we may not be able to terminate the lease associated with the underperforming store. Our leases generally do not allow for termination prior to the end of the lease term without economic consequences; so, if we decide to close a store, we are generally required to continue to perform all obligations under the applicable lease, including the payment of rent, for the balance of the lease term and might also incur termination charges. Even if we are able to assign or sublease the closed locations where our lease cannot be terminated, we may remain liable for certain lease obligations if the assignee or sublessee does not perform.
Furthermore, the success of our stores depends on a number of factors including the sustained success of the shopping center where the store is located, consumer demographics, and consumer shopping patterns. These factors cannot be predicted with complete accuracy and may change over time, resulting in potentially less profitable stores. There is no assurance that we will be able to reverse any decline in customer traffic or that increases in online sales will offset any decline in store traffic. We may need to respond to declines in customer traffic or conversion rates by increasing markdowns or promotions to attract customers, which could adversely impact our financial results.
Failure to secure desirable new store locations and relocation sites, successfully renew or modify existing leases, or effectively manage the profitability of our existing stores could have a material adverse effect on our operations and financial results.
Our business relies on our distribution and fulfillment network and our customer support center. An inability to optimize this network or a disruption to the network, could cause us to lose merchandise, be unable to effectively deliver merchandise to our stores and customers, and adversely affect our financial condition and results of operations.
We own a 917,000 square foot distribution center in Conklin, New York and a 624,000 square foot distribution center in Goodyear, Arizona. We lease a 914,000 square foot distribution center near Atlanta, Georgia, a 725,000 square foot distribution center in Plainfield, Indiana, and a 601,000 square foot distribution center in Smithton, Pennsylvania. We also own a 670,000 square foot customer support center in Coraopolis, Pennsylvania that serves as our corporate headquarters. We plan to open an eCommerce fulfillment center and an additional third-party logistics fulfillment site during the third quarter of fiscal 2019. The eCommerce fulfillment center will operate at the Conklin property identified above and the third-party logistics fulfillment site will be located in California. The ability to optimize our distribution and fulfillment network depends on general economic and real estate conditions which are beyond our control.
We may not be able to maintain our existing distribution centers if the cost of the facilities increase or the location of a facility is no longer desirable. In those cases, we may not be able to locate suitable alternative sites or modify or enter into new leases on acceptable terms. Furthermore, we may need to locate new sites for eCommerce fulfillment centers to satisfy omni-channel demand. If we cannot locate suitable locations for these fulfillment centers on acceptable terms, we will need to rely on our store network, third-party operated fulfillment centers, our distribution centers, and vendors to help meet our fulfillment needs.
An inability to optimize our distribution and fulfillment network, including the expiration of a lease or an unexpected lease termination at one of our facilities (without timely replacement of the applicable facility) or serious disruptions (including natural disasters) at any of these facilities or any delay in opening either of the new eCommerce fulfillment center might impair our ability to adequately stock our stores, process returns of products to vendors, and fulfill eCommerce orders at the speed expected by customers; increase costs associated with shipping and delivery; damage a material portion of our inventory; and otherwise negatively affect our operations, sales, profitability, and reputation.
11
Our strategic plans and initiatives may initially result in a negative impact on our financial results and such plans and initiatives may not achieve the desired results within the anticipated time frame or at all.
Our ability to successfully implement and execute our strategic plans and initiatives is dependent on many factors, some of which are out of our control. In response to a number of challenging conditions in the retail market as a whole, we may increase promotional activities to drive market share to our stores and online. An increase in promotional activities, which will have a negative impact on our gross profit margin, may not achieve the desired results. We also plan to focus on long-term strategic investments, including investments in our digital capabilities, our eCommerce platform, improvements to the customer experience in our stores and online, our supply chain, enhancements to our Scorecard loyalty program, the continued development of our private brands and the Team Sports HQ business, and attracting and retaining knowledgeable and skilled associates and improving associate productivity. These longer-term strategies may require significant capital investment and management attention at the expense of other business initiatives. Additionally, any new initiative is subject to certain risks, including customer acceptance, competition, product differentiation, and the ability to attract and retain qualified personnel. For example, we plan to remove hunt merchandise from 125 Dick's Sporting Goods stores in 2019 where the category under-performs and is less relevant to the market. We plan to utilize this space for categories that are under-served based on the needs of the particular market. If we are not be able to successfully execute our strategic plans and initiatives to achieve the intended results in the anticipated time frame or at all, our results of operation and financial condition may be adversely affected. Additionally, failure to meet stockholder expectations, particularly with respect to earnings, sales, and operating margins could result in volatility in the market value of our stock.
Unauthorized disclosure of sensitive or confidential customer information could harm the Company's business and standing with our customers.
The protection of our customer, associate and Company data is critical. The Company receives confidential customer data, including payment card and personally identifiable information, in the normal course of customer transactions. While we have taken significant steps to protect customer and confidential information, the intentional or negligent actions of employees, business associates or third parties may undermine our security measures and result in unauthorized parties obtaining access to our data systems and misappropriating confidential data. There can be no assurance that advances in computer capabilities, new discoveries in the field of cryptography or other developments will prevent a compromise of our customer transaction processing capabilities and personal data. Because the techniques used to obtain unauthorized access to, disable, degrade, or sabotage systems change frequently and often are not recognized until launched against a target, we may be unable to anticipate these techniques or to implement adequate preventative measures. While we have no knowledge of any material data security breaches to date, any compromise of our data security could result in a violation of applicable privacy and other laws or standards, significant legal and financial exposure beyond the scope or limits of our insurance coverage, interruption of our operations, increased operating costs associated with remediation, equipment acquisitions or disposal, added personnel, and a loss of confidence in our security measures, which could harm our business or investor confidence. Any security breach involving the misappropriation, loss or other unauthorized disclosure of sensitive or confidential information could attract a substantial amount of media attention, damage our reputation, expose us to risk of litigation and material liability, disrupt our operations and harm our business.
Our ability to operate and expand our business and to respond to changing business and economic conditions is dependent upon the availability of adequate capital. The terms of our senior secured revolving credit facility impose certain restrictions that may impair our ability to access sufficient capital.
The operation and growth of our business, including opening new stores and expanding our eCommerce business, and our ability to respond to changing business and economic conditions depend on the availability of adequate capital, which in turn depends on cash flow generated by our business and, if necessary, the availability of equity or debt capital. Our current senior secured revolving credit facility contains provisions that limit our ability to incur additional indebtedness or make substantial asset sales, which might otherwise be used to finance our operations. In the event of our insolvency, liquidation, dissolution or reorganization, the lenders under our senior secured revolving credit facility would be entitled to payment in full from our assets before distributions, if any, were made to our stockholders.
If we are unable to generate sufficient cash flows from operations in the future, and if availability under our current senior secured revolving credit facility is not sufficient to meet our capital needs, we may have to obtain additional financing. We may not be able to obtain such refinancing or additional financing on favorable terms or at all. Our liquidity or access to capital could also be adversely affected by unforeseen changes in the financial markets and global economy.
12
We are subject to costs and risks associated with a complex regulatory, compliance and legal environment, including increased or changing laws and regulations affecting our business, particularly those relating to the sale of consumer products and firearms and ammunition, and those relating to data protection and privacy.
We operate in a complex regulatory and legal environment that exposes us to compliance and litigation risks that could materially affect our operations and financial results. These laws may change, sometimes significantly and unexpectedly, as a result of political, economic or social events. Some of the federal, state or local laws and regulations that affect us include those relating to consumer products, product liability and consumer protection; eCommerce, data protection and privacy; advertisement and marketing; labor and employment; taxes, including changes to tax rates and new taxes, tariffs, and surcharges; firearms, ammunition, knives, food items or other regulated products; accounting, corporate governance and securities; custom or import; and intellectual property.
In addition to potential damage to our reputation and brand, failure to comply with applicable federal, state and local laws and regulations such as those outlined above may result in our being subject to claims, lawsuits, fines and adverse publicity that could have a material adverse effect on our business, results of operations and financial condition.
We depend on our suppliers, distributors and manufacturers to provide us with sufficient quantities of quality products in a timely fashion.
In fiscal 2018, we purchased merchandise from approximately 1,200 vendors. Purchases from Nike represented approximately 19% of our total merchandise purchases. Although in fiscal 2018 purchases from no other vendor represented 10% or more of our total purchases, our dependence on suppliers involves risk. We might be unable to obtain merchandise that consumers demand in a timely manner if there are disruptions in our relationships with key suppliers, which could cause our revenue to materially decline. We generally do not have long-term written contracts with our suppliers that would require them to continue supplying us with merchandise. Key vendors may fail to deliver on their commitments or fail to supply us with sufficient products that comply with our safety and quality standards, whether as a result of supply chain disruptions or other causes, or fail to continue to develop new products that create consumer demand. Furthermore, vendors increasingly sell their products directly to customers or through broadened or alternative distribution channels, such as department stores, family footwear stores, or eCommerce companies. Many of our suppliers also provide us with incentives, such as return privileges, volume purchasing allowances and cooperative advertising, which are not guaranteed. A decline or discontinuation of these incentives could reduce or eliminate our profit margins.
We may be subject to various types of litigation and other claims, and our insurance may not be sufficient to cover damages related to those claims.
From time-to-time the Company or its subsidiaries may be involved in lawsuits or other claims arising in the ordinary course of business, including those related to federal or state wage and hour laws, product liability, consumer protection, advertising, employment, intellectual property, tort, privacy and data protection, and other matters.
We sell firearms and ammunition. These products are associated with an increased risk of injury and related lawsuits with respect to our compliance with Bureau of Alcohol, Tobacco, Firearms and Explosives ("ATF") and state laws and regulations. Any improper or illegal use by our customers of ammunition or firearms sold by us could have a negative impact on our reputation and business. We may incur losses due to lawsuits, including potential class actions, relating to our performance of background checks on firearms purchases and compliance with other sales laws as mandated by state and federal law and related to our policies on the sale of firearms and ammunition. We may also incur losses from lawsuits relating to the improper use of firearms or ammunition sold by us, including lawsuits by municipalities or other organizations attempting to recover costs from manufacturers and retailers of firearms and ammunition.
We may incur losses relating to claims filed against us, including costs associated with defending against such claims, and there is risk that any such claims or liabilities will exceed our insurance coverage, or affect our ability to retain adequate liability insurance in the future. Even if a claim is unsuccessful or is not fully pursued, the negative publicity surrounding any such assertions could adversely affect our reputation. Due to the inherent uncertainties of litigation and other claims, we cannot accurately predict the ultimate outcome of any such matters.
13
If our product costs are adversely affected by foreign trade issues, currency exchange rate fluctuations, increasing prices for raw materials, political instability or other reasons, our sales and profitability may suffer.
A significant portion of the products that we purchase, including those purchased from domestic suppliers, as well as most of our private brand merchandise, is manufactured abroad. Foreign imports subject us to risk relating to changes in import duties, quotas, the introduction of U.S. taxes on imported goods or the extension of U.S. income taxes on our foreign suppliers' sales of imported goods through the adoption of destination-based income tax jurisdiction, loss of "most favored nation" status with the U.S., shipment delays and shipping port constraints, labor strikes, work stoppages or other disruptions, freight cost increases and economic uncertainties. Furthermore, we could face significantly higher U.S. income and similar taxes with respect to sales of products purchased from foreign suppliers if the U.S. were to adopt a system of taxation, such as a border adjustment tax, under which the cost of imported products was not deductible in determining such products' tax base. If such a tax system were adopted, we could also face higher prices for products manufactured or produced abroad that we purchase from our domestic suppliers if they were subject to such a tax. In addition, the U.S. government periodically considers other restrictions on the importation of products obtained by our vendors and us.
General trade tensions between the U.S. and China began escalating in 2018, with multiple rounds of U.S. tariffs on Chinese goods taking effect. Furthermore, China or other countries may institute retaliatory trade measures in response to existing or future tariffs imposed by the U.S. that could have a negative impact on our business. If any of these events continue as described, we may need to seek alternative suppliers or vendors, raise prices, or make changes to our operations, any of which could have a material adverse effect on our sales and profitability, results of operations and financial condition.
If any of these or other factors were to cause a disruption of trade from the countries in which our vendors' supplies or our private brand products' manufacturers are located, our inventory levels may be reduced or the cost of our products may increase. Additionally, we could be impacted by negative publicity or, in some cases, face potential liability to the extent that any foreign manufacturers from whom we directly or indirectly purchase products utilize labor, environmental, workplace safety and other practices that vary from those commonly accepted in the U.S. Also, the prices charged by foreign manufacturers may be affected by the fluctuation of their local currency against the U.S. dollar and the price of raw materials, which could cause the cost of our products to increase and negatively impact our sales or profitability.
Our inability or failure to protect our intellectual property rights or any third parties claiming that we have infringed on their intellectual property rights could have a negative impact on our operating results.
Our trademarks, service marks, copyrights, patents, trade secrets, domain names and other intellectual property, including exclusive licensing rights, are valuable assets that are critical to our success. Effective trademark and other intellectual property protection may not be available in every country in which our products are manufactured or may be made available. The unauthorized reproduction or other misappropriation of our intellectual property could diminish the value of our brands or goodwill and cause a decline in our revenue. In addition, any infringement or other intellectual property claim made against us could be time-consuming to address, result in costly litigation, cause product delays, require us to enter into royalty or licensing agreements or result in our loss of ownership or use of the intellectual property.
Problems with our information systems could disrupt our operations and negatively impact our financial results and materially adversely affect our business operations.
We utilize a number of third-party information systems for core system needs of our business. These systems, if not functioning properly, could disrupt our operations, including our ability to track, record and analyze the merchandise that we sell, process shipments of goods, process financial information or credit card transactions, deliver products or engage in similar normal business activities. Our information systems, including our back-up systems, are subject to damage or interruption from power outages, computer and telecommunications failures, computer viruses, worms, other malicious computer programs, denial-of-service attacks, security breaches (through cyber-attacks from cyber-attackers or sophisticated organizations), catastrophic events such as fires, tornadoes, earthquakes and hurricanes, and usage errors by our associates. If our information systems and our back-up systems are damaged, breached or cease to function properly, we may have to make a significant investment to repair or replace them, and we may suffer loss of critical data and interruptions or delays in our business operations. Any material disruption, malfunction or other similar problems in or with our core information systems could negatively impact our financial results and materially adversely affect our business operations.
14
We may be unable to attract, train, engage and retain key personnel and associates. Furthermore, the loss of Edward W. Stack as our key executive could have a material adverse effect on our business.
If we do not continue to effectively implement our strategic and business-planning processes to attract, retain, train and develop key personnel and qualified employees in all areas of the organization, our business may suffer. In addition, stores depend significantly on our ability to hire and retain quality associates, including store managers and sales associates. The market for non-entry level personnel, particularly for associates with retail expertise, is highly competitive. We are also dependent on the associates who staff our distribution centers.
Furthermore, our success depends on continued service from Edward W. Stack, our Chairman and Chief Executive Officer, who has been operating the Company since 1984. Mr. Stack possesses detailed and in-depth knowledge of the issues, opportunities and challenges facing the Company and the industry. If Mr. Stack no longer served a role in the Company, our business could be materially adversely affected.
Wage increases could adversely affect our financial results.
Recently, various legislative movements have sought to increase the federal minimum wage in the United States and the minimum wage in a number of individual states, some of which have been successful at the state level. As federal or state minimum wage rates increase, we may need to increase not only the wage rates of our minimum wage employees, but also the wages paid to our other hourly employees as well. Further, should we fail to increase our wages competitively in response to increasing wage rates, the quality of our workforce could decline, causing our customer service to suffer. Any increase in the cost of our labor could have an adverse effect on our operating costs, financial condition and results of operations.
Poor performance of professional sports teams within our core regions of operation, as well as league-wide lockouts
or strikes, retirement of or serious injury to key athletes or scandals involving such athletes could adversely affect our financial results.
We sell a significant amount of professional sports team merchandise, the success of which may be subject to fluctuations based on the success or failure of such teams or their key players. Poor performance by the professional sports teams within our core regions of operations, as well as league-wide lockouts or strikes, could cause our financial results to fluctuate year over year. In addition, to the extent we use individual athletes to market our products and advertise our stores or we sell merchandise branded by one or more athletes, the retirement or injury of such athletes or scandals in which they might be implicated could negatively impact our financial results.
The relative seasonality of our operations, along with the current geographic concentrations of our Dick's stores, exposes us to certain risks.
Our business is largely seasonal based on sports seasons and the holiday selling season. Furthermore, a majority of our Dick's Sporting Goods stores are located in the eastern half of the United States, which exposes us to various regional risks, including those relating to weather conditions. Many of our stores are located in geographic areas that experience seasonally cold weather, and we sell a significant amount of cold weather sporting goods and apparel. Our highest sales and operating income results historically occur during our fourth fiscal quarter, which is due, in part, to the holiday selling season and, in part, to our strong sales of cold weather sporting goods and apparel. Poor performance during our fourth quarter, whether because of a slow holiday selling season, unseasonable weather conditions, economic conditions or otherwise, could have a material adverse effect on our business, financial condition and operating results for the entire fiscal year. Additionally, abnormally wet or cold weather in the spring or summer months could reduce our sales of golf, team sports or other merchandise and cause a decrease in our profitability.
15
We may pursue strategic alliances, acquisitions or investments and the failure of an alliance, acquisition or investment to produce the anticipated results or the inability to fully integrate the acquired companies could have an adverse impact on our business.
We may from time-to-time acquire or invest in complementary companies or businesses. The success of acquisitions or investments is based on our ability to make accurate assumptions regarding the valuation, operations, growth potential, integration and other factors relating to such businesses. There can be no assurance that our acquisitions or investments will produce the anticipated results within the expected time frame or at all. Furthermore, acquisitions may result in dilutive issuances of our equity securities, the incurrence of debt, contingent liabilities, amortization expenses or write-offs of goodwill or other intangibles, any of which could harm our financial condition. We also may not be able to successfully integrate operations that we acquire, including their personnel, financial systems, supply chain and other operations, which could adversely affect our business. Acquisitions may also result in the diversion of our capital and our management's attention from other business issues and opportunities.
We are controlled by our Chairman and Chief Executive Officer and his relatives, whose interests may differ from other stockholders.
As of February 2, 2019, Mr. Edward W. Stack, our Chairman and Chief Executive Officer, and his relatives controlled a majority of the combined voting power of our common stock and Class B common stock and would control the outcome of a vote on any corporate transaction or other matter submitted to our stockholders for approval. The interests of Mr. Stack and his relatives may differ from the interests of our other stockholders and they may take actions with which our other stockholders disagree.
Our anti-takeover provisions could prevent or delay a change in control of our Company, even if such change in control
would be beneficial to our stockholders.
Provisions of our Amended and Restated Certificate of Incorporation, as amended, and our Amended and Restated Bylaws as well as provisions of Delaware law could discourage, delay or prevent a merger, acquisition or other change in control of our Company, even if such change in control would be beneficial to our stockholders. These provisions include: authorizing the issuance of Class B common stock; classifying the Board of Directors such that approximately one-third of directors are elected each year; authorizing the issuance of "blank check" preferred stock that could be issued by our Board of Directors to increase the number of outstanding shares and thwart a takeover attempt; prohibiting the use of cumulative voting for the election of directors; prohibiting stockholder action by partial written consent and requiring all stockholder actions to be taken at a meeting of our stockholders or by unanimous written consent if our Class B common stock is no longer outstanding; and establishing advance notice requirements for nominations for election to the Board of Directors or for proposing matters to be acted upon by stockholders at stockholder meetings.
In addition, the Delaware General Corporation Law, to which we are subject, prohibits us, except under specified circumstances, from engaging in any mergers, significant sales of stock or assets or business combinations with any stockholder or group of stockholders who owns 15% or more of our common stock.
We cannot provide any guaranty of future dividend payments or that we will continue to repurchase our common stock pursuant to our stock repurchase program.
Although our Board of Directors has indicated an intention to pay future quarterly cash dividends on our common stock, any determination to pay cash dividends on our common stock in the future will be based upon our financial condition, results of operations, business requirements, and the continuing determination from our Board of Directors that the declaration of dividends is in the best interests of our stockholders and is in compliance with all laws and agreements applicable to the dividend. Furthermore, although our Board of Directors has authorized a five-year $1 billion share repurchase program, we are not obligated to make any purchases under the program and we may discontinue it at any time.
ITEM 1B. UNRESOLVED STAFF COMMENTS
None.
16
ITEM 2. PROPERTIES
We lease all of our stores. Initial lease terms are generally for 10 to 15 years and most store leases contain multiple five-year renewal options and rent escalation provisions. We believe that our leases, when entered into, are at market rate rents. We generally select a new store site nine to 18 months before its opening. Our stores are primarily located in shopping centers in regional shopping areas, as well as in freestanding locations and malls.
17
As of
February 2, 2019
, we operated
858
stores in
47
states. The following table sets forth the number of stores by state:
|
State
|
Dick's Sporting Goods
|
Specialty Concept Stores
(1)
|
Total
|
||||||
|
Alabama
|
14
|
|
3
|
|
17
|
|
|||
|
Arizona
|
9
|
|
2
|
|
11
|
|
|||
|
Arkansas
|
4
|
|
—
|
|
4
|
|
|||
|
California
|
59
|
|
8
|
|
67
|
|
|||
|
Colorado
|
15
|
|
2
|
|
17
|
|
|||
|
Connecticut
|
12
|
|
2
|
|
14
|
|
|||
|
Delaware
|
3
|
|
1
|
|
4
|
|
|||
|
District of Columbia
|
1
|
|
—
|
|
1
|
|
|||
|
Florida
|
46
|
|
8
|
|
54
|
|
|||
|
Georgia
|
23
|
|
1
|
|
24
|
|
|||
|
Idaho
|
5
|
|
1
|
|
6
|
|
|||
|
Illinois
|
30
|
|
4
|
|
34
|
|
|||
|
Indiana
|
20
|
|
1
|
|
21
|
|
|||
|
Iowa
|
7
|
|
3
|
|
10
|
|
|||
|
Kansas
|
10
|
|
1
|
|
11
|
|
|||
|
Kentucky
|
12
|
|
2
|
|
14
|
|
|||
|
Louisiana
|
8
|
|
1
|
|
9
|
|
|||
|
Maine
|
4
|
|
—
|
|
4
|
|
|||
|
Maryland
|
16
|
|
2
|
|
18
|
|
|||
|
Massachusetts
|
19
|
|
2
|
|
21
|
|
|||
|
Michigan
|
23
|
|
5
|
|
28
|
|
|||
|
Minnesota
|
10
|
|
4
|
|
14
|
|
|||
|
Mississippi
|
7
|
|
—
|
|
7
|
|
|||
|
Missouri
|
14
|
|
2
|
|
16
|
|
|||
|
Nebraska
|
4
|
|
1
|
|
5
|
|
|||
|
Nevada
|
3
|
|
2
|
|
5
|
|
|||
|
New Hampshire
|
6
|
|
—
|
|
6
|
|
|||
|
New Jersey
|
19
|
|
3
|
|
22
|
|
|||
|
New Mexico
|
4
|
|
—
|
|
4
|
|
|||
|
New York
|
43
|
|
6
|
|
49
|
|
|||
|
North Carolina
|
33
|
|
9
|
|
42
|
|
|||
|
North Dakota
|
1
|
|
—
|
|
1
|
|
|||
|
Ohio
|
40
|
|
10
|
|
50
|
|
|||
|
Oklahoma
|
8
|
|
2
|
|
10
|
|
|||
|
Oregon
|
10
|
|
2
|
|
12
|
|
|||
|
Pennsylvania
|
41
|
|
11
|
|
52
|
|
|||
|
Rhode Island
|
2
|
|
—
|
|
2
|
|
|||
|
South Carolina
|
13
|
|
2
|
|
15
|
|
|||
|
South Dakota
|
1
|
|
—
|
|
1
|
|
|||
|
Tennessee
|
18
|
|
2
|
|
20
|
|
|||
|
Texas
|
39
|
|
14
|
|
53
|
|
|||
|
Utah
|
5
|
|
1
|
|
6
|
|
|||
|
Vermont
|
2
|
|
—
|
|
2
|
|
|||
|
Virginia
|
29
|
|
5
|
|
34
|
|
|||
|
Washington
|
16
|
|
—
|
|
16
|
|
|||
|
West Virginia
|
6
|
|
1
|
|
7
|
|
|||
|
Wisconsin
|
14
|
|
3
|
|
17
|
|
|||
|
Wyoming
|
1
|
|
—
|
|
1
|
|
|||
|
Total
|
729
|
|
129
|
|
858
|
|
|||
|
(1)
|
Includes the Company's Golf Galaxy and Field & Stream stores. As of
February 2, 2019
, the Company operated
94
Golf Galaxy stores in
32
states and
35
Field & Stream stores in
16
states. In some markets we operate Dick's Sporting Goods stores adjacent to our specialty concept stores on the same property with a pass-through for customers. We refer to this format as a "combo store" and include combo store openings within both the Dick's Sporting Goods and specialty concept store reconciliations, as applicable. As of February 2, 2019, the Company operated 23 combo stores.
|
18
The following is a list of distribution locations including the approximate square footage and if the location is leased or owned:
|
Distribution Facility Location
|
Approximate Square Footage
|
Owned/Leased Facility
|
||
|
Conklin, New York
|
917,000
|
Owned
|
||
|
Atlanta, Georgia
|
914,000
|
Leased
|
||
|
Plainfield, Indiana
|
725,000
|
Leased
|
||
|
Goodyear, Arizona
|
624,000
|
Owned
|
||
|
Smithton, Pennsylvania
|
601,000
|
Leased
|
||
The Company's CSC occupies approximately 670,000 square feet of owned building space in Coraopolis, Pennsylvania. The Company is a direct tenant of Allegheny County Airport Authority ("ACAA") pursuant to an underlying ground lease through 2038. The Company holds a second ground lease with ACAA through 2038 for 89 acres adjacent to its CSC for potential future expansion.
ITEM 3. LEGAL PROCEEDINGS
The Company and its subsidiaries are involved in various proceedings that are incidental to the normal course of our businesses. As of the date of this Annual Report on Form 10-K, the Company does not expect that any of such proceedings will have a material adverse effect on the Company's financial position or results of operations.
ITEM 4. MINE SAFETY DISCLOSURES
Not applicable.
PART II
ITEM 5. MARKET FOR REGISTRANT'S COMMON EQUITY, RELATED STOCKHOLDER MATTERS AND ISSUER PURCHASES OF EQUITY SECURITIES
MARKET INFORMATION AND DIVIDEND POLICY
Shares of Dick's Sporting Goods, Inc. common stock are listed and traded on the New York Stock Exchange ("NYSE") under the symbol "DKS". The Company also has shares of Class B common stock outstanding, which are not listed or traded on any stock exchange or other market. Shares of our Class B common stock can be converted on a one-for-one basis to shares of our common stock at any time at the holder's option and are automatically converted upon the occurrence of certain events.
During fiscal 2018, a quarterly cash dividend of
$0.225
per share of common stock and Class B common stock was paid on
March 30, 2018
,
June 29, 2018
,
September 28, 2018
and
December 28, 2018
to stockholders of record on
March 9, 2018
,
June 8, 2018
,
September 14, 2018
and
December 14, 2018
, respectively.
During fiscal 2017, a quarterly cash dividend of $0.17 per share of common stock and Class B common stock was paid on
March 31, 2017
,
June 30, 2017
,
September 29, 2017
and
December 29, 2017
to stockholders of record on
March 10, 2017
,
June 9, 2017
,
September 8, 2017
and
December 8, 2017
, respectively.
The number of holders of record of shares of the Company's common stock and Class B common stock as of
March 25, 2019
was
262
and
23
, respectively.
The declaration of future dividends and the establishment of the per share amount, record dates and payment dates for any such future dividends will be subject to the final determination of our Board of Directors, and will be dependent upon multiple factors, including future earnings, cash flows, financial requirements and other considerations.
19
COMPARISON OF 5 YEAR CUMULATIVE TOTAL RETURN
The following graph compares the performance of the Company's common stock with that of the Standard & Poor's 500 Composite Stock Price Index (the "S&P 500") and the S&P Specialty Retail Index for the periods indicated below. The graph assumes that $100 was invested on January 31, 2014 in the Company's common stock, the S&P 500 and the S&P Specialty Retail Index and that all dividends were reinvested.
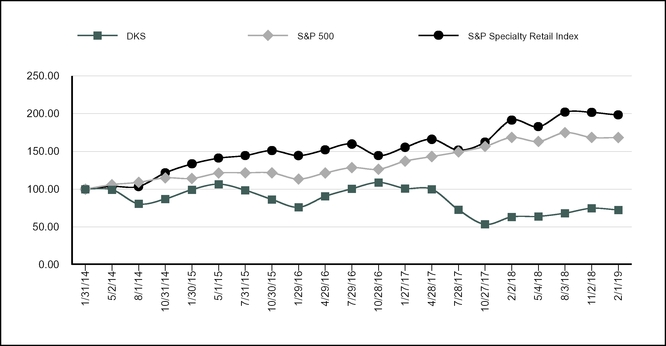
20
ISSUER PURCHASES OF EQUITY SECURITIES
The following table sets forth information with respect to common stock repurchases made during the three months ended
February 2, 2019
:
|
Period
|
Total Number of Shares Purchased
(a)
|
Average Price Paid Per Share
|
Total Number of Shares Purchased as Part of Publicly Announced Plans or Programs
(b)
|
Dollar Value of Shares That May Yet be Purchased Under the Plan or Program
|
||||||||||
|
November 4, 2018 to December 1, 2018
|
—
|
|
$
|
—
|
|
—
|
|
$
|
467,177,053
|
|
||||
|
December 2, 2018 to January 5, 2019
|
961,975
|
|
$
|
35.24
|
|
957,417
|
|
$
|
433,448,032
|
|
||||
|
January 6, 2019 to February 2, 2019
|
—
|
|
$
|
—
|
|
—
|
|
$
|
433,448,032
|
|
||||
|
Total
|
961,975
|
|
$
|
35.24
|
|
957,417
|
|
|
|
|||||
|
(a)
|
Includes shares withheld from employees to satisfy minimum tax withholding obligations associated with the vesting of restricted stock during the period.
|
|
(b)
|
Shares repurchased as part of the Company's previously announced five-year $1 billion share repurchase program authorized by the Board of Directors on March 16, 2016.
|
The information set forth under Part III, Item 12. "Security Ownership of Certain Beneficial Owners and Management and Related Shareholder Matters" is incorporated herein.
ITEM 6. SELECTED FINANCIAL DATA
The selected consolidated financial data for fiscal years
2018
,
2017
,
2016
,
2015
and
2014
presented below under the captions "Statement of Income Data", "Per Common Share Data", "Other Data" and "Balance Sheet Data" have been derived from our Consolidated Financial Statements for those periods. The selected consolidated financial data for fiscal years
2018
,
2017
,
2016
,
2015
and
2014
presented below under the caption "Store Data" have been derived from internal records of our operations.
Our fiscal year consists of 52 or 53 weeks, ends on the Saturday nearest to the last day in January and is referenced by the calendar year ending closest to that date. All fiscal years presented include 52 weeks of operations except fiscal 2017, which included 53 weeks.
21
The information set forth below should be read in conjunction with other sections of this Annual Report on Form 10-K including Part II, Item 7. "Management's Discussion and Analysis of Financial Condition and Results of Operations" and our Consolidated Financial Statements and related notes appearing elsewhere in this Annual Report on Form 10-K.
|
|
Fiscal Year
|
||||||||||||||||||
|
|
2018
|
2017
|
2016
|
2015
|
2014
|
||||||||||||||
|
|
(Dollars in thousands, except per share and per square foot data)
|
||||||||||||||||||
|
Statement of Income Data:
|
|
|
|
|
|
||||||||||||||
|
Net sales
|
$
|
8,436,570
|
|
$
|
8,590,472
|
|
$
|
7,921,981
|
|
$
|
7,270,965
|
|
$
|
6,814,479
|
|
||||
|
Cost of goods sold
(1)
|
5,998,788
|
|
6,101,412
|
|
5,556,198
|
|
5,088,078
|
|
4,727,813
|
|
|||||||||
|
Gross profit
|
2,437,782
|
|
2,489,060
|
|
2,365,783
|
|
2,182,887
|
|
2,086,666
|
|
|||||||||
|
Selling, general and administrative expenses
(2)
|
1,986,576
|
|
1,982,363
|
|
1,875,643
|
|
1,613,075
|
|
1,502,089
|
|
|||||||||
|
Pre-opening expenses
(3)
|
6,473
|
|
29,123
|
|
40,286
|
|
34,620
|
|
30,518
|
|
|||||||||
|
Income from operations
|
444,733
|
|
477,574
|
|
449,854
|
|
535,192
|
|
554,059
|
|
|||||||||
|
Interest expense
|
10,248
|
|
8,047
|
|
5,856
|
|
4,012
|
|
3,215
|
|
|||||||||
|
Other expense (income)
(4)
|
2,565
|
|
(31,810
|
)
|
(14,424
|
)
|
305
|
|
(5,170
|
)
|
|||||||||
|
Income before income taxes
|
431,920
|
|
501,337
|
|
458,422
|
|
530,875
|
|
556,014
|
|
|||||||||
|
Provision for income taxes
|
112,056
|
|
177,892
|
|
171,026
|
|
200,484
|
|
211,816
|
|
|||||||||
|
Net income
|
$
|
319,864
|
|
$
|
323,445
|
|
$
|
287,396
|
|
$
|
330,391
|
|
$
|
344,198
|
|
||||
|
Per Common Share Data:
|
|
|
|
|
|
||||||||||||||
|
Earnings per common share - Basic
|
$
|
3.27
|
|
$
|
3.02
|
|
$
|
2.59
|
|
$
|
2.87
|
|
$
|
2.89
|
|
||||
|
Earnings per common share - Diluted
|
$
|
3.24
|
|
$
|
3.01
|
|
$
|
2.56
|
|
$
|
2.83
|
|
$
|
2.84
|
|
||||
|
Dividends declared per common share
|
$
|
0.90
|
|
$
|
0.68
|
|
$
|
0.605
|
|
$
|
0.55
|
|
$
|
0.50
|
|
||||
|
Weighted average common shares outstanding:
|
|
|
|
|
|
||||||||||||||
|
Basic
|
97,743
|
|
106,977
|
|
111,095
|
|
115,230
|
|
119,244
|
|
|||||||||
|
Diluted
|
98,781
|
|
107,586
|
|
112,216
|
|
116,794
|
|
121,238
|
|
|||||||||
|
Store Data:
|
|
|
|
|
|
||||||||||||||
|
Same store sales (decrease) increase
(5)
|
(3.2
|
)%
|
(0.3
|
)%
|
3.5
|
%
|
(0.2
|
)%
|
2.4
|
%
|
|||||||||
|
Number of stores at end of period
(6)
|
858
|
|
845
|
|
797
|
|
741
|
|
694
|
|
|||||||||
|
Total square footage at end of period
(6)
|
42,223,019
|
|
41,694,681
|
|
39,270,591
|
|
36,703,905
|
|
34,245,885
|
|
|||||||||
|
Net sales per square foot
(7)
|
$
|
167
|
|
$
|
178
|
|
$
|
182
|
|
$
|
181
|
|
$
|
185
|
|
||||
|
Other Data:
|
|
|
|
|
|
||||||||||||||
|
Gross profit margin
|
28.9
|
%
|
29.0
|
%
|
29.9
|
%
|
30.0
|
%
|
30.6
|
%
|
|||||||||
|
Selling, general and administrative expenses as a percentage of net sales
|
23.5
|
%
|
23.1
|
%
|
23.7
|
%
|
22.2
|
%
|
22.0
|
%
|
|||||||||
|
Operating margin
|
5.3
|
%
|
5.6
|
%
|
5.7
|
%
|
7.4
|
%
|
8.1
|
%
|
|||||||||
|
Inventory turnover
(8)
|
3.19x
|
|
3.19x
|
|
3.06x
|
|
3.03x
|
|
3.10x
|
|
|||||||||
|
Depreciation and amortization
|
$
|
243,830
|
|
$
|
237,651
|
|
$
|
233,834
|
|
$
|
193,594
|
|
$
|
179,431
|
|
||||
|
Balance Sheet Data:
|
|
|
|
|
|
||||||||||||||
|
Inventories, net
|
$
|
1,824,696
|
|
$
|
1,711,103
|
|
$
|
1,638,632
|
|
$
|
1,527,187
|
|
$
|
1,390,767
|
|
||||
|
Working capital
(9)
|
$
|
617,759
|
|
$
|
581,071
|
|
$
|
598,263
|
|
$
|
621,015
|
|
$
|
679,965
|
|
||||
|
Total assets
|
$
|
4,187,149
|
|
$
|
4,203,939
|
|
$
|
4,058,296
|
|
$
|
3,559,336
|
|
$
|
3,391,704
|
|
||||
|
Total debt including capital and financing lease obligations
(10)
|
$
|
60,044
|
|
$
|
65,286
|
|
$
|
5,325
|
|
$
|
5,913
|
|
$
|
6,450
|
|
||||
|
Retained earnings
|
$
|
2,455,192
|
|
$
|
2,205,651
|
|
$
|
1,956,066
|
|
$
|
1,737,214
|
|
$
|
1,471,182
|
|
||||
|
Total stockholders' equity
|
$
|
1,904,161
|
|
$
|
1,941,501
|
|
$
|
1,929,489
|
|
$
|
1,789,187
|
|
$
|
1,832,225
|
|
||||
22
|
(1)
|
Cost of goods sold for fiscal 2014 included a $2.4 million write-down of golf-related inventory from the Company's golf restructuring. Cost of goods sold for fiscal 2016 included a $46.4 million write-down of inventory in connection with the Company's implementation of its new merchandising strategy. Cost of goods sold for fiscal 2017 included an $11.5 million charge related to transition costs to enhance the Company's Scorecard loyalty program.
|
|
(2)
|
Selling, general and administrative expenses ("SG&A") for fiscal 2014 included a $14.4 million gain on sale of a corporate aircraft and asset impairment and severance charges related to the Company's golf restructuring of $14.3 million and $3.7 million, respectively. SG&A for fiscal 2015 included a $7.9 million litigation settlement charge. SG&A for fiscal 2016 included a $32.9 million impairment of store assets and store closing charges primarily for ten Golf Galaxy stores in overlapping trade areas with acquired Golfsmith stores, merger and integration costs of $8.5 million to convert former The Sports Authority ("TSA") and Golfsmith stores to Dick's Sporting Goods and Golf Galaxy stores, and a $7.7 million non-cash impairment charge to reduce the carrying value of a corporate aircraft held for sale to its fair market value. Fiscal 2017 included a $7.1 million charge for severance, other employee-related costs and asset write-downs related to a corporate restructuring and $6.6 million for costs related to a litigation contingency.
|
|
(3)
|
Pre-opening expenses for fiscal 2016 and fiscal 2017 included occupancy expenses totaling $5.1 million and $3.5 million, respectively, for TSA and Golfsmith stores converted to Dick's Sporting Goods and Golf Galaxy stores.
|
|
(4)
|
Includes investment income recognized to reflect changes in deferred compensation plan investment values with a corresponding charge / reduction to SG&A for the same amount. Fiscal 2017 included the receipt of a $12.0 million contract termination payment and an $8.1 million multi-year sales tax refund.
|
|
(5)
|
A store is included in the same store sales calculation during the same fiscal period that it commences its 14
th
full month of operations. Stores that were closed or relocated during the applicable period have been excluded from same store sales. Each relocated store is returned to the same store sales base during the fiscal period that it commences its 14
th
full month of operations at the new location. The Company's same store sales calculation consists of both brick and mortar and eCommerce sales. Fiscal 2017 excludes sales during the 53
rd
week.
|
|
(6)
|
Includes Dick's Sporting Goods, Golf Galaxy, Field & Stream and other specialty concept stores.
|
|
(7)
|
Calculated using net sales and gross square footage of all stores open at both the beginning and the end of the period, excluding eCommerce sales. Gross square footage includes the storage, receiving and office space that generally occupies approximately
17%
of total store space within our stores.
|
|
(8)
|
Calculated as cost of goods sold divided by the average monthly ending inventories of the last 13 months.
|
|
(9)
|
Defined as current assets less current liabilities.
|
|
(10)
|
During fiscal 2017, the Company financed $62.5 million for the purchase of a corporate aircraft.
|
23
ITEM 7. MANAGEMENT'S DISCUSSION AND ANALYSIS OF FINANCIAL CONDITION AND RESULTS OF OPERATIONS
The following discussion and analysis should be read in conjunction with Part II, Item 6, "Selected Financial Data" and our Consolidated Financial Statements and related notes appearing elsewhere in this Annual Report on Form 10-K. This Annual Report on Form 10-K contains forward-looking statements within the meaning of the Private Securities Litigation Reform Act of 1995. See "Forward-Looking Statements" and Part I, Item 1A. "Risk Factors".
The Company is a leading omni-channel sporting goods retailer offering an extensive assortment of authentic, high-quality sports equipment, apparel, footwear and accessories through a blend of dedicated associates, in-store services and unique specialty shop-in-shops. The Company also owns and operates Golf Galaxy and Field & Stream stores and Dick's Team Sports HQ. The Company offers its products through a content-rich eCommerce platform that is integrated with its store network and provides customers with the convenience and expertise of a 24-hour storefront. When used in this Annual Report on Form 10-K, unless the context otherwise requires or specifies, any reference to "year" is to the Company's fiscal year.
The primary factors that have historically influenced the Company's profitability include the growth in its number of stores and selling square footage, the continued integration of eCommerce with brick and mortar stores, growth in consolidated same store sales, which include the Company's eCommerce business, and its strong gross profit margins. Over
the last five years, the Company has grown from
558
Dick's Sporting Goods stores at the end of fiscal 2013 to
729
Dick's Sporting Goods stores at the end of fiscal
2018
. The Company has reduced its rate of new store growth and intends to continue this strategy over the next few years in an effort to leverage the significant flexibility within our existing real estate portfolio to capitalize on future real estate opportunities over the near and intermediate term as those leases come up for renewal.
In recent years, the Company has continued to innovate its eCommerce sites and applications with customer experience enhancements, new releases of its mobile and tablet apps, and the development of omni-channel capabilities that integrate the Company's online presence with its brick and mortar stores, including ship-from-store; buy-online, pick-up in-store; return-to-store and multi-faceted marketing campaigns. Additionally, the Company transitioned to an insourced eCommerce platform during the first quarter of fiscal 2017. The Company's eCommerce sales penetration to total net sales has increased from approximately 8% in fiscal 2013 to approximately 15% in fiscal 2018. Approximately 80% of the Company's eCommerce sales are generated within brick and mortar store trade areas.
The retail industry as a whole is dynamic, and the sporting goods category has faced significant disruption in recent years, as several sporting goods retailers have gone out of business. Vendors have broadened their distribution into department stores and family footwear channels while continuing to grow their direct to consumer business. Weak customer demand for firearms and other hunting merchandise across the industry has resulted in slower growth. We have responded to these challenges by focusing on driving profitable sales; emphasizing a refined merchandise assortment that delivers newness, innovation and exclusivity. We have made strategic investments in supply chain, our digital capabilities, the customer experience, our private brands and our teammates to support these efforts. We are also focused on increasing productivity and eliminating non-essential expenses to fund our future strategic investments.
As we look to the future, we are focused on continuing to invest in our business to meet the changing needs of our athletes and increasing their level of engagement with us. We plan to enhance the store experience by optimizing our merchandise assortment, reallocating floor space to regionally relevant and growing merchandise categories and making our stores more experiential. Our primary areas of investment during fiscal 2019 will be to 1) enhance the athlete experience in our stores; 2) improve our eCommerce fulfillment capabilities and 3) implement technology solutions that improve the athlete experience and our teammates’ productivity. We plan to continue to focus on increasing productivity across the business to help fund these investments.
The Company's senior management focuses on certain key indicators to monitor the Company's performance including:
|
•
|
Consolidated same store sales performance – Our management considers same store sales, which consists of both brick and mortar and eCommerce sales, to be an important indicator of our current performance. Same store sales results are important to leverage our costs, which include occupancy costs, store payroll and other store expenses. Same store sales also have a direct impact on our total net sales, net income, cash and working capital. See further discussion of the Company's consolidated same store sales within Part II, Item 6. "Selected Financial Data".
|
|
•
|
Earnings before taxes and the related operating margin – Our management views earnings before taxes and operating margin as key indicators of our performance. The key drivers of earnings before taxes are same store sales, gross profit, and our ability to control selling, general and administrative expenses.
|
24
|
•
|
Cash flows from operating activities – Cash flow generation supports the general liquidity needs of the Company and funds capital expenditures for our omni-channel platform, distribution and administrative facilities, costs associated with continued improvement of information technology tools, potential strategic acquisitions or investments that may arise from time-to-time and stockholder return initiatives, including cash dividends and share repurchases. We typically generate significant cash flows from operating activities and proportionately higher net income levels in our fourth fiscal quarter in connection with the holiday selling season and sales of cold weather sporting goods and apparel. See further discussion of the Company's cash flows in the "Liquidity and Capital Resources and Changes in Financial Condition" section herein.
|
|
•
|
Quality of merchandise offerings – To measure acceptance of its merchandise offerings, the Company monitors sell-throughs, inventory turns, gross margins and markdown rates at the department and style level. This analysis helps the Company manage inventory levels to reduce working capital requirements and deliver optimal gross margins by improving merchandise flow and establishing appropriate price points to minimize markdowns.
|
|
•
|
Store productivity – To assess store-level performance, the Company monitors various indicators, including new store productivity, sales per square foot, store operating contribution margin and store cash flow.
|
Executive Summary
|
•
|
Earnings per diluted share of
$3.24
for the 52 weeks ended February 2, 2019 increased 7.6% compared to earnings per diluted share of
$3.01
during the 53 weeks ended February 3, 2018. Net income for fiscal 2018 totaled
$319.9 million
compared to
$323.4 million
in fiscal 2017.
|
|
•
|
Fiscal 2017 net income included:
|
|
◦
|
$2.2 million, net of tax, or $0.02 per diluted share, of costs incurred by the Company to convert TSA stores to Dick's Sporting Goods stores;
|
|
◦
|
$12.0 million, net of tax, or $0.11 per diluted share, of income from a contract termination payment;
|
|
◦
|
$4.4 million, net of tax, or $0.04 per diluted share, of costs attributable to a corporate restructuring;
|
|
◦
|
$5.0 million, net of tax, or $0.05 per diluted share, of income from a multi-year sales tax refund;
|
|
◦
|
$7.2 million, net of tax, or $0.07 per diluted share, of transition costs incurred to enhance the Company's Scorecard loyalty program; and
|
|
◦
|
$4.2 million, net of tax, or $0.04 per diluted share, of costs for a litigation contingency.
|
|
•
|
Net sales
decreased
1.8%
to
$8,436.6 million
in fiscal
2018
from
$8,590.5 million
in fiscal
2017
due primarily to a 3.2% decrease in consolidated same store sales and the inclusion of a 53
rd
week of sales during fiscal 2017.
|
|
•
|
Consolidated same store sales, adjusted for the shifted retail calendar, decreased 3.1% on a 52-week to 52-week comparative basis, which includes an increase of approximately 17% in eCommerce sales.
|
|
•
|
eCommerce sales penetration increased to approximately 15% of total net sales during fiscal 2018 compared to approximately 12% of total net sales during fiscal 2017 on a 52-week to 52-week comparative basis.
|
|
•
|
During fiscal
2018
, the Company:
|
|
•
|
Declared and paid aggregate cash dividends in the amount of
$0.90
per share on the Company's common stock and Class B common stock;
|
|
•
|
Repurchased
9.6 million
shares of common stock for a total of
$323.4 million
under the currently authorized share repurchase program; and
|
|
•
|
Ended the fiscal year with no outstanding borrowings under its Credit Facility.
|
25
|
•
|
The following table summarizes store openings and closings for fiscal
2018
and fiscal
2017
:
|
|
|
Fiscal 2018
|
Fiscal 2017
|
|||||||||||||||
|
|
Dick's Sporting Goods
|
Specialty Concept Stores
(1)
|
Total
|
Dick's Sporting Goods
|
Specialty Concept Stores
(1)
|
Total
|
|||||||||||
|
Beginning stores
|
716
|
|
129
|
|
845
|
|
676
|
|
121
|
|
797
|
|
|||||
|
New stores:
|
|
|
|
|
|
|
|||||||||||
|
Single-level stores
|
19
|
|
—
|
|
19
|
|
39
|
|
16
|
|
55
|
|
|||||
|
Two-level stores
|
—
|
|
—
|
|
—
|
|
4
|
|
—
|
|
4
|
|
|||||
|
Total new stores
|
19
|
|
—
|
|
19
|
|
43
|
|
16
|
|
59
|
|
|||||
|
Closed stores
|
6
|
|
—
|
|
6
|
|
3
|
|
8
|
|
11
|
|
|||||
|
Ending stores
|
729
|
|
129
|
|
858
|
|
716
|
|
129
|
|
845
|
|
|||||
|
Relocated stores
|
4
|
|
1
|
|
5
|
|
7
|
|
1
|
|
8
|
|
|||||
|
(1)
|
Includes the Company's Golf Galaxy, Field & Stream and other specialty concept stores.
|
Results of Operations
The following table presents, for the periods indicated, selected items in the Consolidated Statements of Income as a percentage of the Company's net sales, as well as the basis point change in percentage of net sales from the prior year:
|
|
Fiscal Year
|
Basis Point Increase / (Decrease) in Percentage of Net Sales from Prior Year
(A)
|
Basis Point Increase / (Decrease) in Percentage of Net Sales from Prior Year
|
|||||||||
|
|
2018
|
2017
(A)
|
2016
(A)
|
2018 - 2017
|
2017 - 2016
|
|||||||
|
Net sales
|
100.00
|
%
|
100.00
|
%
|
100.00
|
%
|
N/A
|
N/A
|
||||
|
Cost of goods sold, including occupancy and distribution costs
|
71.10
|
|
71.03
|
|
70.14
|
|
7
|
89
|
||||
|
Gross profit
|
28.90
|
|
28.97
|
|
29.86
|
|
(7)
|
(89)
|
||||
|
Selling, general and administrative expenses
|
23.55
|
|
23.08
|
|
23.68
|
|
47
|
(60)
|
||||
|
Pre-opening expenses
|
0.08
|
|
0.34
|
|
0.51
|
|
(26)
|
(17)
|
||||
|
Income from operations
|
5.27
|
|
5.56
|
|
5.68
|
|
(29)
|
(12)
|
||||
|
Interest expense
|
0.12
|
|
0.09
|
|
0.07
|
|
3
|
2
|
||||
|
Other expense (income)
|
0.03
|
|
(0.37
|
)
|
(0.18
|
)
|
40
|
(19)
|
||||
|
Income before income taxes
|
5.12
|
|
5.84
|
|
5.79
|
|
(72)
|
5
|
||||
|
Provision for income taxes
|
1.33
|
|
2.07
|
|
2.16
|
|
(74)
|
(9)
|
||||
|
Net income
|
3.79
|
%
|
3.77
|
%
|
3.63
|
%
|
2
|
14
|
||||
|
(A)
|
Column does not add due to rounding.
|
Note - As retailers vary in how they record costs of operating their stores and supply chain between cost of goods sold and SG&A, our gross profit rate and SG&A rate may not be comparable to other retailers. For additional information regarding the types of costs classified within cost of goods sold, SG&A or any other financial statement line items presented herein, refer to Note 1 to the Consolidated Financial Statements included in Item 8, "Financial Statements and Supplementary Data", of this Annual Report on Form 10-K.
26
Fiscal
2018
(52 weeks) Compared to Fiscal
2017
(53 weeks)
Net Sales
Net sales
decreased
1.8%
to
$8,436.6 million
in fiscal
2018
from
$8,590.5 million
in fiscal
2017
due primarily to a 3.2% decrease in consolidated same store sales and the inclusion of a 53
rd
week of sales during fiscal 2017. The 3.2% decrease in consolidated same store sales reduced net sales during fiscal 2018 by $260.3 million, while sales at stores that are not yet included in the comparable store base increased net sales by $106.4 million in fiscal 2018. Net sales during the 53
rd
week of fiscal 2017 totaled $105.4 million. Consolidated same store sales, adjusted for the shifted retail calendar, decreased 3.1% on a 52-week to 52-week comparative basis, which includes an increase of approximately 17% in eCommerce sales. eCommerce sales penetration increased to approximately 15% of total net sales during fiscal 2018 compared to approximately 12% of total net sales during fiscal 2017.
As adjusted for the shifted retail calendar, gains in the outdoor apparel and fitness equipment categories were more than offset by declines in the hunt, outdoor equipment and electronics categories. Our firearms policy changes have contributed to a continuing decline in our hunt business, which was a challenged category coming into fiscal 2018. The broader hunt industry also decelerated and remains challenged. We continue to evaluate our strategy for the hunt business and plan to remove hunt merchandise from approximately 125 Dick's Sporting Goods stores where the category under-performs and is less relevant in the local market, and utilize this space for categories that are under-served based on the needs of that particular market. We have exited the majority of our electronics business, which consisted primarily of fitness tracking. Consolidated same store sales results for fiscal 2018 reflect
a decrease
in transactions of approximately
4.3%
partially offset by
an increase
in sales per transaction of approximately
1.2%
.
Income from Operations
Income from operations
decreased
to
$444.7 million
in fiscal
2018
from
$477.6 million
in fiscal
2017
.
Gross profit
decreased
2.1%
to
$2,437.8 million
in fiscal
2018
from
$2,489.1 million
in fiscal
2017
and
decreased
as a percentage of net sales by
seven
basis points compared to fiscal
2017
. Merchandise margins increased 94 basis points, primarily driven by fewer promotions and favorable merchandise mix as our hunt, outdoor equipment and electronics categories have significantly lower merchandise margin rates compared to other categories. This increase was partially offset by higher eCommerce shipping and fulfillment costs, higher freight as well as occupancy deleverage. Occupancy costs increased $23.9 million in the current year from fiscal 2017. Our occupancy costs, which after the cost of merchandise represent our largest expense within cost of goods sold, are generally fixed in nature and fluctuate based on the number of stores that we operate. Fiscal 2017 included an $11.5 million charge related to transition costs to enhance our Scorecard loyalty program, which negatively impacted gross profit as a percentage of net sales by 13 basis points.
SG&A expenses
increased
0.2%
to
$1,986.6 million
in fiscal
2018
from
$1,982.4 million
in fiscal
2017
, and
increased
as a percentage of net sales by
47
basis points, primarily driven by higher incentive compensation and investments in our growth initiatives to support our long-term strategy. Fiscal 2017 included $7.1 million related to corporate restructuring charges and $6.6 million for costs related to a litigation contingency, each of which negatively impacted SG&A expenses as a percentage of net sales by eight basis points.
Pre-opening expenses
decreased
to
$6.5 million
in fiscal
2018
from
$29.1 million
in fiscal
2017
. Pre-opening expenses in any period fluctuate depending on the timing and number of store openings and relocations. We opened 19 new stores in fiscal 2018 compared to 59 new stores in fiscal 2017. The Company incurred $3.5 million of costs during fiscal 2017 to convert former TSA stores to Dick's Sporting Goods stores.
Other Expense (Income)
Other expense totaled $2.6 million in fiscal 2018 compared to $31.8 million of other income in fiscal 2017. The Company recognizes investment income / expense to reflect changes in deferred compensation plan investment values with a corresponding charge / reduction to SG&A expenses for the same amount. The Company recognized investment expense totaling $3.4 million in fiscal 2018 compared to investment income of $11.1 million in fiscal 2017, primarily driven by performance in the equity markets, which impacted the deferred compensation plan investment values. Additionally, fiscal 2017 included $12.0 million for the receipt of a contract termination payment and $8.1 million for the receipt of a multi-year sales tax refund.
27
Income Taxes
The Company's effective tax rate decreased to
25.9%
for fiscal
2018
from
35.5%
for fiscal
2017
. The decrease is primarily due to a lower statutory corporate tax rate during fiscal 2018 resulting from the Tax Cuts and Jobs Act (the "Tax Act").
Fiscal
2017
(53 weeks) Compared to Fiscal
2016
(52 weeks)
Net Sales
Net sales increased 8.4% to $8,590.5 million in fiscal 2017 from $7,922.0 million in fiscal 2016 due primarily to the growth of our store network, as well as the inclusion of the 53
rd
week of sales during fiscal 2017, partially offset by a 0.3% decrease in consolidated same store sales on a 52-week to 52-week basis. Net sales during the 53
rd
week of fiscal 2017 totaled $105.4 million. The 0.3% decrease in consolidated same store sales reduced net sales by $23.0 million during fiscal 2017. Stores that were not yet included in the comparable store base increased net sales by $586.1 million during fiscal 2017. eCommerce sales penetration was approximately 12% of total net sales during both fiscal 2017 and fiscal 2016, representing an increase of approximately 13% in eCommerce sales on a 52-week to 52-week comparative basis.
The decrease in consolidated same store sales was driven by declines in hunt, electronics and licensed categories, partially offset by gains in the golf and athletic footwear categories along with our private brand businesses. The same store sales results for fiscal 2017 reflect a decrease in transactions of approximately 0.5% partially offset by an increase in sales per transaction of approximately 0.2%.
Income from Operations
Income from operations increased to $477.6 million in fiscal 2017 from $449.9 million in fiscal 2016.
Gross profit increased 5.2% to $2,489.1 million in fiscal 2017 from $2,365.8 million in fiscal 2016, but decreased as a percentage of net sales by 89 basis points compared to fiscal 2016. The decrease in gross profit as a percentage of net sales resulted from lower merchandise margins as the retail marketplace continued to be highly promotional, as well as occupancy deleverage, and higher eCommerce shipping and fulfillment costs. Occupancy costs increased $94.6 million in fiscal 2017 from fiscal 2016. Our occupancy costs, which after the cost of merchandise represent our largest expense within cost of goods sold, are generally fixed in nature and fluctuate based on the number of stores that we operate. As a percentage of net sales, occupancy costs increased at a higher rate than the 8.4% increase in net sales during fiscal 2017. Fiscal 2017 included an $11.5 million charge related to transition costs to enhance the Company's Scorecard loyalty program, which negatively impacted gross profit as a percentage of net sales by 13 basis points. Fiscal 2016 included a $46.4 million inventory write-down in connection with the implementation of our new merchandising strategy, which negatively impacted gross profit as a percentage of net sales by 59 basis points.
SG&A expenses increased 5.7% to $1,982.4 million in fiscal 2017 from $1,875.6 million in fiscal 2016, but decreased as a percentage of net sales by 60 basis points, primarily driven by lower incentive compensation and savings from our new eCommerce operating model, partially offset by higher store payroll costs incurred to deliver improved customer service, and asset impairment charges. Fiscal 2017 included $7.1 million related to corporate restructuring charges and $6.6 million for costs related to a litigation contingency, each of which negatively impacted SG&A expenses as a percentage of net sales by eight basis points. Fiscal 2016 included $49.1 million of charges for asset write-downs, impairments and merger and integration costs, which negatively impacted SG&A expenses by 62 basis points.
Pre-opening expenses decreased to $29.1 million in fiscal 2017 from $40.3 million in fiscal 2016. Pre-opening expenses in any period fluctuate depending on the timing and number of store openings and relocations. The Company incurred $3.5 million and $5.1 million during fiscal 2017 and fiscal 2016, respectively, to convert TSA and Golfsmith stores to Dick's Sporting Goods and Golf Galaxy stores. Pre-opening rent expenses for our self-developed store sites will generally exceed those for sites built to our specifications by our landlords, as we commence recognition of rent expense when we take possession of a site as opposed to when we commence occupancy under the lease term.
28
Other Income
Other income increased to $31.8 million in fiscal 2017 from $14.4 million in fiscal 2016. The Company recognizes investment income / expense to reflect changes in deferred compensation plan investment values with a corresponding charge / reduction to SG&A expenses for the same amount. The Company recognized investment income totaling $11.1 million in fiscal 2017 compared to investment income of $7.2 million in fiscal 2016, primarily driven by an overall improvement in the equity markets, which impacted the deferred compensation plan investment values. Additionally, fiscal 2017 included $12.0 million for the receipt of a contract termination payment and $8.1 million for the receipt of a multi-year sales tax refund. Fiscal 2016
included a $2.9 million benefit from a multi-year sales tax refund as well as a $4.0 million gain for the Company's share of profits from the liquidation of former Golfsmith stores.
Income Taxes
The Company's effective tax rate was 35.5% for fiscal 2017 compared to 37.3% for fiscal 2016. The decrease is primarily due to a lower statutory corporate tax rate resulting from the Tax Act, which required the Company to apply a blended federal income tax rate to fiscal 2017 results based upon a pro-rated percentage of the number of days before and after January 1, 2018.
Liquidity and Capital Resources
Overview
The Company has a $1.25 billion senior secured revolving credit facility (the "Credit Facility"), which also provides for up to $150 million in the form of letters of credit. Under the Credit Facility, which is further described within Note 7 to the Consolidated Financial Statements, subject to satisfaction of certain conditions, the Company may request an increase of up to $350 million in additional borrowing availability.
On August 3, 2018, the Company amended the Credit Facility to provide that all terms of an accounting or financial nature and all computations of financial amounts and ratios referenced in the Credit Facility will be made without giving effect to any lease obligation recorded pursuant to FASB ASU 2016-02,
"Leases (Topic 842)"
, to the extent such obligation would not have been recorded as a capital lease obligation prior to adoption of ASU 2016-02.
The Company's liquidity and capital needs have generally been met by cash from operating activities supplemented by borrowings under the Company's Credit Facility as seasonally necessary. The Company generally utilizes its Credit Facility for working capital needs based primarily on the seasonal nature of its operating cash flows, with the Company's peak borrowing level occurring early in the fourth quarter as the Company increases inventory in advance of the holiday selling season.
Liquidity information for the fiscal years ended (dollars in thousands):
|
February 2, 2019
|
February 3, 2018
|
||||||
|
Funds drawn on Credit Facility
|
$
|
1,875,400
|
|
$
|
2,742,800
|
|
|
|
Number of business days with outstanding balance on Credit Facility
|
195 days
|
|
228 days
|
|
|||
|
Maximum daily amount outstanding under Credit Facility
|
$
|
423,100
|
|
$
|
569,000
|
|
|
Liquidity information as of the fiscal years ended (dollars in thousands):
|
February 2, 2019
|
February 3, 2018
|
||||||
|
Outstanding borrowings under Credit Facility
|
$
|
—
|
|
$
|
—
|
|
|
|
Cash and cash equivalents
|
$
|
113,653
|
|
$
|
101,253
|
|
|
|
Remaining borrowing capacity under Credit Facility
|
$
|
1,233,869
|
|
$
|
1,233,869
|
|
|
|
Outstanding letters of credit under Credit Facility
|
$
|
16,131
|
|
$
|
16,131
|
|
|
The Company intends to allocate capital to invest in its future growth, specifically growing and remodeling its store network and eCommerce business together to deliver an omni-channel shopping experience, as well as other long-term strategic investments while returning capital to stockholders through share repurchases and dividends.
29
Capital expenditures
– Fiscal 2018 capital expenditures totaled $198.2 million on a gross basis and $170.5 million on a net basis, which includes tenant allowances provided by landlords. Normal capital requirements primarily relate to the development of our omni-channel platform, including investments in new and existing stores and eCommerce technology. We reduced our new stores growth rate in fiscal 2018 to 19 new Dick's Sporting Goods stores, which represents a significant reduction from fiscal 2017. The Company also plans to continue to invest in improving its eCommerce fulfillment network and corporate information technology capabilities.
We currently expect fiscal 2019 capital expenditures to be approximately $230.0 million on a gross basis and approximately $200.0 million on a net basis. We plan to continue to invest in technology and eCommerce fulfillment to deliver the best omni-channel customer experience in sporting goods. We plan to reduce our new store growth in fiscal 2019 to approximately seven new Dick's Sporting Goods stores and two new Golf Galaxy stores. Approximately two-thirds of our Dick’s Sporting Goods stores will be up for lease renewal at our option over the next five years. We plan to leverage the significant flexibility within our existing real estate portfolio to capitalize on future real estate opportunities over the near and intermediate term as those leases come up for renewal.
Share repurchases
– On March 16, 2016, the Company's Board of Directors authorized a five-year share repurchase program of up to $1 billion of the Company's common stock. During fiscal
2018
, the Company repurchased
9.6 million
shares of its common stock for
$323.4 million
and currently has approximately $433.4 million remaining under its authorization that extends through 2021. During fiscal
2017
, the Company repurchased 8.1 million shares of its common stock for $284.6 million. The Company intends to repurchase shares from time-to-time to offset dilution and also may pursue additional repurchases of shares under favorable market conditions. Any future share repurchase programs are subject to the authorization by our Board of Directors and will be dependent upon future earnings, cash flows, financial requirements and other factors.
Dividends
– During the fiscal year ended
February 2, 2019
, the Company paid
$89.3 million
of dividends to its stockholders. On
February 22, 2019
, the Company's Board of Directors declared a quarterly cash dividend in the amount of
$0.275
per share on the Company's common stock and Class B common stock payable on
March 29, 2019
to stockholders of record as of the close of business on
March 15, 2019
. The declaration of future dividends and the establishment of the per share amount, record dates and payment dates for any such future dividends are subject to authorization by our Board of Directors, and will be dependent upon multiple factors including future earnings, cash flows, financial requirements and other considerations.
The Company believes cash flows generated by operations and funds available under its Credit Facility will be sufficient to satisfy capital requirements, including planned capital expenditures, share repurchases and quarterly dividend payments to its stockholders through fiscal
2019
. The Company may require additional funding should the Company pursue strategic acquisitions or undertake share repurchases, other investments or store expansion rates in excess of historical levels.
Changes in cash and cash equivalents are as follows (dollars in thousands):
|
|
Fiscal Year Ended
|
||||||||||
|
|
February 2, 2019
|
February 3, 2018
|
January 28, 2017
|
||||||||
|
Net cash provided by operating activities
|
$
|
712,755
|
|
$
|
746,310
|
|
$
|
768,994
|
|
||
|
Net cash used in investing activities
|
(198,219
|
)
|
(485,648
|
)
|
(550,324
|
)
|
|||||
|
Net cash used in financing activities
|
(502,094
|
)
|
(324,240
|
)
|
(172,876
|
)
|
|||||
|
Effect of exchange rate changes on cash and cash equivalents
|
(42
|
)
|
54
|
|
47
|
|
|||||
|
Net increase (decrease) in cash and cash equivalents
|
$
|
12,400
|
|
$
|
(63,524
|
)
|
$
|
45,841
|
|
||
Operating Activities
Operating activities consist primarily of net income, adjusted for certain non-cash items and changes in operating assets and liabilities. Adjustments to net income for non-cash items include depreciation and amortization, deferred income taxes and stock-based compensation expense, as well as non-cash gains and losses on the disposal of the Company's assets. Changes in operating assets and liabilities primarily reflect changes in inventories, accounts payable and income taxes payable / receivable, as well as other working capital changes.
30
Cash provided by operating activities
decreased
$33.6 million
in fiscal
2018
to
$712.8 million
, primarily due to the following:
|
•
|
Changes in deferred construction allowances decreased operating cash flows by $74.0 million compared to the prior year, primarily due to fewer self-developed stores during fiscal 2018.
|
|
•
|
Changes in prepaid expenses and other assets increased operating cash flows by $40.1 million compared to the prior year, primarily due to the timing of payments related to multi-year contractual agreements.
|
Investing Activities
Cash used in investing activities for fiscal
2018
decreased
by
$287.4 million
to
$198.2 million
from fiscal
2017
, primarily due to a $276.1 million decrease in gross capital expenditures. The decrease in gross capital expenditures was primarily driven by the reduction in our new store growth rate in fiscal 2018, coupled with the construction of our fifth distribution facility during fiscal 2017.
Financing Activities
Financing activities consist primarily of the Company's capital return initiatives, including its share repurchase program and cash dividend payments, cash flows generated from stock option exercises and cash activity associated with our Credit Facility. Cash used in financing activities for fiscal
2018
totaled
$502.1 million
compared to
$324.2 million
in fiscal
2017
. The increase in cash used in financing activities was primarily driven by higher share repurchases during fiscal 2018 compared to fiscal 2017 coupled with financing proceeds for the purchase of a corporate aircraft during fiscal 2017.
Contractual Obligations and Commercial Commitments
The Company is party to many contractual obligations that involve commitments to make payments to third parties in the ordinary course of business. The following table provides summary information concerning our future contractual obligations (within the scope of Item 303(a)(5) of Regulation S-K) as of
February 2, 2019
(in thousands):
|
Payments Due by Period
|
|||||||||||||||||||
|
|
Total
|
Less than 1 year
|
1-3 years
|
3-5 years
|
More than 5 years
|
||||||||||||||
|
Contractual obligations:
|
|
|
|
|
|||||||||||||||
|
Term loan (see Note 7)
|
$
|
56,085
|
|
$
|
4,523
|
|
$
|
9,045
|
|
$
|
9,045
|
|
$
|
33,472
|
|
||||
|
Capital lease obligations (see Note 7)
|
3,941
|
|
722
|
|
1,513
|
|
1,496
|
|
210
|
|
|||||||||
|
Other long-term debt
|
18
|
|
18
|
|
—
|
|
—
|
|
—
|
|
|||||||||
|
Interest payments (see Note 7)
|
1,150
|
|
381
|
|
533
|
|
230
|
|
6
|
|
|||||||||
|
Operating lease obligations (see Note 8)
(a)
|
3,735,028
|
|
655,516
|
|
1,177,822
|
|
868,656
|
|
1,033,034
|
|
|||||||||
|
Unrecognized tax benefits
(b)
|
3,145
|
|
3,145
|
|
—
|
|
—
|
|
—
|
|
|||||||||
|
Purchase and other commitments (see Note 14)
(c)
|
118,358
|
|
62,862
|
|
38,108
|
|
8,192
|
|
9,196
|
|
|||||||||
|
Total contractual obligations
|
$
|
3,917,725
|
|
$
|
727,167
|
|
$
|
1,227,021
|
|
$
|
887,619
|
|
$
|
1,075,918
|
|
||||
|
(a)
|
Amounts include aggregate lease obligations, including fixed executory costs.
|
|
(b)
|
Excludes $2,657 of accrued liability for unrecognized tax benefits as we cannot reasonably estimate the timing of settlement. These payments include interest and penalties.
|
|
(c)
|
The Company's purchase obligations relate primarily to marketing commitments, including naming rights, licenses for trademarks, minimum requirements with its third-party eCommerce fulfillment provider, and technology-related and other ordinary course commitments. In the ordinary course of business, the Company enters into many contractual commitments, including purchase orders and commitments for products or services, but generally, such commitments represent annual or cancellable commitments. The amount of purchase obligations shown is based on multi-year non-cancellable contracts outstanding at the end of fiscal
2018
.
|
31
The Note references in the table above are to the Notes to the Consolidated Financial Statements included in Item 8 herein.
The following table summarizes the Company's other commercial commitments, including both on and off-balance sheet arrangements, in effect at
February 2, 2019
(in thousands):
|
Total
|
Less than
1 year
|
||||||
|
Other commercial commitments:
|
|
|
|||||
|
Documentary letters of credit
|
$
|
—
|
|
$
|
—
|
|
|
|
Standby letters of credit
|
16,131
|
|
16,131
|
|
|||
|
Total other commercial commitments
|
$
|
16,131
|
|
$
|
16,131
|
|
|
The Company expects to fund these commitments primarily with operating cash flows generated in the normal course of business.
Off-Balance Sheet Arrangements
Operating leases for our stores represent the majority of our contractual obligations. Future scheduled lease payments under non-cancellable operating leases as of
February 2, 2019
are described under the heading "Operating lease obligations" in the table above.
Critical Accounting Policies and Use of Estimates
The Company's significant accounting policies are described in Note 1 of the Consolidated Financial Statements, which were prepared in accordance with accounting principles generally accepted in the United States of America. Critical accounting policies are those that the Company believes are both most important to the portrayal of the Company's financial condition and results of operations, and require the Company's most difficult, subjective or complex judgments, often as a result of the need to make estimates about the effect of matters that are inherently uncertain. Judgments and uncertainties affecting the application of those policies may result in materially different amounts being reported under different conditions or using different assumptions.
The Company considers the following policies to be the most critical in understanding the judgments that are involved in preparing its consolidated financial statements.
Inventory Valuation
The Company values inventory using the lower of weighted average cost and net realizable value. Net realizable value is generally based on the selling price expectations of the merchandise. The Company regularly reviews inventories to determine if the carrying value of the inventory exceeds net realizable value and when determined necessary, records a reserve to reduce the carrying value to net realizable value. Changes in customer merchandise preference, consumer spending, weather patterns, economic conditions, business trends or merchandising strategies could cause the Company's inventory to be exposed to obsolescence or slow moving merchandise.
Shrink expense is accrued as a percentage of merchandise sales based on historical shrink trends. The Company performs physical inventories at its stores and distribution centers throughout the year. The shrink reserve represents the cumulative loss estimate for each of the Company's locations since the last physical inventory date through the reporting date. Estimates by location and in the aggregate are impacted by internal and external factors and may vary significantly from actual results.
32
Business Development Allowances
Business development allowances include allowances, rebates and cooperative advertising funds received from vendors. These funds are determined for each fiscal year and the majority are based on various quantitative contract terms. Amounts expected to be received from vendors for the purchase of merchandise inventories ("vendor allowances") are recognized as a reduction of cost of goods sold as the merchandise is sold. Amounts that represent a reimbursement of costs incurred, such as advertising, ("cooperative advertising") are recorded as a reduction to the related expense in the period that the related expense is incurred. The Company records an estimate of earned allowances based on the latest projected purchase volumes and advertising forecasts.
Goodwill and Intangible Assets
Goodwill, indefinite-lived and other finite-lived intangible assets are reviewed for impairment on an annual basis, or whenever circumstances indicate that a decline in value may have occurred. Our evaluation for impairment requires accounting judgments and financial estimates in determining the fair value of the reporting unit. If these judgments or estimates change in the future, we may be required to record impairment charges for these assets.
The Company's goodwill impairment test compares the fair value of each reporting unit to its carrying value. The Company determines the fair value of its reporting units using a combination of a discounted cash flow and a market value approach. The Company's estimates may differ from actual results due to, among other things, economic conditions, changes to its business models, or changes in operating performance. Significant differences between these estimates and actual results could result in future impairment charges and could materially affect the Company's future financial results. If the fair value of the reporting unit exceeds the carrying value of the net assets assigned to that reporting unit, goodwill is not impaired. If the carrying value of the net assets assigned to the reporting unit exceeds the fair value of the reporting unit, an impairment charge is recorded to reduce the carrying value to the fair value. As of
February 2, 2019
, the Company had no reporting units at risk for goodwill impairment.
Intangible assets that have been determined to have indefinite lives are not subject to amortization and are reviewed at least annually for potential impairment, or more frequently as mentioned above. The fair value of the Company's intangible assets are estimated and compared to their carrying value. The Company estimates the fair value of these intangible assets based on an income approach using the relief-from-royalty method. This methodology assumes that, in lieu of ownership, a third-party would be willing to pay a royalty in order to exploit the related benefits of these types of assets. This approach is dependent on a number of factors, including estimates of future sales growth and trends, royalty rates in the category of intellectual property, discount rates and other variables. If actual results are not consistent with our estimates and assumptions used in estimating fair value, the Company may be exposed to losses that could be material. The Company does not believe there is reasonable likelihood that there will be a material change in the estimates or assumptions used to calculate fair value. The Company recognizes an impairment charge when the estimated fair value of the intangible asset is less than the carrying value.
Impairment of Long-Lived Assets and Closed Store Reserves
The Company reviews long-lived assets whenever events and circumstances indicate that the carrying value of these assets may not be recoverable based on estimated undiscounted future cash flows. Assets are reviewed at the lowest level for which cash flows can be identified, which is the store level. The Company uses an income approach to determine the fair value of individual store locations, which requires discounting projected future cash flows over each store's remaining lease term. When determining the stream of projected future cash flows associated with an individual store location, the Company makes assumptions, incorporating local market conditions, about key store variables including sales growth rates, gross margin and controllable expenses, such as store payroll. An impairment loss is recognized when the carrying amount of the store location is not recoverable and exceeds its fair value.
Based on an analysis of current and future store performance, management periodically evaluates the need to close underperforming stores. Reserves are established for the present value of any remaining operating lease obligations, net of estimated sublease income, when the Company ceases to use a location. If the timing or amount of actual sublease income differs from estimated amounts, this could result in an increase or decrease in the related reserves.
33
Self-Insurance
The Company is self-insured for certain losses related to health, workers' compensation and general liability insurance, although we maintain stop-loss coverage with third-party insurers to limit our liability exposure. Liabilities associated with these losses are estimated in part by considering historical claim experience, industry factors, severity factors and other actuarial assumptions.
Stock-Based Compensation
The Company accounts for stock-based compensation in accordance with fair value recognition provisions, under which the Company uses the Black-Scholes option-pricing model, which requires the input of assumptions. These assumptions include estimating the length of time employees will retain their vested stock options before exercising them ("expected term"), the estimated volatility of the Company's common stock price over the expected term and the expected dividend yield. In addition, we estimate the number of awards that will ultimately not complete their vesting requirements ("forfeitures") and recognize expense for those stock awards expected to vest. Changes in the assumptions can materially affect the estimate of fair value of stock-based compensation and consequently, the related amount recognized on the Consolidated Statements of Income.
ITEM 7A. QUANTITATIVE AND QUALITATIVE DISCLOSURES ABOUT MARKET RISK
Interest Rate Risk
The Company maintains its Credit Facility to support potential liquidity and capital needs. Our interest rate under the Credit Facility is benchmarked to, at the Company's option, a base rate or an adjusted LIBOR rate plus, in each case, an applicable margin percentage. There were no outstanding borrowings under the Credit Facility as of
February 2, 2019
and
February 3, 2018
.
The Company holds highly liquid instruments purchased with a maturity of three months or less at the date of purchase that are classified as cash equivalents. The Company had cash equivalent investments at
February 2, 2019
and
February 3, 2018
totaling
$33.8 million
and
$21.0 million
, respectively. As these investments are short-term in nature, changes in interest rates generally would not have a material impact on the valuation of these investments.
During fiscal
2018
and
2017
, a hypothetical 10% increase or decrease in interest rates would not have materially affected the Consolidated Financial Statements.
Impact of Inflation
Inflationary factors such as increases in the cost of our products and overhead costs may adversely affect our operating results. Although we do not believe that inflation has had a material impact on our financial position or results of operations to date, a high rate of inflation in the future may have an adverse effect on our ability to maintain current levels of gross margin and SG&A expenses as a percentage of net sales if the selling prices of our products do not increase with inflation.
Seasonality and Quarterly Results
The Company's business is subject to seasonal fluctuations. Significant portions of the Company's net sales and profits are realized during the fourth quarter of the Company's fiscal year, which is due in part to the holiday selling season and in part to sales of cold weather sporting goods and apparel. Any decrease in fiscal fourth quarter sales, whether because of a slow holiday selling season, unseasonable weather conditions or otherwise, could have a material adverse effect on our business, financial condition and operating results for the entire fiscal year.
ITEM 8. FINANCIAL STATEMENTS AND SUPPLEMENTARY DATA
The financial statements required to be filed hereunder are set forth on pages 43 through 69 of this Annual Report on Form 10-K.
ITEM 9. CHANGES IN AND DISAGREEMENTS WITH ACCOUNTANTS ON ACCOUNTING AND FINANCIAL DISCLOSURE
None.
34
ITEM 9A. CONTROLS AND PROCEDURES
Disclosure Controls and Procedures
The Company carried out an evaluation, under the supervision and with the participation of the Company's management, including the Chief Executive Officer and the Chief Financial Officer, of the effectiveness of the design and operation of the disclosure controls and procedures, as defined in Rules 13a-15(e) and 15d-15(e) under the Exchange Act. Based upon that evaluation, the Company's management, including the Company's Chief Executive Officer and the Chief Financial Officer concluded that, as of
February 2, 2019
, the Company's disclosure controls and procedures were effective in ensuring that material information for the Company, including its consolidated subsidiaries, required to be disclosed by the Company in reports that it files or submits under the Exchange Act is recorded, processed, summarized and reported within the time periods specified in the Securities and Exchange Commission's ("SEC") rules and forms, and that it is accumulated and communicated to management, including our principal executive and financial officers, or persons performing similar functions, as appropriate to allow timely decisions regarding required disclosure.
Report of Management on Internal Control over Financial Reporting
Our management is responsible for establishing and maintaining adequate internal control over financial reporting. Internal control over financial reporting is a process to provide reasonable assurance regarding the reliability of our financial reporting for external purposes in accordance with accounting principles generally accepted in the United States of America. Internal control over financial reporting includes: maintaining records that in reasonable detail accurately and fairly reflect our transactions; providing reasonable assurance that transactions are recorded as necessary for preparation of our financial statements; providing reasonable assurance that receipts and expenditures of Company assets are made in accordance with management authorization; and providing reasonable assurance that unauthorized acquisition, use or disposition of Company assets that could have a material effect on our financial statements would be prevented or detected on a timely basis. Because of its inherent limitations, internal control over financial reporting is not intended to provide absolute assurance that a misstatement of our financial statements would be prevented or detected.
Our management conducted an evaluation of the effectiveness of our internal control over financial reporting based on the framework and criteria established in
Internal Control—Integrated Framework (2013)
, issued by the Committee of Sponsoring Organizations of the Treadway Commission. This evaluation included review of the documentation of controls, evaluation of the design effectiveness of controls, testing of the operating effectiveness of controls and a conclusion on this evaluation. Based on this evaluation, management concluded that the Company's internal control over financial reporting was effective as of
February 2, 2019
.
Deloitte & Touche LLP, an independent registered public accounting firm, has issued an attestation report on the Company's internal control over financial reporting included on the following page of this document.
Changes in Internal Control over Financial Reporting
There were no changes in the Company's internal control over financial reporting during the quarter ended February 2, 2019 that have materially affected, or are reasonably likely to materially affect, the Company's internal control over financial reporting.
Inherent Limitations of Control Systems
There are inherent limitations in the effectiveness of any control system, including the potential for human error and the circumvention or overriding of the controls and procedures. Additionally, judgments in decision making can be faulty and breakdowns can occur because of simple error or mistake. An effective control system can provide only reasonable, not absolute, assurance that the control objectives of the system are adequately met. Accordingly, our management, including our Chief Executive Officer and Chief Financial Officer, does not expect that our control system can prevent or detect all error or fraud. Finally, projections of any evaluation or assessment of effectiveness of a control system to future periods are subject to the risks that, over time, controls may become inadequate because of changes in an entity's operating environment or deterioration in the degree of compliance with policies and procedures.
35
REPORT OF INDEPENDENT REGISTERED PUBLIC ACCOUNTING FIRM
To the stockholders and Board of Directors of Dick's Sporting Goods, Inc.
Opinion on Internal Control over Financial Reporting
We have audited the internal control over financial reporting of Dick's Sporting Goods, Inc. and subsidiaries (the "Company") as of February 2, 2019, based on criteria established in
Internal Control - Integrated Framework (2013)
issued by the Committee of Sponsoring Organizations of the Treadway Commission (COSO). In our opinion, the Company maintained, in all material respects, effective internal control over financial reporting as of February 2, 2019, based on criteria established in
Internal Control - Integrated Framework (2013)
issued by COSO.
We have also audited, in accordance with the standards of the Public Company Accounting Oversight Board (United States) (PCAOB), the consolidated financial statements as of and for the year ended February 2, 2019, of the Company and our report dated March 29, 2019, expressed an unqualified opinion on those financial statements.
Basis for Opinion
The Company’s management is responsible for maintaining effective internal control over financial reporting and for its assessment of the effectiveness of internal control over financial reporting, included in the accompanying
Report of Management on Internal Control over Financial Reporting
. Our responsibility is to express an opinion on the Company’s internal control over financial reporting based on our audit. We are a public accounting firm registered with the PCAOB and are required to be independent with respect to the Company in accordance with the U.S. federal securities laws and the applicable rules and regulations of the Securities and Exchange Commission and the PCAOB.
We conducted our audit in accordance with the standards of the PCAOB. Those standards require that we plan and perform the audit to obtain reasonable assurance about whether effective internal control over financial reporting was maintained in all material respects. Our audit included obtaining an understanding of internal control over financial reporting, assessing the risk that a material weakness exists, testing and evaluating the design and operating effectiveness of internal control based on the assessed risk, and performing such other procedures as we considered necessary in the circumstances. We believe that our audit provides a reasonable basis for our opinion.
Definition and Limitations of Internal Control over Financial Reporting
A company’s internal control over financial reporting is a process designed to provide reasonable assurance regarding the reliability of financial reporting and the preparation of financial statements for external purposes in accordance with generally accepted accounting principles. A company’s internal control over financial reporting includes those policies and procedures that (1) pertain to the maintenance of records that, in reasonable detail, accurately and fairly reflect the transactions and dispositions of the assets of the company; (2) provide reasonable assurance that transactions are recorded as necessary to permit preparation of financial statements in accordance with generally accepted accounting principles, and that receipts and expenditures of the company are being made only in accordance with authorizations of management and directors of the company; and (3) provide reasonable assurance regarding prevention or timely detection of unauthorized acquisition, use, or disposition of the company’s assets that could have a material effect on the financial statements.
Because of its inherent limitations, internal control over financial reporting may not prevent or detect misstatements. Also, projections of any evaluation of effectiveness to future periods are subject to the risk that controls may become inadequate because of changes in conditions, or that the degree of compliance with the policies or procedures may deteriorate.
/s/ Deloitte & Touche LLP
Pittsburgh, Pennsylvania
March 29, 2019
36
ITEM 9B. OTHER INFORMATION
Designation of Principal Accounting Officer
On March 28, 2019, the Board of Directors of the Company designated Navdeep Gupta, the Company’s Senior Vice President - Finance and Chief Accounting Officer, to serve as the Company’s principal accounting officer effective April 1, 2019. Lee J. Belitsky, the Company’s Executive Vice President - Chief Financial Officer, who has filled the role of principal accounting officer since September 2016, will continue to serve as the Company’s Executive Vice President - Chief Financial Officer and principal financial officer.
Mr. Gupta, 46, joined Dick’s Sporting Goods in November 2017 as Senior Vice President - Finance and Chief Accounting Officer. Prior to joining the Company, Mr. Gupta spent eleven years at Advance Auto Parts, Inc., most recently serving as the Senior Vice President of Finance. Mr. Gupta held numerous leadership roles during his tenure with Advance Auto Parts, Inc., including Chief Audit Executive, Vice President of Finance and Treasurer, and Director of Finance. Previously, Mr. Gupta held management roles at Sprint Nextel Corporation (now known as Sprint Corporation).
Mr. Gupta’s base salary was increased to $400,000 in connection with the designation. Furthermore, his target payout under the Company’s annual incentive plan was increased to 60% of his base salary and his target annual equity award was increased to $500,000. There were no other changes in Mr. Gupta’s compensation arrangements in connection with this designation.
As a full-time employee, Mr. Gupta will continue to be eligible to participate in the full range of benefits offered by the Company, including health and welfare plans, medical and dental, life and disability insurances as well as the Company’s 401(k) and non-qualified deferred compensation plans. Mr. Gupta is also subject to a non-competition, non-solicitation and confidentiality agreement with the Company, which provides limited severance benefits that are broadly available to employees subject to such agreements. There are no familial relationships between Mr. Gupta and any director, executive officer or (nominee thereof) of the Company, and there have been no transactions since the beginning of the Company’s fiscal 2018, or currently proposed, regarding Mr. Gupta that are required to be disclosed under Item 404(a) of Regulation S-K.
Special Restricted Stock Award
On March 26, 2019, the compensation committee of the Board of Directors of the Company approved a special restricted stock award to certain officers pursuant to the Company’s Amended and Restated 2012 Stock and Incentive Plan (the "2012 Plan"). The restricted stock awards will vest on the first anniversary of their grant date. The restricted stock award will vest so long as the grantee remains employed by the Company through the vesting period, except in certain specified circumstances set forth in the award agreement.
Below are the number of restricted shares to be issued to the officers for which disclosure is required under Item 5.02(e) of Form 8-K:
|
Officer
|
Title
|
Restricted Stock Award (in shares)
|
||
|
Lee J. Belitsky
|
Executive Vice President - Chief Financial Officer
|
18,000
|
||
|
Lauren R. Hobart
|
President
|
18,500
|
||
|
Paul J. Gaffney
|
Executive Vice President - Chief Technology Officer
|
11,000
|
||
The foregoing description of the restricted stock awards does not purport to be complete and is qualified in its entirety by reference to the applicable award agreement, the form of which is filed hereto as Exhibit 10.7b and incorporated herein by reference, and the Company’s 2012 Plan, a copy of which is filed hereto as Exhibit 10.7 and incorporated herein by reference.
37
PART III
ITEM 10. DIRECTORS, EXECUTIVE OFFICERS AND CORPORATE GOVERNANCE
|
(a)
|
Information relative to Directors of the Company will be set forth under the section entitled "Item 1 - Election of Directors" in the Company's definitive Proxy Statement for the
2019
Annual Meeting of Stockholders ("
2019
Proxy Statement") and is incorporated herein by reference.
|
|
(b)
|
Information with respect to Executive Officers of the Company will be set forth in Part I, Item 1.
|
|
(c)
|
Information with respect to compliance with Section 16(a) of the Securities Exchange Act of 1934 is set forth under the section entitled "Stock Ownership" in the
2019
Proxy Statement and is incorporated herein by reference.
|
|
(d)
|
The Company has adopted a code of ethics that applies to all of its employees, including its principal executive officer, principal financial officer, principal accounting officer, controller and other executive officers, and has adopted a separate code of ethics that applies to the Board of Directors, the complete text of which are available through the Investor Relations section of the Company's website at www.dicks.com/investors. If the Company makes any amendments to either code of ethics other than technical, administrative, or other non-substantive amendments, or grants any waivers, including implicit waivers, from a provision of the Code of Conduct applicable to the Company's principal executive officer, principal financial officer, principal accounting officer or controller or persons performing similar functions, the Company will disclose the nature of the amendment or waiver, its effective date and to whom it applies on its website or in a Current Report on Form 8-K filed with the SEC. The Company's website does not form a part of this Annual Report on Form 10-K.
|
|
(e)
|
Information on our audit committee and audit committee financial experts will be set forth under the section entitled "Corporate Governance" in the
2019
Proxy Statement and is incorporated herein by reference.
|
ITEM 11. EXECUTIVE COMPENSATION
The information required by this Item is set forth under the sections entitled "Executive Compensation", "Compensation Tables", "Corporate Governance" and "Item 1 - Election of Directors" in the Company's
2019
Proxy Statement and is incorporated herein by reference. The information under the caption "Executive Compensation - Compensation Committee Report" shall not be deemed "soliciting material" or to be "filed" with the SEC, nor shall such information be incorporated by reference into a future filing under the Securities Act of 1933, as amended, or the Exchange Act, except to the extent the Company specifically incorporates the information by reference.
38
ITEM 12. SECURITY OWNERSHIP OF CERTAIN BENEFICIAL OWNERS AND MANAGEMENT AND RELATED SHAREHOLDER MATTERS
Part of the information required by this Item will be set forth under the caption "Stock Ownership" in the Company's
2019
Proxy Statement and is incorporated herein by reference. The following table summarizes information, as of
February 2, 2019
, for the equity compensation plans of the Company pursuant to which grants of options, restricted stock, restricted stock units or other rights to acquire shares may be granted from time-to-time:
|
Equity Compensation Plan Information
|
|||||||||||
|
Plan Category
|
Number of Securities to be Issued Upon Exercise of Outstanding Options, Warrants and Rights
(a)
|
Weighted Average Exercise Price of Outstanding Options, Warrants and Rights
(b)
|
Number of Securities Remaining Available for Future Issuance Under Equity Compensation Plans (Excluding Securities Reflected in Column (a))
(c)
|
||||||||
|
Equity compensation plans approved by security holders
(1)
|
3,130,427
|
|
(2)
|
$
|
45.65
|
|
6,089,337
|
|
(3)
|
||
|
Equity compensation plans not approved by security holders
|
—
|
|
|
|
—
|
|
|||||
|
Total
|
3,130,427
|
|
|
|
6,089,337
|
|
|||||
|
(1)
|
Represents outstanding awards pursuant to the Company's 2002 Amended and Restated Stock and Incentive Plan and 2012 Stock and Incentive Plan, as amended and restated (the "2012 Plan"). Represents shares of common stock. Shares of Class B Common Stock are not authorized for issuance under the 2012 Plan.
|
|
(2)
|
Upon adoption of the 2012 Plan, the common stock available under the 2002 Amended and Restated Stock and Incentive Plan became available for issuance under the 2012 Plan.
|
|
(3)
|
Shares of common stock that are subject to any award (e.g. options, stock appreciation rights, restricted stock, restricted stock units or performance stock) pursuant to the 2012 Plan will count against the aggregate number of shares of common stock that may be issued as one share for every share issued.
|
ITEM 13. CERTAIN RELATIONSHIPS AND RELATED TRANSACTIONS, AND DIRECTOR INDEPENDENCE
The information required by this Item will be set forth under the caption "Certain Relationships and Transactions with Related Persons" and "Election of Directors - How does the Board determine which directors are considered independent?" in the Company's
2019
Proxy Statement and is incorporated herein by reference.
ITEM 14. PRINCIPAL ACCOUNTANT FEES AND SERVICES
The information required by this Item will be set forth under the caption "Ratification of Independent Registered Public Accounting Firm – Audit and Non-Audit Fees and Independent Public Accountants" in the Company's
2019
Proxy Statement and is incorporated herein by reference.
39
PART IV
ITEM 15. EXHIBITS AND FINANCIAL STATEMENT SCHEDULES
|
(a)
|
The following documents are filed as part of this Annual Report on Form 10-K:
|
|
(1)
|
Financial Statements. The Consolidated Financial Statements required to be filed hereunder are listed in the Index to Consolidated Financial Statements on page 41 of this Annual Report on Form 10-K.
|
|
(2)
|
Financial Statement Schedule. The consolidated financial statement schedule to be filed hereunder is included on page 75 of this Annual Report on Form 10-K. Other schedules have not been included because they are not applicable or because the information is included elsewhere in this report.
|
|
(3)
|
Exhibits. The Exhibits listed in the Index to Exhibits, which appears on pages 70 to 72 and is incorporated herein by reference, are filed as part of this Annual Report on Form 10-K. Certain Exhibits are incorporated by reference from documents previously filed by the Company with the SEC pursuant to Rule 12b-32 under the Securities Exchange Act of 1934, as amended.
|
40
INDEX TO CONSOLIDATED FINANCIAL STATEMENTS
|
|
Page
|
|
41
REPORT OF INDEPENDENT REGISTERED PUBLIC ACCOUNTING FIRM
To the stockholders and Board of Directors of Dick's Sporting Goods, Inc.
Opinion on the Financial Statements
We have audited the accompanying consolidated balance sheets of Dick's Sporting Goods, Inc. and subsidiaries (the "Company") as of February 2, 2019 and February 3, 2018, the related consolidated statements of income, comprehensive income, changes in stockholders' equity, and cash flows, for each of the three years in the period ended February 2, 2019, and the related notes (collectively referred to as the "financial statements"). In our opinion, the financial statements present fairly, in all material respects, the financial position of the Company as of February 2, 2019 and February 3, 2018, and the results of its operations and its cash flows for each of the three years in the period ended February 2, 2019, in conformity with accounting principles generally accepted in the United States of America.
We have also audited, in accordance with the standards of the Public Company Accounting Oversight Board (United States) (PCAOB), the Company's internal control over financial reporting as of February 2, 2019, based on criteria established in
Internal Control - Integrated Framework (2013)
issued by the Committee of Sponsoring Organizations of the Treadway Commission and our report dated March 29, 2019, expressed an unqualified opinion on the Company's internal control over financial reporting.
Basis for Opinion
These financial statements are the responsibility of the Company's management. Our responsibility is to express an opinion on the Company's financial statements based on our audits. We are a public accounting firm registered with the PCAOB and are required to be independent with respect to the Company in accordance with the U.S. federal securities laws and the applicable rules and regulations of the Securities and Exchange Commission and the PCAOB.
We conducted our audits in accordance with the standards of the PCAOB. Those standards require that we plan and perform the audit to obtain reasonable assurance about whether the financial statements are free of material misstatement, whether due to error or fraud. Our audits included performing procedures to assess the risks of material misstatement of the financial statements, whether due to error or fraud, and performing procedures that respond to those risks. Such procedures included examining, on a test basis, evidence regarding the amounts and disclosures in the financial statements. Our audits also included evaluating the accounting principles used and significant estimates made by management, as well as evaluating the overall presentation of the financial statements. We believe that our audits provide a reasonable basis for our opinion.
/s/ Deloitte & Touche LLP
Pittsburgh, Pennsylvania
March 29, 2019
We have served as the Company's auditor since 1998.
42
DICK'S SPORTING GOODS, INC. AND SUBSIDIARIES
CONSOLIDATED STATEMENTS OF INCOME
(Amounts in thousands, except per share data)
|
|
Fiscal Year Ended
|
||||||||||
|
|
February 2,
2019 |
February 3,
2018 |
January 28,
2017 |
||||||||
|
Net sales
|
$
|
8,436,570
|
|
$
|
8,590,472
|
|
$
|
7,921,981
|
|
||
|
Cost of goods sold, including occupancy and distribution costs
|
5,998,788
|
|
6,101,412
|
|
5,556,198
|
|
|||||
|
GROSS PROFIT
|
2,437,782
|
|
2,489,060
|
|
2,365,783
|
|
|||||
|
Selling, general and administrative expenses
|
1,986,576
|
|
1,982,363
|
|
1,875,643
|
|
|||||
|
Pre-opening expenses
|
6,473
|
|
29,123
|
|
40,286
|
|
|||||
|
INCOME FROM OPERATIONS
|
444,733
|
|
477,574
|
|
449,854
|
|
|||||
|
Interest expense
|
10,248
|
|
8,047
|
|
5,856
|
|
|||||
|
Other expense (income)
|
2,565
|
|
(31,810
|
)
|
(14,424
|
)
|
|||||
|
INCOME BEFORE INCOME TAXES
|
431,920
|
|
501,337
|
|
458,422
|
|
|||||
|
Provision for income taxes
|
112,056
|
|
177,892
|
|
171,026
|
|
|||||
|
NET INCOME
|
$
|
319,864
|
|
$
|
323,445
|
|
$
|
287,396
|
|
||
|
EARNINGS PER COMMON SHARE:
|
|
|
|
||||||||
|
Basic
|
$
|
3.27
|
|
$
|
3.02
|
|
$
|
2.59
|
|
||
|
Diluted
|
$
|
3.24
|
|
$
|
3.01
|
|
$
|
2.56
|
|
||
|
WEIGHTED AVERAGE COMMON SHARES OUTSTANDING:
|
|
|
|
||||||||
|
Basic
|
97,743
|
|
106,977
|
|
111,095
|
|
|||||
|
Diluted
|
98,781
|
|
107,586
|
|
112,216
|
|
|||||
See accompanying notes to consolidated financial statements.
43
DICK'S SPORTING GOODS, INC. AND SUBSIDIARIES
CONSOLIDATED STATEMENTS OF COMPREHENSIVE INCOME
(Dollars in thousands)
|
|
Fiscal Year Ended
|
||||||||||
|
|
February 2,
2019 |
February 3,
2018 |
January 28,
2017 |
||||||||
|
NET INCOME
|
$
|
319,864
|
|
$
|
323,445
|
|
$
|
287,396
|
|
||
|
OTHER COMPREHENSIVE (LOSS) INCOME:
|
|
|
|||||||||
|
Foreign currency translation adjustment, net of tax
|
(42
|
)
|
54
|
|
47
|
|
|||||
|
TOTAL OTHER COMPREHENSIVE (LOSS) INCOME
|
(42
|
)
|
54
|
|
47
|
|
|||||
|
COMPREHENSIVE INCOME
|
$
|
319,822
|
|
$
|
323,499
|
|
$
|
287,443
|
|
||
See accompanying notes to consolidated financial statements.
44
DICK'S SPORTING GOODS, INC. AND SUBSIDIARIES
CONSOLIDATED BALANCE SHEETS
(Dollars in thousands, except share and per share data)
|
February 2,
2019 |
February 3,
2018 |
||||||
|
ASSETS
|
|
|
|||||
|
CURRENT ASSETS:
|
|
|
|||||
|
Cash and cash equivalents
|
$
|
113,653
|
|
$
|
101,253
|
|
|
|
Accounts receivable, net
|
37,970
|
|
60,107
|
|
|||
|
Income taxes receivable
|
6,135
|
|
4,433
|
|
|||
|
Inventories, net
|
1,824,696
|
|
1,711,103
|
|
|||
|
Prepaid expenses and other current assets
|
139,944
|
|
129,189
|
|
|||
|
Total current assets
|
2,122,398
|
|
2,006,085
|
|
|||
|
PROPERTY AND EQUIPMENT, NET
|
1,565,271
|
|
1,677,340
|
|
|||
|
INTANGIBLE ASSETS, NET
|
130,166
|
|
136,587
|
|
|||
|
GOODWILL
|
250,476
|
|
250,476
|
|
|||
|
OTHER ASSETS:
|
|
|
|||||
|
Deferred income taxes
|
13,243
|
|
13,639
|
|
|||
|
Other
|
105,595
|
|
119,812
|
|
|||
|
Total other assets
|
118,838
|
|
133,451
|
|
|||
|
TOTAL ASSETS
|
$
|
4,187,149
|
|
$
|
4,203,939
|
|
|
|
LIABILITIES AND STOCKHOLDERS' EQUITY
|
|
|
|||||
|
CURRENT LIABILITIES:
|
|
|
|||||
|
Accounts payable
|
$
|
889,908
|
|
$
|
843,075
|
|
|
|
Accrued expenses
|
364,342
|
|
354,181
|
|
|||
|
Deferred revenue and other liabilities
|
224,984
|
|
212,080
|
|
|||
|
Income taxes payable
|
20,142
|
|
10,476
|
|
|||
|
Current portion of other long-term debt and leasing obligations
|
5,263
|
|
5,202
|
|
|||
|
Total current liabilities
|
1,504,639
|
|
1,425,014
|
|
|||
|
LONG-TERM LIABILITIES:
|
|
|
|||||
|
Other long-term debt and leasing obligations
|
54,781
|
|
60,084
|
|
|||
|
Deferred income taxes
|
11,776
|
|
10,232
|
|
|||
|
Deferred rent and other liabilities
|
711,792
|
|
767,108
|
|
|||
|
Total long-term liabilities
|
778,349
|
|
837,424
|
|
|||
|
COMMITMENTS AND CONTINGENCIES
|
|
|
|||||
|
STOCKHOLDERS' EQUITY:
|
|
|
|||||
|
Preferred stock, par value $0.01 per share, authorized shares 5,000,000; none issued and outstanding
|
—
|
|
—
|
|
|||
|
Common stock, par value $0.01 per share, authorized shares 200,000,000; issued shares 110,734,156 and 110,175,392 at February 2, 2019 and February 3, 2018, respectively; outstanding shares 69,304,874 and 78,317,898 at February 2, 2019 and February 3, 2018, respectively
|
693
|
|
783
|
|
|||
|
Class B common stock, par value, $0.01 per share, authorized shares 40,000,000; issued and outstanding shares 24,541,123 and 24,710,870 at February 2, 2019 and February 3, 2018, respectively
|
245
|
|
247
|
|
|||
|
Additional paid-in capital
|
1,214,287
|
|
1,177,778
|
|
|||
|
Retained earnings
|
2,455,192
|
|
2,205,651
|
|
|||
|
Accumulated other comprehensive loss
|
(120
|
)
|
(78
|
)
|
|||
|
Treasury stock, at cost, 41,429,482 and 31,857,494 at February 2, 2019 and February 3, 2018, respectively
|
(1,766,136
|
)
|
(1,442,880
|
)
|
|||
|
Total stockholders' equity
|
1,904,161
|
|
1,941,501
|
|
|||
|
TOTAL LIABILITIES AND STOCKHOLDERS' EQUITY
|
$
|
4,187,149
|
|
$
|
4,203,939
|
|
|
See accompanying notes to consolidated financial statements.
45
DICK'S SPORTING GOODS, INC. AND SUBSIDIARIES
CONSOLIDATED STATEMENTS OF CHANGES IN STOCKHOLDERS' EQUITY
(Dollars in thousands)
|
Class B
Common Stock
|
|||||||||||||||||||||||||||||||||
|
|
Common Stock
|
Additional
Paid-In
Capital
|
Retained
Earnings
|
Accumulated Other Comprehensive Loss
|
Treasury
Stock
|
Total
|
|||||||||||||||||||||||||||
|
|
Shares
|
Dollars
|
Shares
|
Dollars
|
|||||||||||||||||||||||||||||
|
BALANCE, January 30, 2016
|
86,850,630
|
|
$
|
869
|
|
24,900,870
|
|
$
|
249
|
|
$
|
1,063,705
|
|
$
|
1,737,214
|
|
$
|
(179
|
)
|
$
|
(1,012,671
|
)
|
$
|
1,789,187
|
|
||||||||
|
Exchange of Class B common stock for common stock
|
190,000
|
|
2
|
|
(190,000
|
)
|
(2
|
)
|
—
|
|
—
|
|
—
|
|
—
|
|
—
|
|
|||||||||||||||
|
Exercise of stock options
|
1,421,389
|
|
13
|
|
—
|
|
—
|
|
31,076
|
|
—
|
|
—
|
|
—
|
|
31,089
|
|
|||||||||||||||
|
Restricted stock vested
|
438,160
|
|
4
|
|
—
|
|
—
|
|
(4
|
)
|
—
|
|
—
|
|
—
|
|
—
|
|
|||||||||||||||
|
Minimum tax withholding requirements
|
(149,347
|
)
|
(1
|
)
|
—
|
|
—
|
|
(7,059
|
)
|
—
|
|
—
|
|
—
|
|
(7,060
|
)
|
|||||||||||||||
|
Net income
|
—
|
|
—
|
|
—
|
|
—
|
|
—
|
|
287,396
|
|
—
|
|
—
|
|
287,396
|
|
|||||||||||||||
|
Stock-based compensation
|
—
|
|
—
|
|
—
|
|
—
|
|
33,602
|
|
—
|
|
—
|
|
—
|
|
33,602
|
|
|||||||||||||||
|
Total tax benefit from exercise of stock options
|
—
|
|
—
|
|
—
|
|
—
|
|
9,510
|
|
—
|
|
—
|
|
—
|
|
9,510
|
|
|||||||||||||||
|
Foreign currency translation adjustment, net of taxes of $28
|
—
|
|
—
|
|
—
|
|
—
|
|
—
|
|
—
|
|
47
|
|
—
|
|
47
|
|
|||||||||||||||
|
Purchase of shares for treasury
|
(3,130,954
|
)
|
(31
|
)
|
—
|
|
—
|
|
—
|
|
—
|
|
—
|
|
(145,707
|
)
|
(145,738
|
)
|
|||||||||||||||
|
Cash dividends declared, $0.605 per common share
|
—
|
|
—
|
|
—
|
|
—
|
|
—
|
|
(68,544
|
)
|
—
|
|
—
|
|
(68,544
|
)
|
|||||||||||||||
|
BALANCE, January 28, 2017
|
85,619,878
|
|
$
|
856
|
|
24,710,870
|
|
$
|
247
|
|
$
|
1,130,830
|
|
$
|
1,956,066
|
|
$
|
(132
|
)
|
$
|
(1,158,378
|
)
|
$
|
1,929,489
|
|
||||||||
|
Adju
stment for cumulative effect from change in accounting principle (ASU 2016-16)
|
—
|
|
—
|
|
—
|
|
—
|
|
—
|
|
(1,744
|
)
|
—
|
|
—
|
|
(1,744
|
)
|
|||||||||||||||
|
Exercise of stock options
|
582,022
|
|
6
|
|
—
|
|
—
|
|
16,552
|
|
—
|
|
—
|
|
—
|
|
16,558
|
|
|||||||||||||||
|
Restricted stock vested
|
359,956
|
|
3
|
|
—
|
|
—
|
|
(3
|
)
|
—
|
|
—
|
|
—
|
|
—
|
|
|||||||||||||||
|
Minimum tax withholding requirements
|
(121,681
|
)
|
(1
|
)
|
—
|
|
—
|
|
(5,840
|
)
|
—
|
|
—
|
|
—
|
|
(5,841
|
)
|
|||||||||||||||
|
Net income
|
—
|
|
—
|
|
—
|
|
—
|
|
—
|
|
323,445
|
|
—
|
|
—
|
|
323,445
|
|
|||||||||||||||
|
Stock-based compensation
|
—
|
|
—
|
|
—
|
|
—
|
|
36,239
|
|
—
|
|
—
|
|
—
|
|
36,239
|
|
|||||||||||||||
|
Foreign currency translation adjustment, net of taxes of $30
|
—
|
|
—
|
|
—
|
|
—
|
|
—
|
|
—
|
|
54
|
|
—
|
|
54
|
|
|||||||||||||||
|
Purchase of shares for treasury
|
(8,122,277
|
)
|
(81
|
)
|
—
|
|
—
|
|
—
|
|
—
|
|
—
|
|
(284,502
|
)
|
(284,583
|
)
|
|||||||||||||||
|
Cash dividends declared, $0.68 per common share
|
—
|
|
—
|
|
—
|
|
—
|
|
—
|
|
(72,116
|
)
|
—
|
|
—
|
|
(72,116
|
)
|
|||||||||||||||
|
BALANCE, February 3, 2018
|
78,317,898
|
|
$
|
783
|
|
24,710,870
|
|
$
|
247
|
|
$
|
1,177,778
|
|
$
|
2,205,651
|
|
$
|
(78
|
)
|
$
|
(1,442,880
|
)
|
$
|
1,941,501
|
|
||||||||
|
Adju
stment for cumulative effect from change in accounting principle (ASU 2014-09)
|
—
|
|
—
|
|
—
|
|
—
|
|
—
|
|
20,488
|
|
—
|
|
—
|
|
20,488
|
|
|||||||||||||||
|
Exch
ange of Class B common stock for common stock
|
169,747
|
|
2
|
|
(169,747
|
)
|
(2
|
)
|
—
|
|
—
|
|
—
|
|
—
|
|
—
|
|
|||||||||||||||
|
Rest
ricted stock vested
|
549,293
|
|
5
|
|
—
|
|
—
|
|
(5
|
)
|
—
|
|
—
|
|
—
|
|
—
|
|
|||||||||||||||
|
Minimum tax withholding requirements
|
(160,276
|
)
|
(1
|
)
|
—
|
|
—
|
|
(5,427
|
)
|
—
|
|
—
|
|
—
|
|
(5,428
|
)
|
|||||||||||||||
|
Net income
|
—
|
|
—
|
|
—
|
|
—
|
|
—
|
|
319,864
|
|
—
|
|
—
|
|
319,864
|
|
|||||||||||||||
|
Stock-based compensation
|
—
|
|
—
|
|
—
|
|
—
|
|
41,941
|
|
—
|
|
—
|
|
—
|
|
41,941
|
|
|||||||||||||||
|
Foreign currency translation adjustment, net of taxes of $13
|
—
|
|
—
|
|
—
|
|
—
|
|
—
|
|
—
|
|
(42
|
)
|
—
|
|
(42
|
)
|
|||||||||||||||
|
Purchase of shares for treasury
|
(9,571,788
|
)
|
(96
|
)
|
—
|
|
—
|
|
—
|
|
—
|
|
—
|
|
(323,256
|
)
|
(323,352
|
)
|
|||||||||||||||
|
Cash dividends declared, $0.90 per common share
|
—
|
|
—
|
|
—
|
|
—
|
|
—
|
|
(90,811
|
)
|
—
|
|
—
|
|
(90,811
|
)
|
|||||||||||||||
|
BALANCE, February 2, 2019
|
69,304,874
|
|
$
|
693
|
|
24,541,123
|
|
$
|
245
|
|
$
|
1,214,287
|
|
$
|
2,455,192
|
|
$
|
(120
|
)
|
$
|
(1,766,136
|
)
|
$
|
1,904,161
|
|
||||||||
See accompanying notes to consolidated financial statements.
46
DICK'S SPORTING GOODS, INC. AND SUBSIDIARIES
CONSOLIDATED STATEMENTS OF CASH FLOWS
(Dollars in thousands)
|
|
Fiscal Year Ended
|
||||||||||
|
|
February 2,
2019 |
February 3,
2018 |
January 28,
2017 |
||||||||
|
CASH FLOWS FROM OPERATING ACTIVITIES:
|
|
|
|
||||||||
|
Net income
|
$
|
319,864
|
|
$
|
323,445
|
|
$
|
287,396
|
|
||
|
Adjustments to reconcile net income to net cash provided by operating activities:
|
|
|
|
||||||||
|
Depreciation and amortization
|
243,830
|
|
237,651
|
|
233,834
|
|
|||||
|
Deferred income taxes
|
(5,258
|
)
|
42,453
|
|
(45,036
|
)
|
|||||
|
Stock-based compensation
|
41,941
|
|
36,239
|
|
33,602
|
|
|||||
|
Other non-cash items
|
934
|
|
5,327
|
|
721
|
|
|||||
|
Changes in assets and liabilities:
|
|
|
|
||||||||
|
Accounts receivable
|
16,215
|
|
(208
|
)
|
(4,125
|
)
|
|||||
|
Inventories
|
(94,131
|
)
|
(71,751
|
)
|
(84,733
|
)
|
|||||
|
Prepaid expenses and other assets
|
10,980
|
|
(29,072
|
)
|
(2,282
|
)
|
|||||
|
Accounts payable
|
125,632
|
|
124,628
|
|
59,870
|
|
|||||
|
Accrued expenses
|
21,372
|
|
13,597
|
|
64,469
|
|
|||||
|
Income taxes payable / receivable
|
7,964
|
|
(39,347
|
)
|
26,034
|
|
|||||
|
Deferred construction allowances
|
27,730
|
|
101,712
|
|
179,864
|
|
|||||
|
Deferred revenue and other liabilities
|
(4,318
|
)
|
1,636
|
|
19,380
|
|
|||||
|
Net cash provided by operating activities
|
712,755
|
|
746,310
|
|
768,994
|
|
|||||
|
CASH FLOWS FROM INVESTING ACTIVITIES:
|
|
|
|
||||||||
|
Capital expenditures
|
(198,219
|
)
|
(474,347
|
)
|
(421,920
|
)
|
|||||
|
Acquisitions, net of cash acquired
|
—
|
|
(8,957
|
)
|
(118,769
|
)
|
|||||
|
Deposits and purchases of other assets
|
—
|
|
(2,344
|
)
|
(9,635
|
)
|
|||||
|
Net cash used in investing activities
|
(198,219
|
)
|
(485,648
|
)
|
(550,324
|
)
|
|||||
|
CASH FLOWS FROM FINANCING ACTIVITIES:
|
|
|
|
||||||||
|
Revolving credit borrowings
|
1,875,400
|
|
2,742,800
|
|
2,159,600
|
|
|||||
|
Revolving credit repayments
|
(1,875,400
|
)
|
(2,742,800
|
)
|
(2,159,600
|
)
|
|||||
|
Proceeds from term loan
|
—
|
|
62,492
|
|
—
|
|
|||||
|
Payments on other long-term debt and leasing obligations
|
(5,242
|
)
|
(2,531
|
)
|
(588
|
)
|
|||||
|
Construction allowance receipts
|
—
|
|
—
|
|
—
|
|
|||||
|
Proceeds from exercise of stock options
|
—
|
|
16,558
|
|
31,089
|
|
|||||
|
Minimum tax withholding requirements
|
(5,428
|
)
|
(5,841
|
)
|
(7,060
|
)
|
|||||
|
Cash paid for treasury stock
|
(323,352
|
)
|
(284,583
|
)
|
(145,738
|
)
|
|||||
|
Cash dividends paid to stockholders
|
(89,273
|
)
|
(73,099
|
)
|
(67,972
|
)
|
|||||
|
(Decrease) increase in bank overdraft
|
(78,799
|
)
|
(37,236
|
)
|
17,393
|
|
|||||
|
Net cash used in financing activities
|
(502,094
|
)
|
(324,240
|
)
|
(172,876
|
)
|
|||||
|
EFFECT OF EXCHANGE RATE CHANGES ON CASH AND CASH EQUIVALENTS
|
(42
|
)
|
54
|
|
47
|
|
|||||
|
NET INCREASE (DECREASE) IN CASH AND CASH EQUIVALENTS
|
12,400
|
|
(63,524
|
)
|
45,841
|
|
|||||
|
CASH AND CASH EQUIVALENTS, BEGINNING OF PERIOD
|
101,253
|
|
164,777
|
|
118,936
|
|
|||||
|
CASH AND CASH EQUIVALENTS, END OF PERIOD
|
$
|
113,653
|
|
$
|
101,253
|
|
$
|
164,777
|
|
||
|
Supplemental disclosure of cash flow information:
|
|
|
|
||||||||
|
Accrued property and equipment
|
$
|
18,937
|
|
$
|
29,834
|
|
$
|
70,129
|
|
||
|
Cash paid during the year for interest
|
$
|
9,317
|
|
$
|
8,598
|
|
$
|
4,983
|
|
||
|
Cash paid during the year for income taxes
|
$
|
114,018
|
|
$
|
185,798
|
|
$
|
196,712
|
|
||
See accompanying notes to consolidated financial statements.
47
DICK'S SPORTING GOODS, INC. AND SUBSIDIARIES
NOTES TO CONSOLIDATED FINANCIAL STATEMENTS
1. Basis of Presentation and Summary of Significant Accounting Policies
Operations –
Dick's Sporting Goods, Inc. (together with its subsidiaries, referred to as "the Company", "we", "us" and "our" unless specified otherwise) is a leading omni-channel sporting goods retailer offering an extensive assortment of authentic, high-quality sports equipment, apparel, footwear and accessories through a blend of dedicated associates, in-store services and unique specialty shop-in-shops. The Company also owns and operates Golf Galaxy and Field & Stream stores, and Dick's Team Sports HQ, an all-in-one youth sports digital platform offering scheduling, communications and live scorekeeping through its GameChanger mobile apps, free league management services, custom uniforms and fan wear, and access to donations and sponsorships. The Company offers its products through a content-rich eCommerce platform that is integrated with its store network and provides customers with the convenience and expertise of a 24-hour storefront.
Fiscal Year –
The Company's fiscal year ends on the Saturday closest to the end of January. Fiscal years
2018
,
2017
and
2016
ended on
February 2, 2019
,
February 3, 2018
and
January 28, 2017
, respectively. All fiscal years presented include 52 weeks of operations except fiscal 2017, which included 53 weeks.
Principles of Consolidation –
The Consolidated Financial Statements include Dick's Sporting Goods, Inc. and its wholly-owned subsidiaries. All intercompany accounts and transactions have been eliminated in consolidation.
Use of Estimates in the Preparation of Financial Statements –
The preparation of financial statements in conformity with accounting principles generally accepted in the United States of America ("U.S. GAAP") requires management to make estimates and assumptions that affect the reported amounts of assets and liabilities and disclosure of contingent assets and liabilities at the date of the financial statements and the reported amounts of revenues and expenses during the reporting period. Actual results could differ from those estimates.
Cash and Cash Equivalents –
Cash and cash equivalents consist of cash on hand and all highly liquid instruments purchased with a maturity of three months or less at the date of purchase. Cash equivalents are considered Level 1 investments and totaled
$33.8 million
and
$21.0 million
at
February 2, 2019
and
February 3, 2018
, respectively.
Cash Management –
The Company's cash management system provides for the reimbursement of all major bank disbursement accounts on a daily basis. Accounts payable at
February 2, 2019
and
February 3, 2018
include
$36.4 million
and
$115.2 million
, respectively, of checks drawn in excess of cash balances not yet presented for payment.
Accounts Receivable –
Accounts receivable consist principally of amounts receivable from vendors and landlords. The
allowance for doubtful accounts totaled
$3.0 million
and
$3.5 million
at
February 2, 2019
and
February 3, 2018
, respectively.
Inventories –
Inventories are stated at the lower of weighted average cost and net realizable value. Inventory costs consist of the direct cost of merchandise including freight. Inventories are net of shrinkage, obsolescence, other valuation accounts and vendor allowances totaling
$113.3 million
and
$154.5 million
at
February 2, 2019
and
February 3, 2018
, respectively.
Property and Equipment –
Property and equipment are recorded at cost and include capitalized leases. For financial reporting purposes, depreciation and amortization are computed using the straight-line method over the following estimated useful lives:
|
Buildings
|
40 years
|
|
|
Leasehold improvements
|
10-25 years
|
|
|
Furniture, fixtures and equipment
|
3-7 years
|
|
|
Computer software
|
3-10 years
|
|
For leasehold improvements and property and equipment under capital lease agreements, depreciation and amortization are calculated using the straight-line method over the shorter of the estimated useful lives of the assets or the lease term. Leasehold improvements made significantly after the initial lease term are depreciated over the shorter of their estimated useful lives or the remaining lease term, including renewal periods, if reasonably assured. Depreciation expense was
$223.2 million
,
$214.9 million
and
$203.1 million
for fiscal
2018
,
2017
and
2016
, respectively.
Renewals and betterments are capitalized and repairs and maintenance are expensed as incurred.
48
|
DICK'S SPORTING GOODS, INC. AND SUBSIDIARIES
NOTES TO CONSOLIDATED FINANCIAL STATEMENTS – (Continued)
|
||
Impairment of Long-Lived Assets and Closed Store Reserves –
The Company evaluates its long-lived assets to assess whether the carrying values have been impaired whenever events and circumstances indicate that the carrying value of these assets may not be recoverable based on estimated undiscounted future cash flows. An impairment loss is recognized when the estimated undiscounted cash flows expected to result from the use of the asset plus eventual net proceeds expected from disposition of the asset, if any, are less than the carrying value of the asset. When an impairment loss is recognized, the carrying amount of the asset is reduced to its estimated fair value as determined based on quoted market prices or through the use of other valuation techniques. The related expense is recorded within selling, general and administrative expenses on the Consolidated Statements of Income.
The Company recognizes a liability for costs associated with closed or relocated premises when the Company ceases to use the location. The calculation of accrued lease termination and other costs primarily includes future minimum lease payments, maintenance costs and taxes from the date of closure or relocation to the end of the remaining lease term, net of contractual or estimated sublease income. The liability is discounted using a credit-adjusted risk-free rate of interest. The assumptions used in the calculation of the accrued lease termination and other costs are evaluated on a quarterly basis. The current portion of accrued store closing and relocation reserves is included within accrued expenses and the non-current portion is included within long-term deferred rent and other liabilities on the Consolidated Balance Sheets. The related expense is recorded within selling, general and administrative expenses on the Consolidated Statements of Income.
Goodwill –
Goodwill represents the excess of acquisition cost over the fair value of the net assets of acquired entities. The Company assesses the carrying value of goodwill annually or whenever circumstances indicate that a decline in value may have occurred.
The Company's goodwill impairment test compares the fair value of each reporting unit to its carrying value. The Company determines the fair value of its reporting units using a combination of a discounted cash flow and a market value approach. If the fair value of the reporting unit exceeds the carrying value of the net assets assigned to that reporting unit, goodwill is not impaired. If the carrying value of the net assets assigned to the reporting unit exceeds the fair value of the reporting unit, an impairment charge to selling, general and administrative expenses is recorded to reduce the carrying value to the fair value. A reporting unit is the operating segment, or a business unit one level below that operating segment, for which discrete financial information is prepared and regularly reviewed by management.
Intangible Assets –
Intangible assets consist primarily of trademarks and acquired trade names with indefinite lives, which are tested for impairment annually or whenever circumstances indicate that a decline in value may have occurred. The Company estimates the fair value of these intangible assets based on an income approach using the relief-from-royalty method. The Company's finite-lived intangible assets consist primarily of customer lists, favorable lease assets and other acquisition-related assets. Finite-lived intangible assets are amortized over their estimated useful economic lives and are reviewed for impairment when factors indicate that an impairment may have occurred. The Company recognizes an impairment charge when the estimated fair value of the intangible asset is less than the carrying value.
Self-Insurance –
The Company is self-insured for certain losses related to health, workers' compensation and general liability insurance, although we maintain stop-loss coverage with third-party insurers to limit our liability exposure. Liabilities associated with these losses are estimated in part by considering historical claims experience, industry factors, severity factors and other actuarial assumptions.
Pre-opening Expenses –
Pre-opening expenses, which consist primarily of rent, marketing, payroll and recruiting costs, are expensed as incurred. Rent is recognized within pre-opening expense from the date the Company takes possession of a site through the date of store opening.
Earnings Per Common Share –
Basic earnings per common share is computed based on the weighted average number of shares of common stock outstanding during the period. Diluted earnings per common share is computed based on the weighted average number of shares of common stock, plus the effect of dilutive potential common shares outstanding during the period, using the treasury stock method. Dilutive potential common shares include outstanding stock options, restricted stock and warrants.
49
|
DICK'S SPORTING GOODS, INC. AND SUBSIDIARIES
NOTES TO CONSOLIDATED FINANCIAL STATEMENTS – (Continued)
|
||
Stock-Based Compensation –
The Company has the ability to grant restricted shares of common stock, restricted stock units and stock options to purchase common stock under the Dick's Sporting Goods, Inc. 2012 Stock and Incentive Plan, as Amended and Restated (the "2012 Plan"). The Company records stock-based compensation expenses based on the fair value of stock awards at the grant date and recognizes the expense over the related service period.
Income Taxes –
The Company utilizes the asset and liability method of accounting for income taxes and provides deferred income taxes for temporary differences between the amounts reported for assets and liabilities for financial statement purposes and for income tax reporting purposes, using enacted tax rates in effect in the years in which the differences are expected to reverse. The Company recognizes the tax benefit from an uncertain tax position only if it is more likely than not that the tax position will be sustained on examination by the relevant taxing authorities, based on the technical merits of the position. The tax benefits recognized in the Consolidated Financial Statements from such a position are measured based on the largest benefit that will more likely than not be realized upon ultimate settlement. Interest and penalties from income tax matters are recognized in income tax expense.
Revenue Recognition –
Revenue is recognized upon satisfaction of all contractual performance obligations and transfer of control to the customer. Revenue is measured as the amount of consideration the Company expects to be entitled to in exchange for corresponding goods or services. Substantially all of the Company's sales are single performance obligation arrangements for retail sale transactions for which the transaction price is equivalent to the stated price of the product or service, net of any stated discounts applicable at a point in time. Each sales transaction results in an implicit contract with the customer to deliver a product or service at the point of sale. Revenue from retail sales is recognized at the point of sale, net of sales tax. Revenue from eCommerce sales, including vendor-direct sales arrangements, is recognized upon shipment of merchandise. A provision for anticipated merchandise returns is provided through a reduction of sales and cost of goods sold in the period that the related sales are recorded.
Revenue from gift cards and returned merchandise credits (collectively the "cards") is deferred and recognized upon the redemption of the cards. These cards have no expiration date. Income from unredeemed cards is recognized on the Consolidated Statements of Income within net sales in proportion to the pattern of rights exercised by the customer in future periods. The Company performs an evaluation of historical redemption patterns from the date of original issuance to estimate future period redemption activity.
Cost of Goods Sold –
Cost of goods sold includes: the cost of merchandise (inclusive of vendor allowances, inventory shrinkage and inventory write-downs for the lower of cost and net realizable value); freight; distribution; shipping; and store occupancy costs. The Company defines merchandise margin as net sales less the cost of merchandise sold. Store occupancy costs include rent, common area maintenance charges, real estate and other asset-based taxes, general maintenance, utilities, depreciation and certain insurance expenses.
Selling, General and Administrative Expenses –
Selling, general and administrative expenses include store and field support payroll and fringe benefits, advertising, bank card charges, operating costs associated with the Company's internal eCommerce platform, information systems, marketing, legal, accounting, other store expenses and all expenses associated with operating the Company's Customer Support Center ("CSC").
Advertising Costs –
Production costs for all forms of advertising and the costs to run the advertisements are expensed the first time the advertisement takes place. Advertising expense, net of cooperative advertising, was
$322.2 million
,
$330.1 million
and
$304.9 million
for fiscal
2018
,
2017
and
2016
, respectively.
Business Development Allowances –
Business development allowances include allowances, rebates and cooperative advertising funds received from vendors. These funds are determined for each fiscal year and the majority are based on various quantitative contract terms. Amounts expected to be received from vendors for the purchase of merchandise inventories ("vendor allowances") are recognized as a reduction of cost of goods sold as the merchandise is sold. Amounts that represent a reimbursement of costs incurred, such as advertising ("cooperative advertising"), are recorded as a reduction to the related expense in the period that the related expense is incurred. The Company records an estimate of earned allowances based on the latest projected purchase volumes and advertising forecasts.
50
|
DICK'S SPORTING GOODS, INC. AND SUBSIDIARIES
NOTES TO CONSOLIDATED FINANCIAL STATEMENTS – (Continued)
|
||
Segment Information –
The Company is a specialty omni-channel retailer that offers a broad range of products in its specialty retail stores primarily in the eastern United States. Given the economic characteristics of the store formats, the similar nature of the products sold, the type of customer and method of distribution, the Company's operating segments are aggregated within
one
reportable segment. Refer to Note 17 to the Consolidated Financial Statements herein for additional disclosure of net sales by merchandise category.
Construction Allowances –
All of the Company's store locations are leased. The Company may receive reimbursement from a landlord for some of the cost of the structure, subject to satisfactory fulfillment of applicable lease provisions. These reimbursements may be referred to as tenant allowances, construction allowances or landlord reimbursements ("construction allowances").
The Company's accounting for construction allowances differs if the Company is deemed to be the owner of the asset during the construction period. Some of the Company's leases have a cap on the construction allowance, which places the Company at risk for cost overruns and causes the Company to be deemed the owner during the construction period. In instances where the Company is not deemed to be the owner during the construction period, reimbursement from a landlord for tenant improvements is classified as an incentive and included within deferred revenue and other liabilities on the Consolidated Balance Sheets. The deferred rent credit is amortized as rent expense on a straight-line basis over the term of the lease. Landlord reimbursements from these transactions are included in cash flows from operating activities as a change in deferred construction allowances.
In cases where the Company is deemed to be the owner during the construction period, a sale and leaseback of the asset occurs when construction of the asset is complete and the lease term begins, if relevant sale-leaseback accounting criteria are met. Any gain or loss from the transaction is included within deferred revenue and other liabilities on the Consolidated Balance Sheets and deferred and amortized as rent expense on a straight-line basis over the term of the lease. The Company reports the amount of cash received for the construction allowance as construction allowance receipts within the financing activities section of its Consolidated Statements of Cash Flows when such allowances are received prior to completion of the sale-leaseback transaction. The Company reports the amount of cash received from construction allowances as proceeds from sale leaseback transactions within the investing activities section of its Consolidated Statements of Cash Flows when such amounts are received after the sale-leaseback accounting criteria have been achieved.
Leases –
Escalating rent payments, rent abatements and rent holidays are considered in the calculation of minimum lease payments in the Company's capital lease tests and in determining straight-line rent expense for operating leases. The Company records any difference between the straight-line rent amount and amounts payable under the lease as part of deferred rent within long-term deferred rent and other liabilities on the Consolidated Balance Sheets.
Contingent payments based upon sales and future increases determined by inflation-related indices cannot be estimated at the inception of the lease and accordingly, are charged to operations as incurred. The Company records contingent rent within accrued expenses on the Consolidated Balance Sheets.
51
|
DICK'S SPORTING GOODS, INC. AND SUBSIDIARIES
NOTES TO CONSOLIDATED FINANCIAL STATEMENTS – (Continued)
|
||
Recently Adopted Accounting Pronouncements
Income Taxes
In March 2018, the Financial Accounting Standards Board ("FASB") issued Accounting Standards Update ("ASU") 2018-05,
"Income Taxes (Topic 740): Amendments to SEC Paragraphs Pursuant to SEC Staff Accounting Bulletin No. 118."
This update provides guidance on income tax accounting implications under the Tax Cuts and Jobs Act (the "Tax Act"), which was enacted on December 22, 2017. Areas of clarification under the update are the measurement period time frame, changes in subsequent reporting periods, and reporting requirements as they relate to the Tax Act. The Company adopted ASU 2018-05 during the first quarter of fiscal 2018. The Company recorded provisional charges as a result of the Tax Act, as noted within Note 11 to the Consolidated Financial Statements of the Company's Annual Report on Form 10-K for the fiscal year ended February 3, 2018, for which the Company's reviews have been completed without any significant adjustments required during fiscal 2018. The adoption of this guidance did not have a significant impact on the Company's Consolidated Financial Statements. Refer to Note 11 to the Company's Consolidated Financial Statements herein for additional information.
Stock Compensation
In May 2017, the FASB issued ASU 2017-09,
"Compensation - Stock Compensation (Topic 718): Scope of Modification Accounting."
This update clarifies the changes to terms or conditions of a share-based payment award that require an entity to apply modification accounting. ASU 2017-09 is effective for annual reporting periods, and interim periods therein, beginning after December 15, 2017. Early application is permitted and prospective application is required. The Company adopted ASU 2017-09 during the first quarter of fiscal 2018. The adoption of this guidance did not have a significant impact on the Company's Consolidated Financial Statements.
Intangibles - Goodwill and Other
In January 2017, the FASB issued ASU 2017-04,
"Intangibles - Goodwill and Other (Topic 350): Simplifying the Test of Goodwill Impairment."
This update modifies the concept of impairment and simplifies how an entity is required to test goodwill for impairment by eliminating Step 2 from the goodwill impairment test. ASU 2017-04 is effective for interim or annual goodwill impairment tests during fiscal years beginning after December 15, 2019. Early application is permitted and prospective application is required. The Company elected to early adopt ASU 2017-04 during the first quarter of fiscal 2018. The adoption of this guidance did not have a significant impact on the Company's Consolidated Financial Statements.
Contracts with Customers
In May 2014, the FASB issued ASU 2014-09,
"Revenue from Contracts with Customers."
This update requires an entity to recognize revenue to depict the transfer of promised goods or services to customers in an amount that reflects the consideration to which the entity expects to be entitled in exchange for those goods or services. Additionally, the update (1) specifies the accounting for some costs to obtain or fulfill a contract with a customer and (2) expands disclosure requirements related to revenue and cash flows arising from contracts with customers. In August 2015, the FASB issued ASU 2015-14,
"Revenue from Contracts with Customers - Deferral of the Effective Date"
, which approved a one year deferral of ASU 2014-09 for annual reporting periods beginning after December 15, 2017, including interim periods within that reporting period. Subsequent to the issuance of ASU 2014-09 and ASU 2015-14, the FASB has also issued additional ASUs to assist in clarifying guidance within ASU 2014-09. These updates permit the use of either the full retrospective or modified retrospective transition method. Early application is permitted as of the original effective date for annual reporting periods beginning after December 15, 2016, including interim reporting periods within that reporting period. The Company adopted these ASUs during the first quarter of fiscal 2018. The adoption of these ASUs did not have a significant impact on our Consolidated Financial Statements. Refer to Note 17 to the Company's Consolidated Financial Statements herein for additional information.
52
|
DICK'S SPORTING GOODS, INC. AND SUBSIDIARIES
NOTES TO CONSOLIDATED FINANCIAL STATEMENTS – (Continued)
|
||
Recently Issued Accounting Pronouncement
Leases
In February 2016, the FASB issued ASU 2016-02,
"Leases (Topic 842)."
This update requires an entity to recognize lease assets and lease liabilities on the balance sheet and to disclose key information about the entity's leasing arrangements. ASU 2016-02 is effective for annual reporting periods, and interim periods therein, beginning after December 15, 2018, with early application permitted. A modified retrospective approach is permitted. In July 2018, the FASB issued ASU 2018-10,
"Codification Improvements to Topic 842, Leases,"
and ASU 2018-11,
"Leases (Topic 842), Targeted Improvements,"
which affect certain aspects of the previously issued guidance. Amendments include an additional transition method that allows entities to apply the new standard on the adoption date and recognize a cumulative effect adjustment to the opening balance of retained earnings, as well as a new practical expedient for lessors. The effective date and transition requirements for ASU 2018-10 and ASU 2018-11 are the same as ASU 2016-02. Early adoption is permitted.
The Company will adopt these ASUs during the first quarter of fiscal 2019 using the optional transition method, which allows for prospective application of the standard. We have completed the upgrade of our existing lease management technology solution to facilitate adoption of these ASUs in fiscal 2019. The Company will elect the package of practical expedients permitted under the transition guidance within the new standard, which among other things, allows us to carryforward our historical lease classification, in addition to electing the practical expedient surrounding land easements.
The Company has lease agreements with non-lease components that relate to the lease components. Non-lease components, and the lease components to which they relate, will be accounted for together as a single lease component for all classes of underlying assets. We will also elect to exclude leases with an initial term of twelve months or less from the Consolidated Balance Sheets.
We estimate adoption of the standard will result in recognition of additional net lease assets and lease liabilities of approximately
$2,300.0 million
, respectively, as of February 3, 2019. The difference between these amounts will be recorded as an adjustment to fiscal 2019 beginning retained earnings. The adoption of these ASUs will not have a significant impact on the Company's Consolidated Statement of Income.
2. Goodwill and Other Intangible Assets
The following table summarizes the carrying amount of goodwill and accumulated impairment charges as of the end of the fiscal periods (in thousands):
|
2018
|
2017
|
||||||||||||||
|
Carrying Value
|
Accumulated Impairment
|
Carrying Value
|
Accumulated Impairment
|
||||||||||||
|
Goodwill
|
$
|
250,476
|
|
$
|
111,312
|
|
$
|
250,476
|
|
$
|
111,312
|
|
|||
No
impairment charges were recorded against goodwill in fiscal
2018
,
2017
or
2016
.
The Company had indefinite-lived and finite-lived intangible assets of
$111.0 million
and
$19.1 million
, respectively, as of February 2, 2019 and
$111.0 million
and
$25.6 million
, respectively, as of
February 3, 2018
.
53
|
DICK'S SPORTING GOODS, INC. AND SUBSIDIARIES
NOTES TO CONSOLIDATED FINANCIAL STATEMENTS – (Continued)
|
||
The components of intangible assets were as follows as of the end of the fiscal years (in thousands):
|
|
2018
|
2017
|
|||||||||||||
|
|
Gross Amount
|
Accumulated Amortization
|
Gross Amount
|
Accumulated Amortization
|
|||||||||||
|
Trademarks (indefinite-lived)
|
$
|
89,206
|
|
$
|
—
|
|
$
|
89,206
|
|
$
|
—
|
|
|||
|
Trade names (indefinite-lived)
|
16,031
|
|
—
|
|
16,031
|
|
—
|
|
|||||||
|
Customer lists
|
21,166
|
|
(7,774
|
)
|
21,166
|
|
(4,922
|
)
|
|||||||
|
Acquired technology and other finite-lived intangible assets
|
26,901
|
|
(21,160
|
)
|
26,901
|
|
(17,583
|
)
|
|||||||
|
Other indefinite-lived intangible assets
|
5,796
|
|
—
|
|
5,788
|
|
—
|
|
|||||||
|
Total intangible assets
|
$
|
159,100
|
|
$
|
(28,934
|
)
|
$
|
159,092
|
|
$
|
(22,505
|
)
|
|||
Amortization expense for the Company's finite-lived intangible assets was
$6.4 million
,
$6.4 million
and
$3.5 million
for fiscal
2018
,
2017
and
2016
, respectively. The annual estimated amortization expense of the finite-lived intangible assets recorded as of February 2, 2019 is expected to be as follows (in thousands):
|
Fiscal Year
|
Estimated Amortization Expense
|
||
|
2019
|
$
|
5,514
|
|
|
2020
|
4,636
|
|
|
|
2021
|
4,104
|
|
|
|
2022
|
2,898
|
|
|
|
2023
|
1,792
|
|
|
|
Thereafter
|
189
|
|
|
|
Total
|
$
|
19,133
|
|
3. Store Closings
The following table summarizes the activity of the Company's store closing reserves (in thousands):
|
2018
|
2017
|
||||||
|
Accrued store closing and relocation reserves, beginning of period
|
$
|
10,536
|
|
$
|
17,531
|
|
|
|
Expense charged to earnings
|
3,354
|
|
1,733
|
|
|||
|
Cash payments
|
(8,795
|
)
|
(9,522
|
)
|
|||
|
Interest accretion and other changes in assumptions
|
(540
|
)
|
794
|
|
|||
|
Accrued store closing and relocation reserves, end of period
|
4,555
|
|
10,536
|
|
|||
|
Less: current portion of accrued store closing and relocation reserves
|
(1,323
|
)
|
(4,440
|
)
|
|||
|
Long-term portion of accrued store closing and relocation reserves
|
$
|
3,232
|
|
$
|
6,096
|
|
|
54
|
DICK'S SPORTING GOODS, INC. AND SUBSIDIARIES
NOTES TO CONSOLIDATED FINANCIAL STATEMENTS – (Continued)
|
||
4. Property and Equipment
Property and equipment are recorded at cost and consist of the following as of the end of the fiscal periods (in thousands):
|
2018
|
2017
|
||||||
|
Buildings and land
|
$
|
320,243
|
|
$
|
308,326
|
|
|
|
Leasehold improvements
|
1,613,663
|
|
1,587,235
|
|
|||
|
Furniture, fixtures and equipment
|
1,172,380
|
|
1,123,216
|
|
|||
|
Computer software
|
393,535
|
|
359,175
|
|
|||
|
Total property and equipment
|
3,499,821
|
|
3,377,952
|
|
|||
|
Less: accumulated depreciation and amortization
|
(1,934,550
|
)
|
(1,700,612
|
)
|
|||
|
Net property and equipment
|
$
|
1,565,271
|
|
$
|
1,677,340
|
|
|
The amounts above include construction in progress of
$74.3 million
and
$58.2 million
for fiscal
2018
and
2017
, respectively.
5. Accrued Expenses
Accrued expenses consist of the following as of the end of the fiscal periods (in thousands):
|
2018
|
2017
|
||||||
|
Accrued payroll, withholdings and benefits
|
$
|
166,039
|
|
$
|
125,426
|
|
|
|
Accrued real estate taxes, utilities and other occupancy
|
72,727
|
|
73,200
|
|
|||
|
Accrued property and equipment
|
19,094
|
|
30,303
|
|
|||
|
Accrued sales tax
|
18,576
|
|
23,396
|
|
|||
|
Other accrued expenses
|
87,906
|
|
101,856
|
|
|||
|
Total accrued expenses
|
$
|
364,342
|
|
$
|
354,181
|
|
|
6. Deferred Revenue and Other Liabilities
Deferred revenue and other liabilities consist of the following as of the end of the fiscal periods (in thousands):
|
2018
|
2017
|
||||||
|
Current:
|
|
|
|||||
|
Deferred gift card revenue
|
$
|
156,457
|
|
$
|
179,458
|
|
|
|
Other
|
68,527
|
|
32,622
|
|
|||
|
Total current
|
$
|
224,984
|
|
$
|
212,080
|
|
|
|
Long-term:
|
|
|
|||||
|
Deferred rent, including pre-opening rent
|
$
|
98,808
|
|
$
|
105,998
|
|
|
|
Deferred construction allowances
|
505,767
|
|
547,612
|
|
|||
|
Other
|
107,217
|
|
113,498
|
|
|||
|
Total long-term
|
$
|
711,792
|
|
$
|
767,108
|
|
|
55
|
DICK'S SPORTING GOODS, INC. AND SUBSIDIARIES
NOTES TO CONSOLIDATED FINANCIAL STATEMENTS – (Continued)
|
||
7. Debt
The Company's carrying value and fair value of outstanding debt consists of the following as of the end of the fiscal years (in thousands):
|
2018
|
2017
|
||||||
|
Revolving Credit Facility
|
$
|
—
|
|
$
|
—
|
|
|
|
Term loan
|
56,085
|
|
60,608
|
|
|||
|
Capital leases
|
3,941
|
|
4,570
|
|
|||
|
Other debt
|
18
|
|
108
|
|
|||
|
Total debt
|
60,044
|
|
65,286
|
|
|||
|
Less: current portion
|
(5,263
|
)
|
(5,202
|
)
|
|||
|
Total long-term debt
|
$
|
54,781
|
|
$
|
60,084
|
|
|
Revolving Credit Facility
–
On August 9, 2017, the Company entered into a
five
-year senior secured revolving credit facility (the "Credit Facility") that amended and restated the Company's then-existing credit facility. The Credit Facility provides for a
$1.25 billion
revolving credit facility, including up to
$150 million
in the form of letters of credit, and allows the Company, subject to the satisfaction of certain conditions, to request an increase of up to
$350 million
in borrowing availability subject to existing or new lenders agreeing to provide such additional revolving commitments.
On August 3, 2018, the Company amended the Credit Facility to provide that all terms of an accounting or financial nature and all computations of financial amounts and ratios referenced in the Credit Facility will be made without giving effect to any lease obligation recorded pursuant to FASB ASU 2016-02,
"Leases (Topic 842)"
, to the extent such obligation would not have been recorded as a capital lease obligation prior to adoption of ASU 2016-02.
Subject to specified conditions, the Credit Facility matures on August 9, 2022. It is secured by a first priority security interest in certain property and assets, including receivables, inventory, deposit accounts, securities accounts and other personal property of the Company and is guaranteed by the Company's domestic subsidiaries.
The annual interest rates applicable to loans under the Credit Facility are, at the Company's option, equal to a base rate or an adjusted
LIBOR
rate plus, in each case, an applicable margin percentage. The applicable margin percentage for base rate loans is
0.125%
to
0.375%
and for adjusted LIBOR rate loans is
1.125%
to
1.375%
, depending on the borrowing availability of the Company.
The Credit Facility contains a covenant that requires the Company to maintain a minimum adjusted availability of
7.5%
of its borrowing base. The Credit Facility also contains certain covenants that could within specific predefined circumstances limit the Company's ability to, among other things: incur or guarantee additional indebtedness; pay distributions on, redeem or repurchase capital stock; redeem or repurchase subordinated debt; make certain investments; sell assets; or consolidate, merge or transfer all or substantially all of the Company's assets. Other than in certain limited conditions, the Company is permitted under the Credit Facility to continue to pay dividends and repurchase shares pursuant to its stock repurchase program. As of February 2, 2019, the Company was in compliance with the terms of the Credit Facility.
Credit Facility information as of the fiscal years ended (in thousands):
|
2018
|
2017
|
||||||
|
Outstanding borrowings under Credit Facility
|
$
|
—
|
|
$
|
—
|
|
|
|
Remaining borrowing capacity under Credit Facility
|
$
|
1,233,869
|
|
$
|
1,233,869
|
|
|
|
Outstanding letters of credit under Credit Facility
|
$
|
16,131
|
|
$
|
16,131
|
|
|
56
|
DICK'S SPORTING GOODS, INC. AND SUBSIDIARIES
NOTES TO CONSOLIDATED FINANCIAL STATEMENTS – (Continued)
|
||
Term Loan
–
On August 18, 2017, the Company financed the purchase of a corporate aircraft through a loan with Bank of America Leasing & Capital, LLC ("BOA") with a fixed interest rate of
3.41%
payable in increments of
$4.5 million
annually through December 2024 and a balloon payment of
$29.3 million
(the "BOA Loan"). The BOA Loan may be prepaid in full provided that the prepayment includes all accrued interest and a prepayment fee equal to
1%
of the unpaid balance during the first year of the BOA Loan or a prepayment fee equal to
0.5%
of the unpaid balance during the second year of the BOA Loan.
No
prepayment fee is required after the completion of the second year of the BOA Loan.
Capital Lease Obligations
– The gross and net carrying values of assets under capital leases were
$6.9 million
and
$0.2 million
, respectively, as of
February 2, 2019
and
$6.9 million
and
$0.3 million
, respectively, as of February 3, 2018.
Scheduled lease payments under capital lease obligations as of
February 2, 2019
are as follows (in thousands):
|
Fiscal Year
|
|
||
|
2019
|
$
|
1,103
|
|
|
2020
|
1,103
|
|
|
|
2021
|
943
|
|
|
|
2022
|
863
|
|
|
|
2023
|
863
|
|
|
|
Thereafter
|
216
|
|
|
|
Subtotal
|
5,091
|
|
|
|
Less: amounts representing interest
|
(1,150
|
)
|
|
|
Present value of net scheduled lease payments
|
3,941
|
|
|
|
Less: amounts due in one year
|
(722
|
)
|
|
|
Total long-term capital leases
|
$
|
3,219
|
|
8. Operating Leases
The Company leases all of its stores,
three
of its distribution centers and certain equipment under non-cancellable operating leases that expire at various dates through 2033. Initial lease terms are generally for
10
to
15 years
and most store leases contain multiple
five
-year renewal options and rent escalation provisions. The lease agreements provide primarily for the payment of minimum annual rentals, costs of utilities, property taxes, maintenance, common areas and insurance, and in some cases, contingent rent stated as a percentage of gross sales over certain base amounts. Rent expense under these operating leases totaled approximately
$530.9 million
,
$532.7 million
and
$501.9 million
for fiscal
2018
,
2017
and
2016
, respectively.
Aggregate lease payments, including fixed executory costs, due under non-cancellable operating leases as of
February 2, 2019
are as follows (in thousands):
|
Fiscal Year
|
|
||
|
2019
|
$
|
655,516
|
|
|
2020
|
619,189
|
|
|
|
2021
|
558,633
|
|
|
|
2022
|
475,830
|
|
|
|
2023
|
392,826
|
|
|
|
Thereafter
|
1,033,034
|
|
|
|
Total
|
$
|
3,735,028
|
|
57
|
DICK'S SPORTING GOODS, INC. AND SUBSIDIARIES
NOTES TO CONSOLIDATED FINANCIAL STATEMENTS – (Continued)
|
||
9. Stockholders' Equity
Common Stock, Class B Common Stock and Preferred Stock
– The Company's Amended and Restated Certificate of Incorporation authorizes the issuance of
200,000,000
shares of common stock, par value
$0.01
per share, and the issuance of
40,000,000
shares of Class B common stock, par value
$0.01
per share. In addition, the Company's Amended and Restated Certificate of Incorporation authorizes the issuance of up to
5,000,000
shares of preferred stock.
Holders of common stock generally have rights identical to holders of Class B common stock, except that holders of common stock are entitled to
one
vote per share and holders of Class B common stock are entitled to
ten
votes per share. A related party, relatives of the related party and trusts held by them hold all of the Class B common shares. These shares can only be held by members of this group and are not publicly tradable. Each share of Class B common stock can be converted at any time into
one
share of common stock at the holder's option.
Dividends per Common Share
– The Company declared and paid aggregate cash dividends of
$0.90
,
$0.68
and
$0.605
per share of common stock and Class B common stock during fiscal
2018
,
2017
and
2016
, respectively.
Treasury Stock
– The Company’s
five
-year
$1 billion
share repurchase program in place as of February 2, 2019 was authorized by its Board of Directors on March 16, 2016. During fiscal 2018 and 2017, the Company repurchased
9.6 million
shares for
$323.4 million
and
8.1 million
shares for
$284.6 million
, respectively, of its common stock. The Company had
$433.4 million
remaining under the current share repurchase program as of February 2, 2019.
10. Stock-Based Compensation and Employee Stock Plans
The Company has the ability to grant restricted shares of common stock, restricted stock units and options to purchase common stock under the 2012 Plan. As of
February 2, 2019
, shares of common stock available for future issuance pursuant to the 2012 Plan were
6,089,337
shares.
The following represents total stock-based compensation recognized in the Consolidated Statements of Income for the fiscal years presented (in thousands):
|
2018
|
2017
|
2016
|
|||||||||
|
Stock option expense
|
$
|
7,147
|
|
$
|
8,686
|
|
$
|
9,506
|
|
||
|
Restricted stock expense
|
34,794
|
|
27,553
|
|
24,096
|
|
|||||
|
Total stock-based compensation expense
|
$
|
41,941
|
|
$
|
36,239
|
|
$
|
33,602
|
|
||
|
Total related tax benefit
|
$
|
9,104
|
|
$
|
12,130
|
|
$
|
11,718
|
|
||
Stock Options
–
Stock options are generally granted on an annual basis, vest
25%
per year over
four
years and have a
seven
-year maximum term.
The fair value of each stock option granted is estimated on the grant date using the Black-Scholes ("Black-Scholes") option valuation model. The assumptions used to calculate the fair value of options granted are evaluated and revised, as necessary, to reflect market conditions and the Company's experience. These options are expensed on a straight-line basis over the vesting period, which is considered to be the requisite service period. Compensation expense is recognized only for those options expected to vest, with forfeitures estimated at the date of grant based on the Company's historical experience and future expectations.
58
|
DICK'S SPORTING GOODS, INC. AND SUBSIDIARIES
NOTES TO CONSOLIDATED FINANCIAL STATEMENTS – (Continued)
|
||
The fair value of stock-based awards to employees is estimated on the date of grant using the Black-Scholes valuation with the following assumptions:
|
|
Employee Stock Option Plans
|
||||||||||
|
Black-Scholes Valuation Assumptions
|
2018
|
2017
|
2016
|
||||||||
|
Expected life (years)
(1)
|
5.20
|
|
5.47
|
|
5.40
|
|
|||||
|
Expected volatility
(2)
|
33.15% - 37.41%
|
|
29.24% - 33.86%
|
|
29.20% - 31.93%
|
|
|||||
|
Weighted average volatility
|
34.61
|
%
|
30.52
|
%
|
31.01
|
%
|
|||||
|
Risk-free interest rate
(3)
|
2.55% - 3.04%
|
|
1.70% - 2.25%
|
|
1.07% - 1.90%
|
|
|||||
|
Expected dividend yield
|
2.40% - 2.82%
|
|
1.30% - 2.78%
|
|
1.03% - 1.59%
|
|
|||||
|
Weighted average grant date fair value
|
$
|
9.02
|
|
$
|
11.98
|
|
$
|
12.56
|
|
||
|
(1)
|
The expected term of the options represents the estimated period of time until exercise and is based on historical experience of similar awards giving consideration to the contractual terms, vesting schedules and expectations of future employee behavior.
|
|
(2)
|
Expected volatility is based on the historical volatility of the Company's common stock over a time frame consistent with the expected life of the stock options.
|
|
(3)
|
The risk-free interest rate is based on the implied yield available on U.S. Treasury constant maturity interest rates whose term is consistent with the expected life of the stock options.
|
The assumptions used to calculate the fair value of options granted are evaluated and revised, as necessary, to reflect market conditions and experience.
The stock option activity from
January 30, 2016
through
February 2, 2019
is presented in the following table:
|
Shares Subject to Options
|
Weighted Average Exercise Price per Share
|
Weighted Average Remaining Contractual Life (Years)
|
Aggregate Intrinsic Value (in thousands)
|
|||||||||
|
Outstanding, January 30, 2016
|
3,974,512
|
|
$
|
38.29
|
|
2.94
|
$
|
51,930
|
|
|||
|
Granted
|
1,143,326
|
|
47.79
|
|
||||||||
|
Exercised
|
(1,348,241
|
)
|
22.28
|
|
||||||||
|
Forfeited / Expired
|
(208,512
|
)
|
50.01
|
|
||||||||
|
Outstanding, January 28, 2017
|
3,561,085
|
|
$
|
46.71
|
|
3.88
|
$
|
22,638
|
|
|||
|
Granted
|
786,246
|
|
45.28
|
|
||||||||
|
Exercised
|
(582,022
|
)
|
28.43
|
|
||||||||
|
Forfeited / Expired
|
(635,360
|
)
|
50.60
|
|
||||||||
|
Outstanding, February 3, 2018
|
3,129,949
|
|
$
|
48.97
|
|
4.08
|
$
|
389
|
|
|||
|
Granted
|
881,334
|
|
34.18
|
|
||||||||
|
Forfeited / Expired
|
(880,856
|
)
|
45.96
|
|
||||||||
|
Outstanding, February 2, 2019
|
3,130,427
|
|
$
|
45.65
|
|
4.07
|
$
|
1,783
|
|
|||
|
Exercisable, February 2, 2019
|
1,511,580
|
|
$
|
50.53
|
|
2.65
|
$
|
184
|
|
|||
|
Vested and expected to vest, February 2, 2019
|
2,917,529
|
|
$
|
46.22
|
|
3.95
|
$
|
1,486
|
|
|||
59
|
DICK'S SPORTING GOODS, INC. AND SUBSIDIARIES
NOTES TO CONSOLIDATED FINANCIAL STATEMENTS – (Continued)
|
||
The aggregate intrinsic value reported in the table above is based on the Company's closing stock prices for the last business day of the period indicated. The total intrinsic value for stock options exercised during
2017
and
2016
was
$10.7 million
and
$36.4 million
, respectively. The total fair value of options vested during
2018
,
2017
and
2016
was
$8.1 million
,
$9.6 million
and
$8.4 million
, respectively. The nonvested stock option activity for the year ended
February 2, 2019
is presented in the following table:
|
Shares Subject to Options
|
Weighted Average Grant Date Fair Value
|
|||||
|
Nonvested, February 3, 2018
|
1,650,991
|
|
$
|
13.29
|
|
|
|
Granted
|
881,334
|
|
9.02
|
|
||
|
Vested
|
(572,972
|
)
|
14.13
|
|
||
|
Forfeited
|
(340,506
|
)
|
11.29
|
|
||
|
Nonvested, February 2, 2019
|
1,618,847
|
|
$
|
11.09
|
|
|
As of
February 2, 2019
, unrecognized stock-based compensation expense from nonvested stock options was approximately
$10.4 million
, net of estimated forfeitures, which is expected to be recognized over a weighted average period of approximately
2.42 years
.
The Company issues new shares of common stock upon exercise of stock options.
Additional information regarding options outstanding as of
February 2, 2019
is as follows:
|
|
Options Outstanding
|
Options Exercisable
|
||||||||||||||
|
Range of
Exercise Prices
|
Shares
|
Weighted Average Remaining Contractual Life (Years)
|
Weighted Average Exercise Price
|
Shares
|
Weighted Average Exercise Price
|
|||||||||||
|
$24.48 - $34.05
|
830,465
|
|
6.18
|
$
|
33.10
|
|
26,660
|
|
$
|
28.35
|
|
|||||
|
$35.22 - $47.09
|
945,577
|
|
3.41
|
46.07
|
|
589,971
|
|
46.49
|
|
|||||||
|
$47.73 - $55.29
|
932,936
|
|
3.26
|
50.62
|
|
583,454
|
|
51.41
|
|
|||||||
|
$55.49 - $58.86
|
421,449
|
|
3.23
|
58.44
|
|
311,495
|
|
58.41
|
|
|||||||
|
$24.48 - $58.86
|
3,130,427
|
|
4.07
|
$
|
45.65
|
|
1,511,580
|
|
$
|
50.53
|
|
|||||
Restricted Stock
– The Company issues shares of restricted stock to eligible employees, which are subject to forfeiture until the end of an applicable vesting period. The awards generally vest on the third anniversary of the date of grant, subject to the employee's continuing employment as of that date.
60
|
DICK'S SPORTING GOODS, INC. AND SUBSIDIARIES
NOTES TO CONSOLIDATED FINANCIAL STATEMENTS – (Continued)
|
||
The restricted stock activity from
January 30, 2016
through
February 2, 2019
is presented in the following table:
|
Shares
|
Weighted Average Grant Date Fair Value
|
|||||
|
Nonvested, January 30, 2016
|
2,204,980
|
|
$
|
50.97
|
|
|
|
Granted
|
789,460
|
|
47.89
|
|
||
|
Vested
|
(438,160
|
)
|
47.05
|
|
||
|
Forfeited
|
(196,240
|
)
|
51.23
|
|
||
|
Nonvested, January 28, 2017
|
2,360,040
|
|
$
|
50.64
|
|
|
|
Granted
|
2,228,573
|
|
41.47
|
|
||
|
Vested
|
(359,956
|
)
|
54.13
|
|
||
|
Forfeited
|
(624,420
|
)
|
49.38
|
|
||
|
Nonvested, February 3, 2018
|
3,604,237
|
|
$
|
44.84
|
|
|
|
Granted
|
1,616,600
|
|
33.96
|
|
||
|
Vested
|
(549,293
|
)
|
49.88
|
|
||
|
Forfeited
|
(1,213,927
|
)
|
45.05
|
|
||
|
Nonvested, February 2, 2019
|
3,457,617
|
|
$
|
38.88
|
|
|
As of
February 2, 2019
, total unrecognized stock-based compensation expense from nonvested shares of restricted stock, net of estimated forfeitures, was approximately
$47.6 million
before income taxes, which is expected to be recognized over a weighted average period of approximately
1.47 years
.
During 2013, the Company issued a special grant of
1,185,793
shares of performance-based restricted stock in support of the Company's five-year strategic plan ("the 2013 Long-Term Incentive Plan"). These awards did not achieve the pre-established financial performance metrics by the end of the performance period, which ended on February 3, 2018. The remaining nonvested shares forfeited during fiscal 2018 and became available for issuance under the 2012 Plan.
During 2017, the Company issued a special grant of
674,209
shares of performance-based restricted stock in support of the Company's strategic initiatives ("the 2017 Long-Term Incentive Plan"). As of February 2, 2019, nonvested restricted stock outstanding included
383,807
shares of these performance-based awards. The Company expects
63,712
shares to vest so long as the award recipient remains with the Company through April 2020.
11. Income Taxes
On December 22, 2017, the U.S. government enacted comprehensive tax legislation under the Tax Act. As a result of the Tax Act in fiscal 2017, the Company recorded a provisional income tax charge of
$6.0 million
related to the deemed repatriation of accumulated but undistributed earnings of foreign operations. The re-measurement of the Company’s net deferred tax liability resulted in a provisional income tax benefit of
$5.3 million
.
In response to the Tax Act, the Securities and Exchange Commission staff issued Staff Accounting Bulletin ("SAB") 118 during fiscal 2018, which provides guidance on the application of U.S. GAAP and the accounting for the income tax effects of the Tax Act. SAB 118 provides a measurement period time frame that should not extend beyond one year from the Tax Act enactment date for companies to complete the accounting requirements of ASC 740,
"Income Taxes"
. Upon completion of the Company's tax return filings during fiscal 2018, any changes in management's estimates related to the Tax Act did not have a significant impact on the Company's Consolidated Financial Statements. Additionally, the Tax Act includes a provision designed to tax Global Intangible Low Tax Income ("GILTI") earned by non-U.S. corporate subsidiaries of large U.S. shareholders starting in 2018. The Company has elected to account for any future GILTI tax liabilities as period costs and will expense those liabilities in the period incurred. The Company therefore will not record deferred taxes associated with the GILTI provision of the Tax Act.
61
|
DICK'S SPORTING GOODS, INC. AND SUBSIDIARIES
NOTES TO CONSOLIDATED FINANCIAL STATEMENTS – (Continued)
|
||
The tax owed on the Company’s estimated deemed repatriation resulting from the Tax Act is payable in uneven annual installments through 2025. As such,
$5.2 million
of the tax on undistributed foreign earnings not payable within the next 12 months is presented within long-term deferred rent and other liabilities on the Consolidated Balance Sheet.
The components of the provision for income taxes are as follows for the fiscal years ended (in thousands):
|
2018
|
2017
|
2016
|
|||||||||
|
Current:
|
|
|
|
||||||||
|
Federal
|
$
|
94,729
|
|
$
|
114,443
|
|
$
|
184,636
|
|
||
|
State
|
22,585
|
|
20,996
|
|
31,426
|
|
|||||
|
117,314
|
|
135,439
|
|
216,062
|
|
||||||
|
Deferred:
|
|
|
|
||||||||
|
Federal
|
(3,943
|
)
|
38,805
|
|
(38,138
|
)
|
|||||
|
State
|
(1,315
|
)
|
3,648
|
|
(6,898
|
)
|
|||||
|
(5,258
|
)
|
42,453
|
|
(45,036
|
)
|
||||||
|
Total provision
|
$
|
112,056
|
|
$
|
177,892
|
|
$
|
171,026
|
|
||
The provision for income taxes differs from the amounts computed by applying the federal statutory rate as follows for the following fiscal years:
|
2018
|
2017
|
2016
|
||||||
|
Federal statutory rate
|
21.0
|
%
|
33.7
|
%
|
35.0
|
%
|
||
|
State tax, net of federal benefit
|
3.8
|
%
|
3.3
|
%
|
3.3
|
%
|
||
|
Valuation allowance
|
—
|
%
|
(0.8
|
)%
|
(0.1
|
)%
|
||
|
Other permanent items
|
1.1
|
%
|
(0.7
|
)%
|
(0.9
|
)%
|
||
|
Effective income tax rate
|
25.9
|
%
|
35.5
|
%
|
37.3
|
%
|
||
62
|
DICK'S SPORTING GOODS, INC. AND SUBSIDIARIES
NOTES TO CONSOLIDATED FINANCIAL STATEMENTS – (Continued)
|
||
Components of deferred tax assets (liabilities) consist of the following as of the fiscal years ended (in thousands):
|
2018
|
2017
|
||||||
|
Inventory
|
$
|
35,487
|
|
$
|
35,613
|
|
|
|
Employee benefits
|
33,591
|
|
32,909
|
|
|||
|
Deferred rent
|
27,648
|
|
29,710
|
|
|||
|
Stock-based compensation
|
19,005
|
|
18,315
|
|
|||
|
Gift cards
|
14,458
|
|
13,006
|
|
|||
|
Deferred revenue currently taxable
|
7,263
|
|
7,801
|
|
|||
|
Store closing expense
|
1,178
|
|
2,739
|
|
|||
|
Other accrued expenses not currently deductible for tax purposes
|
5,895
|
|
4,590
|
|
|||
|
Net operating loss carryforward
|
2,056
|
|
3,031
|
|
|||
|
Non income-based tax reserves
|
5,464
|
|
5,518
|
|
|||
|
Capital loss carryforward
|
922
|
|
910
|
|
|||
|
Uncertain income tax positions
|
1,218
|
|
2,152
|
|
|||
|
Insurance
|
2,298
|
|
2,060
|
|
|||
|
Other
|
120
|
|
78
|
|
|||
|
Valuation allowance
|
—
|
|
—
|
|
|||
|
Total deferred tax assets
|
156,603
|
|
158,432
|
|
|||
|
Property and equipment
|
(115,726
|
)
|
(117,925
|
)
|
|||
|
Inventory valuation
|
(26,871
|
)
|
(28,430
|
)
|
|||
|
Intangibles
|
(5,068
|
)
|
(4,844
|
)
|
|||
|
Prepaid expenses
|
(3,723
|
)
|
(3,826
|
)
|
|||
|
Other
|
(3,748
|
)
|
—
|
|
|||
|
Total deferred tax liabilities
|
(155,136
|
)
|
(155,025
|
)
|
|||
|
Net deferred tax asset
|
$
|
1,467
|
|
$
|
3,407
|
|
|
The deferred tax asset from net operating loss carryforwards of
$2.1 million
represents approximately
$6.7 million
of federal net operating losses, which expire in 2036, and
$10.6 million
of state net operating losses, which expire in 2034. In
2018
, of the
$1.5 million
net deferred tax asset, approximately
$13.2 million
is included within other long-term assets and approximately
$11.8 million
is included within other long-term liabilities on the Consolidated Balance Sheet. In 2017, of the
$3.4 million
net deferred tax asset,
$13.6 million
was included within other long-term assets and
$10.2 million
was included within other long-term liabilities.
The Company does not provide for deferred taxes on the excess of the financial reporting basis over the tax basis related to our investments in foreign subsidiaries. It is the Company’s intention to permanently reinvest the earnings from foreign subsidiaries outside the United States. Under the Tax Act, the associated transition tax resulted in the elimination of the excess of the amount of financial reporting basis over the tax basis in the foreign subsidiaries and subjected
$66.6 million
of undistributed foreign earnings to tax. An actual repatriation from our international subsidiaries could still be subject to additional foreign withholding taxes and U.S. state taxes. We do not anticipate the need to repatriate funds to the United States to satisfy domestic liquidity needs and accordingly do not provide for foreign withholding taxes and U.S. state taxes.
As of February 2, 2019, the total liability for uncertain tax positions, including related interest and penalties, was approximately
$5.8 million
.
63
|
DICK'S SPORTING GOODS, INC. AND SUBSIDIARIES
NOTES TO CONSOLIDATED FINANCIAL STATEMENTS – (Continued)
|
||
The following table represents a reconciliation of the Company's total balance of unrecognized tax benefits, excluding interest and penalties (in thousands):
|
2018
|
2017
|
2016
|
|||||||||
|
Beginning of fiscal year
|
$
|
8,047
|
|
$
|
8,293
|
|
$
|
9,784
|
|
||
|
Increases as a result of tax positions taken in a prior period
|
456
|
|
124
|
|
—
|
|
|||||
|
Decreases as a result of tax positions taken in a prior period
|
(411
|
)
|
(142
|
)
|
(831
|
)
|
|||||
|
Increases as a result of tax positions taken in the current period
|
—
|
|
—
|
|
2,067
|
|
|||||
|
Decreases as a result of settlements during the current period
|
(2,977
|
)
|
(228
|
)
|
(2,534
|
)
|
|||||
|
Reductions as a result of a lapse of statute of limitations during the current period
|
(797
|
)
|
—
|
|
(193
|
)
|
|||||
|
End of fiscal year
|
$
|
4,318
|
|
$
|
8,047
|
|
$
|
8,293
|
|
||
The balance at
February 2, 2019
includes
$3.4 million
of unrecognized tax benefits that would impact our effective tax rate if recognized. The Company recognizes accrued interest and penalties from unrecognized tax benefits in income tax expense.
As of
February 2, 2019
, the liability for uncertain tax positions includes
$1.5 million
for the accrual of interest. During fiscal 2018, 2017 and 2016, the Company recorded
$0.3 million
,
$0.4 million
and
$0.3 million
, respectively, for the accrual of interest and penalties in the Consolidated Statements of Income. The Company has ongoing federal, state and local examinations. It is possible that these examinations may be resolved within 12 months. Due to the potential for resolution of these examinations, and the expiration of various statutes of limitation, it is reasonably possible that
$3.1 million
of the Company's gross unrecognized tax benefits and interest at
February 2, 2019
could be recognized within the next 12 months. The Company does not anticipate that changes in its unrecognized tax benefits will have a material impact on the Consolidated Statements of Income during fiscal
2019
.
The Company participates in the Internal Revenue Service ("IRS") Compliance Assurance Program ("CAP"). As part of CAP, tax years are audited on a contemporaneous basis so that all or most issues are resolved prior to the filing of the tax return. The IRS has completed examinations of 2017 and all prior tax years. The Company is no longer subject to examination in any of its major state jurisdictions for years prior to
2014
.
12. Earnings per Common Share
The computations for basic and diluted earnings per common share are as follows (in thousands, except per share data):
|
|
Fiscal Year Ended
|
||||||||||
|
|
2018
|
2017
|
2016
|
||||||||
|
Earnings per common share - Basic:
|
|
|
|
||||||||
|
Net income
|
$
|
319,864
|
|
$
|
323,445
|
|
$
|
287,396
|
|
||
|
Weighted average common shares outstanding - basic
|
97,743
|
|
106,977
|
|
111,095
|
|
|||||
|
Earnings per common share
|
$
|
3.27
|
|
$
|
3.02
|
|
$
|
2.59
|
|
||
|
Earnings per common share - Diluted:
|
|
|
|
||||||||
|
Net income
|
$
|
319,864
|
|
$
|
323,445
|
|
$
|
287,396
|
|
||
|
Weighted average common shares outstanding - basic
|
97,743
|
|
106,977
|
|
111,095
|
|
|||||
|
Dilutive effect of stock-based awards
|
1,038
|
|
609
|
|
1,121
|
|
|||||
|
Weighted average common shares outstanding - diluted
|
98,781
|
|
107,586
|
|
112,216
|
|
|||||
|
Earnings per common share
|
$
|
3.24
|
|
$
|
3.01
|
|
$
|
2.56
|
|
||
|
Anti-dilutive stock-based awards excluded from diluted calculation
|
3,519
|
|
3,693
|
|
1,822
|
|
|||||
64
|
DICK'S SPORTING GOODS, INC. AND SUBSIDIARIES
NOTES TO CONSOLIDATED FINANCIAL STATEMENTS – (Continued)
|
||
13. Retirement Savings Plans
The Company's retirement savings plan, established pursuant to Section 401(k) of the Internal Revenue Code, covers regular status full-time hourly and salaried employees and part-time employees after one month of employment with the Company. Employees must be
21 years
of age to participate. Under the terms of the retirement savings plan, the Company may make a discretionary matching contribution equal to a percentage of each participant's contribution, up to
10%
of the participant's compensation. The Company's discretionary matching contribution percentage is typically
50%
. Total employer contributions recorded under the plan, net of forfeitures, was
$9.8 million
,
$8.3 million
and
$8.7 million
for fiscal
2018
,
2017
and
2016
, respectively.
The Company also has non-qualified deferred compensation plans for highly compensated employees whose contributions are limited under qualified defined contribution plans. Amounts contributed and deferred under the deferred compensation plans are credited or charged with the performance of investment options offered under the plans and elected by the participants. In the event of bankruptcy, the assets of these plans are available to satisfy the claims of general creditors. The liability for compensation deferred under the Company's plans was
$77.3 million
and
$78.9 million
as of
February 2, 2019
and
February 3, 2018
, respectively, and is included within long-term liabilities on the Consolidated Balance Sheets. Total employer contributions recorded under these plans, net of forfeitures, was
$2.1 million
,
$2.1 million
and
$2.2 million
for fiscal
2018
,
2017
and
2016
, respectively.
14. Commitments and Contingencies
Marketing and Naming Rights Commitments
Within the ordinary course of business, the Company enters into contractual commitments in order to promote the Company's brand and products, including media and naming rights extending through
2026
. The aggregate payments under these commitments were
$18.0 million
,
$33.3 million
and
$39.3 million
during fiscal
2018
,
2017
and
2016
, respectively. The aggregate amount of future minimum payments at
February 2, 2019
is as follows (in thousands):
|
Fiscal Year
|
|
||
|
2019
|
$
|
14,192
|
|
|
2020
|
12,250
|
|
|
|
2021
|
9,792
|
|
|
|
2022
|
4,054
|
|
|
|
2023
|
2,888
|
|
|
|
Thereafter
|
9,196
|
|
|
|
Total
|
$
|
52,372
|
|
Licenses for Trademarks
Within the ordinary course of business, the Company enters into licensing agreements for the exclusive or preferential rights to use certain trademarks extending through 2022. Under specific agreements, the Company is obligated to pay annual guaranteed minimum royalties. Also, the Company is required to pay additional royalties when the royalties that are based on qualified purchases or retail sales (dependent upon the agreement) exceed the guaranteed minimum. The aggregate payments under these commitments were
$12.1 million
,
$9.6 million
and
$8.8 million
during fiscal
2018
,
2017
and
2016
, respectively. The aggregate amount of future minimum payments at
February 2, 2019
is as follows (in thousands):
|
Fiscal Year
|
|
||
|
2019
|
$
|
10,033
|
|
|
2020
|
5,213
|
|
|
|
2021
|
2,208
|
|
|
|
2022
|
1,250
|
|
|
|
Total
|
$
|
18,704
|
|
65
|
DICK'S SPORTING GOODS, INC. AND SUBSIDIARIES
NOTES TO CONSOLIDATED FINANCIAL STATEMENTS – (Continued)
|
||
Other
The Company also has other non-cancellable contractual commitments, including minimum requirements with its third-party eCommerce fulfillment provider, and technology-related commitments extending through 2021. The aggregate payments under these commitments were
$48.5 million
,
$37.7 million
and
$17.9 million
during fiscal
2018
,
2017
and
2016
, respectively. The aggregate amount of future minimum payments at
February 2, 2019
is as follows (in thousands):
|
Fiscal Year
|
|
||
|
2019
|
$
|
38,637
|
|
|
2020
|
4,895
|
|
|
|
2021
|
3,750
|
|
|
|
Total
|
$
|
47,282
|
|
The Company is involved in legal proceedings incidental to the normal conduct of its business. Although the outcome of any pending legal proceedings cannot be predicted with certainty, management believes that adequate insurance coverage is maintained and that the ultimate resolution of these matters will not have a material adverse effect on the Company's liquidity, financial position or results of operations.
15. Fair Value Measurements
ASC 820, "
Fair Value Measurement and Disclosures
", outlines a valuation framework and creates a fair value hierarchy for assets and liabilities as follows:
Level 1: Observable inputs such as quoted prices in active markets;
Level 2: Inputs, other than quoted prices in active markets, that are observable either directly or indirectly; and
Level 3: Unobservable inputs in which there is little or no market data, which require the reporting entity to develop its own assumptions.
Assets measured at fair value on a recurring basis as of
February 2, 2019
and
February 3, 2018
are set forth in the table below:
|
Level 1
|
|||||||
|
Description
|
February 2, 2019
|
February 3, 2018
|
|||||
|
Assets:
|
|
|
|||||
|
Deferred compensation plan assets held in trust
(1)
|
$
|
77,324
|
|
$
|
78,894
|
|
|
|
Total assets
|
$
|
77,324
|
|
$
|
78,894
|
|
|
|
(1)
|
Consists of investments in various mutual funds made by eligible individuals as part of the Company's deferred compensation plans (See Note 13).
|
The fair value of cash and cash equivalents, accounts receivable, accounts payable and certain other liabilities approximated book value due to the short-term nature of these instruments at both
February 2, 2019
and
February 3, 2018
.
The Company uses quoted prices in active markets to determine the fair value of the aforementioned assets determined to be Level 1 instruments. The Company's policy for recognition of transfers between levels of the fair value hierarchy is to recognize any transfer at the end of the fiscal quarter in which the determination to transfer was made.
66
|
DICK'S SPORTING GOODS, INC. AND SUBSIDIARIES
NOTES TO CONSOLIDATED FINANCIAL STATEMENTS – (Continued)
|
||
16. Related Party Transaction
On August 18, 2017, the Company agreed to acquire from EWS II, LLC, an entity owned by the Company's Chairman & Chief Executive Officer ("EWS"), the rights and obligations relating to the purchase of an aircraft by EWS from Gulfstream Aerospace Corporation ("Gulfstream"). The Company and EWS entered into an arrangement, pursuant to which the Company agreed to reimburse
$62.8 million
to EWS for principal payments previously made to Gulfstream for the aircraft purchase and for interest incurred in connection with the financing of the aircraft purchase and agreed to fund the final aircraft purchase price payment of
$4.0 million
to Gulfstream. The transaction was approved pursuant to the Company's Related Party Transaction Policy. This aircraft replaced a Company aircraft that came off lease in fiscal 2017.
17. Revenue Recognition
On February 4, 2018, the Company adopted ASU 2014-09 ("Topic 606") using the modified retrospective approach for all contracts not completed as of the adoption date. Financial results for reporting periods beginning after February 3, 2018 are presented in accordance with Topic 606, while prior periods will continue to be reported in accordance with our pre-adoption accounting policies and therefore have not been adjusted to conform to Topic 606.
The primary impact to the Company's accounting policies of adopting Topic 606 relates to the timing of revenue recognition for gift card breakage. Gift card breakage prior to adoption was recognized at the point gift card redemption was deemed remote. As a result of the adoption of Topic 606, the Company now recognizes gift card breakage over time in proportion to the pattern of rights exercised by the customer. This change in accounting policy was accounted for through a cumulative effect adjustment to increase beginning retained earnings during the first quarter of fiscal 2018. The Company reclassified
$27.7 million
from deferred revenue and other liabilities resulting in a cumulative effect adjustment of
$20.5 million
, net of tax, to retained earnings on the Company's Consolidated Balance Sheets and Consolidated Statement of Changes in Stockholders' Equity. Additionally, the adoption of Topic 606 resulted in insignificant financial statement presentation reclassifications related to our customer loyalty program and our sales return reserve. The Company does not expect the adoption of Topic 606 to have a significant impact on the Consolidated Financial Statements on a prospective basis.
In accordance with Topic 606, revenue shall be recognized upon satisfaction of all contractual performance obligations and transfer of control to the customer. The Company elected the practical expedient within Topic 606 related to sales taxes that are assessed by a governmental authority, which allows for the exclusion of sales tax from transaction price. The Company also elected the practical expedient within Topic 606 related to shipping and handling costs, which allows for shipping and handling activities occurring subsequent to the transfer of control to the customer to be accounted for as fulfillment costs rather than a promised service.
Deferred gift card revenue
- Our gift card liability was
$156.5 million
and
$179.5 million
as of February 2, 2019 and February 3, 2018, respectively. During the fiscal year ended February 2, 2019, we recognized
$13.6 million
of gift card breakage revenue and experienced approximately
$81.9 million
of gift card redemptions that were included in our gift card liability as of February 3, 2018. Based on the Company's historical experience, the vast majority of gift card revenue is recognized within twelve months of deferral.
Customer loyalty program
- Loyalty program points are accrued at the estimated retail value per point, net of estimated breakage. We estimate the breakage of loyalty points based on historical redemption rates experienced within the loyalty program. Our customer loyalty program liability was
$32.4 million
and
$29.9 million
as of February 2, 2019 and February 3, 2018, respectively. During the fiscal year ended February 2, 2019, we recognized approximately
$27.5 million
of revenue that was included in our customer loyalty program liability as of February 3, 2018. Based on the Company's customer loyalty program policies, the vast majority of program points earned are redeemed or expire within twelve months.
67
|
DICK'S SPORTING GOODS, INC. AND SUBSIDIARIES
NOTES TO CONSOLIDATED FINANCIAL STATEMENTS – (Continued)
|
||
Net sales by category
- The following table disaggregates the amount of net sales attributable to hardlines, apparel and footwear for the periods presented (in thousands):
|
|
Fiscal Year
|
||||||||||
|
|
2018
|
2017
|
2016
|
||||||||
|
Hardlines
(1)
|
$
|
3,632,147
|
|
$
|
3,886,993
|
|
$
|
3,573,562
|
|
||
|
Apparel
|
2,962,347
|
|
2,920,345
|
|
2,756,099
|
|
|||||
|
Footwear
|
1,719,456
|
|
1,694,590
|
|
1,529,381
|
|
|||||
|
Other
(2)
|
122,620
|
|
88,544
|
|
62,939
|
|
|||||
|
Total net sales
|
$
|
8,436,570
|
|
$
|
8,590,472
|
|
$
|
7,921,981
|
|
||
|
(1)
|
Includes items such as sporting goods equipment, fitness equipment, golf equipment and hunting and fishing gear.
|
|
(2)
|
Includes the Company's non-merchandise sales categories, including in-store services, shipping revenues and credit card processing revenues.
|
18. Quarterly Financial Information (Unaudited)
Summarized quarterly financial information for fiscal
2018
and
2017
is as follows (in thousands, except earnings per share data):
|
|
Fiscal 2018
|
|||||||||||||||
|
|
First
Quarter
|
Second
Quarter
|
|
Third
Quarter
|
Fourth
Quarter
|
|||||||||||
|
Net sales
|
$
|
1,909,719
|
|
$
|
2,177,488
|
|
|
$
|
1,857,273
|
|
$
|
2,492,090
|
|
|||
|
Gross profit
(1)
|
560,369
|
|
659,281
|
|
|
523,554
|
|
694,579
|
|
|||||||
|
Income from operations
(1)
|
87,332
|
|
162,527
|
|
|
52,866
|
|
142,009
|
|
|||||||
|
Net income
|
60,085
|
|
119,397
|
|
37,827
|
|
102,555
|
|
||||||||
|
Earnings per common share:
|
|
|
|
|
||||||||||||
|
Basic
(1)
|
$
|
0.59
|
|
$
|
1.21
|
|
|
$
|
0.39
|
|
$
|
1.09
|
|
|||
|
Diluted
(1)
|
$
|
0.59
|
|
$
|
1.20
|
|
|
$
|
0.39
|
|
$
|
1.07
|
|
|||
|
Weighted average common shares outstanding:
|
|
|
|
|
||||||||||||
|
Basic
|
101,384
|
|
98,716
|
|
|
96,677
|
|
94,193
|
|
|||||||
|
Diluted
|
102,153
|
|
99,591
|
|
|
97,890
|
|
95,490
|
|
|||||||
|
|
Fiscal 2017
|
|||||||||||||||
|
|
First
Quarter
|
Second
Quarter
|
Third
Quarter
|
Fourth
Quarter
|
||||||||||||
|
Net sales
|
$
|
1,825,252
|
|
$
|
2,156,911
|
|
|
$
|
1,944,187
|
|
$
|
2,664,122
|
|
|||
|
Gross profit
|
541,865
|
|
637,222
|
|
|
534,120
|
|
775,853
|
|
|||||||
|
Income from operations
|
90,068
|
|
159,190
|
|
50,001
|
|
178,315
|
|
||||||||
|
Net income
(1)
|
58,195
|
|
(2)
|
112,385
|
|
(3)
|
36,913
|
|
(4)
|
115,951
|
|
(5)
|
||||
|
Earnings per common share:
|
|
|
|
|
||||||||||||
|
Basic
(1)
|
$
|
0.53
|
|
$
|
1.04
|
|
|
$
|
0.35
|
|
$
|
1.11
|
|
|||
|
Diluted
|
$
|
0.52
|
|
$
|
1.03
|
|
|
$
|
0.35
|
|
$
|
1.11
|
|
|||
|
Weighted average common shares outstanding:
|
|
|
|
|
||||||||||||
|
Basic
|
110,441
|
|
108,175
|
|
|
105,466
|
|
104,052
|
|
|||||||
|
Diluted
|
111,406
|
|
108,679
|
|
|
105,814
|
|
104,669
|
|
|||||||
68
|
DICK'S SPORTING GOODS, INC. AND SUBSIDIARIES
NOTES TO CONSOLIDATED FINANCIAL STATEMENTS – (Continued)
|
||
|
(1)
|
Quarterly results for fiscal year do not add to full year results due to rounding.
|
|
(2)
|
Included TSA conversion costs of
$2.2 million
.
|
|
(3)
|
Included receipt of a contract termination payment totaling
$12.0 million
and charges attributable to a corporate restructuring of
$4.4 million
.
|
|
(4)
|
Included receipt of a multi-year sales tax refund totaling
$5.0 million
.
|
|
(5)
|
Included transition costs to enhance the Company's Scorecard loyalty program of
$7.2 million
and costs for a litigation contingency of
$4.2 million
. The fourth quarter of fiscal 2017 represents a
14 week
period, as fiscal 2017 included
53 weeks
.
|
19. Subsequent Event
On
February 22, 2019
, the Company's Board of Directors declared a quarterly cash dividend in the amount of
$0.275
per share on the Company's common stock and Class B common stock payable on
March 29, 2019
to stockholders of record as of the close of business on
March 15, 2019
.
ITEM 16. FORM 10-K SUMMARY
Not applicable.
69
|
Index to Exhibits
|
||||
|
Exhibit Number
|
Description
|
Method of Filing
|
||
|
3.1
|
Incorporated by reference to Exhibit 3.1 to the Registrant's Registration Statement on Form S-8, File No. 333-100656, filed on October 21, 2002
|
|||
|
3.2
|
Incorporated by reference to Exhibit 3.1 to the Registrant's Form 10-Q, File No. 001-31463, filed on September 9, 2004
|
|||
|
3.3
|
Incorporated by reference to Exhibit 3.1 to the Registrant's Current Report on Form 8-K, File No. 001-31463, filed on June 11, 2012
|
|||
|
4.1
|
Incorporated by reference to Exhibit 4.1 to the Registrant's Amendment No. 3 to Statement on Form S-1, File No. 333-96587, filed on September 27, 2002
|
|||
|
10.1
|
Incorporated by reference to Exhibit 10.5 to the Registrant's Form 10-Q, File No. 001-31463, filed on September 9, 2004
|
|||
|
10.2
|
Incorporated by reference to Exhibit 10.22 to Registrant's Form 10-K, File No. 001-31463, filed on March 23, 2006
|
|||
|
10.3
|
Incorporated by reference to Exhibit 10.31 to the Registrant's Annual Report on Form 10-K, File No. 001-31463, filed on March 16, 2012
|
|||
|
10.4*
|
Incorporated by reference to Exhibit 10.10 to the Registrant's Amendment No. 1 to Statement on Form S-1, File No. 333-96587, filed on August 27, 2002
|
|||
|
10.5*
|
Incorporated by reference to Exhibit 10.35 to the Registrant's Form 10-K, File No. 001-31463, filed on March 27, 2008
|
|||
|
10.5a*
|
Incorporated by reference to Exhibit 10.36 to the Registrant's Form 10-K, File No. 001-31463, filed on March 27, 2008
|
|||
|
10.5b*
|
Incorporated by reference to Exhibit 10.46 to the Registrant's Form 10-K, File No. 001-31463, filed on March 20, 2009
|
|||
|
10.5c*
|
Incorporated by reference to Exhibit 10.1 to the Registrant's Form 10-Q, File No. 001-31463, filed on August 30, 2018
|
|||
|
10.6*
|
Incorporated by reference to Annex A to the Registrant's Schedule 14A, File No. 001-31463, filed on April 21, 2010
|
|||
|
10.6a*
|
Incorporated by reference to Exhibit 10.1 to the Registrant's Quarterly Report on Form 10-Q, File No. 001-31463, filed on May 25, 2017
|
|||
|
10.6b*
|
Incorporated by reference to Exhibit 10.9 to the Registrant's Form 10-K, File No. 001-31463, filed on April 8, 2004
|
|||
|
Each management contract and compensatory plan has been marked with an asterisk (*).
|
||||
70
|
Exhibit Number
|
Description
|
Method of Filing
|
||
|
10.6c*
|
Incorporated by reference to Exhibit 10.1 to the Registrant's Current Report on Form 8-K, File No. 001-31463, filed on November 15, 2011
|
|||
|
10.7*
|
Incorporated by reference to Exhibit 99.1 to the Registrant's Current Report on Form 8-K, File No. 001-31463, filed on June 8, 2017
|
|||
|
10.7a*
|
Incorporated by reference to Exhibit 10.2 to the Registrant's Current Report on Form 8-K, File No. 001-31463, filed on June 11, 2012
|
|||
|
10.7b*
|
Incorporated by reference to Exhibit 10.4 to the Registrant's Quarterly Report on Form 10-Q, File No. 001-31463, filed on May 25, 2017
|
|||
|
10.7c*
|
Incorporated by reference to Exhibit 10.3 to the Registrant's Current Report on Form 8-K, File No. 001-31463, filed on June 11, 2012
|
|||
|
10.7d*
|
Incorporated by reference to Exhibit 10.3 to the Registrant's Quarterly Report on Form 10-Q, File No. 001-31463, filed on May 25, 2017
|
|||
|
10.7e*
|
Incorporated by reference to Exhibit 99.1 to the Registrant's Current Report on Form 8-K, File No. 001-31463, filed on March 20, 2017
|
|||
|
10.8
|
Incorporated by reference to Exhibit 10.1 to the Registrant's Current Report on Form 8-K, File No. 001-31463, filed on August 18, 2015
|
|||
|
10.8a
|
Incorporated by reference to Exhibit 10.1 to the Registrant's Quarterly Report on Form 10-Q, File No. 001-31463, filed on August 24, 2017
|
|||
|
10.8b
|
Incorporated by reference to Exhibit 10.1 to the Registrant's Current Report on Form 8-K, File No. 001-31463, filed on August 15, 2017
|
|||
|
10.8c
|
Incorporated by reference to Exhibit 10.3 to the Registrant's Quarterly Report on Form 10-Q, File No. 001-31463, filed on August 24, 2017
|
|||
|
Each management contract and compensatory plan has been marked with an asterisk (*).
|
||||
71
|
Exhibit Number
|
Description
|
Method of Filing
|
||
|
10.8d
|
Incorporated by reference to Exhibit 10.2 to the Registrant's Quarterly Report on Form 10-Q, File No. 001-31463, filed on August 30, 2018
|
|||
|
10.9
|
Incorporated by reference to Exhibit 10.1 to the Registrant's Current Report on Form 8-K, File No. 001-31463, filed on March 21, 2016
|
|||
|
21
|
Filed herewith
|
|||
|
23.1
|
Filed herewith
|
|||
|
31.1
|
|
Filed herewith
|
||
|
31.2
|
|
Filed herewith
|
||
|
32.1
|
|
Furnished herewith
|
||
|
32.2
|
|
Furnished herewith
|
||
|
101.INS
|
XBRL Instance Document
|
Filed herewith
|
||
|
101.SCH
|
XBRL Taxonomy Extension Schema Document
|
Filed herewith
|
||
|
101.CAL
|
XBRL Taxonomy Calculation Linkbase Document
|
Filed herewith
|
||
|
101.DEF
|
XBRL Taxonomy Definition Linkbase Document
|
Filed herewith
|
||
|
101.LAB
|
XBRL Taxonomy Label Linkbase Document
|
Filed herewith
|
||
|
101.PRE
|
XBRL Taxonomy Presentation Linkbase Document
|
Filed herewith
|
||
|
Each management contract and compensatory plan has been marked with an asterisk (*).
|
||||
Attached as Exhibits 101 to this report are the following financial statements from the Company's Annual Report on Form 10-K for the year ended
February 2, 2019
formatted in XBRL ("eXtensible Business Reporting Language"): (i) the Consolidated Statements of Income, (ii) the Consolidated Statements of Comprehensive Income, (iii) the Consolidated Balance Sheets, (iv) the Consolidated Statements of Changes in Stockholders' Equity, (v) the Consolidated Statements of Cash Flows and (vi) related notes to these Consolidated Financial Statements.
72
SIGNATURES
Pursuant to the requirements of Section 13 or 15(d) of the Securities Exchange Act of 1934, the registrant has duly caused this report to be signed on its behalf by the undersigned, thereunto duly authorized.
|
DICK'S SPORTING GOODS, INC.
(Registrant)
|
||
|
By: /s/ LEE J. BELITSKY
|
|
|
|
Lee J. Belitsky
Executive Vice President – Chief Financial Officer
|
||
|
Date: March 29, 2019
|
||
Pursuant to the requirements of the Securities Exchange Act of 1934, the report has been signed below by the following persons on behalf of the registrant and in the capacities and on the date indicated.
|
SIGNATURE
|
CAPACITY
|
DATE
|
|
/s/ EDWARD W. STACK
Edward W. Stack
|
Chairman, Chief Executive Officer and Director
|
March 29, 2019
|
|
/s/ LEE J. BELITSKY
Lee J. Belitsky
|
Executive Vice President – Chief Financial Officer (principal financial and accounting officer)
|
March 29, 2019
|
|
/s/ MARK J. BARRENECHEA
Mark J. Barrenechea
|
Director
|
March 29, 2019
|
|
/s/ VINCENT C. BYRD
Vincent C. Byrd
|
Director
|
March 29, 2019
|
|
/s/ EMANUEL CHIRICO
Emanuel Chirico
|
Director
|
March 29, 2019
|
|
/s/ WILLIAM J. COLOMBO
William J. Colombo
|
Vice Chairman and Director
|
March 29, 2019
|
|
/s/ JACQUALYN A. FOUSE
Jacqualyn A. Fouse
|
Director
|
March 29, 2019
|
|
/s/ LAUREN R. HOBART
Lauren R. Hobart |
Director
|
March 29, 2019
|
|
/s/ LAWRENCE J. SCHORR
Lawrence J. Schorr
|
Director
|
March 29, 2019
|
|
/s/ LARRY D. STONE
Larry D. Stone
|
Director
|
March 29, 2019
|
|
/s/ ALLEN WEISS
Allen Weiss
|
Director
|
March 29, 2019
|
73
REPORT OF INDEPENDENT REGISTERED PUBLIC ACCOUNTING FIRM
To the stockholders and Board of Directors of Dick’s Sporting Goods, Inc.
Opinion on the Financial Statement Schedule
We have audited the consolidated financial statements of Dick's Sporting Goods, Inc. and subsidiaries (the "Company") as of
February 2, 2019
and
February 3, 2018
, and for each of the three years in the period ended
February 2, 2019
, and the Company's internal control over financial reporting as of
February 2, 2019
, and have issued our reports thereon dated
March 29, 2019
; such consolidated financial statements and reports are included in this Annual Report on Form 10-K. Our audits also included the financial statement schedule of the Company listed in the Index at Item 15. This financial statement schedule is the responsibility of the Company's management. Our responsibility is to express an opinion on the Company’s financial statement schedule based on our audits. In our opinion, such financial statement schedule, when considered in relation to the financial statements taken as a whole, presents fairly, in all material respects, the information set forth therein.
/s/ Deloitte & Touche LLP
Pittsburgh, Pennsylvania
March 29, 2019
74
DICK'S SPORTING GOODS, INC. AND SUBSIDIARIES
SCHEDULE II
VALUATION AND QUALIFYING ACCOUNTS
(Dollars in thousands)
|
Balance at Beginning of Period
|
Charged to Costs and Expenses
|
Deductions
|
Balance at End of Period
|
||||||||||||
|
Fiscal 2016
|
|
|
|
|
|
||||||||||
|
Inventory reserve
|
$
|
36,622
|
|
$
|
57,692
|
|
|
$
|
(6,512
|
)
|
$
|
87,802
|
|
||
|
Allowance for doubtful accounts
|
2,727
|
|
4,834
|
|
|
(4,409
|
)
|
3,152
|
|
||||||
|
Reserve for sales returns
|
7,754
|
|
449,666
|
|
(449,220
|
)
|
8,200
|
|
|||||||
|
Allowance for deferred tax assets
|
5,304
|
|
—
|
|
(587
|
)
|
4,717
|
|
|||||||
|
Fiscal 2017
|
|
|
|
|
|
||||||||||
|
Inventory reserve
|
$
|
87,802
|
|
$
|
20,722
|
|
|
$
|
(58,723
|
)
|
$
|
49,801
|
|
||
|
Allowance for doubtful accounts
|
3,152
|
|
5,092
|
|
|
(4,756
|
)
|
3,488
|
|
||||||
|
Reserve for sales returns
|
8,200
|
|
489,607
|
|
(487,396
|
)
|
10,411
|
|
|||||||
|
Allowance for deferred tax assets
|
4,717
|
|
—
|
|
|
(4,717
|
)
|
—
|
|
||||||
|
Fiscal 2018
|
|
|
|
|
|
|
|
|
|
||||||
|
Inventory reserve
|
$
|
49,801
|
|
$
|
8,281
|
|
|
$
|
(14,042
|
)
|
$
|
44,040
|
|
||
|
Allowance for doubtful accounts
|
3,488
|
|
4,721
|
|
|
(5,246
|
)
|
2,963
|
|
||||||
|
Reserve for sales returns
|
10,411
|
|
476,692
|
|
(476,528
|
)
|
10,575
|
|
|||||||
|
Allowance for deferred tax assets
|
—
|
|
—
|
|
|
—
|
|
—
|
|
||||||
75
TABLE OF CONTENTS
Part IItem 1. BusinessItem 1A. Risk FactorsItem 1B. Unresolved Staff CommentsItem 2. PropertiesItem 3. Legal ProceedingsItem 4. Mine Safety DisclosuresPart IIItem 5. Market For Registrant's Common Equity, Related Stockholder Matters and Issuer Purchases Of Equity SecuritiesItem 6. Selected Financial DataItem 7. Management's Discussion and Analysis Of Financial Condition and Results Of OperationsItem 7A. Quantitative and Qualitative Disclosures About Market RiskItem 8. Financial Statements and Supplementary DataItem 9. Changes in and Disagreements with Accountants on Accounting and Financial DisclosureItem 9A. Controls and ProceduresItem 9B. Other InformationPart IIIItem 10. Directors, Executive Officers and Corporate GovernanceItem 11. Executive CompensationItem 12. Security Ownership Of Certain Beneficial Owners and Management and Related Shareholder MattersItem 13. Certain Relationships and Related Transactions, and Director IndependenceItem 14. Principal Accountant Fees and ServicesPart IVItem 15. Exhibits and Financial Statement SchedulesItem 16. Form 10-k Summary