DIGITAL REALTY TRUST, INC.
10-Ks and 10-Qs
|
|
|
|
|
|
|
|
|
|
|
|
|
|
|
|
|
|
|
|
|
|
|
|
|
|
|
|
|
|
|
|
|
|
|
|
|
|
|
|
|
|
|
|
|
|
|
|
|
|
|
|
|
|
|
|
UNITED STATES
SECURITIES AND EXCHANGE COMMISSION
WASHINGTON, D.C. 20549
FORM 10-K
|
x
|
Annual Report Pursuant to Section 13 or 15(d) of the Securities Exchange Act of 1934
|
For the fiscal year ended
December 31, 2018
|
¨
|
Transition Report Pursuant to Section 13 or 15(d) of the Securities Exchange Act of 1934
|
For the Transition Period From to .
|
Commission file number
|
|
001-32336 (Digital Realty Trust, Inc.)
|
|
|
000-54023 (Digital Realty Trust, L.P.)
|
|
DIGITAL REALTY TRUST, INC.
DIGITAL REALTY TRUST, L.P.
(Exact name of registrant as specified in its charter)
|
Maryland (Digital Realty Trust, Inc.)
Maryland (Digital Realty Trust, L.P.)
|
26-0081711
20-2402955
|
|
(State or other jurisdiction of incorporation or organization)
|
(IRS employer identification number)
|
|
Four Embarcadero Center, Suite 3200
San Francisco, CA
|
94111
|
|
(Address of principal executive offices)
|
(Zip Code)
|
(415) 738-6500
(Registrant’s telephone number, including area code)
Securities registered pursuant to Section 12(b) of the Act:
|
|
Title of each class
|
Name of each exchange on which registered
|
|
Digital Realty Trust, Inc.
|
Common Stock, $0.01 par value per share
|
New York Stock Exchange
|
|
Series C Cumulative Redeemable Perpetual
Preferred Stock, $0.01 par value per share |
New York Stock Exchange
|
|
|
Series G Cumulative Redeemable Preferred
Stock, $0.01 par value per share
|
New York Stock Exchange
|
|
|
Series H Cumulative Redeemable Preferred
Stock, $0.01 par value per share
|
New York Stock Exchange
|
|
|
Series I Cumulative Redeemable Preferred
Stock, $0.01 par value per share |
New York Stock Exchange
|
|
|
Series J Cumulative Redeemable Preferred
Stock, $0.01 par value per share |
New York Stock Exchange
|
|
|
Digital Realty Trust, L.P.
|
None
|
None
|
Securities registered pursuant to Section 12(g) of the Act:
|
Digital Realty Trust, Inc.
|
|
None
|
|
Digital Realty Trust, L.P.
|
|
Common Units of
Partnership Interest
|
Indicate by check mark if the registrant is a well-known seasoned issuer, as defined in Rule 405 of the Securities Act.
|
Digital Realty Trust, Inc.
|
Yes
x
No
o
|
|
Digital Realty Trust, L.P.
|
Yes
o
No
x
|
Indicate by check mark if the registrant is not required to file reports pursuant to Section 13 or Section 15(d) of the Act.
|
Digital Realty Trust, Inc.
|
Yes
o
No
x
|
|
Digital Realty Trust, L.P.
|
Yes
o
No
x
|
Indicate by check mark whether the registrant (1) has filed all reports required to be filed by Section 13 or 15(d) of the Securities Exchange Act of 1934 during the preceding 12 months (or for such shorter period that the registrant was required to file such reports), and (2) has been subject to such filing requirements for the past 90 days.
|
Digital Realty Trust, Inc.
|
Yes
x
No
o
|
|
Digital Realty Trust, L.P.
|
Yes
x
No
o
|
Indicate by check mark whether the registrant has submitted electronically every Interactive Data File required to be submitted pursuant to Rule 405 of Regulation S-T (§232.405 of this chapter) during the preceding 12 months (or for such shorter period that the registrant was required to submit such files).
|
Digital Realty Trust, Inc.
|
Yes
x
No
o
|
|
Digital Realty Trust, L.P.
|
Yes
x
No
o
|
Indicate by check mark if disclosure of delinquent filers pursuant to Item 405 of Regulation S-K (§ 229.405 of this chapter) is not contained herein, and will not be contained, to the best of registrant’s knowledge, in definitive proxy or information statements incorporated by reference in Part III of this Form 10-K or any amendment to this Form 10-K.
o
Indicate by check mark whether the registrant is a large accelerated filer, an accelerated filer, a non-accelerated filer, a smaller reporting company, or emerging growth company. See the definitions of “large accelerated filer,” “accelerated filer,” “smaller reporting company,” and “emerging growth company” in Rule 12b-2 of the Exchange Act.
Digital Realty Trust, Inc.:
|
Large accelerated filer
|
x
|
Accelerated filer
|
o
|
|
Non-accelerated filer
|
o
|
Smaller reporting company
|
o
|
|
Emerging growth company
|
o
|
||
Digital Realty Trust, L.P.:
|
Large accelerated filer
|
o
|
Accelerated filer
|
o
|
|
Non-accelerated filer
|
x
|
Smaller reporting company
|
o
|
|
Emerging growth company
|
o
|
||
If an emerging growth company, indicate by check mark if the registrant has elected not to use the extended transition period for complying with any new or revised financial accounting standards provided pursuant to Section 13(a) of the Exchange Act.
|
Digital Realty Trust, Inc.
|
o
|
|
Digital Realty Trust, L.P.
|
o
|
Indicate by check mark whether the registrant is a shell company (as defined in Rule 12b-2 of the Act).
|
Digital Realty Trust, Inc.
|
Yes
o
No
x
|
|
Digital Realty Trust, L.P.
|
Yes
o
No
x
|
The aggregate market value of the common equity held by non-affiliates of Digital Realty Trust, Inc. as of June 29, 2018 totaled approximately
$23 billion
based on the closing price for Digital Realty Trust, Inc.’s common stock on that day as reported by the New York Stock Exchange. Such value excludes common stock held by executive officers, directors and 10% or greater stockholders as of June 29, 2018. The identification of 10% or greater stockholders as of June 29, 2018 is based on Schedule 13G and amended Schedule 13G reports publicly filed before June 29, 2018. This calculation does not reflect a determination that such parties are affiliates for any other purposes.
There is no public trading market for the common units of Digital Realty Trust, L.P. As a result, the aggregate market value of the common units held by non-affiliates of Digital Realty Trust, L.P. cannot be determined.
Indicate the number of shares outstanding of each of the registrant’s classes of common stock, as of the latest practicable date.
Digital Realty Trust, Inc.:
|
Class
|
Outstanding at February 21, 2019
|
|
|
Common Stock, $.01 par value per share
|
207,823,842
|
|
DOCUMENTS INCORPORATED BY REFERENCE
Part III incorporates by reference portions of Digital Realty Trust, Inc.’s Proxy Statement for its
2019
Annual Meeting of Stockholders which the registrants anticipate will be filed no later than 120 days after the end of its fiscal year pursuant to Regulation 14A.
EXPLANATORY NOTE
This report combines the annual reports on Form 10-K for the year ended
December 31, 2018
of Digital Realty Trust, Inc., a Maryland corporation, and Digital Realty Trust, L.P., a Maryland limited partnership, of which Digital Realty Trust, Inc. is the sole general partner. Unless otherwise indicated or unless the context requires otherwise, all references in this report to “we,” “us,” “our,” “our Company” or “the Company” refer to Digital Realty Trust, Inc. together with its consolidated subsidiaries, including Digital Realty Trust, L.P. Unless otherwise indicated or unless the context requires otherwise, all references to “our Operating Partnership” or “the Operating Partnership” refer to Digital Realty Trust, L.P. together with its consolidated subsidiaries.
Digital Realty Trust, Inc. is a real estate investment trust, or REIT, and the sole general partner of Digital Realty Trust, L.P. As of
December 31, 2018
, Digital Realty Trust, Inc. owned an approximate
95.1%
common general partnership interest in Digital Realty Trust, L.P. The remaining approximate
4.9%
of the common limited partnership interests of Digital Realty Trust, L.P. are owned by non-affiliated third parties and certain directors and officers of Digital Realty Trust, Inc. As of
December 31, 2018
, Digital Realty Trust, Inc. owned all of the preferred limited partnership interests of Digital Realty Trust, L.P. As the sole general partner of Digital Realty Trust, L.P., Digital Realty Trust, Inc. has the full, exclusive and complete responsibility for the operating partnership’s day-to-day management and control.
We believe combining the annual reports on Form 10-K of Digital Realty Trust, Inc. and Digital Realty Trust, L.P. into this single report results in the following benefits:
|
•
|
enhancing investors’ understanding of our Company and our Operating Partnership by enabling investors to view the business as a whole in the same manner as management views and operates the business;
|
|
•
|
eliminating duplicative disclosure and providing a more streamlined and readable presentation since a substantial portion of the disclosure applies to both our Company and our Operating Partnership; and
|
|
•
|
creating time and cost efficiencies through the preparation of one combined report instead of two separate reports.
|
There are a few differences between our Company and our Operating Partnership, which are reflected in the disclosure in this report. We believe it is important to understand the differences between our Company and our Operating Partnership in the context of how we operate as an interrelated consolidated company. Digital Realty Trust, Inc. is a REIT, whose only material asset is its ownership of partnership interests of Digital Realty Trust, L.P. As a result, Digital Realty Trust, Inc. does not conduct business itself, other than acting as the sole general partner of Digital Realty Trust, L.P., issuing public equity from time to time and guaranteeing certain unsecured debt of Digital Realty Trust, L.P. and certain of its subsidiaries. Digital Realty Trust, Inc. itself does not issue any indebtedness but guarantees the unsecured debt of Digital Realty Trust, L.P. and certain of its subsidiaries and affiliates, as disclosed in this report. Digital Realty Trust, L.P. holds substantially all the assets of the Company and holds the ownership interests in the Company’s joint ventures. Digital Realty Trust, L.P. conducts the operations of the business and is structured as a partnership with no publicly traded equity. Except for net proceeds from public equity issuances by Digital Realty Trust, Inc., which are generally contributed to Digital Realty Trust, L.P. in exchange for partnership units, Digital Realty Trust, L.P. generates the capital required by the Company’s business through Digital Realty Trust, L.P.’s operations, by Digital Realty Trust, L.P.’s direct or indirect incurrence of indebtedness or through the issuance of partnership units.
The presentation of noncontrolling interests in operating partnership, stockholders’ equity and partners’ capital are the main areas of difference between the consolidated financial statements of Digital Realty Trust, Inc. and those of Digital Realty Trust, L.P. The common limited partnership interests held by the limited partners in Digital Realty Trust, L.P. are presented as limited partners’ capital within partners’ capital in Digital Realty Trust, L.P.’s consolidated financial statements and as noncontrolling interests in operating partnership within equity in Digital Realty Trust, Inc.’s consolidated financial statements. The common and preferred partnership interests held by Digital Realty Trust, Inc. in Digital Realty Trust, L.P. are presented as general partner’s capital within partners’ capital in Digital Realty Trust, L.P.’s consolidated financial statements and as preferred stock, common stock, additional paid-in capital and accumulated dividends in excess of earnings within stockholders’ equity in Digital Realty Trust, Inc.’s consolidated financial statements. The differences in the presentations between stockholders’ equity and partners’ capital result from the differences in the equity issued at the Digital Realty Trust, Inc. and the Digital Realty Trust, L.P. levels.
To help investors understand the significant differences between the Company and the Operating Partnership, this report presents the following separate sections for each of the Company and the Operating Partnership:
|
•
|
consolidated financial statements;
|
|
•
|
the following notes to the consolidated financial statements:
|
|
•
|
"Debt of the Company" and "Debt of the Operating Partnership";
|
|
•
|
"Income per Share" and "Income per Unit";
|
|
•
|
"Equity and Accumulated Other Comprehensive Loss, Net of the Company" and "Capital and Accumulated Other Comprehensive Loss of the Operating Partnership"; and
|
|
•
|
"Quarterly Financial Information";
|
|
•
|
Liquidity and Capital Resources in Management’s Discussion and Analysis of Financial Condition and Results of Operations;
|
|
•
|
Market for Registrant’s Common Equity, Related Stockholder Matters and Issuer Purchases of Equity Securities; and
|
|
•
|
Selected Financial Data.
|
This report also includes separate Item 9A. Controls and Procedures sections and separate Exhibit 31 and 32 certifications for each of the Company and the Operating Partnership in order to establish that the Chief Executive Officer and Chief Financial Officer of each entity has made the requisite certification and that the Company and the Operating Partnership are compliant with Rule 13a-15 or Rule 15d-15 of the Securities Exchange Act of 1934 and 18 U.S.C. §1350.
In order to highlight the differences between the Company and the Operating Partnership, the separate sections in this report for the Company and the Operating Partnership specifically refer to the Company and the Operating Partnership. In the sections that combine disclosure of the Company and the Operating Partnership, this report refers to actions or holdings as being actions or holdings of the Company. Although the Operating Partnership is generally the entity that enters into contracts and joint ventures and holds assets and debt, reference to the Company is appropriate because the business is one enterprise and the Company operates the business through the Operating Partnership.
As general partner with control of the Operating Partnership, Digital Realty Trust, Inc. consolidates the Operating Partnership for financial reporting purposes, and it does not have significant assets other than its investment in the Operating Partnership. Therefore, the assets and liabilities of Digital Realty Trust, Inc. and Digital Realty Trust, L.P. are the same on their respective consolidated financial statements. The separate discussions of Digital Realty Trust, Inc. and Digital Realty Trust, L.P. in this report should be read in conjunction with each other to understand the results of the Company on a consolidated basis and how management operates the Company.
In this report, “properties” and “buildings” refer to all or any of the buildings in our portfolio, including data centers and non-data centers, and “data centers” refers only to the properties or buildings in our portfolio that contain data center space.
DIGITAL REALTY TRUST, INC. AND DIGITAL REALTY TRUST, L.P.
FORM 10-K
FOR THE YEAR ENDED DECEMBER 31, 2018
TABLE OF CONTENTS
|
|
|
PAGE NO.
|
|
ITEM 1.
|
||
|
ITEM 1A.
|
||
|
ITEM 1B.
|
||
|
ITEM 2.
|
||
|
ITEM 3.
|
||
|
ITEM 4.
|
||
|
ITEM 5.
|
||
|
ITEM 6.
|
||
|
ITEM 7.
|
||
|
ITEM 7A.
|
||
|
ITEM 8.
|
||
|
ITEM 9.
|
||
|
ITEM 9A.
|
||
|
ITEM 9B.
|
||
|
ITEM 10.
|
||
|
ITEM 11.
|
||
|
ITEM 12.
|
||
|
ITEM 13.
|
||
|
ITEM 14.
|
||
|
ITEM 15.
|
||
|
ITEM 16.
|
||
PART I
ITEM 1. BUSINESS
The Company
Digital Realty Trust, Inc., through its controlling interest in Digital Realty Trust, L.P. and its subsidiaries, delivers comprehensive space, power, and interconnection solutions that enable its customers and partners to connect with each other and service their own customers on a global technology and real estate platform. We are a leading global provider of data center, colocation and interconnection solutions for customers across a variety of industry verticals ranging from cloud and information technology services, social networking and communications to financial services, manufacturing, energy, healthcare, and consumer products. Digital Realty Trust, Inc. operates as a real estate investment trust, or REIT, for federal income tax purposes.
As of
December 31, 2018
, our portfolio consisted of
214
data centers (including
18
data centers held as investments in unconsolidated joint ventures), of which
145
are located in the United States,
38
are located in Europe, 16 are located in Latin America,
seven
are located in Asia,
five
are located in Australia and
three
are located in Canada.
Digital Realty Trust, L.P., a Maryland limited partnership, is the entity through which Digital Realty Trust, Inc., a Maryland corporation, conducts its business of acquiring, developing, owning and operating data centers. Digital Realty Trust, Inc. was incorporated in the state of Maryland on March 9, 2004. Digital Realty Trust, L.P. was organized in the state of Maryland on July 21, 2004. Our principal executive offices are located at Four Embarcadero Center, Suite 3200, San Francisco, California 94111. Our telephone number is (415) 738-6500. Our website is www.digitalrealty.com.
Recent Acquisitions
On December 20, 2018, our Brazilian subsidiary, Stellar Participações Ltda., completed the acquisition of Ascenty, a leading data center provider in Brazil, from private equity firm Great Hill Partners in a transaction valued at approximately $1.8 billion, net of cash purchased. We believe this transaction, which we refer to as the Ascenty Acquisition, represented a significant extension of our global platform and established us as the premier data center solutions provider in the Latin America region. Separately, we entered into an independent bilateral equity commitment letter with Brookfield Infrastructure, an affiliate of Brookfield Asset Management, one of the largest owners and operators of infrastructure assets globally, under which Brookfield has committed to fund approximately $700 million, excluding Brookfield's share of transaction costs, in exchange for 49% of the total equity interests in a joint venture entity expected to ultimately own Ascenty. The agreement with Brookfield is subject to certain closing conditions and is expected to close in the first quarter of 2019.
On September 14, 2017, we completed the acquisition of DuPont Fabros Technology, Inc., or DFT, in an all-stock merger, which we refer to as the DFT Merger, for equity consideration of approximately $6.2 billion. We believe this transaction expanded our reach with a complementary portfolio in top U.S. metropolitan areas while enhancing our ability to meet the growing demand for hyper-scale and public cloud solutions and solidifying our blue-chip customer base.
On July 5, 2016, we completed the acquisition of a portfolio of eight high-quality, carrier-neutral data centers in Europe, which we refer to as the European Portfolio Acquisition, for a total purchase price of $818.9 million (based on the exchange rate at the date of acquisition). We believe the acquisition of these highly strategic assets in Amsterdam, Frankfurt and London enhanced our global colocation and interconnection platform.
On October 9, 2015, we acquired Telx Holdings, Inc., or Telx, a leading U.S. provider of data center colocation, interconnection and cloud enablement solutions, which we refer to as the Telx Acquisition, for approximately $1.9 billion. We believe this was a transformational transaction that established us as a leading provider of colocation and interconnection solutions in the U.S., and was highly complementary to our existing data center solutions.
1
Industry Background
We believe the data center industry is poised for sustainable growth. The demand for data center infrastructure is being driven by many factors, including the explosive growth of data, rapid growth of cloud adoption and greater demand for IT outsourcing. Computational processing power requirements continue to advance, data traffic is growing, and the volume of data that enterprises generate, transmit, process, analyze, monitor and manage is expanding dramatically. The Internet of Things, 5G, autonomous vehicles and artificial intelligence, among other technological advancements, are driving unprecedented growth of the digital economy, and data centers play an important role. The power requirements and financial costs to support this growth in data, traffic and storage are substantial and growing accordingly.
We believe cloud adoption represents the next generation of corporate IT outsourcing and remains a significant driver of demand for data infrastructure. The cloud is gaining traction because it enables corporate enterprises to achieve efficiencies and contain costs. In addition, the leading cloud service providers are generally mature, well-capitalized technology companies, and cloud platforms are among their fastest growing business segments. Large data centers that deploy computational resources and accompanying power, security and other services at significantly lower cost per unit than smaller ones, and coordinate and aggregate diverse customer, geographic and application demand, are poised to benefit from these cloud-specific industry drivers.
These diverse and secular industry dynamics are driving greater demand for data center capacity not only from global cloud service providers, but also from businesses as diverse as disaster recovery firms and IT service firms. As companies focus on their core competencies and rely on outsourcing to meet their needs, they are also prioritizing colocation for their data center solutions to reduce latency in data transfer. New technologies need a fast, reliable and flexible foundation to operate, and the importance of offering a full spectrum of power, space and connectivity solutions continues to grow.
Our Business
By providing a global real estate and technology platform that enables our customers and partners to connect with each other and service their own customers, we represent an important part of the digital economy that we believe will benefit from powerful, long-term growth drivers. Our platform brings together foundational real estate and innovative technology expertise to deliver a comprehensive, highly specialized product suite to meet customers’ scale, colocation, and connectivity needs. Our solutions help enable the global cloud revolution and provide the infrastructure for today’s growing digital economy.
We believe that the growth trends in the data center market, the cloud, Internet traffic and Internet-based services, combined with cost advantages in outsourcing data center requirements, provide attractive growth opportunities for us as a service provider and are only beginning to penetrate the data center market. Leveraging deep expertise in technology and real estate, we have an expansive global footprint, impressive scale and a full-spectrum product offering in key metropolitan areas around the world. These advantages simplify the contracting process for multinational enterprises, eliminating their need to contract with multiple local data center solutions providers. In addition, in areas where high data center construction and operating costs and long time-to-market prohibit many of our customers from building their own data centers, our global footprint and scale allow us to quickly and efficiently meet our customers' needs.
Digital Realty Pillars
Technology-Enabled Solutions Provider
Our global real estate and technology platform provides comprehensive, customizable solutions and global scale to meet customers’ constantly evolving and expanding data center needs. We provide the trusted foundation for the digital economy, powering our customers’ digital ambitions and supporting their growth.
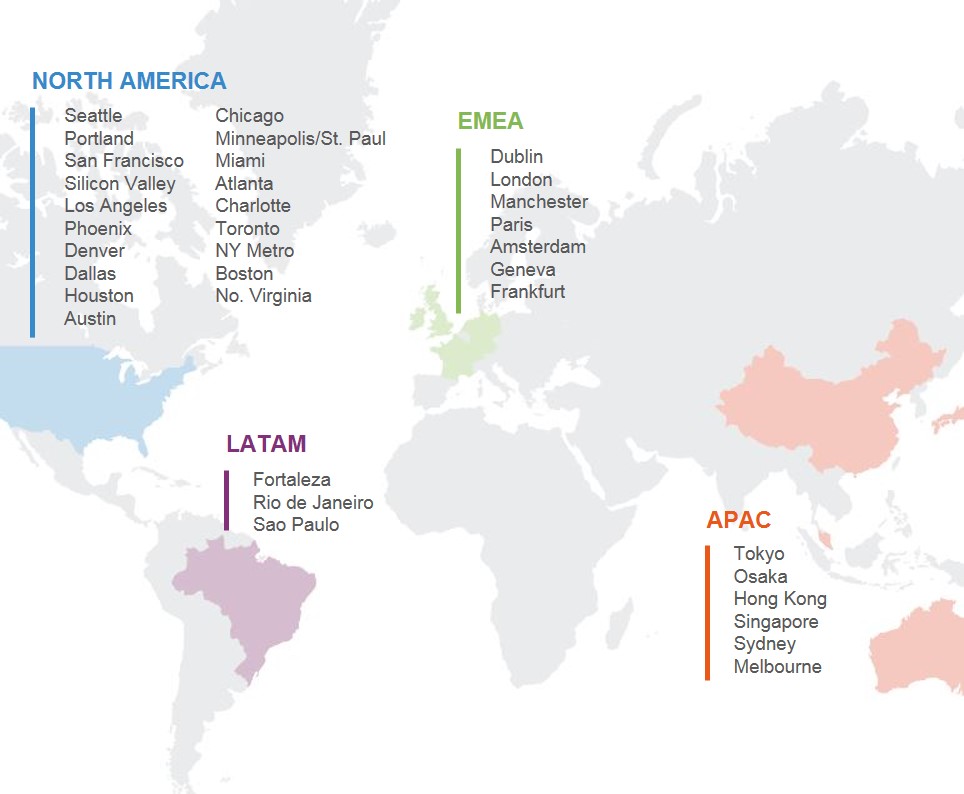
Global, Local and Interconnected
Our data centers are hyper-connected-hubs, strategically located in 35 key metro areas around the world. Our global strength is matched by the expertise of our local teams on the ground. Our data centers provide high-performance access to one of the largest ecosystem of interconnected networks, critical data center and cloud services, customers and partners.
Resiliency
Our record of resiliency, 12 consecutive years of “five-nines” (99.999%) uptime for facilities owned and operated by us, and our award-winning sustainability program ensure our customers’ high-performance networks are effective and
2
environmentally conscious. We design, own and manage data centers and are trusted with the critical IT infrastructures of companies globally, from small businesses to large multinational enterprises. We provide the critical digital foundations to store, manage, and connect our customers’ data, allowing them to focus on performance, innovation and accelerating their business growth.
Trusted Partner
We are a trusted partner for many of the most digitally ambitious companies in the world, helping safeguard their digital capital and driving their growth. Whether designing and delivering dedicated data center facilities, or solving cloud connectivity issues, our dedicated team of technical experts strives to ensure customer success through consistency in operations, customer care and ease of doing business.
Our Data Center Portfolio
Our portfolio of high-quality data centers provides secure, highly-connected and continuously available environments for the exchange, processing and storage of critical electronic information. Data centers are used for digital communication, disaster recovery purposes, transaction processing and housing mission-critical corporate IT applications. Our internet gateway data centers are highly interconnected, network-dense facilities that serve as hubs for internet and data communications within and between major metropolitan areas. We believe internet gateways are extremely valuable and a high-quality, highly interconnected global portfolio such as ours could not be easily replicated today on a cost-competitive basis.
Our global real estate and technology platform provides access to a network of 214 state-of-the-art, interconnected data centers, concentrated in 35 major metropolitan areas across 12 countries on five continents. We are diversified across major metropolitan areas characterized by a high concentration of connected end-users and technology companies. Northern Virginia represented 22% of total revenue for the year ended December 31, 2018, followed by Chicago with 13% of total revenue.
Through strategic investments, we have grown our presence in key metropolitan areas throughout North America, Europe, Latin America, Asia and Australia. Recent acquisitions have expanded our footprint into Latin America, enhanced our data center offerings in strategic and complementary U.S. metropolitan areas, established our colocation and interconnection platform in the U.S. and expanded our colocation and interconnection platform in Europe, each transaction enhancing our presence in top-tier locations throughout the U.S., Europe and Latin America.
The locations of and improvements to our data centers, the network density, interconnection infrastructure and connectivity-centric customers in certain of our facilities, and our comprehensive product offerings are critical to our
3
customers’ businesses, which we believe results in high occupancy levels, longer average lease terms and customer relationships, as well as lower turnover. In addition, many of our data centers contain significant improvements that have been installed at our customers’ expense. The tenant improvements in our data centers are generally readily adaptable for use by similar customers.
Our data centers are physically secure, network-rich and equipped to meet the power and cooling requirements of smaller footprints up to the most demanding IT applications. Many of our data centers are located on major aggregation points formed by the physical presence of multiple major telecommunications service providers, which reduces our customers’ costs and operational risks and enhances the attractiveness of our properties. In addition, our strategically located global data center campuses offer our customers the ability to expand their global footprint as their businesses grow, while our connectivity offerings on our campuses enhance the capabilities and attractiveness of these facilities. Further, the network density, interconnection infrastructure and connectivity-centric customers in certain of our data centers has led to the organic formation of densely interconnected ecosystems that are difficult for others to replicate and deliver added value to our customers.
Our portfolio contains a total of approximately
34.5 million
square feet, including approximately
3.4 million
square feet of space under active development and approximately
2.1 million
square feet of space held for future development. The 18 data centers held as investments in unconsolidated joint ventures have an aggregate of approximately
2.5 million
rentable square feet. The
26
parcels of developable land we own comprise approximately
959
acres. A significant component of our current and future growth is expected to be generated through the development of our existing space held for development and acquisition of new properties. As of December 31, 2018, our portfolio, including the 18 data centers held as investments in unconsolidated joint ventures and excluding space under active development and space held for future development, was approximately
89.0%
leased.
Our Diversified Product Offerings
We provide flexible, customer-centric data center solutions designed to meet the needs of companies of all sizes across multiple industry verticals around the world. Our data centers and comprehensive suite of product offerings are scalable to meet our customers’ needs, from a single rack or cabinet, up to multi-megawatt deployments, along with connectivity, interconnection and solutions to support their hybrid cloud architecture requirements. Over the past few years, we have expanded our product mix to appeal to a broader spectrum of data center customers, especially those seeking to support a greater portion of their data center requirements through a single provider. We are now one of the only data center providers with a comprehensive global product offering that covers the spectrum from single rack colocation to multiple megawatt deployments and connectivity around the world to suit our customers’ current needs and to enable their future growth. Our Critical Facilities Management® services and team of technical engineers and data center operations experts provide 24/7 support for these mission-critical facilities.
Colocation, Scale and Hyper-Scale Platform
.
|
Product Types & Names
|
Description
|
|
|
Colocation
|
Small (one cabinet) to medium (75 cabinets) deployments
Provides agility to quickly deploy in days
Contract length generally 2-3 years
Consistent designs, operational environment, power expenses
|
|
|
Scale & Hyperscale
Powered Base Building
®
Turn-Key Flex
®
|
Scale from medium (300+ kW) to very large deployments
Solution can be executed in weeks
Contract length generally 5-10+ years
Customized data center environment for specific deployment needs
|
|
Our colocation and Turn-Key Flex
®
data centers are move-in ready, physically secure facilities with the power and cooling capabilities to support customers requiring a single rack or cabinet up to mission-critical IT enterprise applications. We believe our colocation and Turn-Key Flex
®
facilities are effective solutions for customers who may lack the bandwidth, capital budget, expertise or desire to provide their own extensive data center infrastructure, management and security. For customers who possess the ability to build and operate their own facility, our Powered Base Building
®
solution provides the physical location, requisite power and network access necessary to support a state-of-the-art data center.
Additionally, our data center campuses offer our customers the opportunity to expand in or near their existing deployments within our data center campuses.
4
Interconnection and Cloud-Enablement Platform
|
Product
|
Description
|
|
|
Cross Connect
|
A Layer 1 connection between two customer defined end points in a Digital Realty facility
|
|
|
Campus Connect
|
Local, dedicated connectivity solution within Digital Realty campus environments located in hyperconnected metros around the world
|
|
|
Metro Connect
|
Dedicated connection between multiple Digital Realty facilities located in the same metro area
|
|
|
Internet Exchange
|
Peering with major carrier, content, and wireless networks on a single, highly-availability service platform
|
|
|
Service Exchange
|
Access to multiple connections through multiple service providers all from one portal
|
|
|
IP Bandwidth
|
Blended bandwidth upstream connectivity with routing to provide a fast, resilient, dedicated Internet connection
|
|
|
Pathway
|
Point-of-entry access for carriers, terminating into the POP or Meet Me Room within a given facility
|
|
Through our recent investments and strategic partnerships, we have significantly expanded our capabilities as a leading provider of interconnection and cloud-enablement services globally. We believe interconnection is an attractive line of business that would be difficult to build organically and enhances the overall value proposition of our colocation, scale and hyper-scale data center product offerings. Furthermore, through product offerings such as our Service Exchange and partnerships with cloud service providers, we are able to support our customers’ hybrid cloud architecture requirements.
Our Global Customers
Our portfolio has attracted a high-quality, diversified mix of customers. We have more than 2,300 customers, and no single customer represented more than approximately 6.8% of the aggregate annualized rent of our portfolio as of December 31, 2018. We provide each customer access to a choice of highly customized solutions based on their scale, colocation, and interconnection needs.
Global Customer Base across a Wide Variety of Industry Sectors
.
We use our in-depth knowledge of requirements for and trends impacting cloud and information technology service providers, content providers, network and communications providers, and other data center users, including enterprise customers, to market our data centers to meet these customers’ specific technology needs. Our customers are increasingly launching multi-regional deployments and growing with us internationally. Our largest customer, Facebook, accounted for approximately 6.8% of the aggregate annualized rent as of December 31, 2018 and no other single customer accounted for more than approximately 6.4% of the aggregate annualized rent of our portfolio. At December 31, 2018, our customers represented a variety of industry verticals, ranging from cloud and information technology services, communications and social networking to financial services, manufacturing, energy, gaming, life sciences and consumer products.
|
Cloud and IT Services
|
Digital Content Providers and Financial Companies
|
Network and Mobile Services
|
|
IBM
|
Facebook, Inc.
|
Verizon
|
|
Fortune 50 Software Company
|
Fortune 25 Investment Grade-Rated Company
|
AT&T
|
|
Cyxtera Technologies
|
LinkedIn
|
Comcast Corporation
|
|
Oracle America, Inc.
|
JPMorgan Chase & Co.
|
CenturyLink
|
|
Equinix
|
China Telecommunications Corporation
|
|
Proven Experience Attracting and Retaining Customers
.
Our specialized data center salesforce, which is aligned t o meet our customers’ needs for global, enterprise and network solutions, provides a robust pipeline of new customers, while
5
existing customers continue to grow and expand their utilization of our technology-enabled services to support a greater portion of their IT needs.
Below is a summary of our leasing activity for the year ended
December 31, 2018
(in millions):
|
Year Ended December 31, 2018
|
||||||||||||||
|
Commenced
|
Signed
|
|||||||||||||
|
Square Feet
|
Annualized GAAP Rent
|
Square Feet
|
Annualized GAAP Rent
|
|||||||||||
|
New
|
1.9
|
|
$
|
255
|
|
1.9
|
|
(1)
|
$
|
240
|
|
(1)
|
||
|
Renewals
|
2.0
|
|
$
|
312
|
|
2.0
|
|
$
|
330
|
|
||||
|
(1)
|
Includes signed new leases with existing customers totaling approximately 1.9 million square feet, which represent approximately $223 million in annualized GAAP rent.
|
Our Design and Construction Program
Our extensive development activity, operating scale and process-based approach to data center design and construction result in significant cost savings and added value for our customers. We have leveraged our purchasing power by securing global purchasing agreements and developing relationships with major equipment manufacturers, reducing costs and shortening delivery timeframes on key components, including major mechanical and electrical equipment. Utilizing our innovative modular data center design, we deliver what we believe to be a technically superior data center environment at significant cost savings. In addition, by utilizing our POD Architecture® to develop new Turn-Key Flex
®
facilities in our existing Powered Base Building
®
facilities, on average we can deliver a fully commissioned facility in under 30 weeks. Finally, our access to capital and investment-grade ratings allow us to provide data center solutions for customers who do not want to invest their own capital.
Our Investment Approach
We have developed detailed, standardized procedures for evaluating acquisitions and investments, including income-producing properties as well as vacant buildings and land suitable for development, to ensure that they meet our strategic, financial, technical and other criteria. These procedures, together with our in-depth knowledge of the technology, data center and real estate industries, allow us to identify strategically located properties and evaluate investment opportunities efficiently and, as appropriate, commit and close quickly. Our investment-grade ratings, along with our broad network of contacts within the data center industry, enable us to effectively capitalize on acquisition and investment opportunities.
Our Management Team and Organization
Our senior management team has many years of experience in the technology and/or real estate industries, including experience as investors in and advisors to technology companies. We believe that our senior management team’s extensive knowledge of both the technology and the real estate industries provides us with a key competitive advantage. Further, a significant portion of compensation for our senior management team and directors is in the form of common equity interests in our Company. We also maintain minimum stock ownership requirements for our senior management team and directors, further aligning their interests with those of external stockholders, as well as an employee stock purchase plan, which encourages our employees to increase their ownership in the Company.
Our Business and Growth Strategies
Our primary business objectives are to maximize: (i) sustainable long-term growth in earnings and funds from operations per share and unit, (ii) cash flow and returns to our stockholders and our Operating Partnership’s unitholders through the payment of dividends and distributions and (iii) return on invested capital. We expect to accomplish these objectives by achieving superior risk-adjusted returns, prudently allocating capital, diversifying our product offerings, accelerating our global reach and scale, and driving revenue growth and operating efficiencies.
Superior Risk-Adjusted Returns
.
We believe that achieving appropriate risk-adjusted returns on our business, including on our development pipeline and leasing transactions, will deliver superior stockholder returns. At December 31, 2018, we had
6
approximately
3.4 million
square feet of space under active development. We may continue to build out our development pipeline when justified by anticipated returns. We have established robust internal guidelines for reviewing and approving leasing transactions, which we believe will drive risk-adjusted returns. We also believe that providing an even stronger value proposition to our customers, including through new and more comprehensive product offerings, as well as continuing to improve operational efficiencies, will further drive improved returns for our business.
Prudently Allocate Capital
.
We believe that the accretive deployment of capital at sufficiently positive spreads above our cost of capital enables us to increase cash flow and create long-term stockholder value.
Strategic and Complementary Investments
.
We have developed significant expertise at underwriting, financing and executing data center investment opportunities. We employ a collaborative approach to deal analysis, risk management and asset allocation, focusing on key elements, such as market fundamentals, accessibility to fiber and power, and the local regulatory environment. In addition, the specialized nature of data centers makes these investment opportunities more difficult for traditional real estate investors to underwrite, resulting in reduced competition for investments relative to other property types. We believe this dynamic creates an opportunity for us to generate attractive risk-adjusted returns on our capital.
Preserve the Flexibility of Our Balance Sheet
. We are committed to maintaining a conservative capital structure. We target a debt-to-adjusted EBITDA ratio at or less than 5.5x, fixed charge coverage of greater than three times, and floating rate debt at less than 20% of total outstanding debt. In addition, we strive to maintain a well-laddered debt maturity schedule, and we seek to maximize the menu of our available sources of capital, while minimizing the related cost. Since Digital Realty Trust Inc.’s initial public offering in 2004, we have raised approximately $30.6 billion of capital through common (excluding forward contracts), preferred and convertible preferred equity offerings, exchangeable debt offerings, non-exchangeable bond offerings, our global revolving credit facility, our term loan facility, a senior notes shelf facility, secured mortgage financings and re-financings, joint venture partnerships and the sale of non-core assets. We endeavor to maintain financial flexibility while using our liquidity and access to capital to support operations, our acquisition, investment, leasing and development programs and global campus expansion, which are important sources of our growth.
Leverage Technology to Develop Comprehensive and Diverse Products
.
We have diversified our product offering, through acquisitions and organically through leveraging innovative technologies, and believe that we have one of the most comprehensive suites of global data center solutions available to customers from a single provider.
Global Service Infrastructure Platform
. With our recent acquisitions, which extended our footprint into Latin America, enhanced our portfolio of scale and hyper-scale data centers in the U.S. and established us as a leading provider of colocation, interconnection and cloud-enablement services globally, we are able to offer a broader range of data center solutions to meet our customers’ needs, from a single rack or cabinet to multi-megawatt deployments. We believe our products like Service Exchange and our partnerships with managed services and cloud service providers further enhance the attractiveness of our data centers.
Provide Foundational Services to Enable Customers and Partners
. We believe that the real estate platform, through which we offer the foundational services of space, power and connectivity, will enable our customers and partners to serve their customers and grow their businesses. We believe our Internet gateway data centers, individual data centers and data center campuses are attractive to a wide variety of customers and partners of all sizes. Furthermore, we believe our colocation and interconnection offerings, as well as the densely connected ecosystems that have developed within our facilities, and the availability and scalability of our comprehensive suite of products are valuable and critical to our customers and partners.
Accelerate Global Reach and Scale.
We have strategically pursued international expansion since our IPO in 2004 and now operate across five continents
.
We believe that our global multi-product data center portfolio is a foundational element of our strategy and our scale and global platform represent key competitive advantages difficult to replicate. Customers and competitors are recognizing the value of interconnected scale, which aligns with our connected campus strategy that enables customers to “land and expand” with us. We expect to continue to source and execute strategic and complementary transactions to strengthen our data center portfolio, expand our global footprint and product mix, and enhance our scale. In December 2018, we completed the acquisition of Ascenty, a leading data center provider in Brazil, immediately establishing Digital Realty as the premier data center solutions provider in the Latin America region.
Drive Revenue Growth and Operating Efficiencies
.
We aggressively manage our properties to maximize cash flow and control costs by leveraging our scale to drive operating efficiencies.
Leverage Strong Industry Relationships.
We use our strong industry relationships with international, national and regional corporate enterprise information technology groups and technology-intensive companies to identify and solve their
7
data center needs. Our sales professionals are technology and real estate industry specialists who can develop complex facility solutions for the most demanding data center and other technology customers.
Maximize Cash Flow
.
We often acquire properties with substantial in-place cash flow and some vacancy, which enables us to create upside through lease-up. We control our costs by negotiating expense pass-through provisions in customer agreements for operating expenses, including power costs and certain capital expenditure. We have also focused on centralizing functions and optimizing operations as well as improving processes and technologies. We believe that expanding our global data center campuses will also contribute to operating efficiencies because we expect to achieve economies of scale on our campus environments.
Sustainability
We believe that addressing sustainability by driving environmental efficiency through the implementation of cost-effective design and use of renewable energy serves as a key differentiator enabling us to deliver products that help attract and retain customers, generate cash flow, and manage operational risks. Ninety percent of our top 20 customers have publicly stated sustainability goals, further highlighting the competitive importance of our sustainability initiatives. Our sustainability platform includes the following:
|
•
|
We manage our data centers so that they offer high degrees of operational efficiencies for our customers. We benchmark and certify certain data centers in accordance with the U.S. Environmental Protection Agency, or EPA, Energy Star program, LEED
TM
, BREEAM, as well as other recognized third-party rating standards. A portion of our U.S. portfolio is enrolled in the U.S. Department of Energy’s Better Buildings Challenge for Data Centers.
|
|
•
|
We have developed solutions to help our customers efficiently utilize energy and water, and to help them procure renewable energy.
|
In 2018, we received the Nareit “Leader in the Light” award for data centers, recognizing our sustainability and energy-efficiency achievements.
Energy and resource management considerations are integrated into our business decisions. For the operating portfolio, annual capital expense investment planning identifies and evaluates resource efficiency project opportunities in a parallel but distinct process from non-resource-impacting capital investments. For acquisitions and new development activity, resiliency risks, resource availability, and renewable energy access are considered. Our design and construction process incorporates sustainable features that support resource efficiency during both construction as well as during eventual operational activity at the sites. We consider water availability, cost, and alternate supply solutions to potable water such as municipally supplied reclaimed water. We also consider cooling system designs to maximize ‘free cooling’ and reduce or eliminate the site’s reliance on access to water for cooling.
Sustainable Data Center Ratings
Data centers receiving third-party sustainable ratings in 2018 totaled approximately 1.4 million square feet, or approximately 44% of our total shell completions in 2018. We received the following sustainable data center ratings for all, or a portion of, the following sites:
|
•
|
44274 Round Table Plaza, Ashburn, VA USA
|
|
•
|
2220 De La Cruz Blvd Phase 3, Santa Clara, CA USA
|
|
•
|
1400 Devon Ave, Elk Grove Village, IL USA
|
|
•
|
Jan Wijsmullerdreef 10, Hoofddorp, Netherlands
|
We also received an operational phase recertification that totaled 370,500 square feet for 29A International Business Park, Jurong, Singapore.
In 2018, we achieved Energy Star for Data Centers recognition for all, or a portion of, the following sites, representing approximately 35% of our U.S. operating portfolio.
(1)
|
(1)
|
Percentage is based on U.S. stabilized assets, excluding Powered Base Building space, space under active development, space held for development, and space held in unconsolidated joint ventures.
|
8
Resource Conservation
We seek to proactively identify and support opportunities to efficiently utilize resources, such as energy and water, throughout our operating portfolio. In 2018, we completed 43 conservation projects primarily focusing on energy and water conservation.
Renewable Energy
In 2018, we entered into power purchase agreements to secure the renewable energy attributes from a solar farm in North Carolina to support the renewable energy needs of a customer in Virginia. We secured additional capacity from our previously announced solar farm contract in North Carolina, and we announced that our Chandler, Arizona portfolio has been enrolled in a utility solar program expected to supply a portion of the site’s energy requirements from utility-supplied solar energy. Our previously disclosed Texas wind farm and Virginia solar farm power purchase agreements produced a total of 428,470 MWh of renewable energy credits in 2018.
SASB
The Sustainability Accounting Standards Board (“SASB”) issued the Real Estate Owners, Developers & Investment Trusts Sustainability Accounting Standard guidance, which outlines proposed disclosure topics and accounting metrics for the real estate industry. We provide data on energy and water management metrics that best correlate with our business and industry as indicated in the following sections. The energy and water data we use is primarily collected and reviewed by third parties who compile the data from property utility statements. These metrics enable us to better manage our portfolio, track our progress on resource efficiency improvements, and track renewable energy sourcing.
Energy Data
|
Year
(1)
|
Energy Consumption Data Coverage as % of Floor Area
|
Total Energy Consumed by Portfolio Area with Data Coverage (MWh)
(2)
|
Grid Electricity Consumption as a % of Energy Consumption
|
% of Energy Generated from Renewable Resources
(3)
|
Like-for-Like Change in Energy Consumption of Portfolio Area with Data Coverage
(4)
|
MWh per Occupied kW
(5)
|
MWh per Occupied kW
Year over Year
% Change
|
|||
|
2017
(6)
|
81
|
%
|
5,813,940
|
|
96%
|
12.6%
|
(7)
|
3.7%
|
6.31
|
(3.0)%
|
|
2016
|
84
|
%
|
3,699,472
|
|
95%
|
23.4%
|
2.5%
|
6.50
|
(5.8)%
|
|
|
2015
|
77
|
%
|
3,252,836
|
|
95%
|
9.5%
|
n/a
|
6.90
|
n/a
|
|
|
(1)
|
Full-year 2018 energy data is not currently available. The most recent full year for which energy data is available is 2017.
|
|
(2)
|
The scope of energy includes: energy purchased from sources external to the Company and its customers; energy produced by the Company and its customers (i.e., self-generated); and energy from all other sources, including direct fuel usage, purchased electricity, and purchased chilled water.
|
|
(3)
|
Excludes renewable energy supplied by standard baseline utility fuel mix. Includes above-baseline utility renewables (e.g., green tariffs), Renewable Energy Credit (REC) purchases and RECs generated by the Company.
|
|
(4)
|
Data reported in MWh on a like-for-like comparison excludes properties which were acquired, disposed of, under development or redeveloped during the reported year.
|
|
(5)
|
We provide a “MWh per occupied kW” metric to assess relative resource use intensity. Excludes kW associated with Powered Base Building space.
|
|
(6)
|
Includes full-year data for properties acquired in the DFT Merger in 2017.
|
|
(7)
|
Reflects the growth of the portfolio due to the DFT Merger in 2017 as well as the conclusion of the Clean Start REC program at the end of 2016.
|
9
Water Data
|
Year
(1)
|
Water Consumption Data Coverage as % of Floor Area
|
Total Water Consumed by Portfolio Area with Data Coverage (kGal)
(2)
|
Like-for-Like Change in Water Consumption of Portfolio Area with Data Coverage
(3)
|
kGal per Occupied kW
(4)
|
Gal per Occupied kW
Year over Year
% Change
|
|||
|
2017
(5)
|
72
|
%
|
1,258,493
|
|
(6)
|
5.8%
|
1.37
|
69.2%
|
|
2016
|
64
|
%
|
459,127
|
|
(2.0)%
|
0.81
|
(5.8)%
|
|
|
2015
|
60
|
%
|
403,373
|
|
n/a
|
0.86
|
n/a
|
|
|
(1)
|
Full-year 2018 water data is not currently available. The most recent full year for which water data is available is 2017.
|
|
(2)
|
Data reported in kilo-gallons (kGal). The scope of water consumed includes potable and non-potable water purchased from third-party suppliers.
|
|
(3)
|
The like-for-like comparison excludes properties which were acquired, disposed, under development or redeveloped during the reported year.
|
|
(4)
|
We provide a “kGal per occupied kW” metric to assess relative resource use intensity. Excludes kGal associated with Powered Base Building space.
|
|
(5)
|
Includes full-year data for properties acquired in the DFT Merger in 2017.
|
|
(6)
|
This change is primarily attributable to the properties acquired in the DFT Merger in 2017, which predominantly utilize water-based cooling solutions.
|
Competition
We compete with numerous data center providers, many of whom own or operate properties similar to ours in some of the same metropolitan areas where our data centers are located, including CoreSite Realty Corporation, CyrusOne Inc., Equinix, Inc., QTS Realty Trust, Inc., Switch, Inc. and various local developers in the U.S., as well as Global Switch Holdings Limited and various regional operators in Europe, Asia, Latin America and Australia. See "We face significant competition, which may adversely affect the occupancy and rental rates of our data centers." in Item 1A. Risk Factors.
Geographic Information
Operating revenues from properties in the United States were
$2,482.1 million
,
$1,942.7 million
and
$1,670.2 million
and outside the United States were
$564.4 million
,
$515.2 million
and
$442.9 million
for the years ended
December 31, 2018
,
2017
and
2016
, respectively. We had investments in real estate located in the United States of
$11.1 billion
,
$10.5 billion
and
$6.3 billion
and outside the United States of
$3.8 billion
,
$3.1 billion
and
$2.6 billion
as of
December 31, 2018
,
2017
and
2016
, respectively.
Operating revenues from properties located in the United Kingdom were
$295.3 million
,
$275.1 million
and
$234.3 million
, or
9.7%
,
11.2%
and
11.1%
of total operating revenues, for the years ended
December 31, 2018
,
2017
and
2016
, respectively. No other foreign country comprised more than 10% of total operating revenues for each of these years. We had investments in real estate located in the United Kingdom of
$1.6 billion
,
$1.7 billion
and
$1.5 billion
, or
10.9%
,
12.1%
and
16.6%
of total investments in real estate, as of
December 31, 2018
,
2017
and
2016
, respectively. No other foreign country comprised more than 10% of total investments in real estate as of each of
December 31, 2018
,
2017
and
2016
. See “Ownership of data centers located outside of the United States subjects us to foreign currency and related risks which may adversely impact our ability to make distributions”, “Our international activities are subject to unique risks different than those faced by us in the United States and we may not be able to effectively manage our international business” and “We face risks with our international acquisitions associated with investing in unfamiliar metropolitan areas” in Item 1A. Risk Factors for risks relating to our international operations.
10
Regulation
General
Our properties are subject to various laws, ordinances and regulations, including regulations relating to common areas. We believe each of our properties as of
December 31, 2018
has the necessary permits and approvals to operate. Our properties must comply with Title III of the Americans with Disabilities Act of 1990, or the ADA, to the extent that such properties are “public accommodations” as defined by the ADA. We believe our properties are in substantial compliance with the ADA and that we will not be required to make substantial capital expenditures to address the requirements of the ADA. However, non-compliance with the ADA could result in imposition of fines or an award of damages to private litigants. See “We may incur significant costs complying with the Americans with Disabilities Act and similar laws.” in Item 1A. Risk Factors.
Environmental Matters
We are exposed to various environmental risks that may result in unanticipated losses and could affect our operating results and financial condition. Either the previous owners or we have conducted environmental reviews on a majority of the properties we have acquired, including land. While some of these assessments have led to further investigation and sampling, none of the environmental assessments have revealed an environmental liability that we believe would have a material adverse effect on our business, financial condition or results of operations. See "We could incur significant costs related to environmental matters, including from government regulation, private litigation, and existing conditions at some of our properties." in Item 1A. Risk Factors for further discussion.
Insurance
We carry commercial general liability, property, and business interruption insurance, including rental income loss coverage on all of the properties in our portfolio under a blanket program. We select policy specifications and insured limits which we believe to be appropriate given the relative risk of loss, the cost of coverage, and industry practice. We believe the properties in our portfolio are adequately insured. We do not carry insurance for generally uninsured exposures such as loss from war or nuclear reaction. In addition, we carry earthquake insurance on our properties in an amount and with deductibles we believe are commercially reasonable. We intend to partially fund the earthquake insurance deductibles through a captive insurance company we established in May 2014. Certain of the properties in our portfolio are located in areas known to be seismically active. See “Potential losses may not be covered by insurance.” in Item 1A. Risk Factors.
Employees
The geographic distribution of our global employee base as of
December 31, 2018
is summarized in the following table.
|
Region
|
Number of Employees
|
||
|
North America
|
1,148
|
|
|
|
Europe
|
284
|
|
|
|
Asia Pacific
|
98
|
|
|
|
Total
|
1,530
|
|
|
Available Information
All reports we file with the SEC are available free of charge via EDGAR through the SEC website at www.sec.gov. We will also provide copies of our Forms 8-K, 10-K, 10-Q, Proxy Statement and amendments to those documents at no charge to investors upon request and make electronic copies of such reports available through our website at www.digitalrealty.com as soon as reasonably practicable after filing such material with the SEC. The information found on, or otherwise accessible through, our website is not incorporated by reference into, nor does it form a part of, this report or any other document that we file with the SEC.
Offices
Our headquarters are located in San Francisco. We have regional U.S. offices in Boston, Chicago, Dallas, Los Angeles, New York, Northern Virginia and Phoenix and regional international offices in Amsterdam, Dublin, London,
São Paulo,
Singapore, Sydney, Tokyo and Hong Kong.
11
Reports to Security Holders
Digital Realty Trust, Inc. is required to send an annual report to its securityholders and to our Operating Partnership’s unitholders.
12
ITEM 1A. RISK FACTORS
For purposes of this section, the term “stockholders” means the holders of shares of Digital Realty Trust, Inc.’s common stock and preferred stock. Set forth below are the risks that we believe are material to Digital Realty Trust, Inc.’s stockholders and Digital Realty Trust, L.P.’s unitholders. You should carefully consider the following factors in evaluating our Company, our properties and our business. The occurrence of any of the following risks might cause Digital Realty Trust, Inc.’s stockholders and Digital Realty Trust, L.P.’s unitholders to lose all or a part of their investment. Some statements in this report, including statements in the following risk factors, constitute forward-looking statements. Please refer to the section entitled “Forward-Looking Statements” starting on page 37.
Risks Related to Our Business and Operations
Our business depends upon the demand for data centers.
We are in the business of owning, acquiring, developing and operating data centers. A reduction in the demand for data center space, power or connectivity would have a greater adverse effect on our business and financial condition than if we owned a portfolio with a more diversified customer base or less specialized use. Our substantial development activities make us particularly susceptible to general economic slowdowns as well as adverse developments in the data center, Internet and data communications and broader technology industries. Any such slowdown or adverse development could lead to reduced corporate IT spending or reduced demand for data center space. Reduced demand could also result from business relocations, including to metropolitan areas that we do not currently serve. Changes in industry practice or in technology could also reduce demand for the physical data center space we provide. In addition, our customers may choose to develop new data centers or expand their own existing data centers or consolidate into data centers that we do not own or operate, which could reduce demand for our newly developed data centers or result in the loss of one or more key customers. If any of our key customers were to do so, it could result in a loss of business to us or put pressure on our pricing. If we lose a customer, we cannot assure you that we would be able to replace that customer at a competitive rate or at all. Mergers or consolidations of technology companies could reduce further the number of our customers and potential customers and make us more dependent on a more limited number of customers. If our customers merge with or are acquired by other entities that are not our customers, they may discontinue or reduce the use of our data centers in the future. Our financial condition, results of operations, cash flow, cash available for distribution and ability to satisfy our debt service obligations could be materially adversely affected as a result of any or all of these factors.
We face significant competition, which may adversely affect the occupancy and rental rates of our data centers.
We compete with numerous data center providers, many of whom own properties similar to ours in some of the same metropolitan areas where our data centers are located, including CoreSite Realty Corporation, CyrusOne Inc., Equinix, Inc., QTS Realty Trust, Inc., Switch, Inc. and various local developers in the U.S., as well as Global Switch Holdings Limited and various regional operators in Europe, Asia, Latin America and Australia. In addition, we may in the future face competition from new entrants into the data center market, including new entrants who may acquire our current competitors. Some of our competitors and potential competitors have significant advantages over us, including greater name recognition, longer operating histories, pre-existing relationships with current or potential customers, significantly greater financial, marketing and other resources and more ready access to capital which allow them to respond more quickly to new or changing opportunities.
If our competitors offer space that our customers or potential customers perceive to be superior to ours based on factors such as available power, security, location, or connectivity, or if they offer rental rates below current market rates, or below the rental rates we are offering, we may lose customers or potential customers or be required to incur costs to improve our data centers or reduce our rental rates. In addition, recently many of our competitors have developed and continue to develop additional data center space. If the supply of data center space continues to increase as a result of these activities or otherwise, rental rates may be reduced or we may face delays in leasing or be unable to lease our vacant space, including space that we develop. Further, if customers or potential customers desire services that we do not offer, we may not be able to lease our space to those customers. Our financial condition, results of operations, cash flow, cash available for distribution and ability to satisfy our debt service obligations could be materially adversely affected as a result of any or all of these factors.
13
Any failure of our physical infrastructure or services could lead to significant costs and disruptions that could harm our business reputation and could adversely affect our earnings and financial condition.
Our business depends on providing customers with highly reliable services, including with respect to power supply, physical security and maintenance of environmental conditions. We may fail to provide such service as a result of numerous factors, including mechanical failure, power outage, human error, physical or electronic security breaches, war, terrorism, fire, earthquake, hurricane, flood and other natural disasters, sabotage and vandalism.
Problems at one or more of our data centers, whether or not within our control, could result in service interruptions or equipment damage. Substantially all of our customer leases include terms requiring us to meet certain service level commitments to our customers. Any failure to meet these or other commitments or any equipment damage in our data centers, including as a result of mechanical failure, power outage, human error or other reasons, could subject us to liability under our lease terms, including service level credits against customer rent payments, monetary damages, or, in certain cases of repeated failures, the right by the customer to terminate the lease. Service interruptions, equipment failures or security breaches may also expose us to additional legal liability and monetary damages and damage our brand and reputation, and could cause our customers to terminate or not renew their leases. In addition, we may be unable to attract new customers if we have a reputation for service disruptions, equipment failures or physical or electronic security breaches in our data centers. Any such failures could materially adversely affect our business, financial condition and results of operations.
We may be vulnerable to breaches, or unauthorized access to, or disruption of our physical and information security infrastructure and systems, any of which could disrupt our operations and have a material adverse effect on our financial condition and results of operations.
Security breaches, or disruption, of our or our customers’ physical or information technology infrastructure, networks and related management systems could result in, among other things, unauthorized access to our facilities, a breach of our and our customers’ networks and information technology infrastructure, the misappropriation of our or our customers’ or their customers’ proprietary or confidential information, interruptions or malfunctions in our or our customers’ operations, delays or interruptions to our ability to meet customer needs, breach of our legal, regulatory or contractual obligations, inability to access or rely upon critical business records or other disruptions in our operations. We may be required to expend significant financial resources to protect against or to remediate such security breaches. We may not be able to implement security measures in a timely manner or, if and when implemented, these measures could be circumvented. Any breaches that may occur could expose us to increased risk of lawsuits, material monetary damages, potential violations of applicable privacy and other laws, penalties and fines, loss of existing or potential customers, harm to our reputation and increases in our security and insurance costs, which could have a material adverse effect on our business, financial condition and results of operations.
Although our customers’ computing equipment resides in our buildings, we do not have access to, nor do we have knowledge of, what data is being housed and processed on their equipment. In the event of a breach resulting in loss of data, such as personally identifiable information or other such data protected by data privacy or other laws, we may be liable for damages, fines and penalties for such losses under applicable regulatory frameworks despite not handling the data. Further, the regulatory framework around data custody, data privacy and breaches varies by jurisdiction and is an evolving area of law. Similarly, new regulations such as the EU General Data Protection Regulation (GDPR) may have significant operational impact on our operations. If we fail to comply with these various regulations, we may have to pay fines or damages. We may not be able to limit our liability or damages in the event of such a loss.
We depend on significant customers, and many of our data centers are single-tenant properties or are currently occupied by single tenants.
As of December 31, 2018, the 20 largest customers in our portfolio represented approximately 53.5% of the total annualized rent generated by our properties. Our top three customers leased approximately 4.0 million square feet of net rentable space as of December 31, 2018, representing approximately 19.4% of the total annualized rent generated by our properties. In addition, 63 of our 214 data centers are occupied by single customers, including data centers occupied solely by our top three customers. Many factors, including global economic conditions, may cause our customers to experience a downturn in their businesses or otherwise experience a lack of liquidity, which may weaken their financial condition and result in their failure to make timely rental and other payments or their default under their agreements with us. Further, the development of new technologies, the adoption of new industry standards or other factors could render many of our customers’ current products and services obsolete or unmarketable and contribute to a downturn in their businesses, thereby increasing the likelihood that they default under their leases, become insolvent or file for bankruptcy. If any customer defaults or fails to make
14
timely rent or other payments, we may experience delays in enforcing our rights as landlord and may incur substantial costs in protecting our investment, which could adversely affect our financial condition and results of operations.
If any customer becomes a debtor in a case under the federal Bankruptcy Code, we cannot evict the customer solely because of the bankruptcy. In addition, the bankruptcy court might authorize the customer to reject and terminate its contracts with us. Our claim against the customer for unpaid, future rent and other payments would be subject to a statutory cap that might be substantially less than the remaining amounts actually owed under their agreements with us. In either case, our claim for unpaid rent and other amounts would likely not be paid in full. Our revenue and cash available for distribution could be materially adversely affected if any of our significant customers were to become bankrupt or insolvent, suffer a downturn in their businesses, fail to renew their contracts or renew on terms less favorable to us than their current terms. As of February 22, 2019, we had no material customers in bankruptcy.
Failure to attract, grow and retain a diverse and balanced customer base, including key magnet customers, could harm our business and operating results.
Our ability to attract, grow and retain a diverse and balanced customer base, consisting of a variety of enterprises, including cloud service providers, network service providers, and digital economy customers, some of which we consider to be key magnets drawing in other customers, may affect our ability to maximize our revenues. Dense and desirable customer concentrations within each facility enable us to better generate significant interconnection revenues, which in turn increases our overall revenues. Our ability to attract customers to our data centers will depend on a variety of factors, including our product offerings, the presence of carriers, the overall mix of customers, the presence of key customers attracting business through ecosystems, the data center’s operating reliability and security and our ability to effectively market our product offerings. Our inability to develop, provide or effectively execute any of these factors may hinder the development, growth and retention of a diverse and balanced customer base and adversely affect our business, financial condition and results of operations.
Our contracts with our customers could subject us to significant liability, which may adversely affect our business, results of operations and financial condition.
In the ordinary course of business, we enter into agreements with our customers pursuant to which we provide data center space, power and connectivity products to our customers. These contracts typically contain indemnification and liability provisions, in addition to service level commitments, which could potentially impose a significant cost on us in the event of losses arising out of certain breaches of such agreements, services to be provided by us or our subcontractors or from third-party claims. Customers increasingly are looking to pass through their regulatory obligations and other liabilities to their outsourced data center providers and we may not be able to limit our liability or damages in an event of loss suffered by such customers whether as a result of our breach of an agreement or otherwise. Further, liabilities and standards for damages and enforcement actions, including the regulatory framework applicable to different types of losses, vary by jurisdiction, and we may be subject to greater liability for certain losses in certain jurisdictions. Additionally, in connection with our acquisitions, we have assumed existing agreements with customers that may subject us to greater liability for such an event of loss. If such an event of loss occurred, we could be liable for material monetary damages and could incur significant legal fees in defending against such an action, which could adversely affect our financial condition and results of operations.
Certain of our customer agreements may include restrictions on the sale of our properties to certain third parties, which could have a material adverse effect on us, including our business, results of operations and financial condition.
Certain of our customer agreements may give the customer a right of first refusal to purchase certain properties if we propose to sell those properties to a third party or prohibit us from selling certain properties to a third party that is a competitor of the customer. The existence of such restrictions could hinder our ability to sell one or more of these properties, which could materially adversely affect our business, financial condition and results of operations.
Our data centers may not be suitable for re-leasing without significant expenditures or renovations.
Because many of our data centers contain tenant improvements installed at our customers’ expense, they may be better suited for a specific data center user or technology industry customer and could require significant modification in order for us to re-lease vacant space to another data center user or technology industry customer. The tenant improvements may also become outdated or obsolete as the result of technological change, the passage of time or other factors. In addition, our development space will generally require substantial improvement to be suitable for data center use. For the same reason, our properties also may not be suitable for leasing to traditional office customers without significant expenditures or renovations.
15
As a result, we may be required to invest significant amounts or offer significant discounts to customers in order to lease or re-lease that space, either of which could adversely affect our financial and operating results.
We may be unable to lease vacant or development space, renew leases, or re-lease space as leases expire.
At
December 31, 2018
, we owned approximately
3.4 million
square feet of space under active development and approximately
2.1 million
square feet of space held for future development. We intend to continue to add new space to our development inventory and to continue to develop additional space from this inventory. A portion of the space that we develop has been, and may continue to be, developed on a speculative basis, meaning that we do not have a signed customer agreement for the space when we begin the development process. We also develop space specifically for customers pursuant to agreements signed prior to beginning the development process. In those cases, if we fail to meet our development obligations under those agreements, these customers may be able to terminate the agreements and we would be required to find a new customer for this space. In addition, in certain circumstances we lease data center facilities prior to their completion. If we fail to complete the facilities in a timely manner, the customer may be entitled to terminate its agreement, seek damages or penalties against us or pursue other remedies and we may be required to find a new customer for the space. We cannot assure you that once we have developed space or land we will be able to successfully lease it at all, or at rates we consider favorable or expected at the time we commenced development. Further, once development of a data center facility is complete, we incur certain operating expenses even if there are no customers occupying any space. If we are not able to complete development in a timely manner or successfully lease the space that we develop, if development costs are higher than we currently estimate, or if lease rates are lower than expected when we began the project or are otherwise undesirable, our financial condition, results of operations, cash flow, cash available for distribution and ability to satisfy our debt service obligations could be materially adversely affected.
In addition, as of
December 31, 2018
, customer agreements representing
22.1%
of the square footage of the properties in our portfolio, excluding month-to-month leases and space held for development, were scheduled to expire through 2020, and an additional
11.6%
of the net rentable square footage, excluding space held for development, was available to be leased. Some of this space may require substantial capital investment to meet the power and cooling requirements of our customers, or may no longer be suitable for their needs. In addition, we cannot assure you that customer agreements will be renewed or that our properties will be re-leased at all, or at net effective rental rates equal to or above the current average net effective rental rates. If the rental rates for our properties decrease, our existing customers do not renew their agreements, we do not lease or re-lease our available space, including newly developed space and space for which customer agreements are scheduled to expire, or it takes longer for us to lease or re-lease this space or for rents to commence on this space, our financial condition, results of operations, cash flow, cash available for distribution and ability to satisfy our debt service obligations could be materially adversely affected.
Additionally, a customer’s decision to lease space and power in one of our data centers and to purchase additional products typically involves a significant commitment of resources and due diligence on the part of our customers regarding the adequacy of our facilities. As a result, the leasing of data center space can have a long sales cycle, and we may expend significant time and resources in pursuing a particular transaction that may not result in revenue. Economic conditions, including market downturns, may further impact this long sales cycle by making it difficult for customers to plan future business activities, which could cause customers to slow spending or delay decision‑making. Our inability to adequately manage the risks associated with the sales cycle may adversely affect our business, financial condition and results of operations.
Even if we have additional space available for lease at any one of our data centers, our ability to lease this space to existing or new customers could be constrained by our ability to provide sufficient electrical power.
As current and future customers increase their power footprint in our data centers over time, the corresponding reduction in available power could limit our ability to increase occupancy rates or network density within our existing data centers. Furthermore, at certain of our data centers, our aggregate maximum contractual obligation to provide power and cooling to our customers may exceed the physical capacity at such data centers if customers were to quickly increase their demand for power and cooling. If we are not able to increase the available power and/or cooling or move the customer to another location within our data centers with sufficient power and cooling to meet such demand, we could lose the customer as well as be exposed to liability under our customer agreements. In addition, our power and cooling systems are difficult and expensive to upgrade. Accordingly, we may not be able to efficiently upgrade or change these systems to meet new demands without incurring significant costs that we may not be able to pass on to our customers. Any such material loss of customers, liability or additional costs could adversely affect our business, financial condition and results of operations.
16
Our portfolio depends upon local economic conditions and is geographically concentrated in certain locations.
Our portfolio is located in 35 metropolitan areas. As of
December 31, 2018
, our portfolio, including the 18 data centers held as investments in unconsolidated joint ventures, was geographically concentrated in the following metropolitan areas:
|
Metropolitan Area
|
Percentage of December 31, 2018 total annualized rent (1)
|
|
|
Northern Virginia
|
23.2
|
%
|
|
Chicago
|
11.8
|
%
|
|
Silicon Valley
|
9.0
|
%
|
|
New York
|
8.4
|
%
|
|
London, United Kingdom
|
8.4
|
%
|
|
Dallas
|
7.7
|
%
|
|
Singapore
|
3.6
|
%
|
|
Phoenix
|
3.6
|
%
|
|
San Francisco
|
2.6
|
%
|
|
Sao Paulo, Brazil
|
2.6
|
%
|
|
Seattle
|
2.3
|
%
|
|
Atlanta
|
2.1
|
%
|
|
Amsterdam, Netherlands
|
1.9
|
%
|
|
Other
|
12.8
|
%
|
|
Total
|
100.0
|
%
|
|
(1)
|
Annualized rent is monthly contractual rent (defined as cash base rent before abatements) under existing leases as of
December 31, 2018
, multiplied by 12. The aggregate amount of abatements for the year ended
December 31, 2018
was approximately $47.4 million.
|
Some of these areas have experienced downturns in recent years. We depend upon the local economic conditions in these areas, including local real estate conditions, and our operations, revenue and cash available for distribution could be materially adversely affected by a downturn in local economic conditions in these areas. Our operations may also be affected if too many competing properties are built in any of these areas or supply otherwise increases or exceeds demand. We cannot assure you that these locations will grow or will remain favorable to data center investments or operations. In addition, we are currently developing data centers in certain of these metropolitan areas. Any negative changes in real estate, technology or economic conditions in these metropolitan areas in particular could negatively impact our performance.
We lease or sublease certain of our data center space from third parties and the ability to retain these leases or subleases could be a significant risk to our ongoing operations.
We do not own 16 buildings that account for approximately 1.3 million rentable square feet, or approximately 4% of our total rentable square feet. These leased buildings accounted for $160.6 million of our total annualized rent as of
December 31, 2018
. In addition, we may acquire additional leased data center space or businesses that lease facilities instead of owning them. Our business could be harmed if we are unable to renew the leases for these data centers on favorable terms or at all. Additionally, in several of our smaller facilities we sublease our space, and our rights under these subleases are dependent on our sublandlord retaining its rights under the prime lease. When the primary terms of our existing leases expire, we generally have the right to extend the terms of our leases for one or more renewal periods, subject to, in the case of several of our subleases, our sublandlord renewing its term under the prime lease. If renewal rates are less favorable than those we currently have, we may be required to increase revenues within existing data centers to offset such increase in lease payments. Failure to increase revenues to sufficiently offset these projected higher costs could adversely impact our operating income. Upon the end of our renewal options, we would have to renegotiate our lease terms with the applicable landlords.
Additionally, if we are unable to renew the lease at any of our data centers, we could lose customers due to the disruptions in their operations caused by the relocation. We could also lose those customers that choose our data centers based on their
17
locations. The costs of relocating data center infrastructure equipment, such as generators, power distribution units and cooling units, to different data centers could be prohibitive and, as such, we could lose the value of this equipment. For these reasons, any lease that cannot be renewed could adversely affect our business, financial condition and results of operations.
We may not be able to adapt to changing technologies and customer requirements and our data center infrastructure may become obsolete.
The technology industry generally and specific industries in which certain of our customers operate are characterized by rapidly changing technology, customer requirements and industry standards. New systems to deliver power to or eliminate heat in data centers or the development of new server technology that does not require the levels of critical load and heat removal that our facilities are designed to provide and could be run less expensively on a different platform could make our data center infrastructure obsolete. Our power and cooling systems are difficult and expensive to upgrade, and we may not be able to efficiently upgrade or change these systems to meet new demands without incurring significant costs that we may not be able to pass on to our customers which could adversely impact our business, financial condition and results of operations. In addition, the infrastructure that connects our data centers to the Internet and other external networks may become insufficient, including with respect to latency, reliability and connectivity. We may not be able to adapt to changing technologies or meet customer demands for new processes or technologies in a timely and cost-effective manner, if at all, which would adversely impact our ability to sustain and grow our business.
Further, our inability to adapt to changing customer requirements may make our data centers obsolete or unmarketable to such customers. Some of our customers operate at significant scale across numerous data center facilities and have designed cloud and computing networks with redundancies and fail-over capabilities across these facilities, which enhances the resiliency of their networks and applications. As a result, these customers may realize cost benefits by locating their data center operations in facilities with less electrical or mechanical infrastructure redundancy than is found in our existing data center facilities. Additionally, some of our customers have begun to operate their data centers using a wider range of humidity levels and at temperatures that are higher than servers customarily have operated at in the past, all of which may result in energy cost savings for these customers. We may not be able to operate our existing data centers under these environmental conditions, particularly in multi-tenant facilities with other customers who are not willing to operate under these conditions, and our data centers could be at a competitive disadvantage to facilities that satisfy such requirements. Because we may not be able to modify the redundancy levels or environmental systems of our existing data centers cost effectively, these or other changes in customer requirements could have a material adverse effect on our business, results of operations and financial condition.
Additionally, due to regulations that apply to our customers as well as industry standards, such as ISO and SOC certifications which customers may deem desirable, they may seek specific requirements from their data centers that we are unable to provide. If new or different regulations or standards are adopted or such extra requirements are demanded by our customers, we could lose some customers or be unable to attract new customers in certain industries, which could materially and adversely affect our operations.
We depend upon third-party suppliers for power, and we are vulnerable to service failures and to price increases by such suppliers and to volatility in the supply and price of power in the open market.
We rely on third parties to provide power to our data centers, and we cannot ensure that these third parties will deliver such power in adequate quantities or on a consistent basis. If the amount of power available to us is inadequate to support our customer requirements, we may be unable to satisfy our obligations to our customers or grow our business. In addition, our data centers may be susceptible to power shortages and planned or unplanned power outages caused by these shortages. Power outages may last beyond our backup and alternative power arrangements, which would harm our customers and our business. Any loss of services or equipment damage could adversely affect both our ability to generate revenues and our operating results, and harm our reputation.
In addition, we may be subject to risks and unanticipated costs associated with obtaining power from various utility companies. Utilities that serve our data centers may be dependent on, and sensitive to price increases for, a particular type of fuel, such as coal, oil or natural gas. In addition, the price of these fuels and the electricity generated from them could increase as a result of proposed legislative measures related to climate change or efforts to regulate carbon emissions. Increases in the cost of power at any of our data centers would put those locations at a competitive disadvantage relative to data centers served by utilities that can provide less expensive power.
We have also entered into power purchase agreements with contract terms ranging from 10-15 years. These agreements require us to purchase renewable energy credits from producers at fixed prices over the terms of the contracts, subject to certain adjustments. In the event that the market price for energy decreases, we may be required to pay more under the power purchase agreements than we would otherwise if we were to purchase renewable energy credits on the open market, which could
18
adversely affect our results of operations. Additionally, interruptions in the operations of one or more of the suppliers under these agreements, as a result of unpredictable weather, natural phenomena or otherwise, could negatively impact the quantity of renewable energy credits delivered to us.
We depend on third parties to provide network connectivity to the customers in our data centers and any delays or disruptions in connectivity may materially adversely affect our operating results and cash flow.
We are not a telecommunications carrier. Although our customers generally are responsible for providing their own network connectivity, we still depend upon the presence of telecommunications carriers’ fiber networks serving our data centers in order to attract and retain customers. We believe that the availability of carrier capacity will directly affect our ability to achieve our projected results. Any carrier may elect not to offer its services within our data centers. Any carrier that has decided to provide network connectivity to our data centers may not continue to do so for any period of time. Further, some carriers are experiencing business difficulties or have announced consolidations. As a result, some carriers may be forced to downsize or terminate connectivity within our data centers, which could have an adverse effect on the business of our customers and, in turn, our own operating results.
Our data centers may require construction and operation of a sophisticated redundant fiber network. The construction required to connect multiple carrier facilities to our data centers is complex and involves factors outside of our control, including regulatory requirements and the availability of construction resources. We have obtained the right to use network resources owned by other companies, including rights to use dark fiber, in order to attract telecommunications carriers and customers to our portfolio. If the establishment of highly diverse network connectivity to our data centers does not occur, is materially delayed or is discontinued, or is subject to failure, our operating results and cash flow may be materially adversely affected. Additionally, any hardware or fiber failures on this network may result in significant loss of connectivity to our data centers. This could negatively affect our ability to attract new customers or retain existing customers, which could have an adverse effect on our business, financial condition and results of operations.
Our international activities, including ownership, operation and acquisition of data centers located outside of the United States, subject us to risks different than those faced by us in the United States and we may not be able to effectively manage our international business.
Our portfolio included 69 data centers located outside of the United States at
December 31, 2018
. We have acquired and developed, and may continue to acquire and develop, and operate data centers outside the United States.
The ownership and operation of data centers located outside of the United States subjects us to risks from fluctuations in exchange rates between foreign currencies and the U.S. dollar. Changes in the relation of these currencies to the U.S. dollar will affect our revenues and operating margins, may materially adversely impact our financial condition, results of operations, cash flow, cash available for distribution and ability to satisfy our debt obligations. We may attempt to mitigate some or all of the risk of currency fluctuation by financing our properties in the local currency denominations, although we cannot assure you that we will be able to do so or that this will be effective. We may also engage in direct hedging activities to mitigate the risks of exchange rate fluctuations in a manner consistent with our qualifications as a REIT, although we cannot assure you that we will be able to do so or that this will be effective.
Our foreign operations involve additional risks not generally associated with investments in the United States, including:
|
•
|
our limited knowledge of and relationships with sellers, customers, contractors, suppliers or other parties in these metropolitan areas;
|
|
•
|
complexity and costs associated with managing international development and operations;
|
|
•
|
difficulty in hiring qualified management, sales and construction personnel and service providers in a timely fashion;
|
|
•
|
the adoption and expansion of trade restrictions or the occurrence of trade wars;
|
|
•
|
differing employment practices and labor issues;
|
|
•
|
multiple, conflicting and changing legal, regulatory, entitlement and permitting, and tax and treaty environments;
|
|
•
|
exposure to increased taxation, confiscation or expropriation;
|
|
•
|
currency transfer restrictions and limitations on our ability to distribute cash earned in foreign jurisdictions to the United States;
|
|
•
|
difficulty in enforcing agreements in non-U.S. jurisdictions, including those entered into in connection with our acquisitions or in the event of a default by one or more of our customers, suppliers or contractors;
|
|
•
|
local business and cultural factors; and
|
|
•
|
political and economic instability, including sovereign credit risk, in certain geographic regions.
|
19
We also face risks with investing in unfamiliar metropolitan areas. We have acquired and may continue to acquire properties in international metropolitan areas that are new to us. When we acquire properties located in these metropolitan areas, we may face risks associated with a lack of market knowledge or understanding of the local economy and culture, forging new business relationships in the area and unfamiliarity with local government and permitting procedures. In addition, due diligence, transaction and structuring costs may be higher than those we may face in the United States. We work to mitigate such risks through extensive diligence and research and associations with experienced local partners; however, we cannot assure you that all such risks will be eliminated.
Our inability to overcome these risks could adversely affect our foreign operations and could harm our business and results of operations.
The results of the United Kingdom’s referendum on withdrawal from the European Union may have a negative effect on global economic conditions, financial markets and our business, which could adversely affect our results of operations.
We are a global company with worldwide operations, including material business operations in Europe. In June 2016, a majority of voters in the United Kingdom elected to withdraw from the European Union in a national referendum, referred to as Brexit. The referendum was advisory, and the terms of any withdrawal are subject to continuing negotiation. Nevertheless, the referendum has created significant uncertainty about the future relationship between the United Kingdom and the European Union, and has given rise to calls for the governments of other European Union member states to consider withdrawal.
These developments, or the perception that any of them could occur, have had and may continue to have a material adverse effect on global economic conditions and the stability of global financial markets, and could significantly reduce global market liquidity and restrict the ability of key market participants to operate in certain financial markets. Asset valuations, currency exchange rates and credit ratings may be especially subject to increased market volatility. Lack of clarity about future United Kingdom laws and regulations as the United Kingdom determines which European Union laws to replace or replicate in the event of a withdrawal could depress economic activity and restrict our access to capital in the United Kingdom. If the United Kingdom and the European Union are unable to negotiate acceptable withdrawal terms or if other European Union member states pursue withdrawal, barrier-free access between the United Kingdom and other European Union member states or among the European economic area overall could be diminished or eliminated. Brexit could lead to legal uncertainty and potentially divergent national laws and regulations as the United Kingdom determines which European Union laws to replace and replicate. Any of these factors could have a material adverse effect on our business, financial condition and results of operations.
Our recent acquisitions may not achieve the intended benefits or may disrupt our plans and operations.
Acquisitions present many risks, and we may not realize the financial or strategic goals that were contemplated at the time of the transaction. We completed the Telx Acquisition in October 2015, the European Portfolio Acquisition in July 2016, the DFT Merger in September 2017 and the acquisition of Ascenty in December 2018. Our ability to realize the anticipated benefits of these and other acquisitions depends, to a large extent, on our ability to integrate each of them with our business. The combination of two independent businesses can be a complex, costly and time-consuming process, which requires significant time and focus from our management team and may divert attention from the day-to-day operations of our business. There can be no assurance that we will be able to successfully integrate acquired properties and businesses with our business or otherwise realize the expected benefits of these acquisitions. The expected synergies from the acquisitions may not be fully realized, which could result in increased costs and have a material adverse effect on our business, financial condition, results of operations, cash flows and the trading price of our common stock.
In addition, the overall integration of the businesses may result in material unanticipated problems, expenses, liabilities, competitive responses and loss of customer relationships, among other potential adverse consequences. Actual integration costs may exceed those estimated and there may be further unanticipated costs and the assumption of known and unknown liabilities. While we have assumed that we will incur certain integration expenses, there are factors beyond our control that could affect the total amount or the timing of such expenses. Many of the expenses that will be incurred, by their nature, are difficult to estimate accurately. If we cannot integrate and operate acquired properties or businesses to meet our financial expectations, our financial condition, results of operations, cash flow, cash available for distribution and ability to satisfy our debt service obligations could be materially adversely affected.
20
The risks of combining businesses include, among others:
|
•
|
we may have underestimated the costs to make any necessary improvements to the acquired properties;
|
|
•
|
the acquired properties may be subject to reassessment, which may result in higher than expected property tax payments;
|
|
•
|
we may be unable to integrate new acquisitions quickly and efficiently, particularly acquisitions of operating businesses or portfolios of properties, into our existing operations;
|
|
•
|
we may face difficulties in integrating employees and in retaining key personnel;
|
|
•
|
we may face challenges in keeping existing customers, including key customers, which could adversely impact our revenue;
|
|
•
|
we may be unable to effectively manage our expanded operations; and
|
|
•
|
market conditions may result in higher than expected vacancy rates and lower than expected rental rates on acquired properties.
|
Any one of these risks could result in increased costs, decreases in the amount of expected revenue and diversion of our management’s time and energy, which could have a material adverse effect on our business, financial condition, results of operations and cash flows. In addition, even if our operations are integrated successfully with the operations of our acquisitions, we may not realize the full benefits of the acquisitions, including the synergies, operating efficiencies, or sales or growth opportunities that are expected. These benefits may not be achieved within the anticipated time frame or at all. All of these factors could decrease or delay any potential accretive effect of the acquisitions and negatively impact the price of our common stock.
Additionally, our portfolio consisted of 214 data centers at
December 31, 2018
, including 18 data centers held as investments in unconsolidated joint ventures. Several of our data centers, including the data centers which we have acquired in the past five years, have been under our management for a limited time. The data centers may have characteristics or deficiencies unknown to us that could affect their valuation or revenue potential. We cannot assure you that the operating performance of these data centers will not decline under our management.
The Brazilian government has exercised, and continues to exercise, significant influence over the Brazilian economy. This influence, as well as Brazilian political and economic conditions, could adversely affect us.
Ascenty’s portfolio of data centers is concentrated in Brazil. The Brazilian government frequently intervenes in the Brazilian economy and occasionally makes significant changes in policy and regulations. The Brazilian government’s actions designed to control inflation, stimulate growth and other policies and regulations have often involved, among other measures, increases in interest rates, changes in tax policies, price controls, currency devaluations, capital controls and limits on imported goods and services. We cannot control or predict changes in policy or regulations that the Brazilian government might adopt in the future.
We may be adversely affected by the economic and political conditions in Brazil as well as changes in policy or regulations at the federal, state or municipal levels involving or affecting factors such as economic or social factors or political instability.
We may be subject to unknown or contingent liabilities related to our recent acquisitions, for which we may have no or limited recourse against the sellers.
Our recent and future acquisitions may be subject to unknown or contingent liabilities for which we may have no or limited recourse against the sellers. Unknown or contingent liabilities might include liabilities for clean-up or remediation of environmental conditions, claims of customers, vendors or other persons dealing with the acquired entities or the former owners of acquired properties or businesses, tax liabilities, claims for indemnification by general partners, directors, officers and others indemnified by the former owners of acquired properties or businesses, and other liabilities whether incurred in the ordinary course of business or otherwise. In addition, the total amount of costs and expenses that we may incur with respect to liabilities associated with our acquisitions may exceed our expectations, which may adversely affect our business, financial condition and results of operations.
Further, we have entered, and may in the future enter, into transactions with limited representations and warranties or with representations and warranties that do not survive the closing of such transactions, in which event we would have no or limited recourse against the sellers of such properties or businesses. While we usually require the sellers to indemnify us with respect to breaches of representations and warranties that survive, such indemnification is often limited and subject to various materiality
21
thresholds, a significant deductible or an aggregate cap on losses. We may obtain insurance policies providing for coverage for breaches of certain representations and warranties in certain transactions, subject to certain exclusions and a deductible, however, there can be no assurance that we would be able to recover any amounts with respect to losses due to breaches of any such representations and warranties.
As a result, there is no guarantee that we will recover any amounts with respect to losses due to breaches by the sellers of their representations and warranties. Finally, indemnification agreements between us and the sellers typically provide that the sellers will retain certain specified liabilities relating to the properties or businesses acquired by us. While the sellers are generally contractually obligated to pay all losses and other expenses relating to such retained liabilities, there can be no guarantee that such arrangements will not require us to incur losses or other expenses as well.
We may be unable to identify, including sourcing off-market deal flow, and complete acquisitions on favorable terms or at all.
A component of our growth strategy is to continue to acquire additional data centers, and we continually evaluate the market of available properties and businesses and may acquire additional properties or businesses when opportunities exist. To date, a substantial portion of our acquisitions were completed before they were widely marketed by real estate brokers, or “off-market.” Properties that are acquired off-market are typically more attractive to us as a purchaser because of the absence of competitive bidding, which could potentially lead to higher prices. We obtain access to off-market deal flow from numerous sources. If we cannot obtain off-market deal flow in the future, our ability to locate and acquire additional properties at attractive prices could be adversely affected.
Our ability to acquire properties or businesses on favorable terms may be subject to the following significant risks:
|
•
|
we may be unable to acquire a desired property or business because of competition from other real estate investors with significant capital, including both publicly traded REITs and institutional investment funds;
|
|
•
|
even if we are able to acquire a desired property or business, competition from other potential acquirers may significantly increase the purchase price or result in other less favorable terms;
|
|
•
|
even if we enter into agreements for the acquisition of real estate or businesses, these agreements are subject to customary conditions to closing; and
|
|
•
|
we may be unable to finance acquisitions on favorable terms or at all.
|
If we cannot complete property or business acquisitions on favorable terms or at all, our financial condition, results of operations, cash flow, cash available for distribution and ability to satisfy our debt service obligations could be materially adversely affected.
Joint venture investments could be adversely affected by our lack of sole decision-making authority, our reliance on our joint venture partners’ financial condition and disputes between us and our joint venture partners.
We currently, and may in the future, co-invest with third parties through partnerships, joint ventures or other entities, acquiring non-controlling interests in or sharing responsibility for managing the affairs of a property or portfolio of properties, partnership, joint venture or other entity. In these events, we are not in a position to exercise sole decision-making authority regarding the properties, partnership, joint venture or other entity. Investments in partnerships, joint ventures, or other entities may, under certain circumstances, involve risks not present when a third party is not involved, including the possibility that partners might become bankrupt or fail to fund their share of required capital contributions. Partners may have economic, tax or other business interests or goals which are inconsistent with our business interests or goals, and may be in a position to take actions contrary to our policies or objectives. Our joint venture partners may take actions that are not within our control, which would require us to dispose of the joint venture asset or transfer it to a taxable REIT subsidiary in order for Digital Realty Trust, Inc. to maintain its status as a REIT. Such investments may also lead to impasses, for example, as to whether to sell a property, because neither we nor our partner would have full control over the partnership or joint venture. Disputes between us and our partners may result in litigation or arbitration that would increase our expenses and prevent our management from focusing their time and effort on our day-to-day business. Consequently, actions by or disputes with our partners may subject properties owned by the partnership or joint venture to additional risk. In addition, we may in certain circumstances be liable for the actions of our third-party partners. Each of these factors may result in returns on these investments being less than we expect or in losses and our financial and operating results may be adversely affected. In addition, we cannot assure you that we will be able to close joint ventures, such as our anticipated joint venture with Brookfield related to the Ascenty Acquisition, on the anticipated schedule or at all. Failure to complete any such joint venture could have a negative impact on our business and the trading price of our common stock.
22
Our growth depends upon the successful development of our existing space and developable land and new properties acquired for development and any delays or unexpected costs in such development may delay and harm our growth prospects, future operating results and financial condition.
At
December 31, 2018
, we had approximately
3.4 million
square feet of space under active development and approximately
2.1 million
square feet of space held for future development. We have built and may continue to build out a large portion of this space on a speculative basis at significant cost. Our successful development of these projects is subject to many risks, including those associated with:
|
•
|
delays in construction, or changes to the plans or specifications;
|
|
•
|
budget overruns, increased prices for raw materials or building supplies, or lack of availability and/or increased costs for specialized data center components, including long lead time items such as generators;
|
|
•
|
construction site accidents and other casualties;
|
|
•
|
financing availability, including our ability to obtain construction financing and permanent financing, or increases in interest rates or credit spreads;
|
|
•
|
labor availability, costs, disputes and work stoppages with contractors, subcontractors or others that are constructing the project;
|
|
•
|
failure of contractors to perform on a timely basis or at all, or other misconduct on the part of contractors;
|
|
•
|
access to sufficient power and related costs of providing such power to our customers;
|
|
•
|
environmental issues;
|
|
•
|
supply chain constraints;
|
|
•
|
fire, flooding, earthquakes and other natural disasters;
|
|
•
|
geological, construction, excavation and equipment problems; and
|
|
•
|
delays or denials of entitlements or permits, including zoning and related permits, or other delays resulting from requirements of public agencies and utility companies.
|
In addition, while we intend to develop data centers primarily in metropolitan areas we are familiar with, we may in the future develop data centers in new geographic regions where we expect the development to result in favorable risk-adjusted returns on our investment. We may not possess the same level of familiarity with the development of data centers in other metropolitan areas, which could adversely affect our ability to develop such data centers successfully or at all or to achieve expected performance.
Development activities, regardless of whether they are ultimately successful, also typically require a substantial portion of our management’s time and attention. This may distract our management from focusing on other operational activities of our business. If we are unable to complete development projects successfully, our business may be adversely affected.
Global economic conditions could adversely affect our liquidity and financial condition.
General economic conditions and the cost and availability of capital may be adversely affected in some or all of the metropolitan areas in which we own properties and conduct our operations. Instability in the U.S., European, Asian, Latin American and other economies and international financial markets may adversely affect our ability, and the ability of our customers, to replace or renew maturing liabilities on a timely basis, access the capital markets to meet liquidity and capital expenditure requirements and may result in adverse effects on our, and our customers’, businesses, financial condition and results of operations.
In addition, our access to funds under our global revolving credit facility depends on the ability of the lenders that are parties to such facilities to meet their funding commitments to us. We cannot assure you that long-term disruptions in the global economy and tighter credit conditions among, and potential failures or nationalizations of, third party financial institutions as a result of such disruptions will not have an adverse effect on our lenders. If our lenders are not able to meet their funding commitments to us, our business, results of operation, cash flows and financial condition could be adversely affected.
If we do not have sufficient cash flow to continue operating our business and are unable to borrow additional funds, access our existing lines of credit or raise equity or debt capital, we may need to find alternative ways to increase our liquidity. Such alternatives may include, without limitation, curtailing development activity, disposing of one or more of our properties possibly on disadvantageous terms or entering into or renewing leases on less favorable terms than we otherwise would.
We have substantial debt and face risks associated with the use of debt to fund our business activities, including refinancing and interest rate risks.
Our total consolidated indebtedness at
December 31, 2018
was approximately $11.1 billion, and we may incur significant additional debt to finance future acquisition, investment and development activities. As of
December 31, 2018
, we have a $2.35
23
billion global revolving credit facility. We have the ability from time to time to increase the size of the global revolving credit facility and the unsecured term loans (discussed below), in any combination, by up to $1.25 billion, subject to receipt of lender commitments and other conditions precedent. At
December 31, 2018
, approximately
$0.9 billion
was available under this facility, net of outstanding letters of credit. As of February 22, 2019, we had approximately
$1.0 billion
available under the global revolving credit facility, net of outstanding letters of credit.
Our substantial indebtedness currently requires us to dedicate a significant portion of our cash flow from operations to debt service payments, which reduces the availability of our cash flow to fund working capital, capital expenditures, expansion efforts, distributions and other general corporate purposes. Additionally, it could: make it more difficult for us to satisfy our obligations with respect to our indebtedness; limit our ability in the future to undertake refinancings of our debt or obtain financing for expenditures, acquisitions, development or other general corporate purposes on terms and conditions acceptable to us, if at all; or affect adversely our ability to compete effectively or operate successfully under adverse economic conditions.
In addition, we may violate restrictive covenants or fail to maintain financial ratios specified in our loan documents, which would entitle the lenders to accelerate our debt obligations, and our secured lenders or mortgagees may foreclose on our properties or our interests in the entities that own the properties that secure their loans and receive an assignment of rents and leases. A foreclosure on one or more of our properties could adversely affect our access to capital, financial condition, results of operations, cash flow and cash available for distribution. Further, our default under any one of our loans could result in a cross-default on other indebtedness. Furthermore, foreclosures could create taxable income without accompanying cash proceeds, a circumstance which could hinder Digital Realty Trust, Inc.’s ability to meet the REIT distribution requirements imposed by the Code.
Additional risks related to our indebtedness include the following:
We may be unable to refinance our indebtedness at maturity or the refinancing terms may be less favorable than the terms of our original indebtedness.
It is likely that we will need to refinance at least a portion of our outstanding debt as it matures. If we are unable to refinance or extend principal payments due at maturity or pay them with proceeds of other capital transactions, then our cash flow may not be sufficient in all years to repay all such maturing debt and to pay distributions. Further, if prevailing interest rates or other factors at the time of refinancing, such as the reluctance of lenders to make commercial real estate loans, result in higher interest rates upon refinancing, then the interest expense relating to that refinanced indebtedness would increase.
Fluctuations in interest rates could materially affect our financial results and may increase the risk our counterparty defaults on our interest rate hedges
.
Because a significant portion of our debt, including debt incurred under our global revolving credit facility, bears interest at variable rates, increases in interest rates could materially increase our interest expense. If the United States Federal Reserve increases short-term interest rates, this would have a significant upward impact on shorter-term interest rates, including the interest rates that apply to our variable rate debt. Potential future increases in interest rates and credit spreads may increase our interest expense and therefore negatively affect our financial condition and results of operations, and reduce our access to capital markets. We have entered into interest rate swap agreements to fix a significant portion of our floating rate debt. Increased interest rates may increase the risk that the counterparties to our swap agreements will default on their obligations, which could further increase our exposure to interest rate fluctuations. Conversely, if interest rates are lower than our swapped fixed rates, we will be required to pay more for our debt than we would have had we not entered into the swap agreements.
Adverse changes in our Company’s credit ratings could negatively affect our financing activity.
The credit ratings of our senior unsecured long-term debt and Digital Realty Trust, Inc.’s preferred stock are based on our Company’s operating performance, liquidity and leverage ratios, overall financial position and other factors employed by the credit rating agencies in their rating analyses of our Company. Our Company’s credit ratings can affect the amount of capital we can access, as well as the terms and pricing of any debt we may incur. We cannot assure you that we will be able to maintain our current credit ratings, and in the event our current credit ratings are downgraded, we would likely incur higher borrowing costs and may encounter difficulty in obtaining additional financing. Also, a downgrade in our credit ratings may trigger additional payments or other negative consequences under our current and future credit facilities and debt instruments. For example, if the credit ratings of our senior unsecured long-term debt are downgraded to below investment grade levels, we may not be able to obtain or maintain extensions on certain of our existing debt. Adverse changes in our credit ratings could negatively impact our refinancing and other capital market activities, our ability to manage our debt maturities, our future growth, our financial condition, the market price of Digital Realty Trust, Inc.’s stock, and our development and acquisition activity.
Our global revolving credit facility, unsecured term loan facility and senior notes restrict our ability to engage in some business activities
.
Our global revolving credit facility and unsecured term loan facility contain negative covenants and other financial and operating covenants that, among other things:
24
|
•
|
restrict our ability to incur additional indebtedness;
|
|
•
|
restrict our ability to make certain investments;
|
|
•
|
restrict our ability to merge with another company;
|
|
•
|
restrict our ability to create, incur or assume liens; and
|
|
•
|
require us to maintain financial coverage ratios, including with respect to unencumbered assets.
|
In addition, the global revolving credit facility and the unsecured term loan facility restrict Digital Realty Trust, Inc. from making distributions to its stockholders, or redeeming or otherwise repurchasing shares of its capital stock, after the occurrence and during the continuance of an event of default, except in limited circumstances including as necessary to enable Digital Realty Trust, Inc. to maintain its qualification as a REIT and to avoid the payment of income or excise tax.
In addition, our unsecured senior notes are governed by indentures, which contain various restrictive covenants, including limitations on our ability to incur indebtedness and requirements to maintain a pool of unencumbered assets. These restrictions, and the restrictions in our global revolving credit facility and unsecured term loan facility, could cause us to default on our senior notes, global revolving credit facility or unsecured term loan facility, as applicable, or negatively affect our operations or our ability to pay dividends to Digital Realty Trust, Inc.’s stockholders or distributions to Digital Realty Trust, L.P.’s unitholders, which could have a material adverse effect on the market value of Digital Realty Trust, Inc.’s common stock and preferred stock.
Failure to hedge effectively against interest rate changes may adversely affect results of operations.
We seek to manage our exposure to interest rate volatility by using interest rate hedging arrangements, such as interest rate cap, forward or swap lock agreements. These agreements involve risks, such as the risk that counterparties may fail to honor their obligations under these arrangements, that these arrangements may not be effective in reducing our exposure to interest rate changes and that a court could rule that such an agreement is not legally enforceable. Our policy is to use these derivatives only to hedge interest rate risks related to our borrowings, not for speculative or trading purposes, and to enter into contracts only with major financial institutions based on their credit ratings and other factors. However, we may choose to change this policy in the future. Approximately 74% of our total indebtedness as of
December 31, 2018
was subject to fixed interest rates or variable rates subject to interest rate swaps. We do not currently hedge our global revolving credit facility and as our borrowings under our global revolving credit facility increase, so will our percentage of indebtedness not subject to fixed rates and our exposure to interest rates increase. Hedging may reduce the overall returns on our investments. Failure to hedge effectively against interest rate changes may materially adversely affect our results of operations.
Our growth depends on external sources of capital which are outside of our control.
In order for Digital Realty Trust, Inc. to maintain its qualification as a REIT, it is required under the Internal Revenue Code of 1986, as amended, which we refer to as the Code, to annually distribute at least 90% of its net taxable income determined without regard to the dividends paid deduction and excluding any net capital gain. In addition, Digital Realty Trust, Inc. will be subject to federal corporate income tax to the extent that it distributes less than 100% of its net taxable income, including any net capital gains. Digital Realty Trust, L.P. is required to make distributions to Digital Realty Trust, Inc. that will enable the latter to satisfy this distribution requirement and avoid income and excise tax liability. Because of these distribution requirements, we may not be able to fund future capital needs, including any necessary acquisition or development financing, from operating cash flow. Consequently, we may rely on third-party sources to fund our capital needs.
Our access to third-party sources of capital depends on a number of factors, including general market conditions, the market’s perception of our business prospects and growth potential, our current and expected future earnings, funds from operations, our cash flow and cash distributions, and the market price per share of Digital Realty Trust, Inc.’s common stock. We cannot assure you that we will be able to obtain equity or debt financing at all or on terms favorable or acceptable to us. Any additional debt we incur will increase our leverage. Further, equity markets have experienced high volatility recently and we cannot assure you that we will be able to raise capital through the sale of equity securities at all or on favorable terms. Sales of equity on unfavorable terms could result in substantial dilution to Digital Realty Trust, Inc.’s common stockholders and Digital Realty Trust, L.P.’s unitholders. In addition, we may be forced to dispose of one or more of our properties, possibly on disadvantageous terms.
If we cannot obtain capital from third-party sources, we may not be able to acquire or develop data centers when strategic opportunities exist, satisfy our debt service obligations, pay cash dividends to Digital Realty Trust, Inc.’s stockholders or make distributions to Digital Realty Trust, L.P.’s unitholders.
25
Declining real estate valuations and impairment charges could adversely affect our earnings and financial condition.
We review each of our properties for indicators that its carrying amount may not be recoverable. Examples of such indicators may include a significant decrease in the market price, a significant adverse change in how the property is being used or expected to be used based on the underwriting at the time of acquisition, an accumulation of costs significantly in excess of the amount originally expected for the acquisition or development, a change in our intended holding period due to our intention to sell an asset, or a history of operating or cash flow losses. When such impairment indicators exist, we review an estimate of the future undiscounted net cash flows (excluding interest charges) expected to result from the real estate investment’s use and eventual disposition and compare it to the carrying value of the property. We consider factors such as future operating income, trends and prospects, as well as the effects of leasing demand, competition and other factors. If our future undiscounted net cash flow evaluation indicates that we are unable to recover the carrying value of a real estate investment, an impairment loss is recorded to the extent that the carrying value exceeds the estimated fair value of the property. These losses have a direct impact on our net income because recording an impairment loss results in an immediate negative adjustment to net income. The evaluation of anticipated cash flows is highly subjective and is based in part on assumptions regarding future occupancy, rental rates and capital requirements that could differ materially from actual results in future periods. A worsening real estate market may cause us to reevaluate the assumptions used in our impairment analysis. These impairment charges could be significant and could adversely affect our financial condition, results of operations and cash available for distribution.
We may incur goodwill and other intangible asset impairment charges, which could adversely affect our earnings and financial condition.
In accordance with U.S. generally accepted accounting practices, or GAAP, we are required to assess our goodwill and other intangible assets, including goodwill and other intangible assets assumed in acquisition transactions, annually, or more frequently whenever events or changes in circumstances indicate potential impairment, such as changing market conditions or any changes in key assumptions. If the testing performed indicates that an asset may not be recoverable, we are required to record a non-cash impairment charge for the difference between the carrying value of the goodwill or other intangible assets and the implied fair value of the goodwill or other intangible assets in the period the determination is made. These impairment charges could be significant and could adversely affect our financial condition, results of operations and cash available for distribution.
Illiquidity of real estate investments could significantly impede our ability to respond to adverse changes in the performance of our properties and harm our financial condition.
Because real estate investments are relatively illiquid and because there may be even fewer buyers for our specialized real estate, our ability to promptly sell properties in our portfolio in response to adverse changes in their performance may be limited, which may harm our financial condition. Further, Digital Realty Trust, Inc. is subject to provisions in the Code that limit a REIT’s ability to dispose of properties, which limitations are not applicable to other types of real estate companies. See “Risks Related to Our Organizational Structure—Digital Realty Trust, Inc.’s duty to its stockholders may conflict with the interests of Digital Realty Trust, L.P.’s unitholders—Tax consequences upon sale or refinancing.” While Digital Realty Trust, Inc. has exclusive authority under Digital Realty Trust, L.P.’s limited partnership agreement to determine whether, when, and on what terms to sell a property, any such decision would require the approval of Digital Realty Trust, Inc.’s board of directors. These limitations may affect our ability to sell properties. This lack of liquidity and the Code restrictions may limit our ability to vary our portfolio promptly in response to changes in economic or other conditions and, as a result, could adversely affect our financial condition, results of operations, cash flow, cash available for distribution and ability to access capital necessary to meet our debt payments and other obligations.
Our success depends on key personnel whose continued service is not guaranteed.
We depend on the efforts of key personnel of our Company, particularly A. William Stein, our Chief Executive Officer, Andrew P. Power, our Chief Financial Officer, Gregory S. Wright, our Chief Investment Officer, Chris Sharp, our Chief Technology Officer, and Erich J. Sanchack, our Executive Vice President, Operations. They are important to our success for many reasons, including that each has a national or regional reputation in our industry and the investment community that attracts investors and business and investment opportunities and assists us in negotiations with investors, lenders, existing and potential customers and industry personnel. If we lost their services, our business and investment opportunities and our relationships with lenders and other capital markets participants, existing and prospective customers and industry personnel could suffer. Many of our Company’s other senior employees also have strong technology, finance and real estate industry reputations. As a result, we have greater access to potential acquisitions, financing, leasing and other opportunities, and are
26
better able to negotiate with customers. As the number of our competitors increases, it becomes more likely that a competitor would attempt to hire certain of these individuals away from our Company. The loss of any of these key personnel would result in the loss of these and other benefits and could materially and adversely affect our results of operations.
We also depend on the talents and efforts of highly skilled technical individuals. Our success depends on our continuing ability to identify, hire, develop, motivate, and retain highly skilled technical personnel for all areas of our organization. Competition in our industry for qualified technical employees is intense, the availability of qualified technical personnel is not guaranteed.
We may have difficulty managing our growth.
We have significantly and rapidly expanded the size of our Company. Our growth may significantly strain our management, operational and financial resources and systems. In addition, as a reporting company, we are subject to the reporting requirements of the Securities Exchange Act of 1934 and the Sarbanes-Oxley Act of 2002, or the Sarbanes-Oxley Act. The requirements of these rules and regulations subject us to certain accounting, legal and financial compliance costs and may strain our management and financial, legal and operational resources and systems. An inability to manage our growth effectively or the increased strain on our management of our resources and systems could result in deficiencies in our disclosure controls and procedures or our internal control over financial reporting and could negatively impact financial condition, results of operations and our cash available for distribution.
We may have difficulty implementing changes to our information technology systems.
We have made significant investments to update and improve our information technology systems and expect such investments to continue in order to meet our business needs, including for ongoing improvements for our customer experience. Transitioning to new or upgraded systems can create difficulties, including potential disruptions to current processes and security complexities. In addition, our information technology systems may require further modification as we grow and as our business needs change, which could prolong difficulties we experience with transitions. Such significant investments in our systems may take longer to deploy and cost more than originally planned. In addition, we may not realize the full benefits we hoped to achieve and we may need to expend significant attention, time and resources to correct problems or find alternative sources for performing various functions. Difficulties in implementing new or upgraded information technology systems or significant system failures or delays or the failure to successfully modify our systems and respond to changes in our business needs could adversely affect our business and results of operations.
Potential losses may not be covered by insurance.
We currently carry commercial general liability, property, business interruption, including loss of rental income, and other insurance policies to cover insurable risks to our Company. We select policy specifications, insured limits and deductibles which we believe to be appropriate and adequate given the relative risk of loss, the cost of the coverage and standard industry practices. Our insurance policies contain industry standard exclusions and we do not carry insurance for generally uninsurable perils, such as loss from war or nuclear reaction. A significant portion of our properties are located in seismically active zones such as California, which represents approximately
13%
of our portfolio’s annualized rent as of
December 31, 2018
. One catastrophic event, for example, in California, could significantly impact multiple properties, the aggregate deductible amounts could be significant and the limits we purchase could prove to be insufficient, which could materially and adversely impact our business, financial condition and results of operations. Furthermore, a catastrophic regional event could also severely impact some of our insurers rendering them insolvent or unable to fully pay on claims despite their current financial strength. We may discontinue purchasing insurance against earthquake, flood or windstorm or other perils on some or all of our properties in the future if the cost of premiums for any of these policies exceeds, in our judgment, the value of the coverage relative to the risk of loss.
In addition, many of our buildings contain extensive and highly valuable technology-related improvements. Under the terms of our leases, customers are obligated to maintain adequate insurance coverage applicable to such improvements and under most circumstances use their insurance proceeds to restore such improvements after a casualty event. In the event of a casualty or other loss involving one of our buildings with extensive installed tenant improvements, our customers may have the right to terminate their leases if we do not rebuild the base building within prescribed times. In such cases, the proceeds from customers’ insurance will not be available to us to restore the improvements, and our insurance coverage may be insufficient to replicate the technology-related improvements made by such customers. Furthermore, the terms of our mortgage indebtedness at certain of our properties may require us to pay insurance proceeds over to our lenders under certain circumstances, rather than use the proceeds to repair the property. If we or one or more of our customers experience a loss which is uninsured or which exceeds policy limits, we could lose the capital invested in the damaged properties as well as the anticipated future cash
27
flows from those properties. In addition, if the damaged properties are subject to recourse indebtedness, we would continue to be liable for the indebtedness, even if these properties were irreparably damaged.
We may become subject to litigation or threatened litigation which may divert management time and attention, require us to pay damages and expenses or restrict the operation of our business.
We may become subject to disputes with parties with whom we conduct business, including as a result of any breach in our security systems or downtime in our critical power and cooling systems. Any such dispute could result in litigation between us and the other parties. Whether or not any dispute actually proceeds to litigation, we may be required to devote significant management time and attention to its resolution (through litigation, settlement or otherwise), which would detract from our management’s ability to focus on our business. Any such resolution could involve the payment of damages or expenses by us, which may be significant. In addition, any such resolution could involve our agreement with terms that restrict the operation of our business.
We could incur significant costs related to environmental matters, including from government regulation, private litigation, and existing conditions at some of our properties.
Under various laws relating to the protection of the environment in the United States, as well as in many jurisdictions in Europe, Asia and South America, a current or previous owner or operator of real estate may be liable for contamination resulting from the presence or discharge of hazardous or toxic substances at a property, and may be required to investigate and clean up such contamination at or emanating from a property. Such laws often impose liability without regard to whether the owner or operator knew of, or was responsible for, the presence of the contaminants, and the liability may be joint and several. In the United States, the Comprehensive Environmental Response, Compensation, and Liability Act of 1980, or CERCLA, established a regulatory and remedial program intended to provide for the investigation and clean-up of facilities where, or from which, a release of any hazardous substance into the environment has occurred or is threatened. CERCLA’s primary mechanism for remedying such problems is to impose strict joint and several liability for clean-up of facilities on current owners and operators of the site, former owners and operators of the site at the time of the disposal of the hazardous substances, any person who arranges for the transportation, disposal or treatment of the hazardous substances, and the transporters who select the disposal and treatment facilities, regardless of the care exercised by such persons. CERCLA also imposes liability for the cost of evaluating and remedying any damage to natural resources. The costs of CERCLA investigation and clean-up can be very substantial. CERCLA also authorizes the imposition of a lien in favor of the United States on all real property subject to, or affected by, a remedial action for all costs for which a party is liable. Subject to certain procedural restrictions, CERCLA gives a responsible party the right to bring a contribution action against other responsible parties for their allocable shares of investigative and remedial costs. Our ability to obtain reimbursement from others for their allocable shares of such costs would be limited by our ability to find other responsible parties and prove the extent of their responsibility, their financial resources, and other procedural requirements. Various state laws, as well as laws in Europe and Asia, also impose in certain cases strict joint and several liability for investigation, clean-up and other damages associated with hazardous substance releases.
Previous owners used some of our properties for industrial and retail purposes, so those properties may contain some level of environmental contamination. Independent environmental consultants have conducted Phase I or similar environmental site assessments on all of the properties in our portfolio. Site assessments are intended to discover and evaluate information regarding the environmental condition of the surveyed property and surrounding properties. These assessments do not generally include soil samplings, subsurface investigations or an asbestos survey and the assessments may fail to reveal all environmental conditions, liabilities or compliance concerns. In addition, material environmental conditions, liabilities or compliance concerns may have arisen after these reviews were completed or may arise in the future. We could be held jointly and severally liable under CERCLA and various state, local and national laws for the investigation and remediation of environmental contamination on our properties caused by previous owners or operators. Further, fuel storage tanks are present at most of our properties, and if releases were to occur, we may be liable for the costs of cleaning any resulting contamination. The presence of contamination or the failure to remediate contamination at our properties may expose us to third-party liability or materially adversely affect our ability to sell, lease or develop the real estate or to borrow using the real estate as collateral.
In addition, some of our customers, particularly those in the biotechnology and life sciences industry and those in the technology manufacturing industry, routinely handle hazardous substances and wastes as part of their operations at our properties. Environmental laws and regulations subject our customers, and potentially us, to liability resulting from these activities or from previous industrial or retail uses of those properties. We could be held jointly and severally liable under CERCLA and various state, local and national laws for the investigation and remediation of hazardous substances released by our customers on our properties. Environmental liabilities could also affect a customer’s ability to make rental payments to us. We cannot assure you that costs of investigation and remediation of environmental matters will not affect our ability to pay
28
dividends to Digital Realty Trust, Inc.’s stockholders and distributions to Digital Realty Trust, L.P.’s unitholders or that such costs or other remedial measures will not have a material adverse effect on our business, assets or results of operations.
Some of our properties may contain asbestos-containing building materials. Environmental laws require that asbestos-containing building materials be properly managed and maintained, and may impose fines and penalties on building owners or operators for failure to comply with these requirements. These laws may also allow third parties to seek recovery from owners or operators for personal injury associated with exposure to asbestos-containing building materials.
Our properties and their uses often require permits from various government agencies, including permits related to zoning and land use. Certain permits from state or local environmental regulatory agencies, including regulators of air quality, are usually required to install and operate diesel-powered generators, which provide emergency back-up power at most of our facilities. These permits often set emissions limits for certain air pollutants, including oxides of nitrogen. In addition, various federal, state, and local environmental, health and safety requirements, such as fire requirements and treated and storm water discharge requirements, apply to some of our properties. Changes to applicable regulations, such as air quality regulations, or the permit requirements for equipment at our facilities, could hinder or prevent our construction or operation of data center facilities.
Also, drought conditions in certain markets have resulted in water usage restrictions and proposals to further restrict water usage. Our data center facilities could face restrictions on water usage, water efficiency mandates, or higher water prices. Climate change could also limit water availability. In addition, sea level rise and more frequent and severe weather events caused or contributed to by climate change pose physical risks to our facilities.
The environmental laws and regulations to which our properties are subject may change in the future, and new laws and regulations may be created. Future laws, ordinances or regulations may impose additional material environmental liability. Such laws include those directly regulating our climate change impacts and those which regulate the climate change impacts of companies with which we do business, such as utilities providing our facilities with electricity. See “Management’s Discussion and Analysis of Financial Condition and Results of Operations-Factors Which May Influence Future Results of Operations-Climate change legislation.” We do not know if or how the requirements will change, but changes may require that we make significant unanticipated expenditures, and such expenditures may materially adversely impact our financial condition, cash flow, results, cash available for distributions, Digital Realty Trust, Inc.’s common stock’s per share trading price, our competitive position and ability to satisfy our debt service obligations.
Our properties may contain or develop harmful mold or suffer from other air quality issues, which could lead to liability for adverse health effects and costs to remedy the problem.
When excessive moisture accumulates in buildings or on building materials, mold may grow, particularly if the moisture problem remains undiscovered or is not addressed over a period of time. Some molds may produce airborne toxins or irritants. Indoor air quality issues can also stem from inadequate ventilation, chemical contamination from indoor or outdoor sources and other biological contaminants such as pollen, viruses and bacteria. Indoor exposure to airborne toxins or irritants above certain levels can be alleged to cause a variety of adverse health effects and symptoms, including allergic or other reactions. As a result, the presence of significant mold or other airborne contaminants at any of our properties could require us to undertake a costly remediation program to contain or remove the mold or other airborne contaminants from the affected property or increase indoor ventilation. In addition, the presence of significant mold or other airborne contaminants could expose us to liability from our customers, their employees, our employees and others if property damage or health concerns arise.
We may incur significant costs complying with the Americans with Disabilities Act, similar laws and other regulations.
Under the Americans with Disabilities Act of 1990, or the ADA, all public accommodations must meet federal requirements related to access and use by disabled persons. We have not conducted an audit or investigation of all of our properties to determine our compliance with the ADA or similar laws of other jurisdictions in which we operate. If one or more of the properties in our portfolio does not comply with the ADA or such other laws, then we would be required to incur additional costs to bring the property into compliance. Additional federal, state and local laws also may require modifications to our properties, or restrict our ability to renovate our properties. We cannot predict the ultimate cost of compliance with the ADA or other laws. If we incur substantial costs to comply with the ADA and any other similar legislation or are subject to awards of damages to private litigants, our financial condition, results of operations, cash flow, cash available for distribution and ability to satisfy our debt service obligations could be materially adversely affected.
29
The properties in our portfolio are subject to various federal, state and local regulations, such as state and local fire and life safety regulations. If we fail to comply with these various regulations, we may have to pay fines or damage awards to private litigants. In addition, we do not know whether existing regulations will change or whether future regulations will require us to make significant unanticipated expenditures that will materially adversely impact our financial condition, results of operations, cash flow, cash available for distribution and ability to satisfy our debt service obligations.
Our business could be adversely impacted if there are deficiencies in our disclosure controls and procedures or internal control over financial reporting.
The design and effectiveness of our disclosure controls and procedures and internal control over financial reporting may not prevent all errors, misstatements or misrepresentations. While management will continue to review the effectiveness of our disclosure controls and procedures and internal control over financial reporting, there can be no guarantee that our internal control over financial reporting will be effective in accomplishing all control objectives all of the time. Furthermore, our disclosure controls and procedures and internal control over financial reporting with respect to entities that we do not control or manage may be substantially more limited than those we maintain with respect to the subsidiaries that we have controlled or managed over the course of time. Deficiencies, including any material weakness, in our internal control over financial reporting which may occur in the future could result in misstatements of our results of operations, restatements of our financial statements, a decline in Digital Realty Trust, Inc.’s stock price, or otherwise materially adversely affect our business, reputation, results of operations, financial condition or liquidity.
Risks Related to Our Organizational Structure
Digital Realty Trust, Inc.’s duty to its stockholders may conflict with the interests of Digital Realty Trust, L.P.’s unitholders.
Conflicts of interest may exist or could arise in the future as a result of the relationships between Digital Realty Trust, Inc. and its stockholders, on the one hand, and our Operating Partnership and its partners, on the other. Digital Realty Trust, Inc.’s directors and officers have duties to Digital Realty Trust, Inc. and its stockholders under Maryland law in connection with their management of our Company. At the same time, Digital Realty Trust, Inc., as general partner, has fiduciary duties under Maryland law to our Operating Partnership and to the limited partners in connection with the management of our Operating Partnership. Digital Realty Trust, Inc.’s duties as general partner to our Operating Partnership and its partners may come into conflict with the duties of Digital Realty Trust, Inc.’s directors and officers to Digital Realty Trust, Inc. and its stockholders. Under Maryland law, a general partner of a Maryland limited partnership owes its limited partners the duties of loyalty and care, which must be discharged consistently with the obligation of good faith and fair dealing, unless the partnership agreement provides otherwise. The partnership agreement of our Operating Partnership provides that for so long as Digital Realty Trust, Inc. owns a controlling interest in our Operating Partnership, any conflict that cannot be resolved in a manner not adverse to either Digital Realty Trust, Inc.’s stockholders or the limited partners will be resolved in favor of Digital Realty Trust, Inc.’s stockholders.
The provisions of Maryland law that allow the fiduciary duties of a general partner to be modified by a partnership agreement have not been tested in a court of law, and we have not obtained an opinion of counsel covering the provisions set forth in the partnership agreement that purport to waive or restrict Digital Realty Trust, Inc.’s fiduciary duties.
Digital Realty Trust, Inc.’s stockholders and Digital Realty Trust, L.P.’s unitholders are also subject to the following additional conflict of interest:
Tax consequences upon sale or refinancing.
Sales of properties and repayment of certain indebtedness will affect holders of common units in our Operating Partnership and Digital Realty Trust, Inc.’s stockholders differently. Consequently, these holders of common units in our Operating Partnership may have different objectives regarding the appropriate pricing and timing of any such sale or repayment of debt. While Digital Realty Trust, Inc. has exclusive authority under the partnership agreement of our Operating Partnership to determine when to refinance or repay debt or whether, when, and on what terms to sell a property, any such decision generally would require the approval of Digital Realty Trust, Inc.’s board of directors and Digital Realty Trust, Inc.’s ability to take such actions, to the extent that they may reduce the liabilities of the Operating Partnership, may be limited pursuant to the tax protection agreement that Digital Realty Trust, Inc. and the Operating Partnership entered into upon completion of the DFT Merger. Certain of Digital Realty Trust, Inc.’s directors and executive officers could exercise their influence in a manner inconsistent with the interests of some, or a majority, of Digital Realty Trust, L.P.’s unitholders, including in a manner which could prevent completion of a sale of a property or the repayment of indebtedness.
30
Digital Realty Trust, Inc.’s charter, Digital Realty Trust, L.P.’s partnership agreement and Maryland law contain provisions that may delay, defer or prevent a change of control transaction.
These provisions include the following:
Digital Realty Trust, Inc.’s charter and the articles supplementary governing its preferred stock contain 9.8% ownership limits.
Digital Realty Trust, Inc.’s charter, subject to certain exceptions, authorizes Digital Realty Trust, Inc.’s board of directors to take such actions as are necessary and desirable to preserve Digital Realty Trust, Inc.’s qualification as a REIT and to limit any person to actual or constructive ownership of no more than 9.8% (by value or by number of shares, whichever is more restrictive) of the outstanding shares of Digital Realty Trust, Inc.’s common stock, 9.8% (by value or by number of shares, whichever is more restrictive) of the outstanding shares of any series of Digital Realty Trust, Inc.’s preferred stock and 9.8% of the value of Digital Realty Trust, Inc.’s outstanding capital stock. Digital Realty Trust, Inc.’s board of directors, in its sole discretion, may exempt (prospectively or retroactively) a proposed transferee from the ownership limit. However, Digital Realty Trust, Inc.’s board of directors may not grant an exemption from the ownership limit to any proposed transferee whose direct or indirect ownership of more than 9.8% of the outstanding shares of Digital Realty Trust, Inc.’s common stock, more than 9.8% of the outstanding shares of any series of Digital Realty Trust, Inc.’s preferred stock or more than 9.8% of the value of Digital Realty Trust, Inc.’s outstanding capital stock could jeopardize Digital Realty Trust, Inc.’s status as a REIT. These restrictions on transferability and ownership will not apply if Digital Realty Trust, Inc.’s board of directors determines that it is no longer in Digital Realty Trust, Inc.’s best interests to attempt to qualify, or to continue to qualify, as a REIT or that compliance is no longer required for REIT qualification. The ownership limit may delay, defer or prevent a transaction or a change of control that might be in the best interest of Digital Realty Trust, Inc.’s stockholders and Digital Realty Trust, L.P.’s unitholders.
Digital Realty Trust, L.P.’s partnership agreement contains provisions that may delay, defer or prevent a change of control transaction.
Digital Realty Trust, L.P.’s partnership agreement provides that Digital Realty Trust, Inc. may not engage in any merger, consolidation or other combination with or into another person, any sale of all or substantially all of its assets or any reclassification, recapitalization or change of its outstanding equity interests unless the transaction is approved by the holders of common units and long-term incentive units representing at least 35% of the aggregate percentage interests of all holders of common units and long-term incentive units and either:
|
•
|
all limited partners will receive, or have the right to elect to receive, for each common unit an amount of cash, securities or other property equal to the product of the number of shares of Digital Realty Trust, Inc. common stock into which a common unit is then exchangeable and the greatest amount of cash, securities or other property paid in consideration of each share of Digital Realty Trust, Inc. common stock in connection with the transaction (provided that, if, in connection with the transaction, a purchase, tender or exchange offer is made to and accepted by the holders of more than 50% of the shares of Digital Realty Trust, Inc. common stock, each holder of common units will receive, or have the right to elect to receive, the greatest amount of cash, securities or other property which such holder would have received if it exercised its right to redemption and received shares of Digital Realty Trust, Inc. common stock in exchange for its common units immediately prior to the expiration of such purchase, tender or exchange offer and thereupon accepted such purchase, tender or exchange offer and the transaction was then consummated); or
|
|
•
|
the following conditions are met:
|
|
•
|
substantially all of the assets directly or indirectly owned by the surviving entity in the transaction are held directly or indirectly by Digital Realty Trust, L.P. or another limited partnership or limited liability company which is the survivor of a merger, consolidation or combination of assets with Digital Realty Trust, L.P., or the surviving partnership;
|
|
•
|
the holders of common units and long-term incentive units own a percentage interest of the surviving partnership based on the relative fair market value of Digital Realty Trust, L.P.’s net assets and the other net assets of the surviving partnership immediately prior to the consummation of such transaction;
|
|
•
|
the rights, preferences and privileges of the holders of interests in the surviving partnership are at least as favorable as those in effect immediately prior to the consummation of such transaction and as those applicable to any other limited partners or non-managing members of the surviving partnership; and
|
|
•
|
the rights of the limited partners or non-managing members of the surviving partnership include at least one of the following: (i) the right to redeem their interests in the surviving partnership for the consideration available to such persons pursuant to Digital Realty Trust, L.P.’s partnership agreement; or (ii) the right to redeem their interests for cash on terms equivalent to those in effect
|
31
with respect to their common units immediately prior to the consummation of such transaction (or, if the ultimate controlling person of the surviving partnership has publicly traded common equity securities, for such common equity securities, with an exchange ratio based on the determination of relative fair market value of such securities and the shares of Digital Realty Trust, Inc. common stock).
These provisions may discourage others from trying to acquire control of Digital Realty Trust, Inc. and may delay, defer or prevent a change of control transaction that might be beneficial to Digital Realty Trust, Inc.’s stockholders and Digital Realty Trust, L.P.’s unitholders.
The change of control conversion features of Digital Realty Trust, Inc.’s preferred stock may make it more difficult for a party to take over our Company or discourage a party from taking over our Company.
Upon the occurrence of specified change of control transactions, holders of our series C preferred stock, series G preferred stock, series H preferred stock, series I preferred stock and series J preferred stock will have the right (unless, prior to the change of control conversion date, we have provided or provide notice of our election to redeem such preferred stock) to convert some or all of their series C preferred stock, series G preferred stock, series H preferred stock, series I preferred stock or series J preferred stock, as applicable, into shares of our common stock (or equivalent value of alternative consideration), subject to caps set forth in the articles supplementary governing the applicable series of preferred stock. The change of control conversion features of the series C preferred stock, series G preferred stock, series H preferred stock, series I preferred stock and series J preferred stock may have the effect of discouraging a third party from making an acquisition proposal for our Company or of delaying, deferring or preventing certain change of control transactions of our Company under circumstances that otherwise could provide the holders of our common stock, series C preferred stock, series G preferred stock, series H preferred stock, series I preferred stock and series J preferred stock with the opportunity to realize a premium over the then-current market price or that stockholders may otherwise believe is in their best interests.
Digital Realty Trust, Inc. could increase or decrease the number of authorized shares of stock and issue stock without stockholder approval.
Digital Realty Trust, Inc.’s charter authorizes Digital Realty Trust, Inc.’s board of directors, without stockholder approval, to amend the charter from time to time to increase or decrease the aggregate number of authorized shares of stock or the number of authorized shares of stock of any class or series, to issue authorized but unissued shares of the Digital Realty Trust, Inc.’s common stock or preferred stock and, subject to the voting rights of holders of preferred stock, to classify or reclassify any unissued shares of the Digital Realty Trust, Inc.’s common stock or preferred stock into other classes of series of stock and to set the preferences, rights and other terms of such classified or reclassified shares. Although Digital Realty Trust, Inc.’s board of directors has no such intention at the present time, it could establish an additional class or series of preferred stock that could, depending on the terms of such class or series, delay, defer or prevent a transaction or a change of control that might be in the best interest of Digital Realty Trust, Inc.’s stockholders and Digital Realty Trust, L.P.’s unitholders.
Certain provisions of Maryland law could inhibit changes in control.
Certain provisions of the Maryland General Corporation Law, or MGCL, may have the effect of impeding a third party from making a proposal to acquire Digital Realty Trust, Inc. or of impeding a change of control under circumstances that otherwise could be in the best interests of Digital Realty Trust, Inc.’s stockholders and Digital Realty Trust, L.P.’s unitholders, including:
|
•
|
“business combination” provisions that, subject to limitations, prohibit certain business combinations between Digital Realty Trust, Inc. and an “interested stockholder” (defined generally as any person who beneficially owns, directly or indirectly, 10% or more of the voting power of Digital Realty Trust, Inc.’s outstanding shares of voting stock or an affiliate or associate of Digital Realty Trust, Inc. who, at any time within the two-year period prior to the date in question, was the beneficial owner, directly or indirectly, of 10% or more of the voting power of Digital Realty Trust, Inc.’s then outstanding shares of stock) or an affiliate thereof for five years after the most recent date on which the stockholder becomes an interested stockholder, and thereafter impose special appraisal rights and supermajority voting requirements on these combinations; and
|
|
•
|
“control share” provisions that provide that “control shares” of Digital Realty Trust, Inc. (defined as shares which, when aggregated with other shares controlled by the stockholder (except solely by virtue of a revocable proxy), entitle the stockholder to exercise one of three increasing ranges of voting power in electing directors) acquired in a “control share acquisition” (defined as the direct or indirect acquisition of ownership or control of issued and outstanding “control shares”) have no voting rights except to the extent approved by Digital Realty Trust, Inc.’s stockholders by the affirmative vote of at least two-thirds of all the votes entitled to be cast on the matter, excluding all interested shares.
|
Digital Realty Trust, Inc. has opted out of these provisions of the MGCL, in the case of the business combination provisions of the MGCL by resolution of its board of directors, and in the case of the control share provisions of the MGCL pursuant to a provision in its bylaws. However, Digital Realty Trust, Inc.’s board of directors may by resolution elect to opt in
32
to the business combination provisions of the MGCL and Digital Realty Trust, Inc. may, by amendment to its bylaws, opt in to the control share provisions of the MGCL in the future.
The provisions of Digital Realty Trust, Inc.’s charter governing removal of directors and the advance notice provisions of Digital Realty Trust, Inc.’s bylaws could delay, defer or prevent a change of control or other transaction that might be in the best interests of Digital Realty Trust, Inc.’s stockholders and Digital Realty Trust, L.P.’s unitholders. Likewise, if Digital Realty Trust, Inc.’s board of directors were to opt in to the business combination provisions of the MGCL or the provisions of Title 3, Subtitle 8 of the MGCL not currently applicable to Digital Realty Trust, Inc., or if the provision in Digital Realty Trust, Inc.’s bylaws opting out of the control share acquisition provisions of the MGCL were rescinded, these provisions of the MGCL could have similar anti-takeover effects.
The conversion rights of Digital Realty Trust, Inc.’s preferred stock may be detrimental to holders of Digital Realty Trust, Inc.’s common stock.
Digital Realty Trust, Inc. currently has 8,050,000 shares of 6.625% series C cumulative redeemable perpetual preferred stock outstanding, 10,000,000 shares of 5.875% series G cumulative redeemable preferred stock outstanding, 14,600,000 shares of 7.375% series H cumulative redeemable preferred stock outstanding, 10,000,000 shares of 6.350% series I cumulative redeemable preferred stock outstanding and 8,000,000 shares of 5.250% series J cumulative redeemable preferred stock outstanding, which may be converted into Digital Realty Trust, Inc. common stock upon the occurrence of limited specified change in control transactions. The conversion of the series C preferred stock, series G preferred stock, series H preferred stock, series I preferred stock or series J preferred stock for Digital Realty Trust, Inc. common stock would dilute stockholder ownership in Digital Realty Trust, Inc. and unitholder ownership in Digital Realty Trust, L.P., and could adversely affect the market price of Digital Realty Trust, Inc. common stock and could impair our ability to raise capital through the sale of additional equity securities.
Digital Realty Trust, Inc.’s rights and the rights of its stockholders to take action against its directors and officers are limited.
Maryland law provides that Digital Realty Trust, Inc.’s directors have no liability in their capacities as directors if they perform their duties in good faith, in a manner they reasonably believe to be in the Company’s best interests and with the care that an ordinarily prudent person in a like position would use under similar circumstances. As permitted by the MGCL, Digital Realty Trust, Inc.’s charter limits the liability of Digital Realty Trust, Inc.’s directors and officers to the Company and its stockholders for money damages, except for liability resulting from:
|
•
|
actual receipt of an improper benefit or profit in money, property or services; or
|
|
•
|
a final judgment based upon a finding of active and deliberate dishonesty by the director or officer that was material to the cause of action adjudicated.
|
In addition, Digital Realty Trust, Inc.’s charter authorizes Digital Realty Trust, Inc. to obligate itself, and Digital Realty Trust, Inc.’s bylaws require it, to indemnify Digital Realty Trust, Inc.’s directors and officers for actions taken by them in those capacities and to pay or reimburse their reasonable expenses in advance of final disposition of a proceeding to the maximum extent permitted by Maryland law. Further, Digital Realty Trust, Inc. has entered into indemnification agreements with its directors and officers. As a result, Digital Realty Trust, Inc. and its stockholders may have more limited rights against its directors and officers than might otherwise exist under common law. Accordingly, in the event that actions taken in good faith by any of Digital Realty Trust, Inc.’s directors or officers impede the performance of the Company, the Company’s stockholders’ ability to recover damages from that director or officer will be limited.
Risks Related to Taxes and Digital Realty Trust, Inc.’s Status as a REIT
Failure to qualify as a REIT would have significant adverse consequences to Digital Realty Trust, Inc. and its stockholders and to Digital Realty Trust, L.P. and its unitholders.
Digital Realty Trust, Inc. has operated and intends to continue operating in a manner that it believes will allow it to qualify as a REIT for federal income tax purposes under the Code. Digital Realty Trust, Inc. has not requested and does not plan to request a ruling from the IRS that it qualifies as a REIT. Qualification as a REIT involves the application of highly technical and complex Code provisions for which there are only limited judicial and administrative interpretations. The complexity of these provisions and of the applicable Treasury Regulations that have been promulgated under the Code is greater in the case of a REIT that, like Digital Realty Trust, Inc., holds its assets through a partnership. The determination of various factual matters and circumstances not entirely within Digital Realty Trust, Inc.’s control may affect its ability to qualify as a REIT. In order to qualify as a REIT, Digital Realty Trust, Inc. must satisfy a number of requirements, including requirements regarding the ownership of its stock, requirements regarding the composition of its assets and a requirement that at least 95% of its gross
33
income in any year must be derived from qualifying sources, such as “rents from real property.” Also, Digital Realty Trust, Inc. must make distributions to stockholders aggregating annually at least 90% of its net taxable income, excluding any net capital gains.
If Digital Realty Trust, Inc. loses its REIT status, it will face serious tax consequences that would substantially reduce its cash available for distribution, including cash available to pay dividends to its stockholders, for each of the years involved because:
|
•
|
Digital Realty Trust, Inc. would not be allowed a deduction for dividends paid to stockholders in computing its taxable income and would be subject to federal corporate income tax on its taxable income;
|
|
•
|
Digital Realty Trust, Inc. also could be subject to the federal alternative minimum tax for taxable years prior to 2018 and possibly increased state and local taxes; and
|
|
•
|
unless Digital Realty Trust, Inc. is entitled to relief under applicable statutory provisions, it could not elect to be taxed as a REIT for four taxable years following the year during which it was disqualified.
|
In addition, if Digital Realty Trust, Inc. fails to qualify as a REIT, it will not be required to make distributions to common stockholders, and accordingly, distributions Digital Realty Trust, L.P. makes to its unitholders could be similarly reduced. As a result of all these factors, Digital Realty Trust, Inc.’s failure to qualify as a REIT could impair our ability to expand our business and raise capital, and could materially adversely affect the value of Digital Realty Trust, Inc.’s stock and Digital Realty Trust, L.P.’s units.
In certain circumstances, Digital Realty Trust, Inc. may be subject to federal and state taxes as a REIT, which would reduce its cash available for distribution to its stockholders.
Even if Digital Realty Trust, Inc. qualifies as a REIT for federal income tax purposes, it may be subject to some federal, state and local taxes on its income or property and, in certain cases, a 100% penalty tax, in the event it sells property as a dealer. In addition, our domestic corporate subsidiary, Digital Services, Inc., which is a taxable REIT subsidiary of Digital Realty Trust, Inc., could be subject to federal, state and local taxes, and our foreign properties and companies are subject to tax in the jurisdictions in which they operate and are located. A domestic taxable REIT subsidiary is subject to U.S. federal income tax as a regular C corporation. In addition, a 100% excise tax will be imposed on certain transactions between a taxable REIT subsidiary and its parent REIT that are not conducted on an arm’s length basis. Any federal, state or foreign taxes Digital Realty Trust, Inc. pays will reduce its cash available for distribution to stockholders.
To maintain Digital Realty Trust, Inc.’s REIT status, we may be forced to borrow funds during unfavorable market conditions.
To qualify as a REIT, Digital Realty Trust, Inc. generally must distribute to its stockholders at least 90% of its net taxable income each year, excluding capital gains, and Digital Realty Trust, Inc. will be subject to regular corporate income taxes to the extent that it distributes less than 100% of its net taxable income each year. In addition, Digital Realty Trust, Inc. will be subject to a 4% nondeductible excise tax on the amount, if any, by which distributions paid by Digital Realty Trust, Inc. in any calendar year are less than the sum of 85% of its ordinary income, 95% of its capital gain net income and 100% of its undistributed income from prior years. While historically Digital Realty Trust, Inc. has satisfied these distribution requirements by making cash distributions to its stockholders, a REIT is permitted to satisfy these requirements by making distributions of cash or other property. We may need to borrow funds for Digital Realty Trust, Inc. to meet the REIT distribution requirements even if the then prevailing market conditions are not favorable for these borrowings. These borrowing needs could result from differences in timing between the actual receipt of cash and inclusion of income for federal income tax purposes, or the effect of non-deductible capital expenditures, the creation of reserves or required debt or amortization payments.
Dividends payable by REITs do not qualify for the reduced tax rates available for some dividends.
The maximum tax rate applicable to “qualified dividend income” payable to U.S. stockholders that are individuals, trusts and estates is 20%. Dividends payable by REITs, however, generally are not eligible for these reduced rates. Under the federal tax legislation enacted in December 2017, commonly known as the Tax Cuts and Jobs Act (the “2017 Tax Legislation”), U.S. stockholders that are individuals, trusts and estates generally may deduct up to 20% of the ordinary dividends (i.e., dividends not designated as capital gain dividends or qualified dividend income) received from a REIT for taxable years beginning after December 31, 2017 and before January 1, 2026. Although this deduction reduces the effective tax rate applicable to certain dividends paid by REITs (generally to 29.6% assuming the shareholder is subject to the 37% maximum rate), such tax rate is still higher than the tax rate applicable to corporate dividends that constitute qualified dividend income. Accordingly, investors who are individuals, trusts and estates may perceive investments in REITs to be relatively less attractive than investments in the
34
stocks of non-REIT corporations that pay dividends treated as qualified dividend income, which could materially and adversely affect the value of the shares of REITs, including the per share trading price of Digital Realty Trust, Inc.’s capital stock.
The tax imposed on REITs engaging in “prohibited transactions” may limit our ability to engage in transactions which would be treated as sales for federal income tax purposes.
A REIT’s net income from prohibited transactions is subject to a 100% penalty tax. In general, prohibited transactions are sales or other dispositions of property, other than foreclosure property, held primarily for sale to customers in the ordinary course of business. Although we do not intend to hold any properties that would be characterized as held for sale to customers in the ordinary course of our business, unless a sale or disposition qualifies under certain statutory safe harbors, such characterization is a factual determination and no guarantee can be given that the IRS would agree with our characterization of our properties or that we will always be able to make use of the available safe harbors.
Complying with REIT requirements may cause us to forgo otherwise attractive opportunities or liquidate otherwise attractive investments.
To qualify as a REIT for federal income tax purposes, Digital Realty Trust, Inc. must continually satisfy tests concerning, among other things, its sources of income, the nature and diversification of its assets (including its proportionate share of Digital Realty Trust, L.P.’s assets), the amounts it distributes to its stockholders and the ownership of its capital stock. If Digital Realty Trust, Inc. fails to comply with one or more of the asset tests at the end of any calendar quarter, it must correct the failure within 30 days after the end of the calendar quarter or qualify for certain statutory relief provisions to avoid losing its REIT qualification and suffering adverse tax consequences. In order to meet these tests, we may be required to forgo investments we might otherwise make or to liquidate otherwise attractive investments. Thus, compliance with the REIT requirements may hinder our performance and reduce amounts available for distribution to Digital Realty Trust, Inc.’s stockholders and Digital Realty Trust, L.P.’s unitholders.
The power of Digital Realty Trust, Inc.’s board of directors to revoke Digital Realty Trust, Inc.’s REIT election without stockholder approval may cause adverse consequences to Digital Realty Trust, Inc.’s stockholders and Digital Realty Trust, L.P.’s unitholders.
Digital Realty Trust, Inc.’s charter provides that its board of directors may revoke or otherwise terminate its REIT election, without the approval of its stockholders, if it determines that it is no longer in Digital Realty Trust, Inc.’s best interests to continue to qualify as a REIT. If Digital Realty Trust, Inc. ceases to qualify as a REIT, it would become subject to U.S. federal corporate income tax on its taxable income and it would no longer be required to distribute most of its taxable income to its stockholders and, accordingly, distributions Digital Realty Trust, L.P. makes to its unitholders could be similarly reduced.
If the Operating Partnership fails to qualify as a partnership for federal income tax purposes, Digital Realty Trust, Inc. would fail to qualify as a REIT and suffer other adverse consequences.
We believe that the Operating Partnership has been organized and operated in a manner that will allow it to be treated as a partnership, and not an association or publicly traded partnership taxable as a corporation, for federal income tax purposes. As a partnership, the Operating Partnership is not subject to federal income tax on its income. Instead, each of its partners, including Digital Realty Trust, Inc., is allocated, and may be required to pay tax with respect to, that partner’s share of the Operating Partnership’s income. No assurance can be provided, however, that the IRS will not challenge the Operating Partnership’s status as a partnership for federal income tax purposes or that a court would not sustain such a challenge. If the IRS were successful in treating the Operating Partnership as an association or publicly traded partnership taxable as a corporation for federal income tax purposes, Digital Realty Trust, Inc. would fail to meet the gross income tests and certain of the asset tests applicable to REITs and, accordingly, would cease to qualify as a REIT. Such REIT qualification failure could impair our ability to expand our business and raise capital, and would materially adversely affect the value of Digital Realty Trust, Inc.’s stock and the Operating Partnership’s units. Also, the failure of the Operating Partnership to qualify as a partnership would cause it to become subject to federal corporate income tax, which would reduce significantly the amount of its cash available for debt service and for distribution to its partners, including Digital Realty Trust, Inc.
Our tax protection agreement may require the Operating Partnership to maintain certain debt levels that otherwise would not be required to operate our business.
In connection with the DFT Merger, we entered into a tax protection agreement with a number of limited partners of DuPont Fabros Technology, L.P. (the “Protected Partners”), all of whom became limited partners of the Operating Partnership. Pursuant to this tax protection agreement, the Protected Partners entered into a guarantee of certain debt of a subsidiary of the
35
Operating Partnership. The Operating Partnership is required to offer the Protected Partners a new guarantee opportunity in the event any guaranteed debt is repaid prior to March 1, 2023. If the Operating Partnership fails to offer the guarantee opportunity or to allocate guaranteed debt to a Protected Partner as required under the tax protection agreement, the Operating Partnership generally would be required to indemnify each Protected Partner for the tax liability resulting from such failure, as determined under the tax protection agreement. These obligations may require the Operating Partnership to maintain more or different indebtedness than we would otherwise require for our business.
Changes in U.S. or foreign tax laws and regulations, including changes to tax rates, legislation and other actions may adversely affect our results of operations, our stockholders, Digital Realty Trust, L.P.’s unitholders and us.
We are headquartered in the United States with subsidiaries and operations globally and are subject to income taxes in these jurisdictions. Significant judgment is required in determining our provision for income taxes. Although we believe that we have adequately assessed and accounted for our potential tax liabilities, and that our tax estimates are reasonable, there can be no assurance that additional taxes will not be due upon audit of our tax returns or as a result of changes to applicable tax laws. The governments of many of the countries in which we operate may enact changes to the tax laws of such countries, including changes to the corporate recognition and taxation of worldwide income. The nature and timing of any changes to each jurisdiction’s tax laws and the impact on our future tax liabilities cannot be predicted with any accuracy but could materially and adversely impact our results of operations and cash flows.
Additionally, each of our properties is subject to real property and personal property taxes. These taxes may increase as tax rates change and as the properties are assessed or reassessed by taxing authorities. Any increase in property taxes on our properties could have a material adverse effect on our revenues and results of operations.
Further, the rules dealing with federal income taxation are constantly under review by persons involved in the legislative process and by the IRS and the U.S. Department of the Treasury. Changes to the tax laws, with or without retroactive application, could materially and adversely affect Digital Realty Trust, Inc.’s stockholders, Digital Realty Trust, L.P.’s unitholders and us. We cannot predict how changes in the tax laws might affect our investors and us. New legislation, Treasury Regulations, administrative interpretations or court decisions could significantly and negatively affect Digital Realty Trust, Inc.’s ability to qualify as a REIT, the federal income tax consequences of such qualification, or the federal income tax consequences of an investment in us. Moreover, the law relating to the tax treatment of other entities, or an investment in other entities, could change, making an investment in such other entities more attractive relative to an investment in a REIT.
The 2017 Tax Legislation has significantly changed the U.S. federal income taxation of U.S. businesses and their owners, including REITs and their stockholders. Changes made by the 2017 Tax Legislation that could affect Digital Realty Trust, Inc. and its stockholders include:
|
•
|
temporarily reducing individual U.S. federal income tax rates on ordinary income; the highest individual U.S. federal income tax rate has been reduced from 39.6% to 37% for taxable years beginning after December 31, 2017 and before January 1, 2026;
|
|
•
|
permanently eliminating the progressive corporate tax rate structure, which previously imposed a maximum corporate tax rate of 35%, and replacing it with a flat corporate tax rate of 21%;
|
|
•
|
permitting a deduction for certain pass-through business income, including dividends received by our stockholders from us that are not designated by us as capital gain dividends or qualified dividend income, which will allow individuals, trusts, and estates to deduct up to 20% of such amounts for taxable years beginning after December 31, 2017 and before January 1, 2026;
|
|
•
|
reducing the highest rate of withholding with respect to our distributions to non-U.S. stockholders that are treated as attributable to gains from the sale or exchange of U.S. real property interests from 35% to 21%;
|
|
•
|
limiting our deduction for net operating losses arising in taxable years beginning after December 31, 2017 to 80% of our REIT taxable income (determined without regard to the dividends paid deduction);
|
|
•
|
generally limiting the deduction for net business interest expense in excess of 30% of a business’s “adjusted taxable income,” except for taxpayers that engage in certain real estate businesses (including most equity REITs) and elect out of this rule (provided that such electing taxpayers must use an alternative depreciation system with longer depreciation periods); and
|
|
•
|
eliminating the corporate alternative minimum tax.
|
Many of these changes that are applicable to us are effective beginning with our 2018 taxable year, without any transition periods or grandfathering for existing transactions. The legislation is unclear in many respects and could be subject to potential amendments and technical corrections, as well as interpretations and implementing regulations by the IRS and the U.S. Department of the Treasury, any of which could lessen or increase the impact of the legislation. In addition, it is unclear how
36
these U.S. federal income tax changes will affect state and local taxation, which often uses federal taxable income as a starting point for computing state and local tax liabilities.
Tax liabilities and attributes inherited in connection with acquisitions may adversely impact our business
.
From time to time we may acquire other corporations or entities and, in connection with such acquisitions, we may succeed to the historic tax attributes and liabilities of such entities. For example, if we acquire a C corporation and subsequently dispose of its assets within five years of the acquisition, we could be required to pay tax on any built-in gain attributable to such assets determined as of the date on which we acquired the assets. In addition, in order to qualify as a REIT, at the end of any taxable year, we must not have any earnings and profits accumulated in a non-REIT year. As a result, if we acquire a C corporation, we must distribute the corporation’s earnings and profits accumulated prior to the acquisition before the end of the taxable year in which we acquire the corporation. We also could be required to pay the acquired entity’s unpaid taxes even though such liabilities arose prior to the time we acquired the entity. Telx was a C corporation at the time of the Telx Acquisition, which raises each of these issues.
Forward-Looking Statements
We make statements in this report that are forward-looking statements within the meaning of the federal securities laws. In particular, statements pertaining to our capital resources, portfolio performance, our ability to lease vacant space and space under development, leverage policy and acquisition and capital expenditure plans, as well as our discussion of “Factors Which May Influence Future Results of Operations,” contain forward-looking statements. Likewise, all of our statements regarding anticipated market conditions, demographics and results of operations are forward-looking statements. You can identify forward-looking statements by the use of forward-looking terminology such as “believes,” “expects,” “may,” “will,” “should,” “seeks,” “approximately,” “intends,” “plans,” “pro forma,” “estimates” or “anticipates” or the negative of these words and phrases or similar words or phrases which are predictions of or indicate future events or trends and which do not relate solely to historical matters. You can also identify forward-looking statements by discussions of strategy, plans or intentions.
Forward-looking statements involve numerous risks and uncertainties and you should not rely on them as predictions of future events. Forward-looking statements depend on assumptions, data or methods which may be incorrect or imprecise and we may not be able to realize them. We do not guarantee that the transactions and events described will happen as described or that they will happen at all. The following factors, among others, could cause actual results and future events to differ materially from those set forth or contemplated in the forward-looking statements:
|
•
|
reduced demand for data centers or decreases in information technology spending;
|
|
•
|
decreased rental rates, increased operating costs or increased vacancy rates;
|
|
•
|
increased competition or available supply of data center space;
|
|
•
|
the suitability of our data centers and data center infrastructure, delays or disruptions in connectivity or availability of power, or failures or breaches of our physical and information security infrastructure or services;
|
|
•
|
our dependence upon significant customers, bankruptcy or insolvency of a major customer or a significant number of smaller customers, or defaults on or non-renewal of leases by customers;
|
|
•
|
breaches of our obligations or restrictions under our contracts with our customers;
|
|
•
|
our inability to successfully develop and lease new properties and development space, and delays or unexpected costs in development of properties;
|
|
•
|
the impact of current global and local economic, credit and market conditions;
|
|
•
|
our inability to retain data center space that we lease or sublease from third parties;
|
|
•
|
difficulties managing an international business and acquiring or operating properties in foreign jurisdictions and unfamiliar metropolitan areas;
|
|
•
|
our failure to realize the intended benefits from, or disruptions to our plans and operations or unknown or contingent liabilities related to, our recent acquisitions, including the Ascenty Acquisition;
|
|
•
|
our failure to successfully integrate and operate acquired or developed properties or businesses;
|
|
•
|
difficulties in identifying properties to acquire and completing acquisitions;
|
|
•
|
risks related to joint venture investments, including as a result of our lack of control of such investments;
|
|
•
|
risks associated with using debt to fund our business activities, including re-financing and interest rate risks, our failure to repay debt when due, adverse changes in our credit ratings or our breach of covenants or other terms contained in our loan facilities and agreements;
|
|
•
|
our failure to obtain necessary debt and equity financing, and our dependence on external sources of capital;
|
|
•
|
financial market fluctuations and changes in foreign currency exchange rates;
|
37
|
•
|
adverse economic or real estate developments in our industry or the industry sectors that we sell to, including risks relating to decreasing real estate valuations and impairment charges and goodwill and other intangible asset impairment charges;
|
|
•
|
our inability to manage our growth effectively;
|
|
•
|
losses in excess of our insurance coverage;
|
|
•
|
environmental liabilities and risks related to natural disasters;
|
|
•
|
our inability to comply with rules and regulations applicable to our Company;
|
|
•
|
Digital Realty Trust, Inc.’s failure to maintain its status as a REIT for federal income tax purposes;
|
|
•
|
Digital Realty Trust, L.P.’s failure to qualify as a partnership for federal income tax purposes;
|
|
•
|
restrictions on our ability to engage in certain business activities; and
|
|
•
|
changes in local, state, federal and international laws and regulations, including related to taxation, real estate and zoning laws, and increases in real property tax rates.
|
The risks included here are not exhaustive, and additional factors could adversely affect our business and financial performance, including factors and risks included in other sections of this report, including under Part I, Item 1A, Risk Factors. Moreover, we operate in a very competitive and rapidly changing environment. New risk factors emerge from time to time and it is not possible for management to predict all such risk factors, nor can we assess the impact of all such risk factors on the business or the extent to which any factor, or combination of factors, may cause actual results to differ materially from those contained in any forward-looking statements. While forward-looking statements reflect our good faith beliefs, they are not guaranties of future performance. We disclaim any obligation to publicly update or revise any forward-looking statement to reflect changes in underlying assumptions or factors, new information, data or methods, future events or other changes.
38
ITEM 1B. UNRESOLVED STAFF COMMENTS
None.
ITEM 2. PROPERTIES
General
In addition to the information in this Item 2, certain information regarding our portfolio is contained in Schedule III (Financial Statement Schedule) under Part IV, Item 15(a) (2) and which is included in Part II, Item 8. Information for Ascenty is only included in the Our Portfolio table in this Item, otherwise all other tables exclude tenant and leasing data related to Ascenty.
Our Portfolio
As of
December 31, 2018
, our portfolio consisted of
214
data centers, including
18
data centers held as investments in unconsolidated joint ventures, and contain a total of approximately
34.5 million
rentable square feet, including
3.4 million
square feet of space under active development and
2.1 million
square feet of space held for development. The following table presents an overview of our portfolio of properties, including the
18
data centers held as investments in unconsolidated joint ventures and developable land, based on information as of
December 31, 2018
(dollar amounts in thousands). All data centers are held in fee simple except as otherwise indicated. Please refer to Note 8 in the Notes to the Consolidated Financial Statements included in Part II, Item 8 of this Annual Report on Form 10-K for a description of all applicable encumbrances as of
December 31, 2018
.
|
Metropolitan Area
|
Data Center Buildings
|
Net Rentable Square Feet
(1)
|
Space Under Active Development
(2)
|
Space Held for Development
(3)
|
Annualized Rent
(4)
|
Occupancy Percentage
(5)
|
|||||||||||||
|
North America
|
|||||||||||||||||||
|
North
ern Virginia
|
30
|
|
5,718,180
|
|
1,425,029
|
|
84,852
|
|
$
|
549,446
|
|
95.4
|
%
|
||||||
|
Chica
go
|
10
|
|
2,963,850
|
|
459,250
|
|
152,362
|
|
291,599
|
|
89.5
|
%
|
|||||||
|
New Y
ork
|
12
|
|
1,980,040
|
|
—
|
|
240,157
|
|
206,251
|
|
83.5
|
%
|
|||||||
|
Silic
on Valley
|
19
|
|
2,251,021
|
|
—
|
|
—
|
|
208,195
|
|
97.1
|
%
|
|||||||
|
Dalla
s
|
21
|
|
3,435,188
|
|
132,310
|
|
81,206
|
|
183,814
|
|
80.4
|
%
|
|||||||
|
Phoen
ix
|
4
|
|
990,385
|
|
—
|
|
108,926
|
|
89,365
|
|
66.4
|
%
|
|||||||
|
San F
rancisco
|
4
|
|
834,540
|
|
13,753
|
|
—
|
|
65,257
|
|
71.8
|
%
|
|||||||
|
Atlan
ta
|
5
|
|
775,606
|
|
—
|
|
313,581
|
|
52,632
|
|
90.6
|
%
|
|||||||
|
Los A
ngeles
|
4
|
|
806,934
|
|
11,545
|
|
—
|
|
41,231
|
|
90.7
|
%
|
|||||||
|
Bosto
n
|
5
|
|
534,249
|
|
—
|
|
50,649
|
|
31,272
|
|
66.8
|
%
|
|||||||
|
Houst
on
|
6
|
|
392,816
|
|
—
|
|
13,969
|
|
19,537
|
|
84.6
|
%
|
|||||||
|
Toronto, Canada
(6)
|
3
|
|
326,591
|
|
60,506
|
|
511,969
|
|
18,022
|
|
75.0
|
%
|
|||||||
|
Denve
r
|
2
|
|
371,500
|
|
—
|
|
—
|
|
11,665
|
|
99.8
|
%
|
|||||||
|
Austi
n
|
1
|
|
85,688
|
|
—
|
|
—
|
|
8,539
|
|
65.1
|
%
|
|||||||
|
Miami
|
2
|
|
226,314
|
|
—
|
|
—
|
|
7,172
|
|
87.2
|
%
|
|||||||
|
Portl
and
|
1
|
|
48,574
|
|
—
|
|
—
|
|
6,337
|
|
85.3
|
%
|
|||||||
|
Minne
apolis/St. Paul
|
1
|
|
328,765
|
|
—
|
|
—
|
|
5,644
|
|
100.0
|
%
|
|||||||
|
Charl
otte
|
3
|
|
95,499
|
|
—
|
|
—
|
|
4,510
|
|
89.1
|
%
|
|||||||
|
Seatt
le
|
1
|
|
40,564
|
|
—
|
|
75,382
|
|
2,609
|
|
77.1
|
%
|
|||||||
|
North America Total / Weighted Average
|
134
|
|
22,206,304
|
|
2,102,393
|
|
1,633,053
|
|
1,803,097
|
|
87.6
|
%
|
|||||||
39
|
Metropolitan Area
|
Data Center Buildings
|
Net Rentable Square Feet
(1)
|
Space Under Active Development
(2)
|
Space Held for Development
(3)
|
Annualized Rent
(4)
|
Occupancy Percentage
(5)
|
|||||||||||||
|
Europe
|
|||||||||||||||||||
|
London, United Kingdom
(7)
|
16
|
|
1,430,107
|
|
92,560
|
|
104,606
|
|
209,634
|
|
91.3
|
%
|
|||||||
|
Amsterdam, Netherlands
(8)
|
9
|
|
474,303
|
|
91,859
|
|
68,185
|
|
46,372
|
|
92.9
|
%
|
|||||||
|
Dublin, Ireland
(8)
|
5
|
|
330,180
|
|
26,646
|
|
—
|
|
26,735
|
|
89.8
|
%
|
|||||||
|
Frankfurt, Germany
(8)
|
3
|
|
83,981
|
|
157,056
|
|
—
|
|
12,006
|
|
75.1
|
%
|
|||||||
|
Paris, France
(8)
|
3
|
|
185,994
|
|
—
|
|
—
|
|
7,077
|
|
100.0
|
%
|
|||||||
|
Manchester, England
(7)
|
1
|
|
38,016
|
|
—
|
|
—
|
|
1,754
|
|
100.0
|
%
|
|||||||
|
Geneva, Switzerland
(8)
|
1
|
|
59,190
|
|
—
|
|
—
|
|
1,772
|
|
100.0
|
%
|
|||||||
|
Europe Total / Weighted Average
|
38
|
|
2,601,771
|
|
368,121
|
|
172,791
|
|
305,350
|
|
91.8
|
%
|
|||||||
|
Asia Pacific
|
|||||||||||||||||||
|
Singapore
(9)
|
2
|
|
540,638
|
|
—
|
|
—
|
|
89,629
|
|
91.5
|
%
|
|||||||
|
Melbourne, Australia
(10)
|
2
|
|
146,570
|
|
—
|
|
—
|
|
16,789
|
|
79.3
|
%
|
|||||||
|
Sydney, Australia
(10)
|
3
|
|
196,665
|
|
117,692
|
|
—
|
|
23,025
|
|
91.7
|
%
|
|||||||
|
Osaka, Japan
(11)
|
1
|
|
—
|
|
239,999
|
|
—
|
|
—
|
|
—
|
|
|||||||
|
Asia Pacific Total / Weighted Average
|
8
|
|
883,873
|
|
357,691
|
|
—
|
|
129,443
|
|
89.5
|
%
|
|||||||
|
Ascenty Acquisition
(12)
|
16
|
|
473,251
|
|
522,643
|
|
243,160
|
|
73,538
|
|
95.3
|
%
|
|||||||
|
Non-Data Center Properties
|
—
|
|
516,107
|
|
—
|
|
—
|
|
4,591
|
|
100.0
|
%
|
|||||||
|
Managed Unconsolidated Joint Ventures
|
|||||||||||||||||||
|
North
ern Virginia
|
4
|
|
546,572
|
|
—
|
|
—
|
|
27,488
|
|
99.5
|
%
|
|||||||
|
Hong Kong
(13)
|
1
|
|
178,505
|
|
—
|
|
7,795
|
|
27,399
|
|
80.7
|
%
|
|||||||
|
Silic
on Valley
|
4
|
|
326,305
|
|
—
|
|
—
|
|
12,942
|
|
100.0
|
%
|
|||||||
|
Dalla
s
|
3
|
|
319,876
|
|
—
|
|
—
|
|
7,739
|
|
100.0
|
%
|
|||||||
|
New Y
ork
|
1
|
|
108,336
|
|
—
|
|
—
|
|
3,460
|
|
100.0
|
%
|
|||||||
|
13
|
|
1,479,594
|
|
—
|
|
7,795
|
|
79,028
|
|
97.5
|
%
|
||||||||
|
Non-Managed Unconsolidated Joint Ventures
|
|||||||||||||||||||
|
Seattle
|
2
|
|
451,369
|
|
—
|
|
—
|
|
55,779
|
|
97.9
|
%
|
|||||||
|
Tokyo
(11)
|
2
|
|
430,277
|
|
—
|
|
—
|
|
22,561
|
|
86.9
|
%
|
|||||||
|
Osaka
(11)
|
1
|
|
92,087
|
|
—
|
|
—
|
|
15,006
|
|
89.2
|
%
|
|||||||
|
5
|
|
973,733
|
|
—
|
|
—
|
|
93,346
|
|
92.2
|
%
|
||||||||
|
Total
|
214
|
|
29,134,633
|
|
3,350,848
|
|
2,056,799
|
|
2,488,393
|
|
89.0
|
%
|
|||||||
40
|
(1)
|
Net rentable square feet at a building represents the current square feet at that building under lease as specified in the lease agreements plus management’s estimate of space available for lease. We estimate the total net rentable square feet available for lease based on a number of factors in addition to contractually leased square feet, including available power, required support space and common area. Net rentable square feet includes tenants’ proportional share of common areas but excludes space held for development.
|
|
(2)
|
Space under active development includes current base building and data center projects in progress.
|
|
(3)
|
Space held for development includes space held for future data center development, and excludes space under active development.
|
|
(4)
|
Annualized rent represents the monthly contractual rent (defined as cash base rent before abatements) under existing leases as of
December 31, 2018
multiplied by 12.
|
|
(5)
|
Excludes space held for development and space under active development. We estimate the total square feet available for lease based on a number of factors in addition to contractually leased square feet, including available power, required support space and common area.
|
|
(6)
|
Rental amounts were calculated based on the exchange rate in effect on
December 31, 2018
of $0.73 to 1.00 CAD.
|
|
(7)
|
Rental amounts were calculated based on the exchange rate in effect on
December 31, 2018
of $1.27 to £1.00.
|
|
(8)
|
Rental amounts were calculated based on the exchange rate in effect on
December 31, 2018
of $1.14 to €1.00.
|
|
(9)
|
Rental amounts were calculated based on the exchange rate in effect on
December 31, 2018
of $0.73 to 1.00 SGD.
|
|
(10)
|
Rental amounts were calculated based on the exchange rate in effect on
December 31, 2018
of $0.70 to 1.00 AUD.
|
|
(11)
|
Rental amounts were calculated based on the exchange rate in effect on
December 31, 2018
of $0.01 to 1.00 JPY.
|
|
(12)
|
Rental amounts were calculated based on the exchange rate in effect on
December 31, 2018
of $0.26 to 1.00 BRL.
|
|
(13)
|
Rental amounts were calculated based on the exchange rate in effect on
December 31, 2018
of $0.13 to 1.00 HKD.
|
We have ground leases on Paul van Vlissingenstraat 16 that expires in 2054, Chemin de l’Epinglier 2 that expires in 2074, Clonshaugh Industrial Estate I and II that expires in 2981, Manchester Technopark that expires in 2125, 29A International Business Park that expires in 2038, Gyroscoopweg 2E-2F, which has a continuous ground lease and will be adjusted on January 1, 2042, and Naritaweg 52, which has a continuous ground lease. We have operating leases at 111 8
th
Avenue (2
nd
and 6
th
floors), 111 8
th
Avenue (3
rd
and 7
th
floors) and 410 Commerce Boulevard, which expire in June 2024, February 2022 and December 2026, respectively. The lease at 111 8
th
Avenue (2
nd
and 6
th
floors) has an option to extend the lease until June 2034 and the lease at 111 8
th
Avenue (3
rd
and 7
th
floors) has an option to extend the lease until February 2032. The lease at 410 Commerce Boulevard has no extension options. As part of the Telx Acquisition and European Portfolio Acquisition, leases relating to operating facilities, offices, and equipment under various lease agreements expire during the years ending December 2018 through June 2047.
We have a fully prepaid ground lease on 2055 E. Technology Circle that expires in 2083. We have a fully prepaid ground lease on Cateringweg 5 that expires in 2059. The ground lease at Naritaweg 52 has been prepaid through December 2036.
41
Customer Diversification
As of
December 31, 2018
, our portfolio was leased to over 2,300 companies, many of which are internationally recognized firms. The following table sets forth information regarding the 20 largest customers in our portfolio based on annualized rent as of
December 31, 2018
(dollar amounts in thousands).
|
Tenant
|
Number
of Locations |
Total
Occupied Square Feet (1)(4) |
Percentage
of Net Rentable Square Feet (4) |
Annualized
Rent (2)(4) |
Percentage
of Annualized Rent |
Weighted
Average Remaining Lease Term in Months |
|||||||||||||
|
1
|
Facebook, Inc.
|
18
|
|
1,207,044
|
|
5.1
|
%
|
$
|
154,426
|
|
6.8
|
%
|
5.3
|
|
|||||
|
2
|
IBM
|
28
|
|
1,061,195
|
|
4.5
|
%
|
145,987
|
|
6.4
|
%
|
3.2
|
|
||||||
|
3
|
Fortune 50 Software Company
|
17
|
|
1,714,762
|
|
7.3
|
%
|
139,947
|
|
6.2
|
%
|
5.2
|
|
||||||
|
4
|
Cyxtera Technologies, Inc. (3)
|
19
|
|
1,938,657
|
|
8.3
|
%
|
80,370
|
|
3.5
|
%
|
4.9
|
|
||||||
|
5
|
Fortune 25 Investment Grade-Rated
Company |
11
|
|
684,546
|
|
2.9
|
%
|
80,104
|
|
3.5
|
%
|
5.1
|
|
||||||
|
6
|
Oracle America, Inc.
|
20
|
|
593,250
|
|
2.5
|
%
|
72,758
|
|
3.2
|
%
|
2.9
|
|
||||||
|
7
|
Equinix
|
21
|
|
959,678
|
|
4.1
|
%
|
58,579
|
|
2.6
|
%
|
10.3
|
|
||||||
|
8
|
Rackspace
|
12
|
|
640,126
|
|
2.7
|
%
|
57,615
|
|
2.5
|
%
|
8.9
|
|
||||||
|
9
|
LinkedIn Corporation
|
7
|
|
441,450
|
|
1.9
|
%
|
54,376
|
|
2.4
|
%
|
5.7
|
|
||||||
|
10
|
Verizon
|
66
|
|
375,246
|
|
1.6
|
%
|
52,196
|
|
2.3
|
%
|
2.9
|
|
||||||
|
11
|
Fortune 500 SaaS Provider
|
8
|
|
496,704
|
|
2.1
|
%
|
44,121
|
|
1.9
|
%
|
6.9
|
|
||||||
|
12
|
AT&T
|
59
|
|
649,754
|
|
2.8
|
%
|
40,331
|
|
1.8
|
%
|
3.5
|
|
||||||
|
13
|
Comcast Corporation
|
26
|
|
182,744
|
|
0.8
|
%
|
34,941
|
|
1.5
|
%
|
6.9
|
|
||||||
|
14
|
JPMorgan Chase & Co.
|
16
|
|
264,652
|
|
1.1
|
%
|
33,410
|
|
1.5
|
%
|
3.3
|
|
||||||
|
15
|
DXC Technology Company (5)
|
11
|
|
244,488
|
|
1.0
|
%
|
33,270
|
|
1.5
|
%
|
3.5
|
|
||||||
|
16
|
Uber Technologies, Inc.
|
5
|
|
167,500
|
|
0.7
|
%
|
30,707
|
|
1.4
|
%
|
3.4
|
|
||||||
|
17
|
CenturyLink, Inc.
|
80
|
|
427,676
|
|
1.8
|
%
|
27,177
|
|
1.2
|
%
|
4.8
|
|
||||||
|
18
|
China Telecommunications
Corporation |
10
|
|
152,843
|
|
0.7
|
%
|
26,494
|
|
1.2
|
%
|
5.3
|
|
||||||
|
19
|
SunGard Availability Services LP
|
11
|
|
222,185
|
|
0.9
|
%
|
24,724
|
|
1.1
|
%
|
6.2
|
|
||||||
|
20
|
Charter Communications
|
18
|
|
144,982
|
|
0.6
|
%
|
23,790
|
|
1.0
|
%
|
5.7
|
|
||||||
|
Total / Weighted Average
|
12,569,482
|
|
53.4
|
%
|
$
|
1,215,323
|
|
53.5
|
%
|
5.3
|
|
||||||||
Note:
Our direct customers may be the entities named in the table above or their subsidiaries or affiliates.
|
(1)
|
Occupied square footage is defined as leases that commenced on or before
December 31, 2018
. For some of our properties, we calculate occupancy based on factors in addition to contractually leased square feet, including available power, required support space and common area.
|
|
(2)
|
Annualized rent represents the monthly contractual base rent (defined as cash base rent before abatements) under existing leases as of
December 31, 2018
multiplied by 12.
|
|
(3)
|
Represents leases with former CenturyLink, Inc. affiliates, which are our direct customers. Cyxtera Technologies, Inc. acquired the data center and colocation business, including such direct customers, of CenturyLink, Inc. in 2Q 2017.
|
|
(4)
|
Represents consolidated portfolio plus our managed portfolio of unconsolidated joint ventures based on our ownership percentage.
|
|
(5)
|
Represents leases with former Hewlett Packard Enterprises affiliates, which are our direct customers, DXC Technology Company was formed in 2Q 2017 from the merger of Computer Sciences Corporation (CSC) and the Enterprise Services business of Hewlett Packard Enterprise.
|
42
Lease Distribution
The following table sets forth information relating to the distribution of leases in the properties in our portfolio, based on net rentable square feet (excluding approximately
3.4 million
square feet of space under active development and approximately
2.1 million
square feet of space held for development at
December 31, 2018
) under lease as of
December 31, 2018
(dollar amounts in thousands).
|
Square Feet Under Lease
|
Total Net
Rentable Square Feet(1)(3) |
Percentage
of Net Rentable Square Feet(1) |
Annualized
Rent(2)(3) |
Percentage
of Annualized Rent |
|||||||||
|
Available
|
3,081,816
|
|
11.6
|
%
|
—
|
|
—
|
|
|||||
|
2,500 or less
|
1,688,707
|
|
6.4
|
%
|
$
|
329,470
|
|
14.5
|
%
|
||||
|
2,501 - 10,000
|
2,707,467
|
|
10.2
|
%
|
331,889
|
|
14.6
|
%
|
|||||
|
10,001 - 20,000
|
6,275,582
|
|
23.6
|
%
|
763,258
|
|
33.7
|
%
|
|||||
|
20,001 - 40,000
|
4,591,290
|
|
17.3
|
%
|
490,622
|
|
21.7
|
%
|
|||||
|
40,001 - 100,000
|
4,127,293
|
|
15.5
|
%
|
226,477
|
|
10.0
|
%
|
|||||
|
Greater than 100,000
|
4,085,370
|
|
15.4
|
%
|
124,788
|
|
5.5
|
%
|
|||||
|
Portfolio Total
|
26,557,525
|
|
100.0
|
%
|
$
|
2,266,504
|
|
100.0
|
%
|
||||
|
(1)
|
For some of our properties, we calculate square footage based on factors in addition to contractually leased square feet, including available power, required support space and common area. We estimate the total net rentable square feet available for lease based on a number of factors in addition to contractually leased square feet, including available power, required support space and common area.
|
|
(2)
|
Annualized rent represents the monthly contractual base rent (defined as cash base rent before abatements) under existing leases as of
December 31, 2018
multiplied by 12.
|
|
(3)
|
Represents consolidated portfolio plus our managed portfolio of unconsolidated joint ventures based on our ownership percentage.
|
43
Lease Expirations
The following table sets forth a summary schedule of the lease expirations for leases in place as of
December 31, 2018
plus available space for ten calendar years at the properties in our portfolio, excluding approximately
3.4 million
square feet of space under active development and approximately
2.1 million
square feet of space held for development at
December 31, 2018
. Unless otherwise stated in the footnotes to the table below, the information set forth in the table assumes that tenants exercise no renewal options and all early termination rights (dollar amounts in thousands).
|
Year
|
Square
Footage of Expiring Leases (1)(4) |
Percentage
of Net Rentable Square Feet (4) |
Annualized
Rent (2)(4) |
Percentage
of Annualized Rent (4) |
Annualized
Rent Per Occupied Square Foot (4) |
Annualized
Rent Per Occupied Square Foot at Expiration (4) |
Annualized
Rent at Expiration |
||||||||||||||||||
|
Available
|
3,081,816
|
|
11.6
|
%
|
|||||||||||||||||||||
|
Month to Month (3)
|
262,033
|
|
1.0
|
%
|
$
|
51,666
|
|
2.3
|
%
|
$
|
197
|
|
$
|
197
|
|
$
|
51,666
|
|
|||||||
|
2019
|
3,458,225
|
|
13.0
|
%
|
444,342
|
|
19.6
|
%
|
128
|
|
129
|
|
444,717
|
|
|||||||||||
|
2020
|
2,408,318
|
|
9.1
|
%
|
294,888
|
|
13.0
|
%
|
122
|
|
124
|
|
298,743
|
|
|||||||||||
|
2021
|
3,041,246
|
|
11.5
|
%
|
274,653
|
|
12.1
|
%
|
90
|
|
94
|
|
286,641
|
|
|||||||||||
|
2022
|
2,821,051
|
|
10.6
|
%
|
268,461
|
|
11.8
|
%
|
95
|
|
103
|
|
290,077
|
|
|||||||||||
|
2023
|
2,099,824
|
|
7.9
|
%
|
217,698
|
|
9.6
|
%
|
104
|
|
109
|
|
228,382
|
|
|||||||||||
|
2024
|
1,809,409
|
|
6.8
|
%
|
166,031
|
|
7.3
|
%
|
92
|
|
97
|
|
176,145
|
|
|||||||||||
|
2025
|
1,761,325
|
|
6.6
|
%
|
140,525
|
|
6.2
|
%
|
80
|
|
92
|
|
162,037
|
|
|||||||||||
|
2026
|
1,247,119
|
|
4.7
|
%
|
120,386
|
|
5.3
|
%
|
97
|
|
113
|
|
140,570
|
|
|||||||||||
|
2027
|
701,899
|
|
2.6
|
%
|
58,248
|
|
2.6
|
%
|
83
|
|
102
|
|
71,494
|
|
|||||||||||
|
2028
|
724,138
|
|
2.7
|
%
|
53,112
|
|
2.3
|
%
|
73
|
|
89
|
|
64,335
|
|
|||||||||||
|
Thereafter
|
3,141,122
|
|
11.9
|
%
|
176,494
|
|
7.9
|
%
|
56
|
|
75
|
|
236,338
|
|
|||||||||||
|
Portfolio Total / Weighted Average
|
26,557,525
|
|
100.0
|
%
|
$
|
2,266,504
|
|
100.0
|
%
|
$
|
97
|
|
$
|
104
|
|
$
|
2,451,145
|
|
|||||||
|
(1)
|
For some of our properties, we calculate square footage based on factors in addition to contractually leased square feet, including available power, required support space and common area. We estimate the total net rentable square feet available for lease based on a number of factors in addition to contractually leased square feet, including available power, required support space and common area.
|
|
(2)
|
Annualized rent represents the monthly contractual base rent (defined as cash base rent before abatements) under existing leases as of
December 31, 2018
multiplied by 12.
|
|
(3)
|
Includes leases, licenses and similar agreements that upon expiration have been automatically renewed on a month-to-month basis.
|
|
(4)
|
Represents consolidated portfolio plus our managed portfolio of unconsolidated joint ventures based on our ownership percentage.
|
ITEM 3. LEGAL PROCEEDINGS
In the ordinary course of our business, we may become subject to tort claims, breach of contract and other claims and administrative proceedings. As of
December 31, 2018
, we were not a party to any legal proceedings which we believe would have a material adverse effect on our operations or financial position.
ITEM 4. MINE SAFETY DISCLOSURES
Not applicable.
44
PART II
ITEM 5. MARKET FOR REGISTRANT’S COMMON EQUITY, RELATED STOCKHOLDER MATTERS AND ISSUER PURCHASES OF EQUITY SECURITIES
Digital Realty Trust, Inc.
Digital Realty Trust, Inc.’s common stock has been listed, and is traded, on the New York Stock Exchange, or the NYSE, under the symbol “DLR” since October 29, 2004.
Subject to the distribution requirements applicable to REITs under the Code, Digital Realty Trust, Inc. intends, to the extent practicable, to invest substantially all of the proceeds from sales and refinancings of its assets in real estate-related assets and other assets. Digital Realty Trust, Inc. may, however, under certain circumstances, make a dividend of capital or of assets. Such dividends, if any, will be made at the discretion of Digital Realty Trust, Inc.'s board of directors.
As of February 21, 2019, there were approximately 520 holders of record of Digital Realty Trust, Inc.’s common stock. This figure does not reflect the beneficial ownership of shares held in nominee name.
Digital Realty Trust, L.P.
There is no established trading market for Digital Realty Trust, L.P.’s common units of limited partnership. As of February 21, 2019, there were 86 holders of record of common units, including Digital Realty Trust, L.P.’s general partner, Digital Realty Trust, Inc.
Digital Realty Trust, L.P. currently intends to continue to make regular quarterly distributions to holders of its common units. Any future distributions will be declared at the discretion of the board of directors of Digital Realty Trust, L.P.’s general partner, Digital Realty Trust, Inc., and will depend on our actual cash flow, financial condition, capital requirements, the annual distribution requirements under the REIT provisions of the Code, and such other factors as the board of directors may deem relevant.
45
STOCK PERFORMANCE GRAPH
The following graph compares the yearly change in the cumulative total stockholder return on Digital Realty Trust, Inc.’s common stock during the period from December 31, 2013 through
December 31, 2018
, with the cumulative total returns on the MSCI US REIT Index (RMS) and the S&P 500 Market Index. The comparison assumes that $100 was invested on December 31, 2013 in Digital Realty Trust, Inc.’s common stock and in each of these indices and assumes reinvestment of dividends, if any.
COMPARISON OF CUMULATIVE TOTAL RETURNS
AMONG DIGITAL REALTY TRUST, INC., S&P 500 INDEX AND RMS INDEX
Assumes $100 invested on December 31, 2013
Assumes dividends reinvested
To fiscal year ending December 31, 2018

46
|
Pricing Date
|
DLR($)
|
S&P 500($)
|
RMS($)
|
|||||
|
December 31, 2013
|
100.0
|
|
100.0
|
|
100.0
|
|
||
|
December 31, 2014
|
142.6
|
|
113.7
|
|
130.4
|
|
||
|
December 31, 2015
|
171.3
|
|
115.3
|
|
133.7
|
|
||
|
December 31, 2016
|
231.1
|
|
129.1
|
|
145.2
|
|
||
|
December 31, 2017
|
276.8
|
|
157.2
|
|
152.5
|
|
||
|
December 31, 2018
|
268.4
|
|
150.3
|
|
145.6
|
|
||
|
•
|
This graph and the accompanying text are not “soliciting material,” are not deemed filed with the SEC and are not to be incorporated by reference in any filing by us under the Securities Act of 1933, as amended, or the Securities Exchange Act of 1934, as amended, whether made before or after the date hereof and irrespective of any general incorporation language in any such filing.
|
|
•
|
The stock price performance shown on the graph is not necessarily indicative of future price performance.
|
|
•
|
The hypothetical investment in Digital Realty Trust, Inc.’s common stock presented in the stock performance graph above is based on the closing price of the common stock on December 31, 2013.
|
SALES OF UNREGISTERED EQUITY SECURITIES
Digital Realty Trust, Inc.
None.
Digital Realty Trust, L.P.
During the year ended
December 31, 2018
, our Operating Partnership issued partnership units in private placements in reliance on the exemption from registration provided by Section 4(a)(2) of the Securities Act, in the amounts and for the consideration set forth below:
During the year ended
December 31, 2018
, Digital Realty Trust, Inc. issued an aggregate of 240,188 shares of its common stock in connection with restricted stock awards for no cash consideration. For each share of common stock issued by Digital Realty Trust, Inc. in connection with such awards, our Operating Partnership issued a restricted common unit to Digital Realty Trust, Inc. During the year ended
December 31, 2018
, our Operating Partnership issued an aggregate of 240,188 common units to Digital Realty Trust, Inc., as required by our Operating Partnership’s partnership agreement. During the year ended
December 31, 2018
, an aggregate of 19,423 shares of its common stock were forfeited to Digital Realty Trust, Inc. in connection with restricted stock awards for a net issuance of 220,765 shares of common stock.
On December 20, 2018, our Operating Partnership issued 2,338,874 common units as partial consideration for the Ascenty Acquisition. The Operating Partnership’s reliance upon the exemption provided by Section 4(a)(2) of the Securities Act, was based in part upon representations made by the sellers in the transaction documents related to the Ascenty Acquisition.
All other issuances of unregistered equity securities of our Operating Partnership during the year ended
December 31, 2018
have previously been disclosed in filings with the SEC. For all issuances of units to Digital Realty Trust, Inc., our Operating Partnership relied on Digital Realty Trust, Inc.’s status as a publicly traded NYSE-listed company with over
$23.8 billion
in total consolidated assets and as our Operating Partnership’s majority owner and general partner as the basis for the exemption under Section 4(a)(2) of the Securities Act.
REPURCHASES OF EQUITY SECURITIES
Digital Realty Trust, Inc.
None.
Digital Realty Trust, L.P.
None.
47
ITEM 6. SELECTED FINANCIAL DATA
SELECTED COMPANY FINANCIAL AND OTHER DATA (Digital Realty Trust, Inc.)
The following table sets forth selected consolidated financial and operating data on an historical basis for Digital Realty Trust, Inc.
The following data should be read in conjunction with our financial statements and notes thereto and “Management’s Discussion and Analysis of Financial Condition and Results of Operations” included elsewhere in this Form 10-K. Certain prior year amounts have been reclassified to conform to the current year presentation.
48
|
|
Year Ended December 31,
|
||||||||||||||||||
|
|
2018
|
2017
|
2016
|
2015
|
2014
|
||||||||||||||
|
|
(Amounts in thousands, except share and per share data)
|
||||||||||||||||||
|
Statement of Operations Data:
|
|||||||||||||||||||
|
Operating Revenues:
|
|||||||||||||||||||
|
Rental and other services
|
$
|
2,412,076
|
|
$
|
2,010,301
|
|
$
|
1,746,828
|
|
$
|
1,395,745
|
|
$
|
1,256,086
|
|
||||
|
Tenant reimbursements
|
624,637
|
|
440,224
|
|
355,903
|
|
359,875
|
|
350,234
|
|
|||||||||
|
Fee income and other
|
9,765
|
|
7,403
|
|
39,482
|
|
7,716
|
|
10,118
|
|
|||||||||
|
Total operating revenues
|
3,046,478
|
|
2,457,928
|
|
2,142,213
|
|
1,763,336
|
|
1,616,438
|
|
|||||||||
|
Operating Expenses:
|
|||||||||||||||||||
|
Rental property operating and maintenance
|
957,065
|
|
759,616
|
|
660,177
|
|
549,885
|
|
503,140
|
|
|||||||||
|
Property taxes
|
129,516
|
|
124,014
|
|
102,497
|
|
92,588
|
|
91,538
|
|
|||||||||
|
Insurance
|
11,402
|
|
10,981
|
|
9,492
|
|
8,809
|
|
8,643
|
|
|||||||||
|
Change in fair value of contingent consideration
|
—
|
|
—
|
|
—
|
|
(44,276
|
)
|
(8,093
|
)
|
|||||||||
|
Depreciation and amortization
|
1,186,896
|
|
842,464
|
|
699,324
|
|
570,527
|
|
538,513
|
|
|||||||||
|
General and administrative
|
163,667
|
|
161,441
|
|
152,733
|
|
105,549
|
|
93,188
|
|
|||||||||
|
Transaction and integration expenses
|
45,327
|
|
76,048
|
|
20,491
|
|
17,400
|
|
1,303
|
|
|||||||||
|
Impairment on investments in real estate
|
—
|
|
28,992
|
|
—
|
|
—
|
|
126,470
|
|
|||||||||
|
Other
|
2,818
|
|
3,077
|
|
213
|
|
60,943
|
|
3,070
|
|
|||||||||
|
Total operating expenses
|
2,496,691
|
|
2,006,633
|
|
1,644,927
|
|
1,361,425
|
|
1,357,772
|
|
|||||||||
|
Operating income
|
549,787
|
|
451,295
|
|
497,286
|
|
401,911
|
|
258,666
|
|
|||||||||
|
Other Income (Expenses):
|
|||||||||||||||||||
|
Equity in earnings of unconsolidated joint ventures
|
32,979
|
|
25,516
|
|
17,104
|
|
15,491
|
|
13,289
|
|
|||||||||
|
Gain on sale of properties
|
80,049
|
|
40,354
|
|
169,902
|
|
94,604
|
|
15,945
|
|
|||||||||
|
Gain on contribution of investment properties to unconsolidated joint ventures
|
—
|
|
—
|
|
—
|
|
—
|
|
95,404
|
|
|||||||||
|
Gain on sale of equity investment
|
—
|
|
—
|
|
—
|
|
—
|
|
14,551
|
|
|||||||||
|
Interest and other income (expense)
|
3,481
|
|
3,655
|
|
(4,564
|
)
|
(2,381
|
)
|
2,663
|
|
|||||||||
|
Interest expense
|
(321,529
|
)
|
(258,642
|
)
|
(236,480
|
)
|
(201,435
|
)
|
(191,085
|
)
|
|||||||||
|
Tax expense
|
(2,084
|
)
|
(7,901
|
)
|
(10,385
|
)
|
(6,451
|
)
|
(5,238
|
)
|
|||||||||
|
Gain (loss) from early extinguishment of debt
|
(1,568
|
)
|
1,990
|
|
(1,011
|
)
|
(148
|
)
|
(780
|
)
|
|||||||||
|
Net income
|
341,115
|
|
256,267
|
|
431,852
|
|
301,591
|
|
203,415
|
|
|||||||||
|
Net income attributable to noncontrolling interests
|
(9,869
|
)
|
(8,008
|
)
|
(5,665
|
)
|
(4,902
|
)
|
(3,232
|
)
|
|||||||||
|
Net income attributable to Digital Realty Trust, Inc.
|
331,246
|
|
248,259
|
|
426,187
|
|
296,689
|
|
200,183
|
|
|||||||||
|
Preferred stock dividends
|
(81,316
|
)
|
(68,802
|
)
|
(83,771
|
)
|
(79,423
|
)
|
(67,465
|
)
|
|||||||||
|
Issuance costs associated with redeemed preferred stock
|
—
|
|
(6,309
|
)
|
(10,328
|
)
|
—
|
|
—
|
|
|||||||||
|
Net income available to common stockholders
|
$
|
249,930
|
|
$
|
173,148
|
|
$
|
332,088
|
|
$
|
217,266
|
|
$
|
132,718
|
|
||||
|
Per Share Data:
|
|||||||||||||||||||
|
Basic income per share available to common stockholders
|
$
|
1.21
|
|
$
|
0.99
|
|
$
|
2.21
|
|
$
|
1.57
|
|
$
|
1.00
|
|
||||
|
Diluted income per share available to common stockholders
|
$
|
1.21
|
|
$
|
0.99
|
|
$
|
2.20
|
|
$
|
1.56
|
|
$
|
0.99
|
|
||||
|
Cash dividend per common share
|
$
|
4.04
|
|
$
|
3.72
|
|
$
|
3.52
|
|
$
|
3.40
|
|
$
|
3.32
|
|
||||
|
Weighted average common shares outstanding:
|
|||||||||||||||||||
|
Basic
|
206,035,408
|
|
174,059,386
|
|
149,953,662
|
|
138,247,606
|
|
133,369,047
|
|
|||||||||
|
Diluted
|
206,673,471
|
|
174,895,098
|
|
150,679,688
|
|
138,865,421
|
|
133,637,235
|
|
|||||||||
49
|
|
December 31,
|
||||||||||||||||||
|
|
2018
|
2017
|
2016
|
2015
|
2014
|
||||||||||||||
|
Balance Sheet Data:
|
|||||||||||||||||||
|
Net investments in real estate
|
$
|
15,079,726
|
|
$
|
13,841,186
|
|
$
|
8,996,362
|
|
$
|
8,770,212
|
|
$
|
8,203,287
|
|
||||
|
Total assets
|
23,766,695
|
|
21,404,345
|
|
12,192,585
|
|
11,416,063
|
|
9,526,784
|
|
|||||||||
|
Global revolving credit facilities
|
1,647,735
|
|
550,946
|
|
199,209
|
|
960,271
|
|
525,951
|
|
|||||||||
|
Unsecured term loan
|
1,178,904
|
|
1,420,333
|
|
1,482,361
|
|
923,267
|
|
976,600
|
|
|||||||||
|
Unsecured senior notes, net of discount
|
7,589,126
|
|
6,570,757
|
|
4,153,797
|
|
3,712,569
|
|
2,791,758
|
|
|||||||||
|
Mortgages and other secured loans, net of premiums
|
685,714
|
|
106,582
|
|
3,240
|
|
302,930
|
|
378,818
|
|
|||||||||
|
Total liabilities
|
12,892,653
|
|
10,300,993
|
|
7,060,288
|
|
6,879,561
|
|
5,612,546
|
|
|||||||||
|
Redeemable noncontrolling interests in operating partnership
|
15,832
|
|
53,902
|
|
—
|
|
—
|
|
—
|
|
|||||||||
|
Total stockholders' equity
|
9,858,644
|
|
10,349,081
|
|
5,096,015
|
|
4,500,132
|
|
3,878,256
|
|
|||||||||
|
Noncontrolling interests in operating partnership
|
906,510
|
|
698,126
|
|
29,684
|
|
29,612
|
|
29,191
|
|
|||||||||
|
Noncontrolling interests in consolidated joint ventures
|
93,056
|
|
2,243
|
|
6,598
|
|
6,758
|
|
6,791
|
|
|||||||||
|
Total liabilities and equity
|
$
|
23,766,695
|
|
$
|
21,404,345
|
|
$
|
12,192,585
|
|
$
|
11,416,063
|
|
$
|
9,526,784
|
|
||||
|
|
Year Ended December 31,
|
||||||||||||||||||
|
|
2018
|
2017
|
2016
|
2015
|
2014
|
||||||||||||||
|
Cash flows from (used in):
|
|||||||||||||||||||
|
Operating activities
|
$
|
1,385,324
|
|
$
|
1,023,305
|
|
$
|
911,242
|
|
$
|
796,840
|
|
$
|
655,888
|
|
||||
|
Investing activities
|
(3,035,993
|
)
|
(1,357,153
|
)
|
(1,303,597
|
)
|
(2,527,501
|
)
|
(644,180
|
)
|
|||||||||
|
Financing activities
|
1,757,269
|
|
321,200
|
|
350,617
|
|
1,750,531
|
|
(26,974
|
)
|
|||||||||
50
SELECTED COMPANY FINANCIAL AND OTHER DATA (Digital Realty Trust, L.P.)
The following table sets forth selected consolidated financial and operating data on an historical basis for our Operating Partnership.
51
|
|
Year Ended December 31,
|
||||||||||||||||||
|
|
2018
|
2017
|
2016
|
2015
|
2014
|
||||||||||||||
|
|
(Amounts in thousands, except unit and per unit data)
|
||||||||||||||||||
|
Statement of Operations Data:
|
|||||||||||||||||||
|
Operating Revenues:
|
|||||||||||||||||||
|
Rental and other services
|
$
|
2,412,076
|
|
$
|
2,010,301
|
|
$
|
1,746,828
|
|
$
|
1,395,745
|
|
$
|
1,256,086
|
|
||||
|
Tenant reimbursements
|
624,637
|
|
440,224
|
|
355,903
|
|
359,875
|
|
350,234
|
|
|||||||||
|
Fee income and other
|
9,765
|
|
7,403
|
|
39,482
|
|
7,716
|
|
10,118
|
|
|||||||||
|
Total operating revenues
|
3,046,478
|
|
2,457,928
|
|
2,142,213
|
|
1,763,336
|
|
1,616,438
|
|
|||||||||
|
Operating Expenses:
|
|||||||||||||||||||
|
Rental property operating and maintenance
|
957,065
|
|
759,616
|
|
660,177
|
|
549,885
|
|
503,140
|
|
|||||||||
|
Property taxes
|
129,516
|
|
124,014
|
|
102,497
|
|
92,588
|
|
91,538
|
|
|||||||||
|
Insurance
|
11,402
|
|
10,981
|
|
9,492
|
|
8,809
|
|
8,643
|
|
|||||||||
|
Change in fair value of contingent consideration
|
—
|
|
—
|
|
—
|
|
(44,276
|
)
|
(8,093
|
)
|
|||||||||
|
Depreciation and amortization
|
1,186,896
|
|
842,464
|
|
699,324
|
|
570,527
|
|
538,513
|
|
|||||||||
|
General and administrative
|
160,364
|
|
156,710
|
|
152,733
|
|
105,549
|
|
93,188
|
|
|||||||||
|
Transaction and integration expenses
|
45,327
|
|
76,048
|
|
20,491
|
|
17,400
|
|
1,303
|
|
|||||||||
|
Impairment on investments in real estate
|
—
|
|
28,992
|
|
—
|
|
—
|
|
126,470
|
|
|||||||||
|
Other
|
2,818
|
|
3,077
|
|
213
|
|
60,943
|
|
3,070
|
|
|||||||||
|
Total operating expenses
|
2,496,691
|
|
2,006,633
|
|
1,644,927
|
|
1,361,425
|
|
1,357,772
|
|
|||||||||
|
Operating income
|
549,787
|
|
451,295
|
|
497,286
|
|
401,911
|
|
258,666
|
|
|||||||||
|
Other Income (Expenses):
|
|||||||||||||||||||
|
Equity in earnings of unconsolidated joint ventures
|
32,979
|
|
25,516
|
|
17,104
|
|
15,491
|
|
13,289
|
|
|||||||||
|
Gain on sale of properties
|
80,049
|
|
40,354
|
|
169,902
|
|
94,604
|
|
15,945
|
|
|||||||||
|
Gain on contribution of investment properties to unconsolidated joint ventures
|
—
|
|
—
|
|
—
|
|
—
|
|
95,404
|
|
|||||||||
|
Gain on sale of equity investment
|
—
|
|
—
|
|
—
|
|
—
|
|
14,551
|
|
|||||||||
|
Interest and other income (expense)
|
3,481
|
|
3,655
|
|
(4,564
|
)
|
(2,381
|
)
|
2,663
|
|
|||||||||
|
Interest expense
|
(321,529
|
)
|
(258,642
|
)
|
(236,480
|
)
|
(202,800
|
)
|
(191,085
|
)
|
|||||||||
|
Tax expense
|
(2,084
|
)
|
(7,901
|
)
|
(10,385
|
)
|
(6,451
|
)
|
(5,238
|
)
|
|||||||||
|
Gain (loss) from early extinguishment of debt
|
(1,568
|
)
|
1,990
|
|
(1,011
|
)
|
(148
|
)
|
(780
|
)
|
|||||||||
|
Net income
|
341,115
|
|
256,267
|
|
431,852
|
|
300,226
|
|
203,415
|
|
|||||||||
|
Net loss (income) attributable to noncontrolling interests in consolidated joint ventures
|
311
|
|
(4,238
|
)
|
(367
|
)
|
(460
|
)
|
(465
|
)
|
|||||||||
|
Net income attributable to
Digital Realty Trust, L.P. |
341,426
|
|
252,029
|
|
431,485
|
|
299,766
|
|
202,950
|
|
|||||||||
|
Preferred units distributions
|
(81,316
|
)
|
(68,802
|
)
|
(83,771
|
)
|
(79,423
|
)
|
(67,465
|
)
|
|||||||||
|
Issuance costs associated with redeemed
preferred units |
—
|
|
(6,309
|
)
|
(10,328
|
)
|
—
|
|
—
|
|
|||||||||
|
Net income available to common unitholders
|
$
|
260,110
|
|
$
|
176,918
|
|
$
|
337,386
|
|
$
|
220,343
|
|
$
|
135,485
|
|
||||
|
Per Unit Data:
|
|||||||||||||||||||
|
Basic income per unit available to common unitholders
|
$
|
1.21
|
|
$
|
0.99
|
|
$
|
2.21
|
|
$
|
1.56
|
|
$
|
1.00
|
|
||||
|
Diluted income per unit available to common unitholders
|
$
|
1.21
|
|
$
|
0.99
|
|
$
|
2.20
|
|
$
|
1.56
|
|
$
|
0.99
|
|
||||
|
Cash distributions per common unit
|
$
|
4.04
|
|
$
|
3.72
|
|
$
|
3.52
|
|
$
|
3.40
|
|
$
|
3.32
|
|
||||
|
Weighted average common units outstanding:
|
|||||||||||||||||||
|
Basic
|
214,312,871
|
|
178,055,936
|
|
152,359,680
|
|
140,905,897
|
|
136,122,661
|
|
|||||||||
|
Diluted
|
214,950,934
|
|
178,891,648
|
|
153,085,706
|
|
141,523,712
|
|
136,390,849
|
|
|||||||||
52
|
|
December 31,
|
||||||||||||||||||
|
|
2018
|
2017
|
2016
|
2015
|
2014
|
||||||||||||||
|
Balance Sheet Data:
|
|||||||||||||||||||
|
Net investments in real estate
|
$
|
15,079,726
|
|
$
|
13,841,186
|
|
$
|
8,996,362
|
|
$
|
8,770,212
|
|
$
|
8,203,287
|
|
||||
|
Total assets
|
23,766,695
|
|
21,404,345
|
|
12,192,585
|
|
11,416,063
|
|
9,526,784
|
|
|||||||||
|
Global revolving credit facilities
|
1,647,735
|
|
550,946
|
|
199,209
|
|
960,271
|
|
525,951
|
|
|||||||||
|
Unsecured term loan
|
1,178,904
|
|
1,420,333
|
|
1,482,361
|
|
923,267
|
|
976,600
|
|
|||||||||
|
Unsecured senior notes, net of discount
|
7,589,126
|
|
6,570,757
|
|
4,153,797
|
|
3,712,569
|
|
2,791,758
|
|
|||||||||
|
Secured debt, including premiums
|
685,714
|
|
106,582
|
|
3,240
|
|
302,930
|
|
378,818
|
|
|||||||||
|
Total liabilities
|
12,892,653
|
|
10,300,993
|
|
7,060,288
|
|
6,880,926
|
|
5,612,546
|
|
|||||||||
|
Redeemable limited partner common units
|
15,832
|
|
53,902
|
|
—
|
|
—
|
|
—
|
|
|||||||||
|
General partner’s capital
|
9,974,291
|
|
10,457,513
|
|
5,231,620
|
|
4,595,357
|
|
3,923,302
|
|
|||||||||
|
Limited partners’ capital
|
911,256
|
|
702,579
|
|
34,698
|
|
33,986
|
|
32,578
|
|
|||||||||
|
Accumulated other comprehensive loss
|
(120,393
|
)
|
(112,885
|
)
|
(140,619
|
)
|
(100,964
|
)
|
(48,433
|
)
|
|||||||||
|
Noncontrolling interests in consolidated joint ventures
|
93,056
|
|
2,243
|
|
6,598
|
|
6,758
|
|
6,791
|
|
|||||||||
|
Total liabilities and capital
|
$
|
23,766,695
|
|
$
|
21,404,345
|
|
$
|
12,192,585
|
|
$
|
11,416,063
|
|
$
|
9,526,784
|
|
||||
|
|
Year Ended December 31,
|
||||||||||||||||||
|
|
2018
|
2017
|
2016
|
2015
|
2014
|
||||||||||||||
|
Cash flows from (used in):
|
|||||||||||||||||||
|
Operating activities
|
$
|
1,385,324
|
|
$
|
1,023,305
|
|
$
|
911,242
|
|
$
|
796,840
|
|
$
|
655,888
|
|
||||
|
Investing activities
|
(3,035,993
|
)
|
(1,357,153
|
)
|
(1,303,597
|
)
|
(2,527,501
|
)
|
(644,180
|
)
|
|||||||||
|
Financing activities
|
1,757,269
|
|
321,200
|
|
350,617
|
|
1,750,531
|
|
(26,974
|
)
|
|||||||||
53
ITEM 7. MANAGEMENT’S DISCUSSION AND ANALYSIS OF FINANCIAL CONDITION AND RESULTS OF OPERATIONS
The following discussion should be read in conjunction with the consolidated financial statements and notes thereto appearing elsewhere in this report. We make statements in this section that are forward-looking statements within the meaning of the federal securities laws. For a complete discussion of forward-looking statements, see the section in this report entitled “Forward-Looking Statements.” Certain risk factors may cause our actual results, performance or achievements to differ materially from those expressed or implied by the following discussion. For a discussion of such risk factors, see the sections in this report entitled “Risk Factors” and “Forward-Looking Statements.”
Occupancy percentages included in the following discussion, for some of our properties, are calculated based on factors in addition to contractually leased square feet, including available power, required support space and common area.
Overview
Our Company
. Digital Realty Trust, Inc. completed its initial public offering of common stock, or our IPO, on November 3, 2004. We believe that we have operated in a manner that has enabled us to qualify, and have elected to be treated, as a REIT under Sections 856 through 860 of the Code. Our Company was formed on March 9, 2004. During the period from our formation until we commenced operations in connection with the completion of our IPO, we did not have any corporate activity other than the issuance of shares of Digital Realty Trust, Inc. common stock in connection with the initial capitalization of the Company. Our Operating Partnership was formed on July 21, 2004.
On December 20, 2018, the Operating Partnership and Stellar Participações Ltda., a Brazilian subsidiary of the Operating Partnership (“Acquisition Sub”), completed the acquisition of Ascenty, a leading data center provider in Brazil, for cash and equity consideration of approximately $2.0 billion. We refer to this transaction as the Ascenty Acquisition.
On September 14, 2017, we completed the acquisition of DuPont Fabros Technology, Inc., in an all-stock merger, which we refer to as the DFT Merger, for equity consideration of approximately $6.2 billion. We believe this transaction expanded our reach with a complementary footprint in top U.S. metropolitan areas while enhancing our ability to meet the growing demand for hyper-scale and public cloud solutions and solidifying our blue-chip customer base. As part of the DFT Merger, we acquired 15 data centers, 14 of which are located in the United States and one is located in Canada.
Business and strategy
. Our primary business objectives are to maximize: (i) sustainable long-term growth in earnings and funds from operations per share and unit, (ii) cash flow and returns to our stockholders and our operating partnership’s unitholders through the payment of distributions and (iii) return on invested capital. We expect to accomplish our objectives by achieving superior risk-adjusted returns, prudently allocating capital, diversifying our product offerings, accelerating our global reach and scale and driving revenue growth and operating efficiencies. We plan to focus on our core business of investing in and developing and operating data centers. A significant component of our current and future internal growth is anticipated through the development of our existing space held for development, acquisition of land for future development and acquisition of new properties. We target high-quality, strategically located properties containing the physical and connectivity infrastructure that supports the applications and operations of data center and technology industry customers and properties that may be developed for such use. Most of our data center properties contain fully redundant electrical supply systems, multiple power feeds, above-standard cooling systems, raised floor areas, extensive in-building communications cabling and high-level security systems. We focus exclusively on owning, acquiring, developing and operating data centers because we believe that the growth in data center demand and the technology-related real estate industry generally will continue to outpace the overall economy.
As of
December 31, 2018
, our portfolio included
214
data centers, including
18
data centers held as investments in unconsolidated joint ventures, with approximately
34.5 million
rentable square feet including approximately
3.4 million
square feet of space under active development and approximately
2.1 million
square feet of space held for development. The
18
data centers held as investments in unconsolidated joint ventures have an aggregate of approximately
2.5 million
rentable square feet. The
26
parcels of developable land we own comprised approximately
959
acres. At
December 31, 2018
, excluding non-managed joint ventures, approximately
2.8 million
square feet was under construction for Turn-Key Flex®, colocation and Powered Base Building® products, all of which are expected to be income producing on or after completion, in
five
U.S. metropolitan areas,
four
European metropolitan areas,
one
Australian metropolitan area,
one
Canadian metropolitan area and
one
Asian metropolitan area, consisting of approximately
1.7 million
square feet of base building construction and
1.1 million
square feet of data center construction.
54
We have developed detailed, standardized procedures for evaluating new real estate investments to ensure that they meet our financial, technical and other criteria. We expect to continue to acquire additional assets as part of our growth strategy. We intend to aggressively manage and lease our assets to increase their cash flow. We may continue to build out our development portfolio when justified by anticipated demand and returns.
We may acquire properties subject to existing mortgage financing and other indebtedness or we may incur new indebtedness in connection with acquiring or refinancing these properties. Debt service on such indebtedness will have a priority over any cash dividends with respect to Digital Realty Trust, Inc.’s common stock and preferred stock. We are committed to maintaining a conservative capital structure. We target a debt-to-Adjusted EBITDA ratio at or less than 5.5x, fixed charge coverage of greater than three times, and floating rate debt at less than 20% of total outstanding debt. In addition, we strive to maintain a well-laddered debt maturity schedule, and we seek to maximize the menu of our available sources of capital, while minimizing the cost.
Revenue base
. As of
December 31, 2018
, we operated
214
data centers through our Operating Partnership, including
18
data centers held as investments in unconsolidated joint ventures, and developable land. These data centers are mainly located throughout North America, with
38
located in Europe,
16
in Latin America,
seven
in Asia and
five
properties in Australia.
The following table presents an overview of our portfolio of data centers, including the
18
data centers held as investments in unconsolidated joint ventures, and developable land, based on information as of
December 31, 2018
.
|
Metropolitan Area
|
Data Center Buildings
|
Net Rentable Square Feet
(1)
|
Space Under Active Development
(2)
|
Space Held for Development
(3)
|
|||||||||
|
North America
|
|||||||||||||
|
North
ern Virginia
|
30
|
|
5,718,180
|
|
1,425,029
|
|
84,852
|
|
|||||
|
Chica
go
|
10
|
|
2,963,850
|
|
459,250
|
|
152,362
|
|
|||||
|
New Y
ork
|
12
|
|
1,980,040
|
|
—
|
|
240,157
|
|
|||||
|
Silic
on Valley
|
19
|
|
2,251,021
|
|
—
|
|
—
|
|
|||||
|
Dalla
s
|
21
|
|
3,435,188
|
|
132,310
|
|
81,206
|
|
|||||
|
Phoen
ix
|
4
|
|
990,385
|
|
—
|
|
108,926
|
|
|||||
|
San F
rancisco
|
4
|
|
834,540
|
|
13,753
|
|
—
|
|
|||||
|
Atlan
ta
|
5
|
|
775,606
|
|
—
|
|
313,581
|
|
|||||
|
Los A
ngeles
|
4
|
|
806,934
|
|
11,545
|
|
—
|
|
|||||
|
Bosto
n
|
5
|
|
534,249
|
|
—
|
|
50,649
|
|
|||||
|
Houst
on
|
6
|
|
392,816
|
|
—
|
|
13,969
|
|
|||||
|
Toronto, Canada
(4)
|
3
|
|
326,591
|
|
60,506
|
|
511,969
|
|
|||||
|
Denve
r
|
2
|
|
371,500
|
|
—
|
|
—
|
|
|||||
|
Austi
n
|
1
|
|
85,688
|
|
—
|
|
—
|
|
|||||
|
Miami
|
2
|
|
226,314
|
|
—
|
|
—
|
|
|||||
|
Portl
and
|
1
|
|
48,574
|
|
—
|
|
—
|
|
|||||
|
Minne
apolis/St. Paul
|
1
|
|
328,765
|
|
—
|
|
—
|
|
|||||
|
Charl
otte
|
3
|
|
95,499
|
|
—
|
|
—
|
|
|||||
|
Seatt
le
|
1
|
|
40,564
|
|
—
|
|
75,382
|
|
|||||
|
North America Total / Weighted Average
|
134
|
|
22,206,304
|
|
2,102,393
|
|
1,633,053
|
|
|||||
|
Europe
|
|||||||||||||
|
London, United Kingdom
(5)
|
16
|
|
1,430,107
|
|
92,560
|
|
104,606
|
|
|||||
|
Amsterdam, Netherlands
(6)
|
9
|
|
474,303
|
|
91,859
|
|
68,185
|
|
|||||
|
Dublin, Ireland
(6)
|
5
|
|
330,180
|
|
26,646
|
|
—
|
|
|||||
55
|
Metropolitan Area
|
Data Center Buildings
|
Net Rentable Square Feet
(1)
|
Space Under Active Development
(2)
|
Space Held for Development
(3)
|
|||||||||
|
Frankfurt, Germany
(6)
|
3
|
|
83,981
|
|
157,056
|
|
—
|
|
|||||
|
Paris, France
(6)
|
3
|
|
185,994
|
|
—
|
|
—
|
|
|||||
|
Manchester, England
(5)
|
1
|
|
38,016
|
|
—
|
|
—
|
|
|||||
|
Geneva, Switzerland
(6)
|
1
|
|
59,190
|
|
—
|
|
—
|
|
|||||
|
Europe Total / Weighted Average
|
38
|
|
2,601,771
|
|
368,121
|
|
172,791
|
|
|||||
|
Asia Pacific
|
|||||||||||||
|
Singapore
(7)
|
2
|
|
540,638
|
|
—
|
|
—
|
|
|||||
|
Melbourne, Australia
(8)
|
2
|
|
146,570
|
|
—
|
|
—
|
|
|||||
|
Sydney, Australia
(8)
|
3
|
|
196,665
|
|
117,692
|
|
—
|
|
|||||
|
Osaka, Japan
(9)
|
1
|
|
—
|
|
239,999
|
|
—
|
|
|||||
|
Asia Pacific Total / Weighted Average
|
8
|
|
883,873
|
|
357,691
|
|
—
|
|
|||||
|
Ascenty Acquisition
(10)
|
16
|
|
473,251
|
|
522,643
|
|
243,160
|
|
|||||
|
Non-Data Center Properties
|
—
|
|
516,107
|
|
—
|
|
—
|
|
|||||
|
Managed Unconsolidated Joint Ventures
|
|||||||||||||
|
North
ern Virginia
|
4
|
|
546,572
|
|
—
|
|
—
|
|
|||||
|
Hong Kong
(11)
|
1
|
|
114,883
|
|
—
|
|
71,417
|
|
|||||
|
Silic
on Valley
|
4
|
|
326,305
|
|
—
|
|
—
|
|
|||||
|
Dalla
s
|
3
|
|
319,876
|
|
—
|
|
—
|
|
|||||
|
New Y
ork
|
1
|
|
108,336
|
|
—
|
|
—
|
|
|||||
|
13
|
|
1,479,594
|
|
—
|
|
7,795
|
|
||||||
|
Non-Managed Unconsolidated Joint Ventures
|
|||||||||||||
|
Seattle
|
2
|
|
451,369
|
|
—
|
|
—
|
|
|||||
|
Tokyo
(9)
|
2
|
|
430,277
|
|
—
|
|
—
|
|
|||||
|
Osaka
(9)
|
1
|
|
92,087
|
|
—
|
|
—
|
|
|||||
|
5
|
|
973,733
|
|
—
|
|
—
|
|
||||||
|
Total
|
214
|
|
29,134,633
|
|
3,350,848
|
|
2,056,799
|
|
|||||
|
(1)
|
Current net rentable square feet as of
December 31, 2018
, which represents the current square feet under lease as specified in the applicable lease agreements plus management’s estimate of space available for lease based on engineering drawings. Includes customers’ proportional share of common areas and excludes space under active development and space held for development.
|
|
(2)
|
Space under active development includes current base building and data center projects in progress.
|
|
(3)
|
Space held for development includes space held for future data center development, and excludes space under active development.
|
|
(4)
|
Rental amounts were calculated based on the exchange rate in effect on
December 31, 2018
of $0.73 to 1.00 CAD.
|
|
(5)
|
Rental amounts were calculated based on the exchange rate in effect on
December 31, 2018
of $1.27 to £1.00.
|
|
(6)
|
Rental amounts were calculated based on the exchange rate in effect on
December 31, 2018
of $1.14 to €1.00.
|
|
(7)
|
Rental amounts were calculated based on the exchange rate in effect on
December 31, 2018
of $0.73 to 1.00 SGD.
|
|
(8)
|
Rental amounts were calculated based on the exchange rate in effect on
December 31, 2018
of $0.70 to 1.00 AUD.
|
56
|
(9)
|
Rental amounts were calculated based on the exchange rate in effect on
December 31, 2018
of $0.01 to 1.00 JPY.
|
|
(10)
|
Rental amounts were calculated based on the exchange rate in effect on
December 31, 2018
of $0.26 to 1.00 BRL.
|
|
(11)
|
Rental amounts were calculated based on the exchange rate in effect on
December 31, 2018
of $0.13 to 1.00 HKD.
|
As of
December 31, 2018
, our portfolio, including the
18
data centers held as investments in unconsolidated joint ventures, were approximately
89.0%
leased excluding approximately
3.4 million
square feet of space under active development and approximately
2.1 million
square feet of space held for development. Due to the capital-intensive and long-term nature of the operations being supported, our lease terms are generally longer than standard commercial leases. As of
December 31, 2018
, our average remaining lease term is approximately
five years
. Our scheduled lease expirations through December 31, 2020 are
22.1%
of rentable square feet excluding month-to-month leases, space under active development and space held for development as of
December 31, 2018
.
Factors Which May Influence Future Results of Operations
Global market and economic conditions.
General economic conditions and the cost and availability of capital may be adversely affected in some or all of the metropolitan areas in which we own properties and conduct our operations. In June 2016, a majority of voters in the United Kingdom elected to withdraw from the European Union in a national referendum. The terms of any withdrawal are subject to ongoing negotiations. Nevertheless, the referendum has created significant uncertainty about the future relationship between the United Kingdom and the European Union, and has given rise to calls for the governments of other European Union member states to consider withdrawal. Instability in the U.S., European, Asia Pacific and other international financial markets and economies may adversely affect our ability, and the ability of our customers, to replace or renew maturing liabilities on a timely basis, access the capital markets to meet liquidity and capital expenditure requirements and may result in adverse effects on our, and our customers’, financial condition and results of operations.
In addition, our access to funds under our global revolving credit facility depends on the ability of the lenders that are parties to such facilities to meet their funding commitments to us. We cannot assure you that long-term disruptions in the global economy and the return of tighter credit conditions among, and potential failures or nationalizations of, third party financial institutions as a result of such disruptions will not have an adverse effect on our lenders. If our lenders are not able to meet their funding commitments to us, our business, results of operations, cash flows and financial condition could be adversely affected.
If we do not have sufficient cash flow to continue operating our business and are unable to borrow additional funds, access our existing lines of credit or raise equity or debt capital, we may need to source alternative ways to increase our liquidity. Such alternatives may include, without limitation, curtailing development activity, disposing of one or more of our properties possibly on disadvantageous terms or entering into or renewing leases on less favorable terms than we otherwise would.
Foreign currency exchange risk.
For the years ended
December 31, 2018
and
2017
, we had foreign operations in the United Kingdom, Ireland, France, the Netherlands, Germany, Switzerland, Canada, Singapore, Australia, Japan and Hong Kong as well as Brazil in the year ended
December 31, 2018
, and, as such, are subject to risk from the effects of exchange rate movements of foreign currencies, which may affect future costs and cash flows. Our foreign operations are conducted in the British pound sterling, Euro, Canadian dollar, Singapore dollar, Australian dollar, Brazilian real, Japanese Yen and the Hong Kong dollar. Our primary currency exposures are to the British pound sterling, the Euro and the Singapore dollar. The possible exit of the United Kingdom (or any other country) from the European Union, or prolonged periods of uncertainty relating to any of these possibilities, could result in increased foreign currency exchange volatility. We attempt to mitigate a portion of the risk of currency fluctuation by financing our investments in the local currency denominations, although there can be no assurance that this will be effective. As a result, changes in the relation of any such foreign currency to U.S. dollars may affect our revenues, operating margins and distributions and may also affect the book value of our assets, the book value of our debt and the amount of stockholders’ equity.
Rental income
. The amount of rental income generated by the data centers in our portfolio depends on several factors, including our ability to maintain or improve the occupancy rates of currently leased space and to lease currently available space and space available from lease terminations. Excluding approximately
3.4 million
square feet of space under active development and approximately
2.1 million
square feet of space held for development as of
December 31, 2018
, the occupancy rate of our portfolio, including the
18
data centers held as investments in unconsolidated joint ventures, was approximately
89.0%
of our net rentable square feet.
As of
December 31, 2018
, we had over
2,300
tenants in our data center portfolio, including the
13
data centers held in our managed portfolio of unconsolidated joint ventures. As of
December 31, 2018
, approximately 88% of our leases (on a rentable square footage basis) contained base rent escalations that were either fixed (generally ranging from 2% to 4%) or indexed based
57
on a consumer price index or other similar inflation related index. We cannot assure you that these escalations will cover any increases in our costs or will otherwise keep rental rates at or above market rates.
The amount of rental income we generate also depends on maintaining or increasing rental rates at our properties, which in turn depends on several factors, including supply and demand and market rates for data center space. Included in our approximately
26.7 million
net rentable square feet, excluding space under active development and space held for development and
18
data centers held as investments in unconsolidated joint ventures, at
December 31, 2018
is approximately
1.1 million
square feet of data center space with extensive installed tenant improvements available for lease. Our Turn-Key Flex
®
product is an effective solution for customers who prefer to utilize a partner with the expertise or capital budget to provide extensive data center infrastructure and security. Our expertise in data center construction and operations enables us to lease space to these customers at a premium over other uses. In addition, as of
December 31, 2018
, we had approximately
3.4 million
square feet of space under active development and approximately
2.1 million
square feet of space held for development, or approximately
14%
of the total rentable space in our portfolio, including the
18
data centers held as investments in unconsolidated joint ventures. Our ability to grow earnings depends in part on our ability to develop space and lease development space at favorable rates, which we may not be able to obtain. Development space requires significant capital investment in order to develop data center facilities that are ready for use and, in addition, we may require additional time or encounter delays in securing tenants for development space. We may purchase additional vacant properties and properties with vacant development space in the future. We will require additional capital to finance our development activities, which may not be available or may not be available on terms acceptable to us, including as a result of the conditions described above under “Global market and economic conditions.”
In addition, the timing between when we sign a new lease with a customer and when that lease commences and we begin to generate rental income may be significant and may not be easily predictable. Certain leases may provide for staggered commencement dates for additional space, the timing of which may be delayed significantly.
Economic downturns, including as a result of the conditions described above under “Global market and economic conditions,” or regional downturns affecting our metropolitan areas or downturns in the data center industry that impair our ability to lease or renew or re-lease space, or otherwise reduce returns on our investments or the ability of our customers to fulfill their lease commitments, as in the case of tenant bankruptcies, could adversely affect our ability to maintain or increase rental rates at our properties.
Scheduled lease expirations.
Our ability to re-lease expiring space at rental rates equal to or in excess of current rental rates will impact our results of operations. In addition to approximately
3.1 million
square feet of available space in our portfolio, which excludes approximately
3.4 million
square feet of space under active development and approximately
2.1 million
square feet of space held for development as of
December 31, 2018
and the five data centers held as investments in our non-managed unconsolidated joint ventures, leases representing approximately
13.0%
and
9.1%
of the net rentable square footage of our portfolio are scheduled to expire during the years ending
December 31, 2019
and
2020
, respectively.
58
During the year ended
December 31, 2018
, we signed new leases totaling approximately
1.9 million
square feet of space and renewal leases totaling approximately
2.0 million
square feet of space. The following table summarizes our leasing activity in the year ended
December 31, 2018
:
|
Rentable Square Feet (1)
|
Expiring
Rates (2) |
New
Rates (2) |
Rental Rate
Changes |
TI’s/Lease
Commissions Per Square Foot |
Weighted
Average Lease Terms (years) |
|||||||||||||||
|
Leasing Activity
(3)(4)
|
||||||||||||||||||||
|
Renewals Signed
|
||||||||||||||||||||
|
Turn-Key Flex ®
|
907,572
|
|
$
|
159.17
|
|
$
|
170.69
|
|
7.2
|
%
|
$
|
4.73
|
|
5.7
|
|
|||||
|
Powered Base Building ®
|
266,824
|
|
$
|
42.06
|
|
$
|
52.68
|
|
25.2
|
%
|
$
|
6.73
|
|
4.8
|
|
|||||
|
Colocation
|
614,808
|
|
$
|
255.95
|
|
$
|
256.82
|
|
0.3
|
%
|
$
|
0.06
|
|
1.8
|
|
|||||
|
Non-technical
|
250,503
|
|
$
|
14.48
|
|
$
|
16.68
|
|
15.2
|
%
|
$
|
2.77
|
|
6.0
|
|
|||||
|
New Leases Signed
(5)
|
||||||||||||||||||||
|
Turn-Key Flex ®
|
1,402,579
|
|
—
|
|
$
|
137.55
|
|
—
|
|
$
|
28.49
|
|
8.3
|
|
||||||
|
Powered Base Building ®
|
290,989
|
|
—
|
|
$
|
32.66
|
|
—
|
|
$
|
13.82
|
|
11.6
|
|
||||||
|
Colocation
|
143,483
|
|
—
|
|
$
|
237.82
|
|
—
|
|
$
|
24.55
|
|
2.3
|
|
||||||
|
Non-technical
|
110,780
|
|
—
|
|
$
|
20.39
|
|
—
|
|
$
|
14.14
|
|
9.6
|
|
||||||
|
Leasing Activity Summary
|
||||||||||||||||||||
|
Turn-Key Flex ®
|
2,310,151
|
|
—
|
|
$
|
150.57
|
|
—
|
|
—
|
|
|||||||||
|
Powered Base Building ®
|
557,813
|
|
—
|
|
$
|
42.24
|
|
—
|
|
—
|
|
|||||||||
|
Colocation
|
758,291
|
|
—
|
|
$
|
253.22
|
|
—
|
|
—
|
|
|||||||||
|
Non-technical
|
361,283
|
|
—
|
|
$
|
17.82
|
|
—
|
|
—
|
|
|||||||||
|
Total Renewals
|
2,039,707
|
|
||||||||||||||||||
|
Total New
|
1,947,831
|
|
||||||||||||||||||
|
(1)
|
For some of our properties, we calculate square footage based on factors in addition to contractually leased square feet, including power, required support space and common area.
|
|
(2)
|
Rental rates represent annual estimated cash rent per rentable square foot adjusted for straight-line rents in accordance with GAAP. GAAP rental rates are inclusive of tenant concessions, if any.
|
|
(3)
|
Excludes short-term leases.
|
|
(4)
|
Commencement dates for the leases signed range from 2018 to 2019.
|
|
(5)
|
Includes leases signed for new and re-leased space.
|
Our ability to re-lease or renew expiring space at rental rates equal to or in excess of current rental rates will impact our results of operations. We continue to see strong demand in most of our key metropolitan areas for data center space and, subject to the supply of available data center space in these metropolitan areas, expect the rental rates we are likely to achieve on re-leased or renewed data center space leases for 2018 expirations on an average aggregate basis will generally be higher than the rates currently being paid for the same space on a GAAP basis and down high single digits on a cash basis. For the year ended
December 31, 2018
, rents on renewed space increased by an average of
7.2%
on a GAAP basis on our Turn-Key Flex® space compared to the expiring rents and increased by an average of
25.2%
on a GAAP basis on our Powered Base Building® space compared to the expiring rents. Our past performance may not be indicative of future results, and we cannot assure you that leases will be renewed or that our data centers will be re-leased at all or at rental rates equal to or above the current average rental rates. Further, re-leased/renewed rental rates in a particular metropolitan area may not be consistent with rental rates across our portfolio as a whole and may fluctuate from one period to another due to a number of factors, including local real estate conditions, local supply and demand for data center space, competition from other data center developers or operators, the condition of the property and whether the property, or space within the property, has been developed.
59
Geographic concentration.
We depend on the market for data centers in specific geographic regions and significant changes in these regional metropolitan areas can impact our future results. As of
December 31, 2018
, our portfolio, including the 18 data centers held as investments in unconsolidated joint ventures, was geographically concentrated in the following metropolitan areas:
|
Metropolitan Area
|
Percentage of December 31, 2018 total annualized rent (1)
|
|
|
Northern Virginia
|
23.2
|
%
|
|
Chicago
|
11.8
|
%
|
|
Silicon Valley
|
9.0
|
%
|
|
New York
|
8.4
|
%
|
|
London, United Kingdom
|
8.4
|
%
|
|
Dallas
|
7.7
|
%
|
|
Singapore
|
3.6
|
%
|
|
Phoenix
|
3.6
|
%
|
|
San Francisco
|
2.6
|
%
|
|
Sao Paulo, Brazil
|
2.6
|
%
|
|
Seattle
|
2.3
|
%
|
|
Atlanta
|
2.1
|
%
|
|
Amsterdam, Netherlands
|
1.9
|
%
|
|
Other
|
12.8
|
%
|
|
Total
|
100.0
|
%
|
|
(1)
|
Annualized rent is monthly contractual rent (defined as cash base rent before abatements) under existing leases as of
December 31, 2018
multiplied by 12. The aggregate amount of abatements for the year ended
December 31, 2018
was approximately $47.4 million.
|
Operating expenses.
Our operating expenses generally consist of utilities, property and ad valorem taxes, property management fees, insurance and site maintenance costs, as well as rental expenses on our ground and building leases. In particular, our buildings require significant power to support the data center operations contained in them. Many of our leases contain provisions under which the tenants reimburse us for all or a portion of property operating expenses and real estate taxes incurred by us. However, in some cases we are not entitled to reimbursement of property operating expenses, other than utility expense, and real estate taxes under our leases for Turn-Key Flex® facilities. We also incur general and administrative expenses, including expenses relating to our asset management function, as well as significant legal, accounting and other expenses related to corporate governance, Securities Exchange Commission, or the SEC, reporting and compliance with the various provisions of the Sarbanes-Oxley Act. Increases or decreases in such operating expenses will impact our overall performance. We expect to incur additional operating expenses as we continue to expand.
Climate change legislation.
In June 2009, the U.S. House of Representatives approved comprehensive clean energy and climate change legislation intended to cut greenhouse gas, or GHG, emissions, via a cap-and-trade program. The U.S. Senate did not subsequently pass similar legislation. Significant opposition to federal climate change legislation exists.
In the absence of comprehensive federal climate change legislation, over the past several years, regulatory agencies, primarily the U.S. Environmental Protection Agency, or EPA, and states took the lead in regulating GHG emissions in the U.S. Under the Obama administration, the EPA moved aggressively to regulate GHG emissions from automobiles and large stationary sources, including electricity producers, using its own authority under the Clean Air Act. The Trump administration has moved to eliminate or modify certain of the EPA’s GHG emissions regulations and refocus the EPA’s mission away from such regulation.
The EPA made an endangerment finding in 2009 that allows it to create regulations imposing emissions reporting, permitting, control technology installation, and monitoring requirements applicable to certain emitters of GHGs, including facilities that provide electricity to our data centers, although the materiality of the impacts will not be fully known until all regulations are finalized and legal challenges are resolved. Under the Obama administration, the EPA finalized rules imposing
60
permitting and control technology requirements upon certain newly-constructed or modified facilities which emit GHGs under the Clean Air Act New Source Review Prevention of Significant Deterioration, or NSR PSD, and Title V permitting programs. As a result, newly-issued NSR PSD and Title V permits for new or modified electricity generating units (EGUs) and other facilities may need to address GHG emissions, including by requiring the installation of “Best Available Control Technology.” The EPA implemented in December 2015 the “Clean Power Plan” regulating carbon dioxide (CO2) emissions from new and existing coal-fired and natural gas EGUs. Existing EGUs are subject to statewide CO2 emissions reduction targets, an effort designed to achieve a thirty-two percent reduction in nationwide existing EGU CO2 emissions by 2030 (in comparison to 2005 levels). The Clean Power Plan would subject new, modified, and reconstructed EGUs to “New Source Performance Standards” that include both technological requirements and numeric emission limits. However, twenty-four states and a number of industry groups challenged the Clean Power Plan in federal court, and in February 2016 the U.S. Supreme Court issued a stay of the Clean Power Plan until the legal challenges have been decided. In March 2017, President Trump ordered the EPA to review and if appropriate revise or rescind the Clean Power Plan, and the EPA proposed to repeal the Clean Power Plan in October 2017. In August 2018, the EPA proposed the “Affordable Clean Energy Rule” to replace the Clean Power Plan. Separately, the EPA’s GHG “reporting rule” requires that certain emitters, including electricity generators, monitor and report GHG emissions. The Trump administration may seek to revise or reverse these regulations.
As a result, states may drive near-term regulation to reduce GHG emissions in the United States. At the state level, California implemented a GHG cap-and-trade program that began imposing compliance obligations on industrial sectors, including electricity generators and importers, in January 2013. In September 2016, California adopted legislation calling for a further reduction in GHG emissions to 40% below 1990 levels by 2030, and in July 2017, California extended its cap-and-trade program through 2030. In September 2018, California adopted legislation that will require all of the state’s electricity to come from carbon-free sources by 2045. As another example of state action, in January 2018, New Jersey announced that it would re-join nine other eastern states in the Regional Greenhouse Gas Initiative (RGGI), a market-based program aimed at reducing GHG emissions from power plants. Several other states have announced that they are actively pursuing new GHG reduction programs.
Outside the United States, the European Union, or EU (including the United Kingdom), has been operating since 2005 under a cap-and-trade program, which directly affects the largest emitters of GHGs, including electricity producers from whom we purchase power, and the EU has taken a number of other climate change-related initiatives, including a directive targeted at improving energy efficiency (which introduces energy efficiency auditing requirements). The Paris Agreement, which was adopted by the United States and 194 other countries and looks to prevent global average temperatures from increasing by more than 2 degrees Celsius above preindustrial levels officially went into force on November 4, 2016. President Trump announced in June 2017 that he will initiate the process to withdraw the United States from the Paris Agreement; however, a number of states have formed groups supporting the Paris Agreement and pledging to fulfill its goals at the state level. National legislation may also be implemented independently by members of the EU. For example, in the United Kingdom, the implementation of the CRC Energy Efficiency Scheme introduced a mandatory reporting and pricing scheme that is designed to incentivize energy efficiency and cut emissions by large energy users. It is not yet clear how Brexit will impact the United Kingdom’s (or the EU’s) approach to climate change regulation. In Canada, GHG cap and trade programs are in operation in Quebec and Nova Scotia. Climate change regulations are in various stages of implementation in other nations as well, including nations where we operate, such as Japan, Singapore, and Australia.
The cost of electric power comprises a significant component of our operating expenses. Any additional taxation or regulation of energy use, including as a result of (i) new legislation that Congress may pass, (ii) the regulations that the EPA has proposed or finalized, (iii) regulations under legislation that states have passed or may pass, or (iv) any further legislation or regulations in the EU or other regions where we operate could significantly increase our costs, and we may not be able to effectively pass all of these costs on to our customers. These matters could adversely impact our business, results of operations, or financial condition.
Interest rates
. As of
December 31, 2018
, we had approximately
$0.8 billion
of variable rate debt subject to interest rate swap agreements, along with
$1.4 billion
,
$435.9 million
and
$143.3 million
of variable rate debt that was outstanding on the unswapped portions of the global revolving credit facilities and the unsecured term loans, along with floating rate notes due 2019, or the 2019 Notes, respectively. The availability of debt and equity capital may decrease or be on unfavorable terms as a result of the circumstances described above under “Global market and economic conditions” or other factors. The effects on commercial real estate mortgages, if available, include, but may not be limited to: higher loan spreads, tightened loan covenants, reduced loan-to-value ratios resulting in lower borrower proceeds and higher principal payments. Potential future increases in interest rates and credit spreads may increase our interest expense and fixed charges and negatively affect our financial condition and results of operations, potentially impacting our future access to the debt and equity capital markets. Increased interest rates may also increase the risk that the counterparties to our swap agreements will default on their obligations, which could further increase our interest expense. If we cannot obtain capital from third party sources, we may not
61
be able to acquire or develop properties when strategic opportunities exist, satisfy our debt service obligations or pay the cash dividends to Digital Realty Trust, Inc.’s stockholders necessary to maintain its qualification as a REIT.
Demand for data center space
. Our portfolio consists primarily of data centers. A decrease in the demand for, or increase in supply of, data center space, Internet gateway facilities or other technology-related real estate would have a greater adverse effect on our business and financial condition than if we owned a portfolio with a more diversified customer base or less specialized use. We have invested in building out additional inventory primarily in what we anticipate will be our active major metropolitan areas prior to having executed leases with respect to this space. We believe that demand in key metropolitan areas such as Northern Virginia, Dallas, Singapore and London is largely in line with supply. We also continue to see strong demand in other key metropolitan areas across our portfolio. However, until this inventory is leased up, which will depend on a number of factors, including available data center space in these metropolitan areas, our return on invested capital is negatively impacted. Our development activities make us particularly susceptible to general economic slowdowns, including recessions and the other circumstances described above under “Global market and economic conditions,” as well as adverse developments in the corporate data center, Internet and data communications and broader technology industries. Any such slowdown or adverse development could lead to reduced corporate IT spending or reduced demand for data center space. Reduced demand could also result from business relocations, including to metropolitan areas that we do not currently serve. Changes in industry practice or in technology, such as virtualization technology, more efficient computing or networking devices, or devices that require higher power densities than today’s devices, could also reduce demand for the physical data center space we provide or make the tenant improvements in our facilities obsolete or in need of significant upgrades to remain viable. In addition, the development of new technologies, the adoption of new industry standards or other factors could render many of our customers’ current products and services obsolete or unmarketable and contribute to a downturn in their businesses, thereby increasing the likelihood that they default under their leases, become insolvent or file for bankruptcy. In addition, demand for data center space, or the rates at which we lease space, may be adversely impacted either across our portfolio or in specific metropolitan areas as a result of an increase in the number of competitors, or the amount of space being offered in our metropolitan areas and other metropolitan areas by our competitors.
Critical Accounting Policies
Our discussion and analysis of our financial condition and results of operations are based upon our consolidated financial statements, which have been prepared in accordance with U.S. generally accepted accounting principles, or GAAP. The preparation of these financial statements in conformity with GAAP requires us to make estimates and assumptions that affect the reported amounts of assets and liabilities at the date of the financial statements and the reported amount of revenues and expenses in the reporting period. Our actual results may differ from these estimates. We have provided a summary of our significant accounting policies in Item 8, Note 2 “Summary of Significant Accounting Policies” in the Notes to Consolidated Financial Statements. We describe below those accounting policies that require material subjective or complex judgments and that have the most significant impact on our financial condition and consolidated results of operations. Our management evaluates these estimates on an ongoing basis, based upon information currently available and on various assumptions management believes are reasonable as of the date on the front cover of this report.
Investments in Real Estate
Acquisition of real estate.
The price that we pay to acquire a property is impacted by many factors including the condition of the property and improvements, the occupancy of the building, the term and rate of in-place leases, the creditworthiness of the customers, favorable or unfavorable financing, above- or below-market ground leases and numerous other factors.
Accordingly, we are required to make subjective assessments to allocate the purchase price paid to acquire investments in real estate among the identifiable assets including intangibles and liabilities assumed based on our estimate of the fair value of such assets and liabilities. This includes determining the value of the property and improvements, land, ground leases, if any, and tenant improvements. Additionally, we evaluate the value of in-place leases on occupancy and market rent, the value of the tenant relationships, the value (or negative value) of above (or below) market leases, any debt or deferred taxes assumed from the seller or loans made by the seller to us and any building leases assumed from the seller. Each of these estimates requires a great deal of judgment and some of the estimates involve complex calculations. These allocation assessments have a direct impact on our results of operations. For example, if we were to allocate more value to land, there would be no depreciation with respect to such amount. If we were to allocate more value to the property as opposed to allocating to the value of in-place tenant leases, this amount would be recognized as an expense over a much longer period of time. This potential effect occurs because the amounts allocated to property are depreciated over the estimated lives of the property whereas amounts allocated to in-place tenant leases are amortized over the estimated term (including renewal and extension assumptions) of the leases. Additionally, the amortization of the value (or negative value) assigned to above (or below) market rate leases is recorded as an adjustment to
62
rental revenue as compared to amortization of the value of in-place tenant leases and tenant relationships, which is included in depreciation and amortization in our consolidated income statements.
From time to time, we will receive offers from third parties to purchase our properties, either solicited or unsolicited. For those offers that we accept, the prospective buyers will usually require a due diligence period before consummation of the transactions. It is not unusual for matters to arise that result in the withdrawal or rejection of the offer during this process. We classify real estate as “held for sale” when all criteria under the GAAP guidance have been met.
Asset impairment evaluation.
We review each of our properties for indicators that its carrying amount may not be recoverable. Examples of such indicators may include a significant decrease in the market price of the property, a change in the expected holding period for the property, a significant adverse change in how the property is being used or expected to be used based on the underwriting at the time of acquisition, an accumulation of costs significantly in excess of the amount originally expected for the acquisition or development of the property, or a history of operating or cash flow losses of the property. When such impairment indicators exist, we review an estimate of the future undiscounted net cash flows (excluding interest charges) expected to result from the real estate investment’s use and eventual disposition and compare that estimate to the carrying value of the property. We consider factors such as future operating income, trends and prospects, as well as the effects of leasing demand, competition and other factors. If our future undiscounted net cash flow evaluation indicates that we are unable to recover the carrying value of a real estate investment, an impairment loss is recorded to the extent that the carrying value exceeds the estimated fair value of the property. These losses have a direct impact on our net income because recording an impairment loss results in an immediate negative adjustment to net income. The evaluation of anticipated cash flows is highly subjective and is based in part on assumptions regarding future occupancy, rental rates and capital requirements that could differ materially from actual results in future periods. Since cash flows on properties considered to be long-lived assets to be held and used are considered on an undiscounted basis to determine whether the carrying value of a property is recoverable, our strategy of holding properties over the long-term directly decreases the likelihood of their carrying values not being recoverable and therefore requiring the recording of an impairment loss. If our strategy changes or market conditions otherwise dictate an earlier sale date, an impairment loss may be recognized and such loss could be material. If we determine that the asset fails the recoverability test, the affected assets must be reduced to their fair value.
We generally estimate the fair value of rental properties utilizing a discounted cash flow analysis that includes projections of future revenues, expenses and capital improvement costs that a market participant would use based on the highest and best use of the asset, which is similar to the income approach that is commonly utilized by appraisers. In certain cases, we may supplement this analysis by obtaining outside broker opinions of value.
Goodwill impairment evaluation.
We perform an annual impairment test for goodwill and between annual tests, we evaluate goodwill for impairment whenever events or changes in circumstances occur that would more likely than not reduce the fair value of a reporting unit below its carrying value. In our impairment tests of goodwill, we first assess qualitative factors to determine whether it is more likely than not that the fair value of a reporting unit is less than its carrying value. If based on this assessment, we determine that the fair value of the reporting unit is not less than its carrying value, then performing the additional two-step impairment test is unnecessary. If our qualitative assessment indicates that goodwill impairment is more likely than not, we perform a two-step impairment test. We test goodwill for impairment under the two-step impairment test by first comparing the book value of net assets including goodwill to the fair value of the reporting unit. If the fair value is determined to be less than the book value of the net assets, including goodwill, a second step is performed to compute the amount of impairment as the difference between the implied fair value of goodwill and its carrying value. We estimate the fair value of the reporting units using discounted cash flows. If the carrying value of goodwill exceeds its implied fair value, an impairment charge is recognized.
Revenue Recognition
The majority of our revenue is derived from lease arrangements, which we account for in accordance with “Leases (Topic 840)”. We account for the non-lease components within our lease arrangements, as well as other sources of revenue, in accordance with “Revenue from Contracts with Customers (Topic 606)”. Revenue recognized as a result of applying Topic 840 was 97% and Topic 606 was 3% of total operating revenue for the year ended
December 31, 2018
.
Our leases are classified as operating leases and minimum rents are recognized on a straight-line basis over the terms of the leases, which may span multiple years. The excess of rents recognized over amounts contractually due pursuant to the underlying leases is included in deferred rent in the accompanying consolidated balance sheets and contractually due but unpaid rents are included in accounts and other receivables.
63
Tenant reimbursements for real estate taxes, common area maintenance, and other recoverable costs under our leases are recognized in the period that the expenses are incurred. Lease termination fees are recognized over the remaining term of the lease, effective as of the date the lease modification is finalized, assuming collection is not considered doubtful. As discussed above, we recognize amortization of the value of acquired above or below-market tenant leases as a reduction of rental revenue in the case of above-market leases or an increase to rental revenue in the case of below-market leases.
We must make subjective estimates as to when our revenue is earned and the collectability of our accounts receivable related to minimum rent, deferred rent, expense reimbursements, lease termination fees and other income. We specifically analyze accounts receivable and historical bad debts, customer concentrations, customer creditworthiness and current economic trends when evaluating the adequacy of the allowance for bad debts. These estimates have a direct impact on our net revenue because a higher bad debt allowance would result in lower net revenue, and recognizing rental revenue as earned in one period versus another would result in higher or lower net revenue for a particular period.
Recently Issued Accounting Pronouncements
Please refer to Item 8, Note 2(aa), “Recent Accounting Pronouncements” in the Notes to the Consolidated Financial Statements.
64
Results of Operations
The discussion below relates to our financial condition and results of operations for the years ended
December 31, 2018
,
2017
and
2016
. A summary of our operating results from continuing operations for the years ended
December 31, 2018
,
2017
and
2016
was as follows (in thousands).
|
|
Year Ended December 31,
|
||||||||||
|
|
2018
|
2017
|
2016
|
||||||||
|
Income Statement Data:
|
|||||||||||
|
Total operating revenues
|
$
|
3,046,478
|
|
$
|
2,457,928
|
|
$
|
2,142,213
|
|
||
|
Total operating expenses
|
(2,496,691
|
)
|
(2,006,633
|
)
|
(1,644,927
|
)
|
|||||
|
Operating income
|
549,787
|
|
451,295
|
|
497,286
|
|
|||||
|
Other expenses, net
|
(208,672
|
)
|
(195,027
|
)
|
(65,434
|
)
|
|||||
|
Net income
|
$
|
341,115
|
|
$
|
256,268
|
|
$
|
431,852
|
|
||
Our portfolio of properties has experienced consistent and significant growth since the first property acquisition in January 2002. As a result of this growth, our period-to-period comparison of our financial performance focuses on the impact on our revenues and expenses on a stabilized portfolio basis. Our stabilized portfolio includes properties owned as of
December 31, 2016
with less than
5%
of total rentable square feet under development and excludes properties that were undergoing, or were expected to undergo, development activities in
2017
-
2018
and properties sold or contributed to joint ventures. Our pre-stabilized pool includes the results of the operating properties acquired below, newly delivered properties that were previously under development and properties acquired as part of the DFT Merger in September 2017.
On December 20, 2018, our Brazilian subsidiary, Stellar Participações Ltda , completed the acquisition of Ascenty, a leading data center provider in Brazil. As part of the acquisition, we acquired 16 data centers, all located in Brazil. Due to the timing of the transaction, the acquisition of Ascenty did not have a substantial impact on our operating income in 2018.
In September 2017, as part of the DFT Merger, we acquired 15 data centers, 14 of which are located in the United States and one is located in Canada. In addition, we acquired the following real estate properties during the year ended
December 31, 2018
:
|
Property Type
|
Amount
(in millions) (2) |
|||
|
Land Parcels
(1)
|
$
|
296.1
|
|
|
|
Data Centers
|
114.6
|
|
||
|
$
|
410.7
|
|
||
|
(1)
|
Represents currently vacant land which is not included in our operating property count.
|
|
(2)
|
Purchase price in U.S. dollars and excludes capitalized closing costs.
|
2018 Dispositions
|
Location
|
Metro
Area
|
Date Sold
|
Gross Proceeds (in millions)
|
Gain (loss) on sale (in millions)
|
||||||||
|
200 Quannapowitt Parkway
|
Boston
|
Jan 25, 2018
|
$
|
15.0
|
|
$
|
(0.4
|
)
|
||||
|
34551 Ardenwood Boulevard
|
Silicon Valley
|
Feb 9, 2018
|
73.3
|
|
25.3
|
|
||||||
|
3065 Gold Camp Drive
|
Sacramento
|
Mar 14, 2018
|
14.2
|
|
5.4
|
|
||||||
|
11085 Sun Center Drive
|
Sacramento
|
Mar 14, 2018
|
36.8
|
|
9.1
|
|
||||||
|
Austin Portfolio
|
Austin
|
Apr 19, 2018
|
47.6
|
|
12.0
|
|
||||||
|
2010 East Centennial Circle
|
Phoenix
|
May 22, 2018
|
5.5
|
|
(0.5
|
)
|
||||||
|
1125 Energy Park Drive
|
Minneapolis
|
May 31, 2018
|
7.0
|
|
2.8
|
|
||||||
|
360 Spear Street
|
San Francisco
|
Sep 21, 2018
|
92.3
|
|
26.7
|
|
||||||
|
$
|
291.7
|
|
$
|
80.4
|
|
|||||||
65
None of the Company's property sales to date represented a significant component or significant shift in strategy that would require discontinued operations presentation.
Comparison of the Year Ended
December 31, 2018
to the Year Ended
December 31, 2017
and Comparison of the Year Ended
December 31, 2017
to the Year Ended
December 31, 2016
Portfolio
As of
December 31, 2018
, our portfolio consisted of
214
data centers, including
18
data centers held as investments in unconsolidated joint ventures, with an aggregate of approximately
34.5 million
rentable square feet, including
3.4 million
square feet of space under active development and
2.1 million
square feet of space held for development, compared to a portfolio consisting of 205 data centers, including seven held-for-sale data centers and 18 data centers held as investments in unconsolidated joint ventures, with an aggregate of approximately
32.1 million
rentable square feet, including
2.7 million
square feet of space under active development and
1.7 million
square feet of space held for development as of
December 31, 2017
, and compared to a portfolio consisting of 187 data centers, including three held-for-sale data centers and 15 data centers held as investments in unconsolidated joint ventures, with an aggregate of
26.1 million
rentable square feet, including
2.0 million
square feet of space under active development and
1.1 million
square feet of space held for development as of
December 31, 2016
.
Revenues
Total operating revenues for the years ended
December 31, 2018
,
2017
and
2016
were as follows (in thousands):
|
|
Year Ended December 31,
|
Change
|
Percentage Change
|
||||||||||||||||||||||
|
|
2018
|
2017
|
2016
|
2018 vs 2017
|
2017 vs 2016
|
2018 vs 2017
|
2017 vs 2016
|
||||||||||||||||||
|
Rental and other services
|
$
|
2,412,076
|
|
$
|
2,010,301
|
|
$
|
1,746,828
|
|
$
|
401,775
|
|
$
|
263,473
|
|
20.0
|
%
|
15.1
|
%
|
||||||
|
Tenant reimbursements
|
624,637
|
|
440,224
|
|
355,903
|
|
184,413
|
|
84,321
|
|
41.9
|
%
|
23.7
|
%
|
|||||||||||
|
Fee income and other
|
9,765
|
|
7,403
|
|
39,482
|
|
2,362
|
|
(32,079
|
)
|
31.9
|
%
|
(81.2
|
)%
|
|||||||||||
|
Total operating revenues
|
$
|
3,046,478
|
|
$
|
2,457,928
|
|
$
|
2,142,213
|
|
$
|
588,550
|
|
$
|
347,481
|
|
23.9
|
%
|
14.7
|
%
|
||||||
The following tables show revenues for the years ended
December 31, 2018
,
2017
and
2016
for stabilized properties and pre-stabilized properties and other (all other properties) (in thousands). Revenue totals for pre-stabilized and other include results from properties that have not yet met the definition of stabilized and properties that are classified as held for sale or were sold during the period.
|
|
Stabilized
Year Ended December 31, |
Pre-Stabilized and Other
Year Ended December 31, |
||||||||||||||||||||||||
|
|
2018
|
2017
|
Change
|
% Change
|
2018
|
2017
|
Change
|
|||||||||||||||||||
|
Rental and other services
|
$
|
1,397,953
|
|
$
|
1,388,427
|
|
$
|
9,526
|
|
0.7
|
%
|
$
|
1,014,123
|
|
$
|
621,874
|
|
$
|
392,249
|
|
||||||
|
Tenant reimbursements
|
254,725
|
|
254,876
|
|
(151
|
)
|
(0.1
|
)%
|
369,912
|
|
185,348
|
|
184,564
|
|
||||||||||||
|
Total operating revenues
|
$
|
1,652,678
|
|
$
|
1,643,303
|
|
$
|
9,375
|
|
0.6
|
%
|
$
|
1,384,035
|
|
$
|
807,222
|
|
$
|
576,813
|
|
||||||
Stabilized rental and other services revenue increased $9.5 million, or
0.7%
, for the year ended
December 31, 2018
compared to the same period in
2017
primarily as a result of an increase in revenues from colocation services and new leasing at our properties during the year ended
December 31, 2018
, the largest of which was for space at 350 E. Cermak Road, 2121 South Price Road and 29A International Business Park, partially offset by expiring leases at certain properties in the stabilized portfolio. Stabilized tenant reimbursement revenue decreased $0.2 million, or
0.1%
, for the year ended
December 31, 2018
compared to the same period in
2017
primarily as a result of reimbursement credits and property tax refunds to tenants at properties in the stabilized portfolio offset by higher utility reimbursements driven by increased power consumption and new leasing.
Pre-stabilized and other revenue increases during the year ended
December 31, 2018
compared to the same period in
2017
were primarily a result of the properties acquired in the DFT Merger, which contributed approximately $311.4 million and $164.0 million to the rental and other services revenue and tenant reimbursement increases, respectively. In addition, 505 North Railroad Avenue, which was acquired in December 2017, contributed $21.9 million and $5.1 million to the rental and other services revenue and tenant reimbursements increases, respectively, for the year ended
December 31, 2018
compared to the same period in
2017
. Also, there were contributions from new leases at our properties that were under development during
66
the year ended
December 31, 2018
, offset partially by a decrease in revenues as a result of properties sold during the year ended
December 31, 2018
.
|
|
Stabilized
Year Ended December 31, |
Pre-Stabilized and Other
Year Ended December 31, |
||||||||||||||||||||||||
|
|
2017
|
2016
|
Change
|
% Change
|
2017
|
2016
|
Change
|
|||||||||||||||||||
|
Rental and other services
|
$
|
1,181,687
|
|
$
|
1,154,380
|
|
$
|
27,307
|
|
2.4
|
%
|
$
|
828,614
|
|
$
|
592,448
|
|
$
|
236,166
|
|
||||||
|
Tenant reimbursements
|
217,068
|
|
218,644
|
|
(1,576
|
)
|
(0.7
|
)%
|
223,156
|
|
137,259
|
|
85,897
|
|
||||||||||||
|
Total operating revenues
|
$
|
1,398,755
|
|
$
|
1,373,024
|
|
$
|
25,731
|
|
1.9
|
%
|
$
|
1,051,770
|
|
$
|
729,707
|
|
$
|
322,063
|
|
||||||
Stabilized rental and other services revenues increased $27.3 million, or 2.4%, for the year ended December 31, 2017 compared to the same period in 2016 primarily as a result of new leasing at our properties during the year ended December 31, 2017, the largest of which was for space at 1-11 Templar Road, 1725 Comstock Street and 200 Paul Avenue along with an increase in revenues from colocation services, offset by expiring leases at certain properties in the stabilized portfolio. Stabilized tenant reimbursement revenue decreased $1.6 million, or 0.7%, for the year ended December 31, 2017 compared to the same period in 2016 primarily as a result of increased property tax reimbursements due to one-time reductions in 2016 at two properties in the stabilized portfolio as well as lower utility reimbursements due to decreased usage and vacancies at certain properties.
Pre-stabilized and other revenue increases during the year ended December 31, 2017 compared to the same period in 2016 were primarily a result of the properties acquired in the DFT Merger, which contributed approximately $115.4 million and $62.3 million to the rental revenue and tenant reimbursement increases, respectively. In addition, the European Portfolio Acquisition contributed approximately $44.9 million and $7.0 million to the rental revenue and interconnection revenue increases, respectively. The remainder of the increases was related to new leases at our properties during the year ended December 31, 2017, offset partially by a decrease in revenues as a result of properties sold during the year ended December 31, 2017.
Fee Income and Other
Occasionally, customers engage the Company for certain services. The nature of these services historically involves property management, construction management, and assistance with financing. The proper revenue recognition of these services can be different, depending on whether the arrangements are service revenue or contractor type revenue. Service revenues are typically recognized on an equal monthly basis based on the minimum fee to be earned. The monthly amounts could be adjusted depending on if certain performance milestones are met.
Fee income also includes management fees. These fees arise from contractual agreements with entities in which we have a noncontrolling interest. The management fees are recognized as earned under the respective agreements. Management and other fee income related to partially owned entities are recognized to the extent attributable to the unaffiliated interest.
During the year ended December 31, 2016, we recognized a non-cash gain on lease termination of approximately $29.2 million, as one of our customers, as part of a lease termination, conveyed substantially all of its colocation and turn-key improvements to the Company.
67
Operating Expenses and Interest Expense
Operating expenses and interest expense during the years ended
December 31, 2018
,
2017
and
2016
were as follows (in thousands):
|
|
Year Ended December 31,
|
Change
|
Percentage Change
|
||||||||||||||||||||||
|
|
2018
|
2017
|
2016
|
2018 vs 2017
|
2017 vs 2016
|
2018 vs 2017
|
2017 vs 2016
|
||||||||||||||||||
|
Rental property operating and maintenance
|
$
|
957,065
|
|
$
|
759,616
|
|
$
|
660,177
|
|
$
|
197,449
|
|
$
|
99,439
|
|
26.0
|
%
|
15.1
|
%
|
||||||
|
Property taxes
|
129,516
|
|
124,014
|
|
102,497
|
|
5,502
|
|
21,517
|
|
4.4
|
%
|
21.0
|
%
|
|||||||||||
|
Insurance
|
11,402
|
|
10,981
|
|
9,492
|
|
421
|
|
1,489
|
|
3.8
|
%
|
15.7
|
%
|
|||||||||||
|
Depreciation and amortization
|
1,186,896
|
|
842,464
|
|
699,324
|
|
344,432
|
|
143,140
|
|
40.9
|
%
|
20.5
|
%
|
|||||||||||
|
General and administrative
|
163,667
|
|
161,441
|
|
152,733
|
|
2,226
|
|
8,708
|
|
1.4
|
%
|
5.7
|
%
|
|||||||||||
|
Transaction and integration expenses
|
45,327
|
|
76,048
|
|
20,491
|
|
(30,721
|
)
|
55,557
|
|
(40.4
|
)%
|
271.1
|
%
|
|||||||||||
|
Impairment of investments in real estate
|
—
|
|
28,992
|
|
—
|
|
(28,992
|
)
|
28,992
|
|
—
|
|
—
|
|
|||||||||||
|
Other
|
2,818
|
|
3,077
|
|
213
|
|
(259
|
)
|
2,864
|
|
(8.4
|
)%
|
1,344.6
|
%
|
|||||||||||
|
Total operating expenses
|
$
|
2,496,691
|
|
$
|
2,006,633
|
|
$
|
1,644,927
|
|
$
|
490,058
|
|
$
|
361,706
|
|
24.4
|
%
|
22.0
|
%
|
||||||
|
Interest expense
|
$
|
321,529
|
|
$
|
258,642
|
|
$
|
236,480
|
|
$
|
62,887
|
|
$
|
22,162
|
|
24.3
|
%
|
9.4
|
%
|
||||||
The following tables show expenses for the years ended
December 31, 2018
,
2017
and
2016
for stabilized properties and pre-stabilized properties and other (all other properties) (in thousands). Expense totals for pre-stabilized and other include results from properties that have not yet met the definition of stabilized and properties that are classified as held for sale or were sold during the period.
|
Stabilized
Year Ended December 31, |
Pre-Stabilized and Other
Year Ended December 31, |
|||||||||||||||||||||||||
|
|
2018
|
2017
|
Change
|
% Change
|
2018
|
2017
|
Change
|
|||||||||||||||||||
|
Rental property operating and
maintenance
|
$
|
505,127
|
|
$
|
494,852
|
|
$
|
10,275
|
|
2.1
|
%
|
$
|
451,938
|
|
$
|
264,764
|
|
$
|
187,174
|
|
||||||
|
Property taxes
|
73,349
|
|
78,059
|
|
(4,710
|
)
|
(6.0
|
)%
|
56,167
|
|
45,955
|
|
10,212
|
|
||||||||||||
|
Insurance
|
7,925
|
|
8,164
|
|
(239
|
)
|
(2.9
|
)%
|
3,477
|
|
2,817
|
|
660
|
|
||||||||||||
Stabilized rental property operating and maintenance expenses increased by approximately $10.3 million, or
2.1%
, for the year ended
December 31, 2018
compared to the same period in
2017
. The increase was primarily related to higher utility costs offset by reduced labor costs and cost containment measures across the portfolio.
Stabilized property taxes decreased by approximately $4.7 million, or
6.0%
, for the year ended
December 31, 2018
compared to the same period in
2017
. The decrease was primarily due to a refund at one of our properties in our stabilized portfolio.
Pre-stabilized and other rental property operating and maintenance expenses increased by approximately $187.2 million for the year ended
December 31, 2018
compared to the same period in
2017
, primarily as a result of the properties acquired in the DFT Merger, which contributed approximately $138.7 million.
Pre-stabilized and other property tax expense increased approximately $10.2 million for the year ended
December 31, 2018
compared to the same period in
2017
, primarily as a result of the properties acquired in the DFT Merger, which contributed approximately $16.1 million offset partially by a decrease in property taxes as a result of properties sold during the year ended
December 31, 2018
and a reduction in property tax liabilities at certain properties in our pre-stabilized and other portfolio.
68
|
Stabilized
Year Ended December 31, |
Pre-Stabilized and Other
Year Ended December 31, |
|||||||||||||||||||||||||
|
|
2017
|
2016
|
Change
|
% Change
|
2017
|
2016
|
Change
|
|||||||||||||||||||
|
Rental property operating and
maintenance
|
$
|
409,614
|
|
$
|
412,358
|
|
$
|
(2,744
|
)
|
(0.7
|
)%
|
$
|
350,002
|
|
$
|
247,819
|
|
$
|
102,183
|
|
||||||
|
Property taxes
|
69,363
|
|
67,929
|
|
1,434
|
|
2.1
|
%
|
54,651
|
|
34,568
|
|
20,083
|
|
||||||||||||
|
Insurance
|
7,663
|
|
7,165
|
|
498
|
|
7.0
|
%
|
3,318
|
|
2,327
|
|
991
|
|
||||||||||||
Stabilized rental property operating and maintenance expenses decreased by approximately $2.7 million, or
0.7%
, for the year ended December 31, 2017 compared to the same period in 2016 primarily as a result of reduced labor costs and cost containment measures across the portfolio.
Stabilized property taxes increased by approximately $1.4 million, or
2.1%
, for the year ended December 31, 2017 compared to the same period in 2016, primarily as a result of increased assessed taxes at one of our properties in Illinois.
Pre-stabilized and other rental property operating and maintenance expenses increased by approximately $102.2 million for the year ended December 31, 2017 compared to the same period in 2016, primarily as a result of the properties acquired in the DFT Merger, which contributed approximately $51.2 million along with the European Portfolio Acquisition, which contributed approximately $20.4 million to the increase, and leasing of completed and delivered inventory.
Pre-stabilized and other property tax expense increased approximately $20.1 million for the year ended December 31, 2017 compared to the same period in 2016, primarily due to a tax refund received in 2016 at one property in Singapore related to a change in assessed value along with the properties acquired in the DFT Merger, which contributed approximately $5.3 million.
Depreciation and Amortization
Depreciation and amortization expense increased by approximately $344.4 million for the year ended
December 31, 2018
compared to the same period in
2017
, principally because of amortization of finite-lived intangibles associated with the DFT Merger, which contributed approximately $310.7 million to the increase.
Depreciation and amortization expense increased by approximately $143.1 million for the year ended
December 31, 2017
compared to the same period in
2016
, principally because of amortization of finite-lived intangibles associated with the DFT Merger, which contributed approximately $116.2 million to the increase along with the European Portfolio Acquisition, which contributed approximately $23.8 million, offset by an impairment charge on the Telx tradename of approximately $6.1 million recorded in the quarter ended June 30, 2016 along with fully depreciated building assets during the year ended
December 31, 2017
.
General and Administrative
General and administrative expenses increased by approximately $2.2 million for the year ended
December 31, 2018
compared to the same period in
2017
, primarily due to an increase in headcount from 2017 to 2018 to support the Company's continued growth.
General and administrative expenses increased by approximately $8.7 million for the year ended
December 31, 2017
compared to the same period in
2016
, primarily due to an increase in headcount from 2016 to 2017 to support the Company's continued growth.
Transactions and Integration Expense
Transactions and integration expense decreased by approximately $30.7 million for the year ended
December 31, 2018
compared to the same period in
2017
, principally due to expenses incurred for the DFT Merger, which was completed in September 2017 partially offset by costs incurred related to the Ascenty Acquisition.
Transactions and integration expense increased by approximately $55.6 million for the year ended
December 31, 2017
compared to the same period in
2016
, principally due to $43.0 million of transaction expenses for the year ended
December 31, 2017
related to the DFT Merger along with integration expenses attributable to recently completed acquisitions.
69
Interest Expense
Interest expense increased by approximately $62.9 million for the year ended
December 31, 2018
compared to the same period in
2017
, primarily due to the issuance of the 2019 Notes in May 2017, the issuance of the 2.750% 2024 Notes and the 2029 Notes in July 2017, the issuance of the 2.750% 2023 Notes and the 2027 Notes in August 2017, the issuance of the 2028 Notes in June 2018 and the 2030 Notes in October 2018.
Interest expense increased by approximately $22.2 million for the year ended
December 31, 2017
compared to the same period in
2016
, primarily due to the issuance of the 2019 Notes in May 2017, the issuance of the 2.750% notes due 2024 and the 3.300% notes due 2029 in July 2017 and the issuance of the 2.750% notes due 2023 and the 3.700% notes due 2027 in August 2017.
Impairment of Investments in Real Estate
We evaluated the carrying value of the properties identified as held for sale to ensure the carrying value was recoverable in light of a potentially shorter holding period. As a result of our evaluation, during the year ended
December 31, 2017
, we recognized $29.0 million of impairment charges on three properties located in the United States to reduce the carrying values to the estimated fair values less costs to sell. The fair values of the three properties were based on comparable sales price data. There were no impairment charges for the years ended December 31, 2018 and 2016.
Gain on Sale of Properties
During the year ended
December 31, 2018
, we recognized a gain on sale of properties of
$80.4 million
primarily related to the disposition of (i) 200 Quannapowitt Parkway, which sold for $15.0 million in January 2018, (ii) 34551 Ardenwood Boulevard, which sold for $73.3 million in February 2018, (iii) 3065 Gold Camp Drive, which sold for $14.2 million in March 2018, (iv) 11085 Sun Center Drive, which sold for $36.8 million in March 2018, (v) the Austin Portfolio, which sold for $47.6 million in April 2018, (vi) 2010 East Centennial Circle, which sold for $5.5 million in May 2018, (vii) 1125 Energy Park Drive, which sold for $7.0 million in May 2018 and (viii) 360 Spear Street, which sold for $92.3 million in September 2018.
During the year ended
December 31, 2017
, we recognized a gain on sale of properties of $40.4 million primarily related to the disposition of (i) 8025 North Interstate 35, which sold for $20.2 million in August 2017, (ii) 44874 Moran Road, which sold for $34.0 million in October 2017, and (iii) 1 Solutions Parkway, which sold for $37.1 million in November 2017.
During the year ended
December 31, 2016
, we recognized a gain on sale of properties of $169.9 million primarily related to the disposition of (i) 47700 Kato Road and 1055 Page Avenue, which sold for $37.5 million in January 2016, (ii) a four-property portfolio composed of 210 N. Tucker Boulevard, 900 Walnut Street, 251 Exchange Place and 1807 Michael Faraday Court, which sold for $114.5 million in the aggregate in July 2016, and (iii) 114 Ambroise Croizat, which sold for $212.0 million in August 2016.
Liquidity and Capital Resources of the Parent Company
In this “Liquidity and Capital Resources of the Parent Company” section and in the “Liquidity and Capital Resources of the Operating Partnership” section below, the term, our “Parent Company”, refers to Digital Realty Trust, Inc. on an unconsolidated basis, excluding our Operating Partnership.
Analysis of Liquidity and Capital Resources
Our Parent Company’s business is operated primarily through our Operating Partnership, of which our Parent Company is the sole general partner and which it consolidates for financial reporting purposes. Because our Parent Company operates on a consolidated basis with our Operating Partnership, the section entitled “Liquidity and Capital Resources of the Operating Partnership” should be read in conjunction with this section to understand the liquidity and capital resources of our Parent Company on a consolidated basis and how our Company is operated as a whole.
Our Parent Company issues public equity from time to time, but generally does not otherwise generate any capital itself or conduct any business itself, other than incurring certain expenses in operating as a public company which are fully reimbursed by the Operating Partnership. Our Parent Company itself does not hold any indebtedness other than guarantees of the indebtedness of our Operating Partnership and certain of its subsidiaries, and its only material asset is its ownership of partnership interests of our
70
Operating Partnership. Therefore, the consolidated assets and liabilities and the consolidated revenues and expenses of our Parent Company and our Operating Partnership are the same on their respective financial statements, except for immaterial differences related to cash, other assets and accrued liabilities that arise from public company expenses paid by our Parent Company. However, all debt is held directly or indirectly at the Operating Partnership level. Our Parent Company’s principal funding requirement is the payment of dividends on its common and preferred stock. Our Parent Company’s principal source of funding for its dividend payments is distributions it receives from our Operating Partnership.
As the sole general partner of our Operating Partnership, our Parent Company has the full, exclusive and complete responsibility for our Operating Partnership’s day-to-day management and control. Our Parent Company causes our Operating Partnership to distribute such portion of its available cash as our Parent Company may in its discretion determine, in the manner provided in our Operating Partnership’s partnership agreement. Our Parent Company receives proceeds from its equity issuances from time to time, but is generally required by our Operating Partnership’s partnership agreement to contribute the proceeds from its equity issuances to our Operating Partnership in exchange for partnership units of our Operating Partnership.
Our Parent Company is a well-known seasoned issuer with an effective shelf registration statement filed on September 22, 2017, which allows our Parent Company to register an unspecified amount of various classes of equity securities. As circumstances warrant, our Parent Company may issue equity from time to time on an opportunistic basis, dependent upon market conditions and available pricing. Any proceeds from such equity issuances would generally be contributed to our Operating Partnership in exchange for additional equity interests in our Operating Partnership. Our Operating Partnership may use the proceeds to acquire additional properties, to fund development opportunities and for general working capital purposes, including potentially for the repurchase, redemption or retirement of outstanding debt or equity securities.
The liquidity of our Parent Company is dependent on our Operating Partnership’s ability to make sufficient distributions to our Parent Company. The primary cash requirement of our Parent Company is its payment of dividends to its stockholders. Our Parent Company also guarantees our Operating Partnership’s, as well as certain of its subsidiaries’ and affiliates’, unsecured debt. If our Operating Partnership or such subsidiaries fail to fulfill their debt requirements, which trigger Parent Company guarantee obligations, then our Parent Company will be required to fulfill its cash payment commitments under such guarantees. However, our Parent Company’s only material asset is its investment in our Operating Partnership.
We believe our Operating Partnership’s sources of working capital, specifically its cash flow from operations, and funds available under its global revolving credit facility are adequate for it to make its distribution payments to our Parent Company and, in turn, for our Parent Company to make its dividend payments to its stockholders. However, we cannot assure you that our Operating Partnership’s sources of capital will continue to be available at all or in amounts sufficient to meet its needs, including making distribution payments to our Parent Company. The lack of availability of capital could adversely affect our Operating Partnership’s ability to pay its distributions to our Parent Company, which would in turn, adversely affect our Parent Company’s ability to pay cash dividends to its stockholders.
Our Parent Company entered into equity distribution agreements in June 2011, which we refer to as the 2011 Equity Distribution Agreements, with each of Merrill Lynch, Pierce, Fenner & Smith Incorporated, Citigroup Global Markets Inc., Credit Suisse Securities (USA) LLC, Deutsche Bank Securities Inc. and Morgan Stanley & Co. LLC, or the Agents, under which it can issue and sell shares of its common stock having an aggregate offering price of up to $400.0 million from time to time through, at its discretion, any of the Agents as its sales agents. The sales of common stock made under the 2011 Equity Distribution Agreements will be made in “at the market” offerings as defined in Rule 415 of the Securities Act. Cumulatively through
December 31, 2018
, our Parent Company had generated net proceeds of approximately $342.7 million from the issuance of approximately 5.7 million common shares under the 2011 Equity Distribution Agreements at an average price of $60.35 per share after payment of approximately $3.5 million of commissions to the sales agents and before offering expenses. No sales were made under the program during the years ended
December 31, 2018
,
2017
and
2016
. As of
December 31, 2018
, shares of common stock having an aggregate offering price of $53.8 million remained available for offer and sale under the program. The 2011 Equity Distribution Agreements were terminated in connection with the entry into the 2019 Equity Distribution Agreements (defined and discussed below) on January 4, 2019.
On January 4, 2019, our Parent Company entered into equity distribution agreements, which we refer to as the 2019 Equity Distribution Agreements, with each of Merrill Lynch, Pierce, Fenner & Smith Incorporated, Barclays Capital Inc., BTIG, LLC, Credit Suisse Securities (USA) LLC, Deutsche Bank Securities Inc., J.P. Morgan Securities LLC, Mizuho Securities USA LLC, Morgan Stanley & Co. LLC, MUFG Securities Americas Inc., PNC Capital Markets LLC, Raymond James & Associates, Inc., RBC Capital Markets, LLC, Scotia Capital (USA) Inc., SMBC Nikko Securities America, Inc., SunTrust Robinson Humphrey, Inc., TD Securities (USA) LLC, and Wells Fargo Securities, LLC, or the Agents, under which it could issue and sell shares of its common stock having an aggregate offering price of up to
$1.0 billion
from time to time through, at its discretion, any of the Agents as its sales agents or as principals. Sales may also be made on a forward basis pursuant to separate forward sale
71
agreements. The sales of common stock made under the 2019 Equity Distribution Agreements will be made in “at the market” offerings as defined in Rule 415 of the Securities Act. To date, no sales have been made under the program.
On September 27, 2018, our Parent Company completed an underwritten public offering of 9,775,000 shares of its common stock (including 1,275,000 shares from the exercise in full of the underwriters' option to purchase additional shares), all of which were offered in connection with forward sale agreements it entered into with certain financial institutions acting as forward purchasers. The forward purchasers borrowed and sold an aggregate of 9,775,000 shares of our Parent Company’s common stock in the public offering. We did not receive any proceeds from the sale of our common stock by the forward purchasers in the public offering. We expect to receive net proceeds of approximately $1.1 billion (net of fees and estimated expenses) upon full physical settlement of the forward sale agreements, which is anticipated to be no later than September 27, 2019.
Ascenty Acquisition Financing
On December 20, 2018, we completed the acquisition of Ascenty for total cash and equity consideration of approximately $1.8 billion, net of cash purchased. The transaction was initially funded with
$600.0 million
of proceeds from a non-recourse,
five
-year secured term loan (see below); the issuance of approximately
$254 million
of Operating Partnership common units in exchange for the substantial majority of the Ascenty management's equity interests; and approximately
$1.0 billion
of unsecured corporate borrowings, comprised of a $375.0 million unsecured term loan (see below) and borrowings under the global revolving credit facility.
On December 19, 2018, the Operating Partnership entered into a term loan agreement, with Digital Realty Trust, Inc. as the parent guarantor, which we refer to as the Ascenty term loan agreement, which governs a
$375.0 million
1
-year senior unsecured term loan, which we refer to as the 2019 Term Loan. The 2019 Term Loan matures on December 19, 2019 with
one
six
-month extension option. Interest rates equal the applicable index plus a margin of
100
basis points, which is based on the current credit ratings of our senior unsecured debt (effective rate of
3.47%
as of
December 31, 2018
).
On December 20, 2018, our Brazilian subsidiary entered into a non-recourse credit agreement for up to
$775.0 million
in the aggregate, which consists of a
$600.0 million
5
-year secured term loan, which we refer to as the December 2023 Secured Loan, plus a
$125.0 million
delayed-draw term loan and a
$50.0 million
revolving credit facility. The December 2023 Secured Loan matures on December 20, 2023. The interest rate on the December 2023 Secured Loan equals the applicable index plus a margin of
425
basis points (effective rate of
7.04%
as of
December 31, 2018
).
Separately, we entered into an independent bilateral equity commitment letter with Brookfield Infrastructure, an affiliate of Brookfield Asset Management, one of the largest owners and operators of infrastructure assets globally, under which Brookfield has committed to fund approximately $700 million, excluding Brookfield's share of transaction costs, in exchange for 49% of the total equity interests in a joint venture entity expected to ultimately own Ascenty. The agreement with Brookfield is subject to certain closing conditions and is expected to close in the first quarter of 2019.
Future Uses of Cash
Our Parent Company may from time to time seek to retire, redeem or repurchase its equity or the debt securities of our Operating Partnership or its subsidiaries through cash purchases and/or exchanges for equity securities in open market purchases, privately negotiated transactions or otherwise. Such repurchases, redemptions or exchanges, if any, will depend on prevailing market conditions, our liquidity requirements, contractual restrictions or other factors. The amounts involved may be material.
We are also subject to the commitments discussed below under “Dividends and Distributions.”
Dividends and Distributions
Our Parent Company is required to distribute 90% of its taxable income (excluding capital gains) on an annual basis in order for it to continue to qualify as a REIT for federal income tax purposes. Accordingly, our Parent Company intends to make, but is not contractually bound to make, regular quarterly distributions to its common stockholders from cash flow from our Operating Partnership’s operating activities. While historically our Parent Company has satisfied this distribution requirement by making cash distributions to its stockholders, it may choose to satisfy this requirement by making distributions of cash or other property. All such distributions are at the discretion of our Parent Company’s board of directors. Our Parent Company considers market factors and our Operating Partnership’s performance in addition to REIT requirements in determining distribution levels. Our Parent Company has distributed at least 100% of its taxable income annually since inception to minimize corporate level federal income taxes. Amounts accumulated for distribution to stockholders are invested primarily in interest-bearing accounts and short-term interest-bearing securities, which are consistent with our intention to maintain our Parent Company’s status as a REIT.
72
As a result of this distribution requirement, our Operating Partnership cannot rely on retained earnings to fund its on-going operations to the same extent that other companies whose parent companies are not REITs can. Our Parent Company may need to continue to raise capital in the debt and equity markets to fund our Operating Partnership’s working capital needs, as well as potential developments at new or existing properties, acquisitions or investments in existing or newly created joint ventures. In addition, our Parent Company may be required to use borrowings under our global revolving credit facility, if necessary, to meet REIT distribution requirements and maintain our Parent Company’s REIT status.
Our Parent Company declared the following dividends on its common and preferred stock during the years ended
December 31, 2018
,
2017
and
2016
(in thousands, except per share amounts):
|
Date dividend
declared |
Dividend payable date
|
Series C Preferred Stock
|
|
Series E Preferred Stock
|
|
Series F Preferred Stock
|
|
Series G Preferred Stock
|
|
Series H Preferred Stock
|
|
Series I Preferred Stock
|
Series J Preferred Stock
|
Common
Stock |
|
||||||||||||||||||||
|
February 17, 2016
|
March 31, 2016
|
—
|
|
$
|
5,031
|
|
|
$
|
3,023
|
|
|
$
|
3,672
|
|
|
$
|
6,730
|
|
|
$
|
3,969
|
|
—
|
|
$
|
131,587
|
|
(1)
|
|||||||
|
May 11, 2016
|
June 30, 2016
|
—
|
|
5,031
|
|
|
3,023
|
|
|
3,672
|
|
6,730
|
|
3,969
|
|
—
|
|
131,607
|
|
(1)
|
|||||||||||||||
|
August 10, 2016
|
September 30, 2016
|
—
|
|
|
—
|
|
(2)
|
3,023
|
|
|
3,672
|
|
|
6,730
|
|
|
3,969
|
|
—
|
|
131,657
|
|
(1)
|
||||||||||||
|
November 9, 2016
|
December 30, 2016 for Preferred Stock;
January 13, 2017 for Common Stock |
—
|
|
|
—
|
|
|
3,023
|
|
3,672
|
|
|
6,730
|
|
|
3,969
|
|
—
|
|
141,882
|
|
(1)
|
|||||||||||||
|
—
|
|
|
$
|
10,062
|
|
|
$
|
12,092
|
|
|
$
|
14,688
|
|
|
$
|
26,920
|
|
|
$
|
15,876
|
|
—
|
|
$
|
536,733
|
|
|
||||||||
|
March 1, 2017
|
March 31, 2017
|
—
|
|
|
—
|
|
$
|
3,023
|
|
|
$
|
3,672
|
|
|
$
|
6,730
|
|
|
$
|
3,969
|
|
—
|
|
$
|
148,358
|
|
(3)
|
||||||||
|
May 8, 2017
|
June 30, 2017
|
—
|
|
—
|
|
|
—
|
|
(4)
|
3,672
|
|
6,730
|
|
3,969
|
|
—
|
|
150,814
|
|
(3)
|
|||||||||||||||
|
August 7, 2017
|
September 29, 2017
|
—
|
|
|
—
|
|
—
|
|
|
3,672
|
|
|
6,730
|
|
|
3,969
|
|
—
|
|
191,041
|
|
(3)
|
|||||||||||||
|
November 2, 2017
|
December 29, 2017 for Preferred Stock;
January 12, 2018 for Common Stock |
$
|
3,963
|
|
(5)
|
—
|
|
|
—
|
|
|
3,672
|
|
|
6,730
|
|
|
3,969
|
|
$
|
4,200
|
|
(5)
|
191,067
|
|
(3)
|
|||||||||
|
$
|
3,963
|
|
|
$
|
—
|
|
|
$
|
3,023
|
|
|
$
|
14,688
|
|
|
$
|
26,920
|
|
|
$
|
15,876
|
|
$
|
4,200
|
|
$
|
681,280
|
|
|
||||||
|
March 1, 2018
|
March 30, 2018
|
$
|
3,333
|
|
|
—
|
|
—
|
|
|
$
|
3,672
|
|
|
$
|
6,730
|
|
|
$
|
3,969
|
|
$
|
2,625
|
|
$
|
208,015
|
|
(6)
|
|||||||
|
May 8, 2018
|
June 29, 2018
|
3,333
|
|
|
—
|
|
|
—
|
|
3,672
|
|
|
6,730
|
|
3,969
|
|
2,625
|
|
208,071
|
|
(6)
|
||||||||||||||
|
August 14, 2018
|
September 28, 2018
|
3,333
|
|
|
—
|
|
—
|
|
|
3,672
|
|
|
6,730
|
|
|
3,969
|
|
2,625
|
|
208,166
|
|
(6)
|
|||||||||||||
|
November 12, 2018
|
December 31, 2018 for Preferred Stock;
January 15, 2019 for Common Stock |
3,333
|
|
—
|
|
|
—
|
|
|
3,672
|
|
|
6,730
|
|
|
3,969
|
|
2,625
|
|
208,415
|
|
(6)
|
|||||||||||||
|
$
|
13,332
|
|
|
—
|
|
|
—
|
|
|
$
|
14,688
|
|
|
$
|
26,920
|
|
|
$
|
15,876
|
|
$
|
10,500
|
|
$
|
832,667
|
|
|
||||||||
|
Annual rate of dividend per share
|
$
|
1.65625
|
|
$
|
1.75000
|
|
$
|
1.65625
|
|
$
|
1.46875
|
|
$
|
1.84375
|
|
$
|
1.58750
|
|
$
|
1.31250
|
|
||||||||||||||
|
(1)
|
$
3.520
annual rate of dividend per share.
|
|
(2)
|
Redeemed on September 15, 2016 for
$25.35972
per share, or a redemption price of
$25.00
per share, plus accrued and unpaid dividends up to but not including the redemption date of approximately
$4.1 million
in the aggregate. In connection with the redemption, the previously incurred offering costs of approximately
$10.3 million
were recorded as a reduction to net income available to common stockholders.
|
|
(3)
|
$3.720
annual rate of dividend per share.
|
|
(4)
|
Redeemed on April 5, 2017 for
$25.01840
per share, or a redemption price of
$25.00
per share, plus accrued and unpaid dividends up to but not including the redemption date of approximately
$0.1 million
in the aggregate. In connection with the redemption, the previously incurred offering costs of approximately
$6.3 million
were recorded as a reduction to net income available to common stockholders.
|
|
(5)
|
Represents a pro rata dividend from and including the original issue date to and including December 31, 2017.
|
|
(6)
|
$4.040
annual rate of dividend per share.
|
Distributions out of our Parent Company’s current or accumulated earnings and profits are generally classified as ordinary income whereas distributions in excess of our Parent Company’s current and accumulated earnings and profits, to the extent of a stockholder’s U.S. federal income tax basis in our Parent Company’s stock, are generally classified as a return of capital.
73
Distributions in excess of a stockholder’s U.S. federal income tax basis in our Parent Company’s stock are generally characterized as capital gain. Cash provided by operating activities has been generally sufficient to fund distributions on an annual basis, however, we may also need to utilize borrowings under the global revolving credit facility to fund distributions.
The expected tax treatment of distributions on our Parent Company’s common stock paid in 2018 is as follows: approximately 80% ordinary income and 20% return of capital. Our preferred dividends will be treated as 100% ordinary income. The tax treatment of distributions on our Parent Company’s common and preferred stock paid in 2017 was as follows: approximately 95% ordinary income and 5% capital gain distribution. The tax treatment of distributions on our Parent Company’s common and preferred stock paid in 2016 was as follows: approximately 98% ordinary income and 2% capital gain distribution.
Liquidity and Capital Resources of the Operating Partnership
In this “Liquidity and Capital Resources of the Operating Partnership” section, the terms “we”, “our” and “us” refer to our Operating Partnership together with its consolidated subsidiaries or our Operating Partnership and our Parent Company together with their consolidated subsidiaries, as the context requires.
Analysis of Liquidity and Capital Resources
Our Parent Company is our sole general partner and consolidates our results of operations for financial reporting purposes. Because we operate on a consolidated basis with our Parent Company, the section entitled “Liquidity and Capital Resources of the Parent Company” should be read in conjunction with this section to understand our liquidity and capital resources on a consolidated basis.
As of
December 31, 2018
, we had
$126.7 million
of cash and cash equivalents, excluding
$8.5 million
of restricted cash. Restricted cash primarily consists of contractual capital expenditures plus other deposits.
Our short-term liquidity requirements primarily consist of operating expenses, development costs and other expenditures associated with our properties, distributions to our Parent Company in order for it to make dividend payments on its preferred stock, distributions to our Parent Company in order for it to make dividend payments to its stockholders required to maintain its REIT status, distributions to the unitholders of common limited partnership interests in Digital Realty Trust, L.P., capital expenditures, debt service on our loans and senior notes, and, potentially, acquisitions. We expect to meet our short-term liquidity requirements through net cash provided by operations, restricted cash accounts established for certain future payments and by drawing upon our global revolving credit facilities.
We are committed to maintaining a conservative capital structure. We target a debt-to-adjusted EBITDA ratio at or less than 5.5x, fixed charge coverage of greater than three times, and floating rate debt at less than 20% of total outstanding debt. In addition, we strive to maintain a well-laddered debt maturity schedule, and we seek to maximize the menu of our available sources of capital, while minimizing the related cost.
On June 21, 2018, we issued $650.0 million in aggregate principal amount of notes, maturing on July 15, 2028 with an interest rate of 4.450% per annum, which we refer to as the 2028 Notes. The purchase price paid by the initial purchasers was 99.852% of the principal amount. The 2028 Notes are our general unsecured senior obligations, rank equally in right of payment with all our other senior unsecured indebtedness and are fully and unconditionally guaranteed by Digital Realty Trust, Inc. Interest on the 2028 Notes is payable on January 15 and July 15 of each year, beginning on January 15, 2019. The net proceeds from the offering after deducting the original issue discount of approximately $1.0 million and underwriting commissions and expenses of approximately $5.7 million was approximately $643.3 million. We used the net proceeds from this offering to temporarily repay borrowings under our global revolving credit facility and for general corporate purposes.
On October 17, 2018, Digital Stout Holding, LLC, a wholly owned subsidiary of the Operating Partnership, issued and sold £400.0 million (approximately $524.6 million based on the exchange rate on October 17, 2018) aggregate principal amount of 3.750% Guaranteed Notes due 2030, or the 2030 Notes. The 2030 Notes are senior unsecured obligations of Digital Stout Holding, LLC and are fully and unconditionally guaranteed by the Parent Company and the Operating Partnership. Net proceeds from the offering were approximately £393.5 million (approximately $516.1 million based on the exchange rate on October 17, 2018) after deducting managers’ discounts and estimated offering expenses. We used the net proceeds from the offering of the 2030 Notes primarily to repay borrowings outstanding under the Operating Partnership’s global credit facility and term loan.
On October 24, 2018, we refinanced our global revolving credit facility and entered into a global senior credit agreement for a
$2.35 billion
senior unsecured revolving credit facility, which we refer to as the 2018 global revolving credit facility, that replaced the
$2.0 billion
revolving credit facility executed on January 15, 2016. In addition, we have the ability from time to time to increase the size of the global revolving credit facility and the unsecured term loans (discussed below), in any
74
combination, by up to
$1.25 billion
, subject to the receipt of lender commitments and other conditions precedent. The 2018 global revolving credit facility matures on
January 24, 2023
, with
two
six
-month extension options available. The interest rate for borrowings under the 2018 global revolving credit facility equals the applicable index plus a margin which is based on the credit ratings of our long-term debt and is currently
90
basis points. An annual facility fee on the total commitment amount of the facility, based on the credit ratings of our long-term debt, currently
20
basis points, is payable quarterly. The 2018 global revolving credit facility provides for borrowings in U.S., Canadian, Singapore, Australian and Hong Kong dollars, as well as Euro, British pound sterling and Japanese yen and includes the ability to add additional currencies in the future. As of
December 31, 2018
, interest rates are based on 1-month LIBOR, 1-month GBP LIBOR, 1-month EURIBOR, 1-month HIBOR, 1-month JPY LIBOR, 1-month SOR and 1-month CDOR, plus a margin of
0.90%
. We have used and intend to use available borrowings under the 2018 global revolving credit facility to acquire additional properties, fund development opportunities and for general working capital and other corporate purposes, including potentially for the repurchase, redemption or retirement of outstanding debt or equity securities. The 2018 global revolving credit facility contains various restrictive covenants, including limitations on our ability to incur additional indebtedness, make certain investments or merge with another company, and requirements to maintain financial coverage ratios, including with respect to unencumbered assets. In addition, the 2018 global revolving credit facility restricts Digital Realty Trust, Inc. from making distributions to its stockholders, or redeeming or otherwise repurchasing shares of its capital stock, after the occurrence and during the continuance of an event of default, except in limited circumstances including as necessary to enable Digital Realty Trust, Inc. to maintain its qualification as a REIT and to minimize the payment of income or excise tax. As of
December 31, 2018
, we were in compliance with all of such covenants. As of
December 31, 2018
, approximately $1.5 billion was drawn under this facility and
$44.5 million
of letters of credit were issued, leaving approximately
$0.8 billion
available for use.
On October 24, 2018, we entered into a credit agreement for a
¥33.3 billion
(approximately
$296.5 million
based on the exchange rate on October 24, 2018) senior unsecured revolving credit facility, which we refer to as the Yen revolving credit facility. The Yen revolving credit facility provides for borrowings in Japanese yen. In addition, we have the ability from time to time to increase the size of the Yen revolving credit facility to up to
¥93.3 billion
(approximately
$831.1 million
based on the exchange rate on October 24, 2018), subject to receipt of lender commitments and other conditions precedent. The Yen revolving credit facility matures on January 24, 2024. The interest rate for borrowings under the Yen revolving credit facility equals the applicable index plus a margin which is based on the credit ratings of our long-term debt and is currently
50
basis points. A quarterly unused commitment fee, which is calculated using the average daily unused revolving credit commitment, is based on the credit ratings of our long-term debt, and is currently
10
basis points. The Yen revolving credit facility contains various restrictive covenants, including limitations on our ability to incur additional indebtedness, make certain investments or merge with another company, and requirements to maintain financial coverage ratios, including with respect to unencumbered assets. In addition, the Yen revolving credit facility restricts Digital Realty Trust, Inc. from making distributions to its stockholders, or redeeming or otherwise repurchasing shares of its capital stock, after the occurrence and during the continuance of an event of default, except in limited circumstances including as necessary to enable Digital Realty Trust, Inc. to maintain its qualification as a REIT and to minimize the payment of income or excise tax. As of
December 31, 2018
, we were in compliance with all of such covenants. As of
December 31, 2018
, approximately
$134.6 million
was drawn under this facility, leaving approximately $158.7 million available for use.
As of
December 31, 2018
, we have capitalized approximately $15.4 million of financing costs, net of accumulated amortization, related to the 2018 global revolving credit facility and the Yen facility in the aggregate.
75
On October 24, 2018, we refinanced our senior unsecured multi-currency term loan facility and entered into an amended and restated term loan agreement, which we refer to as the 2018 term loan agreement, which governs (i) a
$300.0 million
5
-year senior unsecured term loan, which we refer to as the 2023 Term Loan, and (ii) an approximately
$512 million
5
-year senior unsecured term loan, which we refer to as the 2024 Term Loan. The 2018 term loan agreement replaced the
$1.55 billion
term loan agreement executed on January 15, 2016. The 2023 Term Loan matures on January 15, 2023 and the 2024 Term Loan matures on January 24, 2023 with
two
six
-month extension options. In addition, we have the ability from time to time to increase the aggregate size of lending under the 2018 term loan agreement and the 2018 global revolving credit facility (discussed above), in any combination, by up to
$1.25 billion
, subject to receipt of lender commitments and other conditions precedent. Interest rates are based on our senior unsecured debt ratings and are currently
100
basis points over the applicable index for floating rate advances for the 2023 Term Loan and the 2024 Term Loan. Funds may be drawn in U.S., Canadian, Singapore, Australian and Hong Kong dollars. Based on exchange rates in effect at
December 31, 2018
, the balance outstanding is approximately
$0.8 billion
, excluding deferred financing costs. We have used borrowings under the term loans for acquisitions, repayment of indebtedness, development, working capital and general corporate purposes. The covenants under the 2023 Term Loan and 2024 Term Loan are consistent with our 2018 global revolving credit facility and, as of
December 31, 2018
, we were in compliance with all of such covenants. As of
December 31, 2018
, we have capitalized approximately $4.2 million of financing costs, net of accumulated amortization, related to the unsecured term loans.
For a discussion of the potential impact of current global economic and market conditions on our liquidity and capital resources, see “—Factors Which May Influence Future Results of Operations—Global market and economic conditions” above.
Our Parent Company commenced its at-the-market equity distribution program in June 2011, which is discussed under “Liquidity and Capital Resources of the Parent Company” above. To date, our Parent Company has generated net proceeds of approximately $342.7 million from the issuance of approximately 5.7 million shares of common stock under the program at an average price of $60.35 per share after payment of approximately $3.5 million of commissions to the sales agents and before offering expenses. The proceeds from the issuances were contributed to us in exchange for the issuance of approximately 5.7 million common units to our Parent Company. No sales were made under the program during the years ended
December 31, 2018
,
2017
and
2016
. As of
December 31, 2018
, shares of common stock having an aggregate offering price of $53.8 million remained available for offer and sale under the program. The 2011 Equity Distribution Agreements were terminated in connection with the entry into the 2019 Equity Distribution Agreements on January 4, 2019.
On January 4, 2019, our Parent Company entered into new equity distribution agreements, which is discussed under “Liquidity and Capital Resources of the Parent Company” above. To date, no sales have been made under the program.
The Operating Partnership sold the following real estate properties during the year ended
December 31, 2018
:
|
Location
|
Metro
Area
|
Date Sold
|
Gross Proceeds (in millions)
|
Gain (loss) on sale (in millions)
|
||||||||
|
200 Quannapowitt Parkway
|
Boston
|
Jan 25, 2018
|
$
|
15.0
|
|
$
|
(0.4
|
)
|
||||
|
34551 Ardenwood Boulevard
|
Silicon Valley
|
Feb 9, 2018
|
73.3
|
|
25.3
|
|
||||||
|
3065 Gold Camp Drive
|
Sacramento
|
Mar 14, 2018
|
14.2
|
|
5.4
|
|
||||||
|
11085 Sun Center Drive
|
Sacramento
|
Mar 14, 2018
|
36.8
|
|
9.1
|
|
||||||
|
Austin Portfolio
|
Austin
|
Apr 19, 2018
|
47.6
|
|
12.0
|
|
||||||
|
2010 East Centennial Circle
|
Phoenix
|
May 22, 2018
|
5.5
|
|
(0.5
|
)
|
||||||
|
1125 Energy Park Drive
|
Minneapolis
|
May 31, 2018
|
7.0
|
|
2.8
|
|
||||||
|
360 Spear Street
|
San Francisco
|
Sep 21, 2018
|
92.3
|
|
26.7
|
|
||||||
|
$
|
291.7
|
|
$
|
80.4
|
|
|||||||
None of our property sales to date represented a significant component or significant shift in strategy that would require discontinued operations presentation.
The growing acceptance by private institutional investors of the data center asset class has generally pushed capitalization rates lower, as such private investors may often have lower return expectations than us. As a result, we anticipate near-term single asset acquisitions activity to comprise a smaller percentage of our growth while this market dynamic persists.
76
Construction ($ in thousands)
|
|
As of December 31, 2018
|
As of December 31, 2017
|
|||||||||||||||||||||||||||
|
|
Net
Rentable Square Feet (1) |
Current
Investment (2) |
Future
Investment (3) |
Total Cost
|
Net
Rentable Square Feet (1) |
Current
Investment (4) |
Future
Investment (3) |
Total Cost
|
|||||||||||||||||||||
|
Development Lifecycle
|
|||||||||||||||||||||||||||||
|
Land
|
(6)
|
548,833
|
|
—
|
|
548,833
|
|
(6)
|
352,406
|
|
—
|
|
352,406
|
|
|||||||||||||||
|
Development Construction in Progress
|
|||||||||||||||||||||||||||||
|
Space Held for Development (5)
|
1,805,844
|
|
396,440
|
|
—
|
|
396,440
|
|
1,573,758
|
|
$
|
416,553
|
|
—
|
|
$
|
416,553
|
|
|||||||||||
|
Base Building Construction
|
1,724,740
|
|
214,634
|
|
$
|
223,360
|
|
437,994
|
|
1,333,763
|
|
222,093
|
|
$
|
149,507
|
|
371,600
|
|
|||||||||||
|
Data Center Construction
|
1,103,465
|
|
586,995
|
|
521,387
|
|
1,108,382
|
|
1,366,393
|
|
748,006
|
|
500,674
|
|
1,248,680
|
|
|||||||||||||
|
Equipment Pool & Other Inventory
|
N/A
|
|
14,558
|
|
—
|
|
14,558
|
|
7,245
|
|
—
|
|
7,245
|
|
|||||||||||||||
|
Campus, Tenant Improvements
& Other |
N/A
|
|
23,408
|
|
16,228
|
|
39,636
|
|
5,787
|
|
8,360
|
|
14,147
|
|
|||||||||||||||
|
Total Development Construction in Progress
|
4,634,049
|
|
1,236,035
|
|
760,975
|
|
1,997,010
|
|
4,273,914
|
|
1,399,684
|
|
658,541
|
|
2,058,225
|
|
|||||||||||||
|
Enhancement & Other
|
6,918
|
|
11,495
|
|
18,413
|
|
8,416
|
|
27,209
|
|
35,625
|
|
|||||||||||||||||
|
Recurring
|
16,102
|
|
21,373
|
|
37,475
|
|
23,985
|
|
29,184
|
|
53,169
|
|
|||||||||||||||||
|
Total Construction in Progress
|
$
|
1,807,888
|
|
$
|
793,843
|
|
$
|
2,601,731
|
|
$
|
1,784,491
|
|
$
|
714,934
|
|
$
|
2,499,425
|
|
|||||||||||
|
(1)
|
Square footage is based on current estimates and project plans, and may change upon completion of the project or due to remeasurement.
|
|
(2)
|
Represents balances incurred through
December 31, 2018
and included in building and improvements in the consolidated balance sheets.
|
|
(3)
|
Represents estimated cost to complete specific scope of work pursuant to contract, budget or approved capital plan.
|
|
(4)
|
Represents balances incurred through
December 31, 2017
and included in building and improvements in the consolidated balance sheets.
|
|
(5)
|
Excludes space held for development related to the Ascenty Acquisition, unconsolidated joint ventures and properties held for sale.
|
|
(6)
|
Represents approximately
959
acres as of
December 31, 2018
and approximately 539 acres as of
December 31, 2017
.
|
Land inventory and space held for development reflect cumulative cost spent pending future development. Base building construction consists of ongoing improvements to building infrastructure in preparation for future data center fit-out. Datacenter construction includes
1.1 million
square feet of Turn Key Flex®, colocation and Powered Base Building® products. Generally, we expect to deliver the space within 12 months; however, lease commencement dates may significantly impact final delivery schedules. Equipment pool and other inventory represent the value of long-lead time equipment and materials required for timely deployment and delivery of data center construction fit-out. Campus, tenant improvements and other costs include the value of development work which benefits space recently converted to our operating portfolio and is composed primarily of shared infrastructure projects and first-generation tenant improvements.
Future Uses of Cash
Our properties require periodic investments of capital for tenant-related capital expenditures and for general capital improvements. As of
December 31, 2018
, we had approximately
3.4 million
square feet of space under active development and approximately
2.1 million
square feet of space held for development. Turn-Key Flex® space is move-in-ready space for the placement of computer and network equipment required to provide a data center environment. Depending on demand for additional Turn-Key Flex® space, we expect to incur significant tenant improvement costs to build out and develop these types of spaces. At
December 31, 2018
, approximately
2.8 million
square feet was under construction for Turn-Key Flex®, colocation and Powered Base Building® products, all of which are expected to be income producing on or after completion, in
77
five
U.S. metropolitan areas,
four
European metropolitan areas,
one
Australian metropolitan areas,
one
Canadian metropolitan area and
one
Asian metropolitan area, consisting of approximately
1.7 million
square feet of base building construction and
1.1 million
square feet of data center construction. At
December 31, 2018
, we had open commitments, including amounts reimbursable of approximately
$13.4 million
, related to construction contracts of approximately
$401.4 million
.
We currently expect to incur approximately
$1.2 billion
to
$1.4 billion
of capital expenditures for our development programs during the year ending
December 31, 2019
, although this amount may increase or decrease, potentially materially, based on numerous factors, including changes in demand, leasing results and availability of debt or equity capital.
Historical Capital Expenditures
|
|
Year Ended December 31,
|
||||||
|
(in thousands)
|
2018
|
2017
|
|||||
|
Development projects
|
$
|
1,115,149
|
|
$
|
912,217
|
|
|
|
Enhancement and improvements
|
14,240
|
|
6,340
|
|
|||
|
Recurring capital expenditures
|
132,226
|
|
136,290
|
|
|||
|
Total capital expenditures (excluding indirect costs)
|
$
|
1,261,615
|
|
$
|
1,054,847
|
|
|
For the year ended
December 31, 2018
, total capital expenditures increased
$206.8 million
to approximately
$1.3 billion
from
$1.1 billion
for the same period in
2017
. Capital expenditures on our development projects plus our enhancement and improvements projects for the year ended
December 31, 2018
were approximately
$1.1 billion
, which reflects an increase of approximately
23%
from the same period in
2017
. This increase was primarily due to increased spending for ground-up development projects (including development projects acquired in the DFT Merger), Turn-Key Flex space development and base building improvements. Our development capital expenditures are generally funded by our available cash and equity and debt capital. See “—Future Uses of Cash” above for a discussion of the amount of capital expenditures we expect to incur during the year ending
December 31, 2019
.
We are also subject to the commitments discussed below under “Commitments and Contingencies,” “Off-Balance Sheet Arrangements” and “Distributions.”
We actively pursue opportunities for potential acquisitions, with due diligence and negotiations often at different stages at different times. The dollar value of acquisitions for the year ending
December 31, 2019
will be based on numerous factors, including customer demand, leasing results, availability of debt or equity capital and acquisition opportunities.
We may from time to time seek to retire or repurchase our outstanding debt or the equity of our Parent Company through cash purchases and/or exchanges for equity securities of our Parent Company in open market purchases, privately negotiated transactions or otherwise. Such repurchases or exchanges, if any, will depend on prevailing market conditions, our liquidity requirements, contractual restrictions or other factors. The amounts involved may be material.
We expect to meet our short-term and long-term liquidity requirements, including to pay for scheduled debt maturities and to fund acquisitions and non-recurring capital improvements, with net cash from operations, future long-term secured and unsecured indebtedness and the issuance of equity and debt securities and the proceeds of equity issuances by our Parent Company. We also may fund future short-term and long-term liquidity requirements, including acquisitions and non-recurring capital improvements, using our global revolving credit facility pending permanent financing. If we are not able to obtain additional financing on terms attractive to us, or at all, including as a result of the circumstances described above under “Factors Which May Influence Future Results of Operations—Global market and economic conditions”, we may be required to reduce our acquisition or capital expenditure plans, which could have a material adverse effect upon our business and results of operations.
Distributions
All distributions on our units are at the discretion of our Parent Company’s board of directors. In 2018, 2017 and 2016, our Operating Partnership declared the following distributions (in thousands):
78
|
Date distribution
declared |
Distribution payable date
|
Series C Preferred Units
|
Series E Preferred Units
|
Series F Preferred Units
|
Series G Preferred Units
|
Series H Preferred Units
|
Series I Preferred Units
|
Series J Preferred Units
|
Common
Units |
||||||||||||||||||||||||||
|
Feb 17, 2016
|
March 31, 2016
|
—
|
|
$
|
5,031
|
|
$
|
3,023
|
|
$
|
3,672
|
|
$
|
6,730
|
|
$
|
3,969
|
|
—
|
|
$
|
131,587
|
|
(1)
|
|||||||||||
|
May 11, 2016
|
June 30, 2016
|
—
|
|
5,031
|
|
3,023
|
|
3,672
|
|
6,730
|
|
3,969
|
|
—
|
|
131,607
|
|
(1)
|
|||||||||||||||||
|
Aug 10, 2016
|
September 30, 2016
|
—
|
|
—
|
|
(2)
|
3,023
|
|
3,672
|
|
6,730
|
|
3,969
|
|
—
|
|
131,657
|
|
(1)
|
||||||||||||||||
|
Nov 9, 2016
|
December 31, 2016 for
Preferred Units; January 13, 2017 for Common Units |
—
|
|
—
|
|
3,023
|
|
3,672
|
|
6,730
|
|
3,969
|
|
—
|
|
144,193
|
|
(1)
|
|||||||||||||||||
|
—
|
|
$
|
10,062
|
|
$
|
12,092
|
|
$
|
14,688
|
|
$
|
26,920
|
|
$
|
15,876
|
|
—
|
|
$
|
539,044
|
|
||||||||||||||
|
Mar 1, 2017
|
March 31, 2017
|
—
|
|
—
|
|
$
|
3,023
|
|
$
|
3,672
|
|
$
|
6,730
|
|
$
|
3,969
|
|
—
|
|
$
|
150,968
|
|
(3)
|
||||||||||||
|
May 8, 2017
|
June 30, 2017
|
—
|
|
—
|
|
—
|
|
(4)
|
3,672
|
|
6,730
|
|
3,969
|
|
—
|
|
153,176
|
|
(3)
|
||||||||||||||||
|
Aug 7, 2017
|
September 29, 2017
|
—
|
|
—
|
|
—
|
|
3,672
|
|
6,730
|
|
3,969
|
|
—
|
|
199,049
|
|
(3)
|
|||||||||||||||||
|
Nov 2, 2017
|
December 29, 2017 for
Preferred Units; January 12, 2018 for Common Units |
$
|
3,963
|
|
(5)
|
—
|
|
—
|
|
3,672
|
|
6,730
|
|
3,969
|
|
$
|
4,200
|
|
(5)
|
199,061
|
|
(3)
|
|||||||||||||
|
$
|
3,963
|
|
—
|
|
$
|
3,023
|
|
$
|
14,688
|
|
$
|
26,920
|
|
$
|
15,876
|
|
$
|
4,200
|
|
$
|
702,254
|
|
|||||||||||||
|
Mar 1, 2018
|
March 30, 2018
|
$
|
3,333
|
|
—
|
|
—
|
|
$
|
3,672
|
|
$
|
6,730
|
|
$
|
3,969
|
|
$
|
2,625
|
|
$
|
216,953
|
|
(6)
|
|||||||||||
|
May 8, 2018
|
June 29, 2018
|
3,333
|
|
—
|
|
—
|
|
3,672
|
|
6,730
|
|
3,969
|
|
2,625
|
|
216,789
|
|
(6)
|
|||||||||||||||||
|
Aug 14, 2018
|
September 28, 2018
|
3,333
|
|
—
|
|
—
|
|
3,672
|
|
6,730
|
|
3,969
|
|
2,625
|
|
216,825
|
|
(6)
|
|||||||||||||||||
|
Nov 12, 2018
|
December 31, 2018 for
Preferred Units; January 15, 2019 for Common Units |
3,333
|
|
—
|
|
—
|
|
3,672
|
|
6,730
|
|
3,969
|
|
2,625
|
|
216,838
|
|
(6)
|
|||||||||||||||||
|
$
|
13,332
|
|
—
|
|
—
|
|
$
|
14,688
|
|
$
|
26,920
|
|
$
|
15,876
|
|
$
|
10,500
|
|
$
|
867,405
|
|
||||||||||||||
|
Annual rate of distribution per unit
|
$
|
1.65625
|
|
$
|
1.75000
|
|
$
|
1.65625
|
|
$
|
1.46875
|
|
$
|
1.84375
|
|
$
|
1.58750
|
|
$
|
1.31250
|
|
||||||||||||||
|
(1)
|
$
3.520
annual rate of distribution per unit.
|
|
(2)
|
Redeemed on September 15, 2016 for
$25.35972
per unit, or a redemption price of
$25.00
per unit, plus accrued and unpaid distributions up to but not including the redemption date of approximately
$4.1 million
in the aggregate. In connection with the redemption, the previously incurred offering costs of approximately
$10.3 million
were recorded as a reduction to net income available to common unitholders.
|
|
(3)
|
$3.720
annual rate of distribution per unit.
|
|
(4)
|
Redeemed on April 5, 2017 for
$25.01840
per unit, or a redemption price of
$25.00
per unit, plus accrued and unpaid distributions up to but not including the redemption date of approximately
$0.1 million
in the aggregate. In connection with the redemption, the previously incurred offering costs of approximately
$6.3 million
were recorded as a reduction to net income available to common unitholders.
|
|
(5)
|
Represents a pro rata distribution from and including the original issue date to and including December 31, 2017.
|
|
(6)
|
$4.040
annual rate of distribution per unit.
|
As of
December 31, 2018
, we were a party to interest rate swap agreements which hedge variability in cash flows related the U.S. LIBOR and CDOR-based tranches of the unsecured term loans. Under these swaps, we pay variable-rate amounts in exchange for fixed-rate payments over the life of the agreements without exchange of the underlying principal amounts. See Item 7A. “Quantitative and Qualitative Disclosures about Market Risk.”
79
The following table summarizes our debt, interest, lease and construction contract payments due by period as of
December 31, 2018
(dollars in thousands):
|
Obligation
|
2019
|
2020-2021
|
2022-2023
|
Thereafter
|
Total
|
|||||||||||||||
|
Long-term debt principal payments
(1)
|
$
|
518,982
|
|
$
|
1,521,132
|
|
$
|
4,453,332
|
|
$
|
4,708,144
|
|
$
|
11,201,590
|
|
|||||
|
Interest payable
(2)
|
416,474
|
|
709,058
|
|
534,210
|
|
561,621
|
|
2,221,363
|
|
||||||||||
|
Operating leases
|
84,712
|
|
173,608
|
|
162,683
|
|
539,047
|
|
960,050
|
|
||||||||||
|
Construction contracts
(3)
|
401,410
|
|
—
|
|
—
|
|
—
|
|
401,410
|
|
||||||||||
|
$
|
1,421,578
|
|
$
|
2,403,798
|
|
$
|
5,150,225
|
|
$
|
5,808,812
|
|
$
|
14,784,413
|
|
||||||
|
(1)
|
Includes $1.7 billion of borrowings under our global revolving credit facilities and $0.8 billion of borrowings under our unsecured term loan and excludes $0.1 million of loan premiums related to assumed mortgage loans, $1.2 million discount on the 5.875% 2020 notes, $0.4 million discount on the 3.400% 2020 notes, $0.2 million discount on the 5.250% 2021 notes, $1.7 million discount on the 3.625% 2022 notes, $2.0 million discount on the 3.950% 2022 notes, $1.3 million on the 4.750% 2023 notes, $1.0 million on the 2.625% 2024 notes, $0.9 million on the 2.750% 2024 notes, $2.2 million on the 4.250% 2025 notes, $0.2 million on the 2.750% 2023 notes, $0.7 million on the 3.700% 2027 notes, $0.9 million on the 4.450% 2028 Notes, $2.7 million on the 3.300% 2029 notes and $4.4 million on the 3.750% 2030 Notes. All amounts exclude deferred financing costs.
|
|
(2)
|
Interest payable is based on the interest rate in effect on
December 31, 2018
, including the effect of interest rate swaps. Interest payable excluding the effect of interest rate swaps is as follows (in thousands):
|
|
2019
|
$
|
418,864
|
|
|
2020-2021
|
713,837
|
|
|
|
2022-2023
|
538,050
|
|
|
|
Thereafter
|
565,908
|
|
|
|
$
|
2,236,659
|
|
|
|
(3)
|
From time to time in the normal course of our business, we enter into various construction contracts with third parties that may obligate us to make payments. At
December 31, 2018
, we had open commitments, including amounts reimbursable of approximately
$13.4 million
, related to construction contracts of approximately
$401.4 million
.
|
80
Outstanding Consolidated Indebtedness
The table below summarizes our debt maturities and principal payments as of
December 31, 2018
(in thousands):
|
Global Revolving
Credit Facilities (1) |
Unsecured
Term Loans |
Senior Notes
|
Secured Debt
|
Total
Debt |
|||||||||||||||
|
2019
|
$
|
—
|
|
$
|
375,000
|
|
$
|
143,338
|
|
$
|
644
|
|
$
|
518,982
|
|
||||
|
2020
|
—
|
|
—
|
|
1,000,000
|
|
1,132
|
|
1,001,132
|
|
|||||||||
|
2021
|
—
|
|
—
|
|
400,000
|
|
120,000
|
|
520,000
|
|
|||||||||
|
2022
|
—
|
|
—
|
|
800,000
|
|
150,000
|
|
950,000
|
|
|||||||||
|
2023
|
1,528,592
|
|
808,120
|
|
732,620
|
|
434,000
|
|
3,503,332
|
|
|||||||||
|
Thereafter
|
134,564
|
|
—
|
|
4,573,580
|
|
—
|
|
4,708,144
|
|
|||||||||
|
Subtotal
|
$
|
1,663,156
|
|
$
|
1,183,120
|
|
$
|
7,649,538
|
|
$
|
705,776
|
|
$
|
11,201,590
|
|
||||
|
Unamortized discount
|
—
|
|
—
|
|
(19,859
|
)
|
—
|
|
(19,859
|
)
|
|||||||||
|
Unamortized premium
|
—
|
|
—
|
|
—
|
|
148
|
|
148
|
|
|||||||||
|
Total
|
$
|
1,663,156
|
|
$
|
1,183,120
|
|
$
|
7,629,679
|
|
$
|
705,924
|
|
$
|
11,181,879
|
|
||||
|
(1)
|
Subject to
two
six
-month extension options exercisable by us. The bank group is obligated to grant the extension options provided we give proper notice, we make certain representations and warranties and no default exists under the global revolving credit facility, as applicable.
|
The table below summarizes our debt, as of
December 31, 2018
(in millions):
|
Debt Summary:
|
|||
|
Fixed rate
|
$
|
7,487.4
|
|
|
Variable rate debt subject to interest rate swaps
|
783.1
|
|
|
|
Total fixed rate debt (including interest rate swaps)
|
8,270.5
|
|
|
|
Variable rate—unhedged
|
2,911.4
|
|
|
|
Total
|
$
|
11,181.9
|
|
|
Percent of Total Debt:
|
|||
|
Fixed rate (including hedged variable rate debt)
|
74.0
|
%
|
|
|
Variable rate
|
26.0
|
%
|
|
|
Total
|
100.0
|
%
|
|
|
|
|||
|
Weighted Average Interest Rate as of December 31, 2018 (1):
|
|||
|
Fixed rate (including hedged variable rate debt)
|
3.79
|
%
|
|
|
Variable rate
|
3.37
|
%
|
|
|
Total interest rate
|
3.68
|
%
|
|
|
(1)
|
Excludes impact of deferred financing cost amortization.
|
As of
December 31, 2018
, we had approximately $11.2 billion of outstanding consolidated long-term debt as set forth in the table above. Our ratio of debt to total enterprise value was approximately
31%
(based on the closing price of Digital Realty Trust, Inc.’s common stock on
December 31, 2018
of
$106.55
). For this purpose, our total enterprise value is defined as the sum of the market value of Digital Realty Trust, Inc.’s outstanding common stock (which may decrease, thereby increasing our debt to total enterprise value ratio), plus the liquidation value of Digital Realty Trust, Inc.’s preferred stock, plus the aggregate value of our Operating Partnership’s units not held by Digital Realty Trust, Inc. (with the per unit value equal to the market value of one share of Digital Realty Trust, Inc.’s common stock and excluding long-term incentive units, Class C units and Class D units), plus the book value of our total consolidated indebtedness.
The variable rate debt shown above bore interest at interest rates based on various one-month LIBOR, EURIBOR, GBP LIBOR, SOR, BBR, HIBOR, JPY LIBOR, CDOR and U.S. Prime rates, depending on the respective agreement governing the
81
debt, including our global revolving credit facility and unsecured term loans. As of
December 31, 2018
, our debt had a weighted average term to initial maturity of approximately 5.3 years (or approximately 5.5 years assuming exercise of extension options).
Off-Balance Sheet Arrangements
As of
December 31, 2018
, we were party to interest rate swap agreements related to
$783.1 million
of outstanding principal amount on our variable rate debt. See Item 7A. “Quantitative and Qualitative Disclosures about Market Risk.”
As of
December 31, 2018
, our pro-rata share of mortgage debt of unconsolidated joint ventures was approximately
$268.7 million
, of which
$10.2 million
is subject to interest rate swap agreements.
Cash Flows
The following summary discussion of our cash flows is based on the consolidated statements of cash flows and is not meant to be an all-inclusive discussion of the changes in our cash flows for the periods presented below.
Comparison of Year Ended
December 31, 2018
to Year Ended
December 31, 2017
and Comparison of Year Ended
December 31, 2017
to Year Ended
December 31, 2016
The following table shows cash flows and ending cash, cash equivalent and restricted cash balances for the years ended
December 31, 2018
,
2017
and
2016
(in thousands).
|
|
Year Ended December 31,
|
||||||||||
|
|
2018
|
2017
|
2016
|
||||||||
|
Net cash provided by operating activities
|
$
|
1,385,324
|
|
$
|
1,023,305
|
|
$
|
911,242
|
|
||
|
Net cash used in investing activities
|
(3,035,993
|
)
|
(1,357,153
|
)
|
(1,303,597
|
)
|
|||||
|
Net cash provided by financing activities
|
1,757,269
|
|
321,200
|
|
350,617
|
|
|||||
|
Net increase (decrease) in cash, cash equivalents and restricted cash
|
$
|
106,600
|
|
$
|
(12,648
|
)
|
$
|
(41,738
|
)
|
||
Cash provided by operating activities in 2018 increased approximately
$362.0 million
over 2017 and cash provided by operating activities in 2017 increased approximately $112.1 million over 2016. The 2018 increase was driven by year-over-year increase in the cash flow from properties acquired in the September 2017 DFT Merger. The increases in cash flow were offset by properties sold in 2017 and 2018 and an increase in interest expense. The 2017 increase was driven by year-over-year increase in the cash flow from properties acquired in the July 2016 European Portfolio Acquisition and the cash flow from properties acquired in the September 2017 DFT Merger. The increases in cash flow were offset by properties sold in 2016 and 2017 and an increase in interest expense.
Net cash used in investing activities consisted of the following amounts (in thousands).
|
Year Ended December 31,
|
|||||||||||
|
2018
|
2017
|
Change
|
|||||||||
|
Ascenty acquisition
|
$
|
(1,563,830
|
)
|
$
|
—
|
|
$
|
(1,563,830
|
)
|
||
|
Improvements to investments in real estate
|
(1,325,162
|
)
|
(1,150,619
|
)
|
(174,543
|
)
|
|||||
|
Acquisitions of real estate
|
(410,712
|
)
|
(415,764
|
)
|
5,052
|
|
|||||
|
Prepaid construction costs and other investments
|
(13,254
|
)
|
—
|
|
(13,254
|
)
|
|||||
|
Proceeds from sale of properties, net of sales costs
|
286,204
|
|
89,333
|
|
196,871
|
|
|||||
|
Distribution from debt proceeds from closing of joint venture
|
—
|
|
135,973
|
|
(135,973
|
)
|
|||||
|
Investment in unconsolidated joint ventures
|
(673
|
)
|
(93,405
|
)
|
92,732
|
|
|||||
|
Excess proceeds from forward contracts
|
—
|
|
63,956
|
|
(63,956
|
)
|
|||||
|
Other
|
(8,566
|
)
|
13,373
|
|
(21,939
|
)
|
|||||
|
Net cash used in investing activities
|
$
|
(3,035,993
|
)
|
$
|
(1,357,153
|
)
|
$
|
(1,678,840
|
)
|
||
82
|
Year Ended December 31,
|
|||||||||||
|
2017
|
2016
|
Change
|
|||||||||
|
Improvements to investments in real estate
|
$
|
(1,150,619
|
)
|
$
|
(758,081
|
)
|
(392,538
|
)
|
|||
|
Acquisitions of real estate
|
(415,764
|
)
|
(873,285
|
)
|
457,521
|
|
|||||
|
Prepaid construction costs and other investments
|
—
|
|
(32,095
|
)
|
32,095
|
|
|||||
|
Proceeds from sale of properties, net of sales costs
|
89,333
|
|
359,319
|
|
(269,986
|
)
|
|||||
|
Distribution from debt proceeds from closing of joint venture
|
135,973
|
|
—
|
|
135,973
|
|
|||||
|
Investment in unconsolidated joint ventures
|
(93,405
|
)
|
—
|
|
(93,405
|
)
|
|||||
|
Excess proceeds from forward contracts
|
63,956
|
|
—
|
|
63,956
|
|
|||||
|
Other
|
13,371
|
|
545
|
|
12,826
|
|
|||||
|
Net cash used in investing activities
|
$
|
(1,357,155
|
)
|
$
|
(1,303,597
|
)
|
$
|
(53,558
|
)
|
||
Net cash flows provided by financing activities for the Company consisted of the following amounts (in thousands).
|
|
Year Ended December 31,
|
||||||||||
|
|
2018
|
2017
|
2016
|
||||||||
|
Proceeds from borrowings, net of repayments
|
$
|
849,348
|
|
$
|
(1,448,867
|
)
|
$
|
(498,515
|
)
|
||
|
Net proceeds from issuance of common and preferred stock,
including equity plans
|
7,068
|
|
411,309
|
|
1,090,171
|
|
|||||
|
Redemption of preferred stock
|
—
|
|
(182,500
|
)
|
(287,500
|
)
|
|||||
|
Net proceeds from unsecured senior notes and secured debt
|
1,769,006
|
|
2,265,060
|
|
675,591
|
|
|||||
|
Dividend and distribution payments
|
(930,782
|
)
|
(715,209
|
)
|
(605,390
|
)
|
|||||
|
Capital contributions from (distributions to) noncontrolling
interests in consolidated joint ventures, net |
66,124
|
|
(8,593
|
)
|
(527
|
)
|
|||||
|
Other
|
(3,495
|
)
|
—
|
|
(23,213
|
)
|
|||||
|
Net cash provided by financing activities
|
$
|
1,757,269
|
|
$
|
321,200
|
|
$
|
350,617
|
|
||
The increase in cash provided by financing activities was due to proceeds from borrowings, net of repayments increasing during the year ended
December 31, 2018
as compared to 2017 offset by higher proceeds in 2017 from the issuance of the 2019 Notes, 2.750% 2024 Notes, 2029 Notes, 2.750% 2023 Notes and 2027 Notes as compared to the proceeds in 2018 from the issuance of the 2028 Notes and 2030 Notes. The increase in dividend and distribution payments for the year ended
December 31, 2018
as compared to 2017, which was a result of an increase in the number of shares outstanding due to the DFT Merger and increased dividend amount per share of common stock in 2018 as compared to 2017. The 2018 borrowing activity was used in part to fund a portion of the Ascenty Acquisition.
Net cash provided by financing activities decreased by $29.4 million in 2017 primarily as a result of an increase in net proceeds from the issuance of unsecured senior notes in 2017 as compared to 2016, offset by increased repayments of borrowings on the global revolving credit facility, a decrease in net equity issuances and an increase in dividends and distributions paid in 2017 as compared to 2016. The increase in dividend and distribution payments for the year ended December 31, 2017 as compared to the same period in 2016 was due to an increase in the number of shares outstanding and dividend amount per share of common stock in 2017 as compared to 2016 and the payment of dividends on our series J preferred stock during the year ended December 31, 2017, whereas this series of preferred stock was not outstanding in year ended December 31, 2016. The 2017 borrowing activity was used to fund a portion of the repayment, redemption and/or discharge of DFT debt and the payment of certain transaction fees and expenses incurred in connection with the DFT Merger. The 2016 equity issuance was driven primarily by the European Portfolio Acquisition.
83
Net cash flows provided by financing activities for the Operating Partnership consisted of the following amounts (in thousands).
|
|
Year Ended December 31,
|
||||||||||
|
|
2018
|
2017
|
2016
|
||||||||
|
Proceeds from borrowings, net of repayments
|
$
|
849,348
|
|
$
|
(1,448,867
|
)
|
$
|
(498,515
|
)
|
||
|
General partner contributions, net
|
7,068
|
|
228,809
|
|
802,671
|
|
|||||
|
Net proceeds from unsecured senior notes
|
1,769,006
|
|
2,265,060
|
|
675,591
|
|
|||||
|
Distribution payments
|
(930,782
|
)
|
(715,209
|
)
|
(605,390
|
)
|
|||||
|
Capital contributions from (distributions to) noncontrolling
interests in consolidated joint ventures, net |
66,124
|
|
(8,593
|
)
|
(527
|
)
|
|||||
|
Other
|
(3,495
|
)
|
—
|
|
(23,213
|
)
|
|||||
|
Net cash provided by financing activities
|
$
|
1,757,269
|
|
$
|
321,200
|
|
$
|
350,617
|
|
||
The increase in cash provided by financing activities was due to proceeds from borrowings, net of repayments increasing during the year ended
December 31, 2018
as compared to 2017 offset by higher proceeds in 2017 from the issuance of the 2019 Notes, 2.750% 2024 Notes, 2029 Notes, 2.750% 2023 Notes and 2027 Notes as compared to the proceeds in 2018 from the issuance of the 2028 Notes and 2030 Notes. The increase in distribution payments for the year ended
December 31, 2018
as compared to 2017, which was a result of an increase in the number of common units outstanding due to the DFT Merger and increased distribution amount per common unit in 2018 as compared to 2017. The 2018 borrowing activity was used in part to fund a portion of the Ascenty Acquisition.
Net cash provided by financing activities decreased by $29.4 million in 2017 primarily as a result of an increase in net proceeds from the issuance of unsecured senior notes in 2017 as compared to 2016, offset by increased repayments of borrowings on the global revolving credit facility, a decrease in net equity issuances and an increase in distributions paid in 2017 as compared to 2016. The increase in distribution payments for the year ended December 31, 2017 as compared to the same period in 2016 was due to an increase in the number of units outstanding and distribution amount per common unit in 2017 as compared to 2016 and the payment of distributions on our series J preferred units during the year ended December 31, 2017, whereas this series of preferred units was not outstanding in year ended December 31, 2016. The 2017 borrowing activity was used to fund a portion of the repayment, redemption and/or discharge of DFT debt and the payment of certain transaction fees and expenses incurred in connection with the DFT Merger. The 2016 equity issuance was driven primarily by the European Portfolio Acquisition.
Noncontrolling Interests in Operating Partnership
Noncontrolling interests relate to the common units in our Operating Partnership that are not owned by Digital Realty Trust, Inc., which, as of
December 31, 2018
, amounted to
4.9%
of our Operating Partnership common units. Historically, our Operating Partnership has issued common units to third party sellers in connection with our acquisition of real estate interests from such third parties.
Limited partners have the right to require our Operating Partnership to redeem part or all of their common units for cash based upon the fair market value of an equivalent number of shares of Digital Realty Trust, Inc. common stock at the time of the redemption. Alternatively, we may elect to acquire those common units in exchange for shares of Digital Realty Trust, Inc. common stock on a one-for-one basis, subject to adjustment in the event of stock splits, stock dividends, issuance of stock rights, specified extraordinary distributions and similar events. In connection with the DFT Merger, approximately 0.2 million common units of the Operating Partnership were issued to certain former unitholders in DuPont Fabros Technology, L.P., which are subject to certain restrictions and, accordingly, are not presented as permanent capital in the consolidated balance sheet.
Inflation
Many of our leases provide for separate real estate tax and operating expense escalations. In addition, many of the leases provide for fixed base rent increases. We believe that inflationary increases may be at least partially offset by the contractual rent increases and expense escalations described above.
84
Funds From Operations
We calculate funds from operations, or FFO, in accordance with the standards established by the National Association of Real Estate Investment Trusts, or Nareit. FFO represents net income (loss) (computed in accordance with GAAP), excluding gains (or losses) from sales of property, excluding a gain from a pre-existing relationship and after adjustments for impairment charges, real estate related depreciation and amortization (excluding amortization of deferred financing costs), non-controlling interests in operating partnership, unconsolidated partnerships and joint ventures. Management uses FFO as a supplemental performance measure because, in excluding real estate related depreciation and amortization, gains and losses from property dispositions and certain other gains and after adjustments for unconsolidated partnerships, joint ventures and certain other items, it provides a performance measure that, when compared year over year, captures trends in occupancy rates, rental rates and operating costs. We also believe that, as a widely recognized measure of the performance of REITs, FFO will be used by investors as a basis to compare our operating performance with that of other REITs. However, because FFO excludes depreciation and amortization and captures neither the changes in the value of our data centers that result from use or market conditions, nor the level of capital expenditures and capitalized leasing commissions necessary to maintain the operating performance of our data centers, all of which have real economic effect and could materially impact our financial condition and results from operations, the utility of FFO as a measure of our performance is limited. Other REITs may not calculate FFO in accordance with the Nareit definition and, accordingly, our FFO may not be comparable to other REITs’ FFO. FFO should be considered only as a supplement to net income computed in accordance with GAAP as a measure of our performance.
85
Reconciliation of Net Income Available to Common Stockholders to Funds From Operations (FFO)
(in thousands, except per share and unit data)
(unaudited)
|
|
Year Ended December 31,
|
||||||||||
|
|
2018
|
2017
|
2016
|
||||||||
|
Net income available to common stockholders
|
$
|
249,930
|
|
$
|
173,148
|
|
$
|
332,088
|
|
||
|
Adjustments:
|
|||||||||||
|
Noncontrolling interests in operating partnership
|
10,180
|
|
3,770
|
|
5,298
|
|
|||||
|
Real estate related depreciation and amortization (1)
|
1,173,917
|
|
830,252
|
|
682,810
|
|
|||||
|
Real estate related depreciation and amortization related to investment in unconsolidated joint ventures
|
14,587
|
|
11,566
|
|
11,246
|
|
|||||
|
Impairment of investments in real estate
|
—
|
|
28,992
|
|
—
|
|
|||||
|
Impairment charge on Telx trade name
|
—
|
|
—
|
|
6,122
|
|
|||||
|
Gain on sale of properties
|
(80,049
|
)
|
(40,354
|
)
|
(169,902
|
)
|
|||||
|
Noncontrolling interests share of gain on sale of property
|
—
|
|
3,900
|
|
—
|
|
|||||
|
FFO available to common stockholders and unitholders (2)
|
$
|
1,368,565
|
|
$
|
1,011,274
|
|
$
|
867,662
|
|
||
|
Basic FFO per share and unit
|
$
|
6.39
|
|
$
|
5.68
|
|
$
|
5.69
|
|
||
|
Diluted FFO per share and unit (2)
|
$
|
6.37
|
|
$
|
5.65
|
|
$
|
5.67
|
|
||
|
Weighted average common stock and units outstanding
|
|||||||||||
|
Basic
|
214,313
|
|
178,056
|
|
152,360
|
|
|||||
|
Diluted (2)
|
214,951
|
|
178,892
|
|
153,086
|
|
|||||
|
(1) Real estate related depreciation and amortization was computed as follows:
|
|||||||||||
|
Depreciation and amortization per income statement
|
1,186,896
|
|
842,464
|
|
699,324
|
|
|||||
|
Impairment charge on Telx trade name
|
—
|
|
—
|
|
(6,122
|
)
|
|||||
|
Non-real estate depreciation
|
(12,979
|
)
|
(12,212
|
)
|
(10,392
|
)
|
|||||
|
Real estate related depreciation and amortization
|
$
|
1,173,917
|
|
$
|
830,252
|
|
$
|
682,810
|
|
||
|
(2)
|
For all periods presented, we have excluded the effect of dilutive series C, series E, series F, series G, series H, series I and series J preferred stock, as applicable, that may be converted upon the occurrence of specified change in control transactions as described in the articles supplementary governing the series C, series E, series F, series G, series H, series I and series J preferred stock, as applicable, which we consider highly improbable.
|
|
|
Year Ended December 31,
|
|||||||
|
|
2018
|
2017
|
2016
|
|||||
|
Weighted average common stock and units outstanding
|
214,313
|
|
178,056
|
|
152,360
|
|
||
|
Add: Effect of dilutive securities
|
638
|
|
836
|
|
726
|
|
||
|
Weighted average common stock and units outstanding—diluted
|
214,951
|
|
178,892
|
|
153,086
|
|
||
86
ITEM 7A. QUANTITATIVE AND QUALITATIVE DISCLOSURES ABOUT MARKET RISK
Our future income, cash flows and fair values relevant to financial instruments depend upon prevalent market interest rates. Market risk refers to the risk of loss from adverse changes in market prices and interest rates. We do not use derivatives for trading or speculative purposes and only enter into contracts with major financial institutions based on their credit ratings and other factors.
Analysis of Debt between Fixed and Variable Rate
We use interest rate swap agreements and fixed rate debt to reduce our exposure to interest rate movements. As of
December 31, 2018
, our consolidated debt was as follows (in millions):
|
Carrying Value
|
Estimated Fair
Value |
||||||
|
Fixed rate debt
|
$
|
7,487.4
|
|
$
|
7,542.2
|
|
|
|
Variable rate debt subject to interest rate swaps
|
783.1
|
|
783.1
|
|
|||
|
Total fixed rate debt (including interest rate swaps)
|
8,270.5
|
|
8,325.3
|
|
|||
|
Variable rate debt
|
2,911.4
|
|
2,911.4
|
|
|||
|
Total outstanding debt
|
$
|
11,181.9
|
|
$
|
11,236.7
|
|
|
Interest rate derivatives and their fair values as of
December 31, 2018
and
December 31, 2017
were as follows (in thousands):
|
Notional Amount
|
|
|
|
|
Fair Value at Significant Other
Observable Inputs (Level 2) |
||||||||||||||||||
|
As of
December 31, 2018 |
As of
December 31, 2017 |
Type of
Derivative |
Strike
Rate |
Effective Date
|
Expiration
Date |
As of
December 31, 2018 |
As of
December 31, 2017 |
||||||||||||||||
|
Currently-paying contracts
|
|||||||||||||||||||||||
|
$
|
206,000
|
|
(1)
|
$
|
206,000
|
|
Swap
|
1.611
|
|
Jun 15, 2017
|
Jan 15, 2020
|
$
|
1,976
|
|
$
|
1,409
|
|
||||||
|
54,905
|
|
(1)
|
54,905
|
|
Swap
|
1.605
|
|
Jun 6, 2017
|
Jan 6, 2020
|
517
|
|
374
|
|
||||||||||
|
75,000
|
|
(1)
|
75,000
|
|
(1)
|
Swap
|
1.016
|
|
Apr 6, 2016
|
Jan 6, 2021
|
2,169
|
|
2,260
|
|
|||||||||
|
75,000
|
|
(1)
|
75,000
|
|
(1)
|
Swap
|
1.164
|
|
Jan 15, 2016
|
Jan 15, 2021
|
1,970
|
|
1,947
|
|
|||||||||
|
300,000
|
|
(1)
|
300,000
|
|
(1)
|
Swap
|
1.435
|
|
Jan 15, 2016
|
Jan 15, 2023
|
11,463
|
|
9,978
|
|
|||||||||
|
—
|
|
229,012
|
|
(2)
|
Swap
|
0.792
|
|
Jan 15, 2016
|
Jan 15, 2019
|
—
|
|
(430
|
)
|
||||||||||
|
72,220
|
|
(3)
|
78,357
|
|
(3)
|
Swap
|
0.779
|
|
Jan 15, 2016
|
Jan 15, 2021
|
2,024
|
|
3,034
|
|
|||||||||
|
$
|
783,125
|
|
$
|
1,018,274
|
|
$
|
20,119
|
|
$
|
18,572
|
|
||||||||||||
|
(1)
|
Represents debt which bears interest based on one-month U.S. LIBOR.
|
|
(2)
|
Represents debt which bears interest based on one-month GBP LIBOR. Translation to U.S. dollars is based on exchange rate of
$1.35
to
£1.00
as of
December 31, 2017
.
|
|
(3)
|
Represents debt which bears interest based on one-month CDOR. Translation to U.S. dollars is based on exchange rates of
$0.73
to
1.00
CAD as of
December 31, 2018
and
$0.80
to
1.00
CAD as of
December 31, 2017
.
|
87
Sensitivity to Changes in Interest Rates
The following table shows the effects if assumed changes in interest rates occurred, based on fair values and interest expense as of
December 31, 2018
:
|
Assumed event
|
Change
($ millions) |
|||
|
Increase in fair value of interest rate swaps following an assumed 10% increase in interest rates
|
$
|
4.3
|
|
|
|
Decrease in fair value of interest rate swaps following an assumed 10% decrease in interest rates
|
(4.3
|
)
|
||
|
Increase in annual interest expense on our debt that is variable rate and not subject to swapped interest following a 10% increase in interest rates
|
7.0
|
|
||
|
Decrease in annual interest expense on our debt that is variable rate and not subject to swapped interest following a 10% decrease in interest rates
|
(7.0
|
)
|
||
|
Increase in fair value of fixed rate debt following a 10% decrease in interest rates
|
97.8
|
|
||
|
Decrease in fair value of fixed rate debt following a 10% increase in interest rates
|
(90.7
|
)
|
||
Interest risk amounts were determined by considering the impact of hypothetical interest rates on our financial instruments. These analyses do not consider the effect of any change in overall economic activity that could occur in that environment. Further, in the event of a change of that magnitude, we may take actions to further mitigate our exposure to the change. However, due to the uncertainty of the specific actions that would be taken and their possible effects, these analyses assume no changes in our financial structure.
Foreign Currency Exchange Risk
For the years ended
December 31, 2018
,
2017
and
2016
, we had foreign operations in the United Kingdom, Ireland, France, Germany, the Netherlands, Switzerland, Canada, Singapore, Australia, Japan and Hong Kong as well as Brazil in the year ended
December 31, 2018
. As such, we are subject to risk from the effects of exchange rate movements of foreign currencies, which may affect future costs and cash flows. Our foreign operations are conducted in the British pound sterling, Euro, Australian dollar, Singapore dollar, Canadian dollar, Hong Kong dollar, Brazilian real and the Japanese yen. Our primary currency exposures are to the British pound sterling, Euro and the Singapore dollar. We attempt to mitigate a portion of the risk of currency fluctuation by financing our investments in the local currency denominations and we may also hedge well-defined transactional exposures with foreign currency forwards or options, although there can be no assurances that these will be effective. As a result, changes in the relation of any such foreign currency to U.S. dollars may affect our revenues, operating margins and distributions and may also affect the book value of our assets and the amount of stockholders’ equity. For the years ended
December 31, 2018
,
2017
and
2016
, operating revenues from properties outside the United States contributed
$564.4 million
,
$515.2 million
and
$442.9 million
, respectively, which represented
18.5%
,
21.0%
and
21.0%
of our operating revenues, respectively. Net investment in properties outside the United States was
$3.8 billion
and
$3.1 billion
as of
December 31, 2018
and
December 31, 2017
, respectively. Net assets in foreign operations were approximately $0.2 billion and $0.3 billion as of
December 31, 2018
and
December 31, 2017
, respectively.
Other
Certain operating costs incurred by us, such as electricity, are subject to price fluctuations caused by the volatility of underlying commodity prices. In 2018, we entered into power purchase agreements to secure the renewable energy attributes from a solar farm in North Carolina to support the renewable energy needs of a customer in Virginia. In 2017, we entered into power purchase agreements to secure the renewable energy attributes from a wind farm in Illinois and a solar farm in North Carolina. In 2016, we entered into a power purchase agreement to secure the renewable energy attributes from a wind farm in Texas.
88
ITEM 8. FINANCIAL STATEMENTS AND SUPPLEMENTARY DATA
INDEX TO THE CONSOLIDATED FINANCIAL STATEMENTS
|
|
Page No.
|
|
|
|
||
|
|
||
|
Consolidated Financial Statements of Digital Realty Trust, Inc.
|
||
|
|
||
|
|
||
|
|
||
|
|
||
|
|
||
|
Consolidated Financial Statements of Digital Realty Trust, L.P.
|
||
|
|
||
|
|
||
|
|
||
|
|
||
|
|
||
|
Consolidated Financial Statements of Digital Realty Trust, Inc. and Digital Realty Trust, L.P.
|
||
|
|
||
|
|
||
|
Notes to Schedule III—Properties and Accumulated Depreciation
|
178
|
|
89
Management’s Report on Internal Control over Financial Reporting
The management of Digital Realty Trust, Inc. (the Company) is responsible for establishing and maintaining adequate internal control over financial reporting, as such term is defined in Exchange Act Rules 13a-15(f) and 15(d)-15(f). Our internal control system was designed to provide reasonable assurance to the Company’s management and board of directors regarding the preparation and fair presentation of published financial statements.
All internal control systems, no matter how well designed, have inherent limitations. Therefore, even those systems determined to be effective can provide only reasonable assurance with respect to financial statement preparation and presentation.
Under the supervision and with the participation of management, including our Chief Executive Officer and Chief Financial Officer, we assessed the effectiveness of the Company’s internal control over financial reporting as of
December 31, 2018
. In making this assessment, we used the criteria set forth by the Committee of Sponsoring Organizations of the Treadway Commission in
Internal Control—Integrated Framework (2013)
. We acquired Ascenty on December 20, 2018. We have excluded from our overall assessment of the Company's internal control over financial reporting as of
December 31, 2018
, internal control over financial reporting associated with Ascenty's total assets of $2.0 billion and total revenues of $3 million. Based on our assessment, management concluded that as of
December 31, 2018
, the Company’s internal control over financial reporting was effective based on those criteria.
Our independent registered public accounting firm has issued an audit report on the Company’s internal control over financial reporting. This report appears on pages 91 and 92.
90
Management’s Report on Internal Control over Financial Reporting
The management of Digital Realty Trust, L.P. (the Operating Partnership) is responsible for establishing and maintaining adequate internal control over financial reporting, as such term is defined in Exchange Act Rules 13a-15(f) and 15(d)-15(f). Our internal control system was designed to provide reasonable assurance to the Operating Partnership’s management regarding the preparation and fair presentation of published financial statements.
All internal control systems, no matter how well designed, have inherent limitations. Therefore, even those systems determined to be effective can provide only reasonable assurance with respect to financial statement preparation and presentation.
Under the supervision and with the participation of management, including the Chief Executive Officer and Chief Financial Officer of our general partner, we assessed the effectiveness of the Operating Partnership’s internal control over financial reporting as of
December 31, 2018
. In making this assessment, we used the criteria set forth by the Committee of Sponsoring Organizations of the Treadway Commission in
Internal Control—Integrated Framework (2013)
. We acquired Ascenty on December 20, 2018. We have excluded from our overall assessment of the Operating Partnership's internal control over financial reporting as of
December 31, 2018
, internal control over financial reporting associated with Ascenty's total assets of $2.0 billion and total revenues of $3 million. Based on our assessment, management concluded that as of
December 31, 2018
, the Operating Partnership’s internal control over financial reporting was effective based on those criteria.
91
Report of Independent Registered Public Accounting Firm
To the Stockholders and Board of Directors
Digital Realty Trust, Inc.:
Opinion on the Consolidated Financial Statements
We have audited the accompanying consolidated balance sheets of Digital Realty Trust, Inc. and subsidiaries (the Company) as of December 31, 2018 and 2017, the related consolidated income statements and consolidated statements of comprehensive income, equity, and cash flows for each of the years in the three‑year period ended December 31, 2018, and the related notes and financial statement schedule III, properties and accumulated depreciation, (collectively, the consolidated financial statements). In our opinion, the consolidated financial statements present fairly, in all material respects, the financial position of the Company as of December 31, 2018 and 2017, and the results of its operations and its cash flows for each of the years in the three‑year period ended December 31, 2018, in conformity with U.S. generally accepted accounting principles.
We also have audited, in accordance with the standards of the Public Company Accounting Oversight Board (United States) (PCAOB), the Company’s internal control over financial reporting as of December 31, 2018, based on the criteria established in
Internal Control - Integrated Framework (2013)
issued by the Committee of Sponsoring Organizations of the Treadway Commission, and our report dated February 25, 2019 expressed an unqualified opinion on the effectiveness of the Company’s internal control over financial reporting.
Basis for Opinion
These consolidated financial statements are the responsibility of the Company’s management. Our responsibility is to express an opinion on these consolidated financial statements based on our audits. We are a public accounting firm registered with the PCAOB and are required to be independent with respect to the Company in accordance with the U.S. federal securities laws and the applicable rules and regulations of the Securities and Exchange Commission and the PCAOB.
We conducted our audits in accordance with the standards of the PCAOB. Those standards require that we plan and perform the audit to obtain reasonable assurance about whether the consolidated financial statements are free of material misstatement, whether due to error or fraud. Our audits included performing procedures to assess the risks of material misstatement of the consolidated financial statements, whether due to error or fraud, and performing procedures that respond to those risks. Such procedures included examining, on a test basis, evidence regarding the amounts and disclosures in the consolidated financial statements. Our audits also included evaluating the accounting principles used and significant estimates made by management, as well as evaluating the overall presentation of the consolidated financial statements. We believe that our audits provide a reasonable basis for our opinion.
|
/s/ KPMG LLP
|
||
|
We have served as the Company’s auditor since 2004.
|
||
|
San Francisco, California
|
||
|
February 25, 2019
|
||
92
Report of Independent Registered Public Accounting Firm
To the Stockholders and Board of Directors
Digital Realty Trust, Inc.:
Opinion on Internal Control Over Financial Reporting
We have audited Digital Realty Trust, Inc. and subsidiaries’ (the Company) internal control over financial reporting as of December 31, 2018, based on criteria established in
Internal Control - Integrated Framework (2013)
issued by the Committee of Sponsoring Organizations of the Treadway Commission. In our opinion, the Company maintained, in all material respects, effective internal control over financial reporting as of December 31, 2018, based on criteria established in
Internal Control - Integrated Framework (2013)
issued by the Committee of Sponsoring Organizations of the Treadway Commission.
We also have audited, in accordance with the standards of the Public Company Accounting Oversight Board (United States) (PCAOB), the consolidated balance sheets of the Company as of December 31, 2018 and 2017, the related consolidated income statements and statements of comprehensive income, equity, and cash flows for each of the years in the three-year period ended December 31, 2018, and the related notes and financial statement schedules III, properties and accumulated depreciation, (collectively, the consolidated financial statements), and our report dated February 25, 2019 expressed an unqualified opinion on those consolidated financial statements.
The Company acquired Ascenty on December 20, 2018, and management excluded from its assessment of the effectiveness of the Company’s internal control over financial reporting as of December 31, 2018, Ascenty's internal control over financial reporting associated with total assets of approximately $2 billion and total revenues of $3 million included in the consolidated financial statements of the Company as of and for the year-ended December 31, 2018. Our audit of internal control over financial reporting of the Company also excluded an evaluation of Ascenty's internal control over financial reporting.
Basis for Opinion
The Company’s management is responsible for maintaining effective internal control over financial reporting and for its assessment of the effectiveness of internal control over financial reporting, included in the accompanying
Management’s Report on
Internal Control over Financial Reporting
. Our responsibility is to express an opinion on the Company’s internal control over financial reporting based on our audit. We are a public accounting firm registered with the PCAOB and are required to be independent with respect to the Company in accordance with the U.S. federal securities laws and the applicable rules and regulations of the Securities and Exchange Commission and the PCAOB.
We conducted our audit in accordance with the standards of the PCAOB. Those standards require that we plan and perform the audit to obtain reasonable assurance about whether effective internal control over financial reporting was maintained in all material respects. Our audit of internal control over financial reporting included obtaining an understanding of internal control over financial reporting, assessing the risk that a material weakness exists, and testing and evaluating the design and operating effectiveness of internal control based on the assessed risk. Our audit also included performing such other procedures as we considered necessary in the circumstances. We believe that our audit provides a reasonable basis for our opinion.
93
Definition and Limitations of Internal Control Over Financial Reporting
A company’s internal control over financial reporting is a process designed to provide reasonable assurance regarding the reliability of financial reporting and the preparation of financial statements for external purposes in accordance with generally accepted accounting principles. A company’s internal control over financial reporting includes those policies and procedures that (1) pertain to the maintenance of records that, in reasonable detail, accurately and fairly reflect the transactions and dispositions of the assets of the company; (2) provide reasonable assurance that transactions are recorded as necessary to permit preparation of financial statements in accordance with generally accepted accounting principles, and that receipts and expenditures of the company are being made only in accordance with authorizations of management and directors of the company; and (3) provide reasonable assurance regarding prevention or timely detection of unauthorized acquisition, use, or disposition of the company’s assets that could have a material effect on the financial statements.
Because of its inherent limitations, internal control over financial reporting may not prevent or detect misstatements. Also, projections of any evaluation of effectiveness to future periods are subject to the risk that controls may become inadequate because of changes in conditions, or that the degree of compliance with the policies or procedures may deteriorate.
|
/s/ KPMG LLP
|
||
|
San Francisco, California
|
||
|
February 25, 2019
|
||
94
Report of Independent Registered Public Accounting Firm
To the Stockholders and Board of Directors of the General Partner and Partners
Digital Realty Trust, L.P.:
Opinion on the Consolidated Financial Statements
We have audited the accompanying consolidated balance sheets of Digital Realty Trust, L.P. and subsidiaries (the Company) as of December 31, 2018 and 2017, the related consolidated income statements and consolidated statements of comprehensive income, capital, and cash flows for each of the years in the three‑year period ended December 31, 2018, and the related notes and financial statement schedule III, properties and accumulated depreciation (collectively, the consolidated financial statements). In our opinion, the consolidated financial statements present fairly, in all material respects, the financial position of the Company as of December 31, 2018 and 2017, and the results of its operations and its cash flows for each of the years in the three‑year period ended December 31, 2018, in conformity with U.S. generally accepted accounting principles.
Basis for Opinion
These consolidated financial statements are the responsibility of the Company’s management. Our responsibility is to express an opinion on these consolidated financial statements based on our audits. We are a public accounting firm registered with the Public Company Accounting Oversight Board (United States) (PCAOB) and are required to be independent with respect to the Company in accordance with the U.S. federal securities laws and the applicable rules and regulations of the Securities and Exchange Commission and the PCAOB.
We conducted our audits in accordance with the standards of the PCAOB. Those standards require that we plan and perform the audit to obtain reasonable assurance about whether the consolidated financial statements are free of material misstatement, whether due to error or fraud. The Company is not required to have, nor were we engaged to perform, an audit of its internal control over financial reporting. As part of our audits, we are required to obtain an understanding of internal control over financial reporting but not for the purpose of expressing an opinion on the effectiveness of the Company’s internal control over financial reporting. Accordingly, we express no such opinion.
Our audits included performing procedures to assess the risks of material misstatement of the consolidated financial statements, whether due to error or fraud, and performing procedures that respond to those risks. Such procedures included examining, on a test basis, evidence regarding the amounts and disclosures in the consolidated financial statements. Our audits also included evaluating the accounting principles used and significant estimates made by management, as well as evaluating the overall presentation of the consolidated financial statements. We believe that our audits provide a reasonable basis for our opinion.
|
/s/ KPMG LLP
|
||
|
We have served as the Company’s auditor since 2004.
|
||
|
San Francisco, California
|
||
|
February 25, 2019
|
||
95
DIGITAL REALTY TRUST, INC. AND SUBSIDIARIES
CONSOLIDATED BALANCE SHEETS
(in thousands, except share and per share data)
|
December 31, 2018
|
December 31, 2017
|
||||||
|
ASSETS
|
|||||||
|
Investments in real estate:
|
|||||||
|
Properties:
|
|||||||
|
Land
|
$
|
1,509,764
|
|
$
|
1,136,341
|
|
|
|
Acquired ground leases
|
10,575
|
|
11,150
|
|
|||
|
Buildings and improvements
|
16,745,210
|
|
15,215,405
|
|
|||
|
Tenant improvements
|
574,336
|
|
553,040
|
|
|||
|
Total investments in properties
|
18,839,885
|
|
16,915,936
|
|
|||
|
Accumulated depreciation and amortization
|
(3,935,267
|
)
|
(3,238,227
|
)
|
|||
|
Net investments in properties
|
14,904,618
|
|
13,677,709
|
|
|||
|
Investments in unconsolidated joint ventures
|
175,108
|
|
163,477
|
|
|||
|
Net investments in real estate
|
15,079,726
|
|
13,841,186
|
|
|||
|
Cash and cash equivalents
|
126,700
|
|
51
|
|
|||
|
Accounts and other receivables, net of allowance for doubtful accounts of $11,554
and $6,737 as of December 31, 2018 and December 31, 2017, respectively |
299,621
|
|
276,347
|
|
|||
|
Deferred rent
|
463,248
|
|
430,026
|
|
|||
|
Acquired above-market leases, net of accumulated amortization of $158,037 and $110,139
as of December 31, 2018 and December 31, 2017, respectively |
119,759
|
|
184,375
|
|
|||
|
Goodwill
|
4,348,007
|
|
3,389,595
|
|
|||
|
Acquired in-place lease value, deferred leasing costs and intangibles,
net of accumulated amortization of $1,355,013 and $1,016,989 as of December 31, 2018 and December 31, 2017, respectively |
3,144,395
|
|
2,998,806
|
|
|||
|
Restricted cash
|
8,522
|
|
13,130
|
|
|||
|
Assets held for sale
|
—
|
|
139,538
|
|
|||
|
Other assets
|
176,717
|
|
131,291
|
|
|||
|
Total assets
|
$
|
23,766,695
|
|
$
|
21,404,345
|
|
|
|
LIABILITIES AND EQUITY
|
|||||||
|
Global revolving credit facilities
|
$
|
1,647,735
|
|
$
|
550,946
|
|
|
|
Unsecured term loan
|
1,178,904
|
|
1,420,333
|
|
|||
|
Unsecured senior notes, net of discount
|
7,589,126
|
|
6,570,757
|
|
|||
|
Secured debt, including premiums
|
685,714
|
|
106,582
|
|
|||
|
Accounts payable and other accrued liabilities
|
1,164,509
|
|
980,218
|
|
|||
|
Accrued dividends and distributions
|
217,241
|
|
199,761
|
|
|||
|
Acquired below-market leases, net of accumulated amortization of $242,422 and $219,654
as of December 31, 2018 and December 31, 2017, respectively |
200,113
|
|
249,465
|
|
|||
|
Security deposits and prepaid rents
|
209,311
|
|
217,898
|
|
|||
|
Obligations associated with assets held for sale
|
—
|
|
5,033
|
|
|||
|
Total liabilities
|
12,892,653
|
|
10,300,993
|
|
|||
96
DIGITAL REALTY TRUST, INC. AND SUBSIDIARIES
CONSOLIDATED BALANCE SHEETS (continued)
(in thousands, except share and per share data)
|
December 31,
2018 |
December 31,
2017 |
||||||
|
Redeemable noncontrolling interests – operating partnership
|
15,832
|
|
53,902
|
|
|||
|
Commitments and contingencies
|
|
|
|||||
|
Stockholders’ Equity:
|
|||||||
|
Preferred Stock: $0.01 par value per share, 110,000,000 shares authorized, 50,650,000 shares issued and outstanding as of December 31, 2018 and December 31, 2017
|
1,249,560
|
|
1,249,560
|
|
|||
|
Common Stock: $0.01 par value, 315,000,000 shares authorized; 206,425,656 and
205,470,300 shares issued and outstanding as of December 31, 2018 and December 31, 2017, respectively |
2,051
|
|
2,044
|
|
|||
|
Additional paid-in capital
|
11,355,751
|
|
11,261,461
|
|
|||
|
Accumulated dividends in excess of earnings
|
(2,633,071
|
)
|
(2,055,552
|
)
|
|||
|
Accumulated other comprehensive loss, net
|
(115,647
|
)
|
(108,432
|
)
|
|||
|
Total stockholders’ equity
|
9,858,644
|
|
10,349,081
|
|
|||
|
Noncontrolling interests:
|
|||||||
|
Noncontrolling interests in operating partnership
|
906,510
|
|
698,126
|
|
|||
|
Noncontrolling interests in consolidated joint ventures
|
93,056
|
|
2,243
|
|
|||
|
Total noncontrolling interests
|
999,566
|
|
700,369
|
|
|||
|
Total equity
|
10,858,210
|
|
11,049,450
|
|
|||
|
Total liabilities and equity
|
$
|
23,766,695
|
|
$
|
21,404,345
|
|
|
See accompanying notes to the consolidated financial statements.
97
DIGITAL REALTY TRUST, INC. AND SUBSIDIARIES
CONSOLIDATED INCOME STATEMENTS
(in thousands, except share and per share data)
|
|
Year Ended December 31,
|
||||||||||
|
|
2018
|
2017
|
2016
|
||||||||
|
Operating Revenues:
|
|||||||||||
|
Rental and other services
|
$
|
2,412,076
|
|
$
|
2,010,301
|
|
$
|
1,746,828
|
|
||
|
Tenant reimbursements
|
624,637
|
|
440,224
|
|
355,903
|
|
|||||
|
Fee income and other
|
9,765
|
|
7,403
|
|
39,482
|
|
|||||
|
Total operating revenues
|
3,046,478
|
|
2,457,928
|
|
2,142,213
|
|
|||||
|
Operating Expenses:
|
|||||||||||
|
Rental property operating and maintenance
|
957,065
|
|
759,616
|
|
660,177
|
|
|||||
|
Property taxes
|
129,516
|
|
124,014
|
|
102,497
|
|
|||||
|
Insurance
|
11,402
|
|
10,981
|
|
9,492
|
|
|||||
|
Depreciation and amortization
|
1,186,896
|
|
842,464
|
|
699,324
|
|
|||||
|
General and administrative
|
163,667
|
|
161,441
|
|
152,733
|
|
|||||
|
Transaction and integration expenses
|
45,327
|
|
76,048
|
|
20,491
|
|
|||||
|
Impairment of investments in real estate
|
—
|
|
28,992
|
|
—
|
|
|||||
|
Other
|
2,818
|
|
3,077
|
|
213
|
|
|||||
|
Total operating expenses
|
2,496,691
|
|
2,006,633
|
|
1,644,927
|
|
|||||
|
Operating income
|
549,787
|
|
451,295
|
|
497,286
|
|
|||||
|
Other Income (Expenses):
|
|||||||||||
|
Equity in earnings of unconsolidated joint ventures
|
32,979
|
|
25,516
|
|
17,104
|
|
|||||
|
Gain on sale of properties
|
80,049
|
|
40,354
|
|
169,902
|
|
|||||
|
Interest and other income
|
3,481
|
|
3,655
|
|
(4,564
|
)
|
|||||
|
Interest expense
|
(321,529
|
)
|
(258,642
|
)
|
(236,480
|
)
|
|||||
|
Tax expense
|
(2,084
|
)
|
(7,901
|
)
|
(10,385
|
)
|
|||||
|
(Loss) gain from early extinguishment of debt
|
(1,568
|
)
|
1,990
|
|
(1,011
|
)
|
|||||
|
Net income
|
341,115
|
|
256,267
|
|
431,852
|
|
|||||
|
Net income attributable to noncontrolling interests
|
(9,869
|
)
|
(8,008
|
)
|
(5,665
|
)
|
|||||
|
Net income attributable to Digital Realty Trust, Inc.
|
331,246
|
|
248,259
|
|
426,187
|
|
|||||
|
Preferred stock dividends
|
(81,316
|
)
|
(68,802
|
)
|
(83,771
|
)
|
|||||
|
Issuance costs associated with redeemed preferred stock
|
—
|
|
(6,309
|
)
|
(10,328
|
)
|
|||||
|
Net income available to common stockholders
|
$
|
249,930
|
|
$
|
173,148
|
|
$
|
332,088
|
|
||
|
Net income per share available to common stockholders:
|
|||||||||||
|
Basic
|
$
|
1.21
|
|
$
|
0.99
|
|
$
|
2.21
|
|
||
|
Diluted
|
$
|
1.21
|
|
$
|
0.99
|
|
$
|
2.20
|
|
||
|
Weighted average common shares outstanding:
|
|||||||||||
|
Basic
|
206,035,408
|
|
174,059,386
|
|
149,953,662
|
|
|||||
|
Diluted
|
206,673,471
|
|
174,895,098
|
|
150,679,688
|
|
|||||
See accompanying notes to the consolidated financial statements.
98
DIGITAL REALTY TRUST, INC. AND SUBSIDIARIES
CONSOLIDATED STATEMENTS OF COMPREHENSIVE INCOME
(in thousands)
|
|
Year Ended December 31,
|
||||||||||
|
|
2018
|
2017
|
2016
|
||||||||
|
Net income
|
$
|
341,115
|
|
$
|
256,267
|
|
$
|
431,852
|
|
||
|
Other comprehensive income:
|
|||||||||||
|
Foreign currency translation (loss) income adjustments
|
(11,736
|
)
|
28,709
|
|
(86,621
|
)
|
|||||
|
Increase (decrease) in fair value of interest rate swaps and
foreign currency hedges |
8,197
|
|
(3,434
|
)
|
41,998
|
|
|||||
|
Reclassification to interest expense from interest rate swaps
|
(3,969
|
)
|
2,459
|
|
4,968
|
|
|||||
|
Comprehensive income
|
333,607
|
|
284,001
|
|
392,197
|
|
|||||
|
Comprehensive income attributable to noncontrolling interests
|
(9,576
|
)
|
(8,569
|
)
|
(5,025
|
)
|
|||||
|
Comprehensive income attributable to Digital Realty Trust, Inc.
|
$
|
324,031
|
|
$
|
275,432
|
|
$
|
387,172
|
|
||
See accompanying notes to the consolidated financial statements.
99
DIGITAL REALTY TRUST, INC. AND SUBSIDIARIES
CONSOLIDATED STATEMENTS OF EQUITY
(in thousands, except share data)
|
Redeemable Noncontrolling Interests — Operating Partnership
|
Preferred
Stock
|
Number of
Common
Shares
|
Common
Stock
|
Additional
Paid-in
Capital
|
Accumulated
Dividends in
Excess of
Earnings
|
Accumulated
Other
Comprehensive
Income (Loss),
net
|
Total
Stockholders’
Equity
|
Noncontrolling
Interests in
Operating
Partnership
|
Noncontrolling
Interests in
Consolidated
Joint Ventures
|
Total
Noncontrolling
Interests
|
Total
Equity
|
|||||||||||||||||||||||||||||||||||
|
Balance as of December 31,
2015 |
$
|
—
|
|
$
|
1,290,135
|
|
146,384,247
|
|
$
|
1,456
|
|
$
|
4,655,220
|
|
$
|
(1,350,089
|
)
|
$
|
(96,590
|
)
|
$
|
4,500,132
|
|
$
|
29,612
|
|
$
|
6,758
|
|
$
|
36,370
|
|
$
|
4,536,502
|
|
|||||||||||
|
Conversion of common units to common
stock |
—
|
|
—
|
|
430,493
|
|
5
|
|
5,237
|
|
—
|
|
—
|
|
5,242
|
|
(5,242
|
)
|
—
|
|
(5,242
|
)
|
—
|
|
||||||||||||||||||||||
|
Issuance of unvested restricted stock,
net of forfeitures |
—
|
|
—
|
|
120,082
|
|
—
|
|
—
|
|
—
|
|
—
|
|
—
|
|
—
|
|
—
|
|
—
|
|
—
|
|
||||||||||||||||||||||
|
Issuance of common stock in exchange for
cash, net of offering costs |
—
|
|
—
|
|
12,000,000
|
|
120
|
|
1,085,324
|
|
—
|
|
—
|
|
1,085,444
|
|
—
|
|
—
|
|
—
|
|
1,085,444
|
|
||||||||||||||||||||||
|
Exercise of stock options
|
—
|
|
—
|
|
33,948
|
|
—
|
|
1,380
|
|
—
|
|
—
|
|
1,380
|
|
—
|
|
—
|
|
—
|
|
1,380
|
|
||||||||||||||||||||||
|
Redemption of series E preferred stock
|
—
|
|
(277,172
|
)
|
—
|
|
—
|
|
—
|
|
(10,328
|
)
|
—
|
|
(287,500
|
)
|
—
|
|
—
|
|
—
|
|
(287,500
|
)
|
||||||||||||||||||||||
|
Preferred stock offering costs
|
—
|
|
(2
|
)
|
—
|
|
—
|
|
—
|
|
—
|
|
—
|
|
(2
|
)
|
—
|
|
—
|
|
—
|
|
(2
|
)
|
||||||||||||||||||||||
|
Amortization of unearned compensation
on share-based awards |
—
|
|
—
|
|
—
|
|
—
|
|
24,113
|
|
—
|
|
—
|
|
24,113
|
|
—
|
|
—
|
|
—
|
|
24,113
|
|
||||||||||||||||||||||
|
Reclassification of vested
share-based awards |
—
|
|
—
|
|
—
|
|
—
|
|
(10,125
|
)
|
—
|
|
—
|
|
(10,125
|
)
|
10,125
|
|
—
|
|
10,125
|
|
—
|
|
||||||||||||||||||||||
|
Dividends declared on preferred
stock |
—
|
|
—
|
|
—
|
|
—
|
|
—
|
|
(83,771
|
)
|
—
|
|
(83,771
|
)
|
—
|
|
—
|
|
—
|
|
(83,771
|
)
|
||||||||||||||||||||||
|
Dividends and distributions on common
stock and common and incentive units |
—
|
|
—
|
|
—
|
|
—
|
|
—
|
|
(529,419
|
)
|
—
|
|
(529,419
|
)
|
(9,469
|
)
|
—
|
|
(9,469
|
)
|
(538,888
|
)
|
||||||||||||||||||||||
|
Distributions to noncontrolling interests in
consolidated joint ventures, net of contributions |
—
|
|
—
|
|
—
|
|
—
|
|
—
|
|
—
|
|
—
|
|
—
|
|
—
|
|
(527
|
)
|
(527
|
)
|
(527
|
)
|
||||||||||||||||||||||
|
Net income
|
—
|
|
—
|
|
—
|
|
—
|
|
—
|
|
426,187
|
|
—
|
|
426,187
|
|
5,298
|
|
367
|
|
5,665
|
|
431,852
|
|
||||||||||||||||||||||
|
Other comprehensive income—
foreign currency translation adjustments |
—
|
|
—
|
|
—
|
|
—
|
|
—
|
|
—
|
|
(85,300
|
)
|
(85,300
|
)
|
(1,321
|
)
|
—
|
|
(1,321
|
)
|
(86,621
|
)
|
||||||||||||||||||||||
|
Other comprehensive income—
fair value of interest rate swaps |
—
|
|
—
|
|
—
|
|
—
|
|
—
|
|
—
|
|
41,395
|
|
41,395
|
|
603
|
|
—
|
|
603
|
|
41,998
|
|
||||||||||||||||||||||
|
Other comprehensive income—
reclassification of accumulated other comprehensive loss to interest expense |
—
|
|
—
|
|
—
|
|
—
|
|
—
|
|
—
|
|
4,890
|
|
4,890
|
|
78
|
|
—
|
|
78
|
|
4,968
|
|
||||||||||||||||||||||
|
Balance as of December 31,
2016 |
$
|
—
|
|
$
|
1,012,961
|
|
159,019,118
|
|
$
|
1,582
|
|
$
|
5,764,497
|
|
$
|
(1,547,420
|
)
|
$
|
(135,605
|
)
|
$
|
5,096,015
|
|
$
|
29,684
|
|
$
|
6,598
|
|
$
|
36,282
|
|
$
|
5,132,297
|
|
|||||||||||
See accompanying notes to the consolidated financial statements.
100
DIGITAL REALTY TRUST, INC. AND SUBSIDIARIES
CONSOLIDATED STATEMENTS OF EQUITY (continued)
(in thousands, except share data)
|
Redeemable Noncontrolling Interests — Operating Partnership
|
Preferred
Stock
|
Number of
Common
Shares
|
Common
Stock
|
Additional
Paid-in
Capital
|
Accumulated
Dividends in
Excess of
Earnings
|
Accumulated
Other
Comprehensive
Income (Loss),
net
|
Total
Stockholders’
Equity
|
Noncontrolling
Interests in
Operating
Partnership
|
Noncontrolling
Interests in
Consolidated
Joint Ventures
|
Total
Noncontrolling
Interests
|
Total
Equity
|
|||||||||||||||||||||||||||||||||||
|
Balance as of December 31,
2016 |
$
|
—
|
|
$
|
1,012,961
|
|
159,019,118
|
|
$
|
1,582
|
|
$
|
5,764,497
|
|
$
|
(1,547,420
|
)
|
$
|
(135,605
|
)
|
$
|
5,096,015
|
|
$
|
29,684
|
|
$
|
6,598
|
|
$
|
36,282
|
|
$
|
5,132,297
|
|
|||||||||||
|
Conversion of common units to common
stock |
—
|
|
—
|
|
562,582
|
|
6
|
|
10,003
|
|
—
|
|
—
|
|
10,009
|
|
(10,009
|
)
|
—
|
|
(10,009
|
)
|
—
|
|
||||||||||||||||||||||
|
Issuance of unvested restricted stock,
net of forfeitures |
—
|
|
—
|
|
249,050
|
|
—
|
|
—
|
|
—
|
|
—
|
|
—
|
|
—
|
|
—
|
|
—
|
|
—
|
|
||||||||||||||||||||||
|
Common stock and units issued in
connection with DFT merger |
66,259
|
|
—
|
|
43,175,629
|
|
432
|
|
5,247,126
|
|
—
|
|
—
|
|
5,247,558
|
|
676,566
|
|
—
|
|
676,566
|
|
5,924,124
|
|
||||||||||||||||||||||
|
Issuance of common stock, net of
offering costs |
—
|
|
—
|
|
2,375,000
|
|
24
|
|
211,873
|
|
—
|
|
—
|
|
211,897
|
|
—
|
|
—
|
|
—
|
|
211,897
|
|
||||||||||||||||||||||
|
Exercise of stock options
|
—
|
|
—
|
|
17,668
|
|
—
|
|
729
|
|
—
|
|
—
|
|
729
|
|
—
|
|
—
|
|
—
|
|
729
|
|
||||||||||||||||||||||
|
Shares issued under employee stock
purchase plan |
—
|
|
—
|
|
71,253
|
|
—
|
|
5,143
|
|
—
|
|
—
|
|
5,143
|
|
—
|
|
—
|
|
—
|
|
5,143
|
|
||||||||||||||||||||||
|
Issuance of series C preferred stock in
connection with DFT merger |
—
|
|
219,250
|
|
—
|
|
—
|
|
—
|
|
—
|
|
—
|
|
219,250
|
|
—
|
|
—
|
|
—
|
|
219,250
|
|
||||||||||||||||||||||
|
Issuance of series J preferred stock, net of
offering costs |
—
|
|
193,540
|
|
—
|
|
—
|
|
—
|
|
—
|
|
—
|
|
193,540
|
|
—
|
|
—
|
|
—
|
|
193,540
|
|
||||||||||||||||||||||
|
Redemption of series F preferred stock
|
—
|
|
(176,191
|
)
|
—
|
|
—
|
|
—
|
|
(6,309
|
)
|
—
|
|
(182,500
|
)
|
—
|
|
—
|
|
—
|
|
(182,500
|
)
|
||||||||||||||||||||||
|
Amortization of unearned compensation
on share-based awards |
—
|
|
—
|
|
—
|
|
—
|
|
27,981
|
|
—
|
|
—
|
|
27,981
|
|
—
|
|
—
|
|
—
|
|
27,981
|
|
||||||||||||||||||||||
|
Reclassification of vested
share-based awards |
—
|
|
—
|
|
—
|
|
—
|
|
(10,057
|
)
|
—
|
|
—
|
|
(10,057
|
)
|
10,057
|
|
—
|
|
10,057
|
|
—
|
|
||||||||||||||||||||||
|
Adjustment to redeemable noncontrolling
interests—operating partnership |
(12,357
|
)
|
—
|
|
—
|
|
—
|
|
4,166
|
|
—
|
|
—
|
|
4,166
|
|
8,191
|
|
—
|
|
8,191
|
|
12,357
|
|
||||||||||||||||||||||
|
Dividends declared on preferred
stock |
—
|
|
—
|
|
—
|
|
—
|
|
—
|
|
(68,802
|
)
|
—
|
|
(68,802
|
)
|
—
|
|
—
|
|
—
|
|
(68,802
|
)
|
||||||||||||||||||||||
|
Dividends and distributions on common
stock and common and incentive units |
—
|
|
—
|
|
—
|
|
—
|
|
—
|
|
(681,280
|
)
|
—
|
|
(681,280
|
)
|
(20,694
|
)
|
—
|
|
(20,694
|
)
|
(701,974
|
)
|
||||||||||||||||||||||
|
Distributions to noncontrolling interests in
consolidated joint ventures, net of contributions |
—
|
|
—
|
|
—
|
|
—
|
|
—
|
|
—
|
|
—
|
|
—
|
|
—
|
|
(8,593
|
)
|
(8,593
|
)
|
(8,593
|
)
|
||||||||||||||||||||||
|
Net income
|
—
|
|
—
|
|
—
|
|
—
|
|
—
|
|
248,259
|
|
—
|
|
248,259
|
|
3,770
|
|
4,238
|
|
8,008
|
|
256,267
|
|
||||||||||||||||||||||
|
Other comprehensive income—
foreign currency translation adjustments |
—
|
|
—
|
|
—
|
|
—
|
|
—
|
|
—
|
|
28,272
|
|
28,272
|
|
437
|
|
—
|
|
437
|
|
28,709
|
|
||||||||||||||||||||||
|
Other comprehensive income—
fair value of interest rate swaps and foreign currency hedges |
—
|
|
—
|
|
—
|
|
—
|
|
—
|
|
—
|
|
(3,513
|
)
|
(3,513
|
)
|
79
|
|
—
|
|
79
|
|
(3,434
|
)
|
||||||||||||||||||||||
|
Other comprehensive income—
reclassification of accumulated other comprehensive loss to interest expense |
—
|
|
—
|
|
—
|
|
—
|
|
—
|
|
—
|
|
2,414
|
|
2,414
|
|
45
|
|
—
|
|
45
|
|
2,459
|
|
||||||||||||||||||||||
|
Balance as of December 31,
2017 |
$
|
53,902
|
|
$
|
1,249,560
|
|
205,470,300
|
|
$
|
2,044
|
|
$
|
11,261,461
|
|
$
|
(2,055,552
|
)
|
$
|
(108,432
|
)
|
$
|
10,349,081
|
|
$
|
698,126
|
|
$
|
2,243
|
|
$
|
700,369
|
|
$
|
11,049,450
|
|
|||||||||||
101
DIGITAL REALTY TRUST, INC. AND SUBSIDIARIES
CONSOLIDATED STATEMENTS OF EQUITY (continued)
(in thousands, except share data)
|
Redeemable Noncontrolling Interests — Operating Partnership
|
Preferred
Stock
|
Number of
Common
Shares
|
Common
Stock
|
Additional
Paid-in
Capital
|
Accumulated
Dividends in
Excess of
Earnings
|
Accumulated
Other
Comprehensive
Income (Loss),
net
|
Total
Stockholders’
Equity
|
Noncontrolling
Interests in
Operating
Partnership
|
Noncontrolling
Interests in
Consolidated
Joint Ventures
|
Total
Noncontrolling
Interests
|
Total
Equity
|
|||||||||||||||||||||||||||||||||||
|
Balance as of December 31,
2017 |
$
|
53,902
|
|
$
|
1,249,560
|
|
205,470,300
|
|
$
|
2,044
|
|
$
|
11,261,461
|
|
$
|
(2,055,552
|
)
|
$
|
(108,432
|
)
|
$
|
10,349,081
|
|
$
|
698,126
|
|
$
|
2,243
|
|
$
|
700,369
|
|
$
|
11,049,450
|
|
|||||||||||
|
Conversion of common units to common
stock |
—
|
|
—
|
|
711,892
|
|
7
|
|
61,997
|
|
—
|
|
—
|
|
62,004
|
|
(62,004
|
)
|
—
|
|
(62,004
|
)
|
—
|
|
||||||||||||||||||||||
|
Issuance of unvested restricted stock,
net of forfeitures |
—
|
|
—
|
|
220,765
|
|
—
|
|
—
|
|
—
|
|
—
|
|
—
|
|
—
|
|
—
|
|
—
|
|
—
|
|
||||||||||||||||||||||
|
Common stock offering costs
|
—
|
|
—
|
|
—
|
|
—
|
|
1,194
|
|
—
|
|
—
|
|
1,194
|
|
—
|
|
—
|
|
—
|
|
1,194
|
|
||||||||||||||||||||||
|
Shares issued under employee stock
purchase plan |
—
|
|
—
|
|
69,532
|
|
1
|
|
5,873
|
|
—
|
|
—
|
|
5,874
|
|
—
|
|
—
|
|
—
|
|
5,874
|
|
||||||||||||||||||||||
|
Shares repurchased and retired to satisfy
tax withholding upon vesting |
—
|
|
(46,833
|
)
|
(1
|
)
|
(5,054
|
)
|
—
|
|
—
|
|
(5,055
|
)
|
—
|
|
—
|
|
—
|
|
(5,055
|
)
|
||||||||||||||||||||||||
|
Units issued in connection with Ascenty Acquisition
|
—
|
|
—
|
|
—
|
|
—
|
|
—
|
|
—
|
|
—
|
|
—
|
|
253,837
|
|
25,000
|
|
278,837
|
|
278,837
|
|
||||||||||||||||||||||
|
Amortization of unearned compensation
on share-based awards |
—
|
|
—
|
|
—
|
|
—
|
|
32,456
|
|
—
|
|
—
|
|
32,456
|
|
—
|
|
—
|
|
—
|
|
32,456
|
|
||||||||||||||||||||||
|
Reclassification of vested
share-based awards |
—
|
|
—
|
|
—
|
|
—
|
|
(3,772
|
)
|
—
|
|
—
|
|
(3,772
|
)
|
3,772
|
|
—
|
|
3,772
|
|
—
|
|
||||||||||||||||||||||
|
Adjustment to redeemable noncontrolling
interests—operating partnership |
(37,274
|
)
|
—
|
|
—
|
|
—
|
|
1,596
|
|
—
|
|
—
|
|
1,596
|
|
35,678
|
|
—
|
|
35,678
|
|
37,274
|
|
||||||||||||||||||||||
|
Dividends declared on preferred
stock |
—
|
|
—
|
|
—
|
|
—
|
|
—
|
|
(81,316
|
)
|
—
|
|
(81,316
|
)
|
—
|
|
—
|
|
—
|
|
(81,316
|
)
|
||||||||||||||||||||||
|
Dividends and distributions on common
stock and common and incentive units |
(1,271
|
)
|
—
|
|
—
|
|
—
|
|
—
|
|
(833,364
|
)
|
—
|
|
(833,364
|
)
|
(32,311
|
)
|
—
|
|
(32,311
|
)
|
(865,675
|
)
|
||||||||||||||||||||||
|
Contributions from noncontrolling interests
in consolidated joint ventures, net of distributions |
—
|
|
—
|
|
—
|
|
—
|
|
—
|
|
—
|
|
—
|
|
—
|
|
—
|
|
66,124
|
|
66,124
|
|
66,124
|
|
||||||||||||||||||||||
|
Cumulative effect adjustment from
adoption of new accounting standard |
—
|
|
—
|
|
—
|
|
—
|
|
—
|
|
5,915
|
|
—
|
|
5,915
|
|
—
|
|
—
|
|
—
|
|
5,915
|
|
||||||||||||||||||||||
|
Net income
|
475
|
|
—
|
|
—
|
|
—
|
|
—
|
|
331,246
|
|
—
|
|
331,246
|
|
9,705
|
|
(311
|
)
|
9,394
|
|
340,640
|
|
||||||||||||||||||||||
|
Other comprehensive income—
foreign currency translation adjustments |
—
|
|
—
|
|
—
|
|
—
|
|
—
|
|
—
|
|
(11,279
|
)
|
(11,279
|
)
|
(457
|
)
|
—
|
|
(457
|
)
|
(11,736
|
)
|
||||||||||||||||||||||
|
Other comprehensive income—
fair value of interest rate swaps |
—
|
|
—
|
|
—
|
|
—
|
|
—
|
|
—
|
|
7,890
|
|
7,890
|
|
307
|
|
—
|
|
307
|
|
8,197
|
|
||||||||||||||||||||||
|
Other comprehensive income—
reclassification of accumulated other comprehensive income to interest expense |
—
|
|
—
|
|
—
|
|
—
|
|
—
|
|
—
|
|
(3,826
|
)
|
(3,826
|
)
|
(143
|
)
|
—
|
|
(143
|
)
|
(3,969
|
)
|
||||||||||||||||||||||
|
Balance as of December 31,
2018 |
$
|
15,832
|
|
$
|
1,249,560
|
|
206,425,656
|
|
$
|
2,051
|
|
$
|
11,355,751
|
|
$
|
(2,633,071
|
)
|
$
|
(115,647
|
)
|
$
|
9,858,644
|
|
$
|
906,510
|
|
$
|
93,056
|
|
$
|
999,566
|
|
$
|
10,858,210
|
|
|||||||||||
See accompanying notes to the consolidated financial statements.
102
DIGITAL REALTY TRUST, INC. AND SUBSIDIARIES
CONSOLIDATED STATEMENTS OF CASH FLOWS
(in thousands)
|
|
Year Ended December 31,
|
||||||||||
|
|
2018
|
2017
|
2016
|
||||||||
|
Cash flows from operating activities:
|
|||||||||||
|
Net income
|
$
|
341,115
|
|
$
|
256,267
|
|
$
|
431,852
|
|
||
|
Adjustments to reconcile net income to net cash provided by operating activities:
|
|||||||||||
|
Gain on sale of properties
|
(80,049
|
)
|
(40,354
|
)
|
(169,902
|
)
|
|||||
|
Gain on lease termination
|
—
|
|
—
|
|
(29,205
|
)
|
|||||
|
Unrealized gain on marketable equity security
|
(1,631
|
)
|
—
|
|
—
|
|
|||||
|
Impairment of investments in real estate
|
—
|
|
28,992
|
|
—
|
|
|||||
|
Equity in earnings of unconsolidated joint ventures
|
(32,979
|
)
|
(25,516
|
)
|
(17,104
|
)
|
|||||
|
Distributions from unconsolidated joint ventures
|
21,905
|
|
31,747
|
|
16,755
|
|
|||||
|
Write-off of net assets due to early lease terminations
|
2,818
|
|
3,076
|
|
213
|
|
|||||
|
Depreciation and amortization of buildings and improvements, tenant
improvements and acquired ground leases
|
770,275
|
|
594,996
|
|
518,716
|
|
|||||
|
Amortization of acquired in-place lease value, deferred leasing costs
and intangibles |
416,621
|
|
247,468
|
|
180,608
|
|
|||||
|
Amortization of share-based unearned compensation
|
27,159
|
|
20,521
|
|
17,433
|
|
|||||
|
Non-cash amortization of terminated interest rate swaps
|
1,120
|
|
1,204
|
|
—
|
|
|||||
|
Allowance for (recovery of) doubtful accounts
|
6,304
|
|
(776
|
)
|
1,602
|
|
|||||
|
Amortization of deferred financing costs
|
11,537
|
|
10,634
|
|
9,908
|
|
|||||
|
Loss (gain) on early extinguishment of debt
|
1,568
|
|
(1,990
|
)
|
1,011
|
|
|||||
|
Amortization of debt discount/premium
|
3,538
|
|
2,992
|
|
2,616
|
|
|||||
|
Amortization of acquired above-market leases and acquired
below-market leases, net
|
26,530
|
|
1,770
|
|
(8,351
|
)
|
|||||
|
Changes in assets and liabilities, net of impact of business combinations
|
|||||||||||
|
Accounts and other receivables
|
(21,318
|
)
|
(73,717
|
)
|
(13,754
|
)
|
|||||
|
Deferred rent
|
(39,905
|
)
|
(16,564
|
)
|
(24,401
|
)
|
|||||
|
Deferred leasing costs
|
(72,104
|
)
|
(15,363
|
)
|
60
|
|
|||||
|
Other assets
|
(9,145
|
)
|
(1,800
|
)
|
(69,924
|
)
|
|||||
|
Accounts payable and other accrued liabilities
|
39,192
|
|
(16,384
|
)
|
38,432
|
|
|||||
|
Security deposits and prepaid rents
|
(27,227
|
)
|
16,102
|
|
24,677
|
|
|||||
|
Net cash provided by operating activities
|
1,385,324
|
|
1,023,305
|
|
911,242
|
|
|||||
|
Cash flows from investing activities:
|
|||||||||||
|
Improvements to and advances for investments in real estate
|
(1,325,162
|
)
|
(1,150,619
|
)
|
(758,081
|
)
|
|||||
|
Ascenty acquisition
|
(1,679,830
|
)
|
—
|
|
—
|
|
|||||
|
Cash assumed in business combinations
|
116,000
|
|
20,650
|
|
—
|
|
|||||
|
Acquisitions of real estate, net of cash acquired
|
(410,712
|
)
|
(415,764
|
)
|
(873,285
|
)
|
|||||
|
Proceeds from sale of assets, net of sales costs
|
286,204
|
|
89,333
|
|
359,319
|
|
|||||
|
Distribution of debt proceeds from closing of joint venture
|
—
|
|
135,793
|
|
—
|
|
|||||
|
Investments in unconsolidated joint ventures
|
(673
|
)
|
(93,405
|
)
|
—
|
|
|||||
|
Excess proceeds from forward contract settlement
|
—
|
|
63,956
|
|
—
|
|
|||||
|
Prepaid construction costs and other investments
|
(13,254
|
)
|
—
|
|
(32,095
|
)
|
|||||
See accompanying notes to the consolidated financial statements.
103
DIGITAL REALTY TRUST, INC. AND SUBSIDIARIES
CONSOLIDATED STATEMENTS OF CASH FLOWS (continued)
(in thousands)
|
|
Year Ended December 31,
|
||||||||||
|
|
2018
|
2017
|
2016
|
||||||||
|
Improvement advances to tenants
|
(48,502
|
)
|
(50,857
|
)
|
(16,239
|
)
|
|||||
|
Collection of advances from tenants for improvements
|
39,936
|
|
43,760
|
|
16,784
|
|
|||||
|
Net cash used in investing activities
|
(3,035,993
|
)
|
(1,357,153
|
)
|
(1,303,597
|
)
|
|||||
|
Cash flows from financing activities:
|
|||||||||||
|
Borrowings on global revolving credit facility
|
$
|
3,046,245
|
|
$
|
2,180,556
|
|
$
|
2,533,507
|
|
||
|
Repayments on global revolving credit facility
|
(1,945,594
|
)
|
(2,304,686
|
)
|
(3,283,087
|
)
|
|||||
|
Borrowings on unsecured term loans
|
467,922
|
|
—
|
|
766,201
|
|
|||||
|
Repayments on unsecured term loans
|
(674,332
|
)
|
(371,520
|
)
|
(170,736
|
)
|
|||||
|
Borrowings on unsecured senior notes
|
1,169,006
|
|
2,265,060
|
|
675,591
|
|
|||||
|
Principal payments on unsecured senior notes
|
—
|
|
(884,841
|
)
|
—
|
|
|||||
|
Borrowings on secured debt
|
600,000
|
|
104,000
|
|
—
|
|
|||||
|
Principal payments on secured debt
|
(594
|
)
|
(105,546
|
)
|
(299,826
|
)
|
|||||
|
Repayments on other secured loans
|
—
|
|
(50,000
|
)
|
(25,000
|
)
|
|||||
|
Earnout payments related to acquisitions
|
—
|
|
—
|
|
(23,213
|
)
|
|||||
|
Payment of loan fees and costs
|
(44,299
|
)
|
(16,830
|
)
|
(19,574
|
)
|
|||||
|
Capital contributions from (distributions to) noncontrolling
interests in consolidated joint ventures, net |
66,124
|
|
(8,593
|
)
|
(527
|
)
|
|||||
|
Taxes paid related to net settlement of stock-based compensation awards
|
(5,055
|
)
|
—
|
|
—
|
|
|||||
|
Proceeds from common and preferred stock offerings, net
|
1,194
|
|
405,437
|
|
1,085,442
|
|
|||||
|
Proceeds from equity plans
|
5,874
|
|
5,872
|
|
4,729
|
|
|||||
|
Redemption of preferred stock
|
—
|
|
(182,500
|
)
|
(287,500
|
)
|
|||||
|
Proceeds from forward swap contract
|
1,560
|
|
—
|
|
—
|
|
|||||
|
Payment of dividends to preferred stockholders
|
(81,316
|
)
|
(68,802
|
)
|
(83,771
|
)
|
|||||
|
Payment of dividends to common stockholders and distributions to noncontrolling interests in operating partnership
|
(849,466
|
)
|
(646,407
|
)
|
(521,619
|
)
|
|||||
|
Net cash provided by financing activities
|
1,757,269
|
|
321,200
|
|
350,617
|
|
|||||
|
Net increase (decrease) in cash, cash equivalents and restricted cash
|
106,600
|
|
(12,648
|
)
|
(41,738
|
)
|
|||||
|
Effect of exchange rate changes on cash, cash equivalents and restricted cash
|
15,441
|
|
3,793
|
|
(11,288
|
)
|
|||||
|
Cash, cash equivalents and restricted cash at beginning of year
|
13,181
|
|
22,036
|
|
75,062
|
|
|||||
|
Cash, cash equivalents and restricted cash at end of year
|
$
|
135,222
|
|
$
|
13,181
|
|
$
|
22,036
|
|
||
See accompanying notes to the consolidated financial statements.
104
DIGITAL REALTY TRUST, INC. AND SUBSIDIARIES
CONSOLIDATED STATEMENTS OF CASH FLOWS (continued)
(in thousands)
|
|
Year Ended December 31,
|
||||||||||
|
|
2018
|
2017
|
2016
|
||||||||
|
Supplemental disclosure of cash flow information:
|
|||||||||||
|
Cash paid for interest, net of amounts capitalized
|
$
|
288,643
|
|
$
|
211,549
|
|
$
|
216,713
|
|
||
|
Cash paid for income taxes
|
11,224
|
|
9,456
|
|
3,698
|
|
|||||
|
Supplementary disclosure of noncash investing and financing activities:
|
|||||||||||
|
Change in net assets related to foreign currency translation adjustments
|
$
|
(11,736
|
)
|
$
|
28,709
|
|
$
|
(86,621
|
)
|
||
|
Accrual of dividends and distributions
|
217,241
|
|
199,761
|
|
144,194
|
|
|||||
|
Increase (decrease) in accounts payable and other accrued liabilities
related to change in fair value of interest rate swaps |
8,197
|
|
(3,434
|
)
|
41,998
|
|
|||||
|
Noncontrolling interests in operating partnership redeemed for
or converted to shares of common stock
|
62,004
|
|
10,009
|
|
5,242
|
|
|||||
|
Accrual for additions to investments in real estate and tenant improvement
advances included in accounts payable and accrued expenses
|
189,508
|
|
149,548
|
|
128,531
|
|
|||||
|
Assumption of capital lease obligations upon acquisition
|
75,030
|
|
—
|
|
118,923
|
|
|||||
|
Non-cash derecognition of capital lease obligation
|
17,294
|
|
—
|
|
—
|
|
|||||
|
Allocation of purchase price of real estate/investment in partnership to:
|
|||||||||||
|
Investments in real estate
|
$
|
410,712
|
|
$
|
366,105
|
|
$
|
378,431
|
|
||
|
Accounts receivable
|
—
|
|
—
|
|
8,537
|
|
|||||
|
Goodwill
|
—
|
|
—
|
|
448,123
|
|
|||||
|
Acquired above-market leases
|
—
|
|
21,043
|
|
—
|
|
|||||
|
Acquired in-place lease value and deferred leasing costs
|
—
|
|
30,111
|
|
226,877
|
|
|||||
|
Other assets
|
—
|
|
—
|
|
9,011
|
|
|||||
|
Capital lease obligations
|
—
|
|
—
|
|
(118,923
|
)
|
|||||
|
Acquired below-market leases
|
—
|
|
(1,495
|
)
|
(922
|
)
|
|||||
|
Accounts payables and other accrued liabilities
|
—
|
|
—
|
|
(69,084
|
)
|
|||||
|
Security deposits and prepaid rents
|
—
|
|
—
|
|
(8,765
|
)
|
|||||
|
Cash paid for acquisition of real estate
|
$
|
410,712
|
|
$
|
415,764
|
|
$
|
873,285
|
|
||
|
Allocation of purchase price to business combinations:
|
|||||||||||
|
Cash and cash equivalents
|
$
|
116,000
|
|
$
|
20,650
|
|
$
|
—
|
|
||
|
Land
|
—
|
|
312,579
|
|
—
|
|
|||||
|
Buildings and improvements
|
425,000
|
|
3,677,497
|
|
—
|
|
|||||
|
Accounts receivables and other assets
|
30,000
|
|
10,978
|
|
—
|
|
|||||
|
Acquired above-market leases
|
—
|
|
162,333
|
|
—
|
|
|||||
|
Tenant relationship and acquired in-place lease value
|
495,000
|
|
1,582,385
|
|
—
|
|
|||||
|
Goodwill
|
982,667
|
|
2,592,181
|
|
—
|
|
|||||
|
Revolving credit facility
|
—
|
|
(450,697
|
)
|
—
|
|
|||||
|
Unsecured term loan
|
—
|
|
(250,000
|
)
|
—
|
|
|||||
|
Unsecured notes
|
—
|
|
(886,831
|
)
|
—
|
|
|||||
|
Mortgage notes payable and unsecured debt
|
—
|
|
(105,000
|
)
|
—
|
|
|||||
105
|
|
Year Ended December 31,
|
||||||||||
|
|
2018
|
2017
|
2016
|
||||||||
|
Accounts payable and other accrued liabilities
|
(90,000
|
)
|
(248,259
|
)
|
—
|
|
|||||
|
Acquired below-market leases
|
—
|
|
(185,543
|
)
|
—
|
|
|||||
|
Other working capital, net
|
—
|
|
(22,640
|
)
|
—
|
|
|||||
|
Redeemable noncontrolling interests -- operating partnership
|
—
|
|
(66,259
|
)
|
—
|
|
|||||
|
Common stock issued in connection with merger
|
—
|
|
(5,247,558
|
)
|
—
|
|
|||||
|
Noncontrolling interests in operating partnership
|
(253,837
|
)
|
(676,566
|
)
|
—
|
|
|||||
|
Noncontrolling interests in consolidated joint venture
|
(25,000
|
)
|
—
|
|
—
|
|
|||||
|
Issuance of preferred stock in connection with merger
|
—
|
|
(219,250
|
)
|
—
|
|
|||||
|
Cash consideration
|
$
|
1,679,830
|
|
$
|
—
|
|
$
|
—
|
|
||
|
Contribution of assets and liabilities to unconsolidated joint venture:
|
|||||||||||
|
Investments in real estate
|
$
|
—
|
|
$
|
119,106
|
|
$
|
—
|
|
||
|
Other assets
|
—
|
|
16,700
|
|
—
|
|
|||||
|
Other liabilities
|
—
|
|
(31,634
|
)
|
—
|
|
|||||
See accompanying notes to the consolidated financial statements.
106
DIGITAL REALTY TRUST, L.P. AND SUBSIDIARIES
CONSOLIDATED BALANCE SHEETS
(in thousands, except unit data)
|
December 31, 2018
|
December 31, 2017
|
||||||
|
ASSETS
|
|||||||
|
Investments in real estate:
|
|||||||
|
Properties:
|
|||||||
|
Land
|
$
|
1,509,764
|
|
$
|
1,136,341
|
|
|
|
Acquired ground leases
|
10,575
|
|
11,150
|
|
|||
|
Buildings and improvements
|
16,745,210
|
|
15,215,405
|
|
|||
|
Tenant improvements
|
574,336
|
|
553,040
|
|
|||
|
Total investments in properties
|
18,839,885
|
|
16,915,936
|
|
|||
|
Accumulated depreciation and amortization
|
(3,935,267
|
)
|
(3,238,227
|
)
|
|||
|
Net investments in properties
|
14,904,618
|
|
13,677,709
|
|
|||
|
Investments in unconsolidated joint ventures
|
175,108
|
|
163,477
|
|
|||
|
Net investments in real estate
|
15,079,726
|
|
13,841,186
|
|
|||
|
Cash and cash equivalents
|
126,700
|
|
51
|
|
|||
|
Accounts and other receivables, net of allowance for doubtful accounts of $11,554
and $6,737 as of December 31, 2018 and December 31, 2017, respectively |
299,621
|
|
276,347
|
|
|||
|
Deferred rent
|
463,248
|
|
430,026
|
|
|||
|
Acquired above-market leases, net of accumulated amortization of $158,037 and $110,139
as of December 31, 2018 and December 31, 2017, respectively |
119,759
|
|
184,375
|
|
|||
|
Goodwill
|
4,348,007
|
|
3,389,595
|
|
|||
|
Acquired in-place lease value, deferred leasing costs and intangibles,
net of accumulated amortization of $1,355,013 and $1,016,989 as of December 31, 2018 and December 31, 2017, respectively |
3,144,395
|
|
2,998,806
|
|
|||
|
Restricted cash
|
8,522
|
|
13,130
|
|
|||
|
Assets held for sale
|
—
|
|
139,538
|
|
|||
|
Other assets
|
176,717
|
|
131,291
|
|
|||
|
Total assets
|
$
|
23,766,695
|
|
$
|
21,404,345
|
|
|
|
LIABILITIES AND CAPITAL
|
|||||||
|
Global revolving credit facilities
|
$
|
1,647,735
|
|
$
|
550,946
|
|
|
|
Unsecured term loans
|
1,178,904
|
|
1,420,333
|
|
|||
|
Unsecured senior notes, net of discount
|
7,589,126
|
|
6,570,757
|
|
|||
|
Mortgage loans, including premiums
|
685,714
|
|
106,582
|
|
|||
|
Accounts payable and other accrued liabilities
|
1,164,509
|
|
980,218
|
|
|||
|
Accrued distributions
|
217,241
|
|
199,761
|
|
|||
|
Acquired below-market leases, net of accumulated amortization of $242,422 and $219,654
as of December 31, 2018 and December 31, 2017, respectively |
200,113
|
|
249,465
|
|
|||
|
Security deposits and prepaid rents
|
209,311
|
|
217,898
|
|
|||
|
Obligations associated with assets held for sale
|
—
|
|
5,033
|
|
|||
|
Total liabilities
|
12,892,653
|
|
10,300,993
|
|
|||
107
DIGITAL REALTY TRUST, L.P. AND SUBSIDIARIES
CONSOLIDATED BALANCE SHEETS (continued)
(in thousands, except unit data)
|
December 31, 2018
|
December 31, 2017
|
||||||
|
Redeemable limited partner common units
|
15,832
|
|
53,902
|
|
|||
|
Commitments and contingencies
|
|
|
|||||
|
Capital:
|
|||||||
|
Partners’ capital:
|
|||||||
|
General Partner:
|
|||||||
|
Preferred units, 50,650,000 units issued and outstanding as of December 31, 2018 and December 31, 2017 ($1,266,250 liquidation preference, $25.00 per unit)
|
1,249,560
|
|
1,249,560
|
|
|||
|
Common units, 206,425,656 and 205,470,300 units issued and outstanding as of December 31, 2018 and December 31, 2017, respectively
|
8,724,731
|
|
9,207,953
|
|
|||
|
Limited Partners, 10,580,884 and 8,489,095 units outstanding as of
December 31, 2018 and December 31, 2017, respectively |
911,256
|
|
702,579
|
|
|||
|
Accumulated other comprehensive loss
|
(120,393
|
)
|
(112,885
|
)
|
|||
|
Total partners’ capital
|
10,765,154
|
|
11,047,207
|
|
|||
|
Noncontrolling interests in consolidated joint ventures
|
93,056
|
|
2,243
|
|
|||
|
Total capital
|
10,858,210
|
|
11,049,450
|
|
|||
|
Total liabilities and capital
|
$
|
23,766,695
|
|
$
|
21,404,345
|
|
|
See accompanying notes to the consolidated financial statements.
108
DIGITAL REALTY TRUST, L.P. AND SUBSIDIARIES
CONSOLIDATED INCOME STATEMENTS
(in thousands, except unit and per unit data)
|
|
Year Ended December 31,
|
||||||||||
|
|
2018
|
2017
|
2016
|
||||||||
|
Operating Revenues:
|
|||||||||||
|
Rental and other services
|
$
|
2,412,076
|
|
$
|
2,010,301
|
|
$
|
1,746,828
|
|
||
|
Tenant reimbursements
|
624,637
|
|
440,224
|
|
355,903
|
|
|||||
|
Fee income and other
|
9,765
|
|
7,403
|
|
39,482
|
|
|||||
|
Total operating revenues
|
3,046,478
|
|
2,457,928
|
|
2,142,213
|
|
|||||
|
Operating Expenses:
|
|||||||||||
|
Rental property operating and maintenance
|
957,065
|
|
759,616
|
|
660,177
|
|
|||||
|
Property taxes
|
129,516
|
|
124,014
|
|
102,497
|
|
|||||
|
Insurance
|
11,402
|
|
10,981
|
|
9,492
|
|
|||||
|
Depreciation and amortization
|
1,186,896
|
|
842,464
|
|
699,324
|
|
|||||
|
General and administrative
|
163,667
|
|
161,441
|
|
152,733
|
|
|||||
|
Transaction and integration expenses
|
45,327
|
|
76,048
|
|
20,491
|
|
|||||
|
Impairment of investments in real estate
|
—
|
|
28,992
|
|
—
|
|
|||||
|
Other
|
2,818
|
|
3,077
|
|
213
|
|
|||||
|
Total operating expenses
|
2,496,691
|
|
2,006,633
|
|
1,644,927
|
|
|||||
|
Operating income
|
549,787
|
|
451,295
|
|
497,286
|
|
|||||
|
Other Income (Expenses):
|
|||||||||||
|
Equity in earnings of unconsolidated joint ventures
|
32,979
|
|
25,516
|
|
17,104
|
|
|||||
|
Gain on sale of property
|
80,049
|
|
40,354
|
|
169,902
|
|
|||||
|
Interest and other income
|
3,481
|
|
3,655
|
|
(4,564
|
)
|
|||||
|
Interest expense
|
(321,529
|
)
|
(258,642
|
)
|
(236,480
|
)
|
|||||
|
Tax expense
|
(2,084
|
)
|
(7,901
|
)
|
(10,385
|
)
|
|||||
|
(Loss) gain from early extinguishment of debt
|
(1,568
|
)
|
1,990
|
|
(1,011
|
)
|
|||||
|
Net income
|
341,115
|
|
256,267
|
|
431,852
|
|
|||||
|
Net loss (income) attributable to noncontrolling interests
in consolidated joint ventures
|
311
|
|
(4,238
|
)
|
(367
|
)
|
|||||
|
Net income attributable to Digital Realty Trust, L.P.
|
341,426
|
|
252,029
|
|
431,485
|
|
|||||
|
Preferred units distributions
|
(81,316
|
)
|
(68,802
|
)
|
(83,771
|
)
|
|||||
|
Issuance costs associated with redeemed preferred units
|
—
|
|
(6,309
|
)
|
(10,328
|
)
|
|||||
|
Net income available to common unitholders
|
$
|
260,110
|
|
$
|
176,918
|
|
$
|
337,386
|
|
||
|
Net income per unit available to common unitholders:
|
|||||||||||
|
Basic
|
$
|
1.21
|
|
$
|
0.99
|
|
$
|
2.21
|
|
||
|
Diluted
|
$
|
1.21
|
|
$
|
0.99
|
|
$
|
2.20
|
|
||
|
Weighted average common units outstanding:
|
|||||||||||
|
Basic
|
214,312,871
|
|
178,055,936
|
|
152,359,680
|
|
|||||
|
Diluted
|
214,950,934
|
|
178,891,648
|
|
153,085,706
|
|
|||||
See accompanying notes to the consolidated financial statements.
109
DIGITAL REALTY TRUST, L.P. AND SUBSIDIARIES
CONSOLIDATED STATEMENTS OF COMPREHENSIVE INCOME
(in thousands)
|
|
Year Ended December 31,
|
||||||||||
|
|
2018
|
2017
|
2016
|
||||||||
|
Net income
|
$
|
341,115
|
|
$
|
256,267
|
|
$
|
431,852
|
|
||
|
Other comprehensive income:
|
|||||||||||
|
Foreign currency translation (loss) income adjustments
|
(11,736
|
)
|
28,709
|
|
(86,621
|
)
|
|||||
|
Increase (decrease) in fair value of interest rate swaps and
foreign currency hedges |
8,197
|
|
(3,434
|
)
|
41,998
|
|
|||||
|
Reclassification to interest expense from interest rate swaps
|
(3,969
|
)
|
2,459
|
|
4,968
|
|
|||||
|
Comprehensive income
|
$
|
333,607
|
|
$
|
284,001
|
|
$
|
392,197
|
|
||
|
Comprehensive loss (income) attributable to noncontrolling interests in consolidated joint ventures
|
311
|
|
(4,238
|
)
|
(367
|
)
|
|||||
|
Comprehensive income attributable to Digital Realty Trust, L.P.
|
$
|
333,918
|
|
$
|
279,763
|
|
$
|
391,830
|
|
||
See accompanying notes to the consolidated financial statements.
110
DIGITAL REALTY TRUST, L.P. AND SUBSIDIARIES
CONSOLIDATED STATEMENTS OF CAPITAL
(in thousands, except unit data)
|
|
Redeemable Limited Partner Common Units
|
General Partner
|
Limited Partners
|
Accumulated
Other
Comprehensive
Income (Loss)
|
Noncontrolling
Interests in
Consolidated
Joint Ventures
|
Total Capital
|
||||||||||||||||||||||||||||||
|
|
Preferred Units
|
Common Units
|
Common Units
|
|||||||||||||||||||||||||||||||||
|
|
Units
|
Amount
|
Units
|
Amount
|
Units
|
Amount
|
||||||||||||||||||||||||||||||
|
Balance as of December 31, 2015
|
$
|
—
|
|
53,400,000
|
|
$
|
1,290,135
|
|
146,384,247
|
|
$
|
3,305,222
|
|
2,833,326
|
|
$
|
33,986
|
|
$
|
(100,964
|
)
|
$
|
6,758
|
|
$
|
4,535,137
|
|
|||||||||
|
Conversion of limited partner common
units to general partner common units |
—
|
|
—
|
|
—
|
|
430,493
|
|
5,242
|
|
(430,493
|
)
|
(5,242
|
)
|
—
|
|
—
|
|
—
|
|
||||||||||||||||
|
Issuance of unvested restricted common units, net
of forfeitures |
—
|
|
—
|
|
—
|
|
120,082
|
|
—
|
|
—
|
|
—
|
|
—
|
|
—
|
|
—
|
|
||||||||||||||||
|
Issuance of common units, net of offering costs
|
—
|
|
—
|
|
—
|
|
12,000,000
|
|
1,085,444
|
|
—
|
|
—
|
|
—
|
|
—
|
|
1,085,444
|
|
||||||||||||||||
|
Issuance of common units in connection
with the exercise of stock options |
—
|
|
—
|
|
—
|
|
33,948
|
|
1,380
|
|
—
|
|
—
|
|
—
|
|
—
|
|
1,380
|
|
||||||||||||||||
|
Issuance of common units, net of forfeitures
|
—
|
|
—
|
|
—
|
|
—
|
|
—
|
|
72,830
|
|
—
|
|
—
|
|
—
|
|
—
|
|
||||||||||||||||
|
Preferred unit offering costs
|
—
|
|
—
|
|
(2
|
)
|
—
|
|
—
|
|
—
|
|
—
|
|
—
|
|
—
|
|
(2
|
)
|
||||||||||||||||
|
Units issued in connection with employee stock purchase plan
|
—
|
|
—
|
|
—
|
|
50,348
|
|
3,349
|
|
—
|
|
—
|
|
—
|
|
—
|
|
3,349
|
|
||||||||||||||||
|
Redemption of series E preferred units
|
—
|
|
(11,500,000
|
)
|
(277,172
|
)
|
—
|
|
(10,328
|
)
|
—
|
|
—
|
|
—
|
|
—
|
|
(287,500
|
)
|
||||||||||||||||
|
Amortization of unearned compensation on share-based awards
|
—
|
|
—
|
|
—
|
|
—
|
|
24,113
|
|
—
|
|
—
|
|
—
|
|
—
|
|
24,113
|
|
||||||||||||||||
|
Reclassification of vested share-based awards
|
—
|
|
—
|
|
—
|
|
—
|
|
(10,125
|
)
|
—
|
|
10,125
|
|
—
|
|
—
|
|
—
|
|
||||||||||||||||
|
Distributions
|
—
|
|
—
|
|
(83,771
|
)
|
—
|
|
(528,054
|
)
|
—
|
|
(9,469
|
)
|
—
|
|
—
|
|
(621,294
|
)
|
||||||||||||||||
|
Distributions to noncontrolling interests in
consolidated joint ventures, net of contributions |
—
|
|
—
|
|
—
|
|
—
|
|
—
|
|
—
|
|
—
|
|
—
|
|
(527
|
)
|
(527
|
)
|
||||||||||||||||
|
Net income
|
—
|
|
—
|
|
83,771
|
|
—
|
|
342,416
|
|
—
|
|
5,298
|
|
—
|
|
367
|
|
431,852
|
|
||||||||||||||||
|
Other comprehensive loss - foreign currency
translation adjustments |
—
|
|
—
|
|
—
|
|
—
|
|
—
|
|
—
|
|
—
|
|
(86,621
|
)
|
—
|
|
(86,621
|
)
|
||||||||||||||||
|
Other comprehensive loss - fair value of interest rate swaps and
foreign currency hedges |
—
|
|
—
|
|
—
|
|
—
|
|
—
|
|
—
|
|
—
|
|
41,998
|
|
—
|
|
41,998
|
|
||||||||||||||||
|
Other comprehensive income - reclassification
of accumulated other comprehensive loss to interest expense |
—
|
|
—
|
|
—
|
|
—
|
|
—
|
|
—
|
|
—
|
|
4,968
|
|
—
|
|
4,968
|
|
||||||||||||||||
|
Balance as of December 31, 2016
|
$
|
—
|
|
41,900,000
|
|
$
|
1,012,961
|
|
159,019,118
|
|
$
|
4,218,659
|
|
2,475,663
|
|
$
|
34,698
|
|
$
|
(140,619
|
)
|
$
|
6,598
|
|
$
|
5,132,297
|
|
|||||||||
See accompanying notes to the consolidated financial statements.
111
DIGITAL REALTY TRUST, L.P. AND SUBSIDIARIES
CONSOLIDATED STATEMENTS OF CAPITAL (continued)
(in thousands, except unit data)
|
|
Redeemable Limited Partner Common Units
|
General Partner
|
Limited Partners
|
Accumulated
Other
Comprehensive
Income (Loss)
|
Noncontrolling
Interests in
Consolidated
Joint Ventures
|
Total Capital
|
||||||||||||||||||||||||||||||
|
|
Preferred Units
|
Common Units
|
Common Units
|
|||||||||||||||||||||||||||||||||
|
|
Units
|
Amount
|
Units
|
Amount
|
Units
|
Amount
|
||||||||||||||||||||||||||||||
|
Balance as of December 31, 2016
|
$
|
—
|
|
41,900,000
|
|
$
|
1,012,961
|
|
159,019,118
|
|
$
|
4,218,659
|
|
2,475,663
|
|
$
|
34,698
|
|
$
|
(140,619
|
)
|
$
|
6,598
|
|
$
|
5,132,297
|
|
|||||||||
|
Conversion of limited partner common
units to general partner common units |
—
|
|
—
|
|
—
|
|
562,582
|
|
10,009
|
|
(562,582
|
)
|
(10,009
|
)
|
—
|
|
—
|
|
—
|
|
||||||||||||||||
|
Issuance of unvested restricted common units, net
of forfeitures |
—
|
|
—
|
|
—
|
|
249,050
|
|
—
|
|
—
|
|
—
|
|
—
|
|
—
|
|
—
|
|
||||||||||||||||
|
Issuance of common units in connection with DFT merger
|
66,259
|
|
—
|
|
—
|
|
43,175,629
|
|
5,247,558
|
|
6,111,770
|
|
676,566
|
|
—
|
|
—
|
|
5,924,124
|
|
||||||||||||||||
|
Issuance of common units, net of offering costs
|
—
|
|
—
|
|
—
|
|
2,375,000
|
|
211,897
|
|
—
|
|
—
|
|
—
|
|
—
|
|
211,897
|
|
||||||||||||||||
|
Issuance of common units in connection
with the exercise of stock options |
—
|
|
—
|
|
—
|
|
17,668
|
|
729
|
|
—
|
|
—
|
|
—
|
|
—
|
|
729
|
|
||||||||||||||||
|
Issuance of common units, net of forfeitures
|
—
|
|
—
|
|
—
|
|
—
|
|
—
|
|
464,244
|
|
—
|
|
—
|
|
—
|
|
—
|
|
||||||||||||||||
|
Units issued in connection with employee stock purchase plan
|
—
|
|
—
|
|
—
|
|
71,253
|
|
5,143
|
|
—
|
|
—
|
|
—
|
|
—
|
|
5,143
|
|
||||||||||||||||
|
Issuance of series C preferred units in connection with
DFT merger |
—
|
|
8,050,000
|
|
219,250
|
|
—
|
|
—
|
|
—
|
|
—
|
|
—
|
|
—
|
|
219,250
|
|
||||||||||||||||
|
Issuance of series J preferred units, net of offering costs
|
—
|
|
8,000,000
|
|
193,540
|
|
—
|
|
—
|
|
—
|
|
—
|
|
—
|
|
—
|
|
193,540
|
|
||||||||||||||||
|
Redemption of series F preferred units
|
—
|
|
(7,300,000
|
)
|
(176,191
|
)
|
—
|
|
(6,309
|
)
|
—
|
|
—
|
|
—
|
|
—
|
|
(182,500
|
)
|
||||||||||||||||
|
Amortization of unearned compensation on share-based awards
|
—
|
|
—
|
|
—
|
|
—
|
|
27,981
|
|
—
|
|
—
|
|
—
|
|
—
|
|
27,981
|
|
||||||||||||||||
|
Reclassification of vested share-based awards
|
—
|
|
—
|
|
—
|
|
—
|
|
(10,057
|
)
|
—
|
|
10,057
|
|
—
|
|
—
|
|
—
|
|
||||||||||||||||
|
Adjustment to redeemable common units
|
(12,357
|
)
|
—
|
|
—
|
|
—
|
|
4,166
|
|
—
|
|
8,191
|
|
—
|
|
—
|
|
12,357
|
|
||||||||||||||||
|
Distributions
|
—
|
|
—
|
|
(68,802
|
)
|
—
|
|
(681,280
|
)
|
—
|
|
(20,694
|
)
|
—
|
|
—
|
|
(770,776
|
)
|
||||||||||||||||
|
Distributions to noncontrolling interests in
consolidated joint ventures, net of contributions |
—
|
|
—
|
|
—
|
|
—
|
|
—
|
|
—
|
|
—
|
|
—
|
|
(8,593
|
)
|
(8,593
|
)
|
||||||||||||||||
|
Net income
|
—
|
|
—
|
|
68,802
|
|
—
|
|
179,457
|
|
—
|
|
3,770
|
|
—
|
|
4,238
|
|
256,267
|
|
||||||||||||||||
|
Other comprehensive income - foreign currency
translation adjustments |
—
|
|
—
|
|
—
|
|
—
|
|
—
|
|
—
|
|
—
|
|
28,709
|
|
—
|
|
28,709
|
|
||||||||||||||||
|
Other comprehensive loss - fair value of interest rate swaps and
foreign currency hedges |
—
|
|
—
|
|
—
|
|
—
|
|
—
|
|
—
|
|
—
|
|
(3,434
|
)
|
—
|
|
(3,434
|
)
|
||||||||||||||||
|
Other comprehensive income - reclassification
of accumulated other comprehensive loss to interest expense |
—
|
|
—
|
|
—
|
|
—
|
|
—
|
|
—
|
|
—
|
|
2,459
|
|
—
|
|
2,459
|
|
||||||||||||||||
|
Balance as of December 31, 2017
|
$
|
53,902
|
|
50,650,000
|
|
$
|
1,249,560
|
|
205,470,300
|
|
$
|
9,207,953
|
|
8,489,095
|
|
$
|
702,579
|
|
$
|
(112,885
|
)
|
$
|
2,243
|
|
$
|
11,049,450
|
|
|||||||||
See accompanying notes to the consolidated financial statements.
112
DIGITAL REALTY TRUST, L.P. AND SUBSIDIARIES
CONSOLIDATED STATEMENTS OF CAPITAL (continued)
(in thousands, except unit data)
|
|
Redeemable Limited Partner Common Units
|
General Partner
|
Limited Partners
|
Accumulated
Other
Comprehensive
Income (Loss)
|
Noncontrolling
Interests in
Consolidated
Joint Ventures
|
Total Capital
|
||||||||||||||||||||||||||||||
|
|
Preferred Units
|
Common Units
|
Common Units
|
|||||||||||||||||||||||||||||||||
|
|
Units
|
Amount
|
Units
|
Amount
|
Units
|
Amount
|
||||||||||||||||||||||||||||||
|
Balance as of December 31, 2017
|
$
|
53,902
|
|
50,650,000
|
|
$
|
1,249,560
|
|
205,470,300
|
|
$
|
9,207,953
|
|
8,489,095
|
|
$
|
702,579
|
|
$
|
(112,885
|
)
|
$
|
2,243
|
|
$
|
11,049,450
|
|
|||||||||
|
Conversion of limited partner common
units to general partner common units |
—
|
|
—
|
|
—
|
|
711,892
|
|
62,004
|
|
(711,892
|
)
|
(62,004
|
)
|
—
|
|
—
|
|
—
|
|
||||||||||||||||
|
Issuance of unvested restricted common units, net
of forfeitures |
—
|
|
—
|
|
—
|
|
220,765
|
|
|
—
|
|
—
|
|
—
|
|
—
|
|
—
|
|
—
|
|
|||||||||||||||
|
Common unit offering costs
|
—
|
|
—
|
|
—
|
|
—
|
|
|
1,194
|
|
—
|
|
—
|
|
—
|
|
—
|
|
1,194
|
|
|||||||||||||||
|
Issuance of units in connection with
Ascenty Acquisition |
—
|
|
—
|
|
—
|
|
—
|
|
—
|
|
2,338,874
|
|
253,837
|
|
—
|
|
25,000
|
|
278,837
|
|
||||||||||||||||
|
Issuance of common units, net of forfeitures
|
—
|
|
—
|
|
—
|
|
—
|
|
|
—
|
|
464,807
|
|
—
|
|
—
|
|
—
|
|
—
|
|
|||||||||||||||
|
Units issued in connection with employee stock purchase plan
|
—
|
|
—
|
|
—
|
|
69,532
|
|
5,874
|
|
—
|
|
—
|
|
—
|
|
—
|
|
5,874
|
|
||||||||||||||||
|
Units repurchased and retired to satisfy tax withholding upon vesting
|
—
|
|
—
|
|
—
|
|
(46,833
|
)
|
(5,055
|
)
|
—
|
|
—
|
|
—
|
|
—
|
|
(5,055
|
)
|
||||||||||||||||
|
Amortization of unearned compensation on share-based awards
|
—
|
|
—
|
|
—
|
|
—
|
|
32,456
|
|
—
|
|
—
|
|
—
|
|
—
|
|
32,456
|
|
||||||||||||||||
|
Reclassification of vested share-based awards
|
—
|
|
—
|
|
—
|
|
—
|
|
(3,772
|
)
|
—
|
|
3,772
|
|
|
—
|
|
|
—
|
|
—
|
|
||||||||||||||
|
Adjustment to redeemable common units
|
(37,274
|
)
|
—
|
|
—
|
|
—
|
|
1,596
|
|
—
|
|
35,678
|
|
—
|
|
—
|
|
37,274
|
|
||||||||||||||||
|
Distributions
|
(1,271
|
)
|
—
|
|
(81,316
|
)
|
—
|
|
(833,364
|
)
|
—
|
|
(32,311
|
)
|
—
|
|
|
—
|
|
(946,991
|
)
|
|||||||||||||||
|
Contributions from noncontrolling interests in
consolidated joint ventures, net of distributions |
—
|
|
—
|
|
—
|
|
—
|
|
—
|
|
—
|
|
—
|
|
|
—
|
|
|
66,124
|
|
66,124
|
|
||||||||||||||
|
Cumulative effect adjustment from adoption of new accounting standard
|
—
|
|
—
|
|
—
|
|
—
|
|
5,915
|
|
—
|
|
—
|
|
—
|
|
—
|
|
5,915
|
|
||||||||||||||||
|
Net income
|
475
|
|
—
|
|
81,316
|
|
—
|
|
249,930
|
|
—
|
|
9,705
|
|
|
—
|
|
|
(311
|
)
|
340,640
|
|
||||||||||||||
|
Other comprehensive income - foreign currency
translation adjustments |
—
|
|
—
|
|
—
|
|
—
|
|
—
|
|
—
|
|
—
|
|
|
(11,736
|
)
|
—
|
|
(11,736
|
)
|
|||||||||||||||
|
Other comprehensive loss - fair value of interest rate swaps
|
—
|
|
—
|
|
—
|
|
—
|
|
—
|
|
—
|
|
—
|
|
|
8,197
|
|
—
|
|
8,197
|
|
|||||||||||||||
|
Other comprehensive income - reclassification
of accumulated other comprehensive income to interest expense |
—
|
|
—
|
|
—
|
|
—
|
|
—
|
|
—
|
|
—
|
|
|
(3,969
|
)
|
|
—
|
|
(3,969
|
)
|
||||||||||||||
|
Balance as of December 31, 2018
|
$
|
15,832
|
|
50,650,000
|
|
$
|
1,249,560
|
|
206,425,656
|
|
$
|
8,724,731
|
|
10,580,884
|
|
$
|
911,256
|
|
$
|
(120,393
|
)
|
$
|
93,056
|
|
$
|
10,858,210
|
|
|||||||||
See accompanying notes to the consolidated financial statements.
113
DIGITAL REALTY TRUST, L.P. AND SUBSIDIARIES
CONSOLIDATED STATEMENTS OF CASH FLOWS
(in thousands)
|
Year Ended December 31,
|
|||||||||||
|
|
2018
|
2017
|
2016
|
||||||||
|
Cash flows from operating activities:
|
|||||||||||
|
Net income
|
$
|
341,115
|
|
$
|
256,267
|
|
$
|
431,852
|
|
||
|
Adjustments to reconcile net income to net cash provided by operating activities:
|
|||||||||||
|
Gain on sale of properties
|
(80,049
|
)
|
(40,354
|
)
|
(169,902
|
)
|
|||||
|
Gain on lease termination
|
—
|
|
—
|
|
(29,205
|
)
|
|||||
|
Unrealized gain on marketable equity security
|
(1,631
|
)
|
—
|
|
—
|
|
|||||
|
Impairment of investments in real estate
|
—
|
|
28,992
|
|
—
|
|
|||||
|
Equity in earnings of unconsolidated joint ventures
|
(32,979
|
)
|
(25,516
|
)
|
(17,104
|
)
|
|||||
|
Distributions from unconsolidated joint ventures
|
21,905
|
|
31,747
|
|
16,755
|
|
|||||
|
Write-off of net assets due to early lease terminations
|
2,818
|
|
3,076
|
|
213
|
|
|||||
|
Depreciation and amortization of buildings and improvements, tenant improvements
and acquired ground leases
|
770,275
|
|
594,996
|
|
518,716
|
|
|||||
|
Amortization of acquired in-place lease value, deferred leasing costs
and intangibles |
416,621
|
|
247,468
|
|
180,608
|
|
|||||
|
Amortization of share-based unearned compensation
|
27,159
|
|
20,521
|
|
17,433
|
|
|||||
|
Non-cash amortization of terminated interest rate swaps
|
1,120
|
|
1,204
|
|
—
|
|
|||||
|
(Recovery of) allowance for doubtful accounts
|
6,304
|
|
(776
|
)
|
1,602
|
|
|||||
|
Amortization of deferred financing costs
|
11,537
|
|
10,634
|
|
9,908
|
|
|||||
|
Loss (gain) on early extinguishment of debt
|
1,568
|
|
(1,990
|
)
|
1,011
|
|
|||||
|
Amortization of debt discount/premium
|
3,538
|
|
2,992
|
|
2,616
|
|
|||||
|
Amortization of acquired above-market leases and acquired
below-market leases, net |
26,530
|
|
1,770
|
|
(8,351
|
)
|
|||||
|
Changes in assets and liabilities, net of impact of business combinations
|
|||||||||||
|
Accounts and other receivables
|
(21,318
|
)
|
(73,717
|
)
|
(13,754
|
)
|
|||||
|
Deferred rent
|
(39,905
|
)
|
(16,564
|
)
|
(24,401
|
)
|
|||||
|
Deferred leasing costs
|
(72,104
|
)
|
(15,363
|
)
|
60
|
|
|||||
|
Other assets
|
(9,145
|
)
|
(1,800
|
)
|
(69,924
|
)
|
|||||
|
Accounts payable and other accrued liabilities
|
39,192
|
|
(16,384
|
)
|
38,432
|
|
|||||
|
Security deposits and prepaid rents
|
(27,227
|
)
|
16,102
|
|
24,677
|
|
|||||
|
Net cash provided by operating activities
|
1,385,324
|
|
1,023,305
|
|
911,242
|
|
|||||
|
Cash flows from investing activities:
|
|||||||||||
|
Improvements to and advances for investments in real estate
|
(1,325,162
|
)
|
(1,150,619
|
)
|
(758,081
|
)
|
|||||
|
Ascenty acquisition
|
(1,679,830
|
)
|
—
|
|
—
|
|
|||||
|
Cash assumed in business combinations
|
116,000
|
|
20,650
|
|
—
|
|
|||||
|
Acquisitions of real estate, net of cash acquired
|
(410,712
|
)
|
(415,764
|
)
|
(873,285
|
)
|
|||||
|
Proceeds from sale of assets, net of sales costs
|
286,204
|
|
89,333
|
|
359,319
|
|
|||||
|
Distribution of debt proceeds from closing of joint venture
|
—
|
|
135,793
|
|
—
|
|
|||||
|
Investments in unconsolidated joint ventures
|
(673
|
)
|
(93,405
|
)
|
—
|
|
|||||
|
Excess proceeds from forward contract settlement
|
—
|
|
63,956
|
|
—
|
|
|||||
|
Prepaid construction costs and other investments
|
(13,254
|
)
|
—
|
|
(32,095
|
)
|
|||||
|
Improvement advances to tenants
|
(48,502
|
)
|
(50,857
|
)
|
(16,239
|
)
|
|||||
|
Collection of advances from tenants for improvements
|
39,936
|
|
43,760
|
|
16,784
|
|
|||||
|
Net cash used in investing activities
|
(3,035,993
|
)
|
(1,357,153
|
)
|
(1,303,597
|
)
|
|||||
114
DIGITAL REALTY TRUST, L.P. AND SUBSIDIARIES
CONSOLIDATED STATEMENTS OF CASH FLOWS (continued)
(in thousands)
|
|
Year Ended December 31,
|
||||||||||
|
|
2018
|
2017
|
2016
|
||||||||
|
Cash flows from financing activities:
|
|||||||||||
|
Borrowings on global revolving credit facility
|
$
|
3,046,245
|
|
$
|
2,180,556
|
|
$
|
2,533,507
|
|
||
|
Repayments on global revolving credit facility
|
(1,945,594
|
)
|
(2,304,686
|
)
|
(3,283,087
|
)
|
|||||
|
Borrowings on unsecured term loans
|
467,922
|
|
—
|
|
766,201
|
|
|||||
|
Repayments on unsecured term loans
|
(674,332
|
)
|
(371,520
|
)
|
(170,736
|
)
|
|||||
|
Borrowings on unsecured senior notes
|
1,169,006
|
|
2,265,060
|
|
675,591
|
|
|||||
|
Principal payments on unsecured senior notes
|
—
|
|
(884,841
|
)
|
—
|
|
|||||
|
Borrowings on secured debt
|
600,000
|
|
104,000
|
|
—
|
|
|||||
|
Principal payments on secured debt
|
(594
|
)
|
(105,546
|
)
|
(299,826
|
)
|
|||||
|
Repayments on other secured loans
|
—
|
|
(50,000
|
)
|
(25,000
|
)
|
|||||
|
Earnout payments related to acquisitions
|
—
|
|
—
|
|
(23,213
|
)
|
|||||
|
Payment of loan fees and costs
|
(44,299
|
)
|
(16,830
|
)
|
(19,574
|
)
|
|||||
|
Capital contributions from (distributions to) noncontrolling
interests in consolidated joint ventures, net |
66,124
|
|
(8,593
|
)
|
(527
|
)
|
|||||
|
Taxes paid related to net settlement of stock-based compensation awards
|
(5,055
|
)
|
—
|
|
—
|
|
|||||
|
General partner contributions
|
7,068
|
|
228,809
|
|
802,671
|
|
|||||
|
Proceeds from forward swap contracts
|
1,560
|
|
—
|
|
—
|
|
|||||
|
Payment of distributions to preferred unitholders
|
(81,316
|
)
|
(68,802
|
)
|
(83,771
|
)
|
|||||
|
Payment of distributions to common unitholders
|
(849,466
|
)
|
(646,407
|
)
|
(521,619
|
)
|
|||||
|
Net cash provided by financing activities
|
1,757,269
|
|
321,200
|
|
350,617
|
|
|||||
|
Net increase (decrease) in cash, cash equivalents and restricted cash
|
106,600
|
|
(12,648
|
)
|
(41,738
|
)
|
|||||
|
Effect of exchange rate changes on cash, cash equivalents and restricted cash
|
15,441
|
|
3,793
|
|
(11,288
|
)
|
|||||
|
Cash, cash equivalents and restricted cash at beginning of year
|
13,181
|
|
22,036
|
|
75,062
|
|
|||||
|
Cash, cash equivalents and restricted cash at end of year
|
$
|
135,222
|
|
$
|
13,181
|
|
$
|
22,036
|
|
||
115
DIGITAL REALTY TRUST, L.P. AND SUBSIDIARIES
CONSOLIDATED STATEMENTS OF CASH FLOWS (continued)
(in thousands)
|
|
Year Ended December 31,
|
||||||||||
|
|
2018
|
2017
|
2016
|
||||||||
|
Supplemental disclosure of cash flow information:
|
|||||||||||
|
Cash paid for interest, net of amounts capitalized
|
$
|
288,643
|
|
$
|
211,549
|
|
$
|
216,713
|
|
||
|
Cash paid for income taxes
|
11,224
|
|
9,456
|
|
3,698
|
|
|||||
|
Supplementary disclosure of noncash investing and financing activities:
|
|||||||||||
|
Change in net assets related to foreign currency translation adjustments
|
$
|
(11,736
|
)
|
$
|
28,709
|
|
$
|
(86,621
|
)
|
||
|
Accrual of distributions
|
217,241
|
|
199,761
|
|
144,194
|
|
|||||
|
Increase (decrease) in accounts payable and other accrued liabilities related to
change in fair value of interest rate swaps |
8,197
|
|
(3,434
|
)
|
41,998
|
|
|||||
|
Accrual for additions to investments in real estate and tenant improvement
advances included in accounts payable and accrued expenses
|
189,508
|
|
149,548
|
|
128,531
|
|
|||||
|
Assumption of capital lease obligations upon acquisition
|
75,030
|
|
—
|
|
118,923
|
|
|||||
|
Non-cash derecognition of capital lease obligation
|
17,294
|
|
—
|
|
—
|
|
|||||
|
Allocation of purchase price of real estate/investment in partnership to:
|
|||||||||||
|
Investments in real estate
|
$
|
410,712
|
|
$
|
366,105
|
|
$
|
378,431
|
|
||
|
Accounts receivable
|
—
|
|
—
|
|
8,537
|
|
|||||
|
Goodwill
|
—
|
|
—
|
|
448,123
|
|
|||||
|
Acquired above-market leases
|
—
|
|
21,043
|
|
—
|
|
|||||
|
Acquired in-place lease value and deferred leasing costs
|
—
|
|
30,111
|
|
226,877
|
|
|||||
|
Other assets
|
—
|
|
—
|
|
9,011
|
|
|||||
|
Capital lease obligations
|
—
|
|
—
|
|
(118,923
|
)
|
|||||
|
Acquired below-market leases
|
—
|
|
(1,495
|
)
|
(922
|
)
|
|||||
|
Accounts payables and other accrued liabilities
|
—
|
|
—
|
|
(69,084
|
)
|
|||||
|
Security deposits and prepaid rents
|
—
|
|
—
|
|
(8,765
|
)
|
|||||
|
Cash paid for acquisition of real estate
|
$
|
410,712
|
|
$
|
415,764
|
|
$
|
873,285
|
|
||
|
Allocation of purchase price to business combinations:
|
|||||||||||
|
Cash and cash equivalents
|
$
|
116,000
|
|
$
|
20,650
|
|
$
|
—
|
|
||
|
Land
|
—
|
|
312,579
|
|
—
|
|
|||||
|
Buildings and improvements
|
425,000
|
|
3,677,497
|
|
—
|
|
|||||
|
Accounts receivables and other assets
|
30,000
|
|
10,978
|
|
—
|
|
|||||
|
Acquired above-market leases
|
—
|
|
162,333
|
|
—
|
|
|||||
|
Tenant relationship and acquired in-place lease value
|
495,000
|
|
1,582,385
|
|
—
|
|
|||||
|
Goodwill
|
982,667
|
|
2,592,181
|
|
—
|
|
|||||
|
Revolving credit facility
|
—
|
|
(450,697
|
)
|
—
|
|
|||||
|
Unsecured term loan
|
—
|
|
(250,000
|
)
|
—
|
|
|||||
|
Unsecured notes
|
—
|
|
(886,831
|
)
|
—
|
|
|||||
|
Secured debt
|
—
|
|
(105,000
|
)
|
—
|
|
|||||
|
Accounts payable and other accrued liabilities
|
(90,000
|
)
|
(248,259
|
)
|
—
|
|
|||||
116
|
|
Year Ended December 31,
|
||||||||||
|
|
2018
|
2017
|
2016
|
||||||||
|
Acquired below-market leases
|
—
|
|
(185,543
|
)
|
—
|
|
|||||
|
Other working capital, net
|
—
|
|
(22,640
|
)
|
—
|
|
|||||
|
Redeemable noncontrolling interests -- operating partnership
|
—
|
|
(66,259
|
)
|
—
|
|
|||||
|
Common units issued to general partner in connection with merger
|
—
|
|
(5,247,558
|
)
|
—
|
|
|||||
|
Common units issued to limited partners in connection with merger
|
(253,837
|
)
|
(676,566
|
)
|
—
|
|
|||||
|
Noncontrolling interests in consolidated joint venture
|
(25,000
|
)
|
—
|
|
—
|
|
|||||
|
Issuance of preferred units in connection with merger
|
—
|
|
(219,250
|
)
|
—
|
|
|||||
|
Cash consideration
|
$
|
1,679,830
|
|
$
|
—
|
|
$
|
—
|
|
||
|
Contribution of assets and liabilities to unconsolidated joint venture:
|
|||||||||||
|
Investments in real estate
|
$
|
—
|
|
$
|
119,106
|
|
$
|
—
|
|
||
|
Other assets
|
—
|
|
16,700
|
|
—
|
|
|||||
|
Other liabilities
|
—
|
|
(31,634
|
)
|
—
|
|
|||||
See accompanying notes to the consolidated financial statements.
117
DIGITAL REALTY TRUST, INC. AND SUBSIDIARIES
DIGITAL REALTY TRUST, L.P. AND SUBSIDIARIES
NOTES TO CONSOLIDATED FINANCIAL STATEMENTS
December 31, 2018 and 2017
1. Organization and Description of Business
Digital Realty Trust, Inc. through its controlling interest in Digital Realty Trust, L.P. (the Operating Partnership) and the subsidiaries of the Operating Partnership (collectively, we, our, us or the Company) is a leading global provider of data center, colocation and interconnection solutions for customers across a variety of industry verticals ranging from cloud and information technology services, communications and social networking to financial services, manufacturing, energy, healthcare, and consumer products. The Operating Partnership, a Maryland limited partnership, is the entity through which Digital Realty Trust, Inc., a Maryland corporation, conducts its business of owning, acquiring, developing and operating data centers. Digital Realty Trust, Inc. operates as a REIT for federal income tax purposes. A summary of our data center portfolio as of
December 31, 2018
and
2017
is as follows:
|
Data Centers
|
||||||||||||||||||||||
|
As of December 31, 2018
|
As of December 31, 2017
|
|||||||||||||||||||||
|
Region
|
Operating
|
Held for Sale
|
Unconsolidated Joint Ventures
|
Total
|
Operating
|
Held for Sale
|
Unconsolidated Joint Ventures
|
Total
|
||||||||||||||
|
United States
|
131
|
|
|
—
|
|
14
|
|
145
|
|
131
|
|
(2
|
)
|
7
|
|
14
|
|
152
|
|
|||
|
Europe
|
38
|
|
—
|
|
—
|
|
38
|
|
38
|
|
—
|
|
—
|
|
38
|
|
||||||
|
Latin America
|
16
|
|
(1
|
)
|
—
|
|
16
|
|
—
|
|
—
|
|
—
|
|
—
|
|
||||||
|
Asia
|
3
|
|
—
|
|
4
|
|
7
|
|
3
|
|
—
|
|
4
|
|
7
|
|
||||||
|
Australia
|
5
|
|
—
|
|
—
|
|
5
|
|
5
|
|
—
|
|
—
|
|
5
|
|
||||||
|
Canada
|
3
|
|
|
—
|
|
—
|
|
3
|
|
3
|
|
(2
|
)
|
—
|
|
—
|
|
3
|
|
|||
|
Total
|
196
|
|
—
|
|
18
|
|
214
|
|
180
|
|
7
|
|
18
|
|
205
|
|
||||||
|
(1)
|
Includes
16
data centers acquired as part of the Ascenty Acquisition,
eight
of which are under construction.
|
|
(2)
|
Includes
15
data centers acquired as part of the merger with DuPont Fabros Technology, Inc., of which
14
are located in the United States and
one
is located in Canada.
|
On December 20, 2018, the Operating Partnership and Stellar Participações Ltda., a Brazilian subsidiary of the Operating Partnership, completed the acquisition of Ascenty, a leading data center provider in Brazil, for cash and equity consideration of approximately
$1.8 billion
, net of cash purchased. We refer to this transaction as the Ascenty Acquisition. Separately, we entered into an independent bilateral equity commitment letter with Brookfield Infrastructure, an affiliate of Brookfield Asset Management, one of the largest owners and operators of infrastructure assets globally, under which Brookfield has committed to fund approximately
$700 million
(unaudited), excluding Brookfield's share of transaction costs, in exchange for
49%
of the total equity interests in a joint venture entity expected to ultimately own Ascenty. The agreement with Brookfield is subject to certain closing conditions and is expected to close in the first quarter of 2019.
We are diversified in major metropolitan areas where data center and technology customers are concentrated, including the Atlanta, Boston, Chicago, Dallas, Los Angeles, New York, Northern Virginia, Phoenix, San Francisco, Seattle, Silicon Valley and Toronto metropolitan areas in North America, the Amsterdam, Dublin, Frankfurt, London and Paris metropolitan areas in Europe, the Fortaleza, Rio de Janeiro and São Paulo metropolitan areas in Latin America, and the Hong Kong, Melbourne, Osaka, Singapore, Sydney, and Tokyo metropolitan areas in the Asia Pacific region. The portfolio consists of data centers, Internet gateway facilities and office and other non-data center space.
The Operating Partnership was formed on July 21, 2004 in anticipation of Digital Realty Trust, Inc.’s initial public offering (IPO) on November 3, 2004 and commenced operations on that date. As of
December 31, 2018
, Digital Realty Trust, Inc. owns a
95.1%
common interest and a
100.0%
preferred interest in the Operating Partnership. As of
December 31, 2017
, Digital Realty Trust, Inc. owned a
96.0%
common interest and a
100.0%
preferred interest in the Operating Partnership. As sole
118
general partner of the Operating Partnership, Digital Realty Trust, Inc. has the full, exclusive and complete responsibility for the Operating Partnership’s day-to-day management and control. The limited partners of the Operating Partnership do not have rights to replace Digital Realty Trust, Inc. as the general partner nor do they have participating rights, although they do have certain protective rights.
2. Summary of Significant Accounting Policies
(a) Principles of Consolidation and Basis of Presentation
The accompanying consolidated financial statements include all of the accounts of Digital Realty Trust, Inc., the Operating Partnership and the subsidiaries of the Operating Partnership. Intercompany balances and transactions have been eliminated.
The notes to the consolidated financial statements of Digital Realty Trust, Inc. and the Operating Partnership have been combined to provide the following benefits:
|
•
|
enhancing investors’ understanding of the Company and the Operating Partnership by enabling investors to view the business as a whole in the same manner as management views and operates the business;
|
|
•
|
eliminating duplicative disclosure and providing a more streamlined and readable presentation since a substantial portion of the disclosure applies to both the Company and the Operating Partnership; and
|
|
•
|
creating time and cost efficiencies through the preparation of one set of notes instead of two separate sets of notes.
|
There are few differences between the Company and the Operating Partnership, which are reflected in these consolidated financial statements. We believe it is important to understand the differences between the Company and the Operating Partnership in the context of how we operate as an interrelated consolidated company. Digital Realty Trust, Inc.’s only material asset is its ownership of partnership interests of the Operating Partnership. As a result, Digital Realty Trust, Inc. generally does not conduct business itself, other than acting as the sole general partner of the Operating Partnership, issuing public securities from time to time and guaranteeing certain unsecured debt of the Operating Partnership and certain of its subsidiaries and affiliates. Digital Realty Trust, Inc. itself has not issued any indebtedness but guarantees the unsecured debt of the Operating Partnership and certain of its subsidiaries and affiliates, as disclosed in these notes.
The Operating Partnership holds substantially all the assets of the Company and holds the ownership interests in the Company’s joint ventures. The Operating Partnership conducts the operations of the business and is structured as a partnership with no publicly traded equity. Except for net proceeds from public equity issuances by Digital Realty Trust, Inc., which are generally contributed to the Operating Partnership in exchange for partnership units, the Operating Partnership generally generates the capital required by the Company’s business primarily through the Operating Partnership’s operations, by the Operating Partnership’s or its affiliates’ direct or indirect incurrence of indebtedness or through the issuance of partnership units.
The presentation of noncontrolling interests in operating partnership, stockholders’ equity and partners’ capital are the main areas of difference between the consolidated financial statements of Digital Realty Trust, Inc. and those of the Operating Partnership. The common limited partnership interests held by the limited partners in the Operating Partnership are presented as limited partners’ capital within partners’ capital in the Operating Partnership’s consolidated financial statements and as noncontrolling interests in operating partnership within equity in Digital Realty Trust, Inc.’s consolidated financial statements. The common and preferred partnership interests held by Digital Realty Trust, Inc. in the Operating Partnership are presented as general partner’s capital within partners’ capital in the Operating Partnership’s consolidated financial statements and as preferred stock, common stock, additional paid-in capital and accumulated dividends in excess of earnings within stockholders’ equity in Digital Realty Trust, Inc.’s consolidated financial statements. The differences in the presentations between stockholders’ equity and partners’ capital result from the differences in the equity issued at the Digital Realty Trust, Inc. and the Operating Partnership levels.
To help investors understand the significant differences between the Company and the Operating Partnership, these consolidated financial statements present the following separate sections for each of the Company and the Operating Partnership:
|
•
|
consolidated face financial statements; and
|
|
•
|
the following notes to the consolidated financial statements:
|
|
•
|
"Debt of the Company" and "Debt of the Operating Partnership";
|
|
•
|
"Income per Share" and "Income per Unit";
|
119
DIGITAL REALTY TRUST, INC. AND SUBSIDIARIES
DIGITAL REALTY TRUST, L.P. AND SUBSIDIARIES
NOTES TO CONSOLIDATED FINANCIAL STATEMENTS- (Continued)
December 31, 2018 and 2017
|
•
|
"Equity and Accumulated Other Comprehensive Loss, Net of the Company" and Capital and Accumulated Other Comprehensive Loss of the Operating Partnership"; and
|
|
•
|
"Quarterly Financial Information".
|
In the sections that combine disclosure of Digital Realty Trust, Inc. and the Operating Partnership, these notes refer to actions or holdings as being actions or holdings of the Company. Although the Operating Partnership is generally the entity that enters into contracts and joint ventures and holds assets and debt, reference to the Company is appropriate because the business is one enterprise and the Company generally operates the business through the Operating Partnership.
(b) Cash Equivalents
For the purpose of the consolidated statements of cash flows, we consider short-term investments with original maturities of
90
days or less to be cash equivalents. As of
December 31, 2018
and
2017
, cash equivalents consist of investments in money market instruments. Financial instruments which potentially subject the Company to concentration of credit risk consist of cash and cash equivalents held in denominations subject to economic uncertainty and exchange rate volatility, such as Brazil.
(c) Investments in Real Estate
Investments in real estate are stated at cost, less accumulated depreciation and amortization. Land is not depreciated. Depreciation and amortization are recorded on a straight-line basis over the estimated useful lives as follows:
|
Acquired ground leases
|
|
Terms of the related lease
|
|
Buildings and improvements
|
|
5-39 years
|
|
Machinery and equipment
|
7-15 years
|
|
|
Furniture and fixtures
|
3-5 years
|
|
|
Leasehold improvements
|
Shorter of the estimated useful lives or the terms of the related leases
|
|
|
Tenant improvements
|
|
Shorter of the estimated useful lives or the terms of the related leases
|
Improvements and replacements are capitalized when they extend the useful life, increase capacity, or improve the efficiency of the asset. Repairs and maintenance are charged to expense as incurred.
Assets that are classified as held for sale are recorded at the lower of their carrying value or fair value less costs to dispose. We classify an asset as held for sale once management has the authority to approve and commits to a plan to sell, the asset is available for immediate sale, an active program to locate a buyer has commenced and the sale of the asset is probable and transfer of the asset is expected to occur within one year. Upon the classification of assets as held for sale or sold, the depreciation and amortization of the assets will cease.
(d) Investments in Unconsolidated Joint Ventures
The Company’s investments in unconsolidated joint ventures are accounted for using the equity method, whereby our investment is increased for capital contributed and our share of the joint venture's net income and decreased by distributions we receive and our share of any losses of the joint ventures. We do not record losses of the joint ventures in excess of our investment balances unless we are liable for the obligations of the joint venture or are otherwise committed to provide financial support to the joint venture. Likewise, and as long as we have no explicit or implicit obligations to the joint venture, we will suspend equity method accounting to the extent that cash distributions exceed our investment balances until those unrecorded earnings exceed the excess distributions previously recognized in income. In this case, we will apply cost accounting concepts which tie income recognition to the receipt of cash. Cost basis accounting concepts will apply until earnings exceed the excess distributions previously recognized in income.
We amortize the difference between the cost of our investment in the joint ventures and the book value of the underlying equity into income on a straight-line basis consistent with the lives of the underlying assets. The amortization of this difference was immaterial for each of the years ended
December 31, 2018
,
2017
and
2016
.
120
DIGITAL REALTY TRUST, INC. AND SUBSIDIARIES
DIGITAL REALTY TRUST, L.P. AND SUBSIDIARIES
NOTES TO CONSOLIDATED FINANCIAL STATEMENTS- (Continued)
December 31, 2018 and 2017
(e) Impairment of Long-Lived and Finite-Lived Intangible Assets
We review each of our properties for indicators that its carrying amount may not be recoverable. Examples of such indicators may include a significant decrease in the market price of the property, a change in the expected holding period for the property, a significant adverse change in how the property is being used or expected to be used based on the underwriting at the time of acquisition, an accumulation of costs significantly in excess of the amount originally expected for the acquisition or development of the property, or a history of operating or cash flow losses of the property. When such impairment indicators exist, we review an estimate of the future undiscounted net cash flows (excluding interest charges) expected to result from the real estate investment’s use and eventual disposition and compare that estimate to the carrying value of the property. We consider factors such as future operating income, trends and prospects, as well as the effects of leasing demand, competition and other factors. If our future undiscounted net cash flow evaluation indicates that we are unable to recover the carrying value of a real estate investment, an impairment loss is recorded to the extent that the carrying value exceeds the estimated fair value of the property. These losses have a direct impact on our net income because recording an impairment loss results in an immediate negative adjustment to net income. The evaluation of anticipated cash flows is highly subjective and is based in part on assumptions regarding future occupancy, rental rates and capital requirements that could differ materially from actual results in future periods. Since cash flows on properties considered to be long-lived assets to be held and used are considered on an undiscounted basis to determine whether the carrying value of a property is recoverable, our strategy of holding properties over the long-term directly decreases the likelihood of their carrying values not being recoverable and therefore requiring the recording of an impairment loss. If our strategy changes or market conditions otherwise dictate an earlier sale date, an impairment loss may be recognized and such loss could be material. If we determine that the asset fails the recoverability test, the affected assets must be reduced to their fair value.
We generally estimate the fair value of rental properties utilizing a discounted cash flow analysis that includes projections of future revenues, expenses and capital improvement costs that a market participant would use based on the highest and best use of the asset, which is similar to the income approach that is commonly utilized by appraisers. In certain cases, we may supplement this analysis by obtaining outside broker opinions of value.
In considering whether to classify a property as held for sale, the Company considers whether: (i) management has committed to a plan to sell the property; (ii) the property is available for immediate sale in its present condition; (iii) the Company has initiated a program to locate a buyer; (iv) the Company believes that the sale of the property is probable; (v) the Company is actively marketing the property for sale at a price that is reasonable in relation to its current value; and (vi) actions required for the Company to complete the plan indicate that it is unlikely that any significant changes will be made to the plan.
If all the above criteria are met, the Company classifies the property as held for sale. Upon being classified as held for sale, the Company ceases all depreciation and amortization related to the property and it is recorded at the lower of its carrying amount or fair value less cost to sell. The assets and related liabilities of the property are classified separately on the consolidated balance sheets for the most recent reporting period. Only those assets held for sale that constitute a strategic shift that has or will have a major effect on our operations are classified as discontinued operations. To date we have had no property dispositions or assets classified as held for sale that would meet the definition of discontinued operations.
If impairment indicators arise with respect to intangible assets with finite useful lives, we evaluate impairment by comparing the carrying amount of the asset to the estimated future undiscounted net cash flows expected to be generated by the asset. If estimated future undiscounted net cash flows are less than the carrying amount of the asset, then we estimate the fair value of the asset and compare the estimated fair value to the intangible asset’s carrying value. We recognize any shortfall from carrying value as an impairment loss in the current period.
(f) Purchase Accounting
Purchase accounting is applied to the assets and liabilities related to all real estate investments acquired from third parties. The Company evaluates the nature of the purchase to determine whether the purchase is a business combination or an asset acquisition. Transaction costs associated with business combinations are expensed as incurred while transaction costs associated with an asset acquisition are included in the total costs of the acquisition and are allocated on a pro-rata basis to the carrying value of the assets and liabilities recognized in connection with the acquisition. The following accounting policies related to valuing the acquired tangible and intangible assets and liabilities are applicable to both business combinations and asset acquisitions. However, in the event the purchase is an asset acquisition, no goodwill or gain is permitted to be recognized.
121
DIGITAL REALTY TRUST, INC. AND SUBSIDIARIES
DIGITAL REALTY TRUST, L.P. AND SUBSIDIARIES
NOTES TO CONSOLIDATED FINANCIAL STATEMENTS- (Continued)
December 31, 2018 and 2017
In an asset acquisition, the difference between the sum of the identified tangible and intangible assets and liabilities and the total purchase price (including transactions costs) is allocated to the identified tangible and intangible assets and liabilities on a relative fair value basis. In accordance with current accounting guidance
,
the fair value of the real estate acquired is allocated to the acquired tangible assets, consisting primarily of land, building and tenant improvements, and identified intangible assets and liabilities, consisting of the value of above-market and below-market leases, value of in-place leases and acquired ground leases and in the case of a business combination, tenant relationship value, based in each case on their fair values. Loan premiums, in the case of above-market rate loans, or loan discounts, in the case of below-market loans, are recorded based on the fair value of any loans assumed in connection with acquiring the real estate.
The fair values of the tangible assets of an acquired property are determined based on comparable land sales for land and replacement costs adjusted for physical and market obsolescence for the improvements. The fair values of the tangible assets of an acquired property are also determined by valuing the property as if it were vacant, and the “as-if-vacant” value is then allocated to land, building and tenant improvements based on management’s determination of the relative fair values of these assets. Management determines the as-if-vacant fair value of a property based on assumptions that a market participant would use, which is similar to methods used by independent appraisers. Factors considered by management in performing these analyses include an estimate of carrying costs during the expected lease-up periods considering current market conditions and costs to execute similar leases. In estimating carrying costs, management includes real estate taxes, insurance and other operating expenses and estimates of lost rental revenue during the expected lease-up periods based on current market demand. Management also estimates costs to execute similar leases including leasing commissions, tenant improvements, legal and other related costs.
In allocating the fair value of the identified intangible assets and liabilities of an acquired property, above-market and below-market in-place lease values are recorded based on the present value (using an interest rate which reflects the risks associated with the leases acquired) of the difference between (i) the contractual amounts to be paid pursuant to the in-place leases and (ii) estimated fair market lease rates from the perspective of a market participant for the corresponding in-place leases, measured, for above-market leases, over a period equal to the remaining non-cancelable term of the lease and, for below-market leases, over a period equal to the initial term plus any below-market fixed rate renewal periods. The leases we have acquired do not currently include any below-market fixed rate renewal periods. The capitalized above-market lease values are amortized as a reduction of rental income over the remaining non-cancelable terms of the respective leases. The capitalized below-market lease values, also referred to as acquired lease obligations, are amortized as an increase to rental income over the initial terms of the respective leases and any below-market fixed rate renewal periods.
In addition to the intangible value for above-market leases and the intangible negative value for below-market leases, there is intangible value related to having tenants leasing space in the purchased property, which is referred to as in-place lease value. Such value results primarily from the buyer of a leased property avoiding the costs associated with leasing the property and also avoiding rent losses and unreimbursed operating expenses during the lease-up period. Factors to be considered by management in its analysis of in-place lease values include an estimate of carrying costs during hypothetical expected lease-up periods considering current market conditions, and costs to execute similar leases. In estimating carrying costs, management includes real estate taxes, insurance and other operating expenses and estimates of lost rental revenue at market rates during the expected lease-up periods, depending on local market conditions. In estimating costs to execute similar leases, management considers leasing commissions, legal and other related expenses. The value of in-place leases is amortized to expense over the remaining initial terms of the respective leases.
The Company uses the excess earnings method to value tenant relationship value, if any. Such value exists in transactions that involve the acquisition of tenants and customers that are expected to generate recurring revenues beyond existing in place lease terms. The primary factors to be considered by management in its analysis of tenant relationship value include historical tenant lease renewals and attrition rates, rental renewal probabilities and related market terms, estimated operating costs, and discount rate. Tenant relationship value is amortized to expense ratably over the anticipated life of the tenant relationships generating excess earnings, which is the period management uses to value this intangible asset.
(g) Goodwill
Goodwill represents the excess of the purchase price over the fair value of net tangible and intangible assets acquired and tangible and intangible liabilities assumed in a business combination. Goodwill is not amortized. We perform an annual
122
DIGITAL REALTY TRUST, INC. AND SUBSIDIARIES
DIGITAL REALTY TRUST, L.P. AND SUBSIDIARIES
NOTES TO CONSOLIDATED FINANCIAL STATEMENTS- (Continued)
December 31, 2018 and 2017
impairment test for goodwill and between annual tests, we evaluate goodwill for impairment whenever events or changes in circumstances occur that would more likely than not reduce the fair value of a reporting unit below its carrying value. In our impairment tests of goodwill, we first assess qualitative factors to determine whether it is more likely than not that the fair value of a reporting unit is less than its carrying value. If based on this assessment, we determine that the fair value of the reporting unit is not less than its carrying value, then performing the additional two-step impairment test is unnecessary. If our qualitative assessment indicates that goodwill impairment is more likely than not, we perform a two-step impairment test. We test goodwill for impairment under the two-step impairment test by first comparing the book value of net assets including goodwill to the fair value of the reporting unit. If the fair value is determined to be less than the book value of the net assets, including goodwill, a second step is performed to compute the amount of impairment as the difference between the implied fair value of goodwill and its carrying value. We estimate the fair value of the reporting unit using discounted cash flows. If the carrying value of goodwill exceeds its implied fair value, an impairment charge is recognized. We have not recognized any goodwill impairments since our inception. Since some of the goodwill is denominated in foreign currencies, changes to the goodwill balance occur over time due to changes in foreign exchange rates.
The following is a summary of goodwill activity for the year ended
December 31, 2018
(in thousands):
|
Balance as of December 31, 2017
|
Merger / Acquisition
|
Impact of Change in Foreign Exchange Rates
|
Balance as of December 31, 2018
|
|||||||||||||
|
Merger / Portfolio Acquisition
|
||||||||||||||||
|
Telx Acquisition
|
$
|
330,845
|
|
$
|
—
|
|
$
|
—
|
|
$
|
330,845
|
|
||||
|
European Portfolio Acquisition
|
466,604
|
|
—
|
|
(24,255
|
)
|
442,349
|
|
||||||||
|
DFT Merger
|
2,592,146
|
|
—
|
|
—
|
|
2,592,146
|
|
||||||||
|
Ascenty Acquisition
|
—
|
|
982,667
|
|
—
|
|
982,667
|
|
||||||||
|
Total
|
$
|
3,389,595
|
|
$
|
982,667
|
|
$
|
(24,255
|
)
|
$
|
4,348,007
|
|
||||
(h) Capitalization of Costs
Direct and indirect project costs that are clearly associated with the development of properties are capitalized as incurred. Project costs include all costs directly associated with the development of a property, including construction costs, interest, property taxes, insurance, legal fees and costs of personnel working on the project. Indirect costs that do not clearly relate to the projects under development are not capitalized and are charged to expense as incurred.
Capitalization of costs begins when the activities necessary to get the development project ready for its intended use begins, which include costs incurred before the beginning of construction. Capitalization of costs ceases when the development project is substantially complete and ready for its intended use. Determining when a development project commences and when it is substantially complete and ready for its intended use involves a degree of judgment. We generally consider a development project to be substantially complete and ready for its intended use upon receipt of a certificate of occupancy. If and when development of a property is suspended pursuant to a formal change in the planned use of the property, we will evaluate whether the accumulated costs exceed the estimated value of the project and write off the amount of any such excess accumulated costs. For a development project that is suspended for reasons other than a formal change in the planned use of such property, the accumulated project costs are evaluated for impairment consistent with our impairment policies for long-lived assets. Capitalized costs are allocated to the specific components of a project that are benefited.
During the years ended
December 31, 2018
,
2017
and
2016
, we capitalized interest of approximately
$34.7 million
,
$21.7 million
and
$16.3 million
, respectively. During the years ended
December 31, 2018
,
2017
and
2016
, we capitalized amounts relating to compensation expense of employees direct and incremental to construction and successful leasing activities of approximately
$74.1 million
,
$77.3 million
and
$70.7 million
, respectively.
123
DIGITAL REALTY TRUST, INC. AND SUBSIDIARIES
DIGITAL REALTY TRUST, L.P. AND SUBSIDIARIES
NOTES TO CONSOLIDATED FINANCIAL STATEMENTS- (Continued)
December 31, 2018 and 2017
(i) Deferred Leasing Costs
Leasing commissions and other direct and indirect costs associated with the acquisition of tenants are capitalized and amortized on a straight-line basis over the terms of the related leases. Deferred leasing costs is included in acquired in-place lease value, deferred leasing costs and intangibles on the consolidated balance sheet and amounted to approximately
$322.2 million
and
$330.9 million
, net of accumulated amortization, as of
December 31, 2018
and
2017
, respectively. Amortization expense on leasing costs was approximately
$72.9 million
,
$50.1 million
, and
$43.8 million
for the years ended
December 31, 2018
,
2017
and
2016
, respectively.
(j) Foreign Currency Translation
Assets and liabilities of our subsidiaries outside the United States with non-U.S. dollar functional currencies are translated into U.S. dollars using exchange rates as of the balance sheet dates. Income and expenses are translated using the average exchange rates for the reporting period. Foreign currency translation adjustments are recorded as a component of other comprehensive income. In the statement of cash flows, cash flows denominated in foreign currencies are translated using the exchange rates in effect at the time of the cash flows or an average exchange rate for the period, depending on the nature of the cash flow item.
(k) Deferred Financing Costs
Loan fees and costs are recorded as an adjustment to the carrying amount of the related debt and amortized over the life of the related loans on a straight-line basis, which approximates the effective interest method. Such amortization is included as a component of interest expense.
(l) Restricted Cash
Restricted cash consists of deposits for real estate taxes and insurance and other amounts as required by our loan agreements including funds for leasing costs and improvements related to unoccupied space.
(m) Offering Costs
Underwriting commissions and other offering costs are reflected as a reduction in additional paid-in capital, or in the case of preferred stock, as a reduction of the carrying value of preferred stock.
(n) Share-Based Compensation
The Company measures all share-based compensation awards at fair value on the date they are granted to employees and directors, and recognizes compensation cost, net of forfeitures, over the requisite service period for awards with only a service condition. The estimated fair value of the long-term incentive units and Class D units (discussed in Note 14) granted by us is being amortized on a straight-line basis over the expected service period.
The fair value of share-based compensation awards that contain a market condition is measured using a Monte Carlo simulation method and not adjusted based on actual achievement of the market condition.
(o) Derivative Instruments
Derivative financial instruments are employed to manage risks, including foreign currency and interest rate exposures and are not used for trading or speculative purposes. As part of the Company’s risk management program, a variety of financial instruments, such as interest rate swaps and foreign exchange contracts, may be used to mitigate interest rate exposure and foreign currency exposure. The Company recognizes all derivative instruments in the balance sheet at fair value.
Changes in the fair value of derivatives are recognized periodically either in earnings or in stockholders’ equity as a component of accumulated other comprehensive income (loss), depending on whether the derivative financial instrument is undesignated or qualifies for hedge accounting, and if so, whether it represents a fair value, cash flow, or net investment hedge. Gains and losses on derivatives designated as cash flow hedges, to the extent they are included in the assessment of effectiveness, are recorded in other comprehensive income (loss) and subsequently reclassified to earnings to offset the impact of the hedged items when they occur. In the event it becomes probable the forecasted transaction to which a cash flow hedge
124
DIGITAL REALTY TRUST, INC. AND SUBSIDIARIES
DIGITAL REALTY TRUST, L.P. AND SUBSIDIARIES
NOTES TO CONSOLIDATED FINANCIAL STATEMENTS- (Continued)
December 31, 2018 and 2017
relates will not occur, the derivative would be terminated and the amount in other comprehensive income (loss) would be recognized in earnings. Changes in the fair value of derivatives that are designated and qualify as a hedge of the net investment in foreign operations, to the extent they are included in the assessment of effectiveness, are reported in other comprehensive income (loss) and are deferred until disposal of the underlying assets. Gains and losses representing components excluded from the assessment of effectiveness for cash flow and fair value hedges are recognized in earnings on a straight-line basis in the same caption as the hedged item over the term of the hedge. Gains and losses representing components excluded from the assessment of effectiveness for net investment hedges are recognized in earnings on a straight-line basis over the term of the hedge.
The net interest paid or received on interest rate swaps is recognized as interest expense. Gains and losses resulting from the early termination of interest rate swap agreements are deferred and amortized as adjustments to interest expense over the remaining period of the debt originally covered by the terminated swap.
See Note 15 for further discussion on derivative instruments.
(p) Income Taxes
Digital Realty Trust, Inc. has elected to be treated as a real estate investment trust (a “REIT”) for federal income tax purposes. As a REIT, Digital Realty Trust, Inc. generally is not required to pay federal corporate income tax to the extent taxable income is currently distributed to its stockholders. If Digital Realty Trust, Inc. fails to qualify as a REIT in any taxable year, it will be subject to federal income tax (including any applicable alternative minimum tax for taxable years prior to 2018) on its taxable income.
The Company is subject to foreign, state and local income taxes in the jurisdictions in which it conducts business. The Company’s taxable REIT subsidiaries are subject to federal, state and foreign income taxes to the extent there is taxable income. Accordingly, the Company recognizes current and deferred income taxes.
We assess our significant tax positions in accordance with U.S. GAAP for all open tax years and determine whether we have any material unrecognized liabilities from uncertain tax benefits. If a tax position is not considered “more-likely-than-not” to be sustained solely on its technical merits, no benefits of the tax position are to be recognized (for financial statement purposes). As of
December 31, 2018
and
2017
, we have
no
assets or liabilities for uncertain tax positions. We classify interest and penalties from significant uncertain tax positions as interest expense and operating expense, respectively, in our consolidated income statements. For the years ended
December 31, 2018
,
2017
and
2016
, we had
no
such interest or penalties. The tax year 2015 and thereafter remain open to examination by the major taxing jurisdictions with which the Company files tax returns.
See Note 11 for further discussion on income taxes.
(q) Presentation of Transactional-based Taxes
We account for transactional-based taxes, such as value added tax, or VAT, for our international properties on a net basis.
(r) Redeemable Noncontrolling Interests
Redeemable noncontrolling interests include amounts related to partnership units issued by consolidated subsidiaries of the Company in which redemption for equity is outside the control of the Company. Partnership units which are determined to be contingently redeemable for cash under the Financial Accounting Standards Board’s "Distinguishing Liabilities from Equity" guidance are classified as redeemable noncontrolling interests and presented in the mezzanine section between total liabilities and stockholder’s equity on the Company’s consolidated balance sheets. The amounts of consolidated net income attributable to the Company and to the noncontrolling interests are presented on the Company’s consolidated income statements.
125
DIGITAL REALTY TRUST, INC. AND SUBSIDIARIES
DIGITAL REALTY TRUST, L.P. AND SUBSIDIARIES
NOTES TO CONSOLIDATED FINANCIAL STATEMENTS- (Continued)
December 31, 2018 and 2017
(s) Revenue Recognition
In May 2014, the FASB issued ASU No. 2014-09, "Revenue from Contracts with Customers (Topic 606)", and since that date has issued several additional ASUs intended to clarify certain aspects of ASU No. 2014-09 and to provide for certain practical expedients entities may elect upon adoption. Collectively, these ASUs outline a single comprehensive model for entities to use in accounting for revenues arising from contracts with customers. We adopted Topic 606 in the first quarter of 2018 using the modified retrospective transition method and applied Topic 606 to those contracts that were not completed as of January 1, 2018. The results for reporting periods beginning after January 1, 2018 are presented under Topic 606, while prior period amounts are not adjusted and continue to be presented under Topic 605. Our financial statements did not recognize a material effect from the cumulative impact of adopting Topic 606 as the new accounting standard does not impact lessor accounting.
The majority of our revenue is derived from lease arrangements, which we account for in accordance with “Leases (Topic 840)”. We account for the non-lease components within our lease arrangements, as well as other sources of revenue, in accordance with Topic 606. Revenue recognized as a result of applying Topic 840 was
97%
and Topic 606 was
3%
of total operating revenue for the year ended
December 31, 2018
.
Our leases are classified as operating leases and minimum rents are recognized on a straight-line basis over the terms of the leases, which may span multiple years. The excess of rents recognized over amounts contractually due pursuant to the underlying leases is included in deferred rent in the accompanying consolidated balance sheets and contractually due but unpaid rents are included in accounts and other receivables.
Tenant reimbursements for real estate taxes, common area maintenance, and other recoverable costs under our leases are recognized in the period that the expenses are incurred. Lease termination fees are recognized over the remaining term of the lease, effective as of the date the lease modification is finalized, assuming collection is not considered doubtful. As discussed above, we recognize amortization of the value of acquired above or below-market tenant leases as a reduction of rental revenue in the case of above-market leases or an increase to rental revenue in the case of below-market leases. During the year ended December 31, 2016, we recognized a non-cash gain on lease termination of approximately
$29.2 million
, as one of our tenants, as part of a lease termination, conveyed substantially all of its colocation and turn-key improvements to the Company.
Interconnection services are included in rental and other services on the consolidated income statements and are generally provided on a month-to-month, one-year or multi-year term. Interconnection services include port and cross-connect services. Port services are typically sold on a one-year or multi-year term and revenue is recognized on a recurring monthly basis (straight-line). The Company bills customers on a monthly basis and recognizes the revenue over the period the service is provided. Revenue for cross-connect installations is generally recognized in the period the cross-connect is installed. Interconnection services that are not specific to a particular space are accounted for under Topic 606 and have terms that are generally one year or less.
Occasionally, customers engage the Company for certain services. The nature of these services historically involves property management and construction management. The proper revenue recognition of these services can be different, depending on whether the arrangements are service revenue or contractor type revenue.
Service revenues are typically recognized on an equal monthly basis based on the minimum fee to be earned. The monthly amounts could be adjusted depending on if certain performance milestones are met.
Fee income arises primarily from contractual management agreements with entities in which we have a noncontrolling interest. The management fees are recognized as earned under the respective agreements. Management and other fee income related to partially owned noncontrolled entities are recognized to the extent attributable to the unaffiliated interest.
We make subjective estimates as to when our revenue is earned and the collectability of our accounts receivable related to minimum rent, deferred rent, expense reimbursements, lease termination fees and other income. We specifically analyze accounts receivable and historical bad debts, customer concentrations, customer creditworthiness and current economic trends when evaluating the adequacy of the allowance for bad debts. These estimates have a direct impact on our net revenue because
126
DIGITAL REALTY TRUST, INC. AND SUBSIDIARIES
DIGITAL REALTY TRUST, L.P. AND SUBSIDIARIES
NOTES TO CONSOLIDATED FINANCIAL STATEMENTS- (Continued)
December 31, 2018 and 2017
a higher bad debt allowance would result in lower net revenue, and recognizing rental revenue as earned in one period versus another would result in higher or lower net revenue for a particular period.
(t) Asset Retirement Obligations
We record accruals for estimated asset retirement obligations as required by current accounting guidance. The amount of asset retirement obligations relates primarily to estimated costs associated with asbestos removal at the end of the economic life of properties that were built before 1984 along with remediation of soil contamination issues. As of
December 31, 2018
and
2017
, the amount included in accounts payable and other accrued liabilities on our consolidated balance sheets was approximately
$17.5 million
and
$12.5 million
, respectively.
(u) Assets and Liabilities Measured at Fair Value
Fair value under U.S. GAAP is a market-based measurement, not an entity-specific measurement. Therefore, our fair value measurements are determined based on the assumptions that market participants would use in pricing the asset or liability. As a basis for considering market participant assumptions in fair-value measurements, we use a fair-value hierarchy that distinguishes between market participant assumptions based on market data obtained from sources independent of the reporting entity (observable inputs that are classified within Levels 1 and 2 of the hierarchy) and the reporting entity’s own assumptions about market participant assumptions (unobservable inputs classified within Level 3 of the hierarchy).
Level 1 inputs utilize quoted prices (unadjusted) in active markets for identical assets or liabilities that the Company has the ability to access. Level 2 inputs are inputs other than quoted prices included in Level 1 that are observable for the asset or liability, either directly or indirectly. Level 2 inputs may include quoted prices for similar assets and liabilities in active markets, as well as inputs that are observable for the asset or liability (other than quoted prices), such as interest rates, foreign exchange rates, and yield curves that are observable at commonly quoted intervals. Level 3 inputs are unobservable inputs for the asset or liability which are typically based on an entity’s own assumptions, as there is little, if any, related market activity. In instances where the determination of the fair-value measurement is based on inputs from different levels of the fair-value hierarchy, the lowest level input that is significant would be used to determine the fair-value measurement in its entirety. Our assessment of the significance of a particular input to the fair-value measurement in its entirety requires judgment, and considers factors specific to the asset or liability.
(v) Transaction and Integration Expense
Transaction and integration expense includes business combination expenses, other business development expenses and other expenses to integrate newly acquired investments, which are expensed as incurred. Transaction expenses include closing costs, broker commissions and other professional fees, including legal and accounting fees related to business combinations or acquisitions that were not consummated. Integration costs include transition costs associated with organizational restructuring (such as severance and retention payments and recruiting expenses), third-party consulting expenses directly related to the integration of acquired companies (in areas such as cost savings and synergy realization, technology and systems work), and internal costs such as training, travel and labor, reflecting time spent by Company personnel on integration activities and projects. Recurring costs are recorded in general and administrative expense.
(w) Gains on Sale of Properties
As of January 1, 2018, we began accounting for the sale of real estate properties under Financial Accounting Standards Board, or FASB, Accounting Standards Update, or ASU, No. 2017-05, Other Income—Gains and Losses from the Derecognition of Nonfinancial Assets (Subtopic 610-20), which provides for revenue recognition based on transfer of ownership. All properties were non-financial real estate assets and thus not businesses which were sold to noncustomers with no performance obligations subsequent to transfer of ownership. During the year ended
December 31, 2018
, the Company sold real estate properties for gross proceeds of
$291.7 million
, and a recorded net gain of
$80.4 million
.
127
DIGITAL REALTY TRUST, INC. AND SUBSIDIARIES
DIGITAL REALTY TRUST, L.P. AND SUBSIDIARIES
NOTES TO CONSOLIDATED FINANCIAL STATEMENTS- (Continued)
December 31, 2018 and 2017
(x) Management’s Estimates
The preparation of financial statements in conformity with U.S. GAAP requires management to make estimates and assumptions that affect the reported amounts of assets and liabilities and disclosure of contingent assets and liabilities at the date of the consolidated financial statements and the reported amounts of revenues and expenses during the reporting period. Actual results could differ from those estimates made. On an on-going basis, we evaluate our estimates, including those related to the valuation of our real estate properties, tenant relationship value, goodwill, contingent consideration, accounts receivable and deferred rent receivable, performance-based equity compensation plans and the completeness of accrued liabilities. We base our estimates on historical experience, current market conditions, and various other assumptions that are believed to be reasonable under the circumstances. Actual results may vary from those estimates and those estimates could vary under different assumptions or conditions.
(y) Segment and Geographic Information
The Company is managed on a consolidated basis based on customer demand considerations. Deployment of capital is geared to satisfy this demand. In this regard, the sale and delivery of our products is consistent throughout the portfolio. Services are provided to customers typical of the data center industry. Rent, and the cost of services are billed and collected. The Company has
one
operating segment and therefore
one
reporting segment.
Operating revenues from properties in the United States were
$2,482.1 million
,
$1,942.7 million
and
$1,670.2 million
and outside the United States were
$564.4 million
,
$515.2 million
and
$442.9 million
for the years ended
December 31, 2018
,
2017
and
2016
, respectively. We had investments in real estate located in the United States of
$11.1 billion
,
$10.5 billion
and
$6.3 billion
and outside the United States of
$3.8 billion
,
$3.1 billion
and
$2.6 billion
as of
December 31, 2018
,
2017
and
2016
, respectively.
Operating revenues from properties located in the United Kingdom were
$295.3 million
,
$275.1 million
and
$234.3 million
, or
9.7%
,
11.2%
and
11.1%
of total operating revenues, for the years ended
December 31, 2018
,
2017
and
2016
, respectively. No other foreign country comprised more than 10% of total operating revenues for each of these years. We had investments in real estate located in the United Kingdom of
$1.6 billion
,
$1.7 billion
and
$1.5 billion
, or
10.9%
,
12.1%
and
16.6%
of total investments in real estate, as of
December 31, 2018
,
2017
and
2016
, respectively. No other foreign country comprised more than 10% of total investments in real estate as of each of
December 31, 2018
,
2017
and
2016
.
(z) Reclassifications
Certain reclassifications to prior year amounts have been made to conform to the current year presentation. The Company has revised the presentation in its consolidated income statements for the years ended
December 31, 2017
and
2016
to reclassify
$235.7 million
and
$204.3 million
from Interconnection and other to Rental and other services, respectively.
(aa) New Accounting Pronouncements
New Accounting Standards Adopted
In August 2017, the FASB issued ASU No. 2017-12, "Derivatives and Hedging (Topic 815): Targeted Improvements to Accounting for Hedging Activities". The new standard amends the hedge accounting recognition and presentation requirements in Accounting Standards Codification, or ASC, 815. As permitted by ASU No. 2017-12, the Company early adopted this standard in the first quarter of 2018 on a prospective basis. Refer to Note 2(o), Derivative Instruments, for our policy related to the adoption of this standard.
In August 2016, the FASB issued ASU No. 2016-15, "Statement of Cash Flows (Topic 230): Classification of Certain Cash Receipts and Cash Payments". The new standard provides guidance on the classification in the statement of cash flows of cash distributions received from equity method investments, including unconsolidated joint ventures. The ASU provides two approaches to determine the classification of cash distributions received from equity method investees: (i) the “cumulative earnings” approach, under which distributions up to the amount of cumulative equity in earnings recognized are classified as
128
DIGITAL REALTY TRUST, INC. AND SUBSIDIARIES
DIGITAL REALTY TRUST, L.P. AND SUBSIDIARIES
NOTES TO CONSOLIDATED FINANCIAL STATEMENTS- (Continued)
December 31, 2018 and 2017
cash inflows from operating activities, and those in excess of that amount are classified as cash inflows from investing activities, and (ii) the “nature of the distribution” approach, under which distributions are classified based on the nature of the underlying activity that generated cash distributions. An entity could elect either the “cumulative earnings” or the “nature of the distribution” approach. If the “nature of the distribution” approach is elected and the entity lacks the information necessary to apply it in the future, that entity will have to apply the “cumulative earnings” approach as an accounting change on a retrospective basis. We adopted this ASU using the “nature of the distribution” approach and applied it retrospectively, as required by the ASU. We previously presented distributions from our equity method investees by utilizing the “nature of the distribution” approach; therefore, the adoption of this ASU had no effect on our consolidated financial statements.
In January 2016, the FASB issued ASU No. 2016-01, "Recognition and Measurement of Financial Assets and Financial Liabilities". The guidance requires entities to measure equity investments that do not result in consolidation and are not accounted for under the equity method at fair value and to record changes in instruments specific credit risk for financial liabilities measured under the fair value option in other comprehensive income. The principal effect of ASU No. 2016-01 on our consolidated financial statements is that, prior to adoption of ASU No. 2016-01, changes in the fair values of investments in equity securities with readily determinable fair values or redemption values were recognized in other comprehensive income until realized, while under ASU No. 2016-01 all changes in the fair values of these equity securities are recognized in current earnings. The update is effective for fiscal years beginning after December 15, 2017, and for interim periods therein. We adopted this standard in the first quarter of 2018 and the adoption did not have a material impact on our consolidated financial statements.
New Accounting Standards Issued but not yet Adopted
In February 2016, FASB issued ASU No. 2016-02, “Leases”, and since that date has issued several additional ASU’s intended to clarify certain aspects of ASU 2016-02 and to provide certain practical expedients entities can elect upon adoption (collectively, “Topic 842”). Topic 842 sets out the principles for recognition, measurement, presentation, and disclosure of leases for both parties to a lease agreement (i.e., lessees and lessors) and supersedes the previous leases standard, Leases (Topic 840). The standard is effective for the Company on January 1, 2019. Upon adoption of Topic 842, we plan to elect the following practical expedients provided in the standard:
|
•
|
Package (“all or nothing” expedients) - requires us not to reevaluate our existing or expired leases as of January 1, 2019, under Topic 842;
|
|
•
|
Optional transition method - requires us to apply Topic 842 prospectively from the effective date of adoption (i.e., January 1, 2019);
|
|
•
|
Land easements - requires us to account for land easements existing as of January 1, 2019, under the accounting standards applied to them prior to January 1, 2019;
|
|
•
|
Lease and non-lease components (lessee) - requires us to account for lease and nonlease components associated with that lease under Topic 842 as a single lease component, for all classes of underlying assets;
|
|
•
|
Lease and non-lease components (lessor) - requires us to account for lease and nonlease components associated with that lease under Topic 842 as a single lease component, if certain criteria are met, for all classes of underlying assets;
|
|
•
|
Short-term leases practical expedient (lessee) - for leases with a term of 12 months or less in which we are the lessee, this expedient requires us not to record on our balance sheets the related lease liabilities and right-of-use assets.
|
Topic 842 requires use of a modified retrospective transition method. On January 1, 2019 we plan to adopt Topic 842, electing the package of transition practical expedients and the optional transition method to apply the transition provisions from the effective date of adoption. Election of the package of transition practical expedients shall allow us not to reassess the following:
|
•
|
Whether any expired or existing contracts as of January 1, 2019 are or contain leases as defined in Topic 842;
|
|
•
|
The lease classification for any expired or existing leases as of January 1, 2019;
|
|
•
|
Treatment of initial direct costs relating to any existing leases as of January 1, 2019.
|
We shall apply the package of transition practical expedients consistently to all leases (i.e., in which we are a lessee or a lessor) that commenced before January 1, 2019. Election of this expedient permits us to “run off” our leases that commenced before
129
DIGITAL REALTY TRUST, INC. AND SUBSIDIARIES
DIGITAL REALTY TRUST, L.P. AND SUBSIDIARIES
NOTES TO CONSOLIDATED FINANCIAL STATEMENTS- (Continued)
December 31, 2018 and 2017
January 1, 2019, for the remainder of their lease terms pursuant to Topic 840 and to apply Topic 842 to leases commencing or modified after January 1, 2019.
In addition, pursuant to our planned election of the land easement practical expedient, in transition we shall continue to account for land easements existing as of January 1, 2019 under the accounting standards applied to them prior to January 1, 2019. Additionally, we do not plan to elect the transition practical expedient to use hindsight in determining the lease term for our leases, existing as of January 1, 2019 and in assessing impairment of right-of-use assets. We acquired Ascenty on December 20, 2018, and management is currently assessing the impact of Topic 842 from both a lessor and lessee perspective.
Lessee accounting
Topic 842 requires lessees to apply a dual approach, classifying leases as either finance or operating leases based on the principle whether the lease transfers control to the lessee, and is in substance, a financed purchase of the underlying asset by the lessee. Topic 842 also requires lessees to record a right-of-use asset and a lease liability for all leases with a term greater than 12 months regardless of their classification. Accounting for leases with a term of 12 months or less will be similar to existing guidance for operating leases under Topic 840. Interest and amortization expense are recognized for finance leases while a single lease expense is recognized for operating leases, on a straight-line basis.
As we plan our election of the package of transition practical expedients, operating and capital leases existing as of January 1, 2019, for which we are the lessee, shall continue to be classified as operating and finance leases, respectively, subsequent to adoption of Topic 842.
In applying the transition provisions to our operating leases, we shall measure lease liabilities at the present value of the sum of remaining minimum rental payments (as defined under Topic 840) using our incremental borrowing rates as of January 1, 2019. We shall measure right-of-use assets for our operating leases at the initial measurement of applicable lease liabilities adjusted for other related lease balances at transition. At January 1, 2019, we estimate we shall recognize the following for our operating leases: lease liabilities between
$700.0 million
and
$900.0 million
and right-of-use assets between
$625.0 million
and
$825.0 million
.
In applying the transition provisions to our capital leases, at the effective date, we shall measure lease liabilities and right-of-use assets for finance leases at the carrying amount of capital lease obligations and capital lease assets under Topic 840, respectively.
Additionally, we shall apply the transition provisions to build-to-suit leases for which assets and liabilities have been recognized solely as a result of the transactions’ build-to-suit designation in accordance with Topic 840. Therefore, at January 1, 2019 we shall derecognize assets and liabilities for build-to-suit leases where construction had completed, with the difference recorded as an increase to accumulated dividends in excess of earnings at the adoption date. We shall account for these leases from January 1, 2019 following the lessee transition guidance.
Lessor accounting
Under Topic 840 our leases are classified as operating leases, and we recognize rental revenue on a straight-line basis over respective lease terms. Under Topic 840 we consider tenant reimbursements for real estate taxes, common area maintenance, and other recoverable costs as lease components. Generally, we recognize these tenant recoveries as revenue when services are rendered in an amount equal to related operating expenses incurred that are recoverable under the terms of applicable leases. Refer to Note 2(s), Revenue Recognition, for further details on our policies around Revenue Recognition.
For leases entered into on or after January 1, 2019, Topic 842 shall require an entity to identify and separate lease and nonlease components with contract consideration allocated to identified components based on relative stand-alone selling prices. Topic 842 shall govern the recognition of revenue for lease components, and Topic 606 shall govern the recognition of revenue for nonlease components. Under Topic 842, tenant reimbursements for common area maintenance, inclusive of utilities, shall be considered nonlease components. If a lessee makes payments for taxes and insurance directly to a third party on behalf of a lessor, lessors are required to exclude them from variable payments and from recognition in the lessors’ income
130
DIGITAL REALTY TRUST, INC. AND SUBSIDIARIES
DIGITAL REALTY TRUST, L.P. AND SUBSIDIARIES
NOTES TO CONSOLIDATED FINANCIAL STATEMENTS- (Continued)
December 31, 2018 and 2017
statements. Otherwise, tenant recoveries for taxes and insurance are classified as additional lease revenue recognized by the lessor on a gross basis in their income statements.
On January 1, 2019, we plan to elect the practical expedient to account for a lease component and nonlease component(s) associated with that lease as a single component if (i) the timing and pattern of transfer of the lease component and the nonlease component(s) associated with it are the same and (ii) the lease component would be classified as an operating lease if it were accounted for separately. If we determine the lease component is the predominant component, we shall account for the single component as an operating lease in accordance with Topic 842. Conversely, we shall account for the combined component under Topic 606 if we determine the nonlease component is the predominant component. We expect ope
rating leases commencing or modified on or after January 1, 2019, for which we are a lessor, shall qualify for the single component practical expedient with the combined component accounted for under Topic 842.
Topic 842 requires lessors to account for leases using an approach that is substantially similar to existing guidance for sales-type leases, direct financing leases and operating leases. Under Topic 842, the criteria to determine whether a lease should be accounted for as a sales-type lease includes the following: (i) ownership is transferred from lessor to lessee by the end of the lease term, (ii) an option to purchase is reasonably certain to be exercised, (iii) the lease term is for the major part of the underlying asset’s remaining economic life, (iv) the present value of lease payments, including any lessee guaranteed residual value, equals or exceeds substantially all of the fair value of the underlying asset, and (v) the underlying asset is specialized and is expected to have no alternative use at the end of the lease term. If any of these criteria is met, a lease is classified as a sales-type lease by the lessor. If none of the criteria are met, a lease may qualify as a direct financing lease or an operating lease. The existence of a residual value guarantee from an unrelated third party other than the lessee may qualify the lease as a direct financing lease by the lessor. Otherwise, the lease is classified as an operating lease by the lessor. We are still evaluating the impact of this standard on its financial statements as a lessor.
Initial direct costs
Topic 842 requires lessees and lessors to capitalize, as initial direct costs, incremental costs of a lease that would not have been incurred if the lease had not been obtained. Effective January 1, 2019, costs we incur to negotiate or arrange a lease regardless of its outcome, such as fixed employee compensation, tax, or legal advice to negotiate lease terms, and costs related to advertising or soliciting potential tenants shall be expensed as incurred.
We estimate approximately
$37 million
of initial direct costs capitalized in 2018 would have been expensed if Topic 842 had been in effect during 2018. Future expenses as a result of the change in the accounting for initial direct costs shall depend on future events not yet known; therefore, the ultimate impact on initial direct costs from adoption of Topic 842 might differ from our estimate.
As we plan to elect the package of transition practical expedients under Topic 842, we shall not be required to reassess whether initial direct costs capitalized prior to adoption of Topic 842, in connection with leases that commenced prior to January 1, 2019, qualify for capitalization under Topic 842. Therefore, we shall continue to amortize these initial direct costs over corresponding lease terms.
In January 2017, the FASB issued guidance codified in ASU No. 2017-04, "Intangibles – Goodwill and Other (Topic 350): Simplifying the Test for Goodwill Impairment". ASU No. 2017-04 simplifies the accounting for goodwill impairment by eliminating the process of measuring the implied value of goodwill, known as step two, from the goodwill impairment test. Instead, if the carrying amount of a reporting unit exceeds its fair value, an impairment loss shall be recognized in an amount equal to that excess, limited to the total amount of goodwill allocated to that reporting unit. The standard will be effective for interim and annual reporting periods beginning after December 15, 2019, with early adoption permitted. We do not expect the provisions of ASU No. 2017-04 to have a material impact on our consolidated financial statements.
In June 2018, the FASB issued ASU No. 2018-07, “Improvements to Nonemployee Share-Based Payment Accounting,” which more closely aligns the accounting for employee and nonemployee share-based payments. The standard will be effective for interim and annual reporting periods beginning after December 15, 2018. Early adoption is permitted, but no earlier than an
131
DIGITAL REALTY TRUST, INC. AND SUBSIDIARIES
DIGITAL REALTY TRUST, L.P. AND SUBSIDIARIES
NOTES TO CONSOLIDATED FINANCIAL STATEMENTS- (Continued)
December 31, 2018 and 2017
entity’s adoption date of Topic 606. We do not expect the provisions of ASU No. 2018-07 to have a material impact on our consolidated financial statements.
In August 2018, the FASB issued ASU No. 2018-13, “Fair Value Measurement (Topic 820): Disclosure Framework-Changes to the Disclosure Requirements for Fair Value Measurement.” This ASU amends existing fair value measurement disclosure requirements by adding, changing, or removing certain disclosures. ASU No. 2018-13 will be effective for us as of January 1, 2020, and earlier adoption is permitted. We are currently reviewing the impact this ASU will have on our financial statements.
132
DIGITAL REALTY TRUST, INC. AND SUBSIDIARIES
DIGITAL REALTY TRUST, L.P. AND SUBSIDIARIES
NOTES TO CONSOLIDATED FINANCIAL STATEMENTS- (Continued)
December 31, 2018 and 2017
3. Business Combinations
(a) Ascenty Acquisition
We completed the Ascenty Acquisition on December 20, 2018 for total cash and equity consideration of approximately
$2.0 billion
, including approximately
$116.0 million
of assumed cash and cash equivalents. As of
December 31, 2018
, the estimated fair values of acquired assets and assumed liabilities are provisional estimates, but are based on the best information currently available. Since the acquisition closed so late in the year, we have not been able to obtain all of the necessary information to complete the valuation of each of the assets and liabilities due to the time needed to obtain all of the source documents, translate into English, obtain market data information in Brazil, and adequately review and evaluate the information. These provisional estimates are subject to change as we complete all remaining steps in finalizing the purchase price allocation, and it is reasonably possible that, there could be significant changes to the preliminary values below. We expect to finalize the valuation of all assets and liabilities by March 31, 2019.
The following table summarizes the provisional amounts for acquired assets and liabilities recorded at their fair values as of the acquisition date (in thousands):
|
Building and improvements
|
$
|
425,000
|
|
|
Goodwill
|
982,667
|
|
|
|
Tenant relationship value
|
375,000
|
|
|
|
Acquired in-place lease value
|
120,000
|
|
|
|
Cash and cash equivalents
|
116,000
|
|
|
|
Other assets
|
30,000
|
|
|
|
Other liabilities
|
(40,000
|
)
|
|
|
Capital lease and other long-term obligations
|
(50,000
|
)
|
|
|
Total purchase price
|
$
|
1,958,667
|
|
Goodwill represents the excess of the purchase price over the fair value of net tangible and intangible assets acquired and tangible and intangible liabilities assumed in the acquisition. As shown above, we recorded approximately
$1.0 billion
of goodwill related to the Ascenty Acquisition. The strategic benefits of the acquisition include the Company’s ability to continue its strategy to provide foundational data center real estate solutions on a global basis with a diversified product offering of both small and large footprint deployments as well as interconnection services. These factors contributed to the goodwill that was recorded upon consummation of the transaction. As the purchase price allocation is still provisional, the Company can not estimate the amount of the goodwill that may be deductible for federal income tax purposes.
The transaction was initially funded with
$600.0 million
of proceeds from a non-recourse,
five
-year secured term loan; the issuance of approximately
$254 million
of Operating Partnership common units in exchange for the substantial majority of the Ascenty management's equity interests; and approximately
$1.0 billion
of unsecured corporate borrowings. We expect to finalize the permanent capital structure for Ascenty in the first quarter of 2019, in conjunction with closing the joint venture with Brookfield.
133
DIGITAL REALTY TRUST, INC. AND SUBSIDIARIES
DIGITAL REALTY TRUST, L.P. AND SUBSIDIARIES
NOTES TO CONSOLIDATED FINANCIAL STATEMENTS- (Continued)
December 31, 2018 and 2017
(b) DFT Merger
We completed the acquisition of DFT on September 14, 2017. A summary of the fair value of the assets and liabilities acquired for total equity of approximately
$6.2 billion
is as follows (in thousands):
|
Fair Value
|
Weighted Average Remaining Intangible Amortization Life (in months)
|
|||||
|
Land
|
$
|
312,579
|
|
|||
|
Buildings and improvements
|
3,677,497
|
|
||||
|
Cash and cash equivalents
|
20,650
|
|
||||
|
Accounts and other receivables
|
10,978
|
|
||||
|
Acquired above-market leases
|
162,333
|
|
47
|
|||
|
Goodwill
|
2,592,181
|
|
||||
|
Acquired in-place lease value, deferred leasing costs and intangibles:
|
||||||
|
Tenant relationship value
|
980,267
|
|
220
|
|||
|
Acquired in-place lease value
|
557,128
|
|
70
|
|||
|
Tenant origination costs
|
44,990
|
|
80
|
|||
|
Global revolving credit facility, net
(1)
|
(450,697
|
)
|
||||
|
Unsecured term loans
(1)
|
(250,000
|
)
|
||||
|
Unsecured senior notes, net
(2)
|
(886,831
|
)
|
||||
|
Mortgage loans
(1)
|
(105,000
|
)
|
||||
|
Acquired below-market leases
|
(185,543
|
)
|
137
|
|||
|
Accounts payable and other accrued liabilities
|
(248,259
|
)
|
||||
|
Other working capital, net
|
(22,640
|
)
|
||||
|
Total equity consideration for DFT merger
|
$
|
6,209,633
|
|
|||
|
(1)
|
Debt was paid off in full at closing of the DFT merger.
|
|
(2)
|
Approximately
$621 million
of fair value debt was paid off prior to September 30, 2017. The remainder was paid off in October 2017.
|
Goodwill represents the excess of the purchase price over the fair value of net tangible and intangible assets acquired and tangible and intangible liabilities assumed in the merger.
The strategic benefits of the merger include the Company’s ability to grow its presence in strategic, high-demand metropolitan areas with strong growth prospects, expand our hyper-scale product offering and further enhance the credit quality of our existing customer base. These factors contributed to the goodwill that was recorded upon consummation of the transaction. The Company does not believe that any of the goodwill recorded as a result of the DFT merger will be deductible for federal income tax purposes.
134
DIGITAL REALTY TRUST, INC. AND SUBSIDIARIES
DIGITAL REALTY TRUST, L.P. AND SUBSIDIARIES
NOTES TO CONSOLIDATED FINANCIAL STATEMENTS- (Continued)
December 31, 2018 and 2017
The unaudited pro forma financial information set forth below is based on our historical consolidated income statements for the years ended December 31, 2017 and 2016, adjusted to give effect to the DFT Merger as if it occurred on January 1, 2016. The pro forma adjustments primarily relate to transaction expenses, depreciation expense on acquired buildings and improvements, amortization of acquired intangibles, and estimated interest expense related to financing transactions, the proceeds of which were used to fund the repayment of DFT debt in connection with the DFT merger.
|
Digital Realty Trust, Inc.
|
Pro forma (unaudited)
|
|||||||
|
(in thousands, except per share data)
|
||||||||
|
Year Ended December 31,
|
||||||||
|
2017
|
2016
|
|||||||
|
Total revenue
|
$
|
2,860,454
|
|
$
|
2,670,914
|
|
||
|
Net income available to common
stockholders
(1)
|
$
|
51,717
|
|
$
|
99,653
|
|
||
|
Income per share, diluted
(2)
|
$
|
0.25
|
|
$
|
0.51
|
|
||
|
Digital Realty Trust, L.P.
|
Pro forma (unaudited)
|
|||||||
|
(in thousands, except per unit data)
|
||||||||
|
Year Ended December 31,
|
||||||||
|
2017
|
2016
|
|||||||
|
Total revenue
|
$
|
2,860,454
|
|
$
|
2,670,914
|
|
||
|
Net income available to common
unitholders
(1)
|
$
|
53,786
|
|
$
|
103,639
|
|
||
|
Income per unit, diluted
(2)
|
$
|
0.25
|
|
$
|
0.51
|
|
||
|
(1)
|
Pro forma net income available to common stockholders was adjusted to exclude
$43.0 million
of merger-related costs incurred by the Company during the year ended December 31, 2017 and to include these charges in 2016.
|
|
(2)
|
Adjusted to give effect to the issuance of approximately
43.2 million
shares of Digital Realty Trust, Inc. common stock in the DFT merger.
|
The Company recorded transaction expenses of approximately
$43.0 million
in the accompanying 2017 consolidated income statement in connection with the DFT merger. Revenues of approximately
$177.8 million
and net income of approximately
$5.4 million
associated with properties acquired in the DFT merger are included in the consolidated income statement for the year ended December 31, 2017.
135
DIGITAL REALTY TRUST, INC. AND SUBSIDIARIES
DIGITAL REALTY TRUST, L.P. AND SUBSIDIARIES
NOTES TO CONSOLIDATED FINANCIAL STATEMENTS- (Continued)
December 31, 2018 and 2017
4. Investments in Real Estate
A summary of our investments in properties as of
December 31, 2018
and
2017
is as follows:
|
|
As of December 31, 2018
|
||||||||||||||||||||||
|
|
(in thousands)
|
||||||||||||||||||||||
|
Property Type
|
Land
|
Acquired
Ground Lease |
Buildings and
Improvements (1) |
Tenant
Improvements |
Accumulated
Depreciation and Amortization |
Net
Investment in Properties |
|||||||||||||||||
|
Internet Gateway Data Centers
|
$
|
101,964
|
|
$
|
—
|
|
$
|
2,137,458
|
|
$
|
114,013
|
|
$
|
(885,315
|
)
|
$
|
1,468,120
|
|
|||||
|
Data Centers (2)
|
1,391,585
|
|
10,575
|
|
14,502,437
|
|
460,247
|
|
(3,016,646
|
)
|
13,348,198
|
|
|||||||||||
|
Technology Manufacturing
|
11,959
|
|
—
|
|
1,582
|
|
76
|
|
(100
|
)
|
13,517
|
|
|||||||||||
|
Technology Office
|
2,091
|
|
—
|
|
23,104
|
|
—
|
|
(18,441
|
)
|
6,754
|
|
|||||||||||
|
Other
|
2,165
|
|
—
|
|
80,629
|
|
—
|
|
(14,765
|
)
|
68,029
|
|
|||||||||||
|
$
|
1,509,764
|
|
$
|
10,575
|
|
$
|
16,745,210
|
|
$
|
574,336
|
|
$
|
(3,935,267
|
)
|
$
|
14,904,618
|
|
||||||
|
As of December 31, 2017
|
|||||||||||||||||||||||
|
(in thousands)
|
|||||||||||||||||||||||
|
Property Type
|
Land
|
Acquired
Ground Lease |
Buildings and
Improvements (1) |
Tenant
Improvements |
Accumulated
Depreciation and Amortization |
Net
Investment in Properties |
|||||||||||||||||
|
Internet Gateway Data Centers
|
$
|
109,844
|
|
$
|
—
|
|
$
|
1,940,495
|
|
$
|
99,174
|
|
$
|
(778,659
|
)
|
$
|
1,370,854
|
|
|||||
|
Data Centers (2)
|
1,010,306
|
|
11,150
|
|
13,147,042
|
|
453,712
|
|
(2,430,984
|
)
|
12,191,226
|
|
|||||||||||
|
Technology Manufacturing
|
11,959
|
|
—
|
|
1,564
|
|
76
|
|
(31
|
)
|
13,568
|
|
|||||||||||
|
Technology Office
|
2,067
|
|
—
|
|
23,029
|
|
—
|
|
(16,779
|
)
|
8,317
|
|
|||||||||||
|
Other
|
2,165
|
|
—
|
|
103,275
|
|
78
|
|
(11,774
|
)
|
93,744
|
|
|||||||||||
|
$
|
1,136,341
|
|
$
|
11,150
|
|
$
|
15,215,405
|
|
$
|
553,040
|
|
$
|
(3,238,227
|
)
|
$
|
13,677,709
|
|
||||||
|
(1)
|
Balances include, as of
December 31, 2018
and
2017
,
$1.6 billion
and
$1.4 billion
of direct and accrued costs associated with development in progress, respectively.
|
|
(2)
|
Balances include vacant land to support ground-up development.
|
As of
December 31, 2017
, we had identified
eight
properties that met the criteria to be classified as held for sale. As of
December 31, 2017
, the
eight
properties had an aggregate carrying value of
$139.5 million
within total assets and
$5.0 million
within total liabilities and are shown as assets held for sale and obligations associated with assets held for sale on the consolidated balance sheet, respectively. All
eight
properties were sold during the year ended
December 31, 2018
. The properties were not representative of a significant component of our portfolio, nor did the sales represent a significant shift in our strategy. In addition, we evaluated the carrying value of the properties identified as held for sale to ensure the carrying value is recoverable in light of a potentially shorter holding period. As a result of our evaluation, during the year ended
December 31, 2017
, we recognized approximately
$29.0 million
of impairment charges on
three
properties located in the United States to reduce the carrying values to the estimated fair values less costs to sell. The fair values of the three properties were based on comparable sales price data (Level 2 under the fair value hierarchy). There were
no
impairment charges for the years ended
December 31, 2018
and
2016
.
136
DIGITAL REALTY TRUST, INC. AND SUBSIDIARIES
DIGITAL REALTY TRUST, L.P. AND SUBSIDIARIES
NOTES TO CONSOLIDATED FINANCIAL STATEMENTS- (Continued)
December 31, 2018 and 2017
Acquisitions
We acquired the following real estate during the years ended
December 31, 2018
and
2017
(excluding business combinations already discussed in Note 3):
2018 Acquisitions
|
Property Type
|
Amount
(in millions) (2) |
|||
|
Land Parcels
(1)
|
$
|
296.1
|
|
|
|
Data Centers
|
114.6
|
|
||
|
$
|
410.7
|
|
||
2017 Acquisitions
|
Property Type
|
Amount
(in millions) (2) |
|||
|
Land Parcels
(1)
|
$
|
55.3
|
|
|
|
Data Centers
|
346.2
|
|
||
|
Technology Manufacturing
|
14.3
|
|
||
|
$
|
415.8
|
|
||
|
(1)
|
Represents currently vacant land which is not included in our operating property count.
|
|
(2)
|
Purchase price in U.S. dollars and excludes capitalized closing costs. Each of these acquisitions was accounted for as an asset acquisition pursuant to the adoption of ASU 2017-01 on January 1, 2017.
|
The table below reflects the purchase price allocation for the above properties acquired in 2018 and 2017 (in thousands):
|
Property Type
|
Land
|
Buildings and Improvements
|
Tenant Improvements
|
Above-Market Leases
|
In-Place Leases
|
Below-Market Leases
|
Acquisition Date Fair Value
|
|||||||||||||||||||||
|
2018
|
||||||||||||||||||||||||||||
|
Land Parcels
|
$
|
296,071
|
|
$
|
—
|
|
$
|
—
|
|
$
|
—
|
|
$
|
—
|
|
$
|
—
|
|
$
|
296,071
|
|
|||||||
|
Data Centers
|
60,633
|
|
54,008
|
|
—
|
|
—
|
|
—
|
|
—
|
|
114,641
|
|
||||||||||||||
|
Total
|
$
|
356,704
|
|
$
|
54,008
|
|
$
|
—
|
|
$
|
—
|
|
$
|
—
|
|
$
|
—
|
|
$
|
410,712
|
|
|||||||
|
2017
|
||||||||||||||||||||||||||||
|
Land Parcels
|
$
|
55,229
|
|
$
|
—
|
|
$
|
—
|
|
$
|
—
|
|
$
|
—
|
|
$
|
—
|
|
$
|
55,229
|
|
|||||||
|
Data Centers
|
20,431
|
|
275,374
|
|
1,506
|
|
21,043
|
|
28,656
|
|
(811
|
)
|
346,199
|
|
||||||||||||||
|
Technology Manufacturing
|
11,950
|
|
1,539
|
|
76
|
|
—
|
|
1,455
|
|
(684
|
)
|
14,336
|
|
||||||||||||||
|
Total
|
$
|
87,610
|
|
$
|
276,913
|
|
$
|
1,582
|
|
$
|
21,043
|
|
$
|
30,111
|
|
$
|
(1,495
|
)
|
$
|
415,764
|
|
|||||||
|
Weighted average remaining intangible amortization life (in months)
|
65
|
81
|
80
|
|||||||||||||||||||||||||
137
DIGITAL REALTY TRUST, INC. AND SUBSIDIARIES
DIGITAL REALTY TRUST, L.P. AND SUBSIDIARIES
NOTES TO CONSOLIDATED FINANCIAL STATEMENTS- (Continued)
December 31, 2018 and 2017
Dispositions
We sold the following real estate properties during the years ended
December 31, 2018
and
2017
:
2018 Dispositions
|
Location
|
Metro
Area
|
Date Sold
|
Gross Proceeds (in millions)
|
Gain (loss) on sale (in millions)
|
||||||||
|
200 Quannapowitt Parkway
|
Boston
|
Jan 25, 2018
|
$
|
15.0
|
|
$
|
(0.4
|
)
|
||||
|
34551 Ardenwood Boulevard
|
Silicon Valley
|
Feb 9, 2018
|
73.3
|
|
25.3
|
|
||||||
|
3065 Gold Camp Drive
|
Sacramento
|
Mar 14, 2018
|
14.2
|
|
5.4
|
|
||||||
|
11085 Sun Center Drive
|
Sacramento
|
Mar 14, 2018
|
36.8
|
|
9.1
|
|
||||||
|
Austin Portfolio
|
Austin
|
Apr 19, 2018
|
47.6
|
|
12.0
|
|
||||||
|
2010 East Centennial Circle
|
Phoenix
|
May 22, 2018
|
5.5
|
|
(0.5
|
)
|
||||||
|
1125 Energy Park Drive
|
Minneapolis
|
May 31, 2018
|
7.0
|
|
2.8
|
|
||||||
|
360 Spear Street
|
San Francisco
|
Sep 21, 2018
|
92.3
|
|
26.7
|
|
||||||
|
$
|
291.7
|
|
$
|
80.4
|
|
|||||||
2017 Dispositions
|
Location
|
Metro Area
|
Date Sold
|
Gross Proceeds (in millions)
|
Gain on Sale (in millions)
|
||||||||
|
8025 North Interstate 35
|
Austin
|
August 10, 2017
|
$
|
20.2
|
|
$
|
9.6
|
|
||||
|
44874 Moran Road
(1)
|
Northern Virginia
|
October 6, 2017
|
34.0
|
|
15.6
|
|
||||||
|
1 Solutions Parkway
|
St. Louis
|
November 28, 2017
|
37.1
|
|
14.7
|
|
||||||
|
$
|
91.3
|
|
$
|
39.9
|
|
|||||||
|
(1)
|
The property was held in a consolidated joint venture in which the Company owned a
75%
interest. The Company recognized a gain on the sale of approximately
$11.7 million
, net of noncontrolling interests.
|
138
DIGITAL REALTY TRUST, INC. AND SUBSIDIARIES
DIGITAL REALTY TRUST, L.P. AND SUBSIDIARIES
NOTES TO CONSOLIDATED FINANCIAL STATEMENTS- (Continued)
December 31, 2018 and 2017
5. Investments in Unconsolidated Joint Ventures
As of
December 31, 2018
, our investments in unconsolidated joint ventures consist of effective:
50%
interests in
four
joint ventures that own data center buildings in Seattle, Hong Kong, Tokyo, and Osaka;
20%
interests in
two
joint ventures,
one
of which owns
10
data center properties with an investment fund managed by Prudential Real Estate Investors (PREI®) and the other which owns
one
data center property with an affiliate of Griffin Capital Essential Asset REIT, Inc. (GCEAR) and a
17%
interest in a joint venture that owns a data center property at 1101 Space Park Drive in Santa Clara.
On November 1, 2017, the Company formed a joint venture with Mitsubishi Corporation to provide data center solutions in Japan. The Company contributed its recently completed data center development project in Osaka, cash and working capital for a
50%
interest in the joint venture. The Mitsubishi Corporation contributed
two
existing data center facilities in the western Tokyo suburb of Mitaka for the remaining
50%
interest.
139
DIGITAL REALTY TRUST, INC. AND SUBSIDIARIES
DIGITAL REALTY TRUST, L.P. AND SUBSIDIARIES
NOTES TO CONSOLIDATED FINANCIAL STATEMENTS- (Continued)
December 31, 2018 and 2017
The following tables present summarized financial information for our joint ventures for the years ended
December 31, 2018
,
2017
, and
2016
(in thousands):
|
2018
|
%
Ownership |
Net Investment
in Properties |
Total
Assets |
Mortgage
Loans |
Total
Liabilities |
Equity /
(Deficit) |
Revenues
|
Property
Operating Expense |
Net
Operating Income |
Net
Income (Loss) |
||||||||||||||||||||||||||||
|
Unconsolidated Joint Ventures
|
||||||||||||||||||||||||||||||||||||||
|
2001 Sixth Avenue
|
50.00
|
%
|
$
|
32,786
|
|
$
|
49,278
|
|
$
|
134,527
|
|
$
|
139,569
|
|
$
|
(90,291
|
)
|
$
|
52,806
|
|
$
|
(17,264
|
)
|
$
|
35,542
|
|
$
|
25,612
|
|
|||||||||
|
2020 Fifth Avenue
|
50.00
|
%
|
44,644
|
|
54,855
|
|
48,000
|
|
48,333
|
|
6,522
|
|
9,417
|
|
(2,156
|
)
|
7,261
|
|
4,689
|
|
||||||||||||||||||
|
33 Chun Choi Street (Hong Kong)
|
50.00
|
%
|
151,256
|
|
201,527
|
|
—
|
|
9,337
|
|
192,190
|
|
21,394
|
|
(7,164
|
)
|
14,230
|
|
6,958
|
|
||||||||||||||||||
|
Mitsubishi
|
50.00
|
%
|
332,373
|
|
469,159
|
|
228,075
|
|
285,424
|
|
183,735
|
|
59,300
|
|
(26,360
|
)
|
32,940
|
|
15,884
|
|
||||||||||||||||||
|
PREI ®
|
20.00
|
%
|
375,016
|
|
433,024
|
|
210,626
|
|
283,899
|
|
149,125
|
|
42,058
|
|
(8,457
|
)
|
33,601
|
|
(4,159
|
)
|
||||||||||||||||||
|
GCEAR
|
20.00
|
%
|
111,909
|
|
139,268
|
|
101,885
|
|
104,268
|
|
35,000
|
|
20,457
|
|
(8,546
|
)
|
11,911
|
|
(2,177
|
)
|
||||||||||||||||||
|
1101 Space Park Drive
|
17.00
|
%
|
22,677
|
|
24,320
|
|
5,225
|
|
5,327
|
|
18,993
|
|
9,383
|
|
(5,879
|
)
|
3,504
|
|
415
|
|
||||||||||||||||||
|
Total Unconsolidated Joint Ventures
|
$
|
1,070,661
|
|
$
|
1,371,431
|
|
$
|
728,338
|
|
$
|
876,157
|
|
$
|
495,274
|
|
$
|
214,815
|
|
$
|
(75,826
|
)
|
$
|
138,989
|
|
$
|
47,222
|
|
|||||||||||
|
Our investment in and share of equity in earnings of unconsolidated joint ventures
|
$
|
175,108
|
|
$
|
32,979
|
|
||||||||||||||||||||||||||||||||
|
2017
|
%
Ownership |
Net Investment
in Properties |
Total
Assets |
Mortgage
Loans |
Total
Liabilities |
Equity /
(Deficit) |
Revenues
|
Property
Operating Expense |
Net
Operating Income |
Net
Income (Loss) |
||||||||||||||||||||||||||||
|
Unconsolidated Joint Ventures
|
||||||||||||||||||||||||||||||||||||||
|
2001 Sixth Avenue
|
50.00
|
%
|
$
|
26,933
|
|
$
|
50,481
|
|
$
|
134,472
|
|
$
|
138,564
|
|
$
|
(88,083
|
)
|
$
|
49,369
|
|
$
|
(16,719
|
)
|
$
|
32,650
|
|
$
|
20,833
|
|
|||||||||
|
2020 Fifth Avenue
|
50.00
|
%
|
45,309
|
|
54,594
|
|
47,000
|
|
47,249
|
|
7,345
|
|
9,088
|
|
(1,820
|
)
|
7,268
|
|
4,881
|
|
||||||||||||||||||
|
33 Chun Choi Street (Hong Kong)
|
50.00
|
%
|
133,435
|
|
192,071
|
|
—
|
|
5,598
|
|
186,473
|
|
19,235
|
|
(6,504
|
)
|
12,731
|
|
5,467
|
|
||||||||||||||||||
|
Mitsubishi
|
50.00
|
%
|
325,977
|
|
452,063
|
|
221,851
|
|
288,962
|
|
163,101
|
|
7,927
|
|
(4,218
|
)
|
3,709
|
|
1,108
|
|
||||||||||||||||||
|
PREI ®
|
20.00
|
%
|
399,967
|
|
456,912
|
|
207,687
|
|
285,050
|
|
171,862
|
|
41,464
|
|
(7,978
|
)
|
33,486
|
|
13,889
|
|
||||||||||||||||||
|
GCEAR
|
20.00
|
%
|
114,376
|
|
151,191
|
|
101,680
|
|
104,220
|
|
46,971
|
|
18,924
|
|
(7,362
|
)
|
11,562
|
|
(1,962
|
)
|
||||||||||||||||||
|
1101 Space Park Drive
|
17.00
|
%
|
15,953
|
|
17,694
|
|
—
|
|
236
|
|
17,458
|
|
5,958
|
|
(4,629
|
)
|
1,329
|
|
(272
|
)
|
||||||||||||||||||
|
Total Unconsolidated Joint Ventures
|
$
|
1,061,950
|
|
$
|
1,375,006
|
|
$
|
712,690
|
|
$
|
869,879
|
|
$
|
505,127
|
|
$
|
151,965
|
|
$
|
(49,230
|
)
|
$
|
102,735
|
|
$
|
43,944
|
|
|||||||||||
|
Our investment in and share of equity in earnings of unconsolidated joint ventures
|
$
|
163,477
|
|
$
|
25,516
|
|
||||||||||||||||||||||||||||||||
|
2016
|
%
Ownership |
Net Investment
in Properties |
Total
Assets |
Mortgage
Loans |
Total
Liabilities |
Equity /
(Deficit) |
Revenues
|
Property
Operating Expense |
Net
Operating Income |
Net
Income (Loss) |
||||||||||||||||||||||||||||
|
Unconsolidated Joint Ventures
|
||||||||||||||||||||||||||||||||||||||
|
2001 Sixth Avenue
|
50.00
|
%
|
$
|
27,342
|
|
$
|
43,258
|
|
$
|
101,394
|
|
$
|
106,241
|
|
$
|
(62,983
|
)
|
$
|
45,518
|
|
$
|
(15,574
|
)
|
$
|
29,944
|
|
$
|
16,374
|
|
|||||||||
|
2020 Fifth Avenue
|
50.00
|
%
|
45,973
|
|
55,005
|
|
47,000
|
|
47,612
|
|
7,393
|
|
8,788
|
|
(1,500
|
)
|
7,288
|
|
4,821
|
|
||||||||||||||||||
|
33 Chun Choi Street (Hong Kong)
|
50.00
|
%
|
134,249
|
|
184,855
|
|
—
|
|
3,291
|
|
181,564
|
|
18,856
|
|
(6,636
|
)
|
12,220
|
|
6,315
|
|
||||||||||||||||||
|
PREI ®
|
20.00
|
%
|
409,876
|
|
468,298
|
|
207,270
|
|
288,325
|
|
179,973
|
|
41,075
|
|
(8,503
|
)
|
32,572
|
|
13,615
|
|
||||||||||||||||||
|
GCEAR
|
20.00
|
%
|
116,949
|
|
162,863
|
|
101,477
|
|
104,393
|
|
58,470
|
|
19,742
|
|
(7,808
|
)
|
11,934
|
|
(1,396
|
)
|
||||||||||||||||||
|
1101 Space Park Drive
|
17.00
|
%
|
6,839
|
|
8,415
|
|
—
|
|
135
|
|
8,280
|
|
3,539
|
|
(4,105
|
)
|
(566
|
)
|
(1,515
|
)
|
||||||||||||||||||
|
Total Unconsolidated Joint Ventures
|
$
|
741,228
|
|
$
|
922,694
|
|
$
|
457,141
|
|
$
|
549,997
|
|
$
|
372,697
|
|
$
|
137,518
|
|
$
|
(44,126
|
)
|
$
|
93,392
|
|
$
|
38,214
|
|
|||||||||||
|
Our investment in and share of equity in earnings of unconsolidated joint ventures
|
$
|
106,402
|
|
$
|
17,104
|
|
||||||||||||||||||||||||||||||||
140
DIGITAL REALTY TRUST, INC. AND SUBSIDIARIES
DIGITAL REALTY TRUST, L.P. AND SUBSIDIARIES
NOTES TO CONSOLIDATED FINANCIAL STATEMENTS- (Continued)
December 31, 2018 and 2017
The amounts reflected in the tables above, except for our investment in and share of equity in earnings of unconsolidated joint ventures, are based on the historical financial information of the individual joint ventures. The debt of our unconsolidated joint ventures generally are non-recourse to us, except for customary exceptions pertaining to such matters as intentional misuse of funds, environmental conditions, and material misrepresentations.
Differences between the Company’s investments in the joint ventures and the amount of the underlying equity in net assets of the joint ventures are due to basis differences resulting from the Company’s equity investment recorded at its historical basis versus the fair value of the Company’s contributed interest in the joint ventures. Our proportionate share of the earnings or losses related to these unconsolidated joint ventures is reflected as equity in earnings of unconsolidated joint ventures on the accompanying consolidated income statements.
141
DIGITAL REALTY TRUST, INC. AND SUBSIDIARIES
DIGITAL REALTY TRUST, L.P. AND SUBSIDIARIES
NOTES TO CONSOLIDATED FINANCIAL STATEMENTS- (Continued)
December 31, 2018 and 2017
6. Acquired Intangible Assets and Liabilities
The following summarizes our acquired intangible assets (real estate intangibles, comprised of acquired in-place lease value and tenant relationship value along with acquired above-market lease value) and intangible liabilities (acquired below-market lease value) as of
December 31, 2018
and
2017
.
|
|
Balance as of
|
||||||
|
(Amounts in thousands)
|
December 31, 2018
|
December 31, 2017
|
|||||
|
Acquired in-place lease value:
|
|||||||
|
Gross amount
|
$
|
1,569,401
|
|
$
|
1,473,515
|
|
|
|
Accumulated amortization
|
(795,033
|
)
|
(613,948
|
)
|
|||
|
Net
|
$
|
774,368
|
|
$
|
859,567
|
|
|
|
Tenant relationship value:
|
|||||||
|
Gross amount
|
$
|
2,339,606
|
|
$
|
1,978,277
|
|
|
|
Accumulated amortization
|
(291,818
|
)
|
(169,919
|
)
|
|||
|
Net
|
$
|
2,047,788
|
|
$
|
1,808,358
|
|
|
|
Acquired above-market leases:
|
|||||||
|
Gross amount
|
$
|
277,796
|
|
$
|
294,514
|
|
|
|
Accumulated amortization
|
(158,037
|
)
|
(110,139
|
)
|
|||
|
Net
|
$
|
119,759
|
|
$
|
184,375
|
|
|
|
Acquired below-market leases:
|
|||||||
|
Gross amount
|
$
|
442,535
|
|
$
|
469,119
|
|
|
|
Accumulated amortization
|
(242,422
|
)
|
(219,654
|
)
|
|||
|
Net
|
$
|
200,113
|
|
$
|
249,465
|
|
|
Amortization of acquired below-market lease value, net of acquired above-market lease value, resulted in a change in rental revenues of
$(27.3) million
,
$(2.2) million
and
$8.3 million
for the years ended
December 31, 2018
,
2017
and
2016
, respectively. The expected average remaining lives for acquired below-market leases and acquired above-market leases is
8.1 years
and
2.8 years
, respectively, as of
December 31, 2018
. Estimated annual amortization of acquired below-market lease value, net of acquired above-market lease value, for each of the five succeeding years and thereafter, commencing January 1,
2019
is as follows:
|
(Amounts in thousands)
|
|
||
|
2019
|
$
|
(15,323
|
)
|
|
2020
|
(3,915
|
)
|
|
|
2021
|
872
|
|
|
|
2022
|
7,898
|
|
|
|
2023
|
12,045
|
|
|
|
Thereafter
|
78,777
|
|
|
|
Total
|
$
|
80,354
|
|
142
DIGITAL REALTY TRUST, INC. AND SUBSIDIARIES
DIGITAL REALTY TRUST, L.P. AND SUBSIDIARIES
NOTES TO CONSOLIDATED FINANCIAL STATEMENTS- (Continued)
December 31, 2018 and 2017
Amortization of acquired in-place lease value (a component of depreciation and amortization expense) was
$211.0 million
,
$101.2 million
and
$52.6 million
for the years ended
December 31, 2018
,
2017
and
2016
, respectively. The expected average amortization period for acquired in-place lease value is
6.4 years
as of
December 31, 2018
. The weighted average remaining contractual life for acquired leases excluding renewals or extensions is
5.9 years
as of
December 31, 2018
. Estimated annual amortization of acquired in-place lease value for each of the five succeeding years and thereafter, commencing January 1,
2019
is as follows:
|
(Amounts in thousands)
|
|
||
|
2019
|
$
|
158,095
|
|
|
2020
|
123,450
|
|
|
|
2021
|
98,916
|
|
|
|
2022
|
77,056
|
|
|
|
2023
|
65,518
|
|
|
|
Thereafter
|
251,333
|
|
|
|
Total
|
$
|
774,368
|
|
Amortization of tenant relationship value and trade names (a component of depreciation and amortization expense) was approximately
$123.5 million
and
$0
, respectively, for the year ended
December 31, 2018
,
$85.9 million
and
$0
, respectively, for the year ended
December 31, 2017
and
$67.2 million
and
$6.9 million
, respectively for the year ended
December 31, 2016
. During the year ended
December 31, 2016
, management of the Company decided to retire the Telx trade name. Accordingly, the Company wrote off the net remaining balance of approximately
$6.1 million
. The weighted average remaining contractual life for tenant relationship value is
14.8 years
. Estimated annual amortization of tenant relationship value for each of the five succeeding years and thereafter, commencing January 1,
2019
is as follows:
|
(Amounts in thousands)
|
|||
|
2019
|
$
|
143,818
|
|
|
2020
|
143,818
|
|
|
|
2021
|
143,818
|
|
|
|
2022
|
143,818
|
|
|
|
2023
|
143,818
|
|
|
|
Thereafter
|
1,328,698
|
|
|
|
Total
|
$
|
2,047,788
|
|
143
DIGITAL REALTY TRUST, INC. AND SUBSIDIARIES
DIGITAL REALTY TRUST, L.P. AND SUBSIDIARIES
NOTES TO CONSOLIDATED FINANCIAL STATEMENTS- (Continued)
December 31, 2018 and 2017
7. Debt of the Company
In this Note 7, the “Company” refers only to Digital Realty Trust, Inc. and not to any of its subsidiaries.
The Company itself does not have any indebtedness. All debt is held directly or indirectly by the Operating Partnership.
Guarantee of Debt
The Company guarantees the Operating Partnership’s obligations with respect to its
5.875%
notes due 2020 (
5.875%
2020 Notes),
3.400%
notes due 2020 (
3.400%
2020 Notes),
5.250%
notes due 2021 (2021 Notes),
3.950%
notes due 2022 (
3.950%
2022 Notes)
,
3.625%
notes due 2022 (
3.625%
2022 Notes),
2.750%
notes due 2023 (
2.750%
2023 Notes),
4.750%
notes due 2025 (
4.750%
2025 Notes),
3.700%
notes due 2027 (2027 Notes) and
4.450%
notes due 2028 (2028 Notes). The Company and the Operating Partnership guarantee the obligations of Digital Stout Holding, LLC, a wholly owned subsidiary of the Operating Partnership, with respect to its
4.750%
notes due 2023 (
4.750%
2023 Notes),
2.750%
notes due 2024 (
2.750%
2024 Notes),
4.250%
notes due 2025 (
4.250%
2025 Notes),
3.300%
notes due 2029 (2029 Notes) and
3.750%
notes due 2030 (2030 Notes) and the obligations of Digital Euro Finco, LLC, a wholly owned subsidiary of the Operating Partnership, with respect to its
2.625%
notes due 2024 (
2.625%
2024 Notes) and Floating Rate Guaranteed Notes due 2019 (2019 Notes). The Company is also the guarantor of the Operating Partnership’s and its subsidiary borrowers’ obligations under the global revolving credit facilities and unsecured term loans.
144
DIGITAL REALTY TRUST, INC. AND SUBSIDIARIES
DIGITAL REALTY TRUST, L.P. AND SUBSIDIARIES
NOTES TO CONSOLIDATED FINANCIAL STATEMENTS- (Continued)
December 31, 2018 and 2017
8. Debt of the Operating Partnership
A summary of outstanding indebtedness of the Operating Partnership as of
December 31, 2018
and
2017
is as follows (in thousands):
|
Indebtedness
|
Interest Rate at December 31, 2018
|
Maturity Date
|
Principal Outstanding December 31, 2018
|
Principal Outstanding December 31, 2017
|
||||||||
|
Global revolving credit facilities
|
Various
|
(1)
|
Jan 24, 2023
|
(1)
|
$
|
1,663,156
|
|
(2)
|
$
|
558,191
|
|
(2)
|
|
Deferred financing costs, net
|
(15,421
|
)
|
(7,245
|
)
|
||||||||
|
Global revolving credit facilities, net
|
1,647,735
|
|
550,946
|
|
||||||||
|
Unsecured Term Loans
|
||||||||||||
|
2019 Term Loan
|
Base Rate + 1.000%
|
Dec 19, 2019
|
375,000
|
|
—
|
|
||||||
|
2023 Term Loan
|
Various
|
(3)(4)
|
Jan 15, 2023
|
300,000
|
|
(5)
|
300,000
|
|
(5)
|
|||
|
2024 Term Loan
|
Various
|
(3)(4)
|
Jan 24, 2023
|
508,120
|
|
(5)
|
1,125,117
|
|
(5)
|
|||
|
Deferred financing costs, net
|
(4,216
|
)
|
(4,784
|
)
|
||||||||
|
Unsecured term loans, net
|
1,178,904
|
|
1,420,333
|
|
||||||||
|
Unsecured senior notes:
|
||||||||||||
|
Senior Notes:
|
||||||||||||
|
Floating rate notes due 2019
|
EURIBOR + 0.500%
|
May 22, 2019
|
143,338
|
|
(6)
|
150,063
|
|
(6)
|
||||
|
5.875% notes due 2020
|
5.875%
|
Feb 1, 2020
|
500,000
|
|
500,000
|
|
||||||
|
3.400% notes due 2020
|
3.400%
|
Oct 1, 2020
|
500,000
|
|
500,000
|
|
||||||
|
5.250% notes due 2021
|
5.250%
|
Mar 15, 2021
|
400,000
|
|
400,000
|
|
||||||
|
3.950% notes due 2022
|
3.950%
|
Jul 1, 2022
|
500,000
|
|
500,000
|
|
||||||
|
3.625% notes due 2022
|
3.625%
|
Oct 1, 2022
|
300,000
|
|
300,000
|
|
||||||
|
2.750% notes due 2023
|
2.750%
|
Feb 1, 2023
|
350,000
|
|
350,000
|
|
||||||
|
4.750% notes due 2023
|
4.750%
|
Oct 13, 2023
|
382,620
|
|
(7)
|
405,390
|
|
(7)
|
||||
|
2.625% notes due 2024
|
2.625%
|
Apr 15, 2024
|
688,020
|
|
(6)
|
720,300
|
|
(6)
|
||||
|
2.750% notes due 2024
|
2.750%
|
Jul 19, 2024
|
318,850
|
|
(7)
|
337,825
|
|
(7)
|
||||
|
4.250% notes due 2025
|
4.250%
|
Jan 17, 2025
|
510,160
|
|
(7)
|
540,520
|
|
(7)
|
||||
|
4.750% notes due 2025
|
4.750%
|
Oct 1, 2025
|
450,000
|
|
450,000
|
|
||||||
|
3.700% notes due 2027
|
3.700%
|
Aug 15, 2027
|
1,000,000
|
|
1,000,000
|
|
||||||
|
4.450% notes due 2028
|
4.450%
|
Jul 15, 2028
|
650,000
|
|
—
|
|
||||||
|
3.300% notes due 2029
|
3.300%
|
Jul 19, 2029
|
446,390
|
|
(7)
|
472,955
|
|
(7)
|
||||
|
3.750% notes due 2030
|
3.750%
|
Oct 17, 2030
|
510,160
|
|
(7)
|
—
|
|
|||||
|
Unamortized discounts
|
(19,859
|
)
|
(18,508
|
)
|
||||||||
|
Total senior notes, net of discount
|
7,629,679
|
|
6,608,545
|
|
||||||||
|
Deferred financing costs, net
|
(40,553
|
)
|
(37,788
|
)
|
||||||||
|
Total unsecured senior notes, net of discount and deferred financing costs
|
7,589,126
|
|
6,570,757
|
|
||||||||
|
Secured debt:
|
||||||||||||
|
731 East Trade Street
|
8.22%
|
Jul 1, 2020
|
1,776
|
|
2,370
|
|
||||||
|
Secured note due December 2023
|
Base Rate + 4.250%
|
Dec 20, 2023
|
104,000
|
|
104,000
|
|
||||||
|
Secured note due March 2023
|
LIBOR + 1.100%
|
(4)
|
Mar 1, 2023
|
600,000
|
|
—
|
|
|||||
|
Unamortized net premiums
|
148
|
|
241
|
|
||||||||
|
Total secured debt, including premiums
|
705,924
|
|
106,611
|
|
||||||||
|
Deferred financing costs, net
|
(20,210
|
)
|
(29
|
)
|
||||||||
|
Total secured debt, including premiums and net of deferred financing costs
|
685,714
|
|
106,582
|
|
||||||||
|
Total indebtedness
|
$
|
11,101,479
|
|
$
|
8,648,618
|
|
||||||
145
DIGITAL REALTY TRUST, INC. AND SUBSIDIARIES
DIGITAL REALTY TRUST, L.P. AND SUBSIDIARIES
NOTES TO CONSOLIDATED FINANCIAL STATEMENTS- (Continued)
December 31, 2018 and 2017
|
(1)
|
The interest rate for borrowings under the global revolving credit facility equals the applicable index plus a margin of
90
basis points, which is based on the current credit ratings of our long-term debt. An annual facility fee of
20
basis points, which is based on the credit ratings of our long-term debt, is due and payable quarterly on the total commitment amount of the facility.
Two
six
-month extensions are available, which we may exercise if certain conditions are met. The interest rate for borrowings under the Yen revolving credit facility equals the applicable index plus a margin of
50
basis points, which is based on the current credit ratings of our long-term debt.
|
|
(2)
|
Balances as of
December 31, 2018
and
December 31, 2017
are as follows (balances, in thousands):
|
|
Denomination of Draw
|
Balance as of December 31, 2018
|
Weighted-average
interest rate |
Balance as of December 31, 2017
|
Weighted-average
interest rate |
|||||||||
|
Global Revolving Credit Facility
|
|||||||||||||
|
Floating Rate Borrowing (a)
|
|||||||||||||
|
U.S. dollar ($)
|
$
|
890,000
|
|
3.37
|
%
|
$
|
400,000
|
|
2.48
|
%
|
|||
|
British pound sterling (£)
|
8,290
|
|
(c)
|
1.61
|
%
|
18,918
|
|
(d)
|
1.50
|
%
|
|||
|
Euro (€)
|
451,800
|
|
(c)
|
0.90
|
%
|
31,213
|
|
(d)
|
0.62
|
%
|
|||
|
Australian dollar (AUD)
|
27,632
|
|
(c)
|
2.82
|
%
|
—
|
|
|
—
|
%
|
|||
|
Hong Kong dollar (HKD)
|
8,797
|
|
(c)
|
3.14
|
%
|
4,100
|
|
(d)
|
2.20
|
%
|
|||
|
Japanese yen (JPY)
|
4,105
|
|
(c)
|
0.90
|
%
|
65,890
|
|
(d)
|
0.96
|
%
|
|||
|
Singapore dollar (SGD)
|
77,112
|
|
(c)
|
2.79
|
%
|
—
|
|
—
|
%
|
||||
|
Canadian dollar (CAD)
|
60,856
|
|
(c)
|
3.16
|
%
|
23,070
|
|
(d)
|
2.36
|
%
|
|||
|
Total
|
$
|
1,528,592
|
|
2.57
|
%
|
$
|
543,191
|
|
2.15
|
%
|
|||
|
Base Rate Borrowing (b)
|
|||||||||||||
|
U.S. dollar ($)
|
$
|
—
|
|
—
|
%
|
$
|
15,000
|
|
4.50
|
%
|
|||
|
Total borrowings
|
$
|
1,528,592
|
|
2.57
|
%
|
$
|
558,191
|
|
2.21
|
%
|
|||
|
Yen Revolving Credit Facility
|
134,564
|
|
(c)
|
0.50
|
%
|
—
|
|
—
|
%
|
||||
|
Total borrowings
|
$
|
1,663,156
|
|
2.41
|
%
|
$
|
558,191
|
|
2.21
|
%
|
|||
|
(a)
|
The interest rates for floating rate borrowings under the global revolving credit facility currently equal the applicable index plus a margin of
90
basis points, which is based on the credit rating of our long-term debt.
|
|
(b)
|
The interest rates for base rate borrowings under the global revolving credit facility equal the U.S. Prime Rate.
|
|
(c)
|
Based on exchange rates of
$1.28
to £1.00,
$1.15
to
€1.00
,
$0.78
to
1.00
AUD,
$0.13
to
1.00
HKD,
$0.01
to
1.00
JPY,
$0.73
to
1.00
SGD and
$0.73
to
1.00
CAD, respectively, as of
December 31, 2018
.
|
|
(d)
|
Based on exchange rates
$1.23
to £1.00, of
$1.35
to
€1.00
,
$0.78
to
1.00
HKD,
$0.13
to 1.00 JPY,
$0.69
to 1.00 SGD and
$0.80
to 1.00 CAD, respectively, as of
December 31, 2017
.
|
|
(3)
|
Interest rates are based on our current senior unsecured debt ratings and is currently
100
basis points over the applicable index for floating rate advances for the 2023 Term Loan and the 2024 Term Loan.
|
|
(4)
|
We have entered into interest rate swap agreements as a cash flow hedge for interest generated by the U.S. dollar and Canadian dollar borrowings under the global revolving credit facility and unsecured term loan. See Note 15. "Derivative Instruments" for further information.
|
146
DIGITAL REALTY TRUST, INC. AND SUBSIDIARIES
DIGITAL REALTY TRUST, L.P. AND SUBSIDIARIES
NOTES TO CONSOLIDATED FINANCIAL STATEMENTS- (Continued)
December 31, 2018 and 2017
|
(5)
|
Balances as of
December 31, 2018
and
December 31, 2017
are as follows (balances, in thousands):
|
|
Denomination of Draw
|
Balance as of December 31, 2018
|
|
Weighted-average
interest rate |
|
Balance as of December 31, 2017
|
|
Weighted-average
interest rate |
|
||||||
|
U.S. dollar ($)
|
$
|
300,000
|
|
3.46
|
%
|
(b)
|
$
|
606,911
|
|
2.78
|
%
|
(d)
|
||
|
British pound sterling (£)
|
—
|
|
|
—
|
%
|
|
229,011
|
|
(c)
|
1.59
|
%
|
(d)
|
||
|
Singapore dollar (SGD)
|
146,080
|
|
(a)
|
2.76
|
%
|
233,788
|
|
(c)
|
2.17
|
%
|
||||
|
Australian dollar (AUD)
|
204,632
|
|
(a)
|
2.94
|
%
|
179,841
|
|
(c)
|
2.79
|
%
|
||||
|
Hong Kong dollar (HKD)
|
85,188
|
|
(a)
|
3.32
|
%
|
85,762
|
|
(c)
|
2.20
|
%
|
||||
|
Canadian dollar (CAD)
|
72,220
|
|
(a)
|
3.24
|
%
|
(b)
|
78,357
|
|
(c)
|
2.44
|
%
|
(d)
|
||
|
Japanese yen (JPY)
|
—
|
|
|
—
|
%
|
11,447
|
|
(c)
|
1.05
|
%
|
||||
|
Total
|
$
|
808,120
|
|
3.17
|
%
|
(b)
|
$
|
1,425,117
|
|
2.42
|
%
|
(d)
|
||
|
(a)
|
Based on exchange rates of
$0.73
to
1.00
SGD,
$0.70
to
1.00
AUD,
$0.13
to
1.00
HKD and
$0.73
to
1.00
CAD, respectively, as of
December 31, 2018
.
|
|
(b)
|
As of
December 31, 2018
, the weighted-average interest rate reflecting interest rate swaps was
2.44%
(U.S. dollar),
1.78%
(Canadian dollar) and
2.66%
(Total). See Note 15 for further discussion on interest rate swaps.
|
|
(c)
|
Based on exchange rates of
$1.23
to
£1.00
,
$0.75
to
1.00
SGD,
$0.78
to
1.00
AUD,
$0.13
to 1.00 HKD,
$0.74
to 1.00 CAD and
$0.01
to 1.00 JPY, respectively, as of
December 31, 2017
.
|
|
(d)
|
As of
December 31, 2017
, the weighted-average interest rate reflecting interest rate swaps was
2.72%
(U.S. dollar),
1.89%
(British pound sterling),
1.88%
(Canadian dollar) and
2.41%
(Total). See Note 15 for further discussion on interest rate swaps.
|
|
(6)
|
Based on exchange rates of
$1.15
to €1.00 as of
December 31, 2018
and
$1.20
to €1.00 as of
December 31, 2017
.
|
|
(7)
|
Based on exchange rates of
$1.28
to £1.00 as of
December 31, 2018
and
$1.35
to £1.00 as of
December 31, 2017
.
|
Global Revolving Credit Facilities
On October 24, 2018, we refinanced our global revolving credit facility and entered into a global senior credit agreement for a
$2.35 billion
senior unsecured revolving credit facility, which we refer to as the 2018 global revolving credit facility, that replaced the
$2.0 billion
revolving credit facility executed on January 15, 2016. In addition, we have the ability from time to time to increase the size of the global revolving credit facility and the unsecured term loans (discussed below), in any combination, by up to
$1.25 billion
, subject to the receipt of lender commitments and other conditions precedent. The 2018 global revolving credit facility matures on
January 24, 2023
, with
two
six
-month extension options available. The interest rate for borrowings under the 2018 global revolving credit facility equals the applicable index plus a margin which is based on the credit ratings of our long-term debt and is currently
90
basis points. An annual facility fee on the total commitment amount of the facility, based on the credit ratings of our long-term debt, currently
20
basis points, is payable quarterly. The 2018 global revolving credit facility provides for borrowings in U.S., Canadian, Singapore, Australian and Hong Kong dollars, as well as Euro, British pound sterling and Japanese yen and includes the ability to add additional currencies in the future. As of
December 31, 2018
, interest rates are based on 1-month LIBOR, 1-month GBP LIBOR, 1-month EURIBOR, 1-month HIBOR, 1-month JPY LIBOR, 1-month SOR and 1-month CDOR, plus a margin of
0.90%
. We have used and intend to use available borrowings under the 2018 global revolving credit facility to acquire additional properties, fund development opportunities and for general working capital and other corporate purposes, including potentially for the repurchase, redemption or retirement of outstanding debt or equity securities. As of
December 31, 2018
, approximately
$44.5 million
of letters of credit were issued.
The 2018 global revolving credit facility contains various restrictive covenants, including limitations on our ability to incur additional indebtedness, make certain investments or merge with another company, and requirements to maintain financial coverage ratios, including with respect to unencumbered assets. In addition, the 2018 global revolving credit facility restricts Digital Realty Trust, Inc. from making distributions to its stockholders, or redeeming or otherwise repurchasing shares of its capital stock, after the occurrence and during the continuance of an event of default, except in limited circumstances including as necessary to enable Digital
147
DIGITAL REALTY TRUST, INC. AND SUBSIDIARIES
DIGITAL REALTY TRUST, L.P. AND SUBSIDIARIES
NOTES TO CONSOLIDATED FINANCIAL STATEMENTS- (Continued)
December 31, 2018 and 2017
Realty Trust, Inc. to maintain its qualification as a REIT and to minimize the payment of income or excise tax. As of
December 31, 2018
, we were in compliance with all of such covenants.
On October 24, 2018, we entered into a credit agreement for a
¥33.3 billion
(approximately
$296.5 million
based on the exchange rate on October 24, 2018) senior unsecured revolving credit facility, which we refer to as the Yen revolving credit facility. The Yen revolving credit facility provides for borrowings in Japanese yen. In addition, we have the ability from time to time to increase the size of the Yen revolving credit facility to up to
¥93.3 billion
(approximately
$831.1 million
based on the exchange rate on October 24, 2018), subject to receipt of lender commitments and other conditions precedent. The Yen revolving credit facility matures on January 24, 2024. The interest rate for borrowings under the Yen revolving credit facility equals the applicable index plus a margin which is based on the credit ratings of our long-term debt and is currently
50
basis points. A quarterly unused commitment fee, which is calculated using the average daily unused revolving credit commitment, is based on the credit ratings of our long-term debt, and is currently
10
basis points.
The Yen revolving credit facility contains various restrictive covenants, including limitations on our ability to incur additional indebtedness, make certain investments or merge with another company, and requirements to maintain financial coverage ratios, including with respect to unencumbered assets. In addition, the Yen revolving credit facility restricts Digital Realty Trust, Inc. from making distributions to its stockholders, or redeeming or otherwise repurchasing shares of its capital stock, after the occurrence and during the continuance of an event of default, except in limited circumstances including as necessary to enable Digital Realty Trust, Inc. to maintain its qualification as a REIT and to minimize the payment of income or excise tax. As of
December 31, 2018
, we were in compliance with all of such covenants.
Unsecured Term Loans
On October 24, 2018, we refinanced our senior unsecured multi-currency term loan facility and entered into an amended and restated term loan agreement, which we refer to as the 2018 term loan agreement, which governs (i) a
$300.0 million
5
-year senior unsecured term loan, which we refer to as the 2023 Term Loan, and (ii) an approximately
$512 million
5
-year senior unsecured term loan, which we refer to as the 2024 Term Loan. The 2018 term loan agreement replaced the
$1.55 billion
term loan agreement executed on January 15, 2016. The 2023 Term Loan matures on January 15, 2023 and the 2024 Term Loan matures on January 24, 2023 with
two
six
-month extension options. In addition, we have the ability from time to time to increase the aggregate size of lending under the 2018 term loan agreement and the 2018 global revolving credit facility (discussed above), in any combination, by up to
$1.25 billion
, subject to receipt of lender commitments and other conditions precedent. Interest rates are based on our senior unsecured debt ratings and are currently
100
basis points over the applicable index for floating rate advances for the 2023 Term Loan and the 2024 Term Loan. Funds may be drawn in U.S., Canadian, Singapore, Australian and Hong Kong dollars. Based on exchange rates in effect at
December 31, 2018
, the balance outstanding is approximately
$0.8 billion
, excluding deferred financing costs. We have used borrowings under the term loans for acquisitions, repayment of indebtedness, development, working capital and general corporate purposes. The covenants under the 2023 Term Loan and 2024 Term Loan are consistent with our 2018 global revolving credit facility and, as of
December 31, 2018
, we were in compliance with all of such covenants.
148
DIGITAL REALTY TRUST, INC. AND SUBSIDIARIES
DIGITAL REALTY TRUST, L.P. AND SUBSIDIARIES
NOTES TO CONSOLIDATED FINANCIAL STATEMENTS- (Continued)
December 31, 2018 and 2017
Senior Notes
|
Senior Notes and Annual Interest Rate
|
Date Issued
|
Maturity Date
|
Amount Issued (in millions, local currency)
|
Net Proceeds (in millions)
(1)
|
Interest Payment Dates
|
Initial Issuer
(2)
|
||||||||||
|
Floating Rate Guaranteed Notes due 2019
(5)
|
May 22, 2017
|
May 22, 2019
|
€
|
125.0
|
|
$
|
140.1
|
|
Quarterly, commencing August 22, 2017
|
Digital Euro Finco, LLC
(3)
|
||||||
|
5.875% Notes due 2020
|
Jan 28, 2010
|
Feb 1, 2020
|
$
|
500.0
|
|
487.1
|
|
Semi-annually, commencing August 1, 2010
|
Digital Realty Trust, L.P.
|
|||||||
|
3.400% Notes due 2020
|
Oct 1, 2015
|
Oct 1, 2020
|
$
|
500.0
|
|
494.5
|
|
Semi-annually, commencing April 1, 2016
|
Digital Delta Holdings, LLC
(4)
|
|||||||
|
5.250% Notes due 2021
|
Mar 8, 2011
|
Mar 15, 2021
|
$
|
400.0
|
|
395.5
|
|
Semi-annually, commencing September 15, 2011
|
Digital Realty Trust, L.P.
|
|||||||
|
3.950% Notes due 2022
|
Jun 23, 2015
|
Jul 1, 2022
|
$
|
500.0
|
|
491.8
|
|
Semi-annually, commencing January 1, 2016
|
Digital Realty Trust, L.P.
|
|||||||
|
3.625% Notes due 2022
|
Sep 24, 2012
|
Oct 1, 2022
|
$
|
300.0
|
|
293.1
|
|
Semi-annually, commencing April 1, 2013
|
Digital Realty Trust, L.P.
|
|||||||
|
2.750% Notes due 2023
|
Aug 7, 2017
|
Feb 1, 2023
|
$
|
350.0
|
|
346.9
|
|
Semi-annually, commencing February 1, 2018
|
Digital Realty Trust, L.P.
|
|||||||
|
4.750% Notes due 2023
|
Apr 1, 2014
|
Oct 13, 2023
|
£
|
300.0
|
|
490.9
|
|
Semi-annually, commencing October 13, 2014
|
Digital Stout Holding, LLC
(3)
|
|||||||
|
2.625% Notes due 2024
|
Apr 15, 2016
|
Apr 15, 2024
|
€
|
600.0
|
|
670.3
|
|
Annually, commencing
April 15, 2017
|
Digital Euro Finco, LLC
(3)
|
|||||||
|
2.750% Notes due 2024
|
Jul 21, 2017
|
Jul 19, 2024
|
£
|
250.0
|
|
321.3
|
|
Annually, commencing July 19, 2018
|
Digital Stout Holding, LLC
(3)
|
|||||||
|
4.250% Notes due 2025
|
Jan 18, 2013
|
Jan 17, 2025
|
£
|
400.0
|
|
624.2
|
|
Semi-annually, commencing July 17, 2013
|
Digital Stout Holding, LLC
(3)
|
|||||||
|
4.750% Notes due 2025
|
Oct 1, 2015
|
Oct 1, 2025
|
$
|
450.0
|
|
445.8
|
|
Semi-annually, commencing April 1, 2016
|
Digital Delta Holdings, LLC
(4)
|
|||||||
|
3.700% Notes due 2027
|
Aug 7, 2017
|
Aug 15, 2027
|
$
|
1,000.0
|
|
991.0
|
|
Semi-annually, commencing February 15, 2018
|
Digital Realty Trust, L.P.
|
|||||||
|
4.450% Notes due 2028
|
Jun 21, 2018
|
Jul 15, 2028
|
$
|
650.0
|
|
643.3
|
|
Semi-annually, commencing January 15, 2019
|
Digital Realty Trust, L.P.
|
|||||||
|
3.300% Notes due 2029
|
Jul 21, 2017
|
Jul 19, 2029
|
£
|
350.0
|
|
448.6
|
|
Annually, commencing July 19, 2018
|
Digital Stout Holding, LLC
(3)
|
|||||||
|
3.750% Notes due 2030
|
Oct 17, 2018
|
Oct 17, 2030
|
£
|
400.0
|
|
516.1
|
|
Annually, commencing October 17, 2019
|
Digital Stout Holding, LLC
(3)
|
|||||||
|
(1)
|
Amounts are in U.S. dollars, based on the exchange rate on the date of issuance. Net proceeds are equal to principal amount less initial purchaser discount and other debt issuance costs.
|
|
(2)
|
Digital Realty Trust, Inc. guarantees the senior notes issued by Digital Realty Trust, L.P. Both Digital Realty Trust, L.P. and Digital Realty Trust, Inc. guarantee the senior notes issued by Digital Stout Holding, LLC and Digital Euro Finco, LLC.
|
|
(3)
|
A wholly owned subsidiary of Digital Realty Trust, L.P.
|
149
DIGITAL REALTY TRUST, INC. AND SUBSIDIARIES
DIGITAL REALTY TRUST, L.P. AND SUBSIDIARIES
NOTES TO CONSOLIDATED FINANCIAL STATEMENTS- (Continued)
December 31, 2018 and 2017
|
(4)
|
Initially a wholly owned subsidiary of Digital Realty Trust, Inc., pursuant to the terms of the indenture, following the consummation of the Telx Acquisition, on October 13, 2015, Digital Delta Holdings, LLC merged with and into Digital Realty Trust, L.P., with Digital Realty Trust, L.P. surviving the merger and assuming Digital Delta Holdings, LLC’s obligations under the 3.400% 2020 Notes, the 4.750% 2025 Notes, the related indenture and registration rights agreement by operation of law.
|
|
(5)
|
The 2019 Notes bear interest at a rate per annum, reset quarterly, equal to three-month EURIBOR plus 0.50% (currently
0.18%
).
|
The indentures governing each of the senior notes contain certain covenants, including (1) a leverage ratio not to exceed
60%
, (2) a secured debt leverage ratio not to exceed
40%
and (3) an interest coverage ratio of greater than
1.50
, and also requires us to maintain total unencumbered assets of not less than
150%
of the aggregate principal amount of unsecured debt. At
December 31, 2018
, we were in compliance with each of these financial covenants.
Ascenty Acquisition Financing
On December 19, 2018, the Operating Partnership entered into a term loan agreement, with Digital Realty Trust, Inc. as the parent guarantor, which we refer to as the Ascenty term loan agreement, which governs a
$375.0 million
1
-year senior unsecured term loan, which we refer to as the 2019 Term Loan. The 2019 Term Loan matures on December 19, 2019 with
one
six
-month extension option. Interest rates equals the applicable index plus a margin of
100
basis points, which is based on the current credit ratings of our senior unsecured debt (effective rate of
3.47%
as of
December 31, 2018
).
On December 20, 2018, our Brazilian subsidiary entered into a non-recourse credit agreement for up to
$775.0 million
in the aggregate, which consists of a
$600.0 million
5
-year secured term loan, which we refer to as the December 2023 Secured Loan, plus a
$125.0 million
delayed draw term loan and a
$50.0 million
revolving credit facility. The December 2023 Secured Loan matures on December 20, 2023. The interest rate on the December 2023 Secured Loan equals the applicable index plus a margin of
425
basis points (effective rate of
7.04%
as of
December 31, 2018
).
The table below summarizes our debt maturities and principal payments as of
December 31, 2018
(in thousands):
|
Global Revolving
Credit Facilities (1) |
Unsecured
Term Loans |
Senior Notes
|
Secured Debt
|
Total
Debt |
|||||||||||||||
|
2019
|
$
|
—
|
|
$
|
375,000
|
|
|
$
|
143,338
|
|
$
|
644
|
|
$
|
518,982
|
|
|||
|
2020
|
—
|
|
—
|
|
1,000,000
|
|
1,132
|
|
1,001,132
|
|
|||||||||
|
2021
|
—
|
|
—
|
|
400,000
|
|
120,000
|
|
520,000
|
|
|||||||||
|
2022
|
—
|
|
—
|
|
800,000
|
|
150,000
|
|
950,000
|
|
|||||||||
|
2023
|
1,528,592
|
|
808,120
|
|
732,620
|
|
434,000
|
|
3,503,332
|
|
|||||||||
|
Thereafter
|
134,564
|
|
—
|
|
4,573,580
|
|
—
|
|
4,708,144
|
|
|||||||||
|
Subtotal
|
$
|
1,663,156
|
|
$
|
1,183,120
|
|
$
|
7,649,538
|
|
$
|
705,776
|
|
$
|
11,201,590
|
|
||||
|
Unamortized discount
|
—
|
|
—
|
|
(19,859
|
)
|
—
|
|
(19,859
|
)
|
|||||||||
|
Unamortized premium
|
—
|
|
—
|
|
—
|
|
148
|
|
148
|
|
|||||||||
|
Total
|
$
|
1,663,156
|
|
$
|
1,183,120
|
|
$
|
7,629,679
|
|
$
|
705,924
|
|
$
|
11,181,879
|
|
||||
|
(1)
|
Subject to
two
six
-month extension options exercisable by us. The bank group is obligated to grant the extension options provided we give proper notice, we make certain representations and warranties and no default exists under the global revolving credit facility.
|
150
DIGITAL REALTY TRUST, INC. AND SUBSIDIARIES
DIGITAL REALTY TRUST, L.P. AND SUBSIDIARIES
NOTES TO CONSOLIDATED FINANCIAL STATEMENTS- (Continued)
December 31, 2018 and 2017
9. Income per Share
The following is a summary of basic and diluted income per share (in thousands, except share and per share amounts):
|
|
Year Ended December 31,
|
||||||||||
|
|
2018
|
2017
|
2016
|
||||||||
|
Net income available to common stockholders
|
$
|
249,930
|
|
$
|
173,148
|
|
$
|
332,088
|
|
||
|
Weighted average shares outstanding—basic
|
206,035,408
|
|
174,059,386
|
|
149,953,662
|
|
|||||
|
Potentially dilutive common shares:
|
|||||||||||
|
Stock options
|
—
|
|
—
|
|
9,726
|
|
|||||
|
Unvested incentive units
|
141,260
|
|
141,136
|
|
71,031
|
|
|||||
|
Forward equity offering
|
33,315
|
|
124,527
|
|
3,990
|
|
|||||
|
Market performance-based awards
|
463,488
|
|
570,049
|
|
641,279
|
|
|||||
|
Weighted average shares outstanding—diluted
|
206,673,471
|
|
174,895,098
|
|
150,679,688
|
|
|||||
|
Income per share:
|
|||||||||||
|
Basic
|
$
|
1.21
|
|
$
|
0.99
|
|
$
|
2.21
|
|
||
|
Diluted
|
$
|
1.21
|
|
$
|
0.99
|
|
$
|
2.20
|
|
||
We have excluded the following potentially dilutive securities in the calculations above as they would be antidilutive or not dilutive:
|
|
Year Ended December 31,
|
|||||||
|
|
2018
|
2017
|
2016
|
|||||
|
Weighted average of Operating Partnership common units not owned by Digital Realty Trust, Inc.
|
8,227,463
|
|
3,996,550
|
|
2,406,018
|
|
||
|
Potentially dilutive Series C Cumulative Redeemable Perpetual Preferred Stock
|
1,876,584
|
|
540,773
|
|
—
|
|
||
|
Potentially dilutive Series E Cumulative Redeemable Preferred Stock
|
—
|
|
—
|
|
2,880,254
|
|
||
|
Potentially dilutive Series F Cumulative Redeemable Preferred Stock
|
—
|
|
463,301
|
|
1,939,905
|
|
||
|
Potentially dilutive Series G Cumulative Redeemable Preferred Stock
|
2,326,861
|
|
2,261,153
|
|
2,652,503
|
|
||
|
Potentially dilutive Series H Cumulative Redeemable Preferred Stock
|
3,409,772
|
|
3,313,484
|
|
3,886,966
|
|
||
|
Potentially dilutive Series I Cumulative Redeemable Preferred Stock
|
2,329,584
|
|
2,263,799
|
|
2,655,607
|
|
||
|
Potentially dilutive Series J Cumulative Redeemable Preferred Stock
|
1,858,622
|
|
720,803
|
|
—
|
|
||
|
20,028,886
|
|
13,559,863
|
|
16,421,253
|
|
|||
10. Income per Unit
The following is a summary of basic and diluted income per unit (in thousands, except unit and per unit amounts):
151
DIGITAL REALTY TRUST, INC. AND SUBSIDIARIES
DIGITAL REALTY TRUST, L.P. AND SUBSIDIARIES
NOTES TO CONSOLIDATED FINANCIAL STATEMENTS- (Continued)
December 31, 2018 and 2017
|
|
Year Ended December 31,
|
||||||||||
|
|
2018
|
2017
|
2016
|
||||||||
|
Net income available to common unitholders
|
$
|
260,110
|
|
$
|
176,918
|
|
$
|
337,386
|
|
||
|
Weighted average units outstanding—basic
|
214,312,871
|
|
178,055,936
|
|
152,359,680
|
|
|||||
|
Potentially dilutive common units:
|
|||||||||||
|
Stock options
|
—
|
|
—
|
|
9,726
|
|
|||||
|
Unvested incentive units
|
141,260
|
|
141,136
|
|
71,031
|
|
|||||
|
Forward equity offering
|
33,315
|
|
124,527
|
|
3,990
|
|
|||||
|
Market performance-based awards
|
463,488
|
|
570,049
|
|
641,279
|
|
|||||
|
Weighted average units outstanding—diluted
|
214,950,934
|
|
178,891,648
|
|
153,085,706
|
|
|||||
|
Income per unit:
|
|||||||||||
|
Basic
|
$
|
1.21
|
|
$
|
0.99
|
|
$
|
2.21
|
|
||
|
Diluted
|
$
|
1.21
|
|
$
|
0.99
|
|
$
|
2.20
|
|
||
We have excluded the following potentially dilutive securities in the calculations above as they would be antidilutive or not dilutive:
|
|
Year Ended December 31,
|
|||||||
|
|
2018
|
2017
|
2016
|
|||||
|
Potentially dilutive Series C Cumulative Redeemable Perpetual Preferred Units
|
1,876,584
|
|
540,773
|
|
—
|
|
||
|
Potentially dilutive Series E Cumulative Redeemable Preferred Units
|
—
|
|
—
|
|
2,880,254
|
|
||
|
Potentially dilutive Series F Cumulative Redeemable Preferred Units
|
—
|
|
463,301
|
|
1,939,905
|
|
||
|
Potentially dilutive Series G Cumulative Redeemable Preferred Units
|
2,326,861
|
|
2,261,153
|
|
2,652,503
|
|
||
|
Potentially dilutive Series H Cumulative Redeemable Preferred Units
|
3,409,772
|
|
3,313,484
|
|
3,886,966
|
|
||
|
Potentially dilutive Series I Cumulative Redeemable Preferred Units
|
2,329,584
|
|
2,263,799
|
|
2,655,607
|
|
||
|
Potentially dilutive Series J Cumulative Redeemable Preferred Units
|
1,858,622
|
|
720,803
|
|
—
|
|
||
|
11,801,423
|
|
9,563,313
|
|
14,015,235
|
|
|||
152
DIGITAL REALTY TRUST, INC. AND SUBSIDIARIES
DIGITAL REALTY TRUST, L.P. AND SUBSIDIARIES
NOTES TO CONSOLIDATED FINANCIAL STATEMENTS- (Continued)
December 31, 2018 and 2017
11. Income Taxes
Digital Realty Trust, Inc. has elected to be treated and believes that it has been organized and has operated in a manner that has enabled it to qualify as a REIT for federal income tax purposes. As a REIT, Digital Realty Trust, Inc. is generally not subject to corporate level federal income taxes on taxable income distributed currently to its stockholders. Since inception, Digital Realty Trust, Inc. has distributed at least
100%
of its taxable income annually. As such, no provision for federal income taxes has been included in the accompanying consolidated financial statements for the years ended
December 31, 2018
,
2017
and
2016
.
The Operating Partnership is a partnership and is not required to pay federal income tax. Instead, taxable income is allocated to its partners, who include such amounts on their federal income tax returns. As such, no provision for federal income taxes has been included in the Operating Partnership’s accompanying consolidated financial statements.
We have elected taxable REIT subsidiary (“TRS”) status for some of our consolidated subsidiaries. In general, a TRS may provide services that would otherwise be considered impermissible for REITs to provide and may hold assets that REITs cannot hold directly. Income taxes for TRS entities were accrued, as necessary, for the years ended
December 31, 2018
,
2017
and
2016
.
For our TRS entities and foreign subsidiaries that are subject to U.S. federal, state and foreign income taxes, deferred tax assets and liabilities are established for temporary differences between the financial reporting basis and the tax basis of assets and liabilities at the enacted tax rates expected to be in effect when the temporary differences reverse. A valuation allowance for deferred tax assets is provided if we believe it is more likely than not that the deferred tax asset may not be realized, based on available evidence at the time the determination is made. An increase or decrease in the valuation allowance that results from the change in circumstances that causes a change in our judgment about the realizability of the related deferred tax asset is included in the income statement. Deferred tax assets (net of valuation allowance) and liabilities for our TRS entities and foreign subsidiaries were accrued, as necessary, for the years ended
December 31, 2018
,
2017
and
2016
. As of
December 31, 2018
and
2017
, we had deferred tax liabilities net of deferred tax assets of approximately
$146.6 million
and
$167.0 million
, respectively, primarily related to our foreign properties, classified in accounts payable and other accrued expenses in the consolidated balance sheet. The majority of our net deferred tax liability relates to differences between tax basis and book basis of the assets acquired in the Sentrum portfolio acquisition during 2012 and the European portfolio acquisition in July 2016. The valuation allowance against the deferred tax assets at
December 31, 2018
and
2017
relate primarily to net operating loss carryforwards attributable to certain foreign jurisdictions and from the acquisition of Telx, that we do not expect to utilize.
Deferred income tax assets and liabilities as of
December 31, 2018
and
2017
were as follows (in thousands):
|
2018
|
2017
|
|||||||
|
Gross deferred income tax assets:
|
||||||||
|
Net operating loss carryforwards
|
$
|
71,656
|
|
$
|
77,227
|
|
||
|
Basis difference - real estate property
|
8,490
|
|
48,983
|
|
||||
|
Basis difference - intangibles
|
256
|
|
506
|
|
||||
|
Other - temporary differences
|
24,341
|
|
40,220
|
|
||||
|
Total gross deferred income tax assets
|
104,743
|
|
166,936
|
|
||||
|
Valuation allowance
|
(51,439
|
)
|
(46,302
|
)
|
||||
|
Total deferred income tax assets, net of valuation allowance
|
53,304
|
|
120,634
|
|
||||
|
Gross deferred income tax liabilities:
|
||||||||
|
Basis difference - real estate property
|
164,077
|
|
183,283
|
|
||||
|
Basis difference - intangibles
|
6,855
|
|
65,920
|
|
||||
|
Straight-line rent
|
5,340
|
|
1,597
|
|
||||
|
Other - temporary differences
|
23,584
|
|
36,812
|
|
||||
|
Total gross deferred income tax liabilities
|
199,856
|
|
287,612
|
|
||||
|
Net deferred income tax liabilities
|
$
|
146,552
|
|
$
|
166,978
|
|
||
153
DIGITAL REALTY TRUST, INC. AND SUBSIDIARIES
DIGITAL REALTY TRUST, L.P. AND SUBSIDIARIES
NOTES TO CONSOLIDATED FINANCIAL STATEMENTS- (Continued)
December 31, 2018 and 2017
The federal tax legislation enacted in December 2017, commonly known as the Tax Cuts and Jobs Act (the “2017 Tax Legislation”), reduced the corporate federal tax rate in the U.S. to 21%, generally effective January 1, 2018. As such, deferred tax assets and liabilities are remeasured using the lower corporate federal tax rate at December 31, 2017. While we do not expect other material impacts, the new tax rules are complex and, in some respects, lack developed administrative guidance. We continue to work with our tax advisors to analyze and determine the full impact that the 2017 Tax Legislation as a whole will have on us.
154
DIGITAL REALTY TRUST, INC. AND SUBSIDIARIES
DIGITAL REALTY TRUST, L.P. AND SUBSIDIARIES
NOTES TO CONSOLIDATED FINANCIAL STATEMENTS- (Continued)
December 31, 2018 and 2017
12. Equity and Accumulated Other Comprehensive Loss, Net
(a) Equity Distribution Agreements
On June 29, 2011, Digital Realty Trust, Inc. entered into equity distribution agreements, which we refer to as the 2011 Equity Distribution Agreements, with each of Merrill Lynch, Pierce, Fenner & Smith Incorporated, Citigroup Global Markets Inc., Credit Suisse Securities (USA) LLC, Deutsche Bank Securities Inc. and Morgan Stanley & Co. LLC, or the Agents, under which it could issue and sell shares of its common stock having an aggregate offering price of up to
$400.0 million
from time to time through, at its discretion, any of the Agents as its sales agents. The sales of common stock made under the 2011 Equity Distribution Agreements will be made in “at the market” offerings as defined in Rule 415 of the Securities Act. To date, Digital Realty Trust, Inc. has generated net proceeds of approximately
$342.7 million
from the issuance of approximately
5.7 million
common shares under the 2011 Equity Distribution Agreements at an average price of
$60.35
per share after payment of approximately
$3.5 million
of commissions to the sales agents and before offering expenses. No sales were made under the program during the years ended
December 31, 2018
and
2017
. As of
December 31, 2018
, shares of common stock having an aggregate offering price of
$53.8 million
remained available for offer and sale under the program. The 2011 Equity Distribution Agreements were terminated in connection with the entry into the 2019 Equity Distribution Agreements (defined and discussed below) on January 4, 2019.
On January 4, 2019, Digital Realty Trust, Inc. and Digital Realty Trust, L.P. entered into equity distribution agreements, which we refer to as the 2019 Equity Distribution Agreements, with each of Merrill Lynch, Pierce, Fenner & Smith Incorporated, Barclays Capital Inc., BTIG, LLC, Credit Suisse Securities (USA) LLC, Deutsche Bank Securities Inc., J.P. Morgan Securities LLC, Mizuho Securities USA LLC, Morgan Stanley & Co. LLC, MUFG Securities Americas Inc., PNC Capital Markets LLC, Raymond James & Associates, Inc., RBC Capital Markets, LLC, Scotia Capital (USA) Inc., SMBC Nikko Securities America, Inc., SunTrust Robinson Humphrey, Inc., TD Securities (USA) LLC, and Wells Fargo Securities, LLC, or the Agents, under which it could issue and sell shares of its common stock having an aggregate offering price of up to
$1.0 billion
from time to time through, at its discretion, any of the Agents as its sales agents or as principals. Sales may also be made on a forward basis pursuant to separate forward sale agreements. The sales of common stock made under the 2019 Equity Distribution Agreements will be made in “at the market” offerings as defined in Rule 415 of the Securities Act. To date, no sales have been made under the program.
(b) Forward Equity Sale
On September 27, 2018, Digital Realty Trust, Inc. completed an underwritten public offering of
9,775,000
shares of its common stock (including
1,275,000
shares from the exercise in full of the underwriters' option to purchase additional shares), all of which were offered in connection with forward sale agreements it entered into with certain financial institutions acting as forward purchasers. The forward purchasers borrowed and sold an aggregate of
9,775,000
shares of Digital Realty Trust, Inc.’s common stock in the public offering. Digital Realty Trust, Inc. did not receive any proceeds from the sale of its common stock by the forward purchasers in the public offering. The Company expects to receive net proceeds of approximately
$1.1 billion
(net of fees and estimated expenses) upon full physical settlement of the forward sale agreements, which is anticipated to be no later than September 27, 2019.
On May 20, 2016, Digital Realty Trust, Inc. completed an underwritten public offering of
12,500,000
shares of its common stock, all of which were offered in connection with forward sale agreements it entered into with certain financial institutions acting as forward purchasers. On June 2, 2016, the underwriters exercised their option in full to purchase an additional
1,875,000
shares of Digital Realty Trust, Inc.’s common stock from the forward purchasers. The forward purchasers borrowed and sold an aggregate of
14,375,000
shares of Digital Realty Trust, Inc.’s common stock in the public offering. Digital Realty Trust, Inc. did not receive any proceeds from the sale of our common stock by the forward purchasers in the public offering. On September 27, 2016, we physically settled a portion of the forward sale agreements by
155
DIGITAL REALTY TRUST, INC. AND SUBSIDIARIES
DIGITAL REALTY TRUST, L.P. AND SUBSIDIARIES
NOTES TO CONSOLIDATED FINANCIAL STATEMENTS- (Continued)
December 31, 2018 and 2017
issuing an aggregate of
12,000,000
shares of our common stock to the forward purchasers in exchange for net proceeds of approximately
$1.1 billion
. On May 19, 2017, we physically settled and issued the remaining
2,375,000
shares of our common stock to the forward purchasers in exchange for net proceeds of approximately
$211.1 million
.
(c) Redeemable Preferred Stock
|
Shares Outstanding as of December 31,
|
Balance (in thousands, net of issuance costs) as of December 31,
|
||||||||||||||||||||||||||||
|
Preferred Stock
(1)
|
Date(s) Issued
|
Initial Date to Redeem
(2)
|
Share Cap
(3)
|
Total Liquidation Value (in thousands)
(4)
|
Annual Dividend Rate
(5)
|
2018
|
2017
|
2018
|
2017
|
||||||||||||||||||||
|
6.625% Series C Cumulative Redeemable Perpetual Preferred Stock
|
Sep 14, 2017
|
May 15, 2021
|
0.6389035
|
|
$
|
201,250
|
|
$
|
1.65625
|
|
8,050,000
|
|
8,050,000
|
|
$
|
219,250
|
|
$
|
219,250
|
|
|||||||||
|
5.875% Series G Cumulative Redeemable Preferred Stock
|
Apr 9, 2013
|
Apr 9, 2018
|
0.7532000
|
|
250,000
|
|
1.46875
|
|
10,000,000
|
|
10,000,000
|
|
241,468
|
|
241,468
|
|
|||||||||||||
|
7.375% Series H Cumulative Redeemable Preferred Stock
|
Mar 26, 2014
|
Mar 26, 2019
|
0.9632000
|
|
365,000
|
|
1.84375
|
|
14,600,000
|
|
14,600,000
|
|
353,290
|
|
353,290
|
|
|||||||||||||
|
6.350% Series I Cumulative Redeemable Preferred Stock
|
Aug 24, 2015
|
Aug 24, 2020
|
0.7623100
|
|
250,000
|
|
1.58750
|
|
10,000,000
|
|
10,000,000
|
|
242,012
|
|
242,012
|
|
|||||||||||||
|
5.250% Series J Cumulative Redeemable Preferred Stock
|
Aug 7, 2017
|
Aug 7, 2022
|
0.4252100
|
|
200,000
|
|
1.31250
|
|
8,000,000
|
|
8,000,000
|
|
193,540
|
|
193,540
|
|
|||||||||||||
|
$
|
1,266,250
|
|
50,650,000
|
|
50,650,000
|
|
$
|
1,249,560
|
|
$
|
1,249,560
|
|
|||||||||||||||||
|
(1)
|
All series of preferred stock do not have a stated maturity date and are not subject to any sinking fund or mandatory redemption provisions. Upon liquidation, dissolution or winding up, each series of preferred stock will rank senior to Digital Realty Trust, Inc. common stock and on parity with the other series of preferred stock. Holders of each series of preferred stock generally have no voting rights except for limited voting rights if Digital Realty Trust, Inc. fails to pay dividends for
six
or more quarterly periods (whether or not consecutive) and in certain other circumstances.
|
|
(2)
|
Except in limited circumstances, reflects earliest date that Digital Realty Trust Inc. may exercise its option to redeem the preferred stock, at a redemption price of
$25.00
per share, plus accrued and unpaid dividends up to but excluding the date of redemption.
|
|
(3)
|
Upon the occurrence of specified changes of control, as a result of which neither Digital Realty Trust, Inc.’s common stock nor the common securities of the acquiring or surviving entity (or American Depositary Receipts representing such securities) is listed on the New York Stock Exchange, the NYSE MKT, LLC or the NASDAQ Stock Market or listed or quoted on a successor exchange or quotation system, each holder of preferred stock will have the right (unless, prior to the change of control conversion date specified in the applicable Articles Supplementary governing the preferred stock, Digital Realty Trust, Inc. has provided or provides notice of its election to redeem the preferred stock) to convert some or all of the preferred stock held by it into a number of shares of Digital Realty Trust, Inc.’s common stock per share of preferred stock to be converted equal to the lesser of (i) the quotient obtained by dividing (a) the sum of the
$25.00
liquidation preference plus the amount of any accrued and unpaid dividends to, but not including, the change of control conversion date (unless the change of control conversion date is after a record date for a preferred stock dividend payment and prior to the corresponding dividend payment date, in which case no additional amount for such accrued and unpaid dividend will be included in this sum) by (b) the common stock price specified in the applicable Articles Supplementary
|
156
DIGITAL REALTY TRUST, INC. AND SUBSIDIARIES
DIGITAL REALTY TRUST, L.P. AND SUBSIDIARIES
NOTES TO CONSOLIDATED FINANCIAL STATEMENTS- (Continued)
December 31, 2018 and 2017
governing the preferred stock; and (ii) and the Share Cap, subject to certain adjustments; subject, in each case, to provisions for the receipt of alternative consideration as described in the applicable Articles Supplementary governing the preferred stock. Except in connection with specified change of control transactions, the preferred stock is not convertible into or exchangeable for any other property or securities of Digital Realty Trust, Inc.
|
(4)
|
Liquidation preference is
$25.00
per share.
|
|
(5)
|
Dividends on preferred shares are cumulative and payable quarterly in arrears.
|
(d) Noncontrolling Interests in Operating Partnership
Noncontrolling interests in the Operating Partnership relate to the interests that are not owned by Digital Realty Trust, Inc. The following table shows the ownership interest in the Operating Partnership as of
December 31, 2018
and
2017
:
|
|
December 31, 2018
|
December 31, 2017
|
|||||||||
|
|
Number of
units
|
Percentage
of total
|
Number of
units
|
Percentage
of total
|
|||||||
|
Digital Realty Trust, Inc.
|
206,425,656
|
|
95.1
|
%
|
205,470,300
|
|
96.0
|
%
|
|||
|
Noncontrolling interests consist of:
|
|||||||||||
|
Common units held by third parties
|
6,297,272
|
|
2.9
|
%
|
6,899,094
|
|
3.2
|
%
|
|||
|
Issuance of units in connection with Ascenty Acquisition
|
2,338,874
|
|
1.1
|
%
|
—
|
|
—
|
%
|
|||
|
Incentive units held by employees and directors (see note 14)
|
1,944,738
|
|
0.9
|
%
|
1,590,001
|
|
0.8
|
%
|
|||
|
217,006,540
|
|
100.0
|
%
|
213,959,395
|
|
100.0
|
%
|
||||
Limited partners have the right to require the Operating Partnership to redeem part or all of their common units for cash based on the fair market value of an equivalent number of shares of Digital Realty Trust, Inc. common stock at the time of redemption. Alternatively, Digital Realty Trust, Inc. may elect to acquire those common units in exchange for shares of Digital Realty Trust, Inc. common stock on a
one
-for-one basis, subject to adjustment in the event of stock splits, stock dividends, issuance of stock rights, specified extraordinary distributions and similar events. Pursuant to authoritative accounting guidance, Digital Realty Trust, Inc. evaluated whether it controls the actions or events necessary to issue the maximum number of shares that could be required to be delivered under the share settlement of the noncontrolling Operating Partnership common and incentive units. Based on the results of this analysis, we concluded that the common units and incentive units of the Operating Partnership met the criteria to be classified within equity, except for certain common units issued to certain former DFT Operating Partnership unitholders in the DFT Merger, which are subject to certain restrictions and, accordingly, are not presented as permanent equity in the consolidated balance sheet.
In connection with the initial public offering of DFT in 2007, DFT, the DFT Operating Partnership and certain DFT Operating Partnership unitholders entered into a tax protection agreement to assist such unitholders in deferring certain U.S. federal income tax liabilities that may have otherwise resulted from the contribution transactions undertaken in connection with the initial public offering and the ownership of interests in the DFT Operating Partnership and to set forth certain agreements with respect to other tax matters. In connection with the DFT merger, certain DFT Operating Partnership unitholders entered into a new tax protection agreement with Digital Realty Trust, Inc. and the Operating Partnership that replaced and superseded the DFT tax protection agreement, effective as of the closing of the merger. Pursuant to the new tax protection agreement, such DFT Operating Partnership unitholders entered into a guarantee of certain debt of a subsidiary of the Operating Partnership. The Operating Partnership must offer such DFT Operating Partnership unitholders a new guarantee opportunity in the event any guaranteed debt is repaid prior to March 1, 2023. If the Operating Partnership fails to offer the guarantee opportunity or to allocate guaranteed debt to any such DFT Operating Partnership unitholder as required under the new tax
157
DIGITAL REALTY TRUST, INC. AND SUBSIDIARIES
DIGITAL REALTY TRUST, L.P. AND SUBSIDIARIES
NOTES TO CONSOLIDATED FINANCIAL STATEMENTS- (Continued)
December 31, 2018 and 2017
protection agreement, the Operating Partnership generally would be required to indemnify each such DFT Operating Partnership unitholder for the tax liability resulting from such failure, as determined under the new tax protection agreement.
The redemption value of the noncontrolling Operating Partnership common units and the vested incentive units was approximately
$1,076.9 million
and
$887.0 million
based on the closing market price of Digital Realty Trust, Inc. common stock on
December 31, 2018
and
2017
, respectively.
The following table shows activity for the noncontrolling interests in the Operating Partnership for the years ended
December 31, 2018
,
2017
and
2016
:
|
Common
Units |
Incentive
Units |
Total
|
||||||
|
As of December 31, 2015
|
1,421,314
|
|
1,412,012
|
|
2,833,326
|
|
||
|
Redemption of common units for shares of Digital Realty Trust, Inc. common stock
(1)
|
(279,500
|
)
|
—
|
|
(279,500
|
)
|
||
|
Conversion of incentive units held by employees and directors for shares of
Digital Realty Trust, Inc. common stock
(1)
|
—
|
|
(150,993
|
)
|
(150,993
|
)
|
||
|
Grant of incentive units to employees and directors
|
—
|
|
74,246
|
|
74,246
|
|
||
|
Cancellation of incentive units held by employees and directors
|
—
|
|
(1,416
|
)
|
(1,416
|
)
|
||
|
As of December 31, 2016
|
1,141,814
|
|
1,333,849
|
|
2,475,663
|
|
||
|
Common units issued in connection with the DFT merger
|
6,111,770
|
|
—
|
|
6,111,770
|
|
||
|
Redemption of common units for shares of Digital Realty Trust, Inc. common stock
(1)
|
(354,490
|
)
|
—
|
|
(354,490
|
)
|
||
|
Conversion of incentive units held by employees and directors for shares of
Digital Realty Trust, Inc. common stock
(1)
|
—
|
|
(208,092
|
)
|
(208,092
|
)
|
||
|
Incentive units issued upon achievement of market performance condition
|
—
|
|
390,795
|
|
390,795
|
|
||
|
Grant of incentive units to employees and directors
|
—
|
|
73,449
|
|
73,449
|
|
||
|
As of December 31, 2017
|
6,899,094
|
|
1,590,001
|
|
8,489,095
|
|
||
|
Common units issued in connection with the Ascenty Acquisition
|
2,338,874
|
|
—
|
|
2,338,874
|
|
||
|
Redemption of common units for shares of Digital Realty Trust, Inc. common stock (1)
|
(601,822
|
)
|
—
|
|
(601,822
|
)
|
||
|
Conversion of incentive units held by employees and directors for shares of Digital Realty Trust, Inc. common stock (1)
|
—
|
|
(110,070
|
)
|
(110,070
|
)
|
||
|
Incentive units issued upon achievement of market performance condition
|
—
|
|
357,956
|
|
357,956
|
|
||
|
Grant of incentive units to employees and directors
|
—
|
|
128,986
|
|
128,986
|
|
||
|
Cancellation of incentive units held by employees and directors
|
—
|
|
(22,135
|
)
|
(22,135
|
)
|
||
|
As of December 31, 2018
|
8,636,146
|
|
1,944,738
|
|
10,580,884
|
|
||
158
DIGITAL REALTY TRUST, INC. AND SUBSIDIARIES
DIGITAL REALTY TRUST, L.P. AND SUBSIDIARIES
NOTES TO CONSOLIDATED FINANCIAL STATEMENTS- (Continued)
December 31, 2018 and 2017
|
(1)
|
These redemptions and conversions were recorded as a reduction to noncontrolling interests in the Operating Partnership and an increase to common stock and additional paid in capital based on the book value per unit in the accompanying consolidated balance sheet of Digital Realty Trust, Inc.
|
(e) Dividends
We have declared and paid the following dividends on our common and preferred stock for the years ended
December 31, 2018
,
2017
and
2016
(in thousands):
|
Date dividend
declared |
Dividend payable date
|
Series C Preferred Stock
|
|
Series E Preferred Stock
|
|
Series F Preferred Stock
|
|
Series G Preferred Stock
|
|
Series H Preferred Stock
|
|
Series I Preferred Stock
|
Series J Preferred Stock
|
Common
Stock |
|
||||||||||||||||||||
|
February 17, 2016
|
March 31, 2016
|
$
|
—
|
|
|
$
|
5,031
|
|
|
$
|
3,023
|
|
|
$
|
3,672
|
|
|
$
|
6,730
|
|
|
$
|
3,969
|
|
$
|
—
|
|
$
|
131,587
|
|
(1)
|
||||
|
May 11, 2016
|
June 30, 2016
|
—
|
|
5,031
|
|
|
3,023
|
|
|
3,672
|
|
|
6,730
|
|
3,969
|
|
—
|
|
131,607
|
|
(1)
|
||||||||||||||
|
August 10, 2016
|
September 30, 2016
|
—
|
|
|
—
|
|
(2)
|
3,023
|
|
|
3,672
|
|
|
6,730
|
|
|
3,969
|
|
—
|
|
131,657
|
|
(1)
|
||||||||||||
|
November 9, 2016
|
December 30, 2016 for Preferred Stock;
January 13, 2017 for Common Stock |
—
|
|
|
—
|
|
|
3,023
|
|
3,672
|
|
|
6,730
|
|
|
3,969
|
|
—
|
|
141,882
|
|
(1)
|
|||||||||||||
|
$
|
—
|
|
|
$
|
10,062
|
|
|
$
|
12,092
|
|
|
$
|
14,688
|
|
|
$
|
26,920
|
|
|
$
|
15,876
|
|
$
|
—
|
|
$
|
536,733
|
|
|
||||||
|
March 1, 2017
|
March 31, 2017
|
$
|
—
|
|
|
$
|
—
|
|
$
|
3,023
|
|
|
$
|
3,672
|
|
|
$
|
6,730
|
|
|
$
|
3,969
|
|
$
|
—
|
|
$
|
148,358
|
|
(3)
|
|||||
|
May 8, 2017
|
June 30, 2017
|
—
|
|
—
|
|
|
—
|
|
(4)
|
3,672
|
|
6,730
|
|
|
3,969
|
|
—
|
|
150,814
|
|
(3)
|
||||||||||||||
|
August 7, 2017
|
September 29, 2017
|
—
|
|
|
—
|
|
—
|
|
|
3,672
|
|
|
6,730
|
|
|
3,969
|
|
—
|
|
191,041
|
|
(3)
|
|||||||||||||
|
November 2, 2017
|
December 29, 2017 for Preferred Stock;
January 12, 2018 for Common Stock |
3,963
|
|
(5)
|
—
|
|
|
—
|
|
|
3,672
|
|
|
6,730
|
|
|
3,969
|
|
4,200
|
|
(5)
|
191,067
|
|
(3)
|
|||||||||||
|
$
|
3,963
|
|
|
$
|
—
|
|
|
$
|
3,023
|
|
|
$
|
14,688
|
|
|
$
|
26,920
|
|
|
$
|
15,876
|
|
$
|
4,200
|
|
$
|
681,280
|
|
|
||||||
|
March 1, 2018
|
March 30, 2018
|
$
|
3,333
|
|
|
$
|
—
|
|
$
|
—
|
|
|
$
|
3,672
|
|
|
$
|
6,730
|
|
|
$
|
3,969
|
|
$
|
2,625
|
|
$
|
208,015
|
|
(6)
|
|||||
|
May 8, 2018
|
June 29, 2018
|
3,333
|
|
|
—
|
|
|
—
|
|
3,672
|
|
|
6,730
|
|
3,969
|
|
2,625
|
|
208,071
|
|
(6)
|
||||||||||||||
|
August 14, 2018
|
September 28, 2018
|
3,333
|
|
|
—
|
|
—
|
|
|
3,672
|
|
|
6,730
|
|
|
3,969
|
|
2,625
|
|
208,166
|
|
(6)
|
|||||||||||||
|
November 12, 2018
|
December 31, 2018 for Preferred Stock;
January 15, 2019 for Common Stock |
3,333
|
|
—
|
|
|
—
|
|
|
3,672
|
|
|
6,730
|
|
|
3,969
|
|
2,625
|
|
208,415
|
|
(6)
|
|||||||||||||
|
$
|
13,332
|
|
|
$
|
—
|
|
|
$
|
—
|
|
|
$
|
14,688
|
|
|
$
|
26,920
|
|
|
$
|
15,876
|
|
$
|
10,500
|
|
$
|
832,667
|
|
|
||||||
|
Annual rate of dividend per share
|
$
|
1.65625
|
|
$
|
1.75000
|
|
$
|
1.65625
|
|
$
|
1.46875
|
|
$
|
1.84375
|
|
$
|
1.58750
|
|
$
|
1.31250
|
|
||||||||||||||
|
(1)
|
$
3.520
annual rate of dividend per share.
|
|
(2)
|
Redeemed on September 15, 2016 for
$25.35972
per share, or a redemption price of
$25.00
per share, plus accrued and unpaid dividends up to but not including the redemption date of approximately
$4.1 million
in the aggregate. In connection with the redemption, the previously incurred offering costs of approximately
$10.3 million
were recorded as a reduction to net income available to common stockholders.
|
|
(3)
|
$3.720
annual rate of dividend per share.
|
159
DIGITAL REALTY TRUST, INC. AND SUBSIDIARIES
DIGITAL REALTY TRUST, L.P. AND SUBSIDIARIES
NOTES TO CONSOLIDATED FINANCIAL STATEMENTS- (Continued)
December 31, 2018 and 2017
|
(4)
|
Redeemed on April 5, 2017 for
$25.01840
per share, or a redemption price of
$25.00
per share, plus accrued and unpaid dividends up to but not including the redemption date of approximately
$0.1 million
in the aggregate. In connection with the redemption, the previously incurred offering costs of approximately
$6.3 million
were recorded as a reduction to net income available to common stockholders.
|
|
(5)
|
Represents a pro rata dividend from and including the original issue date to and including December 31, 2017.
|
|
(6)
|
$4.040
annual rate of dividend per share.
|
Distributions out of Digital Realty Trust, Inc.’s current or accumulated earnings and profits are generally classified as dividends whereas distributions in excess of its current and accumulated earnings and profits, to the extent of a stockholder’s U.S. federal income tax basis in Digital Realty Trust, Inc.’s stock, are generally classified as a return of capital. Distributions in excess of a stockholder’s U.S. federal income tax basis in Digital Realty Trust, Inc.’s stock are generally characterized as capital gain. Cash provided by operating activities has generally been sufficient to fund all distributions, however, in the future we may also need to utilize borrowings under the global revolving credit facility to fund all or a portion of distributions.
(f) Accumulated Other Comprehensive Income (Loss), Net
The accumulated balances for each item within other comprehensive income (loss), net are as follows (in thousands):
|
Foreign
currency translation adjustments |
Cash flow
hedge adjustments |
Foreign currency net investment hedge adjustments
|
Accumulated
other comprehensive income (loss), net |
||||||||||||
|
Balance as of December 31, 2016
|
$
|
(175,642
|
)
|
$
|
4,888
|
|
$
|
35,149
|
|
$
|
(135,605
|
)
|
|||
|
Net current period change
|
28,272
|
|
5,898
|
|
(9,411
|
)
|
24,759
|
|
|||||||
|
Reclassification to interest expense from interest rate swaps
|
—
|
|
2,414
|
|
—
|
|
2,414
|
|
|||||||
|
Balance as of December 31, 2017
|
$
|
(147,370
|
)
|
$
|
13,200
|
|
$
|
25,738
|
|
$
|
(108,432
|
)
|
|||
|
Net current period change
|
(11,279
|
)
|
7,890
|
|
—
|
|
(3,389
|
)
|
|||||||
|
Reclassification to interest expense from interest rate swaps
|
—
|
|
(3,826
|
)
|
—
|
|
(3,826
|
)
|
|||||||
|
Balance as of December 31, 2018
|
$
|
(158,649
|
)
|
$
|
17,264
|
|
$
|
25,738
|
|
$
|
(115,647
|
)
|
|||
160
DIGITAL REALTY TRUST, INC. AND SUBSIDIARIES
DIGITAL REALTY TRUST, L.P. AND SUBSIDIARIES
NOTES TO CONSOLIDATED FINANCIAL STATEMENTS- (Continued)
December 31, 2018 and 2017
13. Capital and Accumulated Other Comprehensive Income (Loss)
(a) Allocations of Net Income and Net Losses to Partners
Except for special allocations to holders of profits interest units described below in Note 14(a) under the heading “Incentive Plan-Long-Term Incentive Units,” the Operating Partnership’s net income will generally be allocated to Digital Realty Trust, Inc. (the General Partner) to the extent of the accrued preferred return on its preferred units, and then to the General Partner and the Operating Partnership’s limited partners in accordance with the respective percentage interests in the common units issued by the Operating Partnership. Net loss will generally be allocated to the General Partner and the Operating Partnership’s limited partners in accordance with the respective common percentage interests in the Operating Partnership until the limited partner’s capital is reduced to zero and any remaining net loss would be allocated to the General Partner. However, in some cases, losses may be disproportionately allocated to partners who have guaranteed our debt. The allocations described above are subject to special allocations relating to depreciation deductions and to compliance with the provisions of Sections 704(b) and 704(c) of the Code, and the associated Treasury Regulations.
(b) Forward Equity Sale
On September 27, 2018, Digital Realty Trust, Inc. completed an underwritten public offering of
9,775,000
shares of its common stock (including
1,275,000
shares from the exercise in full of the underwriters' option to purchase additional shares), all of which were offered in connection with forward sale agreements it entered into with certain financial institutions acting as forward purchasers. The forward purchasers borrowed and sold an aggregate of
9,775,000
shares of Digital Realty Trust, Inc.’s common stock in the public offering. Digital Realty Trust, Inc. did not receive any proceeds from the sale of our common stock by the forward purchasers in the public offering. The Company expects to receive net proceeds of approximately
$1.1 billion
(net of fees and estimated expenses) upon full physical settlement of the forward sale agreements, which is anticipated to be no later than September 27, 2019. Upon physical settlement of the forward sale agreements, the Operating Partnership is expected to issue partnership units to Digital Realty Trust, Inc. in exchange for contribution of the net proceeds.
161
DIGITAL REALTY TRUST, INC. AND SUBSIDIARIES
DIGITAL REALTY TRUST, L.P. AND SUBSIDIARIES
NOTES TO CONSOLIDATED FINANCIAL STATEMENTS- (Continued)
December 31, 2018 and 2017
(c) Redeemable Preferred Units
|
Units Outstanding as
of December 31,
|
Balance (in thousands, net of issuance costs) as of December 31,
|
|||||||||||||||||||||||||
|
Preferred Units
(1)
|
Date(s) Issued
|
Initial Date to Redeem
(2)
|
Total Liquidation Value (in thousands)
(3)
|
Annual Distribution Rate
(4)
|
2018
|
2017
|
2018
|
2017
|
||||||||||||||||||
|
6.625% Series C Cumulative Redeemable Perpetual Preferred Units
|
Sep 14, 2017
|
May 15, 2021
|
$
|
201,250
|
|
$
|
1.65625
|
|
8,050,000
|
|
8,050,000
|
|
$
|
219,250
|
|
$
|
219,250
|
|
||||||||
|
5.875% Series G Cumulative Redeemable Preferred Units
|
Apr 9, 2013
|
Apr 9, 2018
|
250,000
|
|
1.46875
|
|
10,000,000
|
|
10,000,000
|
|
241,468
|
|
241,468
|
|
||||||||||||
|
7.375% Series H Cumulative Redeemable Preferred Units
|
Mar 26, 2014
|
Mar 26, 2019
|
365,000
|
|
1.84375
|
|
14,600,000
|
|
14,600,000
|
|
353,290
|
|
353,290
|
|
||||||||||||
|
6.350% Series I Cumulative Redeemable Preferred Units
|
Aug 24, 2015
|
Aug 24, 2020
|
250,000
|
|
1.58750
|
|
10,000,000
|
|
10,000,000
|
|
242,012
|
|
242,012
|
|
||||||||||||
|
5.250% Series J Cumulative Redeemable Preferred Units
|
Aug 7, 2017
|
Aug 7, 2022
|
200,000
|
|
1.31250
|
|
8,000,000
|
|
8,000,000
|
|
193,540
|
|
193,540
|
|
||||||||||||
|
$
|
1,266,250
|
|
50,650,000
|
|
50,650,000
|
|
$
|
1,249,560
|
|
$
|
1,249,560
|
|
||||||||||||||
|
(1)
|
All series of preferred units do not have a stated maturity date and are not subject to any sinking fund or mandatory redemption provisions. Upon liquidation, dissolution or winding up, each series of preferred units will rank senior to Digital Realty Trust, Inc. common units and on parity with the other series of preferred units.
|
|
(2)
|
Except in limited circumstances, reflects earliest date that Digital Realty Trust Inc. may exercise its option to redeem the corresponding series of preferred stock, at a redemption price of
$25.00
per share, plus accrued and unpaid dividends up to but excluding the date of redemption. The Operating Partnership is required to redeem the corresponding series of preferred units in the event that the General Partner redeems a series of preferred stock.
|
|
(3)
|
Liquidation preference is
$25.00
per unit.
|
|
(4)
|
Distributions on preferred units are cumulative and payable quarterly in arrears.
|
(d) Partnership Units
Limited partners have the right to require the Operating Partnership to redeem part or all of their common units for cash based on the fair market value of an equivalent number of shares of the General Partner’s common stock at the time of redemption. Alternatively, the General Partner may elect to acquire those common units in exchange for shares of the General Partner’s common stock on a
one
-for-one basis, subject to adjustment in the event of stock splits, stock dividends, issuance of stock rights, specified extraordinary distributions and similar events. Pursuant to authoritative accounting guidance, the Operating Partnership evaluated whether it controls the actions or events necessary to issue the maximum number of shares that could be required to be delivered under the share settlement of the limited partners’ common units and the vested incentive units. Based on the results of this analysis, the Operating Partnership concluded that the common units and incentive units of the Operating Partnership met the criteria to be classified within capital, except for certain common units issued to certain former DFT Operating Partnership unitholders in the DFT Merger which are subject to certain restrictions and are not presented as permanent capital in the consolidated balance sheet.
162
DIGITAL REALTY TRUST, INC. AND SUBSIDIARIES
DIGITAL REALTY TRUST, L.P. AND SUBSIDIARIES
NOTES TO CONSOLIDATED FINANCIAL STATEMENTS- (Continued)
December 31, 2018 and 2017
The redemption value of the limited partners’ common units and the vested incentive units was approximately
$1,076.9 million
and
$887.0 million
based on the closing market price of Digital Realty Trust, Inc.’s common stock on
December 31, 2018
and
2017
, respectively.
(e) Distributions
All distributions on our units are at the discretion of Digital Realty Trust, Inc.’s board of directors. We have declared and paid the following distributions on our common and preferred units for the years ended
December 31, 2018
,
2017
and
2016
(in thousands):
|
Date distribution
declared |
Distribution payable date
|
Series C Preferred Units
|
Series E Preferred Units
|
Series F Preferred Units
|
Series G Preferred Units
|
Series H Preferred Units
|
Series I Preferred Units
|
Series J Preferred Units
|
Common
Units |
||||||||||||||||||||||||||
|
Feb 17, 2016
|
March 31, 2016
|
$
|
—
|
|
|
$
|
5,031
|
|
$
|
3,023
|
|
$
|
3,672
|
|
$
|
6,730
|
|
$
|
3,969
|
|
$
|
—
|
|
$
|
131,587
|
|
(1)
|
||||||||
|
May 11, 2016
|
June 30, 2016
|
—
|
|
5,031
|
|
3,023
|
|
3,672
|
|
6,730
|
|
|
3,969
|
|
—
|
|
131,607
|
|
(1)
|
||||||||||||||||
|
Aug 10, 2016
|
September 30, 2016
|
—
|
|
—
|
|
(2)
|
3,023
|
|
3,672
|
|
6,730
|
|
3,969
|
|
—
|
|
131,657
|
|
(1)
|
||||||||||||||||
|
Nov 9, 2016
|
December 31, 2016 for
Preferred Units; January 13, 2017 for Common Units |
—
|
|
—
|
|
3,023
|
|
3,672
|
|
6,730
|
|
3,969
|
|
—
|
|
144,193
|
|
(1)
|
|||||||||||||||||
|
$
|
—
|
|
$
|
10,062
|
|
$
|
12,092
|
|
$
|
14,688
|
|
$
|
26,920
|
|
$
|
15,876
|
|
$
|
—
|
|
$
|
539,044
|
|
||||||||||||
|
Mar 1, 2017
|
March 31, 2017
|
$
|
—
|
|
$
|
—
|
|
$
|
3,023
|
|
$
|
3,672
|
|
$
|
6,730
|
|
$
|
3,969
|
|
$
|
—
|
|
$
|
150,968
|
|
(3)
|
|||||||||
|
May 8, 2017
|
June 30, 2017
|
—
|
|
—
|
|
—
|
|
(4)
|
3,672
|
|
6,730
|
|
3,969
|
|
—
|
|
153,176
|
|
(3)
|
||||||||||||||||
|
Aug 7, 2017
|
September 29, 2017
|
—
|
|
—
|
|
—
|
|
3,672
|
|
6,730
|
|
3,969
|
|
—
|
|
199,049
|
|
(3)
|
|||||||||||||||||
|
Nov 2, 2017
|
December 29, 2017 for
Preferred Units; January 12, 2018 for Common Units |
3,963
|
|
(5)
|
—
|
|
—
|
|
3,672
|
|
6,730
|
|
3,969
|
|
4,200
|
|
(5)
|
199,061
|
|
(3)
|
|||||||||||||||
|
$
|
3,963
|
|
$
|
—
|
|
$
|
3,023
|
|
$
|
14,688
|
|
$
|
26,920
|
|
$
|
15,876
|
|
$
|
4,200
|
|
$
|
702,254
|
|
||||||||||||
|
Mar 1, 2018
|
March 30, 2018
|
$
|
3,333
|
|
$
|
—
|
|
$
|
—
|
|
$
|
3,672
|
|
$
|
6,730
|
|
$
|
3,969
|
|
$
|
2,625
|
|
$
|
216,953
|
|
(6)
|
|||||||||
|
May 8, 2018
|
June 29, 2018
|
3,333
|
|
—
|
|
—
|
|
3,672
|
|
6,730
|
|
3,969
|
|
2,625
|
|
216,789
|
|
(6)
|
|||||||||||||||||
|
Aug 14, 2018
|
September 28, 2018
|
3,333
|
|
—
|
|
—
|
|
3,672
|
|
6,730
|
|
3,969
|
|
2,625
|
|
216,825
|
|
(6)
|
|||||||||||||||||
|
Nov 12, 2018
|
December 31, 2018 for
Preferred Units; January 15, 2019 for Common Units |
3,333
|
|
—
|
|
—
|
|
3,672
|
|
6,730
|
|
3,969
|
|
2,625
|
|
216,838
|
|
(6)
|
|||||||||||||||||
|
$
|
13,332
|
|
$
|
—
|
|
$
|
—
|
|
$
|
14,688
|
|
$
|
26,920
|
|
$
|
15,876
|
|
$
|
10,500
|
|
$
|
867,405
|
|
||||||||||||
|
Annual rate of distribution per unit
|
$
|
1.65625
|
|
$
|
1.75000
|
|
$
|
1.65625
|
|
$
|
1.46875
|
|
$
|
1.84375
|
|
$
|
1.58750
|
|
$
|
1.31250
|
|
||||||||||||||
|
(1)
|
$
3.520
annual rate of distribution per unit.
|
163
DIGITAL REALTY TRUST, INC. AND SUBSIDIARIES
DIGITAL REALTY TRUST, L.P. AND SUBSIDIARIES
NOTES TO CONSOLIDATED FINANCIAL STATEMENTS- (Continued)
December 31, 2018 and 2017
|
(2)
|
Redeemed on September 15, 2016 for
$25.35972
per unit, or a redemption price of
$25.00
per unit, plus accrued and unpaid distributions up to but not including the redemption date of approximately
$4.1 million
in the aggregate. In connection with the redemption, the previously incurred offering costs of approximately
$10.3 million
were recorded as a reduction to net income available to common unitholders.
|
|
(3)
|
$3.720
annual rate of distribution per unit.
|
|
(4)
|
Redeemed on April 5, 2017 for
$25.01840
per unit, or a redemption price of
$25.00
per unit, plus accrued and unpaid distributions up to but not including the redemption date of approximately
$0.1 million
in the aggregate. In connection with the redemption, the previously incurred offering costs of approximately
$6.3 million
were recorded as a reduction to net income available to common unitholders.
|
|
(5)
|
Represents a pro rata distribution from and including the original issue date to and including December 31, 2017.
|
|
(6)
|
$4.040
annual rate of distribution per unit.
|
(f) Accumulated Other Comprehensive Income (Loss)
The accumulated balances for each item within other comprehensive income (loss) are as follows (in thousands):
|
Foreign
currency translation adjustments |
Cash flow
hedge adjustments |
Foreign currency net investment hedge adjustments
|
Accumulated
other comprehensive income (loss) |
||||||||||||
|
Balance as of December 31, 2016
|
$
|
(180,504
|
)
|
$
|
4,191
|
|
$
|
35,694
|
|
$
|
(140,619
|
)
|
|||
|
Net current period change
|
28,709
|
|
6,108
|
|
(9,542
|
)
|
25,275
|
|
|||||||
|
Reclassification to interest expense from interest rate swaps
|
—
|
|
2,459
|
|
—
|
|
2,459
|
|
|||||||
|
Balance as of December 31, 2017
|
$
|
(151,795
|
)
|
$
|
12,758
|
|
$
|
26,152
|
|
$
|
(112,885
|
)
|
|||
|
Net current period change
|
(11,736
|
)
|
8,197
|
|
—
|
|
(3,539
|
)
|
|||||||
|
Reclassification to interest expense from interest rate swaps
|
—
|
|
(3,969
|
)
|
—
|
|
(3,969
|
)
|
|||||||
|
Balance as of December 31, 2018
|
$
|
(163,531
|
)
|
$
|
16,986
|
|
$
|
26,152
|
|
$
|
(120,393
|
)
|
|||
164
DIGITAL REALTY TRUST, INC. AND SUBSIDIARIES
DIGITAL REALTY TRUST, L.P. AND SUBSIDIARIES
NOTES TO CONSOLIDATED FINANCIAL STATEMENTS- (Continued)
December 31, 2018 and 2017
14. Incentive Plan
On April 28, 2014, our stockholders approved the Digital Realty Trust, Inc., Digital Services, Inc., and Digital Realty Trust, L.P. 2014 Incentive Award Plan (as amended, the 2014 Incentive Award Plan). The 2014 Incentive Award Plan became effective and replaced the Amended and Restated 2004 Incentive Award Plan, as amended, as of the date of such stockholder approval. The material features of the 2014 Incentive Award Plan are described in our definitive Proxy Statement filed on March 19, 2014 in connection with the 2014 Annual Meeting, which description is incorporated herein by reference. Effective as of September 14, 2017, the 2014 Incentive Award Plan was amended to provide that shares which remained available for issuance under DFT’s Amended and Restated 2011 Equity Incentive Plan immediately prior to the closing of the DFT Merger (as adjusted and converted into shares of Digital Realty Trust, Inc.’s common stock) may be used for awards under the 2014 Incentive Award Plan and will not reduce the shares authorized for grant under the 2014 Incentive Award Plan, to the extent that using such shares is permitted without stockholder approval under applicable stock exchange rules. In connection with the amendment to the 2014 Incentive Award Plan, on September 22, 2017, Digital Realty Trust, Inc. registered an additional
3.7 million
shares that may be issued pursuant to the 2014 Incentive Award Plan.
As of
December 31, 2018
, approximately
7.1 million
shares of common stock, including awards convertible into or exchangeable for shares of common stock, remained available for future issuance under the 2014 Incentive Award Plan. Each long-term incentive unit and each Class D unit issued under the 2014 Incentive Award Plan counts as
one
share of common stock for purposes of calculating the limit on shares that may be issued under the 2014 Incentive Award Plan and the individual award limits set forth therein.
Below is a summary of our compensation expense for the years ended
December 31, 2018
,
2017
and
2016
and our unearned compensation as of
December 31, 2018
and December 31, 2017 (in millions):
|
Deferred Compensation
|
Unearned Compensation
|
Expected period to recognize unearned compensation (in years)
|
||||||||||||||||||||||||||||||
|
Expensed
|
Capitalized
|
As of December 31, 2018
|
As of December 31, 2017
|
|||||||||||||||||||||||||||||
|
Year Ended December 31,
|
Year Ended December 31,
|
|||||||||||||||||||||||||||||||
|
Type of incentive award
|
2018
|
2017
|
2016
|
2018
|
2017
|
2016
|
||||||||||||||||||||||||||
|
Long-term incentive units
|
$
|
6.8
|
|
$
|
3.9
|
|
$
|
4.5
|
|
$
|
0.2
|
|
$
|
1.7
|
|
$
|
1.8
|
|
$
|
11.5
|
|
$
|
6.9
|
|
2.9
|
|||||||
|
Market performance-based awards
|
12.7
|
|
9.6
|
|
7.9
|
|
0.8
|
|
2.3
|
|
1.9
|
|
24.8
|
|
24.7
|
|
2.5
|
|||||||||||||||
|
Restricted stock
|
6.1
|
|
4.5
|
|
4.1
|
|
4.2
|
|
3.3
|
|
2.8
|
|
23.6
|
|
17.5
|
|
2.7
|
|||||||||||||||
The following table sets forth the weighted average fair value of for each type of incentive award at the date of grant for the years ended
December 31, 2018
,
2017
and
2016
:
|
Weighted Average Fair Value at Date of Grant
|
|||||||||||
|
Type of incentive award
|
2018
|
2017
|
2016
|
||||||||
|
Long-term incentive units
|
$
|
101.86
|
|
$
|
109.71
|
|
$
|
87.18
|
|
||
|
Market performance-based awards
|
$
|
119.29
|
|
$
|
111.06
|
|
$
|
82.90
|
|
||
|
Restricted stock
|
$
|
100.33
|
|
$
|
108.65
|
|
$
|
83.58
|
|
||
165
DIGITAL REALTY TRUST, INC. AND SUBSIDIARIES
DIGITAL REALTY TRUST, L.P. AND SUBSIDIARIES
NOTES TO CONSOLIDATED FINANCIAL STATEMENTS- (Continued)
December 31, 2018 and 2017
(a) Long-Term Incentive Units
Long-term incentive units, which are also referred to as profits interest units, may be issued to eligible participants for the performance of services to or for the benefit of the Operating Partnership. Long-term incentive units (other than Class D units), whether vested or not, will receive the same quarterly per unit distributions as Operating Partnership common units, which equal the per share distributions on Digital Realty Trust, Inc. common stock. Initially, long-term incentive units do not have full parity with common units with respect to liquidating distributions. If such parity is reached, vested long-term incentive units may be converted into an equal number of common units of the Operating Partnership at any time, and thereafter enjoy all the rights and privileges of common units of the Operating Partnership, including redemption rights.
In order to achieve full parity with common units, long-term incentive units must be fully vested and the holder’s capital account balance in respect of such long-term incentive units must be equal to the capital account balance of a holder of an equivalent number of common units. The capital account balance attributable to each common unit is generally expected to be the same, in part because of the amount credited to a partner’s capital account upon the partner’s contribution of property to the Operating Partnership, and in part because the partnership agreement provides, in most cases, that allocations of income, gain, loss and deduction (which will adjust the partner’s capital accounts) are to be made to the common units on a proportionate basis. As a result, with respect to a number of long-term incentive units, it is possible to determine the capital account balance of an equivalent number of common units by multiplying the number of long-term incentive units by the capital account balance with respect to a common unit.
A partner’s initial capital account balance is equal to the amount the partner paid (or contributed to the Operating Partnership) for the partner’s units and is subject to subsequent adjustments, including with respect to the partner’s share of income, gain or loss of the Operating Partnership. Because a holder of long-term incentive units generally will not pay for the long-term incentive units, the initial capital account balance attributable to such long-term incentive units will be
zero
. However, the Operating Partnership is required to allocate income, gain, loss and deduction to the partner’s capital accounts in accordance with the terms of the partnership agreement, subject to applicable Treasury Regulations. The partnership agreement provides that holders of long-term incentive units will receive special allocations of gain in the event of a sale or “hypothetical sale” of assets of the Operating Partnership prior to the allocation of gain to Digital Realty Trust, Inc. or other limited partners with respect to their common units. The amount of any such allocation will, to the extent of any such gain, be equal to the difference between the capital account balance of a holder of long-term incentive units attributable to such units and the capital account balance attributable to an equivalent number of common units. If and when such gain allocation is fully made, a holder of long-term incentive units will have achieved full parity with holders of common units. To the extent that, upon an actual sale or a “hypothetical sale” of the Operating Partnership’s assets as described above, there is not sufficient gain to allocate to a holder’s capital account with respect to long-term incentive units, or if such sale or “hypothetical sale” does not occur, such units will not achieve parity with common units.
The term “hypothetical sale” refers to circumstances that are not actual sales of the Operating Partnership’s assets but that require certain adjustments to the value of the Operating Partnership’s assets and the partners’ capital account balances. Specifically, the partnership agreement provides that, from time to time, in accordance with applicable Treasury Regulations, the Operating Partnership will adjust the value of its assets to equal their respective fair market values, and adjust the partners’ capital accounts, in accordance with the terms of the partnership agreement, as if the Operating Partnership sold its assets for an amount equal to their value. Such adjustments will generally be made upon the liquidation of the Operating Partnership, the acquisition of an additional interest in the Operating Partnership by a new or existing partner in exchange for more than a de minimis capital contribution, the distribution by the Operating Partnership to a partner of more than a de minimis amount of partnership property as consideration for an interest in the Operating Partnership, the grant of an interest in the Operating Partnership (other than a de minimis interest) as consideration for the performance of services to or for the benefit of the Operating Partnership (including the grant of a long-term incentive unit), and at such other times as may be desirable or required to comply with the Treasury Regulations.
166
DIGITAL REALTY TRUST, INC. AND SUBSIDIARIES
DIGITAL REALTY TRUST, L.P. AND SUBSIDIARIES
NOTES TO CONSOLIDATED FINANCIAL STATEMENTS- (Continued)
December 31, 2018 and 2017
Below is a summary of our long-term incentive unit activity for the year ended
December 31, 2018
.
|
Unvested Long-term Incentive Units
|
Units
|
Weighted-Average
Grant Date Fair Value Per Unit |
||||
|
Unvested, beginning of period
|
99,295
|
|
$
|
90.59
|
|
|
|
Granted
|
128,986
|
|
101.86
|
|
||
|
Vested
|
(51,820
|
)
|
88.88
|
|
||
|
Cancelled or expired
|
(15,356
|
)
|
83.93
|
|
||
|
Unvested, end of period
|
161,105
|
|
$
|
100.94
|
|
|
The grant date fair values, which equal the market price of Digital Realty Trust, Inc. common stock on the applicable grant date(s), are being expensed on a straight-line basis for service awards between
two
and
four
years, the current vesting periods of the long-term incentive units.
(b) Market Performance-Based Awards
During the years ended
December 31, 2018
,
2017
and
2016
, the Compensation Committee of the Board of Directors of Digital Realty Trust, Inc. approved the grant of market performance-based Class D units of the Operating Partnership and market performance-based restricted stock units, or RSUs, covering shares of Digital Realty Trust, Inc.’s common stock (collectively, the “awards”), under the 2014 Incentive Award Plan to officers and employees of the Company.
The awards, which were determined to contain a market condition, utilize total shareholder return, or TSR, over a
three
-year measurement period as the market performance metric. Awards will vest based on the Company’s TSR relative to the MSCI US REIT Index, or RMS, over a
three
-year market performance period, or the Market Performance Period, commencing in January 2016, January 2017 or January 2018, as applicable (or, if earlier, ending on the date on which a change in control of the Company occurs), subject to continued services. Vesting with respect to the market condition is measured based on the difference between Digital Realty Trust, Inc.’s TSR percentage and the TSR percentage of the RMS, or the RMS Relative Market Performance. In the event that the RMS Relative Market Performance during the Market Performance Period is achieved at the “threshold,” “target” or “high” level as set forth below, the awards will become vested as to the market condition with respect to the percentage of Class D units or RSUs, as applicable, set forth below:
|
Level
|
RMS Relative
Market Performance |
Market
Performance
Vesting
Percentage
|
|
|
Below Threshold Level
|
< -300 basis points
|
0
|
%
|
|
Threshold Level
|
-300 basis points
|
25
|
%
|
|
Target Level
|
100 basis points
|
50
|
%
|
|
High Level
|
>
500 basis points
|
100
|
%
|
If the RMS Relative Market Performance falls between the levels specified above, the percentage of the award that will vest with respect to the market condition will be determined using straight-line linear interpolation between such levels.
In January 2019, following the completion of the applicable Market Performance Period, the Compensation Committee determined that the high level had been achieved for the 2016 awards and, accordingly,
339,317
Class D units (including
31,009
distribution equivalent units that immediately vested on December 31, 2018, upon the high level being achieved) and
56,778
RSUs performance vested, subject to service-based vesting. On February 27, 2019,
50%
of the 2016 awards vested and the remaining
50%
will vest on February 27, 2020, subject to continued employment through each applicable vesting date.
In January 2018, following the completion of the applicable Market Performance Period, the Compensation Committee determined that the high level had been achieved for the 2015 awards and, accordingly,
363,193
Class D units (including
167
DIGITAL REALTY TRUST, INC. AND SUBSIDIARIES
DIGITAL REALTY TRUST, L.P. AND SUBSIDIARIES
NOTES TO CONSOLIDATED FINANCIAL STATEMENTS- (Continued)
December 31, 2018 and 2017
36,246
distribution equivalent units that immediately vested on December 31, 2017, upon the high level being achieved) and
49,707
RSUs performance vested, subject to service-based vesting. On February 27, 2018,
50%
of the 2015 awards vested and the remaining
50%
will vest on February 27, 2019, subject to continued employment through each applicable vesting date.
In January 2017, following the completion of the applicable Market Performance Period, the Compensation Committee determined that the high level had been achieved for the 2014 awards and, accordingly,
399,250
Class D units (including
44,702
distribution equivalent units that immediately vested on December 31, 2016, upon the high level being achieved) and
138,567
RSUs performance vested, subject to service-based vesting. On February 27, 2017,
50%
of the 2014 awards vested and the remaining
50%
vested on February 27, 2018.
Following the completion of the applicable Market Performance Period, the 2017 awards that satisfy the market condition, if any, will vest
50%
on February 27, 2020 and
50%
on February 27, 2021, subject to continued employment through each applicable vesting date. Following the completion of the Market Performance Period, the 2018 awards that satisfy the market condition, if any, will vest
50%
on February 27, 2021 and
50%
on February 27, 2022, subject to continued employment through each applicable vesting date.
Service-based vesting will be accelerated, in full or on a pro rata basis, as applicable, in the event of a change in control, termination of employment by the Company without cause, or termination of employment by the award recipient for good reason, death, disability or retirement, in any case, prior to the completion of the applicable Market Performance Period. However, vesting with respect to the market condition will continue to be measured based on RMS Relative Market Performance during the applicable
three
-year Market Performance Period (or, in the case of a change in control, shortened Market Performance Period).
The fair values of the awards were measured using a Monte Carlo simulation to estimate the probability of the market vesting condition being satisfied. The Company’s achievement of the market vesting condition is contingent on its TSR over a
three
-year market performance period, relative to the total shareholder return of the RMS. The Monte Carlo simulation is a probabilistic technique based on the underlying theory of the Black-Scholes formula, which was run for
100,000
trials to determine the fair value of the awards. For each trial, the payoff to an award is calculated at the settlement date and is then discounted to the grant date at a risk-free interest rate. The total expected value of the awards on the grant date was determined by multiplying the average value per award over all trials by the number of awards granted. Assumptions used in the valuations are summarized as follows:
|
Award Date
|
Expected Stock Price Volatility
|
Risk-Free Interest Rate
|
|
January 1, 2016
|
22%
|
1.32%
|
|
February 16, 2016
|
26%
|
0.89%
|
|
January 1, 2017
|
25%
|
1.49%
|
|
February 28, 2017
|
23%
|
1.43%
|
|
January 1, 2018
|
22%
|
1.98%
|
|
March 1, 2018
|
22%
|
2.34%
|
|
March 9, 2018
|
22%
|
2.42%
|
These valuations were performed in a risk-neutral framework, and no assumption was made with respect to an equity risk premium.
As of
December 31, 2018
,
2,165,692
Class D units and
590,569
market performance-based RSUs had been awarded to our executive officers and other employees. The number of units granted reflects the maximum number of Class D units or market performance-based RSUs, as applicable, which will become vested assuming the achievement of the highest level of RMS Relative Market Performance under the awards and, in the case of the Class D units, also includes distribution equivalent units. The grant date fair value of these awards was approximately
$21.8 million
,
$19.5 million
and
$21.2 million
for the years ended
December 31, 2018
,
2017
and
2016
, respectively. We will recognize compensation expense on a straight-line basis over the expected service period of approximately
four
years.
168
DIGITAL REALTY TRUST, INC. AND SUBSIDIARIES
DIGITAL REALTY TRUST, L.P. AND SUBSIDIARIES
NOTES TO CONSOLIDATED FINANCIAL STATEMENTS- (Continued)
December 31, 2018 and 2017
(c) Restricted Stock
Below is a summary of our restricted stock activity for the year ended
December 31, 2018
.
|
Unvested Restricted Stock
|
Shares
|
Weighted-Average
Grant Date Fair Value Per Share |
||||
|
Unvested, beginning of period
|
259,422
|
|
$
|
90.54
|
|
|
|
Granted
(1)
|
168,192
|
|
100.33
|
|
||
|
Vested
|
(96,840
|
)
|
83.63
|
|
||
|
Cancelled or expired
|
(35,273
|
)
|
97.96
|
|
||
|
Unvested, end of period
|
295,501
|
|
$
|
97.49
|
|
|
|
(1)
|
All restricted stock awards granted in
2018
are subject only to service conditions.
|
The grant date fair values, which equal the market price of Digital Realty Trust, Inc. common stock on the grant date, are expensed on a straight-line basis for service awards over the vesting period of the restricted stock, which is generally
four
years.
(d) 401(k) Plan
We have a 401(k) plan whereby our employees may contribute a portion of their compensation to their respective retirement accounts, in an amount not to exceed the maximum allowed under the Code. The 401(k) plan complies with Internal Revenue Service requirements as a 401(k) safe harbor plan whereby matching contributions made by us are
100%
vested. The aggregate cost of our contributions to the 401(k) plan was approximately
$4.8 million
,
$4.6 million
, and
$3.6 million
for the years ended
December 31, 2018
,
2017
and
2016
, respectively.
15. Derivative Instruments
Currently, we use interest rate swaps to manage our interest rate risk. The valuation of these instruments is determined using widely accepted valuation techniques including discounted cash flow analysis on the expected cash flows of each derivative. This analysis reflects the contractual terms of the derivatives, including the period to maturity, and uses observable market-based inputs, including interest rate curves. The fair values of interest rate swaps are determined using the market standard methodology of netting the discounted future fixed cash receipts (or payments) and the discounted expected variable cash payments (or receipts). The variable cash payments (or receipts) are based on an expectation of future interest rates (forward curves) derived from observable market interest rate curves.
To comply with the provisions of fair value accounting guidance, we incorporate credit valuation adjustments to appropriately reflect both our own nonperformance risk and the respective counterparty’s nonperformance risk in the fair value measurements. In adjusting the fair value of our derivative contracts for the effect of nonperformance risk, we have considered the impact of netting and any applicable credit enhancements, such as collateral postings, thresholds, mutual puts, and guarantees.
Although we have determined that the majority of the inputs used to value our derivatives fall within Level 2 of the fair value hierarchy, the credit valuation adjustments associated with our derivatives utilize Level 3 inputs, such as estimates of current credit spreads to evaluate the likelihood of default by us and our counterparties. However, as of
December 31, 2018
, we have assessed the significance of the impact of the credit valuation adjustments on the overall valuation of our derivative positions and have determined that the credit valuation adjustments are not significant to the overall valuation of our derivatives. As a result, we have determined that our derivative valuations in their entirety are classified in Level 2 of the fair value hierarchy. We do not have any fair value measurements on a recurring basis using significant unobservable inputs (Level 3) as of
December 31, 2018
or
December 31, 2017
.
The Company presents its interest rate derivatives in its consolidated balance sheets on a gross basis as interest rate swap assets (recorded in other assets) and interest rate swap liabilities (recorded in accounts payable and other accrued liabilities). As
169
DIGITAL REALTY TRUST, INC. AND SUBSIDIARIES
DIGITAL REALTY TRUST, L.P. AND SUBSIDIARIES
NOTES TO CONSOLIDATED FINANCIAL STATEMENTS- (Continued)
December 31, 2018 and 2017
of
December 31, 2018
, there was no impact from netting arrangements as the Company did not have any derivatives in liability positions.
Cash Flow Hedges of Interest Rate Risk
Our objectives in using interest rate derivatives are to add stability to interest expense and to manage our exposure to interest rate movements related to certain floating rate debt obligations. To accomplish this objective, we primarily use interest rate swaps as part of our interest rate risk management strategy. Interest rate swaps designated as cash flow hedges involve the receipt of variable-rate amounts from a counterparty in exchange for making fixed-rate payments over the life of the agreements without exchange of the underlying notional amount.
We record all our interest rate swaps on the consolidated balance sheet at fair value. In determining the fair value of our interest rate swaps, we consider the credit risk of our counterparties. These counterparties are generally larger financial institutions engaged in providing a variety of financial services. These institutions generally face similar risks regarding adverse changes in market and economic conditions, including, but not limited to, fluctuations in interest rates, exchange rates, equity and commodity prices and credit spreads. The recent and pervasive disruptions in the financial markets have heightened the risks to these institutions.
The ineffective portion of the change in fair value of the derivatives is recognized directly in earnings. During the years ended
December 31, 2018
, 2017 and 2016, there were
no
ineffective portions to our interest rate swaps.
As of
December 31, 2018
and
December 31, 2017
, we had the following outstanding interest rate derivatives that were designated as cash flow hedges of interest rate risk (in thousands):
|
Notional Amount
|
|
|
|
|
Fair Value at Significant Other
Observable Inputs (Level 2) |
|||||||||||||||||||
|
As of
December 31, 2018 |
As of
December 31, 2017 |
Type of
Derivative |
Strike
Rate |
Effective Date
|
Expiration
Date |
As of
December 31, 2018 (4) |
As of
December 31, 2017 (4) |
|||||||||||||||||
|
Currently-paying contracts
|
||||||||||||||||||||||||
|
$
|
206,000
|
|
(1)
|
$
|
206,000
|
|
(1)
|
Swap
|
1.611
|
|
Jun 15, 2017
|
Jan 15, 2020
|
$
|
1,976
|
|
|
$
|
1,409
|
|
|||||
|
54,905
|
|
(1)
|
54,905
|
|
(1)
|
Swap
|
1.605
|
|
Jun 6, 2017
|
Jan 6, 2020
|
517
|
|
|
374
|
|
|||||||||
|
75,000
|
|
(1)
|
75,000
|
|
(1)
|
Swap
|
1.016
|
|
Apr 6, 2016
|
Jan 6, 2021
|
2,169
|
|
|
2,260
|
|
|||||||||
|
75,000
|
|
(1)
|
75,000
|
|
(1)
|
Swap
|
1.164
|
|
Jan 15, 2016
|
Jan 15, 2021
|
1,970
|
|
|
1,947
|
|
|||||||||
|
300,000
|
|
(1)
|
300,000
|
|
(1)
|
Swap
|
1.435
|
|
Jan 15, 2016
|
Jan 15, 2023
|
11,463
|
|
|
9,978
|
|
|||||||||
|
—
|
|
229,012
|
|
(2)
|
Swap
|
0.792
|
|
Jan 15, 2016
|
Jan 15, 2019
|
—
|
|
|
(430
|
)
|
||||||||||
|
72,220
|
|
(3)
|
78,357
|
|
(3)
|
Swap
|
0.779
|
|
Jan 15, 2016
|
Jan 15, 2021
|
2,024
|
|
|
3,034
|
|
|||||||||
|
$
|
783,125
|
|
$
|
1,018,274
|
|
$
|
20,119
|
|
$
|
18,572
|
|
|||||||||||||
|
(1)
|
Represents debt which bears interest based on one-month U.S. LIBOR.
|
|
(2)
|
Represents debt which bears interest based on one-month GBP LIBOR. Translation to U.S. dollars is based on exchange rate of
$1.35
to
£1.00
as of
December 31, 2017
.
|
|
(3)
|
Represents debt which bears interest based on one-month CDOR. Translation to U.S. dollars is based on exchange rates of
$0.73
to
1.00
CAD as of
December 31, 2018
and
$0.80
to
1.00
CAD as of
December 31, 2017
.
|
|
(4)
|
Balance recorded in other assets in the consolidated balance sheets if positive and recorded in accounts payable and other accrued liabilities in the consolidated balance sheets if negative.
|
Amounts reported in accumulated other comprehensive loss related to interest rate swaps will be reclassified to interest expense as interest payments are made on our debt. As of
December 31, 2018
, we estimate that an additional
$7.8 million
will be reclassified as a decrease to interest expense during the year ending December 31, 2019, when the hedged forecasted transactions impact earnings.
170
DIGITAL REALTY TRUST, INC. AND SUBSIDIARIES
DIGITAL REALTY TRUST, L.P. AND SUBSIDIARIES
NOTES TO CONSOLIDATED FINANCIAL STATEMENTS- (Continued)
December 31, 2018 and 2017
Foreign Currency Net Investment Hedges
During the three months ended June 30, 2016, we entered into a series of forward contracts pursuant to which we agreed to sell an amount of foreign currency for an agreed upon amount of U.S. dollars. These forward contracts were executed to manage foreign currency exposures associated with certain transactions. As of June 30, 2016, the forward contracts did not meet the criteria for hedge accounting under GAAP and had a fair value of approximately
$37.8 million
. On July 1, 2016, the
four
forward contracts still in place met the criteria for net investment hedge accounting. During the year ended
December 31, 2017
, we terminated the
four
forward contracts with a notional amount of GBP
357.3 million
. In connection with the settlement, we received approximately
$64.0 million
in proceeds and the related amount of approximately
$26.2 million
of accumulated other comprehensive income (AOCI) will remain in AOCI until the Company sells or liquidates its GBP-denominated investments, which has not occurred as of
December 31, 2018
.
16. Fair Value of Instruments
We disclose fair value information about all financial instruments, whether or not recognized in the consolidated balance sheets, for which it is practicable to estimate fair value. Current accounting guidance requires the Company to disclose fair value information about all financial instruments, whether or not recognized in the balance sheets, for which it is practicable to estimate fair value.
The Company’s disclosures of estimated fair value of financial instruments at
December 31, 2018
and
December 31, 2017
were determined using available market information and appropriate valuation methods. Considerable judgment is necessary to interpret market data and develop estimated fair value. The use of different market assumptions or estimation methods may have a material effect on the estimated fair value amounts.
The carrying amounts for cash and cash equivalents, restricted cash, accounts and other receivables, accounts payable and other accrued liabilities, accrued dividends and distributions, security deposits and prepaid rents approximate fair value because of the short-term nature of these instruments. As described in Note 15. "Derivative Instruments", the interest rate swaps and foreign currency forward contracts are recorded at fair value.
We calculate the fair value of our mortgage loans, unsecured term loan and unsecured senior notes based on currently available market rates assuming the loans are outstanding through maturity and considering the collateral and other loan terms. In determining the current market rate for fixed rate debt, a market spread is added to the quoted yields on federal government treasury securities with similar maturity dates to our debt. The carrying value of our global revolving credit facility approximates fair value, due to the variability of interest rates.
As of
December 31, 2018
and
December 31, 2017
, the aggregate estimated fair value and carrying value of our global revolving credit facility, unsecured term loan, unsecured senior notes and mortgage loans were as follows (in thousands):
|
|
Categorization
under the fair value hierarchy |
As of December 31, 2018
|
As of December 31, 2017
|
||||||||||||||
|
|
Estimated Fair Value
|
Carrying Value
|
Estimated Fair Value
|
Carrying Value
|
|||||||||||||
|
Global revolving credit facilities (1)(5)
|
Level 2
|
$
|
1,663,156
|
|
$
|
1,663,156
|
|
$
|
558,191
|
|
$
|
558,191
|
|
||||
|
Unsecured term loans (2)(6)
|
Level 2
|
1,183,121
|
|
1,183,121
|
|
1,425,117
|
|
1,425,117
|
|
||||||||
|
Unsecured senior notes (3)(4)(7)
|
Level 2
|
7,684,368
|
|
7,629,679
|
|
6,976,603
|
|
6,608,545
|
|
||||||||
|
Mortgage loans (3)(8)
|
Level 2
|
706,086
|
|
705,924
|
|
106,523
|
|
106,611
|
|
||||||||
|
$
|
11,236,731
|
|
$
|
11,181,880
|
|
$
|
9,066,434
|
|
$
|
8,698,464
|
|
||||||
|
(1)
|
The carrying value of our global revolving credit facility approximates estimated fair value, due to the variability of interest rates and the stability of our credit ratings.
|
|
(2)
|
The carrying value of our unsecured term loans approximates estimated fair value, due to the variability of interest rates and the stability of our credit ratings.
|
171
DIGITAL REALTY TRUST, INC. AND SUBSIDIARIES
DIGITAL REALTY TRUST, L.P. AND SUBSIDIARIES
NOTES TO CONSOLIDATED FINANCIAL STATEMENTS- (Continued)
December 31, 2018 and 2017
|
(3)
|
Valuations for our unsecured senior notes and mortgage loans are determined based on the expected future payments discounted at risk-adjusted rates. The 2019 Notes,
5.875%
2020 Notes,
3.400%
2020 Notes, 2021 Notes,
3.950%
2022 Notes,
3.625%
2022 Notes,
4.750%
2023 Notes,
2.750%
2023 Notes,
2.625%
2024 Notes,
2.750%
2024 Notes,
4.750%
2025 Notes,
4.250%
2025 Notes, 2027 Notes, 2028 Notes, 2029 Notes and 2030 Notes are valued based on quoted market prices.
|
|
(4)
|
The carrying value of the
5.875%
2020 Notes,
3.400%
2020 Notes, 2021 Notes,
3.625%
2022 Notes,
3.950%
2022 Notes,
4.750%
2023 Notes,
2.750%
2023 Notes,
2.625%
2024 Notes,
2.750%
2024 Notes,
4.250%
2025 Notes, 2027 Notes, 2028 Notes, 2029 Notes and 2030 Notes are net of discount of
$19.9 million
and
$18.5 million
in the aggregate as of
December 31, 2018
and
December 31, 2017
, respectively.
|
|
(5)
|
The estimated fair value and carrying value are exclusive of deferred financing costs of
$15.4 million
and
$7.2 million
as of
December 31, 2018
and
December 31, 2017
, respectively.
|
|
(6)
|
The estimated fair value and carrying value are exclusive of deferred financing costs of
$4.2 million
and
$4.8 million
as of
December 31, 2018
and
December 31, 2017
, respectively.
|
|
(7)
|
The estimated fair value and carrying value are exclusive of deferred financing costs of
$40.6 million
and
$38.3 million
as of
December 31, 2018
and
December 31, 2017
, respectively.
|
|
(8)
|
The estimated fair value and carrying value are exclusive of deferred financing costs of
$20.2 million
and
$0.0 million
as of
December 31, 2018
and
December 31, 2017
, respectively.
|
17. Tenant Leases
The future minimum lease payments to be received (excluding operating expense reimbursements) by us as of
December 31, 2018
, under non-cancelable operating leases are as follows (in thousands):
|
2019
|
$
|
2,225,243
|
|
|
2020
|
1,784,585
|
|
|
|
2021
|
1,566,645
|
|
|
|
2022
|
1,263,810
|
|
|
|
2023
|
1,055,553
|
|
|
|
Thereafter
|
3,329,052
|
|
|
|
Total
|
$
|
11,224,888
|
|
The table above excludes leases related to the Ascenty Acquisition.
18. Commitments and Contingencies
(a) Operating Leases
We lease space at certain of our data centers from third parties, primarily data centers acquired as part of the Telx Acquisition, European Portfolio Acquisition and Ascenty Acquisition, and certain equipment under noncancelable operating lease agreements. The operating leases for our data centers expire at various dates through 2036 with renewal options available to us. The lease agreements typically provide for base rental rates that increase at defined intervals during the term of the lease.
As of
December 31, 2018
, certain of our data centers, primarily in Europe are subject to ground leases. The termination dates of these ground leases range from 2036 to 2981. These ground leases generally require us to make fixed annual rental payments. In addition, our corporate headquarters along with several regional office locations are subject to leases with termination dates ranging from 2019 to 2024. These office leases generally require us to make fixed annual rental payments plus pay our share of common area, real estate and utility expenses. Some of our ground and office leases include escalation clauses and renewal options.
172
DIGITAL REALTY TRUST, INC. AND SUBSIDIARIES
DIGITAL REALTY TRUST, L.P. AND SUBSIDIARIES
NOTES TO CONSOLIDATED FINANCIAL STATEMENTS- (Continued)
December 31, 2018 and 2017
Rental expense for our operating leases, including ground leases, was approximately
$85.0 million
,
$82.5 million
, and
$83.6 million
for the years ended
December 31, 2018
,
2017
and
2016
, respectively.
The minimum commitment under these leases, excluding fully prepaid ground leases, as of
December 31, 2018
was as follows (in thousands):
|
2019
|
$
|
84,712
|
|
|
2020
|
87,396
|
|
|
|
2021
|
86,212
|
|
|
|
2022
|
81,976
|
|
|
|
2023
|
80,707
|
|
|
|
Thereafter
|
539,047
|
|
|
|
Total
|
$
|
960,050
|
|
(b) Capital Lease Obligations
Capital lease obligations are recorded for leases in which the Company was deemed to be the owner during the construction period under lease accounting guidance. Further, each lease contains provisions indicating continuing involvement with the property at the end of the construction period. As a result, in accordance with applicable accounting guidance, buildings and related assets subject to the leases are reflected in buildings and improvements and accumulated depreciation and amortization on the Company’s consolidated balance sheets and depreciated over their remaining useful lives. The present value of the lease payments associated with these buildings is recorded as capital lease obligations and is classified in accounts payable and other accrued liabilities in the consolidated balance sheets. The financing obligation is amortized using the effective interest method and the interest rate is determined in accordance with the requirements of sale-leaseback accounting.
Future minimum lease payments and their present value for property under capital lease obligations as of
December 31, 2018
, are as follows (in thousands):
|
2019
|
$
|
11,657
|
|
|
2020
|
13,108
|
|
|
|
2021
|
13,207
|
|
|
|
2022
|
13,706
|
|
|
|
2023
|
14,219
|
|
|
|
Thereafter
|
285,774
|
|
|
|
351,671
|
|
||
|
Less amount representing interest
|
(137,827
|
)
|
|
|
Present value
|
$
|
213,844
|
|
The table above excludes a capital lease obligation in the amount of
$50.0 million
assumed as part of the Ascenty Acquisition, as this is a provisional estimate that is subject to change.
(c) Construction Commitments
Our properties require periodic investments of capital for tenant-related capital expenditures and for general capital improvements and from time to time in the normal course of our business, we enter into various construction contracts with third parties that may obligate us to make payments. At
December 31, 2018
, we had open commitments, including amounts reimbursable of approximately
$13.4 million
, related to construction contracts of approximately
$401.4 million
.
173
DIGITAL REALTY TRUST, INC. AND SUBSIDIARIES
DIGITAL REALTY TRUST, L.P. AND SUBSIDIARIES
NOTES TO CONSOLIDATED FINANCIAL STATEMENTS- (Continued)
December 31, 2018 and 2017
(d) Legal Proceedings
Although the Company is involved in legal proceedings arising in the ordinary course of business, as of
December 31, 2018
, the Company is not currently a party to any legal proceedings nor, to its knowledge, is any legal proceeding threatened against it that it believes would have a material adverse effect on its financial position, results of operations or liquidity.
174
DIGITAL REALTY TRUST, INC. AND SUBSIDIARIES
DIGITAL REALTY TRUST, L.P. AND SUBSIDIARIES
NOTES TO CONSOLIDATED FINANCIAL STATEMENTS- (Continued)
December 31, 2018 and 2017
19. Quarterly Financial Information (Digital Realty Trust, Inc.) (unaudited)
The tables below reflect selected quarterly information for the years ended
December 31, 2018
and
2017
. Certain amounts have been reclassified to conform to the current year presentation (in thousands, except per share amounts).
|
|
Three Months Ended
|
||||||||||||||
|
|
December 31, 2018
|
September 30, 2018
|
June 30, 2018
|
March 31, 2018
|
|||||||||||
|
Total operating revenues
|
$
|
778,267
|
|
$
|
768,924
|
|
$
|
754,919
|
|
$
|
744,368
|
|
|||
|
Net income
|
52,597
|
|
90,264
|
|
88,159
|
|
110,095
|
|
|||||||
|
Net income attributable to Digital Realty Trust, Inc.
|
51,559
|
|
87,597
|
|
85,463
|
|
106,627
|
|
|||||||
|
Preferred stock dividends and issuance costs
associated with redeemed preferred stock |
20,329
|
|
20,329
|
|
20,329
|
|
20,329
|
|
|||||||
|
Net income available to common stockholders
|
31,230
|
|
67,268
|
|
65,134
|
|
86,298
|
|
|||||||
|
Basic net income per share available to
common stockholders |
$
|
0.15
|
|
$
|
0.33
|
|
$
|
0.32
|
|
$
|
0.42
|
|
|||
|
Diluted net income per share available to
common stockholders |
$
|
0.15
|
|
$
|
0.33
|
|
$
|
0.32
|
|
$
|
0.42
|
|
|||
|
|
Three Months Ended
|
||||||||||||||
|
|
December 31, 2017
|
September 30, 2017
|
June 30, 2017
|
March 31, 2017
|
|||||||||||
|
Total operating revenues
|
$
|
731,445
|
|
$
|
609,925
|
|
$
|
565,989
|
|
$
|
550,569
|
|
|||
|
Net income
|
79,658
|
|
12,475
|
|
79,571
|
|
84,563
|
|
|||||||
|
Net income attributable to Digital Realty Trust, Inc.
|
73,635
|
|
12,435
|
|
78,651
|
|
83,538
|
|
|||||||
|
Preferred stock dividends and issuance costs
associated with redeemed preferred stock |
20,329
|
|
16,575
|
|
20,814
|
|
17,393
|
|
|||||||
|
Net income (loss) available to common stockholders
|
53,306
|
|
(4,140
|
)
|
57,837
|
|
66,145
|
|
|||||||
|
Basic net income (loss) per share available to
common stockholders |
$
|
0.26
|
|
$
|
(0.02
|
)
|
$
|
0.36
|
|
$
|
0.42
|
|
|||
|
Diluted net income (loss) per share available to
common stockholders |
$
|
0.26
|
|
$
|
(0.02
|
)
|
$
|
0.36
|
|
$
|
0.41
|
|
|||
175
DIGITAL REALTY TRUST, INC. AND SUBSIDIARIES
DIGITAL REALTY TRUST, L.P. AND SUBSIDIARIES
NOTES TO CONSOLIDATED FINANCIAL STATEMENTS- (Continued)
December 31, 2018 and 2017
20. Quarterly Financial Information (Digital Realty Trust, L.P.) (unaudited)
The tables below reflect selected quarterly information for the years ended
December 31, 2018
and
2017
. Certain amounts have been reclassified to conform to the current year presentation (in thousands, except per unit amounts).
|
|
Three Months Ended
|
||||||||||||||
|
|
December 31, 2018
|
September 30, 2018
|
June 30, 2018
|
March 31, 2018
|
|||||||||||
|
Total operating revenues
|
$
|
778,267
|
|
$
|
768,924
|
|
$
|
754,919
|
|
$
|
744,368
|
|
|||
|
Net income
|
52,597
|
|
90,264
|
|
88,159
|
|
110,095
|
|
|||||||
|
Net income attributable to Digital Realty Trust, L.P.
|
52,859
|
|
90,297
|
|
88,163
|
|
110,107
|
|
|||||||
|
Preferred unit distributions and issuance costs associated
with redeemed preferred units |
20,329
|
|
20,329
|
|
20,329
|
|
20,329
|
|
|||||||
|
Net income available to common unitholders
|
32,530
|
|
69,968
|
|
67,834
|
|
89,778
|
|
|||||||
|
Basic net income per unit available to common
unitholders |
$
|
0.15
|
|
$
|
0.33
|
|
$
|
0.32
|
|
$
|
0.42
|
|
|||
|
Diluted net income per unit available to common
unitholders |
$
|
0.15
|
|
$
|
0.33
|
|
$
|
0.32
|
|
$
|
0.42
|
|
|||
|
|
Three Months Ended
|
||||||||||||||
|
|
December 31, 2017
|
September 30, 2017
|
June 30, 2017
|
March 31, 2017
|
|||||||||||
|
Total operating revenues
|
$
|
731,445
|
|
$
|
609,925
|
|
$
|
565,989
|
|
$
|
550,569
|
|
|||
|
Net income
|
79,658
|
|
12,475
|
|
79,571
|
|
84,563
|
|
|||||||
|
Net income attributable to Digital Realty Trust, L.P.
|
75,773
|
|
12,356
|
|
79,458
|
|
84,442
|
|
|||||||
|
Preferred unit distributions and issuance costs associated
with redeemed preferred units |
20,329
|
|
16,575
|
|
20,814
|
|
17,393
|
|
|||||||
|
Net income (loss) available to common unitholders
|
55,444
|
|
(4,219
|
)
|
58,644
|
|
67,049
|
|
|||||||
|
Basic net income (loss) per unit available to common unitholders
|
$
|
0.26
|
|
$
|
(0.02
|
)
|
$
|
0.36
|
|
$
|
0.42
|
|
|||
|
Diluted net income (loss) per unit available to common unitholders
|
$
|
0.26
|
|
$
|
(0.02
|
)
|
$
|
0.36
|
|
$
|
0.41
|
|
|||
21. Subsequent Events
On January 16, 2019, Digital Euro Finco, LLC, a wholly owned indirect finance subsidiary of the Operating Partnership, issued and sold
€850 million
aggregate principal amount of
2.500%
Guaranteed Notes due 2026 denominated in Euros (the “Euro Notes”). The Euro Notes are senior unsecured obligations of Digital Euro Finco, LLC and are fully and unconditionally guaranteed by Digital Realty Trust, Inc. and the operating partnership. The terms of the Euro Notes are governed by an indenture, dated as of January 16, 2019, among Digital Euro Finco, LLC, Digital Realty Trust, Inc., the operating partnership, Deutsche Trustee Company Limited, as trustee, Deutsche Bank AG, London Branch, as paying agent and a transfer agent, and Deutsche Bank Luxembourg S.A., as registrar and a transfer agent (the “Indenture”). The Indenture contains various restrictive covenants, including limitations on our ability to incur additional indebtedness and requirements to maintain a pool of unencumbered assets. Net proceeds from the offering were approximately
€843.5 million
after deducting managers’ discounts and estimated offering expenses. We intend to allocate an amount equal to the net proceeds from the offering of the Euro Notes to finance or refinance, in whole or in part, certain green building, energy and resource efficiency and renewable energy projects (collectively, “Eligible Green Projects”), including the development and redevelopment of such projects. Pending the allocation of an amount equal to the net proceeds of the Euro Notes to Eligible Green Projects, all or a portion of an amount equal to the net proceeds may be used for the payment of outstanding indebtedness or other capital management activities. Such indebtedness to be redeemed or repaid is expected to include the operating partnership’s
5.875%
Senior Notes due 2020 pursuant to a previously announced tender offer for such notes, by redemption or otherwise, and may include borrowings under the operating partnership’s global credit facilities, as well as other outstanding debt securities.
176
DIGITAL REALTY TRUST, INC. AND SUBSIDIARIES
DIGITAL REALTY TRUST, L.P. AND SUBSIDIARIES
NOTES TO CONSOLIDATED FINANCIAL STATEMENTS- (Continued)
December 31, 2018 and 2017
On January 17, 2019, we announced the results of the previously announced cash tender offer, which we refer to as the Tender Offer, by the operating partnership for any and all of the outstanding
$500.0 million
in aggregate principal amount of
5.875%
Senior Notes due 2020 (the “Senior Notes”), which are fully and unconditionally guaranteed by Digital Realty Trust, Inc.. The Tender Offer expired at 5:00 p.m., New York City time, on Thursday, January 17, 2019. As of the expiration of the Tender Offer, approximately
$350.1 million
or
70.02%
of the
$500.0 million
aggregate principal amount of the Senior Notes outstanding prior to the Tender Offer had been validly tendered and not withdrawn in the Tender Offer. The operating partnership accepted for purchase all of the Notes validly tendered and delivered (and not validly withdrawn) in the Tender Offer at or prior to the Expiration Time. Payment for the Notes purchased pursuant to the Tender Offer is anticipated to be made on January 18, 2019 (the “Settlement Date”) or January 23, 2019 (the “Guaranteed Delivery Settlement Date”), as applicable.
The consideration paid under the Tender Offer was
$1,022.81
per
$1,000
principal amount of Senior Notes, plus accrued and unpaid interest to, but not including, the Settlement Date. The total Tender Offer consideration of approximately
$367.7 million
including accrued and unpaid interest was funded from a portion of the net proceeds from the previously announced issuance and sale by Digital Euro Finco, LLC, a wholly owned indirect finance subsidiary of the Operating Partnership, of the Euro Notes.
On January 18, 2019, Digital Realty announced that its operating partnership has elected to redeem all of its Senior Notes that remain outstanding following the Tender Offer on February 19, 2019 (the “Redemption Date”). The aggregate principal amount outstanding of Senior Notes following the settlement of the Tender Offer was approximately
$149.9 million
. The redemption price for the Senior Notes is equal to (a)
$1,020.31
per
$1,000
principal amount of the Senior Notes, or
102.031%
of the aggregate principal amount of the Senior Notes, plus (b) accrued and unpaid interest to, but excluding, the Redemption Date equal to
$2.937500
per
$1,000
principal amount of the Senior Notes. The operating partnership used the net proceeds from the previously announced issuance and sale by Digital Euro Finco, LLC, a wholly owned indirect finance subsidiary of the Operating Partnership, of the Euro Notes. to fund this redemption. After this redemption, no Senior Notes were outstanding.
177
DIGITAL REALTY TRUST, INC.
DIGITAL REALTY TRUST, L.P.
SCHEDULE III
PROPERTIES AND ACCUMULATED DEPRECIATION
December 31, 2018
(In thousands)
|
|
Metropolitan
Area |
Encumbrances
|
Initial costs
|
Costs capitalized
subsequent to acquisition |
Total costs
|
Accumulated
depreciation and amortization |
Date of
acquisition or construction |
Acquisition
(A) or construction (C) |
|||||||||||||||||||||||||||||||||||||||||
|
Land
|
Acquired
ground lease |
Buildings and
improvements |
Improvements
|
Carrying
costs |
Land
|
Acquired
ground lease |
Buildings and
improvements |
Total
|
|||||||||||||||||||||||||||||||||||||||||
|
PROPERTIES:
|
|||||||||||||||||||||||||||||||||||||||||||||||||
|
36 NE 2nd Street
|
Miami
|
—
|
|
1,942
|
|
—
|
|
24,184
|
|
28,408
|
|
—
|
|
1,970
|
|
—
|
|
52,564
|
|
54,534
|
|
(17,441
|
)
|
2002
|
(A)
|
||||||||||||||||||||||||
|
2323 Bryan Street
|
Dallas
|
—
|
|
1,838
|
|
—
|
|
77,604
|
|
55,942
|
|
—
|
|
1,838
|
|
—
|
|
133,546
|
|
135,384
|
|
(71,792
|
)
|
2002
|
(A)
|
||||||||||||||||||||||||
|
300 Boulevard East
|
New York
|
—
|
|
5,140
|
|
—
|
|
48,526
|
|
62,649
|
|
—
|
|
5,140
|
|
—
|
|
111,175
|
|
116,315
|
|
(67,848
|
)
|
2002
|
(A)
|
||||||||||||||||||||||||
|
2334 Lundy Place
|
Silicon Valley
|
—
|
|
3,607
|
|
—
|
|
23,008
|
|
67
|
|
—
|
|
3,607
|
|
—
|
|
23,075
|
|
26,682
|
|
(10,813
|
)
|
2002
|
(A)
|
||||||||||||||||||||||||
|
2440 Marsh Lane
|
Dallas
|
—
|
|
1,477
|
|
—
|
|
10,330
|
|
73,754
|
|
—
|
|
1,486
|
|
—
|
|
84,075
|
|
85,561
|
|
(67,865
|
)
|
2003
|
(A)
|
||||||||||||||||||||||||
|
375 Riverside Parkway
|
Atlanta
|
—
|
|
1,250
|
|
—
|
|
11,578
|
|
31,704
|
|
—
|
|
1,250
|
|
—
|
|
43,282
|
|
44,532
|
|
(31,210
|
)
|
2003
|
(A)
|
||||||||||||||||||||||||
|
4849 Alpha Road
|
Dallas
|
—
|
|
2,983
|
|
—
|
|
10,650
|
|
44,045
|
|
—
|
|
2,983
|
|
—
|
|
54,695
|
|
57,678
|
|
(33,311
|
)
|
2004
|
(A)
|
||||||||||||||||||||||||
|
600 West Seventh Street
|
Los Angeles
|
—
|
|
18,478
|
|
—
|
|
50,824
|
|
64,912
|
|
—
|
|
18,489
|
|
—
|
|
115,725
|
|
134,214
|
|
(68,601
|
)
|
2004
|
(A)
|
||||||||||||||||||||||||
|
2045 & 2055 Lafayette Street
|
Silicon Valley
|
—
|
|
6,065
|
|
—
|
|
43,817
|
|
45
|
|
—
|
|
6,065
|
|
—
|
|
43,862
|
|
49,927
|
|
(19,242
|
)
|
2004
|
(A)
|
||||||||||||||||||||||||
|
11830 Webb Chapel Road
|
Dallas
|
—
|
|
5,881
|
|
—
|
|
34,473
|
|
2,355
|
|
—
|
|
5,881
|
|
—
|
|
36,828
|
|
42,709
|
|
(17,373
|
)
|
2004
|
(A)
|
||||||||||||||||||||||||
|
150 South First Street
|
Silicon Valley
|
—
|
|
2,068
|
|
—
|
|
29,214
|
|
1,499
|
|
—
|
|
2,068
|
|
—
|
|
30,713
|
|
32,781
|
|
(13,631
|
)
|
2004
|
(A)
|
||||||||||||||||||||||||
|
200 Paul Avenue
|
San Francisco
|
—
|
|
14,427
|
|
—
|
|
75,777
|
|
121,670
|
|
—
|
|
14,498
|
|
—
|
|
197,376
|
|
211,874
|
|
(87,390
|
)
|
2004
|
(A)
|
||||||||||||||||||||||||
|
1100 Space Park Drive
|
Silicon Valley
|
—
|
|
5,130
|
|
—
|
|
18,206
|
|
43,082
|
|
—
|
|
5,130
|
|
—
|
|
61,288
|
|
66,418
|
|
(34,035
|
)
|
2004
|
(A)
|
||||||||||||||||||||||||
|
3015 Winona Avenue
|
Los Angeles
|
—
|
|
6,534
|
|
—
|
|
8,356
|
|
6
|
|
—
|
|
6,534
|
|
—
|
|
8,362
|
|
14,896
|
|
(3,825
|
)
|
2004
|
(A)
|
||||||||||||||||||||||||
|
350 East Cermak Road
|
Chicago
|
—
|
|
8,466
|
|
—
|
|
103,232
|
|
236,679
|
|
—
|
|
8,620
|
|
—
|
|
339,757
|
|
348,377
|
|
(223,795
|
)
|
2005
|
(A)
|
||||||||||||||||||||||||
178
DIGITAL REALTY TRUST, INC.
DIGITAL REALTY TRUST, L.P.
SCHEDULE III
PROPERTIES AND ACCUMULATED DEPRECIATION- (Continued)
December 31, 2018
(In thousands)
|
|
Metropolitan
Area |
Encumbrances
|
Initial costs
|
Costs capitalized
subsequent to acquisition |
Total costs
|
Accumulated
depreciation and amortization |
Date of
acquisition or construction |
Acquisition
(A) or construction (C) |
|||||||||||||||||||||||||||||||||||||||||
|
Land
|
Acquired
ground lease |
Buildings and
improvements |
Improvements
|
Carrying
costs |
Land
|
Acquired
ground lease |
Buildings and
improvements |
Total
|
|||||||||||||||||||||||||||||||||||||||||
|
PROPERTIES:
|
|||||||||||||||||||||||||||||||||||||||||||||||||
|
8534 Concord Center Drive
|
Denver
|
—
|
|
|
2,181
|
|
—
|
|
11,561
|
|
763
|
|
—
|
|
2,181
|
|
—
|
|
12,324
|
|
14,505
|
|
(5,537
|
)
|
2005
|
(A)
|
|||||||||||||||||||||||
|
2401 Walsh Street
|
Silicon Valley
|
—
|
|
|
5,775
|
|
—
|
|
19,267
|
|
37
|
|
—
|
|
5,775
|
|
—
|
|
19,304
|
|
25,079
|
|
(8,868
|
)
|
2005
|
(A)
|
|||||||||||||||||||||||
|
2403 Walsh Street
|
Silicon Valley
|
—
|
|
|
5,514
|
|
—
|
|
11,695
|
|
48
|
|
—
|
|
5,514
|
|
—
|
|
11,743
|
|
17,257
|
|
(5,675
|
)
|
2005
|
(A)
|
|||||||||||||||||||||||
|
200 North Nash Street
|
Los Angeles
|
—
|
|
|
4,562
|
|
—
|
|
12,503
|
|
232
|
|
—
|
|
4,562
|
|
—
|
|
12,735
|
|
17,297
|
|
(6,734
|
)
|
2005
|
(A)
|
|||||||||||||||||||||||
|
731 East Trade Street
|
Charlotte
|
1,777
|
|
(1)
|
1,748
|
|
—
|
|
5,727
|
|
267
|
|
—
|
|
1,748
|
|
—
|
|
5,994
|
|
7,742
|
|
(2,599
|
)
|
2005
|
(A)
|
|||||||||||||||||||||||
|
113 North Myers
|
Charlotte
|
—
|
|
|
1,098
|
|
—
|
|
3,127
|
|
4,762
|
|
—
|
|
1,098
|
|
—
|
|
7,889
|
|
8,987
|
|
(2,493
|
)
|
2005
|
(A)
|
|||||||||||||||||||||||
|
125 North Myers
|
Charlotte
|
—
|
|
|
1,271
|
|
—
|
|
3,738
|
|
6,337
|
|
—
|
|
1,271
|
|
—
|
|
10,075
|
|
11,346
|
|
(7,697
|
)
|
2005
|
(A)
|
|||||||||||||||||||||||
|
Paul van Vlissingenstraat 16
|
Amsterdam
|
—
|
|
|
—
|
|
—
|
|
15,255
|
|
26,722
|
|
—
|
|
—
|
|
—
|
|
41,977
|
|
41,977
|
|
(20,320
|
)
|
2005
|
(A)
|
|||||||||||||||||||||||
|
600-780 S. Federal
|
Chicago
|
—
|
|
|
7,849
|
|
—
|
|
27,881
|
|
35,990
|
|
—
|
|
7,975
|
|
—
|
|
63,745
|
|
71,720
|
|
(18,818
|
)
|
2005
|
(A)
|
|||||||||||||||||||||||
|
115 Second Avenue
|
Boston
|
—
|
|
|
1,691
|
|
—
|
|
12,569
|
|
11,458
|
|
—
|
|
1,691
|
|
—
|
|
24,027
|
|
25,718
|
|
(15,050
|
)
|
2005
|
(A)
|
|||||||||||||||||||||||
|
Chemin de l’Epinglier 2
|
Geneva
|
—
|
|
|
—
|
|
—
|
|
20,071
|
|
(558
|
)
|
—
|
|
—
|
|
—
|
|
19,513
|
|
19,513
|
|
(8,220
|
)
|
2005
|
(A)
|
|||||||||||||||||||||||
|
7500 Metro Center Drive
|
Austin
|
—
|
|
|
1,177
|
|
—
|
|
4,877
|
|
69,483
|
|
—
|
|
1,177
|
|
—
|
|
74,360
|
|
75,537
|
|
(13,685
|
)
|
2005
|
(A)
|
|||||||||||||||||||||||
|
3 Corporate Place
|
New York
|
—
|
|
|
1,543
|
|
—
|
|
12,678
|
|
86,885
|
|
—
|
|
1,543
|
|
—
|
|
99,563
|
|
101,106
|
|
(85,242
|
)
|
2005
|
(A)
|
|||||||||||||||||||||||
|
1115 Centennial Avenue
|
New York
|
—
|
|
581
|
|
—
|
|
—
|
|
58,109
|
|
—
|
|
581
|
|
—
|
|
58,109
|
|
58,690
|
|
(448
|
)
|
2005
|
(C)
|
||||||||||||||||||||||||
|
4025 Midway Road
|
Dallas
|
—
|
|
|
2,196
|
|
—
|
|
14,037
|
|
30,842
|
|
—
|
|
2,196
|
|
—
|
|
44,879
|
|
47,075
|
|
(30,901
|
)
|
2006
|
(A)
|
|||||||||||||||||||||||
|
Clonshaugh Industrial Estate
|
Dublin
|
—
|
|
|
—
|
|
1,444
|
|
5,569
|
|
1,685
|
|
—
|
|
—
|
|
95
|
|
8,603
|
|
8,698
|
|
(5,526
|
)
|
2006
|
(A)
|
|||||||||||||||||||||||
|
6800 Millcreek Drive
|
Toronto
|
—
|
|
|
1,657
|
|
—
|
|
11,352
|
|
2,285
|
|
—
|
|
1,657
|
|
—
|
|
13,637
|
|
15,294
|
|
(6,984
|
)
|
2006
|
(A)
|
|||||||||||||||||||||||
|
101 Aquila Way
|
Atlanta
|
—
|
|
|
1,480
|
|
—
|
|
34,797
|
|
(11,162
|
)
|
—
|
|
1,556
|
|
—
|
|
23,559
|
|
25,115
|
|
—
|
|
2006
|
(A)
|
|||||||||||||||||||||||
|
Digital Houston
|
Houston
|
—
|
|
|
6,965
|
|
—
|
|
23,492
|
|
148,984
|
|
—
|
|
6,965
|
|
—
|
|
172,476
|
|
179,441
|
|
(70,198
|
)
|
2006
|
(A)
|
|||||||||||||||||||||||
|
120 E Van Buren
|
Phoenix
|
—
|
|
|
4,524
|
|
—
|
|
157,822
|
|
120,452
|
|
—
|
|
4,524
|
|
—
|
|
278,274
|
|
282,798
|
|
(138,607
|
)
|
2006
|
(A)
|
|||||||||||||||||||||||
179
DIGITAL REALTY TRUST, INC.
DIGITAL REALTY TRUST, L.P.
SCHEDULE III
PROPERTIES AND ACCUMULATED DEPRECIATION- (Continued)
December 31, 2018
(In thousands)
|
|
Metropolitan
Area |
Encumbrances
|
Initial costs
|
Costs capitalized
subsequent to acquisition |
Total costs
|
Accumulated
depreciation and amortization |
Date of
acquisition or construction |
Acquisition
(A) or construction (C) |
|||||||||||||||||||||||||||||||||||||||||
|
Land
|
Acquired
ground lease |
Buildings and
improvements |
Improvements
|
Carrying
costs |
Land
|
Acquired
ground lease |
Buildings and
improvements |
Total
|
|||||||||||||||||||||||||||||||||||||||||
|
PROPERTIES:
|
|||||||||||||||||||||||||||||||||||||||||||||||||
|
Gyroscoopweg 2E-2F
|
Amsterdam
|
—
|
|
—
|
|
—
|
|
13,450
|
|
(1,376
|
)
|
—
|
|
—
|
|
—
|
|
12,074
|
|
12,074
|
|
(5,113
|
)
|
2006
|
(A)
|
||||||||||||||||||||||||
|
Clonshaugh Industrial Estate II
|
Dublin
|
—
|
|
—
|
|
—
|
|
—
|
|
79,116
|
|
—
|
|
—
|
|
—
|
|
79,116
|
|
79,116
|
|
(47,814
|
)
|
2006
|
(C)
|
||||||||||||||||||||||||
|
600 Winter Street
|
Boston
|
—
|
|
1,429
|
|
—
|
|
6,228
|
|
456
|
|
—
|
|
1,429
|
|
—
|
|
6,684
|
|
8,113
|
|
(2,604
|
)
|
2006
|
(A)
|
||||||||||||||||||||||||
|
2300 NW 89th Place
|
Miami
|
—
|
|
1,022
|
|
—
|
|
3,767
|
|
19
|
|
—
|
|
1,022
|
|
—
|
|
3,786
|
|
4,808
|
|
(1,723
|
)
|
2006
|
(A)
|
||||||||||||||||||||||||
|
2055 East Technology Circle
|
Phoenix
|
—
|
|
—
|
|
—
|
|
8,519
|
|
30,060
|
|
—
|
|
—
|
|
—
|
|
38,579
|
|
38,579
|
|
(30,232
|
)
|
2006
|
(A)
|
||||||||||||||||||||||||
|
Unit 9, Blanchardstown Corporate Park
|
Dublin
|
—
|
|
1,927
|
|
—
|
|
40,024
|
|
24,651
|
|
—
|
|
1,660
|
|
—
|
|
64,942
|
|
66,602
|
|
(26,209
|
)
|
2006
|
(A)
|
||||||||||||||||||||||||
|
111 8th Avenue
|
New York
|
—
|
|
—
|
|
—
|
|
17,688
|
|
27,230
|
|
—
|
|
—
|
|
—
|
|
44,918
|
|
44,918
|
|
(31,402
|
)
|
2006
|
(A)
|
||||||||||||||||||||||||
|
8100 Boone Boulevard
|
N. Virginia
|
—
|
|
—
|
|
—
|
|
158
|
|
2,034
|
|
—
|
|
—
|
|
—
|
|
2,192
|
|
2,192
|
|
(2,192
|
)
|
2006
|
(A)
|
||||||||||||||||||||||||
|
21110 Ridgetop Circle
|
N. Virginia
|
—
|
|
2,934
|
|
—
|
|
14,311
|
|
1,307
|
|
—
|
|
2,934
|
|
—
|
|
15,618
|
|
18,552
|
|
(5,991
|
)
|
2007
|
(A)
|
||||||||||||||||||||||||
|
3011 Lafayette Street
|
Silicon Valley
|
—
|
|
3,354
|
|
—
|
|
10,305
|
|
52,300
|
|
—
|
|
3,354
|
|
—
|
|
62,605
|
|
65,959
|
|
(51,360
|
)
|
2007
|
(A)
|
||||||||||||||||||||||||
|
44470 Chilum Place
|
N. Virginia
|
—
|
|
3,531
|
|
—
|
|
37,360
|
|
1
|
|
—
|
|
3,531
|
|
—
|
|
37,361
|
|
40,892
|
|
(12,144
|
)
|
2007
|
(A)
|
||||||||||||||||||||||||
|
43881 Devin Shafron Drive
|
N. Virginia
|
—
|
|
4,653
|
|
—
|
|
23,631
|
|
96,033
|
|
—
|
|
4,653
|
|
—
|
|
119,664
|
|
124,317
|
|
(96,517
|
)
|
2007
|
(A)
|
||||||||||||||||||||||||
|
43831 Devin Shafron Drive
|
N. Virginia
|
—
|
|
3,027
|
|
—
|
|
16,247
|
|
1,382
|
|
—
|
|
3,027
|
|
—
|
|
17,629
|
|
20,656
|
|
(6,485
|
)
|
2007
|
(A)
|
||||||||||||||||||||||||
|
43791 Devin Shafron Drive
|
N. Virginia
|
—
|
|
3,490
|
|
—
|
|
17,444
|
|
77,914
|
|
—
|
|
3,490
|
|
—
|
|
95,358
|
|
98,848
|
|
(61,691
|
)
|
2007
|
(A)
|
||||||||||||||||||||||||
|
Mundells Roundabout
|
London
|
—
|
|
31,354
|
|
—
|
|
—
|
|
41,294
|
|
—
|
|
20,330
|
|
—
|
|
52,318
|
|
72,648
|
|
(13,558
|
)
|
2007
|
(C)
|
||||||||||||||||||||||||
|
1500 Space Park Drive
|
Silicon Valley
|
—
|
|
6,732
|
|
—
|
|
6,325
|
|
46,277
|
|
—
|
|
4,106
|
|
—
|
|
55,228
|
|
59,334
|
|
(53,527
|
)
|
2007
|
(A)
|
||||||||||||||||||||||||
|
Cressex 1
|
London
|
—
|
|
3,629
|
|
—
|
|
9,036
|
|
19,302
|
|
—
|
|
2,452
|
|
—
|
|
29,515
|
|
31,967
|
|
(20,732
|
)
|
2007
|
(A)
|
||||||||||||||||||||||||
|
Naritaweg 52
|
Amsterdam
|
—
|
|
—
|
|
1,192
|
|
23,441
|
|
(5,129
|
)
|
—
|
|
—
|
|
937
|
|
18,567
|
|
19,504
|
|
(6,048
|
)
|
2007
|
(A)
|
||||||||||||||||||||||||
|
1 St. Anne’s Boulevard
|
London
|
—
|
|
1,490
|
|
—
|
|
1,045
|
|
(804
|
)
|
—
|
|
976
|
|
—
|
|
755
|
|
1,731
|
|
(210
|
)
|
2007
|
(A)
|
||||||||||||||||||||||||
180
DIGITAL REALTY TRUST, INC.
DIGITAL REALTY TRUST, L.P.
SCHEDULE III
PROPERTIES AND ACCUMULATED DEPRECIATION- (Continued)
December 31, 2018
(In thousands)
|
|
Metropolitan
Area |
Encumbrances
|
Initial costs
|
Costs capitalized
subsequent to acquisition |
Total costs
|
Accumulated
depreciation and amortization |
Date of
acquisition or construction |
Acquisition
(A) or construction (C) |
|||||||||||||||||||||||||||||||||||||||||
|
Land
|
Acquired
ground lease |
Buildings and
improvements |
Improvements
|
Carrying
costs |
Land
|
Acquired
ground lease |
Buildings and
improvements |
Total
|
|||||||||||||||||||||||||||||||||||||||||
|
PROPERTIES:
|
|||||||||||||||||||||||||||||||||||||||||||||||||
|
2 St. Anne’s Boulevard
|
London
|
—
|
|
922
|
|
—
|
|
695
|
|
32,979
|
|
—
|
|
650
|
|
—
|
|
33,946
|
|
34,596
|
|
(6,437
|
)
|
2007
|
(A)
|
||||||||||||||||||||||||
|
3 St. Anne’s Boulevard
|
London
|
—
|
|
22,079
|
|
—
|
|
16,351
|
|
79,708
|
|
—
|
|
14,335
|
|
—
|
|
103,803
|
|
118,138
|
|
(60,140
|
)
|
2007
|
(A)
|
||||||||||||||||||||||||
|
365 South Randolphville Road
|
New York
|
—
|
|
3,019
|
|
—
|
|
17,404
|
|
301,969
|
|
—
|
|
3,023
|
|
—
|
|
319,369
|
|
322,392
|
|
(133,568
|
)
|
2008
|
(A)
|
||||||||||||||||||||||||
|
701 & 717 Leonard Street
|
Dallas
|
—
|
|
2,165
|
|
—
|
|
9,934
|
|
835
|
|
—
|
|
2,165
|
|
—
|
|
10,769
|
|
12,934
|
|
(3,255
|
)
|
2008
|
(A)
|
||||||||||||||||||||||||
|
Manchester Technopark
|
Manchester
|
—
|
|
—
|
|
—
|
|
23,918
|
|
(8,161
|
)
|
—
|
|
—
|
|
—
|
|
15,757
|
|
15,757
|
|
(4,763
|
)
|
2008
|
(A)
|
||||||||||||||||||||||||
|
1201 Comstock Street
|
Silicon Valley
|
—
|
|
2,093
|
|
—
|
|
1,606
|
|
26,945
|
|
—
|
|
3,398
|
|
—
|
|
27,246
|
|
30,644
|
|
(20,433
|
)
|
2008
|
(A)
|
||||||||||||||||||||||||
|
1550 Space Park Drive
|
Silicon Valley
|
—
|
|
2,301
|
|
—
|
|
766
|
|
2,649
|
|
—
|
|
5,716
|
|
—
|
|
—
|
|
5,716
|
|
—
|
|
2008
|
(A)
|
||||||||||||||||||||||||
|
1525 Comstock Street
|
Silicon Valley
|
—
|
|
2,293
|
|
—
|
|
16,216
|
|
31,131
|
|
—
|
|
2,061
|
|
—
|
|
47,579
|
|
49,640
|
|
(34,656
|
)
|
2008
|
(C)
|
||||||||||||||||||||||||
|
43830 Devin Shafron Drive
|
N. Virginia
|
—
|
|
5,509
|
|
—
|
|
—
|
|
74,916
|
|
—
|
|
5,509
|
|
—
|
|
74,916
|
|
80,425
|
|
(43,316
|
)
|
2009
|
(C)
|
||||||||||||||||||||||||
|
1232 Alma Road
|
Dallas
|
—
|
|
2,267
|
|
—
|
|
3,740
|
|
65,647
|
|
—
|
|
2,266
|
|
—
|
|
69,388
|
|
71,654
|
|
(43,853
|
)
|
2009
|
(A)
|
||||||||||||||||||||||||
|
900 Quality Way
|
Dallas
|
—
|
|
1,446
|
|
—
|
|
1,659
|
|
69,489
|
|
—
|
|
1,437
|
|
—
|
|
71,157
|
|
72,594
|
|
(21,533
|
)
|
2009
|
(A)
|
||||||||||||||||||||||||
|
1210 Integrity Drive
|
Dallas
|
—
|
|
2,041
|
|
—
|
|
3,389
|
|
189,102
|
|
—
|
|
3,472
|
|
—
|
|
191,060
|
|
194,532
|
|
(6,435
|
)
|
2009
|
(A)
|
||||||||||||||||||||||||
|
907 Security Row
|
Dallas
|
—
|
|
333
|
|
—
|
|
344
|
|
97,744
|
|
—
|
|
2,112
|
|
—
|
|
96,309
|
|
98,421
|
|
(9,228
|
)
|
2009
|
(A)
|
||||||||||||||||||||||||
|
908 Quality Way
|
Dallas
|
—
|
|
6,730
|
|
—
|
|
4,493
|
|
13,948
|
|
—
|
|
2,067
|
|
—
|
|
23,104
|
|
25,171
|
|
(18,441
|
)
|
2009
|
(A)
|
||||||||||||||||||||||||
|
904 Quality Way
|
Dallas
|
—
|
|
760
|
|
—
|
|
744
|
|
6,819
|
|
—
|
|
1,151
|
|
—
|
|
7,172
|
|
8,323
|
|
(1,194
|
)
|
2009
|
(A)
|
||||||||||||||||||||||||
|
1215 Integrity Drive
|
Dallas
|
—
|
|
—
|
|
—
|
|
—
|
|
69,836
|
|
—
|
|
995
|
|
—
|
|
68,841
|
|
69,836
|
|
(18,600
|
)
|
2009
|
(C)
|
||||||||||||||||||||||||
|
1350 Duane & 3080 Raymond
|
Silicon Valley
|
—
|
|
7,081
|
|
—
|
|
69,817
|
|
354
|
|
—
|
|
7,081
|
|
—
|
|
70,171
|
|
77,252
|
|
(16,611
|
)
|
2009
|
(A)
|
||||||||||||||||||||||||
|
45901 & 45845 Nokes Boulevard
|
N. Virginia
|
—
|
|
3,437
|
|
—
|
|
28,785
|
|
450
|
|
—
|
|
3,437
|
|
—
|
|
29,235
|
|
32,672
|
|
(7,366
|
)
|
2009
|
(A)
|
||||||||||||||||||||||||
181
DIGITAL REALTY TRUST, INC.
DIGITAL REALTY TRUST, L.P.
SCHEDULE III
PROPERTIES AND ACCUMULATED DEPRECIATION- (Continued)
December 31, 2018
(In thousands)
|
|
Metropolitan
Area |
Encumbrances
|
Initial costs
|
Costs capitalized
subsequent to acquisition |
Total costs
|
Accumulated
depreciation and amortization |
Date of
acquisition or construction |
Acquisition
(A) or construction (C) |
|||||||||||||||||||||||||||||||||||||||||
|
Land
|
Acquired
ground lease |
Buildings and
improvements |
Improvements
|
Carrying
costs |
Land
|
Acquired
ground lease |
Buildings and
improvements |
Total
|
|||||||||||||||||||||||||||||||||||||||||
|
PROPERTIES:
|
|||||||||||||||||||||||||||||||||||||||||||||||||
|
21561 & 21571 Beaumeade Circle
|
N. Virginia
|
—
|
|
3,966
|
|
—
|
|
24,211
|
|
45
|
|
—
|
|
3,966
|
|
—
|
|
24,256
|
|
28,222
|
|
(5,631
|
)
|
2009
|
(A)
|
||||||||||||||||||||||||
|
60 & 80 Merritt
|
New York
|
—
|
|
3,418
|
|
—
|
|
71,477
|
|
97,152
|
|
—
|
|
3,418
|
|
—
|
|
168,629
|
|
172,047
|
|
(41,819
|
)
|
2010
|
(A)
|
||||||||||||||||||||||||
|
55 Middlesex
|
Boston
|
—
|
|
9,975
|
|
—
|
|
68,363
|
|
14,043
|
|
—
|
|
9,975
|
|
—
|
|
82,406
|
|
92,381
|
|
(25,924
|
)
|
2010
|
(A)
|
||||||||||||||||||||||||
|
128 First Avenue
|
Boston
|
—
|
|
5,465
|
|
—
|
|
185,348
|
|
37,493
|
|
—
|
|
5,465
|
|
—
|
|
222,841
|
|
228,306
|
|
(71,312
|
)
|
2010
|
(A)
|
||||||||||||||||||||||||
|
Cateringweg 5
|
Amsterdam
|
—
|
|
—
|
|
3,518
|
|
3,517
|
|
38,829
|
|
—
|
|
—
|
|
3,296
|
|
42,568
|
|
45,864
|
|
(8,480
|
)
|
2010
|
(A)
|
||||||||||||||||||||||||
|
1725 Comstock Street
|
Silicon Valley
|
—
|
|
3,274
|
|
—
|
|
6,567
|
|
39,190
|
|
—
|
|
3,274
|
|
—
|
|
45,757
|
|
49,031
|
|
(25,913
|
)
|
2010
|
(A)
|
||||||||||||||||||||||||
|
3105 Alfred Street
|
Silicon Valley
|
—
|
|
6,533
|
|
—
|
|
3,725
|
|
123,928
|
|
—
|
|
6,532
|
|
—
|
|
127,654
|
|
134,186
|
|
(31,190
|
)
|
2010
|
(A)
|
||||||||||||||||||||||||
|
365 Main Street
|
San Francisco
|
—
|
|
22,854
|
|
—
|
|
158,709
|
|
29,725
|
|
—
|
|
22,854
|
|
—
|
|
188,434
|
|
211,288
|
|
(53,717
|
)
|
2010
|
(A)
|
||||||||||||||||||||||||
|
720 2nd Street
|
San Francisco
|
—
|
|
3,884
|
|
—
|
|
116,861
|
|
10,865
|
|
—
|
|
3,884
|
|
—
|
|
127,726
|
|
131,610
|
|
(33,071
|
)
|
2010
|
(A)
|
||||||||||||||||||||||||
|
2260 East El Segundo
|
Los Angeles
|
—
|
|
11,053
|
|
—
|
|
51,397
|
|
15,774
|
|
—
|
|
11,053
|
|
—
|
|
67,171
|
|
78,224
|
|
(20,837
|
)
|
2010
|
(A)
|
||||||||||||||||||||||||
|
2121 South Price Road
|
Phoenix
|
—
|
|
7,335
|
|
—
|
|
238,452
|
|
213,355
|
|
—
|
|
7,335
|
|
—
|
|
451,807
|
|
459,142
|
|
(128,398
|
)
|
2010
|
(A)
|
||||||||||||||||||||||||
|
4030 Lafayette
|
N. Virginia
|
—
|
|
2,492
|
|
—
|
|
16,912
|
|
10,372
|
|
—
|
|
2,492
|
|
—
|
|
27,284
|
|
29,776
|
|
(6,863
|
)
|
2010
|
(A)
|
||||||||||||||||||||||||
|
4040 Lafayette
|
N. Virginia
|
—
|
|
1,246
|
|
—
|
|
4,267
|
|
24,717
|
|
—
|
|
1,246
|
|
—
|
|
28,984
|
|
30,230
|
|
(4,778
|
)
|
2010
|
(A)
|
||||||||||||||||||||||||
|
4050 Lafayette
|
N. Virginia
|
—
|
|
1,246
|
|
—
|
|
4,371
|
|
35,994
|
|
—
|
|
1,246
|
|
—
|
|
40,365
|
|
41,611
|
|
(23,551
|
)
|
2010
|
(A)
|
||||||||||||||||||||||||
|
2805 Lafayette Street
|
Silicon Valley
|
—
|
|
8,976
|
|
—
|
|
18,155
|
|
130,422
|
|
—
|
|
8,294
|
|
—
|
|
149,259
|
|
157,553
|
|
(31,988
|
)
|
2010
|
(A)
|
||||||||||||||||||||||||
|
29A International Business Park
|
Singapore
|
—
|
|
—
|
|
—
|
|
137,545
|
|
213,162
|
|
—
|
|
—
|
|
—
|
|
350,707
|
|
350,707
|
|
(128,018
|
)
|
2010
|
(A)
|
||||||||||||||||||||||||
|
43940 Digital Loudoun Plaza
|
N. Virginia
|
—
|
|
6,229
|
|
—
|
|
—
|
|
284,883
|
|
—
|
|
7,524
|
|
—
|
|
283,588
|
|
291,112
|
|
(74,154
|
)
|
2011
|
(C)
|
||||||||||||||||||||||||
|
44060 Digital Loudoun Plaza
|
N. Virginia
|
—
|
|
3,700
|
|
—
|
|
—
|
|
187,226
|
|
—
|
|
3,441
|
|
—
|
|
187,485
|
|
190,926
|
|
(24,690
|
)
|
2011
|
(C)
|
||||||||||||||||||||||||
|
44100 Digital Loudoun Plaza
|
N. Virginia
|
—
|
|
3,700
|
|
—
|
|
—
|
|
140,869
|
|
—
|
|
3,493
|
|
—
|
|
141,076
|
|
144,569
|
|
(11,587
|
)
|
2011
|
(C)
|
||||||||||||||||||||||||
|
43780 Digital Loudoun Plaza
|
N. Virginia
|
—
|
|
3,671
|
|
—
|
|
—
|
|
122,489
|
|
—
|
|
4,186
|
|
—
|
|
121,974
|
|
126,160
|
|
(6,976
|
)
|
2011
|
(C)
|
||||||||||||||||||||||||
|
1-11 Templar Road
|
Sydney
|
—
|
|
6,937
|
|
—
|
|
—
|
|
62,870
|
|
—
|
|
4,367
|
|
—
|
|
65,440
|
|
69,807
|
|
(15,816
|
)
|
2011
|
(C)
|
||||||||||||||||||||||||
|
13-23 Templar Road
|
Sydney
|
4,236
|
|
—
|
|
—
|
|
68,074
|
|
—
|
|
3,530
|
|
—
|
|
68,780
|
|
72,310
|
|
(137
|
)
|
2011
|
(C)
|
||||||||||||||||||||||||||
|
Fountain Court
|
London
|
—
|
|
7,544
|
|
—
|
|
12,506
|
|
94,180
|
|
—
|
|
6,319
|
|
—
|
|
107,911
|
|
114,230
|
|
(24,250
|
)
|
2011
|
(A)
|
||||||||||||||||||||||||
|
72 Radnor Drive
|
Melbourne
|
—
|
|
2,568
|
|
—
|
|
—
|
|
66,203
|
|
—
|
|
1,749
|
|
—
|
|
67,022
|
|
68,771
|
|
(9,947
|
)
|
2011
|
(C)
|
||||||||||||||||||||||||
|
98 Radnor Drive
|
Melbourne
|
—
|
|
1,899
|
|
—
|
|
—
|
|
35,692
|
|
—
|
|
1,345
|
|
—
|
|
36,246
|
|
37,591
|
|
(15,159
|
)
|
2011
|
(C)
|
||||||||||||||||||||||||
|
105 Cabot Street
|
Boston
|
—
|
|
2,386
|
|
—
|
|
—
|
|
59,267
|
|
—
|
|
2,448
|
|
—
|
|
59,205
|
|
61,653
|
|
(9,257
|
)
|
2011
|
(C)
|
||||||||||||||||||||||||
182
DIGITAL REALTY TRUST, INC.
DIGITAL REALTY TRUST, L.P.
SCHEDULE III
PROPERTIES AND ACCUMULATED DEPRECIATION- (Continued)
December 31, 2018
(In thousands)
|
|
Metropolitan
Area |
Encumbrances
|
Initial costs
|
Costs capitalized
subsequent to acquisition |
Total costs
|
Accumulated
depreciation and amortization |
Date of
acquisition or construction |
Acquisition
(A) or construction (C) |
|||||||||||||||||||||||||||||||||||||||||
|
Land
|
Acquired
ground lease |
Buildings and
improvements |
Improvements
|
Carrying
costs |
Land
|
Acquired
ground lease |
Buildings and
improvements |
Total
|
|||||||||||||||||||||||||||||||||||||||||
|
PROPERTIES:
|
|||||||||||||||||||||||||||||||||||||||||||||||||
|
3825 NW Aloclek Place
|
Portland
|
—
|
|
|
1,689
|
|
—
|
|
—
|
|
58,153
|
|
—
|
|
1,689
|
|
—
|
|
58,153
|
|
59,842
|
|
(21,249
|
)
|
2011
|
(C)
|
|||||||||||||||||||||||
|
Profile Park
|
Dublin
|
—
|
|
|
6,288
|
|
—
|
|
—
|
|
73,579
|
|
—
|
|
9,573
|
|
—
|
|
70,294
|
|
79,867
|
|
(3,982
|
)
|
2011
|
(C)
|
|||||||||||||||||||||||
|
760 Doug Davis Drive
|
Atlanta
|
—
|
|
|
4,837
|
|
—
|
|
53,551
|
|
3,373
|
|
—
|
|
4,837
|
|
—
|
|
56,924
|
|
61,761
|
|
(13,384
|
)
|
2011
|
(A)
|
|||||||||||||||||||||||
|
2501 S. State Hwy 121
|
Dallas
|
—
|
|
|
23,137
|
|
—
|
|
93,943
|
|
19,180
|
|
—
|
|
24,612
|
|
—
|
|
111,648
|
|
136,260
|
|
(31,141
|
)
|
2012
|
(A)
|
|||||||||||||||||||||||
|
9333 Grand Avenue
|
Chicago
|
—
|
|
|
5,686
|
|
—
|
|
14,515
|
|
74,579
|
|
—
|
|
1,205
|
|
—
|
|
93,575
|
|
94,780
|
|
(34,196
|
)
|
2012
|
(A)
|
|||||||||||||||||||||||
|
9355 Grand Avenue
|
Chicago
|
—
|
|
—
|
|
—
|
|
227,902
|
|
—
|
|
2,518
|
|
—
|
|
225,384
|
|
227,902
|
|
(22,298
|
)
|
2012
|
(A)
|
||||||||||||||||||||||||||
|
9377 Grand Avenue
|
Chicago
|
—
|
|
—
|
|
—
|
|
123,953
|
|
—
|
|
2,137
|
|
—
|
|
121,816
|
|
123,953
|
|
(3,683
|
)
|
2012
|
(A)
|
||||||||||||||||||||||||||
|
850 E Collins
|
Dallas
|
—
|
|
|
1,614
|
|
—
|
|
—
|
|
85,337
|
|
—
|
|
1,614
|
|
—
|
|
85,337
|
|
86,951
|
|
(19,313
|
)
|
2012
|
(C)
|
|||||||||||||||||||||||
|
950 E Collins
|
Dallas
|
—
|
|
|
1,546
|
|
—
|
|
—
|
|
75,284
|
|
—
|
|
1,546
|
|
—
|
|
75,284
|
|
76,830
|
|
(12,178
|
)
|
2012
|
(C)
|
|||||||||||||||||||||||
|
400 S. Akard
|
Dallas
|
—
|
|
|
10,075
|
|
—
|
|
62,730
|
|
2,657
|
|
—
|
|
10,075
|
|
—
|
|
65,387
|
|
75,462
|
|
(11,686
|
)
|
2012
|
(A)
|
|||||||||||||||||||||||
|
410 Commerce Boulevard
|
New York
|
—
|
|
|
—
|
|
—
|
|
—
|
|
30,212
|
|
—
|
|
—
|
|
—
|
|
30,212
|
|
30,212
|
|
(12,866
|
)
|
2012
|
(C)
|
|||||||||||||||||||||||
|
Croydon
|
London
|
—
|
|
|
1,683
|
|
—
|
|
104,728
|
|
40,542
|
|
—
|
|
2,277
|
|
—
|
|
144,676
|
|
146,953
|
|
(26,060
|
)
|
2012
|
(A)
|
|||||||||||||||||||||||
|
Watford
|
London
|
—
|
|
|
—
|
|
7,355
|
|
219,273
|
|
(6,852
|
)
|
—
|
|
—
|
|
6,247
|
|
213,529
|
|
219,776
|
|
(39,423
|
)
|
2012
|
(A)
|
|||||||||||||||||||||||
|
Unit 21 Goldsworth Park
|
London
|
—
|
|
|
17,334
|
|
—
|
|
928,129
|
|
(159,279
|
)
|
—
|
|
12,735
|
|
—
|
|
773,449
|
|
786,184
|
|
(147,488
|
)
|
2012
|
(A)
|
|||||||||||||||||||||||
|
11900 East Cornell
|
Denver
|
—
|
|
|
3,352
|
|
—
|
|
80,640
|
|
2,796
|
|
—
|
|
3,352
|
|
—
|
|
83,436
|
|
86,788
|
|
(17,330
|
)
|
2012
|
(A)
|
|||||||||||||||||||||||
|
701 Union Boulevard
|
New York
|
—
|
|
|
10,045
|
|
—
|
|
6,755
|
|
25,274
|
|
—
|
|
42,074
|
|
—
|
|
—
|
|
42,074
|
|
—
|
|
2012
|
(A)
|
|||||||||||||||||||||||
|
23 Waterloo Road
|
Sydney
|
—
|
|
|
7,112
|
|
—
|
|
3,868
|
|
(3,534
|
)
|
—
|
|
4,823
|
|
—
|
|
2,623
|
|
7,446
|
|
(436
|
)
|
2012
|
(A)
|
|||||||||||||||||||||||
|
1 Rue Jean-Pierre
|
Paris
|
—
|
|
|
9,621
|
|
—
|
|
35,825
|
|
(5,945
|
)
|
—
|
|
8,362
|
|
—
|
|
31,139
|
|
39,501
|
|
(6,777
|
)
|
2012
|
(A)
|
|||||||||||||||||||||||
|
Liet-dit le Christ de Saclay
|
Paris
|
—
|
|
|
3,402
|
|
—
|
|
3,090
|
|
(849
|
)
|
—
|
|
2,957
|
|
—
|
|
2,686
|
|
5,643
|
|
(754
|
)
|
2012
|
(A)
|
|||||||||||||||||||||||
|
127 Rue de Paris
|
Paris
|
—
|
|
|
8,637
|
|
—
|
|
10,838
|
|
(2,548
|
)
|
—
|
|
7,507
|
|
—
|
|
9,420
|
|
16,927
|
|
(2,551
|
)
|
2012
|
(A)
|
|||||||||||||||||||||||
|
17201 Waterview Parkway
|
Dallas
|
—
|
|
|
2,070
|
|
—
|
|
6,409
|
|
42
|
|
—
|
|
2,070
|
|
—
|
|
6,451
|
|
8,521
|
|
(1,253
|
)
|
2013
|
(A)
|
|||||||||||||||||||||||
|
1900 S. Price Road
|
Phoenix
|
—
|
|
|
5,380
|
|
—
|
|
16,975
|
|
982
|
|
—
|
|
5,512
|
|
—
|
|
17,825
|
|
23,337
|
|
(2,217
|
)
|
2013
|
(A)
|
|||||||||||||||||||||||
183
DIGITAL REALTY TRUST, INC.
DIGITAL REALTY TRUST, L.P.
SCHEDULE III
PROPERTIES AND ACCUMULATED DEPRECIATION- (Continued)
December 31, 2018
(In thousands)
|
|
Metropolitan
Area |
Encumbrances
|
Initial costs
|
Costs capitalized
subsequent to acquisition |
Total costs
|
Accumulated
depreciation and amortization |
Date of
acquisition or construction |
Acquisition
(A) or construction (C) |
|||||||||||||||||||||||||||||||||||||||||
|
Land
|
Acquired
ground lease |
Buildings and
improvements |
Improvements
|
Carrying
costs |
Land
|
Acquired
ground lease |
Buildings and
improvements |
Total
|
|||||||||||||||||||||||||||||||||||||||||
|
371 Gough Road
|
Toronto
|
—
|
|
|
7,394
|
|
677
|
|
87,318
|
|
—
|
|
5,560
|
|
—
|
|
89,829
|
|
95,389
|
|
(9,855
|
)
|
2013
|
(A)
|
|||||||||||||||||||||||||
|
1500 Towerview Road
|
Minneapolis
|
—
|
|
|
10,190
|
|
20,054
|
|
3,191
|
|
—
|
|
10,190
|
|
—
|
|
23,245
|
|
33,435
|
|
(4,857
|
)
|
2013
|
(A)
|
|||||||||||||||||||||||||
|
Principal Park
|
London
|
—
|
|
|
11,837
|
|
—
|
|
104,084
|
|
—
|
|
12,343
|
|
—
|
|
103,578
|
|
115,921
|
|
(9,625
|
)
|
2013
|
(C)
|
|||||||||||||||||||||||||
|
Liverpoolweg 10
|
Amsterdam
|
—
|
|
|
733
|
|
3,122
|
|
9,730
|
|
—
|
|
644
|
|
—
|
|
12,941
|
|
13,585
|
|
(2,482
|
)
|
2013
|
(A)
|
|||||||||||||||||||||||||
|
DePresident
|
Amsterdam
|
—
|
|
|
6,737
|
|
—
|
|
117,156
|
|
—
|
|
7,858
|
|
—
|
|
116,035
|
|
123,893
|
|
(2,506
|
)
|
2013
|
(C)
|
|||||||||||||||||||||||||
|
Crawley 2
|
London
|
—
|
|
24,305
|
|
—
|
|
60,285
|
|
—
|
|
26,637
|
|
—
|
|
57,953
|
|
84,590
|
|
(463
|
)
|
2014
|
(C)
|
||||||||||||||||||||||||||
|
Digital Deer Park 3
|
Melbourne
|
—
|
|
1,600
|
|
—
|
|
—
|
|
3
|
|
—
|
|
1,603
|
|
—
|
|
—
|
|
1,603
|
|
—
|
|
2015
|
(C)
|
||||||||||||||||||||||||
|
3 Loyang Way
|
Singapore
|
—
|
|
—
|
|
—
|
|
—
|
|
168,365
|
|
—
|
|
—
|
|
—
|
|
168,365
|
|
168,365
|
|
(3,961
|
)
|
2015
|
(A)
|
||||||||||||||||||||||||
|
Digital Loudoun III
|
N. Virginia
|
—
|
|
43,000
|
|
—
|
|
—
|
|
572,790
|
|
—
|
|
60,358
|
|
—
|
|
555,432
|
|
615,790
|
|
(6,648
|
)
|
2015
|
(C)
|
||||||||||||||||||||||||
|
Digital Frankfurt
|
Frankfurt
|
—
|
|
5,543
|
|
—
|
|
—
|
|
101,172
|
|
—
|
|
9,987
|
|
—
|
|
96,728
|
|
106,715
|
|
(934
|
)
|
2015
|
(C)
|
||||||||||||||||||||||||
|
56 Marietta Street
|
Atlanta
|
(2)
|
—
|
|
1,700
|
|
—
|
|
211,397
|
|
22,788
|
|
—
|
|
1,700
|
|
—
|
|
234,185
|
|
235,885
|
|
(30,981
|
)
|
2015
|
(A)
|
|||||||||||||||||||||||
|
2 Peekay Drive
|
New York
|
(2)
|
—
|
|
—
|
|
—
|
|
115,439
|
|
38,235
|
|
—
|
|
—
|
|
—
|
|
153,674
|
|
153,674
|
|
(25,011
|
)
|
2015
|
(A)
|
|||||||||||||||||||||||
|
100 Delawanna Avenue
|
New York
|
(2)
|
—
|
|
3,600
|
|
—
|
|
85,438
|
|
7,043
|
|
—
|
|
3,600
|
|
—
|
|
92,481
|
|
96,081
|
|
(10,686
|
)
|
2015
|
(A)
|
|||||||||||||||||||||||
|
60 Hudson Street
|
New York
|
(2)
|
—
|
|
—
|
|
—
|
|
32,280
|
|
13,709
|
|
—
|
|
—
|
|
—
|
|
45,989
|
|
45,989
|
|
(12,278
|
)
|
2015
|
(A)
|
|||||||||||||||||||||||
|
32 Avenue of the Americas
|
New York
|
(2)
|
—
|
|
—
|
|
—
|
|
30,980
|
|
3,457
|
|
—
|
|
—
|
|
—
|
|
34,437
|
|
34,437
|
|
(8,693
|
)
|
2015
|
(A)
|
|||||||||||||||||||||||
|
3433 S 120th Place
|
Seattle
|
(2)
|
—
|
|
—
|
|
—
|
|
11,688
|
|
2,324
|
|
—
|
|
—
|
|
—
|
|
14,012
|
|
14,012
|
|
(4,818
|
)
|
2015
|
(A)
|
|||||||||||||||||||||||
|
8435 Stemmons Freeway
|
Dallas
|
(2)
|
—
|
|
—
|
|
—
|
|
5,023
|
|
2,236
|
|
—
|
|
—
|
|
—
|
|
7,259
|
|
7,259
|
|
(2,097
|
)
|
2015
|
(A)
|
|||||||||||||||||||||||
|
2625 Walsh Avenue
|
Silicon Valley
|
(2)
|
—
|
|
—
|
|
—
|
|
4,276
|
|
7,768
|
|
—
|
|
—
|
|
—
|
|
12,044
|
|
12,044
|
|
(2,626
|
)
|
2015
|
(A)
|
|||||||||||||||||||||||
|
111 8th Avenue - Telx
|
New York
|
(2)
|
—
|
|
—
|
|
—
|
|
42,454
|
|
14,422
|
|
—
|
|
—
|
|
56,876
|
|
56,876
|
|
(16,822
|
)
|
2015
|
(A)
|
|||||||||||||||||||||||||
|
350 East Cermak Road - Telx
|
Chicago
|
(2)
|
—
|
|
—
|
|
—
|
|
13,933
|
|
8,163
|
|
—
|
|
—
|
|
—
|
|
22,096
|
|
22,096
|
|
(5,499
|
)
|
2015
|
(A)
|
|||||||||||||||||||||||
|
200 Paul Avenue - Telx
|
San Francisco
|
(2)
|
—
|
|
—
|
|
—
|
|
6,719
|
|
3,322
|
|
—
|
|
—
|
|
—
|
|
10,041
|
|
10,041
|
|
(2,750
|
)
|
2015
|
(A)
|
|||||||||||||||||||||||
|
2323 Bryan Street - Telx
|
Dallas
|
(2)
|
—
|
|
—
|
|
—
|
|
5,191
|
|
3,770
|
|
—
|
|
—
|
|
—
|
|
8,961
|
|
8,961
|
|
(2,578
|
)
|
2015
|
(A)
|
|||||||||||||||||||||||
|
600 W. 7th Street - Telx
|
Los Angeles
|
(2)
|
—
|
|
—
|
|
—
|
|
3,689
|
|
5,096
|
|
—
|
|
—
|
|
—
|
|
8,785
|
|
8,785
|
|
(1,851
|
)
|
2015
|
(A)
|
|||||||||||||||||||||||
|
3825 NW Aloclek Place - Telx
|
Portland
|
(2)
|
—
|
|
—
|
|
—
|
|
3,131
|
|
1,104
|
|
—
|
|
—
|
|
—
|
|
4,235
|
|
4,235
|
|
(1,316
|
)
|
2015
|
(A)
|
|||||||||||||||||||||||
|
120 E. Van Buren Street - Telx
|
Phoenix
|
(2)
|
—
|
|
—
|
|
—
|
|
2,848
|
|
2,407
|
|
—
|
|
—
|
|
—
|
|
5,255
|
|
5,255
|
|
(1,299
|
)
|
2015
|
(A)
|
|||||||||||||||||||||||
|
36 NE 2nd Street - Telx
|
Miami
|
(2)
|
—
|
|
—
|
|
—
|
|
1,842
|
|
2,806
|
|
—
|
|
—
|
|
—
|
|
4,648
|
|
4,648
|
|
(1,238
|
)
|
2015
|
(A)
|
|||||||||||||||||||||||
|
600-780 S. Federal Street - Telx
|
Chicago
|
(2)
|
—
|
|
—
|
|
—
|
|
1,815
|
|
3,227
|
|
—
|
|
—
|
|
—
|
|
5,042
|
|
5,042
|
|
(1,035
|
)
|
2015
|
(A)
|
|||||||||||||||||||||||
|
113 N. Myers Street - Telx
|
Charlotte
|
(2)
|
—
|
|
—
|
|
—
|
|
476
|
|
746
|
|
—
|
|
—
|
|
—
|
|
1,222
|
|
1,222
|
|
(268
|
)
|
2015
|
(A)
|
|||||||||||||||||||||||
|
1100 Space Park Drive - Telx
|
Silicon Valley
|
(2)
|
—
|
|
—
|
|
—
|
|
352
|
|
1,122
|
|
—
|
|
—
|
|
—
|
|
1,474
|
|
1,474
|
|
(233
|
)
|
2015
|
(A)
|
|||||||||||||||||||||||
184
DIGITAL REALTY TRUST, INC.
DIGITAL REALTY TRUST, L.P.
SCHEDULE III
PROPERTIES AND ACCUMULATED DEPRECIATION- (Continued)
December 31, 2018
(In thousands)
|
|
Metropolitan
Area |
Encumbrances
|
Initial costs
|
Costs capitalized
subsequent to acquisition |
Total costs
|
Accumulated
depreciation and amortization |
Date of
acquisition or construction |
Acquisition
(A) or construction (C) |
|||||||||||||||||||||||||||||||||||||||||
|
Land
|
Acquired
ground lease |
Buildings and
improvements |
Improvements
|
Carrying
costs |
Land
|
Acquired
ground lease |
Buildings and
improvements |
Total
|
|||||||||||||||||||||||||||||||||||||||||
|
300 Boulevard East - Telx
|
New York
|
(2)
|
—
|
|
—
|
|
—
|
|
197
|
|
55
|
|
—
|
|
—
|
|
—
|
|
252
|
|
252
|
|
(139
|
)
|
2015
|
(A)
|
|||||||||||||||||||||||
|
Science Park
|
Amsterdam
|
(3)
|
—
|
|
665
|
|
—
|
|
75,095
|
|
22,517
|
|
—
|
|
693
|
|
—
|
|
97,584
|
|
98,277
|
|
(6,905
|
)
|
2016
|
(A)
|
|||||||||||||||||||||||
|
Sovereign House
|
London
|
(3)
|
—
|
|
7,943
|
|
—
|
|
75,184
|
|
36,988
|
|
—
|
|
—
|
|
—
|
|
120,115
|
|
120,115
|
|
(12,253
|
)
|
2016
|
(A)
|
|||||||||||||||||||||||
|
Amstel Business Park
|
Amsterdam
|
(3)
|
—
|
|
2,991
|
|
—
|
|
58,138
|
|
14,086
|
|
—
|
|
3,096
|
|
—
|
|
72,119
|
|
75,215
|
|
(14,666
|
)
|
2016
|
(A)
|
|||||||||||||||||||||||
|
Olivers Yard
|
London
|
(3)
|
—
|
|
7,943
|
|
—
|
|
34,744
|
|
1,353
|
|
—
|
|
7,780
|
|
—
|
|
36,260
|
|
44,040
|
|
(10,089
|
)
|
2016
|
(A)
|
|||||||||||||||||||||||
|
Bonnington House
|
London
|
(3)
|
—
|
|
—
|
|
—
|
|
14,127
|
|
72,272
|
|
—
|
|
174
|
|
—
|
|
86,225
|
|
86,399
|
|
(2,805
|
)
|
2016
|
(A)
|
|||||||||||||||||||||||
|
West Drayton
|
London
|
(3)
|
—
|
|
—
|
|
—
|
|
10,135
|
|
1,469
|
|
—
|
|
—
|
|
—
|
|
11,604
|
|
11,604
|
|
(4,750
|
)
|
2016
|
(A)
|
|||||||||||||||||||||||
|
Lyonerstrasse
|
Frankfurt
|
(3)
|
—
|
|
—
|
|
—
|
|
8,407
|
|
3,140
|
|
—
|
|
—
|
|
—
|
|
11,547
|
|
11,547
|
|
(3,568
|
)
|
2016
|
(A)
|
|||||||||||||||||||||||
|
Meridian Gate
|
London
|
(3)
|
—
|
|
—
|
|
—
|
|
5,893
|
|
692
|
|
—
|
|
—
|
|
—
|
|
6,585
|
|
6,585
|
|
(2,538
|
)
|
2016
|
(A)
|
|||||||||||||||||||||||
|
NE Corner of Campbell Road and Ferris Road
|
Dallas
|
—
|
|
21,902
|
|
—
|
|
—
|
|
795
|
|
—
|
|
22,685
|
|
—
|
|
12
|
|
22,697
|
|
—
|
|
2016
|
(C)
|
||||||||||||||||||||||||
|
9401 West Grand Avenue
|
Chicago
|
—
|
|
12,500
|
|
—
|
|
—
|
|
89,688
|
|
—
|
|
17,363
|
|
—
|
|
84,825
|
|
102,188
|
|
—
|
|
2016
|
(C)
|
||||||||||||||||||||||||
|
Broad Run Technology Park
|
N. Virginia
|
—
|
|
18,019
|
|
—
|
|
—
|
|
14,998
|
|
—
|
|
27,963
|
|
—
|
|
5,054
|
|
33,017
|
|
—
|
|
2016
|
(C)
|
||||||||||||||||||||||||
|
2425-2553 Edgington Street
|
Chicago
|
—
|
|
11,950
|
|
—
|
|
1,615
|
|
43
|
|
—
|
|
11,959
|
|
—
|
|
1,649
|
|
13,608
|
|
(99
|
)
|
2017
|
(C)
|
||||||||||||||||||||||||
|
44490 Chilum Place
|
N. Virginia
|
(4)
|
—
|
|
4,180
|
|
—
|
|
76,745
|
|
1,166
|
|
—
|
|
4,180
|
|
—
|
|
77,911
|
|
82,091
|
|
(6,086
|
)
|
2017
|
(A)
|
|||||||||||||||||||||||
|
44520 Hastings Drive
|
N. Virginia
|
(4)
|
104,000
|
|
6,140
|
|
—
|
|
108,105
|
|
1,050
|
|
—
|
|
6,140
|
|
—
|
|
109,155
|
|
115,295
|
|
(8,271
|
)
|
2017
|
(A)
|
|||||||||||||||||||||||
|
44480 Hastings Drive
|
N. Virginia
|
(4)
|
—
|
|
12,860
|
|
—
|
|
278,384
|
|
426
|
|
—
|
|
12,860
|
|
—
|
|
278,810
|
|
291,670
|
|
(21,536
|
)
|
2017
|
(A)
|
|||||||||||||||||||||||
|
44521 Hastings Drive
|
N. Virginia
|
(4)
|
—
|
|
13,210
|
|
—
|
|
315,539
|
|
307
|
|
—
|
|
13,210
|
|
—
|
|
315,846
|
|
329,056
|
|
(24,425
|
)
|
2017
|
(A)
|
|||||||||||||||||||||||
|
44461 Chilum Place
|
N. Virginia
|
(4)
|
—
|
|
9,620
|
|
—
|
|
249,371
|
|
282
|
|
—
|
|
9,620
|
|
—
|
|
249,653
|
|
259,273
|
|
(19,418
|
)
|
2017
|
(A)
|
|||||||||||||||||||||||
|
21625 Gresham Drive
|
N. Virginia
|
(4)
|
—
|
|
17,500
|
|
—
|
|
448,968
|
|
74
|
|
—
|
|
17,500
|
|
—
|
|
449,042
|
|
466,542
|
|
(35,066
|
)
|
2017
|
(A)
|
|||||||||||||||||||||||
|
21745 Sir Timothy Drive
|
N. Virginia
|
(4)
|
—
|
|
16,010
|
|
—
|
|
289,281
|
|
6,171
|
|
—
|
|
16,010
|
|
—
|
|
295,452
|
|
311,462
|
|
(17,418
|
)
|
2017
|
(A)
|
|||||||||||||||||||||||
|
21744 Sir Timothy Drive
|
N. Virginia
|
(4)
|
—
|
|
10,523
|
|
—
|
|
50,411
|
|
176,111
|
|
—
|
|
10,739
|
|
—
|
|
226,306
|
|
237,045
|
|
(4,924
|
)
|
2017
|
(A)
|
|||||||||||||||||||||||
|
2200 Busse Road
|
Chicago
|
(4)
|
—
|
|
17,270
|
|
—
|
|
384,558
|
|
1,251
|
|
—
|
|
17,270
|
|
—
|
|
385,809
|
|
403,079
|
|
(28,401
|
)
|
2017
|
(A)
|
|||||||||||||||||||||||
|
2299 Busse Road
|
Chicago
|
(4)
|
—
|
|
12,780
|
|
—
|
|
348,348
|
|
(1,701
|
)
|
—
|
|
12,780
|
|
—
|
|
346,647
|
|
359,427
|
|
(26,551
|
)
|
2017
|
(A)
|
|||||||||||||||||||||||
|
1780 Business Center Drive
|
N. Virginia
|
(4)
|
—
|
|
7,510
|
|
—
|
|
106,363
|
|
353
|
|
—
|
|
7,510
|
|
—
|
|
106,716
|
|
114,226
|
|
(7,275
|
)
|
2017
|
(A)
|
|||||||||||||||||||||||
|
8217 Linton Hall Road
|
N. Virginia
|
(4)
|
—
|
|
22,340
|
|
—
|
|
81,985
|
|
343
|
|
—
|
|
22,340
|
|
—
|
|
82,328
|
|
104,668
|
|
(5,266
|
)
|
2017
|
(A)
|
|||||||||||||||||||||||
|
1400 East Devon Avenue
|
Chicago
|
(4)
|
—
|
|
11,012
|
|
—
|
|
178,627
|
|
60,449
|
|
—
|
|
11,261
|
|
—
|
|
238,827
|
|
250,088
|
|
(6,732
|
)
|
2017
|
(A)
|
|||||||||||||||||||||||
|
2220 De La Cruz Blvd
|
Silicon Valley
|
(4)
|
—
|
|
84,650
|
|
—
|
|
634,007
|
|
2,038
|
|
—
|
|
84,650
|
|
—
|
|
636,045
|
|
720,695
|
|
(43,502
|
)
|
2017
|
(A)
|
|||||||||||||||||||||||
|
1 Century Place
|
Toronto
|
(4)
|
—
|
|
26,600
|
|
—
|
|
116,863
|
|
67,153
|
|
—
|
|
25,557
|
|
—
|
|
185,059
|
|
210,616
|
|
(1,001
|
)
|
2017
|
(C)
|
|||||||||||||||||||||||
|
505 North Railroad Avenue
|
Chicago
|
—
|
|
20,431
|
|
—
|
|
245,810
|
|
983
|
|
—
|
|
16,513
|
|
—
|
|
250,711
|
|
267,224
|
|
(6,441
|
)
|
2017
|
(A)
|
||||||||||||||||||||||||
185
DIGITAL REALTY TRUST, INC.
DIGITAL REALTY TRUST, L.P.
SCHEDULE III
PROPERTIES AND ACCUMULATED DEPRECIATION- (Continued)
December 31, 2018
(In thousands)
|
|
Metropolitan
Area |
Encumbrances
|
Initial costs
|
Costs capitalized
subsequent to acquisition |
Total costs
|
Accumulated
depreciation and amortization |
Date of
acquisition or construction |
Acquisition
(A) or construction (C) |
|||||||||||||||||||||||||||||||||||||||||
|
Land
|
Acquired
ground lease |
Buildings and
improvements |
Improvements
|
Carrying
costs |
Land
|
Acquired
ground lease |
Buildings and
improvements |
Total
|
|||||||||||||||||||||||||||||||||||||||||
|
250 Williams
|
Atlanta
|
—
|
|
—
|
|
—
|
|
—
|
|
24,088
|
|
—
|
|
—
|
|
—
|
|
24,088
|
|
24,088
|
|
(3,102
|
)
|
2017
|
(C)
|
||||||||||||||||||||||||
|
CME Agreement
|
Chicago
|
—
|
|
—
|
|
—
|
|
—
|
|
41,478
|
|
—
|
|
—
|
|
—
|
|
41,478
|
|
41,478
|
|
(14,659
|
)
|
2017
|
(C)
|
||||||||||||||||||||||||
|
Osaka 2
|
Osaka
|
—
|
|
13,593
|
|
—
|
|
—
|
|
104,994
|
|
—
|
|
15,489
|
|
—
|
|
103,098
|
|
118,587
|
|
—
|
|
2017
|
(C)
|
||||||||||||||||||||||||
|
Osaka 3
|
Osaka
|
—
|
|
4,713
|
|
—
|
|
—
|
|
249
|
|
—
|
|
4,962
|
|
—
|
|
—
|
|
4,962
|
|
—
|
|
2017
|
(C)
|
||||||||||||||||||||||||
|
De President II
|
Amsterdam
|
—
|
|
6,315
|
|
—
|
|
—
|
|
2,905
|
|
—
|
|
7,095
|
|
—
|
|
2,125
|
|
9,220
|
|
—
|
|
2017
|
(C)
|
||||||||||||||||||||||||
|
Development Property -- N. Virginia
|
N. Virginia
|
(4)
|
—
|
|
16,200
|
|
—
|
|
573
|
|
267
|
|
—
|
|
17,026
|
|
—
|
|
14
|
|
17,040
|
|
(2
|
)
|
2017
|
(C)
|
|||||||||||||||||||||||
|
Development Property -- Portland
|
Portland
|
(4)
|
—
|
|
11,672
|
|
—
|
|
5,924
|
|
8,798
|
|
—
|
|
12,179
|
|
—
|
|
14,215
|
|
26,394
|
|
(1
|
)
|
2017
|
(C)
|
|||||||||||||||||||||||
|
Development Property -- Phoenix
|
Phoenix
|
(4)
|
—
|
|
12,500
|
|
—
|
|
—
|
|
732
|
|
—
|
|
12,998
|
|
—
|
|
234
|
|
13,232
|
|
(1
|
)
|
2017
|
(C)
|
|||||||||||||||||||||||
|
330 E. Cermak Road
|
Chicago
|
—
|
|
25,248
|
|
—
|
|
—
|
|
(1
|
)
|
—
|
|
25,247
|
|
—
|
|
—
|
|
25,247
|
|
—
|
|
2017
|
(C)
|
||||||||||||||||||||||||
|
10000-10006 Godwin Drive
|
N. Virginia
|
—
|
|
17,308
|
|
—
|
|
—
|
|
2,990
|
|
—
|
|
18,239
|
|
—
|
|
2,059
|
|
20,298
|
|
—
|
|
2018
|
(C)
|
||||||||||||||||||||||||
|
2825-2845 Lafayette Street
|
Silicon Valley
|
—
|
|
56,000
|
|
—
|
|
2,941
|
|
60
|
|
—
|
|
56,000
|
|
—
|
|
3,001
|
|
59,001
|
|
(1,574
|
)
|
2018
|
(C)
|
||||||||||||||||||||||||
|
9905 Godwin Drive
|
N. Virginia
|
—
|
|
5,819
|
|
—
|
|
—
|
|
1,583
|
|
—
|
|
7,402
|
|
—
|
|
—
|
|
7,402
|
|
—
|
|
2018
|
(C)
|
||||||||||||||||||||||||
|
Pacific Boulevard and S. Sterling Boulevard
|
N. Virginia
|
—
|
|
27,139
|
|
—
|
|
—
|
|
1,073
|
|
—
|
|
28,145
|
|
—
|
|
67
|
|
28,212
|
|
—
|
|
2018
|
(C)
|
||||||||||||||||||||||||
|
160 Lockwood Road
|
Sydney
|
—
|
|
7,664
|
|
—
|
|
—
|
|
54
|
|
—
|
|
7,718
|
|
—
|
|
—
|
|
7,718
|
|
—
|
|
2018
|
(C)
|
||||||||||||||||||||||||
|
Western Lands
|
N. Virginia
|
—
|
|
238,141
|
|
—
|
|
—
|
|
1,694
|
|
—
|
|
239,835
|
|
—
|
|
—
|
|
239,835
|
|
—
|
|
2018
|
(C)
|
||||||||||||||||||||||||
|
Osaka 4
|
Osaka
|
—
|
|
4,633
|
|
—
|
|
—
|
|
140
|
|
—
|
|
4,773
|
|
—
|
|
—
|
|
4,773
|
|
—
|
|
2018
|
(C)
|
||||||||||||||||||||||||
|
Ascenty
|
Brazil
|
600,000
|
|
—
|
|
—
|
|
425,000
|
|
—
|
|
—
|
|
—
|
|
—
|
|
425,000
|
|
425,000
|
|
—
|
|
2018
|
(A)
|
||||||||||||||||||||||||
|
Other
|
—
|
|
|
8,298
|
|
—
|
|
61,236
|
|
—
|
|
—
|
|
—
|
|
69,534
|
|
69,534
|
|
(11,510
|
)
|
||||||||||||||||||||||||||||
|
$
|
705,777
|
|
$
|
1,476,672
|
|
$
|
13,509
|
|
$
|
9,424,451
|
|
$
|
7,925,253
|
|
$
|
—
|
|
$
|
1,509,764
|
|
$
|
10,575
|
|
$
|
17,319,546
|
|
$
|
18,839,885
|
|
$
|
(3,935,267
|
)
|
|||||||||||||||||
|
(1)
|
The balance shown excludes an unamortized premium of
$147
.
|
|
(2)
|
Represents properties acquired in the Telx Acquisition.
|
|
(3)
|
Represents properties acquired in the European Portfolio Acquisition.
|
|
(4)
|
Represents properties acquired in the DFT Merger.
|
186
DIGITAL REALTY TRUST, INC.
DIGITAL REALTY TRUST, L.P.
NOTES TO SCHEDULE III
PROPERTIES AND ACCUMULATED DEPRECIATION
December 31, 2018
(In thousands)
(1) Tax Cost
The aggregate gross cost of the Company’s properties for federal income tax purposes approximated
$19.4
billion (unaudited) as of
December 31, 2018
.
(2) Historical Cost and Accumulated Depreciation and Amortization
The following table reconciles the historical cost of the Company’s properties for financial reporting purposes for each of the years in the three-year period ended
December 31, 2018
.
|
|
Year Ended December 31,
|
||||||||||
|
2018
|
2017
|
2016
|
|||||||||
|
Balance, beginning of year
|
$
|
16,915,936
|
|
$
|
11,558,469
|
|
$
|
10,915,373
|
|
||
|
Additions during period (acquisitions and improvements)
|
2,008,032
|
|
5,663,404
|
|
760,051
|
|
|||||
|
Deductions during period (dispositions, impairments and assets held for sale)
|
(84,083
|
)
|
(305,937
|
)
|
(116,955
|
)
|
|||||
|
Balance, end of year
|
$
|
18,839,885
|
|
$
|
16,915,936
|
|
$
|
11,558,469
|
|
||
The following table reconciles accumulated depreciation and amortization of the Company’s properties for financial reporting purposes for each of the years in the three-year period ended
December 31, 2018
.
|
|
Year Ended December 31,
|
||||||||||
|
2018
|
2017
|
2016
|
|||||||||
|
Balance, beginning of year
|
$
|
3,238,227
|
|
$
|
2,668,509
|
|
$
|
2,251,268
|
|
||
|
Additions during period (depreciation and amortization expense)
|
714,336
|
|
612,970
|
|
461,506
|
|
|||||
|
Deductions during period (dispositions and assets held for sale)
|
(17,296
|
)
|
(43,252
|
)
|
(44,265
|
)
|
|||||
|
Balance, end of year
|
$
|
3,935,267
|
|
$
|
3,238,227
|
|
$
|
2,668,509
|
|
||
Schedules other than those listed above are omitted because they are not applicable or the information required is included in the consolidated financial statements or the notes thereto.
187
ITEM 9. CHANGES IN AND DISAGREEMENTS WITH ACCOUNTANTS ON ACCOUNTING AND FINANCIAL DISCLOSURE
None.
ITEM 9A. CONTROLS AND PROCEDURES
Our Management’s Reports on Internal Control over Financial Reporting for Digital Realty Trust, Inc. and Digital Realty Trust, L.P. are included in Part II, Item 8, Financial Statements and Supplementary Data on pages 88 and 89.
Evaluation of Disclosure Controls and Procedures (Digital Realty Trust, Inc.)
The Company maintains disclosure controls and procedures that are designed to ensure that information required to be disclosed in its reports filed under the Securities Exchange Act of 1934, as amended, is recorded, processed, summarized and reported within the time periods specified in the U.S. Securities and Exchange Commission’s rules and forms, and that such information is accumulated and communicated to its management, including its chief executive officer and chief financial officer, as appropriate, to allow timely decisions regarding required disclosure. In designing and evaluating the disclosure controls and procedures, the Company’s management recognizes that any controls and procedures, no matter how well designed and operated, can provide only reasonable assurance of achieving the desired control objectives, and its management is required to apply its judgment in evaluating the cost-benefit relationship of possible controls and procedures. Also, the Company has investments in certain unconsolidated entities, which are accounted for using the equity method of accounting. As the Company does not control or manage these entities, its disclosure controls and procedures with respect to such entities may be substantially more limited than those it maintains with respect to its consolidated subsidiaries.
As required by Rule 13a-15(b) or Rule 15d-15(b) of the Securities Exchange Act of 1934, as amended, management of the Company carried out an evaluation, under the supervision and with participation of its chief executive officer and chief financial officer, of the effectiveness of the design and operation of its disclosure controls and procedures that were in effect as of
December 31, 2018
. Based on the foregoing, the Company’s management concluded that its disclosure controls and procedures were effective at the reasonable assurance level.
Changes in Internal Control over Financial Reporting
There has not been any change in our internal control over financial reporting during the three months ended
December 31, 2018
, that has materially affected, or is reasonably likely to materially affect, our internal control over financial reporting.
Evaluation of Disclosure Controls and Procedures (Digital Realty Trust, L.P.)
The Operating Partnership maintains disclosure controls and procedures that are designed to ensure that information required to be disclosed in its reports filed under the Securities Exchange Act of 1934, as amended, is recorded, processed, summarized and reported within the time periods specified in the U.S. Securities and Exchange Commission’s rules and forms, and that such information is accumulated and communicated to its management, including the chief executive officer and chief financial officer of its general partner, as appropriate, to allow timely decisions regarding required disclosure. In designing and evaluating the disclosure controls and procedures, the Operating Partnership’s management recognizes that any controls and procedures, no matter how well designed and operated, can provide only reasonable assurance of achieving the desired control objectives, and its management is required to apply its judgment in evaluating the cost-benefit relationship of possible controls and procedures. Also, the Operating Partnership has investments in certain unconsolidated entities, which are accounted for using the equity method of accounting. As the Operating Partnership does not control or manage these entities, its disclosure controls and procedures with respect to such entities may be substantially more limited than those it maintains with respect to its consolidated subsidiaries.
As required by Rule 13a-15(b) or Rule 15d-15(b) of the Securities Exchange Act of 1934, as amended, management of the Operating Partnership carried out an evaluation, under the supervision and with participation of the chief executive officer and chief financial officer of its general partner, of the effectiveness of the design and operation of its disclosure controls and
188
procedures that were in effect as of
December 31, 2018
. Based on the foregoing, the Operating Partnership’s management concluded that its disclosure controls and procedures were effective at the reasonable assurance level.
Changes in Internal Control over Financial Reporting
There has not been any change in our internal control over financial reporting during the three months ended
December 31, 2018
, that has materially affected, or is reasonably likely to materially affect, our internal control over financial reporting.
ITEM 9B. OTHER INFORMATION
Amendment to Bylaws - Proxy Access
On and effective as of February 22, 2019, the board of directors of Digital Realty Trust, Inc. adopted the Eighth Amended and Restated Bylaws (the “Amended Bylaws”) to, among other things, update Article II “Meetings of Stockholders” to implement proxy access. Article II, Section 15 has been added to permit a stockholder or group of up to 20 stockholders owning at least 3% of the outstanding shares of the Company’s common stock for at least three years to nominate and include in the Company’s proxy materials for an annual meeting of stockholders, director candidates constituting up to 20% of the board of directors elected by the holders of the Company’s common stock, provided that the stockholder (or group) and each nominee satisfy the requirements specified in the Amended Bylaws.
The foregoing summary is qualified in its entirety by reference to the full text of the Amended Bylaws, a copy of which is attached as Exhibit 3.2 hereto and incorporated herein by reference.
Amendment to Corporate Governance Guidelines
Also on February 22, 2019, the Nominating and Corporate Governance Committee and the Board of Directors of Digital Realty Trust, Inc. amended the Company’s Corporate Governance Guidelines to clarify that the Nominating and Corporate Governance Committee shall ensure that it includes, and request that any search firm that it engages include, candidates with diversity of race, ethnicity and gender in the pool from which the Nominating and Corporate Governance Committee selects director candidates. The Company’s Corporate Governance Guidelines are available on our website.
189
PART III
ITEM 10. DIRECTORS, EXECUTIVE OFFICERS AND CORPORATE GOVERNANCE
The information concerning our directors, executive officers and corporate governance required by Item 10 will be included in the Proxy Statement to be filed relating to our
2019
Annual Meeting of Stockholders and is incorporated herein by reference.
We have filed, as exhibits to this Annual Report on Form 10-K, the certifications of our Chief Executive Officer and Chief Financial Officer required under Section 302 of the Sarbanes Oxley Act to be filed with the Securities and Exchange Commission regarding the quality of our public disclosure. We have furnished to the Securities and Exchange Commission as exhibits to this Annual Report on Form 10-K for the year ended
December 31, 2018
, the certifications of our Chief Executive Officer and Chief Financial Officer required under Section 906 of the Sarbanes Oxley Act. In addition, as required by Section 303A.12 of the NYSE Listed Company Manual, our Chief Executive Officer made his annual certification to the NYSE stating that he was not aware of any violation by the Company of the corporate governance listing standards of the NYSE.
ITEM 11. EXECUTIVE COMPENSATION
The information concerning our executive compensation required by Item 11 will be included in the Proxy Statement to be filed relating to our
2019
Annual Meeting of Stockholders and is incorporated herein by reference.
ITEM 12. SECURITY OWNERSHIP OF CERTAIN BENEFICIAL OWNERS AND MANAGEMENT AND RELATED STOCKHOLDER MATTERS
The information concerning the security ownership of certain beneficial owners and management and related stockholder matters (including equity compensation plan information) required by Item 12 will be included in the Proxy Statement to be filed relating to our
2019
Annual Meeting of Stockholders and is incorporated herein by reference.
ITEM 13. CERTAIN RELATIONSHIPS AND RELATED TRANSACTIONS AND DIRECTOR INDEPENDENCE
The information concerning certain relationships, related transactions and director independence required by Item 13 will be included in the Proxy Statement to be filed relating to our
2019
Annual Meeting of Stockholders and is incorporated herein by reference.
ITEM 14. PRINCIPAL ACCOUNTING FEES AND SERVICES
The information concerning our principal accounting fees and services required by Item 14 will be included in the Proxy Statement to be filed relating to our
2019
Annual Meeting of Stockholders and is incorporated herein by reference.
190
PART IV
ITEM 15. EXHIBITS.
|
Exhibit
Number
|
|
Description
|
|
3.1
|
|
|
|
3.2
|
||
|
3.3
|
|
|
|
3.4
|
|
|
|
4.1
|
|
|
|
4.2
|
|
|
|
4.3
|
|
|
|
4.4
|
|
|
|
4.5
|
|
|
|
4.6
|
|
|
|
4.7
|
|
|
|
4.8
|
|
|
|
4.9
|
|
|
191
|
4.10
|
|
|
|
4.11
|
|
|
|
4.12
|
|
|
|
4.13
|
||
|
4.14
|
||
|
4.15
|
||
|
4.16
|
||
|
4.17
|
||
|
4.18
|
||
|
4.19
|
||
|
4.20
|
||
192
|
4.21
|
||
|
4.22
|
||
|
4.23
|
||
|
4.24
|
||
|
4.25
|
||
|
4.26
|
||
|
4.27
|
||
|
4.28
|
||
|
10.1†
|
|
|
|
10.2
|
|
|
|
10.3†
|
|
|
|
10.4†
|
|
|
|
10.5†
|
|
|
193
|
10.6†
|
|
|
|
10.7†
|
|
|
|
10.8†
|
|
|
|
10.9†
|
|
|
|
10.10†
|
|
|
|
10.11†
|
|
|
|
10.12†
|
||
|
10.13
|
||
|
10.14
|
||
|
10.15
|
||
|
10.16
|
||
|
10.17
|
||
194
|
10.18
|
||
|
10.19†
|
||
|
10.20†
|
||
|
10.21†
|
||
|
10.22†
|
|
|
|
10.23†
|
||
|
10.24†
|
||
|
10.25†
|
|
|
|
10.26†
|
|
|
|
10.27†
|
|
|
|
10.28†
|
||
|
10.29†
|
|
|
|
10.30†
|
||
|
10.31†
|
||
|
10.32†
|
||
|
10.33†
|
||
|
10.34†
|
||
195
|
10.35†
|
||
|
10.36†
|
||
|
10.37†
|
|
|
|
10.38†
|
||
|
10.39†
|
||
|
10.40†
|
||
|
10.41†
|
||
|
10.42†
|
||
|
10.43†
|
||
|
10.44†
|
||
|
10.45†
|
||
|
10.46†
|
||
|
10.47†
|
||
|
10.48†
|
||
196
|
10.49*
|
||
|
10.50*
|
||
|
10.51
|
||
|
10.52*
|
||
|
10.53†
|
||
|
10.54#
|
||
|
10.55#
|
||
|
10.56#
|
||
197
|
21.1
|
|
|
|
21.2
|
|
|
|
23.1
|
|
|
|
31.1
|
|
|
|
31.2
|
|
|
|
31.3
|
|
|
|
31.4
|
|
|
|
32.1
|
|
|
|
32.2
|
|
|
|
32.3
|
|
|
|
32.4
|
|
|
|
101
|
|
The following financial statements from Digital Realty Trust, Inc.’s and Digital Realty Trust, L.P.’s Form 10-K for the year ended December 31, 2018, formatted in XBRL interactive data files: (i) Consolidated Balance Sheets as of December 31, 2018 and December 31, 2017; (ii) Consolidated Income Statements for each of the years in the three-year period ended December 31, 2018; (iii) Consolidated Statements of Equity and Comprehensive Income/Statements of Capital and Comprehensive Income for each of the years in the three-year period ended December 31, 2018; (iv) Consolidated Statements of Cash Flows for each of the years in the three-year period ended December 31, 2018; and (v) Notes to Consolidated Financial Statements.
|
|
†
|
Management contract or compensatory plan or arrangement.
|
|
*
|
Portions of this exhibit have been omitted pursuant to a grant of confidential treatment and have been filed separately with the Securities and Exchange Commission.
|
|
#
|
Portions of this exhibit (indicated by asterisks) have been omitted pursuant to a request for confidential treatment and this exhibit has been filed separately with the Securities and Exchange Commission
|
198
ITEM 16.
FORM 10-K SUMMARY
None.
199
SIGNATURES
Pursuant to the requirements of Section 13 or 15(d) of the Securities Exchange Act of 1934, the registrant has duly caused this report to be signed on its behalf by the undersigned, thereunto duly authorized.
|
D
IGITAL
R
EALTY
T
RUST
, I
NC
.
|
||
|
By:
|
|
/s/ A. WILLIAM STEIN
|
|
|
A. William Stein
Chief Executive Officer
|
|
|
Date: February 25, 2019
|
||
POWER OF ATTORNEY
KNOW ALL PERSONS BY THESE PRESENTS, that each person whose signature appears below constitutes and appoints A. William Stein, Andrew P. Power and Joshua A. Mills, and each of them, with full power to act without the other, such person’s true and lawful attorneys-in-fact and agents, with full power of substitution and resubstitution, for him or her and in his or her name, place and stead, in any and all capacities, to sign this Form 10-K and any and all amendments thereto, and to file the same, with exhibits and schedules thereto, and other documents in connection therewith, with the Securities and Exchange Commission, granting unto said attorneys-in-fact and agents, and each of them, full power and authority to do and perform each and every act and thing necessary or desirable to be done in and about the premises, as fully to all intents and purposes as he or she might or could do in person, hereby ratifying and confirming all that said attorneys-in-fact and agents, or any of them, or their or his or her substitute or substitutes, may lawfully do or cause to be done by virtue hereof.
Pursuant to the requirements of the Securities Exchange Act of 1934, this report has been signed below by the following persons on behalf of the registrant and in the capacities and on the dates indicated.
|
Signature
|
|
Title
|
|
Date
|
|
/
S
/ L
AURENCE
A. C
HAPMAN
|
|
Chairman of the Board
|
|
February 25, 2019
|
|
Laurence A. Chapman
|
||||
|
/
S
/ A. W
ILLIAM
S
TEIN
|
|
Chief Executive Officer and Director
(Principal Executive Officer)
|
|
February 25, 2019
|
|
A. William Stein
|
||||
|
/S/
A
NDREW
P
.
P
OWER
|
|
Chief Financial Officer
(Principal Financial Officer)
|
|
February 25, 2019
|
|
Andrew P. Power
|
||||
|
/
S
/ E
DWARD
F. S
HAM
|
|
Chief Accounting Officer
(Principal Accounting Officer)
|
|
February 25, 2019
|
|
Edward F. Sham
|
||||
|
/
S
/ M
ICHAEL
A. C
OKE
|
|
Director
|
|
February 25, 2019
|
|
Michael A. Coke
|
||||
200
|
Signature
|
|
Title
|
|
Date
|
|
/
S
/ K
EVIN
J. K
ENNEDY
|
|
Director
|
|
February 25, 2019
|
|
Kevin J. Kennedy
|
||||
|
/
S
/ W
ILLIAM
G. L
A
P
ERCH
|
|
Director
|
|
February 25, 2019
|
|
William G. LaPerch
|
||||
|
/s/ A
FSHIN
M
OHEBBI
|
|
Director
|
|
February 25, 2019
|
|
Afshin Mohebbi
|
||||
|
/s/ M
ARK
R. P
ATTERSON
|
|
Director
|
|
February 25, 2019
|
|
Mark R. Patterson
|
||||
|
/s/ M
ARY
H
OGAN
P
REUSSE
|
|
Director
|
|
February 25, 2019
|
|
Mary Hogan Preusse
|
||||
|
/s/ J
OHN
T. R
OBERTS
,
JR
.
|
Director
|
|
February 25, 2019
|
|
|
John T. Roberts, Jr.
|
||||
|
/s/ D
ENNIS
E. S
INGLETON
|
Director
|
February 25, 2019
|
||
|
Dennis E. Singleton
|
||||
201
SIGNATURES
Pursuant to the requirements of Section 13 or 15(d) of the Securities Exchange Act of 1934, the registrant has duly caused this report to be signed on its behalf by the undersigned, thereunto duly authorized.
|
D
IGITAL
R
EALTY
T
RUST
, L.P.
|
||
|
By:
|
|
Digital Realty Trust, Inc.,
Its General Partner
|
|
By:
|
|
/s/ A. WILLIAM STEIN
|
|
|
A. William Stein
Chief Executive Officer
|
|
|
Date: February 25, 2019
|
||
POWER OF ATTORNEY
KNOW ALL PERSONS BY THESE PRESENTS, that each person whose signature appears below constitutes and appoints A. William Stein, Andrew P. Power and Joshua A. Mills, and each of them, with full power to act without the other, such person’s true and lawful attorneys-in-fact and agents, with full power of substitution and resubstitution, for him or her and in his or her name, place and stead, in any and all capacities, to sign this Form 10-K and any and all amendments thereto, and to file the same, with exhibits and schedules thereto, and other documents in connection therewith, with the Securities and Exchange Commission, granting unto said attorneys-in-fact and agents, and each of them, full power and authority to do and perform each and every act and thing necessary or desirable to be done in and about the premises, as fully to all intents and purposes as he or she might or could do in person, hereby ratifying and confirming all that said attorneys-in-fact and agents, or any of them, or their or his or her substitute or substitutes, may lawfully do or cause to be done by virtue hereof.
Pursuant to the requirements of the Securities Exchange Act of 1934, this report has been signed below by the following persons on behalf of the registrant and in the capacities and on the dates indicated.
|
Signature
|
|
Title
|
|
Date
|
|
/S/
L
AURENCE
A
.
C
HAPMAN
|
|
Chairman of the Board
|
|
February 25, 2019
|
|
Laurence A. Chapman
|
||||
|
/
S
/ A. W
ILLIAM
S
TEIN
|
|
Chief Executive Officer and Director
(Principal Executive Officer)
|
|
February 25, 2019
|
|
A. William Stein
|
||||
|
/S/
A
NDREW
P
.
P
OWER
|
|
Chief Financial Officer
(Principal Financial Officer)
|
|
February 25, 2019
|
|
Andrew P. Power
|
||||
|
/S/
E
DWARD
F
.
S
HAM
|
|
Chief Accounting Officer
(Principal Accounting Officer)
|
|
February 25, 2019
|
|
Edward F. Sham
|
||||
202
|
Signature
|
|
Title
|
|
Date
|
|
/
S
/ M
ICHAEL
A. C
OKE
|
|
Director
|
|
February 25, 2019
|
|
Michael A. Coke
|
||||
|
/
S
/ K
EVIN
J. K
ENNEDY
|
|
Director
|
|
February 25, 2019
|
|
Kevin J. Kennedy
|
||||
|
/
S
/ W
ILLIAM
G. L
A
P
ERCH
|
|
Director
|
|
February 25, 2019
|
|
William G. LaPerch
|
||||
|
/s/ A
FSHIN
M
OHEBBI
|
|
Director
|
|
February 25, 2019
|
|
Afshin Mohebbi
|
||||
|
/s/ M
ARK
R. P
ATTERSON
|
|
Director
|
|
February 25, 2019
|
|
Mark R. Patterson
|
||||
|
/s/ M
ARY
H
OGAN
P
REUSSE
|
|
Director
|
|
February 25, 2019
|
|
Mary Hogan Preusse
|
||||
|
/s/ J
OHN
T. R
OBERTS
,
JR
.
|
Director
|
February 25, 2019
|
||
|
John T. Roberts, Jr.
|
||||
|
/s/ D
ENNIS
E. S
INGLETON
|
Director
|
February 25, 2019
|
||
|
Dennis E. Singleton
|
||||
203
TABLE OF CONTENTS
Part IItem 1. BusinessItem 1A. Risk FactorsItem 1B. Unresolved Staff CommentsItem 2. PropertiesItem 3. Legal ProceedingsItem 4. Mine Safety DisclosuresPart IIItem 5. Market For Registrant S Common Equity, Related Stockholder Matters and Issuer Purchases Of Equity SecuritiesItem 6. Selected Financial DataItem 7. Management S Discussion and Analysis Of Financial Condition and Results Of OperationsItem 7A. Quantitative and Qualitative Disclosures About Market RiskItem 8. Financial Statements and Supplementary DataItem 9. Changes in and Disagreements with Accountants on Accounting and Financial DisclosureItem 9A. Controls and ProceduresItem 9B. Other InformationPart IIIItem 10. Directors, Executive Officers and Corporate GovernanceItem 11. Executive CompensationItem 12. Security Ownership Of Certain Beneficial Owners and Management and Related Stockholder MattersItem 13. Certain Relationships and Related Transactions and Director IndependenceItem 14. Principal Accounting Fees and ServicesPart IVItem 15. ExhibitsItem 16. Form 10-k Summary