PHYSICIANS REALTY TRUST
UNITED STATES
SECURITIES AND EXCHANGE COMMISSION
WASHINGTON, D.C. 20541
FORM 10-K
ý
ANNUAL REPORT UNDER SECTION 13 OR 15(d) OF THE SECURITIES EXCHANGE ACT OF 1934
For the fiscal year ended
December 31, 2016
o
TRANSITION REPORT UNDER SECTION 13 OR 15(d) OF THE SECURITIES EXCHANGE ACT OF 1934
For the transition period from to
Commission file number: 001-36007 (Physicians Realty Trust)
Commission file number: 333-205034-01 (Physicians Realty L.P.)
PHYSICIANS REALTY TRUST
PHYSICIANS REALTY L.P.
(Exact Name of Registrant as Specified in Its Charter)
|
Maryland (Physicians Realty Trust)
Delaware (Physicians Realty L.P.)
|
46-2519850
80-0941870
|
|
|
(State or Other Jurisdiction
of Incorporation or Organization)
|
(I.R.S. Employer
Identification No.)
|
|
|
|
|
|
|
309 N. Water Street
Suite 500
Milwaukee, Wisconsin
|
|
53202
|
|
(Address of Principal Executive Offices)
|
|
(Zip Code)
|
(414) 367-5600
(Registrant’s telephone number, including area code)
Securities registered under Section 12(b) of the Act:
|
Registrant
|
Title of Each Class
|
|
Name of Each Exchange On Which Registered
|
|
|
Physicians Realty Trust
|
Common Shares, $0.01 par value
|
|
New York Stock Exchange
|
|
Securities registered under Section 12(g) of the Act:
None
Indicate by check mark if the registrant is a well-known seasoned issuer, as defined in Rule 405 of the Securities Act.
Physicians Realty Trust Yes
ý
No
o
Physicians Realty L.P. Yes
o
No
ý
Indicate by check mark if the registrant is not required to file reports pursuant to Section 13 or Section 15(d) of the Act.
Physicians Realty Trust Yes
o
No
ý
Physicians Realty L.P. Yes
o
No
ý
Indicate by check mark whether the registrant (1) has filed all reports required to be filed by Section 13 or 15(d) of the Securities Exchange Act of 1934 during the preceding 12 months (or for such shorter period that the registrant was required to file such reports), and (2) has been subject to such filing requirements for the past 90 days.
Physicians Realty Trust Yes
ý
No
o
Physicians Realty L.P. Yes
o
No
ý
Indicate by check mark whether the registrant has submitted electronically and posted on its corporate Web site, if any, every Interactive Data File required to be submitted and posted pursuant to Rule 405 of Regulation S-T (§ 232.405 of this chapter) during the preceding 12 months (or for such shorter period that the registrant was required to submit and post such files).
Physicians Realty Trust Yes
ý
No
o
Physicians Realty L.P. Yes
ý
No
o
Indicate by check mark if disclosure of delinquent filers pursuant to Item 405 of Regulation S-K (§ 229.405 of this chapter) is not contained herein, and will not be contained, to the best of registrant’s knowledge, in definitive proxy or information statements incorporated by reference in Part III of this Form 10-K or any amendment to this Form 10-K.
o
Indicate by check mark whether the registrant is a large accelerated filer, an accelerated filer, a non-accelerated filer or a smaller reporting company. See definitions of large accelerated filer, accelerated filer and smaller reporting company in Rule 12b-2 of the Exchange Act. (Check one):
Physicians Realty Trust Large accelerated filer
ý
Accelerated filer
o
Non-accelerated filer
o
Smaller reporting company
o
(Do not check if a smaller reporting company)
Physicians Realty L.P. Large accelerated filer
o
Accelerated filer
o
Non-accelerated filer
ý
Smaller reporting company
o
(Do not check if a smaller reporting company)
Indicate by check mark whether the registrant is a shell company (as defined in Rule 12b-2 of the Act).
Physicians Realty Trust Yes
o
No
ý
Physicians Realty L.P. Yes
o
No
ý
The aggregate market value of Physicians Realty Trust’s common shares held by non-affiliates as of June 30,
2016
was approximately
$2,777,149,577
based upon the closing price reported for such date on the New York Stock Exchange. There is no established trading market for units of Physicians Realty L.P.
As of
February 17, 2017
, there were
135,999,067
shares of Physicians Realty Trust’s common shares outstanding.
DOCUMENTS INCORPORATED BY REFERENCE
The information required by Part III of this Annual Report on Form 10-K, to the extent not set forth in this Form 10-K, is incorporated herein by reference from Physicians Realty Trust’s definitive proxy statement relating to the annual meeting of shareholders to be held on
May 3, 2017
, to be filed with the Securities and Exchange Commission within 120 days after the end of the Registrant’s fiscal year ended
December 31, 2016
.
EXPLANATORY NOTE
This Annual Report on Form 10-K combines the Annual Reports on Form 10-K for the year ended December 31, 2016 of Physicians Realty Trust (the “Trust”), a Maryland real estate investment trust, and Physicians Realty L.P. (the “Operating Partnership”), a Delaware limited partnership. Unless otherwise indicated or unless the context requires otherwise, all references in this report to “we,” “us,” “our,” “our company,” the “Company,” and “Physicians Realty” refer to the Trust, together with its consolidated subsidiaries, including the Operating Partnership, and the historical business and operations of four healthcare real estate private equity funds, organized as limited liability companies under the laws of Delaware, managed by B.C. Ziegler & Company, that we have classified for accounting purposes as our “Predecessor” and which we sometimes refer to as the “Ziegler Funds,” and references to the “Operating Partnership” mean collectively the Operating Partnership together with its consolidated subsidiaries. In this report, all references to “common shares” refer to the common shares of the Trust and references to “our shareholders” refer to shareholders of the common shares of the Trust, the term “OP Units” refers to partnership interests of the Operating Partnership and the term “Series A Preferred Units” refers to Series A Participating
Redeemable Preferred Units of the Operating Partnership. As of February 17, 2017, no Series A Preferred Units are outstanding.
The Trust is a self-managed real estate investment trust (“REIT”) formed primarily to acquire, selectively develop, own, and manage healthcare properties that are leased to physicians, hospitals, and healthcare delivery systems. The Trust’s operations are conducted through the Operating Partnership and wholly-owned and majority-owned subsidiaries of the Operating Partnership. The Trust, as the general partner of the Operating Partnership, controls the Operating Partnership and consolidates the assets, liabilities, and results of operations of the Operating Partnership.
The Trust conducts substantially all of its operations through the Operating Partnership. As of December 31, 2016, the Trust held a
97.5%
interest in the Operating Partnership and owns no Series A Preferred Units. Apart from this ownership interest, the Trust has no independent operations.
Noncontrolling interests in the Operating Partnership, shareholders’ equity of the Trust and partners’ capital of the Operating Partnership are the primary areas of difference between the consolidated financial statements of the Trust and those of the Operating Partnership. OP Units not owned by the Trust are accounted for as limited partners’ capital in the Operating Partnership’s consolidated financial statements and as noncontrolling interests in the Trust’s consolidated financial statements. The differences between the Trust’s shareholders’ equity and the Operating Partnership’s partners’ capital are due to the differences in the equity issued by the Trust and the Operating Partnership, respectively.
The Company believes combining the Annual Reports of the Trust and the Operating Partnership, including the notes to the consolidated financial statements, into this single report results in the following benefits:
|
•
|
a combined report enhances investors’ understanding of the Trust and the Operating Partnership by enabling investors to view the business as a whole in the same manner as management views and operates the business;
|
|
•
|
a combined report eliminates duplicative disclosure and provides a more streamlined and readable presentation, as a substantial portion of the Company’s disclosure applies to both the Trust and the Operating Partnership; and
|
|
•
|
a combined report creates time and cost efficiencies through the preparation of one combined report instead of two separate reports.
|
To help investors understand the significant differences between the Trust and the Operating Partnership, this report presents the following separate sections for each of the Trust and the Operating Partnership:
|
•
|
the market for registrant’s common equity, related stockholder matters and issuer purchases of equity securities in Item 5 of this report;
|
|
•
|
selected financial data in Item 6 of this report;
|
|
•
|
the consolidated financial statements in Item 8 and Item 15 of this report;
|
|
•
|
certain accompanying notes to the consolidated financial statements, including
Note 3 (Acquisitions and Dispositions)
,
Note 14 (Earnings Per Share and Earnings Per Unit)
and
Note 16 (Quarterly Data)
;
|
|
•
|
controls and procedures in Item 9A of this report; and
|
|
•
|
the certifications of the Chief Executive Officer and the Chief Financial Officer included as Exhibits 31 and 32 to this report.
|
Included in this report are each of the Company’s and the Operating Partnership’s audited consolidated financial statements for the fiscal years ended December 31, 2016 and 2015 and selected, unaudited quarterly financial information of the Operating Partnership for 2016 and 2015. The Operating Partnership is filing its unaudited quarterly financial data for the
quarterly periods ended September 30, 2016, June 30, 2016, March 31, 2016, September 30, 2015, June 30, 2015 and March 31, 2015 in connection with the Operating Partnership becoming current in its filing obligations under the Securities Exchange Act of 1934, as amended (the “Exchange Act”). In addition, the Operating Partnership intends to file an Annual Report on Form 10-K for the fiscal years ended December 31, 2014, 2013 and 2012 as soon as practicable.
PHYSICIANS REALTY TRUST AND PHYSICIANS REALTY L.P.
Annual Report on Form 10-K for the Year Ended
December 31, 2016
Table of Contents
|
|
Page
|
|
|
|
|
|
|
|
|
|
|
|
|
|
|
|
|
|
|
|
|
|
|
|
|
|
|
|
|
|
|
|
|
|
|
|
|
|
|
|
|
|
|
|
|
|
|
|
|
|
|
|
|
|
|
|
|
|
|
|
|
|
|
|
|
|
|
|
|
|
Forward-Looking Statements
CAUTIONARY STATEMENT REGARDING FORWARD-LOOKING STATEMENTS
This Annual Report on Form 10-K contains forward-looking statements made pursuant to safe harbor provisions of the Private Securities Litigation Reform Act of 1995. All statements other than statements of historical facts may be forward-looking statements within the meaning of the federal securities laws. In particular, statements pertaining to our capital resources, property performance and results of operations contain forward-looking statements. Likewise, all of our statements regarding anticipated growth in our funds from operations and anticipated market conditions, demographics and results of operations are forward-looking statements. You can identify forward-looking statements by the use of forward-looking terminology such as “believes,” “expects,” “may,” “will,” “should,” “seeks,” “approximately,” “intends,” “plans,” “pro forma,” “estimates” or “anticipates” or the negative of these words and phrases or similar words or phrases which are predictions of or indicate future events or trends and which do not relate solely to historical matters. You can also identify forward-looking statements by discussions of strategy, plans, expectations or intentions.
These forward-looking statements reflect the views of our management regarding current expectations and projections about future events and are based on currently available information. These forward-looking statements are not guarantees of future performance and involve numerous risks and uncertainties and you should not rely on them as predictions of future events. Forward-looking statements depend on assumptions, data or methods which may be incorrect or imprecise and we may not be able to realize them. We do not guarantee that the transactions and events described will happen as described (or that they will happen at all). The following factors, among others, could cause actual results and future events to differ materially from those set forth or contemplated in the forward-looking statements:
|
•
|
general economic conditions;
|
|
•
|
adverse economic or real estate developments, either nationally or in the markets where our properties are located;
|
|
•
|
our failure to generate sufficient cash flows to service our outstanding indebtedness, or our ability to pay down or refinance our indebtedness;
|
|
•
|
fluctuations in interest rates and increased operating costs;
|
|
•
|
the availability, terms and deployment of debt and equity capital, including our unsecured revolving credit facility;
|
|
•
|
our ability to make distributions on our common shares;
|
|
•
|
general volatility of the market price of our common shares;
|
|
•
|
our increased vulnerability economically due to the concentration of our investments in healthcare properties;
|
|
•
|
our geographic concentration in Texas causes us to be particularly exposed to downturns in the Texas economy or other changes in Texas market conditions;
|
|
•
|
changes in our business or strategy;
|
|
•
|
our dependence upon key personnel whose continued service is not guaranteed;
|
|
•
|
our ability to identify, hire and retain highly qualified personnel in the future;
|
|
•
|
the degree and nature of our competition;
|
|
•
|
changes in governmental regulations, tax rates and similar matters;
|
|
•
|
defaults on or non-renewal of leases by tenants;
|
|
•
|
decreased rental rates or increased vacancy rates;
|
|
•
|
difficulties in identifying healthcare properties to acquire and completing acquisitions;
|
2
|
•
|
competition for investment opportunities;
|
|
•
|
any adverse effects to Catholic Health Initiatives’ (“CHI”) business, financial position or results of operations that impact the ability of affiliates of CHI to pay us rent;
|
|
•
|
the impact of our investment in joint ventures;
|
|
•
|
the financial condition and liquidity of, or disputes with, any joint venture and development partners with whom we may make co-investments in the future;
|
|
•
|
cybersecurity incidents could disrupt our business and result in the compromise of confidential information;
|
|
•
|
our ability to operate as a public company;
|
|
•
|
changes in accounting principles generally accepted in the United States (GAAP);
|
|
•
|
lack of or insufficient amounts of insurance;
|
|
•
|
other factors affecting the real estate industry generally;
|
|
•
|
our failure to maintain our qualification as a real estate investment trust (or REIT) for U.S. federal income tax purposes;
|
|
•
|
limitations imposed on our business and our ability to satisfy complex rules in order for us to qualify as a REIT for U.S. federal income tax purposes;
|
|
•
|
changes in governmental regulations or interpretations thereof, such as real estate and zoning laws and increases in real property tax rates and taxation of REITs; and
|
|
•
|
factors that may materially adversely affect us, or the per share trading price of our common shares, including:
|
|
•
|
higher market interest rates;
|
|
•
|
the number of our common shares available for future issuance or sale;
|
|
•
|
our issuance of equity securities or the perception that such issuance might occur;
|
|
•
|
future debt;
|
|
•
|
failure of securities analysts to publish research or reports about us or our industry; and
|
|
•
|
securities analysts’ downgrade of our common shares or the healthcare-related real estate sector.
|
While forward-looking statements reflect our good faith beliefs, they are not guarantees of future performance. We disclaim any obligation to publicly update or revise any forward-looking statement to reflect changes in underlying assumptions or factors, new information, data or methods, future events or other changes after the date of this report, except as required by applicable law. You should not place undue reliance on any forward-looking statements that are based on information currently available to us or the third parties making the forward-looking statements. For a further discussion of these and other factors that could impact our future results, performance or transactions, see “Part I, Item 1A. Risk Factors” of this report.
3
Overview
Physicians Realty Trust (the “Trust”), a Maryland real estate investment trust, and Physicians Realty L.P. (the “Operating Partnership”), a Delaware limited partnership, were organized in April 2013 to acquire, selectively develop, own and manage healthcare properties that are leased to physicians, hospitals and healthcare delivery systems. Unless otherwise indicated or unless the context requires otherwise, all references in this report to “we,” “us,” “our,” “our company,” the “Company,” and “Physicians Realty” refer to the Trust, together with its consolidated subsidiaries, including the Operating Partnership, and the Ziegler Funds, and references to the “Operating Partnership” mean collectively the Operating Partnership together with its consolidated subsidiaries. We completed our initial public offering (“IPO”) in July 2013. The Trust’s common shares are listed on the NYSE and it is included in the MSCI US REIT Index.
We have grown our portfolio of gross real estate investments from approximately $124 million at the time of our IPO to approximately
$2.9 billion
as of
December 31, 2016
. As of
December 31, 2016
, our portfolio consisted of
246
properties located in
29
states with approximately
10,883,601
net leasable square feet, which were approximately
96.1%
leased with a weighted average remaining lease term of approximately
8.5
years and approximately
78.4%
of the net leasable square footage of our portfolio was either affiliated with a healthcare delivery system or located within approximately 1/4 mile of a hospital campus.
We receive a cash rental stream from healthcare providers under our leases. Approximately
87.5%
of the annualized base rent payments from our properties as of
December 31, 2016
are from triple net leases, pursuant to which the tenants are responsible for all operating expenses relating to the property, including but not limited to real estate taxes, utilities, property insurance, routine maintenance and repairs, and property management. This structure helps insulate us from increases in certain operating expenses and provides relatively predictable cash flow. We seek to structure our triple net leases to generate attractive returns on a long-term basis. Our leases typically have initial terms of five to 15 years and include annual rent escalators of approximately
1.5%
to
3.0%
. Our operating results depend significantly upon the ability of our tenants to make required rental payments. We believe that our portfolio of medical office buildings and other healthcare facilities will enable us to generate stable cash flows over time because of the diversity of our tenants, staggered lease expiration schedule, long-term leases, and low historical occurrence of tenants defaulting under their leases. As of
December 31, 2016
, leases representing a percentage of our portfolio on the basis of leasable square feet will expire as follows:
|
Year (1)
|
Portfolio Lease Expirations
|
|
|
MTM (2)
|
0.8%
|
|
|
2017
|
3.7%
|
|
|
2018
|
4.5%
|
|
|
2019
|
4.5%
|
|
|
2020
|
3.8%
|
|
|
2021
|
5.1%
|
|
|
2022
|
3.9%
|
|
|
2023
|
4.4%
|
|
|
2024
|
7.2%
|
|
|
2025
|
7.8%
|
|
|
2026
|
27.7%
|
|
|
Thereafter
|
22.7%
|
|
|
Total
|
96.1%
|
|
|
(1)
|
“MTM” means month-to-month.
|
|
(2)
|
Includes
3
leases which expired on
December 31, 2016
, representing
0.1%
of portfolio leasable square feet.
|
We invest in real estate that is integral to providing high quality healthcare services. Our properties are typically located on a campus with a hospital or other healthcare facilities or strategically located and affiliated with a hospital or other healthcare system. We believe the impact of government programs and continuing trends in the healthcare industry create attractive opportunities for us to invest in healthcare-related real estate. Our management team has significant public healthcare REIT experience and has long established relationships with physicians, hospitals and healthcare delivery system decision makers that we believe will provide quality investment and growth opportunities. Our principal investments include medical
4
office buildings, outpatient treatment facilities, and other real estate integral to health care providers. We seek to invest in stabilized medical facility assets with initial cash yields of
6.0%
to
9.0%
.
We had no business operations prior to completion of the IPO and the related formation transactions on July 24, 2013. Our Predecessor, which is not a legal entity, is comprised of the four healthcare real estate private equity funds, organized as limited liability companies under the laws of Delaware, managed by B.C. Ziegler & Company, which we refer to as the Ziegler Funds, that owned directly or indirectly interests in entities that owned our initial properties we acquired on July 24, 2013 in connection with completion of our IPO and related formation transactions.
The Trust is a Maryland real estate investment trust and has elected to be taxed as a REIT for U.S. federal income tax purposes. We conduct our business through an umbrella partnership REIT structure in which our properties are owned by the Operating Partnership directly or through limited partnerships, limited liability companies or other subsidiaries. The Trust is the sole general partner of the Operating Partnership and, as of
February 17, 2017
, owned approximately
97.7%
of the partnership interests in the Operating Partnership (“OP Units”).
Our Objectives and Growth Strategy
Overview
Our principal business objective is to provide attractive risk-adjusted returns to our shareholders through a combination of (i) sustainable and increasing rental revenue and cash flow that generate reliable, increasing dividends, and (ii) potential long-term appreciation in the value of our properties and common shares. Our primary strategies to achieve our business objective are to leverage our physician and hospital relationships nationwide to invest in off-market assets that maximize risk-adjusted returns to our shareholders, to invest in, own and manage a diversified portfolio of high quality healthcare properties, and to pay careful attention to our tenants’ real estate strategies, which we believe will drive high retention, high occupancy and reliable, increasing rental revenue and cash flow.
We intend to grow our portfolio of high-quality healthcare properties leased to physicians, hospitals, healthcare delivery systems and other healthcare providers primarily through acquisitions of existing healthcare facilities that provide stable revenue growth and predictable long-term cash flows. We may also selectively finance the development of new healthcare facilities through joint venture or fee arrangements with premier healthcare real estate developers. Generally, we only expect to make investments in new development properties when approximately 70% or more of the development property has been pre-leased before construction commences. We seek to invest in properties where we can develop strategic alliances with financially sound healthcare providers and healthcare delivery systems that offer need-based healthcare services in sustainable healthcare markets. We focus our investment activity on the following types of healthcare properties:
|
•
|
medical office buildings;
|
|
•
|
outpatient treatment and diagnostic facilities;
|
|
•
|
physician group practice clinics;
|
|
•
|
ambulatory surgery centers; and
|
|
•
|
specialty hospitals and treatment centers.
|
We believe that shifting consumer preferences, limited space in hospitals, the desire of patients and healthcare providers to limit non-essential services provided in a hospital setting, and cost considerations, among other trends, continue to drive the industry trend of performing procedures in outpatient facilities that have traditionally been performed in hospitals, such as surgeries and other invasive medical procedures. As these trends continue, we believe that demand for medical office buildings and similar healthcare properties will continue to rise, and that our investment strategy accounts for these trends.
We may invest opportunistically in life science facilities, assisted living, and independent senior living facilities and in the longer term, senior housing properties, including skilled nursing. Consistent with the Trust’s qualification as a REIT, we may also opportunistically invest in companies that provide healthcare services, and in joint venture entities with operating partners structured to comply with the REIT Investment Diversification Act of 2007 (“RIDEA”).
In connection with our review and consideration of healthcare real estate investment opportunities, we generally take into account a variety of market considerations, including:
|
•
|
whether the property is anchored by a financially-sound healthcare delivery system or whether tenants have strong affiliation to a healthcare delivery system;
|
|
•
|
the performance of the local healthcare delivery system and its future prospects;
|
5
|
•
|
property location, with a particular emphasis on proximity to healthcare delivery systems;
|
|
•
|
demand for medical office buildings and healthcare related facilities, current and future supply of competing properties, and occupancy and rental rates in the market;
|
|
•
|
population density and growth potential;
|
|
•
|
ability to achieve economies of scale with our existing medical office buildings and healthcare related facilities or anticipated investment opportunities; and
|
|
•
|
existing and potential competition from other healthcare real estate owners and operators.
|
In addition, our management team has maintained a conservative balance sheet while investing over $2.8 billion in real estate assets since our IPO in July 2013. We selectively utilize capital market transactions, including raising over $750 million of equity through two follow-on offerings in 2016, in furtherance of our investment strategy.
Business Strategy
We are focused on building and maintaining a portfolio of high-quality healthcare properties leased to physicians, hospitals, healthcare delivery systems and other healthcare providers. Our investment strategy includes a focus on investments with the following key attributes:
|
•
|
We seek to invest in properties serving healthcare systems with dominant market share, high credit quality and those who are investing capital into their campuses. In particular, we seek to own off-market or selectively marketed assets with attractive demographics, economic growth, and high barriers to entry. We seek to invest in and maintain well occupied properties that we believe are critical to the delivery of healthcare.
|
|
•
|
We emphasize ensuring an appropriate and balanced mix of tenants to provide synergies within both individual buildings and the broader health system campus. Our primary tenants are healthcare systems, academic medical centers and leading physician groups. These groups typically have strong and stable financial performance. We believe this helps ensure stability in our rental income and tenant retention over time.
|
|
•
|
We seek to maintain a core, critical portfolio of properties and to build our reputation as a dedicated leading MOB owner and operator.
|
|
•
|
We seek to maintain or increase our average rental rates, and focus on actively leasing our vacant space and reducing leasing concessions.
|
In addition, we seek to invest in properties where we can develop strategic alliances with financially sound healthcare providers and healthcare delivery systems that offer need-based healthcare services in sustainable healthcare markets. We consider long-term relationship building when assessing acquisition potential. These relationships are cultivated by our senior management team, with key industry participants, including health systems and local and regional developers, which have traditionally provided us with valuable sources of potential investment opportunities.
Finally, we actively manage our balance sheet to maintain our investment grade credit rating, to maintain an appropriate level of leverage and to preserve financing flexibility for funding of future acquisitions. In particular, we:
|
•
|
Continue to maintain a high level of liquidity, including borrowing availability under our unsecured revolving credit facility.
|
|
•
|
Maintain access to multiple sources of capital, including private debt issuances and public equity offerings, unsecured bank loans and secured property level debt.
|
|
•
|
Closely monitor our existing debt maturities and average interest rates.
|
6
2016
Highlights and Other Recent Developments
Investments and Dispositions
|
•
|
For the full year
2016
, we completed acquisitions of
95
operating healthcare properties (including 5 condominium units and the CHI Portfolio) and 1 land parcel, located in
23
states for an aggregate purchase price of approximately
$1.27 billion
. In addition, we funded
$14.2 million
of other investments, including the issuance of loans, the acquisition of an equity interest in a joint venture, and buyouts of noncontrolling interests, resulting in total investments of
$1.29 billion
.
|
|
•
|
During 2016, we entered into separate agreements to purchase 52 medical office facilities (which we now treat as 53 medical office facilities because we consider a certain condominium property as being separate from a nearby surgical center property) from regional health systems controlled by Catholic Health Initiatives (“CHI”) containing 3,159,495 rentable square feet located in 10 states (the “CHI Portfolio”). To date, we have completed the acquisition of
49
of the properties in the CHI Portfolio representing
3,016,926
net leasable square feet. We elected not to complete the acquisition of 2 of the CHI Portfolio properties. We still have one property under one of the original agreements to purchase a medical office facility in Fruitland, Idaho for $4.8 million, and we entered into a separate agreement to purchase a newly constructed medical office facility in Omaha, Nebraska for approximately $33.4 million that is 100% leased and will be 100% occupied by CHI’s affiliate, Creighton University Medical Center, upon its completion of certain tenant improvements. We anticipate closing on the Omaha, Nebraska medical office facility during the first quarter of 2017 and on the Fruitland, Idaho medical office facility later in 2017.
|
|
•
|
Since January 1,
2017
, we have completed acquisitions of
4
healthcare properties for an aggregate purchase price of
$109.5 million
containing an aggregate of
238,312
net leasable square feet.
|
|
•
|
The Company has determined that certain past and future rental payments and prepaid expenses from 4 assets affiliated with Foundation Healthcare, Inc. (OTC: FDNH) (“Foundation Healthcare”), may be uncollectible at this time and has reserved approximately
$3.7 million
against previously recognized rental revenue, prepaid expenses, and deferred rent.
$1.1 million
of this charge is attributable to a lease default by Foundation Healthcare’s wholly-owned subsidiary that rented a medical office facility from us in Oklahoma City, Oklahoma. We have entered into a purchase and sale agreement to sell this medical office building for $15.3 million which would generate a net gain of $1.6 million. The closing of the sale of this property is subject to customary closing conditions, and no assurance can be made that we will complete the sale of this property or as to the timing or terms of any such sale.
|
Approximately
$2.6 million
of this charge is attributable to obligations under 3 separate leases for 2 surgical hospitals and a medical office building leased to Foundation Healthcare-physician joint ventures in San Antonio and El Paso, Texas. The Company is actively working with Foundation Healthcare and the physician co-owners in each separate surgical hospital involved to transfer Foundation Healthcare’s interest in each joint venture, shift management away from Foundation Healthcare, and collect past due rent and expenses. Each location is attracting significant interest from surgical hospital management and ownership companies. The Company cannot make any assurance that all or any of the past due rent or prepaid expenses will be collected or that the transfer of joint venture ownership interests from FDNH to a new surgical hospital management company will occur.
Both the Foundation Surgical Hospital of San Antonio and the Foundation Surgical Hospital of El Paso have operated continuously throughout this process and we do not anticipate any disruption in service by either surgical hospital. These three assets and an additional medical office building leased to the Foundation Healthcare-physician joint venture in San Antonio have been slated for disposition.
Separately, the Company has entered into definitive purchase agreements to sell four medical office buildings in Georgia from our legacy portfolio, which consist of
80,292
square feet in the aggregate for a purchase price of
$18.2 million
, which would generate a net gain of $4.0 million.
In total, the 9 assets slated for disposition contain 319,085 square feet of gross leasable area, and the Company currently estimates that these properties will be sold for approximately
$100 million
to
$125 million
in the aggregate. No assurance can be made, however, that any or all of the properties will be sold, that the Company will receive the anticipated consideration for the sale of any or all of the properties, or as to the timing of any such sale or sales.
7
Capital and Dividends
|
•
|
On January 7, 2016, we issued and sold $150 million aggregate principal amount of senior notes. The proceeds of the notes were used to repay borrowings under our unsecured revolving credit facility and for general corporate and working capital purposes and funding acquisitions.
|
|
•
|
On January 25, 2016, we completed a follow-on public offering of 21,275,000 common shares of beneficial interest, including 2,775,000 common shares issued upon exercise of the underwriters’ overallotment option, resulting in net proceeds to us of approximately
$321.1 million
. The Trust contributed the net proceeds of this offering to the Operating Partnership in exchange for 21,275,000 OP Units, and we used the net proceeds of the public offering to repay borrowings under our unsecured revolving credit facility and for general corporate and working capital purposes and funding acquisitions.
|
|
•
|
On April 11, 2016, we completed a follow-on public offering of 25,875,000 common shares of beneficial interest, including 3,375,000 common shares issued upon exercise of the underwriters’ overallotment option, resulting in net proceeds to us of approximately
$442.6 million
. The Trust contributed the net proceeds of this offering to the Operating Partnership in exchange for 25,875,000 OP Units, and we used the net proceeds of the public offering to repay borrowings under our unsecured revolving credit facility, for general corporate and working capital purposes, for funding acquisitions, and to fund a portion of the purchase price for the CHI Acquisition.
|
|
•
|
On June 10, 2016, we amended our existing credit facility, increasing the maximum principal amount available under our unsecured revolving credit facility from $750 million to $850 million, and adding a term loan feature with a $250 million maximum borrowing amount. The amended credit facility includes a swingline loan commitment for up to 10% of the maximum principal amount and provides an accordion feature allowing us to increase borrowing capacity by up to an additional $500 million, subject to customary terms and conditions, resulting in a maximum borrowing capacity of $1.6 billion.
|
|
•
|
On August 5, 2016, we entered into separate At Market Issuance Sales Agreements with each of KeyBanc Capital Markets Inc., Credit Agricole Securities (USA) Inc., JMP Securities LLC, Raymond James & Associates, Inc. and Stifel Nicolaus & Company, Incorporated, pursuant to which we may issue and sell, from time to time, our common shares having an aggregate offering price of up to $300 million.
|
|
•
|
On August 11, 2016, we issued and sold $75 million aggregate principal amount of senior notes. The proceeds of the notes were used to repay borrowings under our unsecured revolving credit facility and for general corporate and working capital purposes and funding acquisitions.
|
Our Industry and Market Opportunity
The nature of healthcare delivery continues to evolve due to the impact of government programs, regulatory changes and consumer preferences. We believe these changes have increased the need for capital among healthcare providers and increased pressure on these providers to integrate more efficient real estate solutions in order enhance the delivery of quality healthcare. In particular, we believe the following factors and trends are creating an attractive environment in which to invest in healthcare properties.
$3.2 Trillion Healthcare Industry Projected to Grow to $5.5 Trillion (and 20.1% of U.S. GDP) by 2025
According to the U.S. Department of Health and Human Services (“HHS”), healthcare spending accounted for 17.8% of U.S. gross domestic product (“GDP”) in 2015. The general aging of the population, driven by the Baby Boomer generation and advances in medical technology and services which increase life expectancy, are key drivers of the growth in healthcare expenditures. The anticipated continuing increase in demand for healthcare services, together with an evolving complex and costly regulatory environment, changes in medical technology and reductions in government reimbursements are expected to pressure capital-constrained healthcare providers to find cost effective solutions for their real estate needs.
8
We believe the demand by healthcare providers for healthcare real estate will increase as healthcare spending in the United States continues to increase. According to the Centers for Medicare & Medicaid Services’ National Health Expenditure Projections 2016-2025, national healthcare expenditures continue to rise and are projected to grow from an estimated $3.5 trillion in 2016 to $5.5 trillion by 2025, representing an average annual rate of growth of 5.8%, reaching a projected 19.9% of GDP in 2025.
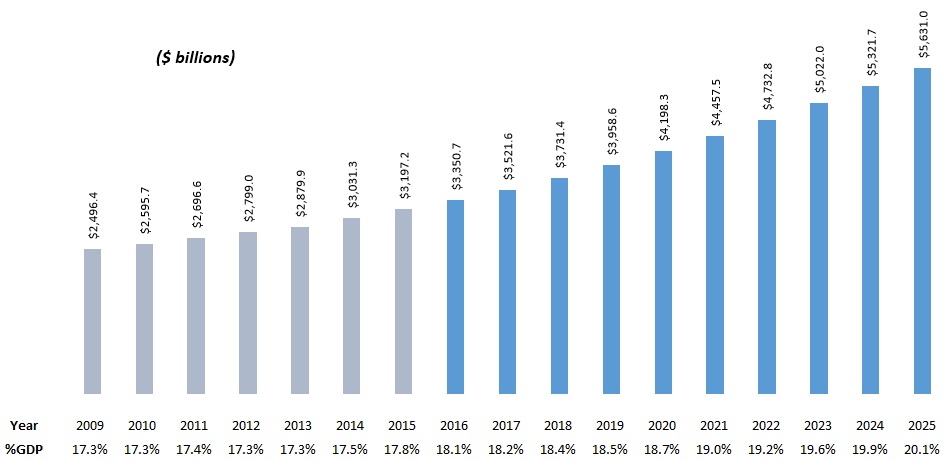
Source: Centers for Medicare & Medicaid Services, Office of the Actuary
Aging Population
The aging of the U.S. population has a direct effect on the demand for healthcare as older persons generally utilize healthcare services at a rate well in excess of younger people. According to the U.S. Census Bureau, the U.S. population over 65 years of age is projected to more than double from 47.8 million to nearly 98.2 million and the 85 and older population is expected to more than triple, from 6.3 million to 19.7 million, between 2015 and 2060. Also according to the U.S. Census Bureau, the number of older Americans is growing as a percentage of the total U.S. population with the number of persons older than 65 estimated to comprise 14.9% of the total U.S. population in 2015 and projected to grow to 23.6% by 2060.
We believe that healthcare expenditures for the population over 65 years of age will continue to rise as a disproportionate share of healthcare dollars is spent on older Americans. To illustrate, in 2012 the elderly (65+ years old) represented only 14% of the population while accounting for 34% of all healthcare-related spending. We believe the older population group increasingly will require treatment and management of chronic and acute health ailments and that this increased demand for healthcare services will create a substantial need for additional medical office buildings and other facilities that serve the healthcare industry in many regions of the United States. Additionally, we believe there will likely be a focus on lowering the cost of outpatient care to support the aging U.S. population, which will continue to support medical office and outpatient facility property demand in the long term. We believe these trends will result in a substantial increase in the number of properties meeting our investment criteria.
9
We believe advances in medical technology will continue to enable healthcare providers to identify and treat once fatal illnesses and improve the survival rate of critically ill and injured patients who will require continuing medical care. Along with these technical innovations, the U.S. population is growing older and living longer.
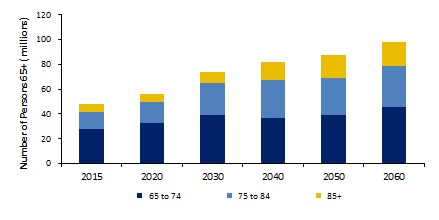
Source: U.S. Census Bureau
Affordable Care Act
The Patient Protection and Affordable Care Act (the “Affordable Care Act”) constitutes a significant overhaul of many aspects of healthcare regulations and health insurance. We believe this evolution of U.S. healthcare policy creates the framework for healthcare services over the near term. The Affordable Care Act requires every American to have health insurance or be subjected to a tax. Those who cannot afford health insurance are offered insurance subsidies or Medicaid coverage. The U.S. Census Bureau estimates that approximately 50 million Americans did not have healthcare insurance in 2009. HHS predicts the Affordable Care Act will result in an additional 30 million Americans having healthcare insurance by 2020, which we believe will substantially increase the demand for healthcare services.
We believe the increase in the number of Americans with access to health insurance will result in an increase in physician office visits and an overall rise in healthcare utilization which in turn will drive a need for expansion of medical, outpatient, and smaller specialty hospital facilities. Additionally, the increased dissemination of health research through media outlets, marketing of healthcare products, and availability of advanced screening techniques and medical procedures have contributed to a more engaged population of healthcare users. We believe this has created increased demand for customized facilities providing specialized, preventive and integrative healthcare services.
The Affordable Care Act further contains provisions which are designed to lower certain reimbursement amounts under Medicare and tie reimbursement levels to the quality of services provided. We believe these and other provisions of the Affordable Care Act will increase the pressure on healthcare providers to become more efficient in their business models, invest capital in their businesses, lower costs and improve the quality of care, which in turn will drive healthcare systems to monetize their real estate assets and create demand for new, modern and specialized facilities.
We note, however, that President Trump and leadership in Congress have publicly stated their intention to repeal and replace (or modify) the Affordable Care Act. On January 20, 2017, President Trump issued an Executive Order stating that it is the administration’s official policy to repeal the Affordable Care Act and instructing the Secretary of Health and Human Services and the heads of all other executive departments and agencies with authority and responsibility under the Affordable Care Act to, among other matters, delay implementation of or grant an exemption from any provision of the Affordable Care Act that would impose a fiscal burden on any state or a cost, fee, tax, penalty, or regulatory burden on individuals, families, healthcare providers, health insurers, patients, and others. We cannot predict the effect of this Executive Order on the Affordable Care Act, or whether the attempt to repeal and replace (or modify) the law will be successful.
Further we cannot predict how the Affordable Care Act might be amended or modified, either through the legislative or judicial process, and how any such modification might impact our tenants’ operations or the net effect of this law on us. If the operations, cash flows or financial condition of our operators and tenants are materially adversely impacted by any repeal or modification of the law, our revenue and operations may be adversely affected as well.
10
Clinical Care Continues to Shift to Outpatient Care
According to the American Hospital Association, procedures traditionally performed in hospitals, such as certain types of surgery, are increasingly moving to outpatient facilities driven by advances in clinical science, shifting consumer preferences, limited or inefficient space in existing hospitals and lower costs in the outpatient environment. This continuing shift toward delivering healthcare services in an outpatient environment rather than a traditional hospital environment increases the need for additional outpatient facilities and smaller, more specialized and efficient hospitals. Studies by the Medicare Payment Advisory Commission and others have shown that healthcare is delivered more cost effectively and with higher patient satisfaction when it is provided on an outpatient basis. Increasingly, hospital admissions are reserved for the critically ill, and less critical patients are treated on an outpatient basis with recuperation in their own homes. We believe healthcare market trends toward outpatient care will continue to push healthcare services out of larger, older, inefficient hospitals and into newer, more efficient and conveniently located outpatient facilities and smaller specialized hospitals. We believe that increased specialization within the medical field is also driving demand for medical facilities designed specifically for particular specialties and that physicians want to locate their practices in medical office space that is in or adjacent to these facilities.
Impact of BBA on Outpatient Care
Section 603 of the Bipartisan Budget Act of 2015 (the “BBA”) will exclude certain hospital outpatient departments (“HOPDs”) from charging hospital inpatient rates, potentially impacting their profitability. Until recently, some HOPDs charged similar rates as hospital inpatient departments for certain services. The BBA was passed into law on November 2, 2015, and is effective as of January 1, 2017. All HOPDs currently reimbursed at the existing hospital inpatient rates will be allowed to continue reimbursement at these higher rates, and thus Section 603 of the BBA will apply only to new HOPD locations.
We own a number of assets that will continue to be reimbursed at hospital inpatient rates, which we refer to as “603 assets” after the applicable section of the BBA. Rent derived from these 603 assets accounts for approximately
23.9%
of our total portfolio annualized base rent as of December 31,
2016
. Depending upon the implementation of the regulations, the BBA may enhance the value of these 603 assets because existing HOPDs may lose their higher reimbursements rates should they choose to change locations.
Portfolio Summary
Please see “Item 2. Properties” for a table that summarizes our portfolio as of
December 31, 2016
.
Geographic Concentration
For the year ended
December 31, 2016
, approximately
12.1%
of our total annualized base rent was derived from properties located in
Texas
.
As a result of this geographic concentration, we are particularly exposed to downturns in the Texas economy or other changes in local real estate market conditions. Any material change in the current payment programs or regulatory, economic, environmental, or competitive conditions in Texas could have a disproportionate effect on our overall business results. In the event of negative economic or other changes in the Texas market, our business, financial condition, and results of operations, our ability to make distributions to our shareholders and the trading price of our common shares may be adversely affected. See the discussion under Item 1A, “Risk Factors,” under the caption, “
Economic and other conditions that negatively affect geographic areas in which we conduct business, and in particular areas to which a greater percentage of our revenue is attributed could materially adversely affect our business, results of operations and financial condition
.”
11
Customer Concentration
We receive substantially all of our revenue as rent payments from tenants under leases of space in our healthcare properties, with our five largest tenants based upon rental revenue representing approximately
$37.9 million
, or
17.3%
, of the annualized base rent from our properties as of
December 31, 2016
. No one tenant represents more than
5.8%
of our total annualized base rent; however,
17.4%
of our total annualized base rent as of December 31, 2016 is from tenants affiliated with CHI. We have no control over the success or failure of our tenants’ businesses and, at any time, any of our tenants may experience a downturn in its business that may weaken its financial condition. Our business, financial position or results of operation could be materially adversely affected if CHI were to experience a material adverse effect on its business, financial position or results of operations. See Item 1A, “Risk Factors,” under the caption “If CHI’s business, financial position or results of operations suffer or are adversely affected, it could have a material adverse effect on our business, financial position or results of operations.”
Competition
We compete with many other entities engaged in real estate investment activities for acquisitions of healthcare properties, including national, regional and local operators, acquirers and developers of healthcare-related real estate properties and other investors such as private equity firms, some of whom may have greater financial resources and lower costs of capital than we do. The competition for healthcare-related real estate properties may significantly increase the price that we must pay for healthcare properties or other assets that we seek to acquire, and our competitors may succeed in acquiring those properties or assets themselves. In addition, our potential acquisition targets may find our competitors to be more attractive because they may have greater resources, may be willing to pay more for the properties or may have a more compatible operating philosophy. In particular, larger REITs that target healthcare properties may enjoy significant competitive advantages that result from, among other things, a lower cost of capital, enhanced operating efficiencies, more personnel, and market penetration and familiarity with markets. In addition, the number of entities and the amount of funds competing for suitable investment properties may increase. Increased competition would result in increased demand for the same assets and therefore increase prices paid for them. Those higher prices for healthcare properties or other assets may adversely affect our returns from our investments.
We also face competition in leasing available MOBs and other facilities that serve the healthcare industry to prospective tenants. As a result, we may have to provide rent concessions, incur charges for tenant improvements, offer other inducements, or we may be unable to timely lease vacant space in our properties, all of which may have a material adverse impact on our results of operations.
On June 10, 2016, the Operating Partnership, as borrower, and the Trust entered into an amended and restated Credit Agreement with KeyBank National Association, as administrative agent, KeyBanc Capital Markets Inc., BMO Capital Markets, and Citizens Bank N.A., as joint lead arrangers and co-book runners, BMO Capital Markets and Citizens Bank N.A., as co-syndication agents, and the lenders party thereto (the “Credit Agreement”) which increased the maximum principal amount available under an unsecured revolving credit facility from
$750 million
to
$850 million
. The Credit Agreement contains a 7-year term loan feature allowing us to borrow in a single drawing up to
$250 million
, increasing the borrowing capacity to an aggregate
$1.1 billion
.
The Credit Agreement also includes a swingline loan commitment for up to
10%
of the maximum principal amount and provides an accordion feature allowing us to increase borrowing capacity by up to an additional
$500 million
, subject to customary terms and conditions, resulting in a maximum borrowing capacity of
$1.6 billion
.
On July 7, 2016, the Operating Partnership borrowed
$250.0 million
under the
7
-year term loan feature of the Credit Agreement. Borrowings under the term loan feature of the Credit Agreement bear interest on the outstanding principal amount at a rate which is determined by the Trust’s credit rating, currently equal to
LIBOR + 1.80%
. The Trust simultaneously entered into a pay-fixed receive-variable rate swap for the full borrowing amount, fixing the LIBOR component of the borrowing rate to
1.07%
, for an all-in fixed rate of
2.87%
. Both the borrowing and pay-fixed receive-variable swap have a maturity date of
June 10, 2023
.
The Credit Agreement has a maturity date of
September 18, 2020
and includes a
one
year extension option. Borrowings under the Credit Agreement bear interest on the outstanding principal amount at an adjusted LIBOR rate, which is based on the Trust’s investment grade rating under the Credit Agreement. As of
December 31, 2016
, the Trust had an investment grade rating from Moody’s of
Baa3
and as such, borrowings under the revolving credit facility of the Credit Agreement accrued interest on the outstanding principal at a rate of LIBOR plus
1.20%
. The Credit Agreement includes a facility fee equal to
0.25%
per annum, which is also determined by the Trust’s investment grade rating.
12
The Credit Agreement contains financial covenants that, among other things, require compliance with leverage and coverage ratios and maintenance of minimum tangible net worth, as well as covenants that may limit our ability to incur additional debt or make distributions. We may, at any time, voluntarily prepay any revolving or swingline loan under the Credit Agreement in whole or in part without premium or penalty. Prepayments of term borrowings require payment of premiums of up to 2.0% of the amount of prepayment, dependent on the date of such prepayment. As of
December 31, 2016
, we were in compliance with all financial covenants.
The Credit Agreement includes customary representations and warranties by the Trust and the Operating Partnership and imposes customary covenants on the Trust and the Operating Partnership. The Credit Agreement also contains customary events of default, and if an event of default occurs and continues, the Operating Partnership is subject to certain actions by the administrative agent, including without limitation, the acceleration of repayment of all amounts outstanding under the Credit Agreement.
The Credit Agreement provides for revolving credit and term loans to the Operating Partnership. Base Rate Loans, Adjusted LIBOR Rate Loans, and Letters of Credit (each, as defined in the Credit Agreement) will be subject to interest rates, based upon the Trust’s investment grade rating as follows:
|
Credit Rating
|
Margin for Revolving Loans: Adjusted LIBOR Rate Loans
and Letter of Credit Fee
|
Margin for Revolving Loans: Base Rate Loans
|
Margin for Term Loans: Adjusted LIBOR Rate Loans
and Letter of Credit Fee
|
Margin for Term Loans: Base Rate Loans
|
||||||
|
At Least A- or A3
|
LIBOR + 0.85%
|
—
|
%
|
LIBOR + 1.40%
|
0.40
|
%
|
||||
|
At Least BBB+ or BAA1
|
LIBOR + 0.90%
|
—
|
%
|
LIBOR + 1.45%
|
0.45
|
%
|
||||
|
At Least BBB or BAA2
|
LIBOR + 1.00%
|
0.10
|
%
|
LIBOR + 1.55%
|
0.55
|
%
|
||||
|
At Least BBB- or BAA3
|
LIBOR + 1.20%
|
0.20
|
%
|
LIBOR + 1.80%
|
0.80
|
%
|
||||
|
Below BBB- or BAA3
|
LIBOR + 1.55%
|
0.60
|
%
|
LIBOR + 2.25%
|
1.25
|
%
|
||||
As of
December 31, 2016
, there were
$401.0
million of borrowings outstanding under our unsecured revolving credit facility and
$448.9
million available for us to borrow without adding additional properties to the unencumbered borrowing base of assets, as defined by the Credit Agreement. As of
December 31, 2016
the Trust had
$250.0 million
of borrowings outstanding under the term loan feature of the Credit Agreement.
On January 7, 2016, the Operating Partnership issued and sold
$150.0 million
aggregate principal amount of senior notes, comprised of (i)
$15.0 million
aggregate principal amount of
4.03%
Senior Notes, Series A, due January 7, 2023, (ii)
$45.0 million
aggregate principal amount of
4.43%
Senior Notes, Series B, due January 7, 2026, (iii)
$45.0 million
aggregate principal amount of
4.57%
Senior Notes, Series C, due January 7, 2028, and (iv)
$45.0 million
aggregate principal amount of
4.74%
Senior Notes, Series D, due January 7, 2031. On August 11, 2016, the note agreement for these notes was amended to make certain changes to its terms, including certain changes to affirmative covenants, negative covenants and definitions contained therein.
On August 11, 2016, the Operating Partnership issued and sold
$75.0 million
aggregate principal amount of senior notes, comprised of (i)
$25.0 million
aggregate principal amount of
4.09%
Senior Notes, Series A, due August 11, 2025, (ii)
$25.0 million
aggregate principal amount of
4.18%
Senior Notes, Series B, due August 11, 2026, and (iii)
$25.0 million
aggregate principal amount of
4.24%
Senior Notes, Series C, due August 11, 2027.
Seasonality
Our business has not been and we do not expect it to become subject to material seasonal fluctuations.
Employees
At
December 31, 2016
, we had
41
full-time employees, none of whom are subject to a collective bargaining agreement. We believe that relations with our employees are positive.
13
Environmental Matters
As an owner of real estate, we are subject to various federal, state and local environmental laws, regulations and ordinances and also could be liable to third parties as a result of environmental contamination or noncompliance at our properties even if we no longer own such properties. See the discussion under Item 1A, “Risk Factors,” under the caption “Environmental compliance costs and liabilities associated with owning, leasing, developing and operating our properties may affect our results of operations.”
Certain Government Regulations
Overview
Our tenants and operators are typically subject to extensive and complex federal, state and local healthcare laws and regulations relating to fraud and abuse practices, government reimbursement, licensure and certificate of need and similar laws governing the operation of healthcare facilities, and we expect that the healthcare industry, in general, will continue to face increased regulation and pressure in the areas of fraud, waste and abuse, cost control, healthcare management and provision of services, among others. These regulations are wide-ranging and can subject our tenants and operators to civil, criminal and administrative sanctions. Affected tenants and operators may find it increasingly difficult to comply with this complex and evolving regulatory environment because of a relative lack of guidance in many areas as certain of our healthcare properties are subject to oversight from several government agencies and the laws may vary from one jurisdiction to another. Changes in laws and regulations, reimbursement enforcement activity and regulatory non-compliance by our tenants and operators can all have a significant effect on their operations and financial condition, which in turn may adversely impact us, as detailed below and set forth under Item 1A, “Risk Factors,” under the caption “The healthcare industry is heavily regulated, and new laws or regulations, changes to existing laws or regulations, loss of licensure or failure to obtain licensure could adversely impact our company and result in the inability of our tenants to make rent payments to us.”
The following is a discussion of certain laws and regulations generally applicable to our operators, and in certain cases, to us.
Healthcare Legislation
Health Reform Laws.
On March 23, 2010, President Obama signed into law the Patient Protection and Affordable Care Act of 2010 (the “Affordable Care Act”) and the Health Care and Education Reconciliation Act of 2010, which amends the Affordable Care Act (collectively with other subsequently enacted federal health care laws and regulations, the “Health Reform Laws”). The Health Reform Laws contain various provisions that may directly impact us or the operators and tenants of our properties. Some provisions of the Health Reform Laws may have a positive impact on our operators’ or tenants’ revenues, by, for example, increasing coverage of uninsured individuals, while others may have a negative impact on the reimbursement of our operators or tenants by, for example, altering the market basket adjustments for certain types of health care facilities. The Health Reform Laws also enhance certain fraud and abuse penalty provisions that could apply to our operators and tenants, in the event of one or more violations of the federal health care regulatory laws. In addition, there are provisions that impact the health coverage that we and our operators and tenants provide to our respective employees. The Health Reform Laws also provide additional Medicaid funding to allow states to carry out the expansion of Medicaid coverage to certain financially-eligible individuals beginning in 2014, and have also permitted states to expand their Medicaid coverage to these individuals since April 1, 2010, if certain conditions are met. On June 28, 2012, the United States Supreme Court upheld the individual mandate of the Health Reform Laws but partially invalidated the expansion of Medicaid. The ruling on Medicaid expansion will allow states not to participate in the expansion—and to forego funding for the Medicaid expansion—without losing their existing Medicaid funding. Given that the federal government substantially funds the Medicaid expansion, it is unclear how many states will ultimately pursue this option. The participation by states in the Medicaid expansion could have the dual effect of increasing our tenants’ revenues, through new patients, but could also further strain state budgets. While the federal government paid for approximately 100% of those additional costs from 2014 to 2016, states now are expected to pay for part of those additional costs.
Challenges to the Health Reform Laws and Potential Repeal and/or Further Reforms under Trump Administration
. Since the enactment of the Health Care Laws, there have been multiple attempts through legislative action and legal challenge to repeal or amend the Health Reform Laws, including the case that was before the U.S. Supreme Court,
King v. Burwell
. Although the Supreme Court in
Burwell
upheld the use of subsidies to individuals in federally-facilitated health care exchanges on June 25, 2015, which ultimately did not disrupt significantly the implementation of the Health Reform Laws, we cannot predict whether other current or future efforts to repeal, amend or challenge the validity of all or part of the Health Reform
14
Laws will be successful, nor can we predict the impact that such a repeal, amendment or challenge would have on our operators or tenants and their ability to meet their obligations to us.
President Trump and leadership in Congress have publicly stated their intention to repeal and replace the Affordable Care Act. On January 20, 2017, President Trump issued an Executive Order stating that it is the administration’s official policy to repeal the Affordable Care Act and instructing the Secretary of Health and Human Services and the heads of all other executive departments and agencies with authority and responsibility under the Affordable Care Act to, among other matters, delay implementation of or grant an exemption from any provision of the Affordable Care Act that would impose a fiscal burden on any state or a cost, fee, tax, penalty, or regulatory burden on individuals, families, healthcare providers, health insurers, patients, and others. We cannot predict the effect of this Executive Order on the Affordable Care Act, or whether any of these attempts to amend, modify, or repeal and replace the law will be successful.
We cannot predict how the Affordable Care Act might be amended or modified, either through the legislative or judicial process, and how any such modification might impact our tenants’ operations or the net effect of this law on us. If the operations, cash flows or financial condition of our operators and tenants are materially adversely impacted by any repeal or modification of the law, our revenue and operations may be adversely affected as well.
Fraud and Abuse Enforcement
There are various extremely complex federal and state laws and regulations governing healthcare providers’ relationships and arrangements and prohibiting fraudulent and abusive practices by such providers. These laws include (i) federal and state false claims acts, which, among other things, prohibit providers from filing false claims or making false statements to receive payment from Medicare, Medicaid or other federal or state healthcare programs, (ii) federal and state anti-kickback and fee-splitting statutes, including the Medicare and Medicaid anti-kickback statute, which prohibit the payment or receipt of remuneration to induce referrals or recommendations of healthcare items or services, (iii) federal and state physician self-referral laws (commonly referred to as the “Stark Law”), which generally prohibit referrals by physicians to entities with which the physician or an immediate family member has a financial relationship, (iv) the federal Civil Monetary Penalties Law, which prohibits, among other things, the knowing presentation of a false or fraudulent claim for certain healthcare services and (v) federal and state privacy laws, including the privacy and security rules contained in the Health Insurance Portability and Accountability Act of 1996, which provide for the privacy and security of personal health information. Violations of healthcare fraud and abuse laws carry civil, criminal and administrative sanctions, including punitive sanctions, monetary penalties, imprisonment, denial of Medicare and Medicaid reimbursement and potential exclusion from Medicare, Medicaid or other federal or state healthcare programs. These laws are enforced by a variety of federal, state and local agencies and can also be enforced by private litigants through, among other things, federal and state false claims acts, which allow private litigants to bring
qui tam
or “whistleblower” actions. Many of our operators and tenants are subject to these laws, and some of them may in the future become the subject of governmental enforcement actions if they fail to comply with applicable laws.
Reimbursement
Sources of revenue for many of our tenants and operators include, among other sources, governmental healthcare programs, such as the federal Medicare program and state and Medicaid program, and non-governmental payors, such as insurance carriers and HMOs. As federal and state governments focus on healthcare reform initiatives, and as the federal government and many states face significant budget deficits, efforts to reduce costs by these payors will likely continue, which may result in reduced or slower growth in reimbursement for certain services provided by some of our tenants and operators.
We cannot predict whether future Congressional proposals will seek to reduce physician reimbursements. Efforts by other payors to reduce healthcare costs are likely to continue, which may result in reductions or slower growth in reimbursement for certain services provided by some of our tenants. Further, revenue realizable under third-party payor agreements can change after examination and retroactive adjustment by payors during the claims settlement process or as a result of post-payment audits. For example, payors may disallow requests for reimbursement based on determinations that certain costs are not reimbursable or reasonable, because additional documentation is necessary or because certain services were not covered or were not medically necessary. The Healthcare Reform Laws and regulatory changes could impose further limitations on government and private payments to healthcare providers. In some cases, states have enacted or are considering enacting measures designed to reduce their Medicaid expenditures and to make changes to private healthcare insurance. In addition, the failure of any of our tenants to comply with various laws and regulations could jeopardize their ability to continue participating in Medicare, Medicaid and other government sponsored payment programs. The financial impact on our tenants’ failure to comply with such laws and regulations could restrict their ability to make rent payments to us.
15
Healthcare Licensure and Certificate of Need
Certain healthcare facilities in our portfolio are subject to extensive federal, state and local licensure, certification and inspection laws and regulations. In addition, various licenses and permits are required to dispense narcotics, operate pharmacies and laboratories, handle radioactive materials and operate equipment. Many states require certain healthcare providers to obtain a certificate of need, which requires prior approval for the construction, expansion and closure of certain healthcare facilities. The approval process related to state certificate of need laws may impact some of our tenants’ and operators’ abilities to expand or change their businesses.
Available Information
Our website address is
www.docreit.com.
We make available, free of charge through the Investor Relations portion of the website, annual reports on Form 10-K, quarterly reports on Form 10-Q, current reports on Form 8-K and amendments to those reports filed or furnished pursuant to Section 13(a) or 15(d) of the Securities Exchange Act of 1934 (as amended, the “Exchange Act”) as soon as reasonably practicable after we electronically file such material with, or furnish it to, the Securities and Exchange Commission (the “SEC” or the “Commission”). Reports of beneficial ownership filed pursuant to Section 16(a) of the Exchange Act are also available on our website. These reports and other information are also available, free of charge, at www.sec.gov. Alternatively, the public may read and copy any materials we file with the SEC at the SEC’s Public Reference Room at 100 F Street, N.E., Washington, D.C. 20549. Information on the operation of the Public Reference Room may be obtained by calling the SEC at 1-800-SEC-0330.
In addition, the Trust’s board of trustees has established a Code of Business Conduct and Ethics that applies to our officers, including our Chief Executive Officer and President and Chief Financial Officer, trustees, and employees. The Code of Business Conduct and Ethics provides a statement of the Company’s policies and procedures for conducting business legally and ethically. A copy of the Code of Business Conduct and Ethics is available in the Investor Relations section of our website (
www.docreit.com
) under the tab “Governance Documents.” Any amendments to or waivers from the Code of Business Conduct and Ethics will be disclosed on our website. Information contained on our website is not part of this report.
16
The following summarizes the material risks of purchasing or owning our securities. Additional unknown risks may also impair our financial performance and business operations. Our business, financial condition and/or results of operation may be materially adversely affected by the nature and impact of these risks. In such case, the market value of our securities could be detrimentally affected, and investors may lose part or all of the value of their investment. You should carefully consider the risks and uncertainties described below.
We have grouped these risk factors into the following general categories:
|
•
|
Risks related to our business;
|
|
•
|
Risks related to the healthcare industry;
|
|
•
|
Risks related to the real estate industry;
|
|
•
|
Risks related to financings;
|
|
•
|
Risks related to our portfolio and structure; and
|
|
•
|
Risks related to our qualification and operation as a REIT.
|
Risks Related To Our Business
There is no assurance that we will be able to achieve our investment objectives.
We may not be able to achieve our investment objectives as described in this report and the value of your investment could decline substantially. Our financial condition and results of operations depend on many factors, including the availability of investment opportunities, readily accessible short and long-term financing, conditions in the financial markets and economic conditions generally. There can be no assurance that we will be able to generate sufficient cash flow over time to pay our operating expenses and make distributions to shareholders.
Our real estate investments are concentrated in healthcare properties, making us more vulnerable economically than if our investments were diversified in other segments of the economy.
We acquire, own, manage, operate and selectively develop properties for lease primarily to physicians, hospitals and healthcare delivery systems. We are subject to risks inherent in concentrating investments in real estate, and further from the concentration of our investments in the healthcare sector. Any adverse effects that result from these risks could be more pronounced than if we diversified our investments outside of healthcare properties. Given our concentration in this sector, our tenant base is especially concentrated and dependent upon the healthcare industry generally, and any industry downturn could adversely affect the ability of our tenants to make lease payments and our ability to maintain current rental and occupancy rates. Our tenant mix could become even more concentrated if a significant portion of our tenants practice in a particular medical field or are reliant upon a particular healthcare delivery system. Accordingly, a downturn in the healthcare industry generally, or in the healthcare related facility specifically, could adversely affect our business, financial condition and results of operations, our ability to make distributions to our shareholders and the trading price of our common shares.
Economic and other conditions that negatively affect geographic areas in which we conduct business, and in particular areas to which a greater percentage of our revenue is attributed could materially adversely affect our business, results of operations and financial condition
.
Our operating results depend upon our ability to maintain and increase occupancy levels and rental rates at our properties. Adverse economic or other conditions in the geographic markets in which we operate, including periods of economic slowdown or recession, industry slowdowns, periods of deflation, relocation of businesses, changing demographics, earthquakes and other natural disasters, fires, terrorist acts, civil disturbances or acts of war and other man-made disasters which may result in uninsured or underinsured losses, and changes in tax, real estate, zoning and other laws and regulations, may lower our occupancy levels and limit our ability to increase rents or require us to offer rental concessions.
For the year ended
December 31, 2016
, approximately
10.7%
of our gross leasable area and
12.1%
of our total annualized base rent was derived from properties located in Texas. As a result of this geographic concentration, we are particularly exposed to downturns in the Texas economy or other changes in local real estate market conditions. Any material change in the current payment programs or regulatory, economic, environmental or competitive conditions in Texas could have
17
a disproportionate effect on our overall business results. In the event of negative economic or other changes in any of the markets in which we conduct business, our business, financial condition and results of operations, our ability to make distributions to our shareholders and the trading price of our common shares may be adversely affected.
Our healthcare properties and tenants face competition from nearby hospitals and other healthcare properties, and we may not realize the benefits that we anticipate from focusing on healthcare properties that are strategically aligned with a healthcare delivery system and from the relationships established through such strategic alignments.
As part of our business strategy, we focus on healthcare properties that are strategically aligned with a healthcare delivery system by (i) seeking to acquire, own, manage, and develop healthcare properties that are located on medical campuses where the underlying land is owned by a healthcare delivery system or by us, or (ii) seeking to acquire, own, manage, and develop healthcare properties located in close proximity to a healthcare delivery system or strategically aligned with a healthcare delivery system through leasing or other arrangements. We may not realize the benefits that we anticipate as a result of these strategic relationships, such as increased rents and reduced tenant turnover rates as compared to healthcare properties that are not strategically aligned. Moreover, building a portfolio of healthcare properties that are strategically aligned does not assure the success of any given property. The associated healthcare delivery system may not be successful and the strategic alignment that we seek for our healthcare properties could dissolve, and we may not succeed in replacing them. In addition, our healthcare properties, the associated healthcare delivery systems with which our healthcare properties are strategically aligned and our tenants may be unable to compete successfully with nearby hospitals, medical practices, other healthcare properties that provide comparable services, pharmacies and other retailers that may initiate or expand healthcare clinic operations and services to compete with our tenants. Any of our properties may be materially and adversely affected if the healthcare delivery system with which it is strategically aligned is unable to compete successfully. If we do not realize the benefits that we anticipate from our business strategy and our strategic alignments dissolve and we are not successful in replacing them, our reputation, business, financial results and prospects may be adversely affected.
Any failure, inability or unwillingness by our tenants to pay rent or other amounts under leases could materially adversely affect our financial results; we may have difficulty finding suitable replacement tenants in the event of a tenant default or non-renewal of our leases, especially for our properties located in smaller markets.
Our portfolio of healthcare properties is leased to physicians, hospitals, healthcare delivery systems and other healthcare providers. We cannot assure you that our tenants will have sufficient assets, income and access to financing to enable them to satisfy their respective obligations to us, and any failure, inability or unwillingness by our tenants to do so could adversely affect our financial results. For example, we determined that certain past and future rental payments and prepaid expenses from four assets affiliated with Foundation Healthcare may be uncollectible at this time and have reserved approximately $3.7 million against previously recognized rental revenue, prepaid expenses, and deferred rent. See “Part II, Item 7. Management’s Discussion and Analysis of Financial Condition and Results of Operations - Recent Developments - Assets Slated for Disposition” for a further discussion of our efforts to collect the unpaid rent payments and to sell the properties. No assurance can be made that all or any of the past due rent or prepaid expenses will be collected or that any or all of the properties will be sold, that we will receive the anticipated consideration for the sale of any or all of the properties, or as ot the timing of any such sale or sales.
We cannot predict whether our tenants will renew or extend existing leases beyond their current terms. Nearly all of our properties are subject to leases which have multi-year terms. As of
December 31, 2016
, leases representing
3.7%
and
4.5%
of leasable square feet at our properties will expire in
2017
and
2018
, respectively, and leases representing
0.1%
of leasable square feet had expired as of December 31, 2016. If any of our leases are not renewed or extended, or if a tenant defaults under the terms of its lease or becomes insolvent, we would attempt to relet those spaces or properties to other tenants or new tenants. In case of non-renewal, we generally have advance notice before expiration of the lease term to arrange for reletting or repositioning of the spaces or the properties and our tenants are required to continue to perform all of their obligations (including the payment of all rental amounts) under the non-renewed leases until such expiration. However, following expiration of a lease term or if we exercise our right to replace a tenant in default, rental payments on the related properties could decline or cease altogether while we relet or reposition the spaces or the properties with suitable replacement tenants. We also might not be successful in identifying suitable replacement tenants or entering into leases with new tenants on a timely basis or on terms as favorable to us as our current leases, or at all, and we may be required to fund certain expenses and obligations (e.g., real estate taxes, debt costs and maintenance expenses) to preserve the value of, and avoid the imposition of liens on, our properties while they are being relet or repositioned. Our ability to relet or reposition our properties, or spaces within our properties, with suitable tenants could be significantly delayed or limited by state licensing, receivership, certificate of need or other laws, as well as by the Medicare and Medicaid change-of-ownership rules. We could also incur substantial additional expenses in connection with any licensing, receivership or change-of-ownership proceedings. In addition, our ability to locate suitable replacement tenants could be impaired by the specialized healthcare uses or contractual restrictions on use of
18
the properties, and we may be required to spend substantial amounts to adapt the properties to other uses. Any such delays, limitations and expenses could adversely impact our ability to collect rent, obtain possession of leased properties or otherwise exercise remedies for tenant default and could have a material adverse effect on us or cause us to take an impairment charge on a property.
All of these risks may be greater in smaller markets, where there may be fewer potential replacement tenants, making it more difficult to replace tenants, especially for specialized spaces, like hospital or outpatient treatment facilities located in our properties, and could have a material adverse effect on us.
We may fail to close any pending acquisitions, which could have a material adverse impact on our results of operations, earnings and cash flow.
From time to time, we enter into definitive agreements to acquire healthcare properties that are structured as bifurcated transactions (i.e., the closing of the transaction does not occur at the time of the signing of the definitive agreement). The acquisition of any such properties are subject to customary closing conditions, and there can be no assurance that those conditions will be satisfied or that the acquisitions will close on the terms that may be described or at all. Pending acquisitions, whether or not they close, require substantial time and attention from management. Furthermore, any such pending acquisitions require significant expense, including expenses for due diligence, legal and accounting fees and other costs. In the event we do not close any pending acquisitions, these expenses will not be offset by revenues from the investments and we may have issued a significant number of additional common shares without realizing a corresponding increase in earnings and cash flow from the investments. As a result, our failure to close pending acquisitions could have a material adverse impact on our financial condition, results of operations and the market price of our common shares.
We may be unable to successfully acquire or develop properties and expand our operations into new or existing markets.
We intend to explore acquisitions or developments of properties in new and existing geographic markets. These acquisitions and developments could divert management’s attention from our existing properties, and we may be unable to retain key employees or attract highly qualified new employees. In addition, we may not possess familiarity with the dynamics and prevailing conditions of any new geographic markets which could adversely affect our ability to successfully expand into or operate within those markets. For example, new markets may have different insurance practices, reimbursement rates and local real estate, zoning and development regulations than those with which we are familiar. We may find ourselves more dependent on third parties in new markets because our distance could hinder our ability to directly and efficiently manage and otherwise monitor new properties in new markets. Our expansion into new markets could result in unexpected costs or delays as well as lower occupancy rates and other adverse consequences. We may not be successful in identifying suitable properties or other assets which meet our acquisition or development criteria or in consummating acquisitions or developments on satisfactory terms or at all for a number of reasons, including, among other things, unsatisfactory results of our due diligence investigations, failure to obtain financing for the acquisition or development on favorable terms or at all, and our misjudgment of the value of the opportunities. We may also be unable to successfully integrate the operations of acquired properties, maintain consistent standards, controls, policies and procedures, or realize the anticipated benefits of the acquisitions within the anticipated timeframe or at all. If we are unsuccessful in expanding into new or our existing markets, it could adversely affect our business, financial condition and results of operations, our ability to make distributions to our shareholders and the trading price of our common shares.
If CHI’s business, financial position or results of operations suffer or are adversely affected, it could have a material adverse effect on our business, financial position or results of operations.
To date, we have completed the acquisition of
49
of the properties in the CHI Portfolio representing
3,016,926
net leasable square feet. We elected not to complete the acquisition of 2 of the CHI Portfolio properties. We still have one property under one of the original agreements to purchase a medical office facility in Fruitland, Idaho for $4.8 million, and we entered into a separate agreement to purchase a newly constructed medical office facility in Omaha, Nebraska for approximately $33.4 million that is 100% leased and will be 100% occupied by CHI’s affiliate, Creighton University Medical Center, upon its completion of certain tenant improvements. We anticipate closing on the Omaha, Nebraska medical office facility during the first quarter of 2017 and on the Fruitland, Idaho medical office facility later in 2017.
Although CHI is not a party to nor a guarantor of the related lease agreements, it controls each of the subsidiaries and affiliates that are parties to the master lease agreement, which was entered into in connection with the closing of the transactions. Given this control, if CHI's business, financial position or results of operations suffer or are adversely affected, it could adversely affect CHI's ability to provide any financial or operational support for the subsidiaries and affiliates it controls, which could adversely affect one or more of the CHI-affiliated tenants' ability to pay rent to us. Additionally, if CHI's business,
19
financial position or results of operations were to suffer or its credit ratings were to be downgraded, it could cause investors to lose confidence in our ability to collect rent from the CHI-affiliated tenants and could cause our stock price to decline. Moreover, there can be no assurance that CHI’s subsidiaries and affiliates will have sufficient assets, income and access to financing to enable them to satisfy their payment obligations under their lease agreements. The inability of CHI’s subsidiaries and affiliates to meet their rent obligations could materially adversely affect our business, financial position or results of operations including our ability to pay dividends to our stockholders as required to maintain our status as a REIT. The inability of CHI’s subsidiaries and affiliates to satisfy their other obligations under their lease agreements such as the payment of taxes, insurance and utilities could have a material adverse effect on the condition of the leased properties as well as on our business, financial position and results of operations. For these reasons, if CHI were to experience a material adverse effect on its business, financial position or results of operations, our business, financial position or results of operations could also be materially adversely affected.
Failure by CHI’s subsidiaries and affiliates to comply with the terms of their lease agreements or to comply with the healthcare regulations to which the leased properties and CHI’s operations are subject could require us to find other lessees for any affected leased properties and there could be a decrease or cessation of rental payments by CHI’s subsidiaries and affiliates. In such event, we may be unable to locate suitable replacement lessees willing to pay similar rental rates or at all, which would have the effect of reducing our rental revenues and could materially adversely affect our business, financial position or results of operations.
We may not be successful in identifying and completing off-market acquisitions and other suitable acquisitions or investment opportunities, which may impede our growth and adversely affect our business, financial condition and results of operations and our ability to make distributions to our shareholders.
An important component of our growth strategy is to acquire “off-market” properties before they are widely marketed by the owners. Facilities that are acquired off-market are typically more attractive to us as a purchaser because of the absence of a formal marketing process, which could lead to higher prices or other unattractive terms. If we cannot obtain off-market deal flow in the future, our ability to locate and acquire facilities at attractive prices could be adversely affected. We expect to compete with many other entities engaged in real estate investment activities for acquisitions of healthcare properties, including national, regional and local operators, acquirers and developers of healthcare-related real estate properties and other investors such as private equity firms, some of whom may have greater financial resources and lower costs of capital than we do. The competition for healthcare-related real estate properties may significantly increase the price that we must pay for healthcare properties or other assets that we seek to acquire, and our competitors may succeed in acquiring those properties or assets themselves. In addition, our potential acquisition targets may find our competitors to be more attractive because they may have greater resources, may be willing to pay more for the properties or may have a more compatible operating philosophy. In particular, larger REITs that target healthcare properties may enjoy significant competitive advantages that result from, among other things, a lower cost of capital, enhanced operating efficiencies, more personnel and market penetration and familiarity with markets. In addition, the number of entities and the amount of funds competing for suitable investment properties may increase. Increased competition would result in increased demand for these assets and therefore likely would increase prices paid for them. Those higher prices for healthcare properties or other assets may adversely affect our returns from our investments.
Some of our existing properties and properties we acquire in the future are and may be subject to ground lease or other restrictions on the use of the space. If we are required to undertake significant capital expenditures to procure new tenants, then our business and results of operations may suffer.
Fifty-eight
of our properties, representing approximately
33.6%
of our total leasable square feet and
32.4%
of our annualized revenue based on rental payments for the month ended
December 31, 2016
, are subject to ground leases that contain certain restrictions. These restrictions include limits on our ability to re-let our initial properties to tenants not affiliated with the healthcare delivery system that owns the underlying property, rights of purchase and rights of first offer and refusal with respect to sales of the property and limits on the types of medical procedures that may be performed. In addition, lower than expected rental rates upon re-letting could impede our growth. We may not be able to re-let space on terms that are favorable to us or at all. Further, we may be required to undertake significant capital expenditures to renovate or reconfigure space to attract new tenants. If we are unable to promptly re-let our initial properties, if the rates upon such re-letting are significantly lower than expected or if we are required to undertake significant capital expenditures in connection with re-letting, our business, financial condition and results of operations, our ability to make distributions to our shareholders and the trading price of our common shares may be adversely affected.
20
We may invest in senior housing facilities that are subject to RIDEA, which may subject us to operational risks and increased costs.
We may invest in senior housing facilities or other properties, structured, where applicable, in compliance with RIDEA or other applicable REIT laws or regulations. If so, we will be exposed to various operational risks with respect to those operating properties that may increase our costs or adversely affect our ability to generate revenues. These risks include fluctuations in patient volume and occupancy, Medicare and Medicaid reimbursement, if applicable, and private pay rates, economic conditions, competition, federal, state, local, and industry-regulated licensure, certification and inspection laws, regulations, and standards, the availability and increases in cost of general and professional liability insurance coverage, state regulation, the availability and increases in cost of labor (as a result of unionization or otherwise) and other risks applicable to operating businesses. Any one or a combination of these factors may adversely affect our revenue and operations.
Uninsured losses or losses in excess of our insurance coverage could adversely affect our financial condition and our cash flows.
We maintain comprehensive liability, fire, flood, earthquake, wind (as deemed necessary or as required by our lenders), extended coverage and rental loss insurance with respect to our initial properties. Certain types of losses, however, may be either uninsurable or not economically insurable, such as losses due to earthquakes, riots, acts of war or terrorism. Should an uninsured loss occur, we could lose both our investment in and anticipated profits and cash flows from a healthcare related facility. If any such loss is insured, we may be required to pay a significant deductible on any claim for recovery of such a loss prior to our insurer being obligated to reimburse us for the loss, or the amount of the loss may exceed our coverage for the loss. In addition, future lenders may require such insurance, and our failure to obtain such insurance could constitute a default under loan agreements. We may determine not to insure some or all of our properties at levels considered customary in our industry and which would expose us to an increased risk of loss. As a result, our business, financial condition and results of operations, our ability to make distributions to our shareholders and the trading price of our common shares may be adversely affected.
Environmental compliance costs and liabilities associated with owning, leasing, developing and operating our properties may affect our results of operations.
Under various U.S. federal, state and local laws, ordinances and regulations, current and prior owners and tenants of real estate may be jointly and severally liable for the costs of investigating, remediating and monitoring certain hazardous substances or other regulated materials on or in such property. In addition to these costs, the past or present owner or tenant of a property from which a release emanates could be liable for any personal injury or property damage that results from such releases, including for the unauthorized release of asbestos-containing materials and other hazardous substances into the air, as well as any damages to natural resources or the environment that arise from such releases. These environmental laws often impose such liability without regard to whether the current or prior owner or tenant knew of, or was responsible for, the presence or release of such substances or materials. Moreover, the release of hazardous substances or materials, or the failure to properly remediate such substances or materials, may adversely affect the owner’s or tenant’s ability to lease, sell, develop or rent such property or to borrow by using such property as collateral. Persons who transport or arrange for the disposal or treatment of hazardous substances or other regulated materials may be liable for the costs of removal or remediation of such substances at a disposal or treatment facility, regardless of whether or not such facility is owned or operated by such person.
Certain environmental laws impose compliance obligations on owners and tenants of real property with respect to the management of hazardous substances and other regulated materials. For example, environmental laws govern the management and removal of asbestos-containing materials and lead-based paint. Failure to comply with these laws can result in penalties or other sanctions. If we incur substantial costs to comply with these environmental laws or we are held liable under these laws, our business, financial condition and results of operations, our ability to make distributions to our shareholders and the trading price of our common shares may be adversely affected.
Acquiring outstanding mortgages or other debt secured by a healthcare related facility or land suitable for development as a healthcare related facility may expose us to risks of costs and delays in acquiring the underlying property.
We may decide to acquire outstanding mortgages or other debt secured by a healthcare related facility or land suitable for development as a healthcare related facility from lenders and investors if we believe we can ultimately foreclose or otherwise acquire ownership of the underlying property in the near-term through foreclosure, deed-in-lieu of foreclosure or other means. However, if we do acquire such debt, borrowers may seek to assert various defenses to our foreclosure or other actions and we may not be successful in acquiring the underlying property on a timely basis, or at all, in which event we could incur significant costs and experience significant delays in acquiring such properties, all of which could adversely affect our
21
financial performance and reduce our expected returns from such investments. In addition, we may not earn a current return on such investments particularly if the mortgage or other debt that we acquire is in default.
We have now, and may have in the future, exposure to contingent rent escalators, which can hinder our growth and profitability.
We receive a significant portion of our revenues by leasing our assets under long-term triple-net leases in which the rental rate is generally fixed with annual escalations. Leases in the future may contain escalators contingent upon the achievement of specified revenue parameters or based on changes in the Consumer Price Index. If, as a result of weak economic conditions or other factors, the revenues generated by our properties do not meet the specified parameters or the Consumer Price Index does not increase, our growth and profitability will be hindered by these leases.
We may not be able to maintain or expand our relationships with our existing and future hospital and healthcare delivery system clients.
The success of our business depends, to a large extent, on our current and future relationships with hospital and healthcare delivery system clients. We invest a significant amount of time to develop, maintain and be responsive to these relationships, and our relationships have helped us to secure acquisition and development opportunities, as well as other advisory, property management and projects, with both new and existing clients. If our relationships with hospital or health system clients deteriorate, if a conflict of interest or non-compete arrangement prevents us from expanding these relationships, or if a hospital on or near whose campus one of our properties is located fails or becomes unable to meet its financial obligations, the business of our tenants could be adversely affected or our ability to secure new acquisition and development opportunities or other advisory, property management and hospital project management projects could be adversely impacted and our professional reputation within the industry could be damaged.
We may be unable to make distributions which could result in a decrease in the market price of our common shares.
Substantially all of our assets are held through the Operating Partnership, which holds substantially all of its properties and assets through subsidiaries. Our Operating Partnership’s cash flow is dependent upon cash distributions to it by its subsidiaries, and in turn, substantially all of the Trust’s cash flow is dependent upon cash distributions to it by the Operating Partnership. The creditors of each of our direct and indirect subsidiaries are entitled to payment of that subsidiary’s obligation to them, as and when due and payable, before distributions may be made by that subsidiary to its equity holders. Therefore, our Operating Partnership’s ability to make distributions to holders of OP Units depends on its subsidiaries’ ability first to satisfy their obligations to their creditors and then to make distributions to the Operating Partnership. Furthermore, holders of Series A Preferred Units are entitled to receive preferred distributions before payment of distributions to OP Unit holders, including the Trust. Finally, the Trust’s ability to pay dividends to holders of common shares depends upon our Operating Partnership’s ability to first satisfy its obligations to its creditors and then to make distributions to the Trust.
While we expect to make regular quarterly distributions to the holders of our common shares, if sufficient cash is not available for distribution from our operations, we may have to fund distributions from working capital, borrow to provide funds for such distributions, or reduce the amount of such distributions. To the extent we borrow to fund distributions, our future interest costs would increase, thereby reducing our earnings and cash available for distributions from what they otherwise would have been. If cash available for distribution generated by our assets is less than expected, or if such cash available for distribution decreases in future periods from expected levels, our inability to make distributions could result in a decrease in the market price of our common shares. All distributions are made at the discretion of our board of trustees. Any inability to make distributions, or to make distributions at expected levels in the future, could result in a decrease in the market price of our common shares.
Cybersecurity incidents could disrupt our business and result in the compromise of confidential information.
Our business is at risk from and may be impacted by cybersecurity attacks, including attempts to gain unauthorized access to our confidential data, and other electronic security breaches. Such cyber attacks can range from individual attempts to gain unauthorized access to our information technology systems to more sophisticated security threats. While we employ a number of measures to prevent, detect and mitigate these threats, there is no guarantee such efforts will be successful in preventing a cyber attack. Cybersecurity incidents could disrupt our business and compromise confidential information of ours and third parties, including our tenants.
22
We may not be able to sustain our growth rate level.
Since our inception in 2013 through
December 31, 2016
, our compounded annual growth rate was
150.0%
. This growth rate has contributed significantly to our growth in revenue. We may not be able to sustain this level of growth and over time we may experience a decline in our growth rate as a result of various factors, including changes in the economic and other conditions in geographic markets in which we conduct business, changes in the real estate market, changes in healthcare regulations, and the competitiveness of the real estate market. Additionally, our significant growth has resulted in increased levels of responsibility for our management, who may experience additional demands related to managing our current properties portfolio.
We have incurred operating losses in the past and we may not be able to maintain profitability.
Since our inception we have incurred operating losses and, as of
December 31, 2016
, we have an accumulated deficit of
$197.3 million
. Although our revenue has grown substantially and we achieved net profit in fiscal years
2015
and
2016
, our revenue growth rate may slow in the future and we cannot provide assurances that we will remain profitable in any quarterly or annual period in the future. Accordingly, you should not rely on the revenue growth or profitability of any prior quarterly or annual period as an indication of our future performance.
Our ability to issue equity to expand our business will depend, in part, upon the market price of our common shares, and our failure to meet market expectations with respect to our business could negatively affect the market price of our common shares and thereby limit our ability to raise capital.
The availability of equity capital to us will depend, in part, upon the market price of our common shares which, in turn, will depend upon various market conditions and other factors that may change from time to time. Our failure to meet the market’s expectation with regard to future earnings and cash distributions would likely adversely affect the market price of our common shares and, as a result, the cost and availability of equity capital to us.
Our issuance of equity securities, including OP Units, or the perception that such issuances might occur could materially adversely affect us, including the per share trading price of our common shares.
The vesting of any restricted shares granted to trustees, executive officers and other employees under our 2013 Equity Incentive Plan, the issuance of our common shares or OP Units in connection with future property, portfolio or business acquisitions and other issuances of our common shares may cause dilution to our shareholders and could have an adverse effect on the per share trading price of our common shares and may adversely affect the terms upon which we may be able to obtain additional capital through the sale of equity securities. In particular, on June 17, 2015, the Trust and the Operating Partnership filed an automatic shelf registration statement on Form S-3 with the Commission covering an indeterminate amount of common shares, preferred shares, convertible shares, debt securities, convertible debt securities or other types of securities from time to time (the “Automatic Shelf Registration Statement”). Pursuant to the Automatic Shelf Registration Statement, the Trust provided a full and unconditional guarantee of the debt securities of the Operating Partnership. Any offering pursuant to the Automatic Shelf Registration Statement, whether a follow-on public offering, pursuant to our $300 million at-the-market offering program, or otherwise, may cause dilution to our shareholders or the Operating Partnership’s limited partners and could cause the per share trading price of our common shares to decline.
The income from certain of our properties is dependent on the ability of our property managers to successfully manage those properties.
We depend upon the performance of our property managers to effectively manage certain of our properties and real estate assets. We do not control these third party property managers, and are accordingly subject to various risks generally associated with outsourcing of management of day-to-day activities. The income we recognize from any properties managed by third party property managers is dependent on the ability of the property manager of such property to successfully manage the property, which such property management is not within our control. Property managers generally compete with other companies in the management of properties, including the quality of care provided, reputation, physical appearance of the property, and price and location, among others. A property manager’s inability to successfully compete with other companies on one or more of the foregoing aspects could adversely impact our business and results of operations. Additionally, because we do not control third party property managers, any adverse events such as issues related to insufficient internal controls, cybersecurity incidents or other adverse events may impact the income we recognize from properties managed by such third party property managers. We may be unable to anticipate such events or properly assess the magnitude of any such events because we do no control third party property managers who provide property management services to us.
23
Risks Related to the Healthcare Industry
The healthcare industry is heavily regulated, and new laws or regulations, changes to existing laws or regulations, loss of licensure or failure to obtain licensure could adversely impact our company and result in the inability of our tenants to make rent payments to us.
The healthcare industry is heavily regulated by U.S. federal, state and local governmental authorities. Our tenants generally are subject to laws and regulations covering, among other things, licensure, certification for participation in
government programs, billing for services, privacy and security of health information and relationships with physicians and other referral sources. In addition, new laws and regulations, changes in existing laws and regulations or changes in the
interpretation of such laws or regulations could negatively affect our financial condition and the financial condition of our tenants. These changes, in some cases, could apply retroactively. The enactment, timing or effect of legislative or regulatory changes cannot be predicted.
The Patient Protection and Affordable Care Act of 2010 (the “Affordable Care Act”) and the Health Care and Education Reconciliation Act of 2010, which amends the Affordable Care Act (collectively, the “Health Reform Laws”) are changing how healthcare services are covered, delivered and reimbursed through expanded coverage of uninsured individuals and reduced Medicare program spending. In addition, the new law reforms certain aspects of health insurance, expands existing efforts to tie Medicare and Medicaid payments to performance and quality and contains provisions intended to strengthen fraud and abuse enforcement. The complexities and ramifications of the Affordable Care Act are significant and are being implemented in a phased approach which began in 2010. At this time, it is difficult to predict the full effects of the Affordable Care Act and its impact on our business, our revenues and financial condition and those of our tenants due to the law’s complexity, lack of implementing regulations or interpretive guidance, gradual implementation and possible amendment. Further, we are unable to foresee how individuals and businesses will respond to the choices afforded them by the Affordable Care Act, or the effect of any potential changes made to the Affordable Care Act or other healthcare laws and programs. The Affordable Care Act could adversely affect the reimbursement rates received by our tenants, the financial success of our tenants and strategic partners and consequently us.
On June 28, 2012, the United States Supreme Court upheld the individual mandate of the Affordable Care Act but partially invalidated the expansion of Medicaid. The ruling on Medicaid expansion allow states not to participate in the
expansion (and to forego funding for the Medicaid expansion) without losing their existing Medicaid funding. While the U.S. federal government paid for approximately 100% of those additional costs from 2014 to 2016, states now are expected to pay a small percentage of those additional costs. Because the U.S. federal government substantially funds the Medicaid expansion, it is unclear how many states ultimately will elect this option. The participation by states in the Medicaid expansion could have the effect of increasing some of our tenants’ revenues but also could be a strain on U.S. federal government and state budgets.
Since the enactment of the Health Reform Laws, there have been multiple attempts through legislative action and legal challenge to repeal or amend the law, including the case that was before the U.S. Supreme Court,
King v. Burwell
. Although the Supreme Court in
Burwell
upheld the use of subsidies to individuals in federally-facilitated health care exchanges on June 25, 2015, which ultimately did not disrupt significantly the implementation of the Health Reform Laws, we cannot predict whether other current or future efforts to repeal or amend the Health Reform Laws will be successful, nor can we predict the impact that such a repeal or amendment would have on our operators or tenants and their ability to meet their obligations to us.
President Trump and leadership in Congress have publicly stated their intention to repeal and replace (or modify) the Affordable Care Act. On January 20, 2017, President Trump issued an Executive Order stating that it is the administration’s official policy to repeal the Affordable Care Act and instructing the Secretary of Health and Human Services and the heads of all other executive departments and agencies with authority and responsibility under the Affordable Care Act to, among other matters, delay implementation of or grant an exemption from any provision of the Affordable Care Act that would impose a fiscal burden on any state or a cost, fee, tax, penalty, or regulatory burden on individuals, families, healthcare providers, health insurers, patients, and others. We cannot predict the effect of this Executive Order on the Affordable Care Act, or whether attempt to repeal and replace the law will be successful.
Further, we cannot predict how the Affordable Care Act might be amended or modified, either through the legislative or judicial process, and how any such modification might impact our tenants’ operations or the net effect of this law on us. If the operations, cash flows or financial condition of our operators and tenants are materially adversely impacted by any repeal or modification of the law, our revenue and operations may be adversely affected as well.
24
Recent changes to healthcare laws and regulations, including to government reimbursement programs such as Medicare and reimbursement rates applicable to our current and future tenants, could have a material adverse effect on the financial condition of our tenants and, consequently, their ability to meet obligations to us.
Statutory and regulatory policy changes and decisions may impact one or more specific unique providers that lease space in any of our facilities. In particular, the following recent changes to healthcare laws and regulations may apply to our tenants:
|
•
|
Recent amendments to an existing statutory moratorium on the establishment of new long-term care hospitals (“LTCH”), the establishment of new LTCH satellite facilities, and bed increases within such existing facilities, which is in effect through September 30, 2017, could impact the Medicare participation of facilities that are not already participating in the Medicare program as LTCHs.
|
|
•
|
The Medicare Access and CHIP Reauthorization Act of 2015 (“MACRA”) reforms Medicare payment policy for services paid under the Medicare physician fee schedule and adopts a series of policy changes affecting a wide range of providers and suppliers. MACRA repeals the sustainable growth rate (the “SGR”) formula effective January 1, 2015, and establishes a new payment framework which may impact payment rates for our tenants, including LTCHs.
|
|
•
|
The Bipartisan Budget Act of 2013 (the “BBA”) establishes new payment limits for Medicare patients discharged from a LTCH who do not meet specified criteria. For any Medicare patient who does not meet the new criteria, the LTCH will be paid a lower “site-neutral” payment rate (subject to a transition period through September 30, 2017), which may impact the financial condition of tenants affected by the lower payment rate. Additionally, new rules may cause all discharges from LTCHs to be paid at the site-neutral rate if the number of discharges for which payment is made under the site-neutral payment rate is greater than 50% of the total number of discharges from the LTCH.
|
|
•
|
The Affordable Care Act instituted a market basket payment adjustment to LTCHs. In fiscal years 2017 through 2019, the market basket update will be reduced by 0.75%. The Affordable Care Act specifically allows these market basket reductions to result in a less than 0% payment update and payment rates that are less than the prior year. MACRA sets the annual update for fiscal year 2018 at 1% after taking into account the market basket payment reduction of 0.75% mandated by the Affordable Care Act.
|
These regulatory changes may have an adverse financial impact on the net operating revenues and profitability of many LTCHs for cost reporting periods beginning on or after July 1, 2016, which could have an impact on their ability to pay rent due to us.
Many states also regulate the establishment and construction of healthcare facilities and services, and the expansion of existing healthcare facilities and services through certificate of need, or CON, laws, which may include regulation of certain types of beds, medical equipment and capital expenditures. Under such laws, the applicable state regulatory body must determine a need exists for a project before the project can be undertaken. If any of our tenants seeks to undertake a CON-regulated project, but are not authorized by the applicable regulatory body to proceed with the project, these tenants could be prevented from operating in their intended manner and could be materially adversely affected.
The application of lower reimbursement rates to our tenants or failure to qualify for existing rates under certain exceptions, the failure to comply with these laws and regulations, or the failure to secure CON approval to undertake a desired project could adversely affect our tenants’ ability to make rent payments to us which may have an adverse effect on our business, financial condition and results of operations, our ability to make distributions to our shareholders and the trading price of our common shares.
Adverse trends in healthcare provider operations may negatively affect our lease revenues and our ability to make distributions to our shareholders.
The healthcare industry is currently experiencing, among other things:
|
•
|
changes in the demand for and methods of delivering healthcare services;
|
|
•
|
changes in third party reimbursement methods and policies;
|
|
•
|
consolidation and pressure to integrate within the healthcare industry through acquisitions and joint ventures; and
|
|
•
|
increased scrutiny of billing, referral and other practices by U.S. federal and state authorities.
|
These factors may adversely affect the economic performance of some or all of our tenants and, in turn, our lease revenues, which may have a material adverse effect on our business, financial condition and results of operations, our ability to make distributions to our shareholders and the trading price of our common shares.
25
Reductions in reimbursement from third party payors, including Medicare and Medicaid, could adversely affect the profitability of our tenants and hinder their ability to make rent payments to us or renew their lease.
Sources of revenue for our tenants typically include the U.S. federal Medicare program, state Medicaid programs, private insurance payors and health maintenance organizations. Healthcare providers continue to face increased government and private payor pressure to control or reduce healthcare costs and significant reductions in healthcare reimbursement, including reduced reimbursements and changes to payment methodologies under the Affordable Care Act. In some cases, private insurers rely upon all or portions of the Medicare payment systems to determine payment rates which may result in decreased reimbursement from private insurers.
The slowdown in the United States economy has negatively affected state budgets, thereby putting pressure on states to decrease spending on state programs including Medicaid. The need to control Medicaid expenditures may be exacerbated by the potential for increased enrollment in state Medicaid programs due to unemployment and declines in family incomes. Historically, states have often attempted to reduce Medicaid spending by limiting benefits and tightening Medicaid eligibility requirements. Many states have adopted, or are considering the adoption of, legislation designed to enroll Medicaid recipients in managed care programs and/or impose additional taxes on hospitals to help finance or expand the states’ Medicaid systems. Potential reductions to Medicaid program spending in response to state budgetary pressures could negatively impact the ability of our tenants to successfully operate their businesses.
Efforts by payors to reduce healthcare costs will likely continue which may result in reductions or slower growth in reimbursement for certain services provided by some of our tenants. A reduction in reimbursements to our tenants from third party payors for any reason could adversely affect our tenants’ ability to make rent payments to us which may have a material adverse effect on our businesses, financial condition and results of operations, our ability to make distributions to our shareholders and the trading price of our common shares.
The Bipartisan Budget Act of 2015 (H.R. 1314) (the “2015 Budget Act”) provides changes to the requirements for providers who seek “hospital outpatient department” (“HOPD”) reimbursement under Medicare.
Section 603 of the 2015 Budget Act generally requires providers who seek to qualify for HOPD to be located on the campus of the hospital that seeks such HOPD, which generally is higher than reimbursement for providers that do not qualify as HOPD providers. The 2015 Budget Act specifically grandfathers HOPD providers in existence as of November 2, 2015 and does not change such HOPD providers' eligibility for HOPD reimbursement.
We have a number of existing tenants that may be reimbursed as HOPD providers and but for the grandfathering protection of the 2015 Budget Act, may not be eligible for HOPD reimbursement in the future. Any provider who establishes a new HOPD location after November 2, 2015 will be subject to the 2015 Budget Act requirements and if any such provider does not satisfy the new requirements, then such provider will be reimbursed for claims billed on or after January 1, 2017 at generally lower reimbursement levels.
Failure to comply with the 2015 Budget Act requirements could adversely affect the ability of certain of our tenants to make rent payments to us, which may have an adverse effect on our business, financial condition and results of operations, our ability to make distributions to our shareholders and the trading price of our common shares.
Our tenants and our company are subject to fraud and abuse laws, the violation of which by a tenant may jeopardize the tenant’s ability to make rent payments to us.
There are various federal and state laws prohibiting fraudulent and abusive business practices by healthcare providers who participate in, receive payments from or are in a position to make referrals in connection with government-sponsored healthcare programs, including the Medicare and Medicaid programs. Our lease arrangements with certain tenants may also be subject to these fraud and abuse laws.
Violations of these laws may result in criminal and/or civil penalties that range from punitive sanctions, damage assessments, penalties, imprisonment, denial of Medicare and Medicaid payments and/or exclusion from the Medicare and Medicaid programs. In addition, the Affordable Care Act clarifies that the submission of claims for items or services generated in violation of the Anti-Kickback Statute constitutes a false or fraudulent claim under the False Claims Act. The federal government has taken the position, and some courts have held, that violations of other laws, such as the Stark Law, can also be a violation of the False Claims Act. Additionally, certain laws, such as the False Claims Act, allow for individuals to bring whistleblower actions on behalf of the government for violations thereof. Imposition of any of these penalties upon one of our
26
tenants or strategic partners could jeopardize that tenant’s ability to operate or to make rent payments or affect the level of occupancy in our healthcare properties, which may have a material adverse effect on our business, financial condition and results of operations, our ability to make distributions to our shareholders and the trading price of our common shares. Further, we enter into leases and other financial relationships with healthcare delivery systems that are subject to or impacted by these laws. We also have other investors who are healthcare providers in certain of our subsidiaries that own our healthcare properties. If any of our relationships, including those related to the other investors in our subsidiaries, are found not to comply with these laws, we and our healthcare provider investors may be subject to civil and/or criminal penalties.
Our healthcare-related tenants may be subject to significant legal actions that could subject them to increased operating costs and substantial uninsured liabilities, which may affect their ability to pay their rent payments to us, and we could be subject to healthcare industry violations.
As is typical in the healthcare industry, our tenants may become subject to claims that their services have resulted in patient injury or other adverse effects. Many of these tenants may have experienced an increasing trend in the frequency and severity of professional liability and general liability insurance claims and litigation asserted against them. The insurance coverage maintained by these tenants may not cover all claims made against them nor continue to be available at a reasonable cost, if at all. In some states, insurance coverage for the risk of punitive damages arising from professional liability and general liability claims and/or litigation may not, in certain cases, be available to these tenants due to state law prohibitions or limitations of availability. As a result, these types of tenants of our healthcare properties and healthcare-related facilities operating in these states may be liable for punitive damage awards that are either not covered or are in excess of their insurance policy limits.
We also believe that there has been, and will continue to be, an increase in governmental investigations of certain healthcare providers, particularly in the area of Medicare/Medicaid false claims, as well as an increase in enforcement actions resulting from these investigations. Insurance is not available to cover such losses. Any adverse determination in a legal proceeding or governmental investigation, any settlements of such proceedings or investigations in excess of insurance coverage, whether currently asserted or arising in the future, could have a material adverse effect on a tenant’s financial condition. If a tenant is unable to obtain or maintain insurance coverage, if judgments are obtained or settlements reached in excess of the insurance coverage, if a tenant is required to pay uninsured punitive damages, or if a tenant is subject to an uninsurable government enforcement action or investigation, the tenant could be exposed to substantial additional liabilities, which may affect the tenant’s ability to pay rent, which in turn could have a material adverse effect on our business, financial condition and results of operations, our ability to pay distributions to our shareholders and the trading price of our common shares. We could also be subject to costly government investigations or other enforcement actions which could have a material adverse effect on our business, financial condition and results of operations, our ability to pay distributions to our shareholders and the trading price of our common shares.
Risks Related to the Real Estate Industry
Our operating performance is subject to risks associated with the real estate industry.
Real estate investments are subject to various risks and fluctuations and cycles in value and demand, many of which are beyond our control. Certain events may decrease cash available for distributions as well as the value of our initial properties. These events include, but are not limited to:
|
•
|
vacancies or our inability to rent space on favorable terms, including possible market pressures to offer tenants rent abatements, tenant improvements, early termination rights or tenant-favorable renewal options;
|
|
•
|
inability to collect rent from tenants;
|
|
•
|
competition from other real estate investors with significant capital, including other real estate operating companies, REITs and institutional private equity or other investment funds;
|
|
•
|
reductions in the level of demand for healthcare properties and changes in the demand for certain healthcare-related properties;
|
|
•
|
increases in the supply of medical office space;
|
|
•
|
increases in expenses associated with our real estate operations, including, but not limited to, insurance costs, third party management fees, energy prices, real estate assessments and other taxes and costs of compliance with laws, regulations and governmental policies, and restrictions on our ability to pass such expenses on to our tenants; and
|
27
|
•
|
changes in, and changes in enforcement of, laws, regulations and governmental policies associated with real estate, including, without limitation, health, safety, environmental, zoning and tax laws, governmental fiscal policies and the ADA.
|
In addition, periods of economic slowdown or recession, such as the recent U.S. economic downturn, rising interest rates or declining demand for real estate, or the public perception that any of these events may occur, could result in a general decline in rents or an increased incidence of defaults under existing leases. If we cannot operate our properties to meet our financial expectations, our business, financial condition, results of operations, cash flow, per share trading price of our common shares and ability to satisfy our debt service obligations and to make distributions to our shareholders could be adversely affected.
Illiquidity of real estate investments could significantly impede our ability to respond to adverse changes in the performance of any of our properties.
Because real estate investments are relatively illiquid, our ability to promptly sell one or more of our properties in response to changing economic, financial and investment conditions is limited. The real estate market is affected by many factors, such as general economic conditions, availability of financing, interest rates and other factors, including supply and demand, that are beyond our control. We cannot predict whether we will be able to sell any of our properties for the price or on the terms set by us or whether any price or other terms offered by a prospective purchaser would be acceptable to us. We also cannot predict the length of time needed to find a willing purchaser and to close the sale of any of our properties. We may be required to expend funds to correct defects or to make improvements before a property can be sold. We cannot assure you that we will have funds available to correct those defects or to make those improvements.
In acquiring a property, we may agree to transfer restrictions that materially restrict us from selling that property for a period of time or impose other restrictions, such as a limitation on the amount of debt that can be placed on that property. These transfer restrictions would impede our ability to sell a property even if we deem it necessary or appropriate. These facts and any others that would impede our ability to respond to adverse changes in the performance of our properties may have an adverse effect on our business, financial condition, results of operations, or ability to make distributions to our shareholders and the trading price of our common shares.
Uncertain market conditions could cause us to sell our healthcare properties at a loss in the future.
We intend to hold our various real estate investments until such time as we determine that a sale or other disposition appears to be advantageous to achieve our investment objectives. Our senior management team and the Trust’s board of trustees may exercise their discretion as to whether and when to sell a healthcare related facility, and we will have no obligation to sell our buildings at any particular time. We generally intend to hold our healthcare properties for an extended period of time, and we cannot predict with any certainty the various market conditions affecting real estate investments that will exist at any particular time in the future. Because of the uncertainty of market conditions that may affect the future disposition of our healthcare properties, we may not be able to sell our properties at a profit in the future or at all. In addition, if we are unable to access the capital markets for financing in the future, we may need to sell some of our properties to raise capital. We may incur prepayment penalties in the event that we sell a property subject to a mortgage earlier than we otherwise had planned. Additionally, we could be forced to sell healthcare properties at inopportune times which could result in us selling the affected property at a substantial loss. Accordingly, the extent to which you will receive cash distributions and realize potential appreciation on our real estate investments will, among other things, be dependent upon fluctuating market conditions. Any inability to sell a healthcare property could adversely impact our ability to make debt payments and distributions to our shareholders.
Our assets may be subject to impairment charges.
We will periodically evaluate our real estate investments and other assets for impairment indicators. The judgment regarding the existence of impairment indicators is based upon factors such as market conditions, tenant performance and legal structure. For example, the termination of a lease by a major tenant may lead to an impairment charge. If we determine that an impairment has occurred, we would be required to make an adjustment to the net carrying value of the asset which could have an adverse effect on our results of operations in the period in which the impairment charge is recorded. In 2014, we recognized a $0.3 million impairment loss on a medical office building in Pickerington, Ohio, and a $1.5 million impairment loss on a medical office building in Lansing, Michigan. Both properties were vacant and were sold during 2015. For both properties, the impairment was assessed because the property’s carrying amount exceeded its estimated fair value. We have determined that none of our properties are impaired as of
December 31, 2016
.
28
Our investments in, or originations of, mezzanine and term loans will be subject to specific risks relating to the particular company, and our loan assets will involve greater risks of loss than senior loans secured by income-producing properties.
As of
December 31, 2016
, we have
eight
mezzanine loans and
two
term loans outstanding, and in the future, we may originate further loans. These investments involve special risks relating to the particular borrower, including its financial condition, liquidity, results of operations, business and prospects. We may also originate other real estate-related investments which take the form of subordinated loans secured by second mortgages on the underlying property or loans secured by a pledge of the ownership interests of either the entity owning the property or a pledge of the ownership interests of the entity that owns the interest in the entity owning the property or other properties. These types of assets involve a higher degree of risk than long-term senior mortgage lending secured by income producing real property, because the loan may become unsecured as a result of foreclosure by the senior lender and because it is in second position and there may not be adequate equity in the property. In the event of a bankruptcy of the entity providing the pledge of its ownership interests as security, we may not have full recourse to the assets of such entity, or the assets of the entity may not be sufficient to satisfy such loan. If a borrower defaults on a loan or debt senior to our loan, or in the event of a borrower bankruptcy, such loan will be satisfied only after the senior debt. We may be unable to enforce guaranties of payment and/or performance given as security for some loans. As a result, we may not recover some or all of our initial expenditure. Mezzanine and term loans may partially finance the construction of real estate projects and so involve additional risks inherent in the construction process, such as adherence to budgets and construction schedules. In addition, mezzanine and term loans may have higher loan-to-value ratios than conventional mortgage loans, resulting in less equity in the property and increasing the risk of loss of principal. Significant losses related to our mezzanine and term loans would result in operating losses for us and may limit our ability to make distributions to our shareholders.
Risks Related to Financings
Required payments of principal and interest on borrowings may leave us with insufficient cash to operate our properties or to pay the distributions currently contemplated or necessary to qualify as a REIT and may expose us to the risk of default under our debt obligations.
We historically borrow on our unsecured revolving credit facility to acquire properties. Then, as market conditions dictate, we have issued equity or long-term fixed rate debt to repay borrowings under our unsecured revolving credit facility. We are subject to risks associated with debt financing, including the risk that existing indebtedness may not be refinanced or that the terms of refinancing may not be as favorable as the terms of current indebtedness. The majority of our borrowings were completed under indentures or contractual agreements that limit the amount of indebtedness we may incur. Accordingly, in the event that we are unable to raise additional equity or borrow money because of these limitations, our ability to acquire additional properties may be limited.
As of
December 31, 2016
, we had approximately $
123.1 million
of mortgage debt on individual properties and approximately
$401.0 million
of borrowings outstanding under our unsecured revolving credit facility. In addition, in January 2016 and August 2016 we issued and sold $150.0 million and $75.0 million, respectively, aggregate principal amount of senior notes. We expect to incur additional debt in the future. We do not anticipate that our internally generated cash flow will be adequate to repay our existing indebtedness upon maturity, and, therefore, we expect to repay our indebtedness through refinancings and future offerings of equity and debt securities, either of which we may be unable to secure on favorable terms or at all. Our level of debt and the limitations imposed upon us by our debt agreements could have adverse consequences, including the following:
|
•
|
our cash flow may be insufficient to meet our required principal and interest payments;
|
|
•
|
we may be unable to borrow additional funds as needed or on favorable terms, including to make acquisitions;
|
|
•
|
we may be unable to refinance our indebtedness at maturity or the refinancing terms may be less favorable than the terms of our original indebtedness;
|
|
•
|
because a portion of our debt bears, or is expected to bear, interest at variable rates, an increase in interest rates could materially increase our interest expense;
|
|
•
|
we may fail to effectively hedge against interest rate volatility;
|
|
•
|
we may be forced to dispose of one or more of our properties, possibly on disadvantageous terms if we are able to do so at all;
|
|
•
|
our leverage could place us at a competitive disadvantage compared to our competitors who have less debt;
|
29
|
•
|
we may experience increased vulnerability to economic and industry downturns, reducing our ability to respond to changing business and economic conditions;
|
|
•
|
we may default on our obligations and the lenders or mortgagees may foreclose on our properties that secure their loans and receive an assignment of rents and leases;
|
|
•
|
we may violate financial covenants contained in our various loan documents which would cause a default on our obligations, giving lenders various remedies, including increased interest rates, foreclosure and liability for additional expenses;
|
|
•
|
we may inadvertently violate non-financial restrictive covenants in our loan documents, such as covenants that require us to maintain the existence of entities, maintain insurance policies and provide financial statements, which would entitle the lenders to accelerate our debt obligations; and
|
|
•
|
our default under any of our mortgage loans with cross-default or cross-collateralization provisions could result in default on other indebtedness and result in the foreclosures of other properties.
|
The realization of any or all of these risks may have an adverse effect on our business, financial condition and results of operations, our ability to make distributions to our shareholders and the trading price of our common shares.
As of
December 31, 2016
, we had approximately
$401.0 million
of borrowings outstanding under our unsecured revolving credit facility (including the term loan feature of our unsecured revolving credit facility) and we issued an aggregate of $225.0 million of debt, all of which is senior to our common shares upon liquidation, and we may in the future make offerings of debt or preferred equity securities which may be senior to our common shares for purposes of dividend distributions or upon liquidation, any of which may materially adversely affect the per share trading price of our common shares.
As of
December 31, 2016
, there were approximately
$401.0 million
of borrowings outstanding under our unsecured revolving credit facility (including the term loan feature of our unsecured revolving credit facility), and we issued $225.0 million of aggregate principal amount of senior notes. In the future, we may attempt to increase our capital resources by making additional offerings of debt or equity securities (or causing the Operating Partnership to issue debt securities), including medium-term notes, senior or subordinated notes and classes or series of preferred shares. Upon liquidation, holders of our debt securities and preferred shares and lenders with respect to other borrowings will be entitled to receive our available assets prior to distribution to the holders of our common shares. Additionally, any convertible or exchangeable securities that we issue in the future may have rights, preferences and privileges more favorable than those of our common shares and may result in dilution to owners of our common shares. Holders of our common shares are not entitled to preemptive rights or other protections against dilution. Our preferred shares would have a preference on liquidating distributions or a preference on dividend payments that could limit our ability pay dividends or other distributions to the holders of our common shares. Because our decision to issue securities in any future offering will depend on market conditions and other factors beyond our control, we cannot predict or estimate the amount, timing or nature of our future offerings. Thus, our shareholders bear the risk that our future offerings could reduce the per share trading price of our common shares and dilute their interest in us.
The derivative instruments that we may use to hedge against interest rate fluctuations may not be successful in mitigating our risks associated with interest rates and could reduce the overall returns on our shareholders’ investment.
We may use derivative instruments to hedge exposure to changes in interest rates on certain of our variable rate loans, but no hedging strategy can protect us completely. We cannot assure our shareholders that our hedging strategy and the derivatives that we use will adequately offset the risk of interest rate volatility or that our hedging of these transactions will not result in losses. Any settlement charges incurred to terminate unused derivative instruments may result in increased interest expense, which may reduce the overall return on our investments. These instruments may also generate income that may not be treated as qualifying REIT income for purposes of the 75% or 95% REIT income tests.
We rely upon external sources of capital to fund future capital needs, and, if we encounter difficulty in obtaining such capital, we may not be able to make future acquisitions necessary to grow our business or meet maturing obligations.
In order to qualify as a REIT under the Code, we are required, among other things, to distribute each year to our shareholders at least 90% of our taxable income, without regard to the deduction for dividends paid and excluding net capital gain. Because of this distribution requirement, we may not be able to fund all of our future capital needs from cash retained from operations, including capital needed to make investments and to satisfy or refinance maturing obligations. As a result, we expect to rely upon external sources of capital, including debt and equity financing, to fund future capital needs. If we are unable to obtain needed capital on satisfactory terms or at all, we may not be able to make the investments needed to expand
30
our business or to meet our obligations and commitments as they mature. Our access to capital will depend upon a number of factors over which we have little or no control, including general stock and bond market conditions and investor interest, the market’s perception of our current and potential future earnings, analyst reports about us and the REIT industry, cash distributions and the market price of our common shares, and other factors such as governmental regulatory action and changes in REIT tax laws. We may not be in a position to take advantage of attractive investment opportunities for growth if we are unable to access the capital markets on a timely basis on favorable terms.
We could become highly leveraged in the future because our organizational documents contain no limitations on the amount of debt that we may incur.
As of
December 31, 2016
, our indebtedness represented approximately
34.6%
of our total assets. However, our organizational documents contain no limitations on the amount of indebtedness that we may incur. We could alter the balance between our total outstanding indebtedness and the value of our properties at any time. If we become more highly leveraged, the resulting increase in outstanding debt could adversely affect our ability to make debt service payments, to pay our anticipated distributions and to make the distributions required to qualify as a REIT. The occurrence of any of the foregoing risks could adversely affect our business, financial condition and results of operations, our ability to make distributions to our shareholders and the trading price of our common shares.
We are subject to covenants in our debt agreements that may restrict or limit our operations and acquisitions and our failure to comply with the covenants in our debt agreements could have a material adverse impact on our business, results of operations and financial condition.
The terms of the instruments governing our existing indebtedness require us to comply with a number of customary financial and other covenants, such as maintaining certain leverage and coverage ratios and minimum tangible net worth requirements. Our continued ability to incur additional debt and to conduct business in general is subject to our compliance with these covenants, which limit our operational flexibility. Breaches of these covenants could result in defaults under the instruments governing the applicable indebtedness, in addition to any other indebtedness cross-defaulted against such instruments. Any such default could have a material adverse impact on our business, results of operations and financial condition or our ability to make distributions to our shareholders.
Increases in interest rates may increase our interest expense and adversely affect our cash flows, our ability to service our indebtedness and our ability to make distributions to our shareholders, and could cause our stock price to decline.
One of the factors that influences the trading prices of our common shares is the dividend yield on the common shares (as a percentage of the price of our common shares) relative to market interest rates. Since the most recent recession, the U.S. Federal Reserve has taken actions which have resulted in low interest rates prevailing in the marketplace for a historically long period of time. However, in each of December 2015 and December 2016, the U.S. Federal Reserve raised its benchmark interest rate by a quarter of a percentage point. In addition, in the latter part of 2016, U.S. government bond prices fell significantly, which is generally inversely correlated with rising interest rates. Further increases in market interest rates may lead prospective purchasers of our common shares to expect a higher dividend yield (with a resulting decline in the trading prices of our common shares) and higher interest rates would likely increase our borrowing costs for both our existing and future indebtedness and potentially decrease funds available for distribution. Thus, higher market interest rates could cause the market price of our common shares to decrease.
Additionally, as of
December 31, 2016
, we had approximately
$434.0 million
of variable-rate indebtedness outstanding that has not been swapped for a fixed interest rate and we expect that more of our indebtedness in the future, including borrowings under our unsecured revolving credit facility since
December 31, 2016
and thereafter, will be subject to variable interest rates. Increases in interest rates on any variable rate indebtedness will increase our interest expense, which could adversely affect our cash flow and our ability to pay distributions to our shareholders.
Failure to hedge effectively against interest rate changes may adversely affect our results of operations.
In certain cases, we may seek to manage our exposure to interest rate volatility by using interest rate hedging arrangements. Hedging involves risks, such as the risk that the counterparty may fail to honor its obligations under an arrangement, that the arrangements may not be effective in reducing our exposure to interest rate changes and that a court could rule that such an agreement is not legally enforceable. In addition, we may be limited in the type and amount of hedging transactions that we may use in the future by our need to satisfy the REIT income tests under the Code. Failure to hedge effectively against interest rate changes may have an adverse effect on our business, financial condition, results of operations, our ability to make distributions to our shareholders and the trading price of our common shares.
31
A downgrade in our credit ratings could materially adversely affect our business and financial condition.
Our credit rating and the credit ratings assigned to our debt securities could change based upon, among other things, our results of operations and financial condition. These ratings are subject to ongoing evaluation by credit rating agencies, and any rating could be changed or withdrawn by a rating agency in the future if, in its judgment, circumstances warrant such action.
If any of the credit rating agencies that have rated our securities downgrades or lowers its credit rating, or if any credit rating agency indicates that it has placed any such rating on a “watch list” for a possible downgrade or lowering, or otherwise indicates that its outlook for that rating is negative, such action could have a material adverse effect on our costs and availability of funding, which could in turn have a material adverse effect on our financial condition, results of operations, cash flows, the trading price of our securities and our ability to satisfy our debt service obligations, among other obligations.
If securities analysts do not publish research or reports about our industry or if they downgrade our common shares or the healthcare-related real estate sector, the market price of our common shares could decline.
The trading market for our common shares depends in part upon the research and reports that industry or financial analysts publish about us and our industry. We have no control over these analysts. Furthermore, if one or more of the analysts who do cover us downgrades our shares or our industry, or the stock of any of our competitors, the price of our common shares could decline. If one or more of these analysts ceases coverage of our company, we could lose attention in the market which in turn could cause the market price of our common shares to decline.
Risks Related to Our Portfolio and Structure
We have no direct operations and rely upon funds received from the Operating Partnership to meet our obligations.
We conduct substantially all of our operations through the Operating Partnership. As of
February 17, 2017
, the Trust owned approximately
97.7%
of the OP Units and apart from this ownership interest, the Trust does not have any independent operations. As a result, the Trust relies upon distributions from the Operating Partnership to pay any distributions that the Trust might declare on the Trust’s common shares. We also rely upon distributions from the Operating Partnership to the Trust to meet our obligations, including tax liability on taxable income allocated to the Trust from the Operating Partnership (which might make distributions to the Trust not equal to the tax on such allocated taxable income). Shareholders’ claims will consequently be structurally subordinated to all existing and future liabilities and obligations (whether or not for borrowed money) of the Operating Partnership and its subsidiaries. Therefore, in the event of bankruptcy, liquidation or reorganization of the Trust, claims of the Trust’s shareholders will be satisfied only after all of the Trust’s and the Operating Partnership’s and its subsidiaries’ liabilities and obligations have been paid in full.
Failure to maintain effective internal control over financial reporting could harm our business, results of operations and financial condition.
Pursuant to the Sarbanes-Oxley Act of 2002, we are required to provide a report by management on internal control over financial reporting, including management’s assessment of the effectiveness of such control. Because of its inherent limitations, including the possibility of human error, the circumvention or overriding of controls, or fraud, effective internal controls over financial reporting may not prevent or detect misstatement and can provide only reasonable assurance with respect to the preparation and fair presentation of financial statements. If we fail to maintain the adequacy of our internal controls, including any failure to implement required new or improved controls as a result of changes to our business or otherwise, or if we experience difficulties in their implementation, our business, results of operations and financial condition could be materially adversely impacted and we could fail to meet our reporting obligations.
Our business could be harmed if key personnel terminate their employment with us or if we are unsuccessful in integrating new personnel into our operations.
Our success depends, to a significant extent, on the continued services of Mr. Thomas, our President and Chief Executive Officer, Mr. Theiler, our Executive Vice President and Chief Financial Officer, Mr. Taylor, our Executive Vice President – Investments, Mr. Lucey, our Senior Vice President – Chief Accounting and Administrative Officer, Mr. Theine, our Senior Vice President of Asset and Investment Management and Mr. Page, our Senior Vice President and General Counsel. We do not maintain key person life insurance on any of our officers. Our ability to continue to acquire and develop healthcare properties depends upon the significant relationships that our senior management team has developed over many years.
32
Although the Trust has entered into employment agreements with Messrs. Thomas, Theiler, Taylor, Lucey, Theine and Page, we cannot provide any assurance that any of them will remain employed by the Trust. Our ability to retain our senior management team, or to attract suitable replacements should any member of the senior management team leave, is dependent on the competitive nature of the employment market. The loss of services of, or the failure to successfully integrate one or more new members of, our senior management team could adversely affect our business and our prospects.
Conflicts of interest could arise as a result of our UPREIT structure.
Conflicts of interest could arise in the future as a result of the relationships between the Trust and its affiliates, on the one hand, and the Operating Partnership or any partner thereof, on the other. The Trust’s trustees and officers have duties to the Trust under applicable Maryland law in connection with their management of our company. At the same time, the Trust, as general partner, has fiduciary duties to the Operating Partnership and to the limited partners under Delaware law in connection with the management of the Operating Partnership. The Trust’s duties, as general partner, to the Operating Partnership and its limited partners may come into conflict with the duties of the Trust’s trustees and officers to the Trust.
Unless otherwise provided for in the relevant partnership agreement, Delaware law generally requires a general partner of a Delaware limited partnership to adhere to fiduciary duty standards under which it owes its limited partners the highest duties of good faith, fairness and loyalty and which generally prohibits such general partner from taking any action or engaging in any transaction as to which it has a conflict of interest.
Additionally, the partnership agreement expressly limits liability by providing that the Trust, as the general partner of the Operating Partnership, and the Trust’s trustees and officers are not be liable or accountable in damages to the Operating Partnership, the limited partners or assignees for errors in judgment, mistakes of fact or law or for any act or omission if the Trust or its trustees or officers acted in good faith. In addition, the Operating Partnership is required to indemnify the Trust, its affiliates and each of their respective officers and trustees, to the fullest extent permitted by applicable law against any and all losses, claims, damages, liabilities (whether joint or several), expenses (including, without limitation, attorneys’ fees and other legal fees and expenses), judgments, fines, settlements and other amounts arising from any and all claims, demands, actions, suits or proceedings, civil, criminal, administrative or investigative, that relate to the operations of the Operating Partnership, provided that the Operating Partnership will not indemnify any such person for (1) acts or omissions committed in bad faith or that were the result of active and deliberate dishonesty, (2) any transaction for which such person received an improper personal benefit in money, property or services, or (3) in the case of a criminal proceeding, the person had reasonable cause to believe the act or omission was unlawful.
The provisions of Delaware law that allow the common law fiduciary duties of a general partner to be modified by a partnership agreement have not been resolved in a court of law, and we have not obtained an opinion of counsel covering the provisions set forth in the partnership agreement that purport to waive or restrict our fiduciary duties that would be in effect under common law were it not for the partnership agreement.
The Trust’s declaration of trust restricts the ownership and transfer of our outstanding shares of beneficial interest which may have the effect of delaying, deferring or preventing a transaction or change of control of our company.
In order for us to qualify as a REIT, no more than 50% of the value of the Trust’s outstanding shares of beneficial interest may be owned, beneficially or constructively, by five or fewer individuals at any time during the last half of each taxable year other than our initial REIT taxable year. Subject to certain exceptions, the Trust’s declaration of trust prohibits any shareholder from owning beneficially or constructively more than 9.8% in value or number of shares, whichever is more restrictive, of the outstanding shares of any class or series of our shares of beneficial interest, although the Trust has granted, and may in the future grant, a waiver from the ownership limitations. The constructive ownership rules under the Code are complex and may cause the outstanding shares owned by a group of related individuals or entities to be deemed to be constructively owned by one individual or entity. As a result, the acquisition of less than 9.8% of our outstanding shares of any class or series by an individual or entity could cause that individual or entity to own constructively in excess of 9.8% of the outstanding shares of any class or series of our shares of beneficial interest and to be subject to the Trust’s declaration of trust’s ownership limit. The Trust’s declaration of trust also prohibits, among other prohibitions, any person from owning our shares of beneficial interest that would result in our being “closely held” under Section 856(h) of the Code or otherwise cause us to fail to qualify as a REIT. Any attempt to own or transfer shares of our beneficial interest in violation of these restrictions may result in the shares being automatically transferred to a charitable trust or may be void.
33
Certain provisions of Maryland law could inhibit changes of control, which may discourage third parties from conducting a tender offer or seeking other change of control transactions that could involve a premium price for our common shares or that our shareholders otherwise believe to be in their best interests.
Certain provisions of the Maryland General Corporation Law, or MGCL, applicable to Maryland real estate investment trusts may have the effect of inhibiting a third party from making a proposal to acquire the Trust (and, indirectly, the Operating Partnership) or of impeding a change of control under circumstances that otherwise could provide the Trust’s common shareholders with the opportunity to realize a premium over the then-prevailing market price of such shares, including:
|
•
|
“business combination” provisions that, subject to limitations, prohibit certain business combinations between us and an “interested shareholder” (defined generally as any person who beneficially owns 10% or more of the voting power of our shares or an affiliate or associate of ours who was the beneficial owner, directly or indirectly, of 10% or more of the voting power of our shares at any time within the two-year period immediately prior to the date in question) or an affiliate thereof for five years after the most recent date on which the shareholder becomes an interested shareholder, and thereafter imposes certain minimum price and/or supermajority shareholder voting requirements on these combinations; and
|
|
•
|
“control share” provisions that provide that holders of “control shares” of our Trust (defined as shares that, when aggregated with all other shares controlled by the shareholder, entitle the shareholder to exercise one of three increasing ranges of voting power in electing trustees) acquired in a “control share acquisition” (defined as the direct or indirect acquisition of ownership or control of issued and outstanding “control shares,” subject to certain exceptions) have no voting rights with respect to their control shares, except to the extent approved by our shareholders by the affirmative vote of at least two-thirds of all the votes entitled to be cast on the matter, excluding all interested shares.
|
Pursuant to the statute, the Trust’s board of trustees has by resolution exempted any business combination between us and any other person from the business combination provisions of the MGCL, provided that the business combination is first approved by the board of trustees (including a majority of trustees who are not affiliates or associates of such person). In addition, the Trust’s bylaws contain a provision exempting any and all acquisitions of our shares from the control share provisions of the MGCL. However, the board of trustees may at any time alter or repeal the resolution exempting certain businesses from the business combination provisions of the MGCL and we may at any time amend or eliminate the provision of our bylaws exempting acquisitions of our shares from the control share provisions of the MGCL.
Certain provisions of the MGCL permit the board of trustees, without shareholder approval and regardless of what is currently provided in the Trust’s declaration of trust or bylaws, to implement certain corporate governance provisions with respect to the Trust, some of which (for example, a classified board) are not currently applicable to us. If implemented, these provisions may have the effect of limiting or precluding a third party from making an unsolicited acquisition proposal for us or of delaying, deferring or preventing a change in control of us under circumstances that otherwise could provide our common shareholders with the opportunity to realize a premium over the then current market price. Pursuant to our declaration of trust, we have elected to be subject to the provisions of Title 3, Subtitle 8 of the MGCL relating to the filling of vacancies on our board of trustees.
We could increase the number of authorized shares, classify and reclassify unissued shares and issue shares without shareholder approval.
The Trust’s board of trustees, without shareholder approval, has the power under the Trust’s declaration of trust to amend our declaration of trust to increase or decrease the aggregate number of shares or the number of shares of any class or series of the Trust that we are authorized to issue, and to authorize us to issue authorized but unissued common shares or preferred shares. In addition, under the declaration of trust, the board of trustees has the power to classify or reclassify any unissued common or preferred shares into one or more classes or series of shares and set or change the preference, conversion or other rights, voting powers, restrictions, limitations as to dividends and other distributions, qualifications or terms or conditions of redemption for such newly classified or reclassified shares. As a result, we may issue series or classes of common shares or preferred shares with preferences, dividends, powers and rights, voting or otherwise, that are senior to, or otherwise conflict with, the rights of holders of our common shares. Although the board of trustees has no such intention at the present time, it could establish a class or series of preferred shares that could, depending on the terms of such class or series, delay, defer or prevent a transaction or a change of control that might involve a premium price for our common shares or that our shareholders otherwise believe to be in their best interests.
34
Our rights and the rights of our shareholders to take action against our trustees and officers are limited, which could limit your recourse in the event that we take certain actions which are not in your best interests.
The Trust’s declaration of trust eliminates the liability of our trustees and officers to us and our shareholders for money damages, except for liability resulting from:
|
•
|
actual receipt of an improper benefit or profit in money, property or services; or
|
|
•
|
active and deliberate dishonesty by the trustee or officer that was established by a final judgment and is material to the cause of action adjudicated.
|
The declaration of trust authorizes us to indemnify our present and former trustees and officers for actions taken by them in those and other capacities to the maximum extent permitted by Maryland law. Our Trust’s bylaws obligate us to indemnify each present and former trustee or officer, to the maximum extent permitted by Maryland law, in the defense of any proceeding to which he or she is made, or threatened to be made, a party by reason of his or her service to us. In addition, we may be obligated to advance the defense costs incurred by our trustee and officers. The Trust has also entered into indemnification agreements with its officers and trustees granting them express indemnification rights. As a result, we and our shareholders may have more limited rights against our trustees and officers than might otherwise exist absent the current provisions in the Trust’s declaration of trust, bylaws and indemnification agreements or that might exist with other companies.
The declaration of trust contains provisions that make removal of the Trust’s trustees difficult, which could make it difficult for our shareholders to effect changes to our management and may prevent a change in control of our company that is in the best interests of our shareholders. The Trust’s declaration of trust provides that a trustee may only be removed for cause upon the affirmative vote of holders of two-thirds of all the votes entitled to be cast generally in the election of trustees. Vacancies may be filled only by a majority of the remaining trustees in office, even if less than a quorum. These requirements make it more difficult to change our management by removing and replacing trustees and may prevent a change in control of our company that is in the best interests of our shareholders.
Certain provisions in the partnership agreement of the Operating Partnership may delay or prevent unsolicited acquisitions of us.
Provisions in the partnership agreement of the Operating Partnership may delay, or make more difficult, unsolicited acquisitions of us or changes of our control. These provisions could discourage third parties from making proposals involving an unsolicited acquisition of us or change of our control, although some shareholders might consider such proposals, if made, desirable. These provisions include, among others:
|
•
|
redemption rights;
|
|
•
|
a requirement that the Trust may not be removed as the general partner of the Operating Partnership without our consent;
|
|
•
|
transfer restrictions on OP Units;
|
|
•
|
the Trust’s ability, as general partner, in some cases, to amend the partnership agreement and to cause the Operating Partnership to issue units with terms that could delay, defer or prevent a merger or other change of control of the Trust or the Operating Partnership without the consent of the limited partners; and
|
|
•
|
the right of the limited partners to consent to direct or indirect transfers of the general partnership interest, including as a result of a merger or a sale of all or substantially all of our assets, in the event that such transfer requires approval by our common shareholders.
|
The Trust’s declaration of trust and bylaws, Maryland law and the partnership agreement of the Operating Partnership also contain other provisions that may delay, defer or prevent a transaction or a change of control that might involve a premium price for our common shares or that our shareholders otherwise believe to be in their best interest.
35
Risks Related to Our Qualification and Operation as a REIT
If we fail to qualify as a REIT in any taxable year, we will face serious tax consequences that would substantially reduce funds available for distributions to our shareholders.
Since our formation, the Trust has been organized and has operated in such a manner as to qualify for taxation as a REIT under the U.S. federal income tax laws, and we intend to continue to operate in such a manner, but no assurances can be given that we will operate in a manner so as to qualify or remain qualified as a REIT.
Failure to qualify as a REIT, or failure to remain qualified as a REIT, would cause us to be taxed as a regular corporation, which would substantially reduce funds available for distributions to our shareholders. If we fail to qualify as a REIT in any taxable year, we would face serious tax consequences that will substantially reduce the funds available for distributions to our shareholders because:
|
•
|
we would not be allowed a deduction for dividends paid to shareholders in computing our taxable income and would be subject to U.S. federal income tax at regular corporate rates;
|
|
•
|
we could be subject to the federal alternative minimum tax and possibly increased state and local taxes; and
|
|
•
|
unless we are entitled to relief under certain U.S. federal income tax laws, we could not re-elect REIT status until the fifth calendar year after the year in which we failed to qualify as a REIT.
|
In addition, if the Trust fails to qualify as a REIT, we will no longer be required to make distributions. As a result of all these factors, the Trust’s failure to qualify as a REIT could impair our ability to expand our business and raise capital, and it would adversely affect the value of our shares of beneficial interest.
Even if we qualify as a REIT, we may face other tax liabilities that reduce our cash flows.
Even if we qualify for taxation as a REIT, we may be subject to certain federal, state and local taxes on our income and assets, including taxes on any undistributed income, tax on income from some activities conducted as a result of a foreclosure, and state or local income, property and transfer taxes. In addition, any taxable REIT subsidiary, or “TRS,” that we may form would be subject to regular corporate federal, state and local taxes. Any of these taxes would decrease cash available for distributions to shareholders.
Failure to make required distributions would subject us to U.S. federal corporate income tax.
The Trust intends to operate in a manner so as to qualify as a REIT for U.S. federal income tax purposes. In order to qualify as a REIT, we generally are required to distribute at least 90% of our REIT taxable income, determined without regard to the dividends paid deduction and excluding any net capital gain, each year to our shareholders. To the extent that we satisfy this distribution requirement, but distribute less than 100% of our REIT taxable income, we will be subject to U.S. federal corporate income tax on our undistributed taxable income. In addition, we will be subject to a 4% nondeductible excise tax if the actual amount that we pay out to our shareholders in a calendar year is less than a minimum amount specified under the Internal Revenue Code of 1986, as amended (the “Code”).
Complying with REIT requirements may cause us to forego otherwise attractive opportunities or liquidate otherwise attractive investments.
To qualify as a REIT for federal income tax purposes, we must continually satisfy tests concerning, among other things, the sources of our income, the nature and diversification of our assets, the amounts we distribute to our shareholders and the ownership of our shares of beneficial interest. In order to meet these tests, we may be required to forego investments we might otherwise make. Thus, compliance with the REIT requirements may hinder our performance.
In particular, we must ensure that at the end of each calendar quarter, at least 75% of the value of our assets consists of cash, cash items, government securities and qualified real estate assets. The remainder of our investment in securities (other than government securities, securities of TRSs and qualified real estate assets) generally cannot include more than 10% of the outstanding voting securities of any one issuer or more than 10% of the total value of the outstanding securities of any one issuer. In addition, in general, no more than 5% of the value of our assets (other than government securities, securities of TRSs and qualified real estate assets) can consist of the securities of any one issuer, and no more than 25% (reduced to 20% for taxable years beginning after December 31, 2017) of the value of our total assets can be represented by the securities of one or more TRSs. Further, debt instruments that do not otherwise qualify as real estate assets issued to us by publicly offered REITs
36
will be treated as qualified real estate assets for purposes of the asset test, but no more than 25% of the value of our total assets may be represented by such debt instruments. If we fail to comply with these requirements at the end of any calendar quarter, we must correct the failure within 30 days after the end of the calendar quarter or qualify for certain statutory relief provisions to avoid losing our REIT qualification and suffering adverse tax consequences. As a result, we may be required to liquidate otherwise attractive investments. These actions could have the effect of reducing our income and amounts available for distribution to our shareholders.
The prohibited transactions tax may limit our ability to dispose of our properties.
A REIT’s net income from prohibited transactions is subject to a 100% tax. In general, prohibited transactions are sales or other dispositions of property other than Foreclosure Property, held primarily for sale to customers in the ordinary course of business. We may be subject to the prohibited transactions tax equal to 100% of net gain upon a disposition of real property. Although a safe harbor to the characterization of the sale of real property by a REIT as a prohibited transaction is available, we cannot assure you that we can comply with the safe harbor or that we will avoid owning property that may be characterized as held primarily for sale to customers in the ordinary course of business. Consequently, we may choose not to engage in certain sales of our properties or may conduct such sales through any TRS that we may form, which would be subject to federal and state income taxation.
We may pay taxable dividends in our common shares and cash, in which case shareholders may sell our common shares to pay tax on such dividends, placing downward pressure on the market price of our common shares.
We may distribute taxable dividends that are payable in cash and common shares at the election of each shareholder. The IRS has issued private letter rulings to other REITs treating certain distributions that are paid partly in cash and partly in shares as taxable dividends that would satisfy the REIT annual distribution requirement and qualify for the dividends paid deduction for U.S. federal income tax purposes. Those rulings may be relied upon only by taxpayers to whom they were issued, but we could request a similar ruling from the IRS. In addition, the IRS issued a revenue procedure creating a temporary safe harbor that authorized publicly traded REITs to make elective cash/share dividends, but that temporary safe harbor has expired. Accordingly, it is unclear whether and to what extent we will be able to make taxable dividends payable in cash and common shares.
If we made a taxable dividend payable in cash and common shares, taxable shareholders receiving such dividends will be required to include the full amount of the dividend as ordinary income to the extent of our current and accumulated earnings and profits, as determined for U.S. federal income tax purposes. As a result, shareholders may be required to pay income tax with respect to such dividends in excess of the cash dividends received. If a U.S. shareholder sells the common shares that it receives as a dividend in order to pay this tax, the sales proceeds may be less than the amount included in income with respect to the dividend, depending on the market price of our common shares at the time of the sale. Furthermore, with respect to certain non-U.S. shareholders, we may be required to withhold U.S. federal income tax with respect to such dividends, including in respect of all or a portion of such dividend that is payable in common shares. If we made a taxable dividend payable in cash and our common shares and a significant number of our shareholders determine to sell our common shares in order to pay taxes owed on dividends, it may put downward pressure on the trading price of our common shares. We do not currently intend to pay taxable dividends using both our common shares and cash, although we may choose to do so in the future.
Any ownership of a TRS we may form in the future will be subject to limitations and our transactions with a TRS will cause us to be subject to a 100% penalty tax on certain income or deductions if those transactions are not conducted on arm’s-length terms.
Overall, no more than 25% of the value of a REIT’s assets may consist of stock or securities of one or more TRSs. The permitted percentage is reduced to 20% for taxable years beginning after December 31, 2017. In addition, the Code limits the deductibility of interest paid or accrued by a TRS to its parent REIT to assure that the TRS is subject to an appropriate level of corporate taxation. The Code also imposes a 100% excise tax on certain transactions between a TRS and its parent REIT that are not conducted on an arm’s-length basis, including “redetermined TRS service income” relating to gross income of a TRS attributable to services provided to, or on behalf of, the REIT (less the deductions properly allocable thereto) to the extent the amount of such income (less such deductions) would be increased on distribution, apportionment or allocation under Code Section 482. Furthermore, we will monitor the value of our respective investments in any TRS that we may form for the purpose of ensuring compliance with TRS ownership limitations and will structure our transactions with any TRS on terms that we believe are arm’s-length to avoid incurring a 100% excise tax from the transactions discussed above. There can be no assurance, however, that we will be able to comply with the 25% (or 20%, as applicable) limitation or to avoid application of the 100% excise tax.
37
If leases of our properties are not respected as true leases for federal income tax purposes, we would fail to qualify as a REIT and would be subject to higher taxes and have less cash available for distribution to our shareholders.
To qualify as a REIT, we must satisfy two gross income tests, under which specified percentages of our gross income must be derived from certain sources, such as “rents from real property.” Rents paid to the Operating Partnership by third party lessees and any TRS lessee that we may form in the future pursuant to the leases of our properties will constitute substantially all of our gross income. In order for such rent to qualify as “rents from real property” for purposes of the gross income tests, the leases must be respected as true leases for federal income tax purposes and not be treated as service contracts, joint ventures or some other type of arrangement. If our leases are not respected as true leases for federal income tax purposes, we would fail to qualify as a REIT.
You may be restricted from acquiring or transferring certain amounts of our common shares.
The share ownership restrictions of the Code for REITs and the 9.8% share ownership limit and other restrictions on ownership and transfer of our shares contained in the Trust’s declaration of trust may inhibit market activity in our shares of beneficial interest and restrict our business combination opportunities.
In order to qualify as a REIT, five or fewer individuals, as defined in the Code, may not own, beneficially or constructively, more than 50% in value of our issued and outstanding shares of beneficial interest at any time during the last half of a taxable year. Attribution rules in the Code determine if any individual or entity beneficially or constructively owns our shares of beneficial interest under this requirement. Additionally, at least 100 persons must beneficially own our shares of beneficial interest during at least 335 days of a taxable year. To help insure that we meet these tests, the declaration of trust restricts the acquisition and ownership of shares of our beneficial interest.
The declaration of trust, with certain exceptions, authorizes our trustees to take such actions as are necessary and desirable to preserve our qualification as a REIT. Unless exempted by our board of trustees, our declaration of trust prohibits any person from beneficially or constructively owning more than 9.8% in value or number of shares, whichever is more restrictive, of the outstanding shares of any class or series of our shares of beneficial interest. Our Board of Trustees has granted, and may in the future grant, an exemption to the 9.8% share ownership limitation. However, our board of trustees may not grant an exemption from this restriction to any proposed transferee whose ownership in excess of 9.8% of the number or value of our outstanding shares would result in our failing to qualify as a REIT. This as well as other restrictions on transferability and ownership will not apply, however, if our board of trustees determines that it is no longer in our best interests to continue to qualify as a REIT.
Dividends payable by REITs do not qualify for the reduced tax rates available for some dividends.
The maximum tax rate applicable to “qualified dividend income” payable to U.S. shareholders that are taxed at individual rates is 23.8%. Dividends payable by REITs, however, generally are not eligible for the reduced rates on qualified dividend income. The more favorable rates applicable to regular corporate qualified dividends could cause investors who are taxed at individual rates to perceive investments in REITs to be relatively less attractive than investments in the stocks of non-REIT corporations that pay dividends, which could adversely affect the value of the shares of REITs, including our common shares.
We may be subject to adverse legislative or regulatory tax changes that could reduce the market price of our common shares.
At any time, the U.S. federal income tax laws governing REITs or the administrative interpretations of those laws may be amended. We cannot predict when or if any new U.S. federal income tax law, regulation or administrative interpretation, or any amendment to any existing U.S. federal income tax law, regulation or administrative interpretation, will be adopted, promulgated or become effective and any such law, regulation, or interpretation may take effect retroactively. We and our shareholders could be adversely affected by any such change in the U.S. federal income tax laws, regulations or administrative interpretations.
None.
38
Geographic Diversification/Concentration
The following table lists the states in which our properties are located and provides certain information regarding our portfolio’s geographic diversification/concentration as of
December 31, 2016
:
|
State
|
Number of Properties
|
GLA (1)
(square feet)
|
Percent of GLA
|
Annualized Base Rent (2)
(thousands)
|
Percent of Annualized Base Rent
|
|||||||||||
|
Alabama
|
10
|
|
396,335
|
|
3.6
|
%
|
$
|
7,506
|
|
3.4
|
%
|
|||||
|
Arkansas
|
4
|
|
118,901
|
|
1.1
|
%
|
1,739
|
|
0.8
|
%
|
||||||
|
Arizona
|
10
|
|
636,549
|
|
5.8
|
%
|
14,161
|
|
6.5
|
%
|
||||||
|
Colorado
|
5
|
|
129,620
|
|
1.2
|
%
|
2,692
|
|
1.2
|
%
|
||||||
|
Florida
|
23
|
|
415,667
|
|
3.8
|
%
|
11,155
|
|
5.1
|
%
|
||||||
|
Georgia
|
22
|
|
631,660
|
|
5.8
|
%
|
12,118
|
|
5.5
|
%
|
||||||
|
Illinois
|
4
|
|
187,975
|
|
1.7
|
%
|
3,597
|
|
1.6
|
%
|
||||||
|
Indiana
|
19
|
|
646,262
|
|
5.9
|
%
|
12,849
|
|
5.9
|
%
|
||||||
|
Kentucky
|
12
|
|
975,884
|
|
9.0
|
%
|
15,459
|
|
7.1
|
%
|
||||||
|
Louisiana
|
3
|
|
150,777
|
|
1.4
|
%
|
5,414
|
|
2.5
|
%
|
||||||
|
Maryland
|
2
|
|
105,754
|
|
1.0
|
%
|
2,440
|
|
1.1
|
%
|
||||||
|
Maine
|
1
|
|
44,677
|
|
0.4
|
%
|
1,266
|
|
0.6
|
%
|
||||||
|
Michigan
|
8
|
|
447,794
|
|
4.1
|
%
|
9,608
|
|
4.4
|
%
|
||||||
|
Minnesota
|
12
|
|
455,929
|
|
4.2
|
%
|
9,439
|
|
4.3
|
%
|
||||||
|
Missouri
|
2
|
|
69,184
|
|
0.6
|
%
|
1,695
|
|
0.8
|
%
|
||||||
|
Mississippi
|
2
|
|
97,294
|
|
0.9
|
%
|
2,446
|
|
1.1
|
%
|
||||||
|
Montana
|
3
|
|
185,085
|
|
1.7
|
%
|
5,151
|
|
2.3
|
%
|
||||||
|
North Carolina
|
1
|
|
29,422
|
|
0.3
|
%
|
616
|
|
0.3
|
%
|
||||||
|
North Dakota
|
7
|
|
390,989
|
|
3.6
|
%
|
6,624
|
|
3.0
|
%
|
||||||
|
Nebraska
|
11
|
|
708,920
|
|
6.5
|
%
|
10,736
|
|
4.9
|
%
|
||||||
|
New Mexico
|
2
|
|
53,029
|
|
0.5
|
%
|
1,349
|
|
0.6
|
%
|
||||||
|
New York
|
11
|
|
484,483
|
|
4.5
|
%
|
10,361
|
|
4.7
|
%
|
||||||
|
Ohio
|
12
|
|
650,319
|
|
6.0
|
%
|
12,822
|
|
5.9
|
%
|
||||||
|
Oklahoma
|
1
|
|
52,000
|
|
0.5
|
%
|
1,324
|
|
0.6
|
%
|
||||||
|
Pennsylvania
|
11
|
|
407,911
|
|
3.7
|
%
|
5,385
|
|
2.5
|
%
|
||||||
|
Tennessee
|
9
|
|
410,395
|
|
3.8
|
%
|
7,674
|
|
3.5
|
%
|
||||||
|
Texas
|
23
|
|
1,163,808
|
|
10.7
|
%
|
26,603
|
|
12.1
|
%
|
||||||
|
Washington
|
10
|
|
588,946
|
|
5.4
|
%
|
12,244
|
|
5.6
|
%
|
||||||
|
Wisconsin
|
6
|
|
248,032
|
|
2.3
|
%
|
4,656
|
|
2.1
|
%
|
||||||
|
Total
|
246
|
|
10,883,601
|
|
100.0
|
%
|
$
|
219,129
|
|
100.0
|
%
|
|||||
|
(1)
|
“GLA” means gross leasable area.
|
|
(2)
|
Calculated for each tenant as the monthly contracted base rent per the terms of such tenant’s lease, as of
December 31, 2016
, multiplied by 12.
|
39
Scheduled Lease Expirations
The following table provides a summary of lease expirations for our properties owned as of
December 31, 2016
, for the periods indicated.
|
Expiration
|
Number of Leases Expiring
|
GLA
|
Percent of GLA
|
Annualized Base Rent (1)
(thousands)
|
Percent of Annualized Base Rent
|
Annualized Base Rent Leased per Square Foot (2)
|
||||||||||||||
|
2017
|
119
|
|
398,498
|
|
3.7
|
%
|
8,482
|
|
3.9
|
%
|
$
|
21.28
|
|
|||||||
|
2018
|
111
|
|
493,676
|
|
4.5
|
%
|
9,648
|
|
4.4
|
%
|
19.54
|
|
||||||||
|
2019
|
91
|
|
494,309
|
|
4.5
|
%
|
10,050
|
|
4.6
|
%
|
20.33
|
|
||||||||
|
2020
|
94
|
|
409,602
|
|
3.8
|
%
|
8,269
|
|
3.8
|
%
|
20.19
|
|
||||||||
|
2021
|
124
|
|
556,518
|
|
5.1
|
%
|
11,291
|
|
5.1
|
%
|
20.29
|
|
||||||||
|
2022
|
50
|
|
430,066
|
|
3.9
|
%
|
9,359
|
|
4.3
|
%
|
21.76
|
|
||||||||
|
2023
|
63
|
|
474,659
|
|
4.4
|
%
|
10,141
|
|
4.6
|
%
|
21.37
|
|
||||||||
|
2024
|
69
|
|
779,561
|
|
7.2
|
%
|
15,244
|
|
6.9
|
%
|
19.55
|
|
||||||||
|
2025
|
106
|
|
853,164
|
|
7.8
|
%
|
20,337
|
|
9.3
|
%
|
23.84
|
|
||||||||
|
2026
|
107
|
|
3,018,383
|
|
27.7
|
%
|
55,173
|
|
25.2
|
%
|
18.28
|
|
||||||||
|
Thereafter:
|
78
|
|
2,468,721
|
|
22.7
|
%
|
60,062
|
|
27.4
|
%
|
24.33
|
|
||||||||
|
Month to month (3)
|
29
|
|
81,970
|
|
0.8
|
%
|
1,072
|
|
0.5
|
%
|
13.08
|
|
||||||||
|
Vacant
|
—
|
|
424,474
|
|
3.9
|
%
|
—
|
|
—
|
|
—
|
|
||||||||
|
Total / Weighted average
|
1,041
|
|
10,883,601
|
|
100.0
|
%
|
$
|
219,129
|
|
100.0
|
%
|
$
|
20.13
|
|
||||||
|
(1)
|
Annualized base rent is calculated by multiplying (a) base rental payments for the month ended
December 31, 2016
, by (b) 12.
|
|
(2)
|
Annualized base rent per leased square foot is calculated by dividing (a) annualized base rent as of
December 31, 2016
, by (b) square footage under commenced leases as of
December 31, 2016
.
|
|
(3)
|
Includes
3
leases which expired on
December 31, 2016
, representing
0.1%
of portfolio leasable square feet.
|
40
Tenants
As of
December 31, 2016
, our properties were
96.1%
leased. No single tenant accounted for more than
5.8%
of our total annualized base rent or
3.7%
of total base revenue as of
December 31, 2016
; however,
17.4%
of our total annualized base rent as of
December 31, 2016
is from tenants affiliated with CHI..
The following table sets forth certain information about the 10 largest tenants in our portfolio based on total annualized base rent as of
December 31, 2016
.
|
Tenant
|
# of
Properties
|
Property
Location
|
Leased SF
|
% Leased
GLA
|
Annualized Base
Rent (1)
(thousands)
|
% of Portfolio
Annualized
Rent (2)
|
|||||||||||
|
CHI - KentuckyOne Health
|
11
|
KY
|
744,101
|
|
6.8
|
%
|
$
|
12,805
|
|
5.8
|
%
|
||||||
|
CHI - Nebraska
|
11
|
NE
|
617,857
|
|
5.7
|
%
|
9,275
|
|
4.2
|
%
|
|||||||
|
CHI - Franciscan (Seattle-Tacoma)
|
8
|
WA
|
328,771
|
|
3.0
|
%
|
5,437
|
|
2.5
|
%
|
|||||||
|
CHI - St. Alexius (North Dakota)
|
6
|
ND
|
320,407
|
|
2.9
|
%
|
5,278
|
|
2.4
|
%
|
|||||||
|
Great Falls Hospital
|
3
|
MT
|
185,085
|
|
1.7
|
%
|
5,151
|
|
2.4
|
%
|
|||||||
|
LifeCare
|
3
|
TX, PA
|
310,352
|
|
2.9
|
%
|
4,911
|
|
2.2
|
%
|
|||||||
|
Trios Health
|
1
|
WA
|
161,885
|
|
1.5
|
%
|
4,684
|
|
2.1
|
%
|
|||||||
|
HonorHealth
|
5
|
AZ
|
215,433
|
|
2.0
|
%
|
4,262
|
|
2.0
|
%
|
|||||||
|
IMS - Dignity Health
|
4
|
AZ
|
165,860
|
|
1.5
|
%
|
3,929
|
|
1.8
|
%
|
|||||||
|
EEPPMC Partners
|
1
|
TX
|
77,000
|
|
0.7
|
%
|
3,693
|
|
1.7
|
%
|
|||||||
|
Total
|
53
|
3,126,751
|
|
28.7
|
%
|
$
|
59,425
|
|
27.1
|
%
|
|||||||
|
(1)
|
Calculated for each tenant as the monthly contracted base rent per the terms of such tenant’s lease, as of
December 31, 2016
, multiplied by 12.
|
|
(2)
|
Calculated as annualized base rent for such tenant as of
December 31, 2016
divided by annualized base rent for the total portfolio as of
December 31, 2016
.
|
Before entering into a lease and during the lease term, we seek to manage our exposure to significant tenant credit issues. In most instances, we seek to obtain tenant financial information, including credit reports, financial statements, and tax returns. Where appropriate, we seek to obtain financial commitments in the form of letters of credit, security deposits, or personal guarantees from tenants. On an ongoing basis, we monitor accounts receivable and payment history for both tenants and properties and seek to identify any credit concerns as quickly as possible. In addition, we keep in close contact with our tenants in an effort to identify and address negative changes to their businesses prior to such adverse changes affecting their ability to pay rent to us.
Ground Leases
We lease the land upon which
58
of our properties are built, representing approximately
33.6%
of our total leasable square feet and
32.4%
of our annualized base revenue as of
December 31, 2016
. The ground leases subject these properties to certain restrictions. These restrictions may limit our ability to re-let such facilities to tenants not affiliated with the healthcare delivery system that owns the underlying land. Restrictions may also include rights of first offer and refusal with respect to sales of the properties and may limit the types of medical procedures that may be performed at the facilities.
From time to time, we are party to various lawsuits, claims and other legal proceedings that arise in the ordinary course of our business. We are not currently a party, as plaintiff or defendant, to any legal proceedings which, individually or in the aggregate, would be expected to have a material effect on our business, financial condition or results of operations if determined adversely to us.
ITEM 4.
MINE SAFETY DISCLOSURES
Not applicable.
41
Physicians Realty Trust
The Trust’s common shares are traded on the NYSE under the symbol “DOC.” As of
February 17, 2017
, the Trust had
218
registered shareholders of record for the Trust’s common shares.
The following table sets forth, for the periods indicated, the high and low sale prices of the Trust’s common shares for the fiscal years ended December 31,
2015
and
2016
, respectively, as reported on the NYSE, and the dividends paid by the Trust with respect to those periods.
|
2015
|
High
|
Low
|
Dividends (1)
|
|
|||||||||
|
First quarter
|
$
|
18.12
|
|
$
|
15.67
|
|
$
|
0.225
|
|
(2)
|
|||
|
Second quarter
|
$
|
17.99
|
|
$
|
14.89
|
|
$
|
0.225
|
|
(3)
|
|||
|
Third quarter
|
$
|
16.29
|
|
$
|
13.86
|
|
$
|
0.225
|
|
(4)
|
|||
|
Fourth quarter
|
$
|
17.05
|
|
$
|
14.68
|
|
$
|
0.225
|
|
(5)
|
|||
|
2016
|
High
|
Low
|
Dividends (1)
|
|
|||||||||
|
First quarter
|
$
|
18.90
|
|
$
|
15.41
|
|
$
|
0.225
|
|
(6)
|
|||
|
Second quarter
|
$
|
21.36
|
|
$
|
17.83
|
|
$
|
0.225
|
|
(7)
|
|||
|
Third quarter
|
$
|
22.03
|
|
$
|
19.73
|
|
$
|
0.225
|
|
(8)
|
|||
|
Fourth quarter
|
$
|
21.45
|
|
$
|
17.12
|
|
$
|
0.225
|
|
(9)
|
|||
|
(1)
|
Dividend information is for dividends declared with respect to that quarter.
|
|
(2)
|
On
April 6, 2015
, the Trust declared a cash dividend of $0.225 per share for the quarterly period ended March 31,
2015
. The dividend was paid on
May 1, 2015
to common shareholders and OP Unit holders of record on
April 17, 2015
.
|
|
(3)
|
On
July 1, 2015
, the Trust declared a cash dividend of $0.225 per share for the quarterly period ended June 30,
2015
. The dividend was paid on
July 31, 2015
to common shareholders and OP Unit holders of record on
July 17, 2015
.
|
|
(4)
|
On
September 28, 2015
, the Trust declared a cash dividend of $0.225 per common share for the quarterly period ended September 30,
2015
. The dividend was paid on
October 30, 2015
to common shareholders and OP Unit holders of record on
October 16, 2015
.
|
|
(5)
|
On
December 31, 2015
, the Trust declared a cash dividend of $0.225 per share for the quarter ending December 31,
2015
. The dividend was paid on
January 29, 2016
to common shareholders and OP Unit holders of record on
January 15, 2016
.
|
|
(6)
|
On
March 18, 2016
, the Trust declared a cash dividend of $0.225 per share for the quarterly period ended March 31,
2016
. The dividend was paid on
April 18, 2016
to common shareholders and OP Unit holders of record on
April 1, 2016
.
|
|
(7)
|
On
June 23, 2016
, the Trust declared a cash dividend of $0.225 per share for the quarterly period ended June 30,
2016
. The dividend was paid on
July 18, 2016
to common shareholders and OP Unit holders of record on
July 5, 2016
.
|
|
(8)
|
On
September 26, 2016
, the Trust declared a cash dividend of $0.225 per common share for the quarterly period ended September 30,
2016
. The dividend was paid on
October 18, 2016
to common shareholders and OP Unit holders of record on
October 6, 2016
.
|
|
(9)
|
On
December 22, 2016
, the Trust declared a cash dividend of $0.225 per share for the quarter ending December 31,
2016
. The dividend was paid on
January 18, 2017
to common shareholders and OP Unit holders of record on
January 5, 2017
.
|
It has been the Trust’s policy to declare quarterly dividends to its shareholders so as to comply with applicable provisions of the Code governing REITs. The declaration and payment of quarterly dividends remains subject to the review and approval of the Board of Trustees.
Physicians Realty L.P.
There is no established public trading market for the OP Units or Series A Preferred Units. As of
February 17, 2017
, there were
no
holders of record and
139,821,116
OP Units outstanding,
136,658,245
of which were held by the Trust. As of
February 17, 2017
, there were
no
Series A Preferred Units outstanding. The following table sets forth, for the periods indicated,
42
the distributions paid by the Operating Partnership to holders of its Series A Preferred Units and OP Units with respect to those periods.
|
2015
|
Dividends
|
|||
|
First quarter
|
$
|
0.225
|
|
|
|
Second quarter
|
$
|
0.225
|
|
|
|
Third quarter
|
$
|
0.225
|
|
|
|
Fourth quarter
|
$
|
0.225
|
|
|
|
2016
|
Dividends
|
|||
|
First quarter
|
$
|
0.225
|
|
|
|
Second quarter
|
$
|
0.225
|
|
|
|
Third quarter
|
$
|
0.225
|
|
|
|
Fourth quarter
|
$
|
0.225
|
|
|
All distributions paid by the Operating Partnership were declared and paid at the same time as dividends that were distributed by the Trust to common shareholders, except that holders of Series A Preferred Units received a 5% cumulative return.
It has been the Operating Partnership’s policy to declare quarterly distributions so as to allow the Trust to comply with applicable provisions of the Code governing REITs. The declaration and payment of quarterly distributions remains subject to the review and approval of the Trust’s Board of Trustees.
43
Stock Performance Graph
This performance graph shall not be deemed “soliciting material” or to be “filed” with the SEC for purposes of Section 18 of the Exchange Act, or otherwise subject to the liabilities under that Section, and shall not be deemed to be incorporated by reference into any filing of Physicians Realty Trust under the Securities Act or the Exchange Act.
The graph below compares the cumulative total return of our common shares, the S&P 500 and the MSCI US REIT Index (RMS), from July 19, 2013 (the date of our IPO) through
December 31, 2016
. The comparison assumes $100 was invested on July 19, 2013 in our common shares and in each of the foregoing indexes and assumes reinvestment of dividends, as applicable. The MSCI US REIT Index consists of equity REITs that are included in the MSCI US Investable Market 2500 Index, except for specialty equity REITS that do not generate a majority of their revenue and income from real estate rental and leasing operations. We have included the MSCI US REIT Index because we joined the MSCI US REIT Index in November 2014 and therefore, we believe that it is representative of the industry in which we compete and is relevant to an assessment of our performance.
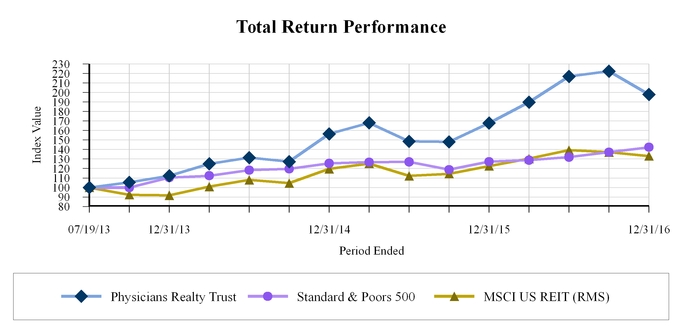
|
|
Period Ending
|
|||||||||||||||||||
|
Index
|
7/19/2013
|
12/31/2013
|
12/31/2014
|
12/31/2015
|
12/31/2016
|
|||||||||||||||
|
Physicians Realty Trust
|
$
|
100.00
|
|
$
|
112.34
|
|
$
|
156.36
|
|
$
|
167.80
|
|
$
|
197.82
|
|
|||||
|
S&P 500
|
$
|
100.00
|
|
$
|
110.29
|
|
$
|
125.39
|
|
$
|
127.13
|
|
$
|
142.33
|
|
|||||
|
MSCI US REIT (RMS)
|
$
|
100.00
|
|
$
|
91.70
|
|
$
|
119.56
|
|
$
|
122.57
|
|
$
|
133.11
|
|
|||||
Recent Sales of Unregistered Securities
On October 28, 2016 and November 4, 2016, as consideration for the Company’s acquisition of the Northwest Michigan Surgery Center located in Traverse City, Michigan, the Trust issued 1,036,538 common shares of beneficial interest, with an aggregate value of approximately $21.0 million (the “Shares”), together with nominal cash consideration.
The Shares were issued (a) in private placements in reliance on Section 4(a)(2) of the Securities Act of 1933, as amended (the “Securities Act”) and the rules and regulations promulgated thereunder and (b) to recipients who each represented that such recipient was an “accredited investor” within the meaning of Rule 506(b) of Regulation D under the Securities Act. The issuance did not involve a public offering, and was made without general solicitation or advertising.
In addition, on January 31, 2017, the Operating Partnership redeemed the minority interest in DOC-7277 Smith’s Mill Road MOB, LLC, a joint venture between the Operating Partnership and Medical Center of New Albany I, LLC, an Ohio limited liability company. As consideration, the Company paid approximately $2.1 million in cash, and the Operating Partnership issued approximately $0.7 million in OP Units, or 38,641 OP Units, to a certain investor who elected to receive OP
44
Units in lieu of cash (the “MCNA OP Units”). The MCNA OP Units are redeemable at the option of the holder which redemption obligation may be satisfied, at the Trust’s option, in cash or registered common shares. The investor in the MCNA OP Units has agreed not to cause the Operating Partnership to redeem its OP Units prior to one year from the issuance date.
The MCNA OP Units were issued (a) in private placements in reliance on Section 4(a)(2) of the Securities Act and the rules and regulations promulgated thereunder and (b) to a recipient who represented that such recipient was an “accredited investor” within the meaning of Rule 506(b) of Regulation D under the Securities Act. The issuance did not involve a public offering, and was made without general solicitation or advertising.
Purchases of Equity Securities by the Issuer and Affiliated Purchasers
The following table sets forth information relating to repurchases of our common shares of beneficial interest and OP Units during the
three months ended December 31, 2016
:
ISSUER PURCHASES OF EQUITY SECURITIES
|
Period
|
(a) Total Number of Shares (or Units) Purchased
|
(b) Average Price Paid per Share (or Unit)
|
(c) Total Number of Shares (or Units) Purchased as Part of Publicly Announced Plans or Programs
|
(d) Maximum Number (or Approximate Dollar Value) of Shares (or Units) that May Yet Be Purchased Under the Plans or Programs
|
|||||||||
|
October 1, 2016 - October 31, 2016
|
151,524
|
|
(1)
|
$
|
21.49
|
|
N/A
|
|
N/A
|
|
|||
|
November 1, 2016 - November 30, 2016
|
—
|
|
—
|
|
N/A
|
|
N/A
|
|
|||||
|
December 1, 2016 - December 31, 2016
|
—
|
|
—
|
|
N/A
|
|
N/A
|
|
|||||
|
Total
|
151,524
|
|
$
|
21.49
|
|
—
|
|
—
|
|
||||
|
(1)
|
Represents 151,524 OP Units redeemed by holders in exchange for common shares of the Trust.
|
The following selected financial data should be read together with the discussion under the caption “Management’s Discussion and Analysis of Financial Condition and Results of Operations,” and the consolidated financial statements and related notes thereto included elsewhere in this report.
We had no business operations prior to completion of the IPO and the formation transactions on July 24, 2013. The balance sheet data as of December 31, 2016, 2015, 2014, and 2013 reflects our financial condition. References in the notes to the consolidated financial statements refer, unless the context indicates otherwise, to the Company for the period July 24, 2013, the date of completion of the IPO and the related formation transactions, through December 31, 2016, and the Predecessor for all prior periods.
Our Predecessor is comprised of the four healthcare real estate private equity funds, organized as limited liability companies under the laws of Delaware, managed by B.C. Ziegler & Company, which we refer to as the Ziegler Funds, that owned directly or indirectly interests in entities that owned our initial properties we acquired on July 24, 2013 in connection with completion of our IPO and related formation transactions.
45
Physicians Realty Trust and Predecessor
|
|
Year Ended December 31,
|
||||||||||||||
|
(in thousands, except per share data)
|
2016
|
2015
|
2014
|
2013 (1)
|
|||||||||||
|
Statement of Operations Data
|
|
|
|
|
|
|
|||||||||
|
Revenues:
|
|
|
|
|
|
|
|||||||||
|
Rental revenues
|
$
|
186,301
|
|
$
|
103,974
|
|
$
|
46,397
|
|
$
|
13,565
|
|
|||
|
Expense recoveries
|
45,875
|
|
21,587
|
|
5,871
|
|
3,234
|
|
|||||||
|
Interest income on real estate loans and other
|
8,858
|
|
3,880
|
|
1,066
|
|
246
|
|
|||||||
|
Total revenues
|
241,034
|
|
129,441
|
|
53,334
|
|
17,045
|
|
|||||||
|
Expenses:
|
|
|
|
|
|
|
|||||||||
|
Interest expense
|
23,864
|
|
10,636
|
|
6,907
|
|
4,295
|
|
|||||||
|
General and administrative
|
18,397
|
|
14,908
|
|
11,440
|
|
3,214
|
|
|||||||
|
Operating expenses
|
65,999
|
|
31,026
|
|
10,154
|
|
4,650
|
|
|||||||
|
Depreciation and amortization
|
86,589
|
|
45,471
|
|
16,731
|
|
5,107
|
|
|||||||
|
Acquisition expenses
|
14,778
|
|
14,893
|
|
10,897
|
|
1,938
|
|
|||||||
|
Management fees
|
—
|
|
—
|
|
—
|
|
475
|
|
|||||||
|
Impairment loss
|
—
|
|
—
|
|
1,750
|
|
—
|
|
|||||||
|
Total expenses
|
209,627
|
|
116,934
|
|
57,879
|
|
19,679
|
|
|||||||
|
Income (loss) before equity in income of unconsolidated entities and gain (loss) on sale of investment properties
|
31,407
|
|
12,507
|
|
(4,545
|
)
|
(2,634
|
)
|
|||||||
|
Equity in income of unconsolidated entities
|
115
|
|
104
|
|
95
|
|
—
|
|
|||||||
|
Gain (loss) on sale of investment properties
|
—
|
|
130
|
|
32
|
|
(2
|
)
|
|||||||
|
Net income (loss)
|
31,522
|
|
12,741
|
|
(4,418
|
)
|
(2,636
|
)
|
|||||||
|
Net (income) loss attributable to noncontrolling interests:
|
|||||||||||||||
|
Predecessor
|
—
|
|
—
|
|
—
|
|
576
|
|
|||||||
|
Operating Partnership
|
(825
|
)
|
(576
|
)
|
695
|
|
470
|
|
|||||||
|
Partially owned properties
|
(716
|
)
|
(377
|
)
|
(314
|
)
|
(71
|
)
|
|||||||
|
Net income (loss) attributable to controlling interest
|
29,981
|
|
11,788
|
|
(4,037
|
)
|
(1,661
|
)
|
|||||||
|
Preferred distributions
|
(1,857
|
)
|
(1,189
|
)
|
—
|
|
—
|
|
|||||||
|
Net income (loss) attributable to common shareholders
|
$
|
28,124
|
|
$
|
10,599
|
|
$
|
(4,037
|
)
|
$
|
(1,661
|
)
|
|||
|
Net income (loss) per share:
|
|||||||||||||||
|
Basic
|
$
|
0.22
|
|
$
|
0.15
|
|
$
|
(0.12
|
)
|
$
|
(0.13
|
)
|
|||
|
Diluted
|
$
|
0.22
|
|
$
|
0.15
|
|
$
|
(0.12
|
)
|
$
|
(0.13
|
)
|
|||
|
Dividends and distributions declared per common share and OP Unit
|
$
|
0.90
|
|
$
|
0.90
|
|
$
|
0.90
|
|
$
|
0.41
|
|
|||
|
Balance Sheet Data (as of end of period):
|
|
|
|
|
|
|
|||||||||
|
Assets:
|
|
|
|
|
|
|
|||||||||
|
Net real estate investments
|
$
|
2,767,624
|
|
$
|
1,579,483
|
|
$
|
773,650
|
|
$
|
227,539
|
|
|||
|
Cash and cash equivalents
|
15,491
|
|
3,143
|
|
15,923
|
|
56,478
|
|
|||||||
|
Tenant receivables, net
|
9,790
|
|
2,977
|
|
1,324
|
|
837
|
|
|||||||
|
Other assets
|
95,187
|
|
53,283
|
|
15,806
|
|
5,901
|
|
|||||||
|
Total assets
|
$
|
2,888,092
|
|
$
|
1,638,886
|
|
$
|
806,703
|
|
$
|
290,755
|
|
|||
|
Liabilities and Equity:
|
|
|
|
|
|
|
|||||||||
|
Credit facility
|
$
|
643,742
|
|
$
|
389,375
|
|
$
|
134,144
|
|
$
|
—
|
|
|||
|
Notes payable
|
224,330
|
|
—
|
|
—
|
|
—
|
|
|||||||
|
Mortgage debt
|
123,083
|
|
94,240
|
|
77,091
|
|
40,716
|
|
|||||||
|
Accounts payable
|
4,423
|
|
644
|
|
700
|
|
836
|
|
|||||||
|
Dividends payable
|
32,179
|
|
20,783
|
|
16,548
|
|
5,681
|
|
|||||||
|
Accrued expenses and other liabilities
|
42,287
|
|
24,473
|
|
6,140
|
|
2,685
|
|
|||||||
|
Acquired lease intangible, net
|
9,253
|
|
5,950
|
|
2,871
|
|
—
|
|
|||||||
|
Total liabilities
|
1,079,297
|
|
535,465
|
|
237,494
|
|
49,918
|
|
|||||||
|
Redeemable noncontrolling interest – Series A Preferred Units and partially owned properties
|
26,477
|
|
26,960
|
|
—
|
|
—
|
|
|||||||
|
Total shareholders’ equity
|
1,738,451
|
|
1,021,132
|
|
534,730
|
|
204,904
|
|
|||||||
|
Noncontrolling interests
|
43,867
|
|
55,329
|
|
34,479
|
|
35,933
|
|
|||||||
|
Total liabilities and equity
|
$
|
2,888,092
|
|
$
|
1,638,886
|
|
$
|
806,703
|
|
$
|
290,755
|
|
|||
|
(1)
|
Because our IPO and the formation transactions were completed on July 24, 2013 and we had no operations prior to completion of our IPO, the results of operations, for the year ended December 31, 2013 reflect the results of operations of the Predecessor from January 1, 2013 through July 23, 2013 and of the Company from July 24, 2013 through December 31, 2013.
|
46
Physicians Realty L.P. and Predecessor
|
|
Year Ended December 31,
|
||||||||||||||
|
(in thousands, except per unit data)
|
2016
|
2015
|
2014
|
2013 (1)
|
|||||||||||
|
Statement of Operations Data
|
|
|
|
|
|
|
|||||||||
|
Revenues:
|
|
|
|
|
|
|
|||||||||
|
Rental revenues
|
$
|
186,301
|
|
$
|
103,974
|
|
$
|
46,397
|
|
$
|
13,565
|
|
|||
|
Expense recoveries
|
45,875
|
|
21,587
|
|
5,871
|
|
3,234
|
|
|||||||
|
Interest income on real estate loans and other
|
8,858
|
|
3,880
|
|
1,066
|
|
246
|
|
|||||||
|
Total revenues
|
241,034
|
|
|
129,441
|
|
|
53,334
|
|
|
17,045
|
|
||||
|
Expenses:
|
|
|
|
|
|
|
|||||||||
|
Interest expense
|
23,864
|
|
10,636
|
|
6,907
|
|
4,295
|
|
|||||||
|
General and administrative
|
18,397
|
|
14,908
|
|
11,440
|
|
3,214
|
|
|||||||
|
Operating expenses
|
65,999
|
|
31,026
|
|
10,154
|
|
4,650
|
|
|||||||
|
Depreciation and amortization
|
86,589
|
|
45,471
|
|
16,731
|
|
5,107
|
|
|||||||
|
Acquisition expenses
|
14,778
|
|
14,893
|
|
10,897
|
|
1,938
|
|
|||||||
|
Management fees
|
—
|
|
—
|
|
—
|
|
475
|
|
|||||||
|
Impairment loss
|
—
|
|
—
|
|
1,750
|
|
—
|
|
|||||||
|
Total expenses
|
209,627
|
|
|
116,934
|
|
|
57,879
|
|
|
19,679
|
|
||||
|
Income (loss) before equity in income of unconsolidated entities and gain (loss) on sale of investment properties
|
31,407
|
|
|
12,507
|
|
|
(4,545
|
)
|
|
(2,634
|
)
|
||||
|
Equity in income of unconsolidated entities
|
115
|
|
104
|
|
95
|
|
—
|
|
|||||||
|
Gain (loss) on sale of investment properties
|
—
|
|
130
|
|
32
|
|
(2
|
)
|
|||||||
|
Net income (loss)
|
31,522
|
|
|
12,741
|
|
|
(4,418
|
)
|
|
(2,636
|
)
|
||||
|
Net (income) loss attributable to noncontrolling interests:
|
|||||||||||||||
|
Predecessor
|
—
|
|
—
|
|
—
|
|
576
|
|
|||||||
|
Partially owned properties
|
(716
|
)
|
(377
|
)
|
(314
|
)
|
(71
|
)
|
|||||||
|
Net income (loss) attributable to controlling interest
|
30,806
|
|
|
12,364
|
|
|
(4,732
|
)
|
|
(2,131
|
)
|
||||
|
Preferred distributions
|
(1,857
|
)
|
(1,189
|
)
|
—
|
|
—
|
|
|||||||
|
Net income (loss) attributable to common unitholders
|
$
|
28,949
|
|
|
$
|
11,175
|
|
|
$
|
(4,732
|
)
|
|
$
|
(2,131
|
)
|
|
Net income (loss) per unit:
|
|||||||||||||||
|
Basic
|
$
|
0.22
|
|
$
|
0.15
|
|
$
|
(0.12
|
)
|
$
|
(0.13
|
)
|
|||
|
Diluted
|
$
|
0.22
|
|
$
|
0.15
|
|
$
|
(0.12
|
)
|
$
|
(0.13
|
)
|
|||
|
Dividends and distributions declared per common unit
|
$
|
0.90
|
|
$
|
0.90
|
|
$
|
0.90
|
|
$
|
0.41
|
|
|||
|
Balance Sheet Data (as of end of period):
|
|
|
|
|
|
|
|||||||||
|
Assets:
|
|
|
|
|
|
|
|||||||||
|
Net real estate investments
|
$
|
2,767,624
|
|
$
|
1,579,483
|
|
$
|
773,650
|
|
$
|
227,539
|
|
|||
|
Cash and cash equivalents
|
15,491
|
|
3,143
|
|
15,923
|
|
56,478
|
|
|||||||
|
Tenant receivables, net
|
9,790
|
|
2,977
|
|
1,324
|
|
837
|
|
|||||||
|
Other assets
|
95,187
|
|
53,283
|
|
15,806
|
|
5,901
|
|
|||||||
|
Total assets
|
$
|
2,888,092
|
|
|
$
|
1,638,886
|
|
|
$
|
806,703
|
|
|
$
|
290,755
|
|
|
Liabilities and Capital:
|
|
|
|
|
|
|
|||||||||
|
Credit facility
|
$
|
643,742
|
|
$
|
389,375
|
|
$
|
134,144
|
|
$
|
—
|
|
|||
|
Notes payable
|
224,330
|
|
—
|
|
—
|
|
—
|
|
|||||||
|
Mortgage debt
|
123,083
|
|
94,240
|
|
77,091
|
|
40,716
|
|
|||||||
|
Accounts payable
|
4,423
|
|
644
|
|
700
|
|
836
|
|
|||||||
|
Dividends payable
|
32,179
|
|
20,783
|
|
16,548
|
|
5,681
|
|
|||||||
|
Accrued expenses and other liabilities
|
42,287
|
|
24,473
|
|
6,140
|
|
2,685
|
|
|||||||
|
Acquired lease intangible, net
|
9,253
|
|
5,950
|
|
2,871
|
|
—
|
|
|||||||
|
Total liabilities
|
1,079,297
|
|
|
535,465
|
|
|
237,494
|
|
|
49,918
|
|
||||
|
Redeemable noncontrolling interest - Series A Preferred Units and partially owned properties
|
26,477
|
|
26,960
|
|
—
|
|
—
|
|
|||||||
|
Total partners’ capital
|
1,781,593
|
|
1,066,583
|
|
568,457
|
|
240,214
|
|
|||||||
|
Noncontrolling interests
|
725
|
|
9,878
|
|
752
|
|
623
|
|
|||||||
|
Total liabilities and capital
|
$
|
2,888,092
|
|
|
$
|
1,638,886
|
|
|
$
|
806,703
|
|
|
$
|
290,755
|
|
|
(1)
|
Because the formation transactions were completed on July 24, 2013 and we had no operations prior to completion of the Trust’s IPO, the results of operations, for the year ended December 31, 2013 reflect the results of operations of the Predecessor from January 1, 2013 through July 23, 2013 and of the Company from July 24, 2013 through December 31, 2013.
|
47
The following discussion should be read in conjunction with our financial statements, including the notes to those statements, included elsewhere in this report, and the Section entitled “Cautionary Statement Regarding Forward-Looking Statements” in this report. As discussed in more detail in the Section entitled “Cautionary Statement Regarding Forward-Looking Statements,” this discussion contains forward-looking statements which involve risks and uncertainties. Our actual results may differ materially from the results discussed in the forward-looking statements. Factors that might cause those differences include those discussed in “Part I, Item 1. Business” and
“Part I, Item 1A. Risk Factors”
and elsewhere in this report.
Overview
We are a self-managed healthcare real estate company organized in April 2013 to acquire, selectively develop, own, and manage healthcare properties that are leased to physicians, hospitals, and healthcare delivery systems. We invest in real estate that is integral to providing high quality healthcare services. Our properties are typically located on a campus with a hospital or other healthcare facilities or strategically located and affiliated with a hospital or other healthcare facilities. We believe the impact of government programs and continuing trends in the healthcare industry create attractive opportunities for us to invest in healthcare related real estate. In particular, we believe the demand for healthcare will continue to increase as a result of the aging population as older persons generally utilize healthcare services at a rate well in excess of younger people. Our management team has significant public healthcare REIT experience and has long established relationships with physicians, hospitals, and healthcare delivery system decision makers that we believe will provide quality investment and growth opportunities. Our principal investments include medical office buildings, outpatient treatment facilities, acute and post-acute care hospitals, as well as other real estate integral to health care providers. We seek to invest in stabilized medical facility assets with initial cash yields of
6.0%
to
9.0%
. We seek to generate attractive risk-adjusted returns for our shareholders through a combination of stable and increasing dividends and potential long-term appreciation in the value of our properties and our common shares.
We have grown our portfolio of gross real estate investments from approximately $124 million at the time of our IPO in July 2013 to approximately
$2.9 billion
as of
December 31, 2016
. Since the date of our IPO through to December 31, 2016, our compounded annual growth rate was
150.0%
. While we expect to continue to grow through property acquisitions and investments as our asset base continues to increase, we expect our annual growth rate to decelerate in the future.
As of
December 31, 2016
, our portfolio consisted of
246
properties located in
29
states with approximately
10,883,601
net leasable square feet, which were approximately
96.1%
leased with a weighted average remaining lease term of approximately
8.5
years. As of
December 31, 2016
, approximately
78.4%
of the net leasable square footage of our portfolio was affiliated with a healthcare delivery system or located within approximately 1/4 mile of a hospital campus. We expect to acquire between
$800 million
and
$1 billion
of real estate during
2017
, including the
2017
acquisitions described in this report, subject to favorable capital market conditions.
48
As of
December 31, 2016
, leases representing a percentage of our portfolio on the basis of leasable square feet will expire as follows:
|
Year (1)
|
Portfolio Lease Expirations
|
|
|
MTM (2)
|
0.8%
|
|
|
2017
|
3.7%
|
|
|
2018
|
4.5%
|
|
|
2019
|
4.5%
|
|
|
2020
|
3.8%
|
|
|
2021
|
5.1%
|
|
|
2022
|
3.9%
|
|
|
2023
|
4.4%
|
|
|
2024
|
7.2%
|
|
|
2025
|
7.8%
|
|
|
2026
|
27.7%
|
|
|
Thereafter:
|
22.7%
|
|
|
Total
|
96.1%
|
|
|
(1)
|
“MTM” means month-to-month.
|
|
(2)
|
Includes
3
leases which expired on
December 31, 2016
, representing
0.1%
of portfolio leasable square feet.
|
We receive a cash rental stream from these healthcare providers under our leases. Approximately
87.5%
of the annualized base rent payments from our properties as of
December 31, 2016
are from triple-net leases, pursuant to which the tenants are responsible for all operating expenses relating to the property, including but not limited to real estate taxes, utilities, property insurance, routine maintenance and repairs, and property management. This structure helps insulate us from increases in certain operating expenses and provides more predictable cash flow. However, in each of December 2015 and December 2016, the U.S. Federal Reserve raised its benchmark interest rate by a quarter of a percentage point, and we expect interest rates to continue to rise at a measured pace. In addition, in the latter part of 2016, U.S. government bond prices fell significantly, which is generally inversely correlated with rising interest rates. An increase in interest rates will affect our cost of borrowing (including with respect to our currently outstanding debt not subject to a fixed interest rate) and could adversely affect our business, our financial results and our ability to complete property acquisitions.
Approximately
9.9%
of the annualized base rent payments from our properties as of
December 31, 2016
are from modified gross base stop leases which allow us to pass through certain increases in future operating expenses (e.g., property tax and insurance) to tenants for reimbursement, thus protecting us from increases in such operating expenses. We seek to structure our triple-net leases to generate attractive returns on a long-term basis. Our leases typically have initial terms of 5 to 15 years and include annual rent escalators of approximately
1.5%
to
3.0%
. Our operating results depend significantly upon the ability of our tenants to make required rental payments. We believe that our portfolio of medical office buildings and other healthcare facilities will enable us to generate stable cash flows over time because of the diversity of our tenants, staggered lease expiration schedule, long-term leases, and low historical occurrence of tenants defaulting under their leases.
We intend to grow our portfolio of high-quality healthcare properties leased to physicians, hospitals, healthcare delivery systems and other healthcare providers primarily through acquisitions of existing healthcare facilities that provide stable revenue growth and predictable long-term cash flows. We may also selectively finance the development of new healthcare facilities through joint venture or fee arrangements with premier healthcare real estate developers. Generally, we only expect to make investments in new development properties when approximately 70% or more of the development property has been pre-leased before construction commences. We seek to invest in properties where we can develop strategic alliances with financially sound healthcare providers and healthcare delivery systems that offer need-based healthcare services in sustainable healthcare markets. We focus our investment activity on the following types of healthcare properties:
|
•
|
medical office buildings;
|
|
•
|
outpatient treatment and diagnostic facilities;
|
|
•
|
physician group practice clinics;
|
|
•
|
ambulatory surgery centers; and
|
|
•
|
specialty hospitals and treatment centers.
|
We believe that shifting consumer preferences, limited space in hospitals, the desire of patients and healthcare providers to limit non-essential services provided in a hospital setting, and cost considerations, among other trends, continue to drive the industry trend of performing procedures in outpatient facilities that have traditionally been performed in hospitals,
49
such as surgeries and other invasive medical procedures. As these trends continue, we believe that demand for medical office buildings and similar healthcare properties will continue to rise, and that our investment strategy accounts for these trends.
We may invest opportunistically in life science facilities, assisted living, and independent senior living facilities and in the longer term, senior housing properties, including skilled nursing. Consistent with our qualification as a REIT, we may also opportunistically invest in companies that provide healthcare services, and in joint venture entities with operating partners, structured to comply with the REIT Investment Diversification Act of 2007 (“RIDEA”).
The Trust is a Maryland real estate investment trust and elected to be taxed as a REIT for U.S. federal income tax purposes. We conduct our business through an UPREIT structure in which our properties are owned by our Operating Partnership directly or through limited partnerships, limited liability companies or other subsidiaries. The Trust is the sole general partner of our Operating Partnership and, as of
December 31, 2016
, owned approximately
97.5%
of the OP Units. As of
February 17, 2017
, we have
135,999,067
common shares outstanding.
Key Transactions in
2016
During
2016
, we completed acquisitions of
95
operating healthcare properties (including 5 condominium units and the CHI Portfolio) and 1 land parcel, located in
23
states for an aggregate purchase price of approximately
$1.27 billion
. In addition, we funded
$14.2 million
of other investments, including the issuance of loans, the acquisition of an equity interest in a joint venture, and buyouts of noncontrolling interests, resulting in total investments of
$1.29 billion
. Acquisitions are detailed in Note
3
to our consolidated financial statements included in Item 8 to this report.
During 2016, we entered into separate agreements to purchase 52 medical office facilities (which we now treat as 53 medical office facilities because we consider a certain condominium property as being separate from a nearby surgical center property) from regional health systems controlled by Catholic Health Initiatives (“CHI”) containing 3,159,495 rentable square feet located in 10 states (the “CHI Portfolio”). To date, we have completed the acquisition of
49
of the properties in the CHI Portfolio representing
3,016,926
net leasable square feet. We elected not to complete the acquisition of 2 of the CHI Portfolio properties. We still have one property under one of the original agreements to purchase a medical office facility in Fruitland, Idaho for $4.8 million, and we entered into a separate agreement to purchase a newly constructed medical office facility in Omaha, Nebraska for approximately $33.4 million that is 100% leased and will be 100% occupied by CHI’s affiliate, Creighton University Medical Center, upon its completion of certain tenant improvements. We anticipate closing on the Omaha, Nebraska medical office facility during the first quarter of 2017 and on the Fruitland, Idaho medical office facility later in 2017.
In addition, we completed several key financing transactions during fiscal year 2016, which are summarized under the heading “Liquidity and Capital Resources” below.
Certain Government Regulations
The healthcare industry is heavily regulated by U.S. federal, state and local governmental authorities. Our tenants generally are subject to laws and regulations covering, among other things, licensure, certification for participation in
government programs, billing for services, privacy and security of health information and relationships with physicians and other referral sources. In addition, new laws and regulations, changes in existing laws and regulations or changes in the
interpretation of such laws or regulations could negatively affect our financial condition and the financial condition of our tenants. These changes, in some cases, could apply retroactively. The enactment, timing or effect of legislative or regulatory changes cannot be predicted.
The Patient Protection and Affordable Care Act of 2010 (the “Affordable Care Act”) and the Health Care and Education Reconciliation Act of 2010, which amends the Affordable Care Act (collectively, the “Health Reform Laws”) are changing how healthcare services are covered, delivered and reimbursed through expanded coverage of uninsured individuals and reduced Medicare program spending. In addition, the new law reforms certain aspects of health insurance, expands existing efforts to tie Medicare and Medicaid payments to performance and quality and contains provisions intended to strengthen fraud and abuse enforcement. The complexities and ramifications of the Affordable Care Act are significant and are being implemented in a phased approach which began in 2010. At this time, it is difficult to predict the full effects of the Affordable Care Act and its impact on our business, our revenues and financial condition and those of our tenants due to the law’s complexity, lack of implementing regulations or interpretive guidance, gradual implementation and possible amendment. Further, we are unable to foresee how individuals and businesses will respond to the choices afforded them by the Affordable Care Act, or the effect of any potential changes made to the Affordable Care Act or other healthcare laws and programs. The Affordable Care Act could adversely affect the reimbursement rates received by our tenants, the financial success of our tenants, and strategic partners and consequently us.
50
On June 28, 2012, the United States Supreme Court upheld the individual mandate of the Affordable Care Act but partially invalidated the expansion of Medicaid. The ruling on Medicaid expansion allow states not to participate in the
expansion (and to forego funding for the Medicaid expansion) without losing their existing Medicaid funding. While the U.S. federal government paid for approximately 100% of those additional costs from 2014 to 2016, states now are expected to pay a small percentage of those additional costs. Because the U.S. federal government substantially funds the Medicaid expansion, it is unclear how many states ultimately will elect this option. The participation by states in the Medicaid expansion could have the effect of increasing some of our tenants’ revenues but also could be a strain on U.S. federal government and state budgets.
Since the enactment of the Affordable Care Act, there have been multiple attempts through legislative action and legal challenge to repeal or amend the law, including the case that was before the U.S. Supreme Court,
King v. Burwell
. Although the Supreme Court in
Burwell
upheld the use of subsidies to individuals in federally-facilitated health care exchanges on June 25, 2015, which ultimately did not disrupt significantly the implementation of the Health Reform Laws, we cannot predict whether other current or future efforts to repeal or amend the Health Reform Laws will be successful, nor can we predict the impact that such a repeal or amendment would have on our operators or tenants and their ability to meet their obligations to us.
President Trump and leadership in Congress have publicly stated their intention to repeal and replace the Affordable Care Act. On January 20, 2017, President Trump issued an Executive Order stating that it is the administration’s official policy to repeal the Affordable Care Act and instructing the Secretary of Health and Human Services and the heads of all other executive departments and agencies with authority and responsibility under the Affordable Care Act to, among other matters, delay implementation of or grant an exemption from any provision of the Affordable Care Act that would impose a fiscal burden on any state or a cost, fee, tax, penalty, or regulatory burden on individuals, families, healthcare providers, health insurers, patients, and others. We cannot predict the effect of this Executive Order on the Affordable Care Act, or whether the attempt to repeal and replace the law will be successful.
Further, we cannot predict how the Affordable Care Act might be amended or modified, either through the legislative or judicial process, and how any such modification might impact our tenants’ operations or the net effect of this law on us. If the operations, cash flows or financial condition of our operators and tenants are materially adversely impacted by any repeal or modification of the law, our revenue and operations may be adversely affected as well.
Recent Developments
On
December 22, 2016
, the Trust’s Board of Trustees authorized and we declared a cash distribution of
$0.225
per common share and common OP Unit for the quarterly period ended
December 31, 2016
. The distribution was paid on
January 18, 2017
to common shareholders and OP Unit holders of record as of the close of business on
January 5, 2017
.
On January 12, 2017,
91,236
Series A Preferred Units issued in conjunction with the Nashville MOB acquisition were redeemed for a total value of $20.0 million.
2017
Property Acquisitions
Since January 1,
2017
, we have completed acquisitions of
4
healthcare properties for an aggregate purchase price of
$109.5 million
containing an aggregate of
238,312
net leasable square feet. In addition, we funded an aggregate
$2.3 million
of loans in
2
separate transactions, resulting in aggregate investment activity of
$111.8 million
. Property acquisitions subsequent to January 1,
2017
are summarized below.
|
Property(1)
|
Location
|
Acquisition
Date |
Investment
(in thousands) |
|||||
|
Orthopedic Associates MOB
|
Flower Mound, TX
|
January 5, 2017
|
$
|
18,800
|
|
|||
|
Medical Arts Center at Hartford
|
Plainville, CT
|
January 11, 2017
|
30,300
|
|
||||
|
CareMount Portfolio (2 MOBs)
|
Lake Katrine / Rhinebeck, NY
|
February 14, 2017
|
60,400
|
|
||||
|
|
|
|
$
|
109,500
|
|
|||
We expect to acquire between
$800 million
and
$1 billion
of real estate during
2017
, including the approximately
$109.5 million
of acquisitions described above.
51
Assets Slated for Disposition
The Company has determined that certain past and future rental payments and prepaid expenses from 4 assets affiliated with Foundation Healthcare, Inc. (OTC: FDNH) (“Foundation Healthcare”) may be uncollectible at this time and has reserved approximately
$3.7 million
against previously recognized rental revenue, prepaid expenses, and deferred rent.
$1.1 million
of this charge is attributable to a lease default by Foundation Healthcare’s wholly-owned subsidiary that rented a medical office facility from us in Oklahoma City, Oklahoma. We have entered in to a purchase and sale agreement to sell this medical office building for $15.3 million. The closing of the sale of this property is subject to customary closing conditions, and no assurance can be made that we will complete the sale of this property or as to the timing or terms of any such sale.
Approximately
$2.6 million
of this charge is attributable to obligations under 3 separate leases for 2 surgical hospitals and a medical office building leased to Foundation Healthcare-physician joint ventures in San Antonio and El Paso, Texas. The Company is actively working with Foundation Healthcare and the physician co-owners in each separate surgical hospital involved to transfer Foundation Healthcare’s interest in each joint venture, shift management away from Foundation Healthcare, and collect past due rent and expenses. Each location is attracting significant interest from surgical hospital management and ownership companies. The Company cannot make any assurance that all or any of the past due rent or prepaid expenses will be collected or that the transfer of joint venture ownership interests from FDNH to a new surgical hospital management company will occur.
Both the Foundation Surgical Hospital of San Antonio and the Foundation Surgical Hospital of El Paso have operated continuously, during 2016 and during this process, and we do not anticipate any disruption in service by either surgical hospital. These three assets and an additional medical office building leased to the Foundation Healthcare-physician joint venture in San Antonio have been slated for disposition.
Separately, we have entered into definitive purchase agreements to sell four medical office buildings in Georgia from our legacy portfolio, which consist of
80,292
square feet in the aggregate for a purchase price of
$18.2 million
.
In total, the 9 assets slated for disposition contain
319,085
square feet of gross leasable area, and the Company currently estimates that these properties will be sold for approximately
$100 million
to
$125 million
in the aggregate. No assurance can be made, however, that any or all of the properties will be sold, that the Company will receive the anticipated consideration for the sale of any or all of the properties, or as to the timing of any such sale or sales.
Components of Our Revenues, Expenses, and Cash Flow
Revenues
Revenues consist primarily of the rental revenues and property operating expense recoveries we collect from tenants pursuant to our leases. Additionally, we recognize certain cash and non-cash revenues. These cash and non-cash revenues are highlighted below.
Rental revenues.
Rental revenues represent rent under existing leases that is paid by our tenants, straight-lining of contractual rents, and below-market lease amortization reduced by lease inducements and above-market lease amortization.
Expense recoveries
. Certain of our leases require our tenants to make estimated payments to us to cover their proportional share of operating expenses, including but not limited to real estate taxes, property insurance, routine maintenance and repairs, utilities, and property management expenses. We collect these estimated expenses and are reimbursed by our tenants for any actual expenses in excess of our estimates or reimburse tenants if our collected estimates exceed our actual operating expenses. The net reimbursed operating expenses are included in revenues as expense recoveries.
We have certain tenants with absolute net leases. Under these lease agreements, the tenant is responsible for operating and building expenses. For absolute net leases, we do not recognize operating expense or expense recoveries.
Interest income on real estate loans and other
. Represents interest income on mezzanine loans, term loans, notes receivable, income generated on tenant improvements, changes in the fair value of derivative liabilities, and other. Interest income on the loans are recognized as earned based on the terms of the loans subject to evaluation of collectability risks.
Expenses
52
Expenses consist primarily of interest expense, general and administrative costs associated with operating our properties, operating expenses of our properties, depreciation and amortization, and costs we incur to acquire properties.
Interest expense.
We recognize the interest expense we incur on our borrowings as interest expense. Additionally, we incur amortization expense for charges such as legal fees, commitment fees, and arrangement fees that reflect costs incurred with arranging certain debt financings. We generally recognize these costs over the term of the respective debt instrument for which the costs were incurred as a component of interest expense.
General and administrative
. General and administrative expenses include certain expenses such as compensation, accounting, legal, and other professional fees as well as certain other administrative and travel costs, and expenses related to bank charges, franchise taxes, corporate filing fees, exchange listing fees, officer and trustee insurance costs, and other costs associated with being a public company.
Operating Expenses.
Operating expenses include property operating expenses such as real estate taxes, property insurance, routine maintenance and repairs, utilities, and third party property management expenses, some of which are reimbursed to us by tenants under the terms of triple net leases.
Depreciation and amortization
. We incur depreciation and amortization expense on all of our long-lived assets. This non-cash expense is designed under generally accepted accounting principles, or GAAP, to reflect the economic useful lives of our assets.
Acquisition expenses.
Acquisition costs are costs we incur in pursuing and closing property acquisitions accounted for as business combinations. These costs include legal, accounting, valuation, other professional or consulting fees, and the compensation of certain employees who dedicate substantially all of their time to acquisition related job functions. We account for acquisition-related costs as expenses in the period in which the costs are incurred and the services are received.
Impairment loss.
We review long-lived assets every quarter for impairment indicators or whenever events or changes in circumstances indicate that the recorded amount of an asset may not be fully recoverable. Impairment losses are recorded when indicators of impairment are present and the carrying amount of the asset is greater than the sum of future undiscounted cash flows expected to be generated by that asset over the remaining expected holding period. If such criteria are present, an impairment loss is recognized based on the excess of the carrying amount of the asset over its fair value.
Equity in income of unconsolidated entities.
We recognize our 40% share of earnings and losses from the entity that owns the land under Crescent City Surgical Centre.
Gain or loss on sale of investment properties.
Upon the sale of investment properties, gains or losses are recognized based upon the difference between the disposal sale price and the net book value of the asset.
Cash Flow
Cash flows from operating activities.
Cash flows from operating activities are derived largely from net income by adjusting our revenues for those amounts not collected in cash during the period in which the revenue is recognized and for cash collected that was billed in prior periods or will be billed in future periods. Net income is further adjusted by adding back expenses charged in the period that is not paid for in cash during the same period. We expect to make our distributions based largely from cash provided by operations.
Cash flows from investing activities
. Cash flows from investing activities consist of cash that is used during a period for making new investments and capital expenditures, offset by cash provided from sales of real estate investments.
Cash flows from financing activities.
Cash flows from financing activities consist of cash we receive from debt and equity financings. This cash provides the primary basis for investments in new properties and capital expenditures. While we may invest a portion of our cash from operations into new investments, as a result of the distribution requirements to maintain our REIT status, it is likely that additional debt or equity financings will finance the majority of our investment activity. Cash used in financing activities consists of repayment of debt and distributions paid to shareholders and OP Unit holders.
Results of Operations
Year Ended
December 31, 2016
compared to the Year Ended
December 31, 2015
.
53
The following table summarizes our results of operations for the years ended
December 31, 2016
and
2015
(in thousands):
|
|
2016
|
2015
|
Change
|
%
|
||||||||||
|
Revenues:
|
|
|
|
|
|
|
|
|
||||||
|
Rental revenues
|
$
|
186,301
|
|
$
|
103,974
|
|
$
|
82,327
|
|
79.2
|
|
|||
|
Expense recoveries
|
45,875
|
|
21,587
|
|
24,288
|
|
112.5
|
|
||||||
|
Interest income on real estate loans and other
|
8,858
|
|
3,880
|
|
4,978
|
|
128.3
|
|
||||||
|
Total revenues
|
241,034
|
|
129,441
|
|
111,593
|
|
86.2
|
|
||||||
|
Expenses:
|
|
|
|
|
|
|
|
|
||||||
|
Interest expense
|
23,864
|
|
10,636
|
|
13,228
|
|
124.4
|
|
||||||
|
General and administrative
|
18,397
|
|
14,908
|
|
3,489
|
|
23.4
|
|
||||||
|
Operating expenses
|
65,999
|
|
31,026
|
|
34,973
|
|
112.7
|
|
||||||
|
Depreciation and amortization
|
86,589
|
|
45,471
|
|
41,118
|
|
90.4
|
|
||||||
|
Acquisition expenses
|
14,778
|
|
14,893
|
|
(115
|
)
|
(0.8
|
)
|
||||||
|
Total expenses
|
209,627
|
|
116,934
|
|
92,693
|
|
79.3
|
|
||||||
|
Income before equity in income of unconsolidated entity and gain on sale of investment properties:
|
31,407
|
|
12,507
|
|
18,900
|
|
151.1
|
|
||||||
|
Equity in income of unconsolidated entities
|
115
|
|
104
|
|
11
|
|
10.6
|
|
||||||
|
Gain on sale of investment properties
|
—
|
|
130
|
|
(130
|
)
|
NM
|
|
||||||
|
Net income
|
$
|
31,522
|
|
$
|
12,741
|
|
$
|
18,781
|
|
147.4
|
|
|||
NM = Not Meaningful
Revenues
Total revenues
increase
d
$111.6 million
, or
86.2%
, for the year ended
December 31, 2016
as compared to the year ended
December 31, 2015
. An analysis of selected revenues follows.
Rental revenues.
Rental revenues
increase
d
$82.3 million
, or
79.2%
, from
$104.0 million
for the year ended
December 31, 2015
to
$186.3 million
for the year ended
December 31, 2016
. The
increase
in rental revenues primarily resulted from our
2016
and
2015
acquisitions which resulted in additional rental revenue of
$52.1 million
and
$31.3 million
, respectively.
Expense recoveries.
Expense recoveries
increase
d
$24.3 million
, or
112.5%
, for the for the year ended
December 31, 2016
as compared to the year ended
December 31, 2015
. The
increase
in expense recoveries primarily resulted from our
2016
and
2015
acquisitions which resulted in additional expense recoveries of
$14.0 million
and
$10.2 million
, respectively.
Interest income on real estate loans and other
. Interest income on real estate loans and other
increase
d
$5.0 million
for the year ended
December 31, 2016
as compared to the year ended
December 31, 2015
. Loan transactions completed during the prior twelve months resulted in
$1.9 million
of increased interest revenue, while other income increased
$2.9 million
relative to the prior year due to the buyout of a purchase option (
$2.1 million
) and the write-off of an expired contingent liability (
$0.8 million
).
Expenses
Total expenses
increase
d by
$92.7 million
, or
79.3%
, for the year ended
December 31, 2016
as compared to the year ended
December 31, 2015
. An analysis of selected expenses follows.
Interest expense
. Interest expense for the year ended
December 31, 2016
was
$23.9 million
compared to
$10.6 million
for the year ended
December 31, 2015
, representing an
increase
of
$13.2 million
, or
124.4%
. An increase of
$7.9 million
resulted from the issuance of our senior notes, an increase of
$3.5 million
resulted from borrowings under the term loan provision of our unsecured credit facility, an increase of
$1.0 million
resulted from the amortization deferred financing fees on our credit facility, and an increase of
$0.9 million
was the result of an increase in interest on new mortgage debt.
54
General and administrative
. General and administrative expenses
increase
d
$3.5 million
or
23.4%
, from
$14.9 million
during the year ended
December 31, 2015
to
$18.4 million
during the year ended
December 31, 2016
. The
increase
included salaries and benefits of
$2.0 million
(including non-cash share compensation of
$0.8 million
), increased office expenditures of
$0.7 million
, and increased travel expenditures of
$0.3 million
.
Operating expenses
. Operating expenses
increase
d
$35.0 million
or
112.7%
, from
$31.0 million
during the year ended
December 31, 2015
to
$66.0 million
during the year ended
December 31, 2016
. The
increase
is primarily due to our
2016
and
2015
property acquisitions which resulted in additional operating expenses of
$19.8 million
and
$11.8 million
, respectively.
Depreciation and amortization
. Depreciation and amortization
increase
d
$41.1 million
, or
90.4%
, from
$45.5 million
during the year ended
December 31, 2015
to
$86.6 million
during the year ended
December 31, 2016
. The
increase
is due to our
2016
and
2015
property acquisitions which resulted in additional depreciation and amortization of
$24.5 million
and
$15.1 million
, respectively.
Acquisition expenses
. Acquisition expenses
decrease
d
$0.1 million
, or
0.8%
, from
$14.9 million
during the year ended
December 31, 2015
to
$14.8 million
during the year ended
December 31, 2016
. During the
twelve month periods ending December 31, 2016 and 2015
, we acquired
$735.8 million
and
$779.2 million
, respectively, of real estate that were considered business combinations and as such, the related acquisition costs were expensed.
Equity in income of unconsolidated entity.
The change in equity income from unconsolidated entity for the year ended
December 31, 2015
compared to the year ended
December 31, 2016
is not significant.
Gain on sale of property.
On March 26, 2015, the Company sold a 20,329 square foot medical office building located in Ohio for approximately $1.6 million, resulting in an insignificant loss. On July 31, 2015, the Company sold a 26,783 square foot medical office building located in Michigan for approximately $1.5 million, realizing a gain of $0.1 million. We have not disposed of any properties during the year ended
December 31, 2016
.
Year Ended
December 31, 2015
compared to the Year Ended
December 31, 2014
.
The following table summarizes our results of operations for the years ended December 31,
2015
and
2014
(in thousands):
|
|
2015
|
2014
|
Change
|
%
|
||||||||||
|
Revenues:
|
|
|
|
|
|
|
|
|
||||||
|
Rental revenues
|
$
|
103,974
|
|
$
|
46,397
|
|
$
|
57,577
|
|
124.1
|
|
|||
|
Expense recoveries
|
21,587
|
|
5,871
|
|
15,716
|
|
267.7
|
|
||||||
|
Interest income on real estate loans and other
|
3,880
|
|
1,066
|
|
2,814
|
|
264.0
|
|
||||||
|
Total revenues
|
129,441
|
|
53,334
|
|
76,107
|
|
142.7
|
|
||||||
|
Expenses:
|
|
|
|
|
|
|
|
|
||||||
|
Interest expense
|
10,636
|
|
6,907
|
|
3,729
|
|
54.0
|
|
||||||
|
General and administrative
|
14,908
|
|
11,440
|
|
3,468
|
|
30.3
|
|
||||||
|
Operating expenses
|
31,026
|
|
10,154
|
|
20,872
|
|
205.6
|
|
||||||
|
Depreciation and amortization
|
45,471
|
|
16,731
|
|
28,740
|
|
171.8
|
|
||||||
|
Acquisition expenses
|
14,893
|
|
10,897
|
|
3,996
|
|
36.7
|
|
||||||
|
Impairment loss
|
—
|
|
1,750
|
|
(1,750
|
)
|
NM
|
|
||||||
|
Total expenses
|
116,934
|
|
57,879
|
|
59,055
|
|
102.0
|
|
||||||
|
Gain (loss) before equity in income of unconsolidated entity and gain on sale of investment properties:
|
12,507
|
|
(4,545
|
)
|
17,052
|
|
(375.2
|
)
|
||||||
|
Equity in income of unconsolidated entity
|
104
|
|
95
|
|
9
|
|
9.5
|
|
||||||
|
Gain on sale of investment properties
|
130
|
|
32
|
|
98
|
|
306.3
|
|
||||||
|
Net income (loss)
|
$
|
12,741
|
|
$
|
(4,418
|
)
|
$
|
17,159
|
|
(388.4
|
)
|
|||
NM = Not Meaningful
55
Revenues
Total revenues increased $76.1 million, or 142.7%, for the year ended December 31, 2015 as compared to the year ended December 31, 2014. An analysis of selected revenues follows.
Rental revenues.
Rental revenues increased $57.6 million, or 124.1%, from $46.4 million for the year ended December 31, 2014 to $104.0 million for the year ended December 31, 2015. The increase in rental revenues primarily resulted from our 2015 and 2014 acquisitions which resulted in additional rental revenue of $31.0 million and $26.5 million, respectively.
Expense recoveries.
Expense recoveries increased $15.7 million, or 267.7%, for the year ended December 31, 2015 as compared to the year ended December 31, 2014. The increase in expense recoveries are the result of our 2015 and 2014 acquisitions which resulted in additional expense recoveries of $9.8 million and $5.9 million, respectively.
Interest income on real estate loans and other
. Interest income on real estate loans and other increased $2.8 million, or 264.0%, for the year ended December 31, 2015 as compared to the year ended December 31, 2014. The increase primarily resulted from $1.5 million of additional interest earned on the Company’s loan investments and $0.8 million of amortized tenant improvement income during the year ended December 31, 2015.
Expenses
Total expenses increased by $59.1 million, or 102.0%, for the year ended December 31, 2015 as compared to the year ended December 31, 2014. An analysis of selected expenses follows.
Interest expense
. Interest expense for the year ended December 31, 2015 was $10.6 million compared to $6.9 million for the year ended December 31, 2014, representing an increase of $3.7 million, or 54.0%. The $3.7 million increase was the result of a $0.9 million increase in interest on new mortgage debt and $3.0 million increase resulting from outstanding balances, non-use fees and amortization of deferred financing costs on our revolving line of credit, partially offset by a $0.2 million decrease in interest on mortgage debt due to pay-downs of existing debt.
General and administrative
. General and administrative expenses increased $3.5 million or 30.3%, from $11.4 million during the year ended December 31, 2014 to $14.9 million during the year ended December 31, 2015. The increase was primarily the result of additional salaries and benefits expenses totaling $3.5 million (including non-cash share compensation of $1.1 million). Other increases in administrative costs were offset by the absence of a one-time charge related to the $1.8 million shared services amendment which occurred during 2014.
Operating expenses
. Operating expenses increased $20.9 million or 205.6%, from $10.2 million during the year ended December 31, 2014 to $31.0 million during the year ended December 31, 2015. The increase in operating expenses primarily resulted from our 2015 and 2014 acquisitions which resulted in additional operating expenses of $12.7 million and $9.0 million, respectively.
Depreciation and amortization
. Depreciation and amortization increased $28.7 million, or 171.8%, from $16.7 million during the year ended December 31, 2014 to $45.5 million during the year ended December 31, 2015. The increase in depreciation and amortization primarily resulted from our 2015 and 2014 acquisitions which resulted in additional depreciation and amortization of $17.3 million and $11.5 million, respectively.
Acquisition expenses
. Acquisition expenses increased $4.0 million or 36.7%, from $10.9 million during the year ended December 31, 2014 to $14.9 million for the year ended December 31, 2015. During the year ended December 31, 2015 and 2014, we acquired $779.2 million and $322.8 million, respectively, of real estate that were considered business combinations and as such, the related acquisition costs were expensed.
Impairment loss.
The Trust recognized a $1.8 million impairment loss on two medical office buildings purchased by the Predecessor for the year ended December 31, 2014. No such impairment loss was recorded for the year ended December 31, 2015.
Equity in income of unconsolidated entity.
The change in equity income from unconsolidated entity for the year ended December 31, 2015 compared to the year ended December 31, 2014 is not significant.
56
Gain on sale of investment properties.
On March 26, 2015, the Company sold a 20,329 square foot medical office building located in Ohio for approximately $1.6 million, resulting in an insignificant loss. On July 31, 2015, the Company sold a 26,783 square foot medical office building located in Michigan for approximately $1.5 million, realizing a gain of $0.1 million. On September 19, 2014, the Company sold a 2,000 square foot medical office building condominium unit located in Florida for approximately $0.3 million, resulting in an insignificant gain.
Cash Flows
Year Ended
December 31, 2016
compared to the Year Ended
December 31, 2015
(in thousands).
|
|
2016
|
2015
|
|||||
|
Cash provided by operating activities
|
$
|
124,779
|
|
$
|
61,352
|
|
|
|
Cash used in investing activities
|
(1,261,176
|
)
|
(801,716
|
)
|
|||
|
Cash provided by financing activities
|
1,148,745
|
|
727,584
|
|
|||
|
Increase (decrease) in cash and cash equivalents
|
$
|
12,348
|
|
$
|
(12,780
|
)
|
|
Cash flows from operating activities
. Cash flows provided by operating activities was
$124.8 million
during the
twelve months ended December 31, 2016
compared to
$61.4 million
during the
twelve months ended December 31, 2015
, representing an increase of
$63.4 million
. This change is primarily attributable to the
increase
d operating cash flows resulting from our
2016
and
2015
acquisitions.
Cash flows from investing activities
. Cash flows used in investing activities was
$1.26 billion
during the
twelve months ended December 31, 2016
compared to cash flows used in investing activities of
$801.7 million
during the
twelve months ended December 31, 2015
, representing a change of
$459.5 million
. The
increase
in cash flows used in investing activities was primarily attributable to our
$492.3 million
increase
in acquisition activity over the prior year, partially offset by reductions in cash used to fund real estate loans and notes totaling
$32.7 million
.
Cash flows from financing activities
. Cash flows provided by financing activities was
$1.15 billion
during the
twelve months ended December 31, 2016
compared to cash flows provided by financing activities of
$727.6 million
during the
twelve months ended December 31, 2015
, representing an
increase
of
$421.1 million
. The
2016
activity was primarily attributable to sales of our common shares, resulting in net proceeds of
$766.8 million
,
$1.18 billion
of proceeds from the credit facility, and
$225.0 million
from our issuance of senior notes. These were partially offset by the
$925.0 million
of payoffs on our credit facility and
$104.9 million
of dividends paid.
Year Ended
December 31, 2015
compared to Year Ended
December 31, 2014
(in thousands).
|
|
2015
|
2014
|
|||||
|
Net cash provided by operating activities
|
$
|
61,352
|
|
$
|
13,295
|
|
|
|
Net cash used in investing activities
|
(801,716
|
)
|
(518,810
|
)
|
|||
|
Net cash provided by financing activities
|
727,584
|
|
464,960
|
|
|||
|
Decrease in cash and cash equivalents
|
$
|
(12,780
|
)
|
$
|
(40,555
|
)
|
|
Cash flows from operating activities
. Cash flows provided by operating activities was $61.4 million during the twelve months ended December 31, 2015 compared to $13.3 million during the twelve months ended December 31, 2014, representing an increase of $48.1 million. This change is attributable to the increased operating cash flows resulting from our 2015 and 2014 acquisitions.
Cash flows from investing activities
. Cash flows used in investing activities was $801.7 million during the twelve months ended December 31, 2015 compared to cash flows used in investing activities of $518.8 million during the twelve months ended December 31, 2014, representing a change of $282.9 million. The increase in cash flows used in investing activities was primarily attributable to our $251.7 million increase in acquisition activity over the prior year.
Cash flows from financing activities
. Cash flows provided by financing activities was $727.6 million during the twelve months ended December 31, 2015 compared to cash flows provided by financing activities of $465.0 million during the twelve months ended December 31, 2014, representing an increase of $262.6 million. The 2015 activity was primarily attributable to our follow-on public offerings and the at-the-market offering, resulting in net proceeds of $545.1 million, and $620.0 million of
57
proceeds from borrowings on our revolving credit facility. These were partially offset by the $363.0 million paydown of our revolving credit facility and $63.7 million of dividends paid.
Non-GAAP Financial Measures
This report includes Funds From Operations (FFO), Normalized FFO, Normalized Funds Available For Distribution (FAD), Net Operating Income (NOI), Cash NOI, Same-Store Cash NOI, Earnings Before Interest, Taxes, Depreciation, and Amortization (EBITDA) and Adjusted EBITDA, which are non-GAAP financial measures. For purposes of Item 10(e) of Regulation S-K promulgated under the Securities Act, a non-GAAP financial measure is a numerical measure of a company’s historical or future financial performance, financial position or cash flows that excludes amounts, or is subject to adjustments that have the effect of excluding amounts, that are included in the most directly comparable financial measure calculated and presented in accordance with GAAP in the statement of operations, balance sheet, or statement of cash flows (or equivalent statements) of the company, or includes amounts, or is subject to adjustments that have the effect of including amounts, that are excluded from the most directly comparable financial measure so calculated and presented. As used in this report, GAAP refers to generally accepted accounting principles in the United States of America. Pursuant to the requirements of Item 10(e) of Regulation S-K promulgated under the Securities Act, we have provided reconciliations of the non-GAAP financial measures to the most directly comparable GAAP financial measures.
Funds From Operations (FFO) and Normalized FFO
We believe that information regarding FFO is helpful to shareholders and potential investors because it facilitates an understanding of the operating performance of our properties without giving effect to real estate depreciation and amortization, which assumes that the value of real estate assets diminishes ratably over time. We calculate FFO in accordance with standards established by the National Association of Real Estate Investment Trusts (“NAREIT”). NAREIT defines FFO as net income or loss (computed in accordance with GAAP) before noncontrolling interests of holders of OP units, excluding preferred distributions, gains (or losses) on sales of depreciable operating property, impairment write-downs on depreciable assets, plus real estate related depreciation and amortization (excluding amortization of deferred financing costs). Our FFO computation may not be comparable to FFO reported by other REITs that do not compute FFO in accordance with NAREIT definition or that interpret the NAREIT definition differently than we do. The GAAP measure that we believe to be most directly comparable to FFO, net income, includes depreciation and amortization expenses, gains or losses on property sales, impairments and noncontrolling interests. In computing FFO, we eliminate these items because, in our view, they are not indicative of the results from the operations of our properties. To facilitate a clear understanding of our historical operating results, FFO should be examined in conjunction with net income (determined in accordance with GAAP) as presented in our financial statements. FFO does not represent cash generated from operating activities in accordance with GAAP, should not be considered to be an alternative to net income or loss (determined in accordance with GAAP) as a measure of our liquidity and is not indicative of funds available for our cash needs, including our ability to make cash distributions to shareholders.
We use Normalized FFO, which excludes from FFO net change in fair value of derivative financial instruments, acquisition expenses, acceleration of deferred financing costs, and other normalizing items. However, our use of the term Normalized FFO may not be comparable to that of other real estate companies as they may have different methodologies for computing this amount. Normalized FFO should not be considered as an alternative to net income or loss (computed in accordance with GAAP), as an indicator of our financial performance or of cash flow from operating activities (computed in accordance with GAAP), or as an indicator of our liquidity, nor is it indicative of funds available to fund our cash needs, including its ability to make distributions. Normalized FFO should be reviewed in connection with other GAAP measurements.
58
The following is a reconciliation from the Trust’s net income, the most direct financial measure calculated and presented in accordance with GAAP, to FFO and Normalized FFO (in thousands, except per share data):
|
Year Ended December 31,
|
|||||||
|
|
2016
|
2015
|
|||||
|
Net income
|
$
|
31,522
|
|
$
|
12,741
|
|
|
|
Earnings per share - diluted
|
$
|
0.22
|
|
$
|
0.15
|
|
|
|
Net income
|
$
|
31,522
|
|
$
|
12,741
|
|
|
|
Net income attributable to noncontrolling interests - partially owned properties
|
(716
|
)
|
(377
|
)
|
|||
|
Preferred distributions
|
(1,857
|
)
|
(1,189
|
)
|
|||
|
Depreciation and amortization expense
|
86,501
|
|
45,445
|
|
|||
|
Depreciation and amortization expense - partially owned properties
|
(683
|
)
|
(484
|
)
|
|||
|
Gain on the sale of investment properties
|
—
|
|
(130
|
)
|
|||
|
FFO applicable to common shares and OP Units
|
$
|
114,767
|
|
$
|
56,006
|
|
|
|
FFO per common share and OP Unit
|
$
|
0.88
|
|
$
|
0.73
|
|
|
|
Net change in fair value of derivative
|
(240
|
)
|
(166
|
)
|
|||
|
Acquisition expenses
|
14,778
|
|
14,893
|
|
|||
|
Write-off of contingent consideration
|
(840
|
)
|
—
|
|
|||
|
Normalized FFO applicable to common shares and OP Units
|
$
|
128,465
|
|
$
|
70,733
|
|
|
|
Normalized FFO per common share and OP Unit
|
$
|
0.98
|
|
$
|
0.92
|
|
|
|
|
|
|
|||||
|
Weighted average number of common shares and OP Units outstanding
|
130,466,893
|
|
76,792,073
|
|
|||
Normalized Funds Available for Distribution (FAD)
We define Normalized FAD, a non-GAAP measure, which excludes from Normalized FFO non-cash compensation expense, straight-line rent adjustments, amortization of acquired above or below market leases and assumed debt, amortization of deferred financing costs, amortization of lease inducements, and recurring capital expenditures related to tenant improvements and leasing commissions, and includes cash payments from seller master leases and rent abatement payments. Other REITs or real estate companies may use different methodologies for calculating Normalized FAD, and accordingly, our computation may not be comparable to those reported by other REITs. Although our computation of Normalized FAD may not be comparable to that of other REITs, we believe Normalized FAD provides a meaningful supplemental measure of our performance due to its frequency of use by analysts, investors, and other interested parties in the evaluation of our performance as a REIT. Normalized FAD should not be considered as an alternative to net income or loss attributable to controlling interest (computed in accordance with GAAP) or as an indicator of our financial performance. Normalized FAD should be reviewed in connection with other GAAP measurements.
59
The following is a reconciliation from the Trust’s Normalized FFO to Normalized FAD (in thousands):
|
|
Year Ended December 31,
|
|||||||
|
|
2016
|
2015
|
||||||
|
Net income
|
$
|
31,522
|
|
$
|
12,741
|
|
||
|
Normalized FFO applicable to common shares and OP Units
|
$
|
128,465
|
|
$
|
70,733
|
|
||
|
Normalized FFO applicable to common shares and OP Units
|
$
|
128,465
|
|
$
|
70,733
|
|
||
|
Non-cash share compensation expense
|
3,920
|
|
3,084
|
|
||||
|
Straight-line rent adjustments
|
(16,226
|
)
|
(9,000
|
)
|
||||
|
Amortization of acquired above/below market leases/assumed debt
|
2,778
|
|
1,832
|
|
||||
|
Amortization of lease inducements
|
892
|
|
572
|
|
||||
|
Amortization of deferred financing costs
|
2,325
|
|
1,373
|
|
||||
|
TI/LC and recurring capital expenditures
|
(8,087
|
)
|
(4,988
|
)
|
||||
|
Seller master lease and rent abatement payments
|
1,032
|
|
1,321
|
|
||||
|
Normalized FAD applicable to common shares and OP Units
|
$
|
115,099
|
|
$
|
64,927
|
|
||
Net Operating Income (NOI) and Cash NOI
NOI is a non-GAAP financial measure that is defined as net income or loss, computed in accordance with GAAP, generated from our total portfolio of properties before general and administrative expenses, acquisition expenses, depreciation and amortization expense, interest expense, net change in the fair value of derivative financial instruments, gain or loss on the sale of investment properties, and impairment losses. We believe that NOI provides an accurate measure of operating performance of our operating assets because NOI excludes certain items that are not associated with management of the properties. Our use of the term NOI may not be comparable to that of other real estate companies as they may have different methodologies for computing this amount.
Cash NOI is a non-GAAP financial measure which excludes from NOI straight-line rent adjustments, amortization of acquired above and below market leases, and other non-cash and normalizing items. Other non-cash and normalizing items include items such as the amortization of lease inducements and payments received from seller master leases and rent abatements. We believe that Cash NOI provides an accurate measure of the operating performance of our operating assets because it excludes certain items that are not associated with management of the properties. Additionally, we believe that Cash NOI is a widely accepted measure of comparative operating performance in the real estate community. Our use of the term Cash NOI may not be comparable to that of other real estate companies as such other companies may have different methodologies for computing this amount.
60
The following is a reconciliation from the Trust’s net income, the most direct financial measure calculated and presented in accordance with GAAP, to NOI, and Cash NOI (in thousands):
|
Year Ended December 31,
|
|||||||
|
|
2016
|
2015
|
|||||
|
Net income
|
$
|
31,522
|
|
$
|
12,741
|
|
|
|
General and administrative
|
18,397
|
|
14,908
|
|
|||
|
Acquisition expenses
|
14,778
|
|
14,893
|
|
|||
|
Depreciation and amortization
|
86,589
|
|
45,471
|
|
|||
|
Interest expense
|
23,864
|
|
10,636
|
|
|||
|
Net change in the fair value of derivative
|
(240
|
)
|
(166
|
)
|
|||
|
Gain on the sale of investment properties
|
—
|
|
(130
|
)
|
|||
|
NOI
|
$
|
174,910
|
|
$
|
98,353
|
|
|
|
|
|
|
|||||
|
NOI
|
$
|
174,910
|
|
$
|
98,353
|
|
|
|
Straight-line rent adjustments
|
(16,226
|
)
|
(9,000
|
)
|
|||
|
Amortization of acquired above/below market leases
|
3,015
|
|
1,832
|
|
|||
|
Amortization of lease inducements
|
892
|
|
572
|
|
|||
|
Seller master lease and rent abatement payments
|
1,032
|
|
1,321
|
|
|||
|
Write-off of contingent consideration
|
(840
|
)
|
—
|
|
|||
|
Cash NOI
|
$
|
162,783
|
|
$
|
93,078
|
|
|
Earnings Before Interest, Taxes, Depreciation, and Amortization (EBITDA) and Adjusted EBITDA
We define EBITDA as net income or loss computed in accordance with GAAP plus depreciation and amortization, interest expense, and net change in the fair value of derivative financial instruments. We define Adjusted EBITDA as net income or loss computed in accordance with GAAP plus depreciation and amortization, interest expense, net change in the fair value of derivative financial instruments, acquisition expenses, non-cash share compensation, and other normalizing items. We consider EBITDA and Adjusted EBITDA important measures because they provide additional information to allow management, investors, and our current and potential creditors to evaluate and compare our core operating results and our ability to service debt.
The following is a reconciliation from the Trust’s net income, the most direct financial measure calculated and presented in accordance with GAAP, to EBITDA and Adjusted EBITDA (in thousands):
|
Year Ended December 31,
|
|||||||
|
|
2016
|
2015
|
|||||
|
Net income
|
$
|
31,522
|
|
$
|
12,741
|
|
|
|
Depreciation and amortization
|
86,589
|
|
45,471
|
|
|||
|
Interest expense
|
23,864
|
|
10,636
|
|
|||
|
Net change in fair value of derivatives
|
(240
|
)
|
(166
|
)
|
|||
|
EBITDA
|
$
|
141,735
|
|
$
|
68,682
|
|
|
|
Acquisition expenses
|
14,778
|
|
14,893
|
|
|||
|
Non-cash share compensation expense
|
3,920
|
|
3,084
|
|
|||
|
Write-off of contingent consideration
|
(840
|
)
|
—
|
|
|||
|
Adjusted EBITDA
|
$
|
159,593
|
|
$
|
86,659
|
|
|
61
Liquidity and Capital Resources
Our short-term liquidity requirements consist primarily of operating and interest expenses and other expenditures directly associated with our properties, including:
|
•
|
property expenses;
|
|
•
|
interest expense and scheduled principal payments on outstanding indebtedness;
|
|
•
|
general and administrative expenses; and
|
|
•
|
capital expenditures for tenant improvements and leasing commissions.
|
In addition, we will require funds for future distributions expected to be paid to our common shareholders and OP Unit holders in our Operating Partnership.
As of
December 31, 2016
, we had a total of
$15.5 million
of cash and cash equivalents and
$448.9 million
of near-term availability on our unsecured revolving credit facility. Our primary sources of cash include rent we collect from our tenants, borrowings under our unsecured credit facility, and financings of debt and equity securities. We believe that our existing cash and cash equivalents, cash flow from operating activities, and borrowings available under our unsecured revolving credit facility will be adequate to fund any existing contractual obligations to purchase properties and other obligations through the next twelve months. However, because of the 90% distribution requirement under the REIT tax rules under the Code, we may not be able to fund all of our future capital needs from cash retained from operations, including capital needed to make investments and to satisfy or refinance maturing obligations. As a result, we expect to rely upon external sources of capital, including debt and equity financing, to fund future capital needs. If we are unable to obtain needed capital on satisfactory terms or at all, we may not be able to make the investments needed to expand our business or to meet our obligations and commitments as they mature. We will rely upon external sources of capital to fund future capital needs, and, if we encounter difficulty in obtaining such capital, we may not be able to make future acquisitions necessary to grow our business or meet maturing obligations.
Our long-term liquidity needs consist primarily of funds necessary to pay for acquisitions, recurring and non-recurring capital expenditures and scheduled debt maturities. We expect to satisfy our long-term liquidity needs through cash flow from operations, unsecured borrowings, issuances of equity and debt securities, and, in connection with acquisitions of additional properties, the issuance of OP Units of our Operating Partnership, and proceeds from select property dispositions and joint venture transactions.
Our ability to access capital in a timely and cost-effective manner is essential to the success of our business strategy as it affects our ability to satisfy existing obligations, including repayment of maturing indebtedness, and to make future investments and acquisitions. Factors such as general market conditions, interest rates, credit ratings on our debt and equity securities, expectations of our potential future earnings and cash distributions, and the trading price of our common shares, each of which are beyond our control and vary or fluctuate over time, all impact our access to and cost of capital. In particular, to the extent interest rates continue to rise, we may experience a decline in the trading price of our common shares, which may impact our decision to conduct equity offerings for capital raising purposes. We will likely also experience higher borrowing costs as interest rates rise, which may also impact our decisions to incur additional indebtedness, or to engage in transactions for which we may need to fund through borrowing.
We expect to continue to utilize equity and debt financings to support our future growth and investment activity. For the twelve months ended December 31, 2016, we raised
$225.0 million
in senior unsecured notes, originated a
$250.0 million
senior unsecured term loan, and increased the balance drawn on our senior unsecured revolving credit facility to
$401.0 million
. A summary of our key financing activities during fiscal year 2016 is included below.
We also continuously evaluate opportunities to finance future investments. New investments are generally funded from temporary borrowings under our primary unsecured credit facility and the proceeds from financing transactions such as those discussed above. Our investments generate cash from net operating income and principal payments on loans receivable. Permanent financing for future investments, which generally replaces funds drawn under our primary unsecured credit facility, has historically been provided through a combination of the issuance of debt and equity securities and the incurrence or assumption of secured debt.
We intend to invest in additional properties as suitable opportunities arise and adequate sources of financing are available. We currently are evaluating additional potential investments consistent with the normal course of our business. There can be no assurance as to whether or when any portion of these investments will be completed. Our ability to complete investments is subject to a number of risks and variables, including our ability to negotiate mutually agreeable terms with
62
sellers and our ability to finance the investment. We may not be successful in identifying and consummating suitable acquisitions or investment opportunities, which may impede our growth and negatively affect our results of operations and may result in the use of a significant amount of management resources. We expect that future investments in properties will depend on and will be financed by, in whole or in part, our existing cash, borrowings, including under our unsecured revolving credit facility, or the proceeds from additional issuances of equity or debt securities.
While we intend to sell the nine assets slated for disposition for other business reasons, we currently do not expect to sell any of our properties to meet our liquidity needs, although we may do so in the future.
We intend to refinance at maturity the mortgage notes payable that have balloon payments at maturity.
We currently are in compliance with all debt covenants in our outstanding indebtedness.
Credit Facility
On June 10, 2016, the Operating Partnership, as borrower, and the Trust entered into an amended and restated Credit Agreement with KeyBank National Association, as administrative agent, KeyBanc Capital Markets Inc., BMO Capital Markets, and Citizens Bank N.A., as joint lead arrangers and co-book runners, BMO Capital Markets and Citizens Bank N.A., as co-syndication agents, and the lenders party thereto (the “Credit Agreement”) which increased the maximum principal amount available under an unsecured revolving credit facility from $750 million to $850 million. The Credit Agreement contains a 7-year term loan feature allowing us to borrow in a single drawing up to
$250 million
, increasing the borrowing capacity to an aggregate
$1.1 billion
. The Credit Agreement also includes a swingline loan commitment for up to
10%
of the maximum principal amount and provides an accordion feature allowing us to increase borrowing capacity by up to an additional
$500 million
, subject to customary terms and conditions, resulting in a maximum borrowing capacity of
$1.6 billion
.
On July 7, 2016, the Operating Partnership borrowed
$250.0 million
under the
7
-year term loan feature of the Credit Agreement. Borrowings under the term loan feature of the Credit Agreement bear interest on the outstanding principal amount at a rate which is determined by the Trust’s credit rating, currently equal to
LIBOR + 1.80%
. The Trust simultaneously entered into a pay-fixed receive-variable rate swap for the full borrowing amount, fixing the LIBOR component of the borrowing rate to
1.07%
, for an all-in fixed rate of
2.87%
. Both the borrowing and pay-fixed receive-variable swap have a maturity date of
June 10, 2023
.
The Credit Agreement has a maturity date of
September 18, 2020
and includes a
one
year extension option. Borrowings under the Credit Agreement bear interest on the outstanding principal amount at an adjusted LIBOR rate, which is based on the Trust’s investment grade rating under the Credit Agreement. As of
December 31, 2016
, the Trust had an investment grade rating from Moody’s of Baa3 and as such, borrowings under the revolving credit facility of the Credit Agreement accrued interest on the outstanding principal at a rate of LIBOR plus
1.20%
. The Credit Agreement includes a facility fee equal to
0.25%
per annum, which is also determined by the Trust’s investment grade rating.
The Credit Agreement contains financial covenants that, among other things, require compliance with leverage and coverage ratios and maintenance of minimum tangible net worth, as well as covenants that may limit our ability to incur additional debt or make distributions. We may, at any time, voluntarily prepay any revolving or swingline loan under the Credit Agreement in whole or in part without premium or penalty. Prepayments of term borrowings require payment of premiums of up to 2.0% of the amount of prepayment, dependent on date of such prepayment. As of
December 31, 2016
, we were in compliance with all financial covenants.
The Credit Agreement includes customary representations and warranties by us and imposes customary covenants on us. The Credit Agreement also contains customary events of default, and if an event of default occurs and continues, the Operating Partnership is subject to certain actions by the administrative agent, including without limitation, the acceleration of repayment of all amounts outstanding under the Credit Agreement.
63
The Credit Agreement provides for revolving credit and term loans to the Operating Partnership. Base Rate Loans, Adjusted LIBOR Rate Loans, and Letters of Credit (each, as defined in the Credit Agreement) will be subject to interest rates, based upon the Trust’s investment grade rating as follows:
|
Credit Rating
|
Margin for Revolving Loans: Adjusted LIBOR Rate Loans
and Letter of Credit Fee
|
Margin for Revolving Loans: Base Rate Loans
|
Margin for Term Loans: Adjusted LIBOR Rate Loans
and Letter of Credit Fee
|
Margin for Term Loans: Base Rate Loans
|
||||||
|
At Least A- or A3
|
LIBOR + 0.85%
|
—
|
%
|
LIBOR + 1.40%
|
0.40
|
%
|
||||
|
At Least BBB+ or BAA1
|
LIBOR + 0.90%
|
—
|
%
|
LIBOR + 1.45%
|
0.45
|
%
|
||||
|
At Least BBB or BAA2
|
LIBOR + 1.00%
|
0.10
|
%
|
LIBOR + 1.55%
|
0.55
|
%
|
||||
|
At Least BBB- or BAA3
|
LIBOR + 1.20%
|
0.20
|
%
|
LIBOR + 1.80%
|
0.80
|
%
|
||||
|
Below BBB- or BAA3
|
LIBOR + 1.55%
|
0.60
|
%
|
LIBOR + 2.25%
|
1.25
|
%
|
||||
As of
December 31, 2016
, there were
$401.0 million
of borrowings outstanding under our unsecured revolving credit facility and
$448.9 million
available for us to borrow without adding additional properties to the unencumbered borrowing base of assets, as defined by the Credit Agreement.
Senior Notes
As of December 31, 2016, we had
$225.0 million
aggregate principal amount of senior notes issued and outstanding by the Operating Partnership, as follows: (i) $15.0 million aggregate principal amount of 4.03% Senior Notes, Series A, due January 7, 2023, (ii) $45.0 million aggregate principal amount of 4.43% Senior Notes, Series B, due January 7, 2026, (iii) $45.0 million aggregate principal amount of 4.57% Senior Notes, Series C, due January 7, 2028, (iv) $45.0 million aggregate principal amount of 4.74% Senior Notes, Series D, due January 7, 2031, (v) $25.0 million aggregate principal amount of 4.09% Senior Notes, Series A, due August 11, 2025, (vi) $25.0 million aggregate principal amount of 4.18% Senior Notes, Series B, due August 11, 2026, and (vii) $25.0 million aggregate principal amount of 4.24% Senior Notes, Series C, due August 11, 2027.
The note agreements covering the notes contain covenants that are substantially similar to those contained in the Credit Agreement, including financial covenants that require compliance with leverage and coverage ratios and maintenance of minimum tangible net worth, as well as other affirmative and negative covenants that may limit, among other things, our ability to incur additional debt, make distributions or investments, incur liens and sell, transfer or dispose of assets. The note agreements also include customary representations and warranties and customary events of default substantially similar to those contained in the Credit Agreement.
Follow-on Equity Offerings
On January 25, 2016, the Trust completed a follow-on public offering of 21,275,000 common shares of beneficial interest, including 2,775,000 common shares issued upon exercise of the underwriters' overallotment option, resulting in net proceeds to us of approximately
$321.1 million
. The Trust contributed the net proceeds of this offering to the Operating Partnership in exchange for 21,275,000 OP Units, and the Operating Partnership used the net proceeds of the public offering to repay borrowings under our unsecured revolving credit facility and for general corporate and working capital purposes and funding acquisitions.
On April 11, 2016, the Trust completed a follow-on public offering of 25,875,000 common shares of beneficial interest, including 3,375,000 common shares issued upon exercise of the underwriters’ overallotment option, resulting in net proceeds to us of approximately
$442.6 million
. The Trust contributed the net proceeds of this offering to the Operating Partnership in exchange for 25,875,000 OP Units, and the Operating Partnership used the net proceeds of the public offering to repay borrowings under our unsecured revolving credit facility, for general corporate and working capital purposes, for funding acquisitions, and to fund a portion of the purchase price for the CHI Acquisition.
ATM Program
On
March 8, 2016
, the Company terminated the separate At Market Issuance Sales Agreements with each of MLV & Co. LLC, KeyBanc Capital Markets Inc., JMP Securities LLC, and RBC Capital Markets, LLC, previously entered into on August 19, 2014. There were no sales of common shares pursuant to such At Market Issuance Sales Agreements during fiscal year 2016.
On August 5, 2016, the Trust and the Operating Partnership entered into separate At Market Issuance Sales Agreements (the “2016 Sales Agreements”) with each of KeyBanc Capital Markets Inc., Credit Agricole Securities (USA) Inc.,
64
JMP Securities LLC, Raymond James & Associates, Inc., and Stifel Nicolaus & Company, Incorporated (the “2016 Agents”), pursuant to which the Trust may issue and sell, from time to time, its common shares having an aggregate offering price of up to $300 million, through the Agents (the “2016 ATM Program”). The offering of the common shares from time to time were registered pursuant to the Trust’s Registration Statement on Form S-3ASR (File No. 333-205034), which became automatically effective upon filing with the Commission on June 17, 2015, as amended by Post-Effective Amendment No. 1 to the Registration Statement on Form S-3ASR, filed by the Trust with the Commission on January 19, 2016. In accordance with the 2016 Sales Agreements, the Trust may offer and sell its common shares through any of the 2016 Agents, from time to time, by any method deemed to be an “at the market offering” as defined in Rule 415 under the Securities Act of 1933, as amended, which includes sales made directly on the New York Stock Exchange or other existing trading market, or sales made to or through a market maker. With the Trust’s express written consent, sales also may be made in negotiated transactions or any other method permitted by law.
During 2016, the Trust’s issuance and sale of common shares pursuant to the 2016 ATM Program is as follows (in thousands, except common shares and price):
|
2016
|
||||||||||
|
|
Common
shares sold
|
Weighted
average price
|
Net
proceeds
|
|||||||
|
Quarterly period ended March 31
|
—
|
|
$
|
—
|
|
$
|
—
|
|
||
|
Quarterly period ended June 30
|
—
|
|
—
|
|
—
|
|
||||
|
Quarterly period ended September 30
|
—
|
|
—
|
|
—
|
|
||||
|
Quarterly period ended December 31
|
135,531
|
|
19.09
|
|
2,561
|
|
||||
|
Year ended December 31
|
135,531
|
|
$
|
19.09
|
|
$
|
2,561
|
|
||
As of
February 17, 2017
, we have
$297.4 million
remaining available under the 2016 ATM Program.
Dividend Reinvestment and Share Purchase Plan
On December 2, 2014, we adopted a Dividend Reinvestment and Share Purchase Plan (the “DRIP”). Under the DRIP:
|
•
|
Existing shareholders may purchase additional common shares by reinvesting all or a portion of the dividends paid on their common shares and by making optional cash payments of not less than $50 and up to a maximum of $10,000 per month;
|
|
•
|
New investors may join the DRIP by making an initial investment of not less than $1,000 and up to a maximum of $10,000; and
|
|
•
|
Once enrolled in the DRIP, participants may authorize electronic deductions from their bank account for optional cash payments to purchase additional shares.
|
The DRIP is administered by our transfer agent, Computershare Trust Company, N.A. Our common shares sold under the DRIP will be newly issued or purchased in the open market, as further described in the DRIP. As of
February 17, 2017
, we have issued
27,909
common shares under the DRIP since its inception.
Critical Accounting Policies
Our consolidated financial statements are prepared in conformity with GAAP, which require us to make estimates and assumptions that affect the reported amounts of assets and liabilities and disclosure of contingent assets and liabilities at the date of the consolidated financial statements and the reported amounts of revenues and expenses during the reporting periods. Actual results could differ from those estimates. Set forth below is a summary of our accounting policies that we believe are critical to the preparation of our consolidated financial statements.
Lease Accounting
We, as lessor, make a determination with respect to each of our leases whether they should be accounted for as operating leases or direct financing leases. The classification criteria is based on estimates regarding the fair value of the leased facilities, minimum lease payments, effective cost of funds, the economic life of the facilities, the existence of a bargain purchase option, and certain other terms in the lease agreements. We believe all of our leases should be accounted for as operating leases. Payments received under operating leases are accounted for in the consolidated statements of operations as rental revenue for actual rent collected plus or minus a straight-line adjustment for estimated minimum lease escalators,
65
adjustments relating to amortization of lease inducements, above and below market leases. Assets subject to operating leases are reported as real estate investments in the consolidated balance sheets.
Substantially all of our leases contain fixed or formula-based rent escalators. To the extent that the escalator increases are tied to a fixed index or rate, lease payments are accounted for on a straight-line basis over the life of the lease.
Principles of Consolidation and Combination
GAAP requires us to identify entities for which control is achieved through means other than voting rights and to determine which business enterprise is the primary beneficiary of variable interest entities (“VIEs”). ASC 810 broadly defines a VIE as an entity in which either (i) the equity investors as a group, if any, lack the power through voting or similar rights to direct the activities of such entity that most significantly impact such entity’s economic performance or (ii) the equity investment at risk is insufficient to finance that entity’s activities without additional subordinated financial support. We identify the primary beneficiary of a VIE as the enterprise that has both of the following characteristics: (i) the power to direct the activities of the VIE that most significantly impact the entity’s economic performance; and (ii) the obligation to absorb losses or receive benefits of the VIE that could potentially be significant to the entity. We consolidate our investment in a VIE when we determine that we are the VIE’s primary beneficiary. We may change our original assessment of a VIE upon subsequent events such as the modification of contractual arrangements that affect the characteristics or adequacy of the entity’s equity investments at risk and the disposition of all or a portion of an interest held by the primary beneficiary. We perform this analysis on an ongoing basis.
For property holding entities not determined to be VIEs, we consolidate such entities in which the Operating Partnership owns
100%
of the equity or has a controlling financial interest evidenced by ownership of a majority voting interest. All intercompany balances and transactions are eliminated in consolidation. For entities in which the Operating Partnership owns less than 100% of the equity interest, the Operating Partnership consolidates the property if it has the direct or indirect ability to control the entities’ activities based upon the terms of the respective entities’ ownership agreements. For these entities, the Operating Partnership records a noncontrolling interest representing equity held by noncontrolling interests.
Purchase of Investment Properties
A property acquired not subject to an existing lease is treated as an asset acquisition and recorded at its purchase price, inclusive of acquisition costs, allocated between the acquired tangible assets and assumed liabilities based upon their relative fair values at the date of acquisition. A property acquired with an existing lease is accounted for as a business combination pursuant to the acquisition method in accordance with ASC Topic 805,
Business Combinations
(“ASC 805”), and assets acquired and liabilities assumed, including identified intangible assets and liabilities, are recorded at fair value.
The determination of fair value involves the use of significant judgment and estimation. We make estimates of the fair value of the tangible and intangible acquired assets and assumed liabilities using information obtained from multiple sources as a result of pre-acquisition due diligence and may include the assistance of a third party appraiser. We estimate the fair value of buildings acquired on an as-if-vacant basis and depreciate the building value over its estimated remaining life. We determine the allocated value of other fixed assets, such as site improvements, based upon the replacement cost and depreciate such value over the assets’ estimated remaining useful lives as determined at the applicable acquisition date. The fair value of land is determined either by considering the sales prices of similar properties in recent transactions or based on internal analyses of recently acquired and existing comparable properties within our portfolio.
In recognizing identified intangible assets and liabilities in connection with a business combination, the value of above-or-below market leases is estimated based on the present value (using an interest rate which reflected the risks associated with the leases acquired) of the difference between contractual amounts to be received pursuant to the leases and management’s estimate of market lease rates measured over a period equal to the estimated remaining term of the lease. The capitalized above-market or below-market lease intangibles are amortized as a reduction or addition to rental income over the estimated remaining term of the respective leases.
In determining the value of in-place leases and tenant relationships, management considers current market conditions and costs to execute similar leases in arriving at an estimate of the carrying costs during the expected lease-up period from vacant to existing occupancy. In estimating carrying costs, management includes real estate taxes, insurance, other operating expenses, estimates of lost rental revenue during the expected lease-up periods, and costs to execute similar leases, including leasing commissions, tenant improvements, legal, and other related costs based on current market demand. The values assigned to in-place leases and tenant relationships are amortized over the estimated remaining term of the lease. If a lease terminates prior to its scheduled expiration, all unamortized costs related to that lease are written off.
66
The values assigned to all lease intangible assets and liabilities are amortized over the estimated remaining term of the lease. If a lease terminates prior to its scheduled expiration, all unamortized costs related to that lease are written off.
We calculate the fair value of any long-term debt assumed by discounting the remaining contractual cash flows on each instrument at the current market rate for those borrowings, which we approximate based on the rate at which it would expect to incur a replacement instrument on the date of acquisition, and recognize any fair value adjustments related to long-term debt as effective yield adjustments over the remaining term of the instrument.
Based on these estimates, we recognize the acquired assets and assumed liabilities at their estimated fair values, which generally are determined using Level 3 inputs, such as market rental rates, capitalization rates, discount rates, or other available market data. Initial valuations are subject to change until the information is finalized, no later than 12 months from the acquisition date. We expense transaction costs associated with acquisitions accounted for as business combinations in the period incurred.
Real Estate Investment Properties and Identified Intangible Assets
We are required to make subjective assessments of the useful lives of our properties for purposes of determining the amount of depreciation to record on an annual basis with respect to our investments in real estate. These assessments have a direct impact on our net income because if we were to shorten the expected useful lives of our investments in real estate we would depreciate such investments over fewer years, resulting in more depreciation expense and lower net income on an annual basis. Real estate investment properties and identified intangible assets are carried at cost, net of accumulated depreciation and amortization. Medical office buildings are depreciated over their estimated useful lives ranging up to 50 years using the straight-line method. Tenant improvements and in-place leases are amortized over the lease life of the in-place leases or the tenant’s respective lease term. Cost of maintenance and repairs are charged to expense when incurred.
We periodically assess the carrying value of real estate investments and related intangible assets in accordance with ASC Topic 360,
Property, Plant & Equipment
(“ASC 360”), to determine if facts and circumstances exist that would suggest that the recorded amount of an asset might be impaired or that the estimated useful life should be modified. In the event impairment in value occurs and a portion of the carrying amount of the real estate investment will not be recovered in part or in whole, a provision will be recorded to reduce the carrying basis of the real estate investment and related intangibles to their estimated fair value. The estimated fair value of our real estate investments is determined by use of a number of customary industry standard methods that include discounted cash flow modeling using appropriate discount and capitalization rates and/or estimated cash proceeds received upon the anticipated disposition of the asset from market comparables. Estimates of future cash flows is based on a number of factors including the historical operating results, leases in place, known trends, and other market or economic factors affecting the real estate investment. The evaluation of anticipated cash flows is subjective and is based on assumptions regarding future occupancy, lease rates and capital requirements that could differ materially from actual results. If our anticipated holding periods change or estimated cash flows decline based on market conditions or other unforeseen factors, impairment may be recognized. Long-lived assets to be disposed of are recorded at the lower of carrying value or fair value less costs to sell.
Revenue
We recognize rental revenues in accordance with ASC 840,
Leases
(“ASC 840”). ASC 840 requires that rental revenue and adjustments relating to lease inducements and above and below market leases, be recognized on a straight-line basis over the term of the lease when collectability is reasonably assured. Recognizing rental revenue on a straight-line basis for leases may result in recognizing revenue for amounts more or less than amounts currently due from tenants. Amounts recognized in excess of amounts currently due are included in other assets on the consolidated balance sheets. If we determine the collectability of straight-line rents is not reasonably assured, we limit future recognition to amounts contractually owed and, where appropriate, establish an allowance for estimated losses.
Expense recoveries related to tenant reimbursement for real estate taxes, insurance, and other operating expenses are recognized as expense recoveries revenue in the period the applicable expenses are incurred. The reimbursements are recognized at gross, as we are generally the primary obligor with respect to real estate taxes and purchasing goods and services from third party suppliers, and have discretion in selecting the supplier, and bear the credit risk.
We have certain tenants with absolute net leases. Under these lease agreements, the tenant is responsible for operating and building expenses. For absolute net leases, we do not recognize expense recoveries.
67
Use of Estimates
The preparation of the consolidated financial statements in conformity with GAAP requires management to make estimates and assumptions that affect the reported amounts of assets and liabilities and disclosure of contingent assets and liabilities at the date of the consolidated financial statements and the reported amounts of revenues and expenses during the reporting period. Significant estimates are made for the valuation of real estate and related intangibles, valuation of financial instruments, impairment assessments, and fair value assessments with respect to purchase price allocations. Actual results could differ from those estimates.
REIT Qualification Requirements
We are subject to a number of operational and organizational requirements necessary to qualify and maintain our qualification as a REIT. If we fail to qualify as a REIT or fail to remain qualified as a REIT in any taxable year, our income would be subject to federal income tax at regular corporate rates and potentially increased state and local taxes and could incur substantial tax liabilities which could have an adverse impact upon our results of operations, liquidity, and distributions to our shareholders.
Real Estate Taxes
As owner of our properties, we are ultimately liable for the real estate taxes on our properties. Pursuant to our triple-net lease agreements, tenants generally are responsible, directly or indirectly, for the payment of all real estate taxes assessed on our properties, which are subject to triple-net leases.
Off-Balance Sheet Arrangements
As of
December 31, 2016
, we had no off-balance sheet debt.
Contractual Obligations
The following table summarizes our material contractual payment obligations and commitments as of
December 31, 2016
:
|
|
|
By Period (in thousands)
|
|||||||||||||||||
|
|
Total
|
Less than 1
Year
|
2018-2019
|
2020-2021
|
2022 and
Thereafter
|
||||||||||||||
|
Principal (1)
|
$
|
999,194
|
|
$
|
38,615
|
|
$
|
60,016
|
|
$
|
414,247
|
|
$
|
486,316
|
|
||||
|
Interest – fixed rate debt (1)
|
120,056
|
|
13,611
|
|
23,592
|
|
21,749
|
|
61,104
|
|
|||||||||
|
Interest – variable rate debt (1)
|
30,314
|
|
8,873
|
|
15,666
|
|
5,775
|
|
—
|
|
|||||||||
|
Ground leases and other operating leases
|
79,586
|
|
2,408
|
|
4,931
|
|
5,014
|
|
67,233
|
|
|||||||||
|
Total
|
$
|
1,229,150
|
|
$
|
63,507
|
|
$
|
104,205
|
|
$
|
446,785
|
|
$
|
614,653
|
|
||||
|
(1)
|
Obligations shown represent 100% of debt service and do not reflect joint venture interests.
|
Inflation
Historically, inflation has not had a significant impact on the operating performance of our properties. Many of our lease agreements contain provisions designed to mitigate the adverse impact of inflation. These provisions include clauses that enable us to receive payment of increased rent pursuant to escalation clauses which generally increase rental rates during the terms of the leases. These escalation clauses often provide for fixed rent increases or indexed escalations (based upon changes in the consumer price index or other measures). However, some of these contractual rent increases may be less than the actual rate of inflation. Most of our lease agreements require the tenant to pay an allocable share of operating expenses, including common area maintenance costs, real estate taxes, and insurance. This requirement reduces our exposure to increases in these costs and operating expenses resulting from inflation.
Seasonality
Our business has not been and we do not expect it to become subject to material seasonal fluctuations.
68
Our future income, cash flows, and fair values relevant to financial instruments are dependent upon prevailing market interest rates. Market risk refers to the risk of loss from adverse changes in market prices and interest rates. We use certain derivative financial instruments to manage, or hedge, interest rate risks related to our borrowings. We do not use derivatives for trading or speculative purposes and only enter into contracts with major financial institutions based upon their credit rating and other factors. Our derivative instruments consist of
one
embedded derivative, which is recognized as a liability on the consolidated balance sheets in accrued expenses and other liabilities, and is measured at fair value and
five
interest rate swaps. See
Note 2 (Summary of Significant Accounting Policies)
and
Note 7 (Derivatives)
to our consolidated financial statements included in Item 8 to this report for further detail on our embedded derivative and interest rate swaps.
Interest risk amounts are our management’s estimates and were determined by considering the effect of hypothetical interest rates on our consolidated financial instruments. These analyses do not consider the effect of any change in overall economic activity that could occur in that environment. Further, in the event of a change of that magnitude, we may take actions to further mitigate our exposure to the change. However, due to the uncertainty of the specific actions that would be taken and their possible effects, these analyses assume no changes in our financial structure.
Fixed Interest Rate Debt
As of
December 31, 2016
, our consolidated fixed interest rate debt totaled
$315.2 million
, which represented
31.5%
of our total consolidated debt, excluding the impact of interest rate swaps. On July 7, 2016, we entered into a pay-fixed receive-variable rate swap for the full $250.0 million borrowing amount of our term loan borrowings, fixing the LIBOR component of the borrowing rate to 1.07%, for an all-in fixed rate of 2.87%. Both the borrowing and pay-fixed receive-variable swap have a maturity date of
June 10, 2023
.
Assuming the effects of the interest rate swap agreement we entered into on July 7, 2016 relating to our unsecured debt, our fixed interest rate debt would represent
56.6%
of our total consolidated debt. Interest rate fluctuations on our fixed interest rate debt will generally not affect our future earnings or cash flows unless such instruments mature or are otherwise terminated. However, interest rate changes could affect the fair value of our fixed interest rate debt.
As of
December 31, 2016
, the fair value and the carrying value of our consolidated fixed interest rate debt were approximately
$307.0 million
and
$315.2 million
, respectively. The fair value estimate of our fixed interest rate debt was estimated using a discounted cash flow analysis utilizing rates we would expect to pay for debt of a similar type and remaining maturity if the loans were originated on
December 31, 2016
. As we expect to hold our fixed interest rate debt instruments to maturity, based on the underlying structure of the debt instrument, and the amounts due under such instruments are limited to the outstanding principal balance and any accrued and unpaid interest, we do not expect that market fluctuations in interest rates, and the resulting change in fair value of our fixed interest rate debt instruments, would have a significant impact on our operating cash flows.
Variable Interest Rate Debt
As of
December 31, 2016
, our consolidated variable interest rate debt totaled
$684.0 million
, which represented
68.5%
of our total consolidated debt. Assuming the effects of the interest rate swap agreement we entered into on July 7, 2016 relating to our unsecured debt, our variable interest rate debt would represent
43.4%
of our total consolidated debt. Interest rate changes on our variable rate debt could impact our future earnings and cash flows, but would not significantly affect the fair value of such debt. As of
December 31, 2016
, we were exposed to market risks related to fluctuations in interest rates on
$434.0 million
of consolidated borrowings. Assuming no increase in the amount of our variable rate debt, if LIBOR were to change by 100 basis points, interest expense on our variable rate debt as of
December 31, 2016
would change by approximately
$4.3 million
annually.
Derivative Instruments
As of
December 31, 2016
, we had
five
outstanding interest rate swaps that were designated as cash flow hedges of interest rate risk, with a total notional amount of
$250.0 million
. See
Note 7 (Derivatives)
within our consolidated financial statements for further detail on our interest rate swaps. We are exposed to credit risk of the counterparty to our interest rate swap agreements in the event of non-performance under the terms of the agreements. If we were not able to replace these swaps in the event of non-performance by the counterparty, we would be subject to variability of the interest rate on the amount outstanding under our debt that is fixed through the use of the swaps.
69
Indebtedness
As of
December 31, 2016
, we had total consolidated indebtedness of approximately
$999.2 million
. The weighted average interest rate on our consolidated indebtedness was
3.09%
(based on the 30-day LIBOR rate as of
December 31, 2016
, of
0.72%
). As of
December 31, 2016
, we had approximately
$434.0 million
, or approximately
43.4%
, of our outstanding long-term debt exposed to fluctuations in short-term interest rates.
The following table sets forth certain information with respect to our consolidated indebtedness outstanding as of
December 31, 2016
(in thousands).
|
Principal
|
Fixed/Floating
Rate
|
Rate
|
|
Maturity
|
|||||||
|
Senior Unsecured Revolving Credit Facility
|
$
|
401,000
|
|
Floating
|
LIBOR + 1.20%
|
|
9/18/2020
|
||||
|
Senior Unsecured Term Loan (1)
|
250,000
|
|
Fixed
|
2.87
|
%
|
6/10/2023
|
|||||
|
Senior Unsecured Notes
|
|||||||||||
|
January 2016 - Series A
|
15,000
|
|
Fixed
|
4.03
|
%
|
1/7/2023
|
|||||
|
January 2016 - Series B
|
45,000
|
|
Fixed
|
4.43
|
%
|
1/7/2026
|
|||||
|
January 2016 - Series C
|
45,000
|
|
Fixed
|
4.57
|
%
|
1/7/2028
|
|||||
|
January 2016 - Series D
|
45,000
|
|
Fixed
|
4.74
|
%
|
1/7/2031
|
|||||
|
August 2016 - Series A
|
25,000
|
|
Fixed
|
4.09
|
%
|
8/11/2025
|
|||||
|
August 2016 - Series B
|
25,000
|
|
Fixed
|
4.18
|
%
|
8/11/2026
|
|||||
|
August 2016 - Series C
|
25,000
|
|
Fixed
|
4.24
|
%
|
8/11/2027
|
|||||
|
Canton Medical Office Building
|
5,986
|
|
Fixed
|
5.94
|
%
|
6/6/2017
|
|||||
|
Firehouse Square
|
2,628
|
|
Fixed
|
6.58
|
%
|
9/6/2032
|
|||||
|
Hackley Medical Center
|
5,172
|
|
Fixed
|
5.93
|
%
|
1/6/2017
|
|||||
|
MeadowView Professional Center
|
10,031
|
|
Fixed
|
5.81
|
%
|
6/6/2017
|
|||||
|
Mid Coast Hospital Medical Office Building (2)
|
7,385
|
|
Floating
|
LIBOR + 2.25%
|
|
5/16/2018
|
|||||
|
Remington Medical Commons
|
4,124
|
|
Floating
|
LIBOR + 2.75%
|
|
9/28/2017
|
|||||
|
Valley West Hospital Medical Office Building
|
4,653
|
|
Fixed
|
4.83
|
%
|
12/1/2020
|
|||||
|
Oklahoma City, OK Medical Office Building
|
7,292
|
|
Fixed
|
4.71
|
%
|
1/10/2021
|
|||||
|
Crescent City Surgical Center
|
18,750
|
|
Fixed
|
5.00
|
%
|
1/23/2019
|
|||||
|
San Antonio, TX Hospital
|
8,424
|
|
Fixed
|
5.00
|
%
|
6/26/2022
|
|||||
|
Savage Medical Office Building
|
5,605
|
|
Fixed
|
5.50
|
%
|
2/1/2022
|
|||||
|
Plaza HCA MOB
|
11,644
|
|
Fixed
|
6.13
|
%
|
8/1/2017
|
|||||
|
St. Luke's Cornwall MOB
|
9,500
|
|
Floating
|
LIBOR + 3.25%
|
|
2/26/2018
|
|||||
|
Columbia MOB
|
12,000
|
|
Floating
|
LIBOR + 3.25%
|
|
3/21/2018
|
|||||
|
Honor Health - Scottsdale Hospital
|
10,000
|
|
Fixed
|
5.41
|
%
|
7/2/2018
|
|||||
|
Total principal
|
999,194
|
|
|
|
|
||||||
|
Unamortized deferred financing cost
|
(8,477
|
)
|
|||||||||
|
Unamortized fair value adjustment
|
438
|
|
|
|
|
||||||
|
Total
|
$
|
991,155
|
|
|
|
|
|||||
|
(1)
|
Our borrowings under the term loan feature of our Credit Agreement bear interest at a rate which is determined by our credit rating, currently equal to
LIBOR + 1.80%
. We have entered into a pay-fixed receive-variable interest rate swap, fixing the LIBOR component of this rate at
1.07%
, resulting in an effective interest rate of
2.87%
.
|
|
(2)
|
We own a 66.3% interest in the joint venture that owns this property. Debt shown in this schedule is the full amount of the mortgage indebtedness on this property.
|
70
Index to Consolidated Financial Statements
|
|
Page
|
|
|
|
|
|
|
Reports of Independent Registered Public Accounting Firm
|
|
|
|
Report of Independent Registered Public Accounting Firm on Internal Control Over Financial Reporting
|
||
|
|
||
|
Financial Statements of Physicians Realty Trust
|
||
|
|
||
|
|
||
|
|
||
|
|
||
|
|
|
|
|
Financial Statements of Physicians Realty L.P.
|
||
|
Notes for Physicians Realty Trust and Physicians Realty L.P.
|
||
|
|
||
71
Report of Independent Registered Public Accounting Firm
The Board of Trustees and Shareholders of Physicians Realty Trust
We have audited the accompanying consolidated balance sheets of Physicians Realty Trust (the “Company”) as of December 31, 2016 and 2015, and the related consolidated statements of operations, comprehensive income, equity and cash flows for each of the three years in the period ended December 31, 2016. Our audits also included the financial statement schedule listed in the Index at Item 15(a). These financial statements and schedule are the responsibility of the Company’s management. Our responsibility is to express an opinion on these financial statements and schedule based on our audits.
We conducted our audits in accordance with the standards of the Public Company Accounting Oversight Board (United States). Those standards require that we plan and perform the audit to obtain reasonable assurance about whether the financial statements are free of material misstatement. An audit includes examining, on a test basis, evidence supporting the amounts and disclosures in the financial statements. An audit also includes assessing the accounting principles used and significant estimates made by management, as well as evaluating the overall financial statement presentation. We believe that our audits provide a reasonable basis for our opinion.
In our opinion, the financial statements referred to above present fairly, in all material respects, the consolidated financial position of Physicians Realty Trust at December 31, 2016 and 2015, and the consolidated results of its operations and its cash flows for each of the three years in the period ended December 31, 2016, in conformity with U.S. generally accepted accounting principles. Also, in our opinion, the related financial statement schedule, when considered in relation to the basic financial statements taken as a whole, presents fairly in all material respects the information set forth therein.
We also have audited, in accordance with the standards of the Public Company Accounting Oversight Board (United States), Physicians Realty Trust's internal control over financial reporting as of December 31, 2016, based on criteria established in Internal Control-Integrated Framework issued by the Committee of Sponsoring Organizations of the Treadway Commission (2013 framework) and our report dated February 24, 2017 expressed an unqualified opinion thereon.
/s/ Ernst & Young LLP
Chicago, Illinois
February 24, 2017
72
Report of Independent Registered Public Accounting Firm
The Partners of Physicians Realty L.P.
We have audited the accompanying consolidated balance sheets of Physicians Realty L.P. (the “Operating Partnership”) as of December 31, 2016 and 2015, and the related consolidated statements of operations, comprehensive income, capital and cash flows for each of the three years in the period ended December 31, 2016. Our audits also included the financial statement schedule listed in the Index at Item 15(a). These financial statements and schedule are the responsibility of the Operating Partnership’s management. Our responsibility is to express an opinion on these financial statements and schedule based on our audits.
We conducted our audits in accordance with the standards of the Public Company Accounting Oversight Board (United States). We were not engaged to perform an audit of the Operating Partnership’s internal control over financial reporting. Our audits included consideration of internal control over financial reporting as a basis for designing audit procedures that are appropriate in the circumstances, but not for the purpose of expressing an opinion on the effectiveness of the Operating Partnership’s internal control over financial reporting. Accordingly, we express no such opinion. An audit also includes examining, on a test basis, evidence supporting the amounts and disclosures in the financial statements, assessing the accounting principles used and significant estimates made by management, and evaluating the overall financial statement presentation. We believe that our audits provide a reasonable basis for our opinion.
In our opinion, the financial statements referred to above present fairly, in all material respects, the consolidated financial position of Physicians Realty L.P. at December 31, 2016 and 2015, and the consolidated results of its operations and its cash flows for each of the three years in the period ended December 31, 2016, in conformity with U.S. generally accepted accounting principles. Also, in our opinion, the related financial statement schedule, when considered in relation to the basic financial statements taken as a whole, presents fairly in all material respects the information set forth therein.
/s/ Ernst & Young LLP
Chicago, Illinois
February 24, 2017
73
Report of Independent Registered Public Accounting Firm on Internal Control Over Financial Reporting
The Board of Trustees and Shareholders of Physicians Realty Trust
We have audited Physicians Realty Trust’s internal control over financial reporting as of December 31, 2016, based on criteria established in Internal Control-Integrated Framework issued by the Committee of Sponsoring Organizations of the Treadway Commission (2013 framework) (the COSO criteria). Physicians Realty Trust’s management is responsible for maintaining effective internal control over financial reporting, and for its assessment of the effectiveness of internal control over financial reporting included in the accompanying Management's Report on Internal Control Over Financial Reporting. Our responsibility is to express an opinion on the company’s internal control over financial reporting based on our audit.
We conducted our audit in accordance with the standards of the Public Company Accounting Oversight Board (United States). Those standards require that we plan and perform the audit to obtain reasonable assurance about whether effective internal control over financial reporting was maintained in all material respects. Our audit included obtaining an understanding of internal control over financial reporting, assessing the risk that a material weakness exists, testing and evaluating the design and operating effectiveness of internal control based on the assessed risk, and performing such other procedures as we considered necessary in the circumstances. We believe that our audit provides a reasonable basis for our opinion.
A company’s internal control over financial reporting is a process designed to provide reasonable assurance regarding the reliability of financial reporting and the preparation of financial statements for external purposes in accordance with generally accepted accounting principles. A company’s internal control over financial reporting includes those policies and procedures that (1) pertain to the maintenance of records that, in reasonable detail, accurately and fairly reflect the transactions and dispositions of the assets of the company; (2) provide reasonable assurance that transactions are recorded as necessary to permit preparation of financial statements in accordance with generally accepted accounting principles, and that receipts and expenditures of the company are being made only in accordance with authorizations of management and directors of the company; and (3) provide reasonable assurance regarding prevention or timely detection of unauthorized acquisition, use, or disposition of the company’s assets that could have a material effect on the financial statements.
Because of its inherent limitations, internal control over financial reporting may not prevent or detect misstatements. Also, projections of any evaluation of effectiveness to future periods are subject to the risk that controls may become inadequate because of changes in conditions, or that the degree of compliance with the policies or procedures may deteriorate.
In our opinion, Physicians Realty Trust maintained, in all material respects, effective internal control over financial reporting as of December 31, 2016, based on the COSO criteria.
We also have audited, in accordance with the standards of the Public Company Accounting Oversight Board (United States), the consolidated balance sheets of Physicians Realty Trust and the related consolidated statements of operations, comprehensive income, equity and cash flows for each of the three years in the period ended December 31, 2016, and our report dated February 24, 2017 expressed an unqualified opinion thereon.
/s/ Ernst & Young LLP
Chicago, Illinois
February 24, 2017
74
Physicians Realty Trust
(in thousands, except share and per share data)
|
December 31, 2016
|
December 31, 2015
|
||||||
|
ASSETS
|
|
|
|
|
|||
|
Investment properties:
|
|
|
|
|
|||
|
Land and improvements
|
$
|
189,759
|
|
$
|
130,788
|
|
|
|
Building and improvements
|
2,402,643
|
|
1,284,863
|
|
|||
|
Tenant improvements
|
14,133
|
|
9,243
|
|
|||
|
Acquired lease intangibles
|
301,462
|
|
205,168
|
|
|||
|
|
2,907,997
|
|
|
1,630,062
|
|
||
|
Accumulated depreciation
|
(181,785
|
)
|
(91,250
|
)
|
|||
|
Net real estate property
|
2,726,212
|
|
|
1,538,812
|
|
||
|
Real estate loans receivable
|
39,154
|
|
39,349
|
|
|||
|
Investment in unconsolidated entity
|
2,258
|
|
1,322
|
|
|||
|
Net real estate investments
|
2,767,624
|
|
|
1,579,483
|
|
||
|
Cash and cash equivalents
|
15,491
|
|
3,143
|
|
|||
|
Tenant receivables, net
|
9,790
|
|
2,977
|
|
|||
|
Other assets
|
95,187
|
|
53,283
|
|
|||
|
Total assets
|
$
|
2,888,092
|
|
|
$
|
1,638,886
|
|
|
LIABILITIES AND EQUITY
|
|
|
|
|
|||
|
Liabilities:
|
|
|
|
|
|||
|
Credit facility
|
$
|
643,742
|
|
$
|
389,375
|
|
|
|
Notes payable
|
224,330
|
|
—
|
|
|||
|
Mortgage debt
|
123,083
|
|
94,240
|
|
|||
|
Accounts payable
|
4,423
|
|
644
|
|
|||
|
Dividends and distributions payable
|
32,179
|
|
20,783
|
|
|||
|
Accrued expenses and other liabilities
|
42,287
|
|
24,473
|
|
|||
|
Acquired lease intangibles, net
|
9,253
|
|
5,950
|
|
|||
|
Total liabilities
|
1,079,297
|
|
|
535,465
|
|
||
|
Redeemable noncontrolling interest – Series A Preferred Units and partially owned properties
|
26,477
|
|
26,960
|
|
|||
|
Equity:
|
|
|
|
|
|||
|
Common shares, $0.01 par value, 500,000,000 common shares authorized, 135,966,013 and 86,864,063 common shares issued and outstanding as of December 31, 2016 and December 31, 2015, respectively
|
1,362
|
|
872
|
|
|||
|
Additional paid-in capital
|
1,920,642
|
|
1,129,284
|
|
|||
|
Accumulated deficit
|
(197,261
|
)
|
(109,024
|
)
|
|||
|
Accumulated other comprehensive income
|
13,708
|
|
—
|
|
|||
|
Total shareholders’ equity
|
1,738,451
|
|
|
1,021,132
|
|
||
|
Noncontrolling interests:
|
|
|
|
|
|||
|
Operating Partnership
|
43,142
|
|
45,451
|
|
|||
|
Partially owned properties
|
725
|
|
9,878
|
|
|||
|
Total noncontrolling interests
|
43,867
|
|
|
55,329
|
|
||
|
Total equity
|
1,782,318
|
|
|
1,076,461
|
|
||
|
Total liabilities and equity
|
$
|
2,888,092
|
|
|
$
|
1,638,886
|
|
The accompanying notes are an integral part of these consolidated financial statements.
75
Physicians Realty Trust
(in thousands, except share and per share data)
|
|
December 31,
|
||||||||||
|
|
2016
|
2015
|
2014
|
||||||||
|
Revenues:
|
|
|
|
|
|
|
|||||
|
Rental revenues
|
$
|
186,301
|
|
$
|
103,974
|
|
$
|
46,397
|
|
||
|
Expense recoveries
|
45,875
|
|
21,587
|
|
5,871
|
|
|||||
|
Interest income on real estate loans and other
|
8,858
|
|
3,880
|
|
1,066
|
|
|||||
|
Total revenues
|
241,034
|
|
|
129,441
|
|
|
53,334
|
|
|||
|
Expenses:
|
|
|
|
|
|
|
|||||
|
Interest expense
|
23,864
|
|
10,636
|
|
6,907
|
|
|||||
|
General and administrative
|
18,397
|
|
14,908
|
|
11,440
|
|
|||||
|
Operating expenses
|
65,999
|
|
31,026
|
|
10,154
|
|
|||||
|
Depreciation and amortization
|
86,589
|
|
45,471
|
|
16,731
|
|
|||||
|
Acquisition expenses
|
14,778
|
|
14,893
|
|
10,897
|
|
|||||
|
Impairment loss
|
—
|
|
—
|
|
1,750
|
|
|||||
|
Total expenses
|
209,627
|
|
|
116,934
|
|
|
57,879
|
|
|||
|
Income (loss) before equity in income of unconsolidated entities and gain on sale of investment properties:
|
31,407
|
|
12,507
|
|
(4,545
|
)
|
|||||
|
Equity in income of unconsolidated entities
|
115
|
|
104
|
|
95
|
|
|||||
|
Gain on sale of investment properties
|
—
|
|
130
|
|
32
|
|
|||||
|
Net income (loss)
|
31,522
|
|
|
12,741
|
|
(4,418
|
)
|
||||
|
Net (income) loss attributable to noncontrolling interests:
|
|||||||||||
|
Operating Partnership
|
(825
|
)
|
(576
|
)
|
695
|
|
|||||
|
Partially owned properties (1)
|
(716
|
)
|
(377
|
)
|
(314
|
)
|
|||||
|
Net income (loss) attributable to controlling interest
|
29,981
|
|
|
11,788
|
|
(4,037
|
)
|
||||
|
Preferred distributions
|
(1,857
|
)
|
(1,189
|
)
|
—
|
|
|||||
|
Net income (loss) attributable to common shareholders
|
$
|
28,124
|
|
$
|
10,599
|
|
$
|
(4,037
|
)
|
||
|
Net income (loss) per share:
|
|
|
|
|
|
|
|||||
|
Basic
|
$
|
0.22
|
|
$
|
0.15
|
|
$
|
(0.12
|
)
|
||
|
Diluted
|
$
|
0.22
|
|
$
|
0.15
|
|
$
|
(0.12
|
)
|
||
|
Weighted average common shares:
|
|
|
|
|
|
|
|||||
|
Basic
|
126,143,114
|
|
72,750,724
|
|
33,063,093
|
|
|||||
|
Diluted
|
130,466,893
|
|
76,792,073
|
|
33,063,093
|
|
|||||
|
Dividends and distributions declared per common share and OP unit
|
$
|
0.90
|
|
$
|
0.90
|
|
$
|
0.90
|
|
||
|
(1)
|
Includes
$0.1 million
of net income attributable to redeemable noncontrolling interests for the year ended December 31,
2016
. No such adjustments are required for the years ended December 31,
2015
and
2014
.
|
The accompanying notes are an integral part of these consolidated financial statements.
76
Physicians Realty Trust
Consolidated Statements of Comprehensive Income
(in thousands)
|
December 31,
|
|||||||||||
|
|
2016
|
2015
|
2014
|
||||||||
|
Net income (loss)
|
$
|
31,522
|
|
$
|
12,741
|
|
$
|
(4,418
|
)
|
||
|
Other comprehensive income:
|
|||||||||||
|
Change in fair value of interest rate swap agreements
|
13,708
|
|
—
|
|
—
|
|
|||||
|
Total other comprehensive income
|
13,708
|
|
—
|
|
—
|
|
|||||
|
Comprehensive income (loss)
|
45,230
|
|
12,741
|
|
(4,418
|
)
|
|||||
|
Comprehensive (income) loss attributable to noncontrolling interests - Operating Partnership
|
(1,162
|
)
|
(576
|
)
|
695
|
|
|||||
|
Comprehensive (income) loss attributable to noncontrolling interests - Partially owned properties
|
(716
|
)
|
(377
|
)
|
(314
|
)
|
|||||
|
Comprehensive income (loss) attributable to common shareholders
|
$
|
43,352
|
|
|
$
|
11,788
|
|
|
$
|
(4,037
|
)
|
The accompanying notes are an integral part of these consolidated financial statements.
77
Physicians Realty Trust
Consolidated Statements of Equity
(in thousands)
|
|
Par
Value
|
Additional
Paid in
Capital
|
Accumulated
Deficit
|
Accumulated Other Comprehensive Income (Loss)
|
Total
Shareholders’
Equity
|
Operating
Partnership
Noncontrolling
interest
|
Partially
Owned
Properties
Noncontrolling
Interest
|
Total
Noncontrolling
Interests
|
Total
Equity
|
||||||||||||||||||||||||||
|
Balance at December 31, 2013
|
$
|
215
|
|
$
|
213,359
|
|
$
|
(8,670
|
)
|
$
|
—
|
|
$
|
204,904
|
|
$
|
35,310
|
|
$
|
623
|
|
$
|
35,933
|
|
$
|
240,837
|
|
||||||||
|
Net proceeds from sale of common shares
|
272
|
|
350,113
|
|
—
|
|
—
|
|
350,385
|
|
—
|
|
—
|
|
—
|
|
350,385
|
|
|||||||||||||||||
|
Restricted share award grants
|
2
|
|
2,100
|
|
(42
|
)
|
—
|
|
2,060
|
|
—
|
|
—
|
|
—
|
|
2,060
|
|
|||||||||||||||||
|
Issuance of common shares in connection with the Ziegler shared service amendment payment
|
1
|
|
1,799
|
|
—
|
|
—
|
|
1,800
|
|
—
|
|
—
|
|
—
|
|
1,800
|
|
|||||||||||||||||
|
Purchase of OP Units
|
—
|
|
—
|
|
—
|
|
—
|
|
—
|
|
(7,546
|
)
|
—
|
|
(7,546
|
)
|
(7,546
|
)
|
|||||||||||||||||
|
Conversion of OP Units
|
20
|
|
13,266
|
|
—
|
|
—
|
|
13,286
|
|
(13,286
|
)
|
—
|
|
(13,286
|
)
|
—
|
|
|||||||||||||||||
|
Dividends/distributions declared
|
—
|
|
—
|
|
(39,048
|
)
|
—
|
|
(39,048
|
)
|
(3,265
|
)
|
—
|
|
(3,265
|
)
|
(42,313
|
)
|
|||||||||||||||||
|
Adjustment for Noncontrolling Interests ownership in Operating Partnership
|
—
|
|
5,380
|
|
—
|
|
—
|
|
5,380
|
|
(5,380
|
)
|
—
|
|
(5,380
|
)
|
—
|
|
|||||||||||||||||
|
Issuance of OP Units in connection with acquisition
|
—
|
|
—
|
|
—
|
|
—
|
|
—
|
|
28,589
|
|
—
|
|
28,589
|
|
28,589
|
|
|||||||||||||||||
|
Distributions
|
—
|
|
—
|
|
—
|
|
—
|
|
—
|
|
—
|
|
(185
|
)
|
(185
|
)
|
(185
|
)
|
|||||||||||||||||
|
Net (loss) income
|
—
|
|
—
|
|
(4,037
|
)
|
—
|
|
(4,037
|
)
|
(695
|
)
|
314
|
|
(381
|
)
|
(4,418
|
)
|
|||||||||||||||||
|
Balance at December 31, 2014
|
510
|
|
586,017
|
|
(51,797
|
)
|
—
|
|
534,730
|
|
33,727
|
|
752
|
|
34,479
|
|
569,209
|
|
|||||||||||||||||
|
Net proceeds from sale of common shares
|
361
|
|
544,756
|
|
—
|
|
—
|
|
545,117
|
|
—
|
|
—
|
|
—
|
|
545,117
|
|
|||||||||||||||||
|
Restricted share award grants, net
|
1
|
|
3,191
|
|
(284
|
)
|
—
|
|
2,908
|
|
—
|
|
—
|
|
—
|
|
2,908
|
|
|||||||||||||||||
|
Purchase of OP Units
|
—
|
|
—
|
|
—
|
|
—
|
|
—
|
|
(1,088
|
)
|
—
|
|
(1,088
|
)
|
(1,088
|
)
|
|||||||||||||||||
|
Conversion of OP Units
|
—
|
|
171
|
|
—
|
|
—
|
|
171
|
|
(171
|
)
|
—
|
|
(171
|
)
|
—
|
|
|||||||||||||||||
|
Dividends/distributions declared
|
—
|
|
—
|
|
(67,542
|
)
|
—
|
|
(67,542
|
)
|
(3,344
|
)
|
—
|
|
(3,344
|
)
|
(70,886
|
)
|
|||||||||||||||||
|
Preferred distributions
|
—
|
|
—
|
|
(1,189
|
)
|
—
|
|
(1,189
|
)
|
—
|
|
—
|
|
—
|
|
(1,189
|
)
|
|||||||||||||||||
|
Issuance of OP Units in connection with acquisitions
|
—
|
|
—
|
|
—
|
|
—
|
|
—
|
|
10,973
|
|
—
|
|
10,973
|
|
10,973
|
|
|||||||||||||||||
|
Contributions
|
—
|
|
—
|
|
—
|
|
—
|
|
—
|
|
—
|
|
8,962
|
|
8,962
|
|
8,962
|
|
|||||||||||||||||
|
Distributions
|
—
|
|
—
|
|
—
|
|
—
|
|
—
|
|
—
|
|
(213
|
)
|
(213
|
)
|
(213
|
)
|
|||||||||||||||||
|
Change in market value of Redeemable Noncontrolling Interest in Operating Partnership
|
—
|
|
(73
|
)
|
—
|
|
—
|
|
(73
|
)
|
—
|
|
—
|
|
—
|
|
(73
|
)
|
|||||||||||||||||
|
Net income
|
—
|
|
—
|
|
11,788
|
|
—
|
|
11,788
|
|
576
|
|
377
|
|
953
|
|
12,741
|
|
|||||||||||||||||
|
Adjustment for Noncontrolling Interests ownership in Operating Partnership
|
—
|
|
(4,778
|
)
|
—
|
|
—
|
|
(4,778
|
)
|
4,778
|
|
—
|
|
4,778
|
|
—
|
|
|||||||||||||||||
|
Balance at December 31, 2015
|
872
|
|
|
1,129,284
|
|
|
(109,024
|
)
|
|
—
|
|
1,021,132
|
|
45,451
|
|
|
9,878
|
|
55,329
|
|
1,076,461
|
|
|||||||||||||
|
Net proceeds from sale of common shares
|
473
|
|
766,368
|
|
—
|
|
—
|
|
766,841
|
|
—
|
|
—
|
|
—
|
|
766,841
|
|
|||||||||||||||||
|
Restricted share award grants, net
|
1
|
|
4,893
|
|
(460
|
)
|
—
|
|
4,434
|
|
—
|
|
—
|
|
—
|
|
4,434
|
|
|||||||||||||||||
|
Purchase of OP Units
|
—
|
|
—
|
|
—
|
|
—
|
|
—
|
|
(3,671
|
)
|
—
|
|
(3,671
|
)
|
(3,671
|
)
|
|||||||||||||||||
|
Conversion of OP Units
|
6
|
|
11,613
|
|
—
|
|
—
|
|
11,619
|
|
(11,619
|
)
|
—
|
|
(11,619
|
)
|
—
|
|
|||||||||||||||||
|
Dividends/distributions declared
|
—
|
|
—
|
|
(115,901
|
)
|
—
|
|
(115,901
|
)
|
(3,106
|
)
|
—
|
|
(3,106
|
)
|
(119,007
|
)
|
|||||||||||||||||
|
Preferred distributions
|
—
|
|
—
|
|
(1,857
|
)
|
—
|
|
(1,857
|
)
|
—
|
|
—
|
|
—
|
|
(1,857
|
)
|
|||||||||||||||||
|
Issuance of common shares and OP Units in connection with acquisitions
|
10
|
|
17,069
|
|
—
|
|
—
|
|
17,079
|
|
6,869
|
|
(100
|
)
|
6,769
|
|
23,848
|
|
|||||||||||||||||
|
Contributions
|
—
|
|
—
|
|
—
|
|
—
|
|
—
|
|
—
|
|
50
|
|
50
|
|
50
|
|
|||||||||||||||||
|
Distributions
|
—
|
|
—
|
|
—
|
|
—
|
|
—
|
|
—
|
|
(543
|
)
|
(543
|
)
|
(543
|
)
|
|||||||||||||||||
|
Change in market value of Redeemable Noncontrolling Interests in Operating Partnership
|
—
|
|
(245
|
)
|
—
|
|
—
|
|
(245
|
)
|
—
|
|
—
|
|
—
|
|
(245
|
)
|
|||||||||||||||||
|
Reclassification of Noncontrolling Interest - partially owned properties
|
—
|
|
—
|
|
—
|
|
—
|
|
—
|
|
—
|
|
(8,514
|
)
|
(8,514
|
)
|
(8,514
|
)
|
|||||||||||||||||
|
Buyout of Noncontrolling Interests - partially owned properties
|
—
|
|
53
|
|
—
|
|
—
|
|
53
|
|
—
|
|
(664
|
)
|
(664
|
)
|
(611
|
)
|
|||||||||||||||||
|
Change in fair value of interest rate swap agreements
|
—
|
|
—
|
|
—
|
|
13,708
|
|
13,708
|
|
—
|
|
—
|
|
—
|
|
13,708
|
|
|||||||||||||||||
|
Net income
|
—
|
|
—
|
|
29,981
|
|
—
|
|
29,981
|
|
825
|
|
618
|
|
1,443
|
|
31,424
|
|
|||||||||||||||||
|
Adjustment for Noncontrolling Interests ownership in Operating Partnership
|
—
|
|
(8,393
|
)
|
—
|
|
—
|
|
(8,393
|
)
|
8,393
|
|
—
|
|
8,393
|
|
—
|
|
|||||||||||||||||
|
Balance at December 31, 2016
|
$
|
1,362
|
|
|
$
|
1,920,642
|
|
|
$
|
(197,261
|
)
|
|
$
|
13,708
|
|
|
$
|
1,738,451
|
|
|
$
|
43,142
|
|
|
$
|
725
|
|
|
$
|
43,867
|
|
|
$
|
1,782,318
|
|
The accompanying notes are an integral part of these consolidated financial statements.
78
Physicians Realty Trust
(in thousands)
|
|
Year Ended December 31,
|
||||||||||
|
|
2016
|
2015
|
2014
|
||||||||
|
Cash Flows from Operating Activities:
|
|
|
|
|
|
|
|||||
|
Net income (loss)
|
$
|
31,522
|
|
$
|
12,741
|
|
$
|
(4,418
|
)
|
||
|
Adjustments to reconcile net income (loss) to net cash provided by operating activities
|
|
|
|
|
|
|
|||||
|
Depreciation and amortization
|
86,589
|
|
45,471
|
|
16,731
|
|
|||||
|
Amortization of deferred financing costs
|
2,325
|
|
1,373
|
|
1,097
|
|
|||||
|
Amortization of lease inducements and above/below market lease intangibles
|
3,906
|
|
2,577
|
|
571
|
|
|||||
|
Straight-line rental revenue/expense
|
(16,226
|
)
|
(9,000
|
)
|
(4,366
|
)
|
|||||
|
Amortization of above market assumed debt
|
(236
|
)
|
(173
|
)
|
—
|
|
|||||
|
Gain on sale of investment properties
|
—
|
|
(130
|
)
|
(32
|
)
|
|||||
|
Equity in income of unconsolidated entities
|
(115
|
)
|
(104
|
)
|
(95
|
)
|
|||||
|
Distribution from unconsolidated entities
|
82
|
|
106
|
|
71
|
|
|||||
|
Change in fair value of derivatives
|
(240
|
)
|
(166
|
)
|
(161
|
)
|
|||||
|
Provision for bad debts
|
2,310
|
|
69
|
|
9
|
|
|||||
|
Non-cash share compensation
|
4,894
|
|
3,798
|
|
2,422
|
|
|||||
|
Ziegler shared service amendment payment
|
—
|
|
—
|
|
1,800
|
|
|||||
|
Write-off of contingent consideration
|
(840
|
)
|
—
|
|
—
|
|
|||||
|
Impairment on investment properties
|
—
|
|
—
|
|
1,750
|
|
|||||
|
Change in operating assets and liabilities:
|
|
|
|
|
|
|
|||||
|
Tenant receivables
|
(10,058
|
)
|
(2,836
|
)
|
(986
|
)
|
|||||
|
Other assets
|
(20,387
|
)
|
(630
|
)
|
(3,518
|
)
|
|||||
|
Accounts payable
|
3,779
|
|
(56
|
)
|
(136
|
)
|
|||||
|
Accrued expenses and other liabilities
|
37,474
|
|
8,312
|
|
2,556
|
|
|||||
|
Net cash provided by operating activities
|
124,779
|
|
|
61,352
|
|
|
13,295
|
|
|||
|
Cash Flows from Investing Activities:
|
|
|
|
|
|
|
|||||
|
Proceeds on sales of investment properties
|
—
|
|
3,039
|
|
235
|
|
|||||
|
Acquisition of investment properties, net
|
(1,245,128
|
)
|
(752,807
|
)
|
(501,127
|
)
|
|||||
|
Capital expenditures on existing investment properties
|
(11,304
|
)
|
(4,988
|
)
|
(900
|
)
|
|||||
|
Pay down of contingent consideration
|
—
|
|
(999
|
)
|
—
|
|
|||||
|
Real estate loans receivable
|
(10,207
|
)
|
(22,359
|
)
|
(15,386
|
)
|
|||||
|
Note receivable
|
—
|
|
(20,545
|
)
|
—
|
|
|||||
|
Repayment of real estate loan receivable
|
11,336
|
|
—
|
|
—
|
|
|||||
|
Repayment of note receivable
|
4,118
|
|
—
|
|
—
|
|
|||||
|
Leasing commissions
|
(1,034
|
)
|
(579
|
)
|
(100
|
)
|
|||||
|
Lease inducements
|
(8,957
|
)
|
(2,478
|
)
|
(1,532
|
)
|
|||||
|
Net cash used in investing activities
|
(1,261,176
|
)
|
|
(801,716
|
)
|
|
(518,810
|
)
|
|||
|
Cash Flows from Financing Activities:
|
|
|
|
|
|
|
|||||
|
Net proceeds from sale of common shares
|
766,841
|
|
545,117
|
|
350,384
|
|
|||||
|
Proceeds from credit facility borrowings
|
1,181,000
|
|
620,000
|
|
395,200
|
|
|||||
|
Payment on credit facility borrowings
|
(925,000
|
)
|
(363,000
|
)
|
(257,200
|
)
|
|||||
|
Proceeds from issuance of mortgage debt
|
39,500
|
|
—
|
|
26,550
|
|
|||||
|
Proceeds from issuance of senior unsecured notes
|
225,000
|
|
—
|
|
—
|
|
|||||
|
Principal payments on mortgage debt
|
(10,232
|
)
|
(2,022
|
)
|
(6,549
|
)
|
|||||
|
Debt issuance costs
|
(4,816
|
)
|
(3,105
|
)
|
(3,887
|
)
|
|||||
|
Dividends paid - shareholders
|
(104,908
|
)
|
(63,720
|
)
|
(28,104
|
)
|
|||||
|
Distributions to noncontrolling interest - Operating Partnership
|
(3,162
|
)
|
(3,216
|
)
|
(3,382
|
)
|
|||||
|
Preferred distributions paid - OP Unit holder
|
(1,508
|
)
|
(563
|
)
|
—
|
|
|||||
|
Distributions to noncontrolling interest - partially owned properties
|
(543
|
)
|
(213
|
)
|
(185
|
)
|
|||||
|
Purchase of Series A Preferred Units
|
(9,756
|
)
|
—
|
|
—
|
|
|||||
|
Purchase of OP Units
|
(3,671
|
)
|
(1,088
|
)
|
(7,546
|
)
|
|||||
|
Common shares repurchased and retired
|
—
|
|
(606
|
)
|
(321
|
)
|
|||||
|
Net cash provided by financing activities
|
1,148,745
|
|
|
727,584
|
|
|
464,960
|
|
|||
|
Net increase (decrease) in cash and cash equivalents
|
12,348
|
|
(12,780
|
)
|
(40,555
|
)
|
|||||
|
Cash and cash equivalents, beginning of year
|
3,143
|
|
15,923
|
|
56,478
|
|
|||||
|
Cash and cash equivalents, end of year
|
$
|
15,491
|
|
|
$
|
3,143
|
|
|
$
|
15,923
|
|
|
Supplemental disclosure of cash flow information - interest paid during the year
|
$
|
17,151
|
|
$
|
9,550
|
|
$
|
5,606
|
|
||
|
Supplemental disclosure of noncash activity - change in fair value of interest rate swap agreements
|
$
|
13,708
|
|
$
|
—
|
|
$
|
—
|
|
||
|
Supplemental disclosure of noncash activity - assumed debt
|
$
|
—
|
|
$
|
18,690
|
|
$
|
15,283
|
|
||
|
Supplemental disclosure of noncash activity - issuance of OP Units and Series A Preferred Units in connection with acquisitions
|
$
|
6,769
|
|
$
|
40,376
|
|
$
|
28,589
|
|
||
|
Supplemental disclosure of noncash activity - contingent consideration
|
$
|
156
|
|
$
|
2,718
|
|
$
|
840
|
|
||
The accompanying notes are an integral part of these consolidated financial statements.
79
Physicians Realty L.P.
Consolidated Balance Sheets
(in thousands, except share and per share data)
|
December 31, 2016
|
December 31, 2015
|
||||||
|
ASSETS
|
|
|
|
|
|||
|
Investment properties:
|
|||||||
|
Land and improvements
|
$
|
189,759
|
|
$
|
130,788
|
|
|
|
Building and improvements
|
2,402,643
|
|
1,284,863
|
|
|||
|
Tenant improvements
|
14,133
|
|
9,243
|
|
|||
|
Acquired lease intangibles
|
301,462
|
|
205,168
|
|
|||
|
|
2,907,997
|
|
1,630,062
|
|
|||
|
Accumulated depreciation
|
(181,785
|
)
|
(91,250
|
)
|
|||
|
Net real estate property
|
2,726,212
|
|
1,538,812
|
|
|||
|
Real estate loans receivable
|
39,154
|
|
39,349
|
|
|||
|
Investment in unconsolidated entity
|
2,258
|
|
1,322
|
|
|||
|
Net real estate investments
|
2,767,624
|
|
1,579,483
|
|
|||
|
Cash and cash equivalents
|
15,491
|
|
3,143
|
|
|||
|
Tenant receivables, net
|
9,790
|
|
2,977
|
|
|||
|
Other assets
|
95,187
|
|
53,283
|
|
|||
|
Total assets
|
$
|
2,888,092
|
|
$
|
1,638,886
|
|
|
|
LIABILITIES AND CAPITAL
|
|||||||
|
Liabilities:
|
|||||||
|
Credit facility
|
$
|
643,742
|
|
$
|
389,375
|
|
|
|
Notes payable
|
224,330
|
|
—
|
|
|||
|
Mortgage debt
|
123,083
|
|
94,240
|
|
|||
|
Accounts payable
|
4,423
|
|
644
|
|
|||
|
Dividends and distributions payable
|
32,179
|
|
20,783
|
|
|||
|
Accrued expenses and other liabilities
|
42,287
|
|
24,473
|
|
|||
|
Acquired lease intangibles, net
|
9,253
|
|
5,950
|
|
|||
|
Total liabilities
|
1,079,297
|
|
535,465
|
|
|||
|
Redeemable noncontrolling interest - Series A Preferred Units and partially owned properties
|
26,477
|
|
26,960
|
|
|||
|
Capital:
|
|||||||
|
Partners’ capital:
|
|||||||
|
General partners’ capital, 135,966,013 and 86,864,063 units issued and outstanding as of December 31, 2016 and 2015, respectively
|
1,724,743
|
|
1,021,132
|
|
|||
|
Limited partners’ capital, 3,436,207 and 3,879,115 units issued and outstanding as of December 31, 2016 and 2015, respectively
|
43,142
|
|
45,451
|
|
|||
|
Accumulated other comprehensive income
|
13,708
|
|
—
|
|
|||
|
Total partners’ capital
|
1,781,593
|
|
1,066,583
|
|
|||
|
Noncontrolling interest - partially owned properties
|
725
|
|
9,878
|
|
|||
|
Total capital
|
1,782,318
|
|
1,076,461
|
|
|||
|
Total liabilities and capital
|
$
|
2,888,092
|
|
$
|
1,638,886
|
|
|
The accompanying notes are an integral part of these consolidated financial statements.
80
Physicians Realty L.P.
Consolidated Statements of Operations
(in thousands, except unit and per unit data)
|
|
December 31,
|
||||||||||
|
|
2016
|
2015
|
2014
|
||||||||
|
Revenues:
|
|
|
|
|
|
|
|||||
|
Rental revenues
|
$
|
186,301
|
|
$
|
103,974
|
|
$
|
46,397
|
|
||
|
Expense recoveries
|
45,875
|
|
21,587
|
|
5,871
|
|
|||||
|
Interest income on real estate loans and other
|
8,858
|
|
3,880
|
|
1,066
|
|
|||||
|
Total revenues
|
241,034
|
|
129,441
|
|
53,334
|
|
|||||
|
Expenses:
|
|||||||||||
|
Interest expense
|
23,864
|
|
10,636
|
|
6,907
|
|
|||||
|
General and administrative
|
18,397
|
|
14,908
|
|
11,440
|
|
|||||
|
Operating expenses
|
65,999
|
|
31,026
|
|
10,154
|
|
|||||
|
Depreciation and amortization
|
86,589
|
|
45,471
|
|
16,731
|
|
|||||
|
Acquisition expenses
|
14,778
|
|
14,893
|
|
10,897
|
|
|||||
|
Impairment loss
|
—
|
|
—
|
|
1,750
|
|
|||||
|
Total expenses
|
209,627
|
|
116,934
|
|
57,879
|
|
|||||
|
Income (loss) before equity in income of unconsolidated entities, gain on sale of investment property, and noncontrolling interests:
|
31,407
|
|
12,507
|
|
(4,545
|
)
|
|||||
|
Equity in income of unconsolidated entities
|
115
|
|
104
|
|
95
|
|
|||||
|
Gain on sale of investment properties
|
—
|
|
130
|
|
32
|
|
|||||
|
Net income (loss)
|
31,522
|
|
12,741
|
|
(4,418
|
)
|
|||||
|
Net income attributable to noncontrolling interests - partially owned properties (1)
|
(716
|
)
|
(377
|
)
|
(314
|
)
|
|||||
|
Net income (loss) attributable to controlling interest
|
30,806
|
|
12,364
|
|
(4,732
|
)
|
|||||
|
Preferred distributions
|
(1,857
|
)
|
(1,189
|
)
|
—
|
|
|||||
|
Net income (loss) attributable to common unitholders
|
$
|
28,949
|
|
$
|
11,175
|
|
$
|
(4,732
|
)
|
||
|
Net income (loss) per common unit:
|
|||||||||||
|
Basic
|
$
|
0.22
|
|
$
|
0.15
|
|
$
|
(0.12
|
)
|
||
|
Diluted
|
$
|
0.22
|
|
$
|
0.15
|
|
$
|
(0.12
|
)
|
||
|
Weighted average common units:
|
|||||||||||
|
Basic
|
129,835,209
|
|
76,459,218
|
|
36,881,712
|
|
|||||
|
Diluted
|
130,466,893
|
|
76,792,073
|
|
36,881,712
|
|
|||||
|
Distributions declared per common unit
|
$
|
0.90
|
|
$
|
0.90
|
|
$
|
0.90
|
|
||
|
(1)
|
Includes
$0.1 million
of net income attributable to redeemable noncontrolling interests for the year ended December 31,
2016
. No such adjustments are required for the years ended December 31,
2015
and
2014
.
|
The accompanying notes are an integral part of these consolidated financial statements.
81
Physicians Realty L.P.
Consolidated Statements of Comprehensive Income
(in thousands)
|
December 31,
|
|||||||||||
|
|
2016
|
2015
|
2014
|
||||||||
|
Net income (loss)
|
$
|
31,522
|
|
$
|
12,741
|
|
$
|
(4,418
|
)
|
||
|
Other comprehensive income:
|
|||||||||||
|
Change in fair value of interest rate swap agreements
|
13,708
|
|
—
|
|
—
|
|
|||||
|
Total other comprehensive income
|
13,708
|
|
—
|
|
—
|
|
|||||
|
Comprehensive income (loss)
|
45,230
|
|
12,741
|
|
(4,418
|
)
|
|||||
|
Comprehensive (income) loss attributable to noncontrolling interests - Partially owned properties
|
(716
|
)
|
(377
|
)
|
(314
|
)
|
|||||
|
Comprehensive income (loss) attributable to common unitholders
|
$
|
44,514
|
|
$
|
12,364
|
|
$
|
(4,732
|
)
|
||
The accompanying notes are an integral part of these consolidated financial statements.
82
Physicians Realty L.P.
Consolidated Statements of Changes in Capital
(in thousands)
|
|
General Partner
|
Limited Partner
|
Accumulated Other Comprehensive Income (Loss)
|
Total
Partners’ Capital
|
Partially
Owned
Properties
Noncontrolling
Interest
|
Total
Partners’ Capital
|
|||||||||||||||||
|
Balance at December 31, 2013
|
$
|
204,904
|
|
$
|
35,310
|
|
$
|
—
|
|
$
|
240,214
|
|
$
|
623
|
|
$
|
240,837
|
|
|||||
|
Net proceeds from sale of Trust common shares and issuance of common units
|
350,385
|
|
—
|
|
—
|
|
350,385
|
|
—
|
|
350,385
|
|
|||||||||||
|
Trust Restricted share award grants
|
2,060
|
|
—
|
|
—
|
|
2,060
|
|
—
|
|
2,060
|
|
|||||||||||
|
Issuance of common shares in connection with the Ziegler shared service amendment payment
|
1,800
|
|
—
|
|
—
|
|
1,800
|
|
—
|
|
1,800
|
|
|||||||||||
|
Purchase of OP Units
|
—
|
|
(7,546
|
)
|
—
|
|
(7,546
|
)
|
—
|
|
(7,546
|
)
|
|||||||||||
|
Conversion of OP Units
|
13,286
|
|
(13,286
|
)
|
—
|
|
—
|
|
—
|
|
—
|
|
|||||||||||
|
OP Units - distributions
|
(39,048
|
)
|
(3,265
|
)
|
—
|
|
(42,313
|
)
|
—
|
|
(42,313
|
)
|
|||||||||||
|
Adjustments for Limited Partners ownership in Operating Partnership
|
5,380
|
|
(5,380
|
)
|
—
|
|
—
|
|
—
|
|
—
|
|
|||||||||||
|
Issuance of OP Units in connection with acquisition
|
—
|
|
28,589
|
|
—
|
|
28,589
|
|
—
|
|
28,589
|
|
|||||||||||
|
Distributions
|
—
|
|
—
|
|
—
|
|
—
|
|
(185
|
)
|
(185
|
)
|
|||||||||||
|
Net (loss) income
|
(4,037
|
)
|
(695
|
)
|
—
|
|
(4,732
|
)
|
314
|
|
(4,418
|
)
|
|||||||||||
|
Balance at December 31, 2014
|
534,730
|
|
33,727
|
|
—
|
|
568,457
|
|
752
|
|
569,209
|
|
|||||||||||
|
Net proceeds from sale of Trust common shares and issuance of common units
|
545,117
|
|
—
|
|
—
|
|
545,117
|
|
—
|
|
545,117
|
|
|||||||||||
|
Trust Restricted share award grants, net
|
2,908
|
|
—
|
|
—
|
|
2,908
|
|
—
|
|
2,908
|
|
|||||||||||
|
Purchase of OP Units
|
—
|
|
(1,088
|
)
|
—
|
|
(1,088
|
)
|
—
|
|
(1,088
|
)
|
|||||||||||
|
Conversion of OP Units
|
171
|
|
(171
|
)
|
—
|
|
—
|
|
—
|
|
—
|
|
|||||||||||
|
OP Units - distributions
|
(67,542
|
)
|
(3,344
|
)
|
—
|
|
(70,886
|
)
|
—
|
|
(70,886
|
)
|
|||||||||||
|
Preferred distributions
|
(1,189
|
)
|
—
|
|
—
|
|
(1,189
|
)
|
—
|
|
(1,189
|
)
|
|||||||||||
|
Issuance of OP Units in connection with acquisition
|
—
|
|
10,973
|
|
—
|
|
10,973
|
|
—
|
|
10,973
|
|
|||||||||||
|
Contributions
|
—
|
|
—
|
|
—
|
|
—
|
|
8,962
|
|
8,962
|
|
|||||||||||
|
Distributions
|
—
|
|
—
|
|
—
|
|
—
|
|
(213
|
)
|
(213
|
)
|
|||||||||||
|
Change in market value of Redeemable Limited Partners
|
(73
|
)
|
—
|
|
—
|
|
(73
|
)
|
—
|
|
(73
|
)
|
|||||||||||
|
Net (loss) income
|
11,788
|
|
576
|
|
—
|
|
12,364
|
|
377
|
|
12,741
|
|
|||||||||||
|
Adjustments for Limited Partners ownership in Operating Partnership
|
(4,778
|
)
|
4,778
|
|
—
|
|
—
|
|
—
|
|
—
|
|
|||||||||||
|
Balance at December 31, 2015
|
1,021,132
|
|
45,451
|
|
—
|
|
1,066,583
|
|
9,878
|
|
1,076,461
|
|
|||||||||||
|
Net proceeds from sale of Trust common shares and issuance of common units
|
766,841
|
|
—
|
|
—
|
|
766,841
|
|
766,841
|
|
|||||||||||||
|
Trust Restricted share award grants, net
|
4,434
|
|
—
|
|
—
|
|
4,434
|
|
4,434
|
|
|||||||||||||
|
Purchase of OP Units
|
—
|
|
(3,671
|
)
|
—
|
|
(3,671
|
)
|
(3,671
|
)
|
|||||||||||||
|
Conversion of OP Units
|
11,619
|
|
(11,619
|
)
|
—
|
|
—
|
|
—
|
|
|||||||||||||
|
OP Units - distributions
|
(115,901
|
)
|
(3,106
|
)
|
—
|
|
(119,007
|
)
|
(119,007
|
)
|
|||||||||||||
|
Preferred distributions
|
(1,857
|
)
|
—
|
|
—
|
|
(1,857
|
)
|
(1,857
|
)
|
|||||||||||||
|
Issuance of OP Units in connection with acquisition
|
17,079
|
|
6,869
|
|
—
|
|
23,948
|
|
(100
|
)
|
23,848
|
|
|||||||||||
|
Contributions
|
—
|
|
—
|
|
—
|
|
—
|
|
50
|
|
50
|
|
|||||||||||
|
Distributions
|
—
|
|
—
|
|
—
|
|
—
|
|
(543
|
)
|
(543
|
)
|
|||||||||||
|
Change in market value of Redeemable Limited Partners
|
(245
|
)
|
—
|
|
—
|
|
(245
|
)
|
(245
|
)
|
|||||||||||||
|
Reclassification of Noncontrolling Interest - partially owned properties
|
—
|
|
—
|
|
—
|
|
—
|
|
(8,514
|
)
|
(8,514
|
)
|
|||||||||||
|
Buyout of Noncontrolling Interest - partially owned properties
|
53
|
|
—
|
|
—
|
|
53
|
|
(664
|
)
|
(611
|
)
|
|||||||||||
|
Change in fair value of interest rate cap agreements
|
—
|
|
—
|
|
13,708
|
|
13,708
|
|
13,708
|
|
|||||||||||||
|
Net income
|
29,981
|
|
825
|
|
—
|
|
30,806
|
|
618
|
|
31,424
|
|
|||||||||||
|
Adjustments for Limited Partners ownership in Operating Partnership
|
(8,393
|
)
|
8,393
|
|
—
|
|
—
|
|
—
|
|
|||||||||||||
|
Balance at December 31, 2016
|
$
|
1,724,743
|
|
$
|
43,142
|
|
$
|
13,708
|
|
$
|
1,781,593
|
|
$
|
725
|
|
$
|
1,782,318
|
|
|||||
The accompanying notes are an integral part of these consolidated financial statements.
83
Physicians Realty L.P.
Consolidated Statements of Cash Flows
(in thousands)
|
|
Year Ended December 31,
|
||||||||||
|
|
2016
|
2015
|
2014
|
||||||||
|
Cash Flows from Operating Activities:
|
|
|
|
|
|
|
|||||
|
Net income (loss)
|
$
|
31,522
|
|
$
|
12,741
|
|
$
|
(4,418
|
)
|
||
|
Adjustments to reconcile net income (loss) to net cash provided by operating activities
|
|||||||||||
|
Depreciation and amortization
|
86,589
|
|
45,471
|
|
16,731
|
|
|||||
|
Amortization of deferred financing costs
|
2,325
|
|
1,373
|
|
1,097
|
|
|||||
|
Accelerated amortization of deferred financing costs
|
—
|
|
—
|
|
—
|
|
|||||
|
Amortization of lease inducements and above/below market lease intangibles
|
3,906
|
|
2,577
|
|
571
|
|
|||||
|
Straight-line rental revenue/expense
|
(16,226
|
)
|
(9,000
|
)
|
(4,366
|
)
|
|||||
|
Amortization of above market assumed debt
|
(236
|
)
|
(173
|
)
|
—
|
|
|||||
|
Gain on sale of investment properties
|
—
|
|
(130
|
)
|
(32
|
)
|
|||||
|
Equity in income of unconsolidated entities
|
(115
|
)
|
(104
|
)
|
(95
|
)
|
|||||
|
Distribution from unconsolidated entities
|
82
|
|
106
|
|
71
|
|
|||||
|
Change in fair value of derivatives
|
(240
|
)
|
(166
|
)
|
(161
|
)
|
|||||
|
Provision for bad debts
|
2,310
|
|
69
|
|
9
|
|
|||||
|
Non-cash share compensation
|
4,894
|
|
3,798
|
|
2,422
|
|
|||||
|
Ziegler shared service amendment payment
|
—
|
|
—
|
|
1,800
|
|
|||||
|
Write-off of contingent consideration
|
(840
|
)
|
—
|
|
—
|
|
|||||
|
Impairment on investment properties
|
—
|
|
—
|
|
1,750
|
|
|||||
|
Change in operating assets and liabilities:
|
|||||||||||
|
Tenant receivables
|
(10,058
|
)
|
(2,836
|
)
|
(986
|
)
|
|||||
|
Other assets
|
(20,387
|
)
|
(630
|
)
|
(3,518
|
)
|
|||||
|
Accounts payable to related parties
|
|
|
—
|
|
—
|
|
|||||
|
Accounts payable
|
3,779
|
|
(56
|
)
|
(136
|
)
|
|||||
|
Accrued expenses and other liabilities
|
37,474
|
|
8,312
|
|
2,556
|
|
|||||
|
Net cash provided by operating activities
|
124,779
|
|
61,352
|
|
13,295
|
|
|||||
|
Cash Flows from Investing Activities:
|
|
|
|
|
|
|
|||||
|
Proceeds on sales of investment property
|
—
|
|
3,039
|
|
235
|
|
|||||
|
Acquisition of investment properties, net
|
(1,245,128
|
)
|
(752,807
|
)
|
(501,127
|
)
|
|||||
|
Capital expenditures on existing investment properties
|
(11,304
|
)
|
(4,988
|
)
|
(900
|
)
|
|||||
|
Pay down of contingent consideration
|
(10,207
|
)
|
(999
|
)
|
—
|
|
|||||
|
Real estate loans receivable
|
11,336
|
|
(22,359
|
)
|
(15,386
|
)
|
|||||
|
Repayment of real estate loan receivable
|
4,118
|
|
—
|
|
—
|
|
|||||
|
Note receivable
|
—
|
|
(20,545
|
)
|
—
|
|
|||||
|
Leasing commissions
|
(1,034
|
)
|
(579
|
)
|
(100
|
)
|
|||||
|
Lease Inducements
|
(8,957
|
)
|
(2,478
|
)
|
(1,532
|
)
|
|||||
|
Net cash used in investing activities
|
(1,261,176
|
)
|
(801,716
|
)
|
(518,810
|
)
|
|||||
|
Cash Flows from Financing Activities:
|
|
|
|
|
|
|
|||||
|
Net proceeds from sale of Trust common shares and issuance of common units
|
766,841
|
|
545,117
|
|
350,384
|
|
|||||
|
Formation transactions
|
—
|
|
—
|
|
—
|
|
|||||
|
Proceeds from credit facility borrowings
|
1,181,000
|
|
620,000
|
|
395,200
|
|
|||||
|
Payment on credit facility borrowings
|
(925,000
|
)
|
(363,000
|
)
|
(257,200
|
)
|
|||||
|
Proceeds from issuance of senior unsecured notes
|
225,000
|
|
—
|
|
—
|
|
|||||
|
Proceeds from issuance of mortgage debt
|
39,500
|
|
—
|
|
26,550
|
|
|||||
|
Principal payments on mortgage debt
|
(10,232
|
)
|
(2,022
|
)
|
(6,549
|
)
|
|||||
|
Debt issuance costs
|
(4,816
|
)
|
(3,105
|
)
|
(3,887
|
)
|
|||||
|
OP Units distributions - General Partner
|
(104,908
|
)
|
(63,720
|
)
|
(28,104
|
)
|
|||||
|
OP Units distributions - Limited Partner
|
(3,162
|
)
|
(3,216
|
)
|
(3,382
|
)
|
|||||
|
Preferred OP Units distributions - Limited Partner
|
(1,508
|
)
|
—
|
|
—
|
|
|||||
|
Distributions to noncontrolling interest - partially owned properties
|
(543
|
)
|
(213
|
)
|
(185
|
)
|
|||||
|
Purchase of Preferred Limited Partner Units
|
(9,756
|
)
|
(563
|
)
|
—
|
|
|||||
|
Purchase of Limited Partner Units
|
(3,671
|
)
|
(1,088
|
)
|
(7,546
|
)
|
|||||
|
Trust common shares repurchased and retired
|
—
|
|
(606
|
)
|
(321
|
)
|
|||||
|
Net cash provided by financing activities
|
1,148,745
|
|
727,584
|
|
464,960
|
|
|||||
|
Net increase (decrease) in cash and cash equivalents
|
12,348
|
|
|
(12,780
|
)
|
|
(40,555
|
)
|
|||
|
Cash and cash equivalents, beginning of year
|
3,143
|
|
15,923
|
|
56,478
|
|
|||||
|
Cash and cash equivalents, end of year
|
$
|
15,491
|
|
$
|
3,143
|
|
$
|
15,923
|
|
||
|
Supplemental disclosure of cash flow information - interest paid during the year
|
$
|
17,151
|
|
$
|
9,550
|
|
$
|
5,606
|
|
||
|
Supplemental disclosure of noncash activity - change in fair value of interest rate swap agreements
|
$
|
13,708
|
|
$
|
—
|
|
$
|
—
|
|
||
|
Supplemental disclosure of noncash activity - assumed debt
|
$
|
—
|
|
$
|
18,690
|
|
$
|
15,283
|
|
||
|
Supplemental disclosure of noncash activity - issuance of OP Units and Series A Preferred Units in connection with acquisitions
|
$
|
6,769
|
|
$
|
40,376
|
|
$
|
28,589
|
|
||
|
Supplemental disclosure of noncash activity - contingent consideration
|
$
|
156
|
|
$
|
2,718
|
|
$
|
840
|
|
||
The accompanying notes are an integral part of these consolidated financial statements.
84
Physicians Realty Trust and Physicians Realty L.P.
Notes to Consolidated Financial Statements
Unless otherwise indicated or unless the context requires otherwise the use of the words “we,” “us” or “our” refers to Physicians Realty Trust and Physicians Realty L.P., collectively.
Note 1.
Organization and Business
Physicians Realty Trust (the “Trust”) was organized in the state of Maryland on April 9, 2013. As of
December 31, 2016
, the Trust was authorized to issue up to
500,000,000
common shares of beneficial interest, par value
$0.01
per share (“common shares”). The Trust filed a Registration Statement on Form S-11 with the Securities and Exchange Commission (the “Commission”) with respect to a proposed underwritten initial public offering (the “IPO”) and completed the IPO of its common shares and commenced operations on July 24, 2013.
The Trust contributed the net proceeds from the IPO to Physicians Realty L.P. (the “Operating Partnership” and together with the Trust and its consolidated subsidiaries, including the Operating Partnership, the “Company”), a Delaware limited partnership, and is the sole general partner of the Operating Partnership. The Trust and the Operating Partnership are managed and operated as one entity. The Trust has no significant assets other than its investment in the Operating Partnership. The Trust’s operations are conducted through the Operating Partnership and wholly-owned and majority-owned subsidiaries of the Operating Partnership. The Trust, as the general partner of the Operating Partnership, controls the Operating Partnership and consolidates the assets, liabilities, and results of operations of the Operating Partnership. Therefore, the assets and liabilities of the Trust and the Operating Partnership are the same.
The Trust is a self-managed real estate investment trust (“REIT”) formed primarily to acquire, selectively develop, own, and manage healthcare properties that are leased to physicians, hospitals, and healthcare delivery systems.
Equity Offerings
On January 25, 2016, the Trust completed a follow-on public offering of
21,275,000
common shares of beneficial interest, including
2,775,000
common shares issued upon exercise of the underwriters’ overallotment option, resulting in net proceeds to it of approximately
$321.1 million
. The Trust contributed the net proceeds of this offering to its Operating Partnership in exchange for
21,275,000
OP Units, and its Operating Partnership used the net proceeds of the public offering to repay borrowings under its unsecured revolving credit facility and for general corporate and working capital purposes and funding acquisitions.
On April 11, 2016, the Trust completed a follow-on public offering of
25,875,000
common shares of beneficial interest, including
3,375,000
common shares issued upon exercise of the underwriters’ overallotment option, resulting in net proceeds to it of approximately
$442.6 million
. The Trust contributed the net proceeds of this offering to the Operating Partnership in exchange for
25,875,000
OP Units, and the Operating Partnership used the net proceeds of the public offering to repay borrowings under its unsecured revolving credit facility, for general corporate and working capital purposes, for funding acquisitions, and to fund a portion of the purchase price for the acquisition of medical office facilities (the “CHI Portfolio”) from certain subsidiaries and affiliates of Catholic Health Initiatives (the “CHI Acquisition”).
85
ATM Program
On August 19, 2014, the Trust and the Operating Partnership entered into separate At Market Issuance Sales Agreements (the “Sales Agreements”) with each of MLV & Co. LLC, KeyBanc Capital Markets Inc., JMP Securities LLC, and RBC Capital Markets, LLC (the “Agents”), pursuant to which the Trust may issue and sell common shares having an aggregate offering price of up to
$150 million
, from time to time, through the Agents pursuant to a shelf registration statement on Form S-3 (the “ATM Program”). During 2015 and 2014, the Trust’s issuance and sale of common shares pursuant to the ATM Program is as follows (in thousands, except common shares and price):
|
2015
|
2014
|
||||||||||||||||||||
|
|
Common
shares sold
|
Weighted
average price
|
Net
proceeds
|
Common
shares sold |
Weighted
average price |
Net
proceeds |
|||||||||||||||
|
Quarterly period ended March 31
|
247,397
|
|
$
|
16.96
|
|
$
|
4,139
|
|
—
|
|
$
|
—
|
|
$
|
—
|
|
|||||
|
Quarterly period ended June 30
|
1,007,695
|
|
16.56
|
|
16,439
|
|
—
|
|
—
|
|
—
|
|
|||||||||
|
Quarterly period ended September 30
|
—
|
|
—
|
|
—
|
|
—
|
|
—
|
|
—
|
|
|||||||||
|
Quarterly period ended December 31
|
—
|
|
—
|
|
—
|
|
3,576,010
|
|
15.54
|
|
54,789
|
|
|||||||||
|
Year ended December 31
|
1,255,092
|
|
$
|
16.63
|
|
$
|
20,578
|
|
3,576,010
|
|
$
|
15.54
|
|
$
|
54,789
|
|
|||||
On
March 8, 2016
, the Company terminated the separate At Market Issuance Sales Agreements with each of MLV & Co. LLC, KeyBanc Capital Markets Inc., JMP Securities LLC, and RBC Capital Markets, LLC, previously entered into on August 19, 2014. There were
no
sales of common shares pursuant to such At Market Issuance Sales Agreements during fiscal year 2016.
On August 5, 2016, the Trust and the Operating Partnership entered into separate At Market Issuance Sales Agreements (the “2016 Sales Agreements”) with each of KeyBanc Capital Markets Inc., Credit Agricole Securities (USA) Inc., JMP Securities LLC, Raymond James & Associates, Inc., and Stifel Nicolaus & Company, Incorporated (the “2016 Agents”), pursuant to which the Trust may issue and sell, from time to time, its common shares having an aggregate offering price of up to
$300.0 million
, through the Agents (the “2016 ATM Program”). In accordance with the 2016 Sales Agreements, the Trust may offer and sell its common shares through any of the 2016 Agents, from time to time, by any method deemed to be an “at the market offering” as defined in Rule 415 under the Securities Act of 1933, as amended, which includes sales made directly on the New York Stock Exchange or other existing trading market, or sales made to or through a market maker. With the Trust’s express written consent, sales may also be made in negotiated transactions or any other method permitted by law.
During 2016, the Trust’s issuance and sale of common shares pursuant to the 2016 ATM Program is as follows (in thousands, except common shares and price):
|
2016
|
||||||||||
|
|
Common
shares sold
|
Weighted
average price
|
Net
proceeds
|
|||||||
|
Quarterly period ended March 31
|
—
|
|
$
|
—
|
|
$
|
—
|
|
||
|
Quarterly period ended June 30
|
—
|
|
—
|
|
—
|
|
||||
|
Quarterly period ended September 30
|
—
|
|
—
|
|
—
|
|
||||
|
Quarterly period ended December 31
|
135,531
|
|
19.09
|
|
2,561
|
|
||||
|
Year ended December 31
|
135,531
|
|
$
|
19.09
|
|
$
|
2,561
|
|
||
As of
February 17, 2017
, the Trust has
$297.4 million
remaining available under the 2016 ATM Program.
Note 2.
Summary of Significant Accounting Policies
Principles of Consolidation
GAAP requires us to identify entities for which control is achieved through means other than voting rights and to determine which business enterprise is the primary beneficiary of variable interest entities (“VIEs”). ASC 810 broadly defines a VIE as an entity in which either (i) the equity investors as a group, if any, lack the power through voting or similar rights to direct the activities of such entity that most significantly impact such entity’s economic performance or (ii) the equity investment at risk is insufficient to finance that entity’s activities without additional subordinated financial support. We identify the primary beneficiary of a VIE as the enterprise that has both of the following characteristics: (i) the power to direct the
86
activities of the VIE that most significantly impact the entity’s economic performance; and (ii) the obligation to absorb losses or receive benefits of the VIE that could potentially be significant to the entity. We consolidate our investment in a VIE when we determine that we are the VIE’s primary beneficiary. We may change our original assessment of a VIE upon subsequent events such as the modification of contractual arrangements that affect the characteristics or adequacy of the entity’s equity investments at risk and the disposition of all or a portion of an interest held by the primary beneficiary. We perform this analysis on an ongoing basis.
For property holding entities not determined to be VIEs, we consolidate such entities in which the Operating Partnership owns
100%
of the equity or has a controlling financial interest evidenced by ownership of a majority voting interest. All intercompany balances and transactions are eliminated in consolidation. For entities in which the Operating Partnership owns less than 100% of the equity interest, the Operating Partnership consolidates the property if it has the direct or indirect ability to control the entities’ activities based upon the terms of the respective entities’ ownership agreements. For these entities, the Operating Partnership records a noncontrolling interest representing equity held by noncontrolling interests.
Noncontrolling Interests
The Company presents the portion of any equity it does not own in entities that it controls (and thus consolidates) as noncontrolling interests and classifies such interests as a component of consolidated equity, separate from the Company’s total shareholders’ equity, on the consolidated balance sheets.
Operating Partnership: Net income or loss is allocated to noncontrolling interests (limited partners) based on their respective ownership percentage of the Operating Partnership. The ownership percentage is calculated by dividing the number of OP Units held by the noncontrolling interests by the total OP Units held by the noncontrolling interests and the Trust. Issuance of additional common shares and OP Units changes the ownership interests of both the noncontrolling interests and the Trust. Such transactions and the related proceeds are treated as capital transactions.
During the year ended December 31, 2016, the Operating Partnership partially funded
one
property acquisition by issuing an aggregate of
174,085
OP Units valued at approximately
$2.9 million
on the date of issuance. The acquisition had a total purchase price of approximately
$8.5 million
. In addition, the Operating Partnership funded the acquisition of the remaining non-controlling interest on a property by issuing an aggregate of
217,549
OP Units valued at approximately
$4.0 million
.
Noncontrolling interests in the Company include OP Units held by the Predecessor’s prior investors and other investors. As of
December 31, 2016
and
2015
, the Trust held a
97.5%
and
95.7%
interest in the Operating Partnership, respectively. As the sole general partner and the majority interest holder, the Trust consolidates the financial position and results of operations of the Operating Partnership.
Holders of OP Units may not transfer their units without the Trust’s prior written consent, as general partner of the Operating Partnership. Beginning on the first anniversary of the issuance of OP Units, OP Unit holders may tender their units for redemption by the Operating Partnership in exchange for cash equal to the market price of the Trust’s common shares at the time of redemption or for unregistered common shares on a
one
-for-one basis. Such selection to pay cash or issue common shares to satisfy an OP Unit holder’s redemption request is solely within the control of the Trust. Accordingly, the Trust presents the OP Units of the Operating Partnership held by investors other than the Trust as noncontrolling interests within equity in the consolidated balance sheet.
Partially Owned Properties: The Trust and OP reflect noncontrolling interests in partially owned properties on the balance sheet for the portion of consolidated properties that are not wholly owned by the Company. The earnings or losses from those properties attributable to the noncontrolling interests are reflected as noncontrolling interests in partially owned properties in the consolidated statement of operations.
Redeemable Noncontrolling Interests - Series A Preferred Units and Partially Owned Properties
On February 5, 2015, the Trust entered into a Second Amended and Restated Agreement of Limited Partnership (the “Partnership Agreement”) which provides for the designation and issuance of the newly designated Series A Participating Redeemable Preferred Units of the Operating Partnership (“Series A Preferred Units”). Series A Preferred Units have priority over all other partnership interests of the Operating Partnership with respect to distributions and liquidation. Holders of Series A Preferred Units are entitled to a
5%
cumulative return and upon redemption, the receipt of
one
common share and
$200
. The holders of the Series A Preferred Units have agreed not to cause the Operating Partnership to redeem their Series A Preferred Units prior to
one year
from the issuance date. In addition, Series A Preferred Units are redeemable at the option of the holders
87
which redemption obligation may be satisfied, at the Trust’s option, in cash or registered common shares. Instruments that require settlement in registered common shares may not be classified in permanent equity as it is not always completely within an issuer’s control to deliver registered common shares. Due to the redemption rights associated with the Series A Preferred Units, the Trust classifies the Series A Preferred Units in the mezzanine section of its consolidated balance sheet.
The Series A Preferred Units were evaluated for embedded features that should be bifurcated and separately accounted for as a freestanding derivative. The Company determined that the Series A Preferred Units contained features that require bifurcation. The Company records the carrying amount of the redeemable noncontrolling interests, less the value of the embedded derivative, at the greater of the carrying value or redemption value. The fair value of the embedded derivative within the Series A Preferred Units is
$5.6 million
and is included in the consolidated balance sheets in accrued expenses and other liabilities.
On February 5, 2015, the acquisition of the Minnetonka MOB was partially funded with the issuance of
44,685
Series A Preferred Units which were valued at
$9.7 million
. On December 17, 2015, the acquisition of the Nashville MOB was partially funded with the issuance of
91,236
Series A Preferred Units which were valued at
$19.7 million
.
On April 1, 2016, the Series A Preferred Units issued in conjunction with the Minnetonka MOB acquisition were redeemed for a total value of
$9.8 million
. The fair value of the embedded derivative associated with the previously outstanding Series A Preferred Units was
$2.7 million
which was derecognized in the course of the redemption.
In connection with the acquisition of the Minnetonka MOB, the Trust received a
$5 million
equity investment from a third party, effective March 1, 2015. This investment earns a
15%
cumulative preferred return. At any point subsequent to the third anniversary of the investment, the holder can require the Trust to redeem the instrument at a price for which the investor will realize a
15%
internal rate of return. Due to the redemption provision, which is outside of the control of the Trust, the Trust classifies the investment in the mezzanine section of its consolidated balance sheet. The Trust records the carrying amount of the redeemable noncontrolling interests at the greater of the carrying value or redemption value.
During 2016, approximately
$8.5 million
was reclassified from Noncontrolling interests - partially owned properties to
Redeemable noncontrolling interest – Series A Preferred Units and partially owned properties
on our consolidated balance sheets due to specific redemption features identified within our investment in a specific property.
Dividends and Distributions
Dividends and distributions for the years ended
December 31, 2016
,
2015
, and
2014
are as follows:
|
Declaration Date
|
Record Date
|
Payment Date
|
Cash Dividend
per Share/Unit
|
|||||
|
December 22, 2016
|
January 5, 2017
|
January 18, 2017
|
$
|
0.225
|
|
|||
|
September 26, 2016
|
October 6, 2016
|
October 18, 2016
|
$
|
0.225
|
|
|||
|
June 23, 2016
|
July 5, 2016
|
July 18, 2016
|
$
|
0.225
|
|
|||
|
March 18, 2016
|
April 1, 2016
|
April 18, 2016
|
$
|
0.225
|
|
|||
|
December 31, 2015
|
January 15, 2016
|
January 29, 2016
|
$
|
0.225
|
|
|||
|
September 28, 2015
|
October 16, 2015
|
October 30, 2015
|
$
|
0.225
|
|
|||
|
July 1, 2015
|
July 17, 2015
|
July 31, 2015
|
$
|
0.225
|
|
|||
|
April 6, 2015
|
April 17, 2015
|
May 1, 2015
|
$
|
0.225
|
|
|||
|
December 30, 2014
|
January 23, 2015
|
February 6, 2015
|
$
|
0.225
|
|
|||
|
September 26, 2014
|
October 17, 2014
|
October 30, 2014
|
$
|
0.225
|
|
|||
|
June 26, 2014
|
July 18, 2014
|
August 1, 2014
|
$
|
0.225
|
|
|||
|
March 27, 2014
|
April 11, 2014
|
April 25, 2014
|
$
|
0.225
|
|
|||
Our shareholders are entitled to reinvest all or a portion of any cash distribution on their shares of our common stock by participating in our Dividend Reinvestment and Share Purchase Plan (“DRIP”), subject to the terms of the plan.
88
Tax Status of Dividends and Distributions
Our distributions of current and accumulated earnings and profits for U.S. federal income tax purposes generally are taxable to shareholders as ordinary income. Distributions in excess of these earnings and profits generally are treated as a non-taxable reduction of the shareholders’ basis in the shares to the extent thereof (non-dividend distributions) and thereafter as taxable gain.
Any cash distributions received by an OP Unit holder in respect of its OP Units generally will not be taxable to such OP Unit holder for U.S. federal income tax purposes, to the extent that such distribution does not exceed the OP Unit holder’s basis in its OP Units. Any such distribution will instead reduce the OP Unit holder’s basis in its OP Units (and OP Unit holders will be subject to tax on the taxable income allocated to them by the Operating Partnership in respect of their OP Units when such income is earned by the Operating Partnership, with such income allocation increasing the OP Unit holders’ basis in their OP Units).
The following table sets forth the federal income tax status of distributions per common share and OP Unit for the periods presented:
|
Year Ended December 31,
|
||||||||||||
|
2016
|
2015
|
2014
|
||||||||||
|
Per common share and OP Unit:
|
||||||||||||
|
Ordinary dividends
|
$
|
0.5325
|
|
$
|
0.2693
|
|
$
|
0.1257
|
|
|||
|
Qualified dividends
|
—
|
|
—
|
|
—
|
|
||||||
|
Capital gain distributions
|
—
|
|
—
|
|
0.0009
|
|
||||||
|
Non-dividend distributions
|
0.3675
|
|
0.6307
|
|
0.7734
|
|
||||||
|
Total
|
$
|
0.9000
|
|
$
|
0.9000
|
|
$
|
0.9000
|
|
|||
Purchases of Investment Properties
A property acquired not subject to an existing lease is treated as an asset acquisition and recorded at its purchase price, inclusive of acquisition costs, allocated between the acquired tangible and intangible assets and assumed liabilities based upon their relative fair values at the date of acquisition. A property acquired with an existing lease is accounted for as a business combination pursuant to the acquisition method in accordance with ASC Topic 805,
Business Combinations
(“ASC 805”), and assets acquired and liabilities assumed, including identified intangible assets and liabilities, are recorded at fair value.
The determination of fair value involves the use of significant judgment and estimation. The Company makes estimates of the fair value of the tangible and intangible acquired assets and assumed liabilities using information obtained from multiple sources as a result of pre-acquisition due diligence and generally includes the assistance of a third party appraiser. The Company estimates the fair value of buildings acquired on an “as-if-vacant” basis and depreciates the building value over the estimated remaining life of the building. The Company determines the allocated value of other fixed assets, such as site improvements, based upon the replacement cost and depreciates such value over the assets’ estimated remaining useful lives as determined at the applicable acquisition date. The fair value of land is determined either by considering the sales prices of similar properties in recent transactions or based on internal analyses of recently acquired and existing comparable properties within the Company’s portfolio.
In recognizing identified intangible assets and liabilities in connection with a business combination, the value of above-or-below market leases is estimated based on the present value (using an interest rate which reflected the risks associated with the leases acquired) of the difference between contractual amounts to be received pursuant to the leases and management’s estimate of market lease rates measured over a period equal to the estimated remaining term of the lease. The capitalized above-market or below-market lease intangibles are amortized as a reduction or addition to rental income over the estimated remaining term of the respective leases plus the term of any renewal options that the lessee would be economically compelled to exercise.
In determining the value of in-place leases, management considers current market conditions and costs to execute similar leases in arriving at an estimate of the carrying costs during the expected lease-up period from vacant to existing occupancy. In estimating carrying costs, management includes real estate taxes, insurance, other operating expenses, estimates of lost rental revenue during the expected lease-up periods, and costs to execute similar leases, including leasing commissions, tenant improvements, legal, and other related costs based on current market demand. The values assigned to in-place leases are
89
amortized to amortization expense over the estimated remaining term of the lease. If a lease terminates prior to its scheduled expiration, all unamortized costs related to that lease are written off, net of any required lease termination payments.
The Company calculates the fair value of any long-term debt assumed by discounting the remaining contractual cash flows on each instrument at the current market rate for those borrowings, which the Company approximates based on the rate it would expect to incur on a replacement instrument on the date of acquisition, and recognizes any fair value adjustments related to long-term debt as effective yield adjustments over the remaining term of the instrument.
Based on these estimates, the Company recognizes the acquired assets and assumed liabilities at their estimated fair values, which are generally determined using Level 3 inputs, such as market rental rates, capitalization rates, discount rates, or other available market data. Initial valuations are subject to change until the information is finalized, no later than 12 months from the acquisition date. The Company expenses transaction costs associated with acquisitions accounted for as business combinations in the period incurred.
Impairment of Intangible and Long-Lived Assets
The Company periodically evaluates its long-lived assets, primarily consisting of investments in real estate, for impairment indicators or whenever events or changes in circumstances indicate that the recorded amount of an asset may not be fully recoverable. If indicators of impairment are present, the Company evaluates the carrying value of the related real estate properties in relation to the undiscounted expected future cash flows of the underlying operations. In performing this evaluation, management considers market conditions and current intentions with respect to holding or disposing of the real estate property. The Company adjusts the net book value of real estate properties to fair value if the sum of the expected future undiscounted cash flows, including sales proceeds, is less than book value. The Company recognizes an impairment loss at the time it makes any such determination. If the Company determines that an asset is impaired, the impairment to be recognized is measured as the amount by which the recorded amount of the asset exceeds its fair value. Fair value is typically determined using a discounted future cash flow analysis or other acceptable valuation techniques, which are based, in turn, upon Level 3 inputs, such as revenue and expense growth rates, capitalization rates, discount rates, or other available market data.
The Company did
not
record impairment charges in the
twelve months ended
December 31, 2016
and
2015
. Impairment charges of
$1.8 million
were recorded in the year ended December 31,
2014
.
Assets Held for Sale and Discontinued Operations
The Company may sell properties from time to time for various reasons, including favorable market conditions. The Company classifies certain long-lived assets as held for sale once the criteria, as defined by GAAP, has been met. Long-lived assets to be disposed of are reported at the lower of their carrying amount or fair value minus cost to sell, and are no longer depreciated. No properties were classified as held for sale as of
December 31, 2016
or
2015
, and dispositions during the years ended December 31,
2015
and
2014
did not qualify as discontinued operations.
Investments in Unconsolidated Entities
The Company reports investments in unconsolidated entities over whose operating and financial policies it has the ability to exercise significant influence under the equity method of accounting. Under this method of accounting, the Company’s share of the investee’s earnings or losses is included in its consolidated statements of operations. The initial carrying value of investments in unconsolidated entities is based on the amount paid to purchase the equity interest.
During 2014, the Company completed the acquisition of a
40%
limited liability company membership interest in Jeff-Orleans Medical Development Real Estate, L.L.C., the entity that owns and leases to the Company the land on which the Crescent City Surgical Centre is situated, for
$1.3 million
.
During 2016, the Company completed the acquisition of a
43%
limited liability company membership interest in Desert Cove MOB, LLC. The entity intends to purchase a Medical Office Building in Scottsdale, AZ with an anticipated purchase price of approximately $6.9 million. The purchase of the MOB will be completed with capital contributed to date by each respective member, as well as the obtaining of project financing of approximately $4.8 million. The Company’s initial investment in the joint venture was
$0.9 million
.
90
Real Estate Loans Receivable
Real estate loans receivable consists of
eight
mezzanine loans and
two
term loans. Each mezzanine loan is collateralized by an ownership interest in the respective borrower, while the term loans are secured by equity interests in
two
medical office building developments. Interest income on the loans are recognized as earned based on the terms of the loans subject to evaluation of collectability risks and are included in the Company’s consolidated statements of operations.
Cash and Cash Equivalents
Cash and cash equivalents consist of cash on hand and short-term investments with maturities of three months or less from the date of purchase.
The Company is subject to concentrations of credit risk as a result of its temporary cash investments. The Company places its temporary cash investments with high credit quality financial institutions in order to mitigate that risk.
Escrow Reserves
The Company is required to maintain various escrow reserves on certain notes payable to cover future property taxes and insurance and tenant improvements costs as defined in each loan agreement. The total reserves as of
December 31, 2016
and
2015
are
$4.3 million
and
$4.8 million
, respectively, which are included in other assets in the consolidated balance sheets.
Deferred Costs
Deferred costs consist primarily of fees paid to obtain financing and costs associated with the origination of long-term leases on real estate properties. After the purchase of a property, lease commissions incurred to extend in-place leases or generate new lease are added to deferred lease costs. Deferred lease costs are included as a component of other assets and are amortized on a straight-line basis over the terms of their respective agreements. Deferred financing costs are shown as a direct reduction from the related debt liability. The Trust amortizes deferred financing costs as a component of interest expense over the terms of the related borrowings using a method that approximates a level yield.
Derivative Instruments
When the Company has derivative instruments embedded in other contracts, it records them either as an asset or a liability measured at their fair value unless they qualify for a normal purchase or normal sales exception. When specific hedge accounting criteria are not met, changes in the Company’s derivative instruments’ fair value are recognized currently in earnings. Changes in the fair market values of the Company’s derivative instruments are recorded in the consolidated statements of income if the derivative instruments do not qualify for, or the Company does not elect to apply for, hedge accounting. If hedge accounting is applied to a derivative instrument, such changes are reported in accumulated other comprehensive income within the consolidated statement of equity, exclusive of ineffectiveness amounts, which are recognized as adjustments to net income.
To manage interest rate risk for certain of its variable-rate debt, the Company uses interest rate swaps as part of its risk management strategy. These derivatives are designed to mitigate the risk of future interest rate increases by providing a fixed interest rate for a limited, pre-determined period of time. Interest rate swaps designated as cash flow hedges involve the receipt of variable-rate amounts from a counterparty in exchange for the Company making fixed-rate payments over the life of the agreements without exchange of the underlying notional amount. As of
December 31, 2016
, the Company had
five
outstanding interest rate swap contracts that are designated as cash flow hedges of interest rate risk. For presentational purposes, they are shown as one derivative due to the identical nature of their economic terms. Further detail is provided in
Note 7 (Derivatives)
.
The effective portion of the change in the fair value of derivatives designated and that qualify as cash flow hedges is recorded in accumulated other comprehensive income (“AOCI”) on the consolidated balance sheets and is subsequently reclassified into earnings as interest expense for the period that the hedged forecasted transaction affects earnings. The ineffective portion of the change in fair value of the derivatives is recognized directly in earnings. For the twelve months ended
December 31, 2016
, the Company recognized a
$0.2 million
gain as a result of hedge ineffectiveness. The Company expects hedge ineffectiveness to be insignificant in the next 12 months.
91
Tenant Receivables, Net
Tenant accounts receivable are stated net of the applicable allowance. Rental payments under these contracts are primarily due monthly. The Company assesses the collectability of tenant receivables, including straight-line rent receivables, and defers recognition of revenue if collectability is not reasonably assured. The Company bases its assessment of the collectability of rent receivables on several factors, including, among other things, payment history, the financial strength of the tenant, and current economic conditions. If management’s evaluation of these factors indicates it is probable that the Company will be unable to recover the full value of the receivable, the Company provides a reserve against the portion of the receivable that it estimates may not be recovered. At
December 31, 2016
and
2015
, the allowance for doubtful accounts was
$2.4 million
and
$0.1 million
, respectively.
Rental Revenue
Rental revenue is recognized on a straight-line basis over the terms of the related leases when collectability is reasonably assured. Recognizing rental revenue on a straight-line basis for leases may result in recognizing revenue for amounts more or less than amounts currently due from tenants. Amounts recognized in excess of amounts currently due from tenants are included in other assets and were approximately
$32.0
million and
$15.6
million as of
December 31, 2016
and
2015
, respectively. If the Company determines that collectability of straight-line rents is not reasonably assured, the Company limits future recognition to amounts contractually owed and, where appropriate, establishes an allowance for estimated losses. Rental revenue is adjusted by amortization of lease inducements and above or below market rents on certain leases. Lease inducements and above or below market rents are amortized over the average remaining life of the lease.
Expense Recoveries
Expense recoveries relate to tenant reimbursement of real estate taxes, insurance, and other operating expenses that are recognized as expense recovery revenue in the period the applicable expenses are incurred. The reimbursements are recorded at gross, as the Company is generally the primary obligor with respect to real estate taxes and purchasing goods and services from third-party suppliers, has discretion in selecting the supplier, and bears the credit risk of tenant reimbursement.
The Company has certain tenants with absolute net leases. Under these lease agreements, the tenant is responsible for operating and building expenses. For absolute net leases, the Company does not recognize expense recoveries.
Income Taxes
The Trust elected to be taxed as a REIT for federal tax purposes commencing with the filing of its tax return for the short taxable year ending December 31, 2013. The Trust had no taxable income prior to electing REIT status. To qualify as a REIT, the Trust must meet certain organizational and operational requirements, including a requirement to distribute at least 90% of its annual REIT taxable income to its shareholders (which is computed without regard to the dividends paid deduction or net capital gain and which does not necessarily equal net income as calculated in accordance with GAAP). As a REIT, the Trust generally will not be subject to federal income tax to the extent it distributes qualifying dividends to its shareholders. If the Trust fails to qualify as a REIT in any taxable year, it will be subject to federal income tax (including any applicable alternative minimum tax) on its taxable income at regular corporate income tax rates and generally will not be permitted to qualify for treatment as a REIT for federal income tax purposes for the four taxable years following the year during which qualification is lost unless the Internal Revenue Service grants the Trust relief under certain statutory provisions. Such an event could materially adversely affect the Trust’s net income and net cash available for distribution to shareholders. However, the Trust intends to continue to operate in such a manner as to continue qualifying for treatment as a REIT. Even if the Trust continues to qualify for taxation as a REIT, the Trust may be subject to state and local taxes on its income and property and federal income and excise taxes on its undistributed income.
As discussed in
Note 1 (Organization and Business)
, the Trust conducts substantially all of its operations through the Operating Partnership. As a partnership, the Operating Partnership generally is not liable for federal income taxes. The income and loss from the operations of the Operating Partnership is included in the tax returns of its partners, including the Trust, who are responsible for reporting their allocable share of the partnership income and loss. Accordingly, no provision for income taxes has been made on the accompanying consolidated financial statements.
Management Estimates
The preparation of consolidated financial statements in conformity with GAAP requires management to make estimates and assumptions that affect the reported amounts of assets and liabilities and disclosure of contingent assets and
92
liabilities as of the date of the consolidated financial statements and the amounts of revenue and expenses reported in the period. Significant estimates are made for the fair value assessments with respect to purchase price allocations, impairment assessments, and the valuation of financial instruments. Actual results could differ from these estimates.
Contingent Liabilities
The Company records liabilities for contingent consideration (included in accrued expenses and other liabilities on its consolidated balance sheets) at fair value as of the acquisition date and reassesses the fair value at the end of each reporting period, with any changes being recognized in earnings. Increases or decreases in the fair value of contingent consideration can result from changes in discount periods, discount rates and probabilities that contingencies will be met.
Related Parties
It is the Company’s policy to make disclosures regarding any transactions in which it participates and in which any related person has a direct or indirect material interest and the amount involved exceeds $120,000 to the extent required by SEC rules. The related person transaction policy is available in the Investor Relations section of the Trust’s website (www.docreit.com) under the tab “Governance Documents.” In 2016, the Company recognized rental revenues totaling $0.6 million from Aurora Health Care, a not-for-profit healthcare provider affiliated with certain members of the Trust’s Board of Trustees.
Reclassifications
Certain prior period amounts have been reclassified to conform to the current financial statement presentation, with no effect on the previously reported consolidated financial position or consolidated results of operations.
Segment Reporting
Under the provision of Codification Topic 280,
Segment Reporting
, the Company has determined that it has one reportable segment with activities related to leasing and managing healthcare properties.
New Accounting Pronouncements
In May 2014, the FASB issued ASU 2014-09,
Revenue from Contracts with Customers
, which creates a new Topic, Accounting Standards Codification Topic 606. The standard is principle-based and provides a five-step model to determine when and how revenue is recognized. The core principle is that a company should recognize revenue when it transfers promised goods or services to customers in an amount that reflects the consideration to which the company expects to be entitled, in exchange for those goods or services. This standard is effective for interim or annual periods beginning after December 15, 2017 and allows for either full retrospective or modified retrospective adoption. Early adoption of this standard is permitted for reporting periods beginning after December 15, 2016. The Company anticipates that adoption of ASU 2014-09 will take place on January 1, 2018 via the modified retrospective approach. Under the full retrospective method, the standard would be applied retrospectively to all reporting periods represented on the financials statements. The modified retrospective approach applies the standard in the year of initial application and presents the cumulative effect of prior periods with an adjustment to beginning retained earnings, with no restatement of comparative periods. As leasing arrangements (which are excluded from ASU 2014-09) represent the primary source of revenue for the Company, the impact of adoption will be limited to the Company’s recognition and presentation of non-lease revenues. The Company continues to evaluate the impact of ASU 2014-09 to its consolidated financial statements.
In February 2015, the FASB issued ASU 2015-02,
Amendments to the Consolidation Analysis
. ASU 2015-02 requires entities to evaluate whether they should consolidate certain legal entities. Principally, the new consolidation standard modified the evaluation of whether limited partnerships and similar legal entities are variable interest entities ("VIE") or voting interest entities. The Company adopted ASU 2015-02 on January 1, 2016. Based on the Company’s review and subsequent analysis of the structure of the Company’s legal entities, the Company has concluded that the Operating Partnership is a VIE because the limited partners of the Operating Partnership do not have substantive kick-out or participating rights. The Trust is the general partner and controlling owner of approximately
97.5%
of the Operating Partnership and will continue to consolidate the Operating Partnership under this new guidance. With respect to the Company’s investment in unconsolidated joint ventures, the new consolidation standard did not have an impact on previous consolidation conclusions.
In April 2015, the FASB issued ASU 2015-03,
Simplifying the Presentation of Debt Issuance Costs
, which changes the presentation of debt issuance costs in financial statements. ASU 2015-03 requires an entity to present such costs in the balance
93
sheet as a direct deduction from the related debt liability rather than as an asset. Amortization of the costs will continue to be reported as interest expense. ASU 2015-03 is effective for annual reporting periods beginning after December 15, 2016. Early adoption is permitted. The new guidance has been applied retrospectively to each prior period presented. The Company adopted ASU 2015-03 on January 1, 2016. As a result of the adoption of ASU 2015-03, the Company reclassified $6.0 million from net deferred costs to the related liabilities within the December 31, 2015 Consolidated Balance Sheet.
In February 2016, the FASB issued ASU 2016-02,
Leases
. The update amends the existing accounting standards for lease accounting, including requiring lessees to recognize most leases on their balance sheets and making targeted changes to lessor accounting. The standard requires a modified retrospective transition approach for all leases existing at, or entered into after, the date of initial application, with an option to use certain transition relief. ASU 2016-02 will be effective for annual reporting periods beginning after December 15, 2018. Early adoption is permitted. As a result of adopting ASU 2016-02, the Company will recognize all of its operating leases for which it is the lessee, including ground leases, on its consolidated balance sheets. The Company is evaluating the impact of the adoption of ASU 2016-02 on January 1, 2019 to its consolidated financial statements.
In March 2016, the FASB issued ASU 2016-09,
Improvements to Employee Share-Based Payment Accounting
. This update simplifies several aspects of accounting for share-based payment transactions, including income tax consequences, classification of awards as either equity or liabilities, and classification on the statements of cash flows. ASU 2016-09 is effective for fiscal years, and for interim periods within those fiscal years, beginning after December 15, 2016. The Company will adopt ASU 2016-09 on January 1, 2017. Adoption is not expected to have have a material impact to its consolidated financial statements.
In January 2017, the FASB issued ASU 2017-01,
Clarifying the Definition of a Business
, that clarifies the framework for determining whether an integrated set of assets and activities meets the definition of a business. The revised framework establishes a screen for determining whether an integrated set of assets and activities is a business and narrows the definition of a business, which is expected to result in fewer transactions being accounted for as business combinations. Acquisitions of integrated sets of assets and activities that do not meet the definition of a business are accounted for as asset acquisitions. ASU 2017-01 will be effective for fiscal years, and for interim periods within those fiscal years, beginning after December 15, 2017. Early adoption is permitted. The Company is currently evaluating the impact of adopting ASU 2017-01 on its consolidated financial statements.
94
Note 3.
Acquisitions and Dispositions
During
2016
, the Company completed acquisitions of
95
operating healthcare properties (including
5
condominium units and the CHI Portfolio) and
1
land parcel, located in
23
states, for an aggregate purchase price of approximately
$1.27 billion
. In addition, the Company completed
$0.9 million
of joint venture investments,
$10.2 million
of loan transactions,
$2.5 million
of redeemable noncontrolling interest buyouts, and
$0.6 million
of equity buyouts, resulting in total investment activity of approximately
$1.29 billion
.
This aggregate purchase price does not include near-term capital expenditure commitments of
$12.9 million
and committed tenant improvement allowances of
$8.9 million
related to the Company’s acquisition of the CHI Portfolio.
Investment activity for the year ending
December 31, 2016
is summarized below:
|
Property (1)
|
Location
|
Acquisition
Date
|
Purchase Price
(in thousands)
|
|||||||
|
Tinseltown - Loan Draws
|
Jacksonville, FL
|
$
|
2,192
|
|
||||||
|
Randall Road MOB - Suite 380
|
(3)
|
Elgin, IL
|
January 14, 2016
|
704
|
|
|||||
|
Great Falls Hospital
|
(2)
|
Great Falls, MT
|
January 25, 2016
|
29,043
|
|
|||||
|
Monterey Medical Center ASC
|
(2)
|
Stuart, FL
|
February 1, 2016
|
6,900
|
|
|||||
|
Physicians Medical Plaza MOB
|
(2)
|
(4)
|
Indianapolis, IN
|
February 1, 2016
|
8,500
|
|
||||
|
Mezzanine Loan - Davis
|
Minnetonka, MN
|
February 4, 2016
|
500
|
|
||||||
|
Park Nicollet Clinic
|
(2)
|
Chanhassen, MN
|
February 8, 2016
|
18,600
|
|
|||||
|
HEB Cancer Center
|
(2)
|
Bedford, TX
|
February 12, 2016
|
13,980
|
|
|||||
|
Riverview Medical Center
|
(2)
|
Lancaster, OH
|
February 26, 2016
|
12,800
|
|
|||||
|
St. Luke's Cornwall MOB
|
(2)
|
Cornwall, NY
|
February 26, 2016
|
14,550
|
|
|||||
|
HonorHealth Glendale
|
(3)
|
Glendale, AZ
|
March 15, 2016
|
9,820
|
|
|||||
|
Columbia MOB
|
(2)
|
Hudson, NY
|
March 21, 2016
|
18,450
|
|
|||||
|
St Vincent POB 1
|
(2)
|
Birmingham, AL
|
March 23, 2016
|
10,951
|
|
|||||
|
St Vincent POB 2
|
(2)
|
Birmingham, AL
|
March 23, 2016
|
7,945
|
|
|||||
|
St Vincent POB 3
|
(2)
|
Birmingham, AL
|
March 23, 2016
|
10,455
|
|
|||||
|
Emerson Medical Building
|
(2)
|
Creve Coeur, MO
|
March 24, 2016
|
14,250
|
|
|||||
|
Randall Road MOB - Suite 160
|
(3)
|
Elgin, IL
|
March 24, 2016
|
865
|
|
|||||
|
Patient Partners Surgery Center
|
(2)
|
Gallatin, TN
|
March 30, 2016
|
4,750
|
|
|||||
|
Eye Associates of NM - Santa Fe
|
(3)
|
Santa Fe, NM
|
March 31, 2016
|
8,739
|
|
|||||
|
Eye Associates of NM - Albuquerque
|
(3)
|
Albuquerque, NM
|
March 31, 2016
|
10,536
|
|
|||||
|
Gardendale Surgery Center
|
(2)
|
Gardendale, AL
|
April 11, 2016
|
7,450
|
|
|||||
|
HealthEast - Curve Crest
|
(2)
|
Stillwater, MN
|
April 14, 2016
|
4,144
|
|
|||||
|
HealthEast - Victor Gardens
|
(2)
|
Hugo, MN
|
April 14, 2016
|
6,025
|
|
|||||
|
NOMS - Clyde
|
(3)
|
Clyde, OH
|
May 10, 2016
|
6,342
|
|
|||||
|
Blandford MOB
|
(3)
|
(5)
|
Little Rock, AR
|
May 11, 2016
|
2,580
|
|
||||
|
Cardwell MOB
|
(2)
|
(5)
|
Lufkin, TX
|
May 11, 2016
|
8,444
|
|
||||
|
Dacono Neighborhood Health
|
(3)
|
(5)
|
Dacono, CO
|
May 11, 2016
|
5,152
|
|
||||
|
Franciscan Health
|
(3)
|
(5)
|
Tacoma, WA
|
May 11, 2016
|
9,772
|
|
||||
|
Grand Island Specialty Clinic
|
(3)
|
(5)
|
Grand Island, NE
|
May 11, 2016
|
2,891
|
|
||||
|
Hot Springs MOB
|
(2)
|
(5)
|
Hot Springs Village, AR
|
May 11, 2016
|
3,626
|
|
||||
|
Jewish Medical Center East
|
(3)
|
(5)
|
Louisville, KY
|
May 11, 2016
|
85,000
|
|
||||
|
Jewish Medical Center South MOB - 1
|
(3)
|
(5)
|
Shepherdsville, KY
|
May 11, 2016
|
17,021
|
|
||||
|
Jewish Medical Plaza I
|
(2)
|
(5)
|
Louisville, KY
|
May 11, 2016
|
9,650
|
|
||||
|
Jewish Medical Plaza II
|
(2)
|
(5)
|
Louisville, KY
|
May 11, 2016
|
6,124
|
|
||||
|
Jewish OCC
|
(3)
|
(5)
|
Louisville, KY
|
May 11, 2016
|
35,600
|
|
||||
95
|
Property (1)
|
Location
|
Acquisition
Date
|
Purchase Price
(in thousands)
|
|||||||
|
Lakeside Three Professional Center
|
(2)
|
(5)
|
Omaha, NE
|
May 11, 2016
|
1,581
|
|
||||
|
Lexington Surgery Center
|
(2)
|
(5)
|
Lexington, KY
|
May 11, 2016
|
20,169
|
|
||||
|
Medical Arts Pavilion
|
(2)
|
(5)
|
Lufkin, TX
|
May 11, 2016
|
6,304
|
|
||||
|
Memorial Outpatient Center
|
(3)
|
(5)
|
Lufkin, TX
|
May 11, 2016
|
4,958
|
|
||||
|
Midlands Two Professional Center
|
(2)
|
(5)
|
Papillion, NE
|
May 11, 2016
|
1,341
|
|
||||
|
Parkview MOB
|
(2)
|
(5)
|
Little Rock, AR
|
May 11, 2016
|
5,060
|
|
||||
|
Peak One ASC
|
(2)
|
(5)
|
Frisco, CO
|
May 11, 2016
|
6,587
|
|
||||
|
Physicians Medical Center
|
(2)
|
(5)
|
Tacoma, WA
|
May 11, 2016
|
6,782
|
|
||||
|
St. Alexius - Minot Medical Plaza
|
(3)
|
(5)
|
Minot, ND
|
May 11, 2016
|
26,570
|
|
||||
|
St. Clare Medical Pavilion
|
(2)
|
(5)
|
Lakewood, WA
|
May 11, 2016
|
10,617
|
|
||||
|
St. Joseph Medical Pavilion
|
(2)
|
(5)
|
Tacoma, WA
|
May 11, 2016
|
13,320
|
|
||||
|
St. Joseph Office Park
|
(2)
|
(5)
|
Lexington, KY
|
May 11, 2016
|
17,228
|
|
||||
|
St. Mary - Caritas Medical II
|
(2)
|
(5)
|
Louisville, KY
|
May 11, 2016
|
5,603
|
|
||||
|
St. Mary - Caritas Medical III
|
(2)
|
(5)
|
Louisville, KY
|
May 11, 2016
|
842
|
|
||||
|
Thornton Neighborhood Health
|
(3)
|
(5)
|
Thornton, CO
|
May 11, 2016
|
3,875
|
|
||||
|
Medical Village at Kissimmee
|
(2)
|
Kissimmee, FL
|
May 26, 2016
|
4,923
|
|
|||||
|
Medical Village at Leesburg
|
(2)
|
Leesburg, FL
|
May 26, 2016
|
4,576
|
|
|||||
|
St. Francis MOB
|
(2)
|
(5)
|
Federal Way, WA
|
June 2, 2016
|
14,287
|
|
||||
|
Children's Hospital MOB
|
(2)
|
Milwaukee, WI
|
June 3, 2016
|
5,850
|
|
|||||
|
Jewish Medical Center South MOB - 2
|
(2)
|
Shepherdsville, KY
|
June 8, 2016
|
4,343
|
|
|||||
|
Good Samaritan North Annex Building
|
(3)
|
(5)
|
Kearney, NE
|
June 28, 2016
|
2,874
|
|
||||
|
NE Heart Institute Medical Building
|
(3)
|
(5)
|
Lincoln, NE
|
June 28, 2016
|
19,600
|
|
||||
|
St. Vincent West MOB
|
(3)
|
(5)
|
Little Rock, AR
|
June 29, 2016
|
14,120
|
|
||||
|
Meridan MOB
|
(3)
|
(5)
|
Englewood, CO
|
June 29, 2016
|
17,329
|
|
||||
|
St. Mary - Caritas Medical I
|
(2)
|
(5)
|
Louisville, KY
|
June 29, 2016
|
8,864
|
|
||||
|
St. Alexius - Medical Arts Pavilion
|
(3)
|
(5)
|
Bismarck, ND
|
June 29, 2016
|
12,983
|
|
||||
|
St. Alexius - Mandan Clinic
|
(3)
|
(5)
|
Mandan, ND
|
June 29, 2016
|
8,390
|
|
||||
|
St. Alexius - Orthopaedic Center
|
(2)
|
(5)
|
Bismarck, ND
|
June 29, 2016
|
14,727
|
|
||||
|
St. Alexius - Rehab Center
|
(3)
|
(5)
|
Bismarck, ND
|
June 29, 2016
|
6,215
|
|
||||
|
St. Alexius - Tech & Ed
|
(3)
|
(5)
|
Bismarck, ND
|
June 29, 2016
|
16,680
|
|
||||
|
Good Samaritan MOB
|
(2)
|
(5)
|
Kearney, NE
|
June 29, 2016
|
24,198
|
|
||||
|
Lakeside Two Professional Building
|
(2)
|
(5)
|
Omaha, NE
|
June 29, 2016
|
13,691
|
|
||||
|
Lakeside Wellness Center
|
(3)
|
(5)
|
Omaha, NE
|
June 29, 2016
|
10,138
|
|
||||
|
McAuley Center
|
(3)
|
(5)
|
Omaha, NE
|
June 29, 2016
|
18,382
|
|
||||
|
Memorial Health Center
|
(3)
|
(5)
|
Grand Island, NE
|
June 29, 2016
|
34,042
|
|
||||
|
Missionary Ridge MOB
|
(2)
|
(5)
|
Chattanooga, TN
|
June 29, 2016
|
7,635
|
|
||||
|
Pilot Medical Center
|
(3)
|
Birmingham, AL
|
June 29, 2016
|
17,351
|
|
|||||
|
St. Joseph Medical Clinic
|
(2)
|
(5)
|
Tacoma, WA
|
June 30, 2016
|
16,444
|
|
||||
|
Woodlands Medical Arts Center
|
(2)
|
(5)
|
The Woodlands, TX
|
June 30, 2016
|
21,227
|
|
||||
|
FESC MOB
|
(3)
|
(5)
|
Tacoma, WA
|
June 30, 2016
|
16,748
|
|
||||
|
Mezzanine Loan - Catalyst
|
Pensacola, FL
|
June 30, 2016
|
1,340
|
|
||||||
|
Prairie Care MOB
|
(2)
|
Maplewood, MN
|
July 6, 2016
|
4,886
|
|
|||||
|
RE Loan - El Paso
|
El Paso, TX
|
July 7, 2016
|
1,300
|
|
||||||
|
Springwoods MOB
|
(2)
|
(5)
|
Spring, TX
|
July 21, 2016
|
19,925
|
|
||||
|
Equity Buyout - Foundation
|
(6)
|
TX / OK
|
July 26, 2016
|
611
|
|
|||||
96
|
Property (1)
|
Location
|
Acquisition
Date
|
Purchase Price
(in thousands)
|
|||||||
|
Mezzanine Loan - Hazelwood
|
Minnetonka, MN
|
July 29, 2016
|
3,375
|
|
||||||
|
Jackson, Tennessee Land
|
(3)
|
Jackson, TN
|
August 2, 2016
|
1,000
|
|
|||||
|
Unity Portfolio (4 MOBs)
|
(2)
|
West Lafayette, IN
|
August 8, 2016
|
28,751
|
|
|||||
|
Medical Village at Maitland
|
(2)
|
Orlando, FL
|
August 23, 2016
|
23,211
|
|
|||||
|
Tri-State Orthopaedics MOB
|
(2)
|
Evansville, IN
|
August 30, 2016
|
22,000
|
|
|||||
|
Noncontrolling Interest Buyout - Great Falls Clinic
|
(7)
|
Great Falls, MT
|
September 30, 2016
|
1,015
|
|
|||||
|
Maury Regional Healthcare MOB
|
(2)
|
(8)
|
Spring Hill, TN
|
September 30, 2016
|
18,500
|
|
||||
|
Spring Ridge Medical Center
|
(2)
|
Wyomissing, PA
|
September 30, 2016
|
6,100
|
|
|||||
|
Doctors Community Hospital MOB
|
(2)
|
Lanham, MD
|
September 30, 2016
|
26,750
|
|
|||||
|
Gig Harbor Medical Pavilion
|
(3)
|
(5)
|
Gig Harbor, WA
|
September 30, 2016
|
4,766
|
|
||||
|
Midlands One Professional Center
|
(2)
|
(5)
|
Papillion, NE
|
September 30, 2016
|
14,856
|
|
||||
|
N.W. Michigan Surgery Center - Units #1 & #2
|
(3)
|
(9)
|
Traverse City, MI
|
October 28, 2016
|
29,448
|
|
||||
|
United Surgical Partners Joint Venture
|
(10)
|
Scottsdale, AZ
|
October 31, 2016
|
903
|
|
|||||
|
N.W. Michigan Surgery Center - Unit #4
|
(3)
|
(11)
|
Traverse City, MI
|
November 4, 2016
|
2,715
|
|
||||
|
Syracuse Portfolio (2 MOBs)
|
(2)
|
Syracuse, NY
|
November 23, 2016
|
54,239
|
|
|||||
|
Cincinnati Eye Institute
|
(3)
|
Cincinnati, OH
|
November 23, 2016
|
38,100
|
|
|||||
|
Curie Building Loan
|
El Paso, TX
|
December 2, 2016
|
1,500
|
|
||||||
|
HonorHealth - Scottsdale MOB
|
(3)
|
Scottsdale, AZ
|
December 2, 2016
|
6,900
|
|
|||||
|
Fox Valley Hematology & Oncology
|
(3)
|
Appleton, WI
|
December 8, 2016
|
28,200
|
|
|||||
|
Gastrointestinal Associates MOB
|
(2)
|
Powell, TN
|
December 9, 2016
|
6,287
|
|
|||||
|
Northern Vision Eye Center
|
(3)
|
Traverse City, MI
|
December 15, 2016
|
2,777
|
|
|||||
|
Noncontrolling Interest Buyout - Great Falls Clinic
|
(12)
|
Great Falls, MT
|
December 15, 2016
|
1,497
|
|
|||||
|
Flower Mound Portfolio (3 MOBs)
|
(3)
|
Flower Mound, TX
|
December 16, 2016
|
27,800
|
|
|||||
|
HonorHealth IRF
|
(3)
|
Scottsdale, AZ
|
December 22, 2016
|
25,628
|
|
|||||
|
|
|
$
|
1,285,185
|
|
||||||
|
(1)
|
“MOB” means medical office building. “ASC” means ambulatory surgery center. “POB” means professional office building. “IRF” means inpatient rehabilitation facility.
|
|
(2)
|
The Company accounted for these acquisitions as business combinations pursuant to the acquisition method and expensed total acquisition costs of
$14.8 million
.
|
|
(3)
|
The Company accounted for these acquisitions as asset acquisitions and capitalized total acquisition costs of
$3.0 million
.
|
|
(4)
|
The Company partially funded the purchase price of this acquisition by issuing a total of
174,085
OP Units valued at approximately
$2.9 million
in the aggregate on the date of issuance.
|
|
(5)
|
These acquisitions are part of the CHI Portfolio.
|
|
(6)
|
The Company acquired the previously outstanding
1%
noncontrolling interest retained by the predecessor owner on
three
properties in El Paso, Texas and Oklahoma City, Oklahoma.
|
|
(7)
|
The Company acquired an additional
3%
interest in the Great Falls Clinic joint venture from the predecessor owner, increasing the Company’s total interest to
77.3%
.
|
|
(8)
|
The Company acquired
99.7%
of the ownership interest in this property, the remainder of which was retained by the seller.
|
|
(9)
|
The Company partially funded the purchase price of the acquisition of two condominium units within the Northwest Michigan Surgery Center through the unregistered issuance of
947,936
common shares of beneficial interest.
|
|
(10)
|
The Company’s investment in the United Surgical Partners J.V. represents a
43%
ownership interest.
|
|
(11)
|
The Company partially funded the purchase price of the acquisition of one additional condominium unit within the Northwest Michigan Surgery Center through the unregistered issuance of
88,602
common shares of beneficial interest.
|
|
(12)
|
The Company acquired an additional
5%
interest in the Great Falls Clinic joint venture from the predecessor owner, increasing the Company’s total interest to
81.8%
.
|
97
For
2016
, the Company recorded revenues and net income of
$66.7 million
and
$14.9 million
, respectively, from its
2016
acquisitions.
During
2015
, the Company completed acquisitions of
66
properties located in
22
states for an aggregate purchase price of approximately
$818.6 million
. In addition, the Company completed loan investments totaling
$22.4 million
. Investment activity for the year ending
December 31, 2015
is summarized below:
|
Property (1)
|
Location
|
Acquisition
Date |
Purchase Price
(in thousands) |
|||||||
|
Minnesota Portfolio
|
(2)
|
|
|
|
||||||
|
Edina MOB
|
(5)
|
Edina MN
|
January 22, 2015
|
$
|
14,190
|
|
||||
|
Crystal MOB
|
(5)
|
Crystal, MN
|
January 22, 2015
|
14,782
|
|
|||||
|
Savage MOB
|
(5)
|
Savage, MN
|
January 22, 2015
|
12,800
|
|
|||||
|
Dell Road MOB
|
(5)
|
Chanhassen, MN
|
January 22, 2015
|
6,410
|
|
|||||
|
Vadnais Heights MOB
|
(5)
|
Vadnais Heights, MN
|
January 29, 2015
|
18,422
|
|
|||||
|
Minnetonka MOB
|
(3)
|
(5)
|
Minnetonka, MN
|
February 5, 2015
|
26,000
|
|
||||
|
Jamestown MOB
|
(5)
|
Jamestown, ND
|
February 5, 2015
|
12,819
|
|
|||||
|
Minnesota Eye MOB
|
(5)
|
Minnetonka, MN
|
February 17, 2015
|
10,882
|
|
|||||
|
Columbus MOB
|
(5)
|
Columbus, GA
|
January 23, 2015
|
6,540
|
|
|||||
|
Methodist Sports MOB
|
(4)
|
(6)
|
Greenwood, IN
|
January 28, 2015
|
10,000
|
|
||||
|
Indianapolis South (4 MOBs)
|
(5)
|
Greenwood, IN
|
February 13, 2015
|
17,183
|
|
|||||
|
Baylor Cancer Center
|
(5)
|
Dallas, TX
|
February 27, 2015
|
8,200
|
|
|||||
|
Bridgeport Medical Center
|
(5)
|
Lakewood, WA
|
February 27, 2015
|
13,750
|
|
|||||
|
Renaissance Office Building
|
(5)
|
Milwaukee, WI
|
March 27, 2015
|
6,500
|
|
|||||
|
University of Rochester Strong Memorial Portfolio (5 MOBs)
|
(5)
|
Rochester, NY
|
March 31, 2015
|
41,000
|
|
|||||
|
Avalon Park Florida Hospital MOB
|
(5)
|
Avalon Park, FL
|
March 31, 2015
|
14,600
|
|
|||||
|
Premier Surgery Center of Louisville
|
(5)
|
Louisville, KY
|
April 10, 2015
|
8,000
|
|
|||||
|
Baton Rouge MOB
|
(5)
|
Baton Rouge, LA
|
April 15, 2015
|
10,486
|
|
|||||
|
Healthpark Medical Center
|
(5)
|
Grand Blanc, MI
|
April 30, 2015
|
18,913
|
|
|||||
|
Plaza HCA MOB
|
(5)
|
Jacksonville, FL
|
April 30, 2015
|
19,000
|
|
|||||
|
Northern Ohio Medical Center
|
(4)
|
Sheffield, OH
|
May 28, 2015
|
11,236
|
|
|||||
|
University of Michigan - Northville MOB
|
(5)
|
Livonia, MI
|
May 29, 2015
|
14,750
|
|
|||||
|
Coon Rapids Medical Center MOB
|
(5)
|
Coon Rapids, MN
|
June 1, 2015
|
7,298
|
|
|||||
|
Mezzanine Loan - UF Health MOB
|
(7)
|
Jacksonville, FL
|
June 1, 2015
|
9,000
|
|
|||||
|
Premier Landmark MOB
|
(4)
|
(8)
|
Bloomington, IN
|
June 5, 2015
|
11,308
|
|
||||
|
Palm Beach ASC
|
(5)
|
Palm Beach, FL
|
June 26, 2015
|
14,070
|
|
|||||
|
Brookstone Physician Center MOB
|
(5)
|
Jacksonville, AL
|
June 30, 2015
|
2,800
|
|
|||||
|
Jackson Woman's Clinic MOB
|
(5)
|
Jackson, TN
|
June 30, 2015
|
5,672
|
|
|||||
|
Hillside Medical Center MOB
|
(5)
|
Hanover, PA
|
June 30, 2015
|
11,400
|
|
|||||
|
Randall Road MOB
|
(5)
|
Elgin, IL
|
June 30, 2015
|
13,045
|
|
|||||
|
Randall Road MOB - Unit 140
|
(4)
|
Elgin, IL
|
July 17, 2015
|
1,750
|
|
|||||
|
Medical Specialists of Palm Beach MOB
|
(5)
|
Atlantis, FL
|
July 24, 2015
|
11,051
|
|
|||||
|
OhioHealth - SW Health Center MOB
|
(5)
|
Grove City, OH
|
July 31, 2015
|
11,460
|
|
|||||
|
Trios Health MOB
|
(5)
|
Kennewick, WA
|
July 31, 2015
|
64,000
|
|
|||||
|
Integrated Medical Services (IMS) Portfolio
|
||||||||||
|
IMS - Paradise Valley MOB
|
(5)
|
Phoenix, AZ
|
August 14, 2015
|
31,814
|
|
|||||
|
IMS - Avondale MOB
|
(5)
|
Avondale, AZ
|
August 19, 2015
|
22,144
|
|
|||||
|
IMS - Palm Valley MOB
|
(5)
|
Goodyear, AZ
|
August 19, 2015
|
35,184
|
|
|||||
98
|
Property (1)
|
Location
|
Acquisition
Date |
Purchase Price
(in thousands) |
|||||||
|
IMS - North Mountain MOB
|
(5)
|
Phoenix, AZ
|
August 31, 2015
|
51,740
|
|
|||||
|
Mezzanine Loan - Warm Springs Rehab Hospital
|
(9)
|
Kyle, TX
|
August 21, 2015
|
3,138
|
|
|||||
|
Memorial Hermann Medical Complex (2 MOBs)
|
(5)
|
Katy, TX
|
September 1, 2015
|
40,400
|
|
|||||
|
Construction Loan - Tinseltown
|
(10)
|
Jacksonville, FL
|
September 4, 2015
|
1,005
|
|
|||||
|
New Albany Medical Center MOB
|
(5)
|
(11)
|
New Albany, OH
|
September 9, 2015
|
11,200
|
|
||||
|
Fountain Hills Medical Campus MOB
|
(5)
|
Fountain Hills, AZ
|
September 30, 2015
|
13,250
|
|
|||||
|
Catalyst Portfolio (12 MOBs)
|
(5)
|
AL & FL
|
October 13, 2015
|
23,805
|
|
|||||
|
Mezzanine Loan - Truman Medical Center
|
(12)
|
Kansas City, MO
|
October 16, 2015
|
4,500
|
|
|||||
|
Arete Surgical Center
|
(5)
|
Johnstown, CO
|
October 19, 2015
|
9,100
|
|
|||||
|
Cambridge Professional Center MOB
|
(5)
|
Waldorf, MD
|
October 30, 2015
|
11,550
|
|
|||||
|
Mezzanine Loan - Great Falls Replacement Surgical Hospital
|
(13)
|
Great Falls, MT
|
November 2, 2015
|
4,500
|
|
|||||
|
HonorHealth 44th Street MOB
|
(5)
|
Phoenix, AZ
|
November 13, 2015
|
7,163
|
|
|||||
|
Mercy Medical Center MOB
|
(5)
|
Fenton, MO
|
December 1, 2015
|
9,850
|
|
|||||
|
Nashville MOB
|
(5)
|
(14)
|
Nashville, TN
|
December 17, 2015
|
45,440
|
|
||||
|
Mezzanine Loan - Wilson Surgery Center
|
(15)
|
Wilson, NC
|
December 17, 2015
|
216
|
|
|||||
|
Hillside Medical Center - Suite 100
|
(4)
|
Hanover, PA
|
December 18, 2015
|
4,240
|
|
|||||
|
Randall Road MOB - Suite 170
|
(4)
|
Elgin, IL
|
December 21, 2015
|
408
|
|
|||||
|
KSF Orthopaedic MOB
|
(5)
|
Houston, TX
|
December 22, 2015
|
6,250
|
|
|||||
|
Great Falls Clinic MOB
|
(5)
|
(16)
|
Great Falls, MT
|
December 29, 2015
|
24,244
|
|
||||
|
Randall Road MOB - Suite 320
|
(4)
|
Elgin, IL
|
December 30, 2015
|
500
|
|
|||||
|
|
|
|
$
|
840,958
|
|
|||||
|
(1)
|
“MOB” means medical office building and “ASC” means ambulatory surgical center.
|
|
(2)
|
Through subsidiaries of the Operating Partnership, the Company acquired
seven
medical office facilities located in the Minneapolis-St. Paul Metropolitan area and
one
additional medical office facility located in Jamestown, North Dakota from affiliates of The Davis Group and investors associated with The Davis Group. The Davis Group retained a less than
1%
minority interest in the property holding entities.
|
|
(3)
|
The Operating Partnership partially funded the purchase price of this acquisition by issuing a total of
44,685
Series A Preferred Units valued at approximately
$9.7 million
in the aggregate on the date of issuance.
|
|
(4)
|
The Company accounted for these acquisitions as asset acquisitions and capitalized $
0.4 million
of total acquisition costs to the basis of the properties.
|
|
(5)
|
The Company accounted for these acquisitions as business combinations pursuant to the acquisition method and expensed total acquisition costs of
$14.9 million
.
|
|
(6)
|
The Company partially funded the purchase price of this acquisition by issuing a total of
420,963
OP Units valued at approximately
$7.3 million
in the aggregate on the date of issuance.
|
|
(7)
|
The Company made a
$9.0 million
mezzanine term loan to fund the development of a MOB in Jacksonville, Florida. The loan is collateralized by an equity interest in the medical building development and accrues interest at a rate of
8.4%
per year.
|
|
(8)
|
The Company partially funded the purchase price of this acquisition by issuing a total of
210,820
OP Units valued at approximately
$3.4 million
in the aggregate on the date of issuance.
|
|
(9)
|
The Company made a
$3.1 million
mezzanine term loan to partially fund the borrower’s acquisition of the
54,500
square foot Warm Springs Rehabilitation Hospital in Kyle, Texas. The mezzanine loan is collateralized by an equity interest in the property and accrues interest at a rate of
8.5%
per year. The Company has an option to purchase the property.
|
|
(10)
|
The Company made additional advances on a construction loan to Tinseltown Partners, LLC to fund the renovations and additions of
two
re-purposed buildings in Jacksonville, Florida. The additional advances total
$1.0 million
and accrue at an interest rate of
9.0%
per year.
|
|
(11)
|
The Company partially funded the purchase price of this acquisition by issuing a total of
16,866
OP Units valued at approximately
$0.2 million
in the aggregate on the date of issuance.
|
99
|
(12)
|
The Company made a
$4.5 million
mezzanine term loan to partially fund the owner’s permanent financing of the Truman Medical Center in Kansas City, Missouri. The loan accrues interest at the rate of
8.02%
per year. The Company has rights of first offer and first refusal to purchase the property.
|
|
(13)
|
The Company made a
$4.5 million
mezzanine term loan to partially fund the construction of the Great Falls Hospital in Great Falls, Montana. The loan accrues interest at the rate of
9.0%
per year. The Company has a contract to purchase the property upon completion of construction.
|
|
(14)
|
The Operating Partnership partially funded the purchase price of this acquisition by issuing a total of
91,236
Series A Preferred Units valued at approximately
$19.7 million
in the aggregate on the date of issuance. Holders of the Series A Preferred Units issued in connection with the acquisition of the Nashville MOB are entitled to certain redemption rights under the partnership agreement of the Operating Partnership which allow them to cause the Operating Partnership to redeem the Series A Preferred Units in exchange for cash, or at the Trust’s option, for common shares, pursuant to a formula provided in the partnership agreement. The investors in the Series A Preferred Units have agreed not cause the Operating Partnership to redeem their Series A Preferred Units prior to December 17, 2016.
|
|
(15)
|
The Company made a
$0.2 million
short term mezzanine loan to partially fund the owner’s acquisition of a
9,890
square foot ambulatory surgery center in Wilson, North Carolina. The loan accrues interest at the rate of
8.8%
per year.
|
|
(16)
|
The Company’s
$24.2 million
investment represents the acquisition of an approximate
75%
membership interest in the entity which owns the Great Falls Clinic.
|
For
2015
, the Company recorded revenues and net income of
$41.4 million
and
$10.6 million
, respectively, from its
2015
acquisitions.
The following table summarizes the preliminary purchase price allocations of the assets acquired and the liabilities assumed, which the Company determined using Level 2 and Level 3 inputs (in thousands):
|
December 31, 2016
|
December 31, 2015
|
||||||
|
Land
|
$
|
57,847
|
|
$
|
52,224
|
|
|
|
Building and improvements
|
1,112,746
|
|
643,470
|
|
|||
|
In-place lease intangible
|
58,666
|
|
99,763
|
|
|||
|
Above market in-place lease intangible
|
9,359
|
|
19,337
|
|
|||
|
Below market in-place lease intangible
|
(4,518
|
)
|
(3,738
|
)
|
|||
|
Above market in-place ground lease
|
(644
|
)
|
—
|
|
|||
|
Below market in-place ground lease
|
28,937
|
|
13,941
|
|
|||
|
Lease inducement
|
8,945
|
|
2,478
|
|
|||
|
Contingent consideration
|
(156
|
)
|
(2,718
|
)
|
|||
|
Receivable
|
104
|
|
3,564
|
|
|||
|
Debt assumed
|
—
|
|
(18,690
|
)
|
|||
|
Prepaid expenses
|
2,659
|
|
—
|
|
|||
|
Issuance of Common Shares
|
(20,980
|
)
|
—
|
|
|||
|
Issuance of OP Units
|
(2,869
|
)
|
(10,973
|
)
|
|||
|
Issuance of Series A Preferred Units
|
—
|
|
(29,403
|
)
|
|||
|
Noncontrolling interest
|
(50
|
)
|
(13,970
|
)
|
|||
|
Investment in unconsolidated entity
|
903
|
|
—
|
|
|||
|
Net assets acquired
|
$
|
1,250,949
|
|
$
|
755,285
|
|
|
These preliminary allocations are subject to revision within the measurement period, not to exceed one year from the date of the acquisitions.
100
Unaudited Pro Forma Financial Information
Physicians Realty Trust
The following table illustrates the pro forma consolidated revenue, net income, and earnings per share as if the Company had acquired the
2016
acquisitions detailed above as of January 1,
2015
(in thousands, except share and per share amounts):
|
|
Year Ended December 31,
|
||||||
|
|
2016
|
2015
|
|||||
|
Revenue
|
$
|
303,590
|
|
$
|
258,657
|
|
|
|
Net income
|
47,154
|
|
37,288
|
|
|||
|
Net income available to common shareholders
|
43,372
|
|
34,090
|
|
|||
|
Earnings per share - basic
|
$
|
0.34
|
|
$
|
0.27
|
|
|
|
Earnings per share - diluted
|
$
|
0.34
|
|
$
|
0.27
|
|
|
|
Weighted average number of shares outstanding - basic
|
126,143,114
|
|
126,143,114
|
|
|||
|
Weighted average number of shares outstanding - diluted
|
130,466,893
|
|
130,466,893
|
|
|||
Physicians Realty L.P.
The following table illustrates the pro forma consolidated revenue, net income, and earnings per share as if the Company had acquired the
2016
acquisitions detailed above as of January 1,
2015
(in thousands, except unit and per unit amounts):
|
|
Year Ended December 31,
|
||||||
|
|
2016
|
2015
|
|||||
|
Revenue
|
$
|
303,590
|
|
$
|
258,657
|
|
|
|
Net income
|
47,154
|
|
37,288
|
|
|||
|
Net income available to common unitholders
|
44,580
|
|
35,720
|
|
|||
|
Earnings per unit - basic
|
$
|
0.34
|
|
$
|
0.28
|
|
|
|
Earnings per unit - diluted
|
$
|
0.34
|
|
$
|
0.27
|
|
|
|
Weighted average number of units outstanding - basic
|
129,835,209
|
|
129,835,209
|
|
|||
|
Weighted average number of units outstanding - diluted
|
130,466,893
|
|
130,466,893
|
|
|||
Note 4.
Intangibles
The following is a summary of the carrying amount of intangible assets and liabilities as of December 31,
2016
and
2015
(in thousands):
|
|
December 31, 2016
|
December 31, 2015
|
|||||||||||||||||||||
|
|
Cost
|
Accumulated
Amortization
|
Net
|
Cost
|
Accumulated
Amortization
|
Net
|
|||||||||||||||||
|
Assets
|
|
|
|
|
|
|
|
|
|
|
|
|
|||||||||||
|
In-place leases
|
$
|
222,394
|
|
$
|
(55,605
|
)
|
$
|
166,789
|
|
$
|
163,728
|
|
$
|
(26,702
|
)
|
$
|
137,026
|
|
|||||
|
Above market leases
|
35,478
|
|
(6,909
|
)
|
28,569
|
|
26,787
|
|
(3,174
|
)
|
23,613
|
|
|||||||||||
|
Leasehold interest
|
712
|
|
(124
|
)
|
588
|
|
712
|
|
(64
|
)
|
648
|
|
|||||||||||
|
Below market ground lease
|
42,878
|
|
(539
|
)
|
42,339
|
|
13,941
|
|
(68
|
)
|
13,873
|
|
|||||||||||
|
Total
|
$
|
301,462
|
|
|
$
|
(63,177
|
)
|
|
$
|
238,285
|
|
|
$
|
205,168
|
|
|
$
|
(30,008
|
)
|
|
$
|
175,160
|
|
|
Liability
|
|
|
|
|
|
|
|
|
|
|
|
|
|||||||||||
|
Below market lease
|
$
|
10,297
|
|
$
|
(2,345
|
)
|
$
|
7,952
|
|
$
|
6,068
|
|
$
|
(799
|
)
|
$
|
5,269
|
|
|||||
|
Above market ground lease
|
1,345
|
|
(44
|
)
|
1,301
|
|
701
|
|
(20
|
)
|
681
|
|
|||||||||||
|
Total
|
$
|
11,642
|
|
|
$
|
(2,389
|
)
|
|
$
|
9,253
|
|
|
$
|
6,769
|
|
|
$
|
(819
|
)
|
|
$
|
5,950
|
|
101
The following is a summary of the acquired lease intangible amortization for the years ended
December 31, 2016
,
2015
, and
2014
(in thousands):
|
|
December 31,
|
||||||||||
|
|
2016
|
2015
|
2014
|
||||||||
|
Amortization expense related to in-place leases
|
$
|
28,902
|
|
$
|
15,300
|
|
$
|
4,133
|
|
||
|
Decrease of rental income related to above-market leases
|
4,403
|
|
2,596
|
|
530
|
|
|||||
|
Decrease of rental income related to leasehold interests
|
59
|
|
59
|
|
5
|
|
|||||
|
Increase of rental income related to below-market leases
|
1,835
|
|
643
|
|
156
|
|
|||||
|
Decrease of operating expense related to above market ground leases
|
24
|
|
16
|
|
4
|
|
|||||
|
Increase in operating expense related to below market ground leases
|
471
|
|
68
|
|
—
|
|
|||||
For the twelve months ended
December 31, 2016
, the Company wrote-off in-place lease intangible assets of approximately
$2.3 million
with accumulated amortization of approximately
$1.0 million
, resulting in the recognition of
$1.3 million
in additional amortization expense. In addition, the Company wrote-off above market lease intangible assets of approximately
$0.7 million
with accumulated amortization of approximately
$0.5 million
, and below market lease intangible liabilities of approximately
$0.3 million
with accumulated accretion of approximately
$0.1 million
, for a net recognition of approximately
$17 thousand
gain
in rental income from intangible amortization.
Future aggregate net amortization of the acquired lease intangibles as of
December 31, 2016
, is as follows (in thousands):
|
|
Net Decrease in
Revenue
|
Net Increase in
Expenses
|
|||||
|
2017
|
$
|
(2,311
|
)
|
$
|
30,305
|
|
|
|
2018
|
(2,217
|
)
|
26,169
|
|
|||
|
2019
|
(2,344
|
)
|
21,803
|
|
|||
|
2020
|
(2,434
|
)
|
19,426
|
|
|||
|
2021
|
(2,477
|
)
|
17,999
|
|
|||
|
Thereafter
|
(9,422
|
)
|
92,125
|
|
|||
|
Total
|
$
|
(21,205
|
)
|
|
$
|
207,827
|
|
For the year ended
December 31, 2016
, the weighted average amortization period for asset lease intangibles and liability lease intangibles are
18
years and
12
years, respectively.
Note 5.
Other Assets
Other assets consisted of the following as of
December 31, 2016
and
2015
(in thousands):
|
December 31,
|
|||||||
|
2016
|
2015
|
||||||
|
Straight line rent receivable
|
32,018
|
|
15,584
|
|
|||
|
Notes receivable
|
16,618
|
|
20,620
|
|
|||
|
Interest rate swap
|
13,881
|
|
—
|
|
|||
|
Lease inducements, net
|
13,255
|
|
4,970
|
|
|||
|
Prepaid expenses
|
8,928
|
|
4,181
|
|
|||
|
Escrows
|
4,334
|
|
4,788
|
|
|||
|
Leasing commissions, net
|
1,858
|
|
1,052
|
|
|||
|
Earnest deposits
|
1,500
|
|
343
|
|
|||
|
Other
|
2,795
|
|
1,745
|
|
|||
|
Total
|
$
|
95,187
|
|
$
|
53,283
|
|
|
102
Note 6.
Debt
The following is a summary of debt as of
December 31, 2016
and
2015
(in thousands):
|
|
December 31,
|
|||||||
|
|
2016
|
2015
|
||||||
|
Fixed interest mortgage notes
|
$
|
90,185
|
|
(1)
|
$
|
89,664
|
|
(2)
|
|
Variable interest mortgage note
|
33,009
|
|
(3)
|
4,262
|
|
(4)
|
||
|
Total mortgage debt
|
123,194
|
|
93,926
|
|
||||
|
$850 million unsecured revolving credit facility bearing variable interest of LIBOR plus 1.20%, due September 2020
|
401,000
|
|
395,000
|
|
||||
|
$250 million unsecured term borrowing bearing fixed interest of 2.87%, due June 2023
|
250,000
|
|
(5)
|
—
|
|
|||
|
$150 million senior unsecured notes bearing fixed interest of 4.03% to 4.74%, due January 2023 to 2031
|
150,000
|
|
—
|
|
||||
|
$75 million senior unsecured notes bearing fixed interest of 4.09% to 4.24%, due August 2025 to 2027
|
75,000
|
|
—
|
|
||||
|
Total principal
|
999,194
|
|
488,926
|
|
||||
|
Unamortized deferred financing cost
|
(8,477
|
)
|
(5,985
|
)
|
||||
|
Unamortized fair value adjustment
|
438
|
|
674
|
|
||||
|
Total debt
|
$
|
991,155
|
|
$
|
483,615
|
|
||
|
(1)
|
Fixed interest mortgage notes, bearing interest from
4.71%
to
6.58%
, with a weighted average interest rate of
5.44%
, and due in 2017, 2018, 2019, 2020, 2021, 2022, and 2032 collateralized by
11
properties with a net book value of
$156.7 million
.
|
|
(2)
|
Fixed interest mortgage notes, bearing interest from
4.71%
to
6.58%
, with a weighted average interest rate of
5.40%
, and due in 2016, 2017, 2019, 2020, 2021, and 2022 collateralized by
11
properties with a net book value of
$145.0 million
.
|
|
(3)
|
Variable interest mortgage notes, bearing variable interest of LIBOR plus
2.25%
to
3.25%
, with a weighted average interest rate of
3.68%
and due in 2017 and 2018, collateralized by
four
properties with a net book value of
$45.6 million
.
|
|
(4)
|
Variable interest mortgage note bearing variable interest of LIBOR plus
2.75%
and due in 2017, collateralized by
one
property with a net book value of
$5.9 million
.
|
|
(5)
|
The Trust’s borrowings under the term loan feature of the Credit Agreement bear interest at a rate which is determined by the Trust’s credit rating, currently equal to
LIBOR + 1.80%
. The Trust has entered into a pay-fixed receive-variable interest rate swap, fixing the LIBOR component of this rate at
1.07%
.
|
On June 10, 2016, the Operating Partnership, as borrower, and the Trust entered into an amended and restated Credit Agreement with KeyBank National Association, as administrative agent, KeyBanc Capital Markets Inc., BMO Capital Markets, and Citizens Bank N.A., as joint lead arrangers and co-book runners, BMO Capital Markets and Citizens Bank N.A., as co-syndication agents, and the lenders party thereto (the “Credit Agreement”) which increased the maximum principal amount available under an unsecured revolving credit facility from
$750 million
to
$850 million
. The Credit Agreement contains a
7
-year term loan feature allowing the Operating Partnership to borrow in a single drawing up to
$250 million
, increasing the borrowing capacity to an aggregate
$1.1 billion
.
The Credit Agreement also includes a swingline loan commitment for up to
10%
of the maximum principal amount and provides an accordion feature allowing the Trust to increase borrowing capacity by up to an additional
$500 million
, subject to customary terms and conditions, resulting in a maximum borrowing capacity of
$1.6 billion
.
On July 7, 2016, the Operating Partnership borrowed
$250.0 million
under the
7
-year term loan feature of the Credit Agreement. Borrowings under the term loan feature of the Credit Agreement bear interest on the outstanding principal amount at a rate which is determined by the Trust’s credit rating, currently equal to
LIBOR + 1.80%
. The Trust simultaneously entered into a pay-fixed receive-variable rate swap for the full borrowing amount, fixing the LIBOR component of the borrowing rate to
1.07%
, for an all-in fixed rate of
2.87%
. Both the borrowing and pay-fixed receive-variable swap have a maturity date of
June 10, 2023
.
The Credit Agreement has a maturity date of
September 18, 2020
and includes a
one
year extension option. Borrowings under the Credit Agreement bear interest on the outstanding principal amount at an adjusted LIBOR rate, which is based on the Trust’s investment grade rating under the Credit Agreement. As of
December 31, 2016
, the Trust had an
103
investment grade rating from Moody’s of
Baa3
and as such, borrowings under the revolving credit facility of the Credit Agreement accrued interest on the outstanding principal at a rate of LIBOR plus
1.20%
. The Credit Agreement includes a facility fee equal to
0.25%
per annum, which is also determined by the Trust’s investment grade rating.
The Credit Agreement contains financial covenants that, among other things, require compliance with leverage and coverage ratios and maintenance of minimum tangible net worth, as well as covenants that may limit the Trust’s and the Operating Partnership’s ability to incur additional debt or make distributions. The Trust may, at any time, voluntarily prepay any revolving or swingline loan under the Credit Agreement in whole or in part without premium or penalty. Prepayments of term borrowings require payment of premiums of up to
2.0%
of the amount of prepayment, dependent on the date of such prepayment. As of
December 31, 2016
, the Trust was in compliance with all financial covenants.
The Credit Agreement includes customary representations and warranties by the Trust and the Operating Partnership, and imposes customary covenants on the Operating Partnership and the Trust. The Credit Agreement also contains customary events of default, and if an event of default occurs and continues, the Operating Partnership is subject to certain actions by the administrative agent, including without limitation, the acceleration of repayment of all amounts outstanding under the Credit Agreement.
The Credit Agreement provides for revolving credit and term loans to the Trust and the Operating Partnership. Base Rate Loans, Adjusted LIBOR Rate Loans, and Letters of Credit (each, as defined in the Credit Agreement) will be subject to interest rates, based upon the Trust’s investment grade rating as follows:
|
Credit Rating
|
Margin for Revolving Loans: Adjusted LIBOR Rate Loans
and Letter of Credit Fee
|
Margin for Revolving Loans: Base Rate Loans
|
Margin for Term Loans: Adjusted LIBOR Rate Loans
and Letter of Credit Fee
|
Margin for Term Loans: Base Rate Loans
|
||||||
|
At Least A- or A3
|
LIBOR + 0.85%
|
—
|
%
|
LIBOR + 1.40%
|
0.40
|
%
|
||||
|
At Least BBB+ or BAA1
|
LIBOR + 0.90%
|
—
|
%
|
LIBOR + 1.45%
|
0.45
|
%
|
||||
|
At Least BBB or BAA2
|
LIBOR + 1.00%
|
0.10
|
%
|
LIBOR + 1.55%
|
0.55
|
%
|
||||
|
At Least BBB- or BAA3
|
LIBOR + 1.20%
|
0.20
|
%
|
LIBOR + 1.80%
|
0.80
|
%
|
||||
|
Below BBB- or BAA3
|
LIBOR + 1.55%
|
0.60
|
%
|
LIBOR + 2.25%
|
1.25
|
%
|
||||
As of
December 31, 2016
, there were
$401.0
million of borrowings outstanding under our unsecured revolving credit facility and
$448.9
million available for us to borrow without adding additional properties to the unencumbered borrowing base of assets, as defined by the Credit Agreement. As of
December 31, 2016
the Company had
$250.0 million
of borrowings outstanding under the term loan feature of the Credit Agreement.
On January 7, 2016, the Operating Partnership issued and sold
$150.0 million
aggregate principal amount of senior notes, comprised of (i)
$15.0 million
aggregate principal amount of
4.03%
Senior Notes, Series A, due January 7, 2023, (ii)
$45.0 million
aggregate principal amount of
4.43%
Senior Notes, Series B, due January 7, 2026, (iii)
$45.0 million
aggregate principal amount of
4.57%
Senior Notes, Series C, due January 7, 2028, and (iv)
$45.0 million
aggregate principal amount of
4.74%
Senior Notes, Series D, due January 7, 2031. On August 11, 2016, the note agreement for these notes was amended to make certain changes to its terms, including certain changes to affirmative covenants, negative covenants and definitions contained therein. Interest on each respective series of the January 2016 Senior Notes is payable semi-annually.
On August 11, 2016, the Operating Partnership issued and sold
$75.0 million
aggregate principal amount of senior notes, comprised of (i)
$25.0 million
aggregate principal amount of
4.09%
Senior Notes, Series A, due August 11, 2025, (ii)
$25.0 million
aggregate principal amount of
4.18%
Senior Notes, Series B, due August 11, 2026, and (iii)
$25.0 million
aggregate principal amount of
4.24%
Senior Notes, Series C, due August 11, 2027. Interest on each respective series of the August 2016 Senior Notes is payable semi-annually.
Certain properties have mortgage debt that contains financial covenants. As of
December 31, 2016
, the Trust was in compliance with all mortgage debt financial covenants.
104
Scheduled principal payments due on debt as of
December 31, 2016
, are as follows (in thousands):
|
2017
|
$
|
38,615
|
|
|
2018
|
39,855
|
|
|
|
2019
|
20,162
|
|
|
|
2020
|
406,603
|
|
|
|
2021
|
7,644
|
|
|
|
Thereafter
|
486,315
|
|
|
|
Total Payments
|
$
|
999,194
|
|
As of
December 31, 2016
and
2015
, the Company had total consolidated indebtedness of approximately
$999.2 million
and
$488.9 million
, respectively. The weighted average interest rate on consolidated indebtedness was
3.09%
as of
December 31, 2016
(based on the 30-day LIBOR rate as of
December 31, 2016
, of
0.72%
). The weighted average interest rate on consolidated indebtedness was
2.28%
as of December 31,
2015
(based on the 30-day LIBOR rate as of December 31,
2015
, of
0.36%
).
For the years ended
December 31, 2016
and
2015
, the Company incurred interest expense on its debt of
$21.5
million and
$9.3
million, respectively.
Note 7.
Derivatives
In the normal course of business, a variety of financial instruments are used to manage or hedge interest rate risk. The Company has implemented ASC 815,
Derivatives and Hedging
(ASC 815), which establishes accounting and reporting standards requiring that all derivatives, including certain derivative instruments embedded in other contracts, be recorded as either an asset or a liability measured at their fair value unless they qualify for a normal purchase or normal sales exception.
When specific hedge accounting criteria are not met, ASC 815 requires that changes in a derivative’s fair value be recognized currently in earnings. Changes in the fair market values of the Company’s derivative instruments are recorded in the consolidated statements of income if such derivatives do not qualify for, or the Company does not elect to apply for, hedge accounting. If hedge accounting is applied to a derivative instrument, such changes are reported in accumulated other comprehensive income within the consolidated statement of equity, exclusive of ineffectiveness amounts, which are recognized as adjustments to net income.
To manage interest rate risk for certain of its variable-rate debt, the Company uses interest rate swaps as part of its risk management strategy. These derivatives are designed to mitigate the risk of future interest rate increases by providing a fixed interest rate for a limited, pre-determined period of time. Interest rate swaps designated as cash flow hedges involve the receipt of variable-rate amounts from a counterparty in exchange for the Company making fixed-rate payments over the life of the agreements without exchange of the underlying notional amount. As of
December 31, 2016
, the Company had
five
outstanding interest rate swap contracts that are designated as cash flow hedges of interest rate risk. For presentational purposes, they are shown as one derivative due to the identical nature of their economic terms.
The effective portion of the change in the fair value of derivatives designated and that qualify as cash flow hedges is recorded in accumulated other comprehensive income (“AOCI”) on the consolidated balance sheets and is subsequently reclassified into earnings as interest expense for the period that the hedged forecasted transaction affects earnings. The ineffective portion of the change in fair value of the derivatives is recognized directly in earnings. For the twelve months ended
December 31, 2016
, the Company recognized a
$0.2 million
gain as a result of hedge ineffectiveness. The Company expects hedge ineffectiveness to be insignificant in the next 12 months.
105
The following table summarizes the location and aggregate fair value of the interest rate swaps on the Company’s consolidated balance sheets (in thousands):
|
Total notional amount
|
$
|
250,000
|
|
|
|
Effective fixed interest rate
|
(1)
|
2.87
|
%
|
|
|
Effective date
|
7/7/2016
|
|
||
|
Maturity date
|
6/10/2023
|
|
||
|
Asset balance at December 31, 2016 (included in Other assets)
|
$
|
13,881
|
|
|
|
(1)
|
1.07%
effective swap rate plus
1.80%
spread per Credit Agreement.
|
Note 8.
Accrued Expenses and Other Liabilities
Accrued expenses and other liabilities consisted of the following as of
December 31, 2016
and
2015
(in thousands):
|
December 31,
|
|||||||
|
2016
|
2015
|
||||||
|
Real estate taxes payable
|
$
|
9,300
|
|
$
|
2,349
|
|
|
|
Prepaid rent
|
5,834
|
|
2,778
|
|
|||
|
Embedded derivative
|
5,571
|
|
8,149
|
|
|||
|
Tenant improvement allowance
|
5,315
|
|
1,184
|
|
|||
|
Accrued interest
|
4,905
|
|
22
|
|
|||
|
Security deposits
|
4,506
|
|
4,038
|
|
|||
|
Accrued incentive compensation
|
1,405
|
|
900
|
|
|||
|
Contingent consideration
|
1,392
|
|
2,559
|
|
|||
|
Accrued expenses and other
|
4,059
|
|
2,494
|
|
|||
|
Total
|
$
|
42,287
|
|
$
|
24,473
|
|
|
Note 9.
Stock-based Compensation
The Company follows ASC 718,
Compensation – Stock Compensation
(“ASC 718”), in accounting for its share-based payments. This guidance requires measurement of the cost of employee services received in exchange for stock compensation based on the grant-date fair value of the employee stock awards. This cost is recognized as compensation expense ratably over the employee’s requisite service period. Incremental compensation costs arising from subsequent modifications of awards after the grant date must be recognized when incurred. Share-based payments classified as liability awards are marked to fair value at each reporting period. Any Common Shares issued pursuant to the Company's incentive equity compensation and employee stock purchase plans will result in the Operating Partnership issuing OP Units to the Trust on a one-for-one basis, with the Operating Partnership receiving the net cash proceeds of such issuances.
Certain of the Company’s employee stock awards vest only upon the achievement of performance targets. ASC 718 requires recognition of compensation cost only when achievement of performance conditions is considered probable. Consequently, the Company’s determination of the amount of stock compensation expense requires a significant level of judgment in estimating the probability of achievement of these performance targets. Additionally, the Company must make estimates regarding employee forfeitures in determining compensation expense. Subsequent changes in actual experience are monitored and estimates are updated as information is available.
In connection with the IPO, the Trust adopted the 2013 Equity Incentive Plan (“2013 Plan”), which made available
600,000
common shares to be administered by the Compensation and Nominating Governance Committee of the Board of Trustees. On August 7, 2014, at the Annual Meeting of Shareholders of Physicians Realty Trust, the Trust’s shareholders approved an amendment to the 2013 Plan to increase the number of common shares authorized for issuance under the 2013 Plan by
1,850,000
common shares, for a total of
2,450,000
common shares authorized for issuance.
106
Restricted Common Shares:
Restricted common shares granted under the 2013 Plan are eligible for dividends as well as the right to vote. During 2014, a total of
152,987
restricted common shares with a total value of
$2.1 million
were granted to Trust employees and the Board of Trustees with vesting periods ranging from
one
to
three
years. During 2015, a total of
162,522
restricted common shares with a total value of
$2.6 million
were granted to Company employees with vesting periods ranging from
one
to
three
years. During 2016, the Trust granted a total of
155,306
restricted common shares with a total value of
$2.8 million
to the Company’s officers and certain of its employees, which have a
one
-year vesting period for officer award-recipients and a
three
-year vesting period for employee award-recipients.
The following is summary of the status of the Trust’s non-vested restricted common shares during
2016
,
2015
, and
2014
:
|
|
Common Shares
|
Weighted
Average Grant
Date Fair Value
|
||||
|
Non-vested at December 31, 2013
|
250,000
|
|
$
|
11.50
|
|
|
|
Granted
|
152,987
|
|
13.79
|
|
||
|
Vested
|
(83,333
|
)
|
11.50
|
|
||
|
Non-vested at December 31, 2014
|
319,654
|
|
12.60
|
|
||
|
Granted
|
162,522
|
|
15.95
|
|
||
|
Vested
|
(170,337
|
)
|
12.93
|
|
||
|
Non-vested at December 31, 2015
|
311,839
|
|
14.17
|
|
||
|
Granted
|
155,306
|
|
17.96
|
|
||
|
Vested
|
(170,034
|
)
|
14.16
|
|
||
|
Forfeited
|
(326
|
)
|
15.36
|
|
||
|
Non-vested at December 31, 2016
|
296,785
|
|
$
|
16.16
|
|
|
For all service awards, the Company records compensation expense for the entire award on a straight-line basis over the requisite service period. For the years ended
December 31, 2016
,
2015
, and
2014
the Company recognized non-cash share compensation of
$3.6 million
,
$2.9 million
, and
$2.2 million
, respectively. Unrecognized compensation expense at
December 31, 2016
,
2015
, and
2014
was
$1.2 million
,
$2.1 million
, and
$2.4 million
, respectively. The Company’s compensation expense recorded in connection with grants of restricted stock reflects an initial estimated cumulative forfeiture rate of
0%
over the requisite service period of the awards. That estimate will be revised if subsequent information indicates that the actual number of awards expected to vest is likely to differ from previous estimates.
Restricted Share Units:
In March
2016
and March
2015
, under the Trust’s 2013 Plan, the Trust granted (i) restricted share units at a target level of
104,553
and
75,250
, respectively, to the Trust’s officers, which are subject to certain performance and market conditions and a
three
year service period and (ii)
36,784
and
40,957
restricted share units, respectively, to the members of the Board of Trustees, which are subject to a
two
year vesting period. In March
2014
, under the Trust’s 2013 Plan, the Trust granted restricted share units at a target level of
55,680
to its officers, which are subject to certain performance and market conditions and a
three
-year service period. Each restricted share unit contains
one
dividend equivalent. The recipient will accrue dividend equivalents on awarded share units equal to the cash dividend that would have been paid on the awarded share unit had the awarded share unit been an issued and outstanding common share on the record date for the dividend.
107
Approximately
80%
of the restricted share units issued to officers in
2016
,
2015
, and
2014
vest based on certain market conditions. The market conditions were valued with the assistance of independent valuation specialists. The Company utilized a Monte Carlo simulation to calculate the weighted average grant date fair values in
2016
,
2015
, and
2014
of
$28.50
,
$20.06
, and
$19.25
per unit, respectively, using the following assumptions:
|
2016
|
2015
|
2014
|
|||||||||
|
Volatility
|
20.3
|
%
|
20.7
|
%
|
18.8% - 34.2%
|
|
|||||
|
Dividend assumption
|
reinvested
|
|
reinvested
|
|
reinvested
|
|
|||||
|
Expected term in years
|
2.8 years
|
|
2.8 years
|
|
2.8 years
|
|
|||||
|
Risk-free rate
|
1.07
|
%
|
1.14
|
%
|
0.65
|
%
|
|||||
|
Stock price (per share)
|
$
|
17.67
|
|
$
|
15.87
|
|
$
|
13.47
|
|
||
The remaining
20%
of the restricted share units issued to officers in
2016
and
2015
vest based upon certain performance conditions. With respect to the performance conditions of the March
2016
grant, the grant date fair value of
$17.67
per unit was based on the share price at the date of grant. The combined weighted average grant date fair value of the March
2016
restricted share units issued to officers is
$26.33
per unit. With respect to the performance conditions of the March
2015
grant, the grant date fair value of
$15.87
per unit was based on the share price at the date of grant. The combined weighted average grant date fair value of the March
2015
restricted share units issued to officers is
$19.22
per unit. With respect to the performance conditions of the March
2014
grant, the grant date fair value of
$13.47
per unit was based on the share price at the date of grant. The combined weighted average grant date fair value of the March
2014
restricted share units issued to officers is
$16.94
per unit.
The following is a summary of the activity in the Trust’s restricted share units during
2016
,
2015
, and
2014
:
|
Executive Awards
|
Trustee Awards
|
||||||||||||
|
|
Restricted Share
Units
|
Weighted
Average Grant
Date Fair Value
|
Restricted Share
Units |
Weighted
Average Grant Date Fair Value |
|||||||||
|
Non-vested at December 31, 2013
|
—
|
|
$
|
—
|
|
—
|
|
$
|
—
|
|
|||
|
Granted
|
55,680
|
|
16.94
|
|
—
|
|
—
|
|
|||||
|
Non-vested at December 31, 2014
|
55,680
|
|
16.94
|
|
—
|
|
—
|
|
|||||
|
Granted
|
75,250
|
|
19.22
|
|
40,957
|
|
15.87
|
|
|||||
|
Non-vested at December 31, 2015
|
130,930
|
|
18.48
|
|
40,957
|
|
15.87
|
|
|||||
|
Granted
|
104,553
|
|
26.33
|
|
36,784
|
|
17.67
|
|
|||||
|
Vested
|
—
|
|
—
|
|
(20,481
|
)
|
15.87
|
|
|||||
|
Non-vested at December 31, 2016
|
235,483
|
|
|
$
|
21.84
|
|
57,260
|
|
$
|
17.03
|
|
||
The Company recognized
$2.1 million
,
$0.9 million
, and
$0.3 million
of non-cash share unit compensation expense for the years ended
December 31, 2016
,
2015
, and
2014
, respectively. Unrecognized compensation expense at
December 31, 2016
,
2015
, and
2014
was
$2.8
million,
$1.6 million
, and
$0.7 million
, respectively.
Note 10.
Fair Value Measurements
ASC Topic 820,
Fair Value Measurement
(“ASC 820”), requires certain assets and liabilities be reported and/or disclosed at fair value in the financial statements and provides a framework for establishing that fair value. The framework for determining fair value is based on a hierarchy that prioritizes the valuation techniques and inputs used to measure fair value.
In general, fair values determined by Level 1 inputs use quoted prices in active markets for identical assets or liabilities that the Company has the ability to access. Fair values determined by Level 2 inputs use other inputs that are observable, either directly or indirectly. These Level 2 inputs include quoted prices for similar assets and liabilities in active markets, and other inputs such as interest rates and yield curves that are observable at commonly quoted intervals.
Level 3 inputs are unobservable inputs, including inputs that are available in situations where there is little, if any, market activity for the related asset. These Level 3 fair value measurements are based primarily on management’s own estimates using pricing models, discounted cash flow methodologies, or similar techniques taking into account the characteristics of the asset or liability. In instances where inputs used to measure fair value fall into different levels of the fair
108
value hierarchy, fair value measurements in their entirety are categorized based on the lowest level input that is significant to the valuation. The assessment of the significance of particular inputs to these fair value measurements requires judgment and considers factors specific to each asset or liability.
The Company has
six
derivative instruments at
December 31, 2016
, consisting of
one
embedded derivative as detailed in the Redeemable Noncontrolling Interests - Operating Partnership and Partially Owned Properties section of Note 2 (Summary of Significant Accounting Policies) and
five
interest rate swaps. For presentational purposes, the Company’s interest rate swaps are shown as a single derivative due to the identical nature of their economic terms, as detailed in the Derivative Instruments section of Note 2 (Summary of Significant Accounting Policies) and
Note 7 (Derivatives)
.
Neither the embedded derivative nor the interest rate swaps are traded on an exchange. The Company’s derivative assets and liabilities are recorded at fair value based on a variety of observable inputs including contractual terms, interest rate curves, yield curves, measure of volatility, and correlations of such inputs. The Company measures its derivatives at fair value on a recurring basis. The fair values are based on Level 2 inputs described above. The Company considers its own credit risk, as well as the credit risk of its counterparties, when evaluating the fair value of its derivatives.
The Company also has assets that under certain conditions are subject to measurement at fair value on a non-recurring basis. This generally includes assets subject to impairment. There were
no
such assets measured at fair value as of
December 31, 2016
.
The carrying amounts of cash and cash equivalents, tenant receivables, payables, and accrued interest are reasonable estimates of fair value because of the short term maturities of these instruments. Fair values for real estate loans receivable and mortgage debt are estimated based on rates currently prevailing for similar instruments of similar maturities and are based primarily on Level 2 inputs.
The following table presents the fair value of the Company’s financial instruments (in thousands):
|
December 31,
|
|||||||||||||||
|
2016
|
2015
|
||||||||||||||
|
|
Carrying
Amount
|
Fair
Value
|
Carrying
Amount
|
Fair
Value
|
|||||||||||
|
Assets:
|
|||||||||||||||
|
Real estate loans receivable
|
$
|
39,154
|
|
$
|
39,154
|
|
$
|
39,349
|
|
$
|
39,349
|
|
|||
|
Notes receivable
|
$
|
16,618
|
|
$
|
16,618
|
|
$
|
20,620
|
|
$
|
20,620
|
|
|||
|
Derivative assets
|
$
|
13,881
|
|
$
|
13,881
|
|
$
|
—
|
|
$
|
—
|
|
|||
|
Liabilities:
|
|||||||||||||||
|
Credit facility
|
$
|
(651,000
|
)
|
$
|
(651,000
|
)
|
$
|
(395,000
|
)
|
$
|
(395,000
|
)
|
|||
|
Notes payable
|
$
|
(225,000
|
)
|
$
|
(214,584
|
)
|
$
|
—
|
|
$
|
—
|
|
|||
|
Mortgage debt
|
$
|
(123,632
|
)
|
$
|
(125,420
|
)
|
$
|
(94,600
|
)
|
$
|
(95,275
|
)
|
|||
|
Derivative liabilities
|
$
|
(5,571
|
)
|
$
|
(5,571
|
)
|
$
|
(8,216
|
)
|
$
|
(8,216
|
)
|
|||
Note 11.
Tenant Operating Leases
The Company is lessor of medical office buildings and other healthcare facilities. Leases have expirations from
2017
through
2045
. As of
December 31, 2016
, the future minimum rental payments on non-cancelable leases, exclusive of expense recoveries, were as follows (in thousands):
|
2017
|
$
|
217,877
|
|
|
2018
|
213,420
|
|
|
|
2019
|
208,518
|
|
|
|
2020
|
203,403
|
|
|
|
2021
|
197,097
|
|
|
|
Thereafter
|
1,172,669
|
|
|
|
Total
|
$
|
2,212,984
|
|
109
Note 12.
Rent Expense
The Company leases the rights to parking structures at
3
of its properties, the air space above
1
property, and the land upon which
58
of its properties are located from third party land owners pursuant to separate leases. In addition, the Company leases
3
individual office spaces. The leases require fixed rental payments and may also include escalation clauses and renewal options. These leases have terms of up to
99
years remaining, excluding extension options. As of
December 31, 2016
, the future minimum lease obligations under non-cancelable parking, air, ground, and office leases were as follows (in thousands):
|
2017
|
$
|
2,408
|
|
|
2018
|
2,456
|
|
|
|
2019
|
2,475
|
|
|
|
2020
|
2,478
|
|
|
|
2021
|
2,536
|
|
|
|
Thereafter
|
67,233
|
|
|
|
Total
|
$
|
79,586
|
|
Rent expense for the parking, air, and ground leases of
$1.9
million,
$1.3
million and
$0.9
million for the years ended
December 31, 2016
,
2015
, and
2014
, respectively, are reported in operating expenses in the consolidated statements of operations. Rent expense for office leases was insignificant for the years ended
December 31, 2016
,
2015
, and
2014
, and is reported within general and administrative expenses in the consolidated statements of operations.
Note 13.
Credit Concentration
The Company uses annualized base rent (“ABR”) as its credit concentration metric.
A
nnualized base rent is calculated by multiplying contractual base rent for the month ended
December 31, 2016
by 12, excluding the impact of concessions and straight-line rent. The following table summarizes certain information about the Company’s top five tenant credit concentrations as of
December 31, 2016
(in thousands):
|
Tenant
|
Total ABR
|
Percent of ABR
|
|||||
|
CHI - KentuckyOne Health
|
$
|
12,805
|
|
5.8
|
%
|
||
|
CHI - Nebraska
|
9,275
|
|
4.2
|
%
|
|||
|
CHI - Franciscan (Seattle-Tacoma)
|
5,437
|
|
2.5
|
%
|
|||
|
CHI - St. Alexius (North Dakota)
|
5,278
|
|
2.4
|
%
|
|||
|
Great Falls Hospital
|
5,151
|
|
2.4
|
%
|
|||
|
Remaining portfolio
|
181,183
|
|
82.7
|
%
|
|||
|
Total
|
219,129
|
|
100.0
|
%
|
|||
Annualized base rent collected from the Company’s top five tenant relationships comprises
17.3%
of its total annualized base rent for the period ending
December 31, 2016
. Total annualized base rent from CHI affiliated tenants totals
17.4%
, including the affiliates disclosed above. Consolidated financial statements of CHI, the parent of the subsidiaries and
affiliates of the entities party to master lease agreements, are publicly available on the Catholic Health Initiatives website
(http://www.catholichealthinitiatives.org/). Information included on the CHI website is not incorporated by reference within
this Annual Report on Form 10-K.
110
The following table summarizes certain information about the Company’s top five geographic concentrations as of
December 31, 2016
(in thousands):
|
State
|
Total ABR
|
Percent of ABR
|
|||||
|
Texas
|
$
|
26,603
|
|
12.1
|
%
|
||
|
Kentucky
|
15,459
|
|
7.0
|
%
|
|||
|
Arizona
|
14,161
|
|
6.5
|
%
|
|||
|
Indiana
|
12,848
|
|
5.9
|
%
|
|||
|
Ohio
|
12,822
|
|
5.9
|
%
|
|||
|
Other
|
137,236
|
|
62.6
|
%
|
|||
|
Total
|
219,129
|
|
100.0
|
%
|
|||
Note 14.
Earnings Per Share and Earnings Per Unit
The following table shows the amounts used in computing the Trust’s basic and diluted earnings per share (in thousands, except share and per share data):
|
|
Year Ended December 31,
|
||||||||||
|
|
2016
|
2015
|
2014
|
||||||||
|
Numerator for earnings per share - basic:
|
|||||||||||
|
Net income (loss)
|
$
|
31,522
|
|
$
|
12,741
|
|
$
|
(4,418
|
)
|
||
|
Net (income) loss attributable to noncontrolling interests:
|
|||||||||||
|
Operating Partnership
|
(825
|
)
|
(576
|
)
|
695
|
|
|||||
|
Partially owned properties
|
(716
|
)
|
(377
|
)
|
(314
|
)
|
|||||
|
Preferred distributions
|
(1,857
|
)
|
(1,189
|
)
|
—
|
|
|||||
|
Numerator for earnings per share - basic:
|
$
|
28,124
|
|
$
|
10,599
|
|
$
|
(4,037
|
)
|
||
|
Numerator for earnings per share - diluted:
|
|||||||||||
|
Numerator for earnings per share - basic:
|
28,124
|
|
10,599
|
|
(4,037
|
)
|
|||||
|
Operating Partnership net income
|
825
|
|
576
|
|
—
|
|
|||||
|
Numerator for earnings per share - diluted
|
$
|
28,949
|
|
$
|
11,175
|
|
$
|
(4,037
|
)
|
||
|
Denominator for earnings per share - basic and diluted:
|
|||||||||||
|
Weighted average number of shares outstanding - basic
|
126,143,114
|
|
72,750,724
|
|
33,063,093
|
|
|||||
|
Effect of dilutive securities:
|
|
|
|||||||||
|
Noncontrolling interest - Operating Partnership units
|
3,692,095
|
|
3,708,494
|
|
—
|
|
|||||
|
Restricted shares
|
205,036
|
|
190,619
|
|
—
|
|
|||||
|
Restricted share units
|
426,648
|
|
142,236
|
|
—
|
|
|||||
|
Denominator for earnings per share - diluted
|
130,466,893
|
|
76,792,073
|
|
33,063,093
|
|
|||||
|
Earnings per share - basic
|
$
|
0.22
|
|
$
|
0.15
|
|
$
|
(0.12
|
)
|
||
|
Earnings per share - diluted
|
$
|
0.22
|
|
$
|
0.15
|
|
$
|
(0.12
|
)
|
||
111
The following table shows the amounts used in computing the Operating Partnership’s basic and diluted earnings per unit (in thousands, except unit and per unit data):
|
|
Year Ended December 31,
|
||||||||||
|
|
2016
|
2015
|
2014
|
||||||||
|
Numerator for earnings per unit - basic and diluted:
|
|||||||||||
|
Net income (loss)
|
31,522
|
|
12,741
|
|
(4,418
|
)
|
|||||
|
Net (income) loss attributable to noncontrolling interests -
partially owned properties
|
(716
|
)
|
(377
|
)
|
(314
|
)
|
|||||
|
Preferred distributions
|
(1,857
|
)
|
(1,189
|
)
|
—
|
|
|||||
|
Numerator for earnings per unit - basic and diluted
|
$
|
28,949
|
|
$
|
11,175
|
|
$
|
(4,732
|
)
|
||
|
Denominator for earnings per unit - basic and diluted:
|
|||||||||||
|
Weighted average number of units outstanding - basic
|
129,835,209
|
|
76,459,218
|
|
36,881,712
|
|
|||||
|
Effect of dilutive securities:
|
|
|
|||||||||
|
Restricted shares
|
205,036
|
|
190,619
|
|
—
|
|
|||||
|
Restricted share units
|
426,648
|
|
142,236
|
|
—
|
|
|||||
|
Denominator for earnings per unit - diluted
|
130,466,893
|
|
76,792,073
|
|
36,881,712
|
|
|||||
|
Earnings per unit - basic
|
$
|
0.22
|
|
$
|
0.15
|
|
$
|
(0.12
|
)
|
||
|
Earnings per unit - diluted
|
$
|
0.22
|
|
$
|
0.15
|
|
$
|
(0.12
|
)
|
||
Note 15.
Subsequent Events
Since January 1,
2017
, the Trust, through subsidiaries of its Operating Partnership, has completed acquisitions of
4
healthcare properties for an aggregate purchase price of
$109.5 million
containing an aggregate of
238,312
net leasable square feet. In addition, the Operating Partnership funded an aggregate
$2.3 million
of loans through
2
separate transactions, resulting in aggregate investment activity of
$111.8 million
. Property acquisitions are summarized below:
|
Property(1)
|
|
Location
|
|
Acquisition
Date |
|
Investment
(in thousands) |
||
|
Orthopedic Associates MOB
|
|
Flower Mound, TX
|
|
January 5, 2017
|
|
$
|
18,800
|
|
|
Medical Arts Center at Hartford
|
|
Plainville, CT
|
|
January 11, 2017
|
|
30,300
|
|
|
|
CareMount Portfolio (2 MOBs)
|
|
Lake Katrine / Rhinebeck, NY
|
|
February 14, 2017
|
|
60,400
|
|
|
|
|
|
|
|
|
|
$
|
109,500
|
|
|
(1)
|
“MOB” means medical office building.
|
On January 3, 2017, the Operating Partnership entered into a purchase and sale agreement to sell
4
properties in Georgia, representing an aggregate
80,292
square feet, for
$18.2 million
.
On January 12, 2017,
91,236
Series A Preferred Units issued in conjunction with the Nashville MOB acquisition were redeemed for a total value of
$20.0 million
.
On January 31, 2017, the Operating Partnership redeemed the minority interest in a joint venture between the Operating Partnership and Medical Center of New Albany I, LLC, an Ohio limited liability company. As consideration, the Operating Partnership paid approximately
$2.1 million
in cash and issued
38,641
OP Units, representing an aggregate
$2.8 million
.
112
Note 16.
Quarterly Data
Physicians Realty Trust
The following unaudited quarterly data has been prepared on the basis of a December 31 year-end. Amounts are in thousands, except for common share and per share amounts.
|
|
Quarter Ended
|
|||||||||||||||
|
2016
|
March 31
|
June 30
|
September 30
|
December 31
|
||||||||||||
|
Total revenues
|
$
|
44,134
|
|
$
|
53,216
|
|
$
|
70,010
|
|
$
|
73,674
|
|
||||
|
Operating income
|
5,392
|
|
7,158
|
|
10,267
|
|
8,590
|
|
||||||||
|
Net income
|
5,424
|
|
7,184
|
|
10,294
|
|
8,620
|
|
||||||||
|
Net income attributable to common shareholders
|
4,386
|
|
6,486
|
|
9,427
|
|
7,825
|
|
||||||||
|
Earnings per share – basic:
|
||||||||||||||||
|
Net income available to common shareholders
|
$
|
0.04
|
|
$
|
0.05
|
|
$
|
0.07
|
|
$
|
0.06
|
|
||||
|
Weighted average number of shares outstanding
|
102,704,008
|
|
131,481,329
|
|
134,608,396
|
|
135,581,976
|
|
||||||||
|
Earnings per share – diluted:
|
||||||||||||||||
|
Net income available to common shareholders
|
$
|
0.04
|
|
$
|
0.05
|
|
$
|
0.07
|
|
$
|
0.06
|
|
||||
|
Weighted average number of shares outstanding
|
107,148,380
|
|
135,944,722
|
|
138,880,787
|
|
139,602,349
|
|
||||||||
As a result of the acquisition activity and equity offerings throughout
2016
and
2015
, the quarterly periods are not comparable quarter over quarter.
|
|
Quarter Ended
|
|||||||||||||||
|
2015
|
March 31
|
June 30
|
September 30
|
December 31
|
||||||||||||
|
Total revenues
|
$
|
24,484
|
|
$
|
29,683
|
|
$
|
34,870
|
|
$
|
40,404
|
|
||||
|
Operating (loss) income
|
(459
|
)
|
3,271
|
|
3,812
|
|
5,883
|
|
||||||||
|
Net (loss) income
|
(448
|
)
|
3,297
|
|
3,983
|
|
5,909
|
|
||||||||
|
Net (loss) income available to common shareholders
|
(522
|
)
|
2,571
|
|
3,404
|
|
5,146
|
|
||||||||
|
Earnings per share - basic:
|
|
|
|
|
|
|
|
|
||||||||
|
Net (loss) income available to common shareholders
|
$
|
(0.01
|
)
|
$
|
0.04
|
|
$
|
0.05
|
|
$
|
0.06
|
|
||||
|
Weighted average number of shares outstanding
|
65,649,478
|
|
70,376,959
|
|
71,034,747
|
|
83,761,536
|
|
||||||||
|
Earnings per share - diluted:
|
|
|
|
|
|
|
|
|
||||||||
|
Net (loss) income available to common shareholders
|
$
|
(0.01
|
)
|
$
|
0.04
|
|
$
|
0.05
|
|
$
|
0.06
|
|
||||
|
Weighted average number of shares outstanding
|
65,649,478
|
|
74,267,284
|
|
75,104,821
|
|
87,911,097
|
|
||||||||
113
Physicians Realty L.P.
The following unaudited quarterly data has been prepared on the basis of a December 31 year-end. Amounts are in thousands, except for common unit and per unit amounts.
|
|
Quarter Ended
|
|||||||||||||||
|
2016
|
March 31
|
June 30
|
September 30
|
December 31
|
||||||||||||
|
Total revenues
|
$
|
44,134
|
|
$
|
53,216
|
|
$
|
70,010
|
|
$
|
73,674
|
|
||||
|
Operating income
|
5,392
|
|
7,158
|
|
10,267
|
|
8,590
|
|
||||||||
|
Net income
|
5,424
|
|
7,184
|
|
10,294
|
|
8,620
|
|
||||||||
|
Net income attributable to common unitholders
|
4,559
|
|
6,687
|
|
9,682
|
|
8,021
|
|
||||||||
|
Earnings per unit – basic:
|
||||||||||||||||
|
Net income available to common unitholders
|
$
|
0.04
|
|
$
|
0.05
|
|
$
|
0.07
|
|
$
|
0.06
|
|
||||
|
Weighted average number of units outstanding
|
106,550,467
|
|
135,351,672
|
|
138,227,384
|
|
139,018,183
|
|
||||||||
|
Earnings per unit – diluted:
|
||||||||||||||||
|
Net income available to common unitholders
|
$
|
0.04
|
|
$
|
0.05
|
|
$
|
0.07
|
|
$
|
0.06
|
|
||||
|
Weighted average number of units outstanding
|
107,148,380
|
|
135,944,722
|
|
138,880,787
|
|
139,602,249
|
|
||||||||
As a result of the acquisition activity and equity offerings throughout
2016
and
2015
, the quarterly periods are not comparable quarter over quarter.
|
|
Quarter Ended
|
|||||||||||||||
|
2015
|
March 31
|
June 30
|
September 30
|
December 31
|
||||||||||||
|
Total revenues
|
$
|
24,484
|
|
$
|
29,683
|
|
$
|
34,870
|
|
$
|
40,404
|
|
||||
|
Operating income
|
(459
|
)
|
3,271
|
|
3,812
|
|
5,883
|
|
||||||||
|
Net income
|
(448
|
)
|
3,297
|
|
3,983
|
|
5,909
|
|
||||||||
|
Net income attributable to common unitholders
|
(546
|
)
|
2,728
|
|
3,604
|
|
5,389
|
|
||||||||
|
Earnings per unit – basic:
|
||||||||||||||||
|
Net income available to common unitholders
|
$
|
(0.01
|
)
|
$
|
0.04
|
|
$
|
0.05
|
|
$
|
0.06
|
|
||||
|
Weighted average number of units outstanding
|
69,146,712
|
|
74,075,323
|
|
74,864,677
|
|
87,565,282
|
|
||||||||
|
Earnings per unit – diluted:
|
|
|
|
|
|
|
|
|
||||||||
|
Net income available to common unitholders
|
$
|
(0.01
|
)
|
$
|
0.04
|
|
$
|
0.05
|
|
$
|
0.06
|
|
||||
|
Weighted average number of units outstanding
|
69,146,712
|
|
74,267,284
|
|
75,104,821
|
|
87,911,097
|
|
||||||||
As further described in Part I, “Explanatory Note,” to this report, in lieu of filing Quarterly Reports on Form 10-Q for the quarterly periods in fiscal 2016 and fiscal 2015, quarterly financial data for those periods is included in this report in the tables below. This data should be read in conjunction with the Operating Partnership’s audited consolidated financial statements and notes thereto included in this report and the Trust’s Quarterly Reports on Form 10-Q for the quarterly periods in fiscal 2016 and fiscal 2015.
114
Physicians Realty L.P.
Consolidated Balance Sheets
(In thousands)
|
September 30,
2016 |
December 31,
2015 |
||||||
|
|
(unaudited)
|
|
|||||
|
ASSETS
|
|
|
|
|
|||
|
Investment properties:
|
|
|
|
|
|||
|
Land and improvements
|
$
|
172,685
|
|
$
|
130,788
|
|
|
|
Building and improvements
|
2,220,448
|
|
1,284,863
|
|
|||
|
Tenant improvements
|
12,627
|
|
9,243
|
|
|||
|
Acquired lease intangibles
|
282,798
|
|
205,168
|
|
|||
|
|
2,688,558
|
|
|
1,630,062
|
|
||
|
Accumulated depreciation
|
(153,815
|
)
|
(91,250
|
)
|
|||
|
Net real estate property
|
2,534,743
|
|
|
1,538,812
|
|
||
|
Real estate loans receivable
|
43,817
|
|
39,349
|
|
|||
|
Investment in unconsolidated entity
|
1,326
|
|
1,322
|
|
|||
|
Net real estate investments
|
2,579,886
|
|
|
1,579,483
|
|
||
|
Cash and cash equivalents
|
8,396
|
|
3,143
|
|
|||
|
Tenant receivables, net
|
9,551
|
|
2,977
|
|
|||
|
Other assets
|
72,814
|
|
53,283
|
|
|||
|
Total assets
|
$
|
2,670,647
|
|
|
$
|
1,638,886
|
|
|
LIABILITIES AND CAPITAL
|
|
|
|
|
|||
|
Liabilities:
|
|
|
|
|
|||
|
Credit facility
|
$
|
448,321
|
|
$
|
389,375
|
|
|
|
Notes payable
|
224,339
|
|
—
|
|
|||
|
Mortgage debt
|
113,736
|
|
94,240
|
|
|||
|
Accounts payable
|
2,222
|
|
644
|
|
|||
|
Dividends and distributions payable
|
31,755
|
|
20,783
|
|
|||
|
Accrued expenses and other liabilities
|
46,574
|
|
24,473
|
|
|||
|
Acquired lease intangibles, net
|
9,399
|
|
5,950
|
|
|||
|
Total liabilities
|
876,346
|
|
|
535,465
|
|
||
|
Redeemable noncontrolling interest - Series A Preferred Units and partially owned properties
|
25,891
|
|
26,960
|
|
|||
|
Capital:
|
|
|
|
|
|||
|
Partners’ capital:
|
|||||||
|
General partner’s capital, 134,620,300 and 86,864,063 units issued and outstanding as of September 31, 2016 and December 31, 2015, respectively
|
1,720,867
|
|
1,021,132
|
|
|||
|
Limited partners’ capital, 3,618,988 and 3,879,115 units issued and outstanding as of September 31, 2016 and December 31, 2015, respectively
|
46,138
|
|
45,451
|
|
|||
|
Accumulated other comprehensive income
|
652
|
|
—
|
|
|||
|
Total partners’ capital
|
1,767,657
|
|
|
1,066,583
|
|
||
|
Noncontrolling interests - partially owned properties
|
753
|
|
9,878
|
|
|||
|
Total capital
|
1,768,410
|
|
|
1,076,461
|
|
||
|
Total liabilities and capital
|
$
|
2,670,647
|
|
|
$
|
1,638,886
|
|
The accompanying notes are an integral part of these consolidated financial statements.
115
Physicians Realty L.P.
Consolidated Statements of Income
(In thousands, except unit and per unit data) (Unaudited)
|
Three Months Ended
September 30, |
Nine Months Ended
September 30, |
||||||||||||||
|
|
2016
|
2015
|
2016
|
2015
|
|||||||||||
|
Revenues:
|
|
|
|
|
|
|
|
|
|||||||
|
Rental revenues
|
$
|
53,327
|
|
$
|
28,145
|
|
$
|
130,378
|
|
$
|
72,111
|
|
|||
|
Expense recoveries
|
14,361
|
|
5,821
|
|
31,816
|
|
14,265
|
|
|||||||
|
Interest income on real estate loans and other
|
2,322
|
|
904
|
|
5,166
|
|
2,661
|
|
|||||||
|
Total revenues
|
70,010
|
|
|
34,870
|
|
|
167,360
|
|
|
89,037
|
|
||||
|
Expenses:
|
|
|
|
|
|
|
|
|
|||||||
|
Interest expense
|
7,300
|
|
3,341
|
|
15,776
|
|
7,244
|
|
|||||||
|
General and administrative
|
4,917
|
|
4,018
|
|
13,964
|
|
11,359
|
|
|||||||
|
Operating expenses
|
19,159
|
|
7,966
|
|
43,994
|
|
20,979
|
|
|||||||
|
Depreciation and amortization
|
23,969
|
|
12,476
|
|
59,778
|
|
31,067
|
|
|||||||
|
Acquisition expenses
|
4,398
|
|
3,257
|
|
11,031
|
|
11,764
|
|
|||||||
|
Total expenses
|
59,743
|
|
|
31,058
|
|
|
144,543
|
|
|
82,413
|
|
||||
|
Income before equity in income of unconsolidated entity and gain on sale of investment property:
|
10,267
|
|
3,812
|
|
22,817
|
|
6,624
|
|
|||||||
|
Equity in income of unconsolidated entity
|
27
|
|
26
|
|
85
|
|
78
|
|
|||||||
|
Gain on sale of investment property
|
—
|
|
145
|
|
—
|
|
130
|
|
|||||||
|
Net income
|
10,294
|
|
|
3,983
|
|
|
22,902
|
|
|
6,832
|
|
||||
|
Net income attributable to noncontrolling interests -
Partially owned properties
|
(176
|
)
|
(79
|
)
|
(553
|
)
|
(255
|
)
|
|||||||
|
Net income attributable to controlling interest
|
10,118
|
|
|
3,904
|
|
|
22,349
|
|
|
6,577
|
|
||||
|
Preferred distributions
|
(436
|
)
|
(300
|
)
|
(1,421
|
)
|
(791
|
)
|
|||||||
|
Net income attributable to common unitholders
|
$
|
9,682
|
|
|
$
|
3,604
|
|
|
$
|
20,928
|
|
|
$
|
5,786
|
|
|
Net income per unit:
|
|
|
|
|
|
|
|
|
|||||||
|
Basic
|
$
|
0.07
|
|
$
|
0.05
|
|
$
|
0.17
|
|
$
|
0.08
|
|
|||
|
Diluted
|
$
|
0.07
|
|
$
|
0.05
|
|
$
|
0.16
|
|
$
|
0.08
|
|
|||
|
Weighted average common units:
|
|
|
|
|
|
|
|
|
|||||||
|
Basic
|
138,227,384
|
|
74,864,677
|
|
126,751,876
|
|
72,716,516
|
|
|||||||
|
Diluted
|
138,880,787
|
|
75,104,821
|
|
127,395,989
|
|
73,040,846
|
|
|||||||
|
Distributions declared per common OP Unit
|
$
|
0.225
|
|
$
|
0.225
|
|
$
|
0.675
|
|
$
|
0.675
|
|
|||
The accompanying notes are an integral part of these consolidated financial statements.
116
Physicians Realty L.P.
Consolidated Statements of Comprehensive Income
(In thousands) (Unaudited)
|
Three Months Ended
September 30, |
Nine Months Ended
September 30, |
||||||||||||||
|
|
2016
|
2015
|
2016
|
2015
|
|||||||||||
|
Net income
|
$
|
10,294
|
|
$
|
3,983
|
|
$
|
22,902
|
|
$
|
6,832
|
|
|||
|
Other comprehensive income:
|
|||||||||||||||
|
Change in fair value of interest rate swap agreements
|
652
|
|
—
|
|
652
|
|
—
|
|
|||||||
|
Total other comprehensive income
|
652
|
|
|
—
|
|
|
652
|
|
|
—
|
|
||||
|
Comprehensive income
|
10,946
|
|
|
3,983
|
|
|
23,554
|
|
|
6,832
|
|
||||
|
Comprehensive income attributable to noncontrolling interests
|
(17
|
)
|
—
|
|
(17
|
)
|
—
|
|
|||||||
|
Comprehensive income attributable to common unitholders
|
$
|
10,929
|
|
|
$
|
3,983
|
|
|
$
|
23,537
|
|
|
$
|
6,832
|
|
The accompanying notes are an integral part of these consolidated financial statements.
117
Physicians Realty L.P.
Consolidated Statement of Changes in Capital
(In thousands)
(Unaudited)
|
|
General Partner
|
Limited Partner
|
Accumulated Other Comprehensive Income (Loss)
|
Total Partners’ Capital
|
Partially Owned Properties Noncontrolling Interest
|
Total Capital
|
|||||||||||||||||
|
Balance at January 1, 2016
|
$
|
1,021,132
|
|
$
|
45,451
|
|
$
|
—
|
|
$
|
1,066,583
|
|
$
|
9,878
|
|
$
|
1,076,461
|
|
|||||
|
Net proceeds from sale of Trust common shares and issuance of common units
|
764,292
|
|
—
|
|
—
|
|
764,292
|
|
—
|
|
764,292
|
|
|||||||||||
|
Trust restricted share award grants, net
|
3,203
|
|
—
|
|
—
|
|
3,203
|
|
—
|
|
3,203
|
|
|||||||||||
|
Purchase of OP Units
|
—
|
|
(2,999
|
)
|
—
|
|
(2,999
|
)
|
—
|
|
(2,999
|
)
|
|||||||||||
|
Conversion of OP Units
|
8,098
|
|
(8,098
|
)
|
—
|
|
—
|
|
—
|
|
—
|
|
|||||||||||
|
OP Units - distributions
|
(85,208
|
)
|
(2,394
|
)
|
—
|
|
(87,602
|
)
|
—
|
|
(87,602
|
)
|
|||||||||||
|
Preferred distributions
|
(1,421
|
)
|
—
|
|
—
|
|
(1,421
|
)
|
—
|
|
(1,421
|
)
|
|||||||||||
|
Issuance of OP Units in connection with acquisition
|
(3,900
|
)
|
6,869
|
|
—
|
|
2,969
|
|
(100
|
)
|
2,869
|
|
|||||||||||
|
Contributions
|
—
|
|
—
|
|
—
|
|
—
|
|
50
|
|
50
|
|
|||||||||||
|
Distributions
|
—
|
|
—
|
|
—
|
|
—
|
|
(450
|
)
|
(450
|
)
|
|||||||||||
|
Change in market value of Redeemable Limited Partners
|
(422
|
)
|
—
|
|
—
|
|
(422
|
)
|
—
|
|
(422
|
)
|
|||||||||||
|
Reclassification of Noncontrolling Interest - partially owned properties
|
—
|
|
—
|
|
—
|
|
—
|
|
(8,514
|
)
|
(8,514
|
)
|
|||||||||||
|
Buyout of Noncontrolling Interests - partially owned properties
|
53
|
|
—
|
|
—
|
|
53
|
|
(664
|
)
|
(611
|
)
|
|||||||||||
|
Change in fair value of interest rate cap agreements
|
—
|
|
—
|
|
652
|
|
652
|
|
—
|
|
652
|
|
|||||||||||
|
Net income
|
21,720
|
|
629
|
|
—
|
|
22,349
|
|
553
|
|
22,902
|
|
|||||||||||
|
Adjustments for Limited Partners ownership in Operating Partnership
|
(6,680
|
)
|
6,680
|
|
—
|
|
—
|
|
—
|
|
—
|
|
|||||||||||
|
Balance at September 30, 2016
|
$
|
1,720,867
|
|
|
$
|
46,138
|
|
$
|
652
|
|
|
$
|
1,767,657
|
|
|
$
|
753
|
|
|
$
|
1,768,410
|
|
|
The accompanying notes are an integral part of this consolidated financial statement.
118
Physicians Realty L.P.
Consolidated Statements of Cash Flows
(In thousands) (Unaudited)
|
|
Nine Months Ended
September 30, |
||||||
|
|
2016
|
2015
|
|||||
|
Cash Flows from Operating Activities:
|
|
|
|
|
|||
|
Net income
|
$
|
22,902
|
|
$
|
6,832
|
|
|
|
Adjustments to reconcile net income to net cash provided by operating activities
|
|
|
|||||
|
Depreciation and amortization
|
59,778
|
|
31,067
|
|
|||
|
Amortization of deferred financing costs
|
1,796
|
|
953
|
|
|||
|
Amortization of lease inducements and above/below market lease intangibles
|
2,994
|
|
1,559
|
|
|||
|
Straight-line rental revenue/expense
|
(12,156
|
)
|
(6,262
|
)
|
|||
|
Amortization of above market assumed debt
|
(177
|
)
|
(114
|
)
|
|||
|
Loss on sale of investment property
|
—
|
|
(130
|
)
|
|||
|
Equity in income of unconsolidated entity
|
(85
|
)
|
(78
|
)
|
|||
|
Distribution from unconsolidated entity
|
82
|
|
79
|
|
|||
|
Change in fair value of derivative
|
(67
|
)
|
(116
|
)
|
|||
|
Provision for bad debts
|
152
|
|
26
|
|
|||
|
Non-cash share compensation
|
3,497
|
|
2,929
|
|
|||
|
Write-off of contingent consideration
|
(840
|
)
|
—
|
|
|||
|
Tenant receivables
|
(7,543
|
)
|
(2,448
|
)
|
|||
|
Other assets
|
(6,320
|
)
|
(1,268
|
)
|
|||
|
Accounts payable
|
1,578
|
|
693
|
|
|||
|
Accrued expenses and other liabilities
|
23,832
|
|
7,929
|
|
|||
|
Net cash provided by operating activities
|
89,423
|
|
|
41,651
|
|
||
|
Cash Flows from Investing Activities:
|
|
|
|
|
|||
|
Proceeds on sales of investment property
|
—
|
|
3,039
|
|
|||
|
Acquisition of investment properties, net
|
(1,044,601
|
)
|
(629,888
|
)
|
|||
|
Capital expenditures on existing investment properties
|
(8,665
|
)
|
(3,974
|
)
|
|||
|
Real estate loans receivable
|
(8,153
|
)
|
(12,404
|
)
|
|||
|
Repayment of note receivable
|
4,118
|
|
—
|
|
|||
|
Note receivable
|
—
|
|
(4,123
|
)
|
|||
|
Repayment of real estate loan receivable
|
4,500
|
|
—
|
|
|||
|
Leasing commissions
|
(707
|
)
|
(278
|
)
|
|||
|
Lease inducements
|
(4,870
|
)
|
(2,478
|
)
|
|||
|
Net cash used in investing activities
|
(1,058,378
|
)
|
|
(650,106
|
)
|
||
|
Cash Flows from Financing Activities:
|
|
|
|
|
|||
|
Net proceeds from sale of Trust common shares and issuance of common units
|
764,292
|
|
318,170
|
|
|||
|
Proceeds from credit facility borrowings
|
921,000
|
|
473,000
|
|
|||
|
Payment on credit facility borrowings
|
(860,000
|
)
|
(138,000
|
)
|
|||
|
Proceeds from issuance of mortgage debt
|
21,500
|
|
—
|
|
|||
|
Proceeds from issuance of senior unsecured notes
|
225,000
|
|
—
|
|
|||
|
Principal payments on mortgage debt
|
(1,646
|
)
|
(1,486
|
)
|
|||
|
Debt issuance costs
|
(4,693
|
)
|
(3,029
|
)
|
|||
|
OP Units distributions - General Partner
|
(74,515
|
)
|
(47,665
|
)
|
|||
|
OP Units distributions - Limited Partner
|
(2,410
|
)
|
(2,374
|
)
|
|||
|
Preferred OP Units distributions - Limited Partner
|
(1,115
|
)
|
(360
|
)
|
|||
|
Distributions to noncontrolling interest - partially owned properties
|
(450
|
)
|
(158
|
)
|
|||
|
Purchase of Preferred Limited Partner Units
|
(9,756
|
)
|
—
|
|
|||
|
Purchase of Limited Partner Units
|
(2,999
|
)
|
(253
|
)
|
|||
|
Trust common shares repurchased and retired
|
—
|
|
(595
|
)
|
|||
|
Net cash provided by financing activities
|
974,208
|
|
|
597,250
|
|
||
|
Net increase (decrease) in cash and cash equivalents
|
5,253
|
|
(11,205
|
)
|
|||
|
Cash and cash equivalents, beginning of period
|
3,143
|
|
15,923
|
|
|||
|
Cash and cash equivalents, end of period
|
$
|
8,396
|
|
|
$
|
4,718
|
|
|
Supplemental disclosure of cash flow information - interest paid during the period
|
$
|
12,074
|
|
$
|
6,010
|
|
|
|
Supplemental disclosure of noncash activity - change in fair value of interest rate swap agreements
|
$
|
652
|
|
$
|
—
|
|
|
|
Supplemental disclosure of noncash activity - assumed debt
|
$
|
—
|
|
$
|
18,690
|
|
|
|
Supplemental disclosure of noncash activity - issuance of OP Units and Series A Preferred Units in connection with acquisitions
|
$
|
6,769
|
|
$
|
20,677
|
|
|
|
Supplemental disclosure of noncash activity - contingent consideration
|
$
|
156
|
|
$
|
550
|
|
|
The accompanying notes are an integral part of these consolidated financial statements.
119
Physicians Realty L.P.
Consolidated Balance Sheets
(In thousands)
|
June 30,
2016 |
December 31,
2015 |
||||||
|
|
(unaudited)
|
|
|||||
|
ASSETS
|
|
|
|
|
|||
|
Investment properties:
|
|
|
|
|
|||
|
Land and improvements
|
$
|
160,718
|
|
$
|
130,788
|
|
|
|
Building and improvements
|
2,080,192
|
|
1,284,863
|
|
|||
|
Tenant improvements
|
11,519
|
|
9,243
|
|
|||
|
Acquired lease intangibles
|
263,919
|
|
205,168
|
|
|||
|
|
2,516,348
|
|
1,630,062
|
|
|||
|
Accumulated depreciation
|
(129,136
|
)
|
(91,250
|
)
|
|||
|
Net real estate property
|
2,387,212
|
|
1,538,812
|
|
|||
|
Real estate loans receivable
|
38,774
|
|
39,349
|
|
|||
|
Investment in unconsolidated entity
|
1,354
|
|
1,322
|
|
|||
|
Net real estate investments
|
2,427,340
|
|
1,579,483
|
|
|||
|
Cash and cash equivalents
|
37,945
|
|
3,143
|
|
|||
|
Tenant receivables, net
|
3,427
|
|
2,977
|
|
|||
|
Other assets
|
64,200
|
|
53,283
|
|
|||
|
Total assets
|
$
|
2,532,912
|
|
$
|
1,638,886
|
|
|
|
LIABILITIES AND CAPITAL
|
|
|
|
|
|||
|
Liabilities:
|
|
|
|
|
|||
|
Credit facility
|
$
|
369,685
|
|
$
|
389,375
|
|
|
|
Notes payable
|
149,561
|
|
—
|
|
|||
|
Mortgage debt
|
114,296
|
|
94,240
|
|
|||
|
Accounts payable
|
1,723
|
|
644
|
|
|||
|
Dividends payable
|
31,771
|
|
20,783
|
|
|||
|
Accrued expenses and other liabilities
|
38,593
|
|
24,473
|
|
|||
|
Acquired lease intangibles, net
|
9,348
|
|
5,950
|
|
|||
|
Total liabilities
|
714,977
|
|
535,465
|
|
|||
|
Redeemable noncontrolling interest - Series A Preferred Units and partially owned properties
|
19,867
|
|
26,960
|
|
|||
|
Capital:
|
|
|
|
|
|||
|
Partners’ capital:
|
|
|
|
|
|||
|
General partner’s capital, 134,337,589 and 86,864,063 units issued and outstanding as of June 30, 2016 and December 31, 2015, respectively
|
1,738,121
|
|
1,021,132
|
|
|||
|
Limited partners’ capital, 3,894,249 and 3,879,115 units issued and outstanding as of June 30, 2016 and December 31, 2015, respectively
|
50,155
|
|
45,451
|
|
|||
|
Total partners’ capital
|
1,788,276
|
|
1,066,583
|
|
|||
|
Noncontrolling interests - partially owned properties
|
9,792
|
|
9,878
|
|
|||
|
Total capital
|
1,798,068
|
|
1,076,461
|
|
|||
|
Total liabilities and capital
|
$
|
2,532,912
|
|
$
|
1,638,886
|
|
|
The accompanying notes are an integral part of these consolidated financial statements.
120
Physicians Realty L.P.
Consolidated Statements of Income
(In thousands, except unit and per unit data) (Unaudited)
|
Three Months Ended
June 30, |
Six Months Ended
June 30, |
||||||||||||||
|
|
2016
|
2015
|
2016
|
2015
|
|||||||||||
|
Revenues:
|
|
|
|
|
|
|
|
|
|||||||
|
Rental revenues
|
$
|
42,196
|
|
$
|
23,625
|
|
$
|
77,051
|
|
$
|
43,966
|
|
|||
|
Expense recoveries
|
9,552
|
|
4,908
|
|
17,455
|
|
8,444
|
|
|||||||
|
Interest income on real estate loans and other
|
1,468
|
|
1,150
|
|
2,844
|
|
1,757
|
|
|||||||
|
Total revenues
|
53,216
|
|
29,683
|
|
97,350
|
|
54,167
|
|
|||||||
|
Expenses:
|
|
|
|
|
|
|
|
|
|||||||
|
Interest expense
|
4,279
|
|
2,193
|
|
8,476
|
|
3,903
|
|
|||||||
|
General and administrative
|
4,926
|
|
3,989
|
|
9,047
|
|
7,341
|
|
|||||||
|
Operating expenses
|
13,798
|
|
7,304
|
|
24,835
|
|
13,013
|
|
|||||||
|
Depreciation and amortization
|
19,799
|
|
10,351
|
|
35,809
|
|
18,591
|
|
|||||||
|
Acquisition expenses
|
3,256
|
|
2,575
|
|
6,633
|
|
8,507
|
|
|||||||
|
Total expenses
|
46,058
|
|
26,412
|
|
84,800
|
|
51,355
|
|
|||||||
|
Income before equity in income of unconsolidated entity and loss on sale of investment property:
|
7,158
|
|
3,271
|
|
12,550
|
|
2,812
|
|
|||||||
|
Equity in income of unconsolidated entity
|
26
|
|
26
|
|
58
|
|
52
|
|
|||||||
|
Loss on sale of investment property
|
—
|
|
—
|
|
—
|
|
(15
|
)
|
|||||||
|
Net income
|
7,184
|
|
3,297
|
|
12,608
|
|
2,849
|
|
|||||||
|
Net income attributable to noncontrolling interests -
Partially owned properties
|
(60
|
)
|
(144
|
)
|
(377
|
)
|
(176
|
)
|
|||||||
|
Net income attributable to controlling interest
|
7,124
|
|
3,153
|
|
12,231
|
|
2,673
|
|
|||||||
|
Preferred distributions
|
(437
|
)
|
(425
|
)
|
(985
|
)
|
(491
|
)
|
|||||||
|
Net income attributable to common unitholders
|
$
|
6,687
|
|
$
|
2,728
|
|
$
|
11,246
|
|
$
|
2,182
|
|
|||
|
Net income per unit:
|
|
|
|
|
|
|
|
|
|||||||
|
Basic
|
$
|
0.05
|
|
$
|
0.04
|
|
$
|
0.09
|
|
$
|
0.03
|
|
|||
|
Diluted
|
$
|
0.05
|
|
$
|
0.04
|
|
$
|
0.09
|
|
$
|
0.03
|
|
|||
|
Weighted average common units:
|
|
|
|
|
|
|
|
|
|||||||
|
Basic
|
135,351,672
|
|
74,075,323
|
|
120,951,069
|
|
71,624,633
|
|
|||||||
|
Diluted
|
135,944,722
|
|
74,267,284
|
|
121,575,247
|
|
71,862,249
|
|
|||||||
|
Distributions declared per common OP Unit
|
$
|
0.225
|
|
$
|
0.225
|
|
$
|
0.45
|
|
$
|
0.45
|
|
|||
The accompanying notes are an integral part of these consolidated financial statements.
121
Physicians Realty L.P.
Consolidated Statement of Changes in Capital
(In thousands)
(Unaudited)
|
|
General Partner
|
Limited Partner
|
Total Partner’s Capital
|
Partially Owned
Properties
Noncontrolling Interest
|
Total Capital
|
||||||||||||||
|
Balance at January 1, 2016
|
$
|
1,021,132
|
|
$
|
45,451
|
|
$
|
1,066,583
|
|
$
|
9,878
|
|
$
|
1,076,461
|
|
||||
|
Net proceeds from sale of Trust common shares and issuance of common units
|
764,205
|
|
—
|
|
764,205
|
|
—
|
|
$
|
764,205
|
|
||||||||
|
Trust restricted share award grants, net
|
2,329
|
|
—
|
|
2,329
|
|
—
|
|
$
|
2,329
|
|
||||||||
|
Purchase of OP Units
|
—
|
|
(2,129
|
)
|
(2,129
|
)
|
—
|
|
$
|
(2,129
|
)
|
||||||||
|
Conversion of OP Units
|
3,293
|
|
(3,293
|
)
|
—
|
|
—
|
|
$
|
—
|
|
||||||||
|
OP Units - distributions
|
(54,821
|
)
|
(1,662
|
)
|
(56,483
|
)
|
—
|
|
$
|
(56,483
|
)
|
||||||||
|
Preferred distributions
|
(985
|
)
|
—
|
|
(985
|
)
|
—
|
|
$
|
(985
|
)
|
||||||||
|
Issuance of OP Units in connection with acquisition
|
(3,900
|
)
|
6,869
|
|
2,969
|
|
(100
|
)
|
$
|
2,869
|
|
||||||||
|
Distributions
|
—
|
|
—
|
|
—
|
|
(363
|
)
|
$
|
(363
|
)
|
||||||||
|
Change in market value of Redeemable Limited Partners
|
(444
|
)
|
—
|
|
(444
|
)
|
—
|
|
$
|
(444
|
)
|
||||||||
|
Net income
|
11,857
|
|
374
|
|
12,231
|
|
377
|
|
$
|
12,608
|
|
||||||||
|
Adjustments for Limited Partners ownership in Operating Partnership
|
(4,545
|
)
|
4,545
|
|
—
|
|
—
|
|
$
|
—
|
|
||||||||
|
Balance at June 30, 2016
|
$
|
1,738,121
|
|
$
|
50,155
|
|
$
|
1,788,276
|
|
$
|
9,792
|
|
$
|
1,798,068
|
|
||||
The accompanying notes are an integral part of these consolidated financial statements.
122
Physicians Realty L.P.
Consolidated Statements of Cash Flows
(In thousands) (Unaudited)
|
|
Six Months Ended
June 30, |
||||||
|
|
2016
|
2015
|
|||||
|
Cash Flows from Operating Activities:
|
|
|
|
|
|||
|
Net income
|
$
|
12,608
|
|
$
|
2,849
|
|
|
|
Adjustments to reconcile net income to net cash provided by operating activities
|
|
|
|||||
|
Depreciation and amortization
|
35,809
|
|
18,591
|
|
|||
|
Amortization of deferred financing costs
|
947
|
|
594
|
|
|||
|
Amortization of lease inducements and above/below market lease intangibles
|
1,989
|
|
838
|
|
|||
|
Straight-line rental revenue/expense
|
(7,204
|
)
|
(3,889
|
)
|
|||
|
Amortization of above market assumed debt
|
(118
|
)
|
(55
|
)
|
|||
|
Loss on sale of investment property
|
—
|
|
15
|
|
|||
|
Equity in income of unconsolidated entity
|
(58
|
)
|
(52
|
)
|
|||
|
Distribution from unconsolidated entity
|
27
|
|
53
|
|
|||
|
Change in fair value of derivative
|
(67
|
)
|
(154
|
)
|
|||
|
Provision for bad debts
|
104
|
|
—
|
|
|||
|
Non-cash share compensation
|
2,599
|
|
1,944
|
|
|||
|
Change in operating assets and liabilities:
|
|
|
|
|
|||
|
Tenant receivables
|
(1,001
|
)
|
(1,453
|
)
|
|||
|
Other assets
|
(3,081
|
)
|
(1,231
|
)
|
|||
|
Accounts payable
|
1,079
|
|
397
|
|
|||
|
Accrued expenses and other liabilities
|
15,908
|
|
4,013
|
|
|||
|
Net cash provided by operating activities
|
59,541
|
|
22,460
|
|
|||
|
Cash Flows from Investing Activities:
|
|
|
|
|
|||
|
Proceeds on sales of investment property
|
—
|
|
1,550
|
|
|||
|
Acquisition of investment properties, net
|
(872,497
|
)
|
(336,128
|
)
|
|||
|
Capital expenditures on existing investment properties
|
(6,980
|
)
|
(1,815
|
)
|
|||
|
Real estate loans receivable
|
(3,478
|
)
|
(9,000
|
)
|
|||
|
Repayment of note receivable
|
4,118
|
|
—
|
|
|||
|
Note receivable
|
—
|
|
(4,123
|
)
|
|||
|
Repayment of real estate loan receivable
|
4,500
|
|
—
|
|
|||
|
Leasing commissions
|
(116
|
)
|
(63
|
)
|
|||
|
Lease inducements
|
(4,870
|
)
|
(2,445
|
)
|
|||
|
Net cash used in investing activities
|
(879,323
|
)
|
(352,024
|
)
|
|||
|
Cash Flows from Financing Activities:
|
|
|
|
|
|||
|
Net proceeds from sale of Trust common shares and issuance of common units
|
764,205
|
|
318,041
|
|
|||
|
Proceeds from credit facility borrowings
|
528,000
|
|
191,000
|
|
|||
|
Payment on credit facility borrowings
|
(545,000
|
)
|
(138,000
|
)
|
|||
|
Proceeds from issuance of mortgage debt
|
21,500
|
|
—
|
|
|||
|
Proceeds from issuance of senior unsecured notes
|
150,000
|
|
—
|
|
|||
|
Principal payments on mortgage debt
|
(1,089
|
)
|
(966
|
)
|
|||
|
Debt issuance costs
|
(4,313
|
)
|
(144
|
)
|
|||
|
OP Units distributions - General Partner
|
(44,151
|
)
|
(31,613
|
)
|
|||
|
OP Units distributions - Limited Partner
|
(1,616
|
)
|
(1,523
|
)
|
|||
|
Preferred OP Units distributions - Limited Partner
|
(704
|
)
|
(238
|
)
|
|||
|
Distributions to noncontrolling interest - partially owned properties
|
(363
|
)
|
(114
|
)
|
|||
|
Purchase of Preferred Limited Partner Units
|
(9,756
|
)
|
—
|
|
|||
|
Purchase of Limited Partner Units
|
(2,129
|
)
|
(253
|
)
|
|||
|
Net cash provided by financing activities
|
854,584
|
|
336,190
|
|
|||
|
Net increase in cash and cash equivalents
|
34,802
|
|
6,626
|
|
|||
|
Cash and cash equivalents, beginning of period
|
3,143
|
|
15,923
|
|
|||
|
Cash and cash equivalents, end of period
|
$
|
37,945
|
|
$
|
22,549
|
|
|
|
Supplemental disclosure of cash flow information - interest paid during the period
|
$
|
4,300
|
|
$
|
3,332
|
|
|
|
Supplemental disclosure of noncash activity - assumed debt
|
$
|
—
|
|
$
|
18,690
|
|
|
|
Supplemental disclosure of noncash activity - issuance of OP Units and Series A Preferred Units in connection with acquisitions
|
$
|
6,869
|
|
$
|
20,438
|
|
|
|
Supplemental disclosure of noncash activity - contingent consideration
|
$
|
156
|
|
$
|
1,482
|
|
|
The accompanying notes are an integral part of these consolidated financial statements.
123
Physicians Realty L.P.
Consolidated Balance Sheets
(In thousands)
|
March 31,
2016 |
December 31,
2015 |
||||||
|
|
(unaudited)
|
|
|||||
|
ASSETS
|
|
|
|
|
|||
|
Investment properties:
|
|
|
|
|
|||
|
Land and improvements
|
$
|
141,152
|
|
$
|
130,788
|
|
|
|
Building and improvements
|
1,452,885
|
|
1,284,863
|
|
|||
|
Tenant improvements
|
10,455
|
|
9,243
|
|
|||
|
Acquired lease intangibles
|
228,788
|
|
205,168
|
|
|||
|
|
1,833,280
|
|
|
1,630,062
|
|
||
|
Accumulated depreciation
|
(108,239
|
)
|
(91,250
|
)
|
|||
|
Net real estate property
|
1,725,041
|
|
|
1,538,812
|
|
||
|
Real estate loans receivable
|
35,937
|
|
39,349
|
|
|||
|
Investment in unconsolidated entity
|
1,327
|
|
1,322
|
|
|||
|
Net real estate investments
|
1,762,305
|
|
|
1,579,483
|
|
||
|
Cash and cash equivalents
|
22,906
|
|
3,143
|
|
|||
|
Tenant receivables, net
|
6,024
|
|
2,977
|
|
|||
|
Other assets
|
59,657
|
|
53,283
|
|
|||
|
Total assets
|
$
|
1,850,892
|
|
|
$
|
1,638,886
|
|
|
LIABILITIES AND CAPITAL
|
|
|
|
|
|||
|
Liabilities:
|
|
|
|
|
|||
|
Credit facility
|
$
|
115,789
|
|
$
|
389,375
|
|
|
|
Notes payable
|
149,551
|
|
—
|
|
|||
|
Mortgage debt
|
114,816
|
|
94,240
|
|
|||
|
Accounts payable
|
1,659
|
|
644
|
|
|||
|
Dividends payable
|
25,701
|
|
20,783
|
|
|||
|
Accrued expenses and other liabilities
|
28,948
|
|
24,473
|
|
|||
|
Acquired lease intangibles, net
|
6,407
|
|
5,950
|
|
|||
|
Total liabilities
|
442,871
|
|
|
535,465
|
|
||
|
Redeemable noncontrolling interest - Series A Preferred Units and partially owned properties
|
27,065
|
|
26,960
|
|
|||
|
Capital:
|
|
|
|
|
|||
|
Partners’ capital:
|
|
|
|
|
|||
|
General partner’s capital, 108,379,324 and 86,864,063 units issued and outstanding as of March 31, 2016 and December 31, 2015, respectively
|
1,323,251
|
|
1,021,132
|
|
|||
|
Limited partners’ capital, 3,905,763 and 3,879,115 units issued and outstanding as of March 31, 2016 and December 31, 2015, respectively
|
47,567
|
|
45,451
|
|
|||
|
Total partners’ capital
|
1,370,818
|
|
|
1,066,583
|
|
||
|
Noncontrolling interests - partially owned properties
|
10,138
|
|
9,878
|
|
|||
|
Total capital
|
1,380,956
|
|
|
1,076,461
|
|
||
|
Total liabilities and capital
|
$
|
1,850,892
|
|
|
$
|
1,638,886
|
|
The accompanying notes are an integral part of these consolidated financial statements.
124
Physicians Realty L.P.
Consolidated Statements of Operations
(In thousands, except unit and per unit data) (Unaudited)
|
Three Months Ended
March 31, |
|||||||
|
|
2016
|
2015
|
|||||
|
Revenues:
|
|
|
|
|
|||
|
Rental revenues
|
$
|
34,855
|
|
$
|
20,341
|
|
|
|
Expense recoveries
|
7,903
|
|
3,536
|
|
|||
|
Interest income on real estate loans and other
|
1,376
|
|
607
|
|
|||
|
Total revenues
|
44,134
|
|
|
24,484
|
|
||
|
Expenses:
|
|
|
|
|
|||
|
Interest expense
|
4,197
|
|
1,710
|
|
|||
|
General and administrative
|
4,121
|
|
3,352
|
|
|||
|
Operating expenses
|
11,037
|
|
5,709
|
|
|||
|
Depreciation and amortization
|
16,010
|
|
8,240
|
|
|||
|
Acquisition expenses
|
3,377
|
|
5,932
|
|
|||
|
Total expenses
|
38,742
|
|
|
24,943
|
|
||
|
Income before equity in income of unconsolidated entity and gain (loss) on sale of investment property:
|
5,392
|
|
(459
|
)
|
|||
|
Equity in income of unconsolidated entity
|
32
|
|
26
|
|
|||
|
Loss on sale of investment property
|
—
|
|
(15
|
)
|
|||
|
Net income (loss)
|
5,424
|
|
|
(448
|
)
|
||
|
Net income attributable to noncontrolling interests - Partially owned properties
|
(317
|
)
|
(32
|
)
|
|||
|
Net income (loss) attributable to controlling interest
|
5,107
|
|
|
(480
|
)
|
||
|
Preferred distributions
|
(548
|
)
|
(66
|
)
|
|||
|
Net income (loss) attributable to common unitholders
|
$
|
4,559
|
|
|
$
|
(546
|
)
|
|
Net income (loss) per unit:
|
|
|
|
|
|||
|
Basic
|
$
|
0.04
|
|
$
|
(0.01
|
)
|
|
|
Diluted
|
$
|
0.04
|
|
$
|
(0.01
|
)
|
|
|
Weighted average common units:
|
|
|
|
|
|||
|
Basic
|
106,550,467
|
|
69,146,712
|
|
|||
|
Diluted
|
107,148,380
|
|
69,146,712
|
|
|||
|
Distributions declared per common OP Unit
|
$
|
0.225
|
|
$
|
0.225
|
|
|
The accompanying notes are an integral part of these consolidated financial statements.
125
Physicians Realty L.P.
Consolidated Statement of Changes in Capital
(In thousands)
(Unaudited)
|
|
General Partner
|
Limited Partner
|
Total Partners’ Capital
|
Partially Owned Properties Noncontrolling Interest
|
Total Capital
|
||||||||||||||
|
Balance at January 1, 2016
|
$
|
1,021,132
|
|
$
|
45,451
|
|
$
|
1,066,583
|
|
$
|
9,878
|
|
$
|
1,076,461
|
|
||||
|
Net proceeds from sale of Trust common shares and issuance of common units
|
321,238
|
|
—
|
|
321,238
|
|
—
|
|
$
|
321,238
|
|
||||||||
|
Trust restricted share award grants, net
|
1,109
|
|
—
|
|
1,109
|
|
—
|
|
$
|
1,109
|
|
||||||||
|
Conversion of OP Units
|
1,861
|
|
(1,861
|
)
|
—
|
|
—
|
|
$
|
—
|
|
||||||||
|
OP Units - distributions
|
(24,469
|
)
|
(848
|
)
|
(25,317
|
)
|
—
|
|
$
|
(25,317
|
)
|
||||||||
|
Preferred distribution
|
(548
|
)
|
—
|
|
(548
|
)
|
—
|
|
$
|
(548
|
)
|
||||||||
|
Issuance of OP Units in connection with acquisition
|
—
|
|
2,869
|
|
2,869
|
|
—
|
|
$
|
2,869
|
|
||||||||
|
Distributions
|
—
|
|
—
|
|
—
|
|
(57
|
)
|
$
|
(57
|
)
|
||||||||
|
Change in market value of Redeemable Limited Partners
|
(223
|
)
|
—
|
|
(223
|
)
|
—
|
|
$
|
(223
|
)
|
||||||||
|
Net income
|
4,934
|
|
173
|
|
5,107
|
|
317
|
|
$
|
5,424
|
|
||||||||
|
Adjustments for Limited Partners ownership in Operating Partnership
|
(1,783
|
)
|
1,783
|
|
—
|
|
—
|
|
$
|
—
|
|
||||||||
|
Balance at March 31, 2016
|
$
|
1,323,251
|
|
|
$
|
47,567
|
|
|
$
|
1,370,818
|
|
|
$
|
10,138
|
|
|
$
|
1,380,956
|
|
The accompanying notes are an integral part of these consolidated financial statements.
126
Physicians Realty L.P.
Consolidated Statements of Cash Flows
(In thousands) (Unaudited)
|
|
Three Months Ended
March 31, |
||||||
|
|
2016
|
2015
|
|||||
|
Cash Flows from Operating Activities:
|
|
|
|
|
|||
|
Net income (loss)
|
$
|
5,424
|
|
$
|
(448
|
)
|
|
|
Adjustments to reconcile net income (loss) to net cash provided by operating activities
|
|
|
|||||
|
Depreciation and amortization
|
16,010
|
|
8,240
|
|
|||
|
Amortization of deferred financing costs
|
448
|
|
293
|
|
|||
|
Amortization of lease inducements and above/below market lease intangibles
|
962
|
|
302
|
|
|||
|
Straight-line rental revenue/expense
|
(3,185
|
)
|
(2,012
|
)
|
|||
|
Amortization of above market assumed debt
|
(59
|
)
|
(10
|
)
|
|||
|
Loss on sale of investment property
|
—
|
|
15
|
|
|||
|
Equity in income of unconsolidated entity
|
(32
|
)
|
(26
|
)
|
|||
|
Distribution from unconsolidated entity
|
27
|
|
26
|
|
|||
|
Change in fair value of derivative
|
(40
|
)
|
(13
|
)
|
|||
|
Provision for bad debts
|
30
|
|
—
|
|
|||
|
Non-cash share compensation
|
1,185
|
|
867
|
|
|||
|
Change in operating assets and liabilities:
|
|
|
|
|
|||
|
Tenant receivables
|
(3,665
|
)
|
(1,022
|
)
|
|||
|
Other assets
|
(1,995
|
)
|
(580
|
)
|
|||
|
Accounts payable
|
1,015
|
|
(252
|
)
|
|||
|
Accrued expenses and other liabilities
|
4,023
|
|
4,345
|
|
|||
|
Net cash provided by operating activities
|
20,148
|
|
|
9,725
|
|
||
|
Cash Flows from Investing Activities:
|
|
|
|
|
|||
|
Proceeds on sales of investment properties
|
—
|
|
1,550
|
|
|||
|
Acquisition of investment properties, net
|
(197,876
|
)
|
(205,278
|
)
|
|||
|
Capital expenditures on existing investment properties
|
(1,820
|
)
|
(1,028
|
)
|
|||
|
Real estate loans receivable
|
(500
|
)
|
(4,123
|
)
|
|||
|
Repayment of real estate loan receivable
|
4,500
|
|
—
|
|
|||
|
Leasing commissions
|
(58
|
)
|
(35
|
)
|
|||
|
Lease inducements
|
(1,284
|
)
|
(462
|
)
|
|||
|
Net cash used in investing activities
|
(197,038
|
)
|
|
(209,376
|
)
|
||
|
Cash Flows from Financing Activities:
|
|
|
|
|
|||
|
Net proceeds from sale of Trust common shares and issuance of common units
|
321,238
|
|
301,772
|
|
|||
|
Proceeds from credit facility borrowings
|
150,000
|
|
73,000
|
|
|||
|
Payment on credit facility borrowings
|
(424,000
|
)
|
(138,000
|
)
|
|||
|
Proceeds from issuance of mortgage debt
|
21,500
|
|
—
|
|
|||
|
Proceeds from issuance of senior unsecured notes
|
150,000
|
|
—
|
|
|||
|
Principal payments on mortgage debt
|
(541
|
)
|
(466
|
)
|
|||
|
Debt issuance costs
|
(808
|
)
|
(24
|
)
|
|||
|
OP Units distributions - General Partner
|
(19,666
|
)
|
(15,792
|
)
|
|||
|
OP Units distributions - Limited Partner
|
(809
|
)
|
(714
|
)
|
|||
|
Preferred OP Units distributions - Limited Partner
|
(204
|
)
|
—
|
|
|||
|
Distributions to noncontrolling interest - partially owned properties
|
(57
|
)
|
(69
|
)
|
|||
|
Purchase of Limited Partner Units
|
—
|
|
(205
|
)
|
|||
|
Net cash provided by financing activities
|
196,653
|
|
|
219,502
|
|
||
|
Net increase in cash and cash equivalents
|
19,763
|
|
19,851
|
|
|||
|
Cash and cash equivalents, beginning of period
|
3,143
|
|
15,923
|
|
|||
|
Cash and cash equivalents, end of period
|
$
|
22,906
|
|
|
$
|
35,774
|
|
|
Supplemental disclosure of cash flow information - interest paid during the period
|
$
|
2,181
|
|
$
|
1,402
|
|
|
|
Supplemental disclosure of noncash activity - assumed debt
|
$
|
—
|
|
$
|
6,323
|
|
|
|
Supplemental disclosure of noncash activity - issuance of OP Units and Series A Preferred Units in connection with acquisitions
|
$
|
2,869
|
|
$
|
17,017
|
|
|
|
Supplemental disclosure of noncash activity - contingent consideration
|
$
|
—
|
|
$
|
1,482
|
|
|
The accompanying notes are an integral part of these consolidated financial statements.
127
Physicians Realty L.P.
Consolidated Balance Sheets
(In thousands, except unit and per unit data)
|
September 30,
2015 |
December 31,
2014 |
||||||
|
|
(unaudited)
|
|
|||||
|
ASSETS
|
|
|
|
|
|||
|
Investment properties:
|
|
|
|
|
|||
|
Land and improvements
|
$
|
123,240
|
|
$
|
79,334
|
|
|
|
Building and improvements
|
1,167,768
|
|
644,086
|
|
|||
|
Tenant improvements
|
8,524
|
|
5,614
|
|
|||
|
Acquired lease intangibles
|
176,087
|
|
72,985
|
|
|||
|
|
1,475,619
|
|
|
802,019
|
|
||
|
Accumulated depreciation
|
(75,930
|
)
|
(45,569
|
)
|
|||
|
Net real estate property
|
1,399,689
|
|
|
756,450
|
|
||
|
Real estate loans receivable
|
28,979
|
|
15,876
|
|
|||
|
Investment in unconsolidated entity
|
1,323
|
|
1,324
|
|
|||
|
Net real estate investments
|
1,429,991
|
|
|
773,650
|
|
||
|
Cash and cash equivalents
|
4,718
|
|
15,923
|
|
|||
|
Tenant receivables, net
|
3,047
|
|
1,324
|
|
|||
|
Other assets
|
34,741
|
|
16,423
|
|
|||
|
Total assets
|
$
|
1,472,497
|
|
|
$
|
807,320
|
|
|
LIABILITIES AND CAPITAL
|
|
|
|
|
|||
|
Liabilities:
|
|
|
|
|
|||
|
Credit facility
|
$
|
467,072
|
|
$
|
134,144
|
|
|
|
Mortgage debt
|
94,795
|
|
77,708
|
|
|||
|
Accounts payable
|
1,393
|
|
700
|
|
|||
|
Dividends payable
|
17,059
|
|
16,548
|
|
|||
|
Accrued expenses and other liabilities
|
19,038
|
|
6,140
|
|
|||
|
Acquired lease intangibles, net
|
5,053
|
|
2,871
|
|
|||
|
Total liabilities
|
604,410
|
|
|
238,111
|
|
||
|
Redeemable noncontrolling interest - Series A Preferred Units and partially owned properties
|
11,719
|
|
—
|
|
|||
|
Capital:
|
|
|
|
|
|||
|
Partners’ capital:
|
|
|
|
|
|||
|
General partner’s capital, 71,040,502 and 50,640,863 units issued and outstanding as of September 31, 2015 and December 31, 2014, respectively
|
811,282
|
|
534,730
|
|
|||
|
Limited partners’ capital, 3,842,763 and 3,190,339 units issued and outstanding as of September 31, 2015 and December 31, 2014, respectively
|
43,737
|
|
33,727
|
|
|||
|
Total partners’ capital
|
855,019
|
|
|
568,457
|
|
||
|
Noncontrolling interest - partially owned properties
|
1,349
|
|
752
|
|
|||
|
Total capital
|
856,368
|
|
|
569,209
|
|
||
|
Total liabilities and capital
|
$
|
1,472,497
|
|
$
|
807,320
|
|
|
The accompanying notes are an integral part of these consolidated financial statements.
128
Physicians Realty L.P.
Consolidated Statements of Operations
(In thousands, except unit and per unit data) (Unaudited)
|
Three Months Ended
September 30, |
Nine Months Ended
September 30, |
||||||||||||||
|
|
2015
|
2014
|
2015
|
2014
|
|||||||||||
|
Revenues:
|
|
|
|
|
|
|
|
|
|||||||
|
Rental revenues
|
$
|
28,145
|
|
$
|
12,506
|
|
$
|
72,111
|
|
$
|
29,555
|
|
|||
|
Expense recoveries
|
5,821
|
|
1,355
|
|
14,265
|
|
3,445
|
|
|||||||
|
Interest income on real estate loans and other
|
904
|
|
300
|
|
2,661
|
|
640
|
|
|||||||
|
Total revenues
|
34,870
|
|
|
14,161
|
|
|
89,037
|
|
|
33,640
|
|
||||
|
Expenses:
|
|
|
|
|
|
|
|
|
|||||||
|
Interest expense
|
3,341
|
|
1,911
|
|
7,244
|
|
4,849
|
|
|||||||
|
General and administrative
|
4,018
|
|
4,445
|
|
11,359
|
|
8,867
|
|
|||||||
|
Operating expenses
|
7,966
|
|
2,531
|
|
20,979
|
|
6,367
|
|
|||||||
|
Depreciation and amortization
|
12,476
|
|
4,413
|
|
31,067
|
|
10,565
|
|
|||||||
|
Acquisition expenses
|
3,257
|
|
2,922
|
|
11,764
|
|
9,254
|
|
|||||||
|
Impairment loss
|
—
|
|
250
|
|
—
|
|
250
|
|
|||||||
|
Total expenses
|
31,058
|
|
|
16,472
|
|
|
82,413
|
|
|
40,152
|
|
||||
|
Income (loss) before equity in income of unconsolidated entity and gain on sale of investment property:
|
3,812
|
|
(2,311
|
)
|
6,624
|
|
(6,512
|
)
|
|||||||
|
Equity in income of unconsolidated entity
|
26
|
|
26
|
|
78
|
|
69
|
|
|||||||
|
Gain on sale of investment properties
|
145
|
|
34
|
|
130
|
|
34
|
|
|||||||
|
Net income (loss)
|
3,983
|
|
|
(2,251
|
)
|
|
6,832
|
|
|
(6,409
|
)
|
||||
|
Net income attributable to noncontrolling interests - Partially owned properties
|
(79
|
)
|
(76
|
)
|
(255
|
)
|
(226
|
)
|
|||||||
|
Net income (loss) attributable to controlling interest
|
3,904
|
|
|
(2,327
|
)
|
|
6,577
|
|
|
(6,635
|
)
|
||||
|
Preferred distributions
|
(300
|
)
|
—
|
|
(791
|
)
|
—
|
|
|||||||
|
Net income (loss) attributable to common unitholders
|
$
|
3,604
|
|
|
$
|
(2,327
|
)
|
|
$
|
5,786
|
|
|
$
|
(6,635
|
)
|
|
Net income (loss) per unit:
|
|
|
|
|
|
|
|
|
|||||||
|
Basic
|
$
|
0.05
|
|
$
|
(0.06
|
)
|
$
|
0.08
|
|
$
|
(0.21
|
)
|
|||
|
Diluted
|
$
|
0.05
|
|
$
|
(0.06
|
)
|
$
|
0.08
|
|
$
|
(0.21
|
)
|
|||
|
Weighted average common units:
|
|
|
|
|
|
|
|
|
|||||||
|
Basic
|
74,864,677
|
|
40,898,015
|
|
72,716,516
|
|
32,010,755
|
|
|||||||
|
Diluted
|
75,104,821
|
|
40,898,015
|
|
73,040,846
|
|
32,010,755
|
|
|||||||
|
Distributions declared per common OP Unit
|
$
|
0.225
|
|
$
|
0.225
|
|
$
|
0.675
|
|
$
|
0.675
|
|
|||
The accompanying notes are an integral part of these consolidated financial statements.
129
Physicians Realty L.P.
Consolidated Statement of Changes in Capital
(In thousands)
(Unaudited)
|
|
General Partner
|
Limited Partner
|
Total Partners’ Capital
|
Partially Owned Properties Noncontrolling Interest
|
Total Capital
|
||||||||||||||
|
Balance at January 1, 2015
|
$
|
534,730
|
|
$
|
33,727
|
|
$
|
568,457
|
|
$
|
752
|
|
$
|
569,209
|
|
||||
|
Net proceeds from sale of Trust common shares and issuance of common units
|
318,170
|
|
—
|
|
318,170
|
|
—
|
|
$
|
318,170
|
|
||||||||
|
Trust restricted share award grants, net
|
2,228
|
|
—
|
|
2,228
|
|
—
|
|
$
|
2,228
|
|
||||||||
|
Purchase of OP Units
|
—
|
|
(253
|
)
|
(253
|
)
|
—
|
|
$
|
(253
|
)
|
||||||||
|
Conversion of OP Units
|
171
|
|
(171
|
)
|
—
|
|
—
|
|
$
|
—
|
|
||||||||
|
OP Units - distributions
|
(47,920
|
)
|
(2,514
|
)
|
(50,434
|
)
|
—
|
|
$
|
(50,434
|
)
|
||||||||
|
Preferred distribution
|
(791
|
)
|
—
|
|
(791
|
)
|
—
|
|
$
|
(791
|
)
|
||||||||
|
Issuance of OP Units in connection with acquisition
|
—
|
|
10,973
|
|
10,973
|
|
—
|
|
$
|
10,973
|
|
||||||||
|
Contributions
|
—
|
|
—
|
|
—
|
|
500
|
|
$
|
500
|
|
||||||||
|
Distributions
|
—
|
|
—
|
|
—
|
|
(158
|
)
|
$
|
(158
|
)
|
||||||||
|
Change in market value of Redeemable Limited Partners
|
92
|
|
—
|
|
92
|
|
—
|
|
$
|
92
|
|
||||||||
|
Net income
|
6,244
|
|
333
|
|
6,577
|
|
255
|
|
$
|
6,832
|
|
||||||||
|
Adjustments for Limited Partners ownership in Operating Partnership
|
(1,642
|
)
|
1,642
|
|
—
|
|
—
|
|
$
|
—
|
|
||||||||
|
Balance at September 30, 2015
|
$
|
811,282
|
|
|
$
|
43,737
|
|
|
$
|
855,019
|
|
|
$
|
1,349
|
|
|
$
|
856,368
|
|
The accompanying notes are an integral part of these consolidated financial statements.
130
Physicians Realty L.P.
Consolidated Statements of Cash Flows
(In thousands) (Unaudited)
|
|
Nine Months Ended
September 30, |
||||||
|
|
2015
|
2014
|
|||||
|
Cash Flows from Operating Activities:
|
|
|
|
|
|||
|
Net income (loss)
|
$
|
6,832
|
|
$
|
(6,409
|
)
|
|
|
Adjustments to reconcile net income (loss) to net cash provided by operating activities
|
|
|
|||||
|
Depreciation and amortization
|
31,067
|
|
10,565
|
|
|||
|
Amortization of deferred financing costs
|
953
|
|
626
|
|
|||
|
Accelerated amortization of deferred financing costs
|
—
|
|
141
|
|
|||
|
Amortization of lease inducements and above/below market lease intangibles
|
1,559
|
|
331
|
|
|||
|
Straight-line rental revenue/expense
|
(6,262
|
)
|
(2,785
|
)
|
|||
|
Amortization of above market assumed debt
|
(114
|
)
|
—
|
|
|||
|
Gain on sale of investment properties
|
(130
|
)
|
(34
|
)
|
|||
|
Equity in income of unconsolidated entity
|
(78
|
)
|
(69
|
)
|
|||
|
Distribution from unconsolidated entity
|
79
|
|
45
|
|
|||
|
Change in fair value of derivatives
|
(116
|
)
|
(138
|
)
|
|||
|
Provision for bad debts
|
26
|
|
5
|
|
|||
|
Non-cash share compensation
|
2,929
|
|
1,681
|
|
|||
|
Ziegler shared service amendment payment
|
—
|
|
1,800
|
|
|||
|
Impairment on investment property
|
—
|
|
250
|
|
|||
|
Change in operating assets and liabilities:
|
|
|
|
|
|||
|
Tenant receivables
|
(2,448
|
)
|
(521
|
)
|
|||
|
Other assets
|
(1,268
|
)
|
(1,285
|
)
|
|||
|
Accounts payable
|
693
|
|
(203
|
)
|
|||
|
Accrued expenses and other liabilities
|
7,929
|
|
3,445
|
|
|||
|
Net cash provided by operating activities
|
41,651
|
|
|
7,445
|
|
||
|
Cash Flows from Investing Activities:
|
|
|
|
|
|||
|
Proceeds on sales of investment properties
|
3,039
|
|
235
|
|
|||
|
Acquisition of investment properties, net
|
(629,888
|
)
|
(404,715
|
)
|
|||
|
Capital expenditures on existing investment properties
|
(3,974
|
)
|
(551
|
)
|
|||
|
Real estate loans receivable
|
(12,404
|
)
|
(6,836
|
)
|
|||
|
Note receivable
|
(4,123
|
)
|
—
|
|
|||
|
Leasing commissions
|
(278
|
)
|
(5
|
)
|
|||
|
Lease inducements
|
(2,478
|
)
|
(1,532
|
)
|
|||
|
Net cash used in investing activities
|
(650,106
|
)
|
|
(413,404
|
)
|
||
|
Cash Flows from Financing Activities:
|
|
|
|
|
|||
|
Net proceeds from sale of Trust common shares and issuance of common units
|
318,170
|
|
295,610
|
|
|||
|
Proceeds from credit facility borrowings
|
473,000
|
|
286,200
|
|
|||
|
Payment on credit facility borrowings
|
(138,000
|
)
|
(216,200
|
)
|
|||
|
Proceeds from issuance of mortgage debt
|
—
|
|
26,550
|
|
|||
|
Principal payments on mortgage debt
|
(1,486
|
)
|
(1,234
|
)
|
|||
|
Debt issuance costs
|
(3,029
|
)
|
(3,848
|
)
|
|||
|
OP Units distributions - General Partner
|
(47,665
|
)
|
(17,443
|
)
|
|||
|
OP Units distributions - Limited Partner
|
(2,374
|
)
|
(2,665
|
)
|
|||
|
Preferred OP Units distributions - Limited Partner
|
(360
|
)
|
—
|
|
|||
|
Distributions to noncontrolling interest - partially owned properties
|
(158
|
)
|
(143
|
)
|
|||
|
Purchase of Limited Partner Units
|
(253
|
)
|
—
|
|
|||
|
Trust common shares repurchased and retired
|
(595
|
)
|
(321
|
)
|
|||
|
Net cash provided by financing activities
|
597,250
|
|
|
366,506
|
|
||
|
Net decrease in cash and cash equivalents
|
(11,205
|
)
|
(39,453
|
)
|
|||
|
Cash and cash equivalents, beginning of period
|
15,923
|
|
56,478
|
|
|||
|
Cash and cash equivalents, end of period
|
$
|
4,718
|
|
|
$
|
17,025
|
|
|
Supplemental disclosure of cash flow information - interest paid during the period
|
$
|
6,010
|
|
$
|
4,113
|
|
|
|
Supplemental disclosure of noncash activity - assumed debt
|
$
|
18,690
|
|
$
|
15,283
|
|
|
|
Supplemental disclosure of noncash activity - issuance of OP Units and Series A Preferred Units in connection with acquisitions
|
$
|
20,677
|
|
$
|
28,589
|
|
|
|
Supplemental disclosure of noncash activity - contingent consideration
|
$
|
550
|
|
$
|
840
|
|
|
The accompanying notes are an integral part of these consolidated financial statements.
131
132
Physicians Realty L.P.
Consolidated Balance Sheets
(In thousands)
|
June 30,
2015 |
December 31,
2014 |
||||||
|
|
(unaudited)
|
|
|||||
|
ASSETS
|
|
|
|
|
|||
|
Investment properties:
|
|
|
|
|
|||
|
Land and improvements
|
$
|
110,349
|
|
$
|
79,334
|
|
|
|
Building and improvements
|
931,467
|
|
644,086
|
|
|||
|
Tenant improvements
|
6,810
|
|
5,614
|
|
|||
|
Acquired lease intangibles
|
132,255
|
|
72,985
|
|
|||
|
|
1,180,881
|
|
802,019
|
|
|||
|
Accumulated depreciation
|
(64,353
|
)
|
(45,569
|
)
|
|||
|
Net real estate property
|
1,116,528
|
|
756,450
|
|
|||
|
Real estate loans receivable
|
25,320
|
|
15,876
|
|
|||
|
Investment in unconsolidated entity
|
1,324
|
|
1,324
|
|
|||
|
Net real estate investments
|
1,143,172
|
|
773,650
|
|
|||
|
Cash and cash equivalents
|
22,549
|
|
15,923
|
|
|||
|
Tenant receivables, net
|
2,333
|
|
1,324
|
|
|||
|
Other assets
|
31,598
|
|
16,423
|
|
|||
|
Total assets
|
$
|
1,199,652
|
|
$
|
807,320
|
|
|
|
LIABILITIES AND CAPITAL
|
|
|
|
|
|||
|
Liabilities:
|
|
|
|
|
|||
|
Credit facility
|
$
|
187,638
|
|
$
|
134,144
|
|
|
|
Mortgage debt
|
95,332
|
|
77,708
|
|
|||
|
Accounts payable
|
1,097
|
|
700
|
|
|||
|
Dividends payable
|
16,942
|
|
16,548
|
|
|||
|
Accrued expenses and other liabilities
|
14,997
|
|
6,140
|
|
|||
|
Acquired lease intangibles, net
|
3,171
|
|
2,871
|
|
|||
|
Total liabilities
|
319,177
|
|
238,111
|
|
|||
|
Redeemable noncontrolling interest - Series A Preferred Units and partially owned properties
|
11,656
|
|
—
|
|
|||
|
Capital
|
|
|
|
|
|||
|
Partners’ capital:
|
|
|
|
|
|||
|
General partner’s capital, 70,955,331 and 50,640,863 units issued and outstanding as of June 30, 2015 and December 31, 2014, respectively
|
823,032
|
|
534,730
|
|
|||
|
Limited partners’ capital, 3,848,950 and 3,190,339 units issued and outstanding as of June 30, 2015 and December 31, 2014, respectively
|
44,473
|
|
33,727
|
|
|||
|
Total partners’ capital
|
867,505
|
|
568,457
|
|
|||
|
Noncontrolling interest - partially owned properties
|
1,314
|
|
752
|
|
|||
|
Total capital
|
868,819
|
|
569,209
|
|
|||
|
Total liabilities and capital
|
$
|
1,199,652
|
|
$
|
807,320
|
|
|
The accompanying notes are an integral part of these consolidated financial statements.
133
Physicians Realty L.P.
Consolidated Statements of Operations
(In thousands, except unit and per unit data) (Unaudited)
|
Three Months Ended
June 30, |
Six Months Ended
June 30, |
||||||||||||||
|
|
2015
|
2014
|
2015
|
2014
|
|||||||||||
|
Revenues:
|
|
|
|
|
|
|
|
|
|||||||
|
Rental revenues
|
$
|
23,625
|
|
$
|
10,241
|
|
$
|
43,966
|
|
$
|
17,049
|
|
|||
|
Expense recoveries
|
4,908
|
|
1,020
|
|
8,444
|
|
2,090
|
|
|||||||
|
Interest income on real estate loans and other
|
1,150
|
|
186
|
|
1,757
|
|
340
|
|
|||||||
|
Total revenues
|
29,683
|
|
11,447
|
|
54,167
|
|
19,479
|
|
|||||||
|
Expenses:
|
|
|
|
|
|
|
|
|
|||||||
|
Interest expense
|
2,193
|
|
1,657
|
|
3,903
|
|
2,938
|
|
|||||||
|
General and administrative
|
3,989
|
|
2,408
|
|
7,341
|
|
4,422
|
|
|||||||
|
Operating expenses
|
7,304
|
|
2,227
|
|
13,013
|
|
3,836
|
|
|||||||
|
Depreciation and amortization
|
10,351
|
|
3,736
|
|
18,591
|
|
6,152
|
|
|||||||
|
Acquisition expenses
|
2,575
|
|
2,045
|
|
8,507
|
|
6,332
|
|
|||||||
|
Total expenses
|
26,412
|
|
12,073
|
|
51,355
|
|
23,680
|
|
|||||||
|
Income (loss) before equity in income of unconsolidated entity and gain (loss) on sale of investment property:
|
3,271
|
|
(626
|
)
|
2,812
|
|
(4,201
|
)
|
|||||||
|
Equity in income of unconsolidated entity
|
26
|
|
26
|
|
52
|
|
43
|
|
|||||||
|
Loss on sale of investment property
|
—
|
|
—
|
|
(15
|
)
|
—
|
|
|||||||
|
Net income (loss)
|
3,297
|
|
(600
|
)
|
2,849
|
|
(4,158
|
)
|
|||||||
|
Net income attributable to noncontrolling interests - Partially owned properties
|
(144
|
)
|
(84
|
)
|
(176
|
)
|
(150
|
)
|
|||||||
|
Net income (loss) attributable to controlling interest
|
3,153
|
|
(684
|
)
|
2,673
|
|
(4,308
|
)
|
|||||||
|
Preferred distributions
|
(425
|
)
|
—
|
|
(491
|
)
|
—
|
|
|||||||
|
Net income (loss) attributable to common unitholders
|
$
|
2,728
|
|
$
|
(684
|
)
|
$
|
2,182
|
|
$
|
(4,308
|
)
|
|||
|
Net income (loss) per unit:
|
|
|
|
|
|
|
|
|
|||||||
|
Basic
|
$
|
0.04
|
|
$
|
(0.02
|
)
|
$
|
0.03
|
|
$
|
(0.15
|
)
|
|||
|
Diluted
|
$
|
0.04
|
|
$
|
(0.02
|
)
|
$
|
0.03
|
|
$
|
(0.15
|
)
|
|||
|
Weighted average common units:
|
|
|
|
|
|
|
|
|
|||||||
|
Basic
|
74,075,323
|
|
29,962,046
|
|
71,624,633
|
|
27,493,474
|
|
|||||||
|
Diluted
|
74,267,284
|
|
29,962,046
|
|
71,862,249
|
|
27,493,474
|
|
|||||||
|
Distributions declared per common OP Unit
|
$
|
0.225
|
|
$
|
0.225
|
|
$
|
0.45
|
|
$
|
0.45
|
|
|||
The accompanying notes are an integral part of these consolidated financial statements.
134
Physicians Realty L.P.
Consolidated Statement of Changes in Capital
(In thousands)
(Unaudited)
|
|
General Partner
|
Limited Partner
|
Total Partners’ Capital
|
Partially Owned Properties Noncontrolling Interest
|
Total Capital
|
||||||||||||||
|
Balance at January 1, 2015
|
$
|
534,730
|
|
$
|
33,727
|
|
$
|
568,457
|
|
$
|
752
|
|
$
|
569,209
|
|
||||
|
Net proceeds from sale of Trust common shares and issuance of common units
|
318,041
|
|
—
|
|
318,041
|
|
—
|
|
$
|
318,041
|
|
||||||||
|
Trust restricted share award grants, net
|
1,879
|
|
—
|
|
1,879
|
|
—
|
|
$
|
1,879
|
|
||||||||
|
Purchase of OP Units
|
—
|
|
(253
|
)
|
(253
|
)
|
—
|
|
$
|
(253
|
)
|
||||||||
|
Conversion of OP Units
|
18
|
|
(18
|
)
|
—
|
|
—
|
|
$
|
—
|
|
||||||||
|
OP Units - distributions
|
(31,870
|
)
|
(1,664
|
)
|
(33,534
|
)
|
—
|
|
$
|
(33,534
|
)
|
||||||||
|
Preferred distribution
|
(491
|
)
|
—
|
|
(491
|
)
|
—
|
|
$
|
(491
|
)
|
||||||||
|
Issuance of OP Units in connection with acquisition
|
—
|
|
10,733
|
|
10,733
|
|
—
|
|
$
|
10,733
|
|
||||||||
|
Contributions
|
—
|
|
—
|
|
—
|
|
500
|
|
$
|
500
|
|
||||||||
|
Distributions
|
—
|
|
—
|
|
—
|
|
(114
|
)
|
$
|
(114
|
)
|
||||||||
|
Net income
|
2,540
|
|
133
|
|
2,673
|
|
176
|
|
$
|
2,849
|
|
||||||||
|
Adjustments for Limited Partners ownership in Operating Partnership
|
(1,815
|
)
|
1,815
|
|
—
|
|
—
|
|
$
|
—
|
|
||||||||
|
Balance at June 30, 2015
|
$
|
823,032
|
|
$
|
44,473
|
|
$
|
867,505
|
|
$
|
1,314
|
|
$
|
868,819
|
|
||||
The accompanying notes are an integral part of these consolidated financial statements.
135
Physicians Realty L.P.
Consolidated Statements of Cash Flows
(In thousands) (Unaudited)
|
|
Six Months Ended
June 30, |
||||||
|
|
2015
|
2014
|
|||||
|
Cash Flows from Operating Activities:
|
|
|
|
|
|||
|
Net income (loss)
|
$
|
2,849
|
|
$
|
(4,158
|
)
|
|
|
Adjustments to reconcile net income (loss) to net cash provided by operating activities
|
|
|
|
|
|||
|
Depreciation and amortization
|
18,591
|
|
6,152
|
|
|||
|
Amortization of deferred financing costs
|
594
|
|
352
|
|
|||
|
Amortization of lease inducements and above/below market lease intangibles
|
838
|
|
186
|
|
|||
|
Straight-line rental revenue/expense
|
(3,889
|
)
|
(1,585
|
)
|
|||
|
Amortization of above market assumed debt
|
(55
|
)
|
—
|
|
|||
|
Loss on sale of investment property
|
15
|
|
—
|
|
|||
|
Equity in income of unconsolidated entity
|
(52
|
)
|
(43
|
)
|
|||
|
Distribution from unconsolidated entity
|
53
|
|
45
|
|
|||
|
Change in fair value of derivatives
|
(154
|
)
|
(72
|
)
|
|||
|
Provision for bad debts
|
—
|
|
6
|
|
|||
|
Non-cash share compensation
|
1,944
|
|
860
|
|
|||
|
Change in operating assets and liabilities:
|
|
|
|
|
|||
|
Tenant receivables
|
(1,453
|
)
|
(50
|
)
|
|||
|
Other assets
|
(1,231
|
)
|
402
|
|
|||
|
Accounts payable
|
397
|
|
(138
|
)
|
|||
|
Accrued expenses and other liabilities
|
4,013
|
|
1,954
|
|
|||
|
Net cash provided by operating activities
|
22,460
|
|
3,911
|
|
|||
|
Cash Flows from Investing Activities:
|
|
|
|
|
|||
|
Proceeds on sales of investment property
|
1,550
|
|
—
|
|
|||
|
Acquisition of investment properties, net
|
(336,128
|
)
|
(208,118
|
)
|
|||
|
Capital expenditures on existing investment properties
|
(1,815
|
)
|
(87
|
)
|
|||
|
Real estate loans receivable
|
(9,000
|
)
|
(6,836
|
)
|
|||
|
Note receivable
|
(4,123
|
)
|
—
|
|
|||
|
Leasing commissions
|
(63
|
)
|
(5
|
)
|
|||
|
Lease inducements
|
(2,445
|
)
|
(1,500
|
)
|
|||
|
Net cash used in investing activities
|
(352,024
|
)
|
(216,546
|
)
|
|||
|
Cash Flows from Financing Activities:
|
|
|
|
|
|||
|
Net proceeds from sale of Trust common shares and issuance of common units
|
318,041
|
|
149,917
|
|
|||
|
Proceeds from credit facility borrowings
|
191,000
|
|
113,200
|
|
|||
|
Payment on credit facility borrowings
|
(138,000
|
)
|
(113,200
|
)
|
|||
|
Proceeds from issuance of mortgage debt
|
—
|
|
26,550
|
|
|||
|
Principal payments on mortgage debt
|
(966
|
)
|
(803
|
)
|
|||
|
Debt issuance costs
|
(144
|
)
|
(1,331
|
)
|
|||
|
OP Units distributions - General Partner
|
(31,613
|
)
|
(9,716
|
)
|
|||
|
OP Units distributions - Limited Partner
|
(1,523
|
)
|
(1,664
|
)
|
|||
|
Preferred OP Units distributions - Limited Partner
|
(238
|
)
|
—
|
|
|||
|
Distributions to noncontrolling interest — partially owned properties
|
(114
|
)
|
(99
|
)
|
|||
|
Purchase of Limited Partner Units
|
(253
|
)
|
—
|
|
|||
|
Net cash provided by financing activities
|
336,190
|
|
162,854
|
|
|||
|
Net increase (decrease) in cash and cash equivalents
|
6,626
|
|
(49,781
|
)
|
|||
|
Cash and cash equivalents, beginning of period
|
15,923
|
|
56,478
|
|
|||
|
Cash and cash equivalents, end of period
|
$
|
22,549
|
|
$
|
6,697
|
|
|
|
Supplemental disclosure of cash flow information — interest paid during the period
|
$
|
3,332
|
|
$
|
2,607
|
|
|
|
Supplemental disclosure of noncash activity — assumed debt
|
$
|
18,690
|
|
$
|
10,395
|
|
|
|
Supplemental disclosure of noncash activity — issuance of OP Units and Series A Preferred Units in connection with acquisitions
|
$
|
20,438
|
|
$
|
3,135
|
|
|
|
Supplemental disclosure of noncash activity — contingent consideration
|
$
|
1,482
|
|
$
|
—
|
|
|
The accompanying notes are an integral part of these consolidated financial statements.
136
Physicians Realty L.P.
Consolidated Balance Sheets
(In thousands)
|
March 31,
2015
|
December 31,
2014
|
||||||
|
|
(unaudited)
|
|
|||||
|
ASSETS
|
|
|
|
|
|||
|
Investment properties:
|
|
|
|
|
|||
|
Land and improvements
|
$
|
99,950
|
|
$
|
79,334
|
|
|
|
Building and improvements
|
817,673
|
|
644,086
|
|
|||
|
Tenant improvements
|
6,417
|
|
5,614
|
|
|||
|
Acquired lease intangibles
|
109,173
|
|
72,985
|
|
|||
|
|
1,033,213
|
|
802,019
|
|
|||
|
Accumulated depreciation
|
(53,451
|
)
|
(45,569
|
)
|
|||
|
Net real estate property
|
979,762
|
|
756,450
|
|
|||
|
Real estate loans receivable
|
16,094
|
|
15,876
|
|
|||
|
Investment in unconsolidated entity
|
1,324
|
|
1,324
|
|
|||
|
Net real estate investments
|
997,180
|
|
773,650
|
|
|||
|
Cash and cash equivalents
|
35,774
|
|
15,923
|
|
|||
|
Tenant receivables, net
|
2,127
|
|
1,324
|
|
|||
|
Other assets
|
27,142
|
|
16,423
|
|
|||
|
Total assets
|
$
|
1,062,223
|
|
$
|
807,320
|
|
|
|
LIABILITIES AND CAPITAL
|
|
|
|
|
|||
|
Liabilities:
|
|
|
|
|
|||
|
Credit facility
|
$
|
69,384
|
|
$
|
134,144
|
|
|
|
Mortgage debt
|
83,584
|
|
77,708
|
|
|||
|
Accounts payable
|
448
|
|
700
|
|
|||
|
Dividends payable
|
16,722
|
|
16,548
|
|
|||
|
Accrued expenses and other liabilities
|
13,029
|
|
6,140
|
|
|||
|
Acquired lease intangibles, net
|
3,056
|
|
2,871
|
|
|||
|
Total liabilities
|
186,223
|
|
238,111
|
|
|||
|
Redeemable noncontrolling interest - Series A Preferred Units and partially owned properties
|
13,721
|
|
—
|
|
|||
|
Capital:
|
|
|
|
|
|||
|
Partners’ capital:
|
|
|
|
|
|||
|
General partner’s capital, 69,943,001 and 50,640,863 units issued and outstanding as of March 31, 2015 and December 31, 2014, respectively
|
818,634
|
|
534,730
|
|
|||
|
Limited partners’ capital, 3,640,900 and 3,190,339 units issued and outstanding as of March 31, 2015 and December 31, 2014, respectively
|
42,430
|
|
33,727
|
|
|||
|
Total partners’ capital
|
861,064
|
|
568,457
|
|
|||
|
Noncontrolling interest - partially owned properties
|
1,215
|
|
752
|
|
|||
|
Total capital
|
862,279
|
|
569,209
|
|
|||
|
Total liabilities and equity
|
$
|
1,062,223
|
|
|
$
|
807,320
|
|
The accompanying notes are an integral part of these consolidated financial statements.
137
Physicians Realty L.P.
Consolidated Statements of Operations
(In thousands, except units and per units data) (Unaudited)
|
Three Months Ended
March 31,
|
|||||||
|
|
2015
|
2014
|
|||||
|
Revenues:
|
|
|
|
|
|||
|
Rental revenues
|
$
|
20,341
|
|
$
|
6,808
|
|
|
|
Expense recoveries
|
3,536
|
|
1,070
|
|
|||
|
Interest income on real estate loans and other
|
607
|
|
154
|
|
|||
|
Total revenues
|
24,484
|
|
8,032
|
|
|||
|
Expenses:
|
|
|
|
|
|||
|
Interest expense
|
1,710
|
|
1,281
|
|
|||
|
General and administrative
|
3,352
|
|
2,014
|
|
|||
|
Operating expenses
|
5,709
|
|
1,609
|
|
|||
|
Depreciation and amortization
|
8,240
|
|
2,416
|
|
|||
|
Acquisition expenses
|
5,932
|
|
4,287
|
|
|||
|
Total expenses
|
24,943
|
|
11,607
|
|
|||
|
Loss before equity in income of unconsolidated entity and loss on sale of investment property:
|
(459
|
)
|
(3,575
|
)
|
|||
|
Equity in income of unconsolidated entity
|
26
|
|
17
|
|
|||
|
Loss on sale of investment property
|
(15
|
)
|
—
|
|
|||
|
Net loss
|
(448
|
)
|
(3,558
|
)
|
|||
|
Net income attributable to noncontrolling interests - Partially owned properties
|
(32
|
)
|
(66
|
)
|
|||
|
Net loss attributable to controlling interest
|
(480
|
)
|
(3,624
|
)
|
|||
|
Preferred distributions
|
(66
|
)
|
—
|
|
|||
|
Net loss attributable to common unitholders
|
$
|
(546
|
)
|
$
|
(3,624
|
)
|
|
|
Net loss per unit:
|
|
|
|
|
|||
|
Basic and diluted
|
$
|
(0.01
|
)
|
$
|
(0.15
|
)
|
|
|
Weighted average common units:
|
|
|
|
|
|||
|
Basic and diluted
|
69,146,712
|
|
24,997,474
|
|
|||
|
Distributions declared per common OP Unit
|
$
|
0.225
|
|
$
|
0.225
|
|
|
The accompanying notes are an integral part of these consolidated financial statements.
138
Physicians Realty L.P.
Consolidated Statements of Changes in Capital
(In thousands) (Unaudited)
|
|
General Partner
|
Limited Partner
|
Total Partners’ Capital
|
Partially Owned Properties Noncontrolling Interest
|
Total Capital
|
||||||||||||||
|
Balance at January 1, 2015
|
$
|
534,730
|
|
$
|
33,727
|
|
$
|
568,457
|
|
$
|
752
|
|
569,209
|
|
|||||
|
Net proceeds from sale of Trust common shares and issuance of common units
|
301,772
|
|
—
|
|
301,772
|
|
—
|
|
301,772
|
|
|||||||||
|
Trust restricted share award grants, net
|
846
|
|
—
|
|
846
|
|
—
|
|
846
|
|
|||||||||
|
Purchase of OP Units
|
—
|
|
(205
|
)
|
(205
|
)
|
—
|
|
(205
|
)
|
|||||||||
|
Conversion of OP Units
|
18
|
|
(18
|
)
|
—
|
|
—
|
|
—
|
|
|||||||||
|
OP Units - distributions
|
(15,821
|
)
|
(809
|
)
|
(16,630
|
)
|
—
|
|
(16,630
|
)
|
|||||||||
|
Preferred distribution
|
(66
|
)
|
—
|
|
(66
|
)
|
—
|
|
(66
|
)
|
|||||||||
|
Issuance of OP Units in connection with acquisition
|
—
|
|
7,314
|
|
7,314
|
|
—
|
|
7,314
|
|
|||||||||
|
Contributions
|
—
|
|
—
|
|
—
|
|
500
|
|
500
|
|
|||||||||
|
Distributions
|
—
|
|
—
|
|
—
|
|
(69
|
)
|
(69
|
)
|
|||||||||
|
Change in market value of Redeemable Limited Partners
|
56
|
|
—
|
|
56
|
|
—
|
|
56
|
|
|||||||||
|
Net (loss) income
|
(456
|
)
|
(24
|
)
|
(480
|
)
|
32
|
|
(448
|
)
|
|||||||||
|
Adjustments for Limited Partners ownership in Operating Partnership
|
(2,445
|
)
|
2,445
|
|
—
|
|
—
|
|
—
|
|
|||||||||
|
Balance at March 31, 2015
|
$
|
818,634
|
|
$
|
42,430
|
|
$
|
861,064
|
|
$
|
1,215
|
|
$
|
862,279
|
|
||||
The accompanying notes are an integral part of these consolidated financial statements.
139
Physicians Realty L.P.
Consolidated Statements of Cash Flows
(In thousands) (Unaudited)
|
|
Three Months Ended
March 31,
|
||||||
|
|
2015
|
2014
|
|||||
|
Cash Flows from Operating Activities:
|
|
|
|
|
|||
|
Net loss
|
$
|
(448
|
)
|
$
|
(3,558
|
)
|
|
|
Adjustments to reconcile net loss to net cash provided by operating activities
|
|
|
|
|
|||
|
Depreciation and amortization
|
8,240
|
|
2,416
|
|
|||
|
Amortization of deferred financing costs
|
293
|
|
148
|
|
|||
|
Amortization of lease inducements and above/below market lease intangibles
|
302
|
|
81
|
|
|||
|
Straight-line rental revenue/expense
|
(2,012
|
)
|
(652
|
)
|
|||
|
Amortization of above market assumed debt
|
(10
|
)
|
—
|
|
|||
|
Loss on sale of investment property
|
15
|
|
—
|
|
|||
|
Equity in income of unconsolidated entity
|
(26
|
)
|
(17
|
)
|
|||
|
Distribution from unconsolidated entity
|
26
|
|
—
|
|
|||
|
Change in fair value of derivatives
|
(13
|
)
|
(41
|
)
|
|||
|
Provision for bad debts
|
—
|
|
6
|
|
|||
|
Non-cash share compensation
|
867
|
|
356
|
|
|||
|
Change in operating assets and liabilities:
|
|
|
|
|
|||
|
Tenant receivables
|
(1,022
|
)
|
(591
|
)
|
|||
|
Other assets
|
(580
|
)
|
6
|
|
|||
|
Accounts payable
|
(252
|
)
|
(114
|
)
|
|||
|
Accrued expenses and other liabilities
|
4,345
|
|
1,580
|
|
|||
|
Net cash provided by (used in) operating activities
|
9,725
|
|
(380
|
)
|
|||
|
Cash Flows from Investing Activities:
|
|
|
|
|
|||
|
Proceeds on sales of investment property
|
1,550
|
|
—
|
|
|||
|
Acquisition of investment properties, net
|
(205,278
|
)
|
(138,779
|
)
|
|||
|
Capital expenditures on existing investment properties
|
(1,028
|
)
|
—
|
|
|||
|
Real estate loans receivable
|
(4,123
|
)
|
(6,836
|
)
|
|||
|
Leasing commissions
|
(35
|
)
|
(5
|
)
|
|||
|
Lease inducements
|
(462
|
)
|
—
|
|
|||
|
Net cash used in investing activities
|
(209,376
|
)
|
(145,620
|
)
|
|||
|
Cash Flows from Financing Activities:
|
|
|
|
|
|||
|
Net proceeds from sale of Trust common shares and issuance of common units
|
301,772
|
|
(57
|
)
|
|||
|
Proceeds from credit facility borrowings
|
73,000
|
|
80,000
|
|
|||
|
Payment on credit facility borrowings
|
(138,000
|
)
|
—
|
|
|||
|
Proceeds from issuance of mortgage debt
|
—
|
|
26,550
|
|
|||
|
Principal payments on mortgage debt
|
(466
|
)
|
(384
|
)
|
|||
|
Debt issuance costs
|
(24
|
)
|
(761
|
)
|
|||
|
OP Units distributions - General Partner
|
(15,792
|
)
|
(4,848
|
)
|
|||
|
OP Units distributions - Limited Partner
|
(714
|
)
|
(832
|
)
|
|||
|
Distributions to noncontrolling interest — partially owned properties
|
(69
|
)
|
(54
|
)
|
|||
|
Purchase of Limited Partner Units
|
(205
|
)
|
—
|
|
|||
|
Net cash provided by financing activities
|
219,502
|
|
99,614
|
|
|||
|
Net increase (decrease) in cash and cash equivalents
|
19,851
|
|
(46,386
|
)
|
|||
|
Cash and cash equivalents, beginning of year
|
15,923
|
|
56,478
|
|
|||
|
Cash and cash equivalents, end of year
|
$
|
35,774
|
|
$
|
10,092
|
|
|
|
Supplemental disclosure of cash flow information — interest paid during the period
|
$
|
1,402
|
|
$
|
1,025
|
|
|
|
Supplemental disclosure of noncash activity — assumed debt
|
$
|
6,323
|
|
$
|
10,800
|
|
|
|
Supplemental disclosure of noncash activity — issuance of OP Units and Series A Preferred Units in connection with acquisitions
|
$
|
17,017
|
|
$
|
—
|
|
|
|
Supplemental disclosure of noncash activity — contingent consideration
|
$
|
1,482
|
|
$
|
—
|
|
|
The accompanying notes are an integral part of these consolidated financial statements.
140
Physicians Realty Trust and Physicians Realty L.P.
Schedule III – Real Estate and Accumulated Depreciation
December 31, 2016
(dollars in thousands)
|
|
|
|
Initial Cost to Company
|
Gross Amount at Which Carried as of Close of Period
|
|
|
|
|||||||||||||||||||||||||||||||||
|
Description
|
Location
|
Encumbrances
|
Land
|
Buildings and
Improvements
|
Cost
Capitalized
Subsequent
to
Acquisitions
|
Land
|
Buildings and
Improvements
|
Total
|
Accumulated
Depreciation
|
Date of
Construction
|
Date Acquired
|
Life on Which
Building Depreciation
in Income Statement
is Computed
|
||||||||||||||||||||||||||||
|
Arrowhead Commons
|
Phoenix, AZ
|
$
|
—
|
|
$
|
740
|
|
$
|
2,551
|
|
$
|
644
|
|
$
|
740
|
|
$
|
3,195
|
|
$
|
3,935
|
|
$
|
(492
|
)
|
2004
|
5/31/2008
|
46
|
||||||||||||
|
Aurora Medical Office Building
|
Green Bay, WI
|
—
|
|
500
|
|
1,566
|
|
—
|
|
500
|
|
1,566
|
|
2,066
|
|
(211
|
)
|
2010
|
4/15/2010
|
50
|
||||||||||||||||||||
|
Austell Medical Office Building
|
Atlanta, GA
|
—
|
|
289
|
|
1,992
|
|
338
|
|
289
|
|
2,330
|
|
2,619
|
|
(570
|
)
|
1971
|
6/30/2008
|
36
|
||||||||||||||||||||
|
Canton Medical Office Building
|
Atlanta, GA
|
5,986
|
|
710
|
|
7,225
|
|
191
|
|
710
|
|
7,416
|
|
8,126
|
|
(2,342
|
)
|
1994
|
5/25/2007
|
30
|
||||||||||||||||||||
|
Decatur Medical Office Building
|
Atlanta, GA
|
—
|
|
740
|
|
2,604
|
|
44
|
|
740
|
|
2,648
|
|
3,388
|
|
(870
|
)
|
1974
|
10/12/2007
|
28
|
||||||||||||||||||||
|
El Paso Medical Office Building
|
El Paso, TX
|
—
|
|
860
|
|
2,866
|
|
369
|
|
860
|
|
3,235
|
|
4,095
|
|
(1,637
|
)
|
1987
|
8/24/2006
|
21
|
||||||||||||||||||||
|
Farmington Professional Pavilion
|
Detroit, MI
|
—
|
|
580
|
|
1,793
|
|
132
|
|
580
|
|
1,925
|
|
2,505
|
|
(1,339
|
)
|
1972
|
1/5/2006
|
15
|
||||||||||||||||||||
|
Firehouse Square
|
Milwaukee, WI
|
2,628
|
|
1,120
|
|
2,768
|
|
—
|
|
1,120
|
|
2,768
|
|
3,888
|
|
(869
|
)
|
2002
|
8/15/2007
|
30
|
||||||||||||||||||||
|
Hackley Medical Center
|
Grand Rapids, MI
|
5,172
|
|
1,840
|
|
6,402
|
|
64
|
|
1,840
|
|
6,466
|
|
8,306
|
|
(2,144
|
)
|
1968
|
12/22/2006
|
30
|
||||||||||||||||||||
|
MeadowView Professional Center
|
Kingsport, TN
|
10,030
|
|
2,270
|
|
11,344
|
|
—
|
|
2,270
|
|
11,344
|
|
13,614
|
|
(3,677
|
)
|
2005
|
5/10/2007
|
30
|
||||||||||||||||||||
|
Mid Coast Hospital Medical Office Building
|
Portland, ME
|
7,385
|
|
—
|
|
11,247
|
|
47
|
|
—
|
|
11,294
|
|
11,294
|
|
(3,230
|
)
|
2008
|
5/1/2008
|
42
|
||||||||||||||||||||
|
New Albany Professional Building
|
Columbus, OH
|
—
|
|
237
|
|
2,767
|
|
571
|
|
237
|
|
3,338
|
|
3,575
|
|
(666
|
)
|
2000
|
1/4/2008
|
42
|
||||||||||||||||||||
|
Northpark Trail
|
Atlanta, GA
|
—
|
|
839
|
|
1,245
|
|
234
|
|
839
|
|
1,479
|
|
2,318
|
|
(625
|
)
|
2001
|
12/28/2005
|
35
|
||||||||||||||||||||
|
Remington Medical Commons
|
Chicago, IL
|
4,123
|
|
895
|
|
6,499
|
|
318
|
|
895
|
|
6,817
|
|
7,712
|
|
(1,975
|
)
|
2008
|
6/1/2008
|
30
|
||||||||||||||||||||
|
Summit Healthplex
|
Atlanta, GA
|
—
|
|
2,633
|
|
15,576
|
|
5,516
|
|
2,633
|
|
21,092
|
|
23,725
|
|
(4,889
|
)
|
2002
|
7/3/2008
|
44
|
||||||||||||||||||||
|
Valley West Hospital Medical Office Building
|
Chicago, IL
|
4,653
|
|
—
|
|
6,275
|
|
611
|
|
—
|
|
6,886
|
|
6,886
|
|
(2,103
|
)
|
2007
|
11/1/2007
|
30
|
||||||||||||||||||||
|
East El Paso Medical Office Building
|
El Paso, TX
|
—
|
|
710
|
|
4,500
|
|
—
|
|
710
|
|
4,500
|
|
5,210
|
|
(429
|
)
|
2004
|
8/30/2013
|
35
|
||||||||||||||||||||
|
East El Paso Surgical Hospital
|
El Paso, TX
|
—
|
|
3,070
|
|
23,627
|
|
—
|
|
3,070
|
|
23,627
|
|
26,697
|
|
(2,188
|
)
|
2004
|
8/30/2013
|
36
|
||||||||||||||||||||
|
LifeCare Plano LTACH
|
Plano, TX
|
—
|
|
3,370
|
|
11,689
|
|
455
|
|
3,370
|
|
12,144
|
|
15,514
|
|
(1,618
|
)
|
1987
|
9/18/2013
|
25
|
||||||||||||||||||||
|
Crescent City Surgical Centre
|
New Orleans, LA
|
18,750
|
|
—
|
|
34,208
|
|
—
|
|
—
|
|
34,208
|
|
34,208
|
|
(2,316
|
)
|
2010
|
9/30/2013
|
48
|
||||||||||||||||||||
|
Foundation Surgical Affiliates Medical Office Building
|
Oklahoma City, OK
|
7,292
|
|
1,300
|
|
12,724
|
|
—
|
|
1,300
|
|
12,724
|
|
14,024
|
|
(962
|
)
|
2004
|
9/30/2013
|
43
|
||||||||||||||||||||
|
Pensacola Medical Office Building
|
Pensacola, FL
|
—
|
|
990
|
|
5,005
|
|
16
|
|
990
|
|
5,021
|
|
6,011
|
|
(332
|
)
|
2012
|
10/4/2013
|
49
|
||||||||||||||||||||
|
Central Ohio Neurosurgical Surgeons Medical Office
|
Columbus, OH
|
—
|
|
981
|
|
7,620
|
|
—
|
|
981
|
|
7,620
|
|
8,601
|
|
(534
|
)
|
2007
|
11/27/2013
|
44
|
||||||||||||||||||||
|
Great Falls Ambulatory Surgery Center
|
Great Falls, MT
|
—
|
|
203
|
|
3,224
|
|
21
|
|
203
|
|
3,245
|
|
3,448
|
|
(299
|
)
|
1999
|
12/11/2013
|
33
|
||||||||||||||||||||
|
Eagles Landing Family Practice Medical Office Building
|
McDonough, GA
|
—
|
|
800
|
|
3,345
|
|
1,548
|
|
800
|
|
4,893
|
|
5,693
|
|
(393
|
)
|
2007
|
2/19/2014
|
36
|
||||||||||||||||||||
|
Eagles Landing Family Practice Medical Office Building
|
Jackson, GA
|
—
|
|
800
|
|
3,345
|
|
1,255
|
|
800
|
|
4,600
|
|
5,400
|
|
(351
|
)
|
2006
|
2/19/2014
|
38
|
||||||||||||||||||||
|
Eagles Landing Family Practice Medical Office Building
|
Conyers, GA
|
—
|
|
1,000
|
|
3,345
|
|
—
|
|
1,000
|
|
3,345
|
|
4,345
|
|
(266
|
)
|
2008
|
2/19/2014
|
37
|
||||||||||||||||||||
|
Eagles Landing Family Practice Medical Office Building
|
McDonough, GA
|
—
|
|
400
|
|
3,345
|
|
1,741
|
|
400
|
|
5,086
|
|
5,486
|
|
(393
|
)
|
2010
|
2/19/2014
|
37
|
||||||||||||||||||||
|
Foundation San Antonio Surgical Hospital
|
San Antonio, TX
|
8,425
|
|
2,230
|
|
23,346
|
|
43
|
|
2,230
|
|
23,389
|
|
25,619
|
|
(2,157
|
)
|
2007
|
2/19/2014
|
35
|
||||||||||||||||||||
|
21st Century Radiation Oncology Centers — Sarasota
|
Sarasota, FL
|
—
|
|
633
|
|
6,557
|
|
—
|
|
633
|
|
6,557
|
|
7,190
|
|
(716
|
)
|
1975
|
2/26/2014
|
27
|
||||||||||||||||||||
141
Physicians Realty Trust and Physicians Realty L.P.
Schedule III – Real Estate and Accumulated Depreciation
December 31, 2016
(dollars in thousands)
|
|
|
|
Initial Cost to Company
|
Gross Amount at Which Carried as of Close of Period
|
|
|
|
|||||||||||||||||||||||||||||||||
|
Description
|
Location
|
Encumbrances
|
Land
|
Buildings and
Improvements
|
Cost
Capitalized
Subsequent
to
Acquisitions
|
Land
|
Buildings and
Improvements
|
Total
|
Accumulated
Depreciation
|
Date of
Construction
|
Date Acquired
|
Life on Which
Building Depreciation
in Income Statement
is Computed
|
||||||||||||||||||||||||||||
|
21st Century Radiation Oncology Centers - Venice
|
Venice, FL
|
—
|
|
814
|
|
2,952
|
|
—
|
|
814
|
|
2,952
|
|
3,766
|
|
(269
|
)
|
1987
|
2/26/2014
|
35
|
||||||||||||||||||||
|
21st Century Radiation Oncology Centers - Engelwood
|
Engelwood, FL
|
—
|
|
350
|
|
1,878
|
|
—
|
|
350
|
|
1,878
|
|
2,228
|
|
(154
|
)
|
1992
|
2/26/2014
|
38
|
||||||||||||||||||||
|
21st Century Radiation Oncology Centers — Port Charlotte
|
Port Charlotte, FL
|
—
|
|
269
|
|
2,326
|
|
—
|
|
269
|
|
2,326
|
|
2,595
|
|
(193
|
)
|
1996
|
2/26/2014
|
36
|
||||||||||||||||||||
|
Foundation San Antonio Healthplex
|
San Antonio, TX
|
—
|
|
911
|
|
4,189
|
|
—
|
|
911
|
|
4,189
|
|
5,100
|
|
(355
|
)
|
2007
|
2/28/2014
|
35
|
||||||||||||||||||||
|
Peachtree Dunwoody Medical Center
|
Atlanta, GA
|
—
|
|
6,046
|
|
27,435
|
|
1,022
|
|
6,046
|
|
28,457
|
|
34,503
|
|
(3,216
|
)
|
1987
|
2/28/2014
|
25
|
||||||||||||||||||||
|
LifeCare LTACH — Fort Worth
|
Fort Worth, TX
|
—
|
|
2,730
|
|
24,639
|
|
—
|
|
2,730
|
|
24,639
|
|
27,369
|
|
(2,319
|
)
|
1985
|
3/28/2014
|
30
|
||||||||||||||||||||
|
LifeCare LTACH — Pittsburgh
|
Pittsburgh, PA
|
—
|
|
1,142
|
|
11,737
|
|
—
|
|
1,142
|
|
11,737
|
|
12,879
|
|
(1,155
|
)
|
1987
|
3/28/2014
|
30
|
||||||||||||||||||||
|
PinnacleHealth Medical Office Building
|
Harrisburg, PA
|
—
|
|
795
|
|
4,601
|
|
—
|
|
795
|
|
4,601
|
|
5,396
|
|
(531
|
)
|
1990
|
4/22/2014
|
25
|
||||||||||||||||||||
|
Pinnacle Health Medical Office Building
|
Carlisle, PA
|
—
|
|
424
|
|
2,232
|
|
—
|
|
424
|
|
2,232
|
|
2,656
|
|
(185
|
)
|
2002
|
4/22/2014
|
35
|
||||||||||||||||||||
|
South Bend Orthopaedics Medical Office Building
|
Mishawaka, IN
|
—
|
|
2,418
|
|
11,355
|
|
—
|
|
2,418
|
|
11,355
|
|
13,773
|
|
(869
|
)
|
2007
|
4/30/2014
|
40
|
||||||||||||||||||||
|
Grenada Medical Complex
|
Grenada, MS
|
—
|
|
185
|
|
5,820
|
|
89
|
|
185
|
|
5,909
|
|
6,094
|
|
(620
|
)
|
1975
|
4/30/2014
|
30
|
||||||||||||||||||||
|
Mississippi Ortho Medical Office Building
|
Jackson, MS
|
—
|
|
1,272
|
|
14,177
|
|
626
|
|
1,272
|
|
14,803
|
|
16,075
|
|
(1,182
|
)
|
1987
|
5/23/2014
|
35
|
||||||||||||||||||||
|
Carmel Medical Pavilion
|
Carmel, IN
|
—
|
|
—
|
|
3,917
|
|
—
|
|
—
|
|
3,917
|
|
3,917
|
|
(428
|
)
|
1993
|
5/28/2014
|
25
|
||||||||||||||||||||
|
Renaissance Ambulatory Surgery Center
|
Oshkosh, WI
|
—
|
|
228
|
|
7,658
|
|
8
|
|
228
|
|
7,666
|
|
7,894
|
|
(496
|
)
|
2007
|
6/30/2014
|
40
|
||||||||||||||||||||
|
Presbyterian Medical Plaza
|
Monroe, NC
|
—
|
|
1,195
|
|
5,681
|
|
6
|
|
1,195
|
|
5,687
|
|
6,882
|
|
(338
|
)
|
2008
|
6/30/2014
|
45
|
||||||||||||||||||||
|
Summit Urology
|
Bloomington, IN
|
—
|
|
125
|
|
4,792
|
|
—
|
|
125
|
|
4,792
|
|
4,917
|
|
(409
|
)
|
1996
|
6/30/2014
|
30
|
||||||||||||||||||||
|
500 Landmark
|
Bloomington, IN
|
—
|
|
627
|
|
3,549
|
|
—
|
|
627
|
|
3,549
|
|
4,176
|
|
(264
|
)
|
2000
|
7/1/2014
|
35
|
||||||||||||||||||||
|
550 Landmark
|
Bloomington, IN
|
—
|
|
2,717
|
|
15,224
|
|
—
|
|
2,717
|
|
15,224
|
|
17,941
|
|
(1,133
|
)
|
2000
|
7/1/2014
|
35
|
||||||||||||||||||||
|
574 Landmark
|
Bloomington, IN
|
—
|
|
418
|
|
1,493
|
|
—
|
|
418
|
|
1,493
|
|
1,911
|
|
(114
|
)
|
2004
|
7/1/2014
|
35
|
||||||||||||||||||||
|
Carlisle II MOB
|
Carlisle, PA
|
—
|
|
412
|
|
3,962
|
|
—
|
|
412
|
|
3,962
|
|
4,374
|
|
(224
|
)
|
1996
|
7/25/2014
|
45
|
||||||||||||||||||||
|
Surgical Institute of Monroe
|
Monroe, MI
|
—
|
|
410
|
|
5,743
|
|
—
|
|
410
|
|
5,743
|
|
6,153
|
|
(466
|
)
|
2010
|
7/28/2014
|
35
|
||||||||||||||||||||
|
The Oaks @ Lady Lake
|
Lady Lake, FL
|
—
|
|
1,065
|
|
8,642
|
|
—
|
|
1,065
|
|
8,642
|
|
9,707
|
|
(502
|
)
|
2011
|
7/31/2014
|
42
|
||||||||||||||||||||
|
Mansfield ASC
|
Mansfield, TX
|
—
|
|
1,491
|
|
6,471
|
|
—
|
|
1,491
|
|
6,471
|
|
7,962
|
|
(362
|
)
|
2010
|
9/2/2014
|
46
|
||||||||||||||||||||
|
Eye Center of Southern Indiana
|
Bloomington, IN
|
—
|
|
910
|
|
11,477
|
|
—
|
|
910
|
|
11,477
|
|
12,387
|
|
(793
|
)
|
1995
|
9/5/2014
|
35
|
||||||||||||||||||||
|
Wayne State
|
Troy, MI
|
—
|
|
3,560
|
|
43,052
|
|
—
|
|
3,560
|
|
43,052
|
|
46,612
|
|
(2,745
|
)
|
1986
|
9/10/2014
|
38
|
||||||||||||||||||||
|
Zangmeister
|
Columbus, OH
|
—
|
|
1,610
|
|
31,120
|
|
—
|
|
1,610
|
|
31,120
|
|
32,730
|
|
(1,831
|
)
|
2007
|
9/30/2014
|
40
|
||||||||||||||||||||
|
Ortho One - Columbus
|
Columbus, OH
|
—
|
|
—
|
|
16,234
|
|
7
|
|
—
|
|
16,241
|
|
16,241
|
|
(906
|
)
|
2009
|
9/30/2014
|
45
|
||||||||||||||||||||
|
Ortho One - Westerville
|
Columbus, OH
|
—
|
|
362
|
|
3,944
|
|
—
|
|
362
|
|
3,944
|
|
4,306
|
|
(227
|
)
|
2007
|
9/30/2014
|
43
|
||||||||||||||||||||
|
Berger Medical Center
|
Columbus, OH
|
—
|
|
—
|
|
5,950
|
|
—
|
|
—
|
|
5,950
|
|
5,950
|
|
(388
|
)
|
2007
|
9/30/2014
|
38
|
||||||||||||||||||||
|
El Paso - Lee Trevino
|
El Paso, TX
|
—
|
|
2,294
|
|
11,316
|
|
396
|
|
2,294
|
|
11,712
|
|
14,006
|
|
(931
|
)
|
1983
|
9/30/2014
|
30
|
||||||||||||||||||||
|
El Paso - Murchison
|
El Paso, TX
|
—
|
|
2,283
|
|
24,543
|
|
974
|
|
2,283
|
|
25,517
|
|
27,800
|
|
(1,942
|
)
|
1970
|
9/30/2014
|
30
|
||||||||||||||||||||
|
El Paso - Kenworthy
|
El Paso, TX
|
—
|
|
728
|
|
2,178
|
|
21
|
|
728
|
|
2,199
|
|
2,927
|
|
(157
|
)
|
1983
|
9/30/2014
|
35
|
||||||||||||||||||||
|
Pinnacle - 32 Northeast
|
Harrisburg, PA
|
—
|
|
408
|
|
3,232
|
|
27
|
|
408
|
|
3,259
|
|
3,667
|
|
(239
|
)
|
1994
|
10/29/2014
|
33
|
||||||||||||||||||||
142
Physicians Realty Trust and Physicians Realty L.P.
Schedule III – Real Estate and Accumulated Depreciation
December 31, 2016
(dollars in thousands)
|
|
|
|
Initial Cost to Company
|
Gross Amount at Which Carried as of Close of Period
|
|
|
|
|||||||||||||||||||||||||||||||||
|
Description
|
Location
|
Encumbrances
|
Land
|
Buildings and
Improvements
|
Cost
Capitalized
Subsequent
to
Acquisitions
|
Land
|
Buildings and
Improvements
|
Total
|
Accumulated
Depreciation
|
Date of
Construction
|
Date Acquired
|
Life on Which
Building Depreciation
in Income Statement
is Computed
|
||||||||||||||||||||||||||||
|
Pinnacle - 4518 Union Deposit
|
Harrisburg, PA
|
—
|
|
617
|
|
7,305
|
|
15
|
|
617
|
|
7,320
|
|
7,937
|
|
(549
|
)
|
2000
|
10/29/2014
|
31
|
||||||||||||||||||||
|
Pinnacle - 4520 Union Deposit
|
Harrisburg, PA
|
—
|
|
169
|
|
2,055
|
|
—
|
|
169
|
|
2,055
|
|
2,224
|
|
(167
|
)
|
1997
|
10/29/2014
|
28
|
||||||||||||||||||||
|
Pinnacle - 240 Grandview
|
Harrisburg, PA
|
—
|
|
321
|
|
4,242
|
|
—
|
|
321
|
|
4,242
|
|
4,563
|
|
(281
|
)
|
1980
|
10/29/2014
|
35
|
||||||||||||||||||||
|
Pinnacle - Market Place Way
|
Harrisburg, PA
|
—
|
|
808
|
|
2,383
|
|
6
|
|
808
|
|
2,389
|
|
3,197
|
|
(214
|
)
|
2004
|
10/29/2014
|
35
|
||||||||||||||||||||
|
CRHS - 2000 10th Avenue
|
Columbus, GA
|
—
|
|
380
|
|
2,737
|
|
—
|
|
380
|
|
2,737
|
|
3,117
|
|
(291
|
)
|
1989
|
11/20/2014
|
22
|
||||||||||||||||||||
|
CRHS - 1942 North Avenue
|
Columbus, GA
|
—
|
|
91
|
|
273
|
|
—
|
|
91
|
|
273
|
|
364
|
|
(49
|
)
|
1971
|
11/20/2014
|
12
|
||||||||||||||||||||
|
CRHS - 920 18th Street
|
Columbus, GA
|
—
|
|
110
|
|
281
|
|
—
|
|
110
|
|
281
|
|
391
|
|
(77
|
)
|
1982
|
11/20/2014
|
8
|
||||||||||||||||||||
|
CRHS - 1900 10th Avenue
|
Columbus, GA
|
—
|
|
474
|
|
5,580
|
|
124
|
|
474
|
|
5,704
|
|
6,178
|
|
(492
|
)
|
1976
|
11/20/2014
|
26
|
||||||||||||||||||||
|
CRHS - 1800 10th Avenue
|
Columbus, GA
|
—
|
|
539
|
|
5,238
|
|
—
|
|
539
|
|
5,238
|
|
5,777
|
|
(415
|
)
|
1980
|
11/20/2014
|
28
|
||||||||||||||||||||
|
CRHS - 705 17th Street
|
Columbus, GA
|
—
|
|
372
|
|
2,346
|
|
278
|
|
372
|
|
2,624
|
|
2,996
|
|
(386
|
)
|
1994
|
11/20/2014
|
15
|
||||||||||||||||||||
|
CRHS - 615 19th Street
|
Columbus, GA
|
—
|
|
75
|
|
113
|
|
—
|
|
75
|
|
113
|
|
188
|
|
(74
|
)
|
1976
|
11/20/2014
|
3
|
||||||||||||||||||||
|
CRHS - 1968 North Avenue
|
Columbus, GA
|
—
|
|
89
|
|
32
|
|
—
|
|
89
|
|
32
|
|
121
|
|
(18
|
)
|
1966
|
11/20/2014
|
4
|
||||||||||||||||||||
|
CRHS - 633 19th Street
|
Columbus, GA
|
—
|
|
99
|
|
255
|
|
—
|
|
99
|
|
255
|
|
354
|
|
(63
|
)
|
1972
|
11/20/2014
|
9
|
||||||||||||||||||||
|
CRHS - 500 18th Street
|
Columbus, GA
|
—
|
|
430
|
|
170
|
|
7
|
|
430
|
|
177
|
|
607
|
|
(75
|
)
|
1982
|
11/20/2014
|
8
|
||||||||||||||||||||
|
CRHS - 2200 Hamilton Road
|
Columbus, GA
|
—
|
|
267
|
|
1,579
|
|
22
|
|
267
|
|
1,601
|
|
1,868
|
|
(165
|
)
|
1992
|
11/20/2014
|
22
|
||||||||||||||||||||
|
CRHS - 1810 Stadium Drive
|
Phenix City, AL
|
—
|
|
202
|
|
149
|
|
26
|
|
202
|
|
175
|
|
377
|
|
(62
|
)
|
1999
|
11/20/2014
|
30
|
||||||||||||||||||||
|
Carle Danville MOB
|
Danville, IL
|
—
|
|
607
|
|
7,136
|
|
—
|
|
607
|
|
7,136
|
|
7,743
|
|
(482
|
)
|
2007
|
11/26/2014
|
33
|
||||||||||||||||||||
|
Middletown Medical - 111 Maltese
|
Middletown, NY
|
—
|
|
670
|
|
9,921
|
|
37
|
|
670
|
|
9,958
|
|
10,628
|
|
(614
|
)
|
1988
|
11/28/2014
|
35
|
||||||||||||||||||||
|
Middletown Medical - 2 Edgewater
|
Middletown, NY
|
—
|
|
200
|
|
2,966
|
|
11
|
|
200
|
|
2,977
|
|
3,177
|
|
(184
|
)
|
1992
|
11/28/2014
|
35
|
||||||||||||||||||||
|
Napoleon Medical Office Building
|
New Orleans, LA
|
—
|
|
1,202
|
|
7,412
|
|
387
|
|
1,202
|
|
7,799
|
|
9,001
|
|
(645
|
)
|
1974
|
12/19/2014
|
25
|
||||||||||||||||||||
|
West TN Bone & Joint - Physicians Drive
|
Jackson, TN
|
—
|
|
1,661
|
|
2,960
|
|
—
|
|
1,661
|
|
2,960
|
|
4,621
|
|
(180
|
)
|
1991
|
12/30/2014
|
35
|
||||||||||||||||||||
|
West TN Bone & Joint
|
Jackson, TN
|
—
|
|
1,250
|
|
5,210
|
|
—
|
|
1,250
|
|
5,210
|
|
6,460
|
|
(362
|
)
|
1996
|
12/30/2014
|
31
|
||||||||||||||||||||
|
Edina MOB
|
Edina MN
|
—
|
|
504
|
|
10,006
|
|
862
|
|
504
|
|
10,868
|
|
11,372
|
|
(1,086
|
)
|
1979
|
1/22/2015
|
24
|
||||||||||||||||||||
|
Crystal MOB
|
Crystal, MN
|
—
|
|
945
|
|
11,862
|
|
—
|
|
945
|
|
11,862
|
|
12,807
|
|
(577
|
)
|
2012
|
1/22/2015
|
47
|
||||||||||||||||||||
|
Savage MOB
|
Savage, MN
|
5,605
|
|
1,281
|
|
10,021
|
|
—
|
|
1,281
|
|
10,021
|
|
11,302
|
|
(506
|
)
|
2011
|
1/22/2015
|
48
|
||||||||||||||||||||
|
Dell Road MOB
|
Chanhassen, MN
|
—
|
|
800
|
|
4,520
|
|
—
|
|
800
|
|
4,520
|
|
5,320
|
|
(250
|
)
|
2008
|
1/22/2015
|
43
|
||||||||||||||||||||
|
Columbus MOB
|
Columbus, GA
|
—
|
|
845
|
|
2,708
|
|
—
|
|
845
|
|
2,708
|
|
3,553
|
|
(309
|
)
|
1980
|
1/23/2015
|
22
|
||||||||||||||||||||
|
Methodist Sports MOB
|
Greenwood, IN
|
—
|
|
1,050
|
|
8,556
|
|
—
|
|
1,050
|
|
8,556
|
|
9,606
|
|
(522
|
)
|
2008
|
1/28/2015
|
33
|
||||||||||||||||||||
|
Vadnais Heights MOB
|
Vadnais Heights, MN
|
—
|
|
2,751
|
|
12,233
|
|
—
|
|
2,751
|
|
12,233
|
|
14,984
|
|
(702
|
)
|
2013
|
1/29/2015
|
43
|
||||||||||||||||||||
|
Minnetonka MOB
|
Minnetonka, MN
|
—
|
|
1,770
|
|
19,797
|
|
—
|
|
1,770
|
|
19,797
|
|
21,567
|
|
(957
|
)
|
2014
|
2/5/2015
|
49
|
||||||||||||||||||||
|
Jamestown MOB
|
Jamestown, ND
|
—
|
|
656
|
|
9,440
|
|
—
|
|
656
|
|
9,440
|
|
10,096
|
|
(562
|
)
|
2013
|
2/5/2015
|
43
|
||||||||||||||||||||
|
Indiana American II
|
Greenwood, IN
|
—
|
|
862
|
|
6,901
|
|
126
|
|
862
|
|
7,027
|
|
7,889
|
|
(388
|
)
|
2008
|
2/13/2015
|
38
|
||||||||||||||||||||
|
Indiana American III
|
Greenwood, IN
|
—
|
|
741
|
|
1,846
|
|
185
|
|
741
|
|
2,031
|
|
2,772
|
|
(209
|
)
|
2001
|
2/13/2015
|
31
|
||||||||||||||||||||
|
Indiana American IV
|
Greenwood, IN
|
—
|
|
771
|
|
1,928
|
|
77
|
|
771
|
|
2,005
|
|
2,776
|
|
(132
|
)
|
2001
|
2/13/2015
|
31
|
||||||||||||||||||||
|
Southpointe
|
Indianapolis, IN
|
—
|
|
563
|
|
1,741
|
|
—
|
|
563
|
|
1,741
|
|
2,304
|
|
(162
|
)
|
1993
|
2/13/2015
|
27
|
||||||||||||||||||||
|
Minnesota Eye MOB
|
Minnetonka, MN
|
—
|
|
1,143
|
|
7,470
|
|
—
|
|
1,143
|
|
7,470
|
|
8,613
|
|
(383
|
)
|
2014
|
2/17/2015
|
44
|
||||||||||||||||||||
|
Baylor Cancer Center
|
Dallas, TX
|
—
|
|
855
|
|
6,007
|
|
19
|
|
855
|
|
6,026
|
|
6,881
|
|
(275
|
)
|
2001
|
2/27/2015
|
43
|
||||||||||||||||||||
143
Physicians Realty Trust and Physicians Realty L.P.
Schedule III – Real Estate and Accumulated Depreciation
December 31, 2016
(dollars in thousands)
|
|
|
|
Initial Cost to Company
|
Gross Amount at Which Carried as of Close of Period
|
|
|
|
|||||||||||||||||||||||||||||||||
|
Description
|
Location
|
Encumbrances
|
Land
|
Buildings and
Improvements
|
Cost
Capitalized
Subsequent
to
Acquisitions
|
Land
|
Buildings and
Improvements
|
Total
|
Accumulated
Depreciation
|
Date of
Construction
|
Date Acquired
|
Life on Which
Building Depreciation
in Income Statement
is Computed
|
||||||||||||||||||||||||||||
|
Bridgeport Medical Center
|
Lakewood, WA
|
—
|
|
1,397
|
|
10,435
|
|
—
|
|
1,397
|
|
10,435
|
|
11,832
|
|
(581
|
)
|
2004
|
2/27/2015
|
35
|
||||||||||||||||||||
|
Renaissance Office Building
|
Milwaukee, WI
|
—
|
|
1,379
|
|
4,182
|
|
2,314
|
|
1,379
|
|
6,496
|
|
7,875
|
|
(614
|
)
|
1896
|
3/27/2015
|
15
|
||||||||||||||||||||
|
Calkins 125
|
Rochester, NY
|
—
|
|
534
|
|
10,164
|
|
11
|
|
534
|
|
10,175
|
|
10,709
|
|
(735
|
)
|
1997
|
3/31/2015
|
32
|
||||||||||||||||||||
|
Calkins 200
|
Rochester, NY
|
—
|
|
210
|
|
3,317
|
|
—
|
|
210
|
|
3,317
|
|
3,527
|
|
(206
|
)
|
2000
|
3/31/2015
|
38
|
||||||||||||||||||||
|
Calkins 300
|
Rochester, NY
|
—
|
|
372
|
|
6,645
|
|
—
|
|
372
|
|
6,645
|
|
7,017
|
|
(414
|
)
|
2002
|
3/31/2015
|
39
|
||||||||||||||||||||
|
Calkins 400
|
Rochester, NY
|
—
|
|
353
|
|
8,226
|
|
8
|
|
353
|
|
8,234
|
|
8,587
|
|
(549
|
)
|
2007
|
3/31/2015
|
39
|
||||||||||||||||||||
|
Calkins 500
|
Rochester, NY
|
—
|
|
282
|
|
7,074
|
|
11
|
|
282
|
|
7,085
|
|
7,367
|
|
(374
|
)
|
2008
|
3/31/2015
|
41
|
||||||||||||||||||||
|
Avalon Park Florida Hospital MOB
|
Avalon Park, FL
|
—
|
|
1,041
|
|
10,685
|
|
—
|
|
1,041
|
|
10,685
|
|
11,726
|
|
(497
|
)
|
2009
|
3/31/2015
|
41
|
||||||||||||||||||||
|
Premier Surgery Center of Louisville
|
Louisville, KY
|
—
|
|
1,106
|
|
5,437
|
|
—
|
|
1,106
|
|
5,437
|
|
6,543
|
|
(238
|
)
|
2013
|
4/10/2015
|
43
|
||||||||||||||||||||
|
Baton Rouge MOB
|
Baton Rouge, LA
|
—
|
|
711
|
|
7,720
|
|
—
|
|
711
|
|
7,720
|
|
8,431
|
|
(404
|
)
|
2003
|
4/15/2015
|
35
|
||||||||||||||||||||
|
Healthpark Medical Center
|
Grand Blanc, MI
|
—
|
|
—
|
|
17,624
|
|
—
|
|
—
|
|
17,624
|
|
17,624
|
|
(896
|
)
|
2006
|
4/30/2015
|
36
|
||||||||||||||||||||
|
Plaza HCA MOB
|
Jacksonville, FL
|
11,645
|
|
1,112
|
|
12,553
|
|
—
|
|
1,112
|
|
12,553
|
|
13,665
|
|
(564
|
)
|
2007
|
4/30/2015
|
39
|
||||||||||||||||||||
|
Northern Ohio Medical Center
|
Sheffield, OH
|
—
|
|
644
|
|
9,162
|
|
—
|
|
644
|
|
9,162
|
|
9,806
|
|
(751
|
)
|
1999
|
5/28/2015
|
20
|
||||||||||||||||||||
|
University of Michigan - Northville MOB
|
Livonia, MI
|
—
|
|
2,200
|
|
8,627
|
|
150
|
|
2,200
|
|
8,777
|
|
10,977
|
|
(490
|
)
|
1988
|
5/29/2015
|
30
|
||||||||||||||||||||
|
Coon Rapids Medical Center MOB
|
Coon Rapids, MN
|
—
|
|
607
|
|
5,857
|
|
—
|
|
607
|
|
5,857
|
|
6,464
|
|
(287
|
)
|
2007
|
6/1/2015
|
35
|
||||||||||||||||||||
|
Premier Landmark MOB
|
Bloomington, IN
|
—
|
|
872
|
|
10,537
|
|
—
|
|
872
|
|
10,537
|
|
11,409
|
|
(447
|
)
|
2008
|
6/5/2015
|
39
|
||||||||||||||||||||
|
Palm Beach ASC
|
Palm Beach, FL
|
—
|
|
2,576
|
|
7,675
|
|
—
|
|
2,576
|
|
7,675
|
|
10,251
|
|
(304
|
)
|
2003
|
6/26/2015
|
40
|
||||||||||||||||||||
|
Brookstone Physician Center MOB
|
Jacksonville, AL
|
—
|
|
—
|
|
1,913
|
|
—
|
|
—
|
|
1,913
|
|
1,913
|
|
(100
|
)
|
2007
|
6/30/2015
|
31
|
||||||||||||||||||||
|
Jackson Woman's Clinic MOB
|
Jackson, TN
|
—
|
|
555
|
|
3,800
|
|
10
|
|
555
|
|
3,810
|
|
4,365
|
|
(175
|
)
|
1998
|
6/30/2015
|
35
|
||||||||||||||||||||
|
Hillside Medical Center MOB
|
Hanover, PA
|
—
|
|
812
|
|
13,217
|
|
23
|
|
812
|
|
13,240
|
|
14,052
|
|
(534
|
)
|
2003
|
6/30/2015
|
35
|
||||||||||||||||||||
|
Randall Road MOB
|
Elgin, IL
|
—
|
|
1,124
|
|
15,404
|
|
486
|
|
1,124
|
|
15,890
|
|
17,014
|
|
(610
|
)
|
2006
|
6/30/2015
|
38
|
||||||||||||||||||||
|
Medical Specialists of Palm Beach MOB
|
Atlantis, FL
|
—
|
|
—
|
|
7,560
|
|
6
|
|
—
|
|
7,566
|
|
7,566
|
|
(317
|
)
|
2002
|
7/24/2015
|
37
|
||||||||||||||||||||
|
OhioHealth - SW Health Center MOB
|
Grove City, OH
|
—
|
|
1,363
|
|
8,516
|
|
—
|
|
1,363
|
|
8,516
|
|
9,879
|
|
(373
|
)
|
2001
|
7/31/2015
|
37
|
||||||||||||||||||||
|
Trios Health MOB
|
Kennewick, WA
|
—
|
|
—
|
|
55,178
|
|
3,795
|
|
—
|
|
58,973
|
|
58,973
|
|
(1,822
|
)
|
2015
|
7/31/2015
|
45
|
||||||||||||||||||||
|
IMS - Paradise Valley MOB
|
Phoenix, AZ
|
—
|
|
—
|
|
25,893
|
|
—
|
|
—
|
|
25,893
|
|
25,893
|
|
(960
|
)
|
2004
|
8/14/2015
|
43
|
||||||||||||||||||||
|
IMS - Avondale MOB
|
Avondale, AZ
|
—
|
|
1,818
|
|
18,108
|
|
10
|
|
1,818
|
|
18,118
|
|
19,936
|
|
(583
|
)
|
2006
|
8/19/2015
|
45
|
||||||||||||||||||||
|
IMS - Palm Valley MOB
|
Goodyear, AZ
|
—
|
|
2,666
|
|
28,655
|
|
—
|
|
2,666
|
|
28,655
|
|
31,321
|
|
(962
|
)
|
2006
|
8/19/2015
|
43
|
||||||||||||||||||||
|
IMS - North Mountain MOB
|
Phoenix, AZ
|
—
|
|
—
|
|
42,877
|
|
18
|
|
—
|
|
42,895
|
|
42,895
|
|
(1,341
|
)
|
2008
|
8/31/2015
|
47
|
||||||||||||||||||||
|
Memorial Hermann - Phase I
|
Katy, TX
|
—
|
|
822
|
|
6,797
|
|
19
|
|
822
|
|
6,816
|
|
7,638
|
|
(250
|
)
|
2005
|
9/1/2015
|
39
|
||||||||||||||||||||
|
Memorial Hermann - Phase II
|
Katy, TX
|
—
|
|
1,560
|
|
25,601
|
|
17
|
|
1,560
|
|
25,618
|
|
27,178
|
|
(899
|
)
|
2006
|
9/1/2015
|
40
|
||||||||||||||||||||
|
New Albany Medical Center MOB
|
New Albany, OH
|
—
|
|
1,600
|
|
8,505
|
|
47
|
|
1,600
|
|
8,552
|
|
10,152
|
|
(347
|
)
|
2005
|
9/9/2015
|
37
|
||||||||||||||||||||
|
Fountain Hills Medical Campus MOB
|
Fountain Hills, AZ
|
—
|
|
2,593
|
|
7,635
|
|
—
|
|
2,593
|
|
7,635
|
|
10,228
|
|
(275
|
)
|
1995
|
9/30/2015
|
39
|
||||||||||||||||||||
|
Fairhope MOB
|
Fairhope, AL
|
—
|
|
640
|
|
5,227
|
|
14
|
|
640
|
|
5,241
|
|
5,881
|
|
(193
|
)
|
2005
|
10/13/2015
|
38
|
||||||||||||||||||||
|
Foley MOB
|
Foley, AL
|
—
|
|
365
|
|
732
|
|
—
|
|
365
|
|
732
|
|
1,097
|
|
(27
|
)
|
1997
|
10/13/2015
|
40
|
||||||||||||||||||||
144
Physicians Realty Trust and Physicians Realty L.P.
Schedule III – Real Estate and Accumulated Depreciation
December 31, 2016
(dollars in thousands)
|
|
|
|
Initial Cost to Company
|
Gross Amount at Which Carried as of Close of Period
|
|
|
|
|||||||||||||||||||||||||||||||||
|
Description
|
Location
|
Encumbrances
|
Land
|
Buildings and
Improvements
|
Cost
Capitalized
Subsequent
to
Acquisitions
|
Land
|
Buildings and
Improvements
|
Total
|
Accumulated
Depreciation
|
Date of
Construction
|
Date Acquired
|
Life on Which
Building Depreciation
in Income Statement
is Computed
|
||||||||||||||||||||||||||||
|
Foley Venture
|
Foley, AL
|
—
|
|
420
|
|
1,118
|
|
—
|
|
420
|
|
1,118
|
|
1,538
|
|
(41
|
)
|
2002
|
10/13/2015
|
38
|
||||||||||||||||||||
|
North Okaloosa MOB
|
Crestview, FL
|
—
|
|
190
|
|
1,010
|
|
—
|
|
190
|
|
1,010
|
|
1,200
|
|
(34
|
)
|
2005
|
10/13/2015
|
41
|
||||||||||||||||||||
|
Commons on North Davis
|
Pensacola, FL
|
—
|
|
380
|
|
1,237
|
|
—
|
|
380
|
|
1,237
|
|
1,617
|
|
(42
|
)
|
2009
|
10/13/2015
|
41
|
||||||||||||||||||||
|
Sorrento Road
|
Pensacola, FL
|
—
|
|
170
|
|
894
|
|
—
|
|
170
|
|
894
|
|
1,064
|
|
(31
|
)
|
2010
|
10/13/2015
|
41
|
||||||||||||||||||||
|
Breakfast Point Medical Park
|
Panama City, FL
|
—
|
|
—
|
|
817
|
|
—
|
|
—
|
|
817
|
|
817
|
|
(26
|
)
|
2012
|
10/13/2015
|
42
|
||||||||||||||||||||
|
Panama City Beach
|
Panama City, FL
|
—
|
|
—
|
|
739
|
|
—
|
|
—
|
|
739
|
|
739
|
|
(23
|
)
|
2012
|
10/13/2015
|
42
|
||||||||||||||||||||
|
Perdido Medical Park
|
Pensacola, FL
|
—
|
|
100
|
|
1,147
|
|
—
|
|
100
|
|
1,147
|
|
1,247
|
|
(38
|
)
|
2010
|
10/13/2015
|
41
|
||||||||||||||||||||
|
Ft. Walton Beach
|
Ft. Walton Beach, FL
|
—
|
|
230
|
|
914
|
|
—
|
|
230
|
|
914
|
|
1,144
|
|
(35
|
)
|
1979
|
10/13/2015
|
35
|
||||||||||||||||||||
|
Panama City
|
Panama City, FL
|
—
|
|
—
|
|
661
|
|
—
|
|
—
|
|
661
|
|
661
|
|
(23
|
)
|
2003
|
10/13/2015
|
38
|
||||||||||||||||||||
|
Pensacola - Catalyst
|
Pensacola, FL
|
—
|
|
220
|
|
1,685
|
|
—
|
|
220
|
|
1,685
|
|
1,905
|
|
(58
|
)
|
2001
|
10/13/2015
|
39
|
||||||||||||||||||||
|
Arete Surgical Center
|
Johnstown, CO
|
—
|
|
399
|
|
6,667
|
|
—
|
|
399
|
|
6,667
|
|
7,066
|
|
(181
|
)
|
2013
|
10/19/2015
|
45
|
||||||||||||||||||||
|
Cambridge Professional Center MOB
|
Waldorf, MD
|
—
|
|
590
|
|
8,520
|
|
26
|
|
590
|
|
8,546
|
|
9,136
|
|
(315
|
)
|
1999
|
10/30/2015
|
35
|
||||||||||||||||||||
|
HonorHealth 44th Street MOB
|
Phoenix, AZ
|
—
|
|
515
|
|
3,884
|
|
—
|
|
515
|
|
3,884
|
|
4,399
|
|
(178
|
)
|
1988
|
11/13/2015
|
28
|
||||||||||||||||||||
|
Mercy Medical Center MOB
|
Fenton, MO
|
—
|
|
1,201
|
|
6,778
|
|
—
|
|
1,201
|
|
6,778
|
|
7,979
|
|
(202
|
)
|
1999
|
12/1/2015
|
40
|
||||||||||||||||||||
|
Nashville MOB
|
Nashville, TN
|
—
|
|
1,555
|
|
39,713
|
|
—
|
|
1,555
|
|
39,713
|
|
41,268
|
|
(883
|
)
|
2015
|
12/17/2015
|
46
|
||||||||||||||||||||
|
KSF Orthopaedic MOB
|
Houston, TX
|
—
|
|
530
|
|
3,712
|
|
—
|
|
530
|
|
3,712
|
|
4,242
|
|
(214
|
)
|
1984
|
12/22/2015
|
19
|
||||||||||||||||||||
|
Great Falls Clinic MOB
|
Great Falls, MT
|
—
|
|
—
|
|
27,402
|
|
—
|
|
—
|
|
27,402
|
|
27,402
|
|
(737
|
)
|
2004
|
12/29/2015
|
40
|
||||||||||||||||||||
|
Great Falls Hospital
|
Great Falls, MT
|
—
|
|
—
|
|
25,262
|
|
—
|
|
—
|
|
25,262
|
|
25,262
|
|
(661
|
)
|
2015
|
1/25/2016
|
40
|
||||||||||||||||||||
|
Monterey Medical Center ASC
|
Stuart, FL
|
—
|
|
380
|
|
5,064
|
|
—
|
|
380
|
|
5,064
|
|
5,444
|
|
(115
|
)
|
2013
|
2/1/2016
|
42
|
||||||||||||||||||||
|
Physicians Medical Plaza MOB
|
Indianapolis, IN
|
—
|
|
—
|
|
6,703
|
|
—
|
|
—
|
|
6,703
|
|
6,703
|
|
(197
|
)
|
2004
|
2/1/2016
|
34
|
||||||||||||||||||||
|
Park Nicollet Clinic
|
Chanhassen, MN
|
—
|
|
1,941
|
|
14,555
|
|
—
|
|
1,941
|
|
14,555
|
|
16,496
|
|
(363
|
)
|
2005
|
2/8/2016
|
40
|
||||||||||||||||||||
|
HEB Cancer Center
|
Bedford, TX
|
—
|
|
—
|
|
11,839
|
|
—
|
|
—
|
|
11,839
|
|
11,839
|
|
(218
|
)
|
2014
|
2/12/2016
|
44
|
||||||||||||||||||||
|
Riverview Medical Center
|
Lancaster, OH
|
—
|
|
1,313
|
|
10,243
|
|
63
|
|
1,313
|
|
10,306
|
|
11,619
|
|
(287
|
)
|
1997
|
2/26/2016
|
33
|
||||||||||||||||||||
|
St. Luke's Cornwall MOB
|
Cornwall, NY
|
9,500
|
|
—
|
|
13,017
|
|
—
|
|
—
|
|
13,017
|
|
13,017
|
|
(364
|
)
|
2006
|
2/26/2016
|
35
|
||||||||||||||||||||
|
HonorHealth Glendale
|
Glendale, AZ
|
—
|
|
1,770
|
|
8,089
|
|
—
|
|
1,770
|
|
8,089
|
|
9,859
|
|
(160
|
)
|
2015
|
3/15/2016
|
45
|
||||||||||||||||||||
|
Columbia MOB
|
Hudson, NY
|
12,000
|
|
—
|
|
16,550
|
|
—
|
|
—
|
|
16,550
|
|
16,550
|
|
(394
|
)
|
2006
|
3/21/2016
|
35
|
||||||||||||||||||||
|
St Vincent POB 1
|
Birmingham, AL
|
—
|
|
—
|
|
10,172
|
|
87
|
|
—
|
|
10,259
|
|
10,259
|
|
(530
|
)
|
1975
|
3/23/2016
|
15
|
||||||||||||||||||||
|
St Vincent POB 2
|
Birmingham, AL
|
—
|
|
48
|
|
6,624
|
|
72
|
|
48
|
|
6,696
|
|
6,744
|
|
(358
|
)
|
1988
|
3/23/2016
|
15
|
||||||||||||||||||||
|
St Vincent POB 3
|
Birmingham, AL
|
—
|
|
75
|
|
9,433
|
|
62
|
|
75
|
|
9,495
|
|
9,570
|
|
(300
|
)
|
1992
|
3/23/2016
|
25
|
||||||||||||||||||||
|
Emerson Medical Building
|
Creve Coeur, MO
|
—
|
|
1,590
|
|
9,853
|
|
13
|
|
1,590
|
|
9,866
|
|
11,456
|
|
(222
|
)
|
1989
|
3/24/2016
|
35
|
||||||||||||||||||||
|
Patient Partners Surgery Center
|
Gallatin, TN
|
—
|
|
203
|
|
3,376
|
|
—
|
|
203
|
|
3,376
|
|
3,579
|
|
(74
|
)
|
2007
|
3/30/2016
|
40
|
||||||||||||||||||||
|
Eye Associates of NM - Santa Fe
|
Santa Fe, NM
|
—
|
|
900
|
|
6,604
|
|
—
|
|
900
|
|
6,604
|
|
7,504
|
|
(166
|
)
|
2002
|
3/31/2016
|
35
|
||||||||||||||||||||
|
Eye Associates of NM - Albuquerque
|
Albuquerque, NM
|
—
|
|
1,020
|
|
7,832
|
|
—
|
|
1,020
|
|
7,832
|
|
8,852
|
|
(174
|
)
|
2007
|
3/31/2016
|
40
|
||||||||||||||||||||
|
Gardendale Surgery Center
|
Gardendale, AL
|
—
|
|
200
|
|
5,732
|
|
—
|
|
200
|
|
5,732
|
|
5,932
|
|
(107
|
)
|
2011
|
4/11/2016
|
42
|
||||||||||||||||||||
|
HealthEast - Curve Crest
|
Stillwater, MN
|
—
|
|
409
|
|
3,279
|
|
—
|
|
409
|
|
3,279
|
|
3,688
|
|
(63
|
)
|
2011
|
4/14/2016
|
43
|
||||||||||||||||||||
|
HealthEast - Victor Gardens
|
Hugo, MN
|
—
|
|
572
|
|
4,400
|
|
—
|
|
572
|
|
4,400
|
|
4,972
|
|
(89
|
)
|
2008
|
4/14/2016
|
41
|
||||||||||||||||||||
|
NOMS - Clyde
|
Clyde, OH
|
—
|
|
440
|
|
5,948
|
|
—
|
|
440
|
|
5,948
|
|
6,388
|
|
(96
|
)
|
2015
|
5/10/2016
|
44
|
||||||||||||||||||||
|
Blandford MOB
|
Little Rock, AR
|
—
|
|
203
|
|
2,386
|
|
—
|
|
203
|
|
2,386
|
|
2,589
|
|
(43
|
)
|
1983
|
5/11/2016
|
40
|
||||||||||||||||||||
145
Physicians Realty Trust and Physicians Realty L.P.
Schedule III – Real Estate and Accumulated Depreciation
December 31, 2016
(dollars in thousands)
|
|
|
|
Initial Cost to Company
|
Gross Amount at Which Carried as of Close of Period
|
|
|
|
|||||||||||||||||||||||||||||||||
|
Description
|
Location
|
Encumbrances
|
Land
|
Buildings and
Improvements
|
Cost
Capitalized
Subsequent
to
Acquisitions
|
Land
|
Buildings and
Improvements
|
Total
|
Accumulated
Depreciation
|
Date of
Construction
|
Date Acquired
|
Life on Which
Building Depreciation
in Income Statement
is Computed
|
||||||||||||||||||||||||||||
|
Cardwell MOB
|
Lufkin, TX
|
—
|
|
—
|
|
8,348
|
|
—
|
|
—
|
|
8,348
|
|
8,348
|
|
(143
|
)
|
1999
|
5/11/2016
|
42
|
||||||||||||||||||||
|
Dacono Neighborhood Health
|
Dacono, CO
|
—
|
|
2,258
|
|
2,911
|
|
—
|
|
2,258
|
|
2,911
|
|
5,169
|
|
(69
|
)
|
2014
|
5/11/2016
|
44
|
||||||||||||||||||||
|
Franciscan Health
|
Tacoma, WA
|
—
|
|
711
|
|
9,096
|
|
65
|
|
711
|
|
9,161
|
|
9,872
|
|
(405
|
)
|
1951
|
5/11/2016
|
15
|
||||||||||||||||||||
|
Grand Island Specialty Clinic
|
Grand Island, NE
|
—
|
|
102
|
|
2,802
|
|
150
|
|
102
|
|
2,952
|
|
3,054
|
|
(53
|
)
|
1978
|
5/11/2016
|
42
|
||||||||||||||||||||
|
Hot Springs MOB
|
Hot Springs Village, AR
|
—
|
|
305
|
|
3,309
|
|
—
|
|
305
|
|
3,309
|
|
3,614
|
|
(82
|
)
|
1988
|
5/11/2016
|
30
|
||||||||||||||||||||
|
Jewish Medical Center East
|
Louisville, KY
|
—
|
|
—
|
|
81,248
|
|
—
|
|
—
|
|
81,248
|
|
81,248
|
|
(1,255
|
)
|
2003
|
5/11/2016
|
45
|
||||||||||||||||||||
|
Jewish Medical Center South MOB - 1
|
Shepherdsville, KY
|
—
|
|
—
|
|
15,861
|
|
—
|
|
—
|
|
15,861
|
|
15,861
|
|
(311
|
)
|
2005
|
5/11/2016
|
39
|
||||||||||||||||||||
|
Jewish Medical Plaza I
|
Louisville, KY
|
—
|
|
—
|
|
8,808
|
|
—
|
|
—
|
|
8,808
|
|
8,808
|
|
(177
|
)
|
1970
|
5/11/2016
|
35
|
||||||||||||||||||||
|
Jewish Medical Plaza II
|
Louisville, KY
|
—
|
|
—
|
|
5,216
|
|
—
|
|
—
|
|
5,216
|
|
5,216
|
|
(234
|
)
|
1964
|
5/11/2016
|
15
|
||||||||||||||||||||
|
Jewish OCC
|
Louisville, KY
|
—
|
|
—
|
|
35,703
|
|
—
|
|
—
|
|
35,703
|
|
35,703
|
|
(705
|
)
|
1985
|
5/11/2016
|
34
|
||||||||||||||||||||
|
Lakeside Three Professional Center
|
Omaha, NE
|
—
|
|
—
|
|
1,372
|
|
25
|
|
—
|
|
1,397
|
|
1,397
|
|
(35
|
)
|
2006
|
5/11/2016
|
35
|
||||||||||||||||||||
|
Lexington Surgery Center
|
Lexington, KY
|
—
|
|
1,229
|
|
18,914
|
|
—
|
|
1,229
|
|
18,914
|
|
20,143
|
|
(429
|
)
|
2000
|
5/11/2016
|
30
|
||||||||||||||||||||
|
Medical Arts Pavilion
|
Lufkin, TX
|
—
|
|
—
|
|
6,215
|
|
5
|
|
—
|
|
6,220
|
|
6,220
|
|
(135
|
)
|
2004
|
5/11/2016
|
33
|
||||||||||||||||||||
|
Memorial Outpatient Center
|
Lufkin, TX
|
—
|
|
—
|
|
4,808
|
|
—
|
|
—
|
|
4,808
|
|
4,808
|
|
(82
|
)
|
1990
|
5/11/2016
|
45
|
||||||||||||||||||||
|
Midlands Two Professional Center
|
Papillion, NE
|
—
|
|
—
|
|
587
|
|
8
|
|
—
|
|
595
|
|
595
|
|
(98
|
)
|
1976
|
5/11/2016
|
5
|
||||||||||||||||||||
|
Parkview MOB
|
Little Rock, AR
|
—
|
|
705
|
|
4,343
|
|
—
|
|
705
|
|
4,343
|
|
5,048
|
|
(91
|
)
|
1988
|
5/11/2016
|
35
|
||||||||||||||||||||
|
Peak One ASC
|
Frisco, CO
|
—
|
|
—
|
|
5,763
|
|
—
|
|
—
|
|
5,763
|
|
5,763
|
|
(95
|
)
|
2006
|
5/11/2016
|
44
|
||||||||||||||||||||
|
Physicians Medical Center
|
Tacoma, WA
|
—
|
|
—
|
|
5,862
|
|
10
|
|
—
|
|
5,872
|
|
5,872
|
|
(148
|
)
|
1977
|
5/11/2016
|
27
|
||||||||||||||||||||
|
St. Alexius - Minot Medical Plaza
|
Minot, ND
|
—
|
|
—
|
|
26,078
|
|
—
|
|
—
|
|
26,078
|
|
26,078
|
|
(409
|
)
|
2015
|
5/11/2016
|
49
|
||||||||||||||||||||
|
St. Clare Medical Pavilion
|
Lakewood, WA
|
—
|
|
—
|
|
9,005
|
|
—
|
|
—
|
|
9,005
|
|
9,005
|
|
(214
|
)
|
1989
|
5/11/2016
|
33
|
||||||||||||||||||||
|
St. Joseph Medical Pavilion
|
Tacoma, WA
|
—
|
|
—
|
|
11,497
|
|
—
|
|
—
|
|
11,497
|
|
11,497
|
|
(235
|
)
|
1989
|
5/11/2016
|
35
|
||||||||||||||||||||
|
St. Joseph Office Park
|
Lexington, KY
|
—
|
|
3,722
|
|
12,675
|
|
373
|
|
3,722
|
|
13,048
|
|
16,770
|
|
(628
|
)
|
1992
|
5/11/2016
|
14
|
||||||||||||||||||||
|
St. Mary - Caritas Medical II
|
Louisville, KY
|
—
|
|
—
|
|
5,587
|
|
—
|
|
—
|
|
5,587
|
|
5,587
|
|
(113
|
)
|
1979
|
5/11/2016
|
34
|
||||||||||||||||||||
|
St. Mary - Caritas Medical III
|
Louisville, KY
|
—
|
|
—
|
|
383
|
|
46
|
|
—
|
|
429
|
|
429
|
|
(102
|
)
|
1974
|
5/11/2016
|
2
|
||||||||||||||||||||
|
Thornton Neighborhood Health
|
Thornton, CO
|
—
|
|
1,609
|
|
2,287
|
|
—
|
|
1,609
|
|
2,287
|
|
3,896
|
|
(53
|
)
|
2014
|
5/11/2016
|
43
|
||||||||||||||||||||
|
Medical Village at Kissimmee
|
Kissimmee, FL
|
—
|
|
634
|
|
3,365
|
|
—
|
|
634
|
|
3,365
|
|
3,999
|
|
(55
|
)
|
2006
|
5/26/2016
|
39
|
||||||||||||||||||||
|
Medical Village at Leesburg
|
Leesburg, FL
|
—
|
|
802
|
|
3,047
|
|
—
|
|
802
|
|
3,047
|
|
3,849
|
|
(79
|
)
|
1979
|
5/26/2016
|
25
|
||||||||||||||||||||
|
St. Francis MOB
|
Federal Way, WA
|
—
|
|
—
|
|
12,817
|
|
6
|
|
—
|
|
12,823
|
|
12,823
|
|
(226
|
)
|
1987
|
6/2/2016
|
38
|
||||||||||||||||||||
|
Children's Hospital MOB
|
Milwaukee, WI
|
—
|
|
476
|
|
4,897
|
|
—
|
|
476
|
|
4,897
|
|
5,373
|
|
(72
|
)
|
2016
|
6/3/2016
|
45
|
||||||||||||||||||||
|
Jewish Medical Center South MOB - 2
|
Shepherdsville, KY
|
—
|
|
27
|
|
3,827
|
|
—
|
|
27
|
|
3,827
|
|
3,854
|
|
(56
|
)
|
2006
|
6/8/2016
|
40
|
||||||||||||||||||||
|
Good Samaritan North Annex Building
|
Kearney, NE
|
—
|
|
—
|
|
2,734
|
|
—
|
|
—
|
|
2,734
|
|
2,734
|
|
(44
|
)
|
1984
|
6/28/2016
|
37
|
||||||||||||||||||||
|
NE Heart Institute Medical Building
|
Lincoln, NE
|
—
|
|
—
|
|
19,738
|
|
—
|
|
—
|
|
19,738
|
|
19,738
|
|
(211
|
)
|
2004
|
6/28/2016
|
47
|
||||||||||||||||||||
|
St. Vincent West MOB
|
Little Rock, AR
|
—
|
|
—
|
|
13,453
|
|
—
|
|
—
|
|
13,453
|
|
13,453
|
|
(149
|
)
|
2012
|
6/29/2016
|
49
|
||||||||||||||||||||
|
Meridan MOB
|
Englewood, CO
|
—
|
|
1,608
|
|
15,774
|
|
—
|
|
1,608
|
|
15,774
|
|
17,382
|
|
(239
|
)
|
2002
|
6/29/2016
|
38
|
||||||||||||||||||||
|
St. Mary - Caritas Medical I
|
Louisville, KY
|
—
|
|
—
|
|
8,774
|
|
—
|
|
—
|
|
8,774
|
|
8,774
|
|
(178
|
)
|
1991
|
6/29/2016
|
25
|
||||||||||||||||||||
146
Physicians Realty Trust and Physicians Realty L.P.
Schedule III – Real Estate and Accumulated Depreciation
December 31, 2016
(dollars in thousands)
|
|
|
|
Initial Cost to Company
|
Gross Amount at Which Carried as of Close of Period
|
|
|
|
|||||||||||||||||||||||||||||||||
|
Description
|
Location
|
Encumbrances
|
Land
|
Buildings and
Improvements
|
Cost
Capitalized
Subsequent
to
Acquisitions
|
Land
|
Buildings and
Improvements
|
Total
|
Accumulated
Depreciation
|
Date of
Construction
|
Date Acquired
|
Life on Which
Building Depreciation
in Income Statement
is Computed
|
||||||||||||||||||||||||||||
|
St. Alexius - Medical Arts Pavilion
|
Bismarck, ND
|
—
|
|
—
|
|
12,902
|
|
—
|
|
—
|
|
12,902
|
|
12,902
|
|
(208
|
)
|
1974
|
6/29/2016
|
32
|
||||||||||||||||||||
|
St. Alexius - Mandan Clinic
|
Mandan, ND
|
—
|
|
708
|
|
7,700
|
|
—
|
|
708
|
|
7,700
|
|
8,408
|
|
(99
|
)
|
2014
|
6/29/2016
|
43
|
||||||||||||||||||||
|
St. Alexius - Orthopaedic Center
|
Bismarck, ND
|
—
|
|
—
|
|
13,881
|
|
—
|
|
—
|
|
13,881
|
|
13,881
|
|
(188
|
)
|
1997
|
6/29/2016
|
39
|
||||||||||||||||||||
|
St. Alexius - Rehab Center
|
Bismarck, ND
|
—
|
|
—
|
|
5,920
|
|
—
|
|
—
|
|
5,920
|
|
5,920
|
|
(126
|
)
|
1997
|
6/29/2016
|
25
|
||||||||||||||||||||
|
St. Alexius - Tech & Ed
|
Bismarck, ND
|
—
|
|
—
|
|
16,688
|
|
—
|
|
—
|
|
16,688
|
|
16,688
|
|
(226
|
)
|
2011
|
6/29/2016
|
38
|
||||||||||||||||||||
|
Good Samaritan MOB
|
Kearney, NE
|
—
|
|
—
|
|
24,154
|
|
—
|
|
—
|
|
24,154
|
|
24,154
|
|
(272
|
)
|
1999
|
6/29/2016
|
45
|
||||||||||||||||||||
|
Lakeside Two Professional Building
|
Omaha, NE
|
—
|
|
—
|
|
13,358
|
|
19
|
|
—
|
|
13,377
|
|
13,377
|
|
(177
|
)
|
2000
|
6/29/2016
|
38
|
||||||||||||||||||||
|
Lakeside Wellness Center
|
Omaha, NE
|
—
|
|
—
|
|
10,177
|
|
—
|
|
—
|
|
10,177
|
|
10,177
|
|
(132
|
)
|
2000
|
6/29/2016
|
39
|
||||||||||||||||||||
|
McAuley Center
|
Omaha, NE
|
—
|
|
1,427
|
|
17,020
|
|
—
|
|
1,427
|
|
17,020
|
|
18,447
|
|
(309
|
)
|
1988
|
6/29/2016
|
30
|
||||||||||||||||||||
|
Memorial Health Center
|
Grand Island, NE
|
—
|
|
—
|
|
33,967
|
|
—
|
|
—
|
|
33,967
|
|
33,967
|
|
(506
|
)
|
1955
|
6/29/2016
|
35
|
||||||||||||||||||||
|
Missionary Ridge MOB
|
Chattanooga, TN
|
—
|
|
—
|
|
7,223
|
|
1
|
|
—
|
|
7,224
|
|
7,224
|
|
(363
|
)
|
1976
|
6/29/2016
|
10
|
||||||||||||||||||||
|
Pilot Medical Center
|
Birmingham, AL
|
—
|
|
1,419
|
|
14,528
|
|
—
|
|
1,419
|
|
14,528
|
|
15,947
|
|
(225
|
)
|
2005
|
6/29/2016
|
35
|
||||||||||||||||||||
|
St. Joseph Medical Clinic
|
Tacoma, WA
|
—
|
|
—
|
|
16,427
|
|
—
|
|
—
|
|
16,427
|
|
16,427
|
|
(275
|
)
|
1991
|
6/30/2016
|
30
|
||||||||||||||||||||
|
Woodlands Medical Arts Center
|
The Woodlands, TX
|
—
|
|
—
|
|
19,168
|
|
5
|
|
—
|
|
19,173
|
|
19,173
|
|
(289
|
)
|
2001
|
6/30/2016
|
35
|
||||||||||||||||||||
|
FESC MOB
|
Tacoma, WA
|
—
|
|
—
|
|
12,702
|
|
139
|
|
—
|
|
12,841
|
|
12,841
|
|
(275
|
)
|
1980
|
6/30/2016
|
26
|
||||||||||||||||||||
|
Prairie Care MOB
|
Maplewood, MN
|
—
|
|
525
|
|
3,099
|
|
—
|
|
525
|
|
3,099
|
|
3,624
|
|
(38
|
)
|
2016
|
7/6/2016
|
45
|
||||||||||||||||||||
|
Springwoods MOB
|
Spring, TX
|
—
|
|
3,821
|
|
14,830
|
|
50
|
|
3,821
|
|
14,880
|
|
18,701
|
|
(159
|
)
|
2015
|
7/21/2016
|
44
|
||||||||||||||||||||
|
Unity - ASC, Imaging & MOB
|
West Lafayette, IN
|
—
|
|
960
|
|
9,991
|
|
—
|
|
960
|
|
9,991
|
|
10,951
|
|
(126
|
)
|
2001
|
8/8/2016
|
35
|
||||||||||||||||||||
|
Unity - Medical Pavilion
|
West Lafayette, IN
|
—
|
|
1,070
|
|
12,454
|
|
—
|
|
1,070
|
|
12,454
|
|
13,524
|
|
(157
|
)
|
2001
|
8/8/2016
|
35
|
||||||||||||||||||||
|
Unity - Faith, Hope & Love
|
West Lafayette, IN
|
—
|
|
280
|
|
1,862
|
|
—
|
|
280
|
|
1,862
|
|
2,142
|
|
(24
|
)
|
2001
|
8/8/2016
|
35
|
||||||||||||||||||||
|
Unity - Immediate Care & OCC
|
West Lafayette, IN
|
—
|
|
300
|
|
1,833
|
|
—
|
|
300
|
|
1,833
|
|
2,133
|
|
(22
|
)
|
2004
|
8/8/2016
|
37
|
||||||||||||||||||||
|
Medical Village at Maitland
|
Orlando, FL
|
—
|
|
2,393
|
|
18,543
|
|
—
|
|
2,393
|
|
18,543
|
|
20,936
|
|
(153
|
)
|
2006
|
8/23/2016
|
44
|
||||||||||||||||||||
|
Tri-State Orthopaedics MOB
|
Evansville, IN
|
—
|
|
1,580
|
|
14,162
|
|
—
|
|
1,580
|
|
14,162
|
|
15,742
|
|
(138
|
)
|
2004
|
8/30/2016
|
37
|
||||||||||||||||||||
|
Maury Regional Healthcare MOB
|
Spring Hill, TN
|
—
|
|
—
|
|
15,619
|
|
—
|
|
—
|
|
15,619
|
|
15,619
|
|
(101
|
)
|
2012
|
9/30/2016
|
41
|
||||||||||||||||||||
|
Spring Ridge Medical Center
|
Wyomissing, PA
|
—
|
|
28
|
|
4,943
|
|
—
|
|
28
|
|
4,943
|
|
4,971
|
|
(35
|
)
|
2002
|
9/30/2016
|
37
|
||||||||||||||||||||
|
Doctors Community Hospital POB
|
Lanham, MD
|
—
|
|
—
|
|
23,034
|
|
—
|
|
—
|
|
23,034
|
|
23,034
|
|
(120
|
)
|
2009
|
9/30/2016
|
48
|
||||||||||||||||||||
|
Gig Harbor Medical Pavilion
|
Gig Harbor, WA
|
—
|
|
—
|
|
4,791
|
|
—
|
|
—
|
|
4,791
|
|
4,791
|
|
(54
|
)
|
1991
|
9/30/2016
|
30
|
||||||||||||||||||||
|
Midlands One Professional Center
|
Papillion, NE
|
—
|
|
—
|
|
14,922
|
|
—
|
|
—
|
|
14,922
|
|
14,922
|
|
(101
|
)
|
2010
|
9/30/2016
|
37
|
||||||||||||||||||||
|
N.W. Michigan Surgery Center Units #1, #2, & #4
|
Traverse City, MI
|
—
|
|
2,748
|
|
30,005
|
|
—
|
|
2,748
|
|
30,005
|
|
32,753
|
|
(130
|
)
|
2004
|
10/28/2016
|
40
|
||||||||||||||||||||
|
Northeast Medical Center
|
Fayetteville, NY
|
—
|
|
3,899
|
|
25,564
|
|
—
|
|
3,899
|
|
25,564
|
|
29,463
|
|
(78
|
)
|
1998
|
11/23/2016
|
33
|
||||||||||||||||||||
|
North Medical Center
|
Liverpool, NY
|
—
|
|
1,232
|
|
18,680
|
|
—
|
|
1,232
|
|
18,680
|
|
19,912
|
|
(50
|
)
|
1989
|
11/23/2016
|
35
|
||||||||||||||||||||
|
Cincinnati Eye Institute
|
Cincinnati, OH
|
—
|
|
2,050
|
|
32,546
|
|
—
|
|
2,050
|
|
32,546
|
|
34,596
|
|
(162
|
)
|
1985
|
11/23/2016
|
35
|
||||||||||||||||||||
|
HonorHealth - Scottsdale MOB
|
Scottsdale, AZ
|
—
|
|
—
|
|
4,288
|
|
—
|
|
—
|
|
4,288
|
|
4,288
|
|
(10
|
)
|
2000
|
12/2/2016
|
45
|
||||||||||||||||||||
|
Fox Valley Hematology & Oncology
|
Appleton, WI
|
—
|
|
1,590
|
|
26,666
|
|
—
|
|
1,590
|
|
26,666
|
|
28,256
|
|
(52
|
)
|
2015
|
12/8/2016
|
44
|
||||||||||||||||||||
|
Gastrointestinal Associates MOB
|
Powell, TN
|
—
|
|
937
|
|
3,214
|
|
—
|
|
937
|
|
3,214
|
|
4,151
|
|
(10
|
)
|
1965
|
12/9/2016
|
30
|
||||||||||||||||||||
147
Physicians Realty Trust and Physicians Realty L.P.
Schedule III – Real Estate and Accumulated Depreciation
December 31, 2016
(dollars in thousands)
|
|
|
|
Initial Cost to Company
|
Gross Amount at Which Carried as of Close of Period
|
|
|
|
|||||||||||||||||||||||||||||||||
|
Description
|
Location
|
Encumbrances
|
Land
|
Buildings and
Improvements
|
Cost
Capitalized
Subsequent
to
Acquisitions
|
Land
|
Buildings and
Improvements
|
Total
|
Accumulated
Depreciation
|
Date of
Construction
|
Date Acquired
|
Life on Which
Building Depreciation
in Income Statement
is Computed
|
||||||||||||||||||||||||||||
|
Northern Vision Eye Center
|
Traverse City, MI
|
—
|
|
490
|
|
2,132
|
|
—
|
|
490
|
|
2,132
|
|
2,622
|
|
(5
|
)
|
2006
|
12/15/2016
|
35
|
||||||||||||||||||||
|
Flower Mound MOB
|
Flower Mound, TX
|
—
|
|
1,945
|
|
8,312
|
|
—
|
|
1,945
|
|
8,312
|
|
10,257
|
|
(18
|
)
|
2011
|
12/16/2016
|
43
|
||||||||||||||||||||
|
Carrollton MOB
|
Flower Mound, TX
|
—
|
|
2,183
|
|
10,461
|
|
—
|
|
2,183
|
|
10,461
|
|
12,644
|
|
(24
|
)
|
2002
|
12/16/2016
|
40
|
||||||||||||||||||||
|
HonorHealth IRF
|
Scottsdale, AZ
|
10,000
|
|
—
|
|
19,331
|
|
—
|
|
—
|
|
19,331
|
|
19,331
|
|
—
|
|
2000
|
12/22/2016
|
42
|
||||||||||||||||||||
|
|
$
|
123,194
|
|
$
|
189,760
|
|
$
|
2,389,096
|
|
$
|
27,680
|
|
$
|
189,760
|
|
$
|
2,416,776
|
|
$
|
2,606,536
|
|
$
|
(118,609
|
)
|
|
|
|
|||||||||||||
148
Physicians Realty Trust and Physicians Realty L.P.
Schedule III – Real Estate and Accumulated Depreciation
December 31, 2016
The aggregate cost for federal income tax purposes of the real estate as of
December 31, 2016
is
$2.49 billion
, with accumulated tax depreciation of
$94.4 million
. The cost, net of accumulated depreciation, is approximately
$2.39 billion
(unaudited).
The cost capitalized subsequent to acquisitions is net of dispositions.
The changes in total real estate for the years ended
December 31, 2016
,
2015
, and
2014
are as follows (in thousands):
|
|
Year Ended December 31,
|
||||||||||
|
|
2016
|
2015
|
2014
|
||||||||
|
Balance as of the beginning of the year
|
$
|
1,424,894
|
|
$
|
729,034
|
|
$
|
224,730
|
|
||
|
Acquisitions
|
1,170,593
|
|
695,693
|
|
505,379
|
|
|||||
|
Additions
|
11,049
|
|
4,440
|
|
900
|
|
|||||
|
Impairment
|
—
|
|
—
|
|
(1,750
|
)
|
|||||
|
Dispositions
|
—
|
|
(4,273
|
)
|
(225
|
)
|
|||||
|
Balance as of the end of the year
|
$
|
2,606,536
|
|
$
|
1,424,894
|
|
$
|
729,034
|
|
||
The changes in accumulated depreciation for the years ended
December 31, 2016
,
2015
, and
2014
are as follows (in thousands):
|
|
Year Ended December 31,
|
||||||||||
|
|
2016
|
2015
|
2014
|
||||||||
|
Balance as of the beginning of the year
|
$
|
61,242
|
|
$
|
32,772
|
|
$
|
20,299
|
|
||
|
Depreciation
|
57,367
|
|
29,958
|
|
12,473
|
|
|||||
|
Dispositions
|
—
|
|
(1,488
|
)
|
—
|
|
|||||
|
Balance as of the end of the year
|
$
|
118,609
|
|
$
|
61,242
|
|
$
|
32,772
|
|
||
149
None.
Physicians Realty Trust
Evaluation of Disclosure Controls and Procedures.
The Trust’s management, with the participation of its Chief Executive Officer and Chief Financial Officer, has evaluated the effectiveness of the Trust’s disclosure controls and procedures (as defined in Rules 13a- 15(e) and 15d- 15(e) under the Exchange Act), as of the end of the period covered by this report. Based on such evaluation, the Trust’s Chief Executive Officer and Chief Financial Officer concluded that as of
December 31, 2016
, the Trust’s disclosure controls and procedures are designed at a reasonable assurance level and are effective to provide reasonable assurance that information it is required to disclose in reports that it files or submits under the Exchange Act is recorded, processed, summarized, and reported within the time periods specified in the rules and forms of the SEC, and that such information is accumulated and communicated to the Trust’s management, including its Chief Executive Officer and Chief Financial Officer, as appropriate, to allow timely decisions regarding required disclosure.
Changes in Internal Control over Financial Reporting.
There have been no changes in the Trust’s system of internal control over financial reporting during the quarter ended
December 31, 2016
, that have materially affected, or are reasonably likely to materially affect, the Trust’s internal control over financial reporting.
Management’s Report on Internal Control over Financial Reporting.
The Trust’s management is responsible for establishing and maintaining adequate internal control over financial reporting (as defined in Rule 13a-15(f) under the Exchange Act). Management conducted an assessment of the effectiveness of the Trust’s internal control over financial reporting based on the criteria set forth in Internal Control - Integrated Framework issued by the Committee of Sponsoring Organizations of the Treadway Commission (2013 framework). Based on the assessment, management has concluded that the Trust’s internal control over financial reporting was effective as of
December 31, 2016
to provide reasonable assurance regarding the reliability of financial reporting and the preparation of financial statements in accordance with GAAP.
The effectiveness of the Trust’s internal control over financial reporting as of
December 31, 2016
has been audited by Ernst & Young LLP (“EY”), an independent registered public accounting firm, as stated in their report included in Part II, Item 8 of this Annual Report on Form 10-K.
Limitations on Effectiveness of Controls and Procedures.
In designing and evaluating the disclosure controls and procedures and the Trust’s internal control over financial reporting, management recognizes that any controls and procedures, no matter how well designed and operated, can provide only reasonable assurance of achieving the desired control objectives. In addition, the design of disclosure controls and procedures and the Trust’s internal control over financial reporting must reflect the fact that there are resource constraints and that management is required to apply judgment in evaluating the benefits of possible controls and procedures relative to their costs.
Physicians Realty L.P.
Evaluation of Disclosure Controls and Procedures.
The Operating Partnership’s management, with the participation of the Chief Executive Officer and Chief Financial Officer of the Operating Partnership’s general partner, has evaluated the effectiveness of the Operating Partnership’s disclosure controls and procedures (as defined in Rules 13a- 15(e) and 15d- 15(e) under the Exchange Act), as of the end of the period covered by this report. Based on such evaluation, the Chief Executive Officer and Chief Financial Officer of the Operating Partnership’s general partner concluded that as of
December 31, 2016
, the Operating Partnership’s disclosure controls and
150
procedures are designed at a reasonable assurance level and are effective to provide reasonable assurance that information it is required to disclose in reports that it files or submits under the Exchange Act is recorded, processed, summarized, and reported within the time periods specified in the rules and forms of the SEC, and that such information is accumulated and communicated to our management, including the Chief Executive Officer and Chief Financial Officer of the Operating Partnership’s general partner, as appropriate, to allow timely decisions regarding required disclosure.
Changes in Internal Control over Financial Reporting.
There have been no changes in the Operating Partnership’s system of internal control over financial reporting during the quarter ended
December 31, 2016
, that have materially affected, or are reasonably likely to materially affect, the Operating Partnership’s internal control over financial reporting.
Management’s Report on Internal Control over Financial Reporting.
The Operating Partnership’s management is responsible for establishing and maintaining adequate internal control over financial reporting (as defined in Rule 13a-15(f) under the Exchange Act). Management conducted an assessment of the effectiveness of the Operating Partnership’s internal control over financial reporting based on the criteria set forth in Internal Control - Integrated Framework issued by the Committee of Sponsoring Organizations of the Treadway Commission (2013 framework). Based on the assessment, management has concluded that the Operating Partnership’s internal control over financial reporting was effective as of
December 31, 2016
to provide reasonable assurance regarding the reliability of financial reporting and the preparation of financial statements in accordance with GAAP.
Limitations on Effectiveness of Controls and Procedures.
In designing and evaluating the disclosure controls and procedures and the Operating Partnership’s internal control over financial reporting, management recognizes that any controls and procedures, no matter how well designed and operated, can provide only reasonable assurance of achieving the desired control objectives. In addition, the design of disclosure controls and procedures and the Operating Partnership’s internal control over financial reporting must reflect the fact that there are resource constraints and that management is required to apply judgment in evaluating the benefits of possible controls and procedures relative to their costs.
None.
151
Incorporated herein by reference are “Proposal 1 - Election of Trustees”, “Section 16(a) Beneficial Ownership Reporting Compliance”, “Corporate Governance Matters”, “Executive Officers”, and “Report of the Audit Committee of the Board of Trustees” to be included in the Trust’s
2017
Proxy Statement, which will be filed with the SEC within 120 days after the end of its fiscal year ended
December 31, 2016
.
Code of Business Conduct and Ethics
Information regarding our Code of Business Conduct and Ethics is provided in “Part I., Item 1. Business - Available Information” and is incorporated herein by reference.
Incorporated herein by reference are “Executive Compensation”, “
2016
Non-Employee Trustee Compensation”, “Compensation Committee Interlocks and Insider Participation”, and “Compensation Committee Report” to be included in the Trust’s
2017
Proxy Statement, which will be filed with the SEC within 120 days after the end of its fiscal year ended
December 31, 2016
.
Incorporated herein by reference are “Security Ownership of Certain Beneficial Owners and Management” to be included in the Trust’s
2017
Proxy Statement, which will be filed with the SEC within 120 days after the end of its fiscal year ended
December 31, 2016
.
Equity Compensation Plan Information
The table below presents information as of
December 31, 2016
for the 2013 Equity Incentive Plan. We do not have any equity compensation plans that have not been approved by shareholders.
|
Plan Category
|
Number of securities to be issued upon exercise of outstanding warrants and rights
(a) |
Weighted-average exercise price of outstanding options, warrants and rights
(b) |
Number of securities remaining available for future issuance under equity compensation plans (excluding securities reflected in column (a))
(c) |
|||||||||
|
Equity compensation plans approved by shareholders
|
722,941
|
|
(1)
|
—
|
|
$
|
1,231,698
|
|
(2)
|
|||
|
Equity compensation plans not approved by shareholders
|
—
|
|
—
|
|
—
|
|
||||||
|
Total
|
722,941
|
|
—
|
|
$
|
1,231,698
|
|
|||||
|
(1)
|
Includes (i) performance-based restricted stock units at maximum level granted to our officers under the 2013 Equity Incentive Plan, which will vest, if at all, based on achievement of performance criteria over a performance period, subject to the terms of the grant, and (ii) time-based restricted stock units granted to our non-employee trustees under the 2013 Equity Incentive Plan. With the exception of performance-based restricted stock units issued to certain officers in 2014, which have been determined to be recognized at a 190% performance level, performance-based restricted stock units are reflected at maximum levels for each of the awards because actual performance through
December 31, 2016
was either at maximum level or between target and maximum levels for each of the awards under the 2013 Equity Incentive Plan. With the exception of the 2014 performance-based restricted stock units, the actual number of performance-based restricted stock units granted has not been determined and will be determined based on the Company’s performance over the 3-year performance periods applicable to each award.
|
|
(2)
|
Represents 1,006,242 shares under the 2013 Equity Incentive Plan and 225,456 shares under the 2015 Employee Stock Purchase Plan available for future issuance as of
December 31, 2016
.
|
152
Incorporated herein by reference are “Certain Relationships and Related Transactions” and “Trustee Independence” to be included in the Trust’s
2017
Proxy Statement, which will be filed with the SEC within 120 days after the end of its fiscal year ended
December 31, 2016
.
Incorporated herein by reference is “Proposal 2 - Ratification of Independent Registered Public Accounting Firm” to be included in the Trust’s
2017
Proxy Statement, which will be filed with the SEC within 120 days after the end of its fiscal year ended
December 31, 2016
.
153
(a)
The following documents are filed as part of this report:
(1)
Financial Statements
:
|
|
Page
|
|
|
|
|
|
|
Reports of Independent Registered Public Accounting Firm
|
|
|
|
Report of Independent Registered Public Accounting Firm on Internal Control Over Financial Reporting
|
||
|
|
||
|
Financial Statements of Physicians Realty Trust
|
||
|
|
||
|
|
||
|
|
||
|
|
||
|
|
|
|
|
Financial Statements of Physicians Realty L.P.
|
||
|
Notes for Physicians Realty Trust and Physicians Realty L.P.
|
||
|
|
||
(2)
Financial Statement Schedules
:
All other schedules for which provision is made in the applicable accounting regulations of the Securities and Exchange Commission are omitted because they are not required under the related instructions or are not applicable, or because the required information is shown in the consolidated financial statements or notes thereto.
(3)
Exhibits:
See the Exhibit Index immediately following the signature page of this report on Form 10-K.
154
None.
155
SIGNATURES
Pursuant to the requirements of Section 13 or 15(d) of the Securities Exchange Act of 1934, the registrant has duly caused this report to be signed on its behalf by the undersigned, thereunto duly authorized.
|
|
PHYSICIANS REALTY TRUST
|
|
|
|
|
|
|
Dated:
|
February 24, 2017
|
/s/ John T. Thomas
|
|
|
John T. Thomas
|
|
|
|
Chief Executive Officer and President
|
|
|
|
(Principal Executive Officer)
|
|
Power of Attorney
KNOW ALL PERSONS BY THESE PRESENTS, that each person whose signature appears below constitutes and appoints John T. Thomas and Jeffrey N. Theiler and each of them severally, his or her true and lawful attorney-in-fact with power of substitution and resubstitution to sign in his or her name, place and stead, in any and all capacities, to do any and all things and execute any and all instruments that such attorney may deem necessary or advisable under the Securities Exchange Act of 1934 and any rules, regulations and requirements of the Securities and Exchange Commission in connection with this Annual Report on Form 10-K and any and all amendments hereto, as fully and for all intents and purposes as he or she might do or could do in person, and hereby ratifies and confirms all said attorneys-in-fact and agents, each acting alone, and his or her substitute or substitutes, may lawfully do or cause to be done by virtue hereof.
Pursuant to the requirements of the Securities Exchange Act of 1934, this report has been signed below by the following persons on behalf of the registrant and in the capacities and on the dates indicated.
156
|
Signature
|
|
Title
|
|
Date
|
|
|
|
|
|
|
|
/s/ JOHN T. THOMAS
|
|
Chief Executive Officer and
|
|
February 24, 2017
|
|
John T. Thomas
|
|
President and Trustee (Principal Executive Officer)
|
|
|
|
|
|
|
|
|
|
/s/ JEFFREY N. THEILER
|
|
Executive Vice President and
|
|
February 24, 2017
|
|
Jeffrey N. Theiler
|
|
Chief Financial Officer (Principal Financial Officer)
|
|
|
|
|
|
|
|
|
|
/s/ JOHN W. LUCEY
|
|
Senior Vice President - Chief Accounting and
|
|
February 24, 2017
|
|
John W. Lucey
|
|
Administrative Officer (Principal Accounting Officer)
|
|
|
|
|
|
|
|
|
|
/s/ STANTON D. ANDERSON
|
|
Trustee
|
|
February 24, 2017
|
|
Stanton D. Anderson
|
|
|
|
|
|
|
|
|
|
|
|
/s/ MARK A. BAUMGARTNER
|
|
Trustee
|
|
February 24, 2017
|
|
Mark A. Baumgartner
|
|
|
|
|
|
|
|
|
|
|
|
/s/ ALBERT C. BLACK, JR.
|
|
Trustee
|
|
February 24, 2017
|
|
Albert C. Black, Jr.
|
|
|
|
|
|
|
|
|
|
|
|
/s/ WILLIAM A. EBINGER, M.D.
|
|
Trustee
|
|
February 24, 2017
|
|
William A. Ebinger, M.D.
|
|
|
|
|
|
|
|
|
|
|
|
/s/ TOMMY G. THOMPSON
|
|
Chairman
|
|
February 24, 2017
|
|
Tommy G. Thompson
|
|
|
|
|
|
|
|
|
|
|
|
/s/ RICHARD A. WEISS
|
|
Trustee
|
|
February 24, 2017
|
|
Richard A. Weiss
|
|
|
||
157
SIGNATURES
Pursuant to the requirements of Section 13 or 15(d) of the Securities Exchange Act of 1934, the registrant has duly caused this report to be signed on its behalf by the undersigned, thereunto duly authorized.
|
|
PHYSICIANS REALTY L.P.
by: Physicians Realty Trust, its general partner
|
|
|
|
|
|
|
Dated:
|
February 24, 2017
|
/s/ John T. Thomas
|
|
|
John T. Thomas
|
|
|
|
Chief Executive Officer and President
|
|
|
|
(Principal Executive Officer)
|
|
Power of Attorney
KNOW ALL PERSONS BY THESE PRESENTS, that each person whose signature appears below constitutes and appoints John T. Thomas and Jeffrey N. Theiler and each of them severally, his or her true and lawful attorney-in-fact with power of substitution and resubstitution to sign in his or her name, place and stead, in any and all capacities, to do any and all things and execute any and all instruments that such attorney may deem necessary or advisable under the Securities Exchange Act of 1934 and any rules, regulations and requirements of the Securities and Exchange Commission in connection with this Annual Report on Form 10-K and any and all amendments hereto, as fully and for all intents and purposes as he or she might do or could do in person, and hereby ratifies and confirms all said attorneys-in-fact and agents, each acting alone, and his or her substitute or substitutes, may lawfully do or cause to be done by virtue hereof.
Pursuant to the requirements of the Securities Exchange Act of 1934, this report has been signed below by the following persons on behalf of the registrant and in the capacities and on the dates indicated.
158
|
Signature
|
|
Title
|
|
Date
|
|
|
|
|
|
|
|
/s/ JOHN T. THOMAS
|
|
Chief Executive Officer and
|
|
February 24, 2017
|
|
John T. Thomas
|
|
President and Trustee (Principal Executive Officer) of Physicians Realty Trust, the general partner of Physicians Realty L.P.
|
|
|
|
|
|
|
|
|
|
/s/ JEFFREY N. THEILER
|
|
Executive Vice President and
|
|
February 24, 2017
|
|
Jeffrey N. Theiler
|
|
Chief Financial Officer (Principal Financial Officer) of Physicians Realty Trust, the general partner of Physicians Realty L.P.
|
|
|
|
|
|
|
|
|
|
/s/ JOHN W. LUCEY
|
|
Senior Vice President - Chief Accounting and
|
|
February 24, 2017
|
|
John W. Lucey
|
|
Administrative Officer (Principal Accounting Officer) of Physicians Realty Trust, the general partner of Physicians Realty L.P.
|
|
|
|
|
|
|
|
|
|
/s/ STANTON D. ANDERSON
|
|
Trustee of Physicians Realty Trust, the general partner of Physicians Realty L.P.
|
|
February 24, 2017
|
|
Stanton D. Anderson
|
|
|
|
|
|
|
|
|
|
|
|
/s/ MARK A. BAUMGARTNER
|
|
Trustee of Physicians Realty Trust, the general partner of Physicians Realty L.P.
|
|
February 24, 2017
|
|
Mark A. Baumgartner
|
|
|
|
|
|
|
|
|
|
|
|
/s/ ALBERT C. BLACK, JR.
|
|
Trustee of Physicians Realty Trust, the general partner of Physicians Realty L.P.
|
|
February 24, 2017
|
|
Albert C. Black, Jr.
|
|
|
|
|
|
|
|
|
|
|
|
/s/ WILLIAM A. EBINGER, M.D.
|
|
Trustee of Physicians Realty Trust, the general partner of Physicians Realty L.P.
|
|
February 24, 2017
|
|
William A. Ebinger, M.D.
|
|
|
|
|
|
|
|
|
|
|
|
/s/ TOMMY G. THOMPSON
|
|
Chairman of the Board of Trustees of Physicians Realty Trust, the general partner of Physicians Realty L.P.
|
|
February 24, 2017
|
|
Tommy G. Thompson
|
|
|
|
|
|
|
|
|
|
|
|
/s/ RICHARD A. WEISS
|
|
Trustee of Physicians Realty Trust, the general partner of Physicians Realty L.P.
|
|
February 24, 2017
|
|
Richard A. Weiss
|
|
|
||
159
EXHIBIT INDEX
|
Exhibit No.
|
|
Title
|
|
|
3.1
|
|
(1)
|
Articles of Amendment and Restatement of Physicians Realty Trust
|
|
3.2
|
|
(2)
|
Bylaws of Physicians Realty Trust, as amended through February 22, 2017
|
|
3.3
|
|
(3)
|
Certificate of Limited Partnership of Physicians Realty L.P.
|
|
4.1
|
|
(1)
|
Form of Certificate of Common Shares of Physicians Realty Trust
|
|
10.1
|
|
(4)
|
Second Amended and Restated Agreement of Limited Partnership of Physicians Realty L.P., dated February 5, 2015
|
|
10.2
|
|
(5)
|
Form of Restricted Shares Award Agreement (Time Vesting)**
|
|
10.3
|
|
(1)
|
Form of Indemnification Agreement between Physicians Realty Trust and its trustees and officers
|
|
10.3
|
|
(6)
|
Employment Agreement dated as of February 26, 2016, between the Trust and John T. Thomas**
|
|
10.4
|
|
(7)
|
Employment Agreement dated as of May 5, 2016, between the Trust and Jeffrey N. Theiler**
|
|
10.5
|
|
(7)
|
Employment Agreement dated as of May 5, 2016, between the Trust and John W. Lucey**
|
|
10.6
|
|
(7)
|
Employment Agreement dated as of May 5, 2016, between the Trust and Mark D. Theine**
|
|
10.7
|
|
(7)
|
Employment Agreement dated as of May 5, 2016, between the Trust and Deeni Del Mar Taylor**
|
|
10.8
|
|
(7)
|
Employment Agreement dated as of May 5, 2016, between the Trust and Bradley D. Page**
|
|
10.9
|
|
Employment Agreement dated as of January 1, 2017, between the Trust and Dan Klein* **
|
|
|
10.10
|
|
(8)
|
Physicians Realty Trust Incentive Bonus Plan**
|
|
10.12
|
|
(8)
|
Form of Restricted Share Award Agreement - Executive (Time Vesting)**
|
|
10.13
|
|
(8)
|
Form of Restricted Share Award Agreement - Trustees (Time Vesting)**
|
|
10.14
|
|
(8)
|
Form of Restricted Share Unit Award Agreement (Performance Units)**
|
|
10.15
|
|
(9)
|
Physicians Realty Trust 2013 Equity Incentive Plan, as amended effective August 7, 2014**
|
|
10.16
|
|
(10)
|
Contribution Agreement, dated as of February 5, 2015, by and among United Properties Investment, LLC, a Minnesota limited liability company, Minnetonka Medical Building, LLC, a Minnesota limited liability company and DOC-15450 State Highway 7 MOB, LLC, a Wisconsin limited liability company
|
|
10.17
|
|
(11)
|
Amended and Restated Employment Agreement dated as of February 19, 2015, between the Trust and John Sweet**
|
|
10.18
|
|
(12)
|
Form of Restricted Share Award Agreement - Executive (Time Vesting)**
|
|
10.19
|
|
(12)
|
Form of Restricted Share Unit Award Agreement - Executive (Performance Vesting)**
|
|
10.20
|
|
(12)
|
Form of Restricted Share Unit Award Agreement - Trustees (Time Vesting)**
|
|
10.21
|
|
(13)
|
Amended and Restated Credit Agreement, dated June 10, 2016, among Physicians Realty L.P., Physicians Realty Trust, KeyBank National Association, KeyBanc Capital Markets Inc., BMO Capital Markets, Citizens Bank, N.A., and the lenders party thereto.
|
|
10.22
|
|
(14)
|
Physicians Realty Trust 2015 Employee Stock Purchase Plan**
|
|
10.23
|
|
(15)
|
Note Purchase and Guarantee Agreement, dated as of January 7, 2016, among the Operating Partnership,
the Trust and each of the purchasers identified therein
|
|
10.24
|
|
(15)
|
Form of 4.03% Senior Notes, Series A, due January 7, 2023 (included in Exhibit 10.23)
|
|
10.25
|
|
(15)
|
Form of 4.43% Senior Notes, Series B, due January 7, 2026 (included in Exhibit 10.23)
|
|
10.26
|
|
(15)
|
Form of 4.57% Senior Notes, Series C, due January 7, 2028 (included in Exhibit 10.23)
|
|
10.27
|
|
(15)
|
Form of 4.74% Senior Notes, Series D, due January 7, 2031 (included in Exhibit 10.23)
|
|
10.28
|
|
(16)
|
Note Purchase and Guarantee Agreement, dated as of August 11, 2016, among the Operating Partnership, the Trust and each of the purchasers identified therein
|
|
10.29
|
|
(16)
|
Form of 4.09% Senior Notes, Series A, due August 11, 2025 (included in Exhibit 10.28)
|
|
10.30
|
|
(16)
|
Form of 4.18% Senior Notes, Series B, due August 11, 2026 (included in Exhibit 10.28)
|
|
10.31
|
|
(16)
|
Form of 4.24% Senior Notes, Series C, due August 11, 2027 (included in Exhibit 10.28)
|
|
10.32
|
|
(16)
|
First Amendment to the Note Purchase and Guarantee Agreement, dated as of August 11, 2016, among the Operating Partnership, the Trust and the Required Noteholders
|
|
10.33
|
|
(17)
|
Purchase and Sale Agreement (Building Sale / Ground Lease Form), dated as of April 5, 2016, by and between the Seller Entities identified on Exhibit A thereto and Physicians Realty L.P.
|
|
10.34
|
|
(17)
|
Purchase and Sale Agreement (Fee Simple Form), dated as of April 5, 2016, by and between the Seller Entities identified on Exhibit A thereto and Physicians Realty L.P.
|
|
12.1
|
|
Statement re Computation of Ratio of Earnings to Fixed Charges*
|
|
|
12.2
|
|
Statement re Computation of Ratio of Earnings to Fixed Charges and Preferred Unit Distributions*
|
|
|
21.1
|
|
List of Subsidiaries of the Registrant*
|
|
160
|
Exhibit No.
|
|
Title
|
|
|
23.1
|
|
Consent of Ernst & Young LLP for Physicians Realty Trust*
|
|
|
23.2
|
|
Consent of Ernst & Young LLP for Physicians Realty L.P.*
|
|
|
24.1
|
|
Power of Attorney (included on signature pages)*
|
|
|
31.1
|
|
Certification of John T. Thomas, pursuant to Section 302 of the Sarbanes-Oxley Act of 2002 for Physicians Realty Trust*
|
|
|
31.2
|
|
Certification of Jeffrey N. Theiler, pursuant to Section 302 of the Sarbanes-Oxley Act of 2002 for Physicians Realty Trust*
|
|
|
31.3
|
|
Certification of John T. Thomas, pursuant to Section 302 of the Sarbanes-Oxley Act of 2002 for Physicians Realty L.P.*
|
|
|
31.4
|
|
Certification of Jeffrey N. Theiler, pursuant to Section 302 of the Sarbanes-Oxley Act of 2002 for Physicians Realty L.P.*
|
|
|
32.1
|
|
Certification of John T. Thomas and Jeffrey N. Theiler, pursuant to Section 906 of the Sarbanes-Oxley Act of 2002 (Subsections (a) and (b) of Section 1350, Chapter 63 of Title 18, United States Code) for Physicians Realty Trust*
|
|
|
32.2
|
|
Certification of John T. Thomas and Jeffrey N. Theiler, pursuant to Section 906 of the Sarbanes-Oxley Act of 2002 (Subsections (a) and (b) of Section 1350, Chapter 63 of Title 18, United States Code) for Physicians Realty L.P.*
|
|
|
101.INS
|
|
XBRL Instance Document(†)
|
|
|
101.SCH
|
|
XBRL Extension Schema Document(†)
|
|
|
101.CAL
|
|
XBRL Taxonomy Extension Calculation Linkbase Document(†)
|
|
|
101.DEF
|
|
XBRL Taxonomy Extension Definition Linkbase Document(†)
|
|
|
101.LAB
|
|
XBRL Taxonomy Extension Label Linkbase Document(†)
|
|
|
101.PRE
|
|
XBRL Taxonomy Extension Presentation Linkbase Document(†)
|
|
*
Filed herewith
**
Indicates a management contract or compensatory plan or arrangement.
† Users of this data are advised pursuant to Rule 406T of Regulation S-T that this interactive data file is deemed not filed or part of a registration statement for purposes of Section 11 or 12 of the Securities Act, is deemed not filed for purposes of Section 18 of the Exchange Act, and otherwise is not subject to liability under these sections.
|
(1)
|
Incorporated by reference to Amendment No. 2 to the Registrant’s Registration Statement on Form S-11 filed with the SEC on June 14, 2013 (File No. 333-188862).
|
|
(2)
|
Incorporated by reference to the Registrant’s Current Report on Form 8-K filed with the SEC on February 24, 2017 (File No. 001-36007).
|
|
(3)
|
Incorporated by reference to the Registrant’s Registration Statement on Form S-3 filed with the SEC on June 17, 2015 (File No. 333-205034).
|
|
(4)
|
Incorporated by reference to the Registrant’s Current Report on Form 8-K filed with the SEC on February 6, 2015.
|
|
(5)
|
Incorporated by reference to Amendment No. 3 to the Registrant’s Registration Statement on Form S-11 filed with the SEC on June 20, 2013 (File No. 333-188862).
|
|
(6)
|
Incorporated by reference to the Registrant’s Current Report on Form 8-K filed with the SEC on March 1, 2016 (File No. 001-36007).
|
|
(7)
|
Incorporated by reference to the Registrant’s Current Report on Form 8-K filed with the SEC on May 6, 2016 (File No. 001-36007).
|
|
(8)
|
Incorporated by reference to the Registrant’s Current Report on Form 8-K filed with the SEC on May 7, 2014 (File No. 001-36007).
|
|
(9)
|
Incorporated by reference to the Registrant’s Current Report on Form 8-K filed with the SEC on August 7, 2014 (File No. 001-36007).
|
|
(10)
|
Incorporated by reference to the Registrant’s Annual Report on Form 10-K filed with the SEC on March 12, 2015 (Fle No. 001-36007).
|
|
(11)
|
Incorporated by reference to the Registrant’s Current Report on Form 8-K filed with the SEC on February 20, 2015 (File No. 001-36007).
|
|
(12)
|
Incorporated by reference to the Registrant’s Annual Report on Form 10-K filed with the SEC on March 12, 2015 (File No. 001-36007).
|
|
(13)
|
Incorporated by reference to the Registrant’s Current Report on Form 8-K filed with the SEC on June 13, 2016 (File No. 001-36007).
|
161
|
(14)
|
Incorporated by reference to the Registrant’s Quarterly Report on Form 10-Q filed with the SEC on August 10, 2015 (File No. 001-36007).
|
|
(15)
|
Incorporated by reference to the Registrant’s Current Report on Form 8-K filed with the SEC on January 12, 2016 (File No. 001-36007).
|
|
(16)
|
Incorporated by reference to the Registrant’s Current Report on Form 8-K filed with the SEC on August 11, 2016 (File No. 001-36007).
|
|
(17)
|
Incorporated by reference to the Registrant’s Quarterly Report on Form 10-Q filed with the SEC May 6, 2016 (File No. 001-36007).
|
162
TABLE OF CONTENTS
Part IItem 1. BusinessItem 1A. Risk FactorsItem 1B. Unresolved Staff CommentsItem 2. PropertiesItem 3. Legal ProceedingsItem 4. Mine Safety DisclosuresPart IIItem 5. Market For Registrant S Common Equity, Related Stockholder Matters and Issuer Purchases Of Equity SecuritiesItem 6. Selected Financial DataItem 7. Management S Discussion and Analysis Of Financial Condition and Results Of OperationsItem 7A. Quantitative and Qualitative Disclosures About Market RiskNote 2 (summary Of Significant Accounting Policies)Note 7 (derivatives)Item 8. Financial Statements and Supplementary DataNote 1. Organization and BusinessNote 2. Summary Of Significant Accounting PoliciesNote 1 (organization and Business)Note 3. Acquisitions and DispositionsNote 4. IntangiblesNote 5. Other AssetsNote 6. DebtNote 7. DerivativesNote 8. Accrued Expenses and Other LiabilitiesNote 9. Stock-based CompensationNote 10. Fair Value MeasurementsNote 11. Tenant Operating LeasesNote 12. Rent ExpenseNote 13. Credit ConcentrationNote 14. Earnings Per Share and Earnings Per UnitNote 15. Subsequent EventsNote 16. Quarterly DataItem 9. Changes in and Disagreements with Accountants on Accounting and Financial DisclosureItem 9A. Controls and ProceduresItem 9B. Other InformationPart IIIItem 10. Directors, Executive Officers and Corporate GovernanceItem 11. Executive CompensationItem 12. Security Ownership Of Certain Beneficial Owners and Management and Related Stockholder MattersItem 13. Certain Relationships and Related Transactions, and Director IndependenceItem 14. Principal Accountant Fees and ServicesPart IVItem 15. Exhibits and Financial Statement SchedulesItem 16. Form 10-k Summary