|
|
|
|
|
|
|
|
|
|
|
|
|
|
|
|
|
|
|
|
|
|
|
|
|
|
|
|
|
|
|
|
|
|
|
|
|
|
|
|
|
|
|
|
|
|
|
|
|
|
|
|
|
|
|
|
Table of Contents
OF THE SECURITIES EXCHANGE ACT OF 1934
|
Delaware
(State of Incorporation) |
53-0257888
(I.R.S. Employer Identification No.) |
(Address of principal executive offices)
| Title of Each Class | Name of Each Exchange on Which Registered | |||
| Common Stock, par value $1 | New York Stock Exchange | |||
| Large accelerated filer þ | Accelerated filer o | Non-accelerated filer o | Smaller reporting company o |
Table of Contents
1
2
Table of Contents
| Item 1. | Business |
| • | Material handling equipment such as industrial and recreational winches, utility, construction and demolition machinery attachments, hydraulic parts, industrial automation tools, four-wheel-drive (“4WD”) and all-wheel drive (“AWD”) powertrain systems, accessories for off-road vehicles and operator cabs and rollover structures. | |
| • | Mobile equipment related products, primarily refuse truck bodies, tank trailers, compactors, balers, vehicle service lifts and collision equipment, car wash systems, internal engine components, fluid control assemblies and various aerospace components. |
| • | Engineered products such as refrigeration systems, refrigeration display cases, walk-in coolers, foodservice equipment, commercial kitchen air and ventilation systems, heat transfer equipment, and food and beverage packaging machines. | |
| • | Product identification related products such as industrial marking and coding systems used to code information (i.e. dates and serial numbers) on consumer products, printing products for cartons used in warehouse logistics operations, bar code printers and portable printers. |
| • | Energy market production and distribution products such as sucker rods, downhole rod pumps, drill bit inserts for oil and gas exploration, gas well production control devices, control valves, piston and seal rings, control instrumentation, remote data collection and transfer devices, and components for compressors, turbo machinery, motors and generators. | |
| • | Fluid solution products including nozzles, swivels and breakaways used to deliver various types of fuel, suction system equipment, unattended fuel management systems, integrated tank monitoring, pumps used in fluid transfer applications, quick disconnect couplings used in a wide variety of biomedical and commercial applications, and chemical proportioning and dispensing systems. |
| • | Electronic technology equipment and devices/components such as advanced micro-component products for the hearing aid, mobile phone and consumer electronics industries, high frequency capacitors, microwave electromagnetic switches, radio frequency and microwave filters, electromagnetic products, frequency control/select components and sophisticated automated assembly and testing equipment. |
3
Table of Contents
4
Table of Contents
5
Table of Contents
6
Table of Contents
7
Table of Contents
8
Table of Contents
9
Table of Contents
10
Table of Contents
| Item 1A. | Risk Factors |
| • | The Company’s results for 2011 may continue to be impacted by current domestic and international economic conditions and uncertainties. |
| • | Increasing product/service and price competition by international and domestic competitors, including new entrants and the ability of the Company to introduce new and competitive products could cause the Company’s businesses to generate lower revenue, operating profits and cash flows. |
11
Table of Contents
| • | Some of Dover’s companies may not anticipate, adapt to, or capitalize on technological developments and are subject to the cyclical nature of their industries. These factors could cause these companies to become less competitive and lead to reduced market share, revenue, operating profits and cash flows. |
| • | Our companies could lose customers or generate lower revenue, operating profits and cash flows if there are significant increases in the cost of raw materials (including energy) or if they are unable to obtain raw materials. |
| • | The Company is subject to risks relating to its existing foreign operations and expansion into new geographical markets. |
| • | political, social and economic instability and disruptions; | |
| • | government embargoes or trade restrictions; | |
| • | the imposition of duties and tariffs and other trade barriers; | |
| • | import and export controls; | |
| • | limitations on ownership and on repatriation of earnings; | |
| • | transportation delays and interruptions; |
12
Table of Contents
| • | labor unrest and current and changing regulatory environments; | |
| • | increased compliance costs; | |
| • | the impact of loss of a single-source manufacturing facility; | |
| • | difficulties in staffing and managing multi-national operations; and | |
| • | limitations on its ability to enforce legal rights and remedies. |
| • | The Company’s exposure to exchange rate fluctuations on cross-border transactions and the translation of local currency results into U.S. dollars could negatively impact the Company’s results of operations. |
| • | The Company’s operating profits and cash flows could be adversely affected if the Company cannot achieve projected savings and synergies. |
| • | Failure to attract, retain and develop personnel or to provide adequate succession plans for key management could have an adverse effect on the Company’s operating results. |
| • | The Company’s businesses and their profitability and reputation could be adversely affected by domestic and foreign governmental and public policy changes (including environmental and employment regulations and tax policies such as export subsidy programs, research and experimentation credits, carbon emission regulations, and other similar programs), risks associated with emerging markets, changes in statutory tax rates and unanticipated outcomes with respect to tax audits. |
13
Table of Contents
| • | Unforeseen developments in contingencies such as litigation could adversely affect the Company’s financial condition. |
| • | The Company’s revenue, operating profits and cash flows could be adversely affected if Dover’s companies are unable to protect or obtain patent and other intellectual property rights. |
| • | The Company’s growth and results of operations may be adversely affected if the Company is unsuccessful in its capital allocation and acquisition program or is unable to divest non-core assets and businesses as planned. |
| • | The Company’s borrowing costs may be impacted by its credit ratings developed by various rating agencies. |
14
Table of Contents
| Item 1B. | Unresolved Staff Comments |
| Item 2. | Properties |
| Number and Nature of Facilities | Square Footage (000’s) | |||||||||||||||||||
| Segment | Mfg. | Warehouse | Sales/Service | Owned | Leased | |||||||||||||||
|
Industrial Products
|
67 | 11 | 17 | 4,726 | 1,603 | |||||||||||||||
|
Engineered Systems
|
34 | 24 | 70 | 2,604 | 6,010 | |||||||||||||||
|
Fluid Management
|
71 | 11 | 36 | 2,599 | 1,290 | |||||||||||||||
|
Electronic Technologies
|
44 | 6 | 28 | 1,122 | 1,293 | |||||||||||||||
| Locations |
Leased Facilities
|
|||||||||||||||||||||||
|
North
|
Expiration Dates (Years) | |||||||||||||||||||||||
| America | Europe | Asia | Other | Minimum | Maximum | |||||||||||||||||||
|
Industrial Products
|
61 | 15 | 7 | 3 | 1 | 4 | ||||||||||||||||||
|
Engineered Systems
|
41 | 35 | 40 | 7 | 1 | 7 | ||||||||||||||||||
|
Fluid Management
|
80 | 11 | 5 | 3 | 1 | 15 | ||||||||||||||||||
|
Electronic Technologies
|
29 | 14 | 20 | 1 | 1 | 11 | ||||||||||||||||||
| Item 3. | Legal Proceedings |
15
Table of Contents
| Item 4. | [Removed and Reserved] |
| Name | Age | Positions Held and Prior Business Experience | ||||
|
Robert A. Livingston
|
57 | Chief Executive Officer and Director (since December 2008), President (since June 2008) and Chief Operating Officer (from June 2008 — December 2008) of Dover; prior thereto Vice President of Dover and President and Chief Executive Officer of Dover Engineered Systems, Inc. (from July 2007 to May 2008); prior thereto Vice President of Dover and President and Chief Executive Officer of Dover Electronics, Inc. (from October 1, 2004). | ||||
|
Kevin P. Buchanan
|
55 | Vice President, Taxation (since July 2010); prior thereto Deputy General Counsel, Tax (November 2009 to June 2010) and Vice President, Tax (May 2000 to October 2009) of Monsanto Company. | ||||
|
Ivonne M. Cabrera
|
44 | Vice President of Dover (since May 2010) and Deputy General Counsel of Dover (since February 2004). | ||||
|
Brad M. Cerepak
|
51 | Vice President and Chief Financial Officer (since August 2009); prior thereto Vice President, Finance (since June 2009) of Dover; prior thereto Vice President and Controller, Trane, Inc. (August 2005 to June 2008). | ||||
|
Thomas W. Giacomini
|
45 | Vice President of Dover (since February 2008) and President (since April 2009) and Chief Executive Officer of Dover Industrial Products, Inc. (since July 2009); prior thereto President of Material Handling Platform (since October 2007); prior thereto President of Warn Industries, Inc. (from July 2005); prior thereto Chief Operating Officer of Warn Industries, Inc. (from 2000 to July 2005). | ||||
|
Paul E. Goldberg
|
47 | Treasurer and Director of Investor Relations of Dover (since February 2006); prior thereto Assistant Treasurer of Dover (from July 2002). | ||||
|
Raymond C. Hoglund
|
60 | Vice President of Dover and President and Chief Executive Officer of Dover Engineered Systems, Inc. (since August 2008); prior thereto President and Chief Executive Officer of Hill Phoenix, Inc. (from February 2005). | ||||
|
Jay L. Kloosterboer
|
50 | Vice President, Human Resources (since January 2009); prior thereto Executive Vice President — Business Excellence of AES Corporation (from May 2005); prior thereto Vice President and Chief Human Resources Officer of AES Corporation (from May 2003). | ||||
|
Raymond T. McKay, Jr.
|
57 | Vice President of Dover (since February 2004), Controller of Dover (since November 2002). | ||||
|
James H. Moyle
|
58 | Vice President, Supply Chain and Global Sourcing (since April 2009); prior thereto Chief Financial Officer of Dover Fluid Management, Inc. (since July 2007); prior thereto Vice President and Chief Financial Officer of Dover Diversified, Inc. (since November 2005); prior thereto Executive Vice President of Knowles Electronics, Inc. (since September 2003). | ||||
16
Table of Contents
| Name | Age | Positions Held and Prior Business Experience | ||||
|
Joseph W. Schmidt
|
64 | Vice President, General Counsel and Secretary of Dover (since January 2003). | ||||
|
Stephen R. Sellhausen
|
52 | Vice President, Corporate Development of Dover (since January 2009); prior thereto Vice President, Business Development of Dover (from April 2008); prior thereto investment banker with Citigroup Global Markets. | ||||
|
Sivasankaran Somasundaram
|
45 | Vice President of Dover (since January 2008); Executive Vice President of Dover Fluid Management (since January 2010); President of Fluid Solutions Platform (since January 2008); prior thereto President of Gas Equipment Group (from May 2006); prior thereto President of RPA Process Technologies (from March 2004); prior thereto Vice President of Dorr-Oliver Eimco (supplier of solid/liquid separation equipment and wholly-owned subsidiary of GLV Inc.) (from November 2002 through February 2004). | ||||
|
William W. Spurgeon, Jr.
|
52 | Vice President of Dover and President and Chief Executive Officer of Dover Fluid Management, Inc. (since July 2007); prior thereto Vice President of Dover and President and Chief Executive Officer of Dover Diversified, Inc. (from October 1, 2004). | ||||
|
Michael Y. Zhang
|
47 | Vice President of Dover (since May 2010) and Managing Director of Dover Regional Headquarters Shanghai (since January 2009); prior thereto various roles at ABB, Ltd., including Vice President, ABB Control System and Product Business (September 2004 to March 2008). | ||||
|
David R. Van Loan
|
62 | Vice President of Dover and President and Chief Executive Officer of Dover Electronic Technologies, Inc. (since July 2007); prior thereto Vice President of Dover and President and Chief Executive Officer of Dover Technologies International, Inc. (from January 2006); prior thereto President of Dover Technologies International, Inc. (from July 2005); prior thereto for more than eight years, President and Chief Executive Officer of Everett Charles Technologies, Inc. | ||||
17
Table of Contents
| Item 5. | Market for Registrant’s Common Equity, Related Shareholder Matters and Issuer Purchases of Equity Securities |
| 2010 | 2009 | |||||||||||||||||||||||
| Market Prices |
Dividends
|
Market Prices |
Dividends
|
|||||||||||||||||||||
| High | Low | Per Share | High | Low | Per Share | |||||||||||||||||||
|
First Quarter
|
$ | 47.56 | $ | 40.50 | $ | 0.26 | $ | 36.15 | $ | 21.79 | $ | 0.25 | ||||||||||||
|
Second Quarter
|
55.50 | 41.42 | 0.26 | 36.55 | 25.83 | 0.25 | ||||||||||||||||||
|
Third Quarter
|
53.00 | 40.50 | 0.275 | 39.79 | 30.30 | 0.26 | ||||||||||||||||||
|
Fourth Quarter
|
59.20 | 51.39 | 0.275 | 43.10 | 36.52 | 0.26 | ||||||||||||||||||
| $ | 1.07 | $ | 1.02 | |||||||||||||||||||||
|
Total Number of
|
Maximum Number (or
|
|||||||||||||||
|
Shares Purchased as
|
Approximate Dollar Value)
|
|||||||||||||||
|
Total Number of
|
Part of Publicly
|
of Shares that May Yet Be
|
||||||||||||||
|
Shares
|
Average Price
|
Announced Plans or
|
Purchased under the Plans
|
|||||||||||||
| Period | Purchased(1) | Paid per Share | Programs | or Programs | ||||||||||||
|
October 1 to October 31
|
19,004 | $ | 53.00 | — | 7,453,968 | |||||||||||
|
November 1 to November 30
|
140,285 | 55.13 | 140,000 | 7,313,968 | ||||||||||||
|
December 1 to December 31
|
769,869 | 57.95 | 745,500 | 6,568,468 | ||||||||||||
|
For the Fourth Quarter 2010
|
929,158 | $ | 57.43 | 885,500 | 6,568,468 | |||||||||||
| (1) | In October, November and December, 19,004, 285, and 24,369 of these shares were acquired by the Company, respectively, from the holders of its employee stock options when they tendered these shares as full or partial payment of the exercise price of such options. These shares are applied against the exercise price at the market price on the date of exercise. During November and December, the Company purchased 140,000 and 745,500 shares, respectively, under the five-year, 10,000,000 share repurchase authorized by the Board of Directors in May 2007, leaving 6,568,468 available for repurchase as of the end of December 2010. |
18
Table of Contents
Dover Corporation, S&P 500 Index & Peer Group Index
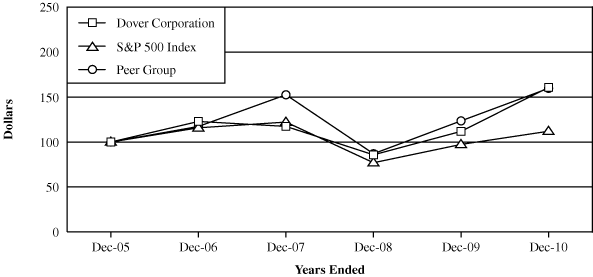
| * | Total return assumes reinvestment of dividends. |
|
Actuant Corp.
|
FMC Technologies | Parker-Hannifin Corp. | ||
|
ACGO Corporation
|
Honeywell International | Pentair Inc. | ||
|
Agilent Technologies
|
Hubbell Incorporated | Precision Castparts Corp. | ||
|
Ametek Inc.
|
IDEX Corporation | Rockwell Automation | ||
|
Cameron International
|
Illinois Tool Works | Roper Industries | ||
|
Carlisle Companies
|
Ingersoll-Rand Company | SPX Corporation | ||
|
Cooper Industries
|
ITT Corporation | Terex Corporation | ||
|
Crane Co.
|
Leggett & Platt Inc. | The Timken Company | ||
|
Danaher Corporation
|
Manitowoc Co. | Tyco International | ||
|
Deere & Company
|
Masco Corp. | United Technologies Corp. | ||
|
Eaton Corporation
|
Oshkosh Corp. | Weatherford International | ||
|
Emerson Electric Co.
|
Paccar Inc. | 3M Company | ||
|
Flowserve Corporation
|
Pall Corporation |
19
Table of Contents
| Item 6. | Selected Financial Data |
| 2010 | 2009 | 2008 | 2007 | 2006 | ||||||||||||||||
| (In thousands, except per share figures) | ||||||||||||||||||||
|
Revenue
|
$ | 7,132,648 | $ | 5,775,689 | $ | 7,568,888 | $ | 7,317,270 | $ | 6,419,528 | ||||||||||
|
Earnings from continuing operations
|
707,908 | 371,894 | 694,758 | 669,750 | 595,680 | |||||||||||||||
|
Basic earnings (loss) per share:
|
||||||||||||||||||||
|
Continuing operations
|
$ | 3.79 | $ | 2.00 | $ | 3.69 | $ | 3.33 | $ | 2.92 | ||||||||||
|
Discontinued operations
|
(0.04 | ) | (0.08 | ) | (0.55 | ) | (0.04 | ) | (0.17 | ) | ||||||||||
|
Net earnings
|
3.75 | 1.91 | 3.13 | 3.28 | 2.76 | |||||||||||||||
|
Weighted average shares outstanding
|
186,897 | 186,136 | 188,481 | 201,330 | 203,773 | |||||||||||||||
|
Diluted earnings (loss) per share:
|
||||||||||||||||||||
|
Continuing operations
|
$ | 3.74 | $ | 1.99 | $ | 3.67 | $ | 3.30 | $ | 2.90 | ||||||||||
|
Discontinued operations
|
(0.04 | ) | (0.08 | ) | (0.55 | ) | (0.04 | ) | (0.16 | ) | ||||||||||
|
Net earnings
|
3.70 | 1.91 | 3.12 | 3.26 | 2.73 | |||||||||||||||
|
Weighted average shares outstanding
|
189,170 | 186,736 | 189,269 | 202,918 | 205,497 | |||||||||||||||
|
Dividends per common share
|
$ | 1.07 | $ | 1.02 | $ | 0.90 | $ | 0.77 | $ | 0.71 | ||||||||||
|
Capital expenditures
|
$ | 183,217 | $ | 120,009 | $ | 175,795 | $ | 173,653 | $ | 191,937 | ||||||||||
|
Depreciation and amortization
|
268,406 | 258,223 | 261,154 | 243,776 | 195,840 | |||||||||||||||
|
Total assets
|
8,562,894 | 7,882,403 | 7,883,238 | 8,068,407 | 7,626,657 | |||||||||||||||
|
Total debt
|
1,807,811 | 1,860,884 | 2,085,673 | 2,090,652 | 1,771,040 | |||||||||||||||
20
Table of Contents
| Item 7. | Management’s Discussion and Analysis of Financial Condition and Results of Operations |
21
Table of Contents
| % / Point Change | ||||||||||||||||||||
|
2010
|
2009
|
|||||||||||||||||||
| Years Ended December 31, |
versus
|
versus
|
||||||||||||||||||
| 2010 | 2009 | 2008 | 2009 | 2008 | ||||||||||||||||
| (In thousands except per share figures) | ||||||||||||||||||||
|
Revenue
|
$ | 7,132,648 | $ | 5,775,689 | $ | 7,568,888 | 24 | % | (24 | )% | ||||||||||
|
Cost of goods and services
|
4,399,990 | 3,676,535 | 4,838,881 | 20 | % | (24 | )% | |||||||||||||
|
Gross profit
|
2,732,658 | 2,099,154 | 2,730,007 | 30 | % | (23 | )% | |||||||||||||
|
Selling and administrative expenses
|
1,697,721 | 1,511,111 | 1,700,677 | 12 | % | (11 | )% | |||||||||||||
|
Restructuring — severance and exit costs
|
6,200 | 72,102 | 27,364 | (91 | )% | 163 | % | |||||||||||||
|
Interest expense, net
|
106,341 | 100,375 | 96,037 | 6 | % | 5 | % | |||||||||||||
|
Other expense (income), net
|
3,512 | (3,950 | ) | (12,726 | ) | (189 | )% | (69 | )% | |||||||||||
|
Earnings from continuing operations
|
707,908 | 371,894 | 694,758 | 90 | % | (46 | )% | |||||||||||||
|
Net earnings
|
700,104 | 356,438 | 590,831 | 96 | % | (40 | )% | |||||||||||||
|
Net earnings per common share — diluted
|
$ | 3.70 | $ | 1.91 | $ | 3.12 | 94 | % | (39 | )% | ||||||||||
|
Gross profit margin
|
38.3 | % | 36.3 | % | 36.1 | % | 2.0 | 0.2 | ||||||||||||
|
Selling and administrative expenses as a percentage of revenue
|
23.8 | % | 26.2 | % | 22.5 | % | (2.4 | ) | 3.7 | |||||||||||
|
Effective tax rate
|
23.5 | % | 24.4 | % | 26.6 | % | (0.9 | ) | (2.2 | ) | ||||||||||
22
Table of Contents
23
Table of Contents
24
Table of Contents
| Severance | Exit | Total | ||||||||||
|
Balance at December 31, 2007
|
$ | 5,762 | $ | 22,668 | $ | 28,430 | ||||||
|
Provision
|
14,980 | 12,384 | 27,364 | |||||||||
|
Purchase accounting
|
2,933 | 2,698 | 5,631 | |||||||||
|
Payments
|
(16,094 | ) | (12,035 | ) | (28,129 | ) | ||||||
|
Other, including impairments
|
(378 | ) | (1,961 | ) | (2,339 | ) | ||||||
|
Balance at December 31, 2008
|
7,203 | 23,754 | 30,957 | |||||||||
|
Provision
|
53,106 | 18,996 | 72,102 | |||||||||
|
Purchase accounting
|
— | (16,074 | ) | (16,074 | ) | |||||||
|
Payments
|
(53,009 | ) | (13,828 | ) | (66,837 | ) | ||||||
|
Other, including impairments
|
852 | (4,229 | ) | (3,377 | ) | |||||||
|
Balance at December 31, 2009
|
8,152 | 8,619 | 16,771 | |||||||||
|
Provision
|
2,989 | 3,211 | 6,200 | |||||||||
|
Payments
|
(9,773 | ) | (5,574 | ) | (15,347 | ) | ||||||
|
Other, including impairments
|
(225 | ) | 495 | 270 | ||||||||
|
At December 31, 2010
|
$ | 1,143 | $ | 6,751 | $ | 7,894 | ||||||
| Years Ended December 31, | ||||||||||||
| 2010 | 2009 | 2008 | ||||||||||
|
Industrial Products
|
$ | 1,182 | $ | 17,505 | $ | 8,285 | ||||||
|
Engineered Systems
|
2,364 | 18,381 | 10,071 | |||||||||
|
Fluid Management
|
1,476 | 9,707 | 2,475 | |||||||||
|
Electronic Technologies
|
1,178 | 26,509 | 6,533 | |||||||||
|
Total
|
$ | 6,200 | $ | 72,102 | $ | 27,364 | ||||||
|
Classified in the Statements of Operations as follows:
|
||||||||||||
|
Cost of goods and services
|
$ | 2,147 | $ | 21,943 | $ | — | ||||||
|
Selling and adminstrative expenses
|
4,053 | 50,159 | 27,364 | |||||||||
|
Total
|
$ | 6,200 | $ | 72,102 | $ | 27,364 | ||||||
25
Table of Contents
| % Change | ||||||||||||||||||||
|
2010
|
2009
|
|||||||||||||||||||
| Years Ended December 31, |
versus
|
versus
|
||||||||||||||||||
| 2010 | 2009 | 2008 | 2009 | 2008 | ||||||||||||||||
| (In thousands) | ||||||||||||||||||||
|
Revenue
|
||||||||||||||||||||
|
Material Handling
|
$ | 854,331 | $ | 660,353 | $ | 1,136,869 | 29 | % | (42 | )% | ||||||||||
|
Mobile Equipment
|
995,159 | 962,177 | 1,323,422 | 3 | % | (27 | )% | |||||||||||||
|
Eliminations
|
(1,679 | ) | (738 | ) | (786 | ) | ||||||||||||||
| $ | 1,847,811 | $ | 1,621,792 | $ | 2,459,505 | 14 | % | (34 | )% | |||||||||||
|
Segment earnings
|
$ | 226,385 | $ | 139,757 | $ | 299,740 | 62 | % | (53 | )% | ||||||||||
|
Operating margin
|
12.3 | % | 8.6 | % | 12.2 | % | ||||||||||||||
|
Acquisition related depreciation and amortization expense*
|
$ | 31,792 | $ | 32,048 | $ | 32,283 | (1 | )% | (1 | )% | ||||||||||
|
Bookings
|
||||||||||||||||||||
|
Material Handling
|
$ | 899,794 | $ | 587,676 | $ | 1,109,028 | 53 | % | (47 | )% | ||||||||||
|
Mobile Equipment
|
1,033,114 | 901,164 | 1,177,880 | 15 | % | (23 | )% | |||||||||||||
|
Eliminations
|
(2,130 | ) | (986 | ) | (1,134 | ) | ||||||||||||||
| $ | 1,930,778 | $ | 1,487,854 | $ | 2,285,774 | 30 | % | (35 | )% | |||||||||||
|
Backlog
|
||||||||||||||||||||
|
Material Handling
|
$ | 165,505 | $ | 116,658 | $ | 188,591 | 42 | % | (38 | )% | ||||||||||
|
Mobile Equipment
|
368,140 | 329,774 | 387,329 | 12 | % | (15 | )% | |||||||||||||
|
Eliminations
|
(822 | ) | (371 | ) | (220 | ) | ||||||||||||||
| $ | 532,823 | $ | 446,061 | $ | 575,700 | 19 | % | (23 | )% | |||||||||||
| * | Represents the pre-tax impact on earnings from the depreciation and amortization of acquisition accounting write-ups to reflect the fair value of inventory, property, plant and equipment, and intangible assets. |
26
Table of Contents
| % Change | ||||||||||||||||||||
|
2010
|
2009
|
|||||||||||||||||||
| Years Ended December 31, |
versus
|
versus
|
||||||||||||||||||
| 2010 | 2009 | 2008 | 2009 | 2008 | ||||||||||||||||
| (In thousands) | ||||||||||||||||||||
|
Revenue
|
||||||||||||||||||||
|
Engineered Products
|
$ | 1,339,204 | $ | 1,059,660 | $ | 1,085,881 | 26 | % | (2 | )% | ||||||||||
|
Product Identification
|
890,471 | 802,276 | 924,469 | 11 | % | (13 | )% | |||||||||||||
| $ | 2,229,675 | $ | 1,861,936 | $ | 2,010,350 | 20 | % | (7 | )% | |||||||||||
|
Segment earnings
|
$ | 301,906 | $ | 227,268 | $ | 278,553 | 33 | % | (18 | )% | ||||||||||
|
Operating margin
|
13.5 | % | 12.2 | % | 13.9 | % | ||||||||||||||
|
Acquisition related depreciation and amortization expense*
|
$ | 28,688 | $ | 26,666 | $ | 24,394 | 8 | % | 9 | % | ||||||||||
|
Bookings
|
||||||||||||||||||||
|
Engineered Products
|
$ | 1,408,443 | $ | 1,018,067 | $ | 1,043,873 | 38 | % | (2 | )% | ||||||||||
|
Product Identification
|
902,874 | 817,359 | 920,712 | 10 | % | (11 | )% | |||||||||||||
| $ | 2,311,317 | $ | 1,835,426 | $ | 1,964,585 | 26 | % | (7 | )% | |||||||||||
|
Backlog
|
||||||||||||||||||||
|
Engineered Products
|
$ | 288,969 | $ | 218,520 | $ | 183,821 | 32 | % | 19 | % | ||||||||||
|
Product Identification
|
86,315 | 74,700 | 61,195 | 16 | % | 22 | % | |||||||||||||
| $ | 375,284 | $ | 293,220 | $ | 245,016 | 28 | % | 20 | % | |||||||||||
27
Table of Contents
| * | Represents the pre-tax impact on earnings from the depreciation and amortization of acquisition accounting write-ups to reflect the fair value of inventory, property, plant and equipment, and intangible assets. |
28
Table of Contents
| % Change | ||||||||||||||||||||
|
2010
|
2009
|
|||||||||||||||||||
| Years Ended December 31, |
versus
|
versus
|
||||||||||||||||||
| 2010 | 2009 | 2008 | 2009 | 2008 | ||||||||||||||||
| (In thousands) | ||||||||||||||||||||
|
Revenue
|
||||||||||||||||||||
|
Energy
|
$ | 885,582 | $ | 624,211 | $ | 935,414 | 42 | % | (33 | )% | ||||||||||
|
Fluid Solutions
|
754,650 | 646,849 | 778,812 | 17 | % | (17 | )% | |||||||||||||
|
Eliminations
|
(442 | ) | (150 | ) | (180 | ) | ||||||||||||||
| $ | 1,639,790 | $ | 1,270,910 | $ | 1,714,046 | 29 | % | (26 | )% | |||||||||||
|
Segment earnings
|
$ | 388,420 | $ | 259,269 | $ | 385,317 | 50 | % | (33 | )% | ||||||||||
|
Operating margin
|
23.7 | % | 20.4 | % | 22.5 | % | ||||||||||||||
|
Acquisition related depreciation and amortization expense*
|
$ | 22,010 | $ | 18,389 | $ | 19,550 | 20 | % | (6 | )% | ||||||||||
|
Bookings
|
||||||||||||||||||||
|
Energy
|
$ | 895,360 | $ | 610,045 | $ | 964,517 | 47 | % | (37 | )% | ||||||||||
|
Fluid Solutions
|
758,002 | 645,098 | 771,359 | 18 | % | (16 | )% | |||||||||||||
|
Eliminations
|
(1,175 | ) | (140 | ) | (178 | ) | ||||||||||||||
| $ | 1,652,187 | $ | 1,255,003 | $ | 1,735,698 | 32 | % | (28 | )% | |||||||||||
|
Backlog
|
||||||||||||||||||||
|
Energy
|
$ | 94,113 | $ | 77,173 | $ | 95,532 | 22 | % | (19 | )% | ||||||||||
|
Fluid Solutions
|
65,525 | 60,540 | 64,471 | 8 | % | (6 | )% | |||||||||||||
|
Eliminations
|
(33 | ) | (2 | ) | (12 | ) | ||||||||||||||
| $ | 159,605 | $ | 137,711 | $ | 159,991 | 16 | % | (14 | )% | |||||||||||
| * | Represents the pre-tax impact on earnings from the depreciation and amortization of acquisition accounting write-ups to reflect the fair value of inventory, property, plant and equipment, and intangible assets. |
29
Table of Contents
| % Change | ||||||||||||||||||||
|
2010
|
2009
|
|||||||||||||||||||
| Years Ended December 31, |
versus
|
versus
|
||||||||||||||||||
| 2010 | 2009 | 2008 | 2009 | 2008 | ||||||||||||||||
| (In thousands) | ||||||||||||||||||||
|
Revenue
|
$ | 1,423,664 | $ | 1,026,954 | $ | 1,396,131 | 39 | % | (26 | )% | ||||||||||
|
Segment earnings
|
250,428 | 83,694 | 193,641 | 199 | % | (57 | )% | |||||||||||||
|
Operating margin
|
17.6 | % | 8.1 | % | 13.9 | % | ||||||||||||||
|
Acquisition related depreciation and amortization expense*
|
$ | 33,998 | $ | 33,203 | $ | 36,481 | 2 | % | (9 | )% | ||||||||||
|
Bookings
|
$ | 1,544,954 | $ | 1,055,282 | $ | 1,342,382 | 46 | % | (21 | )% | ||||||||||
|
Backlog
|
342,578 | 206,893 | 175,317 | 66 | % | 18 | % | |||||||||||||
| * | Represents the pre-tax impact on earnings from the depreciation and amortization of acquisition accounting write-ups to reflect the fair value of inventory, property, plant and equipment, and intangible assets. |
30
Table of Contents
| At December 31, | ||||||||||||
| Net Debt to Net Capitalization Ratio | 2010 | 2009 | 2008 | |||||||||
| (In thousands) | ||||||||||||
|
Current maturities of long-term debt
|
$ | 1,925 | $ | 35,624 | $ | 32,194 | ||||||
|
Commercial paper
|
15,000 | — | 192,750 | |||||||||
|
Long-term debt
|
1,790,886 | 1,825,260 | 1,860,729 | |||||||||
|
Total debt
|
1,807,811 | 1,860,884 | 2,085,673 | |||||||||
|
Less: Cash, cash equivalents and short-term investments
|
(1,309,095 | ) | (938,174 | ) | (826,869 | ) | ||||||
|
Net debt
|
498,716 | 922,710 | 1,258,804 | |||||||||
|
Add: Stockholders’ equity
|
4,526,562 | 4,083,608 | 3,792,866 | |||||||||
|
Net capitalization
|
$ | 5,025,278 | $ | 5,006,318 | $ | 5,051,670 | ||||||
|
Net debt to net capitalization
|
9.9 | % | 18.4 | % | 24.9 | % | ||||||
31
Table of Contents
| Years Ended December 31, | ||||||||||||
| Free Cash Flow | 2010 | 2009 | 2008 | |||||||||
| (In thousands) | ||||||||||||
|
Cash flow provided by operating activities
|
$ | 950,551 | $ | 802,060 | $ | 1,010,416 | ||||||
|
Less: Capital expenditures
|
(183,217 | ) | (120,009 | ) | (175,795 | ) | ||||||
|
Free cash flow
|
$ | 767,334 | $ | 682,051 | $ | 834,621 | ||||||
|
Free cash flow as a percentage of revenue
|
10.8 | % | 11.8 | % | 11.0 | % | ||||||
32
Table of Contents
|
Short Term
|
Long Term
|
|||||||||||
| Rating | Rating | Outlook | ||||||||||
|
Moody’s
|
P-1 | A2 | Stable | |||||||||
|
Standard & Poor’s
|
A-1 | A | Stable | |||||||||
|
Fitch
|
F1 | A | Stable | |||||||||
| Years Ended December 31, | ||||||||||||
| Cash Flows from Continuing Operations | 2010 | 2009 | 2008 | |||||||||
| (In thousands) | ||||||||||||
|
Net Cash Flows Provided By (Used In):
|
||||||||||||
|
Operating activities
|
$ | 950,551 | $ | 802,060 | $ | 1,010,416 | ||||||
|
Investing activities
|
(178,957 | ) | (257,865 | ) | (452,994 | ) | ||||||
|
Financing activities
|
(304,788 | ) | (389,953 | ) | (560,904 | ) | ||||||
33
Table of Contents
34
Table of Contents
35
Table of Contents
| Payments Due by Period | ||||||||||||||||||||||||
|
Less than
|
More than
|
|||||||||||||||||||||||
| Total | 1 Year | 1-3 Years | 3-5 Years | 5 Years | Other(4) | |||||||||||||||||||
| (In thousands) | ||||||||||||||||||||||||
|
Long-term debt(1)
|
1,792,811 | $ | 401,911 | $ | 1,116 | $ | 299,047 | $ | 1,090,737 | $ | — | |||||||||||||
|
Interest expense(2)
|
1,293,735 | 82,875 | 159,250 | 157,422 | 894,188 | — | ||||||||||||||||||
|
Rental commitments
|
237,358 | 54,544 | 76,730 | 43,048 | 63,036 | — | ||||||||||||||||||
|
Purchase obligations
|
30,543 | 27,899 | 2,597 | 47 | — | — | ||||||||||||||||||
|
Capital leases
|
3,467 | 1,149 | 1,494 | 184 | 640 | — | ||||||||||||||||||
|
Supplemental & post-retirement
benefits(3)
|
116,008 | 18,706 | 22,562 | 31,828 | 42,912 | — | ||||||||||||||||||
|
Uncertain tax positions(4)
|
226,088 | 29,641 | — | — | — | 196,447 | ||||||||||||||||||
|
Total obligations
|
$ | 3,700,010 | $ | 616,725 | $ | 263,749 | $ | 531,576 | $ | 2,091,513 | $ | 196,447 | ||||||||||||
| (1) | See Note 8 to the Consolidated Financial Statements. Amounts represent total long-term debt, including current maturities. The amount presented within the less than one year category includes $399,986 relating to the Company’s 6.50% notes which mature February 15, 2011. This amount is classified as long-term within the Consolidated Balance Sheet at December 31, 2010 as the Company has the ability and intends to refinance this debt on a long-term basis. The Company anticipates refinancing this debt with a maturity date beyond five years; however, since the terms of the refinancing have not been finalized, the debt is reflected within the less than one year category in the above table. | |
| (2) | Amounts represent estimate of future interest payments on long-term debt using the interest rates in effect at December 31, 2010. | |
| (3) | Amounts represent estimated benefit payments under the Company’s supplemental and post-retirement benefit plans. See Note 13 to the Consolidated Financial Statements. The Company also expects to contribute approximately $40 million to its qualified defined benefit plans in 2011, which amount is not reflected in the above table. | |
| (4) | Due to the uncertainty of the potential settlement of future uncertain tax positions, management is unable to estimate the timing of the related payments, if any, that will be made subsequent to 2011. These amounts do not include the potential indirect benefits resulting from deductions or credits for payments made to other jurisdictions. |
| • | Revenue is recognized when all of the following circumstances are satisfied: a) persuasive evidence of an arrangement exists, b) price is fixed or determinable, c) collectability is reasonably assured, and d) delivery has occurred. In revenue transactions where installation is required, revenue can be recognized when the installation obligation is not essential to the functionality of the delivered products. Revenue transactions involving non-essential installation obligations are those which can generally be completed in a short period of time at insignificant cost and the skills required to complete these installations are not unique to the |
36
Table of Contents
| Company and in many cases can be provided by third parties or the customers. If the installation obligation is essential to the functionality of the delivered product, then revenue recognition is deferred until installation is complete. In addition, when it is determined that there are multiple deliverables to a sales arrangement, the Company will allocate consideration received to the separate deliverables based on their relative fair values and recognize revenue based on the appropriate criteria for each deliverable identified. In a limited number of revenue transactions, other post shipment obligations such as training and customer acceptance are required and, accordingly, revenue recognition is deferred until the customer is obligated to pay, or acceptance has been confirmed. Service revenue is recognized and earned when services are performed. Revenues associated with construction-type contracts are recorded using the percentage-of-completion method. The Company recognizes contract revenue under percentage-of-completion accounting using the cost to cost method measure of progress. The application of percentage of completion accounting requires estimates of future revenues and contract costs over the full term of the contract. The Company updates project cost estimates on a quarterly basis or more frequently when changes in circumstances warrant. |
| • | Inventory for the majority of the Company’s subsidiaries, including all international subsidiaries, are stated at the lower of cost, determined on the first-in, first-out (FIFO) basis, or market. Other domestic inventory is stated at cost, determined on the last-in, first-out (LIFO) basis, which is less than market value. Under certain market conditions, estimates and judgments regarding the valuation of inventory are employed by the Company to properly value inventory. The Electronic Technologies companies tend to experience somewhat higher levels of inventory value fluctuations, particularly given the relatively high rate of product obsolescence over relatively short periods of time. | |
| • | Occasionally, the Company will establish restructuring reserves at an operation, in accordance with appropriate accounting principles. These reserves, for both severance and exit costs, require the use of estimates. Though the Company believes that these estimates accurately reflect the anticipated costs, actual results may be different than the estimated amounts. | |
| • | The Company has significant tangible and intangible assets on its balance sheet that include goodwill and other intangibles related to acquisitions. The valuation and classification of these assets and the assignment of useful depreciation and amortization lives involve significant judgments and the use of estimates. The testing of these intangibles under established accounting guidelines for impairment also requires significant use of judgment and assumptions, particularly as it relates to the identification of reporting units and the determination of fair market value. The Company’s assets and reporting units are tested and reviewed for impairment on an annual basis during the fourth quarter or, when indicators of impairment exist, such as a significant sustained change in the business climate, during the interim periods. The Company estimates fair value using discounted cash flow analyses (i.e. an income approach) which incorporate management assumptions relating to future growth and profitability. Changes in business or market conditions could impact the future cash flows used in such analyses. The Company believes that its use of estimates and assumptions are reasonable and comply with generally accepted accounting principles. No goodwill impairment was indicated by the Company’s testing of its 10 identified reporting units in the fourth quarter of 2010, and the fair values of the reporting units significantly exceeded the carrying values. If the fair value of each of the reporting units was decreased by 10%, the resulting fair value would still have exceeded the carrying value and no impairment would have been recognized. | |
| • | The valuation of the Company’s pension and other post-retirement plans requires the use of assumptions and estimates that are used to develop actuarial valuations of expenses and assets/liabilities. Inherent in these valuations are key assumptions, including discount rates, investment returns, projected salary increases and benefits, and mortality rates. The actuarial assumptions used in the Company’s pension reporting are reviewed annually and are compared with external benchmarks to ensure that they accurately account for the Company’s future pension obligations. Changes in assumptions and future investment returns could potentially have a material impact on the Company’s pension expenses and related funding requirements. The Company’s expected long-term rate of return on plan assets is reviewed annually based on actual returns, economic trends and portfolio allocation. The Company’s discount rate assumption is determined by developing a yield curve based on high quality corporate bonds with maturities matching the plans’ expected benefit payment streams. The plans’ expected cash flows are then discounted by the resulting year-by-year |
37
Table of Contents
| spot rates. As disclosed in Note 13 to the Consolidated Financial Statements, the Company’s 2010 weighted-average discount rates used to measure its qualified defined benefit, supplemental and other post-retirement obligations were 5.37%, 5.50% and 5.10%, respectively, in each case reduced from the 2009 rates of 5.71%, 5.95% and 5.50%, respectively. The reduced discount rates are reflective of the decline in global market interests over these periods. A 25 basis point decrease in the discount rates used for these plans would have increased the post retirement benefit obligations by approximately $26.7 million from the amount recorded in the financial statements at December 31, 2010. The Company’s pension expense is also sensitive to changes in the expected long-term rate of return on plan assets. A decrease of 25 basis points in the expected long-term rate of return on assets would have increased the Company’s defined benefit pension expense by approximately $1.3 million. |
| • | The Company has significant amounts of deferred tax assets that are reviewed for recoverability and valued accordingly. These assets are evaluated by using estimates of future taxable income streams and the impact of tax planning strategies. Reserves are also estimated, using more likely than not criteria, for ongoing audits regarding federal, state and international issues that are currently unresolved. The Company routinely monitors the potential impact of these situations and believes that it is properly reserved. Reserves related to tax accruals and valuations related to deferred tax assets can be impacted by changes in accounting regulations, changes in tax codes and rulings, changes in statutory tax rates, and the Company’s future taxable income levels. The provision for uncertain tax positions provides a recognition threshold and measurement attribute for financial statement tax benefits taken or expected to be taken in a tax return and disclosure requirements regarding uncertainties in income tax positions. The tax position is measured at the largest amount of benefit that is greater than 50 percent likely of being realized upon ultimate settlement. The Company records interest and penalties related to unrecognized tax benefits as a component of its provision for income taxes. | |
| • | The Company has significant accruals and reserves related to the self-insured portion of its risk management program. These accruals require the use of estimates and judgment with regard to risk exposure and ultimate liability. The Company estimates losses under these programs using actuarial assumptions, the Company’s experience and relevant industry data. The Company reviews these factors quarterly and considers the current level of accruals and reserves adequate relative to current market conditions and Company experience. | |
| • | The Company has established reserves for environmental and legal contingencies at both the operating company and corporate levels. A significant amount of judgment and the use of estimates is required to quantify the Company’s ultimate exposure in these matters. The valuation of reserves for contingencies is reviewed on a quarterly basis at the operating and corporate levels to ensure that the Company is properly reserved. Reserve balances are adjusted to account for changes in circumstances for ongoing issues and the establishment of additional reserves for emerging issues. While the Company believes that the current level of reserves is adequate, future changes in circumstances could impact these determinations. | |
| • | The Company from time to time will discontinue certain operations for various reasons. Estimates are used to adjust, if necessary, the assets and liabilities of discontinued operations to their estimated fair market value. These estimates include assumptions relating to the proceeds anticipated as a result of the sale. Fair value is established using internal valuation calculations along with market analysis of similar-type entities. The adjustments to fair market value of these operations provide the basis for the gain or loss when sold. Changes in business conditions or the inability to sell an operation could potentially require future adjustments to these estimates. | |
| • | The Company is required to recognize in its consolidated statements of operations the expense associated with all share-based payment awards made to employees and directors, including stock options, stock appreciation rights (SARs), restricted stock and performance share awards. The Company uses the Black-Scholes valuation model to estimate the fair value of its SARs, and stock options that are granted to employees. The model requires management to estimate the expected life of the SAR or option, expected forfeitures and the volatility of the Company’s stock using historical data. The Company uses the Monte Carlo simulation model to estimate fair value of performance share awards which also requires management |
38
Table of Contents
| to estimate the volatility of its stock and the volatility of returns on the stock of its peer group as well as the correlation of the returns between the companies in the peer group. For additional information related to the assumptions used, see Note 10 to the Consolidated Financial Statements in Item 8 of this Form 10-K. |
39
Table of Contents
| Item 7A. | Quantitative and Qualitative Disclosures About Market Risk |
40
Table of Contents
| Item 8. | Financial Statements and Supplementary Data |
FINANCIAL STATEMENT SCHEDULE
41
Table of Contents
42
Table of Contents
43
Table of Contents
44
Table of Contents
| Years Ended December 31, | ||||||||||||
| 2010 | 2009 | 2008 | ||||||||||
| (In thousands, except per share amounts) | ||||||||||||
|
Revenue
|
$ | 7,132,648 | $ | 5,775,689 | $ | 7,568,888 | ||||||
|
Cost of goods and services
|
4,399,990 | 3,676,535 | 4,838,881 | |||||||||
|
Gross profit
|
2,732,658 | 2,099,154 | 2,730,007 | |||||||||
|
Selling and administrative expenses
|
1,697,721 | 1,511,111 | 1,700,677 | |||||||||
|
Operating earnings
|
1,034,937 | 588,043 | 1,029,330 | |||||||||
|
Interest expense, net
|
106,341 | 100,375 | 96,037 | |||||||||
|
Other expense (income), net
|
3,512 | (3,950 | ) | (12,726 | ) | |||||||
|
Earnings before provision for income taxes and discontinued
operations
|
925,084 | 491,618 | 946,019 | |||||||||
|
Provision for income taxes
|
217,176 | 119,724 | 251,261 | |||||||||
|
Earnings from continuing operations
|
707,908 | 371,894 | 694,758 | |||||||||
|
Loss from discontinued operations, net
|
(7,804 | ) | (15,456 | ) | (103,927 | ) | ||||||
|
Net earnings
|
$ | 700,104 | $ | 356,438 | $ | 590,831 | ||||||
|
Basic earnings (loss) per common share:
|
||||||||||||
|
Earnings from continuing operations
|
$ | 3.79 | $ | 2.00 | $ | 3.69 | ||||||
|
Loss from discontinued operations, net
|
(0.04 | ) | (0.08 | ) | (0.55 | ) | ||||||
|
Net earnings
|
3.75 | 1.91 | 3.13 | |||||||||
|
Weighted average shares outstanding
|
186,897 | 186,136 | 188,481 | |||||||||
|
Diluted earnings (loss) per common share:
|
||||||||||||
|
Earnings from continuing operations
|
$ | 3.74 | $ | 1.99 | $ | 3.67 | ||||||
|
Loss from discontinued operations, net
|
(0.04 | ) | (0.08 | ) | (0.55 | ) | ||||||
|
Net earnings
|
3.70 | 1.91 | 3.12 | |||||||||
|
Weighted average shares outstanding
|
189,170 | 186,736 | 189,269 | |||||||||
|
Dividends paid per common share
|
$ | 1.07 | $ | 1.02 | $ | 0.90 | ||||||
| Years Ended December 31, | ||||||||||||
| 2010 | 2009 | 2008 | ||||||||||
|
Weighted average shares outstanding — Basic
|
186,897 | 186,136 | 188,481 | |||||||||
|
Dilutive effect of assumed exercise of employee stock options,
SARs and performance shares
|
2,273 | 600 | 788 | |||||||||
|
Weighted average shares outstanding — Diluted
|
189,170 | 186,736 | 189,269 | |||||||||
|
Anti-dilutive options/SARs excluded from diluted EPS computation
|
1,378 | 9,176 | 5,103 | |||||||||
45
Table of Contents
|
At December 31,
|
At December 31,
|
|||||||
| 2010 | 2009 | |||||||
| (In thousands) | ||||||||
|
Current assets:
|
||||||||
|
Cash and cash equivalents
|
$ | 1,187,361 | $ | 714,365 | ||||
|
Short-term investments
|
121,734 | 223,809 | ||||||
|
Receivables, net of allowances of $34,151 and $41,832
|
1,087,704 | 878,754 | ||||||
|
Inventories, net
|
714,110 | 570,858 | ||||||
|
Prepaid and other current assets
|
61,242 | 64,922 | ||||||
|
Deferred tax asset
|
89,720 | 69,999 | ||||||
|
Total current assets
|
3,261,871 | 2,522,707 | ||||||
|
Property, plant and equipment, net
|
847,189 | 828,922 | ||||||
|
Goodwill
|
3,368,033 | 3,350,217 | ||||||
|
Intangible assets, net
|
907,523 | 950,748 | ||||||
|
Other assets and deferred charges
|
111,145 | 113,108 | ||||||
|
Assets of discontinued operations
|
67,133 | 116,701 | ||||||
|
Total assets
|
$ | 8,562,894 | $ | 7,882,403 | ||||
|
Current liabilities:
|
||||||||
|
Notes payable and current maturities of long-term debt
|
$ | 16,925 | $ | 35,624 | ||||
|
Accounts payable
|
469,038 | 357,004 | ||||||
|
Accrued compensation and employee benefits
|
275,947 | 210,804 | ||||||
|
Accrued insurance
|
112,198 | 107,455 | ||||||
|
Other accrued expenses
|
240,786 | 219,295 | ||||||
|
Federal and other taxes on income
|
79,492 | 38,994 | ||||||
|
Total current liabilities
|
1,194,386 | 969,176 | ||||||
|
Long-term debt
|
1,790,886 | 1,825,260 | ||||||
|
Deferred income taxes
|
381,297 | 292,344 | ||||||
|
Other liabilities
|
564,121 | 573,137 | ||||||
|
Liabilities of discontinued operations
|
105,642 | 138,878 | ||||||
|
Commitments and contingent liabilities
|
||||||||
|
Stockholders’ Equity:
|
||||||||
|
Preferred stock
|
— | — | ||||||
|
Common stock
|
249,361 | 247,342 | ||||||
|
Additional paid-in capital
|
596,457 | 497,291 | ||||||
|
Accumulated other comprehensive earnings
|
50,161 | 84,842 | ||||||
|
Retained earnings
|
5,953,027 | 5,453,022 | ||||||
|
Common stock in treasury
|
(2,322,444 | ) | (2,198,889 | ) | ||||
|
Total stockholders’ equity
|
4,526,562 | 4,083,608 | ||||||
|
Total liabilities and stockholders’ equity
|
$ | 8,562,894 | $ | 7,882,403 | ||||
46
Table of Contents
|
Accumulated
|
|||||||||||||||||||||||||||||
|
Common
|
Additional
|
Other
|
Total
|
Comprehensive
|
|||||||||||||||||||||||||
|
Stock
|
Paid-In
|
Comprehensive
|
Retained
|
Treasury
|
Stockholders’
|
Earnings
|
|||||||||||||||||||||||
| $1 Par Value | Capital | Earnings (Loss) | Earnings | Stock | Equity | (Loss) | |||||||||||||||||||||||
| (In thousands) | |||||||||||||||||||||||||||||
|
Balance at December 31, 2007
|
$ | 244,548 | $ | 353,031 | $ | 217,648 | $ | 4,870,460 | $ | (1,739,514 | ) | $ | 3,946,173 | $ | 829,876 | ||||||||||||||
|
Net earnings
|
— | — | — | 590,831 | — | 590,831 | $ | 590,831 | |||||||||||||||||||||
|
Dividends paid
|
— | — | — | (169,071 | ) | — | (169,071 | ) | — | ||||||||||||||||||||
|
Common stock issued for options exercised
|
2,038 | 68,549 | — | — | — | 70,587 | — | ||||||||||||||||||||||
|
Tax benefit from the exercise of stock options
|
— | 8,449 | — | — | — | 8,449 | — | ||||||||||||||||||||||
|
Stock-based compensation expense
|
— | 24,367 | — | — | — | 24,367 | — | ||||||||||||||||||||||
|
Common stock issued, net of cancellations
|
29 | 832 | — | — | — | 861 | — | ||||||||||||||||||||||
|
Common stock acquired
|
— | — | — | — | (466,737 | ) | (466,737 | ) | — | ||||||||||||||||||||
|
Translation of foreign financial statements
|
— | — | (146,433 | ) | — | — | (146,433 | ) | (146,433 | ) | |||||||||||||||||||
|
Unrealized holding losses, net of tax of $582
|
— | — | (1,081 | ) | — | — | (1,081 | ) | (1,081 | ) | |||||||||||||||||||
|
Effect of adoption of ASC 715, change in measurement date
|
— | — | 1,960 | (5,762 | ) | — | (3,802 | ) | — | ||||||||||||||||||||
|
Pension amortization and adjustment, net of tax of $31,923
|
— | — | (61,278 | ) | — | — | (61,278 | ) | (61,278 | ) | |||||||||||||||||||
|
Balance at December 31, 2008
|
$ | 246,615 | $ | 455,228 | $ | 10,816 | $ | 5,286,458 | $ | (2,206,251 | ) | $ | 3,792,866 | $ | 382,039 | ||||||||||||||
|
Net earnings
|
— | — | — | 356,438 | — | 356,438 | $ | 356,438 | |||||||||||||||||||||
|
Dividends paid
|
— | — | — | (189,874 | ) | — | (189,874 | ) | — | ||||||||||||||||||||
|
Common stock issued for options exercised
|
712 | 24,807 | — | — | — | 25,519 | — | ||||||||||||||||||||||
|
Tax benefit from the exercise of stock options
|
— | 425 | — | — | — | 425 | — | ||||||||||||||||||||||
|
Stock-based compensation expense
|
— | 17,176 | — | — | — | 17,176 | — | ||||||||||||||||||||||
|
Common stock issued, net of cancellations
|
15 | 617 | — | — | — | 632 | — | ||||||||||||||||||||||
|
Issuance of treasury stock
|
— | (962 | ) | — | — | 7,362 | 6,400 | — | |||||||||||||||||||||
|
Translation of foreign financial statements
|
— | — | 76,442 | — | — | 76,442 | 76,442 | ||||||||||||||||||||||
|
Unrealized holding gains, net of tax of ($582)
|
— | — | 1,091 | — | — | 1,091 | 1,091 | ||||||||||||||||||||||
|
Pension amortization and adjustment, net of tax of $1,740
|
— | — | (3,507 | ) | — | — | (3,507 | ) | (3,507 | ) | |||||||||||||||||||
|
Balance at December 31, 2009
|
$ | 247,342 | $ | 497,291 | $ | 84,842 | $ | 5,453,022 | $ | (2,198,889 | ) | $ | 4,083,608 | $ | 430,464 | ||||||||||||||
|
Net earnings
|
— | — | — | 700,104 | — | 700,104 | $ | 700,104 | |||||||||||||||||||||
|
Dividends paid
|
— | — | — | (200,099 | ) | — | (200,099 | ) | — | ||||||||||||||||||||
|
Common stock issued for options exercised
|
1,983 | 69,465 | — | — | — | 71,448 | — | ||||||||||||||||||||||
|
Tax benefit from the exercise of stock options
|
— | 6,466 | — | — | — | 6,466 | — | ||||||||||||||||||||||
|
Stock-based compensation expense
|
— | 21,464 | — | — | — | 21,464 | — | ||||||||||||||||||||||
|
Common stock issued, net of cancellations
|
36 | 1,771 | — | — | — | 1,807 | — | ||||||||||||||||||||||
|
Common stock acquired
|
— | — | — | — | (123,555 | ) | (123,555 | ) | — | ||||||||||||||||||||
|
Translation of foreign financial statements
|
— | — | (33,636 | ) | — | — | (33,636 | ) | (33,636 | ) | |||||||||||||||||||
|
Unrealized holding losses, net of tax of ($126)
|
— | — | 234 | — | — | 234 | 234 | ||||||||||||||||||||||
|
Pension amortization and adjustment, net of tax of $1,189
|
— | — | (1,279 | ) | — | — | (1,279 | ) | (1,279 | ) | |||||||||||||||||||
|
Balance at December 31, 2010
|
$ | 249,361 | $ | 596,457 | $ | 50,161 | $ | 5,953,027 | $ | (2,322,444 | ) | $ | 4,526,562 | $ | 665,423 | ||||||||||||||
47
Table of Contents
| For the Years Ended December 31, | ||||||||||||
| 2010 | 2009 | 2008 | ||||||||||
| (In thousands) | ||||||||||||
|
Operating Activities of Continuing Operations
|
||||||||||||
|
Net earnings
|
$ | 700,104 | $ | 356,438 | $ | 590,831 | ||||||
|
Adjustments to reconcile net earnings to net cash provided by
operating activities:
|
||||||||||||
|
Loss from discontinued operations
|
7,804 | 15,456 | 103,927 | |||||||||
|
Depreciation and amortization
|
268,406 | 258,223 | 261,154 | |||||||||
|
Stock-based compensation
|
22,102 | 17,912 | 25,246 | |||||||||
|
Provision for losses on accounts receivable (net of recoveries)
|
(620 | ) | 17,260 | 12,040 | ||||||||
|
Deferred income taxes
|
84,839 | (23,062 | ) | 33,459 | ||||||||
|
Employee benefit plan expense
|
32,914 | 37,221 | 36,275 | |||||||||
|
Loss on extinguishment of long-term debt
|
4,343 | — | — | |||||||||
|
Gain on sale of line of business
|
— | — | (7,518 | ) | ||||||||
|
Other non-current, net
|
15,937 | 26,609 | (33,081 | ) | ||||||||
|
Cash effect of changes in current assets and liabilities
(excluding effects of acquisitions, dispositions and foreign
exchange):
|
||||||||||||
|
Accounts receivable
|
(195,934 | ) | 163,054 | 36,427 | ||||||||
|
Inventories
|
(131,476 | ) | 97,241 | 27,128 | ||||||||
|
Prepaid expenses and other assets
|
4,766 | 18,296 | 882 | |||||||||
|
Accounts payable
|
104,093 | (31,306 | ) | (19,273 | ) | |||||||
|
Accrued expenses
|
92,975 | (95,647 | ) | 26,161 | ||||||||
|
Accrued taxes
|
(1,501 | ) | 23,319 | (27,881 | ) | |||||||
|
Contributions to employee benefit plans
|
(58,201 | ) | (78,954 | ) | (55,361 | ) | ||||||
|
Net cash provided by operating activities of continuing
operations
|
950,551 | 802,060 | 1,010,416 | |||||||||
|
Investing Activities of Continuing Operations
|
||||||||||||
|
Proceeds from sale of short-term investments
|
553,466 | 406,033 | — | |||||||||
|
Purchase of short-term investments
|
(466,881 | ) | (348,439 | ) | (279,460 | ) | ||||||
|
Proceeds from sale of property, plant and equipment
|
17,593 | 22,973 | 13,248 | |||||||||
|
Additions to property, plant and equipment
|
(183,217 | ) | (120,009 | ) | (175,795 | ) | ||||||
|
Proceeds from sales of businesses
|
4,500 | 3,571 | 92,774 | |||||||||
|
Acquisitions (net of cash acquired)
|
(104,418 | ) | (221,994 | ) | (103,761 | ) | ||||||
|
Net cash used in investing activities of continuing
operations
|
(178,957 | ) | (257,865 | ) | (452,994 | ) | ||||||
|
Financing Activities of Continuing Operations
|
||||||||||||
|
Increase (decrease) in notes payable, net
|
15,000 | (192,749 | ) | (412,723 | ) | |||||||
|
Reduction of long-term debt
|
(75,855 | ) | (33,908 | ) | (186,390 | ) | ||||||
|
Proceeds from long-term debt
|
— | — | 594,120 | |||||||||
|
Purchase of common stock
|
(123,555 | ) | — | (466,737 | ) | |||||||
|
Proceeds from exercise of stock options, including tax benefits
|
79,721 | 26,578 | 79,897 | |||||||||
|
Dividends to stockholders
|
(200,099 | ) | (189,874 | ) | (169,071 | ) | ||||||
|
Net cash used in financing activities of continuing
operations
|
(304,788 | ) | (389,953 | ) | (560,904 | ) | ||||||
|
Cash Flows from Discontinued Operations
|
||||||||||||
|
Net cash used in operating activities of discontinued operations
|
(3,700 | ) | (5,967 | ) | (7,592 | ) | ||||||
|
Net cash used in investing activities of discontinued operations
|
(140 | ) | (888 | ) | (1,805 | ) | ||||||
|
Net cash used in discontinued operations
|
(3,840 | ) | (6,855 | ) | (9,397 | ) | ||||||
|
Effect of exchange rate changes on cash and cash equivalents
|
10,030 | 19,569 | (45,817 | ) | ||||||||
|
Net increase in cash and cash equivalents
|
472,996 | 166,956 | (58,696 | ) | ||||||||
|
Cash and cash equivalents at beginning of period
|
714,365 | 547,409 | 606,105 | |||||||||
|
Cash and cash equivalents at end of period
|
$ | 1,187,361 | $ | 714,365 | $ | 547,409 | ||||||
|
Supplemental information — cash paid during the
year for:
|
||||||||||||
|
Income taxes
|
$ | 105,328 | $ | 115,047 | $ | 212,348 | ||||||
|
Interest
|
$ | 116,037 | $ | 116,847 | $ | 120,834 | ||||||
48
Table of Contents
| 1. | Description of Business and Summary of Significant Accounting Policies |
49
Table of Contents
50
Table of Contents
51
Table of Contents
| 2. | Acquisitions |
52
Table of Contents
|
Company/Product
|
||||||||||||
| Date | Type | Line Acquired | Location (Near) | Segment | Platform | Company | ||||||
|
4-May
|
Stock | BSC Filters | York, UK | Electronic Technologies | N/A | Ceramic & Microwave Products Group | ||||||
|
Designer and manufacturer of microwave filters, diplexers,
waveguide and coaxial passive components.
|
||||||||||||
|
1-Jun
|
Asset | Chemilizer | Largo, FL | Fluid Management | Fluid Solutions | HydroSystems | ||||||
|
Manufacturer of non-electric, volumetric dosing equipment used
in commercial animal raising, agriculture, horticulture and
irrigation markets.
|
||||||||||||
|
17-Aug
|
Asset | Intek Manufacturing | Fort Wayne, IN | Engineered Systems | Engineered Products | Unified Brands | ||||||
|
Manufacturer of electric and gas steam equipment (steamers,
kettles, braising pans).
|
||||||||||||
|
30-Sep
|
Asset | Diagnostic Product Line — Dynalco Controls | Ft. Lauderdale, FL | Fluid Management | Energy | Cook Compression | ||||||
|
Manufacturer and servicer of portable analyzers targeting the
gas gathering and gas transmission markets.
|
||||||||||||
|
30-Sep
|
Stock | Gear Products | Tulsa, OK | Industrial Products | Material Handling | Tulsa Winch Group | ||||||
|
Manufacturer of worm gear and planetary hoists, rotation drives,
rotation bearings and hydraulic pump drives.
|
||||||||||||
|
24-Nov
|
Asset | KMC/Bearings Inc. | Houston, TX/Rhode Island | Fluid Management | Energy | Waukesha Bearings | ||||||
|
Designer and manufacturer of fluid film bearings serving process
plant, refinery, deep hole drilling, plant air and
refridgeration industries.
|
||||||||||||
| 2010 | ||||
|
Current assets, net of cash acquired
|
$ | 14,983 | ||
|
Property, plant and equipment
|
11,610 | |||
|
Goodwill
|
40,086 | |||
|
Intangible assets
|
43,650 | |||
|
Total assets acquired
|
110,329 | |||
|
Total liabilities assumed
|
(5,911 | ) | ||
|
Net assets acquired
|
$ | 104,418 | ||
53
Table of Contents
|
Industrial
|
Engineered
|
Fluid
|
Electronic
|
|||||||||||||||||
| Products | Systems | Management | Technologies | Total | ||||||||||||||||
|
Goodwill — Tax deductible
|
$ | 8,106 | $ | 4,575 | $ | 22,970 | $ | — | $ | 35,651 | ||||||||||
|
Goodwill — Non deductible
|
— | — | — | 4,435 | 4,435 | |||||||||||||||
|
Trademarks
|
738 | 552 | 1,900 | — | 3,190 | |||||||||||||||
|
Customer intangibles
|
5,157 | 1,180 | 25,525 | 1,240 | 33,102 | |||||||||||||||
|
Unpatented technologies
|
— | — | 5,854 | — | 5,854 | |||||||||||||||
|
Other intangibles
|
— | — | 364 | 1,140 | 1,504 | |||||||||||||||
| $ | 14,001 | $ | 6,307 | $ | 56,613 | $ | 6,815 | $ | 83,736 | |||||||||||
| Date | Type | Acquired Companies | Location (Near) | Segment | Platform | Company | ||||||
|
8-May
|
Asset | Tyler Refrigeration | Niles, MI | Engineered Systems | Engineered Products | Hill Phoenix | ||||||
|
Manufacturer of refrigerated specialty display merchandisers and
refrigeration systems for the food retail industry.
|
||||||||||||
|
24-Aug
|
Asset | Mechanical Field Services | Gardendale, TX | Fluid Management | Energy | Cook Compression | ||||||
|
Manufacturer of air and gas compressors.
|
||||||||||||
|
12-Nov
|
Asset | Ala Cart Inc. | Charlotte, NC | Engineered Systems | Engineered Products | Unified Brands | ||||||
|
Manufacturer of foodservice equipment, ventilation and conveyor
systems.
|
||||||||||||
|
17-Nov
|
Asset/Stock | Barker Company | Keosaugua, IA | Engineered Systems | Engineered Products | Hill Phoenix | ||||||
|
Manufacturer of refrigerated, non-refrigerated and hot display
cases.
|
||||||||||||
|
16-Dec
|
Asset | Extech Instruments | Waltham, MA | Engineered Systems | Product Identification | Datamax O’Neil | ||||||
|
Developer of portable printers for enterprise-wide applications.
|
||||||||||||
|
31-Dec
|
Asset | Inpro/Seal | Rock Island, IL | Fluid Management | Energy | Waukesha Bearings | ||||||
|
Manufacturer of metallic gaskets and machined seals, parts and
components for ball and roller bearings.
|
||||||||||||
54
Table of Contents
| Years Ended December 31, | ||||||||
| 2010 | 2009 | |||||||
|
Revenue from continuing operations:
|
||||||||
|
As reported
|
$ | 7,132,648 | $ | 5,775,689 | ||||
|
Pro forma
|
7,173,187 | 5,827,947 | ||||||
|
Net earnings from continuing operations:
|
||||||||
|
As reported
|
$ | 707,908 | $ | 371,894 | ||||
|
Pro forma
|
713,306 | 374,794 | ||||||
|
Basic earnings per share from continuing operations:
|
||||||||
|
As reported
|
$ | 3.79 | $ | 2.00 | ||||
|
Pro forma
|
3.82 | 2.01 | ||||||
|
Diluted earnings per share from continuing operations:
|
||||||||
|
As reported
|
$ | 3.74 | $ | 1.99 | ||||
|
Pro forma
|
3.77 | 2.01 | ||||||
| 3. | Disposed and Discontinued Operations |
| Years Ended December 31, | ||||||||||||
| 2010 | 2009 | 2008 | ||||||||||
|
Revenue
|
$ | 9,380 | $ | 55,275 | $ | 84,065 | ||||||
|
Loss on sale, net of taxes(1)
|
$ | (14,203 | ) | $ | (11,170 | ) | $ | (101,692 | ) | |||
|
Earnings (loss) from operations before taxes
|
(3,918 | ) | (2,062 | ) | (3,886 | ) | ||||||
|
Benefit (provision) for income taxes
|
10,317 | (2,224 | ) | 1,651 | ||||||||
|
Gain (loss) from discontinued operations, net of tax
|
$ | (7,804 | ) | $ | (15,456 | ) | $ | (103,927 | ) | |||
55
Table of Contents
| (1) | Includes impairments and other adjustments to previously sold discontinued operations. |
| At December 31, | At December 31, | |||||||
| 2010 | 2009 | |||||||
|
Assets of Discontinued Operations
|
||||||||
|
Current assets
|
$ | 52,678 | $ | 73,284 | ||||
|
Non-current assets
|
14,455 | 43,417 | ||||||
| $ | 67,133 | $ | 116,701 | |||||
|
Liabilities of Discontinued Operations
|
||||||||
|
Current liabilities
|
$ | 34,111 | $ | 25,919 | ||||
|
Non-current liabilities
|
71,531 | 112,959 | ||||||
| $ | 105,642 | $ | 138,878 | |||||
| 4. | Inventories |
| At December 31, | At December 31, | |||||||
| 2010 | 2009 | |||||||
|
Raw materials
|
$ | 349,628 | $ | 291,340 | ||||
|
Work in progress
|
161,597 | 136,726 | ||||||
|
Finished goods
|
253,910 | 191,853 | ||||||
|
Subtotal
|
765,135 | 619,919 | ||||||
|
Less LIFO reserve
|
51,025 | 49,061 | ||||||
|
Total
|
$ | 714,110 | $ | 570,858 | ||||
56
Table of Contents
| 5. | Property, Plant & Equipment |
| At December 31, | At December 31, | |||||||
| 2010 | 2009 | |||||||
|
Land
|
$ | 50,760 | $ | 48,010 | ||||
|
Buildings and improvements
|
567,941 | 555,262 | ||||||
|
Machinery, equipment and other
|
1,921,509 | 1,840,638 | ||||||
| 2,540,210 | 2,443,910 | |||||||
|
Accumulated depreciation
|
(1,693,021 | ) | (1,614,988 | ) | ||||
|
Total
|
$ | 847,189 | $ | 828,922 | ||||
| 6. | Goodwill and Other Intangible Assets |
|
Industrial
|
Engineered
|
Fluid
|
Electronic
|
|||||||||||||||||
| Products | Systems | Management | Technologies | Total | ||||||||||||||||
|
Goodwill
|
1,018,967 | 788,424 | 631,191 | 976,706 | 3,415,288 | |||||||||||||||
|
Accumulated impairment losses
|
(99,752 | ) | — | (59,970 | ) | — | (159,722 | ) | ||||||||||||
|
Balance at January 1, 2009
|
919,215 | 788,424 | 571,221 | 976,706 | 3,255,566 | |||||||||||||||
|
Acquisitions
|
— | 49,807 | 43,882 | — | 93,689 | |||||||||||||||
|
Foreign currency translation
|
1,236 | 4,887 | 2,829 | 2,800 | 11,752 | |||||||||||||||
|
Purchase price adjustments
|
— | (10,790 | ) | — | — | (10,790 | ) | |||||||||||||
|
Balance at December 31, 2009
|
920,451 | 832,328 | 617,932 | 979,506 | 3,350,217 | |||||||||||||||
|
Acquisitions
|
8,106 | 4,575 | 22,970 | 4,435 | 40,086 | |||||||||||||||
|
Foreign currency translation
|
824 | (3,665 | ) | (644 | ) | (6,130 | ) | (9,615 | ) | |||||||||||
|
Purchase price adjustments
|
2,525 | (14,184 | ) | (996 | ) | — | (12,655 | ) | ||||||||||||
|
Balance at December 31, 2010
|
931,906 | 819,054 | 639,262 | 977,811 | 3,368,033 | |||||||||||||||
57
Table of Contents
| At December 31, 2010 | At December 31, 2009 | |||||||||||||||
|
Gross Carrying
|
Accumulated
|
Gross Carrying
|
Accumulated
|
|||||||||||||
| Amount | Amortization | Amount | Amortization | |||||||||||||
|
Amortized Intangible Assets:
|
||||||||||||||||
|
Trademarks
|
$ | 74,053 | $ | 21,330 | $ | 72,790 | $ | 16,492 | ||||||||
|
Patents
|
131,975 | 94,632 | 128,041 | 84,092 | ||||||||||||
|
Customer Intangibles
|
802,663 | 334,585 | 764,865 | 267,558 | ||||||||||||
|
Unpatented Technologies
|
138,780 | 86,461 | 134,822 | 75,244 | ||||||||||||
|
Drawings & Manuals
|
15,650 | 7,728 | 11,922 | 6,523 | ||||||||||||
|
Distributor Relationships
|
73,183 | 24,724 | 73,230 | 20,974 | ||||||||||||
|
Other
|
28,202 | 18,445 | 23,740 | 16,032 | ||||||||||||
|
Total
|
1,264,506 | 587,905 | 1,209,410 | 486,915 | ||||||||||||
|
Unamortized Intangible Assets:
|
||||||||||||||||
|
Trademarks
|
230,922 | 228,253 | ||||||||||||||
|
Total Intangible Assets
|
$ | 1,495,428 | $ | 587,905 | $ | 1,437,663 | $ | 486,915 | ||||||||
| 7. | Accrued Expenses and Other Liabilities |
| At December 31, | At December 31, | |||||||
| 2010 | 2009 | |||||||
|
Warranty
|
$ | 49,776 | $ | 47,980 | ||||
|
Unearned/deferred revenue
|
45,616 | 13,462 | ||||||
|
Taxes other than income
|
27,888 | 25,411 | ||||||
|
Accrued interest
|
27,679 | 28,226 | ||||||
|
Accrued volume discounts
|
13,896 | 14,115 | ||||||
|
Accrued commissions (non-employee)
|
9,900 | 9,745 | ||||||
|
Legal and environmental
|
8,193 | 9,622 | ||||||
|
Restructuring and exit
|
5,555 | 13,203 | ||||||
|
Other (none of which are individually significant)
|
52,283 | 57,531 | ||||||
| $ | 240,786 | $ | 219,295 | |||||
58
Table of Contents
| At December 31, | At December 31, | |||||||
| 2010 | 2009 | |||||||
|
Deferred compensation
|
$ | 257,122 | $ | 253,208 | ||||
|
Tax reserves
|
196,446 | 230,200 | ||||||
|
Unearned/deferred revenue
|
40,767 | 32,995 | ||||||
|
Legal and environmental
|
19,234 | 20,954 | ||||||
|
Warranty
|
8,453 | 11,733 | ||||||
|
Restructuring and exit
|
2,339 | 3,568 | ||||||
|
Other
|
39,760 | 20,479 | ||||||
| $ | 564,121 | $ | 573,137 | |||||
59
Table of Contents
| Severance | Exit | Total | ||||||||||
|
Balance at December 31, 2007(A)
|
$ | 5,762 | $ | 22,668 | $ | 28,430 | ||||||
|
Provision
|
14,980 | 12,384 | 27,364 | |||||||||
|
Purchase accounting
|
2,933 | 2,698 | 5,631 | |||||||||
|
Payments
|
(16,094 | ) | (12,035 | ) | (28,129 | ) | ||||||
|
Other, including impairments
|
(378 | ) | (1,961 | ) | (2,339 | ) | ||||||
|
Balance at December 31, 2008(B)
|
7,203 | 23,754 | 30,957 | |||||||||
|
Provision
|
53,106 | 18,996 | 72,102 | |||||||||
|
Purchase accounting
|
— | (16,074 | ) | (16,074 | ) | |||||||
|
Payments
|
(53,009 | ) | (13,828 | ) | (66,837 | ) | ||||||
|
Other, including impairments
|
852 | (4,229 | ) | (3,377 | ) | |||||||
|
Balance at December 31, 2009(C)
|
8,152 | 8,619 | 16,771 | |||||||||
|
Provision
|
2,989 | 3,211 | 6,200 | |||||||||
|
Payments
|
(9,773 | ) | (5,574 | ) | (15,347 | ) | ||||||
|
Other, including impairments
|
(225 | ) | 495 | 270 | ||||||||
|
Balance at December 31, 2010
|
$ | 1,143 | $ | 6,751 | $ | 7,894 | ||||||
| (A) | Includes $26,823 for acquisition-related restructuring accruals established in purchase accounting. | |
| (B) | Includes $27,864 for acquisition-related restructuring accruals established in purchase accounting. | |
| (C) | Includes $895 for acquisition-related restructuring accruals established in purchase accounting. This balance was settled in 2010. |
| Years Ended December 31, | ||||||||||||
| 2010 | 2009 | 2008 | ||||||||||
|
Industrial Products
|
$ | 1,182 | $ | 17,505 | $ | 8,285 | ||||||
|
Engineered Systems
|
2,364 | 18,381 | 10,071 | |||||||||
|
Fluid Management
|
1,476 | 9,707 | 2,475 | |||||||||
|
Electronic Technologies
|
1,178 | 26,509 | 6,533 | |||||||||
|
Total
|
$ | 6,200 | $ | 72,102 | $ | 27,364 | ||||||
|
Cost of goods and services
|
$ | 2,147 | $ | 21,943 | $ | — | ||||||
|
Selling and adminstrative expenses
|
4,053 | 50,159 | 27,364 | |||||||||
|
Total
|
$ | 6,200 | $ | 72,102 | $ | 27,364 | ||||||
60
Table of Contents
| 8. | Borrowings and Lines of Credit |
| 2010 | 2009 | |||||||
|
6.50%
10-year
notes due February 15, 2011
|
$ | 399,986 | $ | 399,921 | ||||
|
4.875%
10-year
notes due October 15, 2015
|
299,047 | 298,851 | ||||||
|
5.45%
10-year
notes due March 15, 2018
|
347,608 | 347,280 | ||||||
|
6.60%
30-year
notes due March 15, 2038
|
247,595 | 247,506 | ||||||
|
6.65%
30-year
debentures due June 1, 2028
|
199,379 | 199,344 | ||||||
|
5.375%
30-year
debentures due October 15, 2035
|
296,048 | 295,890 | ||||||
|
Non-interest bearing, amortizing loan due July 2011
|
— | 67,684 | ||||||
|
Other
|
3,148 | 4,408 | ||||||
|
Total long-term debt
|
1,792,811 | 1,860,884 | ||||||
|
Less current installments
|
(1,925 | ) | (35,624 | ) | ||||
| $ | 1,790,886 | $ | 1,825,260 | |||||
61
Table of Contents
| 9. | Financial Instruments |
| Fair Value — Asset (Liability) | ||||||||||
| 2010 | 2009 | Balance Sheet Caption | ||||||||
|
Foreign exchange forward/collar contracts
|
$ | 503 | $ | 16 | Prepaid/Other assets | |||||
|
Foreign exchange forward/collar contracts
|
— | (99 | ) | Other accrued expenses | ||||||
|
Net investment hedge swap derivative
|
(19,774 | ) | (13,278 | ) | Other liabilities | |||||
62
Table of Contents
| December 31, 2010 | December 31, 2009 | |||||||||||||||||||||||
| Level 1 | Level 2 | Level 3 | Level 1 | Level 2 | Level 3 | |||||||||||||||||||
|
Assets:
|
||||||||||||||||||||||||
|
Short-term investments
|
$ | 121,734 | $ | — | $ | — | $ | 223,809 | $ | — | $ | — | ||||||||||||
|
Foreign currency exchange contracts
|
— | 503 | 16 | |||||||||||||||||||||
|
Liabilities:
|
||||||||||||||||||||||||
|
Net investment hedge derivative
|
— | 19,774 | — | — | 13,278 | — | ||||||||||||||||||
|
Foreign currency exchange contracts
|
— | — | — | — | 99 | — | ||||||||||||||||||
63
Table of Contents
| 10. | Equity and Cash Incentive Program |
|
Weighted-Average
|
||||||||
|
Number of
|
Grant-Date
|
|||||||
| Performance Share Awards | Shares | Fair Value | ||||||
|
Unvested at December 31, 2009
|
75,006 | $ | 35.79 | |||||
|
Granted
|
68,446 | 57.49 | ||||||
|
Vested
|
— | — | ||||||
|
Forfeited
|
— | — | ||||||
|
Unvested at December 31, 2010
|
143,452 | $ | 46.14 | |||||
64
Table of Contents
|
2010
|
2009
|
|||||||
| Performance Shares | Grant | Grant | ||||||
|
Risk-free interest rate
|
1.37 | % | 1.30 | % | ||||
|
Dividend yield
|
2.38 | % | 2.93 | % | ||||
|
Expected life (years)
|
2.9 | 2.7 | ||||||
|
Volatility
|
39.98 | % | 39.57 | % | ||||
|
Share price at date of grant
|
$ | 42.88 | $ | 32.47 | ||||
|
Fair value of performance award
|
$ | 57.49 | $ | 35.79 | ||||
|
2010
|
2009
|
2008
|
||||||||||
| Grant | Grant | Grant | ||||||||||
|
Risk-free interest rate
|
2.77 | % | 2.06 | % | 3.21 | % | ||||||
|
Dividend yield
|
2.33 | % | 3.23 | % | 1.86 | % | ||||||
|
Expected life (years)
|
6.0 | 6.5 | 6.5 | |||||||||
|
Volatility
|
31.93 | % | 30.47 | % | 26.09 | % | ||||||
|
Option grant price
|
$ | 42.88 | $ | 29.45 | $ | 42.30 | ||||||
|
Fair value of options granted
|
$ | 11.66 | $ | 6.58 | $ | 10.97 | ||||||
65
Table of Contents
| SARs | Stock Options | |||||||||||||||||||||||||||||||
|
Weighted
|
Weighted
|
|||||||||||||||||||||||||||||||
|
Average
|
Average
|
|||||||||||||||||||||||||||||||
|
Weighted
|
Remaining
|
Weighted
|
Remaining
|
|||||||||||||||||||||||||||||
|
Average
|
Aggregate
|
Contractual
|
Average
|
Contractual
|
||||||||||||||||||||||||||||
|
Number of
|
Exercise
|
Intrinsic
|
Term
|
Number of
|
Exercise
|
Aggregate
|
Term
|
|||||||||||||||||||||||||
| Shares | Price | Value | (Years) | Shares | Price | Intrinsic Value | (Years) | |||||||||||||||||||||||||
|
Outstanding at 1/1/2008
|
3,241,226 | $ | 48.32 | 8,260,730 | $ | 35.77 | ||||||||||||||||||||||||||
|
Granted
|
2,234,942 | 42.30 | — | — | ||||||||||||||||||||||||||||
|
Forfeited
|
(373,193 | ) | 45.90 | (139,826 | ) | 36.82 | ||||||||||||||||||||||||||
|
Exercised
|
— | — | $ | — | (2,040,458 | ) | 34.29 | $ | 15,807 | |||||||||||||||||||||||
|
Outstanding at 12/31/2008
|
5,102,975 | 45.82 | — | 8.23 | 6,080,446 | 36.22 | 35,359 | 4.29 | ||||||||||||||||||||||||
|
Exercisable at December 31, 2008 through February 14,
2015
|
— | — | 6,080,466 | 36.22 | ||||||||||||||||||||||||||||
|
Outstanding at 1/1/2009
|
5,102,975 | $ | 45.82 | 6,080,446 | $ | 36.22 | ||||||||||||||||||||||||||
|
Granted
|
2,825,701 | 29.51 | — | — | ||||||||||||||||||||||||||||
|
Forfeited
|
(320,490 | ) | 38.85 | (174,386 | ) | 31.06 | ||||||||||||||||||||||||||
|
Exercised
|
— | — | $ | — | (713,678 | ) | 34.63 | |||||||||||||||||||||||||
|
Outstanding at 12/31/2009
|
7,608,186 | 40.05 | — | 7.89 | 5,192,382 | 36.62 | $ | 8,903 | 3.48 | |||||||||||||||||||||||
|
Exercisable at December 31, 2009 through February 14,
2016
|
1,477,658 | 46.00 | 5,192,382 | 36.62 | ||||||||||||||||||||||||||||
|
Outstanding at 1/1/2010
|
7,608,186 | $ | 40.05 | 5,192,382 | $ | 36.62 | ||||||||||||||||||||||||||
|
Granted
|
2,304,574 | 42.88 | — | |||||||||||||||||||||||||||||
|
Forfeited
|
(312,950 | ) | 38.56 | (314,584 | ) | 38.39 | ||||||||||||||||||||||||||
|
Exercised
|
(167,797 | ) | 47.06 | $ | 252 | (1,978,663 | ) | 35.94 | $ | 24,976 | ||||||||||||||||||||||
|
Outstanding at 12/31/2010
|
9,432,013 | 40.63 | 74,841 | 7.46 | 2,899,135 | 36.79 | 34,128 | 2.99 | ||||||||||||||||||||||||
|
Exercisable at December 31, 2010 through:
|
||||||||||||||||||||||||||||||||
|
2011
|
— | $ | — | $ | — | 118,613 | $ | 40.99 | $ | 898 | ||||||||||||||||||||||
|
2012
|
— | — | — | 345,006 | 37.90 | 3,678 | ||||||||||||||||||||||||||
|
2013
|
— | — | — | 479,064 | 24.59 | 11,483 | ||||||||||||||||||||||||||
|
2014
|
— | — | — | 797,078 | 41.25 | 5,828 | ||||||||||||||||||||||||||
|
2015
|
— | — | — | 1,159,374 | 38.00 | 12,241 | ||||||||||||||||||||||||||
|
2016
|
1,253,338 | 46.00 | 3,209 | — | — | — | ||||||||||||||||||||||||||
|
2017
|
1,378,443 | 50.60 | — | — | — | |||||||||||||||||||||||||||
|
Total exercisable at December 31, 2010
|
2,631,781 | 48.41 | 3,209 | 5.62 | 2,899,135 | 36.79 | 34,128 | 2.99 | ||||||||||||||||||||||||
66
Table of Contents
| SARs Outstanding | SARs Exercisable | |||||||||||||||||||||||
|
Weighted Average
|
Weighted Average
|
|||||||||||||||||||||||
|
Weighted Average
|
Remaining Life
|
Weighted Average
|
Remaining Life
|
|||||||||||||||||||||
| Range of Exercise Prices | Number | Exercise Price | in Years | Number | Exercise Price | in Years | ||||||||||||||||||
|
$29.45-$35.50
|
2,596,423 | $ | 29.52 | 8.12 | — | $ | — | — | ||||||||||||||||
|
$42.30-$50.60
|
6,835,590 | $ | 44.84 | 7.20 | 2,631,781 | $ | 48.41 | 5.62 | ||||||||||||||||
| Options Outstanding | Options Exercisable | |||||||||||||||||||||||
|
Weighted Average
|
Weighted Average
|
|||||||||||||||||||||||
|
Weighted Average
|
Remaining Life
|
Weighted Average
|
Remaining Life
|
|||||||||||||||||||||
| Range of Exercise Prices | Number | Exercise Price | in Years | Number | Exercise Price | in Years | ||||||||||||||||||
|
$24.50-$31.00
|
479,514 | $ | 24.53 | 2.12 | 479,514 | $ | 24.53 | 2.12 | ||||||||||||||||
|
$33.00-$39.00
|
1,501,430 | 38.00 | 3.43 | 1,501,430 | 38.00 | 3.43 | ||||||||||||||||||
|
$39.40-$43.00
|
918,191 | 41.21 | 2.73 | 918,191 | 41.21 | 2.50 | ||||||||||||||||||
| 11. | Income Taxes |
| For the Years Ended December 31, | ||||||||||||
| 2010 | 2009 | 2008 | ||||||||||
|
Domestic
|
$ | 470,396 | $ | 258,313 | $ | 527,509 | ||||||
|
Foreign
|
454,688 | 233,305 | 418,510 | |||||||||
| $ | 925,084 | $ | 491,618 | $ | 946,019 | |||||||
| For the Years Ended December 31, | ||||||||||||
| 2010 | 2009 | 2008 | ||||||||||
|
Taxes on income from continuing operations
|
217,176 | 119,724 | 251,261 | |||||||||
|
Credit to stockholders’ equity for tax benefit related to
stock option/SAR exercises
|
(6,466 | ) | (425 | ) | (8,449 | ) | ||||||
| 210,710 | 119,299 | 242,812 | ||||||||||
67
Table of Contents
| For the Years Ended December 31, | ||||||||||||
| 2010 | 2009 | 2008 | ||||||||||
|
Current:
|
||||||||||||
|
U.S. Federal
|
$ | 33,867 | $ | 71,269 | $ | 124,193 | ||||||
|
State and local
|
8,295 | 5,191 | 24,060 | |||||||||
|
Foreign
|
105,476 | 68,065 | 69,549 | |||||||||
|
Total current — continuing
|
147,638 | 144,525 | 217,802 | |||||||||
|
Deferred:
|
||||||||||||
|
U.S. Federal
|
95,036 | (12,985 | ) | 21,207 | ||||||||
|
State and local
|
140 | 116 | 301 | |||||||||
|
Foreign
|
(25,638 | ) | (11,932 | ) | 11,951 | |||||||
|
Total deferred — continuing
|
69,538 | (24,801 | ) | 33,459 | ||||||||
|
Total expense — continuing
|
$ | 217,176 | $ | 119,724 | $ | 251,261 | ||||||
|
For the Years Ended
|
||||||||||||
| December 31, | ||||||||||||
| 2010 | 2009 | 2008 | ||||||||||
|
U.S. Federal income tax rate
|
35.0 | % | 35.0 | % | 35.0 | % | ||||||
|
State and local taxes, net of Federal income tax benefit
|
1.3 | 1.5 | 1.7 | |||||||||
|
Foreign operations tax effect
|
(8.1 | ) | (5.2 | ) | (6.9 | ) | ||||||
|
Subtotal
|
(6.8 | ) | (3.7 | ) | (5.2 | ) | ||||||
|
R&E tax credits
|
(0.4 | ) | (0.4 | ) | (0.5 | ) | ||||||
|
Domestic manufacturing deduction
|
(0.8 | ) | (0.9 | ) | (0.7 | ) | ||||||
|
Foreign tax credits
|
(0.5 | ) | 1.2 | (0.1 | ) | |||||||
|
Branch losses
|
(0.5 | ) | (1.1 | ) | (0.5 | ) | ||||||
|
Settlement of tax contingencies
|
(4.2 | ) | (6.9 | ) | (1.9 | ) | ||||||
|
Other, principally non-tax deductible items
|
1.7 | 1.2 | 0.5 | |||||||||
|
Effective rate from continuing operations
|
23.5 | % | 24.4 | % | 26.6 | % | ||||||
68
Table of Contents
| At December 31, | ||||||||
| 2010 | 2009 | |||||||
|
Deferred Tax Assets:
|
||||||||
|
Accrued insurance
|
$ | 10,777 | $ | 9,794 | ||||
|
Accrued compensation, principally postretirement benefits and
other employee benefits
|
119,148 | 103,800 | ||||||
|
Accrued expenses, principally for state income taxes, interest
and warranty
|
66,543 | 73,147 | ||||||
|
Long-term liabilities, principally warranty, environmental, and
exit costs
|
759 | 2,548 | ||||||
|
Inventories, principally due to reserves for financial reporting
purposes and capitalization for tax purposes
|
24,806 | 25,593 | ||||||
|
Net operating loss and other carryforwards
|
68,558 | 106,009 | ||||||
|
Accounts receivable, principally due to allowance for doubtful
accounts
|
8,089 | 9,786 | ||||||
|
Prepaid pension assets
|
1,619 | 7,947 | ||||||
|
Other assets
|
10,377 | 13,904 | ||||||
|
Total gross deferred tax assets
|
310,676 | 352,528 | ||||||
|
Valuation allowance
|
(38,136 | ) | (43,171 | ) | ||||
|
Total deferred tax assets
|
$ | 272,540 | $ | 309,357 | ||||
|
Deferred Tax Liabilities:
|
||||||||
|
Accounts receivable
|
$ | (8,304 | ) | $ | (9,098 | ) | ||
|
Plant and equipment, principally due to differences in
depreciation
|
(51,872 | ) | (46,831 | ) | ||||
|
Intangible assets, principally due to different tax and
financial reporting bases and amortization lives
|
(503,941 | ) | (475,773 | ) | ||||
|
Total gross deferred tax liabilities
|
$ | (564,117 | ) | $ | (531,702 | ) | ||
|
Net deferred tax liability
|
$ | (291,577 | ) | $ | (222,345 | ) | ||
|
Current deferred tax asset
|
$ | 89,720 | $ | 69,999 | ||||
|
Non-current deferred tax liability
|
(381,297 | ) | (292,344 | ) | ||||
| $ | (291,577 | ) | $ | (222,345 | ) | |||
69
Table of Contents
| Continuing | Discontinued | Total | ||||||||||
|
Unrecognized tax benefits at January 1, 2008
|
$ | 188,758 | $ | 34,987 | $ | 223,745 | ||||||
|
Additions based on tax positions related to the current year
|
24,015 | — | 24,015 | |||||||||
|
Additions for tax positions of prior years
|
25,866 | 22,578 | 48,444 | |||||||||
|
Reductions for tax positions of prior years
|
(19,267 | ) | (10,906 | ) | (30,173 | ) | ||||||
|
Settlements
|
(2,859 | ) | — | (2,859 | ) | |||||||
|
Lapse of statutes
|
(11,466 | ) | — | (11,466 | ) | |||||||
|
Unrecognized tax benefits at December 31, 2008
|
205,047 | 46,659 | 251,706 | |||||||||
|
Additions based on tax positions related to the current year
|
46,133 | 39,480 | 85,613 | |||||||||
|
Additions for tax positions of prior years
|
5,622 | 2,741 | 8,363 | |||||||||
|
Reductions for tax positions of prior years
|
(9,497 | ) | (2,014 | ) | (11,511 | ) | ||||||
|
Settlements
|
(41,869 | ) | (5,914 | ) | (47,783 | ) | ||||||
|
Lapse of statutes
|
(7,074 | ) | (2,748 | ) | (9,822 | ) | ||||||
|
Unrecognized tax benefits at December 31, 2009
|
198,362 | 78,204 | 276,566 | |||||||||
|
Additions based on tax positions related to the current year
|
22,566 | — | 22,566 | |||||||||
|
Additions for tax positions of prior years
|
15,258 | — | 15,258 | |||||||||
|
Reductions for tax positions of prior years
|
(39,883 | ) | (6,716 | ) | (46,599 | ) | ||||||
|
Settlements
|
(8,152 | ) | (17,804 | ) | (25,956 | ) | ||||||
|
Lapse of statutes
|
(7,654 | ) | — | (7,654 | ) | |||||||
|
Unrecognized tax benefits at December 31, 2010
|
$ | 180,497 | (A) | $ | 53,684 | $ | 234,181 | |||||
| (A) | If recognized, the net amount of potential tax benefits that would impact the Company’s effective tax rate is $150.0 million. During the years ended December 31, 2010, 2009, and 2008, the Company recorded potential |
70
Table of Contents
| interest and penalty expense of $1.5 million, $5.0 million and $(0.6) million, respectively, related to its unrecognized tax benefits as a component of provision for income taxes. The Company had accrued interest and penalties of $45.6 million at December 31, 2010 and $46.5 million at December 31, 2009. |
| 12. | Commitments and Contingent Liabilities |
| Operating | Capital | |||||||
|
2011
|
$ | 54,544 | $ | 1,149 | ||||
|
2012
|
44,831 | 845 | ||||||
|
2013
|
31,899 | 649 | ||||||
|
2014
|
24,478 | 89 | ||||||
|
2015
|
18,570 | 95 | ||||||
|
2016 and thereafter
|
63,036 | 640 | ||||||
| 2010 | 2009 | |||||||
|
Beginning Balance, January 1
|
$ | 59,713 | $ | 56,137 | ||||
|
Provision for warranties
|
40,190 | 34,342 | ||||||
|
Increase from acquisitions/dispositions
|
173 | 3,838 | ||||||
|
Settlements made
|
(40,876 | ) | (34,781 | ) | ||||
|
Other adjustments, including currency translation
|
(971 | ) | 177 | |||||
|
Ending Balance, December 31
|
$ | 58,229 | $ | 59,713 | ||||
71
Table of Contents
| 13. | Employee Benefit Plans |
|
December
|
December
|
Current
|
||||||||||
| 2010 | 2009 | Target | ||||||||||
|
Equity — domestic
|
40 | % | 39 | % | 35 | % | ||||||
|
Equity — international
|
22 | % | 21 | % | 22 | % | ||||||
|
Fixed income — domestic
|
32 | % | 34 | % | 35 | % | ||||||
|
Real estate
|
6 | % | 6 | % | 8 | % | ||||||
|
Total
|
100 | % | 100 | % | 100 | % | ||||||
72
Table of Contents
| At December 31, 2010 | At December 31, 2009 | |||||||||||||||||||||||||||||||
|
Total Fair
|
Total Fair
|
|||||||||||||||||||||||||||||||
| Level 1 | Level 2 | Level 3 | Value | Level 1 | Level 2 | Level 3 | Value | |||||||||||||||||||||||||
|
Asset category:
|
||||||||||||||||||||||||||||||||
|
Common stocks
|
$ | 154,832 | $ | 5,381 | $ | — | $ | 160,213 | $ | 110,728 | $ | 4,868 | $ | — | $ | 115,596 | ||||||||||||||||
|
Fixed income investments
|
6,070 | 160,251 | — | 166,321 | 8,955 | 133,586 | — | 142,541 | ||||||||||||||||||||||||
|
Debt, equity and real estate funds
|
— | 171,856 | 23,059 | 194,915 | — | 177,342 | 20,401 | 197,743 | ||||||||||||||||||||||||
|
Cash and equivalents
|
10,149 | — | — | 10,149 | 11,761 | — | — | 11,761 | ||||||||||||||||||||||||
| $ | 171,051 | $ | 337,488 | $ | 23,059 | $ | 531,598 | $ | 131,444 | $ | 315,796 | $ | 20,401 | $ | 467,641 | |||||||||||||||||
|
Real Estate
|
||||
| Investments | ||||
|
Balance at December 31, 2009
|
$ | 20,401 | ||
|
Realized gains
|
1,156 | |||
|
Unrealized gains
|
1,502 | |||
|
Balance at December 31, 2010
|
$ | 23,059 | ||
73
Table of Contents
|
Qualified
|
Non Qualified
|
Post-Retirement
|
||||||||||||||||||||||
| Defined Benefits | Supplemental Benefits | Benefits | ||||||||||||||||||||||
| 2010 | 2009 | 2010 | 2009 | 2010 | 2009 | |||||||||||||||||||
|
Change in benefit obligation
|
||||||||||||||||||||||||
|
Benefit obligation at beginning of year
|
$ | 541,206 | $ | 484,891 | $ | 127,355 | $ | 152,695 | $ | 15,329 | $ | 16,470 | ||||||||||||
|
Benefits earned during the year
|
14,687 | 13,971 | 4,241 | 6,188 | 279 | 314 | ||||||||||||||||||
|
Interest cost
|
30,574 | 28,936 | 7,677 | 8,688 | 837 | 959 | ||||||||||||||||||
|
Plan participants’ contributions
|
809 | 1,014 | — | — | 2,094 | 172 | ||||||||||||||||||
|
Benefits paid
|
(30,418 | ) | (27,699 | ) | (18,471 | ) | (26,828 | ) | (3,661 | ) | (1,597 | ) | ||||||||||||
|
Federal subsidy on benefits paid
|
— | — | — | — | 85 | 130 | ||||||||||||||||||
|
Actuarial loss (gain)
|
25,617 | 20,469 | 4,885 | (13,388 | ) | (455 | ) | 538 | ||||||||||||||||
|
Business acquisitions/divestitures
|
— | 7,241 | — | — | — | — | ||||||||||||||||||
|
Amendments
|
1,781 | 227 | 1,348 | — | — | (1,657 | ) | |||||||||||||||||
|
Settlements and curtailments
|
(1,697 | ) | (6,963 | ) | — | — | — | — | ||||||||||||||||
|
Currency rate changes
|
(1,591 | ) | 10,322 | — | — | — | — | |||||||||||||||||
|
Other
|
75 | 8,797 | — | — | — | — | ||||||||||||||||||
|
Benefit obligation at end of year
|
581,043 | 541,206 | 127,035 | 127,355 | 14,508 | 15,329 | ||||||||||||||||||
|
Change in Plan Assets
|
||||||||||||||||||||||||
|
Fair value of plan assets at beginning of year
|
467,641 | 410,711 | — | — | — | — | ||||||||||||||||||
|
Actual return on plan assets
|
55,205 | 23,992 | — | — | — | — | ||||||||||||||||||
|
Company contributions
|
38,163 | 50,701 | 18,471 | 26,828 | 1,567 | 1,425 | ||||||||||||||||||
|
Employee contributions
|
809 | 1,014 | — | — | 2,094 | 172 | ||||||||||||||||||
|
Benefits paid
|
(30,418 | ) | (27,699 | ) | (18,471 | ) | (26,828 | ) | (3,661 | ) | (1,597 | ) | ||||||||||||
|
Acquisitions
|
— | 6,361 | — | — | — | |||||||||||||||||||
|
Settlements and curtailments
|
(503 | ) | (6,547 | ) | — | — | — | |||||||||||||||||
|
Currency rate changes
|
701 | 7,191 | — | — | — | |||||||||||||||||||
|
Other
|
— | 1,917 | — | — | — | |||||||||||||||||||
|
Fair value of plan assets at end of year
|
531,598 | 467,641 | — | — | — | — | ||||||||||||||||||
|
Funded status
|
(49,445 | ) | (73,565 | ) | (127,035 | ) | (127,355 | ) | (14,508 | ) | (15,329 | ) | ||||||||||||
|
Accrued benefit cost
|
$ | (49,445 | ) | $ | (73,565 | ) | $ | (127,035 | ) | $ | (127,355 | ) | $ | (14,508 | ) | $ | (15,329 | ) | ||||||
|
Amounts recognized in the Balance Sheets consist of:
|
||||||||||||||||||||||||
|
Assets and Liabilities:
|
||||||||||||||||||||||||
|
Other assets and deferred charges
|
$ | 5,930 | $ | 3,339 | $ | — | $ | — | $ | — | $ | — | ||||||||||||
|
Accrued compensation and employee benefits
|
(1,343 | ) | (1,527 | ) | (17,670 | ) | (14,468 | ) | (1,036 | ) | (1,189 | ) | ||||||||||||
|
Other liabilities (principally compensation)
|
(54,032 | ) | (75,377 | ) | (109,365 | ) | (112,887 | ) | (13,472 | ) | (14,140 | ) | ||||||||||||
|
Total Assets and Liabilities
|
(49,445 | ) | (73,565 | ) | (127,035 | ) | (127,355 | ) | (14,508 | ) | (15,329 | ) | ||||||||||||
|
Net actuarial losses (gains)
|
$ | 168,605 | 165,935 | $ | (10,159 | ) | (15,045 | ) | $ | (2,917 | ) | (2,881 | ) | |||||||||||
|
Prior service cost (credit)
|
8,547 | 8,133 | 51,445 | 57,363 | (2,262 | ) | (2,671 | ) | ||||||||||||||||
|
Net asset at transition, other
|
(155 | ) | (198 | ) | — | — | — | — | ||||||||||||||||
|
Deferred taxes
|
(59,845 | ) | (58,426 | ) | (14,451 | ) | (14,812 | ) | 1,754 | 1,885 | ||||||||||||||
|
Total Accumulated Other Comprehensive Loss (Earnings), net of tax
|
117,152 | 115,444 | 26,835 | 27,506 | (3,425 | ) | (3,667 | ) | ||||||||||||||||
|
Net amount recognized at December 31,
|
$ | 67,707 | $ | 41,879 | $ | (100,200 | ) | $ | (99,849 | ) | $ | (17,933 | ) | $ | (18,996 | ) | ||||||||
|
Accumulated benefit obligations
|
$ | 532,426 | $ | 494,690 | $ | 95,771 | $ | 93,956 | ||||||||||||||||
|
Information for plans with accumulated benefit obligations in
excess of plan assets:
|
||||||||||||||||||||||||
|
ABO
|
$ | 105,846 | $ | 120,278 | $ | 95,771 | $ | 93,956 | ||||||||||||||||
|
PBO
|
114,888 | 127,928 | 127,035 | 127,356 | ||||||||||||||||||||
|
Fair value of plan assets
|
66,485 | 71,003 | — | — | ||||||||||||||||||||
74
Table of Contents
|
Non-Qualified
|
||||||||||||||||||||||||||||||||||||
| Qualified Defined Benefits | Supplemental Benefits | Post-Retirement Benefits | ||||||||||||||||||||||||||||||||||
| 2010 | 2009 | 2008 | 2010 | 2009 | 2008 | 2010 | 2009 | 2008 | ||||||||||||||||||||||||||||
|
Service Cost
|
$ | 14,687 | $ | 13,971 | $ | 13,042 | $ | 4,241 | $ | 6,188 | $ | 7,688 | $ | 279 | $ | 314 | $ | 274 | ||||||||||||||||||
|
Interest Cost
|
30,574 | 28,936 | 28,337 | 7,677 | 8,688 | 9,434 | 837 | 959 | 954 | |||||||||||||||||||||||||||
|
Expected return on plan assets
|
(38,289 | ) | (34,612 | ) | (34,341 | ) | — | — | — | — | — | — | ||||||||||||||||||||||||
|
Amortization of:
|
||||||||||||||||||||||||||||||||||||
|
Prior service cost (income)
|
1,365 | 1,292 | 1,343 | 7,266 | 7,706 | 7,463 | (409 | ) | (172 | ) | (172 | ) | ||||||||||||||||||||||||
|
Transition obligation
|
(42 | ) | (43 | ) | (53 | ) | — | — | — | — | — | — | ||||||||||||||||||||||||
|
Recognized actuarial (gain) loss
|
5,474 | 5,216 | 3,933 | — | — | — | (398 | ) | (426 | ) | (478 | ) | ||||||||||||||||||||||||
|
Settlement and curtailment gains
|
(348 | ) | (795 | ) | (1,149 | ) | — | (1 | ) | — | — | — | — | |||||||||||||||||||||||
|
Total net periodic benefit cost
|
$ | 13,421 | $ | 13,965 | $ | 11,112 | $ | 19,184 | $ | 22,581 | $ | 24,585 | $ | 309 | $ | 675 | $ | 578 | ||||||||||||||||||
|
Non-Qualified
|
||||||||||||||||||||||||
|
Qualified
|
Supplemental
|
Post-Retirement
|
||||||||||||||||||||||
| Defined Benefits | Benefits | Benefits | ||||||||||||||||||||||
| 2010 | 2009 | 2010 | 2009 | 2010 | 2009 | |||||||||||||||||||
|
Discount rate
|
5.37 | % | 5.71 | % | 5.50 | % | 5.95 | % | 5.10 | % | 5.50 | % | ||||||||||||
|
Average wage increase
|
4.32 | % | 4.26 | % | 4.50 | % | 4.50 | % | — | — | ||||||||||||||
|
Ultimate medical trend rate
|
— | — | — | — | 5.00 | % | 5.00 | % | ||||||||||||||||
|
Non-Qualified
|
||||||||||||||||||||||||||||||||||||
|
Qualified
|
Supplemental
|
Post-Retirement
|
||||||||||||||||||||||||||||||||||
| Defined Benefits | Benefits | Benefits | ||||||||||||||||||||||||||||||||||
| 2010 | 2009 | 2008 | 2010 | 2009 | 2008 | 2010 | 2009 | 2008 | ||||||||||||||||||||||||||||
|
Discount rate
|
5.71 | % | 6.10 | % | 6.10 | % | 5.95 | % | 6.10 | % | 6.25 | % | 5.50 | % | 6.00 | % | 6.00 | % | ||||||||||||||||||
|
Average wage increase
|
4.29 | % | 4.26 | % | 4.20 | % | 4.50 | % | 6.00 | % | 6.00 | % | — | — | — | |||||||||||||||||||||
|
Expected return on plan assets
|
7.37 | % | 7.37 | % | 6.40 | % | — | — | — | — | — | — | ||||||||||||||||||||||||
|
Ultimate medical trend rate
|
— | — | — | — | — | — | 5.00 | % | 5.00 | % | 5.00 | % | ||||||||||||||||||||||||
75
Table of Contents
|
Qualified
|
Non-Qualified
|
|||||||||||
|
Defined
|
Supplemental
|
Post-Retirement
|
||||||||||
| Benefits | Benefits | Benefits | ||||||||||
|
2011
|
$ | 34,249 | $ | 17,670 | $ | 1,036 | ||||||
|
2012
|
35,124 | 12,593 | 1,065 | |||||||||
|
2013
|
35,690 | 7,843 | 1,061 | |||||||||
|
2014
|
35,891 | 3,612 | 1,052 | |||||||||
|
2015
|
36,344 | 26,105 | 1,059 | |||||||||
|
2016-2020
|
200,090 | 38,466 | 4,446 | |||||||||
|
Qualified
|
Non-Qualified
|
|||||||
|
Defined
|
Supplemental
|
|||||||
| Benefits | Benefits | |||||||
|
To plan assets
|
$ | 40,000 | $ | — | ||||
|
To plan participants
|
840 | 17,670 | ||||||
|
Non-Qualified
|
||||||||||||
|
Qualified
|
Supplemental
|
|||||||||||
| Defined Benefits | Benefits | Post-Retirement | ||||||||||
|
Amortization of:
|
||||||||||||
|
Prior service cost (income)
|
$ | 1,424 | $ | 7,266 | $ | (409 | ) | |||||
|
Transition obligation
|
(42 | ) | — | — | ||||||||
|
Recognized actuarial (gain) loss
|
9,613 | — | (241 | ) | ||||||||
|
Total
|
$ | 10,995 | $ | 7,266 | $ | (650 | ) | |||||
76
Table of Contents
| 14. | Segment Data |
77
Table of Contents
| For the Years Ended December 31, | ||||||||||||
| 2010 | 2009 | 2008 | ||||||||||
|
REVENUE
|
||||||||||||
|
Industrial Products
|
$ | 1,847,811 | $ | 1,621,792 | $ | 2,459,505 | ||||||
|
Engineered Systems
|
2,229,675 | 1,861,936 | 2,010,350 | |||||||||
|
Fluid Management
|
1,639,790 | 1,270,910 | 1,714,046 | |||||||||
|
Electronic Technologies
|
1,423,664 | 1,026,954 | 1,396,131 | |||||||||
|
Intra — segment eliminations
|
(8,292 | ) | (5,903 | ) | (11,144 | ) | ||||||
|
Total consolidated revenue
|
$ | 7,132,648 | $ | 5,775,689 | $ | 7,568,888 | ||||||
|
EARNINGS FROM CONTINUING OPERATIONS
|
||||||||||||
|
Segment Earnings:
|
||||||||||||
|
Industrial Products
|
$ | 226,385 | $ | 139,757 | $ | 299,740 | ||||||
|
Engineered Systems
|
301,906 | 227,268 | 278,553 | |||||||||
|
Fluid Management
|
388,420 | 259,269 | 385,317 | |||||||||
|
Electronic Technologies
|
250,428 | 83,694 | 193,641 | |||||||||
|
Total segments
|
1,167,139 | 709,988 | 1,157,251 | |||||||||
|
Corporate expense/other
|
(135,714 | ) | (117,995 | ) | (115,195 | ) | ||||||
|
Net interest expense
|
(106,341 | ) | (100,375 | ) | (96,037 | ) | ||||||
|
Earnings from continuing operations before provision for income
taxes and discontinued operations
|
925,084 | 491,618 | 946,019 | |||||||||
|
Provision for taxes
|
217,176 | 119,724 | 251,261 | |||||||||
|
Earnings from continuing operations — total
consolidated
|
$ | 707,908 | $ | 371,894 | $ | 694,758 | ||||||
|
OPERATING MARGINS (pre-tax)
|
||||||||||||
|
Segments:
|
||||||||||||
|
Industrial Products
|
12.3 | % | 8.6 | % | 12.2 | % | ||||||
|
Engineered Systems
|
13.5 | % | 12.2 | % | 13.9 | % | ||||||
|
Fluid Management
|
23.7 | % | 20.4 | % | 22.5 | % | ||||||
|
Electronic Technologies
|
17.6 | % | 8.1 | % | 13.9 | % | ||||||
|
Total Segments
|
16.4 | % | 12.3 | % | 15.3 | % | ||||||
|
Earnings from continuing operations
|
13.0 | % | 8.5 | % | 12.5 | % | ||||||
| TOTAL ASSETS AT DECEMBER 31: | 2010 | 2009 | 2008 | |||||||||
|
Industrial Products
|
$ | 1,925,495 | $ | 1,874,242 | $ | 2,069,743 | ||||||
|
Engineered Systems
|
1,886,100 | 1,818,750 | 1,729,331 | |||||||||
|
Fluid Management
|
1,405,122 | 1,267,388 | 1,231,391 | |||||||||
|
Electronic Technologies
|
1,830,833 | 1,751,826 | 1,820,173 | |||||||||
|
Corporate (principally cash and equivalents and marketable
securities)
|
1,448,211 | 1,053,496 | 963,494 | |||||||||
|
Total continuing assets
|
8,495,761 | 7,765,702 | 7,814,132 | |||||||||
|
Assets from discontinued operations
|
67,133 | 116,701 | 69,106 | |||||||||
|
Consolidated total
|
$ | 8,562,894 | $ | 7,882,403 | $ | 7,883,238 | ||||||
78
Table of Contents
| For the Years Ended December 31, | ||||||||||||
| DEPRECIATION and AMORTIZATION | 2010 | 2009 | 2008 | |||||||||
|
Industrial Products
|
$ | 68,462 | $ | 71,453 | $ | 73,516 | ||||||
|
Engineered Systems
|
62,348 | 60,106 | 61,062 | |||||||||
|
Fluid Management
|
61,263 | 54,023 | 49,962 | |||||||||
|
Electronic Technologies
|
74,296 | 71,544 | 75,587 | |||||||||
|
Corporate
|
2,037 | 1,097 | 1,027 | |||||||||
|
Consolidated total
|
$ | 268,406 | $ | 258,223 | $ | 261,154 | ||||||
|
CAPITAL EXPENDITURES
|
||||||||||||
|
Industrial Products
|
$ | 45,377 | $ | 23,750 | $ | 43,194 | ||||||
|
Engineered Systems
|
39,012 | 34,740 | 33,609 | |||||||||
|
Fluid Management
|
46,399 | 34,424 | 61,054 | |||||||||
|
Electronic Technologies
|
40,821 | 25,725 | 37,730 | |||||||||
|
Corporate
|
11,608 | 1,370 | 208 | |||||||||
|
Consolidated total
|
$ | 183,217 | $ | 120,009 | $ | 175,795 | ||||||
| Revenue | Long-Lived Assets | |||||||||||||||||||
| For the Years Ended December 31, | At December 31, | |||||||||||||||||||
| 2010 | 2009 | 2008 | 2010 | 2009 | ||||||||||||||||
|
United States
|
$ | 3,863,849 | $ | 3,257,152 | $ | 4,246,792 | $ | 551,763 | $ | 543,886 | ||||||||||
|
Europe
|
1,210,644 | 1,078,308 | 1,544,144 | 139,975 | 144,651 | |||||||||||||||
|
Other Americas
|
680,230 | 463,176 | 642,673 | 45,830 | 36,666 | |||||||||||||||
|
Total Asia
|
1,188,679 | 791,292 | 968,169 | 108,430 | 103,026 | |||||||||||||||
|
Other
|
189,246 | 185,761 | 167,110 | 1,191 | 693 | |||||||||||||||
| $ | 7,132,648 | $ | 5,775,689 | $ | 7,568,888 | $ | 847,189 | $ | 828,922 | |||||||||||
| 15. | Shareholders’ Equity |
79
Table of Contents
| 16. | Quarterly Data (Unaudited) |
| Continuing Operations | Net Earnings | |||||||||||||||||||||||||||||||
|
Per Share -
|
Per Share -
|
Per Share -
|
Per Share -
|
|||||||||||||||||||||||||||||
| Quarter | Revenue | Gross Profit | Earnings | Basic | Diluted | Net Earnings | Basic | Diluted | ||||||||||||||||||||||||
|
2010
|
||||||||||||||||||||||||||||||||
|
First
|
$ | 1,583,270 | $ | 612,157 | $ | 121,485 | $ | 0.65 | $ | 0.65 | $ | 108,127 | $ | 0.58 | $ | 0.58 | ||||||||||||||||
|
Second
|
1,786,696 | 688,698 | 171,893 | 0.92 | 0.91 | 169,870 | 0.91 | 0.90 | ||||||||||||||||||||||||
|
Third
|
1,887,141 | 711,685 | 222,759 | 1.19 | 1.18 | 223,759 | 1.20 | 1.19 | ||||||||||||||||||||||||
|
Fourth
|
1,875,541 | 720,118 | 191,771 | 1.03 | 1.01 | 198,348 | 1.06 | 1.04 | ||||||||||||||||||||||||
| $ | 7,132,648 | $ | 2,732,658 | $ | 707,908 | 3.79 | 3.74 | $ | 700,104 | 3.75 | 3.70 | |||||||||||||||||||||
|
2009
|
||||||||||||||||||||||||||||||||
|
First
|
$ | 1,379,086 | $ | 482,144 | $ | 61,096 | $ | 0.33 | $ | 0.33 | $ | 53,428 | $ | 0.29 | $ | 0.29 | ||||||||||||||||
|
Second
|
1,390,331 | 493,310 | 100,874 | 0.54 | 0.54 | 97,080 | 0.52 | 0.52 | ||||||||||||||||||||||||
|
Third
|
1,499,611 | 558,266 | 107,484 | 0.58 | 0.58 | 106,884 | 0.57 | 0.57 | ||||||||||||||||||||||||
|
Fourth
|
1,506,661 | 565,434 | 102,440 | 0.55 | 0.55 | 99,046 | 0.53 | 0.53 | ||||||||||||||||||||||||
| $ | 5,775,689 | $ | 2,099,154 | $ | 371,894 | 2.00 | 1.99 | $ | 356,438 | 1.91 | 1.91 | |||||||||||||||||||||
80
Table of Contents
| 17. | Subsequent Events |
81
Table of Contents
|
Balance at
|
Acquired by
|
Charged to
|
Balance at
|
|||||||||||||||||||||
|
Beginning of
|
Purchase or
|
Cost and
|
Accounts
|
End of
|
||||||||||||||||||||
| Allowance for Doubtful Accounts | Year | Merger | Expense (A) | Written Off | Other | Year | ||||||||||||||||||
|
Year Ended December 31, 2010
|
||||||||||||||||||||||||
|
Allowance for Doubtful Accounts
|
$ | 41,832 | 113 | (620 | ) | (6,857 | ) | (317 | ) | $ | 34,151 | |||||||||||||
|
Year Ended December 31, 2009
|
||||||||||||||||||||||||
|
Allowance for Doubtful Accounts
|
$ | 32,647 | — | 17,260 | (10,198 | ) | 2,123 | $ | 41,832 | |||||||||||||||
|
Year Ended December 31, 2008
|
||||||||||||||||||||||||
|
Allowance for Doubtful Accounts
|
$ | 32,211 | 40 | 12,040 | (10,650 | ) | (994 | ) | $ | 32,647 | ||||||||||||||
| (A) | Net of recoveries on previously reserved or written-off balances. |
|
Balance at
|
Acquired by
|
Balance at
|
||||||||||||||||||||||
|
Beginning of
|
Purchase or
|
End of
|
||||||||||||||||||||||
| Deferred Tax Valuation Allowance | Year | Merger | Additions | Reductions | Other | Year | ||||||||||||||||||
|
Year Ended December 31, 2010
|
||||||||||||||||||||||||
|
Deferred Tax Valuation Allowance
|
$ | 43,171 | — | — | (5,035 | ) | — | $ | 38,136 | |||||||||||||||
|
Year Ended December 31, 2009
|
||||||||||||||||||||||||
|
Deferred Tax Valuation Allowance
|
$ | 55,486 | — | 2,875 | (15,190 | ) | — | $ | 43,171 | |||||||||||||||
|
Year Ended December 31, 2008
|
||||||||||||||||||||||||
|
Deferred Tax Valuation Allowance
|
$ | 64,534 | — | 2,818 | (7,554 | ) | (4,312 | ) | $ | 55,486 | ||||||||||||||
|
Balance at
|
Acquired by
|
Charged to
|
Balance at
|
|||||||||||||||||||||
|
Beginning of
|
Purchase or
|
Cost and
|
End of
|
|||||||||||||||||||||
| Inventory Reserves | Year | Merger | Expense | Reductions | Other | Year | ||||||||||||||||||
|
Year Ended December 31, 2010
|
||||||||||||||||||||||||
|
Inventory Reserves
|
$ | 101,295 | 531 | 20,476 | (15,395 | ) | (1,436 | ) | $ | 105,471 | ||||||||||||||
|
Year Ended December 31, 2009
|
||||||||||||||||||||||||
|
Inventory Reserves
|
$ | 100,471 | — | 21,307 | (21,869 | ) | 1,386 | $ | 101,295 | |||||||||||||||
|
Year Ended December 31, 2008
|
||||||||||||||||||||||||
|
Inventory Reserves
|
$ | 100,081 | 1,033 | 24,113 | (22,920 | ) | (1,836 | ) | $ | 100,471 | ||||||||||||||
|
Balance at
|
Acquired by
|
Charged to
|
Balance at
|
|||||||||||||||||||||
|
Beginning of
|
Purchase or
|
Cost and
|
End of
|
|||||||||||||||||||||
| LIFO Reserve | Year | Merger | Expense | Reductions | Other | Year | ||||||||||||||||||
|
Year Ended December 31, 2010 LIFO Reserve
|
$ | 49,061 | — | 1,964 | — | — | $ | 51,025 | ||||||||||||||||
|
Year Ended December 31, 2009 LIFO Reserve
|
$ | 58,810 | — | — | (9,749 | ) | — | $ | 49,061 | |||||||||||||||
|
Year Ended December 31, 2008 LIFO Reserve
|
$ | 51,988 | — | 6,822 | — | — | $ | 58,810 | ||||||||||||||||
82
Table of Contents
| Item 9. | Changes in and Disagreements With Accountants on Accounting and Financial Disclosure |
| Item 9A. | Controls and Procedures |
| Item 9B. | Other Information |
83
Table of Contents
| Item 10. | Directors and Executive Officers and Corporate Governance |
| Item 11. | Executive Compensation |
| Item 12. | Security Ownership of Certain Beneficial Owners and Management and Related Shareholder Matters |
| (a) | (b) | (c) | ||||||||||
|
Number of Securities
|
||||||||||||
|
Remaining Available
|
||||||||||||
|
Number of Securities
|
Weighted-Average
|
for Future Issuance
|
||||||||||
|
to be Issued Upon
|
Exercise Price of
|
Under Equity
|
||||||||||
|
Exercise of
|
Outstanding
|
Compensation Plans
|
||||||||||
|
Outstanding Options,
|
Options, Warrants
|
(Excluding Securities
|
||||||||||
| Plan Category | Warrants and Rights | and Rights | Reflected in Column (a)) | |||||||||
|
Equity compensation plans approved by stockholders
|
12,474,600 | $ | 39.68 | 8,259,949 | ||||||||
|
Equity compensation plans not approved by stockholders
|
— | — | — | |||||||||
|
Total
|
12,474,600 | $ | 39.68 | 8,259,949 | ||||||||
84
Table of Contents
| Item 13. | Certain Relationships and Related Transactions and Director Independence |
| Item 14. | Principal Accountant Fees and Services |
| Item 15. | Exhibits, Financial Statement Schedules |
| • | Schedule II — Valuation and Qualifying Accounts |
| (2 | .1) | Sale and Purchase Agreement, dated as of December 22, 2010, between the Company, NXP B.V., Knowles Electronics, LLC, EFF Acht Beteiligungsverwaltung GmbH and NXP Semiconductors N.V.** | ||
| (3 | )(i)(a) | Restated Certificate of Incorporation, filed as Exhibit 3.1 to the Company’s Quarterly Report on Form 10-Q for the Period Ended June 30, 1998 (SEC File No. 001-04018), is incorporated by reference. | ||
| (3 | )(i)(b) | Certificate of Correction to the Restated Certificate of Incorporation dated as of January 24, 2003, filed as Exhibit 3(i) to the Company’s Current Report on Form 8-K filed February 28, 2003 (SEC File No. 001-04018), is incorporated by reference. | ||
| (3 | )(ii) | By-Laws of the Company as amended and restated as of November 6, 2008, filed as Exhibit 3(ii) to the Company’s Current Report on Form 8-K filed November 12, 2008 (SEC File No. 001-04018), are incorporated by reference. |
85
Table of Contents
| (4 | .1) | Indenture, dated as of June 8, 1998 between the Company and The First National Bank Chicago, as Trustee, filed as Exhibit 4.1 to the Company’s Current Report on Form 8-K filed June 12, 1998 (SEC File No. 001-04018), is incorporated by reference. | ||
| (4 | .2) | Form of 6.65% Debentures due June 1, 2028 ($200,000,000 aggregate principal amount), filed as Exhibit 4.4 to the Company’s Current Report on Form 8-K filed June 12, 1998 (SEC File No. 001-04018), is incorporated by reference. | ||
| (4 | .3) | Form of 6.50% Notes due February 15, 2011 ($400,000,000 aggregate principal amount), filed as Exhibit 4.3 to the Company’s current report on Form 8-K filed February 12, 2001 (SEC File No. 001-04018), is incorporated by reference. | ||
| (4 | .4) | Indenture, dated as of February 8, 2001 between the Company and BankOne Trust Company, N.A., as trustee, filed as Exhibit 4.1 to the Company’s current report on Form 8-K filed February 12, 2001 (SEC File No. 001-04018), is incorporated by reference. | ||
| (4 | .5) | First Supplemental Indenture among the Company, J.P. Morgan Trust Company, National Association, as original trustee, and The Bank of New York, as Trustee, filed as Exhibit 4.1 to the Company’s Current Report on Form 8-K filed October 12, 2005 (SEC File No. 001-04018) is incorporated by reference. | ||
| (4 | .6) | Form of 4.875% Notes due October 15, 2015 ($300,000,000 aggregate principal amount), filed as exhibit 4.2 to the Company’s Current Report on Form 8-K filed October 12, 2005 (SEC File No. 001-04018) is incorporated by reference. | ||
| (4 | .7) | Form of 5.375% Debentures due October 15, 2035 ($300,000,000 aggregate principal amount), filed as exhibit 4.3 to the Company’s Current Report on Form 8-K filed October 12, 2005 (SEC File No. 001-04018) is incorporated by reference. | ||
| (4 | .8) | Second Supplemental Indenture between the Company and The Bank of New York, as trustee, filed as Exhibit 4.1 to the Company’s Current Report on Form 8-K filed March 14, 2008 (SEC File No. 001-040018) is incorporated by reference. | ||
| (4 | .9) | Form of Global Note representing the 5.45% Notes due March 15, 2018 ($350,000,000 aggregate principal amount), filed as exhibit 4.2 to the Company’s Current Report on Form 8-K filed March 14, 2008 (SEC File No. 001-04018) is incorporated by reference. | ||
| (4 | .10) | Form of Global Note representing 6.60% Notes due March 15, 2038 ($250,000,000) aggregate principal amount) filed as Exhibit 4.3 to the Company’s Current Report on Form 8-K filed March 14, 2008 (SEC File No. 001-04018) is incorporated by reference. | ||
| The Company agrees to furnish to the Securities and Exchange Commission upon request, a copy of any instrument with respect to long-term debt under which the total amount of securities authorized does not exceed 10 percent of the total consolidated assets of the Company. | ||||
| (10 | .1) | Employee Savings and Investment Plan, filed as Exhibit 99 to Registration Statement on Form S-8 (SEC File No. 33-01419), is incorporated by reference.* | ||
| (10 | .2) | Amended and Restated 1996 Non-Employee Directors’ Stock Compensation Plan, filed as Exhibit 10.2 to the Company’s Annual Report on Form 10-K for the year ended December 31, 2004 (SEC File No. 001-04018) is incorporated by reference. | ||
| (10 | .3) | Executive Officer Annual Incentive Plan, as amended and restated as of January 1, 2009, filed as Exhibit 10.2 to the Company’s Current Report on Form 8-K filed May 13, 2009 (SEC File No. 001-04018) is incorporated by reference.* | ||
| (10 | .4) | Executive Change in Control Agreement as amended and restated as of January 1, 2009, filed as Exhibit 10.4 to the Company’s Annual Report on Form 10-K for the year ended December 31, 2008 (SEC File No. 001-04018) is incorporated by reference.* | ||
| (10 | .5) | 1995 Incentive Stock Option Plan and 1995 Cash Performance Program, as amended as of May 4, 2006 with respect to all awards then outstanding, filed as Exhibit 10.5 to the Company’s Annual Report on Form 10-K for the year ended December 31, 2006 (SEC File No. 001-04018) is incorporated by reference.* | ||
| (10 | .6) | Deferred Compensation Plan, as amended and restated as of January 1, 2009, filed as Exhibit 10.6 to the Company’s Annual Report on Form 10-K for the year ended December 31, 2008 (SEC File No. 001-04018) is incorporated by reference.* | ||
| (10 | .7) | 2005 Equity and Cash Incentive Plan, as amended as of January 1, 2009, filed as Exhibit 10.1 to the Company’s Current Report on Form 8-K filed May 13, 2009 (SEC File No. 001-04018) is incorporated by reference.* | ||
| (10 | .8) | Form of award grant letter for SSAR grants made under 2005 Equity and Cash Incentive Plan.* |
86
Table of Contents
| (10 | .9) | Form of award grant letter for cash performance awards made under the 2005 Equity and Cash Incentive Plan.* | ||
| (10 | .10) | Form of award grant letter for performance share awards made under the 2005 Equity and Cash Incentive Plan.* | ||
| (10 | .11) | Pension Replacement Plan (formerly the Supplemental Executive Retirement Plan), as amended and restated as of January 1, 2010, filed as Exhibit 10.11 to the Company’s Annual Report on Form 10-K for the year ended December 31, 2009 (SEC File No. 001-04018) is incorporated by reference.* | ||
| (10 | .12) | Letter Agreement between Ronald L. Hoffman and the Company, dated November 28, 2008, filed as Exhibit 99.1 to the Company’s Current Report on Form 8-K filed November 26, 2008 (SEC File No. 001-04018) is incorporated by reference.* | ||
| (10 | .13) | Letter Agreement between Robert G. Kuhbach and the Company, dated November 13, 2009, filed as Exhibit 10.13 to the Company’s Annual Report on Form 10-K for the year ended December 31, 2009 (SEC File No. 001-04018) is incorporated by reference.* | ||
| (10 | .14) | Five-year Credit Agreement dated as of November 9, 2007 by and among Dover Corporation, the Lenders listed therein, the Borrowing Subsidiaries party thereto, JPMorgan Chase Bank, N.A as Administrative Agent, Deutsche Bank Securities Inc. as Syndication Agent, and Bank of America, N.A., The Royal Bank of Scotland plc and Wachovia Bank, National Association as Documented Agents, filed as Exhibit 99.1 to the Company’s Current Report on Form 8-K filed November 14, 2007 (SEC File No. 001-04018), is incorporated by reference. | ||
| (10 | .15) | Form of award grant letter for restricted stock awards made under the 2005 Equity and Cash Incentive Plan.* | ||
| (10 | .16) | Amendment No. 1 to the Executive Employee Supplemental Retirement Agreement with Robert A. Livingston, Jr., filed as Exhibit 99.1 to the Company’s Current Report on Form 8-K filed March 3, 2010 (SEC File No. 001-04018), is incorporated by reference.* | ||
| (10 | .17) | Executive Severence Plan.* | ||
| (10 | .18) | Senior Executive Change-in-Control Severence Plan.* | ||
| (14 | ) | Dover Corporation Code of Ethics for Chief Executive Officer and Senior Financial Officers, filed as Exhibit 14 to the Company’s Annual Report on Form 10-K for the year ended December 31, 2003 (SEC File No. 001-04018), is incorporated by reference. | ||
| (21 | ) | Subsidiaries of Dover. | ||
| (23 | ) | Consent of Independent Registered Public Accounting Firm. | ||
| (24 | ) | Power of Attorney (included in signature page). | ||
| (31 | .1) | Certification pursuant to Rule 13a-14 of the Securities and Exchange Act of 1934, as amended, signed and dated by Brad M. Cerepak. | ||
| (31 | .2) | Certification pursuant to Rule 13a-14 of the Securities and Exchange Act of 1934, as amended, signed and dated by Robert A. Livingston. | ||
| (32 | ) | Certification pursuant to 18 U.S.C. Section 1350, signed and dated by Brad M. Cerepak and Robert A. Livingston. | ||
| (101 | ) | The following materials from Dover Corporation’s Annual Report on Form 10-K for the year ended December 31, 2010 formatted in XBRL (Extensible Business Reporting Language): (i) the Consolidated Statements of Operations for the three years ended December 31, 2010, (ii) the Consolidated Balance Sheets at December 31, 2010 and 2009, (iii) the Consolidated Statements of Stockholders’ Equity for the three years ended December 31, 2010, (iv) the Consolidated Statements of Cash Flows for the three years ended December 31, 2010, (v) Notes to the Consolidated Financial Statements, and (vi) Financial Statement Schedule of Valuation and Qualifying Accounts.*** |
| * | Executive compensation plan or arrangement. | |
| ** | Confidential treatment requested. | |
| *** | In accordance with Rule 406T of Regulation S-T, the XBRL related information in Exhibit 101 to this Annual Report on Form 10-K shall not be deemed to be “filed” for purposes of Section 18 of the Exchange Act, or otherwise subject to the liability of that section, and shall not be part of any registration statement or other document filed under the Securities Act or the Exchange Act, except as shall be expressly set forth by specific reference in such filing. | |
| (d) | Not applicable. |
87
Table of Contents
| By: |
/s/
Robert
A. Livingston
|
| Signature | Title | Date | ||||
|
/s/
Robert
W. Cremin
|
Chairman, Board of Directors | February 11, 2011 | ||||
|
/s/
Robert
A. Livingston
|
Chief Executive Officer,
President and Director (Principal Executive Officer) |
February 11, 2011 | ||||
|
/s/
Brad
M. Cerepak
|
Vice President and
Chief Financial Officer (Principal Financial Officer) |
February 11, 2011 | ||||
|
/s/
Raymond
T. Mckay, Jr.
|
Vice President, Controller
(Principal Accounting Officer) |
February 11, 2011 | ||||
|
/s/
David
H. Benson
|
Director | February 11, 2011 | ||||
|
/s/
Jean-Pierre
M. Ergas
|
Director | February 11, 2011 | ||||
88
Table of Contents
| Signature | Title | Date | ||||
|
/s/
Peter
T. Francis
|
Director | February 11, 2011 | ||||
|
/s/
Kristiane
C. Graham
|
Director | February 11, 2011 | ||||
|
/s/
James
L. Koley
|
Director | February 11, 2011 | ||||
|
/s/
Richard
K. Lochridge
|
Director | February 11, 2011 | ||||
|
/s/
Bernard
G. Rethore
|
Director | February 11, 2011 | ||||
|
/s/
Michael
B. Stubbs
|
Director | February 11, 2011 | ||||
|
/s/
Stephen
M. Todd
|
Director | February 11, 2011 | ||||
|
/s/
Stephen
K. Wagner
|
Director | February 11, 2011 | ||||
|
/s/
Mary
A. Winston
|
Director | February 11, 2011 | ||||
89
Table of Contents
| (2 | .1) | Sale and Purchase Agreement, dated as of December 22, 2010, between the Company, NXP B.V., Knowles Electronics, LLC, EFF Acht Beteiligungsverwaltung GmbH and NXP Semiconductors N.V.** | ||
| (3 | )(i)(a) | Restated Certificate of Incorporation, filed as Exhibit 3.1 to the Company’s Quarterly Report on Form 10-Q for the Period Ended June 30, 1998 (SEC File No. 001-04018), is incorporated by reference. | ||
| (3 | )(i)(b) | Certificate of Correction to the Restated Certificate of Incorporation dated as of January 24, 2003, filed as Exhibit 3(i) to the Company’s Current Report on Form 8-K filed February 28, 2003 (SEC File No. 001-04018), is incorporated by reference. | ||
| (3 | )(ii) | By-Laws of the Company as amended and restated as of November 6, 2008, filed as Exhibit 3(ii) to the Company’s Current Report on Form 8-K filed November 12, 2008 (SEC File No. 001-04018), are incorporated by reference. | ||
| (4 | .1) | Indenture, dated as of June 8, 1998 between the Company and The First National Bank Chicago, as Trustee, filed as Exhibit 4.1 to the Company’s Current Report on Form 8-K filed June 12, 1998 (SEC File No. 001-04018), is incorporated by reference. | ||
| (4 | .2) | Form of 6.65% Debentures due June 1, 2028 ($200,000,000 aggregate principal amount), filed as Exhibit 4.4 to the Company’s Current Report on Form 8-K filed June 12, 1998 (SEC File No. 001-04018), is incorporated by reference. | ||
| (4 | .3) | Form of 6.50% Notes due February 15, 2011 ($400,000,000 aggregate principal amount), filed as Exhibit 4.3 to the Company’s current report on Form 8-K filed February 12, 2001 (SEC File No. 001-04018), is incorporated by reference. | ||
| (4 | .4) | Indenture, dated as of February 8, 2001 between the Company and BankOne Trust Company, N.A., as trustee, filed as Exhibit 4.1 to the Company’s current report on Form 8-K filed February 12, 2001 (SEC File No. 001-04018), is incorporated by reference. | ||
| (4 | .5) | First Supplemental Indenture among the Company, J.P. Morgan Trust Company, National Association, as original trustee, and The Bank of New York, as Trustee, filed as Exhibit 4.1 to the Company’s Current Report on Form 8-K filed October 12, 2005 (SEC File No. 001-04018) is incorporated by reference. | ||
| (4 | .6) | Form of 4.875% Notes due October 15, 2015 ($300,000,000 aggregate principal amount), filed as exhibit 4.2 to the Company’s Current Report on Form 8-K filed October 12, 2005 (SEC File No. 001-04018) is incorporated by reference. | ||
| (4 | .7) | Form of 5.375% Debentures due October 15, 2035 ($300,000,000 aggregate principal amount), filed as exhibit 4.3 to the Company’s Current Report on Form 8-K filed October 12, 2005 (SEC File No. 001-04018) is incorporated by reference. | ||
| (4 | .8) | Second Supplemental Indenture between the Company and The Bank of New York, as trustee, filed as Exhibit 4.1 to the Company’s Current Report on Form 8-K filed March 14, 2008 (SEC File No. 001-040018) is incorporated by reference. | ||
| (4 | .9) | Form of Global Note representing the 5.45% Notes due March 15, 2018 ($350,000,000 aggregate principal amount), filed as exhibit 4.2 to the Company’s Current Report on Form 8-K filed March 14, 2008 (SEC File No. 001-04018) is incorporated by reference. | ||
| (4 | .10) | Form of Global Note representing 6.60% Notes due March 15, 2038 ($250,000,000) aggregate principal amount) filed as Exhibit 4.3 to the Company’s Current Report on Form 8-K filed March 14, 2008 (SEC File No. 001-04018) is incorporated by reference. | ||
| The Company agrees to furnish to the Securities and Exchange Commission upon request, a copy of any instrument with respect to long-term debt under which the total amount of securities authorized does not exceed 10 percent of the total consolidated assets of the Company. | ||||
| (10 | .1) | Employee Savings and Investment Plan, filed as Exhibit 99 to Registration Statement on Form S-8 (SEC File No. 33-01419), is incorporated by reference.* | ||
| (10 | .2) | Amended and Restated 1996 Non-Employee Directors’ Stock Compensation Plan, filed as Exhibit 10.2 to the Company’s Annual Report on Form 10-K for the year ended December 31, 2004 (SEC File No. 001-04018) is incorporated by reference. |
90
Table of Contents
| (10 | .3) | Executive Officer Annual Incentive Plan, as amended and restated as of January 1, 2009, filed as Exhibit 10.2 to the Company’s Current Report on Form 8-K filed May 13, 2009 (SEC File No. 001-04018) is incorporated by reference.* | ||
| (10 | .4) | Executive Change in Control Agreement as amended and restated as of January 1, 2009, filed as Exhibit 10.4 to the Company’s Annual Report on Form 10-K for the year ended December 31, 2008 (SEC File No. 001-04018) is incorporated by reference.* | ||
| (10 | .5) | 1995 Incentive Stock Option Plan and 1995 Cash Performance Program, as amended as of May 4, 2006 with respect to all awards then outstanding, filed as Exhibit 10.5 to the Company’s Annual Report on Form 10-K for the year ended December 31, 2006 (SEC File No. 001-04018) is incorporated by reference.* | ||
| (10 | .6) | Deferred Compensation Plan, as amended and restated as of January 1, 2009, filed as Exhibit 10.6 to the Company’s Annual Report on Form 10-K for the year ended December 31, 2008 (SEC File No. 001-04018) is incorporated by reference.* | ||
| (10 | .7) | 2005 Equity and Cash Incentive Plan, as amended as of January 1, 2009, filed as Exhibit 10.1 to the Company’s Current Report on Form 8-K filed May 13, 2009 (SEC File No. 001-04018) is incorporated by reference.* | ||
| (10 | .8) | Form of award grant letter for SSAR grants made under 2005 Equity and Cash Incentive Plan.* | ||
| (10 | .9) | Form of award grant letter for cash performance awards made under the 2005 Equity and Cash Incentive Plan.* | ||
| (10 | .10) | Form of award grant letter for performance share awards made under the 2005 Equity and Cash Incentive Plan.*. | ||
| (10 | .11) | Pension Replacement Plan (formerly the Supplemental Executive Retirement Plan), as amended and restated as of January 1, 2010, filed as Exhibit 10.11 to the Company’s Annual Report on Form 10-K for the year ended December 31, 2009 (SEC File No. 001-04018) is incorporated by reference.* | ||
| (10 | .12) | Letter Agreement between Ronald L. Hoffman and the Company, dated November 28, 2008, filed as Exhibit 99.1 to the Company’s Current Report on Form 8-K filed November 26, 2008 (SEC File No. 001-04018) is incorporated by reference.* | ||
| (10 | .13) | Letter Agreement between Robert G. Kuhbach and the Company, dated November 13, 2009, filed as Exhibit 10.13 to the Company’s Annual Report on Form 10-K for the year ended December 31, 2009 (SEC File No. 001-04018) is incorporated by reference.* | ||
| (10 | .14) | Five-year Credit Agreement dated as of November 9, 2007 by and among Dover Corporation, the Lenders listed therein, the Borrowing Subsidiaries party thereto, JPMorgan Chase Bank, N.A as Administrative Agent, Deutsche Bank Securities Inc. as Syndication Agent, and Bank of America, N.A., The Royal Bank of Scotland plc and Wachovia Bank, National Association as Documented Agents, filed as Exhibit 99.1 to the Company’s Current Report on Form 8-K filed November 14, 2007 (SEC File No. 001-04018), is incorporated by reference. | ||
| (10 | .15) | Form of award grant letter for restricted stock awards made under the 2005 Equity and Cash Incentive Plan.* | ||
| (10 | .16) | Amendment No. 1 to the Executive Employee Supplemental Retirement Agreement with Robert A. Livingston, Jr., filed as Exhibit 99.1 to the Company’s Current Report on Form 8-K filed March 3, 2010 (SEC File No. 001-04018), is incorporated by reference.* | ||
| (10 | .17) | Executive Severence Plan.* | ||
| (10 | .18) | Senior Executive Change-in-Control Severence Plan.* | ||
| (14 | ) | Dover Corporation Code of Ethics for Chief Executive Officer and Senior Financial Officers, filed as Exhibit 14 to the Company’s Annual Report on Form 10-K for the year ended December 31, 2003 (SEC File No. 001-04018), is incorporated by reference. | ||
| (21 | ) | Subsidiaries of Dover. | ||
| (23 | ) | Consent of Independent Registered Public Accounting Firm. | ||
| (24 | ) | Power of Attorney (included in signature page). | ||
| (31 | .1) | Certification pursuant to Rule 13a-14 of the Securities and Exchange Act of 1934, as amended, signed and dated by Brad M. Cerepak. |
91
Table of Contents
| (31 | .2) | Certification pursuant to Rule 13a-14 of the Securities and Exchange Act of 1934, as amended, signed and dated by Robert A. Livingston. | ||
| (32 | ) | Certification pursuant to 18 U.S.C. Section 1350, signed and dated by Brad M. Cerepak and Robert A. Livingston. | ||
| (101 | ) | The following materials from Dover Corporation’s Annual Report on Form 10-K for the year ended December 31, 2010 formatted in XBRL (Extensible Business Reporting Language): (i) the Consolidated Statements of Operations for the three years ended December 31, 2010, (ii) the Consolidated Balance Sheets at December 31, 2010 and 2009, (iii) the Consolidated Statements of Stockholders’ Equity for the three years ended December 31, 2010, (iv) the Consolidated Statements of Cash Flows for the three years ended December 31, 2010, (v) Notes to the Consolidated Financial Statements, and (vi) Financial Statement Schedule of Valuation and Qualifying Accounts.*** |
| * | Executive compensation plan or arrangement. | |
| ** | Confidential treatment requested. | |
| *** | In accordance with Rule 406T of Regulation S-T, the XBRL related information in Exhibit 101 to this Annual Report on Form 10-K shall not be deemed to be “filed” for purposes of Section 18 of the Exchange Act, or otherwise subject to the liability of that section, and shall not be part of any registration statement or other document filed under the Securities Act or the Exchange Act, except as shall be expressly set forth by specific reference in such filing. | |
| (d) | Not applicable. |
92